CADTH Reimbursement Review
Romosozumab (Evenity)
Sponsor: Amgen Canada Inc.
Therapeutic area: Osteoporosis
This multi-part report includes:
Clinical Review
Pharmacoeconomic Review
Clinical Review
Abbreviations
AE
adverse event
ANCOVA
analysis of covariance
BMD
bone mineral density
BSAP
bone-specific alkaline phosphatase
BTM
bone turnover marker
CAROC
Canadian Association of Radiologists and Osteoporosis Canada
CI
confidence interval
DXA
dual-energy X-ray absorptiometry
EQ-5D-5L
EuroQol 5-Dimensions 5-Levels
FRAX
Fracture Risk Assessment
HRQoL
health-related quality of life
LOCF
last observation carried forward
ONJ
osteonecrosis of the jaw
OPAQ-SV
Osteoporosis Assessment Questionnaire Short Version
P1NP
procollagen type 1 N-terminal propeptide
RCT
randomized controlled trial
SAE
serious adverse event
sCTX
serum C-telopeptide
SD
standard deviation
Executive Summary
An overview of the submission details for the drug under review is provided in Table 1.
Item | Description |
|---|---|
Drug product | Romosozumab (Evenity), 105 mg/1.17 mL solution for subcutaneous injection, single-use pre-filled syringe |
Indication | For the treatment of osteoporosis in postmenopausal women at high risk for fracture, defined as a history of osteoporotic fracture, or multiple risk factors for fracture |
Reimbursement request | For the treatment of osteoporosis in postmenopausal women with a history of osteoporotic fracture and who are at very high risk for future fracture |
Health Canada approval status | NOC |
Health Canada review pathway | Standard review |
NOC date | June 17, 2019 |
Sponsor | Amgen Canada Inc. |
NOC = Notice of Compliance.
Introduction
Osteoporosis is a skeletal disorder characterized by low bone mass, compromised bone strength, and deterioration of bone quality, which results in an increased risk of fracture.1,2 When osteoporosis-related fractures occur, patients experience pain, deformity, disability, loss of height, compromised health-related quality of life (HRQoL), and decreased life expectancy.1,3 Osteoporosis affects 2 million Canadians, predominantly postmenopausal women.4
Different classes of drugs are indicated for prevention of osteoporosis-related fractures. Oral bisphosphonates are the most widely used anti-osteoporosis treatments in Canada.5 However, oral bisphosphonates are associated with important adverse events (AEs) such as gastrointestinal events6,7 and are potentially associated with rare but serious adverse events (SAEs), including atrial fibrillation, osteonecrosis of the jaw (ONJ), and atypical femoral fractures. Alternative first-line medications include denosumab, zoledronic acid (an IV bisphosphonate), raloxifene, and teriparatide.
Romosozumab (Evenity) is a humanized monoclonal antibody that inhibits the action of sclerostin, a regulatory factor in bone metabolism. It increases bone formation and, to a lesser extent, decreases bone resorption.8 On June 17, 2019, romosozumab was approved by Health Canada for the treatment of osteoporosis in postmenopausal women at high risk for fracture, defined as a history of osteoporotic fracture, or with multiple risk factors for fracture.8 The reimbursement request by the sponsor for romosozumab is for the treatment of osteoporosis in postmenopausal women with a history of osteoporotic fracture and who are at very high risk for future fracture.
Romosozumab is available as a solution for subcutaneous injection in pre-filled syringes at a dose of 105 mg per 1.17 mL syringe. The recommended dosage of romosozumab is 210 mg administered once every month. Treatment duration of romosozumab is limited to 12 monthly doses. Once the patient has completed the 12-month romosozumab therapy, osteoporosis therapy with an antiresorptive agent should be considered.8
Stakeholder Perspectives
The information in this section is a summary of input provided by the patient and clinician groups who responded to CADTH’s call for input and from a clinical expert consulted by CADTH for the purpose of this review.
Patient Input
One patient group, Osteoporosis Canada, submitted input for this review. Osteoporosis Canada is a national organization dedicated to serving people who have or are at risk of developing osteoporosis.
The patient group indicated that the most important and feared consequence of osteoporosis is the risk of a fracture. From the patient perspective, the impact of a fracture can be substantial. Fractures in older populations are associated with acute and often chronic pain, changes in levels or loss of independence, decreased mobility, social isolation resulting in depression, or institutionalization as a result of a fragility fracture. Hip fractures in particular are associated with a significant decline in a patient’s ability to live independently and higher death rates resulting from complications. For younger seniors, this may result in time away from work, possibly with a financial impact.
Patients expressed that they would value a new treatment option that works differently from conventional options, particularly if it is easier to administer and comes with fewer side effects. Respondents to the Osteoporosis Canada survey reported the outcomes of most importance to them were preserving HRQoL, preventing fracture-related deaths, preventing admission to long-term care homes, preserving their ability to perform daily physical and social activities, preventing osteoporotic fractures, and avoiding serious side effects.
Clinician Input
Input From the Clinical Expert Consulted by CADTH
The clinical expert consulted by CADTH for this review indicated that, even though oral bisphosphonates are most commonly prescribed for the treatment of osteoporosis in postmenopausal women, they are associated with limitations such as inconvenient administration, gastrointestinal toxicities, and low absorption rates. Use of parenteral bisphosphonates is relatively limited because they are perceived as drugs to be prescribed by a specialist, and some patients are reluctant to receive IV infusions or subcutaneous injections. Treatment options for certain patient groups, such as those with renal insufficiency and renal failure, are limited.
In the expert’s opinion, romosozumab can be used as a first-line treatment for patients with the lowest bone mineral density (BMD) and greatest risk of fracture. It can also be used as a second-line treatment after patients fail on an antiresorptive agent and experience significant bone loss and fractures.
The expert stated that treatment response is assessed using change in BMD after treatment and suggested that measurement of BMD be conducted first at 12 months, when the patient transitions to antiresorptive therapy, and again 12 to 18 months later after a treatment change.
The expert indicated that romosozumab treatment should be discontinued if the patient experiences intolerable AEs. When a cardiovascular event occurs, the clinician should consider stopping the treatment.
Clinician Group Input
No input was provided by clinician groups.
Drug Program Input
In response to drug programs’ questions regarding the initiation of therapy in special subpopulations (e.g., patients with severe renal impairment), the clinical expert consulted by CADTH indicated that treatment of osteoporosis in patients with renal failure is complicated and should be managed by an osteoporosis specialist. Use of romosozumab is not always appropriate. For patients who are currently receiving active treatment for osteoporosis, clinicians would likely switch to romosozumab only if the patient was not responding satisfactorily to the current treatment and is still considered at high risk for fracture. Clinicians would consider use of romosozumab in patients who have received teriparatide therapy.
With respect to treatment continuation or renewal, the clinical expert indicated that, although continuous use of romosozumab beyond the recommended 12 months of treatment is not expected to be beneficial, intermittent treatment with romosozumab — for example, repeating a 12-month romosozumab course after a follow-on therapy of 1 year or more — may be considered. Should a dose of romosozumab be missed or treatment need to be temporarily stopped, the expert suggested that the patient receive a full 12 months of treatment.
The expert also stated that, although management and prescribing romosozumab would ideally involve clinicians with expertise in osteoporosis, in practice the drug may be prescribed by other health care providers and can be administered in an office.
Clinical Evidence
Pivotal Studies and Protocol-Selected Studies
Description of Studies
Two phase III studies (FRAME, N = 7,180; ARCH, N = 4,093) were included in the systematic review. The trials enrolled postmenopausal women (55 to 90 years of age) with osteoporosis.
The FRAME study was a double-blind, placebo-controlled randomized controlled trial (RCT) that assessed the efficacy and safety of romosozumab for the treatment of osteoporosis in postmenopausal women. Eligible patients were randomized to receive romosozumab 210 mg subcutaneously or placebo once a month for 12 months. After the 12-month double-blind treatment period, both groups received open-label denosumab 60 mg every 6 months for an additional 12 months. After the first 24-month treatment (12 months with romosozumab or placebo followed by 12 months with denosumab), patients entered a 12-month open-label extension period, during which they continued to receive denosumab 60 mg every 6 months. The co-primary efficacy end points were the incidences of new vertebral fractures at month 12 and month 24. Secondary efficacy end points included the incidence of various types of fractures and change from baseline in BMD T-scores. In this study, the mean age of the patients at baseline was 71 years and 41% of the patients had a historical fracture. The 10-year probability of a major osteoporotic fracture in this patient population at baseline was 13%, reflecting a moderate-risk population.
The ARCH study was a double-blind, active-controlled RCT that assessed the efficacy and safety of romosozumab for the treatment of osteoporosis in postmenopausal women with a high risk of fracture. Eligible patients were randomized to receive romosozumab 210 mg subcutaneously or oral alendronate 70 mg for 12 months. After the initial 12-month double-blind alendronate-controlled study period, both groups received open-label alendronate therapy 70 mg once a week for an additional 12 months. The primary efficacy end points in ARCH were the incidence of new vertebral fractures at month 24 and the incidence of clinical fractures (nonvertebral and clinical vertebral) during the primary analysis period, which refers to randomization to the time point at which clinical fractures were confirmed for at least 330 patients and all patients have had the opportunity to complete the month 24 study visit. Secondary efficacy end points included the incidence of various types of fractures and change from baseline in BMD T-scores. In this study, the mean age of the patients at baseline was 74 years and almost all patients had historical fracture. The 10-year probability of a major osteoporotic fracture in this patient population at baseline was 20%, reflecting a high-risk population.
Efficacy Results
Outcomes of fractures are relevant in clinical trials of osteoporosis. They were also identified by the clinicians and patient group as important outcomes. In FRAME, the risk of new vertebral fractures measured at the end of 1 year and 2 years of treatment were the primary efficacy end points. Treatment with romosozumab was associated with a 73% (95% confidence interval [CI], 53 to 84) reduction in the relative risk of a new vertebral fracture at month 12, and a 75% (95% CI, 60 to 84) relative risk reduction at month 24, compared to placebo. The between-group differences were statistically significant. According to the clinical expert consulted by CADTH, the benefit gained in the reduction of the risk of a new vertebral fracture is clinically meaningful. Results for a number of fracture-related outcomes (nonvertebral fractures, major nonvertebral fractures, new or worsening vertebral fractures, hip fractures, major osteoporotic fractures, and multiple new or worsening vertebral fractures) favoured romosozumab, and fewer patients in the romosozumab group developed these fractures compared to patients in the placebo group. Estimated differences in the risk of a fracture between romosozumab and placebo groups were statistically significant for clinical fractures, but failed to reach statistical significance for nonvertebral fractures. Firm conclusions for all other secondary end points cannot be made as the testing procedure was stopped after the failed test for nonvertebral fractures.
In ARCH, the risk of new vertebral fractures at month 24 and the risk of clinical fractures through the primary analysis study period (defined as the time from randomization to after clinical fractures had been confirmed in more than 330 patients and all patients completed the month 24 study visit) were co-primary efficacy end points. Treatment with 1 year of romosozumab followed by alendronate therapy for another year was associated with a statistically significantly reduced risk of new vertebral fractures (relative risk reduction = 50%; 95% CI, 34 to 62) through month 24, compared with treatment with alendronate for 2 years. Romosozumab was also associated with a statistically significantly reduced risk of clinical fractures (hazard ratio = 0.73; 95% CI, 0.61 to 0.88) through the primary analysis study period. The clinical expert indicated that the benefit gained in the reduction in the risk of new vertebral fractures or clinical fractures is clinically meaningful. Results for other fracture-related outcomes in this study (nonvertebral fractures, new vertebral fractures, clinical fractures, hip fractures, major nonvertebral fractures, major osteoporotic fractures, and all osteoporotic fractures) also favoured romosozumab over alendronate. The estimated difference in the rates of nonvertebral fractures was found to be statistically significant for patients on romosozumab compared to those on alendronate. Firm conclusions cannot be drawn for other fracture end points as no attempt was made to account for multiple comparisons.
One of the most important clinical outcomes considered by clinician and patient input was HRQoL, which was an exploratory outcome in both FRAME and ARCH. It was evaluated using the EuroQol 5-Dimensions 5-Levels questionnaire (EQ-5D-5L), which is a generic quality-of-life assessment tool, and the disease-specific Osteoporosis Assessment Questionnaire Short Version (OPAQ-SV). Results of the 2 studies did not show consistent or clinically meaningful changes between romosozumab and the comparators in any of these tools. A vertebral fracture is the most common clinical manifestation of osteoporosis, and approximately 2-thirds of these fractures are asymptomatic. This could explain why a deterioration or improvement in symptoms and quality of life may not be easily detected and a change in HRQoL may not be observed. Overall, the potential benefit of romosozumab on HRQoL remains unknown. The relationship between the gains from reduced fracture risk and improvement in patient’s HRQoL was unclear.
Change in BMD from baseline was measured in the lumbar spine, total hip, and femoral neck in both FRAME and ARCH. In ARCH, treatment with romosozumab was associated with a statistically significantly increased BMD from baseline at all 3 sites, compared to alendronate. Similar results were observed in the FRAME study when comparing romosozumab to placebo; however, BMD end points were not adjusted for multiple comparisons in this study. In general, the differences between romosozumab and placebo were numerically greater than those between romosozumab and alendronate. According to the clinical expert, the between-group differences in the ARCH study are clinically meaningful. These results were consistent with the change in incidence of fractures in the study population.
Harms Results
During the 24-month study period, the incidence of AEs was similar between romosozumab (month 12: 78%; month 24: 85%) and placebo (month 12: 80%; month 24: 86%) in FRAME, and between romosozumab (month 12: 76%; primary analysis period: 87%) and alendronate (month 12: 79%; primary analysis period: 89%). The incidence of SAEs was similar between romosozumab (month 12: 10%; month 24: 16%) and placebo (month 12: 9%; month 24: 15%) in FRAME, and between romosozumab (month 12: 13%; primary analysis period: 29%) and alendronate (month 12: 14%; primary analysis period: 30%) in ARCH. Treatment discontinuations due to AEs were similar between romosozumab (month 12: 3%; month 24: 3%) and placebo (month 12: 3%; month 24: 3%) in FRAME, and between romosozumab (month 12: 3%; primary analysis period: 7%) and alendronate (month 12: 3%; primary analysis period 24: 7%) in ARCH.
The incidence of fatal events was similar between romosozumab and placebo in the FRAME study, and between romosozumab and alendronate in the ARCH study, during the 2-year study period.
In terms of AEs of particular interest, the incidence of hypersensitivity and ONJ were similar between romosozumab and comparators at 12 and 24 months in both studies. The frequencies of cardiovascular events, particularly myocardial infarction and stroke, were higher with romosozumab versus alendronate at 12 and 24 months in the ARCH study.
Table 2: Summary of Key Results From FRAME and ARCH
Outcomes | FRAME | ARCH | ||
|---|---|---|---|---|
Romo/deno (N = 3,589) | Placebo/deno (N = 3,591) | Romo/alen (N = 2,046) | Alen/alen (N = 2,047) | |
Incidence rates of new vertebral fractures through month 12 | ||||
Incidence, n/N (%) | 16 of 3,321 (0.5) | 59 of 3,322 (1.8) | NA | |
Absolute risk reduction, %, point estimate (95% CI) | 1.30 (0.79 to 1.80) | |||
Risk ratio, point estimate (95% CI) Relative risk reduction (95% CI) | 0.27 (0.16 to 0.47) 73% (53 to 84) | |||
Odds ratio, point estimate (95% CI) P value | 0.27 (0.15 to 0.47) < 0.001 | |||
Incidence rates of new vertebral fractures through month 24 | ||||
Incidence, n/N (%) | 21 of 3,325 (0.6) | 84 of 3,327 (2.5) | 74 of 1,825 (4.1) | 147 of 1,834 (8.0) |
Absolute risk reduction, %, point estimate (95% CI) | 1.89 (1.30 to 2.49) | 4.03 (2.50 to 5.57) | ||
Risk ratio, point estimate (95% CI) RRR (95% CI) | 0.25 (0.16 to 0.40) 75% (60 to 84) | 0.50 (0.38 to 0.66) 50% (34 to 62) | ||
Odds ratio point estimate (95% CI) P value | 0.24 (0.15 to 0.39) < 0.001 | 0.48 (0.36 to 0.64) < 0.001 (nominal) < 0.001 (adjusted) | ||
Incidence rates of clinical fractures through primary analysisa | ||||
Incidence, n/N (%) | NA | 198 of 2,046 (9.7) | 266 of 2,047 (13.0) | |
Hazard ratio, point estimate (95% CI) P value | 0.73 (0.61 to 0.88) < 0.001 (nominal) < 0.001 (adjusted) | |||
Change in BMDb | ||||
Lumbar spine | ||||
Baseline, mean (SD) | −2.72 (1.04) | −2.71 (1.04) | −2.94 (1.25) | −2.99 (1.24) |
Number of evaluable patients at month 12 | 3,151 | 3,148 | 1,722 | 1,718 |
LS mean at month 12 (95% CI) | 13.1 (12.8 to 13.3) | 0.4 (0.2 to 0.5) | 13.7 (13.4 to 14.0) | 5.0 (4.7 to 5.2) |
LS mean difference (95% CI) | 12.7 (12.4 to 12.9) | 8.7 (8.3 to 9.1) | ||
P value | < 0.001 | < 0.001 | ||
Number of evaluable patients at month 24 | 2,861 | 2,877 | 1,571 | 1,577 |
LS mean at month 24 (95% CI) | 16.6 (16.3 to 16.8) | 5.5 (5.3 to 5.7) | 15.3 (14.9 to 15.7) | 7.2 (6.9 to 7.5) |
LS mean difference (95% CI) | 11.1 (10.8 to 11.40) | 8.1 (7.6 to 8.6) | ||
P value | < 0.001 | < 0.001 | ||
Total hip | ||||
Baseline, mean (SD) | −2.48 (0.47) | −2.46 (0.47) | −2.78 (0.68) | −2.81 (0.67) |
Number of evaluable patients at month 12 | 3,197 | 3,210 | 1,781 | 1,781 |
LS mean at month 12 (95% CI) | 6.0 (5.9 to 6.2) | 0.3 (0.1 to 0.4) | 6.2 (5.9 to 6.4) | 2.8 (2.7 to 3.0) |
LS mean difference (95% CI) | 5.8 (5.6 to 6.0) | 3.3 (3.0 to 3.6) | ||
P value | < 0.001 | < 0.001 | ||
Number of evaluable patients at month 24 | 2,903 | 2,918 | 1,622 | 1,627 |
LS mean at month 24 (95% CI) | 8.5 (8.3 to 8.7) | 3.2 (3.1 to 3.3) | 7.2 (7.0 to 7.5) | 3.5 (3.2 to 3.7) |
LS mean difference (95% CI) | 5.3 (5.1 to 5.5) | 3.8 (3.4 to 4.1) | ||
P value | < 0.001 | < 0.001 | ||
Femoral neck | ||||
Baseline, mean (SD) | −2.76 (0.28) | −2.74 (0.29) | −2.89 (0.49) | −2.90 (0.50) |
Number of evaluable patients at month 12 | 3,197 | 3,210 | 1,781 | 1,781 |
LS mean at month 12 (95% CI) | 5.5 (5.2 to 5.7) | 0.3 (0.1 to 0.5) | 4.9 (4.7 to 5.2) | 1.7 (1.5 to 2.0) |
LS mean difference (95% CI) | 5.2 (4.9 to 5.4) | 3.2 (2.9 to 3.5) | ||
P value | < 0.001 | < 0.001 | ||
Number of evaluable patients at month 24 | 2,903 | 2,918 | 1,622 | 1,627 |
LS mean at month 24 (95% CI) | 7.3 (7.0 to 7.5) | 2.3 (2.1 to 2.6) | 6.0 (5.7 to 6.4) | 2.3 (2.0 to 2.6) |
LS mean difference (95% CI) | 4.9 (4.7 to 5.2) | 3.8 (3.4 to 4.1) | ||
P value | < 0.001 | < 0.001 | ||
Harms (safety analysis set) | ||||
N | 3,581 | 3,576 | 2,040 | 2,014 |
AEs, n (%) Month 12 Month 24 in FRAME or primary analysis period in ARCH | 2,806 (78.4) 3,053 (85.3) | 2,850 (79.7) 3,069 (85.8) | 1,544 (75.7) 1,766 (86.6) | 1,584 (78.6) 1,784 (88.6) |
SAEs, n (%) Month 12 Month 24 in FRAME or primary analysis period in ARCH | 344 (9.6) 565 (15.8) | 312 (8.7) 540 (15.1) | 262 (12.8) 586 (28.7) | 278 (13.8) 605 (30.0) |
WDAEs (from study treatment), n (%) Month 12 Month 24 in FRAME or primary analysis period in ARCH | 103 (2.9) 122 (3.4) | 94 (2.6) 110 (3.1) | 70 (3.4) 133 (6.5) | 64 (3.2) 146 (7.2) |
Deaths, n (%) Month 12 Month 24 in FRAME or primary analysis period in ARCH | 29 (0.8) 52 (1.5) | 23 (0.6) 47 (1.3) | 30 (1.5) 90 (4.4) | 21 (1.0) 90 (4.5) |
Notable harms, n (%) – Month 12 Hypersensitivity ONJ Any CV SAEs Cardiac ischemic event Heart failure Noncoronary revascularization Cerebrovascular event Peripheral vascular ischemic event not requiring revascularization | 242 (6.8) 1 (< 0.1) 44 (1.2) 15 (0.4) 7 (0.2) NR 10 (0.3) 3 (< 0.1) | 245 (6.9) 0 41 (1.1) 14 (0.4) 4 (0.1) NR 11 (0.3) 1 (< 0.1) | 122 (6.0) 0 50 (2.5) 16 (0.8) 4 (0.2) 3 (0.1) 16 (0.8) 0 | 118 (5.9) 0 38 (1.9) 6 (0.3) 8 (0.4) 5 (0.2) 7 (0.3) 2 (< 0.1) |
Month 24 in FRAME or primary analysis period in ARCH Hypersensitivity ONJ Any CV SAEs Cardiac ischemic event Heart failure Noncoronary revascularization Cerebrovascular event Peripheral vascular ischemic event not requiring revascularization | 314 (8.8) 2 (< 0.1) 82 (2.3) 18 (0.5) 8 (0.2) NR 27 (0.8) 7 (0.2) | 331 (9.3) 0 79 (2.2) 26 (0.7) 9 (0.3) NR 24 (0.7) 2 (< 0.1) | 205 (10.0) 1 (< 0.1) 133 (6.5) 30 (1.5) 12 (0.6) 6 (0.3) 45 (2.2) 2 (< 0.1) | 185 (9.2) 1 (< 0.1) 122 (6.1) 20 (1.0) 23 (1.1) 10 (0.5) 27 (1.3) 5 (0.2) |
AE = adverse event; alen = alendronate; BMD = bone mineral density; CI = confidence interval; CV = cardiovascular; deno = denosumab; LS = least squares; ONJ = osteonecrosis of the jaw; NR = not reported; romo = romosozumab; RRR = relative risk reduction; SAE = serious adverse event; SD = standard deviation; WDAE = withdrawal due to adverse event.
aPrimary analysis period was from randomization to after clinical fractures had been confirmed in 330 or more patients.
bP values for all outcomes related to BMD in the FRAME study were not adjusted for multiplicity.
Critical Appraisal
In the included studies, the completion rate at the end of 1 year of treatment was close to 90%, and more than 80% in FRAME and 77% in ARCH at the end of 2 years of treatment. The reasons for dropout were similar between treatment groups. The dropout rates, while consistent with those of other clinical trials of osteoporosis treatments, were still high and may affect the validity of the study results considering the proportion of data that needed to be imputed for analyses. In both studies, a last observation carried forward (LOCF) method was used to account for missing data for most efficacy end points. Sensitivity analyses that did not assume data were missing at random were conducted. These sensitivity analyses confirmed that the trial results were generally robust to the handling of missing data in the primary and secondary analyses.
In the FRAME and ARCH studies, a step-down procedure, with the primary and selected secondary outcome measures included, was used to control for multiplicity. Outcomes outside of the testing hierarchy, such as HRQoL (an exploratory outcome in both studies) and occurrence of cardiovascular events, need to be interpreted with consideration for the possibility of inflated type I error.
The clinical expert provided input on how to define high-risk patients. Risks of future fractures should be determined based on multiple factors, including patients’ demographic characteristics, history of fracture, sites of previous fracture, use of certain medications, Fracture Risk Assessment (FRAX) scores, BMD scores, and many others. For example, a hip fracture carries more weight than an ankle or wrist fracture when calculating future fracture risks. Subgroup analyses in the 2 studies examined the consistency of the primary analyses results across subgroup levels based on age, prevalent vertebral fracture status, history of fragility fracture, and baseline BMD T-scores, among others. More factors, such as effect of prior pharmacotherapy, patient compliance to prior treatment, and previous fractures that carry more weight (e.g., hip fractures or multiple fragility fractures), should also be considered.
There is limited direct evidence comparing romosozumab and relevant comparators, with only a comparison with alendronate in the ARCH study to inform the comparative efficacy and safety of romosozumab versus other osteoporosis medications.
Indirect Comparisons
Description of Studies
One sponsor-submitted indirect treatment comparison (ITC) was summarized and critically appraised.11 The sponsor-submitted ITC aimed to evaluate the relative clinical efficacy of romosozumab and several treatments for osteoporosis, including denosumab, raloxifene, zoledronate, risedronate, and alendronate. Included studies enrolled postmenopausal women with primary osteoporosis or osteopenia who were at risk of developing fragility fractures. The 3 outcomes that were analyzed were sustaining vertebral, hip, and nonvertebral fragility fractures.
Efficacy Results
The sponsor-submitted ITC conducted a systematic review and used frequentist network meta-analysis (NMA) to evaluate the relative clinical efficacy of romosozumab to other treatments for osteoporosis.
The ITC reported that romosozumab was associated with a significant reduction in the risk of sustaining hip, nonvertebral, and vertebral fragility fractures compared to raloxifene, and a significant reduction in sustaining vertebral fractures compared to alendronate, risedronate, and raloxifene. There was no significant difference between romosozumab and any of alendronate, residronate, zoledronate, or denosumab in the risk of sustaining hip and nonvertebral fractures, and no significant difference was evident between romosozumab and either zoledronate or denosumab in the risk of sustaining vertebral fractures.
Harms Results
The sponsor-submitted ITC did not examine AEs, SAEs, withdrawal due to AEs, or deaths in the network of studies in the ITC.
Critical Appraisal
Critical appraisal points of the sponsor-submitted ITC involve the lack of reporting certain patient characteristics that would better address the certainty of the indirect evidence, including details of clinical heterogeneity in the included studies, effect modifiers and their influence on the results, construction of nodes in the ITC network, and details of assessments of essential NMA assumptions. The sponsor-submitted ITC could have used more sensitivity and subgroup analysis to satisfy the assumptions of transitivity and homogeneity, and a meta-regression that adjusted for effect modifiers could have influenced the results. Also, given that the sponsor-submitted ITC failed to provide a definition for “placebo,” double-counted hip fractures when analyzing hip and nonvertebral fracture outcomes, and did not distinguish between symptomatic and non-symptomatic vertebral fractures, the substantial uncertainty remaining undermines the internal and external validity of the ITC.
Other Relevant Evidence
Description of Studies
One long-term extension study, the FRAME Extension, provides longer-term evidence regarding the use of romosozumab to treat osteoporosis in postmenopausal women at high risk for fracture.12 After the 24-month primary analysis of the FRAME study, eligible patients could enrol in the 12-month open-label extension period, during which they could continue to receive open-label denosumab 60 mg every 6 months; all patients in the extension phase of the FRAME trial were therefore treated with denosumab.
Efficacy Results
Through month 36, all fracture locations (new vertebral, clinical, nonvertebral, major nonvertebral, new or worsening vertebral, hip, major osteoporotic, and multiple new or worsening vertebral) showed an improved relative risk reduction in fractures among patients treated initially with romosozumab followed by denosumab (romosozumab/denosumab group), compared to patients treated initially with placebo followed by denosumab (placebo/denosumab group). The percent change in BMD at the lumbar spine, hip, and femoral neck from baseline to month 36 was also improved among patients in the romosozumab/denosumab group compared to patients in the placebo/denosumab group. The percent changes in bone turnover markers (BTMs) from baseline to month 36 were similar in both treatment groups when considering procollagen type 1 N-terminal propeptide (P1NP) and sclerostin. When considering serum C-telopeptide (sCTX), there was a −41 ng/L change in the placebo/denosumab group compared to a −14 ng/L change in the romosozumab/denosumab group; none of the BTM analyses (i.e., P1NP, sclerostin, or sCTX) indicated a difference between treatment groups (nominal P value > 0.05).
Harms Results
Reported AEs occurred in a similar proportion of both treatment groups (88% in the romosozumab/denosumab group and 89% in the placebo/denosumab group). For SAEs, the occurrence rate was 20% and 21% of patients in the romosozumab/denosumab and placebo/denosumab groups, respectively. Those AEs that led to treatment discontinuation were infrequently reported, occurring among 4% of patients in each treatment group. Few patients (2% in each treatment group) discontinued the study due to AEs. Fatal events were reported among 2% of patients in each treatment group.
Critical Appraisal
In the extension phase of the FRAME study, none of the analyses were adjusted for multiplicity, which may increase the likelihood of type I error. All results and analyses of the extension period of the FRAME trial should be considered supportive evidence. The FDA administered a warning related to cardiovascular AEs associated with the use romosozumab. None of the cardiovascular events that occurred during the extension phase suggested a greater risk among patients who were initially treated with romosozumab. The overall occurrence rate of cardiovascular AEs was generally low, at between less than 0.1% and 3.6% of patients. Analyses were conducted to determine the differences in the odds of cardiovascular events occurring between treatment groups; however, some of the sample sizes for specific cardiovascular AEs were low. The analyses designed to detect differences in the odds of cardiovascular events between the romosozumab/denosumab and placebo/denosumab groups were not powered or adjusted for multiplicity. Differences in the odds of cardiovascular AEs occurring in patients initially treated with romosozumab and those receiving placebo should be interpreted with caution.
The extension phase of the FRAME study provided insight into the long-term effects of initial treatment with romosozumab followed by treatment with an antiresorptive agent such as denosumab. These long-term data can help inform patients and physicians about the long-term effects (i.e., 36 months) of treatment with romosozumab followed by denosumab. Longer-term data (i.e., ≥ 10 years) may be more useful for patients and clinicians for determining long-term fracture risks after treatment with romosozumab. While the extension phase provided some indication of the fracture risk and change in BMD associated with romosozumab, it is not possible to know how patient outcomes will be affected in the future.
The differences in fracture incidence between patients initially treated with romosozumab and placebo was an end point of the extension phase of the FRAME study; results indicated a greater risk reduction in all analyzed sites among patients initially treated with romosozumab compared to patients initially treated with placebo. It is uncertain how initial treatment with romosozumab followed by long-term intervention with denosumab may compare to other treatments patients receive in clinical practice.
Conclusions
Two phase III double-blind RCTs, 1 placebo-controlled (FRAME) and 1 active-controlled (ARCH), provided evidence supporting the efficacy of romosozumab for the treatment of osteoporosis in postmenopausal women. The evidence from ARCH was considered more relevant to this review because it was the only study with an active comparator (alendronate) and more closely represents the target population for treatment with romosozumab (postmenopausal women with osteoporosis who are at high risk for fracture). Compared to alendronate, patients who were treated with monthly subcutaneous injections of 210 mg of romosozumab experienced benefits in reducing the risk of new fractures and increasing BMD. Changes in the incidence of new vertebral fractures and clinical fractures at month 12 and month 24 were considered statistically significant and likely clinically relevant. However, whether treatment with romosozumab is associated with any HRQoL benefit remains uncertain. The incidence rates of AEs, SAEs and treatment discontinuation due to AEs were similar between romosozumab and alendronate; however, a signal for a potential increased risk of cardiovascular-related AEs, particularly myocardial infarction and stroke, was noted with romosozumab compared with alendronate.
The results from 1 sponsor-submitted ITC suggest that romosozumab therapy may offer a beneficial effect in reducing the risk of sustaining nonvertebral fractures compared to some current treatments. Results of this indirect comparison are associated with a substantial risk of bias due to limitations, such as extensive heterogeneity, that have not been adequately accounted for.
The extension phase of the FRAME study, in which all participants received denosumab, suggest that the treatment effect from romosozumab in reducing the risk of fracture and increasing BMD was maintained. The frequency of AEs was generally similar between patients in the romosozumab/denosumab and placebo/denosumab groups. However, limitations of this extension study, such as the lack of a comparator group and a lack of patients from a high-risk population, contribute uncertainty to the results.
Introduction
Disease Background
Osteoporosis is a generalized skeletal disorder characterized by low bone mass, compromised bone strength, and deterioration of bone quality, which results in an increased risk of fracture.1,2 Patients with osteoporosis usually have no clinical manifestations until there is a fracture. When osteoporosis-related fractures occur, patients suffer from pain, deformity, disability, loss of height, compromised HRQoL, and decreased life expectancy.1,3 Vertebral compression fracture is the most common clinical manifestation of osteoporosis. Approximately 2-thirds of these fractures occur asymptomatically and are diagnosed as incidental findings on chest or abdominal radiographs. Symptomatic vertebral fractures, including height loss, are also observed. Hip fractures affect up to 15% of women by 80 years of age.13 The major source of morbidity and mortality from osteoporosis is attributed to hip fractures. They are not only associated with an increased mortality risk, but also influence long-term function and independence. In Canada, mortality among women was reported to be as high as 28% in the first year following a hip fracture.14 Fifty percent of women who suffer a hip fracture do not return to their previous functional state and become dependent on others for assistance with daily activities.15 Osteoporotic fractures can also occur at the distal forearm and proximal humerus.13 After the first fracture, the risk of subsequent fracture is increased and is highest in the first 1 to 2 years.16 While some researchers indicated that 10 years after a fracture, there is no added risk of future fracture compared to someone who has not fractured,16 other researchers reported that the relative risk of a subsequent fracture after the first fracture remained increased over 15 years.17
Osteoporosis affects 2 million Canadians, predominantly postmenopausal women due to decreased production of estrogen following menopause.4 Among Canadians aged 50 years and older, osteoporosis is associated with a substantial economic cost, accounting for $2.3 billion, or 1.3% of health care budgets, and the acute care cost of managing osteoporotic fractures was $1.2 billion, or 50% of total costs, based on data for fiscal year 2007 to 2008.18
According to the clinical expert consulted by CADTH, a diagnosis of osteoporosis should be considered for anyone who has had a fragility fracture. However, in most patients it is diagnosed before any fractures occurring through an assessment of BMD by dual-energy X-ray absorptiometry (DXA). A BMD scan provides a 2-dimensional record of mineral content in the region of interest (lumbar spine, total hip, and femoral neck), which, when combined with anthropometric parameters (height and weight), provides information about the strength and other mechanical properties of bone. The risk for most fractures is inversely proportional to BMD, with women typically having a lower baseline value than men. The WHO uses the “T-score” to define diagnostic thresholds for low bone mass and osteoporosis based on BMD measurements compared with those from a young adult reference population. Normal BMD is defined as a value within 1 standard deviation (SD) of the mean value in the reference population (values of −1 or higher); a T-score that is 1 to 2.5 SDs below the young adult mean (values of −1 to −2.5) is termed low bone mass, which was previously osteopenia; and a T-score that is 2.5 SDs or more below the young adult mean BMD (values of lower than −2.5) is defined as osteoporosis, provided that other causes of low BMD have been ruled out.1 A clinical diagnosis of osteoporosis may be made in the presence of a fragility fracture (those occurring spontaneously or from minor trauma), particularly at the spine, hip, wrist, humerus, rib, and pelvis, without measurement of BMD.1 In postmenopausal women, a clinical diagnosis of osteoporosis may also be made if there is a high risk for fracture as determined by fracture risk models. Organizations such as the Canadian Association of Radiologists recommend using an individual’s 10-year risk of fracture as the threshold for intervention.19 The 2010 Clinical Practice Guidelines for the Diagnosis and Management of Osteoporosis in Canada recommends the FRAX tool, a computer-based calculator that estimates the probability of major osteoporotic fracture,20,21 or the Canadian Association of Radiologists and Osteoporosis Canada (CAROC) fracture risk assessment tool to evaluate an individual’s absolute 10-year fracture risk, accounting for risk factors such as age, history of fracture, and glucocorticoid use.22 In addition to femoral neck BMD, age, gender, fracture history, and glucocorticoid use, FRAX also takes into account other clinical risk factors, such as individual body mass index, smoking and alcohol use, and any comorbid conditions that may contribute to bone loss.1 According to the clinical expert consulted by CADTH, the FRAX model is used globally and has country-specific databases to adjust fracture risks for ethnicity (country of origin), as opposed to the CAROC model, which has no capability of such adjustments.
Standards of Therapy
Lifestyle measures such as adequate calcium and vitamin D intake, exercise, smoking cessation, counselling on fall prevention, avoidance of heavy alcohol use, and avoidance of use of medications that increase bone loss (e.g., glucocorticoids), should be adopted universally to reduce bone loss in postmenopausal women.23 For women with a high risk of fracture as determined by a combination of BMD and clinical risk factors (such as a prior spine or hip fracture, multiple fragility fractures, a T-score between −1 and −2.5, or with a 10-year risk of fracture of greater than 10%), potential pharmacotherapies include antiresorptive agents (e.g., bisphosphonates) that decrease bone turnover and anabolic agents (e.g., teriparatide or romosozumab) that stimulate bone formation.15,22-25 According to the clinical expert, pharmacotherapy is required for patients with a greater than 20% risk of fracture over 10 years, while for those with a moderate risk of fracture (between 10% to 20%), pharmacotherapy is optional.
In Canada, different classes of drugs are indicated for osteoporosis, including 4 bisphosphonates (alendronate, risedronate, etidronate, and zoledronic acid), various forms of postmenopausal hormone therapy, a selective estrogen-receptor modulator (raloxifene), a biologic (denosumab), and a parathyroid hormone analogue (teriparatide). The 2010 Canadian clinical practice guidelines recommend the bisphosphonates alendronate and risedronate as first-line treatments, with high-quality evidence supporting benefits in the prevention of hip, nonvertebral, and vertebral fractures.5,22 Among these, alendronate and risedronate accounted for the vast majority of all dispensed oral osteoporosis medications.26,27 However, bisphosphonates are associated with reduced adherence due to gastrointestinal AEs6,7 and rare SAEs, including atrial fibrillation, ONJ, and atypical femoral fractures.28,29 Alternative first-line medications include denosumab, zoledronic acid, and raloxifene. Although teriparatide is also listed, the high cost of this anabolic therapy and the need for daily injections for 2 years restrict access to the medication. Raloxifene is only recommended for the prevention of vertebral fractures and therefore is not considered for use in most patients, except for those early in menopause, when the spine BMD begins to drop but hip bone density is usually preserved. Evidence supporting the efficacy of cyclic etidronate with calcium supplementation is weaker. For patients at high risk of fractures residing in long-term care, raloxifene and cyclic etidronate with calcium supplementation are not recommended.22
Drug
Romosozumab is a humanized monoclonal antibody that inhibits the action of sclerostin, a regulatory factor in bone metabolism. It increases bone formation and, to a lesser extent, decreases bone resorption. Results of animal studies show that romosozumab stimulates new bone formation on trabecular and cortical bone surfaces by stimulating osteoblastic activity, resulting in increases in trabecular and cortical bone mass and improvements in bone structure and strength.8
On June 17, 2019, romosozumab was approved by Health Canada for the treatment of osteoporosis in postmenopausal women at high risk for fracture, defined as a history of osteoporotic fracture, or multiple risk factors for fracture.8 The reimbursement request by the sponsor for romosozumab is for the treatment of osteoporosis in postmenopausal women with a history of osteoporotic fracture and who are at very high risk for future fracture.
Romosozumab is available as a solution for subcutaneous injection in pre-filled syringes at a dose of 105 mg per 1.17 mL syringe. The recommended dosage of romosozumab is 210 mg administered once every month as 2 consecutive subcutaneous injections of 105 mg each using single-dose pre-filled syringes for 12 doses. Patients should be adequately supplemented with calcium and vitamin D. The treatment regimen for romosozumab is limited to 12 monthly doses. Once the patient has completed the 12-month romosozumab therapy, osteoporosis therapy with an antiresorptive agent should be considered. In the absence of a follow-on antiresorptive therapy, BMD gains typically trend toward pre-treatment levels following cessation of romosozumab.8
Romosozumab carries a serious warning regarding the potential risk of myocardial infarction, stroke, and cardiovascular death. Romosozumab should be discontinued in patients who experience a myocardial infarction or stroke. Table 3 provides details of the mechanism of action, indication, route and dose of administration, and adverse effects of romosozumab, alendronate, and denosumab.
Table 3: Key Characteristics of Romosozumab, Alendronate, and Denosumab
Heading | Romosozumab | Alendronate | Denosumab |
|---|---|---|---|
Mechanism of action | A humanized monoclonal antibody that inhibits the action of sclerostin, increases bone formation, and, to a lesser extent, decreases bone resorption | A bisphosphonate that acts as a potent, specific inhibitor of osteoclast-mediated bone resorption | A RANKL inhibitor that decreases bone resorption and increases bone mass and strength in both cortical and trabecular bone throughout the skeleton |
Indicationa | For the treatment of osteoporosis in postmenopausal women at high risk for fracture, defined as a history of osteoporotic fracture, or multiple risk factors for fracture | For the treatment and prevention of osteoporosis in postmenopausal women For the treatment of osteoporosis in men to reduce the incidence of fractures For the treatment and prevention of glucocorticoid-induced osteoporosis in men and women | For the treatment of postmenopausal women with osteoporosis at high risk for fracture, defined as a history of osteoporotic fracture, or multiple risk factors for fracture; or patients who have failed or are intolerant to other available osteoporosis therapy A treatment to increase bone mass in men with osteoporosis at high risk for fracture, defined as a history of osteoporotic fracture, or multiple risk factors for fracture; or patients who have failed or are intolerant to other available osteoporosis therapy A treatment to increase bone mass in men with nonmetastatic prostate cancer receiving androgen deprivation therapy who are at high risk for fracture A treatment to increase bone mass in women with nonmetastatic breast cancer receiving adjuvant aromatase inhibitor therapy, who have low bone mass and are at high risk for fracture A treatment to increase bone mass in women and men at high risk for fracture due to sustained systemic glucocorticoid therapy A treatment to increase bone mass in women and men at high risk for fracture who are starting or have recently started long-term glucocorticoid therapy |
Route of administration | Subcutaneous injection | Oral | Subcutaneous |
Recommended dose | 210 mg monthly × 12 months | Treatment of osteoporosis in postmenopausal women and in men: a single 70 mg tablet weekly or 10 mg tablet daily Prevention of osteoporosis in postmenopausal women: a single 5 mg tablet daily | 60 mg every 6 months |
Serious adverse effects or safety issues | Contraindicated in patients with hypocalcemia Serious warnings and precautions: may increase the risk of MI, stroke and CV death; not recommended in patients with a history of MI or stroke; treatment should be discontinued in patients that experience an MI or stroke | Contraindicated in patients with abnormalities of the esophagus, who cannot stand or sit upright for at least 30 minutes, who are at increased risk of aspiration, those with hypocalcemia, or those with renal insufficiency Warnings and precautions: potential for esophageal irritation; ONJ; severe bone, joint and/or muscle pain; low-energy fractures of subtrochanteric and proximal femoral shaft; local irritation of the upper gastrointestinal mucosa; and ocular disturbances | Contraindicated in patients with hypocalcemia or female patients who are pregnant or are trying to become pregnant Warnings and precautions: hypocalcemia must be corrected prior to treatment with denosumab; clinical monitoring of calcium levels is recommended before each dose, and in patients predisposed to hypocalcemia, < 2 weeks after the initial dose; potential for serious infections for patients on concomitant immune-suppressant agents or with impaired immune systems; ONJ; AFF; multiple vertebral fractures following discontinuation of denosumab |
AFF = atypical femoral fractures; CV = cardiovascular; MI = myocardial infarction; ONJ = osteonecrosis of the jaw; RANKL = receptor activator of nuclear factor kappa-B ligand.
aHealth Canada–approved indication.
Source: Product monographs of Evenity,8 Fosamax,30 and Prolia.31
Stakeholder Perspectives
Patient Group Input
This section was prepared by CADTH staff based on the input provided by patient groups.
About the Patient Group and Information Gathered
One patient group, Osteoporosis Canada, submitted the patient input for this review. Osteoporosis Canada is a national organization dedicated to serving people who have or are at risk of developing osteoporosis. The organization works to educate, empower, and support individuals and communities in the risk reduction of osteoporosis and related fractures. Its vision is a Canada without osteoporotic fractures and to this end it educates Canadians about osteoporosis, advocates for optimal osteoporosis care, and invests in osteoporosis research.
Osteoporosis Canada spoke directly with patients who have either completed 1 year of romosozumab or have been on it for several months, after obtaining permission from treating physicians who were on the Scientific Advisory Council of Osteoporosis Canada. From February 3 to 15, 2021, Osteoporosis Canada interviewed 4 patients with an average age of 70 in the Greater Toronto Area regarding their personal experience with romosozumab. Osteoporosis Canada recognized that the information it gathered on direct patient experience with this drug is limited. There have been no further fractures in patients interviewed at very high risk of fracture, who tolerated the drug well with no or minimal side effects and valued the opportunity to be treated on this new drug. In 2018, Osteoporosis Canada conducted a survey of patients living with osteoporosis to provide input in updating the 2010 Clinical Practice Guidelines for the Diagnosis and Management of Osteoporosis in Canada. In this survey, information on the issues and health outcomes that was deemed important to the patients was collected from more than 1,000 members of the Canadian Osteoporosis Patient Network. Some patient input from this survey was used to inform this submission.
Disease Experience
The patient group indicated that it recognizes that the most important and feared consequence of osteoporosis is the risk of fracture. Fractures can occur at several sites but are of significant concern when affecting the spine, hips, wrists, or shoulders. From the patient’s perspective, the impact of a fracture can be substantial; fractures in older populations are associated with acute and chronic pain, changes in levels or loss of independence, decreased mobility, social isolation resulting in depression, or institutionalization as a result of a fragile fracture. It is estimated that up to 40%, or even 50%, of elderly individuals who sustain a hip fracture will experience a significant decline in their ability to live independently. Additionally, 28% of women and 37% of men who suffer a hip fracture will die within a year from complications. Even a relatively simple wrist fracture will interfere with a person’s daily activities. For younger seniors, this may result in time away from work, possibly with a financial impact. In many cases, it results in increased care requirements from family members and/or other caregivers. According to Osteoporosis Canada, 1.5 million work-days are lost annually in Canada by fracture patients and 400,000 days are lost by caregivers.
Everyday activities can be severely compromised for those with fractures. If an individual has osteoporosis affecting the spine and is at high risk of fracture, an activity as ordinary as making a bed or the act of bending forward without caution can cause a fracture. A cough or sneeze can break a rib. Intimate relations are compromised. Activities such as golf or tennis, or picking up a grandchild, may have to be avoided because of the possibility of inducing a fracture. The knowledge that bones may break with minimal trauma results in significant fear of falling, which further limits independence and mobility.
Experiences With Treatments
Four patients who have experience with romosozumab were interviewed. The first patient was a 65-year-old female who was diagnosed with osteoporosis several years ago and was intolerant of bisphosphonate and denosumab. She received a 9-month treatment of romosozumab in the doctor’s office, administered by a nurse. This patient indicated that romosozumab worked well for her without serious side effects, except for some tolerable joint, muscle, hip, and groin pain. The second patient was a 77-year-old female who continued to be at very high risk of an osteoporotic fracture despite prior exposure to other, unspecified drugs. She completed 12 months of romosozumab therapy and reported no side effects, and no pain or irritation from the treatment. The third patient was a female in her mid-70s who was diagnosed with osteoporosis several years ago and suffered osteoporotic fractures but for whom other, unspecified drugs were contraindicated. She completed 6 months of romosozumab therapy. This patient was grateful for being offered this treatment as other osteoporosis medications had either failed or are contraindicated. She experienced an injection-site reaction on the day of and the day after the injection, but these were considered inconsequential. The fourth patient was a male in his early 60s who was diagnosed in May 2019. He was prescribed 12 months of romosozumab because of the severity of his osteoporosis. After the treatment, significant increases in BMD of both the hip and spine were observed. Minimal side effects, such as soreness at the injection-site and mild leg pain, were reported. None of these patients had problems with the administration of romosozumab.
Many common themes emerge from these interviews. The patients did not have an adequate response to or could not tolerate the conventional available drugs. They continued to fracture. These patients valued a new treatment option that works differently from conventional options, 1 that both builds new bone and prevents bone loss, is easier to administer, and has fewer side effects. The patients said that this new drug offers hope that new fractures will be prevented and that quality of life, including functionality and independence, will be maintained.
Patients expressed appreciation for the opportunity to choose an anabolic therapy option other than teriparatide. They appreciated that romosozumab involves 12 monthly injections rather than daily injections for 24 months (as is the case with teriparatide).
Improved Outcomes
Respondents to the Osteoporosis Canada survey reported that the outcomes that were of most importance to them were preserving quality of life (for example, improved mobility and independence), preventing fracture-related deaths, preventing admission to long-term care homes, preserving their ability to perform daily physical and social activities, preventing all fractures related to osteoporosis, and avoiding serious side effects.
Respondents expressed the desire for a choice of treatment regimens when unable to tolerate conventional medications, experiencing inadequate response to other medications, or having severe osteoporosis and continuing to fracture. The patients who were interviewed indicated that, compared to teriparatide, romosozumab may be more acceptable to many patients due to its less-frequent (monthly) injection schedule and shorter treatment course. Some patients received the injection from a health care professional, which was convenient; and some learned to self-inject.
Patients interviewed expressed appreciation for a novel therapy that both increases bone formation and bone resorption. The treatment under review holds great promise for patients for whom conventional therapies are contraindicated or not working.
Clinician Input
Input From the Clinical Expert Consulted by CADTH
All CADTH review teams include at least 1 clinical specialist with expertise in the diagnosis and management of the condition for which the drug is indicated. Clinical experts are a critical part of the review team and are involved in all phases of the review process (e.g., providing guidance on the development of the review protocol, assisting in the critical appraisal of clinical evidence, interpreting the clinical relevance of the results, and providing guidance on the potential place in therapy). The following input was provided by a clinical specialist with expertise in the diagnosis and management of osteoporosis.
Unmet Needs
Although oral bisphosphonates are most commonly prescribed for the treatment of osteoporosis, they are associated with inconvenient administration, gastrointestinal toxicities, and low absorption rates. Parenteral bisphosphonates offer greater benefit and fewer adverse effects, but are more costly than oral formulations. Primary care physicians are less likely to prescribe IV formulations, which are perceived as drugs to be prescribed by a specialist, and some patients are reluctant to receive IV infusions or subcutaneous injections. In addition, although patients with renal insufficiency and renal failure often suffer from substantial bone loss and fragility, current treatment options for this patient group are limited. Only denosumab is considered safe in this population at present. There is a substantial unmet need for medications that can preserve bone mass and reduce the risk of fracture but are safe in the renal-failure population.
Place in Therapy
Romosozumab would be used as a first-line treatment for patients with the lowest BMD and greatest risk of fracture. Romosozumab should be followed with an antiresorptive medication to maintain any gains in BMD and bone strength. Romosozumab would also be used as a second-line treatment after patients fail on an antiresorptive agent and have significant bone loss and fractures. Romosozumab can be used again if the subsequent antiresorptive use fails to maintain the bone mass and strength achieved through the initial romosozumab therapy.
According to the clinical expert, if romosozumab were affordable and covered by the public drug benefit programs, it would cause a significant shift in the current treatment paradigm in postmenopausal women with osteoporosis. Treatment with romosozumab increases bone formation and improves bone strength, and subsequent antiresorptive use maintains raised BMD levels, reducing the risk of fracture in the future.
Patient Population
Romosozumab shows treatment effects in males and females of all adult age groups that have been studied, and at all levels of initial BMD. The expert indicated that all patients with osteoporosis would benefit from the increased bone formation and strength associated with romosozumab, and those at the highest risk of fracture and/or with the lowest BMD would benefit most. These patients can be identified through a combination of fracture risk estimation using FRAX, documentation of prior fragility fractures (by radiographic imaging and patient’s medical history), and routine BMD testing.
Patients at low risk of fracture are least suitable for treatment with romosozumab.
Assessing Response to Treatment
In clinical practice, treatment response is assessed using change in BMD. Bone typically responds slowly to any treatment, such that an 18- to 24-month interval is more suitable when treating with a bisphosphonate or denosumab, but a significant improvement in BMD may be observed after a full year of treatment with romosozumab. The clinical expert suggests measuring BMD at 12 months, when the patient transitions to antiresorptive therapy, and again 12 to 18 months later after a treatment change.
It is also possible to measure the bone formation marker P1NP at baseline and a month later. An increase in serum P1NP at 1 month from baseline may predict a BMD response at 1 year. However, measurement of this marker is not widely available in Canada, and a change in P1NP did not correlate well with the net change in BMD at 1 year in a post hoc analysis of the STRUCTURE study.
Discontinuing Treatment
Romosozumab treatment should be discontinued if the adverse effects, such as an allergic response with hives or anaphylaxis, are intolerable. When a cardiovascular event occurs, the clinician should consider stopping the treatment if it is unknown whether the event is drug-related or not.
Prescribing Conditions
The involvement of a specialist is not required to diagnose, treat, or monitor patients who receive romosozumab. The drug can be administered in a primary care physician or nurse practitioner’s office, outpatient or specialty clinic, or by a community health nurse.
Clinician Group Input
No input was provided by clinician groups.
Drug Program Input
The drug programs provide input on each drug being reviewed through CADTH’s reimbursement review processes by identifying issues that may affect their ability to implement a recommendation. The implementation questions and corresponding responses from the clinical experts consulted by CADTH are summarized in Table 4.
Table 4: Summary of Drug Plan Input and Clinical Expert Response
Drug program implementation questions | Clinical expert response |
|---|---|
Considerations for initiation of therapy in special subpopulations | |
The product monograph advises no dosage adjustment may be required in patients with severe renal impairment (an estimated glomerular filtration rate of 15 mL/min/1.73 m2 to 29 mL/min/1.73 m2) or end-stage renal disease requiring hemodialysis; however, romosozumab should be used with caution. How will clinicians consider use of romosozumab in patients with renal impairment? | Treatment of osteoporosis in patients with overt renal failure is complicated and should be managed by an osteoporosis specialist. A bone biopsy is recommended to determine the patient’s situation. For a patient with renal failure and low bone formation, it is reasonable to use romosozumab. However, for the many renal-failure patients who have high bone turnover and high bone resorption, use of romosozumab is inappropriate due to secondary hyperparathyroidism and treatment with glucocorticoids. For milder degrees of renal failure the same problem will prevail; most patients will have high bone turnover for which a bone-forming agent is not the most appropriate treatment (an antiresorptive or antiremodelling agent is more appropriate). But if a bone biopsy documents low bone formation rates, then romosozumab could be indicated. |
The trial data are from women aged 55 to 90 years. Would postmenopausal women younger than 55 years of age be considered for romosozumab in practice? | Bone mass is normally stable in premenopausal women, whereas it declines after menopause due to the effects of low estrogen and aging, and the risk of fracture increases. Gaining BMD and bone strength are important in women at high risk of fracture. Therefore, postmenopausal women who are younger than 55 years of age can be considered for romosozumab therapy in practice. |
For patients who are currently receiving active treatment for osteoporosis (e.g., bisphosphonates), would they be switched to romosozumab in practice? | Postmenopausal women should include those with premature ovarian failure and those who have had a surgical menopause, e.g., post-ovariectomy, which can occur at any premenopausal age. If patients are currently receiving active treatment for osteoporosis, clinicians would likely switch to romosozumab only if they patient was not showing a satisfactory response to the current treatment and is still considered at high risk of facture. In general, the longer a patient has been on a bisphosphonate, the less benefit there would be to switching to romosozumab. Patients at low to moderate risk of fracture and receiving bisphosphonates should not switch to romosozumab. |
Would patients who have trialled teriparatide and not achieved treatment goals be prescribed romosozumab? | There is no restriction on use of romosozumab in patients who have received teriparatide previously. While teriparatide has a lifetime maximum use of 24 months, there is no such restriction on romosozumab. |
Considerations for continuation or renewal of therapy | |
Are there any issues with access to BMD testing within jurisdictions, especially in the COVID-19 context? Is testing difficult to access in rural areas? | Access to BMD testing varies across the country. Some provinces are better served than others. During the lockdown phases of the pandemic, it was not possible to have BMD testing. The expert consulted by CADTH indicated that at present, BMD testing has returned to normal in most of the areas of the country. Rural areas have reduced access to BMD among other radiological procedures. |
The trial data and the product monograph support use of romosozumab as a 12-month treatment course. However, neither provide clear guidance on re-treatment with romosozumab. How would this be considered in clinical practice, especially if there is evidence after the initial treatment that treatment goals were not achieved? What factors would lead you to think re-treatment with romosozumab would not benefit the patient? (Please be specific regarding criteria/thresholds.) | Evidence on re-treatment with romosozumab is available. Data suggest that continuous use of romosozumab is not expected to be beneficial, because the bone becomes unresponsive with such a course. However, intermittent treatment with romosozumab (completing a 1-year course and then having another after a lapse of a year or more) may be considered. If a patient saw no discernible benefit from 1 treatment course of romosozumab, it is unlikely that a second would be beneficial, but more data are needed to confirm this. If a patient had obvious gains in BMD with romosozumab and then after an interval showed a marked decline in BMD and/or new fragility fractures, that would be a clear-cut indication for potential re-treatment with romosozumab. If their imminent risk of fracture or 10-year risk of fracture had been reduced significantly, and then subsequently increased again, that would be a possible re-treatment indication. |
If a dose of romosozumab is missed or treatment needs to be temporarily stopped (e.g., a patient undergoing a procedure requires its discontinuation), how would this be handled in clinical practice? Is the regimen restarted or does the patient transition to another form of therapy or does the patient receive the rest of the medication for a total of 12 months? | The patients should receive a full 12-month treatment with romosozumab, even if the treatment may be interrupted. Most or all of the discernible effects of romosozumab appear to be lost in 12 to 18 months if it is not followed by antiresorptive treatment. Then, if the treatment interruption is expected to last several months, it would be prudent for the patient to be treated with an antiresorptive until the romosozumab can be resumed. |
Considerations for discontinuation of therapy | |
Aside from serious adverse events (e.g., major cardiovascular events), are there any reasons treatment with romosozumab would be discontinued before completing the recommended 12-month regimen? | The main reasons for treatment discontinuation would be intolerance to the medication, such as from anaphylaxis, hives, or rash. If the patient needs treatment with prednisone or a similar steroid to shut down the allergic response, the adverse effects of prednisone, which can cause bone loss, may negate the beneficial effects of romosozumab treatment. In such an instance, it may be prudent to temporarily switch to an antiresorptive treatment (a bisphosphonate or denosumab) until such a time as the patient has been weaned off prednisone or equivalent. Bisphosphonates and denosumab have been shown to prevent bone loss from ongoing glucocorticoid use, whereas there are no such studies for romosozumab at present. |
Considerations for prescribing of therapy | |
Will romosozumab be prescribed initially by a clinical specialist, e.g., an endocrinologist? There may be limited access to specialists within some regions. | As romosozumab is simple to prescribe, with 2 injections given once monthly, it may be prescribed by other health care providers. As long as the indications are followed, family physicians and nurse practitioners should be able to prescribe it, and it would likely be administered by them in their offices. In practice, primary care physicians and nurses tend to avoid new medications due to a lack of knowledge and experience, and insurance companies tend to prefer that specialists prescribe expensive rather than primary care personnel. Although primary care physicians and nurse practitioners should be able to prescribe romosozumab, it may effectively be a specialist-only drug for the initial years if insurance companies insist. |
Romosozumab is recommended for use as monotherapy, but are there scenarios when physicians may want to prescribe it in concurrent combination (instead of sequential) with other treatments for osteoporosis such as oral bisphosphonates? | In general, studies using combinations of other osteoporosis medications have shown no added or synergistic benefit from combination-therapy regimens, although there are a few scenarios where combination therapy may be useful. Evidence for any potential benefit from combination therapy with romosozumab is lacking. The clinical expert consulted by CADTH advised against using romosozumab in combination regimens until compelling evidence is available to show that it is beneficial in terms of preventing fractures. Monotherapy refers to use of these osteoporosis drugs, whereas all patients should be receiving calcium and vitamin D concurrently, either through optimization of diet or use of supplements. All clinical trials with osteoporosis medications involved optimized calcium and vitamin D intake; failing to optimize such intake can be expected to blunt or even negate the effect of any osteoporosis pharmacotherapy. |
Other implementation issues | |
Would the drug be initiated in the hospital setting post-fracture, and then maintained in the community setting? | Romosozumab is expected to be given in the primary care office and possibly in specialty clinics. In the expert’s experience, when prescribing romosozumab or denosumab, the patient is instructed to go to a family physician to receive an injection. Some patients are happy to learn to self-inject, but this is somewhat more challenging with romosozumab due to the higher injection volumes and the need to administer 2 injections on the same day. |
BMD = bone mineral density.
Clinical Evidence
The clinical evidence included in the review of romosozumab is presented in 3 sections. The first section, the systematic review, includes pivotal studies provided in the sponsor’s submission to CADTH and Health Canada, as well as those studies that were selected according to an a priori protocol. The second section includes indirect evidence from the sponsor and indirect evidence selected from the literature that met the selection criteria specified in the review. The third section includes sponsor-submitted long-term extension studies and additional relevant studies that were considered to address important gaps in the evidence included in the systematic review.
Systematic Review (Pivotal and Protocol-Selected Studies)
Objectives
To perform a systematic review of the beneficial and harmful effects of romosozumab (solution for injection, 105 mg per 1.17 mL syringe) for the treatment of osteoporosis in postmenopausal women at high risk for fracture, defined as a history of osteoporotic fracture, or multiple risk factors for fracture.
Methods
Studies selected for inclusion in the systematic review include pivotal studies provided in the sponsor’s submission to CADTH and Health Canada, as well as those meeting the selection criteria presented in Table 5. Outcomes included in the CADTH review protocol reflect those considered to be important by patients, clinicians, and drug plans.
Table 5: Inclusion Criteria for the Systematic Review
Criteria | Description |
|---|---|
Population | Post-menopausal women who are diagnosed with osteoporosis and at high risk for fracture Subgroups: • History of fragility fracture • Previous treatment for osteoporosis • BMD T-score at baseline (≤ −2.5 vs. > 2.5) • Risk of future fracture |
Intervention | Romosozumab 210 mg monthly, subcutaneously for ≤ 12 months |
Comparator | Bisphosphonates: • alendronate • risedronate • zoledronic acid RANKL inhibitors: denosumab SERM: raloxifene |
Outcomes | Efficacy outcomes: New fractures (vertebral, hip, and others) HRQoL Mortality Change in BMD Change in bone turnover markers (e.g., P1NP, CTX) Hospitalization related to fracture Harms outcomes: AEs, SAEs, WDAEs, mortality, and notable harms/harms of special interest (myocardial infarction, stroke, cardiovascular death, ONJ, hypersensitivity) |
Study designs | Published and unpublished phase III and IV RCTs |
AE = adverse event; BMD = bone mineral density; CTX = C-telopeptide; HRQoL = health-related quality of life; ONJ = osteonecrosis of the jaw; P1NP = procollagen type 1 N-terminal propeptide; RANKL = receptor activator of nuclear factor kappa-B ligand; RCT = randomized controlled trial; SAE = serious adverse event; SC = subcutaneous injection; SERM = selective estrogen-receptor modulator; WDAE = withdrawal due to adverse event.
The literature search for clinical studies was performed by an information specialist using a peer-reviewed search strategy according to the Peer Review of Electronic Search Strategies checklist (https://www.cadth.ca/resources/finding-evidence/press).32
Published literature was identified by searching the following bibliographic databases: MEDLINE All (1946‒) via Ovid and Embase (1974‒) via Ovid. The search strategy comprised both controlled vocabulary, such as the National Library of Medicine’s MeSH (Medical Subject Headings), and keywords. The main search concept was Evenity (romosozumab). Clinical trials registries searched included the US National Institutes of Health’s clinicaltrials.gov, WHO’s International Clinical Trials Registry Platform search portal, Health Canada’s Clinical Trials Database, and the European Union Clinical Trials Register.
No filters were applied to limit the retrieval by study type. Retrieval was not limited by publication date or by language. Conference abstracts were excluded from the search results. Appendix 1 provides detailed search strategies.
The initial search was completed on March 10, 2020. Regular alerts updated the search until the meeting of the CADTH Canadian Drug Expert Committee on September 22, 2021.
Grey literature (literature that is not commercially published) was identified by searching relevant websites from the Grey Matters: A Practical Tool For Searching Health-Related Grey Literature checklist (https://www.cadth.ca/grey-matters).33 Included in this search were the websites of regulatory agencies (US FDA and European Medicines Agency). Google was used to search for additional internet-based materials. Appendix 1 provides more information on the grey literature search strategy.
These searches were supplemented by reviewing bibliographies of key papers and through contacts with appropriate experts. In addition, the sponsor of the drug was contacted for information regarding unpublished studies.
Findings from the Literature
Two studies were identified from the literature for inclusion in the systematic review (Figure 1). The included studies are summarized in Table 6.
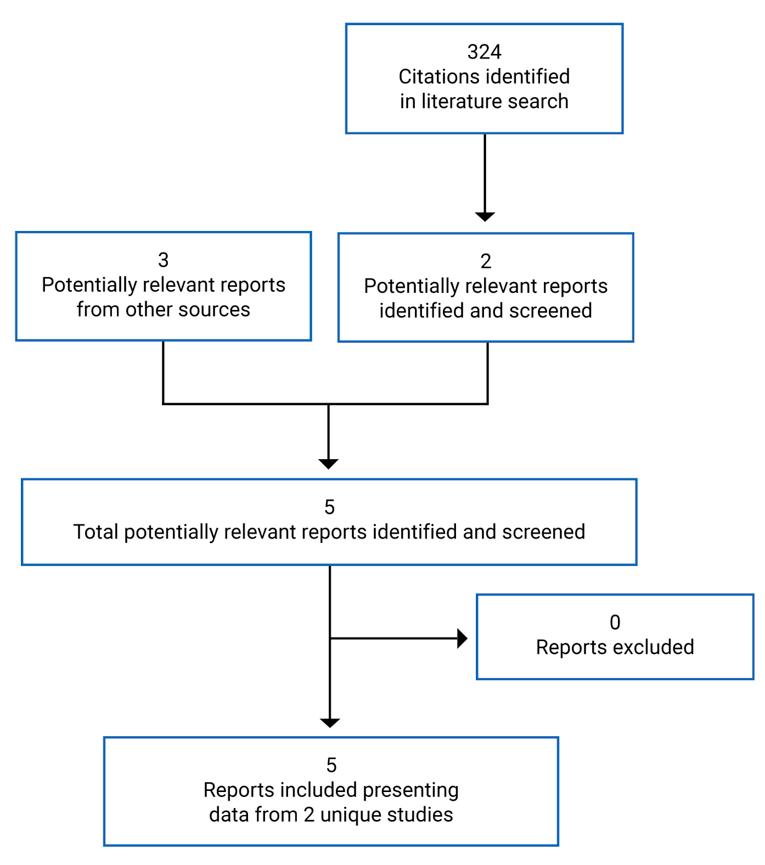
Table 6: Details of Included Studies
Study details | FRAME | ARCH |
|---|---|---|
Designs and populations | ||
Study design | Phase III, multi-centre, double-blind, placebo-controlled RCT | Phase III, multi-centre, double-blind, active-controlled RCT |
Locations | 222 centres in Europe, Central and Latin America, Asia, North America, Australia, and New Zealand | 270 centres in Europe, Australia and New Zealand, Asia, North America including Canada and Central and Latin America, and Africa |
Patient enrolment dates | First patient enrolled: March 15, 2012 Last patient completed 24-month visit: December 14, 2015 | First patient enrolled: May 4, 2012 Last patient enrolled: February 18, 2015 |
Randomized (N) | 7,180 | 4,093 |
Inclusion criteria | Ambulatory postmenopausal women, age ≥ 55 to ≤ 90 years at randomization BMD T-score ≤ −2.50 at the total hip or femoral neck ≥ 2 vertebrae in the L1 through L4 region and at least 1 hip was evaluable | Ambulatory postmenopausal women, age ≥ 55 to ≤ 90 years at randomization. Patients met at least 1 of the following BMD and fracture criteria: BMD T-score ≤ −2.50 at the total hip or femoral neck and either ≥ 1 moderate or severe vertebral fracture or ≥ 2 mild vertebral fractures or BMD T-score ≤ −2.00 at the total hip or femoral neck and either ≥ 2 moderate or severe vertebral fractures or a fracture of the proximal femur that occurred within 3 to 24 months before randomization At least 1 hip was evaluable by DXA as assessed by the principal investigator |
Exclusion criteria | BMD T-score ≤ −3.50 at the total hip or femoral neck History of hip fracture Any severe or > 2 moderate vertebral fractures Use of the following agents affecting bone metabolism: Strontium ranelate or fluoride (for osteoporosis): > 1 month of cumulative use within 5 years before randomization | Use of the following agents affecting bone metabolism: Strontium ranelate or fluoride (for osteoporosis): > 1 month of cumulative use within 5 years before randomization |
Exclusion criteria (continued) | IV bisphosphonates:
Oral bisphosphonates: any dose received within 3 months before randomization, > 1 month of cumulative use between 3 and 12 months before randomization, or > 3 years of cumulative use, unless last dose received ≥ 5 years before randomization Denosumab or any cathepsin K inhibitor: any dose received within 18 months before randomization. Teriparatide or any PTH analogues: any dose received within 3 months before randomization, or > 1 month of cumulative use between 3 and 12 months before randomization Systemic oral or transdermal estrogen or SERMs: > 1 month of cumulative use within 6 months before randomization Hormonal ablation therapy: > 1 month of cumulative use within 6 months before randomization Tibolone, cinacalcet, or calcitonin: any dose received within 3 months before randomization. Systemic glucocorticosteroids: ≥ 5 mg prednisone equivalent per day for > 14 days within 3 months before randomization History of metabolic or bone disease (except osteoporosis) that may interfere with the interpretation of the results. History of solid organ or bone marrow transplants History of ONJ Vitamin D insufficiency Current hyper- or hypocalcemia Current, uncontrolled hyper- or hypothyroidism | IV bisphosphonates:
Oral bisphosphonates: any dose received within 3 months before randomization, > 1 month of cumulative use between 3 and 12 months before randomization, or > 3 years of cumulative use, unless last dose received ≥ 5 years before randomization Denosumab or any cathepsin K inhibitor: any dose received within 18 months before randomization Teriparatide or any PTH analogues: any dose received within 3 months before randomization, or > 1 month of cumulative use between 3 and 12 months before randomization Systemic oral or transdermal estrogen or SERMs: > 1 month of cumulative use within 6 months before randomization Hormonal ablation therapy: > 1 month of cumulative use within 6 months before randomization Tibolone, cinacalcet, or calcitonin: any dose received within 3 months before randomization Systemic glucocorticosteroids: ≥ 5 mg prednisone equivalent per day for > 14 days within 3 months before randomization History of metabolic or bone disease (except osteoporosis) that may interfere with the interpretation of the results History of solid organ or bone marrow transplants Vitamin D insufficiency Current hyper- or hypocalcemia Current, uncontrolled hyper- or hypothyroidism |
Exclusion criteria (continued) | Current, uncontrolled hyper- or hypoparathyroidism Possible diagnosis of multiple myeloma or related lymphoproliferative disorder Contraindicated or intolerant to denosumab therapy | Current, uncontrolled hyperparathyroidism or history of hypoparathyroidism Possible diagnosis of multiple myeloma or related lymphoproliferative disorder Contraindicated or intolerant to alendronate therapy |
General exclusion criteria |
| |
Drugs | ||
Intervention | Romosozumab 210 mg SC monthly × 12 months followed by denosumab 60 mg SC every 6 months × 12 months | Romosozumab 210 mg SC monthly × 12 months followed by alendronate 70 mg PO weekly 12 months |
Comparators | Placebo SC monthly × 12 months followed by denosumab 60 mg SC every 6 months × 12 months | Alendronate 70 mg PO weekly × 12 months followed by alendronate 70 mg PO weekly × 12 months |
Duration | ||
Phase | ||
Screening | ≤ 35 days | ≤ 35 days |
Double-blind | 12 months | 12 months |
Follow-up | 12 months open-label treatment with denosumab | 12 months open-label treatment with alendronate |
Outcomes | ||
Primary end points | Incidence of new vertebral fracture through month 12 Incidence of new vertebral fracture through month 24 | Incidence of clinical fracture (nonvertebral fracture and clinical vertebral fracture) Incidence of new vertebral fracture through month 24 |
Secondary and exploratory end points | Secondary end points Incidence of the following fracture outcomes through month 24:
| Secondary end points Incidence of the following fracture outcomes through month 12 or 24:
|
Secondary and exploratory end points (continued) |
% change from baseline in BMD at lumbar spine, total hip and femoral neck Exploratory end points:
Safety:
|
% change from baseline in BMD at lumbar spine, total hip, and femoral neck at months 24 and 36 Exploratory end points:
Safety:
|
Notes | ||
Publications | Cosman et al. (2016)34 | Saag et al. (2017)35 |
AE = adverse event; BMD = bone mineral density; BPI = Brief Pain Inventory EQ-5D-5L = EuroQol 5-Dimensions 5-Levels questionnaire; HBV = hepatitis B virus; HCV = hepatitis C virus; HRQoL = health-related quality of life; IV = IV; LAD = limited activity days; ONJ = osteonecrosis of the jaw; OPAQ-SV = Osteoporosis Assessment Questionnaire; PO = orally; PTH = parathyroid hormone; RCT = randomized controlled trial; SAE = serious adverse event; SC = subcutaneous; SERM = selective estrogen-receptor modulator; WDAE = withdrawal due to adverse event.
Note: Three additional reports were included: the submission,36 Health Canada Reviewer’s Report,37 and FDA report.38
Description of Studies
FRAME (N = 7,180) was a phase III, multi-centre, double-blind, placebo-controlled RCT to evaluate the efficacy and safety of romosozumab for the treatment of osteoporosis in postmenopausal women. Eligible patients were randomized 1:1 to receive romosozumab 210 mg by subcutaneous injection or placebo once a month for 12 months. Randomization was stratified by age group (< 75 years versus ≥ 75 years) and prevalent vertebral fracture. Patients, investigators, and the sponsor remained blind to the initial treatment assignment. After the 12-month double-blind treatment period, both groups received open-label denosumab 60 mg every 6 months for an additional 12 months. During this period, patients remained blinded to the initial treatment allocation. After the first 24-month treatment (12 months with romosozumab or placebo followed by 12 months with denosumab), patients entered a 12-month open-label extension period, during which they continued to receive denosumab 60 mg every 6 months (Figure 2).
The co-primary efficacy end points were the incidence of new vertebral fracture at month 12 and at month 24.
Figure 2: FRAME Study Flow Chart
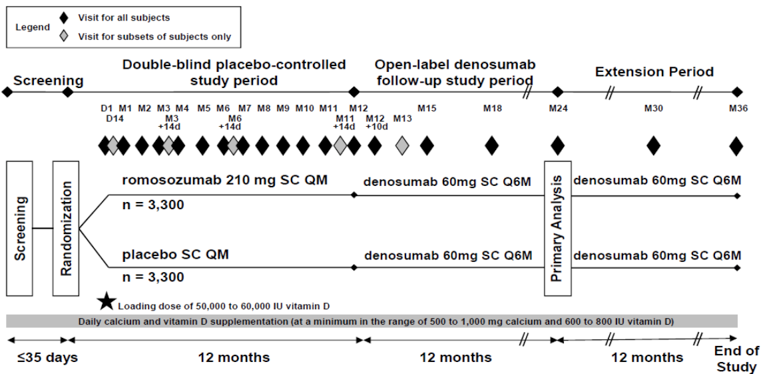
D and d = day; M = month; QM = every month; Q6M = every 6 months; SC = subcutaneously.
Note: The n = 3,300 per treatment group refers to planned enrolment.
Source: Clinical Study Report for FRAME.9
The ARCH study (N = 4,093) was a phase III, multi-centre, double-blind, active-controlled RCT to evaluate the efficacy and safety of romosozumab in postmenopausal women with a high risk of fracture. Eligible patients were randomized in a ratio of 1:1 to receive romosozumab subcutaneously or oral alendronate 70 mg for 12 months. Randomization was stratified by age (< 75 years versus ≥ 75 years). After the initial 12-month double-blind alendronate-controlled study period, both groups received open-label alendronate 70 mg once a week for an additional 12 months, while remaining blind to their initial treatment assignment of romosozumab or alendronate (Figure 3).
The primary efficacy end points in ARCH were the incidence of new vertebral fracture at month 24 and incidence of clinical fracture (nonvertebral fracture and clinical vertebral fracture) during the primary analysis study period, which refers to randomization to the time point at which clinical fractures were confirmed for at least 330 patients and all patients have had the opportunity to complete the month 24 study visit.
Figure 3: ARCH Study Flow Chart
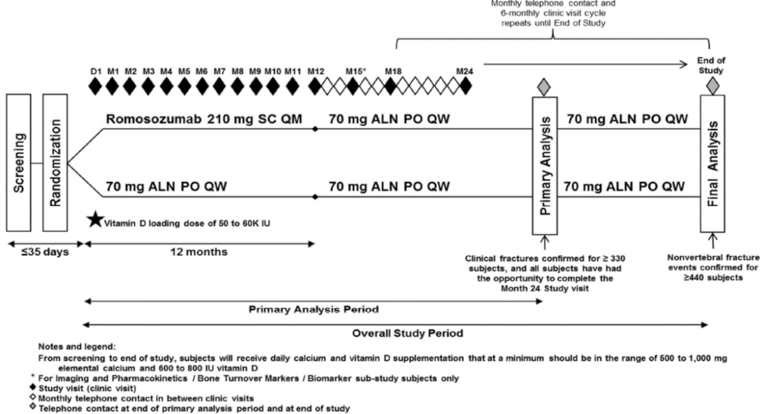
ALN = alendronate; D = day; IU = international unit; M = month; PO = orally; QM = every month; QW = every week; SC = subcutaneously.
Note: Study completion constituted completion of primary analysis if superiority was proven for nonvertebral fractures or when at least 440 patients experienced a nonvertebral fracture.
Source: Clinical Study Report for ARCH.10
Populations
Inclusion and Exclusion Criteria
In FRAME, postmenopausal women aged 55 to 90 years at randomization (post-menopause was defined as no vaginal bleeding or spotting for 12 consecutive months before screening) were screened. Patients were eligible if they had a BMD T-score of −2.50 or lower at the total hip or femoral neck, as assessed by the central imaging vendor at the time of screening, based on DXA scans and using data for Caucasian women from the 1998 National Health and Nutritional Examination Survey. At least 2 vertebrae in the L1 through L4 region and at least 1 hip were evaluable by DXA, as assessed by the principal investigator, based on lateral spine X-rays. Patients were excluded if they had a BMD T-score of no more than −3.50 at the total hip or femoral neck at baseline, a hip fracture at any time, any severe or more than 2 moderate vertebral fractures, severe metabolic or bone diseases, and significant laboratory abnormalities.
In ARCH, postmenopausal women aged 55 to 90 years who met at least 1 of the following criteria were eligible: a BMD T-score of −2.5 or less at the total hip or femoral neck and either 1 or more moderate or severe vertebral fractures or 2 or more mild vertebral fractures; or a BMD T-score of −2.0 or less at the total hip or femoral neck and either 2 or more moderate or severe vertebral fractures or a fracture of the proximal femur sustained 3 to 24 months before randomization. The BMD T-scores at the time of screening were assessed by the central imaging vendor based on DXA scans and using data for Caucasian women from the 1998 National Health and Nutritional Examination Survey. Vertebral fractures at the time of screening were assessed by the central imaging vendor based on lateral spine X-rays. Histories of proximal femur fractures were assessed by the principal investigator based on a discharge summary, radiology report, or comparable documentation of type and date of fracture. Patients were excluded if the glomerular filtration rate was < 35 mL/min/1.73 m3 of body surface area.
In both studies, patients with recent use of certain osteoporosis drugs affecting bone metabolism were excluded. Details of inclusion and exclusion criteria in FRAME and ARCH are provided in Table 6.
Baseline Characteristics
In both studies, baseline characteristics were generally similar between treatment groups (Table 7). Patients in FRAME were approximately 3 years younger than those in ARCH. The mean age of the patients was 71 years in FRAME and 74 years in ARCH. More White patients were enrolled in ARCH (70% in ARCH versus 57% in FRAME). The ARCH study enrolled a patient population with higher risks for fracture: 96% of patients in ARCH with at least 1 prevalent vertebral fracture at baseline and 18% of those in FRAME had at least 1 prevalent vertebral fracture, BMD T-scores were lower in ARCH, and the 10-year probability of a major osteoporotic fracture calculated by FRAX was 20% in ARCH but 13% in FRAME.
Table 7: Summary of Baseline Characteristics — Full Analysis Set
Characteristic | FRAME | ARCH | ||
|---|---|---|---|---|
Romo/deno (n = 3,589) | Placebo/deno (n = 3,591) | Romo/alen (n = 2,046) | Alen/alen (n = 2,047) | |
Age, mean (SD), years | 70.9 (7.0) | 70.8 (6.9) | 74.4 (7.5) | 74.2 (7.5) |
Sex, n (%) | ||||
Female | 3,589 (100) | 3,591 (100) | 2,046 (100) | 2,047 (100) |
Race, n (%) | ||||
White | 2,063 (57.5) | 2,052 (57.1) | 1,447 (70.7) | 1,415 (69.1) |
Asian | 425 (11.8) | 441 (12.3) | 137 (6.7) | 149 (7.3) |
Black or African-American | 77 (2.1) | 74 (2.1) | 19 (0.9) | 23 (1.1) |
American Indian or Alaska Native | 64 (1.8) | 63 (1.8) | 5 (0.2) | 7 (0.3) |
Native Hawaiian or other Pacific Islander | 0 | 1 (< 0.1) | 0 | 2 (< 0.1) |
Multiple | 60 (1.7) | 59 (1.6) | 2 (< 0.1) | 4 (0.2) |
Other | 900 (25.1) | 901 (25.1) | 436 (21.3) | 446 (21.8) |
BMI, mean (SD), kg/m2 | 24.66 (4.3) | 24.74 (4.4) | 25.5 (4.4) | 25.4 (4.4) |
Any historical fracture, n (%) | 1,457 (40.6) | 1,469 (40.9) | 2,043 (99.9) | 2,043 (99.8) |
Prevalent vertebral fracture, yes, n (%) | 672 (18.7) | 645 (18.0) | 1,969 (96.2) | 1,964 (95.9) |
BMD T-score, mean (SD) | ||||
Lumbar spine | −2.72 (1.04) | −2.71 (1.04) | −2.94 (1.25) | −2.99 (1.24) |
Total hip | −2.48 (0.47) | −2.46 (0.47) | −2.78 (0.68) | −2.81 (0.67) |
Femoral neck | −2.76 (0.28) | −2.74 (0.29) | −2.89 (0.49) | −2.90 (0.50) |
25 (OH) vitamin D, mean (SD), nmol/L | 74.5 (30.2) | 74.2 (26.3) | 79.4 (32.5) | 77.7 (32.0) |
10-year probability of a major osteoporotic fracture based on FRAX, mean (SD) | 13.4 (8.8) | 13.4 (8.5) | 20.2 (10.2) | 20.0 (10.1) |
alen/alen = treatment with alendronate for 12 months followed by alendronate for additional 12 months; BMD = bone mineral density; BMI = body mass index; FRAX = Fracture Risk Assessment tool; OH = hydroxide; placebo/deno = treatment with placebo for 12 months followed by denosumab for additional 12 months; romo/alen = treatment with romosozumab for 12 months followed by alendronate for additional 12 months; romo/deno = treatment with romosozumab for 12 months followed by denosumab for additional 12 months; SD = standard deviation.
Interventions
In FRAME, eligible patients were randomized to receive romosozumab subcutaneously or matched placebo for 12 months. After the initial 12-months double-blind placebo-controlled period, all patients received open-label denosumab 60 mg subcutaneously every 6 months, while remaining blinded to their initial treatment assignment of romosozumab or placebo. After the 24-month study period, eligible patients who entered the extension period received an additional 12 months of open-label treatment with denosumab, for a total treatment period of 36 months.
In ARCH, eligible patients were randomized to receive subcutaneous romosozumab or oral alendronate 70 mg for 12 months. During this period, patients also received matched placebo for either alendronate or romosozumab. After the initial 12-month double-blind alendronate-controlled study period, both groups received open-label alendronate 70 mg once a week for an additional 12 months, while remaining blinded to their initial treatment assignment of romosozumab or alendronate. No dosing adjustments for romosozumab/placebo, alendronate/placebo, or alendronate were permitted.
In both studies, patients received daily calcium and vitamin D supplementation from screening to end of study at a minimum of 500 mg to 1,000 mg of elemental calcium and 600 IU to 800 IU of vitamin D. In addition, patients with a serum 25 (hydroxide) vitamin D level of 20 ng/mL or greater and no more than 40 ng/mL at screening received an initial loading dose of 50,000 IU to 60,000 IU vitamin D after randomization. Patients with a serum 25 (hydroxide) vitamin D level of greater than 40 ng/mL at screening may have received the vitamin D loading dose at the principal investigator’s discretion.
Outcomes
A list of efficacy end points identified in the CADTH review protocol that were assessed in the clinical trials included in this review is provided in Table 8. These end points are summarized below. A detailed discussion and critical appraisal of the outcome measures are provided in Appendix 2.
Table 8: Summary of Outcomes of Interest Identified in the CADTH Review Protocol
Outcome measure | FRAME | ARCH |
|---|---|---|
Primary, secondary, or exploratory | ||
Incidence of various types of fractures | ||
All fractures | NR | Secondary |
New vertebral fracture | Primary (measured at month 12 and month 24) | Primary |
Clinical fracture (nonvertebral fracture and clinical vertebral fracture) | Secondary | Primary |
Nonvertebral fracture | Secondary | Secondary |
New or worsening fracture | Secondary | Secondary |
Major nonvertebral fracture | Secondary | Secondary |
Hip fracture | Secondary | Secondary |
Major osteoporotic fracture | Secondary | — |
Multiple new or worsening vertebral fracture | Secondary | Secondary |
Change from baseline in BMD | Secondary | Secondary |
HRQoL | Exploratory | Exploratory |
Mortality | Safety end point | Safety end point |
BTMs | Assessed in 130 randomized patients enrolled in a BTM substudy of FRAME | Assessed in 298 randomized patients enrolled in a BTM substudy of ARCH |
BMD = bone mineral density; BTM = bone turnover marker; HRQoL = health-related quality of life; NR = not reported.
New Fractures (Vertebral, Hip, and Others)
The incidence of various fracture types was measured in both FRAME and ARCH. The different types of fracture are defined below.
New vertebral fractures occurred when there was an increase of at least 1 grade from the previous grade of 0 in any vertebra from T4 to L4 on the Genant semiquantitative scoring method.
Clinical fractures included clinical vertebral and nonvertebral fractures (excluding skull, facial, mandible, cervical vertebrae, thoracic vertebrae, lumbar vertebrae, metacarpus, finger phalanges, and toe phalanges) that were associated with signs and/or symptoms indicative of a fracture.
A nonvertebral fracture was defined as a fracture present on radiographs or other diagnostic images such as CT or MRI confirming the fracture within 14 days of the reported fracture image date on an electronic case report form, and/or documented in a radiology report, surgical report, or discharge summary, excluding skull, facial, mandible, cervical vertebrae, thoracic vertebrae, lumbar vertebrae, metacarpus, finger phalanges, and toe phalanges. Fractures associated with high trauma severity or pathologic fractures were excluded.
The major nonvertebral fracture type was a subset of nonvertebral fractures, including pelvis, distal femur (i.e., femur excluding hip), proximal tibia (i.e., tibia excluding ankle), ribs, proximal humerus (i.e., humerus excluding elbow), forearm, and hip.
The hip fracture type was a subset of nonvertebral fractures, including femur neck, femur intertrochanter, and femur subtrochanter.
Major osteoporotic fractures included hip, forearm, or humerus fractures that were not associated with a pathologic fracture regardless of trauma severity, and clinical vertebral fractures.
Health-Related Quality of Life
An exploratory outcome measure in both studies, HRQoL was measured with the OPAQ-SV and EQ-5D-5L at specific time points throughout the 24-month study period in FRAME and ARCH.
Mortality
Death rates were reported in both studies. In both FRAME and ARCH, an attempt was made to classify each death as cardiovascular- or non-cardiovascular-related based on predefined criteria. In the event a death could not be classified as either cardiovascular- or non-cardiovascular-related, it was classified as undetermined. In ARCH, all undetermined deaths were presumed to be cardiovascular-related for completeness.
Change in Bone Mineral Density
The percent changes from baseline in BMD at the lumbar spine, total hip, and femoral neck were compared between treatment groups in both studies.
Change in Bone Turnover Markers
Increases in bone turnover have been associated with aging and diseases such as osteoporosis, contributing to increased risks of a fracture. Change in BMTs from baseline was assessed in substudies in both FRAME and ARCH. The evaluated bone formation markers included P1NP, bone-specific alkaline phosphatase (BSAP) and osteocalcin, and the evaluated bone resorption marker was sCTX.
Hospitalization Related to Fractures
Hospitalization related to fractures was not assessed in either study.
Statistical Analysis
FRAME Study
A sample size of 6,600 patients was anticipated to provide 91% power to detect a 40% decrease in the risk of nonvertebral fractures after romosozumab treatment for 12 months and 88% power to detect an overall 30% decrease in the risk of nonvertebral fractures in the 24-month study period using a log-rank test (alpha = 0.05).
A fixed-sequence testing procedure was used for multiplicity adjustment of the co-primary and secondary efficacy end points to maintain the overall significance level at 0.05. If the testing sequence was stopped at a particular step, the remaining end points in the testing sequence were not formally tested for statistical significance, and the corresponding P values were considered descriptive. The P values for the analyses of other secondary, exploratory, and substudy end points were nominal without adjusting for multiplicity. All P values were 2-sided. The following sequence was used in the testing procedure:
Step 1: Subject incidence of new vertebral fracture through month 12 and through month 24 (co-primary end points; nominal P value for each end point < 0.05)
Step 2: Subject incidence of clinical fracture through month 12
Step 3: Subject incidence of nonvertebral fracture through month 12 and through month 24, using the Hochberg procedure at a 0.05 level within the step
Step 4: Subject incidence of clinical fracture through month 24
Step 5: Subject incidence of major nonvertebral fracture through month 12 and through month 24, using the Hochberg procedure at a 0.05 level within the step
Step 6: Subject incidence of new or worsening vertebral fracture through month 12 and through month 24, using the Hochberg procedure at a 0.05 level within the step
Step 7: Subject incidence of hip fracture through month 12 and through month 24, using the Hochberg procedure at a 0.05 level within the step.
For the co-primary end points in this study, the primary analysis set for vertebral fractures was used for analyses of patient incidence of new vertebral fracture through month 12 and through month 24. The number and percentage of patients with a new vertebral fracture was summarized by treatment group. The significance of the treatment effect between romosozumab and placebo (month 12) and between romosozumab/denosumab and placebo/denosumab (month 24) was assessed using a logistic regression model with treatment as the main effect and age and prevalent vertebral fracture strata as covariates. The odds ratio, corresponding 95% CI, and P value of the score test were provided. Statistical significance for the co-primary end points was declared if the P values for testing the treatment effects through month 12 and month 24 were both less than 0.05. Point estimates of absolute risk reduction (difference in proportions, control – treatment), risk ratio (ratio of proportions, treatment over control), and the corresponding 95% CIs were also calculated using the Mantel-Haenszel method, adjusting for age and prevalent vertebral fracture strata.
For the secondary fracture end points, analyses of new or worsening vertebral fractures and multiple new or worsening vertebral fractures were performed on the primary analysis set using the logistic regression analysis described for the co-primary end points. The significance of the treatment effect between romosozumab and placebo (month 12) or romosozumab/denosumab and placebo/denosumab (month 24) was assessed using a stratified Cox proportional hazards model that controlled for age and prevalent vertebral fracture strata and used treatment as the independent variable. The estimated hazard ratio, corresponding 95% CI, and the P value of the score test were provided. The point estimate of the adjusted risk difference (difference in Kaplan–Meier estimates; control arm − treatment arm) and the corresponding 95% CIs were also provided using the inverse variance-weighted method. Adjusted P values based on the testing sequence for secondary fracture end points were provided in addition to the nominal P values from the statistical tests.
Subgroups analyses were performed for new vertebral fractures, clinical fractures, and nonvertebral fractures at months 12 and 24 using subgroup age categories (younger than 65 and 65 years or older, younger than 75 years and 75 years or older), as well as categories based on prevalent vertebral fracture status (yes, no), history of fragility fracture (yes, no), history of nonvertebral fracture at age ≥ 55 years (yes, no), race (White, non-White), geographic region (Western Europe; Australia and New Zealand; Central and Eastern Europe; Asia Pacific; North America; and Central or Latin America), baseline lumbar spine BMD T-score (≤ −3, > −3 and ≤ −2.5, > −2.5), baseline total hip or femoral neck BMD T-score (≤ −3 versus both total hip and femoral neck BMD T-score > −3), baseline BMI, and FRAX score for major osteoporotic fractures. The treatment-by-subgroup interaction was tested quantitatively. If the P value for the quantitative interaction was no greater than 0.05, qualitative interaction testing was performed.
Missing data for the vertebral fracture rate were imputed using the LOCF method.
For BMD end points, the primary efficacy analysis set for BMD (month 12 and month 24) was used for analyses of percent change from baseline in BMD. The treatment comparisons of the BMD in the lumbar spine, total hip, and femoral neck at months 12 and 24 were analyzed using an analysis of covariance (ANCOVA) model with LOCF imputation as the primary analysis. The ANCOVA model included treatment, age, prevalent vertebral fracture strata, and baseline value of the end point. Additional covariates of machine type and machine type-by-baseline value interactions were also included. The least squares mean of the treatment difference (treatment − control), the corresponding 95% CI, and P value were used to compare treatments at each time point.
ARCH Study
The total planned sample size of approximately 4,000 patients (2,000 patients per treatment group) was determined based on the clinical fracture and new vertebral fracture end points. The dropout rate was assumed to be 10% for the first year and 8% per year thereafter. Because the study design required all patients to complete the month 24 visit for the ascertainment of the new vertebral fracture end point, the minimum follow-up for an individual subject was at least 24 months. Additionally, all patients were to be followed until nonvertebral fracture events were confirmed in 440 patients for the final analysis, but this follow-up was not required as superiority of the nonvertebral fracture end point was achieved at the primary analysis.
The statistical significance for the primary end points (new vertebral fractures through month 24; clinical fractures through primary analysis) and selected key secondary end points (lumbar spine, total hip, and femoral neck BMD at month 24 and month 12; nonvertebral fractures through the primary analysis), were controlled using a sequential testing procedure to maintain the overall significance level for the study at 0.05, as determined by the Hochberg procedure. With this procedure, formal inferential testing was performed for a step only when statistical significance was declared for all end points tested in the previous steps. If the testing sequence stopped at a particular step, the remaining end points in the testing sequence were not formally tested for statistical significance and the corresponding P values were considered descriptive. The P values for the analyses of other secondary, exploratory, and substudy end points were nominal without adjusting for multiplicity. All P values were 2-sided.
The following testing sequence was used if both the co-primary end points were significant at 0.05 (2-sided):
percent change from baseline in BMD at lumbar spine at month 24
percent change from baseline in BMD at total hip at month 24
percent change from baseline in BMD at femoral neck at month 24
percent change from baseline in BMD at lumbar spine at month 12
percent change from baseline in BMD at total hip at month 12
percent change from baseline in BMD at femoral neck at month 12
if all preceding end points were significant, the nonvertebral fracture end point would be tested using a group sequential approach at the primary analysis and the final analysis based on a 1-sided test (alpha = 0.025).
For the analysis of primary end points, the number and percentage of patients with 1 or more new vertebral fractures through month 24 were summarized by randomized treatment group. The incidence of new vertebral fractures through month 24 between the randomized treatment groups was compared using a logistic regression model based on the primary efficacy analysis set for vertebral fractures. The adjusted odds ratio and the corresponding 95% CI were also derived from the model. The primary analytical model for comparing the incidence of clinical fractures at primary analysis between the randomized treatment groups used a stratified Cox proportional hazards model based on the full analysis set. The hazard ratio of romosozumab compared with that of alendronate and the CI were based on the model. The cumulative incidence of fractures was summarized using Kaplan–Meier estimates. To demonstrate the robustness of the results from the primary analytical models, additional supportive analyses were performed for the analysis subset and for new vertebral fractures through month 24 based on time to first new vertebral fracture using the stratified Cox proportional hazards model.
Missing data for the vertebral fracture rate were imputed using the LOCF method.
For secondary fracture end points, analyses of fracture end points (nonvertebral fractures, clinical fractures, clinical vertebral fractures, all fractures, major nonvertebral fractures, major osteoporotic fractures, and hip fractures) were performed on the full analysis set. For other fracture end points (new vertebral fractures, new or worsening vertebral fractures, and multiple new or worsening vertebral fractures), the incidences were compared using a logistic regression model. The number and percentage of patients with at least 1 of these vertebral fractures were summarized by treatment group at month 12 and month 24. The adjusted odds ratio and the corresponding 95% CI were also provided. The number and percent of patients with a new vertebral fracture between month 12 and month 24 were summarized by treatment group and a comparison performed using a logistic regression model.
Subgroups analyses were performed for the incidences of new vertebral fractures, clinical fractures, and nonvertebral fractures for the subgroup categories of age (< 75 and ≥ 75 years), presence or absence of severe vertebral fractures at baseline, number of prevalent vertebral fractures at baseline (0 to 1, 2, and 3 or more), race (White, non-White), geographic region (Western Europe, Australia and New Zealand; Central and Eastern Europe and the Middle East; Asia Pacific and South Africa; North America; Central and Latin America; and all regions excluding Central and Latin America), baseline lumbar spine BMD T-score (≤ −3, > −3 and ≤ −2.5, > −2.5), baseline total hip or femoral neck BMD T-score of −3 or lower versus both total hip and femoral neck BMD T-score of higher than −3, baseline BMI, FRAX score for major osteoporotic fracture, and history of nonvertebral fracture at age 55 years or older (yes, no). The odds ratios of romosozumab compared with alendronate, and their respective 95% CIs, were summarized for each category of subgroup. For the incidence of new vertebral fractures, the treatment-by-subgroup interaction was tested using logistic regression and included individual subgroup and treatment-by-subgroup interactions. For clinical and nonvertebral fractures, the treatment-by-subgroup interaction was tested using a stratified Cox proportional hazards model. If the P value for the interaction was less than 0.05, qualitative interaction testing was performed using the Gail and Simon test.
For BMD end points, the primary efficacy subset for BMD was used for the analyses of percent changes from baseline in lumbar spine, total hip, and femoral neck by DXA at months 12, 24, and 36. The treatment comparisons were analyzed using the ANCOVA model with LOCF imputation as the primary analysis. Descriptive summaries of observed DXA values at month 36 were provided without LOCF. Graphical displays to assess the model included response versus fitted values, response versus standardized residuals, and a normal probability plot of the standardized residuals. The sensitivity analyses included the repeated measures model, in which each body site is estimated using a separate repeated measures model. Absolute values and change from baseline for BMD were also summarized descriptively by time point and machine type.
Analysis Populations
FRAME Study
The primary analysis set for vertebral fractures included all randomized patients with a baseline and at least 1 post-baseline evaluation of vertebral fracture at or before the time point under consideration, including patients with missing baseline Genant semiquantitative scores whose first post-baseline spinal radiograph showed no fracture on the same vertebrae.
The full analysis set included all randomized patients.
The per-protocol analysis sets included patients who were compliant with the protocol (i.e., did not violate any of the predefined important inclusion or exclusion criteria for patient eligibility at baseline) and who met minimum investigational product-exposure requirements.
Primary efficacy analysis set for BMD and patient- and clinician-reported outcome end points included all randomized patients who had a baseline and at least 1 post-baseline evaluation at or before the time point under consideration in the study period.
The safety analysis set included all randomized patients who received at least 1 dose of the investigational product in the 12-month double-blind period. The incidence rates for the 24-month study period included all events that occurred in the double-blind period, and all events that occurred in the open-label period for those patients who received at least 1 dose of denosumab.
ARCH Study
The primary efficacy analysis set for vertebral fractures included all randomized patients who had a baseline and at least 1 post-baseline evaluation of vertebral fractures at or before the time point under consideration. Patients in this subset were analyzed according to their randomized treatment assignment, regardless of the treatment received. This analysis set was used as the primary analysis set for the following end points: new, new or worsening, and multiple new or worsening vertebral fractures.
The full analysis set included all randomized patients. Patients in the full analysis set were analyzed according to their randomized treatment assignments, regardless of treatment received. The full analysis set was used as the primary analysis set for the following end points: nonvertebral fractures, clinical fractures, clinical vertebral fractures, all fractures, major nonvertebral fractures, major osteoporotic fractures, and hip fractures.
The per-protocol analysis set was only used to analyze the following end points: incidence of clinical fractures, new vertebral fractures, and nonvertebral fractures through month 12 as sensitivity analyses. This subset includes patients who received an active investigational product and did not violate any important inclusion or exclusion criteria for patient eligibility at enrolment per important protocol deviation documents.
The safety analysis set included all randomized patients who received at least 1 active dose of the investigational product in the 12-month, double-blind, alendronate-controlled study period. This analysis set was used to analyze safety data for the double-blind study period, primary analysis period, and overall study period.
The primary analysis set for BMD, height, and patient- and clinician-reported outcome end points for the double-blind period and primary analysis period included all randomized patients who had a baseline and at least 1 post-baseline evaluation at or before the time point under consideration.
Results
Patient Disposition
In FRAME, a total of 7,180 patients were randomized into the study, with 3,589 patients randomized to the romosozumab group and 3,591 patients randomized to the placebo group. Eighty-nine percent of patients completed the double-blind period (romosozumab, 88.7%; placebo, 89.3%) and 83.9% of patients completed the 24-month study period (romosozumab/denosumab: 83.4%; placebo/denosumab: 84.4%). Throughout the study, withdrawn consent was the most frequently reported reason for withdrawal from study in both treatment groups (romosozumab/denosumab: 9.6%; placebo/denosumab: 8.7% in the 24-month study period).
In ARCH, a total of 4,093 patients were randomized to the romosozumab 210 mg monthly (2,046 patients) and alendronate 70 mg weekly (2,047 patients) treatment groups. A total of 89.3% of enrolled patients completed the 12-month double-blind period (romosozumab: 89.5%; alendronate: 89.1%) and 77.0% of them completed the primary analysis period (romosozumab/alendronate: 76.9%; alendronate/alendronate: 77.0%). Throughout the study, withdrawn consent and death were the most frequently reported reasons for study discontinuation in both treatment groups (6.3% and 1.3%, respectively, in the romosozumab group, and 6.8% and 1.2%, respectively, in the alendronate group during the 12-month double-blind period; 12.9% and 4.6%, respectively, in the romosozumab/alendronate group and 12.3% and 4.7%, respectively, in the alendronate/alendronate group during the primary analysis period).
Details of patient disposition for FRAME and ARCH are provided in Table 9.
Study details | FRAME | ARCH | ||
|---|---|---|---|---|
Romo/deno | Placebo/deno | Romo/alen | Alen/alen | |
Screened, N | 16,716 | 16,916 | ||
Main reasons (> 5% of patient population) for screen failure | Total number: 9,536 BMD T-score ≤ 2.5 at total hip or femoral neck: 51.8% Vitamin D insufficiency: 27.4% Patient signed informed consent but did not enroll: 13.2% Any severe SQ score or more than 2 moderate SQ scores: 8.7% BMD T-score ≤ 3.5 at total hip or femoral neck: 7.6% Patients not available for study visits: 5.3% | Total number: 12,823 BMD T-score and vertebral fracture requirement: 84.2% Vitamin D insufficiency: 29.5% Patient signed informed consent but did not enroll: 5.2% | ||
Randomized, N | 7,180 | 4,093 | ||
3,589 | 3,591 | 2,046 | 2,047 | |
Completed the 12-month DB period, n (%) | 3,185 (88.7) | 3,205 (89.3) | 1,831 (89.5) | 1,823 (89.1) |
Discontinued 12-month study period, n (%) | 404 (11.3) | 386 (10.7) | 215 (10.5) | 224 (10.9) |
Reason for study discontinuation, n (%) | ||||
Adverse events | 39 (1.1) | 39 (1.1) | 25 (1.2) | 25 (1.2) |
Lost to follow-up | 22 (0.6) | 21 (0.6) | 13 (0.6) | 16 (0.8) |
Consent withdrawn | 261 (7.3) | 253 (7.0) | 129 (6.3) | 139 (6.8) |
Noncompliance | 9 (0.3) | 16 (0.4) | 7 (0.3) | 4 (0.2) |
Ineligibility determined | 7 (0.2) | 6 (0.2) | 2 (< 0.1) | 5 (0.2) |
Protocol deviation | 2 (< 0.1) | 3 (< 0.1) | 3 (0.1) | 3 (0.1) |
Death | 27 (0.8) | 20 (0.6) | 27 (1.3) | 24 (1.2) |
Required alternate therapy | 2 (< 0.1) | 2 (< 0.1) | 0 | 1 (< 0.1) |
Administrative decision | 1 (< 0.1) | 2 (< 0.1) | 0 | 1 (< 0.1) |
Other | 34 (0.9) | 24 (0.7) | 9 (0.4) | 6 (0.3) |
Completed the 24-month period (FRAME) or primary analysis period (ARCH), n (%) | 2,994 (83.4) | 3,032 (84.4) | 1,574 (76.9) | 1,576 (77.0) |
Discontinued 24-month study period (FRAME) or primary analysis period (ARCH), n (%) | 595 (16.6) | 559 (15.6) | 472 (23.1) | 471 (23.0) |
Adverse events | 47 (1.3) | 53 (1.5) | 45 (2.2) | 43 (2.1) |
Lost to follow-up | 37 (1.0) | 35 (1.0) | 32 (1.6) | 35 (1.7) |
Consent withdrawn | 346 (9.6) | 314 (8.7) | 263 (12.9) | 251 (12.3) |
Noncompliance | 15 (0.4) | 33 (0.9) | 14 (0.7) | 12 (0.6) |
Ineligibility determined | 8 (0.2) | 8 (0.2) | 2 (< 0.1) | 5 (0.2) |
Protocol deviation | 3 (< 0.1) | 4 (0.1) | 3 (0.1) | 4 (0.2) |
Death | 49 (1.4) | 44 (1.2) | 95 (4.6) | 97 (4.7) |
Required alternate therapy | 4 (0.1) | 2 (< 0.1) | 2 (< 0.1) | 7 (0.3) |
Administrative decision | 20 (0.6) | 15 (0.4) | 0 | 1 (< 0.1) |
Other | 54 (1.5) | 44 (1.2) | 16 (0.8) | 16 (0.8) |
Ongoing | 12 (0.3) | 7 (0.2) | NA | |
Full analysis set, N | 3,589 | 3,591 | 2,046 | 2,047 |
Primary analysis set, N | 3,589 | 3,591 | 2,046 | 2,047 |
Per-protocol set, N | 3,565 | 3,556 | 2,010 | 1,994 |
Safety set, N | 3,581 | 3,576 | 2,040 | 2,014 |
alen = alendronate; BMD = bone mass density; DB = double-blind; deno = denosumab; NA = not applicable; romo = romosozumab; SQ = visual semiquantitative grading scale for vertebral fractures on lateral spine X-rays.
Source: Clinical Study Reports for FRAME9 and ARCH10; the sponsor provided additional information.
Exposure to Study Treatments
FRAME
The median number of doses received during the double-blind period was 12.0 (range = 1 to 12) in both groups; 75.3% of the romosozumab group and 75.1% of the placebo group received 12 doses. The mean cumulative romosozumab exposure was 2,260.3 mg (SD = 612.8).
ARCH
During the 12-month double-blind period, the median number of double-blind period subcutaneous injections of romosozumab or matching placebo received was 12.0 (range = 1 to 12) in both groups. In the romosozumab group, 74.8% of patients received 12 doses of subcutaneous romosozumab and, in the alendronate treatment group, 75.2% received subcutaneous injections of matching placebo. In the romosozumab treatment group, the median cumulative romosozumab exposure was 2,520.0 mg (range = 70 mg to 2,520 mg). In the alendronate group, the median cumulative alendronate exposure during the 12-month double-blind period was 3,640 mg (range = 70 mg to 4,410 mg).
The distribution for the duration of follow-up (in weeks or months) per treatment group was not reported for either FRAME or ARCH.
Table 10: Extent of Exposure — Safety Analysis Set
Details | FRAME | ARCH | ||
|---|---|---|---|---|
Romo/deno N = 3,581 | Placebo/deno N = 3,576 | Romo/alen N = 2,040 | Alen/alen N = 2,014 | |
Number of doses received in the double-blind period, median (range) | 12 (1 to 12) | 12 (1 to 12) | 12 (1 to 12) | 12 (1 to 12) |
Number of patients receiving 12 doses, n (%) | 2,698 (75.3) | 2,687 (75.1) | NR | NR |
Cumulative romo exposure during DB period, mg, mean (SD) | 2,260.3 (612.8) | 0 | 2,261.1 (613.8) | 0 |
Cumulative alen exposure during DB period, mg, mean (SD) | NA | NA | 3.2 (95.8) | 3,263.9 (840.2) |
alen = alendronate; NA = not applicable; NR = not reported; romo = romosozumab; SD = standard deviation.
Efficacy
Only those efficacy outcomes and analyses of subgroups identified in the review protocol are reported below. Appendix 3 provides detailed efficacy data.
New Fractures (Vertebral, Hip, and Others)
In the FRAME study, romosozumab therapy reduced the risk of new vertebral fractures compared with placebo through month 12 (odds ratio = 0.27; 95% CI, 0.15 to 0.47; P < 0.001), with a relative risk reduction of 73% (risk ratio = 0.27; 95% CI, 0.16 to 0.47). Over the 24-month study period, treatment with romosozumab for 12 months followed by denosumab for 12 months reduced the risk of new vertebral fractures compared with treatment with placebo for 12 months followed by denosumab for 12 months (odds ratio = 0.24; 95% CI, 0.15 to 0.39; P < 0.001), with a relative risk reduction of 75% (risk ratio = 0.25; 95% CI, 0.16 to 0.40) (Table 11).
Table 11: Primary Fracture Outcomes — FRAME, Primary Efficacy Analysis Set, LOCF Imputation
Fracture details | Romo/deno N = 3,589 | Placebo/deno N = 3,591 |
|---|---|---|
Incidence rates of new vertebral fracture through month 12 | ||
Incidence, n/N (%) | 16 of 3,321 (0.5) | 59 of 3,322 (1.8) |
Absolute risk reduction, % point estimate (95% CI) | 1.30 (0.79 to 1.80) | |
Risk ratio Point estimate (95% CI) RRR (95% CI) | 0.27 (0.16 to 0.47) 73% (53 to 84) | |
Odds ratio Point estimate (95% CI) P value | 0.27 (0.15 to 0.47) < 0.001 | |
Incidence rates of new vertebral fracture through month 24 | ||
Incidence, n/N (%) | 21 of 3,325 (0.6) | 84 of 3,327 (2.5) |
Absolute risk reduction,a % Point estimate (95% CI)b | 1.89 (1.30 to 2.49) | |
Risk ratioa Point estimate (95% CI) RRR (95% CI)b | 0.25 (0.16 to 0.40) 75% (60 to 84) | |
Odds ratioc Point estimate (95% CI) P value | 0.24 (0.15 to 0.39) < 0.001 | |
CI = confidence interval; LOCF = last observation carried forward; RRR = relative risk reduction.
aBased on the Mantel-Haenszel method adjusted for age and prevalent vertebral fracture stratification variables.
bCalculated from risk ratio as 100 × (1 − risk ratio).
cBased on a logistic regression model adjusted for age and prevalent vertebral fracture stratification variables; P value based on score test.
Source: Clinical Study Report for FRAME.9
Subgroup analyses based on lumbar spine BMD T-scores at baseline (≤ −3 versus > −3 and ≤ −2.5 versus > −2.5), total hip and femoral neck BMD T-scores at baseline (≤ −3 versus > −3), historical fragility fracture (yes versus no) and FRAX scores at baseline (≤ 8.21 versus > 8.21 and ≤ 14.27 versus > 14.27) were performed for the primary efficacy end points. In general, the subgroup analyses results are consistent with the primary analysis results; patients treated with romosozumab had a numerically lower risk of new vertebral fractures at month 12 and 24 compared to the patients treated with placebo (Table 35).
The co-primary and selected secondary efficacy end points were tested in a fixed-sequence approach to control for multiplicity. Romosozumab reduced the risk of clinical fractures (nonvertebral and clinical [i.e., symptomatic] vertebral fractures) by 36% (95% CI, 11 to 54) compared with placebo through month 12 (P = 0.008). Clinical fractures through 24 months were not a part of the testing structure. The next step in the testing sequence was the simultaneous comparison of the fracture incidence for the secondary end points of nonvertebral fractures at months 12 and 24. The 25% (95% CI, −5 to 47) relative risk reduction with romosozumab for nonvertebral fractures through month 12 was not statistically significant (P = 0.096) and the P value for nonvertebral fractures through month 24 did not meet a statistical significance threshold after applying the Hochberg procedure to adjust for multiple comparisons (P = 0.057) (Table 12). No further statistical conclusions can be made for other secondary end points as the testing sequence was halted or the secondary end points were not adjusted for multiple comparisons.
Table 12: Secondary Fracture End Points Through Month 12 and Through Month 24 —FRAME
Fracture Time point | Incidence, n/N1 (%) Placebo and romosozumaba | Absolute risk reduction, % (95% CI) | Relative risk reduction, % (95% CI) | Ratiob | Nominal P valuec,d | Adjusted P valuee | |
|---|---|---|---|---|---|---|---|
Clinicald Month 12 Month 24 | Placebo 90 of 3,591 (2.5) 147 of 3,591 (4.1) | Romosozumab 58 of 3,589 (1.6) 99 of 3,589 (2.8) | 1.2% (0.4 to 1.9) 1.4% (0.5 to 2.4) | 36% (11 to 54) 33% (13 to 48) | 0.64 0.67 | 0.008 0.002 | 0.008 0.096 |
Nonvertebrald Month 12 Month 24 | Placebo 75 of 3,591 (2.1) 129 of 3,591 (3.6) | Romosozumab 56 of 3,589 (1.6) 96 of 3,589 (2.7) | 0.8% (0.1 to 1.4) 1.0% (0.2 to 1.9) | 25% (−5 to 47) 25% (3 to 43) | 0.75 0.75 | 0.096 0.029 | 0.096 0.057 |
Major nonvertebrald Month 12 Month 24 | Placebo 55 of 3,591 (1.5) 101 of 3,591 (2.8) | Romosozumab 37 of 3,589 (1.0) 67 of 3,589 (1.9) | 0.6% (0.1 of 1.2) 1.1% (0.3 of 1.8) | 33% (−2 to 56) 33% (9 to 51) | 0.67 0.67 | 0.060 0.009 | 0.096 0.096 |
New or worsening vertebralc Month 12 Month 24 | Placebo 59 of 3,322 (1.8) 84 of 3,327 (2.5) | Romosozumab 17 of 3,321 (0.5) 22 of 3,325 (0.7) | 1.3% (0.8 to 1.8) 1.9% (1.3 to 2.5) | 71% (51 to 83) 74% (58 to 84) | 0.29 0.26 | < 0.001 < 0.001 | 0.096 0.096 |
Hipd Month 12 Month 24 | Placebo 13 of 3,591 (0.4) 22 of 3,591 (0.6) | Romosozumab 7 of 3,589 (0.2) 11 of 3,589 (0.3) | 0.3% (0.0 to 0.6) 0.4% (0.0 to 0.7) | 46% (−35 to78) 50% (−4 to 76) | 0.54 0.50 | 0.18 0.059 | 0.18 0.12 |
Major osteoporoticd Month 12 Month 24 | Placebo 63 of 3,591 (1.8) 110 of 3,591 (3.1) | Romosozumab 38 of 3,589 (1.1) 68 of 3,589 (1.9) | 0.9% (0.3 to 1.5) 1.2% (0.5 to 2.0) | 40% (10 to 60) 38% (16 to 54) | 0.60 0.62 | 0.012 0.002 | NAf NAf |
Multiple new or worsening vertebralc Month 12 Month 24 | Placebo 9 of 3,322 (0.3) 17 of 3,327 (0.5) | Romosozumab 1 of 3,321 (< 0.1) 1 of 3,325 (< 0.1) | 0.2% (0.1 to 0.4) 0.5% (0.2 to 0.7) | 89%(13 to 99) 94%(56 to 99) | 0.11 0.06 | 0.011 < 0.001 | NAf NAf |
CI = confidence interval; N1 = number of patients in either the primary efficacy analysis set (new, worsening, and new or worsening vertebral fractures) or the full analysis set (clinical, nonvertebral, major nonvertebral, hip, and major osteoporotic fractures).
aValues represent romosozumab and placebo groups through month 12 and romosozumab/denosumab and placebo/denosumab groups through month 24.
bRisk or hazard ratio compared with placebo through month 12 or with placebo/denosumab through month 24; a ratio of less than 1 favours romosozumab (month 12) or romosozumab/denosumab (month 24).
cRelative risk reduction is calculated from the risk ratio as 100 × (1 − risk ratio). The absolute risk reduction and risk ratio are based on the Mantel-Haenszel method adjusted for age and prevalent vertebral fracture stratification variables. Nominal P values for vertebral fracture end points are based on a logistic regression model adjusting for age and prevalent vertebral fracture stratification variables.
dRelative risk reduction is calculated from the hazard ratio as 100 × (1 − hazard ratio). Absolute risk reduction is based on an inverse-weighted method adjusting for age and prevalent vertebral fracture stratification variables. The hazard ratio and nominal P values for clinical, nonvertebral, major nonvertebral, hip, and major osteoporotic fractures are based on a Cox proportional hazards model adjusting for age and prevalent vertebral fracture stratification variables.
eBased on a combination of fixed sequential and Hochberg testing procedures, which includes the co-primary and selected secondary end point comparisons and are to be compared to a significance level of 0.05.
fEnd point was not part of sequential testing strategy; therefore, P value adjustment is not applicable.
Source: Clinical Study Report for FRAME.9
In ARCH, through month 24, treatment with romosozumab 210 mg monthly for 12 months followed by alendronate 70 mg weekly for 12 months reduced the risk of new vertebral fractures by 50% compared with alendronate alone (relative risk = 0.50; 95% CI, 0.38 to 0.66; odds ratio = 0.48; 95% CI, 0.36 to 0.64; adjusted P < 0.001). Through the primary analysis (after clinical fractures had been confirmed in at least 330 patients), treatment with romosozumab 210 mg monthly for 12 months followed by alendronate 70 mg weekly reduced the hazard ratio of clinical fractures (nonvertebral fracture and clinical vertebral fracture) by 27% compared with alendronate alone (hazard ratio = 0.73; 95% CI, 0.61 to 0.88; adjusted P < 0.001), based on 464 patients with clinical fractures.
Table 13: Primary Fracture Outcomes — ARCH, Full Analysis Set
Study details | Romosozumab N = 2,046 | Alendronate N = 2,047 |
|---|---|---|
Incidence rates of new vertebral fracture through month 24 | ||
Incidence, n/N (%) | 74 of 1,825 (4.1) | 147 of 1,834 (8.0) |
Absolute risk reduction,a %, point estimate (95% CI) | 4.03 (2.50 to 5.57) | |
Risk ratio,a point estimate (95% CI) RRR (95% CI)b | 0.50 (0.38 to 0.66) 50% (34 to 62) | |
Odds ratio,c point estimate (95% CI) Nominal P value Adjusted P value | 0.48 (0.36 to 0.64) < 0.001 < 0.001 | |
Incidence rates of clinical fracture through primary analysisd | ||
Incidence, n/N (%) | 198 of 2,046 (9.7) | 266 of 2,047 (13.0) |
Hazard ratio,e point estimate (95% CI) Nominal P value Adjusted P value | 0.73 (0.61 to 0.88) < 0.001 < 0.001 | |
CI = confidence interval; RRR = relative risk reduction.
aBased on the Mantel-Haenszel method adjusted for age strata, baseline total hip BMD T-score (≤ −2.5, > −2.5), and presence of severe vertebral fracture at baseline.
bCalculated from risk ratio as 100 × (1 − risk ratio).
cBased on a logistic regression model adjusted for age strata, baseline total hip BMD T-score, and presence of a severe vertebral fracture at baseline; P value based on score test.
dClinical fracture included nonvertebral and symptomatic vertebral fracture; primary analysis period was from randomization to after clinical fractures had been confirmed in at least 330 patients.
eThe hazard ratio estimate is based on Cox proportional hazards model adjusting for age strata, baseline total hip BMD T-score, and presence of a severe vertebral fracture at baseline.
Source: Clinical Study Report for ARCH.10
Subgroup analyses based on lumbar spine BMD T-scores at baseline (≤ −3 versus > −3 and ≤ −2.5 versus > −2.5), total hip and femoral neck BMD T-score at baseline (≤ −3 versus > −3) and the FRAX score at baseline (≤ 14.22 versus > 14.22 and ≤ 22.47 versus > 22.47) were performed for the primary efficacy end points. In general, the subgroup analyses results are consistent with the primary analysis results in that patients treated with romosozumab had a numerically lower risk of a new vertebral fracture and clinical fracture at month 24, compared to the patients treated with alendronate (Table 36).
Nonvertebral fractures were a secondary efficacy outcome and accounted for multiple comparisons via a sequential testing structure. In the primary analysis, treatment with romosozumab 210 mg monthly for 12 months followed by alendronate 70 mg weekly reduced the hazard ratio of nonvertebral fractures by 19% (hazard ratio = 0.81; 95% CI, 0.66 to 0.99; P = 0.019, 1-sided nominal P value) based on 395 patients with nonvertebral fractures. Under the group sequential design, with an information fraction of 90% (395 of 440), the significance level at primary analysis was determined to be 0.0233 (1-sided). This result is significant as 0.019 is less than 0.0223; consistent with this, the multiplicity-adjusted 2-sided P value (adjusting for the fixed-sequence and the group sequential testing) was significant at 0.040.
Table 14: Secondary Fracture Outcomes — ARCH, Full Analysis Set
Study details | Romosozumab N = 2,046 | Alendronate N = 2,047 |
|---|---|---|
Incidence rates of nonvertebral fracture through primary analysis | ||
Incidence, n/N (%) | 178 of 2,046 (8.7) | 217 of 2,047 (10.6) |
Hazard ratio, point estimate (95% CI) Nominal P value (2-sided) Nominal P value (1-sided) Adjusted P value | 0.81 (0.66 to 0.99) 0.037 0.019 0.040 | |
CI = confidence interval.
Source: Clinical Study Report for ARCH.10
No additional fracture end points were included in the testing structure for ARCH. Results for all other fracture end points should be considered as supportive evidence. During the primary analysis period, treatment with romosozumab for 12 months followed by alendronate was associated with a numerically smaller risk of hip fractures, major nonvertebral fractures, major osteoporotic fractures, and all osteoporotic fractures.
At month 12, treatment with romosozumab for 12 months followed by alendronate was associated with a numerically smaller risk of new vertebral fractures, clinical fractures, all osteoporotic fractures, new or worsening vertebral fractures, and major nonvertebral fractures.
At month 24, treatment with romosozumab for 12 months followed by alendronate was associated with a numerically smaller risk of clinical fractures, clinical vertebral fractures, new or worsening vertebral fractures, and multiple new or worsening vertebral fractures (Table 15).
Table 15: Secondary and Exploratory Fracture Outcomes Not Included in the Testing Sequence — ARCH
Fracture category Time point | Incidence, n/N1 (%) Alendronate and romosozumaba | Absolute risk reduction, % (95% CI) | Relative risk reduction, % (95% CI) | Odds or hazard ratiob | Nominal P valuec,d | |
|---|---|---|---|---|---|---|
New vertebralc Month 12 | Alendronate 85 of 1,703 (5.0) | Romosozumab 55 of 1,696 (3.2) | 1.8% (0.5 to 3.2) | 36% (11 to 54) | 0.63 | 0.008 |
Clinical d Month 12 Month 24 | Alendronate 110 of 2,047 (5.4) 197 of 2,047 (9.6) | Romosozumab 79 of 2,046 (3.9) 146 of 2,046 (7.1) | 1.8% (0.5 to 3.1) 2.7% (0.8, 4.5) | 28% (4 to 46) 26% (9 to 41) | 0.72 0.74 | 0.027 0.005 |
Nonvertebrald Month 12 Month 24 | Alendronate 95 of 2,047 (4.6) 159 of 2,047 (7.8) | Romosozumab 70 of 2,046 (3.4) 129 of 2,046 (6.3) | 1.4% (0.1 to 2.6) 1.6% (−0.1 to 3.3) | 26% (−1 to 46) 19% (−2 to 36) | 0.74 0.81 | 0.057 0.074 |
Clinical vertebrald Month 12 Month 24 | Alendronate 18 of 2,047 (0.9) 44 of 2,047 (2.1) | Romosozumab 10 of 2,046 (0.5) 18 of 2,046 (0.9) | 0.4% (−0.7 to 1.5) 1.6% (0.5 to 2.7) | 44% (−22 to 74) 59% (29 to 76) | 0.56 0.41 | 0.14 < 0.001 |
Hipd Month 12 Month 24 Primary analysis | Alendronate 22 of 2,047 (1.1) 43 of 2,047 (2.1) 66 of 2,047 (3.2) | Romosozumab 14/2,046 (0.7) 31/2,046 (1.5) 41/2,046 (2.0) | 0.3% (−0.3 to 0.9) 0.6% (−0.2 to 1.4) Not calculated | 36% (−26, 67) 28% (−15, 54) 38% (8 to 58) | 0.64 0.72 0.62 | 0.19 0.17 0.015 |
Major nonvertebrald Month 12 Primary analysis | Alendronate 88 of 2,047 (4.3) 196 of 2,047 (9.6) | Romosozumab 59 of 2,046 (2.9) 146 of 2,046 (7.1) | 1.6% (0.4 to 2.7) Not calculated | 33% (6 to 52) 27% (10 to 41) | 0.67 0.73 | 0.019 0.004 |
Major osteoporoticd Month 12 Primary analysis | Alendronate 85 of 2,047 (4.2) 209 of 2,047 (10.2) | Romosozumab 61 of 2,046 (3.0) 146 of 2,046 (7.1) | 1.4% (0.3 to 2.5) Not calculated | 28% (−1 to 48) 32% (16 to 45) | 0.72 0.68 | 0.053 < 0.001 |
All osteoporoticd Month 12 Primary analysis | Alendronate 189 of 2,047 (9.2) 392 of 2,047 (19.1) | Romosozumab 134 of 2,046 (6.5) 266 of 2,046 (13.0) | 2.2% (0.5 to 3.8) Not calculated | 29% (12 to 43) 35% (24 to 44) | 0.71 0.65 | 0.002 < 0.001 |
CI = confidence interval; N1 = number of patients in either the primary analysis set for vertebral fracture (new, new or worsening, and multiple new or worsening vertebral fractures) or the full analysis set (clinical, nonvertebral, major nonvertebral, hip, clinical vertebral, major osteoporotic, and all fractures).
Note: Major nonvertebral fracture includes fractures of the pelvis, distal femur, proximal tibia, ribs, proximal humerus, forearm, and hip. Fractures associated with high trauma severity or pathologic fractures are excluded. All fractures (osteoporotic) includes any osteoporotic nonvertebral fractures that were not associated with high trauma severity or pathologic fractures and new or worsening vertebral fractures regardless of trauma severity or pathologic fractures. Major osteoporotic fractures include hip, forearm, or humerus fractures that are not associated with a pathologic fracture regardless of trauma severity, and clinical vertebral fractures. Missing values for new vertebral fractures and clinical vertebral fractures are imputed by carrying forward the last non-missing post-baseline value before the missing value.
aValues represent percentage of patients with fracture in the romosozumab group vs. the alendronate group through month 12 and in the romosozumab/alendronate group vs the alendronate/alendronate group through month 24 and/or primary analysis.
bOdds or hazard ratio compared with alendronate through month 12 or with alendronate/alendronate through month 24 and primary analysis; ratio < 1 favours romosozumab (month 12) or romosozumab/alendronate (month 24 and primary analysis).
cRelative risk reduction is calculated from the risk ratio as 100 × (1 − risk ratio). Absolute risk reduction and risk ratio are based on Mantel-Haenszel method adjusted for age strata, baseline total hip BMD T-score (≤ −2.5, > −2.5), and presence of severe vertebral fracture at baseline. Odds ratios are based on a logistic regression model adjusted for age strata, baseline total hip BMD T-score, and the presence of a severe vertebral fracture at baseline; nominal P values for vertebral fractures are based on score test.
dRelative risk reduction is calculated from the hazard ratio as 100 × (1 − hazard ratio). Absolute risk reduction is based on inverse-weighted method adjusting for age strata, baseline total hip BMD T-score (≤ −2.5, > −2.5), and presence of a severe vertebral fracture at baseline. Hazard ratio estimates and nominal P values are based on Cox proportional hazards model adjusting for age strata, baseline total hip BMD T-scores, and the presence of a severe vertebral fracture at baseline.
Source: Clinical Study Report for ARCH.10
Health-Related Quality of Life
In FRAME, no consistent or clinically meaningful differences in patient- or clinician-reported outcome end points (OPAQ-SV, EQ-5D-5L, Limited Activity Days survey, or Brief Pain Inventory worst pain score) were identified between the romosozumab and placebo groups during the 12-month double-blind period, or between the romosozumab/denosumab and placebo/denosumab groups during the 24-month study period.
Similarly in ARCH, no consistent or clinically meaningful differences in patient- or clinician-reported outcome end points (OPAQ-SV, EQ-5D-5L, Limited Activity Days, or Brief Pain Inventory worst pain scores) were identified between the romosozumab and alendronate groups during the 12-month double-blind period or between romosozumab/alendronate and alendronate/alendronate groups during the primary analysis period.
Mortality
The numbers of patients who died during the study period in the FRAME and ARCH studies are presented in Table 16. The section on harms provides detailed mortality data from the 2 studies.
Table 16: Deaths — FRAME and ARCH, Safety Analysis Set
Time | FRAME | ARCH | ||
|---|---|---|---|---|
Romo/deno (n = 3,589) | Placebo/deno (n = 3,591) | Romo/alen (n = 2,040) | Alen/alen (n = 2,014) | |
At month 12, n (%) | 29 (0.8) | 23 (0.6) | 30 (1.5) | 21 (1.0) |
At month 24 in FRAME or primary analysis period in ARCH, n (%) | 52 (1.5) | 47 (1.3) | 90 (4.4) | 90 (4.5) |
alen/alen = treatment with alendronate for 12 months followed by alendronate for additional 12 months; placebo/deno = treatment with placebo for 12 months followed by denosumab for additional 12 months; romo/alen = treatment with romosozumab for 12 months followed by alendronate for additional 12 months; romo/deno = treatment with romosozumab for 12 months followed by denosumab for additional 12 months.
Change in Bone Mineral Density
FRAME Study
Treatment with romosozumab significantly increased BMD at the lumbar spine (between-group difference = 12.7%; 95% CI, 12.4 to 12.9), total hip (between-group difference = 5.8%; 95% CI, 5.6 to 6.0), and femoral neck (between-group difference = 5.2%; 95% CI, 4.9 to 5.4) compared with placebo at month 12. In addition, romosozumab followed by denosumab was associated with increases in BMD at the lumbar spine, total hip, and femoral neck at month 24. Mean differences in percent change from baseline to month 24 in BMD were greater for patients in the romosozumab/denosumab group compared with the placebo/denosumab group (P < 0.001 at each site). The BMD end points were not included in the sequential testing procedure for multiplicity adjustment.
ARCH Study
The BMD end points were adjusted for multiple comparisons at month 24 and month 12 and included in the testing sequence. At month 12, romosozumab significantly increased BMD compared with alendronate at the lumbar spine, total hip, and femoral neck, with least squares mean differences of 8.7% (95% CI, 8.3 to 9.1), 3.3% (95% CI, 3.0 to 3.6), and 3.2% (95% CI, 2.9 to 3.5), respectively (adjusted P < 0.001 for all 3 sites). At month 24, romosozumab for 12 months followed by alendronate for 12 months, significantly increased BMD compared with alendronate alone at the lumbar spine, total hip, and femoral neck, with mean differences of 8.1% (95% CI, 7.6 to 8.6), 3.8% (95% CI, 3.4 to 4.1), and 3.8% (95% CI, 3.4 to 4.1), respectively (adjusted P < 0.001 for all 3 sites).
Table 17: Change in BMD From Baseline by DXA — FRAME and ARCH, Primary Efficacy Analysis Set for BMD
Details | FRAME | ARCH | ||
|---|---|---|---|---|
Romo/deno (n = 3,589) | Placebo/deno (n = 3,591) | Romo/alen (n = 1,750) | Alen/alen (n = 1,757) | |
Lumbar spine | ||||
Baseline, mean (SD) | −2.72 (1.04) | −2.71 (1.04) | −2.94 (1.25) | −2.99 (1.24) |
Number of evaluable patients at month 12 | 3,151 | 3,148 | 1,722 | 1,718 |
LS mean at month 12 (95% CI) | 13.1 (12.8 to 13.3) | 0.4 (0.2 to 0.5) | 13.7 (13.4 to 14.0) | 5.0 (4.7 to 5.2) |
LS mean difference (95% CI) | 12.7 (12.4 to 12.9) | 8.7 (8.3 to 9.1) | ||
P value | < 0.001 | < 0.001 | ||
Number of evaluable patients at month 24 | 2,861 | 2,877 | 1,571 | 1,577 |
LS mean at month 24 (95% CI) | 16.6 (16.3 to 16.8) | 5.5 (5.3 to 5.7) | 15.3 (14.9 to 15.7) | 7.2 (6.9 to 7.5) |
LS mean difference (95% CI) | 11.1 (10.8 to 11.4) | 8.1 (7.6 to 8.6) | ||
P value | < 0.001 | < 0.001 | ||
Total hip | ||||
Baseline, mean (SD) | −2.48 (0.47) | −2.46 (0.47) | −2.78 (0.68) | −2.81 (0.67) |
Number of evaluable patients at month 12 | 3,197 | 3,210 | 1,781 | 1,781 |
LS mean at month 12 (95% CI) | 6.0 (5.9 to 6.2) | 0.3 (0.1 to 0.4) | 6.2 (5.9 to 6.4) | 2.8 (2.7 to 3.0) |
LS mean difference (95% CI) | 5.8 (5.6 to 6.0) | 3.3 (3.0 to 3.6) | ||
P value | < 0.001 | < 0.001 | ||
Number of evaluable patients at month 24 | 2,903 | 2,918 | 1,622 | 1,627 |
LS mean at month 24 (95% CI) | 8.5 (8.3 to 8.7) | 3.2 (3.1 to 3.3) | 7.2 (7.0 to 7.5) | 3.5 (3.2 to 3.7) |
LS mean difference (95% CI) | 5.3 (5.1 to 5.5) | 3.8 (3.4 to 4.1) | ||
P value | < 0.001 | < 0.001 | ||
Femoral neck | ||||
Baseline, mean (SD) | −2.76 (0.28) | −2.74 (0.29) | −2.89 (0.49) | −2.90 (0.50) |
Number of evaluable patients at month 12 | 3,197 | 3,210 | 1,781 | 1,781 |
LS mean at month 12 (95% CI) | 5.5 (5.2 to 5.7) | 0.3 (0.1 to 0.5) | 4.9 (4.7 to 5.2) | 1.7 (1.5 to 2.0) |
LS mean difference (95% CI) | 5.2 (4.9 to 5.4) | 3.2 (2.9 to 3.5) | ||
P value | < 0.001 | < 0.001 | ||
Number of evaluable patients at month 24 | 2,903 | 2,918 | 1,622 | 1,627 |
LS mean at month 24 (95% CI) | 7.3 (7.0 to 7.5) | 2.3 (2.1 to 2.6) | 6.0 (5.7 to 6.4) | 2.3 (2.0 to 2.6) |
LS mean difference (95% CI) | 4.9 (4.7 to 5.2) | 3.8 (3.4 to 4.1) | ||
P value | < 0.001 | < 0.001 | ||
alen/alen = treatment with alendronate for 12 months followed by alendronate for additional 12 months; BMD = bone mineral density; CI = confidence interval; DXA = dual-energy X-ray absorptiometry; LS = least squares; placebo/deno = treatment with placebo for 12 months followed by denosumab for additional 12 months; romo/alen = treatment with romosozumab for 12 months followed by alendronate for additional 12 months; romo/deno = treatment with romosozumab for 12 months followed by denosumab for additional 12 months.
SD = standard deviation.
Change in Bone Turnover Markers
FRAME Study
A total of 130 randomized patients were enrolled in the BTM and biomarker substudy, representing all regions except Asia Pacific; 129 patients were included in the BTM and biomarker substudy efficacy analysis set (64 patients in the romosozumab/denosumab group and 65 patients in the placebo/denosumab group). At least 90% of patients in each treatment group completed the 24-month study period. No adjustment for multiple comparisons was made for the analysis of this substudy.
For the bone formation markers, the median percent change from baseline in P1NP was lower in the romosozumab group compared with the placebo group at the end of double-blind treatment at month 12 (romosozumab group: −17%; placebo group: −3%; P = 0.006). Similar to P1NP, serum concentrations of BSAP (romosozumab group: −13%; placebo group; −10%; P = 0.34) and osteocalcin (romosozumab group: −19%; placebo group: −12%; P = 0.48) peaked early in romosozumab-treated patients and declined thereafter, returning to baseline by month 12.
For the bone resorption markers during double-blind treatment, the median percent change from baseline in sCTX was lower in the romosozumab group than in the placebo group at day 14, month 1, month 3 plus 14 days, month 6 plus 14 days, month 9, and month 12 (romosozumab group: −53%; placebo group: −29%; P < 0.001). Changes in sCTX were assessed through month 24 after the end of double-blind treatment. In both treatment groups, denosumab caused similar reductions in sCTX through month 24.
ARCH Study
A total of 298 randomized patients enrolled in the imaging and BTM substudy, including 157 patients in the romosozumab/alendronate group and 141 patients in the alendronate/alendronate group. Patients from all regions participated in the substudy. A total of 136 patients (86.6%) in the romosozumab/alendronate group and 125 patients (88.7%) in the alendronate/alendronate group completed the double-blind study period. No adjustment for multiple comparisons was made for the analysis of this substudy.
For the bone formation markers, the median percent change from baseline in P1NP was greater in the romosozumab group than in the alendronate group at all time points evaluated during double-blind treatment: at month 12, the median percent change was −30% in the romosozumab group compared to −63% in the alendronate group (P < 0.001). After month 12, when all patients received open-label alendronate, the median P1NP value in the romosozumab/alendronate group decreased below baseline at month 15 and remained consistently reduced through month 36. Similar to P1NP, serum concentrations of BSAP (−7% at month 12 in the romosozumab group compared to −35% in the alendronate group) and osteocalcin (−18% at month 12 in the romosozumab group compared to −50% in the alendronate group) peaked at month 1 in romosozumab-treated patients and declined through month 12 (the last assessment time point for these BTMs), returning to baseline by month 9.
Levels of the bone resorption marker sCTX showed a decrease in the romosozumab group at month 1 (the time point of first assessment) and remained reduced but above the levels in the alendronate group through month 12 (romosozumab group: −38%; alendronate group: −70%; P < 0.001). After month 12, when all patients received open-label alendronate, the median sCTX value in the romosozumab/alendronate group decreased at months 15, 18, and 24 to levels similar to those in the alendronate/alendronate group. At month 36, the median sCTX value in the romosozumab/alendronate group increased but remained below baseline (nominal P = 0.042 versus the alendronate/alendronate group).
Harms
Only those harms identified in the review protocol are reported below.
Table 18 provides detailed harms data.
Adverse Events
FRAME Study
The incidence of AEs was similar in patients who received romosozumab (78.4%) and patients who received placebo (79.7%). Frequently reported AEs in the romosozumab group and the placebo group during the 12-month double-blind period were arthralgia (13.0% and 12.0%, respectively), nasopharyngitis (12.8% and 12.2%, respectively), and back pain (10.5% and 10.6%, respectively). At month 24, commonly reported in the respective 2 treatment groups were arthralgia (16.3% and 15.8%), nasopharyngitis (15.6% and 15.3%), back pain (12.9% and 14.4%), fall (10.8% and 12.8%), and pain in extremity (10.1% and 10.2%).
ARCH Study
The incidence of AEs was similar in patients who received romosozumab (75.7%) and patients who received alendronate (78.6%). Frequently reported AEs during 12-month double-blind period were nasopharyngitis (10.4% and 10.8%) and back pain (9.1% and 11.3%) in the romosozumab group and the alendronate group, respectively. In the primary analysis study period, commonly reported AEs were nasopharyngitis (17.8% and 18.5%), back pain (16.1% and 19.5%), arthralgia (16.1% and 18.0%), fall (13.8% and 16.7%), hypertension (11.1% and 11.2%), pain in extremity (11.0%, and 12.2%), upper respiratory tract infection (9.8% and 10.9%), osteoarthritis (9.6% and 10.1%), and urinary tract infection (9.1% and 12.1%), respectively, in the 2 treatment groups.
Serious Adverse Events
FRAME Study
During the 12-month double-blind period, SAEs were reported for 344 patients (9.6%) who received romosozumab and 312 patients (8.7%) who received placebo. The most frequently reported SAEs (> 0.2% of patients in either treatment group) were pneumonia (romosozumab: 0.5%; placebo: 0.3%), chronic obstructive pulmonary disease (romosozumab: 0.2%; placebo: 0.4%), and osteoarthritis (romosozumab: 0.2%; placebo: 0.4%).
During the 24-month study period, SAEs were reported for 565 patients (15.8%) in the romosozumab/denosumab group and 540 patients (15.1%) in the placebo/denosumab group. The most frequently reported SAEs (≥ 0.4% of patients in either treatment group) were pneumonia (0.9% for the romosozumab/denosumab group; 0.6% for the placebo/denosumab group), hypertension (romosozumab/denosumab: 0.4%; placebo/denosumab: 0.3%), chronic obstructive pulmonary disease (romosozumab/denosumab; 0.4%; placebo/denosumab: 0.6%), and atrial fibrillation (0.4% each).
ARCH Study
During the 12-month double-blind period, SAEs were reported for 262 patients (12.8%) who received romosozumab and 278 (13.8%) who received alendronate. The most frequently reported SAEs (> 0.5% of patients in either treatment group) were pneumonia (romosozumab: 0.8%; alendronate: 0.8%), femur fracture (romosozumab: 0.5%; alendronate 0.6%), radius fracture (romosozumab: 0.4%; alendronate: 0.6%), chronic obstructive pulmonary disease (romosozumab: 0.2%; alendronate: 0.5%), and femoral neck fracture (romosozumab: 0.2%; alendronate:0.6%).
During the primary analysis period, SAEs were reported for 586 patients (28.7%) in the romosozumab/alendronate group and 605 (30.0%) in the alendronate/alendronate group. The most frequently reported SAEs (> 1.0% of patients) in the romosozumab/alendronate group were pneumonia (2.3% versus 2.1% in the alendronate/alendronate group), femur fracture (1.9% versus 2.3%), and chronic obstructive pulmonary disease (1.1% versus 1.4%).
Withdrawal Due to Adverse Events
FRAME Study
At month 12, AEs led to withdrawal from the study drug for 103 patients (2.9%) who received romosozumab and 94 patients (2.6%) who received placebo during the 12-month double-blind period. The AEs that led to discontinuation of the study drug for at least 0.2% of patients in either treatment group were pain in extremity (romosozumab: 0.2%; placebo: < 0.1%) and musculoskeletal pain (romosozumab: < 0.1%; placebo: 0.2%).
During the 24-month study period, AEs led to withdrawal from the study drug for 122 patients (3.4%) who received romosozumab/denosumab and 110 patients (3.1%) who received placebo/denosumab. The AEs that led to discontinuation of the study drug for ≥ 0.2% of patients in either treatment group were pain in extremity (romosozumab/denosumab: 0.3%; placebo/denosumab: < 0.1%), arthralgia (romosozumab/denosumab: 0.2%; placebo/denosumab: 0.1%), and musculoskeletal pain (romosozumab/denosumab: < 0.1%; placebo/denosumab: 0.2%).
ARCH Study
At month 12, AEs led to discontinuation of the study drug for 70 patients (3.4%) in the romosozumab group and 64 patients (3.2%) in the alendronate group. The most frequently reported AEs (≥ 0.2% in either treatment group) leading to discontinuation of the study drug were nausea (romosozumab: 0.2%; alendronate: < 0.1%), dyspepsia (romosozumab: 0.2%; alendronate: < 0.1%), abdominal pain upper (romosozumab: 0.1%; alendronate: 0.2%), and myalgia (romosozumab: 0.2%; alendronate: < 0.1%)
In the primary analysis period, AEs led to withdrawal of the study drug for 133 patients (6.5%) who received romosozumab/alendronate and 146 patients (7.2%) who received alendronate/alendronate during the primary analysis period. The AEs that led to discontinuation of the study drug for more than 0.2% of patients in either treatment group were dyspepsia (romosozumab/alendronate: 0.4%; alendronate/alendronate: 0.2%), abdominal pain upper (romosozumab/alendronate: 0.3%; alendronate/alendronate: 0.3%), and myalgia (romosozumab/alendronate: 0.3%; alendronate/alendronate: < 0.1%).
Mortality
FRAME Study
At month 12, fatal AEs occurred in 29 patients (0.8%) in the romosozumab group and 23 patients (0.6%) in the placebo group during double-blind treatment. The AEs that occurred in at least 0.1% of patients in either treatment group resulted in death (0.1% in each group) and malignant lung neoplasm (romosozumab: 0.1%; placebo: 0%). The AEs resulting in death that were considered by the investigator to be related to investigational product included 1 event of deep vein thrombosis in the romosozumab group and 1 event of sudden death in the placebo group.
At month 24, additional AEs leading to death occurred in 23 patients (0.7%) in the romosozumab/denosumab group and 24 patients (0.7%) in the placebo/denosumab group during the open-label denosumab treatment period, resulting in a cumulative total of 52 deaths (1.5%) in the romosozumab/denosumab group and 47 deaths (1.3%) in the placebo/denosumab group. Over the 24-month study period, AEs resulting in death that occurred in at least 0.1% of patients in either treatment group were malignant lung neoplasm (romosozumab/denosumab: 0.2%; placebo/denosumab: < 0.1%), death (romosozumab/denosumab: 0.3%; placebo/denosumab: 0.1%), and sudden death (romosozumab/denosumab: 0%; placebo/denosumab: 0.1%). Two (< 0.1%) and 1 (< 0.1%), respectively, were considered by the investigator to be related to treatment.
ARCH Study
At month 12, fatal AEs occurred in 30 patients (1.5%) in the romosozumab group and 21 patients (1.0%) in the alendronate group during the 12-month double-blind treatment period. The AEs resulting in death that occurred in at least 2 patients in either treatment group were acute myocardial infarction (romosozumab: 3 patients; alendronate: 0 patients), cardiac failure (romosozumab: 2 patients; alendronate: 1 patient), urosepsis (romosozumab: 2 patients; alendronate: 0 patients), pneumonia (romosozumab: 1 patient; alendronate: 3 patients), cerebrovascular accident (romosozumab: 1 patient; alendronate: 2 patients), death (romosozumab: 1 patient; alendronate: 2 patients), and sudden death (romosozumab: 1 patient; alendronate: 2 patients). During the 12-month double-blind treatment period, the AEs resulting in death that were considered by the investigator to be related to the investigational product were reported for no patients in the romosozumab group and 3 patients in the alendronate group (1 event each of pneumonia, cervix carcinoma stage IV, and cerebrovascular accident).
Through the primary analysis period, AEs leading to death occurred in 60 patients (2.9%) in the romosozumab/alendronate group and 69 patients (3.5%) in the alendronate/alendronate group during the open-label alendronate treatment period, resulting in a cumulative total of 90 deaths (4.4%) in the romosozumab/alendronate group and 90 deaths (4.5%) in the alendronate/alendronate group. Over the primary analysis period, the AEs resulting in death that occurred in at least 4 patients (0.2%) in either treatment group were acute myocardial infarction (romosozumab/alendronate: 5 patients; alendronate/alendronate: 4 patients), cardiac failure (romosozumab/alendronate: 3 patients; alendronate/alendronate: 4 patients), cardiac failure congestive (romosozumab/alendronate: 2 patients; alendronate/alendronate: 4 patients), pneumonia (romosozumab/alendronate: 7 patients; alendronate/alendronate: 8 patients), cerebrovascular accident (romosozumab/alendronate: 4 patients; alendronate/alendronate: 3 patients), death (romosozumab/alendronate: 13 patients; alendronate/alendronate: 17 patients), and sudden death (romosozumab/alendronate: 4 patients; alendronate/alendronate: 3 patients).
Notable Harms
The incidence of AEs of particular interest was similar between treatment groups in FRAME and ARCH.
At month 12 in FRAME, hypersensitivity occurred in 6.8% of patients in the romosozumab group and 6.9% of patients in the placebo group. Serious cardiovascular events were reported in 1.2% of patients treated with romosozumab and 1.1% of patients treated with placebo. At month 24, hypersensitivity occurred in 8.8% of patients in the romosozumab group and 9.3% of patients in the placebo group. Serious cardiovascular events were reported in 2.3% of patients treated with romosozumab and 2.2% of patients treated with placebo.
At month 12 in ARCH, hypersensitivity occurred in 6.0% of patients in the romosozumab group and 5.9% of patients in the alendronate group. Serious cardiovascular events were reported in 2.5% of patients treated with romosozumab and 1.9% of patients treated with alendronate. At month 24, hypersensitivity occurred in 10.0% of patients in the romosozumab group and 9.2% of patients in the alendronate group. Serious cardiovascular events were reported in 6.5% of patients treated with romosozumab and 6.1% of patients treated with alendronate. Of the major adverse cardiac events, ischemic cardiac events and cerebrovascular events were more frequent in the romosozumab group.
Cases of ONJ were rare in both studies.
Table 18: Summary of Harms — Safety Analysis Set
Details | FRAME | ARCH | ||
|---|---|---|---|---|
Romo/deno N = 3,581 | Placebo/deno N = 3,576 | Romo/alen N = 2,040 | Alen/alen N = 2,014 | |
Patients with ≥ 1 adverse event | ||||
Month 12 | ||||
n (%) | 2,806 (78.4) | 2,850 (79.7) | 1,544 (75.7) | 1,584 (78.6) |
Most common events,a n (%) Arthralgia Nasopharyngitis Back pain | 467 (13.0) 459 (12.8) 375 (10.5) | 429 (12.0) 438 (12.2) 378 (10.6) | < 10% 213 (10.4) < 10% | < 10% 218 (10.8) 228 (11.3) |
Month 24 in FRAME and primary analysis period in ARCH | ||||
n (%) | 3,053 (85.3) | 3,069 (85.8) | 1,766 (86.6) | 1,784 (88.6) |
Most common events,a n (%) Arthralgia Nasopharyngitis Back pain Fall Pain in extremity Hypertension Upper respiratory tract infection Urinary tract infection | 585 (16.3) 557 (15.6) 463 (12.9) 387 (10.8) 362 (10.1) < 10% < 10% < 10% | 565 (15.8) 546 (15.3) 516 (14.4) 457 (12.8) 363 (10.2) < 10% < 10% < 10% | 329 (16.1) 363 (17.8) 329 (16.1) 282 (13.8) 225 (11.0) 227 (11.1) < 10% < 10% | 363 (18.0) 373 (18.5) 393 (19.5) 336 (16.7) 246 (12.2) 225 (11.2) 220 (10.9) 243 (12.1) |
Patients with ≥ 1 serious adverse event | ||||
Month 12 in FRAME and ARCH | ||||
n (%) | 344 (9.6) | 312 (8.7) | 262 (12.8) | 278 (13.8) |
Most common events, n (%) Pneumonia COPD Osteoarthritis Femur fracture Radius fracture Femoral neck fracture | 19 (0.5) 6 (0.2) 6 (0.2) 7 (0.2) 5 (0.1) 8 (0.2) | 10 (0.3) 15 (0.4) 15 (0.4) 4 (0.1) 3 (< 0.1) 3 (< 0.1) | 16 (0.8) 5 (0.2) 6 (0.3) 11 (0.5) 8 (0.4) 5 (0.2) | 17 (0.8) 10 (0.5) 5 (0.2) 12 (0.6) 12 (0.6) 12 (0.6) |
Month 24 in FRAME and primary analysis period in ARCH | ||||
n (%) | 565 (15.8) | 540 (15.1) | 586 (28.7) | 605 (30.0) |
Most common events, n (%) Pneumonia Hypertension COPD Atrial fibrillation Femur fracture | 31 (0.9) 15 (0.4) 13 (0.4) 13 (0.4) 6 (0.2) | 23 (0.6) 9 (0.3) 22 (0.6) 13 (0.4) 12 (0.3) | 47 (2.3) 7 (0.3) 22 (1.1) 11 (0.5) 38 (1.9) | 42 (2.1) 8 (0.4) 29 (1.4) 17 (0.8) 47 (2.3) |
Patients who stopped treatment due to adverse events | ||||
Month 12 | ||||
n (%) | 103 (2.9) | 94 (2.6) | 70 (3.4) | 64 (3.2) |
Most common events, n (%) Pain in extremity Musculoskeletal pain Nausea Dyspepsia Abdominal pain upper Myalgia | 8 (0.2) 3 (< 0.1) 4 (0.1) 0 1 (< 0.1) 2 (< 0.1) | 1 (< 0.1) 7 (0.2) 0 0 1 (< 0.1) 2 (< 0.1) | 1 (< 0.1) 0 4 (0.2) 4 (0.2) 3 (0.1) 1 (< 0.1) | 2 (< 0.1) 1 (< 0.1) 2 (< 0.1) 1 (< 0.1) 4 (0.2) 5 (0.2) |
Month 24 in FRAME and primary analysis period in ARCH | ||||
n (%) | 122 (3.4) | 110 (3.1) | 133 (6.5) | 146 (7.2) |
Most common events, n (%) Pain in extremity Arthralgia Musculoskeletal pain Dyspepsia Abdominal pain upper Myalgia | 9 (0.3) 6 (0.2) 3 (< 0.1) 1 (< 0.1) 1 (< 0.1) 2 (< 0.1) | 1 (< 0.1) 5 (0.1) 7 (0.2) 0 1 (< 0.1) 2 (< 0.1) | 1 (< 0.1) 5 (0.2) 0 9 (0.4) 6 (0.3) 1 (< 0.1) | 3 (0.1) 2 (< 0.1) 1 (< 0.1) 4 (0.2) 6 (0.3) 6 (0.3) |
Deaths | ||||
Month 12 | ||||
n (%) | 29 (0.8) | 23 (0.6) | 30 (1.5) | 21 (1.0) |
Most common eventsb Malignant lung neoplasm Acute myocardial infarction Cardiac failure Urosepsis Pneumonia Cerebrovascular accident Death Sudden death | 4 (0.1) 0 0 NR 0 0 5 (0.1) 0 | 0 0 0 NR 0 2 (< 0.1) 5 (0.1) 1 (< 0.1) | NR 3 2 2 1 1 1 1 | NR 0 1 0 3 2 2 2 |
Month 24 in FRAME and primary analysis period in ARCH | ||||
n (%) | 52 (1.5) | 47 (1.3) | 90 (4.4) | 90 (4.5) |
Most common eventsb Malignant lung neoplasm Acute myocardial infarction Cardiac failure Cardiac failure congestive Pneumonia Cerebrovascular accident Death Sudden death | 6 (0.2) 1 (< 0.1) 0 1 (< 0.1) 1 (< 0.1) 0 11 (0.3) 0 | 1 (< 0.1) 1 (< 0.1) 2 (< 0.1) 0 0 2 (< 0.1) 5 (0.1) 4 (0.1) | NR 5 3 2 7 4 13 4 | NR 4 4 4 8 3 17 3 |
Notable harms | ||||
Month 12, n (%) | ||||
Hypersensitivity ONJ Any cardiovascular SAEs Cardiac ischemic event Heart failure Noncoronary revascularization Cerebrovascular event Peripheral vascular ischemic event not requiring revascularization | 242 (6.8) 1 (< 0.1) 44 (1.2) 15 (0.4) 7 (0.2) 0 10 (0.3) 3 (< 0.1) | 245 (6.9) 0 41 (1.1) 14 (0.4) 4 (0.1) 0 11 (0.3) 1 (< 0.1) | 122 (6.0) 0 50 (2.5) 16 (0.8) 4 (0.2) 3 (0.1) 16 (0.8) 0 | 118 (5.9) 0 38 (1.9) 6 (0.3) 8 (0.4) 5 (0.2) 7 (0.3) 2 (< 0.1) |
Month 24 in FRAME and primary analysis period in ARCH, n (%) | ||||
Hypersensitivity ONJ Any cardiovascular SAEs Cardiac ischemic event Heart failure Noncoronary revascularization Cerebrovascular event Peripheral vascular ischemic event not requiring revascularization | 314 (8.8) 2 (< 0.1) 82 (2.3) 18 (0.5) 8 (0.2) 0 27 (0.8) 7 (0.2) | 331 (9.3) 0 79 (2.2) 26 (0.7) 9 (0.3) 0 24 (0.7) 2 (< 0.1) | 205 (10.0) 1 (< 0.1) 133 (6.5) 30 (1.5) 12 (0.6) 6 (0.3) 45 (2.2) 2 (< 0.1) | 185 (9.2) 1 (< 0.1) 122 (6.1) 20 (1.0) 23 (1.1) 10 (0.5) 27 (1.3) 5 (0.2) |
alen/alen = treatment with alendronate for 12 months followed by alendronate for additional 12 months; COPD = chronic obstructive pulmonary disease; NR = not reported; ONJ = osteonecrosis of the jaw; placebo/deno = treatment with placebo for 12 months followed by denosumab for additional 12 months; romo/alen = treatment with romosozumab for 12 months followed by alendronate for additional 12 months; romo/deno = treatment with romosozumab for 12 months followed by denosumab for additional 12 months.
aFrequency greater than 10%.
bOccurred in greater than 0.1% of patients in FRAME or greater than 2 patients in ARCH.
Critical Appraisal
Internal Validity
Both FRAME and ARCH were large, phase III, double-blind RCTs. The ARCH study had an active control arm of oral bisphosphonate. The sample sizes of the 2 studies provided sufficient power to detect the differences between treatment groups. Appropriate methods were used to randomize patients to treatments and conceal treatment allocation. These studies reported on objective outcomes that are deemed reasonable for clinical trials of postmenopausal women with osteoporosis (i.e., incidence of fracture and change in BMD), limiting the possibility of bias.
In general, patients’ characteristics appear to be balanced at baseline between groups. The study results are unlikely to be biased by imbalanced baseline patient characteristics. The completion rate at the end of 1 year of treatment was close to 90%, and greater than 80% in FRAME and 77% in ARCH at the end of 2 years of treatment. The reasons for dropouts were similar between treatment groups. The clinical expert stated that dropout rates were acceptable and consistent with other clinical trials of osteoporosis.
The dropout rates in both FRAME and ARCH were high, which could affect the study results. In ARCH, there was a concern for the potential for bias from the exclusion of patients from the primary analysis set for vertebral fractures through month 24. The inclusion of these patients in an analysis based on the full analysis set was also problematic when they were considered as not having a vertebral fracture and subsequently lowered the incidence rates. In addition, missing data on post-baseline vertebral fracture status due to missing spinal X-ray assessments were imputed using the LOCF method. In response to a request from Health Canada, sensitivity analyses using various methods (e.g., LOCF approach or multiple imputation with the missing-at-random assumption) were conducted to assess the robustness of the primary analysis results. However, the sensitivity analysis using a multiple imputation methodology under the missing-at-random assumption was still a concern, given that the primary reasons for discontinuation from the study included consent withdrawal, death, and AEs. Additional sensitivity analyses that did not assume that the data were missing at random were requested by Health Canada. The results showed that the magnitude of the treatment effect was reduced (compared to the original analyses and as the analyses using multiple imputation under the missing-at-random assumption) but remained statistically significant. The results were robust to the handling of missing data.37 In addition, the main reasons for study discontinuation were withdrawn consent and death. No sensitivity analyses were performed based on these reasons.
Multiplicity was controlled for in FRAME and ARCH based on a step-down procedure, with the primary and selected secondary outcome measures included. Outcomes outside of the testing hierarchy, such as HRQoL (an exploratory outcome in these 2 studies) or occurrence of cardiovascular events, need to be interpreted with caution due to the possible inflated type I error.
The clinical expert provided input on defining high-risk patients. Risks of future fractures should be determined based on multiple factors, including patients’ demographic characteristics, history of fracture, sites of previous fracture, use of certain medications, FRAX scores, BMD scores, and many others. For example, a hip fracture carries more weight than an ankle or wrist fracture for future fracture risk. The clinical expert also indicated that fracture risk models continue to be revised with time and the latest versions should be used; forthcoming iterations of FRAX are anticipated to incorporate the effects of prior pharmacotherapy, type 1 and type 2 diabetes, how recent a fracture is, and the effects of multiple fractures. Subgroup analyses were performed in the 2 studies to examine the consistency of the primary analyses results across subgroup levels, based on age, prevalent vertebral fracture status, history of fragility fracture and baseline BMD T-scores, among others. These subgroups were not adjusted for multiple comparisons and therefore their results are only considered as supportive evidence. Moreover, it would be desirable to consider more factors, such as the effect of patient compliance to prior treatment and previous fractures that carry more weight (e.g., hip fractures or multiple fragility fractures). As well, previous pharmacologic treatment for osteoporosis may be a treatment effect modifier and was a subgroup of interest specified in the protocol of this review. In both FRAME and ARCH, patients were generally excluded based on previous osteoporosis treatment within specified time periods of study enrolment. For example, patients were excluded if they had received any dose of an oral bisphosphonate within 3 months before randomization, more than 1 month of cumulative use between 3 and 12 months before randomization, or more than 3 years of cumulative use unless the last dose received was at least 5 years before randomization. Additionally, a washout period of at least 35 days was required for patients who were previously treated with osteoporosis drugs. However, antiresorptive drugs such as oral bisphosphonates may have a long half-life in bone, ranging from 1 to 10 years, depending on the rate of bone turnover. It is unclear to what extent there were carry-over effects of previous treatments and whether these were distributed differently between groups. As a result, the potential impact of this factor could not be evaluated.
Results of the FRAME study are difficult to interpret at month 24 because patients treated with romosozumab followed by denosumab received 2 years of active treatment while those in the placebo followed by denosumab group received only 1 year of active treatment. The European Medicines Agency and FDA guidelines suggest a minimum of 24 months of active treatment data to assess fracture outcomes and bone safety due to the delayed effects of anti-osteoporosis drugs, particularly antiresorptive drugs such as denosumab.39,40 The comparison and duration of treatment for the comparison in FRAME are therefore problematic.
For ARCH, it is unclear whether the treatment response in the alendronate group is consistent with what has been observed in similar patient populations in other trials. Specifically, assay sensitivity of the ARCH study is difficult to determine in the absence of a placebo group and between-trial heterogeneity. It is therefore unclear whether the magnitude of the treatment effect with romosozumab versus alendronate will be observed in clinical practice.
External Validity
A high proportion of patients (57% in FRAME and 76% in ARCH) failed the screening. The main reasons for the screening failure were not meeting the BMD T-score or fracture requirement and vitamin D insufficiency (Table 9).
According to the clinical expert consulted by CADTH, the inclusion and exclusion criteria for the 2 pivotal studies were generally consistent with clinical practice. Based on patients’ baseline characteristics, the study populations reflect a typical Canadian population that would receive romosozumab in practice. However, patients were excluded from FRAME if they had a BMD T-score of −3.5 or lower at the total hip or femoral neck, a hip fracture at any time and/or any severe vertebral fracture, or more than 2 moderate vertebral fractures. Although patients with these characteristics were likely excluded because the comparator in FRAME was placebo, these patients represent those at a higher risk for fracture and the patient population for which romosozumab is intended to treat. The ARCH study did not exclude patients with these characteristics and is therefore more similar to the patient population intended for treatment with romosozumab. Compared to FRAME, patients in the ARCH study were older, almost all had historical fractures and prevalent vertebral fractures, and they had lower BMD T-scores at different body sites and a higher FRAX score at baseline, which is consistent with patients with high risk of osteoporotic fracture.
The clinical expert also indicated that, in practice, most patients with osteoporosis are untreated due to fear of side effects and potential long-term adverse effects, such as ONJ and atypical hip fractures, as well as failure to recognize the condition. Across North America, less than 20% and, in clinical trials of osteoporosis, less than 10% of hip fracture patients were treated for osteoporosis when they were surveyed a year after the incident fracture. Therefore, in the included study (FRAME), using placebo as a comparator to romosozumab reflects the current clinical practice in Canada and would provide evidence for the effect of the study drug in preventing future fractures in the study population.
Because alendronate was the only active comparator available for this review, there is a lack of direct evidence to demonstrate comparative efficacy and safety of romosozumab versus other osteoporosis medications, and anabolic drugs in particular.
The FRAME and ARCH studies were designed to include a treatment-naive population. However, there is likely a percentage of patients who have been treated with medications, such as antiresorptive therapies, and who may be prescribed romosozumab. The results from the FRAME and ARCH studies do not adequately inform on this sequencing of treatments.
Indirect Evidence
Objectives and Methods for the Summary of Indirect Evidence
No head-to-head comparison of romosozumab against other relevant treatments for osteoporosis, other than alendronate, was available for this review. CADTH conducted a literature search to identify potentially relevant ITCs in people with osteoporosis at high risk for fracture, in addition to reviewing the sponsor’s ITC submission to CADTH. A focused but unlimited literature search for NMAs dealing with osteoporosis was run in MEDLINE All (1946–) on March 09, 2021. Titles, abstracts, and full-text articles were screened for inclusion by 1 reviewer based on the population, intervention, comparator, and outcome criteria outlined in Table 5. One sponsor-submitted ITC was summarized and critically appraised.11 The sponsor-submitted ITC was used to inform the pharmacoeconomic model.
Description of Indirect Comparisons
The sponsor-submitted ITC, which is an NMA, aimed to evaluate the relative clinical efficacy of romosozumab to teriparatide, denosumab, raloxifene, zoledronate, risedronate, ibandronate, alendronate, strontium ranelate, vitamin D plus calcium, bazedoxifene, tibolone, hormone therapy, calcitonin, lasofoxifene, vitamin D, calcium, parathyroid hormone 1 to 84, and abaloparatide in postmenopausal women with primary osteoporosis or osteopenia at risk for developing fragility fractures. The sponsor performed a systematic review to identify relevant studies for inclusion in the ITC. The 3 outcomes analyzed were occurrence of vertebral, hip, and nonvertebral fragility fractures.
The population, intervention, comparators, outcomes, and design of studies included in the sponsor’s ITC are provided in Table 19.
Table 19: Study Selection Criteria and Methods for the Sponsor’s ITC
Study details | Sponsor-submitted indirect treatment comparison |
|---|---|
Population | Postmenopausal women with primary osteoporosis or osteopenia at risk for developing fragility fractures |
Intervention |
|
Intervention (continued) |
|
Comparator | Placebo or any intervention listed above |
Outcome | • Vertebral fragility fracture • Hip fragility fracture • Nonvertebral fragility fracture |
Study design | Randomized controlled trials |
Publication characteristics | Language of publication was not restricted |
Eligibility criteria | Studies that:
|
Databases searched |
|
Selection process | Articles screened independently by 2 researchers |
Data extraction process | Data extraction was performed by pairs of reviewers and compared for discrepancies |
Quality assessment |
|
IM = intramuscular; ITC = indirect treatment comparison; IV = IV; SC = subcutaneous.
Source: Sponsor-submitted ITC.11
Methods of Sponsor-Submitted Indirect Treatment Comparison
Objectives
The primary objective of the sponsor’s ITC was to compare the efficacy of various drugs in the treatment of primary osteoporosis or osteopenia for the prevention of fragility fractures in postmenopausal women.
Study Selection Methods
A literature of multiple electronic databases, including MEDLINE through the Ovid interface, Embase, Cochrane Central Register of Controlled Trials (CENTRAL), ISI Web of Science, and Scopus, were searched. The search was not restricted by the language of the publication or the country of origin of the study.
Studies were eligible and included if they were RCTs, enrolled postmenopausal women with primary osteoporosis or osteopenia at risk for developing fragility fractures, compared 1 or more of the interventions of interest to each other or to placebo, and reported the outcomes of interest (vertebral, hip, and nonvertebral fragility fractures) as a primary or secondary outcome or as an AE. The authors of the sponsor-submitted ITC did not provide a set of exclusion criteria for the systematic review.
Titles and abstracts were reviewed for potential study inclusion. Two reviewers independently evaluated study eligibility based on their titles and abstracts. If at least 1 reviewer determined that an article was potentially eligible, its full-text version was retrieved, and pairs of reviewers assessed its eligibility. Conflicts and discrepancies between the 2 reviewers were resolved through discussion and consensus.
A standardized and piloted data extraction form using an online reference management system (Distiller SR, Ottawa, Canada) was used. Pairs of reviewers extracted data independently and resolved disagreements by discussion and consensus. The following variables were extracted: baseline characteristics, patient demographics, type of interventions, and outcome data. The outcome data extracted corresponded to the number of patients with the outcome of fracture, unless only the number of fractures (not patients) was reported. If the fracture was reported as a clinical fracture and if it was assessed by radiography, the radiographic fracture was extracted. Some studies reported fractures by location without the “nonvertebral” label; in these cases, all the fractures, including hip and/or pelvis fractures, were considered nonvertebral. For studies that report hip and pelvis fractures separately, only the hip fracture outcome was characterized as hip fracture.
Risk of bias was assessed using the Cochrane risk-of-bias tool.11 Studies with a loss to follow-up of greater than 10% were qualified as having a high risk of attrition bias. The Grading of Recommendations, Assessment, Development, and Evaluation framework was used to rate the certainty in the estimates of the direct and indirect comparisons as part of the NMA. Certainty in the estimates was rated down because of methodological limitations of the trial, indirectness, inconsistency, imprecision, and reporting bias. The confidence in the estimates was rated as high, moderate, low, or very low.
The clinical efficacy outcomes assessed were risks of sustaining vertebral, hip, and nonvertebral fragility fractures.
Indirect Treatment Comparison Analysis Methods
The authors of the submitted ITC used a frequentist NMA approach. Direct (head-to-head) comparisons were conducted using the random-effects model as described by DerSimonian and Laird41 to estimate pooled relative risks and 95% CIs. A multivariate random-effects NMA was also conducted to combine the direct and indirect comparisons of drugs using a frequentist consistency model.42,43
The random-effects model was chosen to account for the anticipated heterogeneity between studies. For the random-effects model of direct comparisons, between-trial heterogeneity was assessed using the I2 statistic, for which a value greater than 50% suggests substantial between-trial heterogeneity.
Network inconsistency between direct and indirect comparisons was assessed using the node-splitting method by comparing the direct and indirect estimates and conducting z tests using a significance level of 5%.
Potential publication bias was assessed using the Egger regression test and visual inspection of funnel plots.
Sensitivity analyses were conducted for the effects of zoledronate and calcitonin based on dosage and administration route.
All statistical analyses were performed using version 15 of STATA (StatCorp LP, College Station, TX).
Table 20 below present a summary of the methods used for the ITC.
Table 20: Sponsor-Submitted Indirect Treatment Comparison Analysis Methods
Study details | ITC1 |
|---|---|
ITC methods | Multivariate random-effects network meta-analysis under a frequentist framework |
Priors | Not applicable |
Assessment of model fit | Not reported |
Assessment of consistency | Node-splitting method |
Assessment of convergence | Not applicable |
Outcomes | Relative risk of sustaining vertebral, hip, or nonvertebral fragility fracture |
Follow-up time points | Up to 72 months |
Construction of nodes | Not reported |
Sensitivity analyses | Conducted for the effects of zoledronate and calcitonin based on dosage and administration route |
Subgroup analysis | Not conducted |
Methods for pairwise meta-analysis | Random-effects model under a frequentist framework |
ITC = indirect treatment comparison.
Source: Sponsor-submitted ITC.11
Results of Sponsor-Submitted Indirect Treatment Comparison
Summary of Included Studies
A total of 107 RCTs were included in the ITC. The studies were published between 1979 and 2017; this included 27 studies published before 2000. A total of 193,987 postmenopausal women with a mean age of 66.2 years were included. The majority (55.1%) of participants were White. The duration of the trials ranged between 3 and 120 months, with a median of 27.7 months. The sample size was between 36 and 36,282 patients in treatment arms. Most of the included trials involved comparisons with placebo. Hormone therapy and alendronate were the most commonly tested agents, followed by calcium and vitamin D. When calcium and/or vitamin D were given to both arms of a trial, their effect was considered neutralized and equal in both arms, allowing the arm that received calcium and/or vitamin D plus placebo to be considered placebo. A summary of the study characteristics and patient’s baseline characteristics for each of the included studies are presented in Table 37 and Table 38.
The risk of bias was assessed using the Cochrane risk-of-bias tool. Of the 107 included RCTs, 49 had concealment of a treatment allocation, 102 had well-balanced baseline prognostic factors, 76 reported blinded patients, 77 reported blinded caregivers, 21 reported blinded outcome assessors, 11 reported blinded data collectors, and 7 reported blinded data analysts. The quality and appropriateness of the randomization procedures of the included RCTs were not provided. Overall, 55 RCTs had a high risk of bias. The risk of bias was high in most of the RCTs involving calcitonin, calcium, and vitamin D, as well as in some older bisphosphonate trials. No RCTs were excluded based on the assessment of bias.
Results
Hip Fractures
In all, 107 studies and 19 treatments were included in the hip fracture network (Figure 4). For studies reporting hip and pelvis fractures separately, only the hip fracture outcome was analyzed as hip fracture.
Figure 4: Network of Trials Included in the Hip Fracture Analysis
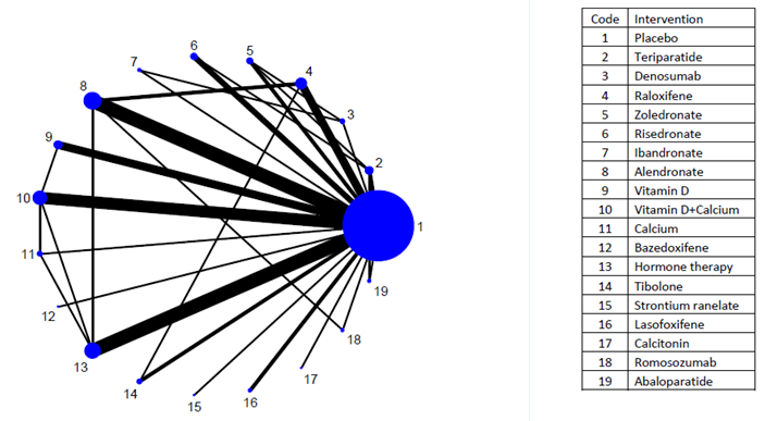
Source: Moreno et al.,44 copyright 2019. This work is licensed under the Attribution 4.0 International Public Licence. Full text available at https://figshare.com/articles/dataset/Appendix_to_network_meta-analysis_Fragility_Fractures/7629344.
Treatment with romosozumab was associated with a significant reduction in the risk of sustaining hip fragility fractures compared to raloxifene. No significant difference in the risk of sustaining hip fractures was seen when romosozumab was compared with alendronate, risedronate, zoledronate, or denosumab.
Nonvertebral Fractures
The nonvertebral fracture network included 107 studies and 20 treatments (Figure 5). Some studies in the evidence network reported fractures by location without the “nonvertebral” label; in these cases, all the fractures, including hip and/or pelvis fractures, were considered nonvertebral.
Figure 5: Network of Trials Included in the Nonvertebral Fracture Analysis
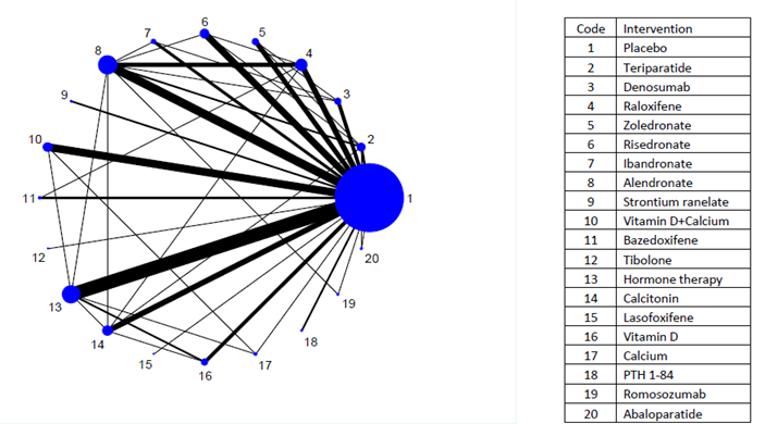
PTH = parathyroid hormone.
Source: Moreno et al.,44 Copyright 2019. This work is licensed under the Attribution 4.0 International Public Licence. Full text available at https://figshare.com/articles/dataset/Appendix_to_network_meta-analysis_Fragility_Fractures/7629344.
Treatment with romosozumab was associated with a significant reduction in the risk of sustaining nonvertebral fragility fractures compared to raloxifene. There was no significant difference between romosozumab versus alendronate, risedronate, zoledronate, or denosumab in the risk of sustaining nonvertebral fractures.
Vertebral Fractures
The vertebral fracture network included 107 studies and 20 treatments (Figure 6). Vertebral fractures are characterized as symptomatic or non-symptomatic, with 70% being non-symptomatic. The sponsor-submitted ITC did not explicitly state whether vertebral fractures defined and assessed in the studies were symptomatic or non-symptomatic.
Figure 6: Network of Trials Included in the Vertebral Fracture Analysis
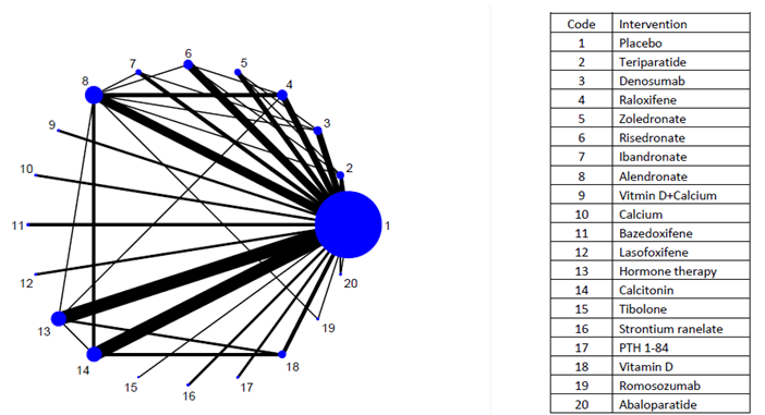
PTH = parathyroid hormone.
Source: Moreno et al.,44 copyright 2019. This work is licensed under the Attribution 4.0 International Public Licence. Full text available at https://figshare.com/articles/dataset/Appendix_to_network_meta-analysis_Fragility_Fractures/7629344.
Treatment with romosozumab was associated with a significant reduction in the risk of sustaining vertebral fragility fractures compared to alendronate, risedronate and raloxifene. There was no significant difference between romosozumab versus zoledronate or denosumab in the risk of sustaining vertebral fractures.
Table 21: Network Meta-Analysis Results for Hip, Nonvertebral, and Vertebral Fractures
Intervention relative to romosozumab | Mean treatment difference (95% CI) random-effects model | ||
|---|---|---|---|
Hip fractures | Nonvertebral fractures | Vertebral fractures | |
Alendronate | 1.40 (0.81 to 2.45) | 1.25 (0.98 to 1.59) | 1.71 (1.18 to 2.48) |
Risedronate | 1.67 (0.88 to 3.16) | 1.16 (0.88 to 1.53) | 1.84 (1.16 to 2.92) |
Zoledronate | 1.38 (0.71 to 2.69) | 1.18 (0.88 to 1.59) | 1.15 (0.65 to 2.05) |
Raloxifene | 2.09 (1.10 to 3.99) | 1.41 (1.08 to 1.83) | 1.77 (1.12 to 2.81) |
Denosumab | 1.29 (0.61 to 2.76) | 1.20 (0.89 to 1.62) | 0.95 (0.56 to 1.61) |
CI = confidence interval.
Note: the bolded values indicated statistically significant results.
Source: Sponsor-submitted indirect treatment comparison.44
Sensitivity Analyses Based on the Route of Administration
Sensitivity analyses of the effects of zoledronate and calcitonin based on dosage and administration route were conducted. No statistically significant difference was found between 5 mg zoledronate and other doses of zoledronate in the effect on nonvertebral fractures. A sensitivity analysis of a single 5 mg dose of zoledronate found a statistically significant reduction in vertebral fractures. A sensitivity analysis of intranasal calcitonin demonstrated a statistically significant reduction in vertebral fractures, whereas the effects of injectable or oral calcitonin were not statistically significant. The results are presented in Figures 7 through 12 in Appendix 4.
Critical Appraisal of the Sponsor-Submitted Indirect Treatment Comparison
The sponsor’s rationale and objectives for conducting the ITC were clearly reported. According to the clinical expert consulted by CADTH for this review, the comparators and the dosages used were generally similar to those used in clinical practice. A comprehensive systematic review was performed with a 2-stage, dual-selection process. The language of publication was not restricted, thereby reducing publication bias. The clinical efficacy outcomes assessed were risks of sustaining vertebral, hip, and nonvertebral fragility fractures. Key efficacy outcomes for HRQoL or symptoms were not included in the analysis. Safety outcomes (i.e., AEs and SAEs), mortality, withdrawals due to AEs, and notable harms were not reported. Overall, 55 out of the 107 included RCTs had a high risk of bias. The risk of bias was high in most of the RCTs involving calcitonin, calcium, and vitamin D, as well as in some older bisphosphonate trials. No RCTs were excluded based on the assessment of bias.
Clinical heterogeneity was present in the analysis due to varying study duration, blinding, dosage, fracture risk assessment, publication date, patient demographic and clinical characteristics, and clinical-effect modifiers. Heterogeneity could have been reduced by specifying additional inclusion criteria for studies, such as requiring data on the blinding status, dosage, fracture risk assessment, and follow-up duration. The clinical expert consulted for this review indicated that many additional factors are considered potential effect modifiers, such as ethnicity, country of origin, calcium and vitamin D intake, weight-bearing physical activity, falls and conditions that increase the risk of falls, overweight or obesity, glucocorticoid use, lactose intolerance, gastrointestinal disorders (Crohn or celiac disease, ulcerative colitis, and bowel resections), systemic inflammatory disorders such as rheumatoid arthritis and lupus, diabetes (type 1 or 2), early menopause, and lack of postmenopausal hormone replacement therapy. The potential impact of these were not evaluated and adjusted for (where appropriate) in the ITC. Furthermore, the Canadian FRAX model and CAROC assume that the patient is Caucasian. In the US, the FRAX model distinguishes African-American from Hispanic and Caucasian patients. As such, a patient’s country of origin is important, and Asians tend to have a much lower fracture risk than Caucasians at the same level of BMD (the former can be low-risk when the latter are high-risk, as experts have seen in many patients). According to the clinical expert consulted for this review, ethnicity and how it is used in fracture risk assessment tools such as FRAX and CAROC have substantial effects on the risk of sustaining fragility fractures. The sponsor-submitted ITC did not incorporate or adjust for these effects when summarizing the ITC results. In addition, in the sponsor-submitted ITC the trials examining hormone replacement therapy tended to enrol younger women, and trials examining denosumab, romosozumab, teriparatide, and abaloparatide tended to enrol women who were more likely to have prevalent fractures or an increased risk for fracture. Also, the 2 trials involving romosozumab differed significantly in patient population and treatment dosage, as described in previous sections, providing further evidence that the ITC had substantial heterogeneity. The sponsor-submitted ITC did not perform sensitivity analyses by removing outlier studies that had effect modifiers that could potentially influence the results. The sponsor-submitted ITC also did not conduct a meta-regression to attempt to account for effect modifiers that could potentially minimize their influence on the results.
While the authors of the sponsor-submitted ITC did assess the risk of bias for the included studies, they did not provide a plan to investigate the impact of studies that were considered to be of low quality or have a high risk of bias.
Some studies in the evidence network reported fractures by location without the “nonvertebral” label; in these cases, all the fractures, including hip and/or pelvis fractures, were considered nonvertebral. This resulted in the same hip-fracture incidences being used in the calculations of 2 different outcomes: the risk of sustaining hip fractures and the risk of sustaining nonvertebral fractures. This double-counting thereby reduced the comparability of the results synthesized for different outcomes and overall internal validity of the ITC.
Vertebral fractures are characterized as symptomatic or non-symptomatic, with 70% being non-symptomatic, according to the clinical expert consulted for this review. It was not explicitly stated in the sponsor-submitted ITC whether vertebral fractures defined and assessed in the studies were symptomatic or non-symptomatic, which limits the generalizability of the synthesized results for vertebral fractures and the overall external validity of the ITC.
Sample size was large for most studies included in the ITC, the number of trials in relation to the number of nodes in the network was sufficiently large, and the total number of studies in the network was large (107). The degree of uncertainty in treatment effect estimates (risk ratios) was therefore not substantial, as demonstrated by the relatively narrow 95% CIs.
As a definition for “placebo” was not provided, it was not possible to determine whether this intervention was defined consistently across studies.
Summary
The sponsor-submitted ITC suggested that romosozumab was superior to alendronate and risedronate in preventing vertebral fractures and superior to raloxifene for all 3 outcomes evaluated (hip, vertebral, and nonvertebral fractures). No statistically significant differences were reported between romosozumab and zoledronate or denosumab on any of the outcomes evaluated. However, the sponsor-submitted ITC lacked: reporting of details for clinical heterogeneity in the included studies; effect modifiers and their influence on the results; construction of nodes in the ITC network; and details of assessments of essential NMA assumptions, including transitivity, consistency, and heterogeneity, that would better inform on the certainty of the indirect evidence. The ITC also did not conduct sensitivity and subgroup analyses to sufficiently assess homogeneity, or conduct a meta-regression to adjust for effect modifiers that could potentially influence the results. In addition, the majority of the studies in the evidence network were rated as having a high risk of bias, but no sensitivity analysis was conducted to examine the influence of these studies. Furthermore, given that the sponsor-submitted NMA did not provide a definition for “placebo,” double-counted hip fractures when analyzing hip and nonvertebral fracture outcomes, and did not distinguish between symptomatic and non-symptomatic vertebral fractures, there is uncertainty around the ITCs that undermines the internal and external validity of the ITC.
Other Relevant Evidence
This section includes submitted long-term extension studies and additional relevant studies in the sponsor’s submission to CADTH that were considered to address important gaps in the evidence included in the systematic review.
One long-term extension study, the FRAME Extension, was summarized to provide long-term evidence regarding romosozumab for the treatment of osteoporosis in postmenopausal women at high risk for fracture. The extension phase of the trial did not meet the eligibility criteria pre-specified for the CADTH systematic review as the main interventions of the trial did not involve romosozumab. However, the trial provided long-term efficacy data for patients treated with denosumab for 2 years after initially being treated with either romosozumab or placebo.
Long-Term Extension Study
The FRAME study is described in the Clinical Evidence section of this report. Briefly, the goal of the trial was to determine if 12 months of treatment with romosozumab was effective in reducing the incidence of new vertebral fractures, and if 12 months of romosozumab followed by 12 months of denosumab was effective in reducing the incidence of new vertebral fractures, compared to placebo, among postmenopausal women with osteoporosis.12 After the 24-month primary analysis of the trial, eligible patients could enrol in the 12-month open-label extension period, during which patients could continue to receive open-label denosumab at 60 mg every 6 months. The following section discusses results from the extension phase of the trial.12
Methods
Methodological details of the FRAME trial are described previously in this report. Figure 2 of this report illustrates all phases of the FRAME Trial.
Populations
Eligibility criteria of the FRAME study are descried elsewhere in this CADTH report. Briefly, inclusion criteria specified patients who were postmenopausal women between the ages of 55 and 90 years of age with a BMD T-score of no more than −2.50 at the total hip or femoral neck. Exclusion criteria included patients with a BMD T-score of no more than −3.50 at the total hip or femoral neck, a hip fracture at any time, any severe or more than 2 moderate vertebral fractures, severe metabolic or bone diseases, significant laboratory abnormalities, and the use of drugs that can affect bone metabolism. However, some therapies were permitted for use during off-treatment periods before trial randomization.12
Interventions
Patients who received open-label denosumab in the extension phase continued to receive 60 mg of denosumab subcutaneously every 6 months. Patients who continued into the extension phase remained blinded to their initial treatment assignment.12
Outcomes
All outcomes assessed in the extension portion of the FRAME study were based on the final analysis (36-month) study period. A summary of outcome objectives and specific end points assessed is included in Table 22.
Table 22: Summary of End Points Assessed in the FRAME Extension Trial
Outcome | Description |
|---|---|
Exploratory | |
Objective | Efficacy objectives of the extension phase of the FRAME study were considered exploratory and included:
|
End points |
|
Safety | |
Objective end points | Safety outcomes aimed to characterize the safety and tolerability of romosozumab treatment for 12 months followed by denosumab treatment for 24 months compared to placebo followed by denosumab treatment Summaries of adverse events, laboratory data, vital signs, and formation of anti-denosumab antibodies were analyzed |
End points |
|
Substudy | |
Objective | Substudy objectives included assessment of bone turnover markers and biomarkers. Specifically, objectives included:
|
End points |
|
BMD = bone mineral density; P1NP = procollagen type 1 N-terminal propeptide; sCTX = serum C-telopeptide.
Source: FRAME Extension Clinical Study Report.12
Statistical Analysis
All analyses of efficacy were performed on patients by the treatment group to which they were randomized, regardless of the treatment they actually received. Descriptive statistics (i.e., mean, SD, minimum, 25th percentile, median, 75th percentile, maximum, and number of non-missing observations) were used to summarize continuous outcomes. Frequencies and percentages were used to summarize nominal and ordinal categorical outcomes; unless otherwise specified, percentages were based on the patients with non-missing observations. Kaplan–Meier event rates were used to capture time-to-event outcomes. P values were 2-sided. For exploratory and substudy end points, including this extension phase, P values were nominal and were not adjusted for multiplicity.12
A summary of statistical methods for outcomes is provided in Table 23.
Table 23: Summary of Analysis Methods for the Extension phase (Exploratory End Points)
End Point | Methods |
|---|---|
Binary end points | |
Patient incidence of:
|
|
Time-to-event end points | |
Patient incidence of:
|
|
ANCOVA model | |
Percent change from baseline in BMD by DXA for:
|
|
ANCOVA = analysis of covariance; BMD = bone mineral density; CI = confidence interval; DXA = dual-energy X-ray absorptiometry.
Safety Analysis
The safety analysis set was used for all analyses of safety. No formal statistical testing was planned for safety analyses. Safety data were summarized based on actual treatment received by patients during the double-blind period of the FRAME trial. Patient incidence rates for the extension phase (i.e., the 36-month study period) included all events occurring during both the main double-blind phase of the trial and the extension phase for all patients receiving at least 1 dose of denosumab. All AEs were coded using the Medical Dictionary for Regulatory Activities version 19.1.12
All deaths and cardiovascular-related deaths were submitted for adjudication to an external independent committee of physicians with expertise in cardiology, osteoporosis, internal medicine, or neurology. Adjudicated cardiovascular events of death, cardiac ischemic events, cerebrovascular events, noncoronary revascularization, heart failure, and peripheral vascular events not requiring revascularization were summarized using patient incidence rates, odds ratios, and 95% CIs. No statistical tests for safety analyses were performed.12
Substudy Analyses of Bone Turnover Markers and Biomarkers
No stratification (i.e., by age strata and prevalent vertebral fracture strata) occurred during analyses of BTM and biomarkers. The level of significance was 0.05 and all P values were considered nominal and calculated from a Wilcoxon rank sum test. No adjustments were made for multiplicity.12
Analysis Sets
Primary analysis set for vertebral fractures: all randomized patients with a baseline and at least 1 post-baseline evaluation of vertebral fractures at or before the time point under consideration, including patients with missing baseline Genant semiquantitative scores whose first post-baseline spinal radiograph shows no fracture on the same vertebrae.
Full analysis set: all randomized patients. The full analysis set was the primary analysis set for the following fracture efficacy end points: nonvertebral, clinical, major nonvertebral, major osteoporotic, and hip.12
Primary efficacy analysis set for BMD end points: all randomized patients who had a baseline and at least 1 post-baseline evaluation at or before the time point under consideration in the study period.12
Safety analysis set: all randomized patients who received at least 1 dose of the investigational product in the 12-month double-blind period. The patient incidence rates for the 36-month study period included all events that occurred in the double-blind period and, in addition, all events that occurred in the open-label and extension periods for those patients who received at least 1 dose of denosumab.12
Extension period analysis set: all randomized patients who entered the extension period at month 24. This set was used to summarize baseline characteristics and demographics for patients who entered the extension study.12
BTM and biomarker substudy efficacy analysis set: all randomized patients who enrolled in the BTM substudy and had a baseline and at least 1 reported post-baseline reported BTM result.12
Patient Disposition
Eligibility for the 12-month extension phase was reported to follow the overall enrolment of the main phase of the trial, as there were no noticeable changes in proportions of patients remaining in the study. The study was conducted across 222 centres in 25 countries.12
A summary of patients completing and withdrawing from the FRAME extension study is reported in Table 24. A total of 7,180 patients were randomized into the main phase of the trial; 3,589 patients to the romosozumab group and 3,591 patients to the placebo group. A total of 6,045 patients completed the 24-month study period and entered the extension phase. Of the 7,180 randomized patients, 80% completed the 36-month study period, which was completed by 79.4% of patients within the romosozumab/denosumab group and 80.5% of patients in the placebo/denosumab group. Approximately 20% of patients discontinued from the 36-month study period, most commonly due to withdrawal of consent (10.3%).12
Important protocol deviations during the extension phase of the FRAME trial involved 256 patients (3.6%); these included deviations related to eligibility criteria that were considered important.12
Study details | Placebo/denosumab 60 mg every 6 months N = 3,591 n (%) | Romosozumab 210 mg monthly Denosumab 60 mg every 6 months N = 3,589 n (%) |
|---|---|---|
36-month study period accounting | ||
Completed 36-month study period | 2,892 (80.5) | 2,851 (79.4) |
Discontinued study during 36-month study period | 699 (19.5) | 738 (20.6) |
Consent withdrawn | 352 (9.8) | 390 (10.9) |
Death | 81 (2.3) | 74 (2.1) |
Other | 70 (1.9) | 70 (2.0) |
Adverse event | 63 (1.8) | 61 (1.7) |
Lost to follow-up | 55 (1.5) | 68 (1.9) |
Noncompliance | 52 (1.4) | 27 (0.8) |
Administrative decision | 15 (0.4) | 33 (0.9) |
Ineligibility determined | 5 (0.1) | 8 (0.2) |
Protocol deviation | 4 (0.1) | 3 (< 0.1) |
Requirement for alternative therapy | 2 (< 0.1) | 4 (0.1) |
36-month study period investigational product accounting | ||
Completed 36-month study period investigational product | 2,865 (79.8) | 2,808 (78.2) |
Discontinued investigational product during 36-month study period | 672 (18.7) | 716 (19.9) |
Consent withdrawn | 316 (8.8) | 356 (9.9) |
Adverse event | 130 (3.6) | 131 (3.7) |
Other | 72 (2.0) | 74 (2.1) |
Death | 60 (1.7) | 52 (1.4) |
Lost to follow-up | 40 (1.1) | 50 (1.4) |
Noncompliance | 40 (1.1) | 32 (0.9) |
Ineligibility determined | 6 (0.2) | 7 (0.2) |
Requirement for alternative therapy | 4 (0.1) | 6 (0.2) |
Administrative decision | 0 | 6 (0.2) |
Protocol deviation | 4 (0.1) | 2 (< 0.1) |
Note: Percentages are based on number of patients randomized. One subject discontinued study without providing a reason for discontinuation so is captured as “other.”
Source: FRAME Extension Clinical Study Report.12
Exposure to Study Treatments
A summary of baseline characteristics for the FRAME study was reported in the Baseline Characteristics subsection of the Clinical Evidence section of this clinical report. Demographic and disease baseline characteristics of patients during the extension phase of the trial were similar to demographic characteristics of patients during the main phase of the trial. Baseline characteristics were similar across both treatment groups.12
The following exposures to treatment are reported for the final analysis at month 36. Exposure to treatment during the primary 24 months of the trial are reported in the Exposure to Study Treatment subsection of the Clinical Evidence section of this report. A total of 3,581 patients received a minimum of 1 dose of romosozumab (210 mg monthly) and 3,576 patients received placebo; these patients were included in the safety analysis set. Of patients who entered the 12-month extension period, 3,087 received a minimum of 1 dose of denosumab in the romosozumab/denosumab group compared to 3,112 patients in the placebo/denosumab group.12 Most patients in both the romosozumab/denosumab group (90.6%) and the placebo/denosumab group (91.2%) received all 4 doses of denosumab. The mean cumulative exposure of denosumab was similar across both treatment groups at 229.2 mg (range = 60 mg to 240 mg) in the romosozumab/denosumab group and 230.5 mg (range = 60 mg to 240 mg) in the placebo/denosumab group.12
Efficacy
None of the analyses for the FRAME study were adjusted for multiplicity; all results summarized below are therefore considered descriptive. A summary of fracture end points through to month 36 of the FRAME study are reported in Table 25.
Table 25: Summary of Fracture End Points Through Month 36
Fracture category | Placebo/denosumab 60 mg q.6.m n (%) | Romosozumab 210 mg q.m. Denosumab 60 mg q.6.m. n (%) | Absolute risk reduction, % (95% CI) | Relative risk reduction, % (95% CI) | Ratioa | Nominal P valueb,c,d |
|---|---|---|---|---|---|---|
New vertebralb | 94 of 3,327 (2.8) | 32 of 3,327 (1.0) | 1.86 (1.21 to 2.52) | 66 (49 to 77) | 0.34 | < 0.001 |
Clinicalc | 196 of 3,591 (5.5) | 143 of 3,589 (4.0) | 1.6 (0.5 to 2.7) | 27 (10 to 41) | 0.73 | 0.004 |
Nonvertebralc | 176 of 3,591 (4.9) | 139 of 3,589 (3.9) | 1.1 (0.0 to 2.2) | 21 (1 to 37) | 0.79 | 0.039 |
Major nonvertebralc | 138 of 3,591 (3.8) | 100 of 3,589 (2.8) | 1.1 (0.2 to 2.1) | 27 (6 to 44) | 0.73 | 0.015 |
New or worsening vertebralb | 94 of 3,327 (2.8) | 33 of 3,327 (1.0) | 1.83 (1.18 to 2.49) | 65 (48 to 76) | 0.35 | < 0.001 |
Hipc | 31 of 3,591 (0.9) | 18 of 3,589 (0.5) | 0.4 (0.0 to 0.8) | 41 (−5 to 67) | 0.59 | 0.071 |
Major osteoporoticc | 147 of 3,591 (4.1) | 103 of 3,589 (2.9) | 1.3 (0.4 to 2.3) | 30 (10 to 45) | 0.70 | 0.006 |
Multiple new or worsening vertebralb | 20 of 3,327 (0.6) | 2 of 3,327 (< 0.1) | 0.54 (0.27 to 0.82) | 90 (57 to 98) | 0.10 | < 0.001 |
q.6.m = every 6 months; q.m. = every month.
Note: Major nonvertebral fracture includes fractures of the pelvis, distal femur, proximal tibia, ribs, proximal humerus, forearm, and hip. Major osteoporotic fractures include clinical vertebral fractures and fractures of the hip, forearm and humerus. Fractures associated with high trauma severity or pathologic fractures are excluded.
aRisk or hazard ratio compared with placebo/denosumab through month 36; a ratio of less than 1 favours romosozumab/denosumab.
bRelative risk reduction is calculated from the risk ratio as 100 × (1 – risk ratio). Absolute risk reduction and risk ratio are based on a Mantel-Haenszel method adjusted for age and prevalent vertebral fracture stratification variables. Nominal P values for vertebral fracture end points are based on a logistic regression model adjusting for age and prevalent vertebral fracture stratification variables.
cRelative risk reduction is calculated from the hazard ratio as 100 × (1 – hazard ratio). Absolute risk reduction is based on an inverse-weighted method adjusting for age and prevalent vertebral fracture stratification variables. The hazard ratio and nominal P values for clinical, nonvertebral, major nonvertebral, hip, and major osteoporotic fractures are based on a Cox proportional hazards model adjusting for age and prevalent vertebral fracture stratification variables.
dP values were not adjusted for multiple comparisons.
Source: FRAME Extension Clinical Study Report.12
New Vertebral Fractures Through Month 36
A total of 32 patients (1.0%) in the romosozumab/denosumab group had a new vertebral fracture compared to 94 patients (2.8%) in the placebo/denosumab group. A relative risk reduction of 66% (95% CI, 49 to 77; risk ratio = 0.34) was observed for patients in the romosozumab/denosumab compared with patients in the placebo/denosumab group.12
Clinical Fractures (Nonvertebral Fractures and Clinical Vertebral Fractures) Through Month 36
In the romosozumab/denosumab group, 143 patients (4.0%) in the romosozumab/denosumab group and 196 patients (5.5%) in the placebo/denosumab group had a clinical fracture resulting in a relative risk reduction of 27% (95% CI, 10 to 41; hazard ratio = 0.73) for romosozumab/denosumab compared with placebo/denosumab.12
Nonvertebral Fractures Through Month 36
A total of 139 patients (3.9%) and 176 patients (4.9%) in the romosozumab/denosumab group and placebo/denosumab groups, respectively, had a nonvertebral fracture. The relative risk reduction for romosozumab/denosumab compared with placebo/denosumab was 21% (95% CI, 1 to 37; hazard ratio = 0.79).12
Major Nonvertebral Fractures Through Month 36
One hundred patients (2.8%) in the romosozumab/denosumab group compared to 138 (3.8%) in the placebo/denosumab group had a major nonvertebral fracture. A relative risk reduction of 27% (95% CI, 6 to 44; hazard ratio = 0.73) was observed for patients in the romosozumab/denosumab group compared with patients in the placebo/denosumab group.12
New or Worsening Vertebral Fractures Through Month 36
Through month 36, 33 patients (1.0%) in the romosozumab/denosumab group and 94 (2.8%) in the placebo/denosumab group had a new or worsening vertebral fracture; the relative risk reduction for romosozumab/denosumab compared with placebo/denosumab was 65% (95% CI, 48 to 76; risk ratio = 0.35).12
Hip Fractures Through Month 36
A total of 18 patients (0.5%) in the romosozumab/denosumab group had a hip fracture versus 31 (0.9%) in the placebo/denosumab group. The relative risk reduction for romosozumab/denosumab compared with placebo/denosumab was 41% (95% CI, −5 to 67; hazard ratio = 0.59).12
Major Osteoporotic Fractures Through Month 36
A major osteoporotic fracture was observed in 103 patients (2.9%) in the romosozumab/denosumab group and 147 (4.1%) in the placebo/denosumab group. The relative risk reduction was 30% (95% CI, 10 to 45; hazard ratio = 0.70) for patients in the romosozumab/denosumab group compared with patients in the placebo/denosumab group.12
Multiple New or Worsening Vertebral Fractures Through Month 36
Two patients (< 0.1%) in the romosozumab/denosumab group and 20 patients (0.6%) in the placebo/denosumab group had multiple new or worsening vertebral fractures. The relative risk reduction for romosozumab/denosumab compared with placebo/denosumab was 90% (95% CI, 57 to 98; risk ratio = 0.10).12
Percent Change from Baseline in Bone Mineral Density by Dual-Energy X-ray Absorptiometry
Table 26 reports the change in BMD from baseline to month 36 of the study. Mean BMD values for the lumbar spine, total hip, and femoral neck for patients in the romosozumab/denosumab group were more than double the BMDs of the same locations for patients in the placebo/denosumab group.12
Table 26: Bone Mineral Density Percent Change from Baseline at Month 36 (ANCOVA Model)
Fracture category | Placebo/denosumab 60 mg q.6.m N = 3,591 n (%) | Romosozumab 210 mg q.m. Denosumab 60 mg q.6.m. N = 3,589 n (%) | Difference from placebo/denosumab 60 mg q.6.m.a |
|---|---|---|---|
Lumbar spine | |||
N | 2,996 | 2,980 | |
LS mean (SE) | 7.5 (0.1) | 18.1 (0.1) | 10.5 (0.2) |
(95% CI) | (7.4 to 7.7) | (17.8 to 18.3) | (10.2 to 10.8) |
P value | < 0.001 | ||
Total hip | |||
N | 3,072 | 3,040 | |
LS mean (SE) | 4.2 (0.1) | 9.4 (0.1) | 5.2 (0.1) |
(95% CI) | (4.0 to 4.3) | (9.2 to 9.5) | (5.0 to 5.4) |
P value | < 0.001 | ||
Femoral neck | |||
N | 3,072 | 3,040 | |
LS mean (SE) | 3.4 (0.1) | 8.2 (0.1) | 4.8 (0.1) |
(95% CI) | (3.1 to 3.7) | (7.9 to 8.5) | (4.5 to 5.0) |
P value | < 0.001 | ||
ANCOVA = analysis of covariance; BMD = bone mineral density; LS = least squares; q.6.m. = every 6 months; q.m. = every month.
aBased on an ANCOVA model adjusting for treatment, age and prevalent vertebral fracture stratification variables, baseline value, machine type, and baseline value-by-machine type interaction, without adjustment for multiplicity.
Source: FRAME Extension Clinical Study Report.12
Bone Turnover Marker and Biomarker Substudy
Bone Formation Marker (Procollagen type 1 N-terminal Propeptide): The mean percent change from baseline in P1NP was −56% in the romosozumab/denosumab group and −57% in the placebo/denosumab group (Table 27).12
Bone Resorption Marker (Serum C-telopeptide): In the romosozumab/denosumab group, the mean percent change from baseline in sCTX was −14% compared to −41% in the placebo/denosumab group (Table 27). The mean percent change of sclerostin from baseline was 13.0% in the romosozumab/denosumab group versus 14.7% in the placebo/denosumab group.12
Table 27: Percent Change from Baseline in Bone Turnover Markers at Month 36
Fracture category | Placebo/denosumab 60 mg q.6.m N = 62 n (%) | Romosozumab 210 mg q.m. Denosumab 60 mg q.6.m. N = 62 n (%) | Difference from placebo/denosumab 60 mg q.6.m.a |
|---|---|---|---|
Procollagen type 1 N-terminal propeptide (mcg/L) | |||
N | 48 | 49 | |
Mean (SD) | −57 (27) | −56 (35) | |
Minimum to maximum | −90 to 27 | −91 to 72 | |
P value | 0.79a | ||
Serum C-telopeptide re-testb (ng/L) | |||
N | 48 | 49 | |
Mean (SD) | −41 (46) | −14 (94) | |
Minimum to maximum | −96 to 64 | −93 to 350 | |
P value | 0.33a | ||
Sclerostin (pg/mL) | |||
N | 49 | 48 | |
Mean (SD) | 14.7 | 13.0 | |
Minimum to maximum | −25.7 to 116.9 | −35.5 to 131.8 | |
P value | 0.89a | ||
BTM = bone turnover marker; N = number of randomized patients enrolled in the BTM and biomarker substudy with a baseline and at least 1 post-baseline reported result for the parameter of interest; q.6.m. = every 6 months; q.m. = every month.
aNominal P values are from a Wilcoxon rank sum test without multiplicity adjustment.
bRetest was performed due to an assay shift.
Source: FRAME Extension Clinical Study Report.12
Harms
Frequently Reported Adverse Events
Adverse events occurred in 88.1% and 89.0% of patients in the romosozumab/denosumab and placebo/denosumab groups, respectively. A summary of frequently reported AEs (occurrence rate ≥ 5%) is provided in Table 28. The most commonly occurring AEs in the respective romosozumab/denosumab and placebo/denosumab groups were arthralgia (18.7% versus 18.6%), nasopharyngitis (18.2% versus 17.4%), back pain (14.5% versus 16.1%), fall (13.7% versus 15.2%), pain in extremity (11.7% versus 11.4%) and hypertension (11.0% versus 11.8%). All AEs were reported at a similar rate across both treatment groups.12
Table 28: Patient Incidence of Treatment-Emergent Adverse Events by Preferred Term
Adverse events | Placebo/denosumab 60 mg N = 3,576 | Romosozumab 210 mg monthly Denosumab 60 mg every 6 months N = 3,581 |
|---|---|---|
All adverse events,a n (%) | 3,182 (89.0) | 3,156 (88.1) |
Arthralgia | 666 (18.6) | 668 (18.7) |
Nasopharyngitis | 622 (17.4) | 651 (18.2) |
Back pain | 577 (16.1) | 521 (14.5) |
Fall | 544 (15.2) | 489 (13.7) |
Pain in extremity | 407 (11.4) | 418 (11.7) |
Hypertension | 421 (11.8) | 395 (11.0) |
Osteoarthritis | 345 (9.6) | 335 (9.4) |
Headache | 273 (7.6) | 294 (8.2) |
Musculoskeletal pain | 260 (7.3) | 263 (7.3) |
Urinary tract infection | 273 (7.6) | 256 (7.1) |
Influenza | 242 (6.8) | 238 (6.6) |
Upper respiratory tract infection | 256 (7.2) | 236 (6.6) |
Viral upper respiratory tract infection | 263 (7.4) | 230 (6.4) |
Dizziness | 217 (6.1) | 229 (6.4) |
Muscle spasms | 201 (5.6) | 211 (5.9) |
Constipation | 212 (5.9) | 189 (5.3) |
Cough | 179 (5.0) | 189 (5.3) |
Diarrhea | 193 (5.4) | 182 (5.1) |
Contusion | 204 (5.7) | 180 (5.0) |
Bronchitis | 165 (4.6) | 180 (5.0) |
MedDRA = Medical Dictionary for Regulatory Activities; N = number of patients who received at least 1 dose of the investigational product in the double-blind period.
Note: Preferred terms are sorted by descending order of frequency in the romosozumab/denosumab group and coded using MedDRA version 19.1. The patient incidence rates for the 36-month study period included all events that occurred in the double-blind period and, in addition, all events that occurred in the open-label and extension periods for those patients who received at least 1 dose of denosumab.
aIncludes all adverse events, not only those occurring at a rate of 5% or greater.
Source: FRAME Extension Clinical Study Report.12
Serious Adverse Events
A summary of SAEs is reported in Table 29. In general, SAEs were infrequently reported and similar across both treatment groups. Most SAEs were reported among less than 1% of patients.12
Table 29: Patient Incidence of Serious Adverse Events by System Organ Class and Preferred Term (at Least 0.2% Patient Incidence in Any Treatment Group) (Safety Analysis Set)
SAEs | Placebo/denosumab 60 mg q.6.m. N = 3,576 | Romosozumab 210 mg q.m. Denosumab 60 mg q.6.m. N = 3,581 |
|---|---|---|
Total SAEs | 733 (20.5) | 728 (20.3) |
Infections and infestations | 133 (3.7) | 153 (4.3) |
Pneumonia | 37 (1.0) | 44 (1.2) |
Urinary tract infection | 14 (0.4) | 17 (0.5) |
Cellulitis | 11 (0.3) | 11 (0.3) |
Bronchitis | 3 (< 0.1) | 9 (0.3) |
Sepsis | 3 (< 0.1) | 7 (0.2) |
Gastroenteritis | 3 (< 0.1) | 6 (0.2) |
Appendicitis | 7 (0.2) | 4 (0.1) |
Diverticulitis | 6 (0.2) | 3 (< 0.1) |
Neoplasms benign, malignant, and unspecified (including cysts and polyps) | 112 (3.1) | 110 (3.1) |
Lung neoplasm malignant | 10 (0.3) | 13 (0.4) |
Breast cancer | 11 (0.3) | 8 (0.2) |
Basal cell carcinoma | 6 (0.2) | 7 (0.2) |
Adenocarcinoma gastric | 8 (0.2) | 2 (< 0.1) |
Cardiac disorders | 113 (3.2) | 103 (2.9) |
Atrial fibrillation | 18 (0.5) | 17 (0.5) |
Acute myocardial infarction | 10 (0.3) | 16 (0.4) |
Angina unstable | 9 (0.3) | 10 (0.3) |
Cardiac failure congestive | 8 (0.2) | 10 (0.3) |
Cardiac failure | 7 (0.2) | 10 (0.3) |
Myocardial infarction | 9 (0.3) | 8 (0.2) |
Coronary artery disease | 7 (0.2) | 7 (0.2) |
Angina pectoris | 5 (0.1) | 7 (0.2) |
Myocardial ischemia | 7 (0.2) | 3 (< 0.1) |
Nervous system disorders | 88 (2.5) | 98 (2.7) |
Cerebrovascular accident | 9 (0.3) | 14 (0.4) |
Ischemic stroke | 9 (0.3) | 13 (0.4) |
Transient ischemic attack | 6 (0.2) | 13 (0.4) |
Syncope | 7 (0.2) | 9 (0.3) |
Injury, poisoning, and procedural complications | 111 (3.1) | 93 (2.6) |
Radius fracture | 17 (0.5) | 14 (0.4) |
Femoral neck fracture | 14 (0.4) | 11 (0.3) |
Femur fracture | 19 (0.5) | 9 (0.3) |
Ulna fracture | 12 (0.3) | 8 (0.2) |
Humerus fracture | 8 (0.2) | 8 (0.2) |
Fibula fracture | 8 (0.2) | 7 (0.2) |
Tibia fracture | 7 (0.2) | 7 (0.2) |
Fall | 6 (0.2) | 7 (0.2) |
Head injury | 3 (< 0.1) | 6 (0.2) |
Gastrointestinal disorders | 82 (2.3) | 74 (2.1) |
Abdominal pain | 9 (0.3) | 10 (0.3) |
Pancreatitis acute | 1 (< 0.1) | 6 (0.2) |
Gastrointestinal hemorrhage | 6 (0.2) | 2 (< 0.1) |
Musculoskeletal and connective tissue disorders | 68 (1.9) | 56 (1.6) |
Osteoarthritis | 27 (0.8) | 21 (0.6) |
Spinal osteoarthritis | 10 (0.3) | 1 (< 0.1) |
Respiratory, thoracic, and mediastinal disorders | 53 (1.5) | 55 (1.5) |
Chronic obstructive pulmonary disease | 28 (0.8) | 22 (0.6) |
Pulmonary embolism | 6 (0.2) | 9 (0.3) |
Asthma | 3 (< 0.1) | 8 (0.2) |
Vascular disorders | 37 (1.0) | 46 (1.3) |
Hypertension | 12 (0.3) | 15 (0.4) |
Hypertensive crisis | 2 (< 0.1) | 6 (0.2) |
General disorders and administration site conditions | 28 (0.8) | 34 (0.9) |
Death | 9 (0.3) | 13 (0.4) |
Non-cardiac chest pain | 3 (< 0.1) | 10 (0.3) |
Metabolism and nutrition disorders | 20 (0.6) | 28 (0.8) |
Dehydration | 1 (< 0.1) | 7 (0.2) |
Hepatobiliary disorders | 32 (0.9) | 26 (0.7) |
Cholelithiasis | 11 (0.3) | 12 (0.3) |
Cholecystitis acute | 6 (0.2) | 5 (0.1) |
Reproductive system and breast disorders | 14 (0.4) | 24 (0.7) |
Uterine prolapse | 2 (< 0.1) | 7 (0.2) |
Eye disorders | 18 (0.5) | 14 (0.4) |
Cataract | 14 (0.4) | 13 (0.4) |
Blood and lymphatic system disorders | 18 (0.5) | 13 (0.4) |
Anemia | 9 (0.3) | 4 (0.1) |
Psychiatric disorders | 15 (0.4) | 13 (0.4) |
Depression | 6 (0.2) | 3 (< 0.1) |
MedDRA = Medical Dictionary for Regulatory Activities; N = number of patients who received at least 1 dose of investigational product in the double-blind period; q.6.m. = every 6 months; q.m. = every month.
Note: System organ classes and preferred terms are sorted by descending order of frequency in the romosozumab/denosumab group and coded using MedDRA version 19.1. The patient incidence rates for the 36-month study period include all events that occurred in the double-blind period and, in addition, all events that occurred in the open-label and extension periods for those patients who received at least 1 dose of denosumab.
Source: FRAME Extension Clinical Study Report.12
Treatment Discontinuation and Withdrawal Due to Adverse Events
Treatment was discontinued due to AEs for 3.9% of patients in the romosozumab/denosumab group compared to 3.6% of patients in the placebo/denosumab group. In general, treatment discontinuations due to AEs were infrequently reported among all patients (occurring at a rate of < 0.2%). In the romosozumab/denosumab group, the most common AEs resulting in treatment discontinuation were pain in extremity (0.3%) and arthralgia (0.2%). In the placebo/denosumab group, the most common AEs resulting in treatment discontinuation were arthralgia and musculoskeletal pain (0.2% each) (Table 30).12
Withdrawal from the study due to AEs was reported in 64 patients (1.8%) in each treatment group. Adverse events that led to discontinuation from the trial were reported in no more than 0.1% of patients.12
Table 30: Treatment Discontinuations Due to Adverse Events (Safety Analysis Set)
AEs | Placebo/denosumab 60 mg q.6.m. N = 3,576 n (%) | Romosozumab 210 mg q.m. Denosumab 60 mg q.6.m. N = 3,581 n (%) |
|---|---|---|
Total number of patients reporting AEs leading to investigational product discontinuation AEs | 130 (3.6) | 138 (3.9) |
Neoplasms benign, malignant, and unspecified (including cysts and polyps) | 31 (0.9) | 30 (0.8) |
Lung neoplasm malignant | 6 (0.2) | 4 (0.1) |
Musculoskeletal and connective tissue disorders | 30 (0.8) | 30 (0.8) |
Pain in extremity | 2 (< 0.1) | 9 (0.3) |
Arthralgia | 6 (0.2) | 6 (0.2) |
Musculoskeletal pain | 8 (0.2) | 3 (< 0.1) |
Back pain | 4 (0.1) | 2 (< 0.1) |
Gastrointestinal disorders | 10 (0.3) | 16 (0.4) |
Nausea | 0 | 4 (0.1) |
General disorders and administration site conditions | 13 (0.4) | 13 (0.4) |
Fatigue | 4 (0.1) | 3 (< 0.1) |
Nervous system disorders | 17 (0.5) | 11 (0.3) |
Dizziness | 5 (0.1) | 2 (< 0.1) |
AE = adverse event; MedDRA = Medical Dictionary for Regulatory Activities; N = number of patients who received at least 1 dose of the investigational product in the double-blind period; q.6.m. = every 6 months; q.m. = every month.
Note: System organ classes and preferred terms are sorted by descending order of frequency in the romosozumab/denosumab group and coded using MedDRA version 19.1. The patient incidence rates for the 36-month study period include all events that occurred in the double-blind period and, in addition, all events that occurred in the open-label and extension periods for those patients who received at least 1 dose of denosumab.
Source: FRAME Extension Clinical Study Report.12
Deaths
Over the 36-month study period, fatal AEs occurred in 72 patients (2.0%) and 85 patients (2.4%) in the romosozumab/denosumab and placebo/denosumab groups, respectively. The occurrence of treatment-related AEs resulting in death (indicated by the investigator that there was a possibility they may have been caused by the study drug) were generally infrequent, occurring in less than 0.1% of patients.12
Cardiovascular-related deaths were also captured and adjudicated separately by an independent committee of physicians. A summary of adjudicated positive cardiovascular deaths is supplied in Table 31. In total, 43 patients (1.2%) in the romosozumab/denosumab group and 50 patients (1.4%) in the placebo/denosumab group died from a cardiovascular-related cause. Approximately half of cardiovascular deaths in each treatment group were labelled “undetermined” but were counted among cardiovascular deaths. Fatal serious cardiovascular AEs were uncommon, occurring in no more than 0.2% of patients in each group. Overall, cardiovascular deaths were reported at similar rates across both treatment groups, although the number of patients who died from a cerebrovascular event was numerically higher in the placebo/denosumab group.12
Table 31: Adjudicated Positive Cardiovascular Death Events
Type | Placebo/denosumab 60 mg N = 3,576 | Romosozumab 210 mg monthly Denosumab 60 mg every 6 months N = 3,581 |
|---|---|---|
Number of patients with adjudicated positive cardiovascular deatha | 50 (1.4) | 43 (1.2) |
Undetermined | 21 (0.6) | 23 (0.6) |
Fatal serious adverse event categoriesb | ||
Cardiac ischemic event | 3 (< 0.1) | 3 (< 0.1) |
Cerebrovascular event | 7 (0.2) | 2 (< 0.1) |
Noncoronary revascularization | 0 | 0 |
Heart failure | 2 (< 0.1) | 2 (< 0.1) |
Peripheral vascular events not requiring revascularization | 0 | 1 (< 0.1) |
N = number of patients who received at least 1 dose of the investigational product in the 12-month double-blind period.
Note: The patient incidence rates for the 36-month study period include all events that occurred in the 12-month double-blind period and, in addition, all events that occurred in the open-label and extension periods for those patients who received at least 1 dose of denosumab.
aAdjudicated positive cardiovascular deaths includes fatal events adjudicated as cardiovascular-related or undetermined to be cardiovascular.
bNot all serious fatal adverse events were categorized into specific adjudication categories; some fatal events were adjudicated as cardiovascular-related without falling into a predefined category.
Source: FRAME Extension Clinical Study Report.12
Adverse Events of Special Interest
Certain AEs of special interest were specified in the CADTH systematic review protocol. Adverse events of special interest are reported in Table 32, and include adjudicated ONJ and adjudicated cardiovascular events, including cardiac ischemic events, heart failure, noncoronary revascularization, cerebrovascular events, and peripheral vascular events not requiring vascularization. Adverse events of special interest occurred at similar rates among both treatment groups.
Table 32: Summary of Adverse Events of Special Interest During the 36-Month Trial Period (Safety Analysis Set)
AE | Placebo/denosumab 60 mg every 6 months N = 3,576 n (%) | Romosozumab 210 mg monthly Denosumab 60 mg every 6 months N = 3,581 n (%) |
|---|---|---|
Any cardiovascular serious AE | 124 (3.5) | 128 (3.6) |
Cardiac ischemic event | 38 (1.1) | 36 (1.0) |
Heart failure | 15 (0.4) | 12 (0.3) |
Noncoronary revascularization | 4 (0.1) | 2 (< 0.1) |
Cerebrovascular event | 36 (1.0) | 43 (1.2) |
Peripheral vascular events not requiring revascularization | 3 (< 0.1) | 8 (0.2) |
Adjudicated positive ONJ | 0 | 2 (< 0.1) |
N = number of patients who received at least 1 dose of the investigational product in the 12-month double-blind period; ONJ = osteonecrosis of the jaw.
Note: The patient incidence rates for the 36-month study period include all events that occurred in the 12-month double-blind period and, in addition, all events that occurred in the open-label and extension periods for those patients who received at least 1 dose of denosumab.
Source: FRAME Extension Clinical Study Report.12
Adjudicated Cardiovascular Events: Cardiovascular SAEs were reported among 128 patients (3.6%) in the romosozumab/denosumab group and 124 patients (3.5%) in the placebo/denosumab group. In general, there were no differences in the incidence of adjudicated cardiovascular events (e.g., cardiac ischemic event, heart failure, noncoronary revascularization, cerebrovascular event, and peripheral vascular events not requiring revascularization) between the 2 treatment groups.
Adjudicated Positive Osteonecrosis of the Jaw: Two events (< 0.1%), both occurring in the romosozumab/denosumab group, were adjudicated to positively show ONJ. No events were considered serious. All events occurred during the 24-month period of the trial; no additional positively adjudicated AEs of ONJ were identified during the 12-month extension phase of the study.12
Critical Appraisal
Internal Validity
During the open-label extension period all patients were assigned to the same treatment. Due to knowledge of treatment assignment, open-label trials may have a greater likelihood of biasing outcomes in favour of novel treatments compared to placebo or traditional standards of care. However, as all patients were assigned the same treatment during the extension phase, it is unlikely that biases related to open-label trials affected the performance of patients and analyses of efficacy outcomes. Further, patients remained blinded to initial treatment assignment through the extension phase of the trial. It was unclear whether investigators and study personnel also remained blinded to initial treatment assignment.
All trial outcomes and statistical methods were pre-specified. However, none of the analyses were adjusted for multiplicity. Therefore, the lack of adjustment may increase the likelihood of type I error and of detecting a statistical difference when it may not be present. All results and analyses of the extension period of the FRAME trial should be considered descriptive.
Exposure to denosumab was similar across both the romosozumab/denosumab and placebo/denosumab treatment groups. More than 90% of patients in both the groups received all 4 doses of denosumab and had a mean cumulative exposure of 229.2 mg (range = 60 mg to 240 mg) and 230.5 mg (range = 60 mg to 240 mg), respectively.12 Any differences in treatment exposure of denosumab are therefore not likely to confound overall treatment effects based in initial treatment with romosozumab or placebo.
Important protocol deviations were reported for 122 patients (3.4%) in the romosozumab/denosumab group and 134 patients (3.7%) in the placebo/denosumab group. Important protocol deviations occurred at similar frequency between both treatment groups of the trial and were due to patients receiving the incorrect treatment or dose (2.1% versus 2.2%), entering the trial without satisfying eligibility criteria (0.7% versus 1.0%), receiving a concomitant medication excluded from eligibility criteria (0.3% versus 0.3%), missing data (0.1% versus 0.3%), and developing withdrawal criteria without being withdrawn from the trial (0.3% versus 0.1%).12 Eligibility criteria of the trial included a list of concomitant medications patients could be administered throughout the trial. Important protocol deviations pertaining to patients who received excluded concomitant medications were reported for 24 patients (12 in each treatment group). As equal numbers of patients in each treatment group received concomitant medications not permitted within the trial, and because the number of patients receiving these medications was so small, it is unlikely that such deviations had a substantial impact on any efficacy or safety analyses.12
Data on BTMs were reported as part of the substudy of the FRAME extension. Results of BTMs in the extension phase of the FRAME trial showed a similar mean percent change from baseline in P1NP and sclerostin levels. The sample sizes for the BTM substudy were small (N = 62 for each treatment group), and the substudy was not powered to detect differences between treatment groups. In addition, the analyses for BTMs were not adjusted for multiplicity, increasing the likelihood of type I error.
Health Canada and the FDA have included safety warnings related to cardiovascular AEs (potential risk of myocardial infarction, stroke, and cardiovascular death) in the respective product monograph and product label for romosozumab. Analyses were conducted to determine the differences in odds of cardiovascular events occurring between treatment groups; however, some of the sample sizes for specific cardiovascular AEs were small (and are not reported here). The analyses for detecting differences in the odds of a cardiovascular event between the romosozumab/denosumab and placebo/denosumab groups was not powered or adjusted for multiplicity. Differences in the odds of cardiovascular AEs occurring between patients initially treated with romosozumab and placebo should be interpreted with caution as the study was not adequately designed to evaluate the excess risk of cardiovascular events in the treatment groups and comparisons have not been controlled for multiple comparisons.
External Validity
Patient baseline demographic and clinical characteristics were generally balanced across both treatment groups. Baseline characteristics of patients during the extension phase of the trial remained similar to baseline characteristics at the beginning of the FRAME trial. Therefore, as the characteristics of patients remained stable throughout the 36-month length of the trial, it is unlikely that imbalances either between treatment groups or between patients analyzed at different time points in the trial resulted in any confounding of results. Clinical experts also confirmed that patients in the FRAME trial would be considered candidates for treatment with romosozumab.
The extension phase of the FRAME trial provided longer-term efficacy and safety data pertaining to initial treatment with either romosozumab or placebo, and long-term use of denosumab. Denosumab may be administered to patients for as long as it remains effective.31 However, romosozumab is recommended for use once a month for a maximum of 12 months.8 Therefore, this trial provides insight into the long-term effects of initial treatment with romosozumab followed by treatment with an antiresorptive agent, such as denosumab. This long-term data can help inform patients and physicians about the long-term effects (i.e., 36 months) of treatment with romosozumab followed by denosumab. Longer-term data (i.e., ≥ 10 years) may be more useful for patients and clinicians for determining long-term fracture risks after treatment with romosozumab. Differences in fracture incidence between patients initially treated with romosozumab and placebo was an end point of the extension phase of the FRAME study; results indicated a greater risk reduction in all analyzed sites among patients initially treated with romosozumab compared to patients initially treated with placebo.
Discussion
Summary of Available Evidence
Two phase III studies (FRAME, N = 7,180; ARCH, N = 4,093) submitted by the sponsor are included in this systematic review. The trials enrolled postmenopausal women (55 to 90 years of age) with osteoporosis.
The FRAME study was a double-blind, placebo-controlled RCT that assessed the efficacy and safety of romosozumab for the treatment of osteoporosis in postmenopausal women. Eligible patients were randomized to receive romosozumab 210 mg subcutaneously or placebo once a month for 12 months. After the 12-month double-blind treatment period, both groups received open-label denosumab 60 mg every 6 months for an additional 12 months. After the first 24-month treatment, patients entered a 12-month open-label extension period (currently ongoing), during which they continued to receive denosumab 60 mg every 6 months. The co-primary efficacy end points were incidence of new vertebral fractures at month 12 and at month 24.
The ARCH study was a double-blind, active-controlled RCT that assessed the efficacy and safety of romosozumab for the treatment of osteoporosis in postmenopausal women with a high risk of fracture. Eligible patients were randomized to receive romosozumab 210 mg subcutaneously or oral alendronate 70 mg for 12 months. After the initial 12-month double-blind alendronate-controlled study period, both groups received open-label alendronate therapy 70 mg once a week for an additional 12 months. The primary efficacy end points in ARCH were the incidence of new vertebral fractures at month 24 and the incidence of clinical fractures (nonvertebral fractures and clinical vertebral fractures) during the primary analysis period, which refers to randomization to the time point that clinical fractures were confirmed for at least 330 patients, and at which point patients have had the opportunity to complete the month 24 study visit.
A limitation of the direct evidence provided by the 2 trials is a lack of comparative evidence between romosozumab and other active treatments, such as another anabolic drug. One sponsor-submitted ITC evaluated the relative clinical efficacy of romosozumab to other active treatments such as teriparatide, denosumab, raloxifene, zoledronate, risedronate, and abaloparatide in postmenopausal women with primary osteoporosis or osteopenia at risk for developing fragility fractures.
Interpretation of Results
Efficacy
Outcomes of fracture are relevant in clinical trials of osteoporosis. They were also identified by the clinicians and patients as important clinical outcomes. In FRAME, the risks of new vertebral fractures measured at the end of 1 year and 2 years of treatment were the primary efficacy end points. Treatment with romosozumab was associated with a statistically significant relative risk reduction in new vertebral fractures at month 12 and at month 24 compared to placebo. According to the clinical expert consulted by CADTH, the benefit gained in reduction in the risk of new vertebral fracture is likely to be clinically meaningful. Results on a number of fracture-related outcomes evaluated as secondary end points (nonvertebral fractures, major nonvertebral fractures, new or worsening vertebral fractures, hip fractures, major osteoporotic fractures, and multiple new/worsening vertebral fractures) favoured romosozumab, with fewer patients in the romosozumab group developing these fractures compared to patients receiving placebo. The difference in the risk of clinical fractures was shown to be statistically significant for romosozumab compared to placebo at months 12 and 24. Results were not statistically significant for comparisons of nonvertebral fractures, and formal testing was not conducted for the remaining end points as the statistical testing sequence was stopped. The lack of statistical differences between romosozumab and placebo, according to the clinical study report for the FRAME study, may be partly attributed to a higher percentage of the FRAME study population coming from Central or South America. A statistically significant treatment-by-region interaction for the analysis of nonvertebral fractures was reported through month 12. The Central or South America subgroup made up 43.0% of the randomized population in the study, but the frequency of nonvertebral fractures in this population was lower than expected. The observed frequency of nonvertebral fractures in the first 12 months in the placebo group was 1.2%, and in the romosozumab group it was 1.5%, while the expected nonvertebral fracture frequency was 3.5% (used for sample-size calculations). In comparison with the rest of the world, the nonvertebral fracture frequency was 2.7% in the placebo group and 1.6% in the romosozumab group (post hoc relative risk reduction = 42%; 95% CI, 11 to 63; P = 0.012). Although subgroup analyses by world region were pre-specified, the analyses to explore the impact of the Central or South America results versus the rest-of-world results were post hoc.
In general, the results from the FRAME study are difficult to interpret, particularly the sequencing of romosozumab followed by denosumab, because of the placebo comparator and differences between groups in the study. This point was raised in the Health Canada reviewer’s report, which stated, “The comparison of romosozumab/denosumab to placebo/denosumab at month 24 is not a valid comparison given that patients in the placebo/denosumab treatment group have only been exposed to one year of active treatment versus the romosozumab/denosumab treatment group who have been exposed to 2 years of active treatment.”37 As well, it was noted previously that patients with characteristics of those at higher risk of fracture were excluded from the FRAME study. As a result, there is a high degree of uncertainty that the results from FRAME at month 24 are interpretable or representative of the expected effects in the population targeted for treatment with romosozumab.
In the ARCH study, the risk of new vertebral fractures at month 24 and the risk of clinical fractures through the primary analysis study period were co-primary efficacy end points. Treatment with 1 year of romosozumab followed by alendronate therapy for another year was associated with a statistically significantly reduced risk of new vertebral fractures through month 24, compared with treatment with alendronate for 2 years. Romosozumab was also associated with a statistically significantly reduced risk of clinical fractures through the primary analysis study period. The clinical expert indicated that the benefit gained in reduction in the risk of new vertebral fractures and clinical fractures is likely clinically meaningful. Results on other fracture-related outcomes in this study (nonvertebral fractures, new vertebral fractures, clinical fractures, hip fractures, major nonvertebral fractures, major osteoporotic fractures, and all osteoporotic fractures) also favoured romosozumab over alendronate. The comparison for nonvertebral fractures was statistically significant in favour of romosozumab. Firm conclusions cannot be drawn for all other fracture end points as they were not adjusted for multiple comparisons. As with FRAME, the results of this study are somewhat difficult to interpret because of the design of the study, which used a relevant treatment as a comparator. However, it was difficult to assess the assay sensitivity of the trial because it lacked a third group treated with placebo, which would be particularly important because alendronate has a different mechanism of action and it may take 2 to 3 years for the fracture preventive benefits to be detectable. Nonetheless, the treatment groups were likely more comparable than in the FRAME study and the enrolled patient population is more representative of the target patient population. As well, the results are biologically plausible as, according to the clinical expert consulted by CADTH, the preferred approach to treating patients with osteoporosis at risk of fracture is to enhance bone building (using a drug such as romosozumab) then prevent bone degeneration (using an antiresorptive or antiremodelling drug). The results of the ARCH study therefore appear to represent improved fracture risk reduction with romosozumab/alendronate versus alendronate/alendronate, although the exact magnitude of the treatment effect is unclear.
Among the important clinical outcomes by clinicians and patient group was HRQoL, which was an exploratory outcome in both FRAME and ARCH. It was evaluated using the generic EQ-5D-5L and a disease-specific questionnaire, OPAQ-SV. Results of the 2 studies did not show consistent or clinically meaningful changes in any of these tools between romosozumab and the comparators. A vertebral fracture is the most common clinical manifestation of osteoporosis. Among them, approximately 2-thirds of these fractures are asymptomatic. This could explain why a deterioration or improvement in symptoms and quality of life may not be easily detected, and therefore why a change in HRQoL may not be observed.
Overall, the potential benefit of romosozumab on HRQoL remains unknown. The relationship between the gains from reduced fracture risk and improvement in patient’s HRQoL was unclear.
The incidence of fatal events was similar between romosozumab and placebo in the FRAME study, and between romosozumab and alendronate in the ARCH study, during the 2-year study period.
The change in BMD from baseline was measured at the lumbar spine, total hip, and femoral neck in FRAME and ARCH. In the ARCH study, treatment with romosozumab was associated with a statistically significantly increase in BMD from baseline at all 3 sites, compared to alendronate at both months 12 and 24. Results from the FRAME study showed similar trends in BMD when comparing romosozumab to placebo, although these comparisons did not account for multiple comparisons. Additionally, the same concerns regarding the similarity of the treatment groups in FRAME for making comparisons is highly uncertain. According to the clinical expert, the between-group differences in the ARCH trial are clinically meaningful. These results were consistent with the change in incidence of fracture in the study population.
Longer-term data from the FRAME extension study provided insight regarding the effects of initial treatment with romosozumab followed by treatment with an antiresorptive agent beyond the initial 24-month treatment period. Results of the extension study suggested that, for all fracture types (i.e., new vertebral, clinical, nonvertebral, major nonvertebral, new or worsening vertebral, hip, major osteoporotic, and multiple new or worsening vertebral), greater reductions in the risk of fractures were observed among patients initially treated with romosozumab followed by denosumab (romosozumab/denosumab group) compared to patients initially treated with placebo followed by denosumab (placebo/denosumab group). The gains in BMD were also maintained in the original romosozumab group. There is no control arm in the extension phase of FRAME, and all results and analyses during this period are considered descriptive. Large observational studies and pooled analysis have found that treatment-related BMD changes are strongly associated with fracture reductions across randomized trials of osteoporosis treatments with different mechanisms of action, and support the use of BMD as a surrogate outcome for fracture outcomes.45-47 The use of BTMs may complement measurements of BMD in the management of osteoporosis, particularly among patients who have been or are currently taking therapies that are antiresorptive or result in bone formation. However, the correlation between BTMs and the occurrence of osteoporotic fractures may not be as strong as BMD.
The direct evidence comparing romosozumab to existing treatments in postmenopausal women with a high risk of fracture is limited to the results from the ARCH study. The sponsor submitted a single ITC to examine the relative clinical efficacy of romosozumab to other active treatments, such as denosumab, raloxifene, alendronate, risedronate, and zoledronate, in postmenopausal women with primary osteoporosis or osteopenia at risk for developing fragility fractures. However, the ITC did not inform the comparative evidence because of key limitations that precluded drawing conclusions from the results of the analysis. Limitations that were identified in the ITC included a lack of reporting of certain patient characteristics that would better inform on the certainty of the indirect evidence, the high risk of bias associated with most studies, evidence of extensive clinical heterogeneity between studies, a lack of appropriate statistical methods to adjust for effect modifiers that could potentially influence the study results, no clear definition for “placebo” in the included studies, and double-counting of hip fractures when analyzing hip and nonvertebral fracture outcomes. There is therefore uncertainty around the ITC that undermines the internal and external validity of this analysis.
Harms
During the 24-month study period, the incidence of AEs was similar between romosozumab (month 12: 78%; month 24: 85%) and placebo (month 12: 80%; month 24: 86%) in FRAME, and between romosozumab (month 12: 76%; primary analysis period: 87%) and alendronate (month 12: 79%; primary analysis period 24: 89%) in ARCH. The common AEs reported in the romosozumab groups were arthralgia, nasopharyngitis, back pain, and pain in extremities. The incidence of SAEs was similar between romosozumab (month 12: 10%; month 24: 16%) and placebo (month 12: 9%; month 24: 15%) in FRAME, and between romosozumab (month 12: 13%; primary analysis period: 29%) and alendronate (month 12: 14%; primary analysis period 24: 30%) in ARCH. In the romosozumab group, pneumonia, chronic obstructive pulmonary disease, osteoarthritis, femur fractures, radius fractures, and femoral neck fractures were considered SAEs. Treatment discontinuation due to AEs were also similar between romosozumab (month 12: 3%; month 24: 3%) and placebo (month 12: 3%; month 24: 3%) in FRAME, and between romosozumab (month 12: 3%; primary analysis period: 7%) and alendronate (month 12: 3%; primary analysis period 24: 7%) in ARCH. In terms of AEs of particular interest for the review, the incidence of hypersensitivity and ONJ were similar between romosozumab and placebo and alendronate. There was a potential signal of an association between cardiovascular AEs with romosozumab, when compared with alendronate in the ARCH study. The rates of cardiovascular serious AEs were similar between groups in FRAME at 12 and 24 months, but higher in patients in the romosozumab group (2.5%) than the alendronate group (1.9%) at month 12 and at month 24 (6.5% versus 6.1%, respectively). Myocardial infarction and stroke occurred at higher rates with romosozumab. The percentages were more similar at 24 months, but patients in both groups had been receiving alendronate alone for 12 months after romosozumab or placebo, and therefore the 24-month time point is likely not the optimal point to assess differences between groups. The potential increased risk of cardiovascular events has been noted by Health Canada in the product monograph and by FDA on the label for romosozumab, with both regulators adding warnings for the potential risk of myocardial infarction, stroke, and cardiovascular death.8,38 The clinical expert consulted by CADTH also indicated that romosozumab treatment would not be started in patients with a history of myocardial infarction or stroke, and that it would be discontinued in patients who experience a myocardial infarction or stroke.
The balance between longer-term benefits and risks with romosozumab is also unclear. Longer-term data from the FRAME Extension study suggested AEs occurred at similar rates across both treatment groups (88% in the romosozumab/denosumab group and 89% in the placebo/denosumab group). All AEs of special interest were infrequently reported (< 4%), except for AEs, potentially related to hypersensitivity. Cardiovascular-related AEs were generally reported at similar rates in each treatment group and were rare (< 1%). However, the design of the study (all patients had been receiving denosumab) makes these data difficult to interpret, leading to increased uncertainty about the longer-term safety of romosozumab treatment.
The sponsor-submitted ITC did not examine the comparative safety of romosozumab versus other medications for the treatment of osteoporosis. The only comparative data between romosozumab and other active treatments for osteoporosis available therefore come from the comparison with alendronate in the ARCH study. Given input from patients regarding the importance of treatment options with fewer adverse effects and better tolerability, there are limited data to determine whether romosozumab fills this need, particularly considering the observed higher frequency of cardiovascular events with romosozumab versus alendronate.
Conclusions
Two phase III double-blind RCTs — 1 placebo-controlled (FRAME) and 1 active-controlled (ARCH) — provided evidence supporting the efficacy and safety of romosozumab for the treatment of osteoporosis in postmenopausal women with a high risk of fracture. Compared to alendronate or placebo, patients who were treated with a romosozumab subcutaneous injection 210 mg once a month showed benefits in reducing the risk of new fracture and increasing BMD. Changes in the incidence of new vertebral fracture and clinical fracture at month 12 and month 24 were considered statistically and clinically relevant. Changes in BMD from baseline to month 12 and month 24 as reported in the ARCH study were also statistically and clinically meaningful. However, whether treatment with romosozumab is associated with any HRQoL benefit remains uncertain. The incidence of AEs, SAEs, and treatment discontinuation due to AEs were similar across treatment groups in both the FRAME and ARCH studies. The risk of cardiovascular-related AEs was comparable between romosozumab therapy and placebo, and between romosozumab therapy and alendronate therapy.
Little direct evidence is available on the relative efficacy and safety of romosozumab versus current treatments for the target population. One sponsor-submitted ITC provided indirect data on the relative clinical efficacy of romosozumab to other active treatments. The results suggest that romosozumab therapy may have a beneficial effect in reducing the risk of sustaining nonvertebral fractures compared to some current treatments. Results of this ITC are associated with a substantial risk of bias due to limitations such as extensive heterogeneity that have not been adequately accounted for.
The longer-term efficacy and safety of romosozumab were evaluated in the extension phase of the FRAME study, in which all study participants received denosumab. This extension study provided insight regarding the long-term effects (3 years) of initial treatment with romosozumab followed by treatment with an antiresorptive agent. Findings of this extension study suggest that the treatment effects from romosozumab in reducing the risk of fracture and increasing BMD were maintained. The frequency of AEs was similar between patients who originally received romosozumab or placebo. However, limitations of this extension study, such as the lack of a comparator group and a lack of patients from a high-risk population, contribute uncertainty to the results.
References
1.Rosen HN, Drezner MK. Clinical manifestations, diagnosis, and evaluation ofosteoporosis in postmenopausal women. In: Post TW, ed. UpToDate. Waltham (MA): UpToDate; 2020: www.uptodate.com. Accessed 2021 Mar 01.
2.Allen S, Forney-Gorman A, Homan M, Kearns A, Kramlinger A, Sauer M. Diagnosis and treatment of osteoporosis. (Health care guideline). Bloomington (MN): Institute for Clinical Systems Improvement; 2017: https://www.icsi.org/wp-content/uploads/2019/01/Osteo.pdf. Accessed 2021 Jul 14.
3.Simpson EL, Martyn-St James M, Hamilton J, et al. Clinical effectiveness of denosumab, raloxifene, romosozumab, and teriparatide for the prevention of osteoporotic fragility fractures: a systematic review and network meta-analysis. Bone. 2020;130:115081. PubMed
4.Osteoporosis: impact report 2017-2018. Toronto (ON): Osteoporosis Canada; 2018: https://osteoporosis.ca/wp-content/uploads/EN-Osteo-Impact-Report-F2017-2018.pdf. Accessed 2021 Jul 14.
5.Lewiecki EM. Bisphosphonates for the treatment of osteoporosis: insights for clinicians. Ther Adv Chronic Dis. 2010;1(3):115-128. PubMed
6.Modi A, Fan CS, Tang J, Weaver JP, Sajjan S. Association of gastrointestinal events with osteoporosis treatment initiation and treatment compliance in Germany: an observational study. Bone Rep. 2016;5:208-213. PubMed
7.Siris ES, Fan CS, Yang X, Sajjan S, Sen SS, Modi A. Association between gastrointestinal events and compliance with osteoporosis therapy. Bone Rep. 2016;4:5-10. PubMed
8.Evenity (romosozumab): 105 mg/1.17 mL solution for subcutaneous injection with single-use prefilled syringe [product monograph]. Mississauga (ON): Amgen Canada Inc.; 2019 Jun 17.
9.Clinical Study Report: 20070337. A multicenter, international, randomized, double-blind, placebo-controlled, parallel-group study to assess the efficacy and safety of romosozumab treatment in postmenopausal women with osteoporosis [internal sponsor's report]. Thousand Oaks (CA): Amgen Inc.; 2016 Jun 03.
10.Clinical Study Report: 20110142. A multicenter, international, randomized, double-blind, alendronate-controlled study to determine the efficacy and safety of romosozumab in the treatment of postmenopausal women with osteoporosis [internal sponsor's report]. Thousand Oaks (CA): Amgen Inc.; 2017 Jul 26.
11.Barrionuevo P, Kapoor E, Asi N, et al. Efficacy of pharmacological therapies for the prevention of fractures in postmenopausal women: a network meta-analysis. J Clin Endocrinol Metab. 2019;104(5):1623-1630. PubMed
12.Supplemental Clinical Study Report: 20070337. A multicenter, international, randomized, double-blind, placebo-controlled, parallel-group Study to assess the efficacy and safety of romosozumab treatment in postmenopausal women with osteoporosis: 36-month final analysis [internal sponsor's report]. Thousand Oaks (CA): Amgen Inc.; 2017 May 29.
13.Braithwaite RS, Col NF, Wong JB. Estimating hip fracture morbidity, mortality and costs. J Am Geriatr Soc. 2003;51(3):364-370. PubMed
14.Osteoporosis Canada. Osteoporosis facts and statistics. 2021; https://osteoporosis.ca/fast-facts/. Accessed 2021 Aug 13.
15.Wells GA, Cranney A, Peterson J, et al. Alendronate for the primary and secondary prevention of osteoporotic fractures in postmenopausal women. Cochrane Database Syst Rev. 2008;1:CD001155. PubMed
16.Compston JE, Drake MT. Defining very high fracture risk: is FRAX fit for purpose? J Bone Miner Res. 2020;35(8):1399-1403. PubMed
17.van Geel TA, van Helden S, Geusens PP, Winkens B, Dinant GJ. Clinical subsequent fractures cluster in time after first fractures. Ann Rheum Dis. 2009;68(1):99-102. PubMed
18.Tarride JE, Hopkins RB, Leslie WD, et al. The burden of illness of osteoporosis in Canada. Osteoporos Int. 2012;23(11):2591-2600. PubMed
19.Siminoski K, Leslie WD, Frame H, et al. Recommendations for bone mineral density reporting in Canada. Can Assoc Radiol J. 2005;56(3):178-188. PubMed
20.Centre for Metabolic Bone Diseases UoS, UK. FRAX: Fracture Risk Assessment Tool. 2008; https://www.sheffield.ac.uk/FRAX/. Accessed 2021 Jul 21.
21.Fujiwara S, Nakamura T, Orimo H, et al. Development and application of a Japanese model of the WHO fracture risk assessment tool (FRAX). Osteoporos Int. 2008;19(4):429-435. PubMed
22.Papaioannou A, Morin S, Cheung AM, et al. 2010 clinical practice guidelines for the diagnosis and management of osteoporosis in Canada: summary. CMAJ. 2010;182(17):1864-1873. PubMed
23.Rosen HN, Drezner MK. Overview of the management of osteoporosis in postmenopausal women. In: Post TW, ed. UpToDate. Waltham (MA): UpToDate; 2020: www.uptodate.com. Accessed 2021 Mar 01.
24.Camacho PM, Petak SM, Binkley N, et al. American Association of Clinical Endocrinologists and American College of Endocrinology clinical practice guidelines for the diagnosis and treatment of postmenopausal osteoporosis - 2016--executive summary. Endocr Pract. 2016;22(9):1111-1118. PubMed
25.Tabacco G, Bilezikian JP. Osteoanabolic and dual action drugs. Br J Clin Pharmacol. 2019;85(6):1084-1094. PubMed
26.Cadarette SM, Carney G, Baek D, Gunraj N, Paterson JM, Dormuth CR. Osteoporosis medication prescribing in British Columbia and Ontario: impact of public drug coverage. Osteoporos Int. 2012;23(4):1475-1480. PubMed
27.Wysowski DK, Greene P. Trends in osteoporosis treatment with oral and intravenous bisphosphonates in the United States, 2002-2012. Bone. 2013;57(2):423-428. PubMed
28.Brown JP, Morin S, Leslie W, et al. Bisphosphonates for treatment of osteoporosis: expected benefits, potential harms, and drug holidays. Can Fam Physician. 2014;60(4):324-333. PubMed
29.Barrionuevo P, Gionfriddo MR, Castaneda-Guarderas A, et al. Women's values and preferences regarding osteoporosis treatments: a systematic review. J Clin Endocrinol Metab. 2019;104(5):1631-1636. PubMed
30.Fosamax (alendronate sodium): 70 mg oral tablets [product monograph]. Kirkland (QC): Merck Canada Inc.; 2017 May 26: https://www.merck.ca/static/pdf/FOSAMAX-PM_E.pdf?bcs-agent-scanner=e73f1b8a-f1fc-114d-ae9b-ad952724ebf1. Accessed 2021 Jul 12.
31.Prolia (denosumab injection): 60 mg/mL solution for injection in a prefilled syringe [product monograph]. Mississauga (ON): Amgen Canada Inc.; 2020 Dec 09: https://www.amgen.ca/~/media/1e79aee7d94340df88c3d97f5bb897c3.ashx?bcs-agent-scanner=84821fa9-e09a-2747-af02-c9fd21351f20. Accessed 2021 Sep 01.
32.McGowan J, Sampson M, Salzwedel DM, Cogo E, Foerster V, Lefebvre C. PRESS Peer Review of Electronic Search Strategies: 2015 guideline statement. J Clin Epidemiol. 2016;75:40-46. PubMed
33.Grey matters: a practical tool for searching health-related grey literature. Ottawa (ON): CADTH; 2019: https://www.cadth.ca/grey-matters. Accessed 2021 Feb 26.
34.Cosman F, Crittenden DB, Adachi JD, et al. Romosozumab treatment in postmenopausal women with osteoporosis. N Engl J Med. 2016;375(16):1532-1543. PubMed
35.Saag KG, Petersen J, Brandi ML, et al. Romosozumab or alendronate for fracture prevention in women with osteoporosis. N Engl J Med. 2017;377(15):1417-1427. PubMed
36.Drug Reimbursement Review sponsor submission: Evenity (romosozumab), 105 mg/1.17 mL solution for subcutaneous injection with single-use prefilled syringe [internal sponsor's package]. Mississauga (ON): Amgen Canada Inc.; 2021 Feb 25.
37.Health Canada reviewer's report: Evenity (romosozumab) [internal sponsor's report]. Ottawa (ON): Therapeutics Products Directorate, Health Canada; 2019.
38.Center for Drug Evaluation Research. Multidiscipline review(s). Evenity (romosozumab) subcutaneous injection with single-use prefilled syringe. Company: Amgen Inc. Application No.: 761062. Approval date: 04/09/2019 (FDA approval package). Silver Spring (MD): U.S. Food and Drug Administration (FDA); 2019: https://www.accessdata.fda.gov/drugsatfda_docs/nda/2019/761062Orig1s000TOC.cfm. Accessed 2021 Jul 29.
39.Committee for Medicinal Products for Human Use. Guideline on the evaluation of medicinal products in the treatment of primary osteoporosis. (European public assessment report). London (GB): European Medicines Agency; 2006: https://www.ema.europa.eu/en/documents/scientific-guideline/guideline-evaluation-medicinal-products-treatment-primary-osteoporosis_en.pdf. Accessed 2021 Jul 29.
40.Osteoporosis: nonclinical evaluation of drugs intended for treatment: draft guidance for industry Silver Spring (MD): U.S. Food and Drug Administration (FDA); 2016: https://www.fda.gov/files/drugs/published/Osteoporosis---Nonclinical-Evaluation-of-Drugs-Intended-for-Treatment-Guidance-for-Industry.pdf. Accessed 2021 Jul 29.
41.DerSimonian R, Laird N. Meta-analysis in clinical trials. Control Clin Trials. 1986;7(3):177-188. PubMed
42.Higgins JP, Jackson D, Barrett JK, Lu G, Ades AE, White IR. Consistency and inconsistency in network meta-analysis: concepts and models for multi-arm studies. Res Synth Methods. 2012;3(2):98-110. PubMed
43.White IR, Barrett JK, Jackson D, Higgins JP. Consistency and inconsistency in network meta-analysis: model estimation using multivariate meta-regression. Res Synth Methods. 2012;3(2):111-125. PubMed
44.Moreno PB, Kapoor E, Asi N, et al. Data from: Barrionuevo P, Kapoor E, Asi N, et al. Efficacy of pharmacological therapies for the prevention of fractures in postmenopausal women: a network meta-analysis. J Clin Endocrinol Metab. 2019;104(5):1623-1630. Figshare. 2019 Jan 25. 10.6084/m9.figshare.7629344. Accessed 2021 Jul 16.
45.Black DM, Cauley JA, Wagman R, et al. The ability of a single BMD and fracture history assessment to predict fracture over 25 years in postmenopausal women: the study of osteoporotic fractures. J Bone Miner Res. 2018;33(3):389-395. PubMed
46.Black DM, Bauer DC, Vittinghoff E, et al. Treatment-related changes in bone mineral density as a surrogate biomarker for fracture risk reduction: meta-regression analyses of individual patient data from multiple randomised controlled trials. Lancet Diabetes Endocrinol. 2020;8(8):672-682. PubMed
47.Lee JH, Lee YH, Moon SH, Group TOPS. Association between bone mineral density and clinical consequences: cross-sectional study of Korean postmenopausal women in an orthopaedic outpatient clinic. J Korean Med Sci. 2014;29(8):1152-1160. PubMed
48.Alay I, Kaya C, Cengiz H, Yildiz S, Ekin M, Yasar L. The relation of body mass index, menopausal symptoms, and lipid profile with bone mineral density in postmenopausal women. Taiwan J Obstet Gynecol. 2020;59(1):61-66. PubMed
49.Ilic Stojanovic O, Vuceljic M, Lazovic M, et al. Bone mineral density at different sites and vertebral fractures in Serbian postmenopausal women. Climacteric. 2017;20(1):37-43. PubMed
50.Wu Q, Xiao X, Xu Y. Evaluating the performance of the WHO International Reference Standard for osteoporosis diagnosis in postmenopausal women of varied polygenic score and race. J Clin Med. 2020;9(2):499. PubMed
51.Silverman SL. The Osteoporosis Assessment Questionnaire (OPAQ): a reliable and valid disease-targeted measure of health-related quality of life (HRQOL) in osteoporosis. Qual Life Res. 2000;9(1):767-774.
52.Zhang YP, Wei HH, Wang W, et al. Cross-cultural adaptation and validation of the osteoporosis assessment questionnaire short version (OPAQ-SV) for Chinese osteoporotic fracture females. Clin Rheumatol. 2016;35(4):1003-1010. PubMed
53.Axelsson B, Sjödén PO. Assessment of quality of life in palliative care--psychometric properties of a short questionnaire. Acta Oncol. 1999;38(2):229-237. PubMed
54.Qu XL, Zheng B, Chen TY, Cao ZR, Qu B, Jiang T. Bone turnover markers and bone mineral density to predict osteoporotic fractures in older women: a retrospective comparative study. Orthop Surg. 2020;12(1):116-123. PubMed
55.Acar B, Ozay AC, Ozay OE, Okyay E, Sisman AR, Ozaksoy D. Evaluation of thyroid function status among postmenopausal women with and without osteoporosis. Int J Gynaecol Obstet. 2016;134(1):53-57. PubMed
56.Shetty S, Kapoor N, Bondu JD, Thomas N, Paul TV. Bone turnover markers: emerging tool in the management of osteoporosis. Indian J Endocrinol Metab. 2016;20(6):846-852. PubMed
57.Vasikaran S, Eastell R, Bruyère O, et al. Markers of bone turnover for the prediction of fracture risk and monitoring of osteoporosis treatment: a need for international reference standards. Osteoporos Int. 2011;22(2):391-420. PubMed
Appendix 1: Literature Search Strategy
Note that this appendix has not been copy-edited.
Clinical Literature Search
Overview
Interface: Ovid
Databases:
MEDLINE All (1946–)
Embase (1974–)
Note: Subject headings and search fields have been customized for each database. Duplicates between databases were removed in Ovid.
Date of search: March 10, 2021
Alerts: Bi-weekly search updates until project completion
Search filters applied: No filters were applied to limit the retrieval by study type.
Limits:
Publication date limit: no limit
Language limit: no limit
Conference abstracts: excluded
Syntax | Description |
|---|---|
/ | At the end of a phrase, searches the phrase as a subject heading |
MeSH | Medical Subject Heading |
exp | Explode a subject heading |
* | Before a word, indicates that the marked subject heading is a primary topic; or, after a word, a truncation symbol (wildcard) to retrieve plurals or varying endings |
.ti | Title |
.ot | Original title |
.ab | Abstract |
.hw | Heading word; usually includes subject headings and controlled vocabulary |
.kf | Author keyword heading word (MEDLINE) |
.kw | Author keyword (Embase) |
.dq | Candidate term word (Embase) |
.pt | Publication type |
.rn | Registry number |
.nm | Name of substance word (MEDLINE) |
medall | Ovid database code: MEDLINE All, 1946 to present, updated daily |
oemezd | Ovid database code; Embase, 1974 to present, updated daily |
Multi-Database Strategy
(evenity* or romosozumab* or AMG 785 or AMG785 or CDP 7851 or CDP7851 or 3VHF2ZD92J).ti,ab,kf,ot,hw,rn,nm.
1 use medall
*romosozumab/
(evenity* or romosozumab* or AMG 785 or AMG785 or CDP 7851 or CDP7851).ti,ab,kw,dq.
or/3-4
5 use oemezd
6 not conference abstract.pt.
2 or 7
remove duplicates from 8
Clinical Trials Registries
ClinicalTrials.gov
Produced by the US National Library of Medicine. Targeted search used to capture registered clinical trials.
[Search -- Studies with results | evenity OR romosozumab OR sclerostin ab OR AMG 785 OR AMG785 OR CDP 7851 OR CDP7851]
WHO ICTRP
International Clinical Trials Registry Platform, produced by the World Health Organization. Targeted search used to capture registered clinical trials.
[Search terms -- evenity OR romosozumab OR sclerostin ab OR AMG 785 OR AMG785 OR CDP 7851 OR CDP7851]
Health Canada’s Clinical Trials Database
Produced by Health Canada. Targeted search used to capture registered clinical trials.
[Search terms -- evenity OR romosozumab OR sclerostin ab OR AMG 785 OR AMG785 OR CDP 7851 OR CDP7851]
EU Clinical Trials Register
European Union Clinical Trials Register, produced by the European Union. Targeted search used to capture registered clinical trials.
[Search terms -- evenity OR romosozumab OR sclerostin ab OR AMG 785 OR AMG785 OR CDP 7851 OR CDP7851]
Grey Literature
Search dates: February 26, 2021 – March 10, 2021
Keywords: Evenity OR romosozumab OR AMG 785 OR AMG785 OR CDP 7851 OR CDP7851 OR osteoporosis
Limits: Publication years: no date limits
Updated: Search updated prior to the meeting of the CADTH Canadian Drug Expert Committee (CDEC)
Relevant websites from the following sections of the CADTH grey literature checklist Grey Matters: A Practical Tool for Searching Health-Related Grey Literature were searched:
Health Technology Assessment Agencies
Health Economics
Clinical Practice Guidelines
Drug and Device Regulatory Approvals
Advisories and Warnings
Drug Class Reviews
Clinical Trials Registries
Databases (free)
Internet Search
Appendix 2: Description and Appraisal of Outcome Measures
Note that this appendix has not been copy-edited.
Aim
To describe the following outcome measures and review their measurement properties (validity, reliability, responsiveness to change, and MID):
BMD
BTM (e.g., P1NP, BSAP, OC, sCTX)
HRQoL related outcomes:
OPAQ-SV osteoporosis assessment questionnaire short version
EQ-5D-5L
Findings
Table 34: Summary of outcome measures and their measurement properties
Outcome measure | Type | Conclusions about measurement properties | MID |
|---|---|---|---|
BMD | Physician measure of bone density typically based on DXA scanning. | BMD has been demonstrated to be associated with bone fracture risk.45,47-49 Low BMD has been associated with short- and long-term fracture risk among patients.45,47 However, one study suggested that there may be differences in BMD classification of osteoporosis and across race which may impact fracture risk for patients of difference races or ethnicities.50 | N/A |
OPAQ-SV | The questionnaire for assessment of HRQoL of patients with osteoporosis. The OPAQ-SV contains 34 items categorized into 3 dimensions, including “physical function,” “emotional status,” and “symptoms.” Higher OPAQ-SV scores are indicative of better health status. | Validity and reliability were assessed in a Chinese population.52 High reliability and validity of the tool were demonstrated among this population. | A MID specific to patients with osteoporosis was not identified. |
OPAQ-SV (continued) | Each domain in the questionnaire produces scores between 0 and 10, with 0 representing the worst possible health status and 10 representing the best possible health status. Domain scores within the questionnaire are summed and then present a score between 0 and 100, with 0 representing the worst possible health status and 100 representing the best possible health status.51,52 | ||
EQ-5D-5L | The EQ-5D is a standardized tool for measurement of health outcomes and has been used across many diseases and conditions.53 The EQ-5D-5L consists of a descriptive system and the EQ visual analogue scale (VAS). The descriptive system comprises 5 dimensions: mobility, self-care, usual activities, pain/discomfort, and anxiety/depression. | Data pertaining to the reliability and validity of the tool were not identified. However, one study assessed EQ-5D to BMD T-scores. There was an observed positive correlation between the VAS and the EQ-5D index score based on patients’ BMD. | A MID specific to patients with osteoporosis was not identified. |
BTM (P1NP, BSAP, OC, sCTX) | Physical measurement of BTMs, which are associated with bone remodelling and may be used to complement measurements of BMD in a patient’s assessment of osteoporosis. BTMs are related to the metabolism of bone and can be used as indicators for bone resorption and formation.54 | Increasing BTM has been associated with lower BMD.54 However, BTM levels are prone to change based on patient characteristics and may not necessarily be used as a single tool when assessing patients. | N/A |
BMD = bone mineral density; BSAP = bone-specific alkaline phosphatase; BTM = bone turnover marker; DXA = dual-energy X-ray absorptiometry; OC = osteocalcin; MID = minimal important difference; N/A = not applicable; OPAQ-SV = Osteoporosis Assessment Questionnaire Short Version; P1NP = procollagen type 1 N-telopeptide; sCTX = serum type 1 collagen C-telopeptide.
Bone Mineral Density
Low BMD has been associated with osteoporosis among both men and women. Several factors or health states have been linked to low BMD, including aging, sex, low calcium from diet, vitamin D deficiency, low BMI, reduced activity, or low thyroid function.48,55 Women going through menopause are at greater risk for osteoporosis due to changes in hormone levels which result in metabolic changes. Postmenopausal women are at greater risk for low bone mass and reduced bone strength. The association between BMD and fracture has been shown across many populations across the globe.45,47-49
One study by Black et al.45 used data from a large multicenter prospective cohort study in the US (the Study of Osteoporotic Fractures) which assessed BMD via DXA scans and risk factors in 7,959 women 67 years of age or older (mean 73.4 years) between the years of 1988 to 1990. The women were followed up for hip fractures for 25 years, and 20 years for any nonvertebral fracture. After 25 years, 15.9% of women experienced one or more hip fractures. After 20 years, 43.7% of women experienced one or more nonvertebral fracture. At the end of the follow-up period, the incidence of hip and nonvertebral fractures were both related to age. Specifically, the 25-year incidence of hip fracture among women aged over 80 years at baseline was 22.6% versus 13.9% among women aged under 70 years, after accounting for competing risk of mortality. Similarly, the 20-year incidence of nonvertebral fracture among women aged over 80 years was 50.0% versus 42.6% among women aged under 70 years.45 The authors Black et al.45 found that femoral neck BMD was strongly predictive of long-term incidence of hip and nonvertebral fractures even after adjustment for age and accounting or the competing risk of mortality. Long-term incidence of hip fracture ranged from 29.6% to 7.6% at the lowest and highest BMD quartiles, respectively. Long-term incidence of nonvertebral fracture ranged from 59.7% to 32.9% in the lowest and highest BMD quartiles, respectively. Overall, Black et al. found that BMD was a long-term risk factor for hip and nonvertebral fracture. Femoral neck BMD was found to have a predictive value of 2.6 over the first 5 years of follow-up for hip fracture; the predictive value of femoral neck BMD remained statistically significant for hip fracture occurring at 20 to 25 years after the initial BMD assessment (relative hazard = 1.8; 95% CI, 1.4 to 2.4). Femoral neck BMD was found to have a constant predictive value of nonvertebral fracture over the entire 20 year follow-up without any evidence of attenuation. Finally, Black et al.45 were also able to show that baseline femoral neck BMD and age were both correlated with hip fracture risk; BMD remained a predictor of fracture within each age group. Of note, this study by Black et al.45 excluded women who were African-American as they were noted to have a lower rate of hip fracture.
Lee et al.47 conducted a cross-sectional and observational nation-wide study to evaluate BMD in Korean postmenopausal and to analyze the prevalence of osteoporosis and osteopenia. Women were classified into groups based on baseline BMD T-scores as normal (−1 ≤ T-score), osteopenia (−2.5 < T-score < −1), and osteoporotic (T-score ≤ −2.5). Based on lumbar spine BMD, 25.9%, 37.0%, and 37.2% of the sample were classified based on BMD T-score categories, respectively, 31.4%, 45.3%, and 23.3% of women were distributed into the BMD T-score categories based on their femoral neck measurements, and 40.7%, 42.5%, and 16.9% were classified based on their total hip measurements, respectively. BMD measurements tended to decrease with increasing age. BMI was found to have a positive correlation with the L-spine BMD (r=0.303, P <0.001), and weak correlations with the femur neck (r=0.172, P<0.001), and the total hip BMD (r=0.229, P<0.001).47 Lee et al.,47 found that the incidence of vertebral compression fractures increased as BMD T-score increased. Mean BMD scores in the L-spine, femur neck, and total hip were also found to be statistically significantly lower in women with osteoporotic vertebral fracture compared to women without fracture (P <0.001); this finding was maintained regardless of whether women in the sample reported back pain or pain in general. Among patients with vertebral fracture, L-spine and total hip BMD values were significantly lower among patients with pain than in patients without pain (P<0.01). BMD values in the L-spine, femur and total hip were also significantly lower among patients with vertebral fracture without pain, than in patients who did not have vertebral fracture (P <0.01).47 No statistically significant difference was observed between the L-spine BMD and patients with hip fractures or wrist fractures; although the BMD scores were found to be lower among patients with fracture than without fracture. However, femur neck BMD scores and total hip BMD was statistically significantly lower in patients with hip fracture or wrist fracture than in patients without a hip fracture or wrist fracture (P = 0.037 and P < 0.001 for hip fracture and P = 0.009 and P < 0.001 for wrist fracture).47
One study by Wu et al.50 examined the BMD T-scores and its prediction of major osteoporotic fractures in groups with different genetic profiling and of different races. The international reference standard for osteoporosis diagnosis states that the femur beck BMD lies at least 2.5 standard deviations below (T-score ≤ −2.5). However, this cut-off has limitations which include other risk factors that affect fracture risk independent of BMD (e.g., age, sex, previous fracture) and the fact that the threshold may have low sensitivity as many fractures occur with a femur neck BMD T-score > −2.5. Data were obtained from 2,417 women included in the Women’s Health Initiative study, a nation-wide longitudinal study examining the health of postmenopausal women between 50 and 79 years of age without severe medical conditions at baseline. Analyses on women were conducted with 19 years of follow-up. Wu et al.50 found that T-score estimated incidence of fracture was underestimated in all racial groups, except for Indigenous American; results were statistically significantly underestimated for African-American and White women. The predicted and observed incidence of major osteoporotic fracture as 1.42% and 2.73%, respectively for African-American women (prevalence odds ratio [POR] = 0.52; 95% CI, 0.30 to 0.83), and 11.5% and 18.38% for White women (POR = 0.63, 95% CI, 0.50 to 0.78). There was also a significant difference in the underestimation of fracture among African-American (POR= 0.19; 95% CI, 0.11 to 0.31), Hispanic (POR= 0.48; 95% CI, 0.33 to 0.67) and White women (POR= 0.47; 95% CI, 0.37 to 0.59). Results from Wu et al.50 also demonstrated that it is possible that race is a significant predictor of major osteoporotic fracture, as African-American, Hispanic and Indigenous American women had a 59% (HR = 0.43; 95% CI, 0.32 to 0.88), 41% (HR = 0.59; 95% CI, 0.35 to 0.99), and 56% (HR = 0.44; 95% CI, 0.36 to 0.54) lower hazard of major osteoporotic fracture compared to White women, respectively, after adjustment of baseline BMD T-score. The results of this analysis suggest that ethnic or racial considerations may be required when diagnosing osteoporosis to provide more accurate assessments of fracture risk.
EQ-5D-5L
The EQ-5D is a standardized tool for measurement of health outcomes and has been used across many diseases and conditions.53 The EQ-5D-5L consists of a descriptive system and the EQ-5D Visual Analogue Scale (VAS). The descriptive system comprises 5 dimensions: mobility, self-care, usual activities, pain/discomfort, and anxiety/depression. Each dimension within the questionnaire allows patients to answer using 5 levels: 1 = “no problems,” 2 = “slight problems,” 3 = “moderate problems,” 4 = “severe problems,” and 5 = “extreme problems” or “unable to perform,” which is the worst response in the dimension. Lee et al.47 assessed the correlation between BMD and each item (mobility, self-care, usual activities, pain/discomfort, anxiety/depression) of the EQ-5D among Korean women. The study is briefly described above under the BMD subsection. VAS scores of the EQ-5D were found to be higher for patients categorized with normal BMD T-score values than patients with osteopenia or osteoporotic BMD T-scores. The authors reported a strong positive correlation between the VAS and the EQ-5D index score based on patients’ BMD.47
Women with normal BMD T-scores had significantly higher femur neck and total hip BMD values in the mobility item of the EQ-5D, compared to osteopenia and osteoporotic women (p=0.0037 ad 0.011, respectively). Total hip BMD was significantly higher for women with normal BMD T-scores than osteopenia and osteoporotic women for the ‘usual activities’ (p=0.028) and ‘pain/discomfort’ (p=0.018) items. Femur neck BMD was significantly higher among women with normal BMD T-scores than women than osteopenia or osteoporotic women (P=0.020). BMD levels in the L-spine, femur and total hip were not found to have correlations with the VAS.47
The CADTH literature search did not identify any information pertaining to MIDs for the EQ-5D-5L which could be applied to patients with osteoporosis.
OPAQ-SV
The OPAQ-SV was adapted from the Osteoporosis Assessment Questionnaire (OPAQ), which was a valid and reliable tool to assess the HRQoL of patients with osteoporosis.51 The OPAQ was developed in 1993 and included 14-18 domains which were grouped into 4 dimensions, including “physical function,” “emotional status,” “symptoms,” and “social interaction.” The OPAQ was available in 2 long versions which included either 73 questions (version 1.0) or 60 questions (2.0).51 The OPAQ-SV has 34 items categorized into 3 dimensions, including “physical function,” “emotional status,” and “symptoms.” Higher OPAQ-SV scores are indicative of better health status. Each item on the questionnaire consists of 5 options: “all days,” “most days,” “some days,” “few days,” “no days,” or “always,” “very often,” “sometimes,” “almost never,” “never.” Each domain in the questionnaire produces scores between 0 and 10, with 0 representing the worst possible health status and 10 representing the best possible health status. Domain scores within the questionnaire are summed and then present a score between 0 and 100, with 0 representing the worst possible health status and 100 representing the best possible health status.51,52
While the reliability and validity of the OPAQ have previously been shown, the CADTH literature search did not identify articles which demonstrated the reliability and validity of the OPAQ-SV. However, the short version of this questionnaire is likely to be more convenient for use in clinical trials as there are fewer items within the questionnaire for patients to complete. One article was identified in the CADTH literature search which demonstrated reliability and validity of the Chinese version of the OPAQ-SV for use among Chinese patients; a cross-sectional study was conducted with 234 postmenopausal osteoporotic fracture patients recruited from orthopedic units in 5 tertiary hospitals in China.52 Item analysis of the OPAQ-SV indicated a statistically significant difference between items which scored the highest and items which scored the lowest (p<0.001). Item analysis was also conducted in the 3 dimensions of the questionnaire, and the total scores; the results of the item analysis revealed that there was good discrimination without indication of floor or ceiling effects.
Reliability for each domain of the questionnaire was assessed by calculating the Cronbach alpha coefficient. The physical function, emotional status and symptom dimensions showed a Cronbach alpha of 0.975, 0.861, and 0.823, respectively. The entire Chinese OPAQ-SV showed a Cronbach alpha of 0.970. Split-half coefficient reliability high at 0.868 between 0.697 and 0.956 for the 3 dimensions. Test-retest reliability showed robust results for the 3 dimensions of the questionnaire. item mean scores were 48.51 for the physical function dimension, 50.58 for emotional status, and 41.25 for symptoms; after 2 weeks the mean scores were 48.38, 48.38, and 40.0, respectively. Pearson rank-order correlations were 0.995 for physical function, 0.984 for emotional status, and 0.992 for symptoms.52 Discriminant validity was checked by comparing scores from women with and without fractures. Significant differences were observed between women with and without fractures in all 3 dimensions of the questionnaire, even after adjustment for age (p<0.001).52
The correlation between item scores and corresponding dimensions, and the dimensions with the total questionnaire were assessed in order to determine construct validity. Moderate to strong correlations were observed with correlation coefficients between 0.575 and 0.974 (p<0.01). Exploratory factor analysis revealed that a 6-factor solution which explained 75.847% of the total variance. Factor loadings from the exploratory analysis of the 34 questionnaire items produced values ranging from 0543 to 0.892 with item communalities from 0.512 to 0.890. The 3 dimensions of the OPAQ-SV were compared to the 4 dimensions (physical functioning, role-physical, mental health and bodily pain) of the 12-Item Short Form Survey (SF-12). The Spearman’s r correlations revealed high correlation of the OPAQ-SV to the SF-12 across all domains; Spearman’s r correlations between the dimensions of the SF-12 and corresponding dimensions of the OPAQ-SV were 0.778 for physical functioning, 0.770 for role-physical, 0.515 for mental health and 0.621 for bodily pain.52
The CADTH literature search did not identify any information pertaining to MIDs for the OPAQ-SV which could be applied to patients with osteoporosis.
Bone Turnover Markers
BTMs are associated with bone remodelling and may be used as part of a patient’s assessment of osteoporosis. Increases in bone turnover have been observed with aging and diseases such as osteoporosis, contributing to increased risk of fracture. Molecular markers, such as BTMs, related to bone metabolism can be used as a tool in the detection of bone formation and bone resorption.56 The use of BTMs may be used to complement measurements of BMD in the management of osteoporosis, especially among patients who have been or are currently taking therapies which are antiresorptive or result in bone formation. The International Osteoporosis Foundation and International Federation of Clinical Chemistry and Laboratory Medicine have proposed that serum CTX-1 (sCTX) be used as a reference marker for bone resorption, and serum P1NP be used as reference markers of bone formation.56,57 BTMs included in the Clinical Evidence section of this CADTH report were P1NP, BSAP, OC, sCTX.
One retrospective study by Qu et al.54 assessed how BMD and BTM in older women with osteoporosis may predict risk of osteoporotic fracture.54 Data from 203 patients diagnosed with osteoporosis and hospitalized in a hospital in China between October 2017 and February 2019 were examined. BTMs assessed included P1NP, beta C-telopeptide of type I collagen (beta-CTX), and molecular fragment of osteocalcin N-terminal (N-MID). Bone metabolism-related indicators were also assessed, including calcium, phosphorus, and alkaline phosphatase (ALP). Patients were separated into the following groups: Group A (60-70 years of age), Group B (71-90 years of age), Group C (81-90 years of age). Comparisons of BMD and BTMs (PINP, β-CTX, N-MID, ALP, Ca, and P) were made between patients who had a fracture and those did not have a fracture. In general, there were differences in BTMs observed among patients in the fracture and non-fracture groups, and among different age groups.54
Qu et al.54 conducted binary logistic regression to analyze BMD and BTM for prediction of osteoporotic fracture risk. Beta-CTX was significantly correlated with the occurrence of osteoporotic fracture (OR=7.572, 95% CI, 1.441 to 3.059). Qu et al.54 showed that higher levels of beta-CTX and lower BMD had greater odds of resulting osteoporotic fracture. A positive correlation was observed between P1NP with occurrence of osteoporotic fracture (OR = 4.213, 95% CI, 0.978 to 1.005); this result was not statistically significant. However, the results of the study by Qu et al.54 should be interpreted with caution as they may not be powered for comparisons. In addition, BTMs may be subject to fluctuation based on diet and circadian rhythms which may introduce uncertainty and variability in the results and interpretation of data. The study by Qu et al.54 reported analyses for some BTMs; it is unclear whether results may be generalized to other BTMs, such as BSAP or OC.
Appendix 3: Subgroup Analyses in the Pivotal Studies
Note that this appendix has not been copy-edited.
Table 35: Primary Fracture Outcomes — FRAME, Subgroup Analysis by Baseline Characteristics, Primary Efficacy Analysis Set for Vertebral Fractures, LOCF Imputation
Subgroups | Romo/Deno N = 3,589 | Placebo/Deno N = 3,591 |
|---|---|---|
Incidence rates of new vertebral fracture through Month 12 | ||
Baseline lumbar spine BMD T-Scores | ||
≤ -3 Incidence, n/N1 (%) Absolute risk reduction, %, point estimate (95% CI) Risk ratio, point estimate (95% CI) Odds ratio, point estimate (95% CI) P value | 12/1402 (0.9) 1.77 (0.79 to 2.74) 0.33 (0.17 to 0.62) 0.32 (0.17 to 0.62) < 0.001 | 35/1337 (2.6) |
> -3 and ≤ -2.5 Incidence, n/N1 (%) Absolute risk reduction, %, point estimate (95% CI) Risk ratio, point estimate (95% CI) Odds ratio, point estimate (95% CI) P value | 0/639 (0) 1.72 (0.69 to 2.74) NE (NE) NE (NE) NE | 11/619 (1.8) |
> -2.5 Incidence, n/N1 (%) Absolute risk reduction, %, point estimate (95% CI) Risk ratio, point estimate (95% CI) Odds ratio, point estimate (95% CI) P value | 3/1205 (0.2) 0.47 (0.07 to 1.01) 0.34 (0.09 to 1.27) 0.34 (0.09 to 1.27) = 0.092 | 9/1272 (0.7) |
Baseline total hip and femoral neck BMD T-scores | ||
≤ -3 Incidence, n/N1 (%) Absolute risk reduction, %, point estimate (95% CI) Risk ratio, point estimate (95% CI) Odds ratio, point estimate (95% CI) P value | 4/856 (0.5) 1.54 (0.47 to 2.60) 0.25 (0.08 to 0.71) 0.22 (0.07 to 0.66) = 0.003 | 18/827 (2.2) |
> -3 Incidence, n/N1 (%) Absolute risk reduction, %, point estimate (95% CI) Risk ratio, point estimate (95% CI) Odds ratio, point estimate (95% CI) P value | 12/2465 (0.5) 1.16 (0.59 to 1.73) 0.29 (0.15 to 0.56) 0.29 (0.15 to 0.56) < 0.001 | 41/2494 (1.6) |
FRAX score for 10-year risk of major osteoporotic fracture | ||
≤ 8.21 Incidence, n/N1 (%) Absolute risk reduction, %, point estimate (95% CI) Risk ratio, point estimate (95% CI) Odds ratio, point estimate (95% CI) P value | 3/1120 (0.3) 0.95 (0.24 to 1.65) 0.20 (0.05 to 0.76) 0.22 (0.06 to 0.79) = 0.011 | 13/1096 (1.2) |
> 8.21 and ≤ 14.27 Incidence, n/N1 (%) Absolute risk reduction, %, point estimate (95% CI) Risk ratio, point estimate (95% CI) Odds ratio, point estimate (95% CI) P value | 2/1087 (0.2) 1.74 (0.91 to 2.58) 0.09 (0.02 to 0.40) 0.09 (0.02 to 0.40) < 0.001 | 22/1143 (1.9) |
> 14.27 Incidence, n/N1 (%) Absolute risk reduction, %, point estimate (95% CI) Risk ratio, point estimate (95% CI) Odds ratio, point estimate (95% CI) P value | 11/1106 (1.0) 1.19 (0.14 to 2.24) 0.46 (0.22 to 0.93) 0.44 (0.21 to 0.90) = 0.022 | 24/1079 (2.2) |
Historical fragility fracture | ||
Yes Incidence, n/N1 (%) Absolute risk reduction, %, point estimate (95% CI) Risk ratio, point estimate (95% CI) Odds ratio, point estimate (95% CI) P value | 8/821 (1.0) 1.57 (0.28 to 2.85) 0.38 (0.17 to 0.86) 0.37 (0.16 to 0.85) = 0.015 | 20/786 (2.5) |
No Incidence, n/N1 (%) Absolute risk reduction, %, point estimate (95% CI) Risk ratio, point estimate (95% CI) Odds ratio, point estimate (95% CI) P value | 8/2500 (0.3) 1.21 (0.68 to 1.74) 0.21 (0.10 to 0.45) 0.21 (0.10 to 0.45) < 0.001 | 39/2536 (1.5) |
Incidence rates of new vertebral fracture through Month 24 | ||
Baseline lumbar spine BMD T-score | ||
≤ -3 Incidence, n/N1 (%) Absolute risk reduction, %, point estimate (95% CI) Risk ratio, point estimate (95% CI) Odds ratio, point estimate (95% CI) P value | 14/1404 (1.0) 2.59 (1.47 to 3.71) 0.28 (0.15 to 0.50) 0.27 (0.15 to 0.49) < 0.001 | 48/1339 (3.6) |
> -3 and ≤ -2.5 Incidence, n/N1 (%) Absolute risk reduction, %, point estimate (95% CI) Risk ratio, point estimate (95% CI) Odds ratio, point estimate (95% CI) P value | 0/639 (0) 2.37 (1.17 to 3.57) NE (NE) NE (NE) NE | 15/619 (2.4) |
> -2.5 Incidence, n/N1 (%) Absolute risk reduction, %, point estimate (95% CI) Risk ratio, point estimate (95% CI) Odds ratio, point estimate (95% CI) P value | 6/1207 (0.5) 0.86 (0.12 to 1.61) 0.36 (0.14 to 0.91) 0.36 (0.14 to 0.91) = 0.024 | 17/1275 (1.3) |
Baseline total hip and femoral neck BMD T-scores | ||
≤ -3 Incidence, n/N1 (%) Absolute risk reduction, %, point estimate (95% CI) Risk ratio, point estimate (95% CI) Odds ratio, point estimate (95% CI) P value | 6/857 (0.7) 2.48 (1.16 to 3.81) 0.23 (0.10 to 0.54) 0.21 (0.09 to 0.51) < 0.001 | 28/828 (3.4) |
> -3 Incidence, n/N1 (%) Absolute risk reduction, %, point estimate (95% CI) Risk ratio, point estimate (95% CI) Odds ratio, point estimate (95% CI) P value | 15/2468 (0.6) 1.65 (0.99 to 2.30) 0.27 (0.15 to 0.47) 0.27 (0.15 to 0.47) < 0.001 | 56/2498 (2.2) |
FRAX score for 10-year risk of major osteoporotic fracture | ||
≤ 8.21 Incidence, n/N1 (%) Absolute risk reduction, %, point estimate (95% CI) Risk ratio, point estimate (95% CI) Odds ratio, point estimate (95% CI) P value | 6/1122 (0.5) 1.23 (0.35 to 2.11) 0.29 (0.12 to 0.75) 0.31 (0.12 to 0.77) = 0.008 | 19/1097 (1.7) |
> 8.21 and ≤ 14.27 Incidence, n/N1 (%) Absolute risk reduction, %, point estimate (95% CI) Risk ratio, point estimate (95% CI) Odds ratio, point estimate (95% CI) P value | 2/1089 (0.2) 2.35 (1.41 to 3.30) 0.07 (0.02 to 0.30) 0.07 (0.02 to 0.29) < 0.001 | 29/1146 (2.5) |
> 14.27 Incidence, n/N1 (%) Absolute risk reduction, %, point estimate (95% CI) Risk ratio, point estimate (95% CI) Odds ratio, point estimate (95% CI) P value | 13/1106 (1.2) 2.09 (0.86 to 3.33) 0.36 (0.19 to 0.68) 0.34 (0.18 to 0.65) < 0.001 | 36/1080 (3.3) |
Historical fragility fracture | ||
Yes Incidence, n/N1 (%) Absolute risk reduction, %, point estimate (95% CI) Risk ratio, point estimate (95% CI) Odds ratio, point estimate (95% CI) P value | 9/821 (1.1) 2.84 (1.31 to 4.36) 0.28 (0.13 to 0.58) 0.27 (0.13 to 0.56) < 0.001 | 31/787 (3.9) |
No Incidence, n/N1 (%) Absolute risk reduction, %, point estimate (95% CI) Risk ratio, point estimate (95% CI) Odds ratio, point estimate (95% CI) P value | 12/2504 (0.5) 1.60 (0.98 to 2.22) 0.23 (0.12 to 0.43) 0.23 (0.12 to 0.43) < 0.001 | 53/2540 (2.1) |
CI = confidence interval; FRAX = Fracture Risk Assessment too; LOCF = last observation carried forward; N = number of patients randomized; NE = not estimable; N1 = number of patients in the primary analysis set; RRR = relative risk reduction.
Source: CSR of FRAME9
Table 36: Primary Fracture Outcomes — ARCH, Subgroup Analysis by Baseline Characteristics, primary efficacy analysis set for Vertebral Fractures, LOCF imputation
Subgroups | Romo/Alen N = 2,046 | Alen/Alen N = 2047 |
|---|---|---|
Incidence rates of new vertebral fracture through Month 24 | ||
Baseline lumbar spine BMD T-Scores | ||
≤ -3 Incidence, n/N1 (%) Absolute risk reduction, %, point estimate (95% CI) Risk ratio, point estimate (95% CI) Odds ratio, point estimate (95% CI) P value | 37/892 (4.1) 3.50 (1.35 to 5.65) 0.54 (0.37 to 0.80) 0.52 (0.34 to 0.78) = 0.001 | 72/925 (7.8) |
> -3 and ≤ -2.5 Incidence, n/N1 (%) Absolute risk reduction, %, point estimate (95% CI) Risk ratio, point estimate (95% CI) Odds ratio, point estimate (95% CI) P value | 9/277 (3.2) 3.20 (-0.35 to 6.75) 0.49 (0.22 to 1.08) 0.51 (0.22 to 1.20) = 0.12 | 15/270 (5.6) |
> -2.5 Incidence, n/N1 (%) Absolute risk reduction, %, point estimate (95% CI) Risk ratio, point estimate (95% CI) Odds ratio, point estimate (95% CI) P value | 17/577 (2.9) 5.49 (2.80 to 8.18) 0.35 (0.21 to 0.60) 0.32 (0.18 to 0.57) < 0.001 | 46/557 (8.3) |
Baseline total hip and femoral neck BMD T-scores | ||
≤ -3 Incidence, n/N1 (%) Absolute risk reduction, %, point estimate (95% CI) Risk ratio, point estimate (95% CI) Odds ratio, point estimate (95% CI) P value | 48/837 (5.7) 3.23 (0.77 to 5.70) 0.64 (0.45 to 0.90) 0.61 (0.42 to 0.90) = 0.011 | 76/853 (8.9) |
> -3 Incidence, n/N1 (%) Absolute risk reduction, %, point estimate (95% CI) Risk ratio, point estimate (95% CI) Odds ratio, point estimate (95% CI) P value | 26/988 (2.6) 4.70 (2.79 to 6.61) 0.36 (0.23 to 0.55) 0.34 (0.21 to 0.53) < 0.001 | 71/981 (7.2) |
FRAX score for 10-year risk of major osteoporotic fracture | ||
≤ 14.22 Incidence, n/N1 (%) Absolute risk reduction, %, point estimate (95% CI) Risk ratio, point estimate (95% CI) Odds ratio, point estimate (95% CI) P value | 20/608 (3.3) 2.11 (-0.15 to 4.37) 0.61 (0.35 to 1.04) 0.58 (0.33 to 1.03) = 0.059 | 33/632 (5.2) |
> 14.22 and ≤ 22.47 Incidence, n/N1 (%) Absolute risk reduction, %, point estimate (95% CI) Risk ratio, point estimate (95% CI) Odds ratio, point estimate (95% CI) P value | 21/616 (3.4) 5.84 (3.12 to 8.56) 0.37 (0.23 to 0.60) 0.35 (0.21 to 0.58) < 0.001 | 57/610 (9.3) |
> 22.47 Incidence, n/N1 (%) Absolute risk reduction, %, point estimate (95% CI) Risk ratio, point estimate (95% CI) Odds ratio, point estimate (95% CI) P value | 32/598 (5.4) 4.34 (1.33 to 7.34) 0.56 (0.37 to 0.84) 0.51 (0.33 to 0.81) = 0.004 | 57/586 (9.7) |
Incidence rates of clinical fracture through primary analysis period (full analysis set) | ||
Baseline lumbar spine BMD T-score | ||
≤ -3 Incidence, n/N1 (%) Hazard ratio, point estimate (95% CI) P value | 77/997 (7.7) 0.66 (0.50 to 0.89) = 0.005 | 116/1024 (11.3) |
> -3 and ≤ -2.5 Incidence, n/N1 (%) Hazard ratio, point estimate (95% CI) P value | 24/304 (7.9) 1.04 (0.59 to 1.84) = 0.90 | 24/305 (7.9) |
> -2.5 Incidence, n/N1 (%) Hazard ratio, point estimate (95% CI) P value | 66/649 (10.2) 0.95 (0.68 to 1.34) = 0.78 | 67/617 (10.9) |
Baseline total hip and femoral neck BMD T-scores | ||
≤ -3 Incidence, n/N1 (%) Hazard ratio, point estimate (95% CI) P value | 91/949 (9.6) 0.80 (0.61 to 1.05) = 0.11 | 114/961 (11.9) |
> -3 Incidence, n/N1 (%) Hazard ratio, point estimate (95% CI) P value | 87/1097 (7.9) 0.82 (0.61 to 1.09) = 0.16 | 103/1085 (9.5) |
FRAX score for 10-year risk of major osteoporotic fracture | ||
≤ 14.22 Incidence, n/N1 (%) Hazard ratio, point estimate (95% CI) P value | 49/665 (7.4) 0.91 (0.62 to 1.34) = 0.63 | 55/688 (8.0) |
> 14.22 and ≤ 22.47 Incidence, n/N1 (%) Hazard ratio, point estimate (95% CI) P value | 53/692 (7.7) 0.72 (0.50 to 1.03) = 0.067 | 71/692 (10.3) |
> 22.47 Incidence, n/N1 (%) Hazard ratio, point estimate (95% CI) P value | 75/686 (10.9) 0.78 (0.57 to 1.06) = 0.11 | 91/660 (13.8) |
CI = confidence interval; FRAX = LOCF = last observation carried forward; N = number of patients randomized; NA = not applicable; NE = not estimable; N1 = number of patients in the primary analysis set; RRR = relative risk reduction.
Source: Clinical Study Report for ARCH.10
Appendix 4: Indirect Treatment Comparisons
Note that this appendix has not been copy-edited.
Table 37: Characteristics of Trials Included in the ITC
Trial name or author, year of publication | N | Interventions | Study duration | Country |
|---|---|---|---|---|
Alexandersen, 1999 | 50 | HRT (17 beta-estradiol 50 mcg/day, patch + norethisterone acetate oral 1 mg/day) vs. placebo | 24 months | Denmark |
Bai, 2013 | 483 | zoledronate 5 mg/ year vs. placebo | 24 months | China |
Bischoff, 2003 | 122 | vitamin D3 800 IU vs. placebo | 3 months | Switzerland |
Black, 1996 | 2,027 | alendronate 5 mg/day for 24 months and then increased to 10 mg/day vs. placebo | 36 months | USA |
Black, 2007 | 7,765 | zoledronate, 5 mg / year vs. placebo | 24 months | Multiple countries |
Blair, 2009 | 329 | calcitonin (salmon calcitonin) intranasal 200 IU/day vs. teriparatide 20 mcg/day | 6 months | Multiple countries |
Bock, 2012 | 70 | ibandronate 150 mg/month vs. placebo | 12 months | Germany |
Body, 2002 | 146 | alendronate 10 mg/day vs. teriparatide 40 mcg/day | 14 months | Multiple countries |
Bolton-Smith, 2007 | 123 | vitamin D 400 IU + calcium 1 g/day vs. placebo | 24 months | UK |
Bone, 1997 | 359 | alendronate 1, 2.5 or 5 mg / day vs. placebo | 24 months | USA |
Bone, 2008 | 332 | denosumab, 60 mg/6 months vs. placebo | 24 months | Multiple countries |
Bush, 1996 | 875 | HRT (CEE 0.625 mg/day only, or cyclic or continuous CEE 0.625 mg/day + MPA 10 mg/day [day 1 to 12], or CEE 0.625 mg/day + MPA 2.5 mg/day, or CEE 0.625 mg/day + micronized progesterone) vs. placebo | 36 months | USA |
Cauley, 2003 | 16,608 | estrogen + progestin vs. placebo | 18 months | USA |
Chapuy, 1992/1994 | 3,270 | vitamin D3 800 IU/day + tricalcium phosphate 1.2 g/day vs. placebo | 18 months | France |
Chapuy, 2002 | 583 | vitamin D3 800 IU/day + elemental calcium 1.2 g/day as a fixed combination or separate vs. placebo | 24 months | France |
Chesnut, 2000 | 1,255 | calcitonin (salmon calcitonin) intranasal 100, 200, or 400 IU/day vs. placebo | 60 months | Multiple countries |
Chesnut, 2004 | 2,946 | ibandronate 2.5 mg/day or 20 mg in 4 doses/month vs. placebo | 36 months | Multiple countries |
Clemmesen, 1997 | 132 | risedronate 2.5 mg/day vs. placebo | 24 months | Multiple countries |
Cosman, 2009 | 99 | alendronate 70 total mg/week vs. raloxifene 60 mg/day | 18 months | USA |
Cosman, 2011 | 275 | teriparatide 20 mcg/day + injectable placebo vs. zoledronate 5 mg/once | 12 months | Multiple countries |
Cosman, 2016 | 7,180 | romosozumab sc 210 mg/month vs. placebo | 12 months | Multiple countries |
Cummings, 1998 | 4,432 | alendronate 5 mg/day vs. placebo | 50.4 months | USA |
Cummings, 2008 | 4,534 | tibolone 1.25 mg/day vs. placebo | 34 months | Multiple countries |
Cummings, 2009 | 7,868 | denosumab 60 mg/6 months vs. placebo | 36 months | Multiple countries |
Cummings, 2010 | 8,556 | lasofoxifene 0.25 mg/day vs. placebo | 60 months | Multiple countries |
Dursun, 2001 | 101 | alendronate 10 mg/day vs. calcitonin (salmon calcitonin) intranasal 100 IU/day vs. placebo | 12 months | Turkey |
Ensrud, 2008 | 10,101 | raloxifene 60 mg/day vs. placebo | 67.2 months (median) | Multiple countries |
Ettinger, 1999 | 7,705 | raloxifene 60 or 120 mg/day vs. placebo | 36 months | Multiple countries |
Fogelman, 2000 | 359 | risedronate 5 mg/day vs. placebo | 24 months | Multiple countries |
Fogelman, 2008 | 180 | teriparatide 100 mcg/day vs. placebo | 17.4 months (teriparatide), 18.2 months (placebo) | Multiple countries |
Gallagher, 2001 | 367 | HRT (conjugated estrogen 0.625 mg/d + MPA 2.5 mg/d) vs. vitamin D (calcitriol 0.5 mcg/day) vs. placebo | 36 months | USA |
Garay Lillo, 1997 | 4,185 | vitamin D 16,000 IU/week vs. placebo | 24 months | Spain |
Gennari, 1985 | 45 | calcitonin (salmon calcitonin) 100 IU/day or 100IU/interdaily vs. control | 12 months | Italy |
Greenspan, 1998 | 120 | alendronate 5 mg (10 for the last 12 months) / day vs. placebo | 30 months | USA |
Greenspan, 2002 | 327 | alendronate 10 mg/day vs. placebo | 24 months | USA |
Greenspan, 2007 | 2,679 | teriparatide 100 mcg/day vs. placebo | 18 months | Multiple countries |
Greenspan, 2015 | 181 | zoledronate 5 mg/once vs. placebo | 24 months | USA |
Grey, 2009 | 50 | zoledronate, 5mg/once vs. placebo | 24 months | New Zealand |
Grey, 2014 | 180 | zoledronate 1 mg, 2.5 mg or 5 mg/once vs. placebo | 24 months | New Zealand |
Gruber, 1984 | 45 | calcitonin (synthetic salmon calcitonin) im or sc 100 IU/day vs. control | 24 months | USA |
Hadji, 2012 | 710 | risedronate 35 mg/week vs teriparatide 20 mcg/day | 18 months | USA |
Harris, 1999 | 1,641 | risedronate 5 mg/day vs. placebo | 36 months | USA |
Harwood, 2004 | 150 | vitamin D (ergocalciferol) iv 300,000 IU/day + calcium carbonate 1 g/day vs. vitamin D 300,000 IU/day vs. control | 12 months | UK |
Henriksen, 2016 | 4,665 | calcitonin (salmon calcitonin) oral 0.8 mg/day vs. placebo | 36 months | Multiple countries |
Hizmetli, 1998 | 107 | calcitonin (salmon calcitonin) intranasal 50 or 100 IU/day vs. placebo | 24 months | Turkey |
Hooper, 2005 | 383 | Risedronate 2.5 or 5 mg/day vs. placebo | 24 months | Australia |
Hulley, 1998 | 2,763 | HRT (CEE 0.625 mg/day + MPA 2.5 mg/day) vs. placebo | 36 months | USA |
Ishida, 2004 | 264 | HRT (estrogen 0.625 mg/day + MPA 2.5 mg/d) vs. calcitonin (eel calcitonin) 20 IU/week vs. vitamin D 1 mcg/d vs. placebo | 24 months | Japan |
Itabashi, 2011 | 425 | bazedoxifene 20 mg, 40 mg/day vs. placebo | 26 months | Japan |
Iwamoto, 2008 | 122 | alendronate 5 mg/day vs. raloxifene, 60 mg/day | 12 months | Japan |
Iwamoto, 2011 | 194 | alendronate 35 mg/week vs. calcitonin (as elcatonin, an eel calcitonin derivative) im 20 IU/week | 6 months | Japan |
Jackson, 2006 | 36,282 | calcium carbonate 1 g/day + vitamin D3 400 IU/day vs. placebo | 84 months | USA |
Jacobsen, 2012 | 318 | tibolone 1.25 mg/day vs. raloxifene 60 mg/day vs. placebo | 24 months | The Netherlands |
Koh, 2016 | 135 | denosumab sc 60 mg single dose vs. placebo | 6 months | Korea |
Komulainen, 1998 | 348 | HRT (Estradiol valerate 2 mg + cyproterone acetate 1 mg) vs. calcium 93 mg + vitamin D 300 IU/day vs. placebo | 60 months | Finland |
Lees, 2001 | 579 | HRT (17β-estradiol 1 or 2 mg/day [day 1 to 28] + dydrogesterone 5, 10, or 20 mg/day [day 15 to 28]) vs. placebo | 24 months | UK and Canada |
Liberman, 1995 | 994 | alendronate 5, 10 or 20 mg/day vs. placebo | 36 months | Multiple countries |
Lindsay, 1990 | 50 | HRT (CCE 0.625 mg/d, women with intact uterus received MPA 5-10 mg/day) vs. placebo | 24 months | USA |
Luckey, 2004 | 456 | alendronate 70 mg/week vs. raloxifene 60 mg/day | 12 months | USA |
Lufkin, 1992 | 75 | HRT (Estradiol 0.1 mg/day + MPA 10 mg/day) vs. placebo | 12 months | USA |
Lufkin, 1998 | 143 | raloxifene 60 or 120 mg/day vs. no treatment | 12 months | USA |
Macdonald, 2013 | 305 | vitamin D 400 or 1,000 IU/day vs. placebo | 12 months | UK |
McClung, 2001 | 9,331 | risedronate 2.5 or 5 mg/day vs. placebo | 24 months | Multiple countries |
McClung, 2004 | 612 | HRT (CEE 0.625 mg/day + MPA 5 mg/day or 17β- estradiol 1-2 mg/day + norethisterone acetate 1 mg/day) vs. placebo | 72 months | Multiple countries |
McClung, 2005 | 203 | alendronate 10 mg/day + injectable placebo vs. teriparatide 20 mcg/day + oral placebo | NR | Multiple countries |
McClung, 2006 | 365 | denosumab every 3 months (6, 14 or 30 mg) or every 6 months (14, 60, 100 or 210 mg) vs. placebo | 12 months | USA |
McClung, 2009 | 160 | ibandronate 150 mg/month vs. placebo | 12 months | USA |
Meunier, 2004/2009 | 1,649 | strontium ranelate 2 g/day vs. placebo | 48 months | Multiple countries |
Miller, 2008 | 1,760 | alendronate 70 mg/week vs. ibandronate 150 mg/month | 12 months | Multiple countries |
Miller, 2016a | 643 | denosumab sc 60 mg single dose + iv placebo vs. zoledronate iv 5 mg single dose + sc placebo | 12 months | Multiple countries |
Miller, 2016b | 2,463 | teriparatide 20 mcg//day vs. abaloparatide 80 mcg/day vs. placebo | 18 months | Multiple countries |
Morii, 2003 | 202 | raloxifene 60 or 120 mg / day vs. placebo | 12 months | Japan |
Mortensen, 1998 | 111 | risedronate 5 mg/day or 5 mg/day the first 2 week each month vs. placebo | 24 months | USA and Denmark |
Mosekilde, 2000 | 1,006 | HRT (oestradiol 2 mg/day [day 1-12], norethisterone acetate 1 mg/day [day 13-22], oestradiol 1 mg/day [day 23-28]) vs. placebo | 60 months | Denamark |
Muscoso, 2004 | 1,200 | alendronate 10 mg/day vs. risedronate 5 mg/day vs. raloxifene 60 mg/day | 24 months | Italy |
Nachtiga ll, 1979 | 168 | HRT (conjugated estrogen 2.5 mg/day + MPA 10 mg/day) vs. placebo | 120 months | USA |
Nakamu ra, 2012a | 212 | denosumab 14, 60, 100 mg/6 months vs. placebo | 12 months | Japan |
Nakamu ra, 2012b | 549 | teriparatide sc 56.5 mcg/week vs. placebo | 18 months | Japan |
Nakamu ra, 2014 | 898 | denosumab 60 mg/6 months vs. placebo | 24 months | Japan |
Neer, 2001 | 1,637 | teriparatide 20 or 40 mcg/day vs. placebo | 18 months | Multiple countries |
Overgaard, 1992 | 308 | calcitonin (salmon calcitonin) intranasal 50, 100, or 200 IU/day vs. placebo | 24 months | Denmark |
Panico, 2011 | 81 | alendronate 70 mg/week vs. teriparatide 20 mcg/day | 18 months | Italy |
Pfeifer, 2000 | 148 | vitamin D 800 IU/day vs. control | 12 months | Germany |
Pols, 1999 | 1,908 | alendronate 10 mg/day vs. placebo | 12 months | Multiple countries |
Porthouse, 2005 | 3,314 | calcium carbonate 1 g/day + vitamin D3 1,600 IU/day vs. control | 18 months | UK |
Prince, 2006 | 1,460 | calcium carbonate 1.2 g/day vs. placebo | 60 months | Australia |
Radford, 2014 | 1,471 | calcium 1 g/day vs. placebo | 60 months | New Zealand |
Recker, 1999 | 128 | HRT (CEE 0.3 mg/day + MPA 2.5 mg/day) vs. placebo | 42 months | USA |
Recker, 2004 | 2,862 | ibandronate 0.5 or 1 mg/3 months vs. placebo | 36 months | NR |
Recker, 2007 | 1,423 | alendronate 10 mg/day vs. raloxifene 60 mg/day | 10.8 months | USA |
Recknor, 2013 | 833 | denosumab 60 mg/6 months vs. ibandronate 150 mg/month | 12 months | Multiple countries |
Reginster, 2000 | 814 | risedronate 5 mg/day vs. placebo | 36 months | Multiple countries |
Reginster, 2005/2008 | 5,091 | strontium ranelate 2 g/day vs. placebo | 36 and 60 months | Multiple countries |
Reid, 2002 | 351 | zoledronate, 0.25, 0.5, or 1 mg every 3 months; or 2 mg infusion twice; or one 4 mg infusion vs. placebo | 12 months | Multiple countries |
Reid, 2004 | 461 | raloxifene 60 or 150 mg/day vs. placebo | 36 months | Multiple countries |
Rico, 1995 | 72 | calcitonin (salmon calcitonin) im 100 IU/day vs. control | 24 months | Spain |
Rogers, 2009 | 51 | lasofoxifene 0.25 mg/day vs. placebo | 24 months | UK |
Saag, 2017 | 4,093 | Monthly sc romosozumab (210 mg) vs. weekly oral alendronate | 12 months | Multiple countries |
Salovaar a, 2010 | 3,195 | vitamin D (cholecalciferol) 800 IU/day + calcium carbonate 1 g/day vs. control group | 36 months | Finland |
Silverman, 2008/2012 | 7,492 | bazedoxifene 20 or 40 mg/day vs. raloxifene 60 mg/day vs. placebo | 36 months for raloxifene arm, 60 months for the rest. | Multiple countries |
Tanko, 2004 | 277 | calcitonin (salmon calcitonin) oral 0.15, 0.4, 1, or 2.5 mg/day or 1 mg/interdaily vs. placebo | 36 months | Denmark and Belgium |
Tierney, 2009 | 142 | HRT (17β-estradiol micronized 1 mg/day + norethindrone 0.35 mg/3 days per week) vs. placebo | 24 months | Canada |
Ushiroyama, 2001 | 151 | calcitonin im 10 IU twice a month vs. vitamin D (1ɑ- hydroxycholecalciferol) 1 mcg/day vs. control | 24 months | Japan |
Vickers, 2007 | 6,026 | HRT (estrogen 0.625 mg/ day or estrogen 2.5 mg/day + Progesterone 5 mg/day) vs. placebo | 11.9 months | Japan |
Weiss, 1999 | 175 | HRT (17β-E2 transdermal system of 0.025,0.05,0.06, and 0.1 mg/day) vs. placebo | 24 months | USA |
Wimalawansa, 1998 | 36 | HRT (premarin 0.625 mg/day + norgestrel 150 mcg for 12 days each month) vs. control | 48 months | NR |
Yan, 2009 | 560 | alendronate 70 mg/week vs. placebo | 12 months | China |
Source: sponsor-submitted ITC11,44
Table 38: Summary of patient characteristics for the 107 included trials
Trial name or author, year of publication | Patient description | Baseline BMD status | Age (mean or range in years) | Race/ethnicity |
|---|---|---|---|---|
Alexandersen, 1999 | Healthy postmenopausal women with low BMD | Osteoporosis and osteopenia | 65 | NR |
Bai, 2013 | Postmenopausal women with Osteoporosis | Osteoporosis | 56.8 | 100% Asian |
Bischoff, 2003 | Women aged ≥ 60 years with the ability to walk 3 m with or without a walking aid | NR | 84.6 | NR |
Black, 1996 | Women aged 55-81 years with existing vertebral fractures, with at least 2 years of menopause and low femoral neck BMD | Osteopenia or Osteoporosis | 55-81 | 97% White, 1% Asian, 1% Black |
Black, 2007 | Women aged 65- 89 years with osteoporosis | Osteoporosis | 73 | NR |
Blair, 2009 | Postmenopausal women with osteoporosis | Osteoporosis | 68.7 | 100% Asian |
Bock, 2012 | Women aged 60-75 years with menopause for > 5 years with osteoporosis | Osteoporosis | NR | NR |
Body, 2002 | Ambulatory postmenopausal women aged 30-85 years | Osteoporosis | 65.5 | 82% White |
Bolton-Smith, 2007 | Healthy women ≥ 60 years | Normal BMD | 68.3 | NR |
Bone, 1997 | Women aged 60- 85 years with osteoporosis | Osteoporosis and osteopenia | 71 | 97% White |
Bone, 2008 | Ambulatory postmenopausal women with osteopenia | Osteopenia | 59.4 | 83% White |
Bush, 1996 | Healthy post-menopause women aged 45-64 years | Normal BMD | 56 | 88.7% White |
Cauley, 2003 | Postmenopausal women with an intact uterus | NR | 63.3 | 84% White, 7% Black, 5% Hispanic, 0.3% Native American, 2% Asian/Pacific Islander |
Chapuy, 1992/1994 | Healthy women living in nursing homes or apartment houses | NR | 84 | NR |
Chapuy, 2002 | Ambulatory women with life expectancy of at least 24 months | NR | NR | NR |
Chesnut, 2000 | Postmenopausal women for at least 1 year with osteoporosis | Osteoporosis | 68.3 | White, Asian, or Hispanic |
Chesnut, 2004 | Women aged 55-80 years and ≥ 5 years postmenopausal with osteoporosis | Osteoporosis | 69 | NR |
Clemmesen, 1997 | Healthy women with at least 1 year of menopause with osteoporosis | Osteoporosis | 68 | NR |
Cosman, 2009 | Women aged ≥ 50 years with osteoporosis | Osteoporosis | 68.4 | NR |
Cosman, 2011 | Postmenopausal women with osteoporosis | Osteoporosis | 45-89 | 97.9% White |
Cosman, 2016 | Postmenopausal ambulatory women aged 55- 90 years | Osteoporosis | 70.9 | 39.6% Hispanic, 60.4% non- Hispanic |
Cummings, 1998 | Women aged 55- 80 years without a vertebral fracture, with at least 2 years of menopause and BMD of 0.68 g/cm2 | Osteopenia and osteoporosis | 68 | 97% White |
Cummings, 2008 | Women aged 60-85 years with osteoporosis | Osteoporosis | 68.25 | NR |
Cummings, 2009 | Women aged 60-90 years with osteoporosis | Osteoporosis | 72.3 | NR |
Cummings, 2010 | Postmenopausal women (59 to 80 years of age) | Osteoporosis | 67 | 74.1% White, 18.4% Asian |
Dursun, 2001 | Postmenopausal women with BMD of -2 SD or less (lumbar spine or femoral neck) | Osteoporosis and osteopenia | 60.3 | NR |
Ensrud, 2008 | Women aged ≥55 years with documented heart disease or at high risk of coronary events | Normal BMD | 68 | 84% White |
Ettinger, 1999 | Women with at least 2 years of menopause and had no severe or long-term disabling condition but osteoporosis | Osteoporosis | 67 | 95.7% White |
Fogelman, 2000 | Women up to 80 years of age with at least 1 year of menopause and BMD -2 or less (lumbar spine) | Osteoporosis and osteopenia | 65 | NR |
Fogelman, 2008 | Postmenopausal women for a minimum of 1 year | Osteoporosis and osteopenia | 58.8 | NR |
Gallagher, 2001 | Women aged 65-77 years with normal BMD | Normal BMD | 71.7 | NR |
Garay Lillo, 1997 | Ambulatory women aged 65-85 years | NR | NR | NR |
Gennari, 1985 | Postmenopausal women with vertebral atraumatic compressions | Osteoporosis | 58.7 | NR |
Greenspan, 1998 | Healthy, ambulatory, community- dwelling women aged ≥ 65 years | None specified | 70 | NR |
Greenspan, 2002 | Ambulatory women aged ≥ 65 years living in long-term care facilities | Osteoporosis and osteopenia | 78.5 | 97% White |
Greenspan, 2007 | Postmenopausal women aged 45-54 years with osteoporosis | Osteoporosis | 64.4 | NR |
Greenspan, 2015 | Postmenopausal frail women aged ≥65 years who resided in a nursing home or assisted-living facility | Osteoporosis | 85.5 | NR |
Grey, 2009 | Postmenopausal women for at least 5 years with BMD between -1 and -2 (lumbar spine of total hip) | Osteopenia | 63.5 | NR |
Grey, 2014 | Postmenopausal women for at least 5 years with BMD between -1 and -2.5 (lumbar spine of total hip) | Osteopenia | 65.3 | NR |
Gruber, 1984 | Postmenopausal White women aged 51-71 years with osteoporosis | Osteoporosis | 65.4 | 100% White |
Hadji, 2012 | Women aged ≥ 45 years with 2 years of menopause and a history of back pain for ≥ 2 months | Osteoporosis | NR | 0.7% African- American, 18% Hispanic, 80.4% White, 0.4% Asian, 0.4% Native American |
Harris, 1999 | Ambulatory women aged ≤ 85 years with at least 1 vertebral fracture | Osteoporosis | 69 | 96% White |
Harwood, 2004 | Postmenopausal elderly women after hip fracture | Osteoporosis | 81.3 | NR |
Henriksen, 2016 | Postmenopausal ambulatory women aged 55-85 years | Osteoporosis | 66.8 | 66.5% White, 1.5% Black, 19.2% Hispanic, 12.8% Asian |
Hizmetli, 1998 | Postmenopausal women with osteoporosis | Osteoporosis | 58 | NR |
Hooper, 2005 | Early postmenopausal (6-36 months) women with osteoporosis | Osteoporosis | 53 | 98% White |
Hulley, 1998 | Postmenopausal women aged 55-80 years for at least 1 year with established coronary disease | NR | 67 | 89% White |
Ishida, 2004 | Ambulatory women aged 50- 75 with osteoporosis | Osteoporosis | 69.5 | NR |
Itabashi, 2011 | Postmenopausal women aged ≤85 years with an intact uterus | Osteoporosis | 63 | Asian |
Iwamoto, 2008 | Postmenopausal women with osteoporosis | Osteoporosis | 69.4 | Asian |
Iwamoto, 2011 | Postmenopausal osteoporotic women with mild to moderate back pain | Osteoporosis | 79.8 | NR |
Jackson, 2006 | Postmenopausal women aged 50-79 years | NR | 62.4 | 83% White, 9.2% Black, 4.2% Hispanic, 0.4% American Indian, 2% Asian |
Jacobsen, 2012 | Postmenopausal women aged ≥70 years | NR | 73.7 | NR |
Koh, 2016 | Postmenopausal women aged 60-90 years | Osteoporosis | 66.5 | 100% Asian |
Komulainen, 1998 | Early postmenopausal women (6 to 24 months) | Osteoporosis | 52.5 | NR |
Lees, 2001 | Postmenopausal women for at least 6 months and were non-hysterectomized | Normal BMD | 55.6 | NR |
Liberman, 1995 | Women aged 45- 80 years with ≥ 5 years with menopause with osteoporosis | Osteoporosis | 64 | 87.4% White, 0.4% Black; 12.2% other |
Lindsay, 1990 | Postmenopausal women with osteoporosis | Osteoporosis | 62 | NR |
Luckey, 2004 | Postmenopausal women aged > 40 years with osteoporosis | Osteoporosis | 64.2 | 92% White |
Lufkin, 1992 | Ambulatory postmenopausal women with osteoporosis | Osteoporosis | 64.7 | NR |
Lufkin, 1998 | Ambulatory postmenopausal women aged 45-75 years | Osteoporosis | 68.4 | NR |
Macdonald, 2013 | Healthy postmenopausal women aged 60-70 years | Normal BMD | 64.6 | NR |
McClung, 2001 | Ambulatory postmenopausal women over the age of 70 | Osteoporosis | 79 | 98% White |
McClung, 2004 | Healthy women > 6 months post-menopause; aged < 60 years | Normal BMD, Osteopenia and Osteoporosis | 55 | NR |
McClung, 2005 | Postmenopausal women aged 45-84 years with osteoporosis | Osteoporosis | 45-84 | NR |
McClung, 2006 | Postmenopausal women aged ≤80 years with osteopenia or osteoporosis | Osteoporosis and osteopenia | 63 | 85% White, 11% Hispanic, 3% Black |
McClung, 2009 | Ambulatory postmenopausal women aged 45-0 years | Osteopenia | 53.5 | NR |
Meunier, 2004/2009 | Postmenopausal women aged ≥ 50 years with at least 1 vertebral fracture and a lumbar BMD ≤0.84 g/cm2 | Osteoporosis | 69.3 | 100% White |
Miller, 2008 | Ambulatory postmenopausal women with osteoporosis | Osteoporosis | 65.6 | 82% White |
Miller, 2016a | Postmenopausal ambulatory women aged ≥ 50 years who received oral bisphosphonate therapy for ≥ 2 years | Osteoporosis | 69 | 96.9% White, 1.4% Asian, 0.2% Black or African- American, 1.6% other |
Miller, 2016b | Postmenopausal women aged 49- 86 years | Osteoporosis | 68.8 | 79.7% White, 16.1% Asian, 3% Black or African- American, 1.3% other |
Morii, 2003 | Postmenopausal women aged ≤ 80 years with osteoporosis | Osteoporosis | 64.7 | 100% Asian |
Mortensen, 1998 | Postmenopausal women for 6-60 months with normal BMD | Normal BMD | 51.6 | 100% White |
Mosekilde, 2000 | Women aged 45-58 years with intact uterus and 3 to 24 months from last menstruation with perimenopausal symptoms | Normal BMD | 49.8 | NR |
Muscoso, 2004 | Postmenopausal women with osteoporosis | Osteoporosis | 68 | NR |
Nachtigall, 1979 | Postmenopausal women | NR | 55 | NR |
Nakamura, 2012a | Ambulatory postmenopausal women aged ≤80 years | Osteoporosis | 65.1 | 100% Asian |
Nakamura, 2012b | Healthy postmenopausal women aged 65-95 years with 1-5 vertebral fractures with low BMD | Osteoporosis | 75.3 | 100% Asian |
Nakamura, 2014 | Postmenopausal women aged ≥ 50 years with 1 to 4 prevalent vertebral fractures | Osteoporosis | 69.5 | 100% Asian |
Neer, 2001 | Ambulatory postmenopausal women for at least 5 years with osteoporosis | Osteoporosis | 70 | 98% White |
Overgaard, 1992 | Healthy women aged 68-72 years with bone mineral content on average 30% below the mean value for healthy premenopausal women (distal forearm) | Osteoporosis | 68-72 | NR |
Panico, 2011 | Postmenopausal women with back pain, osteoporosis, and 2 vertebral fractures | Osteoporosis | 62.6 | NR |
Pfeifer, 2000 | Ambulatory healthy women aged ≥ 70 years with 25-hydroxycholecalciferol serum level below 50 nmol/l | NR | 74.8 | NR |
Pols, 1999 | Postmenopausal women for 3 years aged 85 years with osteoporosis. | Osteoporosis and osteopenia | 62.8 | 94% White |
Porthouse, 2005 | Postmenopausal women aged ≥ 70 years with risk factor for hip fracture | NR | 76.8 | NR |
Prince, 2006 | Postmenopausal women ≥ 70 years | Osteoporosis | 75.2 | NR |
Radford, 2014 | Healthy postmenopausal women | Normal BMD | 74.1 | NR |
Recker, 1999 | Healthy White women aged > 65 years and spinal BMD 0.9 g/cm2 or less | Osteopenia or Osteoporosis | 73 | 100% White |
Recker, 2004 | Postmenopausal women with BMD T-score of -2 to -5 and one to 4 prevalent vertebral fractures | Osteoporosis | 67 | NR |
Recker, 2007 | Ambulatory postmenopausal women aged 50-80 years | Osteoporosis | 65.6 | 87% White |
Recknor, 2013 | Postmenopausal women with low bone density treated previously with oral bisphosphonate therapy | Osteopenia and Osteoporosis | 67.2 | 85.5% White |
Reginster, 2000 | Ambulatory women aged ≤85 years with ≥2 vertebral fracture | Osteoporosis | 71 | NR |
Reginster, 2005/2008 | Ambulatory postmenopausal women aged ≥74 years with osteoporosis | Osteoporosis | 76.47 | NR |
Reid, 2002 | Postmenopausal women aged 45-80 years | Osteoporosis and osteopenia | 64 | 99.4% White |
Reid, 2004 | Postmenopausal women aged 40-60 | Normal BMD or Osteopenia | 53 | 95% White |
Rico, 1995 | Postmenopausal women with osteoporosis | Osteoporosis | 69.2 | NR |
Rogers, 2009 | Women aged >50 years with menopause for > 5 years with BMD T- score between -1 to -2.5 | Osteopenia | 63.4 | NR |
Saag, 2017 | Ambulatory postmenopausal women 55 to 90 years | Osteoporosis | 74 | 32% Hispanic |
Salovaara, 2010 | Women aged ≥ 65 years | NR | 67.4 | NR |
Silverman, 2008/2012 | Healthy postmenopausal women aged 55- 85 with osteoporosis. At least 2 years of menopause | Osteoporosis | 66.4 | 87% White |
Tanko, 2004 | Healthy postmenopausal women aged 55- 85. At least 5 years of menopause | Normal BMD | 55-85 | 100% White |
Tierney, 2009 | Women aged ≥ 60 years with last menstrual cycle ≥ 12 months before | NR | 74.7 | 93% White, 4.2% Black, 2.8% Asian |
Ushiroyama, 2001 | Postmenopausal Japanese women for at least 6 months with osteopenia or osteoporosis | Osteopenia and osteoporosis | 52.5 | NR |
Vickers, 2007 | Postmenopausal (no menstrual period for 12 months) women aged 50-69 years | NR | 62.8 | NR |
Weiss, 1999 | Postmenopausal women aged ≥45 years, who had undergone hysterectomy without oophorectomies | NR | 51.2 | 83.4% White, 6.9% Black, 5.1% Hispanic |
Wimalawansa, 1998 | Postmenopausal White women with osteoporosis | Osteoporosis | 64.9 | 100% White |
Yan, 2009 | Ambulatory postmenopausal women with osteoporosis aged ≤85 years | Osteoporosis | 65 | 100% Asian |
Source: sponsor-submitted ITC11,44
Figure 7: Sensitivity Analysis Results for Zoledronate Compared With Placebo Using 5 Mg Single Dose: Nonvertebral Fractures
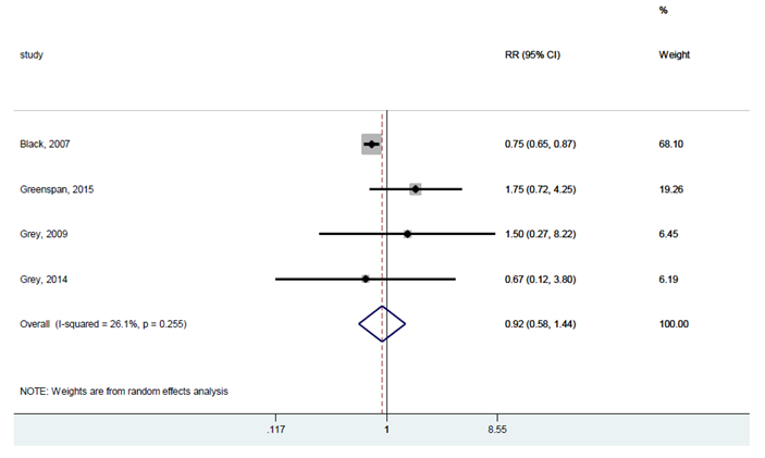
Source: Moreno et al.,44 Copyright 2019. This work is licensed under the Attribution 4.0 International Public Licence. Full text available here: https://figshare.com/articles/dataset/Appendix_to_network_meta-analysis_Fragility_Fractures/7629344
Figure 8: Sensitivity Analysis Results for Zoledronate Compared with Placebo Using Other Doses: Nonvertebral Fractures
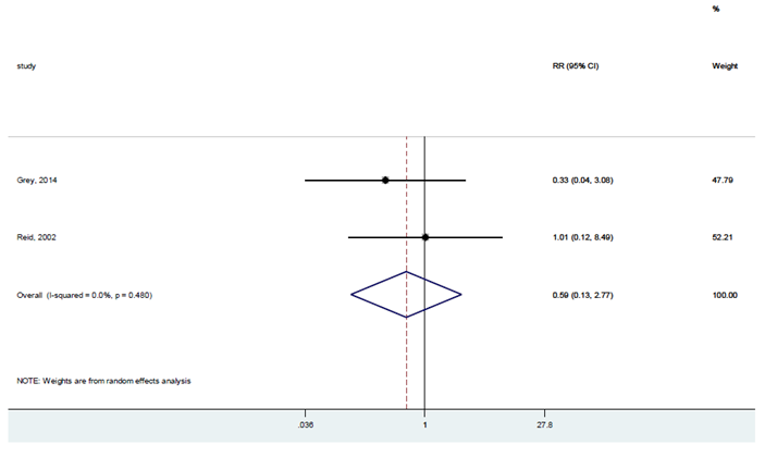
Source: Moreno et al.,44 Copyright 2019. This work is licensed under the Attribution 4.0 International Public Licence. Full text available here: https://figshare.com/articles/dataset/Appendix_to_network_meta-analysis_Fragility_Fractures/7629344
Figure 9: Sensitivity Analysis Results for Zoledronate Compared With Placebo Using 5 mg Single Dose: Vertebral Fractures
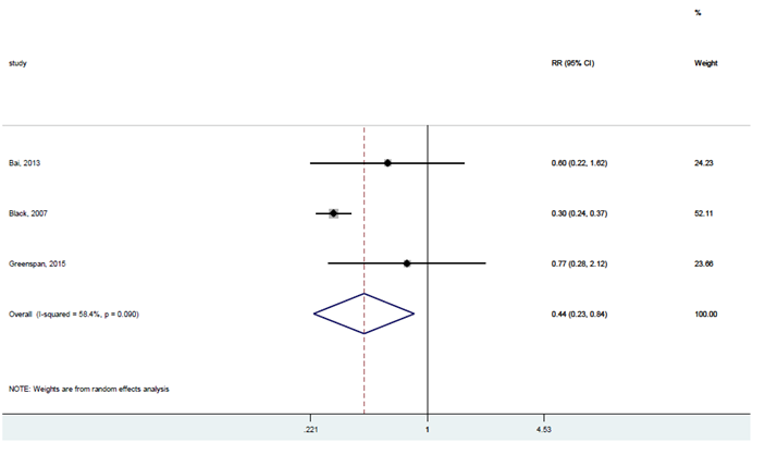
Source: Moreno et al.,44 Copyright 2019. This work is licensed under the Attribution 4.0 International Public Licence. Full text available here: https://figshare.com/articles/dataset/Appendix_to_network_meta-analysis_Fragility_Fractures/7629344
Figure 10: Sensitivity Analysis Results for Calcitonin Compared With Placebo Using the Intranasal Route: Vertebral Fractures
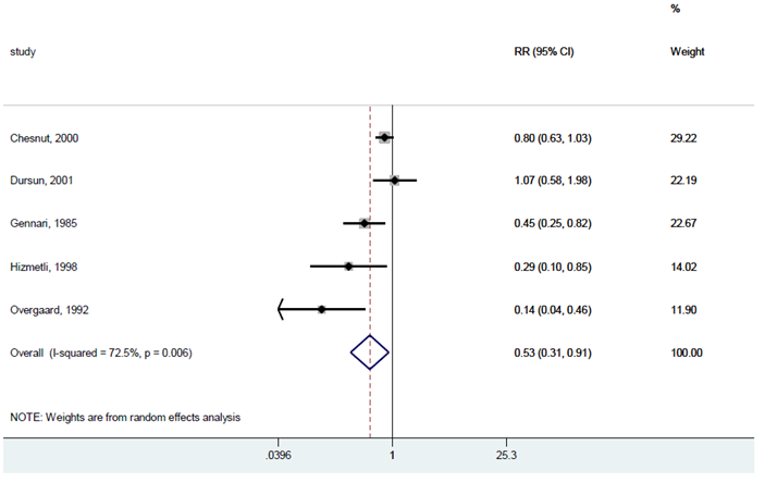
Source: Moreno et al.,44 Copyright 2019. This work is licensed under the Attribution 4.0 International Public Licence. Full text available here: https://figshare.com/articles/dataset/Appendix_to_network_meta-analysis_Fragility_Fractures/7629344
Figure 11: Sensitivity Analysis Results for Calcitonin Compared with Placebo Using the Injectable Route: Vertebral Fractures
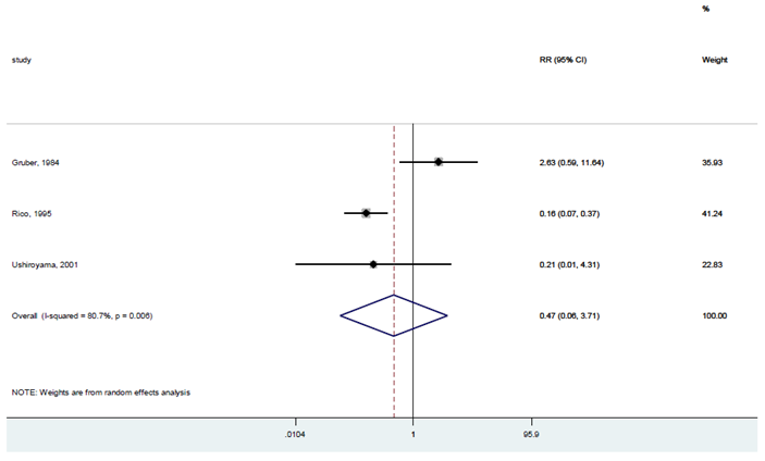
Source: Moreno et al.,44 Copyright 2019. This work is licensed under the Attribution 4.0 International Public Licence. Full text available here: https://figshare.com/articles/dataset/Appendix_to_network_meta-analysis_Fragility_Fractures/7629344
Figure 12: Sensitivity Analysis Results for Calcitonin Compared With Placebo Using the Oral Route: Vertebral Fractures
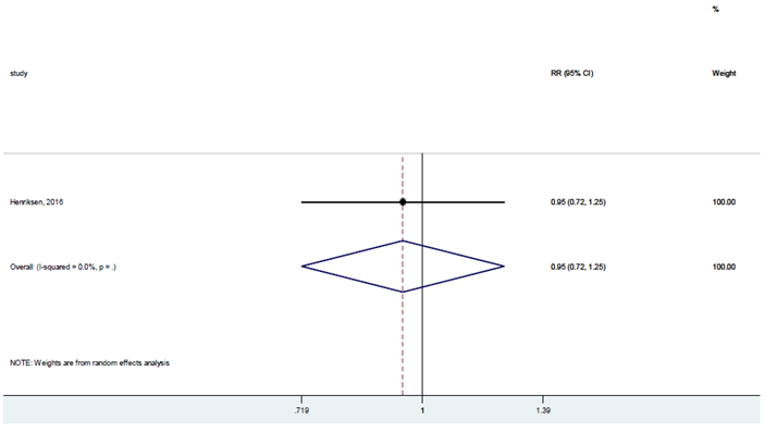
Source: Moreno et al.,44 Copyright 2019. This work is licensed under the Attribution 4.0 International Public License. Full text available here: https://figshare.com/articles/dataset/Appendix_to_network_meta-analysis_Fragility_Fractures/7629344
Pharmacoeconomic Review
Abbreviations
BIA
budget impact analysis
BMD
bone mineral density
CI
confidence interval
HRQoL
health-related quality of life
ICER
incremental cost-effectiveness ratio
LTC
long-term care
QALY
quality-adjusted life-year
Executive Summary
The executive summary comprises 2 tables (Table 1 and Table 2) and a conclusion.
Item | Description |
|---|---|
Drug product | Romosozumab (Evenity), pre-filled syringe |
Submitted price | Romosozumab, 105 mg/1.17 mL, pre-filled syringe: $328.39 |
Indication | For the treatment of osteoporosis in postmenopausal women at high risk for fracture, defined as a history of osteoporotic fracture, or with multiple risk factors for fracture |
Health Canada approval status | NOC |
Health Canada review pathway | Standard |
NOC date | NOC received: June 17, 2019 |
Reimbursement request | Reimbursement is being sought for use in the treatment of osteoporosis in postmenopausal women with a history of osteoporotic fracture AND who are at very high risk for future fracture |
Sponsor | Amgen Canada Inc. |
Submission history | Previously reviewed: No |
NOC = Notice of Compliance.
Table 2: Summary of Economic Evaluation
Component | Description |
|---|---|
Type of economic evaluation | Cost-utility analysis Markov model |
Target populations | Health Canada–approved population: postmenopausal women at high risk for fracture, defined as a history of osteoporotic fracture, OR with multiple risk factors for fracture Reimbursement-request population: women with postmenopausal osteoporosis with a history of osteoporotic fracture AND who are at very high risk for future fracture Those approved by Health Canada but not requested for reimbursement: women with postmenopausal osteoporosis with multiple risk factors for fracture, OR prior fracture but are not deemed to be at very high risk for future fracture |
Treatment | Romosozumab followed by alendronate |
Comparators | Alendronate, denosumab, raloxifene, risedronate, zoledronate |
Perspective | Canadian publicly funded health care payer |
Outcomes | Number of fractures, QALYs, life-years |
Time horizon | Lifetime (50 years) |
Key data source | Effectiveness of comparators: network meta-analysis of osteoporosis randomized controlled trials, Barrionuevo et al. (2019) Effectiveness of romosozumab came from the ARCH trial (Saag et al. [2017]) and the FRAME trial (Cosman et al. [2016]) |
Submitted results |
|
Key limitations | • The sponsor assumed that the treatment benefit of romosozumab followed by alendronate, relative to all other pharmacologic treatments, lasted for 5 years after discontinuing alendronate. It is not clear that the evidence used to support this applies to the high-risk population used in the model. Additionally, assuming a treatment effect of 9 years may be optimistic, as there is no evidence on the long-term effect of romosozumab (1-time treatment for 1 year). Finally, there is no evidence on the long-term relative effect on fractures of alendronate or romosozumab compared to other treatments in the model. • The cost of long-term care post-fracture was assumed to be $184.96 daily or $67,000 annually. As the cost of long-term care post-fracture was already included in the recurring direct medical costs related to fractures, this resulted in double-counting. • The sponsor assumed excess mortality from a fracture for 3 years after a vertebral and hip fracture. Data from the ARCH and FRAME trials do not support a difference in mortality. The CADTH clinical expert indicated there may be a mortality risk directly attributed to hip fractures. This mortality risk could last 1 year post–hip fracture due to limited mobility during this time. • The sponsor assumed a hip or vertebral fracture would always influence patients’ utility, with effects lasting up to 29 years. The utility values used in the model, obtained from an international study, showed a trend of improvement up to 18 months; however, the sponsor assumed no further improvement after 18 months. No evidence was found to support this assumption. • The CADTH clinical expert suggested that many physicians will administer romosozumab themselves, as they currently do with denosumab, and expected less than 10% of patients would self-administer romosozumab. • There is uncertainty regarding what proportion of patients in the full Health Canada indication would meet the specific requested reimbursement criteria. Values used in the cost-utility analysis lacked clinical plausibility and likewise did not match values used in the sponsor’s budget impact analysis. |
CADTH reanalysis results |
|
ICER = incremental cost-effectiveness ratio; QALY = quality-adjusted life-year.
Conclusions
Evidence from the ARCH and FRAME trials suggests that use of romosozumab followed by either alendronate or denosumab results in fewer fractures compared with alendronate alone or placebo in patients with a prior fracture or patients at high risk of fracture. The ARCH trial alone only represents patients covered under the sponsor’s reimbursement request. Combined, the FRAME and ARCH trials represent all patients covered under the Health Canada indication. Results from an indirect comparison suggest that romosozumab therapy may have a beneficial effect in reducing the risk of sustaining nonvertebral fractures, compared to all current treatments; however, results of this indirect comparison were associated with a substantial risk of bias.
To better reflect current evidence, CADTH undertook a reanalysis that restricted the relative treatment effect to time on treatment, eliminated double-counting of the costs of long-term care (LTC), limited the mortality effects of hip fractures to 1 year, reduced the long-term utility impact of a fracture, accounted for physician costs of administering romosozumab, and updated the proportion of patients who have multiple risk factors with no prior hip or vertebral fracture history.
For the full Health Canada indication, the CADTH base case resulted in a sequential incremental cost-effectiveness ratio (ICER) of $561,229 per quality-adjusted life-year (QALY) for romosozumab followed by alendronate. There was a 0% probability of romosozumab being cost-effective at a threshold of $50,000 per QALY in the Health Canada–indicated population. An 80% price reduction would be required to achieve cost-effectiveness at a threshold of $50,000 per QALY. However, this analysis assumes efficacy data from the ARCH trial apply equally to the entire Health Canada population, making the results highly uncertain. A scenario analysis that used relative effects from the FRAME trial, assuming the relative treatment effect would not improve beyond this point as it did in the ARCH trial, found the ICER increased to $1,875,332 per QALY. Therefore, an 80% price reduction may be highly conservative. In the reimbursement-requested population, the sequential ICER was $219,799 per QALY for romosozumab followed by alendronate, with a 0% probability of being cost-effective. A 53% price reduction would be needed for romosozumab to be cost-effective in the reimbursement-requested population at a threshold of $50,000 per QALY. The cost-effectiveness of romosozumab is lower in the full Health Canada indication, relative to the reimbursement request, due to the lower incidence of fractures in the full population. A lower incidence of fractures leads to a smaller absolute reduction in hip and vertebral fractures. As both analyses used outcomes from the indirect comparison, which was associated with a high degree of bias, the cost-effectiveness of romosozumab relative to comparators for which there is no direct evidence is highly uncertain.
The results of the cost-effectiveness analysis are driven by the effectiveness of treatments on the likelihood of a hip or vertebral fracture and the long-term consequences of said fractures. The most consequential long-term impacts of fractures on cost-effectiveness in the model are the effect on the patients’ health-related quality of life (HRQoL), the increased mortality, and the likelihood of transitioning to LTC. There was no direct evidence on the effect of romosozumab on these long-term consequences. Finally, there is uncertainty regarding who would be eligible for the reimbursement population and whether this population is truly reflected by the ARCH trial. To achieve cost-effectiveness in the reimbursement population, a price reduction of more than 53% may be required if the population eligible for treatment is broader than what is seen in the ARCH trial.
Stakeholder Input Relevant to the Economic Review
This section is a summary of the feedback received from the patient groups, registered clinicians, and drug plans that participated in the CADTH review process.
Feedback was received from 1 patient group (Osteoporosis Canada). Information was collected from a published patient survey and interviews with 4 patients from the Greater Toronto Area who had experience taking the drug under review. The survey results described the following outcomes as being important to patients: preserving quality of life (including improved mobility and independence), preventing fracture-related deaths, preventing admission to LTC homes, preserving their ability to perform daily physical and social activities, preventing all fractures related to osteoporosis, avoiding serious side effects, and having a choice of treatment when unable to tolerate conventional medications. Direct interviews with patients included 2 individuals who completed 12 months of treatment, 1 individual who completed 9 months of treatment, and 1 individual who completed 6 months of treatment. Patients described side effects (i.e., joint, muscle, groin, or leg pain; soreness; achiness; and burning at the injection site) following administration of romosozumab; however, these were described as “tolerable” or “inconsequential.” After completing 12 months of treatment, 1 patient reported increases in bone mineral density (BMD) in the hip and spine. Compared to other treatment options, 1 patient had tried a bisphosphonate and denosumab and was intolerant to both, and another patient had contraindications to or failed other therapies. The patients raised no issues with administration of the drug, and the reduced frequency (monthly versus daily) and shorter duration (12 months versus 24 months) of administration compared to teriparatide was appreciated. One patient reported receiving the initial 2 injections at the clinic and self-administering the remaining injections.
No clinician input was received for this review.
Potential implementation issues identified by drug plans included considerations for eligibility criteria, place in therapy, and health care resource use. Questions about eligibility criteria included whether patients with myocardial infarction or stroke, renal impairment, men, women younger than 55 years, and patients presenting as at high risk of fracture (without a prior fragility fracture) would be eligible for treatment with romosozumab, and if high-risk patients should be defined using fracture risk calculators. Drug plan interest in the place in therapy included a clarification regarding whether romosozumab would be used in treatment-naive or treatment-experienced patients, if patients may be switched to romosozumab from their existing therapies, if romosozumab may be used in combination with other therapies, if there are situations in which patients may be re-tried on romosozumab after failing, how failure would be defined, and if there would be situations in which romosozumab would not be given for the full 12 months for which it is recommended. Questions about health care resource use were of interest to drug plans, including how often patients will be monitored, if romosozumab would be prescribed by a specialist, and if there will be any access issues for BMD testing or injections (if a patient is unable to self-inject) in remote or isolated areas or in the context of the COVID-19 pandemic.
Several of these concerns were addressed in the sponsor’s model: quality of life, fracture-related deaths, and admission to LTC homes are all accounted for; some patients self-administer romosozumab; the cost-effectiveness of patients with different risks could be explored; and the cost-effectiveness of romosozumab followed by alendronate or by risedronate (as a scenario analysis) could be considered, along with the cost of monitoring romosozumab.
CADTH was unable to address 1 concern raised in stakeholder input, specifically that the model did not account for differences in adverse events.
Economic Review
The current review is for romosozumab (Evenity) for postmenopausal women at high risk for fracture, defined as a history of osteoporotic fracture, or with multiple risk factors for fracture.
Economic Evaluation
Summary of Sponsor’s Economic Evaluation
Overview
The sponsor submitted a cost-utility analysis of romosozumab followed by alendronate compared with alendronate, denosumab, raloxifene, risedronate, and zoledronate. The model population comprised postmenopausal women at high risk for fracture, defined as a history of osteoporotic fracture, or with multiple risk factors for fracture. This population is a subset of the full Health Canada population, which is postmenopausal women at high risk for fracture, defined as a history of osteoporotic fracture and with multiple risk factors for fracture.
Romosozumab is administered as a subcutaneous injection from a 1.17 mL single-use pre-filled syringe, each containing 105 mg of romosozumab. Two separate subcutaneous injections are needed to administer the total dose of 210 mg once monthly for 12 months. Romosozumab should be administered by a health care provider or an individual trained by a health care professional. Following romosozumab, patients receive alendronate for 4 years. As each syringe costs $328.39, a single cycle of treatment costs $656.78 and a full year of treatment costs $7,881.36.
The clinical objectives modelled are life-years, QALYs, and the number and type of fractures. The reference perspective is the public health care perspective including LTC costs. The time horizon is a lifetime, with a maximum age of 100, and the annual discount rate is 1.5%.
Model Structure
The sponsor submitted a Markov-state transition cohort model with 7 health states (Figure 1, Appendix 3). The cycle length in the model is 6 months. All patients begin in the baseline health state, from which they can transition to “vertebral fracture,” “hip fracture,” or “other osteoporotic fracture” health states or death. Only patients in the “other osteoporotic fracture” health state can transition back to the baseline health state, but they can also transition to the vertebral or hip fracture health states and death. The model has a hierarchical structure based on the severity of fracture types, with hip fracture being the most severe, followed by vertebral facture. In the model, patients cannot return to a less severe health state. Patients in the vertebral fracture health state can transition to a post-vertebral fracture health state, to a hip fracture health state, or to death. Patients in the hip fracture health state can transition to a post–hip fracture health state or death. The sponsor’s chosen health states do not allow patients that have experienced a hip fracture to experience any further vertebral or other fractures. To resolve this, an adjustment was made to estimate the downstream fractures that are not captured in the Markov model. This was achieved by multiplying the number of patients in each higher hierarchy state by the incidence rate of the lower hierarchy fracture type in the model population.
Transitions to fracture health states are based on the treatment-specific risk of fractures applied to the fracture risk of the cohort. Transitions to death are based on general-population all-cause mortality for females in Canada and applying fracture- and age-specific relative risks of mortality. Relative risks of mortality are highest in the first year following a hip or vertebral fracture and are lower in the second and subsequent years. No additional mortality risk is associated with other osteoporotic fractures.
Model Inputs
The baseline cohort is a combination of 2 populations. The more severe population includes patients that have a previous fracture and multiple risk factors for fracture; the less severe population comprises those with multiple risk factors for fracture, but not necessarily a previous fracture, although some will also have had previous fractures. The prior-fracture population is based on the population in the ARCH trial.1 In the post-fracture population, 62.5% have multiple vertebral fractures, 33.9% have 1 vertebral fracture, and 3.6% have no vertebral fractures; the starting age is 74 years old and the T-score is −2.5 or lower. The multiple-risk-factor population is based on the FRAME trial.2 In this population, 4.4% have multiple vertebral fractures, 14.0% have 1 vertebral fracture, and 81.6% have no vertebral fractures; the starting age is 71 years old and the T-score is −2.5. To estimate the baseline cohort, it is assumed that 73.1% are high-risk patients with a prior fracture and 26.9% are patients with multiple risk factors.
To calculate the fracture risk for the cohort, the sponsor uses age-specific fracture rates for the Canadian general population and adjusts them to an untreated postmenopausal osteoporosis population. This adjustment is based on a meta-analysis that provides age-dependent relative risks of fracture by decline in the BMD and literature reporting a higher risk based on previous fractures. Baseline mortality is based on age-dependent mortality statistics from Statistics Canada. The relative risk of mortality from each type of fracture comes from a 2011 study of Canadian women. Mortality in the first year after a fracture is highest, with no subsequent risk of mortality after a non-hip, nonvertebral fracture. The relative risk of mortality from hip and vertebral fractures is assumed to continue for 8 years, but at a lower level. The sponsor assumes that 30% of the excess mortality in this study is attributable to the fracture, reducing the relative risks from the Canadian study by 70%.
To estimate fractures by treatment, effectiveness inputs for each comparator in the model from a 2019 network meta-analysis are applied to the population risk.3 Treatment effectiveness of romosozumab for the prior-fracture population is based on the relative effect compared to alendronate from the ARCH trial. Treatment effectiveness of romosozumab for the multiple-risk-factor population is also based on the ARCH trial; however, a lower fracture incidence, taken from the FRAME trial, is assumed. Dosing of romosozumab in the model is the same as in both the ARCH and FRAME trials. It is assumed that after 5 years of treatment, efficacy lasts for another 5 years and then declines linearly until there is no effect. This assumption is based on a clinical study in which mean BMD remained at or above pre-treatment levels after patients received 5 years alendronate treatment followed by 5 years of placebo.4
Estimates of age- and sex-specific HRQoL for the general Canadian population are taken from the 2013 to 2014 Canadian Community Health Survey. The HRQoL multipliers are applied to the general-population values for those who have experienced each type of fracture, accounting for whether it has been 1 year or more since the fracture. These multipliers are taken from the International Costs and Utilities Related to Osteoporotic Fractures Study.5 It is assumed a hip or vertebral fracture will always influence the patients’ quality of life, with effects lasting up to 29 years.
The sponsor included drug acquisition costs, treatment monitoring and administration costs, direct medical costs due to fractures, and LTC costs. A scenario analysis also considered some societal costs, including lost productivity costs and patient out-of-pocket costs. All costs are reported in 2020 Canadian dollars.
The sponsor provides the drug acquisition costs of romosozumab; for all other comparator treatments the lowest available unit price from the Ontario Drug Benefit Formulary is used. To administer drugs, the sponsor assumed that all patients have 1 physician visit a year and a BMD measurement every 2 years. It also assumed that 85% of patients on romosozumab would have 12 nurse visits a year and 15% would have 2 nurse visits before self-administering for the rest of the year. Although zoledronate is administered by IV drug infusion, this cost is not included in the model, as infusion costs are often borne by the drug manufacturer in Canada. Direct medical costs of fractures are assigned by type of fracture, age at fracture, and whether it is the first year after the fracture or a subsequent year. For first-year costs, the source is a 2010 study comparing pre- and post-fracture costs in Manitoba.6 For subsequent years after a hip or vertebral fracture, direct medical costs are sourced from Goeree et al.,7 which derives these cost estimates from Wiktorowicz et al.10 In addition, 37% of patients receive daily nursing home costs for the rest of their lives after a hip fracture. Daily nursing home costs are estimated to be $184.96, as reported by AdvantAge Ontario.8
Summary of Sponsor’s Economic Evaluation Results
All analyses were run probabilistically (5,000 iterations for the base case and scenario analyses). The deterministic and probabilistic results were similar. The probabilistic findings are presented below.
Base-Case Results
The sponsor’s economic evaluation reports that 12 months of romosozumab followed by 4 years of alendronate dominates all the other comparators, i.e., it is less costly and provides more QALYs, in the Health Canada–indicated population. Costs and QALYs are based on the number of fractures patients are calculated to have over their lifetime. In the reference-case analysis, patients on romosozumab followed by those on alendronate are expected to have 2.36 fractures (95% confidence interval [CI], 1.97 to 2.80) over their lifetime, compared to patients on other drugs, including alendronate (2.47; 95% CI, 2.07 to 2.94), denosumab (2.39; 95% CI, 2.00 to 2.83), raloxifene (2.59; 95% CI, 2.17 to 3.06), risedronate (2.49; 95% CI, 2.08 to 2.96), and zoledronate (2.41; 95% CI, 2.02 to 2.86). Patients on romosozumab followed by alendronate are expected to have the fewest hip and vertebral fractures, while patients on denosumab are expected to have the fewest other types of fractures.
At the end of the lifetime time horizon, which was capped when patients reached 100 years of age, 5% of the cohort was still alive.
Table 3: Summary of the Sponsor’s Economic Evaluation Results — Health Canada–Indication Population
Drug | Total costs ($) | Total QALYs | Sequential ICER ($ per QALY) |
|---|---|---|---|
Romosozumab followed by alendronate | 89,391 | 8.929 | |
Zoledronate | 89,839 | 8.874 | Dominated |
Alendronate | 89,980 | 8.838 | Dominated |
Denosumab | 90,930 | 8.890 | Dominated |
Risedronate | 93,669 | 8.816 | Dominated |
Raloxifene | 100,965 | 8.785 | Dominated |
ICER = incremental cost-effectiveness ratio; QALY = quality-adjusted life-year.
Note: Only romosozumab followed by alendronate is on the efficiency frontier; all comparator costs and QALYs are shown above. Results are based on the publicly available prices of the comparator treatments.
Source: Sponsor’s pharmacoeconomic submission (Table 35, page 78).9
The sponsor’s reimbursement-requested population comprises patients that have a prior fracture. This population is more severe than the Health Canada–indication population, which also includes patients who have multiple risk factors for fracture but do not necessarily have a prior fracture. Table 4 shows that these patients have higher costs and lower QALYs than the Health Canada–indication population; however, romosozumab followed by alendronate dominates all comparators in this population, i.e., it has lower costs and higher QALYs than each of the comparators.
Table 4: Summary of the Sponsor’s Economic Evaluation Results — Reimbursement-Requested Population
Drug | Total costs ($) | Total QALYs | Sequential ICER ($ per QALY) |
|---|---|---|---|
Romosozumab followed by alendronate | 97,073 | 8.431 | Reference |
Zoledronate | 98,548 | 8.368 | Dominated |
Alendronate | 98,923 | 8.324 | Dominated |
Denosumab | 99,443 | 8.386 | Dominated |
Risedronate | 103,120 | 8.298 | Dominated |
Raloxifene | 111,202 | 8.264 | Dominated |
ICER = incremental cost-effectiveness ratio; QALY = quality-adjusted life-year.
Note: Only romosozumab followed by alendronate is on the efficiency frontier; all comparator costs and QALYs are shown above. Results are based on the publicly available prices of the comparator treatments.
Source: Sponsor’s pharmacoeconomic submission (Table 49, page 104).9
Sensitivity and Scenario Analysis Results
Results were most sensitive to the efficacy of the comparators, the parametric models chosen for the extrapolation of romosozumab followed by alendronate, the daily costs of the nursing home, the proportion of patients admitted to a nursing home after a hip fracture, the duration of fracture reduction benefit for romosozumab followed by alendronate, and the time horizon of the model. Analyses of the time horizon demonstrates that romosozumab followed by alendronate has an ICER of greater than $71,000 per QALY at time horizons of 10 years or less. At the high end of the 95% CI for treatment efficacy, denosumab and zoledronate were the cost-effective options compared to romosozumab followed by alendronate. Lower nursing home costs and lower proportions of hip fracture patients going to nursing homes also decreased the net monetary benefit of romosozumab followed by alendronate compared to all other treatments.
CADTH Appraisal of the Sponsor’s Economic Evaluation
CADTH identified several key limitations to the sponsor’s analysis that have notable implications on the economic analysis:
Treatment efficacy extrapolation: Romosozumab is only given for 1 year, after which the patient will continue alendronate for an additional 4 years. For all other comparators in the model, the treatment duration is 5 years in total. The sponsor assumes that the relative treatment effect remains following the end of treatment or discontinuation, and benefits last for 5 years after discontinuation. This assumption is based on a clinical study in which patients received 5 years of alendronate treatment followed by 5 years of placebo. In the group that received 5 years of alendronate followed by 5 years of placebo, BMD measurements remained at or above post–alendronate discontinuation levels. However, this study also found that switching to placebo for 5 years resulted in declines in BMD at the total hip (−2.4%; 95% CI, −2.9 to −1.8; P < 0.001) and spine (−3.7%; 95% CI, −4.5 to −3.0; P < 0.001).4 They also found a significantly higher risk of clinical vertebral fractures among those randomized to placebo versus those who continued alendronate after 5 years. The authors conclude that “discontinuation of alendronate for up to 5 years does not appear to significantly increase fracture risks. However, women at very high risk of clinical vertebral fractures may benefit by continuing beyond 5 years.” Given the target population for the analysis is patients at high risk of fracture, it is not clear whether the results of the study would be applicable. While this study compares 5 years of alendronate to 10 years of alendronate, there is no evidence on the long-term relative effect of alendronate or romosozumab post-discontinuation compared to the other treatments in the model. Of greater relevance to the economic model is whether the continued benefit post-discontinuation is higher for some therapies relative to others; this is unknown. In a scenario analysis, the sponsor tests of the fracture reduction benefits of romosozumab followed by alendronate versus alendronate alone are limited to 4 years for hip and other fractures, and 2 years for vertebral fractures, in line with the time period observed in the ARCH trial. In this analysis the sponsor found that romosozumab followed by alendronate was dominated by zoledronate and denosumab, i.e., romosozumab followed by alendronate had higher costs and fewer QALYs. The cost-effectiveness of romosozumab is therefore strongly affected by whether there are continued health gains beyond what was seen in the trial. Finally, due to the shorter duration of the FRAME trial, the sponsor assumes the ARCH trial results can be applied to a population with no prior fractures. This assumption is used to derive results for the full Health Canada indication, which is made up of high-risk individuals with and without prior fractures. The ARCH trial represents a much more severe population in comparison to the full Health Canada indication. This makes the results for the full Health Canada indication highly uncertain.
After 5 years CADTH assumed no additional treatment benefit for romosozumab over other treatments. This still assumes continued treatment benefit beyond what was seen in the trial (2 years for vertebral fracture and 4 years for hip fracture).
As a scenario analysis, CADTH assumed that the relative treatment effect across therapies remains 5 years after treatment discontinuation.
As a further scenario analysis, CADTH also used the FRAME efficacy results for the population with multiple risk fractures, assuming they remained constant for 5 years.
Uncertainty related to the indirect comparison: Direct evidence for the treatment effect of romosozumab followed by alendronate comes from the ARCH and FRAME trials. In these trials the respective comparators are alendronate and placebo followed by denosumab. Comparative evidence for romosozumab versus zoledronate, risedronate, and raloxifene therefore comes exclusively from indirect evidence. The CADTH clinical reviews notes that results of this indirect comparison are associated with a substantial risk of bias due to limitations, such as extensive heterogeneity, that have not been adequately accounted for. Likewise, the outcomes from the network meta-analysis are applied equally to the analysis that focuses on the reimbursement request and to the analysis that focuses on the full Health Canada indication. This assumes that the treatment benefit is not affected by patient severity.
CADTH notes that the indirect evidence used by the sponsor is the best available evidence to inform comparative efficacy estimates for zoledronate, risedronate, and raloxifene. However, given the limitations associated with this indirect comparison, conclusions on the cost-effectiveness of romosozumab relative to comparators for which there is no direct evidence are limited.
Cost of LTC: After a hip fracture the sponsor assumes 37% of patients require LTC at a cost of $184.96 per day or more than $67,000 per year. However, the cost of LTC is already incorporated into the post-fracture costs from Goeree et al. (2006).7 Hip fracture costs in Goeree et al. were derived from a study by Wiktorowicz et al. (2001), which notes: “Health care resources assessed included initial hospitalization, rehospitalization, rehabilitation, chronic care, home care, long-term care (LTC) and informal care.”10 Therefore, adding LTC costs separately double-counts LTC costs. This artificially inflates the cost savings associated with preventing a hip fracture.
The sponsor also assumed that post-fracture costs, as reported by Goeree et al., 7 will last for the remainder of the patient’s life. A large portion of this cost is likely made up of LTC costs. In the sponsor’s model only patients who experience a hip fracture can accumulate the costs associated with LTC, i.e., there is no baseline probability of transferring to LTC care. However, as patients age they are more likely to transfer to LTC for reasons other than hip fracture. According to Statistics Canada, 7.1% of all seniors aged 65 and older live in collective dwellings, such as nursing homes, chronic LTC hospitals, and residences for senior citizens, and 29.6% of seniors aged 85 and older live in special-care facilities.11 As time goes on and more patients who have not had hip fractures move to LTC and everyone starts to receive a similar level of care, the incremental cost associated with a past hip fracture decreases.
As LTC costs have already been captured in the post-fracture costs, CADTH removed additional LTC costs included by the sponsor to avoid double-counting.
Mortality increases due to hip fracture: In the sponsor’s model, patients who experience a hip or vertebral fracture have an increased risk of death for the rest of their life, while patients who experience any other type of fracture have an increased risk of mortality for 1 year. The relative risks of mortality for each fracture type are taken from a study by Morin et al. (2011). As the sponsor notes, “Due to the relative frailty of osteoporotic patients, not all excess mortality following an osteoporotic fracture (compared with mortality in the general population) can be directly related to the fracture event. Therefore, in line with previous analyses, the assumption was made that 30% of excess mortality after hip, vertebral, and other fractures was caused by the event.” The CADTH clinical expert suggested that mortality effects after a hip fracture may last for 1 year due to lack of mobility. Data from the ARCH and FRAME trials do not support a difference in mortality. In the FRAME study, 0.8% of patients on the romosozumab arm had died after 12 months, compared to 0.6% of patients on the placebo arm. After 24 months 1.5% of patients on the romosozumab arm had died, compared to 1.3% on the placebo arm. In the ARCH study, 1.5% of patients on the romosozumab arm had died at 12 months, compared to 1.0% on the alendronate-alone arm. During the primary analysis period, 4.4% of patients on the romosozumab arm died, compared to 4.5% on the alendronate-alone arm.
In line with clinical expert opinion, CADTH modelled excess mortality for hip fractures only for 1 year post-fracture.
Long-term consequences of fractures on quality of life: The sponsor assumed a hip or vertebral fracture will influence patients’ quality of life, with effects lasting up to 29 years. The HRQoL values used in the model come from an international study that measured patients’ HRQoL for up to 18 months. In this study, patient’s HRQoL increased after the initial decrement due to the fracture. At 18 months patients’ HRQoL was back up to 85% of their pre-fracture HRQoL after a hip fracture, to 85% after a vertebral fracture, and to 99% after a distal forearm fracture. Despite the trend of continued improvement, the sponsor assumes that patients will no longer improve after 18 months. No evidence was found to support this assumption. Assuming patients will remain at a lower HRQoL for the rest of their lives benefits the treatment with the lowest probability of hip and vertebral fractures, which in this case is romosozumab followed by alendronate. Further exploration of increasing the HRQoL of patients with hip or vertebral fractures after 2 years should be explored.
CADTH was unable to incorporate a time-varying utility impact as time from the fracture increased. To account for this, CADTH assumed that, after 1 year post-fracture, a patient’s utility would only be 5% less than what they experienced pre-fracture for the remainder of their life. Ideally the patient’s utility would decrease by 15% after 1 year as per Svedbom et al., and improve over time. However, the model did not allow this functionality.
Administration costs of romosozumab: The sponsor assumes that 85% of patients would have romosozumab administered by a nurse each month and that 15% of patients would have 2 nurse visits to learn how to self-administer romosozumab. The CADTH clinical expert suggested that many physicians will administer romosozumab themselves, as they currently do with denosumab, and expected less than 10% of patients to self-administer romosozumab.
CADTH assumed that 10% of patients would self-administer romosozumab, 45% would have it administered by a nurse, and 45% by a physician.
Deriving cost-effectiveness in the full Health Canada population: Two distinct patient populations constitute the Health Canada indication. The ARCH trial represents patients who have had a prior fracture and are deemed to be at very high risk of a future fracture. This represents a subset of the full Health Canada indication, which also includes patients with a prior fracture that was not hip or vertebral, as well as patients with no prior fracture but with multiple risk factors for a future fracture. This population is better represented by the FRAME trial, in which any history of hip fracture or a severe vertebral fracture or 2 or more moderate vertebral fractures were exclusion criteria. Combined, the FRAME and ARCH trials cover the full Health Canada indication. To derive results for the reimbursement request, the sponsor ran the analysis using outputs from the ARCH trial. For the remainder of the Health Canada population the sponsor ran the analysis using fracture incidence rates from the FRAME trial. To derive results for the full Health Canada indication, the sponsor weighted the results, assuming 75% of patients in the Health Canada indication would fit the ARCH trial criteria and 25% would fit the FRAME trial criteria. However, to derive these values the sponsor made some inappropriate assumptions. First, it assumed that risk factors for future fracture were independent. The clinical expert consulted by CADTH noted that there is typically considerable overlap among risk factors. Second, the sponsor assumed that the reimbursement request represents patients with any prior fracture. This is not true, as the reimbursement request states patients must be at very high risk of a future fracture and the ARCH trial required a prior vertebral or hip fracture for trial entry. Finally, the sponsor used different values when assessing the budget impact. In the cost-utility analysis the sponsor assumed 75% of the Health Canada indication would also meet the reimbursement-request criteria. However, in the budget impact analysis (BIA) it assumed that only 15% of the reimbursement-requested population would make up the Health Canada indication. As results are more favourable in the reimbursement-requested population, the higher the proportion they make up of the Health Canada indication the better the cost-effectiveness of romosozumab.
In discussions with the clinical expert, CADTH derived more plausible weights. CADTH assumed that 10.1% of patients would have multiple risk factors without any prior fracture, 11.3% of patients would have had any prior fracture, and 1.6% would have had a prior fracture and be deemed to be at very high risk of a future fracture. The proportion of patients who had multiple risk factors and no prior fracture (10.1%) was taken from Leslie et al. (2011).12 In this study, they found 10.1% of patients were deemed to be at high risk with no prior fracture. Therefore, multiple risk factors with no prior fracture were needed for a patient to be deemed to be at high risk. The figure of 11.3% of patients with a prior fracture was taken from the same source as the sponsor (Fraser et al. [2011]). This covers all fragility fractures. The 1.6% estimate of patients with a prior hip or spinal fracture was taken from Leslie et al. (2011). Finally, CADTH assumes 66% of those with a prior hip or vertebral fracture have a T-score of less than or equal to −2.5. In the full Health Canada population, this proportion is assumed to be 57.2%. These values were taken from the sponsors BIA. Taking this into account, CADTH derived the following:
the proportion of women over 50 who meet the Health Canada indication = (10.1% + 11.3%) × 57.2% = 12.2%
the proportion of women over 50 who meet the reimbursement-request population = 1.6% × 66% = 1.1%
therefore, 9% (1.1 of 12.2) of patients in the full Health Canada indication match the reimbursement request (prior fracture and very high risk) and the remainder match the FRAME trial (multiple risk factors).
Additionally, the following key assumptions were made by the sponsor and have been appraised by CADTH (Table 5).
Table 5: Key Assumptions of the Submitted Economic Evaluation (Not Noted as Limitations to the Submission)
Sponsor’s key assumption | CADTH comment |
|---|---|
Adverse event and serious adverse event rates were considered to be the same between groups. | Meta-analysis of FRAME and ARCH study data showed that the hazard ratios (for romosozumab vs. control) for time to first major adverse cardiac event (defined as myocardial infarction, stroke or cardiovascular death), were 1.39 (95% CI, 0.97 to 2.00) for the 12-month double-blind treatment period and 1.13 (95% CI, 0.93 to 1.38) for the overall study period. Although the results were not statistically significant at P = 0.05, the conservative approach would have been to incorporate this in the probabilistic analysis. |
Multiple health-related quality-of-life decrements are multiplicative rather than additive. | This is considered an acceptable assumption within the context of this review. |
Treatment effects of comparators are the same for both the prior fracture population and the high-risk population. | As with romosozumab, it is expected that the comparators would be most effective in the prior fracture risk population. |
The overlap in the prior fracture population and the high-risk population will not affect the combined decision. | Ideally, each patient group should be considered separately with no overlap to derive results for the full Health Canada–indication population. |
Patients are fully persistent with therapy in all treatment arms over the 5-year treatment period. | This is considered an acceptable assumption. |
CI = confidence interval.
CADTH Reanalyses of the Economic Evaluation
Base-Case Results
The CADTH base case was derived by making changes in model parameter values and assumptions, in consultation with clinical experts.
Table 6: CADTH Revisions to the Submitted Economic Evaluation
Stepped analysis | Sponsor’s value or assumption | CADTH value or assumption |
|---|---|---|
Correctionsa to sponsor’s base case | ||
None were identified | None were identified | None were identified |
Changes to derive the CADTH base case | ||
1. Treatment efficacy extrapolation | Treatment effects last for 5 years after discontinuation | Treatment effects last for 0 years after discontinuation |
2. Cost of long-term care | $184.96 per day | $0 per day (as costs are already included in the direct medical costs) |
3. Mortality increases due to hip fracture | 30% of relative risks on mortality after a fracture are attributable to the fracture and last for 8 years | Excess mortality is only attributable to hip fracture for 1 year post-fracture |
4. Long-term consequences of fracture on quality of life | Health-related quality-of-life decrements measured at 18 months persist for hip and vertebral fracture patients for the rest of their life | Health-related quality-of-life decrements after 1 year are increased to 0.95 |
5. Administration costs | 85% of patients are administered romosozumab by a nurse and 15% self-administer | 45% of patients are given romosozumab by a physician, 45% receive it from a nurse, and 10% self-administer |
6. Cost-effectiveness in the Health Canada population | Assumed 75% of the full Health Canada indication matched the ARCH trial and 25% matched the FRAME trial | Assumed 9% of the full Health Canada indication matched the ARCH trial and 91% matched the FRAME trial |
CADTH base case | Reanalyses 1, 2, 3, 4, 5, and 6 are used to calculate the CADTH base case | |
aCorrections are minor errors (e.g., transcription errors between report and model, misapplication of distributions, or standard errors in probabilistic analyses) that are not identified as limitations.
In the Health Canada–indicated population, the CADTH base case resulted in alendronate being the least expensive and least effective option, with a 64% probability of being cost-effective at a threshold of $50,000 per QALY; zoledronate had an ICER of $137,366 per QALY compared to alendronate, with a 19% probability of being cost-effective at a threshold of $50,000 per QALY; and romosozumab followed by alendronate had an ICER of $561,229 per QALY compared to zoledronate, with a 0% probability of being cost-effective at a threshold of $50,000 per QALY. All other treatments were dominated. The model predicts that, relative to alendronate alone, romosozumab followed by alendronate will result in approximately 11 fewer hip fractures, 16 fewer vertebral fractures, and 15 fewer other fractures per 1,000 patients treated. This translates into absolute risk reductions of 1.1%, 1.6%, and 1.5%, respectively.
Table 7: Summary of the CADTH Base Case — Health Canada Population
Drug | Total costsa | Total QALYs | ICER vs. romosozumab followed by alendronate | Sequential ICERb |
|---|---|---|---|---|
Alendronate | $31,458 | 10.231 | $415,769 | Reference |
Zoledronate | $32,263 | 10.237 | $561,229 | $137,366 |
Romosozumab followed by alendronate | $38,558 | 10.248 | Reference | $561,229 |
Treatments that are dominated or extendedly dominated | ||||
Risedronate | $31,796 | 10.227 | $317,683 | Dominated |
Raloxifene | $33,822 | 10.218 | $155,938 | Dominated |
Denosumab | $34,422 | 10.240 | $470,512 | Extendedly dominated |
ICER = incremental cost-effectiveness ratio; QALY = quality-adjusted life-years.
aReanalysis is based on publicly available prices of the comparator treatments
bReference product is least costly alternative; drug name should be stated.
In the reimbursement-requested population, the CADTH base case resulted in alendronate being the least expensive and least effective option, with a 37% probability of being cost-effective at a threshold of $50,000 per QALY; zoledronate had an ICER of $25,479 per QALY compared to alendronate, with a 50% probability of being cost-effective at a threshold of $50,000 per QALY; and romosozumab followed by alendronate had an ICER of $219,799 per QALY compared to zoledronate, with a 0% probability of being cost-effective at a threshold of $50,000 per QALY. All other treatments were dominated. The model predicts that, relative to alendronate alone, romosozumab followed by alendronate will result in 23 fewer hip fractures, 55 fewer vertebral fractures and 37 fewer other fractures per 1,000 patients treated. This translates into absolute risk reductions of 2.3%, 5.5%, and 3.7%, respectively.
Table 8: Summary of the CADTH Base Case — Reimbursement-Requested Population
Drug | Total costsa | Total QALYs | ICER vs. romosozumab followed by alendronate | Sequential ICERb |
|---|---|---|---|---|
Alendronate | $51,370 | 8.563 | $146,723 | Reference |
Zoledronate | $51,749 | 8.578 | $219,799 | $25,479 |
Romosozumab followed by alendronate | $57,169 | 8.603 | Reference | $219,799 |
Treatments that are dominated or extendedly dominated | ||||
Denosumab | $53,685 | 8.584 | $187,631 | Extendedly dominated |
Risedronate | $52,079 | 8.554 | $103,923 | Dominated |
Raloxifene | $54,656 | 8.538 | $38,685 | Dominated |
ICER = incremental cost-effectiveness ratio; QALY = quality-adjusted life-years.
aReanalysis is based on publicly available prices of the comparator treatments.
bReference product is least costly alternative – drug name should be stated.
Scenario Analysis Results
In the full Health Canada population, the CADTH reanalysis investigating price reductions found that romosozumab followed by alendronate is cost-effective at a threshold of $50,000 per QALY, with a price reduction of 80% (Table 10).
In the reimbursement-requested population, i.e., those with prior fracture, romosozumab followed by alendronate is cost-effective at a threshold of $50,000 per QALY, with a price reduction of 53%.
Table 9: CADTH Price Reduction Analyses
Price reduction | ICERs for romosozumab followed by alendronate vs. alendronate, zoledronate, risedronate denosumab, and raloxifene | ||
|---|---|---|---|
Sponsor base case – Health Canada and reimbursement population | CADTH reanalysis – Health Canada population | CADTH reanalysis – reimbursement population | |
None | Dominates | $561,229 (vs. zoledronate) | $219,799 (vs. zoledronate) |
10% | Dominates | $491,000 (vs. zoledronate) | $187,210 (vs. zoledronate) |
20% | Dominates | $421,400 (vs. zoledronate) | $156,789 (vs. zoledronate) |
30% | Dominates | $351,321 (vs. zoledronate) | $124,451 (vs. zoledronate) |
40% | Dominates | $281,296 (vs. zoledronate) | $92,124 (vs. zoledronate) |
50% | Dominates | $211,300 (vs. zoledronate) | $61,234 (vs. zoledronate) |
60% | Dominates | $141,420 (vs. zoledronate) | $28,789 (vs. alendronate) |
70% | Dominates | $71,321 (vs. zoledronate) | $9,235 (vs. alendronate) |
80% | Dominates | $50,012 (vs. alendronate) | Dominant (relative to all comparators) |
ICER = incremental cost-effectiveness ratio; vs. = versus.
Note: Comparator is based on the sequential analysis. Bold indicates where the ICER falls to approximately $50,000 per QALY.
Issues for Consideration
The patent for denosumab expires in 2022. This would reduce the cost of this comparator within the analysis and could therefore influence the cost-effectiveness of romosozumab.
Unlike some alternatives, romosozumab may require monthly visits to receive an injection. This may be difficult for some patients in remote areas.
Overall Conclusions
Evidence from the ARCH and FRAME trial suggest that use of romosozumab followed by either alendronate or denosumab results in fewer fractures than alendronate alone or placebo in patients with a prior fracture or patients at F of fracture. The ARCH trial alone only represents patients covered under the sponsor’s reimbursement request. Combined, the FRAME and ARCH trials represent all patients covered under the Health Canada indication. Results from an indirect comparison suggest that romosozumab therapy may have a beneficial effect in reducing the risk of sustaining nonvertebral fractures, compared to all current treatments; however, results of this indirect comparison were associated with a substantial risk of bias.
To better reflect current evidence, CADTH undertook a reanalysis that restricted the treatment efficacy to 5 years, eliminated double-counting of the costs of LTC, limited the mortality effects of hip fractures to 1 year, reduced the long-term utility impact of a fracture, accounted for physician costs of administering romosozumab, and updated the proportion of patients who have multiple risk factors with no prior hip or vertebral fracture history.
For the full Health Canada indication, the CADTH base case resulted in a sequential ICER of $561,229 per QALY for romosozumab followed by alendronate. There was a 0% probability of romosozumab being cost-effective at a threshold of $50,000 per QALY in the Health Canada–indicated population. An 80% price reduction would be required to achieve cost-effectiveness at a threshold of $50,000 per QALY. However, this analysis assumes efficacy data from the ARCH trial apply equally to the entire Health Canada population, making the results highly uncertain. A scenario analysis that used relative effects from the FRAME trial, assuming the relative treatment effect would not improve beyond this point as it did in the ARCH trial, found the ICER increased to $1,875,332 per QALY. Therefore, an 80% price reduction may be highly conservative. In the reimbursement-requested population, the sequential ICER was $219,799 per QALY for romosozumab followed by alendronate, with a 0% probability of being cost-effective at a threshold of $50,000 per QALY. A 53% reduction in price would be needed for romosozumab to be cost-effective in the reimbursement-requested population. The reason cost-effectiveness of romosozumab is lower in the full Health Canada indication, relative to the reimbursement request, is the lower incidence of fractures in the full population. A lower incidence of fractures leads to a smaller absolute reduction in hip and vertebral fractures. Because both analyses used outcomes from the indirect comparison, which was associated with a high degree of bias, the cost-effectiveness of romosozumab relative to comparators for which there is no direct evidence is highly uncertain.
The results of the cost-effectiveness analysis are driven by the effectiveness of treatments on the likelihood of a hip or vertebral fracture and the long-term consequences of such fractures. The most consequential long-term impacts of fractures on cost-effectiveness in the model are the effect on the patients’ HRQoL, the increased mortality, and the likelihood of transitioning to LTC. There was no direct evidence on the effect of romosozumab on these long-term consequences.
The main area of outstanding uncertainty in the analysis is the long-term relative effectiveness of romosozumab followed by alendronate compared to all other available options. There are no data beyond 2 years for vertebral fractures and 4 years for hip fractures in a very high-risk population. There is even less evidence for relative effectiveness in patients who have not had a prior fracture. If the benefit of romosozumab is sustained for 10 years relative to other treatments, then the cost-effectiveness is improved. Conversely, if effectiveness in patients who have not had a prior hip or vertebral fracture is less than what was seen in the ARCH trial, then cost-effectiveness in the full Health Canada population decreases.
References
1.Saag KG, Petersen J, Brandi ML, et al. Romosozumab or alendronate for fracture prevention in women with osteoporosis. N Engl J Med. 2017;377(15):1417-1427. PubMed
2.Cosman F, Crittenden DB, Adachi JD, et al. Romosozumab treatment in postmenopausal women with osteoporosis. N Engl J Med. 2016;375(16):1532-1543. PubMed
3.Barrionuevo P, Kapoor E, Asi N, et al. Efficacy of pharmacological therapies for the prevention of fractures in postmenopausal women: a network meta-analysis. J Clin Endocrinol Metab. 2019;104(5):1623-1630. PubMed
4.Black DM, Schwartz AV, Ensrud KE, et al. Effects of continuing or stopping alendronate after 5 years of treatment: the Fracture Intervention Trial Long-term Extension (FLEX): a randomized trial. JAMA. 2006;296(24):2927-2938. PubMed
5.Svedbom A, Hadji P, Hernlund E, et al. Cost-effectiveness of pharmacological fracture prevention for osteoporosis as prescribed in clinical practice in France, Germany, Italy, Spain, and the United Kingdom. Osteoporos Int. 2019;30(9):1745-1754. PubMed
6.Metge CJ, Azimee M, Lix L, Morin S, Caetano P, Leslie WD. Using cost-of-illness analysis to describe the direct burden of fracture: estimates of potential savings from prevention. Can J Clin Pharmacol. 2010;17:e90-e127.
7.Goeree R, Blackhouse G, Adachi J. Cost-effectiveness of alternative treatments for women with osteoporosis in Canada. Curr Med Res Opin. 2006;22(7):1425-1436. PubMed
8.AdvantAge Ontario. About long term care homes 2020; http://www.advantageontario.ca/AAO/Content/Resources/Consumers/About_Long_Term_Care.aspx?WebsiteKey=00bad89a-d342-4c6e-bc0c-b4b493c5462c. Accessed 2020 Nov 11.
9.Pharmacoeconomic evaluation [internal sponsor's report]. In: Drug Reimbursement Review sponsor submission: Evenity (romosozumab), 105 mg/1.17 mL solution for subcutaneous injection with single-use prefilled syringe. Mississauga (ON): Amgen Canada Inc.; 2021 Feb 25.
10.Wiktorowicz ME, Goeree R, Papaioannou A, Adachi JD, Papadimitropoulos E. Economic implications of hip fracture: health service use, institutional care and cost in Canada. Osteoporos Int. 2001;12(4):271-278. PubMed
11.Living arrangements of seniors: families, households and marital status, structural type of dwelling and collectives, 2011 Census of Population. (Census in brief). Ottawa (ON): Statistics Canada; 2018: https://www12.statcan.gc.ca/census-recensement/2011/as-sa/98-312-x/98-312-x2011003_4-eng.cfm. Accessed 2021 Aug 31.
12.Leslie WD, Lix LM, Langsetmo L, et al. Construction of a FRAX® model for the assessment of fracture probability in Canada and implications for treatment. Osteoporos Int. 2011;22(3):817-827. PubMed
13.DeltaPA. Ottawa (ON): IQVIA; 2021: https://www.iqvia.com/. Accessed 2021 Aug 31.
14.B.C. Government. BC PharmaCare formulary search. 2021; https://pharmacareformularysearch.gov.bc.ca. Accessed 2021 Aug 31.
15.Government of Alberta. Interactive drug benefit list. 2021; https://idbl.ab.bluecross.ca/idbl/load.do. Accessed 2021 Aug 31.
16.Evenity (romosozumab): 105 mg/1.17 mL solution for subcutaneous injection with single-use prefilled syringe [product monograph]. Mississauga (ON): Amgen Canada Inc.; 2019 Jun 17.
17.Drug Reimbursement Review sponsor submission: Evenity (romosozumab), 105 mg/1.17 mL solution for subcutaneous injection with single-use prefilled syringe [internal sponsor's package]. Mississauga (ON): Amgen Canada Inc.; 2021 Feb 25.
18.Budget Impact Analysis [internal sponsor's report]. In: Drug Reimbursement Review sponsor submission: Evenity (romosozumab), 105 mg/1.17 mL solution for subcutaneous injection with single-use prefilled syringe. Mississauga (ON): Amgen Canada Inc.; 2021 Feb 25.
19.Fraser LA, Langsetmo L, Berger C, et al. Fracture prediction and calibration of a Canadian FRAX® tool: a population-based report from CaMos. Osteoporos Int. 2011;22(3):829-837. PubMed
20.Sutherland G, Dinh T. Understanding the gap: a pan-Canadian analysis of prescription drug insurance coverage. Ottawa (ON): Conference Board of Canada; 2017: http://innovativemedicines.ca/wp-content/uploads/2017/12/20170712-understanding-the-gap.pdf. Accessed 2021 Aug 31.
21.Langdahl BL, Libanati C, Crittenden DB, et al. Romosozumab (sclerostin monoclonal antibody) versus teriparatide in postmenopausal women with osteoporosis transitioning from oral bisphosphonate therapy: a randomised, open-label, phase 3 trial. Lancet. 2017;390(10102):1585-1594. PubMed
Appendix 1: Cost Comparison Table
Note that this appendix has not been copy-edited.
The comparators presented in the following table have been deemed to be appropriate based on feedback from clinical expert(s) and drug plans. Comparators may be recommended (appropriate) practice or actual practice. Existing product listing agreements are not reflected in the table and as such, the table may not represent the actual costs to public drug plans.
Table 10: CADTH Cost Comparison Table for the Treatment of Osteoporosis
Treatment | Strength | Form | Price | Recommended dosage | Daily cost ($) | Annual cost ($) |
|---|---|---|---|---|---|---|
Romosozumab (Evenity) | 105 mg/1.17 mL | Single-use pre-filled syringe 1.17 mL | 328.3900a | 210 mg, every month | 21.59 | 7,881 |
RANK ligand inhibitor | ||||||
Denosumab (Prolia) | 60 mg/mL | Single-use pre-filled syringe 1 mL | 395.7800 | 60 mg, every 6 months | 2.17 | 792 |
Bisphosphonates | ||||||
Alendronate (Fosamax, generics) | 10 mg 70 mg | Tablet | 0.4987 2.1014 | 10 mg daily or 70 mg weekly | 0.30 | 109 |
Alendronate /cholecalciferol (Fosavance, generics) | 70 mg/70 mcg 70 mg/140 mcg | Tablet | 2.4348 1.2174 | 70 mg weekly | 0.17 | 63 |
Risedronate (Actonel, generics) | 35 mg 150 mg | Tablet | 1.9787 11.1875 | 35 mg weekly | 0.28 | 103 |
Risedronate (Actonel) | 35 mg | Delayed release tablet | 11.8653 | 35 mg weekly | 1.69 | 617 |
Zoledronic acid (Aclasta, generics) | 5 mg/100 mL | IV infusion 100 mL | 335.4000 | 5 mg annually | 0.92 | 335 |
Parathyroid hormone analogue | ||||||
Teriparatide (Forteo, generic) | 250 mcg/mL | Pre-filled pen 3 mL (37.5 doses) 2.4 mL (30 doses) | 800.7934b | 20 mcg dailyc | 28.60 | 10,439 |
Selective estrogen receptor modulator | ||||||
Raloxifene HCl (Evista, generics) | 60 mg | Tablet | 1.0268 | 60 mg daily | 1.03 | 375 |
Note: All prices are from the Ontario Drug Benefit Formulary (accessed June 2021), unless otherwise indicated, and do not include dispensing fees.
aSponsor’s submitted price: 1 package contains 2 syringes (i.e., 210 mg) — $656.7800.
bPrice from Delta PA accessed March 2021.13
cOne pen lasts for 28 days.
Table 11: CADTH Cost Comparison Table for Osteoporosis (Off-Label Comparators)
Treatment | Strength | Form | Price | Recommended dosage | Daily cost ($) | Annual cost ($) |
|---|---|---|---|---|---|---|
Bisphosphonates | ||||||
Etidronate (Didronel, generics) | 200 mg | Tablet | 0.8918a | 400 mg for 14 days every 3 monthsb | 0.27 | 100 |
Pamidronate (Aredia, generics) | 3 mg/mL 6 mg/mL 9 mg/mL | IV infusion 10 mL | 3.0317c 9.0366c 9.0953c | 30 or 60 mg every 3 monthsb | 0.33 to 0.66 | 121 to 243 |
Note: All prices are from the Ontario Drug Benefit Formulary (accessed June 2021), unless otherwise indicated, and do not include dispensing fees.
aPrice from the British Columbia PharmaCare Formulary (accessed March 15, 2021).14
bBased on feedback from the clinical expert consulted by CADTH for this review.
cPrice from the Alberta Drug Benefit List (accessed March 15, 2021).14,15
Appendix 2: Submission Quality
Note that this appendix has not been copy-edited.
Description | Yes/No | Comments |
|---|---|---|
Population is relevant, with no critical intervention missing, and no relevant outcome missing | Yes | None |
Model has been adequately programmed and has sufficient face validity | Yes | None |
Model structure is adequate for decision problem | Yes | None |
Data incorporation into the model has been done adequately (e.g., parameters for probabilistic analysis) | No | The addition of long-term care costs resulted in double-counting. |
Parameter and structural uncertainty were adequately assessed; analyses were adequate to inform the decision problem | Yes | None |
The submission was well organized and complete; the information was easy to locate (clear and transparent reporting; technical documentation available in enough details) | Yes | None |
Appendix 3: Additional Information on the Submitted Economic Evaluation
Note that this appendix has not been copy-edited.
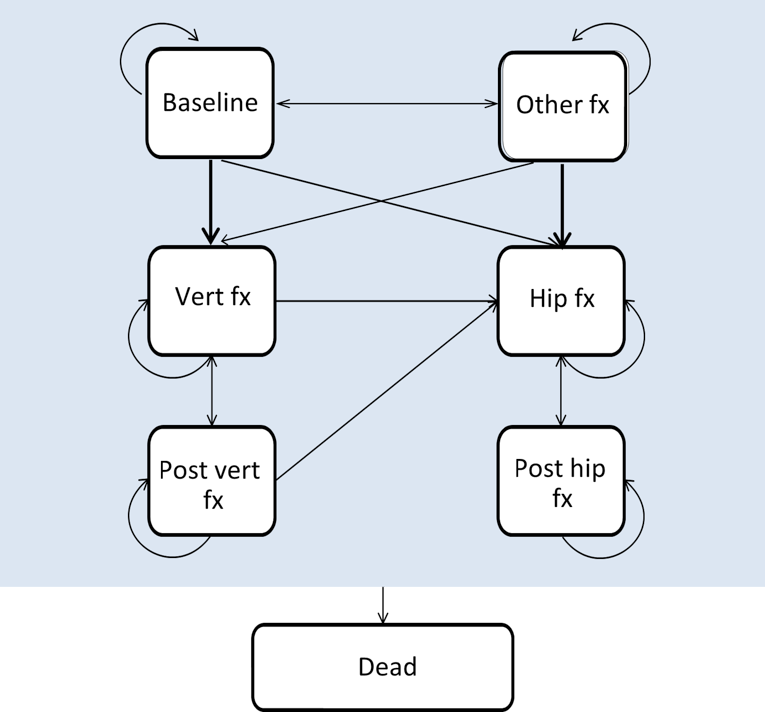
Detailed Results of the Sponsor’s Base Case
Table 13: Disaggregated Summary of Sponsor’s Economic Evaluation Results for the Reimbursement-Request Population
Parameter | Romosozumab/alendronate | Alendronate | Denosumab | Raloxifene | Risedronate | Zoledronate |
|---|---|---|---|---|---|---|
Number of fractures | ||||||
No. hip fractures | 557 | 596 | 589 | 646 | 616 | 594 |
No. vertebral fractures | 784 | 872 | 815 | 896 | 889 | 831 |
No. other fractures | 1,341 | 1,362 | 1,325 | 1,420 | 1,351 | 1,328 |
Discounted life-years | ||||||
Total LYs | 12.649 | 12.631 | 12.643 | 12.620 | 12.627 | 12.640 |
Discounted quality-adjusted life-years | ||||||
Discounted quality-adjusted life-years | 8.431 | 8.324 | 8.386 | 8.264 | 8.298 | 8.368 |
Discounted costs | ||||||
Total | $97,073 | $98,923 | $99,443 | $111,202 | $103,120 | $98,548 |
Hip | $81,575 | $91,561 | $89,651 | $103,913 | $96,453 | $90,979 |
Vertebral | $14,599 | $16,135 | $15,013 | $16,250 | $16,329 | $15,304 |
Other fracture | $14,103 | $13,787 | $13,671 | $14,102 | $13,603 | $13,633 |
Monitoring and administration | $758 | $567 | $741 | $567 | $567 | $567 |
Drug | $8,259 | $521 | $3,778 | $1,788 | $491 | $1,601 |
Table 14: Disaggregated Summary of Sponsor’s Economic Evaluation Results for Full Health Canada Indication
Parameter | Romosozumab/alendronate | Alendronate | Denosumab | Raloxifene | Risedronate | Zoledronate |
|---|---|---|---|---|---|---|
Number of fractures | ||||||
No. hip fractures | 504 | 537 | 531 | 580 | 554 | 535 |
No. vertebral fractures | 636 | 706 | 660 | 724 | 719 | 673 |
No. other fractures | 1,215 | 1,230 | 1,199 | 1,281 | 1,220 | 1,201 |
Discounted life-years | ||||||
Total life-years | 13.130 | 13.114 | 13.125 | 13.104 | 13.111 | 13.122 |
Discounted quality-adjusted life-years | ||||||
8.929 | 8.838 | 8.890 | 8.785 | 8.816 | 8.874 | |
Discounted costs | ||||||
Total | $89,391 | $89,980 | $90,930 | $100,965 | $93,669 | $89,839 |
Hip | $76,503 | $85,343 | $83,646 | $96,310 | $89,678 | $84,820 |
Vertebral | $11,944 | $13,167 | $12,273 | $13,258 | $13,321 | $12,505 |
Other fracture | $12,905 | $12,646 | $12,546 | $12,916 | $12,488 | $12,514 |
Monitoring/ Administration | $760 | $569 | $744 | $569 | $569 | $569 |
Drug | $8,263 | $523 | $3,791 | $1,794 | $493 | $1,606 |
Appendix 4: Additional Details on the CADTH Reanalyses and Sensitivity Analyses of the Economic Evaluation
Note that this appendix has not been copy-edited.
Table 15: Disaggregated Summary of CADTH’s Economic Evaluation Results for Full Health Canada Indication
Parameter | Romosozumab/ alendronate | Alendronate | Denosumab | Raloxifene | Risedronate | Zoledronate |
|---|---|---|---|---|---|---|
Number of fractures | ||||||
Number of hip fractures | 398 | 409 | 407 | 423 | 415 | 409 |
Number of vertebral fractures | 304 | 319 | 309 | 323 | 322 | 312 |
Number of other fractures | 922 | 937 | 926 | 957 | 932 | 927 |
Discounted life-years | ||||||
Total life-years | 14.312 | 14.310 | 14.311 | 14.308 | 14.309 | 14.310 |
Discounted quality-adjusted life-years | ||||||
8.386 | 10.248 | 10.231 | 10.240 | 10.218 | 10.227 | 10.237 |
Discounted costs | ||||||
Total | $38,558 | $31,458 | $34,422 | $33,822 | $31,796 | $32,263 |
Hip | $21,061 | $21,968 | $21,790 | $23,117 | $22,407 | $21,904 |
Vertebral | $6,034 | $6,314 | $6,100 | $6,332 | $6,350 | $6,154 |
Other fracture | $10,013 | $10,046 | $10,006 | $10,140 | $9,989 | $9,998 |
Monitoring/ administration | $1,054 | $572 | $748 | $572 | $572 | $572 |
Drug | $8,274 | $528 | $3,824 | $1,810 | $497 | $1,620 |
Table 16: Disaggregated Summary of CADTH’s Economic Evaluation Results for Reimbursement Request Population
Parameter | Romosozumab/ alendronate | Alendronate | Denosumab | Raloxifene | Risedronate | Zoledronate |
|---|---|---|---|---|---|---|
Number of fractures | ||||||
Number of hip fractures | 601 | 624 | 620 | 654 | 635 | 623 |
Number of vertebral fractures | 860 | 915 | 878 | 930 | 926 | 888 |
Number of other fractures | 1,368 | 1,405 | 1,378 | 1,441 | 1,398 | 1,382 |
Discounted life-years | ||||||
Total life-years | 12.676 | 12.670 | 12.671 | 12.664 | 12.668 | 12.671 |
Discounted quality-adjusted life-years | ||||||
8.386 | 8.603 | 8.563 | 8.584 | 8.538 | 8.554 | 8.578 |
Discounted costs | ||||||
Total | $57,169 | $51,370 | $53,685 | $54,656 | $52,079 | $51,749 |
Hip | $28,996 | $30,635 | $30,315 | $32,702 | $31,428 | $30,522 |
Vertebral | $16,071 | $16,978 | $16,287 | $17,037 | $17,095 | $16,460 |
Other fracture | $14,006 | $14,064 | $13,996 | $14,210 | $13,974 | $13,985 |
Monitoring and administration | $1,047 | $566 | $739 | $566 | $566 | $566 |
Drug | $8,259 | $522 | $3,780 | $1,790 | $491 | $1,602 |
Table 17: CADTH Reanalysis Stepped Results for Full Health Canada Population
Stepped analysis | Drug | Total costs ($) | Total QALYs | ICER ($ per QALY) |
|---|---|---|---|---|
Sponsor’s base case | Romosozumab/alendronate | $88,781 | 8.937 | NA |
Zoledronate | $89,391 | 8.845 | dominated | |
Alendronate | $89,408 | 8.882 | dominated | |
Denosumab | $90,222 | 8.898 | dominated | |
Risedronate | $93,210 | 8.823 | dominated | |
Raloxifene | $100,461 | 8.793 | dominated | |
Efficacy Extrapolation 0 years | Alendronate | $94,344 | 8.806 | NA |
Zoledronate | $94,780 | 8.833 | 16,416 | |
Denosumab | $96,120 | 8.844 | ext. dom. | |
Romosozumab/alendronate | $96,637 | 8.873 | 46,676 | |
Risedronate | $96,835 | 8.791 | dominated | |
Raloxifene | $101,983 | 8.770 | dominated | |
Remove double-counting of LTC costs | Alendronate | $43,310 | 8.845 | NA |
Zoledronate | $43,533 | 8.882 | 6,094 | |
Risedronate | $44,300 | 8.823 | dominated | |
Denosumab | $45,296 | 8.898 | ext. dom. | |
Raloxifene | $47,408 | 8.793 | dominated | |
Romosozumab/alendronate | $48,254 | 8.937 | 85,713 | |
Increased administration costs | Romosozumab/alendronate | $89,106 | 8.937 | NA |
Zoledronate | $89,391 | 8.845 | dominated | |
Alendronate | $89,408 | 8.882 | dominated | |
Denosumab | $90,222 | 8.898 | dominated | |
Risedronate | $93,210 | 8.823 | dominated | |
Raloxifene | $100,461 | 8.793 | dominated | |
Post-fracture utility increased | Romosozumab/alendronate | $88,781 | 9.110 | NA |
Zoledronate | $89,391 | 9.057 | dominated | |
Alendronate | $89,408 | 9.079 | dominated | |
Denosumab | $90,222 | 9.088 | dominated | |
Risedronate | $93,210 | 9.044 | dominated | |
Raloxifene | $100,461 | 9.023 | dominated | |
Excess mortality modelled for one year post–hip fracture only | Romosozumab/alendronate | $88,405 | 8.955 | NA |
Zoledronate | $89,089 | 8.902 | dominated | |
Alendronate | $89,139 | 8.869 | dominated | |
Denosumab | $89,880 | 8.917 | dominated | |
Risedronate | $92,985 | 8.847 | dominated | |
Raloxifene | $100,285 | 8.818 | dominated | |
Re-weighting ICER for Health Canada population (assume 9% have prior fracture AND very high risk) | Alendronate | $68,615 | 10.065 | NA |
Zoledronate | $69,035 | 10.084 | $22,098 | |
Denosumab | $70,593 | 10.093 | ext. dom. | |
Romosozumab/alendronate | $71,039 | 10.117 | $61,863 | |
Risedronate | $71,091 | 10.051 | dominated | |
Raloxifene | $76,511 | 10.029 | dominated |
Scenario Analyses
Two scenario analyses were conducted:
Assume that relative treatment effects last 5 years after discontinuation. Results shown for both the full Health Canada population and the reimbursement request.
Use efficacy from the FRAME trial and assume hazard ratios at the end of the trial apply for the remainder of treatment. Results are only displayed for the full Health Canada population as this impact does not impact results for the reimbursement request where data from the ARCH trial is directly applicable.
Table 18: CADTH Scenario Analyses
Stepped analysis | Drug | Total costs ($) | Total QALYs | ICER ($ per QALY) |
|---|---|---|---|---|
Assume relative treatment effects continue for 5 years post-discontinuation (full Health Canada population) | Alendronate | $30,297 | 10.252 | Reference |
Risedronate | $30,877 | 10.244 | dominated | |
Zoledronate | $30,958 | 10.260 | $75,396 | |
Denosumab | $33,055 | 10.264 | ext. dom. | |
Raloxifene | $33,397 | 10.230 | dominated | |
Romosozumab/alendronate | $36,877 | 10.276 | $374,304 | |
Assume relative treatment effects continue for 5 years post-discontinuation (reimbursement population) | Zoledronate | $49,031 | 8.616 | Reference |
Alendronate | $49,074 | 8.594 | dominated | |
Risedronate | $50,220 | 8.580 | dominated | |
Denosumab | $50,822 | 8.624 | ext. dom. | |
Raloxifene | $53,688 | 8.555 | dominated | |
Romosozumab/alendronate | $53,785 | 8.650 | $139,901 | |
Use FRAME efficacy data for ‘multiple risk factors but no prior fracture’ population (full Health Canada population) | Alendronate | $31,482 | 10.231 | Reference |
Risedronate | $31,787 | 10.227 | dominated | |
Zoledronate | $32,254 | 10.237 | $124,617 | |
Raloxifene | $33,818 | 10.218 | dominated | |
Denosumab | $34,419 | 10.239 | $920,800 | |
Romosozumab/alendronate | $39,121 | 10.242 | $1,875,332 |
Appendix 5: Submitted BIA and CADTH Appraisal
Note that this appendix has not been copy-edited.
Table 19: Summary of Key Take-Aways
Key Take-aways of the BIA |
|---|
|
Summary of Sponsor’s BIA
The sponsor submitted a BIA that compared the change in expenditure for public drug plan formularies with the introduction of romosozumab compared to a reference scenario where romosozumab was not available. The BIA was modelled over a 3-year time period (January 2022 to December 2024) from the perspective of the Canadian public drug programs (excluding Quebec), with a base year of January 2021 to December 2021. The patient population of interest is for postmenopausal women at high risk for fracture, defined as a history of osteoporotic fracture, or multiple risk factors for fracture, which is in line with the Health Canada–approved indication.16 The sponsor’s reimbursement request is for postmenopausal women with a history of osteoporotic fracture and who are at a very high risk for future fracture, which is a subgroup of the Health Canada–approved indication.17 The reference scenario included the availability of alendronate 70 mg, risedronate 35 mg, and denosumab, and assumed that 40% of patients would receive alendronate 70 mg, 40% of patients would receive risedronate 35 mg, and 20% of patients would receive denosumab. The new drug scenario included the availability of romosozumab for the first year of treatment followed by treatment with alendronate 70 mg (50% of the time) and risedronate 35 mg in (50% of the time). Patients receiving alendronate, risedronate, or denosumab continue therapy for the duration of the model.
The sponsor used an epidemiologic, incidence-based model to estimate the eligible population size as illustrated in Figure 2 (using Ontario as an example).18 Briefly, the sponsor estimated the number of women eligible for treatment with romosozumab by identifying women older than 50 years of age at high risk of fracture (3.32%) and a T-score of less than or equal to −2.5 (57.2%). The sponsor assumed that 30% of women experiencing a fracture will receive treatment, and that 64% of these women have coverage through the public drug plans. The sponsor assumed annual population growth based on population projections from Statistics Canada.
The sponsor’s estimated market share for romosozumab was assumed to be 20% in year one, 25% in year two and 30% in year 3 with alendronate 70 mg, risedronate 35 mg, and denosumab 60 mg, taking the remaining market share of (30% each for alendronate and risedronate in year 1; 28% each in year 2; and 25% each in year 3), and 20% in all 3 years for denosumab. No market expansion is expected with reimbursement of romosozumab.18
Key inputs to the BIA are documented in Table 20.
Sponsor’s key assumptions:
Included the costs of drug acquisition, mark-up, and dispensing fees.
Patients who initiate alendronate 70 mg, risedronate 35 mg, or denosumab will remain on therapy for the duration of the model.
Patients who initiate romosozumab will remain on therapy for 1 year and then switch to alendronate 70 mg or risedronate 35 mg for the remainder of the model. All costs after the first year of treatment are assumed to be equal in the new drug scenario and the reference scenario.
The introduction of romosozumab in the new drug scenario will not displace market share from denosumab 60 mg.
Reference: Sponsor’s submission.18
Indication (Ontario Example)
Figure 2: Sponsor’s Estimation of the Size of the Eligible Population for Full Health Canada Indication
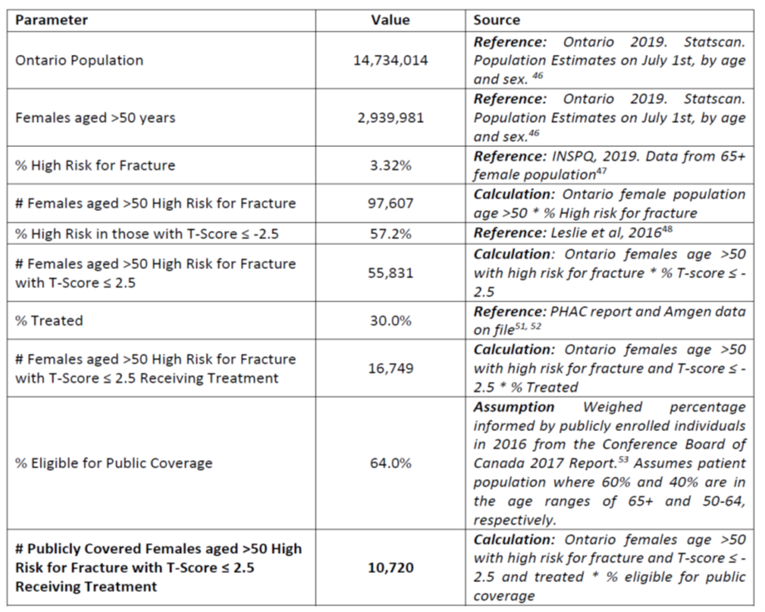
Table 20: Summary of Key Model Parameters
Parameter | Sponsor’s estimate (reported as year 1 / year 2 / year 3 if appropriate) |
|---|---|
Target population | |
Number of patients eligible for drug under review for full Health Canada population | 22,408 / 22,762 / 23,113 |
Market Uptake (3 years) | |
Uptake (reference scenario) Alendronate 70 mg Risedronate 35 mg Denosumab 60 mg | 40% / 40% / 40% 40% / 40% / 40% 20% / 20% / 20% |
Uptake (new drug scenario) Romosozumab Alendronate 70 mg Risedronate 35 mg Denosumab 60 mg | 20% / 25% / 30% 30% / 28% / 25% 30% / 28% / 25% 20% / 20% / 20% |
Cost of treatment (per patient) | |
Cost of treatment over one year Romosozumab Alendronate 70 mg Risedronate 35 mg Denosumab 60 mg | $7,881 $109 $103 $792 |
Reference: Sponsor’s submission.18
Summary of the Sponsor’s BIA Results
The sponsor estimated the net budget impact of introducing romosozumab for the full Health Canada population to be $37,846,080 in year 1, $48,055,065 in year 2, and $58,554,646 in year 3 for a 3-year total of $144,455,791.18 The sponsor also conducted an analysis to estimate the budget impact of romosozumab according to the requested reimbursement population (i.e., for patients with a history of osteoporotic fracture and who are at very high risk for future fracture) and sensitivity analysis to assess: changes to the assumptions for market share, percentage of patients treated, removal of mark-up and dispensing fees, inclusion of administration fees, changes in population growth, and the inclusion of risedronate 150 mg as a comparator. Changes in market share assumptions and percentage of patients treated had the greatest impact on 3-year budget impact. The 3-year total budget impact for the requested reimbursement population was estimated by the sponsor to be $22,023,149.
CADTH Appraisal of the Sponsor’s BIA
CADTH identified several key limitations to the sponsor’s analysis that have notable implications on the results of the BIA:
Unable to estimate impact of alternative subsequent treatment options following romosozumab: The sponsor estimated the budget impact of romosozumab for one year followed by alendronate and risedronate for 2 years compared to alendronate or risedronate for 3 years, and consequently that all costs beyond the first year of treatment are assumed to be equal in the new drug scenario and the reference scenario. Based on feedback from the clinical expert consulted by CADTH for this review, it is possible that prescribing clinicians may prefer to treat patients with zoledronic acid or denosumab following the use of romosozumab. The sponsor’s assumption that all patients will be treated with alendronate or risedronate following treatment with romosozumab underestimates the incremental costs of romosozumab and the overall budget impact given that alternative drugs such as zoledronic acid and denosumab have higher annual costs compared to alendronate or risedronate.
CADTH was unable to account for alternative subsequent treatment options in the base-case reanalysis due to structure of the model. CADTH conducted a scenario analysis to assess the impact of assuming that 100% of patients will receive denosumab following treatment with romosozumab to explore the maximum costs that could arise from this treatment sequence. This was conducted by incorporating an incremental annual cost ($682.29) of treatment with denosumab (annual cost $791.56) compared to a lower cost oral bisphosphonate (alendronate; annual cost $109.27) for all patients treated with romosozumab. This scenario assumes that all patients treated with romosozumab in year 1 and year 2 would incur additional costs in years 2 and 3.
Uncertainty in the derivation of patients eligible for treatment: The sponsor estimated that 3.32% of females aged > 50 years would be at high risk for fracture, 57.2% of these individuals would have a T-score of ≤ −2.5, 30% of patients would be treated in practice.
The clinical expert consulted by CADTH for this review indicated that the values used to derive the proportion of patients who are at high risk of fracture who have had a prior fracture (0.44%) and patents who are at high risk of fracture (3.32%) were underestimated. The expert noted that the source used to derive these estimates was based on a population that would have had a diagnosis of osteoporosis and/or prescriptions for osteoporosis medications filled, when in practice the percentage of patients who receive a diagnosis and/or treatment for the condition is quite low (i.e., often less than 10% to 20% of individuals who have osteoporosis). Consequently, these assumptions were likely to underestimate the eligible patient population for romosozumab. Secondly, the sponsor’s estimate for the number of patients eligible for treatment was, in part, based on the assumption that 57.2% of women with incident fractures would have a T-score of ≤ 2.5. Feedback from the clinical expert consulted by CADTH for this review indicated that BMD is only one indicator of fracture risk, and that there are patients who may be at a high risk of fracture even with a T-score of > 2.5. Consequently, the assumption that only women with a T-score of ≤ 2.5 would be eligible for treatment is likely to underestimate the eligible patient population.
o CADTH revised the proportion of patients with a prior hip or vertebral fracture to be 1.6% in line with a study by Leslie et al 2011.12 CADTH revised the proportion of patients deemed high risk to be 21.4%. This was based on the number of patients deemed high risk with no prior fracture (10.1% taken from Leslie et al 201112) added onto the number of patients with a prior fracture (11.3% taken from Fraser et al. [2011]19). Of these patients, CADTH assumed that 10% would be treated. A scenario analysis was conduct that assumed 20% would be treated.
Uncertainty in the derivation of patients eligible for public coverage: The sponsor’s estimate that 64% of patients would be eligible for public coverage was based on a Conference Board of Canada 2017 Report20 that estimated the percentage of individuals covered by public plans to be 89.4% and 24.8% for 65+ and 25 to 64 years, respectively, and used a weighted average (60% of patients age 65+ years and 40% of patients aged 50 to 64 years), to calculate overall eligibility for public coverage. This estimate is likely underestimated given that based on the ARCH trial, 11.7% of patients were < 65 years of age, 21.2% of patients in the FRAME trial2 were younger than 65 years of age, and 22.5% of patients in the STRUCTURE trial21 were < 65 years of age. An underestimate of the percentage of patients eligible for public coverage underestimates the potential budget impact of romosozumab.
CADTH revised the estimated of percentage of patients eligible for public coverage to 82% in the base case which reflected the percentage of patients aged <65 years in the ARCH trial (11.7% aged <65 years with 24.8% public coverage; 88.3% aged 65+ with 89.4% public coverage).
Uncertain mix of relevant drugs in the reference scenario: The sponsor’s model compared a new drug scenario with the introduction of romosozumab to a reference scenario that included alendronate, risedronate, and denosumab. As stated in the CADTH clinical review report, other relevant comparators in this setting include zoledronic acid and raloxifene, of which, zoledronic acid was believed to be an important treatment option in this setting. According to the clinical expert consulted by CADTH for this review, the relevant agents in the reference scenario will depend on how romosozumab is prescribed in practice. From a specialty clinic viewpoint, the more commonly prescribed treatment options would be denosumab and zoledronic acid, and from a family practice perspective, alendronate and risedronate are more likely to be used. Given that the indicated patient population are those at high risk of future fracture, it is likely that most patients would be followed by a specialist, and therefore relevant treatment options in the reference scenario would also include zoledronic acid. The inclusion zoledronic acid in the reference scenario will influence the results of the BIA if alternative assumptions are used for which agents romosozumab is expected to displace in practice
CADTH was unable to address this in the base case reanalysis.
Additional limitations were identified but were not considered to be key limitations.
Uncertainty in the market share estimates for romosozumab: The sponsor assumed market share estimates for romosozumab as 20% in the first year, 25% in Year 2 and 30% in Year 3. According to the clinical expert consulted by CADTH for this review, the cardiovascular safety warning for romosozumab may be a limiting factor to uptake, however the potential benefits of monthly dosing and one year duration, the market share for romosozumab may result in greater uptake. CADTH undertook a scenario analysis assuming a 10% increase in market share over each year for romosozumab.
Uncertainty in oral bisphosphate use after treatment with romosozumab: The sponsor assumed that 50% of patients would receive alendronate and 50% would receive risedronate following the first year of romosozumab. If oral bisphosphonates are used following romosozumab, the clinical expert consulted by CADTH indicated that alendronate may be preferred in cases were a pause in treatment is required given that bone loss starts soon after treatment with risedronate is stopped. Given the small difference in annual costs between alendronate and risedronate ($109 vs. $103), preference for one over the other will not have a substantial impact on costs.
CADTH Reanalyses of the BIA
Table 21: CADTH Revisions to the Submitted BIA
Stepped analysis | Sponsor’s value or assumption | CADTH value or assumption |
|---|---|---|
Corrections to sponsor’s base case | ||
None | None | None |
Changes to derive the CADTH base case | ||
1. Percentage of patients eligible for the full Health Canada indication and the reimbursement request |
|
|
2. Percentage of patients eligible for public coverage | 64%, except for NIHB where 100% coverage is assumed | 82%, except for NIHB where 100% coverage is assumed |
CADTH base case | Reanalysis 1 + 2 | |
NIHB = Non-Insured Health Benefits program.
The results of the CADTH stepwise reanalysis are presented in summary format in Table 22 and a more detailed breakdown is presented in Table 24. The analysis is based on publicly available prices of the comparator treatments. In the CADTH reanalysis, the expected budget impact over the 3-year time horizon is expected to be $684,195,999 (Year 1, $179,247,490; Year 2, $227,606,038; Year 3, $277,342,470) for the full Health Canada population and $51,154,841 (Year 1, $13,401,682; Year 2, $17,017,274; Year 3, $20,735,886) for the reimbursement-request population.
Table 22: Summary of the CADTH Reanalyses of the BIA for the Full Health Canada indication
Stepped analysis | Three-year total |
|---|---|
Submitted base case | $144,455,791 |
CADTH reanalysis 1: Updating the percentage of patients eligible under the Full Health Canada | $542,616,958 |
CADTH reanalysis 2: Percentage of patients eligible for public coverage | $183,293,165 |
CADTH base case (1 + 2) | $684,195,999 |
BIA = budget impact analysis.
Table 23: Summary of the CADTH Reanalyses of the BIA for the Sponsor’s Reimbursement Request
Stepped analysis | Three-year total |
|---|---|
Submitted base case | $22,023,149 |
CADTH reanalysis 1: Updating the percentage of patients eligible under the sponsor’s reimbursement request | $40,569,492 |
CADTH reanalysis 2: Percentage of patients eligible for public coverage | $27,944,139 |
CADTH base case (1 + 2) | $51,154,841 |
BIA = budget impact analysis.
CADTH conducted the following scenario analyses on the full Health Canada indication:
Price reduction of 80% based on the results of the pharmacoeconomic model for the full Health Canada indication where the ICER would be at $50,000 per QALY for romosozumab.
Assuming alternate treatments (denosumab and zoledronic acid) following treatment with romosozumab.
Assuming that 20% of individuals who met the eligibility criteria would receive treatment.
Assuming an additional 10% market share over each year for romosozumab (i.e., Year 1, 30%; Year 2, 35%; Year 3, 40%).
The results of the CADTH scenario analyses are outlined in Table 24. The 3-year budget impact ranged from $130,615,137, using an 80% price reduction, to $1,368,391,997 when assuming that 20% of eligible patients would receive treatment in practice.
Table 24: Detailed Breakdown of the CADTH Reanalyses of the BIA for the Full Health Canada Indication
Stepped analysis | Scenario | Year 0 (current situation) | Year 1 | Year 2 | Year 3 | Three-year total |
|---|---|---|---|---|---|---|
Submitted base case | Reference | $8,126,485 | $16,386,621 | $24,776,510 | $33,294,638 | $74,457,769 |
New drug | $8,126,485 | $54,232,701 | $72,831,575 | $91,849,284 | $218,913,560 | |
Budget impact | $0 | $37,846,080 | $48,055,065 | $58,554,646 | $144,455,791 | |
CADTH base case | Reference | $38,512,321 | $77,659,073 | $117,421,794 | $157,793,134 | $352,874,001 |
New drug | $38,512,321 | $256,906,563 | $345,027,832 | $435,135,604 | $1,037,070,000 | |
Budget impact | $0 | $179,247,490 | $227,606,038 | $277,342,470 | $684,195,999 | |
CADTH scenario analysis: 80% price reduction | Reference | $38,512,321 | $77,659,073 | $117,421,794 | $157,793,134 | $352,874,001 |
New drug | $38,512,321 | $111,879,561 | $160,872,778 | $210,736,799 | $483,489,138 | |
Budget impact | $0 | $34,220,488 | $43,450,984 | $52,943,665 | $130,615,137 | |
CADTH scenario analysis: 20% received treatment | Reference | $77,024,642 | $155,318,146 | $234,843,589 | $315,586,267 | $705,748,002 |
New drug | $77,024,642 | $513,813,127 | $690,055,665 | $870,271,208 | $2,074,139,999 | |
Budget impact | $0 | $358,494,981 | $455,212,076 | $554,684,940 | $1,368,391,997 | |
CADTH scenario analysis: alternate subsequent treatment options | Reference | $38,512,321 | $77,659,073 | $117,421,794 | $157,793,134 | $352,874,001 |
New drug | $38,512,321 | $256,906,563 | $358,197,452 | $465,026,506 | $1,080,130,522 | |
Budget impact | $0 | $179,247,490 | $240,775,658 | $307,233,373 | $727,256,521 | |
CADTH scenario analysis: increased market share estimates for romosozumab | Reference | $38,512,321 | $77,659,073 | $117,421,794 | $157,793,134 | $352,874,001 |
New drug | $38,512,321 | $346,530,309 | $436,070,247 | $527,583,094 | $1,310,183,650 | |
Budget impact | $0 | $268,871,236 | $318,648,453 | $369,789,960 | $957,309,649 |
ISSN: 2563-6596
Disclaimer: The information in this document is intended to help Canadian health care decision-makers, health care professionals, health systems leaders, and policy-makers make well-informed decisions and thereby improve the quality of health care services. While patients and others may access this document, the document is made available for informational purposes only and no representations or warranties are made with respect to its fitness for any particular purpose. The information in this document should not be used as a substitute for professional medical advice or as a substitute for the application of clinical judgment in respect of the care of a particular patient or other professional judgment in any decision-making process. The Canadian Agency for Drugs and Technologies in Health (CADTH) does not endorse any information, drugs, therapies, treatments, products, processes, or services.
While care has been taken to ensure that the information prepared by CADTH in this document is accurate, complete, and up-to-date as at the applicable date the material was first published by CADTH, CADTH does not make any guarantees to that effect. CADTH does not guarantee and is not responsible for the quality, currency, propriety, accuracy, or reasonableness of any statements, information, or conclusions contained in any third-party materials used in preparing this document. The views and opinions of third parties published in this document do not necessarily state or reflect those of CADTH.
CADTH is not responsible for any errors, omissions, injury, loss, or damage arising from or relating to the use (or misuse) of any information, statements, or conclusions contained in or implied by the contents of this document or any of the source materials.
This document may contain links to third-party websites. CADTH does not have control over the content of such sites. Use of third-party sites is governed by the third-party website owners’ own terms and conditions set out for such sites. CADTH does not make any guarantee with respect to any information contained on such third-party sites and CADTH is not responsible for any injury, loss, or damage suffered as a result of using such third-party sites. CADTH has no responsibility for the collection, use, and disclosure of personal information by third-party sites.
Subject to the aforementioned limitations, the views expressed herein are those of CADTH and do not necessarily represent the views of Canada’s federal, provincial, or territorial governments or any third party supplier of information.
This document is prepared and intended for use in the context of the Canadian health care system. The use of this document outside of Canada is done so at the user’s own risk.
This disclaimer and any questions or matters of any nature arising from or relating to the content or use (or misuse) of this document will be governed by and interpreted in accordance with the laws of the Province of Ontario and the laws of Canada applicable therein, and all proceedings shall be subject to the exclusive jurisdiction of the courts of the Province of Ontario, Canada.
The copyright and other intellectual property rights in this document are owned by CADTH and its licensors. These rights are protected by the Canadian Copyright Act and other national and international laws and agreements. Users are permitted to make copies of this document for non-commercial purposes only, provided it is not modified when reproduced and appropriate credit is given to CADTH and its licensors.
About CADTH: CADTH is an independent, not-for-profit organization responsible for providing Canada’s health care decision-makers with objective evidence to help make informed decisions about the optimal use of drugs, medical devices, diagnostics, and procedures in our health care system.
Funding: CADTH receives funding from Canada’s federal, provincial, and territorial governments, with the exception of Quebec.