CADTH Reimbursement Review
Triheptanoin (Dojolvi)
Sponsor: Ultragenyx Canada Inc.
Therapeutic area: Long-chain fatty acid oxidation disorders
This multi-part report includes:
Clinical Review
Pharmacoeconomic Review
Clinical Review
Abbreviations
6MWT
6-minute walk test
12MWT
12-minute walk test
acyl CoA
acyl coenzyme A
AE
adverse event
ATP
adenosine triphosphate
CACT
carnitine-acylcarnitine translocase
CI
confidence interval
CK
creatine kinase
CPT
carnitine palmitoyltransferase
DCI
daily caloric intake
ED
emergency department
EEI
energy expenditure index
FAS
full analysis set
GEE
generalized estimation equation
GI
gastrointestinal
HR
heart rate
HRQoL
health-related quality of life
IST
investigator-sponsored trials
LCF
long-chain fatty acid
LC-FAOD
long-chain fatty acid oxidation disorder
LCHAD
long-chain 3-hydroxy-acyl-CoA dehydrogenase
LV
left ventricular
LVEF
left ventricular ejection fraction
MCE
major clinical event
MCS
mental component summary
MCT
medium-chain triglyceride
MID
minimally important difference
PAS
primary analysis set
PCS
physical component summary
PHS
physical summary score
PSS
psychosocial summary score
RCT
randomized controlled trial
RER
respiratory exchange ratio
SAE
serious adverse event
SD
standard deviation
SF-10
Short Form (10) Health Survey
SF-12v2
Short Form (12) Health Survey version 2
TCA
tricarboxylic acid
TEAE
treatment-emergent adverse event
TEE
total energy expenditure
TFP
trifunctional protein
VLCAD
very long-chain acyl-CoA dehydrogenase
w/w
weight per weight
Executive Summary
An overview of the submission details for the drug under review is provided in Table 1.
Item | Description |
|---|---|
Drug product | Triheptanoin (Dojolvi), 100% w/w oral liquid |
Indication | As a source of calories and fatty acids for the treatment of adult and pediatric patients with LC-FAODs |
Reimbursement request | As per indication |
Health Canada approval status | NOC |
Health Canada review pathway | Priority review |
NOC date | February 15, 2021 |
Sponsor | Ultragenyx Canada Inc. |
LC-FAOD = long-chain fatty acid oxidation disorder; NOC = Notice of Compliance.
Introduction
Long-chain fatty acid oxidation disorders (LC-FAODs) are a heterogenous group of rare autosomal recessive genetic disorders. The disorders are due to mutations in the genes encoding mitochondrial enzymes involved in the conversion of dietary long-chain fatty acids into energy and are associated with chronic energy deficiency and acute crises of energy production.1 Patients with LC-FAODs are at risk of metabolic decompensation, particularly during times of physiologic stress or when energy intake is reduced (e.g., fasting, vigorous exercise, illness, vomiting, or surgery).2 Several types of LC-FAODs have been identified, including carnitine palmitoyltransferase (CPT I or CPT II) deficiency, very long-chain acyl coenzyme A (acyl-CoA) dehydrogenase (VLCAD) deficiency, long-chain 3-hydroxy-acyl-CoA dehydrogenase (LCHAD) deficiency, trifunctional protein (TFP) deficiency, and carnitine-acylcarnitine translocase (CACT) deficiency. The most common is VLCAD deficiency.3 There is considerable variability in the incidence and prevalence estimates for LC-FAODs. Overall, the estimated collective incidence of LC-FAODs is 1 in 5,000 to 10,000 live births. The population prevalence of LC-FAODs range widely, from 1 in 100,000 to 1 in 2,000,000, depending on the specific type.4 The sponsor estimates the incidence of LC-FAODs in Canada to be approximately 10 to 15 births per year. Based on a global prevalence of approximately 1 per 100,000, the sponsor estimates that 380 Canadians have LC-FAODs.5
The clinical presentation of LC-FAODs can vary, depending on the specific disorder and age of onset, although there are common elements. Acute manifestations of LC-FAODs can include episodes of hypoketotic hypoglycemia, hyperammonemia, or rhabdomyolysis, induced by fasting, exercise, or illness. Patients also develop cardiomyopathy or hepatic dysfunction, which leads to hospitalizations and premature death.1 According to the clinical experts consulted by CADTH, LC-FAODs can largely be divided into infantile, pediatric, and adult presentations of the disease. Early in life, manifestations include marked metabolic disturbance, with high mortality and morbidity. Newborn screening for LC-FAODs has contributed to early identification and treatment, which has reduced the burden of this disease. Infants have moderate forms, which often involve hepatic and cardiac disease. Juveniles and adults who are diagnosed with LC-FAODs often exhibit neuromuscular symptoms such as rhabdomyolysis, peripheral neuropathy, and retinopathy, which can range from mild to severe and significantly impact quality of life and physical functioning. The spectrum of disease severity can also be correlated with the type of LC-FAOD. For example, manifestations of LCHAD are mainly severe, whereas half of patients with VLCAD can have asymptomatic or mild presentations, as evidenced by milder variants identified by the newborn screening tests.
According to the clinical experts consulted for this review, standard therapy in Canada is largely supportive and individualized based on the needs of the patient. Therapy is often guided by age at diagnosis, severity of clinical presentation, and type of LC-FAOD. Chronic treatment usually includes dietary modification (i.e., low fat, high carbohydrate), avoidance of prolonged fasting, avoidance of activity requiring high exertion, and supplementation with medium-chain triglyceride (MCT)-based products. Some patients may also receive essential fatty acids or carnitine.
Triheptanoin is an MCT consisting of 3 odd-chain 7-carbon fatty acids (heptanoates). As a source of medium odd-chain fatty acids, triheptanoin bypasses the process requiring the specific enzymes that are deficient in patients with LC-FAODs for the conversion of dietary long-chain fatty acids into energy.6 Health Canada reviewed triheptanoin under its Priority Review process and approved it as a source of calories and fatty acids for the treatment of adult and pediatric patients with LC-FAODs. The recommended target daily dosage of triheptanoin is up to 35% of the patient’s total prescribed DCI, divided into at least 4 doses, administered at mealtimes or with snacks, at 3-hour to 4-hour intervals or as directed by the health care provider.6
The objective of this CADTH reimbursement review is to perform a systematic review of the beneficial and harmful effects of triheptanoin 100% weight per weight (w/w) oral liquid as a source of calories and fatty acids for the treatment of LC-FAODs in adult and pediatric patients.
Stakeholder Perspectives
The information in this section is a summary of input provided by the patient groups that responded to CADTH’s call for patient input and from clinical expert(s) consulted by CADTH for the purpose of this review.
Patient Input
One patient group, MitoAction (Massachusetts, US), responded to the call for patient input for this CADTH reimbursement review. Input was not received from any Canadian patient group. MitoAction has engaged with the patient community through weekly support calls, Facebook groups, and a Mito411 Support line. It has received direct feedback from the patient community in the US about their experience with triheptanoin.
The patient group emphasized that the energy depletion for patients with LC-FAODs can be debilitating, and patients often cannot participate in normal day-to-day activities. Patients must manage their energy exertion throughout the day, because a simple task can physically overwhelm an individual with an LC-FAOD. Limitations to activity can lead to depression, isolation, and other mental health issues, which are very common in patients with a rare disease. Manifestations of LC-FAOD can also lead to hospitalization and organ damage.
Ideal outcomes for the patient community include increased energy levels, which lead to more physical activity, improved cognitive functioning, decreased stress on organ systems, and reduced hospitalizations. This would provide an enhanced quality of life and independence for patients. MitoAction notes that, with proper treatment and disease management, patients with LC-FAODs can lead full and meaningful lives despite their diagnosis.
Clinician Input
Input From Clinical Experts Consulted by CADTH
The clinical experts consulted by CADTH stated that current treatments may help some patients, but there are patients who still experience recurrence of symptoms despite optimized therapy. There is need for more effective treatment for patients with ongoing symptomatic LC-FAODs, particularly those with severe forms of the disease. Supplementation with even-chain MCT has led to a positive response and reduction of complications in some patients. However, tolerability is an issue (due to gastrointestinal [GI] adverse events [AEs]), which, in turn, affects adherence to the treatment regimen.
The experts indicated that, in general, triheptanoin would be reserved for more severe cases of LC-FAODs, or as second-line therapy after even-chain MCT products had been tried. For most patients, the clinical experts anticipate that triheptanoin would be used when there is inadequate response to optimized dietary measures and conventional even-chain MCT supplementation. Triheptanoin may be used as first-line therapy in selected patients (usually neonates or infants) presenting with acute, life-threatening cardiovascular or metabolic decompensation. If such patients respond to triheptanoin, treatment would be expected to continue upon hospital discharge.
According to the clinical experts, in general, it is appropriate for a patient who starts triheptanoin to receive an adequate trial and be evaluated annually for improvement or maintenance of effect, although initial evaluations may be more frequent (e.g., every 3 or 6 months). The clinical experts emphasized that assessing response to treatment should be individualized. Depending on the age of the patient, type of LC-FAOD, presenting symptoms, and clinical severity, the goals of treatment vary (e.g., address rate of progression of left ventricular [LV] dysfunction, frequency of events such as rhabdomyolysis or hospitalization, length of hospital admissions, recurrent episodes of metabolic decompensation, exercise intolerance, muscle pain with exertion, quality of life). For example, in infants presenting with catastrophic events, survival would be a relevant outcome, and follow-up would be performed frequently. In stable older children and adults, follow-up may be performed every 6 to 12 months. The clinical experts stated that the decision to discontinue treatment is made according to individualized parameters based on the patient’s medical history. If parameters used to measure response in the patient return to pre-treatment levels or gains are not maintained, then triheptanoin treatment should be discontinued at the annual assessment. Treatment should also be discontinued if unacceptable side effects develop.
Clinician Group Input
This section was prepared by CADTH staff based on the input provided by clinician groups.
Input was received from the Garrod Association Guideline Committee on the reimbursement review on triheptanoin. The clinician group noted that, currently, the management of patients with LC-FAODs mainly includes medical nutrition therapy. The group commented that this typically includes the restriction of long-chain fatty acids and supplementation with MCT.
The clinician group noted that patients with severe LC-FAODs have a greater unmet need than those with milder LC-FOADs. The group added that this is because patients with severe LC-FOADs can present with symptoms regardless of good compliance with standard treatment. The committee noted that the drug under review will replace and not complement MCT supplements. They recommended that the 2 supplementations (triheptanoin and MCT) should not be given together, owing to a theoretical concern that MCT oil and triheptanoin compete for enzyme activity. The committee noted that patients with moderate-to-severe LC-FAODs are likely to respond to treatment under review and thus would be best suited for treatment.
The group commented that triheptanoin should be used as first- or second-line treatment, based on the clinical judgment of the treating physician. The clinician group added that patients with mild, asymptomatic LC-FAODs who are diagnosed via newborn screening programs would be least suited for treatment with the drug under review. In addition, the clinician group noted that patients diagnosed with LCHAD and mitochondrial TFP deficiencies are at risk of developing retinopathy and peripheral neuropathy. They added that neither MCT supplementations nor triheptanoin treat these symptoms.
Drug Program Input
Input was obtained from the jurisdictions participating in CADTH reimbursement reviews. The following were identified as key factors that could affect the implementation of recommendations:
availability of tests to diagnose LC-FAOD
place of triheptanoin in therapy
eligibility criteria for treatment with triheptanoin
assessment criteria for measuring therapeutic response.
The clinical experts consulted by CADTH provided responses, which can be found in the Drug Program Input section.
Clinical Evidence
Pivotal Studies and Protocol-Selected Studies
Description of Studies
A total of 3 sponsor-submitted studies were included in this report. Aside from these sponsor-submitted pivotal studies, none of the other identified citations met the inclusion criteria for the CADTH systematic review. Two of the studies (CL201 and CL202) were funded by the sponsor, whereas the third study (Gillingham et al. [2017]) was conducted by an independent investigator.
Study CL201 (N = 29) was a multi-centre, open-label, single-arm phase II study investigating the efficacy and safety of triheptanoin in adults and children (6 months of age and older) exhibiting serious clinical manifestations of LC-FAODs despite current management. Patients must have had severe LC-FAODs with confirmed diagnosis of CPT II, VLCAD, LCHAD, or TFP deficiency, and must have been on stable treatment (including dietary measures). At the baseline visit, any prior MCT was discontinued and treatment with triheptanoin was initiated (i.e., added to standard therapy). The target dosage of triheptanoin was 25% to 35% of DCI or maximum tolerated dosage, and treatment was continued up to 78 weeks (18 months).
Study CL202 (N = 75) is an ongoing, open-label, extension study investigating the long-term safety and efficacy of triheptanoin in patients older than 6 months of age with LC-FAODs. Eligible patients must have had a confirmed diagnosis of CPT I, CPT II, VLCAD, LCHAD, TFP, or CACT deficiency. The study consists of 3 cohorts: patients who had previously participated in CL201 (CL201 rollover cohort, N = 24), patients who failed conventional therapy and continued to exhibit clinical manifestations of LC-FAOD (triheptanoin-naive cohort, N = 20), and patients who participated in other programs to access triheptanoin, such as investigator-sponsored trials (ISTs) or compassionate use (IST or other cohort, N = 31). All 3 were single-arm cohorts; none included a parallel comparator group. The target dosage of triheptanoin was 25% to 35% of DCI, and treatment was continued up to 5 years (60 months) while enrolled in CL202. Data presented in this report reflect an interim analysis with a cut-off date of June 1, 2018; the mean duration of treatment was 25.92 months overall. The mean duration for each treatment cohort was as follows: 23.01 months for the CL201 rollover cohort (excludes CL201 study duration), 15.68 months for the triheptanoin-naive cohort, and 34.77 months for the IST or other cohort.
The study by Gillingham et al. (2017; N = 32) was a double-blind randomized controlled trial (RCT) that investigated whether triheptanoin has a therapeutic advantage over conventional treatment for LC-FAODs. Before study enrolment, patients must have had at least 1 episode of rhabdomyolysis and must have been on a stable diet that included MCT. Adults and children 7 years of age and older with confirmed diagnosis of CPT II, VLCAD, TFP, or LCHAD were randomized 1:1 to a diet containing triheptanoin or trioctanoin (an even-chain fatty acid triglyceride), with both MCTs dosed at 20% of estimated DCI. Randomization occurred separately at 2 investigative sites and was stratified according to diagnosis (CPT II, VLCAD, or TFP and LCHAD). Baseline assessments were completed at enrolment, and patients were admitted to the research centre for 4 days for outcome measurements. Upon discharge, patients continued treatment with assigned diet and MCT supplementation for 4 months. At the end of 4 months, baseline assessments were repeated.
At baseline, the average age of patients in CL201 and CL202 was younger than that of patients enrolled in the Gillingham et al. (2017) trial. The 2 sponsor-funded trials enrolled mainly pediatric patients (< 18 years); the mean age was 12.06 years (standard deviation [SD] = 13.21) in CL201, and 13.87 years (SD = 13.19) in CL202. The mean age in the Gillingham et al. (2017) study was 24.75 years (SD = 14.3). The most common LC-FAODs diagnosed in the patients enrolled in CL201 and CL202 were VLCAD and LCHAD deficiencies. In the Gillingham et al. (2017) study, a similar number of patients was diagnosed with VLCAD, LCHAD and TFP, or CPT II deficiencies. According to available data (i.e., excluding the IST or other cohort of CL202), the majority of patients enrolled in all 3 studies had received prior treatment with an MCT formulation, and all were being treated with dietary measures. In CL201 and CL202, approximately 65% of patients were receiving carnitine supplementation. Prior to enrolment, patients in the CL201 study had received approximately 17% of DCI as medium-chain fat from MCTs.
In Study CL201, patients were prescribed a mean triheptanoin dosage of 31.20% DCI (SD = 8.88). The mean dosage of triheptanoin consumed was 27.5% (SD = 4.58) of DCI. During the study, there was a 10% DCI increase (from average 17.4% to 27.5%) in the amount of medium-chain fat consumed, compared to the pre-triheptanoin period. In Study CL202, the mean dosage of triheptanoin prescribed was 26.95% of DCI (SD = 7.48). The mean triheptanoin dosage (% DCI) actually consumed was not reported, although, on average, most patients consumed more than 90% of their prescribed dosage. In the Gillingham et al. (2017) study, patients consumed 16.62% (SD = 2.66) and 14.83% (SD = 3.40) of DCI from triheptanoin and trioctanoin, respectively.
Study CL201 did not explicitly identify primary and secondary efficacy end points; rather, the study grouped end points as key or supportive. Numerous key end points were measured for several disease areas. The following clinical outcomes, relevant to this review, were assessed: major clinical events (MCEs; hospitalizations, emergency department [ED] or acute care visits, or emergency interventions for rhabdomyolysis, hypoglycemia, or cardiomyopathy), exercise intolerance (12-minute walk test [12MWT], cycle ergometry), functional disability and cognitive development (Short Form (10) Health Survey [SF-10], Short Form (12) Health Survey [SF-12]), and cardiac function (echocardiogram).
The primary end point in Study CL202 was the annualized rate of MCEs, including rhabdomyolysis, hypoglycemia, and cardiomyopathy. Annualized duration of total MCEs was considered a secondary efficacy end point, as were the annualized event rate and annualized event days (also referred to as annualized duration rate) of each of the MCEs separately (i.e., rhabdomyolysis, hypoglycemia, and cardiomyopathy).
The primary outcomes in the Gillingham et al. (2017) study included changes in total energy expenditure (TEE), cardiac function (as measured by echocardiography), exercise tolerance (measured by treadmill ergometry), and phosphocreatine recovery following acute exercise.
Efficacy Results
Efficacy results are summarized in Table 2 and Table 3. Results for efficacy outcomes identified in the CADTH review protocol are reported; only the efficacy end points and parameters that were deemed to show favourable changes for triheptanoin according to the trial reports and publications have been included in the tables. In addition, none of the results discussed were adjusted for multiplicity. Consequently, designating differences as statistically significant has been avoided. Of note, none of the 3 studies evaluated the following efficacy outcomes that were identified in the CADTH review protocol: survival, symptom relief, reduction in concomitant medications, or productivity.
Major Clinical Events
MCEs were not measured as part of the efficacy analyses in the Gillingham et al. (2017) study. MCEs were defined in both CL201 and CL202 as rhabdomyolysis, hypoglycemia, or cardiac disease events caused by LC-FAODs, or an intercurrent illness complicated by an LC-FAOD, resulting in any hospitalization, ED or acute care visit, or emergency intervention (any unscheduled administration of therapeutics at home or in the clinic). These measures were presented as annualized event rates and event days (also called duration rate) as an aggregate, as well as major rhabdomyolysis events, hypoglycemia events, and events due to decompensation of cardiomyopathy being presented separately. Of note, the majority of MCEs reported in both CL201 and CL202 were rhabdomyolysis events.
Due to the heterogeneity of clinical manifestations of LC-FAODs, both studies used a retrospective control, comparing MCEs before and during triheptanoin treatment. Retrospective data collection was intended to provide a within-subject comparison for MCEs; thus, each patient acted as his or her own control. In Study CL201, medical history from 18 months (78 weeks) before study entry was collected to establish a pre-triheptanoin baseline and was compared to 78 weeks of triheptanoin treatment. In Study CL202, historical medical data were collected for patients in the CL201 rollover and triheptanoin-naive cohorts. Statistical comparisons were made between data collected from 18 months before triheptanoin treatment and the first 36 months (CL201 rollover cohort, including treatment received during CL201) or 18 months (triheptanoin-naive cohort) of study treatment. No statistical comparisons were made for the IST or other cohort in CL202 due to lack of pre-triheptanoin data.
In Study CL201, a reduction in annualized event rates and event days occurred across all 3 clinical manifestations as a result of triheptanoin treatment but was most favourable for the aggregate measure that included all event types. For total MCEs, including all event subtypes, the difference in the mean annualized event rate was 0.81 events per year, and the difference in mean annualized event days was 2.997 in favour of triheptanoin.
In the CL201 rollover cohort of Study CL202, the most notable improvement due to triheptanoin was in the annualized event rate of total MCEs. For this primary efficacy end point, the difference in the mean annualized event rate of total MCEs, including all event subtypes, was 0.80 events per year in favour of triheptanoin treatment. For the remaining annualized event rates and event days (secondary efficacy end points), triheptanoin treatment resulted in a reduction across all comparisons, but none were significant. In the triheptanoin-naive cohort of CL202, a heavily skewed distribution was observed, which limited the interpretation of results; none of the changes observed in MCEs were significant.
To evaluate the effect of triheptanoin on MCEs in different subgroups, several ad hoc analyses were performed. The following 2 relevant subgroups, identified in the CADTH systematic review protocol, were analyzed in both CL201 and CL202: subgroup by age at triheptanoin initiation (< 6 years, ≥ 6 to < 18 years, and ≥ 18 years) and subgroup by subtype of LC-FAOD (LCHAD, VLCAD, CPT II, and TFP deficiency). For subgroup analyses based on age at treatment initiation, results across different age groups in CL201 were generally consistent with those of the overall population. Inconsistent and variable results were observed in CL202. For subgroup analyses based on subtype of LC-FAOD, results across all diagnosis groups in CL201 were consistent with those of the overall population, except for patients with TFP deficiency. For this subtype only, annualized event rate, but not annualized event duration, was reduced. Similarly, for both CL201 rollover and triheptanoin-naive cohorts of Study CL202, all subtypes except for TFP deficiency had results consistent with those of the overall population. The analyses and interpretability of subgroup data are limited by the small sample sizes of individual subgroups and by skewed data in CL202.
Hospitalizations
Hospitalizations were captured as part of the MCEs in CL201 and CL202. Across both studies, most MCEs before and during triheptanoin treatment were hospitalizations due to rhabdomyolysis. Although few events due to cardiomyopathy occurred during the 2 trials, such events are serious and almost all led to hospitalization.
In Study CL201, annualized hospitalization rates and hospitalization days were reduced across all 3 clinical manifestations as a result of triheptanoin treatment but the reduction was most favourable for the aggregate measure that included all event types. For hospitalizations due to total MCEs, including all event subtypes, the difference in the mean annualized event rate was 0.74 hospitalizations per year and the difference in mean annualized event days was 2.92 in favour of triheptanoin.
In the CL201 rollover cohort of Study CL202, the most notable improvement with triheptanoin treatment was in the annualized hospitalization rate of total MCEs. The difference in the mean annualized hospitalization rate of total MCEs, including all event subtypes, was 0.67 events per year in favour of triheptanoin treatment. For the remaining annualized hospitalization rates and hospitalization days due to specific event subtypes, triheptanoin treatment resulted in a reduction across all comparisons, but none were significant. The exception was hospitalization for major rhabdomyolysis events, for which the mean annualized event days appeared to increase with treatment, although median days decreased. This may be due to the highly skewed distribution of annualized event days observed in this cohort. In the triheptanoin-naive cohort of Study CL202, a heavily skewed distribution was observed, which limited the interpretability of results. None of the changes observed in hospitalizations were significant.
In the study by Gillingham et al. (2017), 7 hospitalizations for acute rhabdomyolysis were reported in each treatment group. There was no difference in length of hospital stay.
Emergency Department Usage
ED usage was not measured as part of the efficacy analyses in the Gillingham et al. (2017) study. ED visits were captured as part of the MCEs in CL201 and CL202. Overall, there were very few ED visits before and during triheptanoin treatment, and all ED visits were due to rhabdomyolysis. In Study CL201, there was no meaningful difference in annualized ED visit rates between the pre-triheptanoin and triheptanoin treatment periods. In Study CL202, no statistical analyses were performed to compare ED visits before and during treatment with triheptanoin. Numerically, the CL201 rollover cohort had an increase in ED visits during triheptanoin treatment, whereas the triheptanoin-naive cohort had a decrease in visits. However, the small number of events and lack of statistical testing preclude drawing any definitive conclusions.
Health-Related Quality of Life
Health-related quality of life (HRQoL) was not measured in the Gillingham et al. (2017) study. In studies CL201 and CL202, changes in HRQoL were measured using the Short Form (10) Health Survey (SF-10) in children 5 to 17 years of age, and the Short Form (12) Health Survey version 2 (SF-12v2) in adults 18 years and older. For both assessments, a score of 50 constituted the normalized base score, and each factor of 10 represented 1 SD above or below the mean. Overall, the population included in the assessments of HRQoL was much smaller than the number of patients enrolled in each study or cohort.
In CL201, the main statistical comparison in HRQoL was the change from baseline at week 24. For pediatric patients (SF-10), mean baseline physical summary score (PHS) indicated impairment, whereas the psychosocial summary score (PSS) was similar to that in the general population. At week 24, no notable changes from baseline were observed in PHS or PSS scores. Beyond week 24, the PHS improved over time as a result of treatment, at week 48 and week 78; however, scores remained below the population norm. For adults (SF-12v2), the mean baseline physical component summary (PCS) score was lower than the population mean; the mental component summary (MCS) score was slightly below the norm. At week 24, there was notable improvement in both PCS and MCS scores as a result of treatment. This benefit was maintained through week 78 for the PCS score, but not MCS. Despite improvement, mean PCS scores remained below the population norm.
In CL202, no statistical tests were performed to compare the change in scores over time. Thus, observations can only be made regarding the general trend in scores with treatment in each of the 3 cohorts.
In the CL201 rollover cohort of CL202, SF-10 PHS scores appeared to decline over the 18 months of treatment during CL202; however, scores remained above the baseline level taken before starting triheptanoin in CL201. The SF-10 PSS scores remained generally stable from baseline through the CL202 study; these scores were similar to the population norm. For SF-12v2, PCS scores during the CL202 study were relatively stable and similar to pre-treatment levels. The MCS scores of SF-12 were also relatively stable during the CL202 study, and mean values remained within the population norm.
In the triheptanoin-naive cohort, the baseline mean PHS scores for SF-10 were lower than the population norm, indicating impairment. Scores appeared to improve over time and were similar to the population average while patients were receiving treatment. The mean SF-10 PSS scores were similar to the population norm at baseline and remained within this range throughout the CL202 study. For SF-12v2, changes in HRQoL were difficult to assess due to the small number of patients in each post-baseline assessment.
In the IST or other cohort, scores for both SF-10 and SF-12v2 remained relatively stable throughout the 18 months of treatment in the CL202 study.
Physical Function and Exercise Tolerance
Physical function and exercise tolerance were measured using the 12MWT and cycle ergometry in Study CL201, and treadmill ergometry and phosphocreatine recovery in the study by Gillingham et al. (2017). Study CL202 did not assess physical function or exercise tolerance.
In Study CL201, the primary analysis for the 12MWT was conducted at week 18, and 8 patients performed the 12MWT at all key assessment points. Although results showed overall improvement with triheptanoin treatment in the various parameters, most were not significant. The mean change from baseline was often associated with wide confidence intervals (CIs), reducing the certainty of the results. The only notable improvement in the 12MWT parameters was in the energy expenditure index (EEI) from baseline to week 18, although baseline EEI was already within the normal range, as identified in the study (0.14 beats/m to 0.89 beats/m).
In Study CL201, the primary analysis for the cycle ergometry test was conducted at week 24, and 7 patients performed the cycle ergometry test at both baseline and the later assessment. At week 24, cycle ergometry workload and duration improved overall, although neither were significant.
In the Gillingham et al. (2017) study, all patients completed the treadmill ergometry test to measure exercise tolerance. After 4 months of treatment, the only notable difference between the 2 treatment groups was in maximum heart rate (HR), with a mean difference in change from baseline of 6.98 beats/min (95% CI, 0.34 to 13.63) in favour of triheptanoin. There was no difference between the 2 treatment groups for VO2 or peak double product (a marker of cardiac workload measured by multiplying systolic blood pressure by HR); systolic blood pressure remained constant throughout the test.
The study by Gillingham et al. (2017) also measured phosphocreatine recovery after a repetitive lower leg exercise to evaluate muscle adenosine triphosphate (ATP) synthesis. This exercise protocol was completed by 8 adults in the triheptanoin group and 7 adults in the trioctanoin group. After 4 months of treatment, there was no difference between the 2 treatment groups in test results.
Cardiac Function Parameters
Cardiac function was measured using echocardiography in all 3 included studies. In Study CL201, an echocardiogram was performed on all patients at baseline and on 35 patients at week 24. At baseline, mean LV ejection fraction (LVEF) was within the normal rage specified in the study (55% to 70%), and no significant change was observed at week 24. In Study CL202, there were no notable changes overall in the echocardiography parameters. In all 3 cohorts, the mean LVEF at baseline was also within the normal range.
In the Gillingham et al. (2017) study, an echocardiogram was assessed in 21 patients (n = 10 triheptanoin, n = 11 trioctanoin). After 4 months of treatment, there was a difference between the 2 treatment groups in change from baseline in mean LV wall mass as well as mean LVEF. For LV wall mass, the difference in relative change from baseline between the 2 treatment groups was 20% in favour of triheptanoin. For LVEF, the difference between triheptanoin and trioctanoin in change from baseline was 7.4% (95% CI, −0.1% to 15%) in favour of triheptanoin. Of note, all patients except for 1 had normal cardiac function at baseline; the majority of the observed changes were within the normal range.
Harms Results
Safety data are summarized in Table 4. All or almost all (98.7%) of patients enrolled in studies CL201 and CL202, respectively, reported at least 1 treatment-emergent adverse event (TEAE). Although the total number of patients who experienced at least 1 TEAE was not reported in the Gillingham et al. (2017) study, it appears that the majority of patients did experience 1 or more TEAEs; there was a similar frequency of various AEs between the triheptanoin and trioctanoin treatment groups. Of note, complications of the underlying LC-FAOD (e.g., rhabdomyolysis) were also captured as an AE in all 3 studies, which likely contributed to the high rates of reported TEAEs. Overall, the reported TEAEs were similar across studies and generally consistent with the known AE profile of triheptanoin or the underlying LC-FAOD. The most commonly reported TEAEs were rhabdomyolysis, GI-related TEAEs (e.g., diarrhea, vomiting, GI upset), or infections (e.g., upper respiratory tract infections, viral illnesses).
Treatment-emergent serious adverse events (SAEs) were reported in 65.5% of patients in CL201 and 76.0% of patients in CL202; these rates included MCEs that were also reported as an SAE. In Study CL202, the proportion of patients who experienced at least 1 SAE during the study was similar across the 3 cohorts. The most common SAEs were related to the underlying LC-FAOD (e.g., rhabdomyolysis) or acute infectious diseases, including GI infections. The study by Gillingham et al. (2017) did not categorize TEAEs by severity or seriousness. In Study CL201, 4 patients discontinued triheptanoin treatment due to TEAEs, most of which were GI-related. Treatment was discontinued due to TEAEs in 1 patient in Study CL202 (non-serious rhabdomyolysis) and in none of the patients in the Gillingham et al. (2017) study. Across the 3 studies, 2 deaths were reported, both in Study CL201; neither was considered to be due to triheptanoin. Although weight gain was identified as a notable harm in the CADTH review protocol, it was not reported as an AE in any of the 3 studies. According to growth measures collected throughout the study, there were no clinically significant changes in z scores for weight (in pediatric patients for CL201 and CL202). In the Gillingham et al. (2017) study, no difference in body composition or weight gain was noted between the 2 treatment groups.
Additional Information
As part of the sponsor’s feedback on this CADTH reimbursement review report, the sponsor sent CADTH a summary of updated analysis for certain outcomes in Study CL202 (Appendix 5). Due to the brief and selective nature of the information provided, CADTH could not use the summary to update all the relevant CL202 interim data and is unable to provide critical appraisal of the updated analysis.7
Table 2: Summary of Key Efficacy Results From Pivotal and Protocol-Selected Studies — Total Major Clinical Events and Hospitalizations for Total Major Clinical Events
Result | CL201 | CL202 | ||||||
|---|---|---|---|---|---|---|---|---|
Triheptanoin N = 29 | CL201 rollover N = 24 | Triheptanoin-naive N = 20 | IST/other N = 31 | |||||
Pre-triheptanoin | Triheptanoina | Pre-triheptanoin | Triheptanoina | Pre-triheptanoin | Triheptanoina | Pre-triheptanoin | Triheptanoina | |
Total major clinical events (all event subtypes)b | ||||||||
Annualized event rate (events per year) | ||||||||
Mean (SD) | 1.69 (1.61) | 0.88 (1.14) | 1.76 (1.640) | 0.96 (1.09) | 2.95 (3.01) | 7.72 (27.05) | NR | NR |
Median (IQR) | 1.33 (0.67 to 2.25) | 0.66 (0.00 to 1.31) | 1.53 (0.33 to 2.73) | 0.50 (0.0 to 1.62) | 2.33 (1.00 to 3.83) | 0.71 (0.0 to 1.90) | NR | NR |
Difference in mean (events per year)c | 0.81 | 0.80 | NA | NR | ||||
P valued | 0.021e | 0.032e | 0.107f | NR | ||||
Annualized event days (days per year) | ||||||||
Mean (SD) | 5.96 (6.08) | 2.96 (3.97) | 6.31 (6.35) | 5.78 (11.50) | 18.86 (28.92) | 28.89 (85.18) | NR | NR |
Median (IQR) | 5.33 (0.67 to 8.67) | 1.24 (0.00 to 4.67) | 5.33 (0.33 to 9.00) | 1.83 (0.0 to 5.67) | 10.00 (3.33 to 19.00) | 2.00 (0.0 to 6.58) | NR | NR |
Difference in mean (days per year)c | 3.00 | NA | NA | NR | ||||
P valued | 0.028e | 0.300f | 0.148f | NR | ||||
Hospitalizations for total major clinical events (all event subtypes)b | ||||||||
Annualized event rate (events per year) | ||||||||
Mean (SD) | 1.39 (1.35) | 0.65 (1.01) | 1.43 (1.32) | 0.76 (1.01) | 2.28 (2.04) | 7.59 (27.09) | NR | NR |
Median (IQR) | 1.15 (0.00 to 2.00) | 0.00 (0.00 to 0.68) | 1.33 (0.00 to 2.12) | 0.33 (0.00 to 1.46) | 2.00 (0.67 to 3.83) | 0.33 (0.00 to 1.56) | NR | NR |
Difference in mean (events per year)c | 0.74 | NA | NA | NR | ||||
P valued | 0.016e | 0.043e | 0.276f | NR | ||||
Annualized event days (days per year) | ||||||||
Mean (SD) | 5.66 (6.11) | 2.74 (3.94) | 5.98 (6.38) | 5.59 (11.54) | 18.19 (28.93) | 28.75 (85.22) | NR | NR |
Median (IQR) | 4.33 (0.00 to 8.00) | 0.00 (0.00 to 4.16) | 4.83 (0.00 to 8.67) | 1.83 (0.00 to 5.33) | 9.664 (2.33 to 18.00) | 1.33 (0.00 to 6.25) | NR | NR |
Difference in mean (days per year)c | 2.92 | NA | NA | NR | ||||
P valued | 0.032e | 0.439f | 0.292f | NR | ||||
IQR = interquartile range; IST = investigator-sponsored trial; NA = not applicable; NR = not reported; SD = standard deviation.
Note: Only the efficacy end points and parameters deemed to show significant change according to the trial reports or publications (in at least 1 study/treatment cohort) have been included in the table.
aFor both studies CL201 and CL202, the pre-triheptanoin period consists of the 18 months preceding triheptanoin initiation (or from birth to triheptanoin initiation for infants). The triheptanoin treatment period was as follows for each study/cohort (or early termination date, whichever was earlier): Study CL201 – between the triheptanoin initiation date and completion date; Study CL202, CL201 rollover cohort – the first 36 months following triheptanoin initiation during the combined CL201/CL202 study period; Study CL202, triheptanoin-naive cohort – the first 18 months following triheptanoin initiation during the CL202 study period; CL202, IST/Other Cohort – data while on treatment with triheptanoin were not compared to a retrospective period due to limited historical information on medical management before triheptanoin.
bMajor clinical events included rhabdomyolysis, hypoglycemia, and cardiomyopathy events caused by LC-FAODs, resulting in any hospitalization, ED or acute care visits, or emergency interventions.
cThe difference in the mean annualized event rates and mean annualized event days between pre-triheptanoin and triheptanoin treatment periods are only provided for results deemed statistically significant according to the studies (P ≤ 0.05).
dP value not adjusted for multiplicity.
eP value calculated using a paired t-test. Analyses were not adjusted for multiple testing (i.e., the type I error rate had not been controlled).
fP values from Wilcoxon signed rank test are presented, as the normality assumption was violated (Shapiro-Wilk normality test P value < 0.05). Analyses were not adjusted for multiple testing (i.e., the type I error rate had not been controlled).
Source: CL201 Clinical Study Report,8 CL202 Clinical Study Report,9 Gillingham et al. (2017).
Table 3: Summary of Key Efficacy Results From Pivotal and Protocol-Selected Studies — SF-10, SF-12, 12MWT, Treadmill Ergometry, and Echocardiogram
Result | CL201 | CL202 | Gillingham et al. (2017) | |||
|---|---|---|---|---|---|---|
Triheptanoin N = 29 | CL201 rollover N = 24 | Triheptanoin-naive N = 20 | IST/other N = 31 | Triheptanoin N = 16 | Trioctanoin N = 16 | |
SF-10 (5 years to 17 years of age) | ||||||
Physical summary score | ||||||
Test time 1 | Week 24 | Month 6 | Month 6 | Month 6 | NA | NA |
n | 5 | 8 | 5 | 14 | NA | NA |
Baseline mean (SD) | 13.94 (11.91) | 39.62 (9.93) | 29.19 (13.20) | 34.22 (18.35) | NA | NA |
Mean change from baseline (SD or SE)b | 2.16 (SE = 2.44) | −4.22 (SD = 13.37) | 13.58 (SD = 5.22) | −1.45 (SD = 19.03) | NA | NA |
95% CI | −2.62 to 6.94 | NR | NR | NR | NA | NA |
P valuea | 0.375 | NR | NR | NR | NA | NA |
Test time 2 | Week 78 | Month 18 | Month 18 | Month 18 | NA | NA |
n | 3 | 8 | 2 | 15 | NA | NA |
Baseline mean (SD) | 18.92 (12.09) | 39.62 (9.93) | 21.12 (20.88) | 34.09 (17.69) | NA | NA |
Mean change from baseline (SD or SE)b | 17.30 (SE = 1.43) | −4.00 (SD = 12.86) | 34.39 (SD = 23.29) | −4.00 (SD = 12.86) | NA | NA |
95% CI | 14.51 to 20.09 | NR | NR | NR | NA | NA |
P valuea | < 0.0001 | NR | NR | NR | NA | NA |
Psychosocial summary score | ||||||
Test time 1 | Week 24 | Month 6 | Month 6 | Month 6 | NA | NA |
n | 5 | 8 | 5 | 14 | NA | NA |
Baseline mean (SD) | 46.77 (14.57)c | 52.03 (7.79)c | 42.85 (11.52)c | 49.29 (8.95)c | NA | NA |
Mean change from baseline (SD or SE)b | 0.82 (SE = 2.63) | 0.45 (SD = 2.38) | 13.01 (SD = 8.44) | −2.74 (SD = 10.33) | NA | NA |
95% CI | −4.34 to 5.97 | NR | NR | NR | NA | NA |
P valuea | 0.756 | NR | NR | NR | NA | NA |
Test time 2 | Week 78 | Month 18 | Month 18 | Month 18 | NA | NA |
n | 3 | 8 | 2 | 15 | NA | NA |
Baseline mean (SD) | 49.80 (9.39)c | 52.03 (7.79)c | 41.78 (6.31)c | 49.98 (9.03)c | NA | NA |
Mean change from baseline (SD or SE)b | 2.11 (SE = 2.92) | −0.89 (SD = 4.20) | 13.82 (SD = 0.64) | −1.78 (SD = 9.15) | NA | NA |
95% CI | −3.61 to 7.82 | NR | NR | NR | NA | NA |
P valuea | 0.470 | NR | NR | NR | NA | NA |
SF-12 (≥ 18 years of age) | ||||||
Physical component summary score | ||||||
Test time 1 | Week 24 | Month 6 | Month 6 | Month 6 | NA | NA |
n | 5 | 4 | 2 | 10 | NA | NA |
Baseline mean (SD) | 28.61 (6.51) | 30.81 (8.19) | 29.97 (4.15) | 44.02 (12.37) | NA | NA |
Mean change from baseline (SD or SE)b | 8.87 (SE = 1.63) | 0.26 (SD = 1.92) | 3.86 (SD = 13.92) | 0.18 (SD = 5.26) | NA | NA |
95% CI | 5.67 to 12.08 | NR | NR | NR | NA | NA |
P valuea | < 0.0001 | NR | NR | NR | NA | NA |
Test time 2 | Week 78 | Month 18 | Month 18 | Month 18 | NA | NA |
n | 5 | 4 | 1 | 10 | NA | NA |
Baseline mean (SD) | 28.61 (6.51) | 30.81 (8.19) | 32.90 (NA) | 44.02 (12.37) | NA | NA |
Mean change from baseline (SD or SE)b | 3.62 (SE = 1.72) | 2.15 (SD = 10.61) | 17.71 (NA) | 1.38 (SD = 10.11) | NA | NA |
95% CI | 0.25 to 6.99 | NR | NR | NR | NA | NA |
P valuea | 0.035 | NR | NR | NR | NA | NA |
Mental component summary score | ||||||
Test time 1 | Week 24 | Month 6 | Month 6 | Month 6 | NA | NA |
n | 5 | 4 | 2 | 10 | NA | NA |
Baseline mean (SD) | 42.54 (20.81)c | 53.85 (11.36)c | 43.47 (11.80)c | 47.09 (15.11)c | NA | NA |
Mean change from baseline (SD or SE)b | 9.70 (SE = 4.00) | 3.55 (SD = 8.95) | 7.08 (SD = 11.60) | 2.73 (SD = 4.72) | NA | NA |
95% CI | 1.87 to 17.54 | NR | NR | NR | NA | NA |
P valuea | 0.015 | NR | NR | NR | NA | NA |
Test time 2 | Week 78 | Month 18 | Month 18 | Month 18 | NA | NA |
n | 5 | 4 | 1 | 10 | NA | NA |
Baseline mean (SD) | 42.54 (20.81)c | 53.85 (11.36)c | 51.81 (NA)c | 47.09 (15.11)c | NA | NA |
Mean change from baseline (SD or SE)b | 4.42 (SE = 6.74) | −2.90 (SD = 6.83) | −14.92 (NA) | 4.43 (SD = 11.29) | NA | NA |
95% CI | −8.78 to 17.62 | NR | NR | NR | NA | NA |
P valuea | 0.512 | NR | NR | NR | NA | NA |
12MWT – energy expenditure index (≥ 6 years of age) | ||||||
Week 18 | ||||||
n | 8 | NA | NA | NA | NA | NA |
Baseline mean (SD), beats/m | 0.26 (0.20)c | NA | NA | NA | NA | NA |
LS mean (SE) change from baseline, beats/mb | −0.18 (0.09) | NA | NA | NA | NA | NA |
95% Cl | −0.35 to 0.00 | NA | NA | NA | NA | NA |
P valuea | 0.049 | NA | NA | NA | NA | NA |
Week 60 | ||||||
n | 8 | NA | NA | NA | NA | NA |
Baseline mean (SD), beats/m | 0.26 (0.20)c | NA | NA | NA | NA | NA |
LS mean (SE) change from baseline, beats/mg | −0.050 (0.07) | NA | NA | NA | NA | NA |
95% Cl | −0.18 to 0.08 | NA | NA | NA | NA | NA |
P valuea | 0.443 | NA | NA | NA | NA | NA |
Treadmill ergometry — maximum heart rate | ||||||
Month 4 | ||||||
n | NA | NA | NA | NA | 16 | 16 |
Mean difference in change from baseline, beats/min (95% CI) | NA | NA | NA | NA | 6.98 (0.34 to 13.63) | |
P valuea | NA | NA | NA | NA | 0.040 | |
Echocardiogram | ||||||
LVEF | ||||||
Test time 1 | NA | Month 12 | Month 12 | Month 12 | Month 4 | Month 4 |
n | NA | 21 | 10 | 29 | 10 | 11 |
Baseline mean (SD), % | NA | 62.05 (7.82)c | 60.40 (6.08)c | 61.45 (8.33)c | NRc | NRc |
Mean change from baseline, % (SD) or | NA | 0.43 (8.14) | 1.70 (9.15) | −0.28 (6.81) | NR | |
Mean difference in change from baseline, % (95% CI) | NA | NR | NR | NR | 7.4% (−0.1 to 15) | |
P valuea | NA | NR | NR | NR | 0.046 | |
Test time 2 | Week 24 | Month 24 | Month 24 | Month 24 | NA | NA |
n | 25 | 12 | 6 | 25 | NA | NA |
Baseline mean (SD), % | 61.36 (9.28)c | 62.75 (6.33)c | 57.50 (4.76)c | 61.84 (8.76)c | NA | NA |
Mean change from baseline, % (SD) or | 1.08 (1.07) | −2.00 (11.02) | 8.33 (4.68) | 0.72 (7.92) | NA | NA |
Mean difference in change from baseline, % (95% CI) | NA | NR | NR | NR | NA | NA |
P valuea | 0.473d | NR | NR | NR | NA | NA |
LVM | ||||||
Test time 1 | NR | Month 12 | Month 12 | Month 12 | Month 4 | Month 4 |
n | NR | 18 | 10 | 31 | 10 | 11 |
Baseline mean, g (SD) | NR | 91.78 (61.03) | 70.50 (49.24) | 117.16 (52.13) | NR | NR |
Mean change from baseline, g (SD) | NR | −1.50 (29.37) | −0.90 (31.25) | 12.58 (22.65) | NR | |
Mean difference in change from baseline, fold change (95% CI) | NR | NR | NR | NR | 0.80 (0.65 to 0.99) | |
P valuea | NR | NR | NR | NR | 0.041 | |
Test time 2 | NR | Month 24 | Month 24 | Month 24 | NA | NA |
n | NR | 10 | 5 | 28 | NA | NA |
Baseline mean (SD), % | NR | 77.80 (39.66) | 70.60 (51.74) | 117.29 (50.89) | NA | NA |
Mean change from baseline, % (SD) or | NR | 13.20 (32.30) | −13.60 (37.32) | 5.61 (34.47) | NA | NA |
Mean difference in change from baseline, % (95% CI) | NR | NR | NR | NR | NA | NA |
P valuea | NR | NR | NR | NR | NA | NA |
12MWT = 12-minute walk test; CI = confidence interval; IST = investigator-sponsored trial; LS = least squares; LVEF = left ventricular ejection fraction; LVM = left ventricular mass; NA = not applicable; NR = not reported; SD = standard deviation; SE = standard error; SF-10 = Short Form (10) Health Survey; SF-12 = Short Form (12) Health Survey.
Note: Only the efficacy end points and parameters deemed to show significant change according to the trial reports or publications (in at least 1 study/treatment cohort) have been included in the table.
aP value not adjusted for multiplicity.
bFor HRQoL measures (SF-10 and SF-12), changes from baseline values are reported as LS mean (SE) change from baseline for CL201 and mean (SD) change from baseline for CL202. For SF-10, SF-12, and the 12MWT in Study CL201, the LS mean, SE, 95% CI, and 2-sided P value are from the generalized estimation equation (GEE) model. The GEE model included the change from baseline for each parameter as the dependent variable and time as the categorical variable and were adjusted for baseline measurement with compound symmetry covariance structure. Analyses were not adjusted for multiple testing (i.e., the type I error rate had not been controlled).
cBaseline measures were considered to be normal or within normal range.
dP value calculated using a paired t-test. Analyses were not adjusted for multiple testing (i.e., the type I error rate had not been controlled).
Source: CL201 Clinical Study Report,8 CL202 Clinical Study Report,9 Gillingham et al. (2017).
Table 4: Summary of Key Harms Results From Pivotal and Protocol-Selected Studies — Safety
Result | CL201 | CL202 | Gillingham et al. (2017) | |||
|---|---|---|---|---|---|---|
Triheptanoin N = 29 | CL201 rollover N = 24 | Triheptanoin-naive N = 20 | IST/other N = 31 | Triheptanoin N = 16 | Trioctanoin N = 16 | |
Harms, n (%) (safety analysis set) | ||||||
AEs | 29 (100.0) | 24 (100.0) | 19 (95.0) | 31 (100.0) | NRa | NRa |
SAEs | 19 (65.5) | 18 (75.0) | 15 (75.0) | 24 (77.4) | NRa | NRa |
WDAEs | 4 (13.8) | 0 (0.0) | 1 (5.0) | 0 (0.0) | 0 (0.0) | 0 (0.0) |
Deaths | 0 (0.0) | 0 (0.0) | 1 (5.0) | 1 (3.2) | 0 (0.0) | 0 (0.0) |
Notable harms | ||||||
Diarrhea | 16 (55.2) | 5 (20.8) | 8 (40.0) | 10 (32.3) | 5 (31.3) | 6 (37.5) |
Vomiting | 14 (48.3) | 11 (45.8) | 7 (35.0) | 8 (25.8) | 6 (37.5) | 0 |
Abdominal pain | 8 (27.6) | 2 (8.3) | 3 (15.0) | 2 (6.5) | NR | NR |
Abdominal pain upper | 4 (13.8) | 6 (25.0) | 2 (10.0) | 4 (12.9) | NR | NR |
Gastrointestinal pain | 3 (10.3) | 2 (8.3) | 1 (5.0) | 0 (0.0) | NR | NR |
Gastrointestinal upset | NR | NR | NR | NR | 11 (68.8) | 12 (75.0) |
AE = adverse event; IST = investigator-sponsored trial; NR = not reported; SAE = serious adverse event; WDAE = withdrawal due to adverse event.
aThe study by Gillingham et al. (2017) did not provide a total number of patients who experienced at least 1 AE, although it appears that the majority of patients did experience 1 or more TEAEs. The TEAEs were also not categorized by severity or seriousness.
Source: CL201 Clinical Study Report,8 CL202 Clinical Study Report,9 Gillingham et al. (2017).10
Critical Appraisal
A few major limitations and sources of bias are provided. Further details for each point, as well as a complete list of limitations and sources of bias, are available in the Critical Appraisal section of this report.
Studies CL201 and CL202 were single-arm, phase II trials that did not include a parallel treatment comparator. Analyses of MCEs were conducted using a before-after design. The MCEs were evaluated before and after initiation of triheptanoin, with each patient serving as his or her own control, using data collected retrospectively from medical records. Due to inherent limitations in the study design (e.g., lack of relevant comparator as a control, no blinding of treatment, potential influence of concurrent therapies, impact of growth and maturation of patients on test performance), results from these 2 trials could be considered supportive but cannot offer solid evidence of treatment benefits. The comparative efficacy of triheptanoin compared to even-chain MCTs was investigated only in the Gillingham et al. (2017) trial.
The effects of triheptanoin as first-line treatment in patients who have not received any form of prior MCT supplementation require further investigation. The majority of patients (≥ 90%) in studies CL201 and the CL201 rollover and triheptanoin-naive cohorts of CL202 had received prior treatment with an MCT formulation. As per inclusion criteria, all patients enrolled in the Gillingham et al. (2017) study had received prior supplementation with MCT.
Study results cannot be generalized to patients with CACT or CPT I deficiencies due to low enrolment numbers in Study CL202, and these patients were excluded from the CL201 and Gillingham et al. (2017) trials. Notably, in Canada, the CPT IA P479L variant is prevalent in Indigenous communities (e.g., British Columbia First Nations and Inuit populations) and the CPT IA G710E variant is prevalent in Hutterite communities, but data on the efficacy of triheptanoin in these groups are lacking.11,12 However, the clinical experts consulted on this review note that patients with these CPT IA variants typically have mild disease or are asymptomatic and generally do not require active treatment with MCTs.
In all 3 trials, the sample size of each study and treatment group and cohort were small. As a result, differences in 1 or 2 patients can have a substantial impact on results, leading to a high degree of uncertainty due to imprecise estimates. Nevertheless, because of the rarity of this disease, such a small sample size is not unusual.
None of the 3 trials employed a hierarchical testing procedure or strategy to control for the overall type I error rate; no adjustments were made for multiple testing among any of the outcomes analyzed. Consequently, statistically significant results should be interpreted with consideration of the potential for inflated type I error.
The evaluation of patient-reported outcomes (e.g., HRQoL), exercise tests that depend on patient effort, or AEs in studies CL201 and CL202 may have been influenced by the unblinded treatment regimens, resulting in reporting bias. Furthermore, an estimated minimally important difference (MID) has not been identified in the LC-FAOD population for SF-10 or SF-12, nor have these tests been validated in patients with LC-FAODs. For these reasons, along with the small sample sizes, the clinical significance of the HRQoL findings is unclear.
Confounding due to changes in diet and MCT dosage cannot be ruled out. For example, in Study CL201, there was an increase of approximately 10% DCI in the dosage of MCT when patients transitioned from MCT oil to triheptanoin after study enrolment. For studies CL202 (except for the CL201 rollover cohort) and Gillingham et al. (2017), no baseline dietary treatment information, including dosage of prior MCT supplementation, was available.
The efficacy of triheptanoin on survival, peripheral neuropathy, or retinopathy is unknown, as none of the studies measured these important clinical outcomes. As well, the majority of MCEs documented in studies CL201 and CL202 were due to rhabdomyolysis. The small number of events and patients who had cardiomyopathy or experienced hypoglycemia limits the interpretation of efficacy for MCEs other than rhabdomyolysis.
The RCT by Gillingham et al. (2017) did not include end points that were deemed important by clinicians and patient groups, including survival, clinical events, symptoms such as fatigue, or HRQoL. Thus, the relative efficacy of triheptanoin compared to even-chain MCTs (i.e., trioctanoin) for these important outcomes is unknown, and available data do not provide evidence to support the use of triheptanoin over trioctanoin to prevent or reduce clinical events.
Indirect Comparisons
No indirect comparisons were submitted by the sponsor or identified in the literature search.
Other Relevant Evidence
No other relevant evidence was included in this review.
Conclusions
LC-FAODs are a complex group of diseases with a wide spectrum of disease manifestations and heterogenous presentations. Based on the 3 sponsor-submitted studies, current evidence does not adequately address the clinical question of whether triheptanoin improves relevant outcomes compared to current standard of care in patients with LC-FAOD who require treatment.
The 2 single-arm, phase II, open-label trials (CL201 and CL202) appear to show a reduction in annualized rate and duration of MCEs, mainly driven by hospitalizations due to rhabdomyolysis, when comparing events that occurred during triheptanoin treatment to a retrospective pre-treatment period. The clinical experts consulted by CADTH noted that these results are clinically meaningful; however, not all patients responded favourably. Due to the significant risk of bias, potential confounding factors, and statistical uncertainty, it cannot be stated with confidence whether any benefits observed in these trials are attributable to triheptanoin treatment.
The double-blind RCT by Gillingham et al. (2017) appears to show some benefit of triheptanoin over trioctanoin, an even-chain MCT, in exercise tolerance (i.e., maximum HR on treadmill ergometry), as well as cardiac parameters (i.e., LVEF and LV mass on echocardiography). However, the relationship between the modest difference in HR and longer-term exercise tolerance is unknown, and the clinical relevance of cardiac parameter findings is difficult to determine, considering that patients had normal cardiac function at baseline. The short duration of treatment (4 months) and the lower dose of triheptanoin than that recommended in the product monograph further add to the limitations in generalizability of the study results to clinical practice. At this time, there is no evidence showing superiority of triheptanoin over other sources of MCTs for the clinically relevant end points of mortality, morbidity such as reduction in clinical events or hospitalization, or HRQoL. As a result, firm conclusions on the clinical benefit of triheptanoin over even-chain MCTs cannot be made.
Because of its odd-carbon-chain structure, triheptanoin is thought to act as an anaplerotic compound that directly addresses the tricarboxylic acid (TCA) cycle deficiencies that arise in LC-FAODs, which are not addressed by even-chain MCTs.1 However, based on currently available aggregate data, it is unclear whether the advantage at the cellular level translates to definitive clinical benefit. Overall, whether triheptanoin will improve the lives of patients with LC-FAOD, compared to even-chain MCTs, has not been adequately addressed with available data. It is highly uncertain whether triheptanoin is better than the alternative MCT formulations currently available. Evidence gaps also remain for other clinical manifestations of LC-FAODs that have not been investigated; for example, retinopathy or peripheral neuropathy. The clinical experts consulted on this review emphasized the unmet need in previously undiagnosed patients who present with acute, life-threatening cardiovascular or metabolic decompensation. In these crisis situations, the experts anticipate patients will start on triheptanoin as inpatients and continue on treatment upon discharge if they have a good response.
Introduction
Disease Background
Fatty acid oxidation disorders are inborn errors of metabolism caused by the disruption of fatty acid substrate entry into mitochondria or a defect in their beta-oxidation in the mitochondrial matrix. These metabolic disorders are primarily categorized as medium- or long-chain, based on the length of the fatty acid chain, with LC-FAODs affecting metabolism of fatty acids greater than 8 to 12 carbons. LC-FAODs are a heterogenous group of rare, autosomal recessive genetic disorders.1 Six types of LC-FAODs have been identified: carnitine palmitoyltransferase (CPT I or CPT II) deficiency, very long-chain acyl coenzyme A (acyl-CoA) dehydrogenase (VLCAD) deficiency, long-chain 3-hydroxy-acyl-coA dehydrogenase (LCHAD) deficiency, and trifunctional protein (TFP) deficiency. The most common is VLCAD deficiency.3
The mutations associated with this disorder occur in genes that encode enzymes involved in the carnitine shuttle, which transports long-chain fatty acids into the mitochondria, or in beta-oxidation for conversion of the long-chain fatty acids into energy (Figure 1).3 LC-FAODs are characterized by chronic energy deficiency, with episodes of acute crises of energy production. During times of reduced intake, prolonged fasting, or increased demand for energy due to illness, fatty acids are released from storage in the adipose tissues. Normally, fatty acids are then metabolized in the mitochondria via beta-oxidation and used as a major source of energy for the myocardium, skeletal muscles, and liver.1,2 With exercise, glycogen from muscle is used as the main source of energy for the initial 20 to 30 minutes; however, prolonged and high-intensity exercise depends on fatty acids for sources of energy. Because patients with LC-FAOD are unable to convert long-chain fatty acids into energy, they are at risk of metabolic decompensation, particularly during times of physiologic stress or when energy intake is reduced (e.g., fasting, vigorous exercise, illness, vomiting, or surgery).2 Potentially toxic fatty acid intermediates can also accumulate in the blood and organs.1
The clinical presentation of LC-FAODs can vary depending on the specific disorder and age of onset, although there are common elements. Acute manifestations of LC-FAODs can include episodes of hypoketotic hypoglycemia, hyperammonemia, or rhabdomyolysis induced by fasting, exercise, or illness. Patients also develop cardiomyopathy or hepatic dysfunction, which leads to hospitalizations and premature death. Hypoglycemia is experienced more often in infants and younger children, whereas myopathy is more frequent in adults or children older than 6 years of age. Peripheral neuropathy and pigmentary retinopathy are unique to LCHAD and TFP deficiencies.1
According to the clinical experts consulted by CADTH, LC-FAODs can largely be divided into infantile, pediatric, and adult presentations of the disease. Early in life, manifestations include marked metabolic disturbance, with high mortality and morbidity. Newborn screening for LC-FAODs has contributed to early identification and treatment, which has reduced mortality rates. Infants have moderate forms, which are often implicated with hepatic and cardiac disease. Juveniles and adults who are diagnosed with LC-FAODs often exhibit neuromuscular symptoms such as rhabdomyolysis, peripheral neuropathy, and retinopathy, which can range in severity from mild to severe and significantly impact quality of life and physical functioning. The spectrum of disease severity can also be correlated with the type of LC-FAOD. For example, manifestations of LCHAD are mainly severe, whereas half of patients with VLCAD can have asymptomatic or mild presentations, as evidenced by milder variants identified by the newborn screening tests.
Before the introduction of newborn screening, mortality was as high as 60% to 90%. Newborn screening for LC-FAODs and early intervention have reduced mortality rates; however, patients continue to experience morbidity due to episodes of metabolic decompensation. These recurrent symptoms and hospitalizations have a negative impact on the quality of life of patients and caregivers.1
There is considerable variability in the incidence and prevalence estimates for LC-FAODs. Overall, the estimated collective incidence of FAODs is 1 in 5,000 to 10,000 live births. The prevalence of FAODs ranges widely, from 1 in 100,000 to 1 in 2,000,000, depending on the specific type.4 Although detailed epidemiology of this rare disorder across Canada is limited, some estimates can be derived from provincial data. For example, based on the 2019 report from Newborn Screening Ontario, the following disease prevalence was reported for individual deficiencies: 1 in 323,173 for CPT I, 1 in 387,808 for CPT II, 1 in 161,587 for LCHAD, and 1 in 71,816 for VLCAD.13 The sponsor estimates the incidence of LC-FAODs in Canada to be approximately 10 to 15 births per year. Based on a global prevalence of approximately 1 per 100,000, the sponsor estimates that 380 Canadians have LC-FAODs.5 FAODs occur in both males and females and all ethnic populations.4
Standards of Therapy
The current standard therapy for LC-FAODs mainly involves nutritional and symptomatic management. With nutritional management, the primary goal is to limit the use of long-chain fat as a substrate for energy production. Part of this is achieved by restricting the amount of dietary long-chain fatty acids. However, an adequate amount for normal growth and development is still required. Additionally, patients are counselled to avoid fasting to prevent beta-oxidation and catabolism of long-chain fatty acids into required energy. Further dietary adjustments, such as increasing carbohydrate intake, may also necessary during times of strenuous exercise or illness. Supplementation with carnitine or essential fatty acids (e.g., docosahexaenoic acid) may also be required.1
Patients are also given supplementation with MCTs as a source of fatty acids and calories.1,14 Other than triheptanoin, there are no therapies for treatment of LC-FAODs approved in Canada. Regulation of even-chain MCT supplements in Canada falls under the Natural and Non-prescription Health Products Directorate (NNHPD).15 As such products, even-chain MCTs can be obtained without a prescription but are reimbursed in some jurisdictions under specialized publicly funded drug programs.16 The commercially available non-prescription MCT formulations consist of a mix of even-chain fatty acids, usually 8-carbon (octanoate), 10-carbon (decanoate), and 12-carbon (dodecanoate) fatty acids, and the proportions of fatty acids may vary from lot to lot. MCTs are used as supplementation in patients with LC-FAODs, as they pass through a different metabolic pathway than long-chain fatty acids. For example, MCTs enter the mitochondria directly and do not depend on the carnitine-based transport system. Furthermore, MCTs are metabolized by medium-chain-specific enzymes and bypass the need for long-chain-specific transport and enzymes.
Despite treatment, patients with all LC-FAODs still experience episodes of hypoglycemia, cardiomyopathy, and rhabdomyolysis, and those with LCHAD and TFP deficiencies experience peripheral neuropathy and pigmentary retinopathy as well. Patients also continue to experience recurring hospitalizations as well as high rates of morbidity and mortality.1
Input From Clinical Experts Consulted by CADTH
Standard Therapy in Canada
The overall goals of treatment include prevention of acute metabolic or cardiac decompensations and prevention of long-term complications and disabilities associated with the course of disease. Specific goals can vary with each individual and may include different areas of focus, such as preventing episodes of rhabdomyolysis or hypoglycemia, reducing hospital admissions or duration of hospitalization, slowing progression of cardiomyopathy, improving HRQoL, or increasing measures of physical function, either in terms of activities of daily living or the ability to participate in activities and sports.
Standard treatment is largely supportive and is individualized based on the needs of the patient, often guided by age of diagnosis, severity of clinical presentation, and type of LC-FAOD. Asymptomatic adults generally do not automatically receive treatment; however, asymptomatic early-onset forms (i.e., upon diagnosis on newborn screening) are likely to be treated with standard measures. Chronic treatment usually includes dietary modification (i.e., low fat, high carbohydrate), avoidance of prolonged fasting, avoidance of activity requiring high exertion, and supplementation with medium chain–based products. Some patients may also receive essential fatty acids or carnitine.
Drug
Triheptanoin is an MCT consisting of 3 odd-chain 7-carbon fatty acids (heptanoates). As a source of medium odd-chain fatty acids, triheptanoin bypasses the process requiring the specific enzymes that are deficient in patients with LC-FAODs for the conversion of dietary long-chain fatty acids into energy.6 Triheptanoin is available as an oral liquid containing 100% w/w of triheptanoin as an active ingredient. Each mL of triheptanoin oral liquid provides 8.3 kcal.6
As an odd-chain MCT, triheptanoin is thought to differ from even-chain MCTs in the way it undergoes oxidation (Figure 1). The benefits of odd-carbon triheptanoin are thought to be due to its anaplerotic properties (production of metabolic intermediates), which resupply TCA cycle intermediates. Upon oral administration, triheptanoin is extensively hydrolyzed in the intestines by pancreatic lipases to heptanoate and glycerol. Once in the mitochondria, heptanoate is metabolized by small- and medium-chain beta-oxidation enzymes. By undergoing 1 or 2 cycles of beta-oxidation, the heptanoate produces 2 units of 2-carbon acetyl coenzyme A (CoA) and 1 unit of 3-carbon propionyl-CoA product, or 1 unit of acetyl-CoA and 1 unit of 5-carbon pentanoyl-CoA products.3 Acetyl-CoA is used as a substrate in the TCA cycle as well as for ketone synthesis. Ketones serve as an alternate form of energy for the brain, myocardium, muscle, kidney, and other tissues, and are important when glucose is unavailable during fasting or physiologic stress.1 Propionyl-CoA is further metabolized, ultimately to succinyl-CoA and succinate, which resupplies the TCA cycle intermediates to increase ATP production and supports continued gluconeogenesis, as well as mitochondrial energy production. In the liver, pentanoyl-CoA also serves as an anaplerotic substrate to support generation of ketones, which can be used by peripheral tissues.3 Thus, in addition to bypassing the deficient enzymes, triheptanoin is thought to act as an anaplerotic compound to directly address the TCA cycle deficiencies in LC-FAODs, which are not addressed by administration of even-chain MCTs.1 Unlike triheptanoin, even-carbon fatty acids are thought to have limited effectiveness due to the depletion of odd-chain TCA cycle intermediates.3
Health Canada reviewed triheptanoin under its Priority Review process. A Notice of Compliance was issued on February 15, 2020, which approved triheptanoin as a source of calories and fatty acids for the treatment of adult and pediatric patients with LC-FAODs. The requested reimbursement criteria from Ultragenyx Canada Inc., the sponsor, aligns with the Health Canada indication. On June 30, 2020, the US FDA approved triheptanoin for the treatment of pediatric and adult patients with molecularly confirmed LC-FAODs.
Figure 1: Mechanism of Action of Odd-Carbon (C7) or Even-Carbon (C8) MCTs
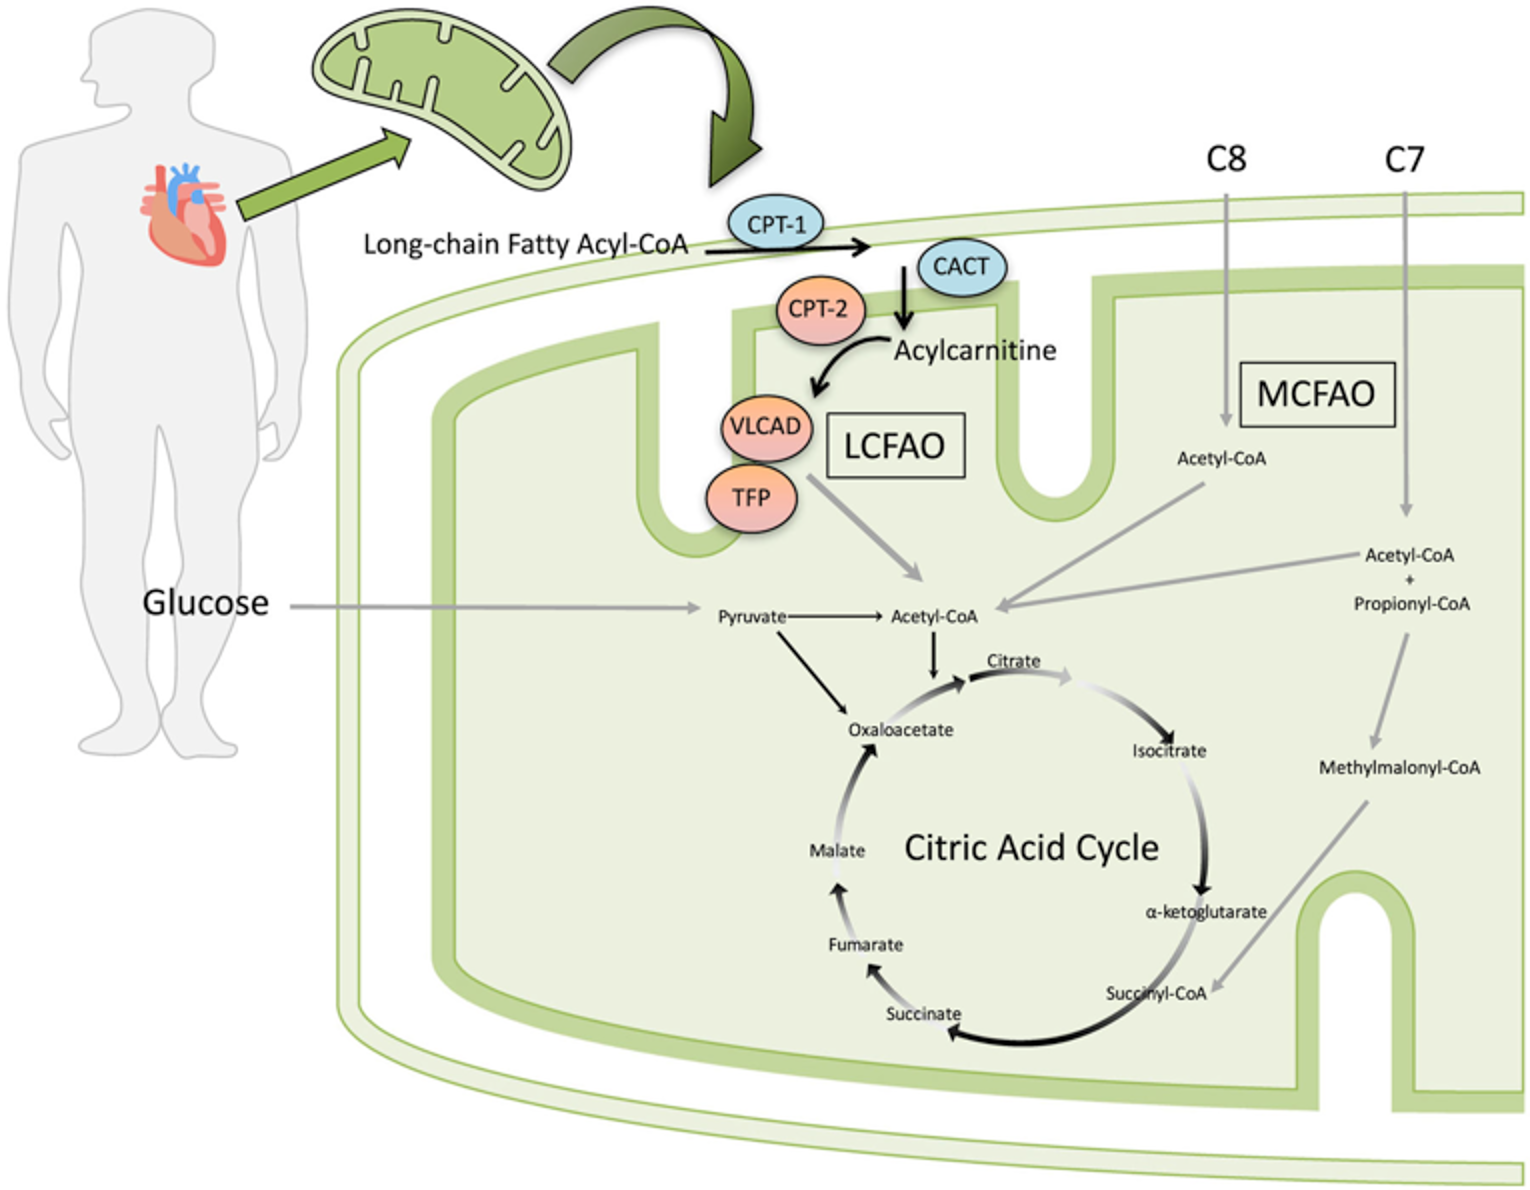
CACT = carnitine-acylcarnitine translocase; CoA = coenzyme A; CPT-1 = carnitine palmitoyltransferase 1; CPT-2 = carnitine palmitoyltransferase 2; LCFAO = long-chain fatty acid oxidation; MCFAO = medium-chain fatty acid oxidation; VLCAD = very long-chain acyl-CoA dehydrogenase; TFP = trifunctional protein.
Note: From original figure: “Model for the proposed benefit of triheptanoin (C7) compared to trioctanoate (C8) among patients with LC-FAODs. Trioctanoate provides three 8-carbon fatty acids (C8) that, once imported into the mitochondria, are oxidized to 4 acetyl-CoA molecules. Triheptanoate provides three 7-carbon fatty acids (C7) that, once imported into the mitochondria, are oxidized to produce 2 acetyl-CoA and 1 propionyl-CoA molecule. Propionyl-CoA is converted to D-methylmalonyl-CoA by mitochondrial propionyl-CoA carboxylase, followed by conversion to succinyl-CoA by D-methylmalonyl-CoA isomerase and L-methylmalonyl-CoA mutase. Succinyl-CoA is an intermediate of the citric acid cycle (CAC) and can increase intermediate pool size of carbon substrates.” Diagram is from the Gillingham et al. (2017) study, in which trioctanoin was used as the source of even-carbon (chain) MCT. The red and blue enzymes represent the enzymes affected by LC-FAOD; the red enzymes are the LC-FAOD types (CPT II, VLCAD, TFP and LCHAD deficiency) included in the trial.
Source: Triheptanoin versus trioctanoin for long-chain fatty acid oxidation disorders: a double blinded, randomized controlled trial. Gillingham MB, Heitner SB, Martin J, et al. J Inherit Metab Dis. 2017;40(6):831-843. © John Wiley and Sons 2017. Reprinted with permission.
Stakeholder Perspectives
Patient Group Input
This section was prepared by CADTH staff based on the input provided by patient groups.
About the Patient Groups and Information Gathered
One patient group, MitoAction (Massachusetts, US), responded to the call for patient input for this CADTH reimbursement review. Input was not received from any Canadian patient group(s).
MitoAction is a non-profit organization founded by patients, parents, and Boston hospital health care leaders who had a vision of improving quality of life for children and adults with mitochondrial disease. MitoAction’s mission is to improve the quality of life for children, adults, and families living with mitochondrial disease through support, education, outreach, advocacy, and clinical research initiatives and by granting wishes for children affected by mitochondrial disease.
MitoAction has engaged with the patient community through weekly support calls, Facebook groups, and a Mito411 Support line. It has received direct feedback from the patient community in the US about their positive experience with triheptanoin (Dojolvi). Since the US approval of triheptanoin, MitoAction has interacted with dozens of adult patients and parents who have shared their feedback.
Disease Experience
MitoAction provided information that patients with LC-FAODs have trouble breaking down fat to produce usable energy. Symptoms of LC-FAODs include lethargy, irritability, noticeably enlarged liver, abnormal heart rhythms, cardiac failure, cardiopulmonary failure, poor muscle tone, and periodic severe muscle pain caused by rhabdomyolysis. Patients must be on a strict diet to manage fat intake and energy reserves. They often need to take breaks when performing simple activities and take naps during the day. Therefore, patients are often unable to participate in normal day-to-day activities, as this becomes too draining and causes extreme exhaustion, which can lead to hospitalization and damage to their organs. As energy levels become depleted, organ function can become significantly impacted and severe muscle weakness can occur; this is known as a “mito crash.” Patients must manage their energy exertion throughout the day, so a simple task can physically overwhelm an individual with LC-FAOD. Limitations to activity can lead to depression, isolation, and other mental health issues, which are very common in patients with a rare disease. LC-FAODs are a progressive disease. Hopefully, with proper treatment and disease management, patients can lead full and meaningful lives, despite their diagnosis.
Experience With Treatment
The patient group indicated that, before triheptanoin was available, patients’ only option was the use of over-the-counter MCT oils. In the US, MCT oils are not regulated by the FDA, and the dosing and quality vary among manufacturers. Compliance is difficult to manage. These products can also be very costly for families.
A high school student shared that she was able to enjoy her senior-year activities because of using triheptanoin. Prior to treatment, she would not have been able to do such activities, but now she even looks forward to not using her wheelchair and walking at her graduation. Parents of patients have shared that, after treatment with triheptanoin, their children are able to participate in extracurricular activities and may not require as much rest time during the day. Patients with LC-FAODs have to be very cognizant of their energy usage, often taking naps throughout the day.
The patient group noted that triheptanoin provides a treatment that allows patients to properly break down fats and therefore produce energy to function. In addition to increased energy levels, patients reported decreased hospitalization as compared to when they were not taking triheptanoin. Patients shared that, since rhabdomyolysis is associated with elevated creatine kinase (CK) levels, while on triheptanoin, their CK levels have not been elevated to critical levels. Another patient shared that, even after the first treatment with triheptanoin, there was a “calm of the storm.” Her health had been severely declining and she was using a wheelchair, fully dependent upon a caregiver, with significant muscle weakness and stress on the heart. Within 3 weeks of taking triheptanoin, she began to have muscle twitches, indicating that her muscles were “coming back to life.” She was able to build upon this returning function and, within 2.5 months, was able to stand on her own. Within 6 months she was able to walk outside her house with a walker. The severe muscle decline had caused significant pain and nausea, and she indicated that, for the first time in a long time, she was able to tolerate food and actually felt hungry. The impact of treatment was life-altering.
MitoAction stated that, with the availability of triheptanoin, patients can now be managed by their clinician using a regulated therapy with controlled dosing and product quality. This treatment is readily accessible in the US with a prescription. Under financial assistance programs, triheptanoin is accessible to every patient in the US who may benefit from the therapy.
Triheptanoin was the first therapy for patients affected by LC-FAODs approved by the FDA. According to MitoAction, this was monumental for this rare disease community, and triheptanoin truly has shown a tremendous impact in the quality of life for patients with LC-FAODs.
Improved Outcomes
The patient group emphasized that the energy depletion for patients with LC-FAODs can be debilitating. The level of exhaustion is almost incomprehensible for someone who has never experienced this level of fatigue. A good analogy is to consider running a house on 1 AA battery that never charges beyond 20%. The disease also has a devastating effect on organs and body functions.
Ideal outcomes for the patient community include increased energy levels, leading to boosted physical activity, improved cognitive functioning, decreased stress on organ systems, and reduced hospitalizations. These outcomes would provide an enhanced quality of life and independence for patients.
Clinician Input
Input From Clinical Experts Consulted by CADTH
All CADTH review teams include at least 1 clinical specialist with expertise regarding the diagnosis and management of the condition for which the drug is indicated. Clinical experts are a critical part of the review team and are involved in all phases of the review process (e.g., providing guidance on the development of the review protocol, assisting in the critical appraisal of clinical evidence, interpreting the clinical relevance of the results, and providing guidance on the potential place in therapy). In addition, as part of the triheptanoin review, a panel of 5 clinical experts from across Canada was convened to characterize unmet therapeutic needs, assist in identifying and communicating situations where there are gaps in the evidence that could be addressed through the collection of additional data, promote the early identification of potential implementation challenges, gain further insight into the clinical management of patients living with a condition, and explore the potential place in therapy of the drug (e.g., potential reimbursement conditions). A summary of this panel discussion is presented.
Unmet Needs
Current treatments may help some patients, but there are patients who still experience recurrence of symptoms despite optimized therapy. For example, musculoskeletal manifestations (e.g., rhabdomyolysis) are often poorly controlled in adults with severe disease. There is a need for more effective treatment for patients with ongoing symptomatic LC-FAODs, particularly those with severe forms of the disease. While metabolic markers of disease and genotype and phenotype correlation may predict some patients with severe forms of LC-FAODs, the correlation is not perfect. Furthermore, currently available therapies do not effectively treat retinopathy or peripheral neuropathy associated with LC-FAODs.
Supplementation with even-chain MCT has led to positive response and reduction of complications in some patients. However, tolerability (i.e., GI AEs) affects adherence to the treatment regimen.
Place in Therapy
In general, triheptanoin would be reserved for more severe cases of LC-FAODs or used as second-line therapy after even-chain MCT products had been tried. For most patients, the panellists anticipate that triheptanoin would be used when there is inadequate response to conventional even-chain MCT supplementation. Triheptanoin is much more costly than even-chain MCT products, and certain patients will still respond to the latter. All patients should be on, and adherent to, appropriate dietary management. Triheptanoin should be considered as first-line treatment in selected patients presenting with life-threatening symptoms of LC-FAODs. These occur most often in infants but are not limited to infants.
Patient Population
It is important for patients to have a confirmed diagnosis that is based on clinical, biochemical, or molecular parameters. The patient population eligible for triheptanoin treatment would be those with an inadequate response despite receiving optimized therapy with dietary measures and even-chain MCT products. It is expected that patients with chronic symptoms would try even-chain MCT products before switching to triheptanoin.
An exception would be previously undiagnosed patients (usually neonates or infants) presenting with acute, life-threatening cardiovascular or metabolic decompensation. In these crisis situations, patients may be started on triheptanoin as an inpatient. If patients respond to triheptanoin, treatment would be expected to continue upon discharge, without requiring a trial of even-chain MCT products.
Assessing Response to Treatment
Depending on the presenting symptoms, goals of treatment vary (e.g., rate of progression of LV dysfunction, frequency of events such as rhabdomyolysis or hospitalization, length of hospital admissions, recurrent episodes of metabolic decompensation, exercise intolerance, muscle pain with exertion, quality of life). Often, the age of the patient, type of LC-FAOD, and clinical severity also influence the goals of treatment. Thus, the definition and assessment of response must be individualized based on the patient’s history. For example, in infants presenting with catastrophic events, survival would be a relevant outcome, and follow-up would be frequent. In older children and adults with stable symptoms, follow-up may be performed every 6 months to 12 months.
Time to response to triheptanoin treatment and assessment intervals will vary according to the indication. Several indications, such as recurrent rhabdomyolysis and episodes of metabolic decompensation (i.e., hypoglycemia, hyperammonemia) can be assessed annually, with the goal of reducing the frequency or duration of hospitalization from clinical events. For chronic progressive cardiomyopathy, assessments (i.e., echocardiograms) can be performed every 6 months to determine whether progression is slowing. A deterioration on at least 2 consecutive echocardiograms may indicate a nonresponse. Other symptoms may show improvement sooner, and therefore can be assessed several months after triheptanoin initiation. As an example, in patients with myopathy and/or exercise intolerance, dynamic testing such as the 12MWT should be performed at baseline and 6 months, with the goal of improvement being similar to those reported in clinical trials. For patients with muscle pain upon exertion, improvement can occur within 1 month to 2 months, and gains can be assessed through HRQoL measures, work or school productivity, participation in exercise, or need for analgesics.
Not all patients will respond to triheptanoin treatment. In general, it is appropriate for a patient who starts triheptanoin to receive an adequate trial and be evaluated annually for improvement or maintenance of effect.
Discontinuing Treatment
Patients who respond to triheptanoin are expected to continue treatment indefinitely, as long as it is tolerated. Treatment may be discontinued according to individualized parameters based on the patient’s medical history. As previously discussed,, the goals of treatment for each patient vary, depending on the presenting symptoms and indication. If parameters used to measure response in the patient return to pre-treatment levels, or gains are not maintained, then triheptanoin treatment should be discontinued at the annual assessment.
Lack of adherence to therapy or assessments may also be an indication to discontinue triheptanoin treatment. After attempts to mitigate the adverse effects and improve tolerance to triheptanoin (e.g., reduce dosage or alter administration schedule), if nonadherence continues, physicians must assess whether continuing triheptanoin is warranted.
Prescribing Conditions
The diagnosis and treatment of LC-FAODs, as well as prescription of triheptanoin for the treatment of LC-FAODs, should be restricted to qualified specialists in pediatric or adult inherited metabolic diseases. Such physicians may also be affiliated with different specialties; for example, medical genetics, biochemical genetics, pediatrics, and endocrinology.
In most cases, triheptanoin would be started in an outpatient specialty clinic. In some cases, for example, in a previously undiagnosed patient presenting to a hospital with acute metabolic or cardiac decompensation, triheptanoin would be started on an inpatient basis by a metabolic disease specialist; upon the patient’s discharge, the treatment would be continued under the guidance of a specialty clinic.
Additional Considerations
The panellists noted that patients with LC-FAODs present with varying symptoms that range in severity. Thus, it is important for metabolic specialists to identify patients with phenotypes that are severe and can benefit from triheptanoin treatment. The notion of an “n of 1” trial was also emphasized; when there is an absolute indication for triheptanoin, the treatment plan must be individualized. Furthermore, panellists highlighted the importance of assessing patients at regular intervals to ensure benefit is maintained and for continuity of treatment.
Clinician Group Input
This section was prepared by CADTH staff based on the input provided by clinician groups.
One clinician group input was received from the Canadian Association of Centres for the Management of Hereditary Metabolic Disorders or the Association canadienne des centres de traitement pour les maladies métaboliques héréditaires, also known as the Garrod Association, on the review of triheptanoin (Dojolvi) for LC-FAODs. The Garrod Association is a national body formed to help coordinate the management of inherited metabolic disorders in Canada.
The Garrod Association Guideline Committee formulates clinical guidelines, endorses existing guidelines, and writes statements on specific inherited metabolic diseases for approval by the Garrod Executive. The committee may also assemble task forces to review specific diseases and formulate recommendations for review by the committee. The Garrod Association Guideline Committee is composed of 6 to 10 members of the Garrod Association with interest, experience, and expertise in clinical practice, laboratory practice, and/or research involving metabolic disorders. Different perspectives are provided through members having diverse job profiles, geographic locations, and career stages; information has been compiled into a resource for continuous updating or for publication. Currently, the committee includes 6 clinicians, a biochemical geneticist, and 2 methodologists.
For this reimbursement review, the Garrod Association provided a statement based on clinical judgment and expertise; it did not conduct a formal review of the evidence. Therefore, the clinical group notes that only the clinician members of the Guideline Committee, with input from additional metabolic physicians from across Canada with interest and experience in LC-FAODs, participated in preparing the input document. Information was gathered based on both clinician experience and literature review. Keywords used for the literature search include “fatty acid oxidation disorders, treatment, dietary treatment, management guidelines, clinical trials, triheptanoin.” A draft prepared by 1 clinician was circulated to the other members for their comments and feedback, followed by approval from the president of the Garrod Association.
Unmet Needs
The clinician group noted that, currently, treatment available for the management of patients with LC-FAODs mainly includes medical nutrition therapy. The group commented that this therapy typically involves the restriction of long-chain fatty acids (LCFs) and supplementation with MCTs. The group noted that MCT supplementation is administered as a powdered infant formula high in MCTs and low in long-chain triglycerides (e.g., Lipistart, Portagen, Monogen) or MCT Procal, MCT oil, and Liquigen in older children. In addition, the Guideline Committee noted that treatment is tailored to a specific condition, age, and disease severity. Limiting fasting and emergency treatment regimens are the cornerstones of therapy.
The Guideline Committee also noted that treatment is directed to reduce cardiac complications and rhabdomyolysis episodes as well as to prevent episodes of acute metabolic decompensation. The group added that the restriction of LCFs and supplementation with MCT has been shown to reverse cardiomyopathy and reduce disease complications.
As noted by the clinician group, some currently available therapies for LC-FAODs include the use of L-carnitine; however, the group added that this use is controversial. The clinician group commented that triheptanoin was available only in clinical trials until recently and that, in Canada, it was given to patients with severe disease as compassionate treatment. In this case, the group noted that the treatment was targeting improvement in symptoms to reduce the frequency and the severity of acute disease manifestations, such as hyperammonemia. Docosahexaenoic acid (DHA) supplements and antioxidants were considered helpful for retinopathy in cases of LCHAD and TFP deficiencies. The group noted that no other medications are commonly used.1,2,17-20
The Guideline Committee noted that the goals of treatment include early detection through newborn screening and early initiation of treatment to reduce morbidity and mortality of patients with LC-FAODs. The clinician group added that treatment aims to improve or prevent disease complications, including cardiac disease, liver disease, skeletal myopathy, hypoglycemia, retinopathy, and rhabdomyolysis. The clinician group also commented that treatment is directed to prevent or reduce the frequency of acute metabolic decompensation episodes (including hypoketotic hypoglycemia, liver dysfunction, hyperammonemia, rhabdomyolysis, arrhythmias, and cardiomyopathy). It noted that treatment with triheptanoin is expected to decrease disease-related complications, improve quality of life, and prolong the life expectancy of patients with LC-FAODs.
The clinician group noted that the following needs are not being met by currently available treatment: not all patients respond to available treatments; better-tolerated treatments are needed; patients become refractory to current treatment options; and treatments are needed to improve compliance.2,21,22
The clinician group noted that patients with severe LC-FAODs have greater unmet needs than those with milder LC-FOADs. The group added that this is because patients with severe LC-FOADs can present with symptoms regardless of good compliance with standard treatments. These symptoms include repeated episodes of acute metabolic decompensation, episodes of rhabdomyolysis, and worsening of cardiopathy, leading to recurrent hospital admissions, reduced quality of life, and shortened life expectancy.2 The Guideline Committee added that the drug under review would address some of these unmet needs.
Place in Therapy
The Garrod Association Guideline Committee noted that the drug under review will replace and not complement MCT supplements. They recommended that the 2 supplementations (triheptanoin and MCT) should not be given together, owing to a theoretical concern that MCT oil and triheptanoin compete for enzyme activity. The clinician group also noted that the drug under review is not the first treatment approved to address the underlying disease process; however, it might add a treatment benefit, as triheptanoin has 7-carbon fatty acids that are metabolized to both acetyl-CoA and propionyl-CoA. The group noted that this provides an anaplerotic effect to replenish deficient TCA cycle metabolites, an effect that is not provided by standard MCT-based supplementation.23
In addition, the group noted that the mildest cases of LC-FAODs do not require specific dietary therapy and that moderate-to-severe cases of LC-FAODs require dietary modifications and supplementation with MCT or triheptanoin. The group commented that, in a case of neonate or an infant, a formula enriched in MCT and restricted in long-chain triglycerides may be the first-line treatment. In older children and adults, the group noted that stand-alone MCT-containing products (oil or powder) or triheptanoin can be used as a first-line treatment along with dietary modifications. The group commented that triheptanoin may also be considered a first-line treatment in patients presenting with cardiomyopathy. Therefore, taking into consideration these points, the clinician group noted that they anticipate that the drug under review may cause a shift in the current treatment paradigm.
With respect to whether it would be appropriate to recommend that patients try other treatments before initiating treatment with the drug under review, the clinician group noted that, in neonates and infants, it is appropriate to recommend starting treatment with MCT-enriched, LCF-restricted infant formulas. A large portion of the diet for neonates and infants is based on infant formula that supplies a complete diet, including protein, carbohydrates, vitamins and minerals, trace elements, and essential fatty acids. The group commented that, after weaning infant formulas, the patients might be switched to triheptanoin instead of MCT supplements. The clinician group added that, in cases of predicted severe disease and based on clinical judgment of the treating physician, triheptanoin could be tried as first-line treatment in neonates and infants if the risk of trying standard MCT first is too great. Regardless of first-line or second-line use, the clinician and metabolic dietician will need to work together to come up with an individualized prescribed infant formula to provide all needed nutrients during treatment with triheptanoin.
With respect to sequencing of therapies, the clinical group noted that, when treatment with MCT supplementation fails, treatment with triheptanoin should be tried and vice versa. The group added that infants on complete MCT formulas might be switched to triheptanoin after weaning from infant formula feeding. The group commented that this is a significant departure from the sequence employed in current practice, as there are currently no other treatment options.
Patient Population
The Garrod Association Guideline Committee noted that patients with moderate-to-severe LC-FAODs are likely to respond to triheptanoin and are thus best suited for treatment. The group added that patients with moderate-to-severe disease with partial or poor response to standard treatment with MCT supplementation are most in need of the drug under review and that these patients tent to be on the severe end of the disease spectrum. The group added that patients with mild forms of the disease are usually not treated with diet modifications, i.e., MCT supplements. These patients would not need to be treated with triheptanoin.
The clinician group noted that patients best suited for treatment with triheptanoin will be identified by the following criteria:
laboratory tests, including glucose, CK, aspartate transaminase, alanine transaminase, and acylcarnitine profile
genetic testing
enzymatic testing (when available and indicated)
cardiac echocardiogram and electrocardiogram
number of metabolic decompensations and hospital admissions for acute metabolic decompensation
clinical judgment of a physician experienced in metabolic diseases.
With respect to diagnosis, the clinician group noted that it is not challenging to diagnose LC-FAODs. This group of conditions is diagnosed in routine clinical practice via provincial newborn screen programs and, in rare cases where the newborn screen was not available (for example, in the case of new immigrants), it is diagnosed based on clinical symptoms and suggestive biochemical markers. In addition, the group noted that late-onset presentation of LC-FAODs is diagnosed based on symptoms in patients who were born before initiation of newborn screening.
The clinician group added that there are no major issues related to diagnosis and that biochemical testing, including acylcarnitine profile and urine organic acids, is widely available. The group also noted that molecular testing is available via provincial newborn screening programs or diagnostic laboratories (in or outside of the province). Additionally, the group commented that specific enzyme activity testing based on the specific LC-FAODs diagnosed is available as an out-of-country test, entailing additional costs, but could be available in Canada soon. All of these tests are currently performed in clinical practice.
The clinician group noted that underdiagnosis of LC-FAODs is unlikely, as most patients are diagnosed via newborn screening programs in Canada. However, there might be underdiagnosis in the adult population born before 2007 to 2010 (when LC-FAODs newborn screening was started in most provinces in Canada) presenting with late-onset disease. The group noted that pre-symptomatic patients with LC-FAODs are currently treated with MCT supplementation if biochemical markers (acylcarnitine profile, enzyme activity), molecular results, or cardiac function evaluation (echocardiography, electrocardiography) suggest more significant disease.
The group commented that triheptanoin should be used as first- or second-line treatment based on the clinical judgment of the treating physician. The clinician group added that patients with mild, asymptomatic disease who are diagnosed via newborn screening programs would be least suited for treatment with triheptanoin.
With respect to identifying the patients who are most likely to exhibit a response to treatment, the clinician group noted that most patients will be identified based on clinical presentation. The group added that patients with severe disease might present in the first few weeks of life with cardiomyopathy, arrhythmias, hypoglycemia, and liver disease. The group noted that these patients might present before the availability of newborn screening results. They added that differentiation between mild disease variants and classical disease is often possible through biochemical and/or genetic testing. The group noted that patients with moderate disease who do not respond optimally to standard treatment with MCT supplementation would also likely exhibit a response to treatment with triheptanoin. Finally, as noted by the clinician group, patients are identified and referred to metabolic treating centres via provincial newborn screen programs or, among adults, following symptomatic presentation.
Assessing Response to Treatment
The clinician group noted that the following outcomes are used to determine whether a patient is responding to treatment:
Clinical outcomes: number of acute metabolic decompensation events (requiring hospitalization and ED visits) and reduction in chronic symptoms such as myalgia, myopathy, reduced exercise endurance
Patient-reported improvement in quality of life
Improvement or stability in biochemical marker (glucose, CK, aspartate transaminase, alanine transaminase, and acylcarnitine) profile and imaging studies (echocardiogram)
The group added that the outcomes used in clinical practice are aligned with the outcomes typically used in clinical trials.10,24
The group also noted that a clinically meaningful response to treatment will be considered as follows:
Stability or improvement in periodic echocardiograms
Stability or improvement in laboratory markers, including glucose, CK, aspartate transaminase, alanine transaminase, and acylcarnitine profile
Stability or improvement in reported clinical symptoms, including myalgia, myopathy, exercise endurance
Reduction in acute metabolic decompensation events leading to hospital admissions
According to the clinician group, treatment response should be assessed based on a few parameters, similar to current disease monitoring for patients receiving MCT supplementation. These include clinical monitoring and biochemical markers (glucose, CK, aspartate transaminase, alanine transaminase, and acylcarnitine profile) conducted every few weeks to every few months, depending on the type of LC-FAOD, disease severity, and patient age, as well as annual cardiac echocardiography and electrocardiography, although the frequency might change based on disease severity.
Discontinuing Treatment
The clinician group noted the following factors that should be considered when deciding to stop treatment:
Clinical and/or biochemical deterioration while on the treatment; increased number of hospital admissions with acute metabolic decompensation episodes; worsening episodes of hypoketotic hypoglycemia and liver disease (as noted by documented hypoglycemia and/or worsening in aspartate transaminase and alanine transaminase profiles); rhabdomyolysis (worsening in CK levels); or worsening cardiac disease, as noted in repeated echocardiograms
Significant adverse reactions, hypersensitivity, or intolerance to the medication
Nonadherence with the medication
Prescribing Conditions
With respect to the settings most appropriate for treatment with triheptanoin, the clinician group noted that a hospital outpatient clinic is the most appropriate setting for monitoring. They added that patients will be evaluated every few months (depending on disease type, severity, and patient’s age) by a metabolic physician and metabolic dietician. In addition, the group noted that a clinical biochemical geneticist and a metabolic physician or a clinical geneticist are required to diagnose, treat, and monitor patients who might receive triheptanoin.
Additional Considerations
The Garrod Association Guideline Committee noted that patients diagnosed with LCHAD and TFP deficiencies are at risk of developing retinopathy and peripheral neuropathy. They added that neither MCT supplementation nor triheptanoin treat these symptoms. They commented that docosahexaenoic acid (DHA) supplementation and antioxidants can be used to treat retinopathy. However, there is no specific treatment available for peripheral neuropathy.
Drug Program Input
The drug programs provide input on each drug being reviewed through CADTH’s reimbursement review by identifying issues that may affect their ability to implement a recommendation. The implementation questions and corresponding responses from the clinical experts consulted by CADTH are summarized in Table 5.
Table 5: Summary of Drug Plan Input and Clinical Expert Response
Drug program implementation questions | Clinical expert response |
|---|---|
Are the tests used to help diagnose LC-FAODs available in all Canadian jurisdictions? | Following a positive newborn screen (screening available throughout Canada), confirmatory biochemical testing, including acylcarnitine profile and urine organic acids, is also widely available in Canada. Molecular testing is available via provincial newborn screening programs or diagnostic genomic laboratories (in or outside of the province). Jurisdictions that perform newborn screening using tandem mass spectrometry and acylcarnitine analysis can identify LC-FAODs; however, results may not always be reported. Most patients are diagnosed with LC-FAODs via newborn screening programs in Canada. Adults born before the introduction of newborn screening may present with symptoms and are diagnosed clinically with late-onset disease. |
How should “severe” disease be defined? Would patients with mild or moderate LC-FAODs be treated with triheptanoin? | The phenotypes are not classified as moderate or severe but rather by organ system involvement (e.g., cardiomyopathy, rhabdomyolysis, retinopathy, neuropathy). Every patient is unique in terms of his or her presentation, and disease within each organ system can be classified as mild, moderate, and severe. Thus, in LC-FAODs, broad classifications are useful but only as a general guide. In general, earlier presentations (i.e., younger age groups) are more severe in terms of the extent of organ system involvement. However, later-onset presentations can still be very severe or life-threatening. Differentiation between mild disease variants and classical disease is often possible via biochemical and/or genetic testing. The mildest cases of LC-FAODs do not require specific dietary therapy; asymptomatic adult patients are unlikely to require chronic interventions including MCTs such as triheptanoin. Moderate-to-severe cases of LC-FAODs require dietary modifications and supplementation with MCT or triheptanoin. Pre-symptomatic patients with biochemical markers (acylcarnitine profile, enzyme activity), molecular results, or cardiac function evaluation (echocardiography, electrocardiography) suggestive of more significant disease are currently treated with diet and MCT supplementation. Triheptanoin would likely be used as second-line treatment in most patients. |
Would patients < 6 months old be treated with triheptanoin? The Health Canada indication does not include any age restrictions, but Study CL201 included patients ≥ 6 months (median age 5 years, range 0.9 to 59 years). | The general treatment principles for all age groups of patients with LC-FAODs disorders are similar. In neonates or infants, MCT supplementation with formula feeds may be given as first-line treatment. While CL201 and CL202 studies only included patients older than 6 months of age, triheptanoin is still expected to be prescribed to younger patients with severe forms of LC-FAODs that are not adequately treated with other available measures. Additionally, infants with catastrophic symptomatic presentation of LC-FAODs are expected to be treated immediately with all available treatments, including triheptanoin. After discharge, these infants are expected to continue on triheptanoin therapy, without requiring a trial of even-chain MCT. |
If patients should be managed on a stable treatment regimen (including diet), as per inclusion criteria for Study CL201, before being eligible for triheptanoin, how should “stable treatment regimen” be defined (e.g., what prior therapies should be included and what is the duration of the trial of treatment)? Can a patient’s diet potentially affect outcomes of treatment with MCT oils or triheptanoin? | Because patients have varying clinical presentations, treatment is individualized based on the type of LC-FAOD, organ system involved, and frequency of events. As a result, the type and duration of prior therapies differ with each individual, and there is no standardized protocol in this patient population. Common treatments include dietary measures, avoidance of fasting, MCT products, and carnitine in some patients. Dietary measures should be optimized before initiating even-chain MCT supplementation or triheptanoin. |
Is MCT supplementation a relevant comparator in this population? Is there a preferred formulation or composition of MCT oil in the treatment of LC-FAODs (e.g., 8-carbon, 10-carbon, 12-carbon)? Would even-chain MCT oil be prescribed before triheptanoin? When should triheptanoin be used first-line and why? | MCT supplementation is a relevant comparator in this population, as it is used as part of the treatment regimen in Canadian patients with LC-FAODs. There is no preferred formulation or composition, and the choice is guided by the funding guidelines of the jurisdiction. Even-chain MCT products are expected to continue being used in the chronic treatment of LC-FAODs. Triheptanoin will likely be used in patients who do not respond to even-chain MCT products or in young patients presenting with an acute crisis of new-onset LC-FAOD. |
How should response to triheptanoin be defined? What outcome measure(s) should be used and when should response be assessed? Would the outcome measure(s) be different based on the age of the patient? | Response to triheptanoin would be assessed in the same manner as response to other treatments for LC-FAODs. The measure of response should be tailored to the patient and depends on the presenting organ system involvement and clinical status. Ideally, measures should be based on those that can objectively quantify clinical improvement, such as change in frequency and length of hospitalization. Formal exercise tolerance tests may also provide an indication of a patient’s response to treatment. Subjective parameters, for example, residual pain and activities of daily living, may also be considered. In infants with catastrophic presentation, survival would be an important measure, as are frequency of hospitalization and ED visits; in children, long-term growth and development would also be monitored. |
Are there any specific types of LC-FAODs that may not benefit from treatment with triheptanoin? | The general treatment principles and approach for the different types of LC-FAODs are similar. While CL201 and the study by Gillingham et al. (2017) did not include patients with CACT and CPT I deficiency, triheptanoin is still expected to be prescribed to patients with severe forms of these types that are not adequately treated with other available measures. |
Is there any evidence to support the use of triheptanoin for the treatment of medical conditions beyond LC-FAODs, including other inborn errors of metabolism (e.g., GLUT1 deficiency)? | There is currently insufficient evidence to support the use of triheptanoin in the treatment of medical conditions beyond the current indication, including patients with other inborn errors of metabolism. |
CACT = carnitine-acylcarnitine translocase; CPT = carnitine palmitoyltransferase; ED = emergency department; GLUT1 = glucose transporter type I; LC-FAOD = long-chain fatty acid oxidation disorder; MCT = medium-chain triglyceride.
Clinical Evidence
The clinical evidence included in the review of triheptanoin is presented in 3 sections. The first section, the Systematic Review, includes pivotal studies provided in the sponsor’s submission to CADTH and Health Canada, as well as those studies that were selected according to an a priori protocol. The second section includes indirect evidence selected from the literature that met the selection criteria specified in the review. The third section includes additional relevant studies that were considered to address important gaps in the evidence included in the systematic review. Of note, no indirect evidence or other additional relevant studies were identified in the literature search.
Systematic Review of Pivotal and Protocol-Selected Studies
Objectives
To perform a systematic review of the beneficial and harmful effects of triheptanoin 100% w/w oral liquid as a source of calories and fatty acids for the treatment of LC-FAODs in adult and pediatric patients.
Methods
Studies selected for inclusion in the systematic review included pivotal studies provided in the sponsor’s submission to CADTH and Health Canada, as well as those meeting the selection criteria presented in Table 6. Outcomes included in the CADTH review protocol reflected outcomes considered to be important to patients, clinicians, and drug plans.
Table 6: Inclusion Criteria for the Systematic Review
Criterion | Description |
|---|---|
Patient population | Adult and pediatric patients with LC-FAODs Subgroups:
|
Intervention | Triheptanoin oral liquid
|
Comparators |
|
Outcomes | Efficacy outcomes:
Harms outcomes:
|
Study designs | Published and unpublished phase III and IV RCTs |
6MWT = 6-minute walk test; 12MWT = 12-minute walk test; AE = adverse event; CACT = carnitine‐acylcarnitine translocase; CPT = carnitine palmitoyltransferase; GI = gastrointestinal; HRQoL = quality of life; LC-FAOD = long-chain fatty acid oxidation disorder; LCHAD = long‐chain 3‐hydroxy‐acyl‐CoA dehydrogenase; MCT = medium-chain triglyceride; RCT = randomized controlled trial; SAE = serious adverse event; TFP = trifunctional protein; VLCAD = very long‐chain acyl‐CoA dehydrogenase; vs. = versus; WDAE = withdrawal due to adverse events.
The literature search for clinical studies was performed by an information specialist using a peer-reviewed search strategy according to the PRESS Peer Review of Electronic Search Strategies checklist.25
Published literature was identified by searching the following bibliographic databases: MEDLINE All (1946–) via Ovid and Embase (1974–) via Ovid. All Ovid searches were run simultaneously as a multi-file search. Duplicates were removed using Ovid deduplication for multi-file searches, followed by manual deduplication in Endnote. The search strategy comprised both controlled vocabulary, such as the National Library of Medicine’s MeSH (Medical Subject Headings), and keywords. The main search concept was Dojolvi (triheptanoin). Clinical trials registries were searched: the US National Institutes of Health’s clinicaltrials.gov, WHO International Clinical Trials Registry Platform (ICTRP) search portal, Health Canada’s Clinical Trials Database, and the European Union Clinical Trials Register.
No filters were applied to limit the retrieval by study type. Retrieval was not limited by publication date or by language. Conference abstracts were excluded from the search results. Refer to Appendix 1 for the detailed search strategies.
The initial search was completed on April 28, 2021. Regular alerts updated the search until the meeting of the CADTH Canadian Drug Expert Committee on August 18, 2021.
Grey literature (literature that is not commercially published) was identified by searching relevant websites from the Grey Matters: A Practical Tool For Searching Health-Related Grey Literature tool.26 Included in this search were the websites of regulatory agencies (US FDA and European Medicines Agency). Google was used to search for additional internet-based materials. Refer to Appendix 1 for more information on the grey literature search strategy.
These searches were supplemented by reviewing bibliographies of key papers and through contacts with appropriate experts. In addition, the manufacturer of the drug was contacted for information regarding unpublished studies.
Two CADTH clinical reviewers independently selected studies for inclusion in the review based on titles and abstracts, according to the predetermined protocol. Full-text articles of all citations considered potentially relevant by at least 1 reviewer were acquired. Reviewers independently made the final selection of studies included in the review, and differences were resolved through discussion.
A focused literature search for network meta-analyses regarding “fatty acid oxidation” was run in MEDLINE All (1946–) on April 27, 2021. No limits were applied.
Findings From the Literature
A total of 5 publication from 3 studies were identified from the literature for inclusion in the systematic review (Figure 2). None of the studies met the CADTH systematic review criteria; included studies are pivotal trials submitted by the sponsor. The included studies are summarized in Table 5. A list of excluded studies is presented in Appendix 1.
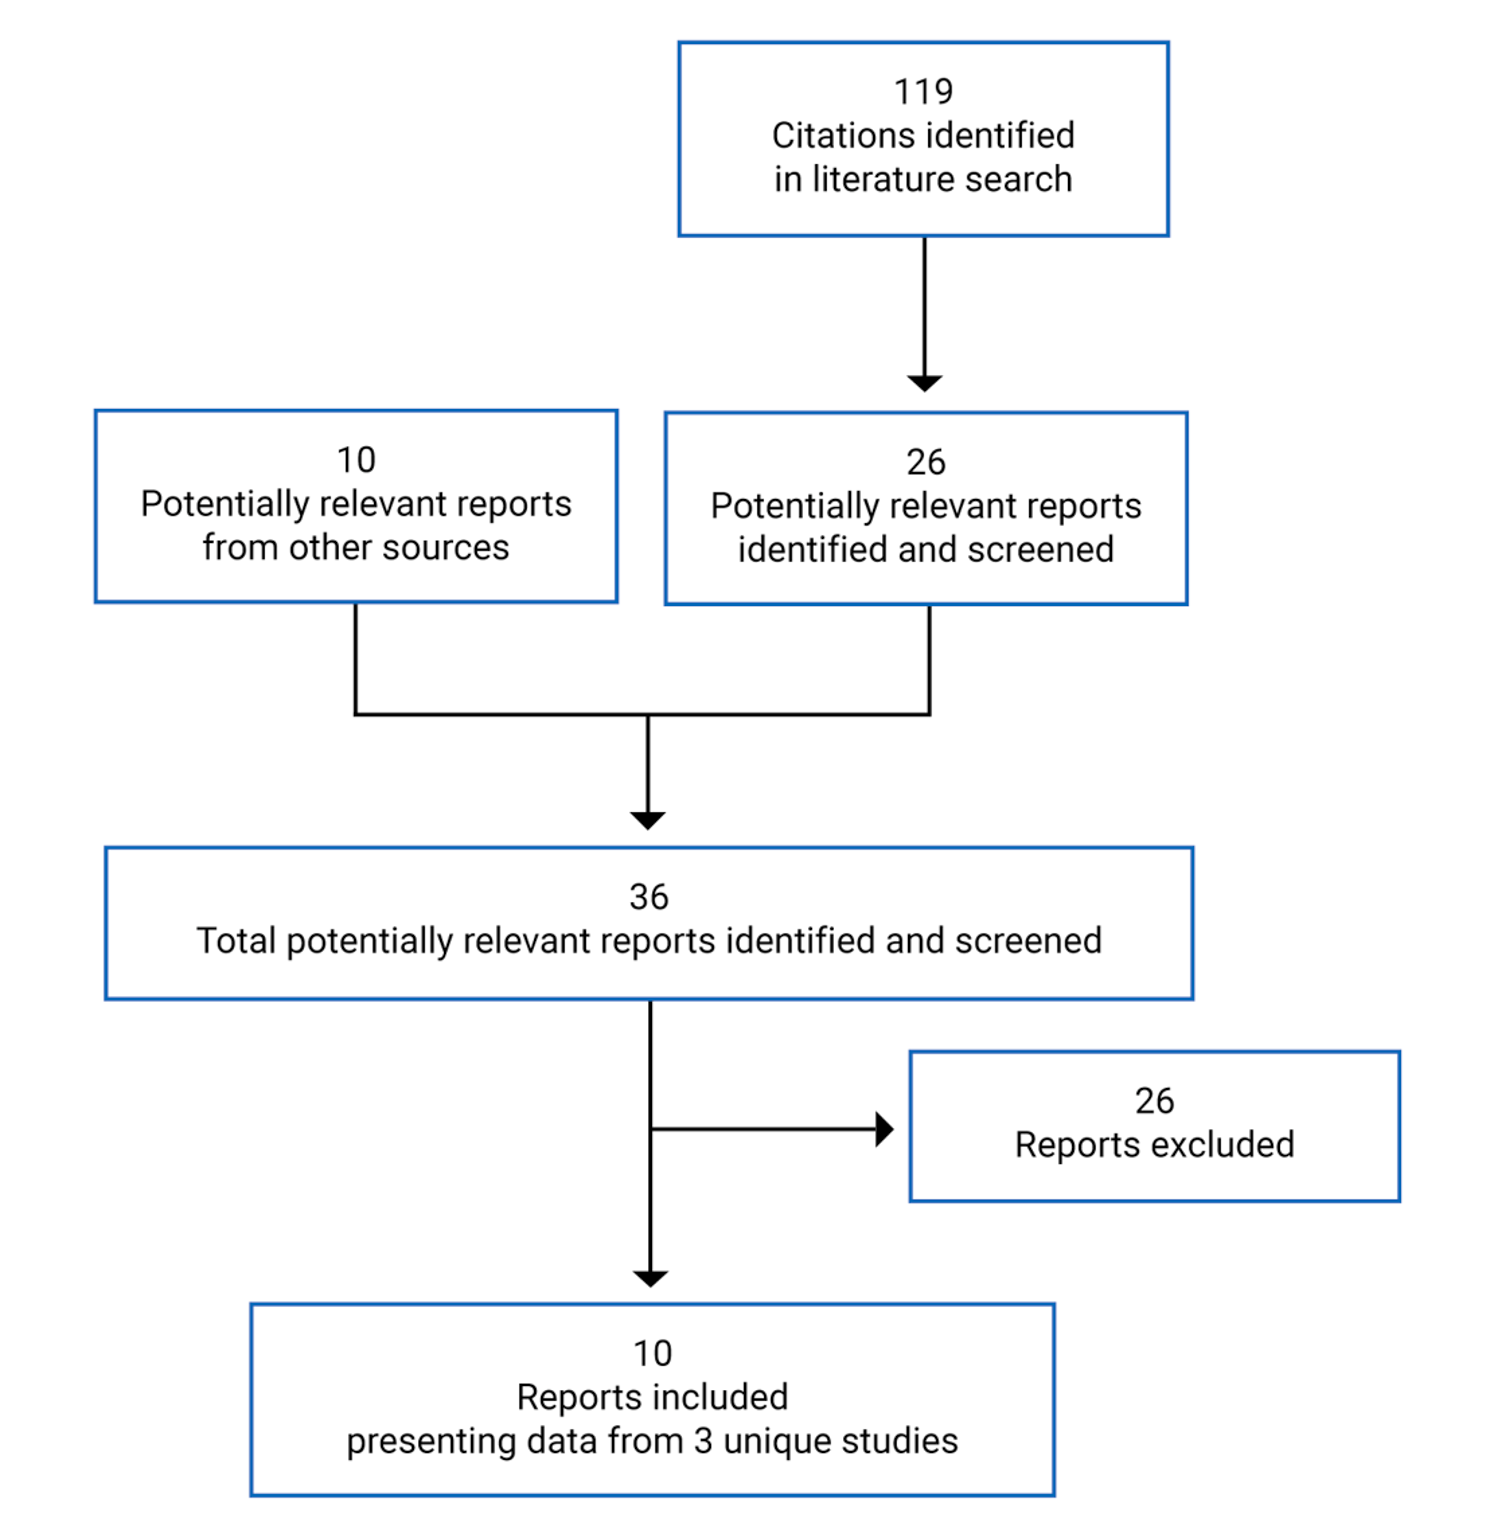
Table 7: Details of Included Studies
Detail | Study CL201 | Study CL202 | Gillingham et al. (2017) |
|---|---|---|---|
Designs and populations | |||
Study design | Phase II, prospective, SA, OL | Phase II, prospective, SA, OL | Phase II, prospective, DB, RCT |
Locations | US and UK | US and UK | US |
Patient enrolment dates | February 2014 to December 2014 | December 2014 to April 2018 | November 2011 to February 2015 |
Randomized (N) | 29 | 75 | 32 |
Inclusion criteria |
|
|
|
Exclusion criteria |
|
|
|
(continued) |
|
|
|
Drugs | |||
Intervention | Triheptanoin up to 25% to 35% of total calories p.o. or by G-tube divided least q.i.d. with foode | Triheptanoin up to 25% to 35% of total calories p.o. or by G-tube divided least q.i.d. with foodf | Triheptanoin (C7) 20% of estimated total daily energy needs |
Comparator(s) | None | None | Trioctanoin (8-carbon) 20% of estimated total daily energy needs |
Duration | |||
Phase | |||
Run-in | 4 weeks | NA | NA |
Treatment | 24 weeks | 5 years (in addition to any prior study) | 4 months |
Extension | 54 weeks | NA | NA |
Outcomes | |||
Primary end point | Key efficacy end points: Exercise intolerance measured by cycle ergometry
Muscle function measured during the 12MWT
| Primary end point: • Annualized LC-FAOD major events rate (also referred to as annualized MCE rate) o Inclusive of skeletal myopathy (rhabdomyolysis), hepatic (hypoglycemia) and cardiomyopathy eventsh | Primary end point: • Change from baseline in: o Total energy expenditure o Cardiac function by echocardiography o Exercise tolerance o Phosphocreatine recovery following acute exercise |
(continued) |
Functional disability and cognitive development measured:
| ||
(continued) |
Rhabdomyolysis events resulting in hospitalizations, ED visits, and emergency intervention: annualized event rate, annualized duration, total number of events, total duration (days) Hypoglycemia events resulting in hospitalizations, ED visits, or emergency intervention: annualized event rate, annualized event days,g total number of events, total duration (days) Cardiac events resulting in hospitalizations, ED visits, or emergency intervention: annualized event rate, annualized event days,g total number of events, total duration (days) | ||
Secondary and exploratory end points | Supportive efficacy end points
| Secondary end points
Exploratory end pointsi
| Secondary end points
|
(continued) | Patient diaries
| ||
Notes | |||
Publications | Vockley et al. (2017)27 Vockley et al. (2019)24 Vockley et al. (2021)28 | Vockley et al. (2020)29 | Gillingham et al. (2017)10 |
6MWT = 6-minute walk test; 12MWT = 12-minute walk test; ALT = alanine aminotransferase; AST = aspartate transaminase; AUC = area under the curve; BP = blood pressure; CACT = carnitine-acylcarnitine translocase; CK = creatine kinase; CPT = carnitine palmitoyltransferase; DB = double-blind; EEI = energy expenditure index; EF = ejection fraction; ED = emergency department; FAOD = fatty acid oxidation disorder; FPS = Faces Pain Scale; GGT = gamma glutamyl transpeptidase; G-tube = gastronomy tube; HR = heart rate; IST = investigator-sponsored trial; LC-FAOD = long-chain fatty acid oxidation disorder; LCHAD = long-chain 3-hydroxy-acyl-CoA dehydrogenase; LVEF = left ventricular ejection fraction; MCAD = medium-chain acyl-CoA dehydrogenase; MCE = major clinical event; MCS = mental component summary; MCT = medium-chain triglyceride; NA = not applicable; OL = open-label; q.i.d. = 4 times a day; PCS = physical component summary; PDMS-2 = Peabody Developmental Motor Scales – Second Edition; PEDI-CAT = Pediatric Evaluation of Disability Inventory Computer Adaptive Test; PHS = Physical Summary Score; p.o. = orally; PSS = Psychosocial Summary Score; SA = single-arm; RCT = randomized controlled trial; RER = respiratory exchange ratio; RPE = ratings of perceived exertion; SF-10 = Short Form (10) Health Survey; SF-12v2 = Short Form (12) Health Survey – version 2; TFP = trifunctional protein; VAS = visual analogue scale; VLCAD = very long chain acyl-CoA dehydrogenase.
Note: Five additional reports were included: CL201 Clinical Study Report,8 CL202 Clinical Study Report,9 Common Technical Document from sponsor’s submission,5 Health Canada Clinical Reviewer Regulatory Report,30,31 and FDA Integrated Review Report.32
aDiagnosis must be confirmed by results of acylcarnitine profiles, fatty acid oxidation probe studies in cultured fibroblasts, and/or mutation analysis obtained from medical records.
bPrior treatment regimen (including diet) should be stable for the last 60 days. Once study drug treatment had started, patients had to maintain all aspects of the treatment regimen and diet, other than discontinuation of MCT.
cDetails of significant clinical manifestations are as follows: Chronic elevated CK with MCEs: elevated mean CK levels (defined as ≥ 2 times the upper limit of age/gender-matched normal, or ≥ 500 units/L if age-matched reference not established) over the last 6 months to 1 year, not associated with an acute rhabdomyolysis event, AND at least 2 MCEs (as defined in the protocol) in the last year, or at least 4 MCEs over the past 2 years. Episodic elevated CK with reported muscle dysfunction: episodes of elevated CK levels over the last 6 months to 1 year, AND patient report of frequent muscle fatigue, exercise intolerance, or limitation of exercise. Highly elevated CK but asymptomatic: more seriously elevated mean CK levels (defined as ≥ 4 times the upper limit of age/gender-matched normal, or ≥ 1,000 units/L if age-matched reference is not established) consistent with substantial chronic muscle rupture over the last 6 months to 1 year, regardless of frequency hospitalizations or ED events. Frequent severe major medical episodes: at least 3 within the past year, or 5 within 2 years of hypoglycemia, rhabdomyolysis, or exacerbation of cardiomyopathy, requiring ED or acute care visits or hospitalizations. Severe susceptibility to hypoglycemia: serum glucose < 60 mg/dL (< 3.3 mmol/L) after short periods of fasting (less than 4 hours to 12 hours, depending on age), with at least 2 events in the last year that required ongoing prophylactic management, OR recurrent symptomatic hypoglycemia (blood glucose levels or clinical symptoms of hypoglycemia) at home requiring intervention ≥ 2 times per week. Evidence of functional cardiomyopathy: with echocardiogram within past 90 days documenting poor ejection fraction requiring ongoing medical management.
dClinical trials include the following ClinicalTrials.gov Identifiers: NCT01379625, NCT01461304, and NCT01886378 (CL201).
eTriheptanoin was added to standard therapy and titrated to an effective dosage that reduced symptoms substantially, up to the maximum tolerated dosage level. Any prior MCT oil was discontinued before starting triheptanoin.
fIf a patient had been receiving a lower dose of triheptanoin, the individual could continue treatment at this dose, provided there was no evidence of symptomatic disease or clinical signs of exercise limitation. Triheptanoin dosages above 35% of total caloric intake could be considered as needed at the discretion of the Investigator on an individual basis; it was recommended that dosages above 35% be discussed with the medical monitor before administration. If a patient had been off triheptanoin treatment for > 1 month or was treatment-naive, the dosage was titrated following the study drug administration guidelines. Patients who switch from MCT to triheptanoin were permitted to transition at the same dosage and then titrate, as appropriate.
gAnnualized event days were originally referred to as the annualized duration rate in the study protocol and statistical analysis plan.
hMCEs include skeletal myopathy (rhabdomyolysis), hepatic (hypoglycemia), and cardiac disease (cardiomyopathy) events, and were defined as any visit to the ED or acute care, hospitalization, emergency intervention (i.e., any unscheduled administration of therapeutics at home or in the clinic), or any similar event whether caused primarily by LC-FAOD or by an intercurrent illness complicated by LC-FAOD.
iAdditional end points were collected during earlier versions of the protocol and were later removed from the protocol in amendments. These include: 1) PDMS-2 for children < 6 years and children ≥ 6 years who are unable to perform a valid and consistent cycle ergometry test or 12MWT; 2) 12MWT; 3) PEDI-CAT for all patients < 18 years (or for patients 18 to 20 years, as clinically indicated) at the time of informed consent; 4) patient diary.
Source: CL201 Clinical Study Report,8 CL202 Clinical Study Report,9 Gillingham et al. (2017),10 Sponsor’s Response to Additional Information Request.33
Description of Studies
Three sponsor-submitted trials (CL201, CL202, and Gillingham et al. [2017]) were included in this review. Details of all 3 trials are provided in Table 7.
Study CL201 (N = 29) was a multi-centre, prospective, open-label, single-arm phase II study investigating the efficacy and safety of triheptanoin in adults and children (6 months of age and older) exhibiting serious clinical manifestations of LC-FAODs despite current management. The primary objective of the study was to evaluate the effects of triheptanoin on acute clinical pathophysiology (including exercise tolerance and HRQoL) associated with chronic energy deficiency due to LC-FAODs following 24 weeks of treatment. Additionally, the objective following 78 weeks of treatment was to evaluate the impact of triheptanoin on MCEs (i.e., metabolic crises). CL201 was conducted between February 4, 2014, and August 25, 2016, at 10 investigative sites across the US and UK. The study consisted of a 4-week run-in, 24-week treatment, and 54-week treatment extension period (Figure 3). Inclusion criteria for each patient was assessed based on available medical history of MCEs during the prior 24 months. As well, a medical history from the prior 18 months (78 weeks) was collected to establish a pre-triheptanoin comparison. In this study, assessments collected during the run-in period and from historical data were also used as comparators for the treatment phase. Due to the heterogeneity of clinical manifestations of LC-FAODs, the retrospective data collection was intended to provide a within-subject comparison for MCEs; thus, each patient acted as his or her own control for the comparison of 78 weeks of conventional management (pre-triheptanoin) to the 78 weeks of triheptanoin treatment. During the 4-week run-in phase, enrolled patients continued current management to establish a stable baseline. Thereafter, at the baseline visit, any use of MCT was discontinued and treatment with triheptanoin was initiated (i.e., added to standard therapy). Patients received up to a total of 78 weeks (18 months) of treatment with triheptanoin, which included the 24-week treatment and an additional 54-week treatment extension period if indicated by the investigator. After initiation of treatment, patients were followed every 4 to 6 weeks during the 24-week treatment period and every 12 weeks to 18 weeks during the extension period to assess long-term safety and efficacy. For patients who did not continue on a separate extension protocol, a follow-up visit occurred 4 weeks after the week 78 visit.
Additional dietary assessments were performed for patients enrolled in CL201; data were obtained from each patient’s medical record. Although dietary data were not recorded and collected during the entire retrospective period (78 weeks before triheptanoin start), they were captured at run-in (4 weeks before baseline) as well as at baseline and were considered representative of the entire retrospective period.
Figure 3: Study Design for CL201
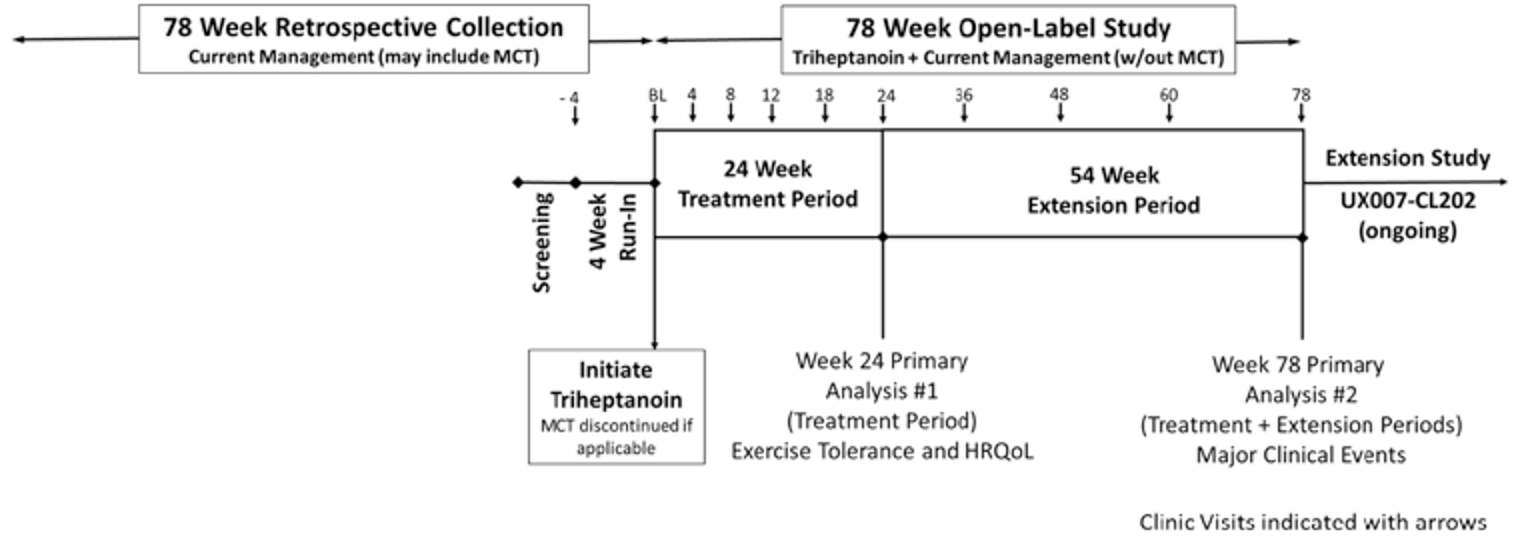
MCT = medium-chain triglyceride; HRQoL = health-related quality of life.
Source: CL201 Clinical Study Report.8
Study CL202 (N = 75) is an ongoing open-label extension study investigating the long-term safety and efficacy of triheptanoin in patients older than 6 months of age with LC-FAODs. The study comprises 3 cohorts: patients who had previously participated in CL201 (CL201 rollover cohort, N = 24), patients who failed conventional therapy and continued to exhibit clinical manifestations of LC-FAODs (triheptanoin-naive cohort, N = 20), and patients who participated in other programs to access triheptanoin, such as ISTs or compassionate use (IST or other cohort, N = 31). All 3 cohorts were single-arm; none included a parallel comparator group. The first patient initiated the study on December 9, 2014, and the study is being conducted at 10 investigative centres across the US and UK. The study consists of a baseline visit, then a treatment period of up to 5 years (60 months); for patients in the CL201 rollover cohort, the baseline visit was the final week 78 visit. In patients for whom historical medical data had already been collected as part of a prior triheptanoin treatment protocol, the effect of triheptanoin on MCEs during CL202 was compared with the available historical information. Data from 18 months before initiation of triheptanoin were considered the retrospective period, and patients acted as their own internal controls for efficacy assessment during the CL202 treatment period. Although the CL201 rollover cohort and triheptanoin-naive cohorts had retrospective periods, patients in the IST or other cohort had limited historical information on medical management before triheptanoin. As a consequence, data while on treatment with triheptanoin were not compared to a retrospective period in the IST or other cohort. Efficacy and safety of triheptanoin were reported across 3 study periods in CL202 (Figure 4). Study period 1 (main study period) started on day 1 and continued until the last visit day in CL202; study period 2 had the same ending as study period 1 but started from day 1 of triheptanoin treatment and was used in selected analyses for CL201 rollover patients. Study period 3 started from 18 months preceding start of triheptanoin and ended 1 day before day 1 of triheptanoin treatment; this was also referred to as the retrospective period for MCE data collection and was used for selected analyses of CL201 rollover and triheptanoin-naive patients. Data presented in this report reflect an interim analysis with a cut-off date of June 1, 2018. After initiation of treatment, an initial assessment via phone call was conducted at week 2. Patients were then assessed at the clinic at 6-month intervals from month 6 to month 60. Between clinic visits, phone assessments were also made at 6-month intervals between month 3 and 57 to assess for MCEs, AEs, SAEs, and changes to concomitant medications. After study treatment was discontinued, a safety follow-up call was conducted 30 to 35 days after the last dose of the study drug.
Figure 4: Study Design and Cohorts for CL202
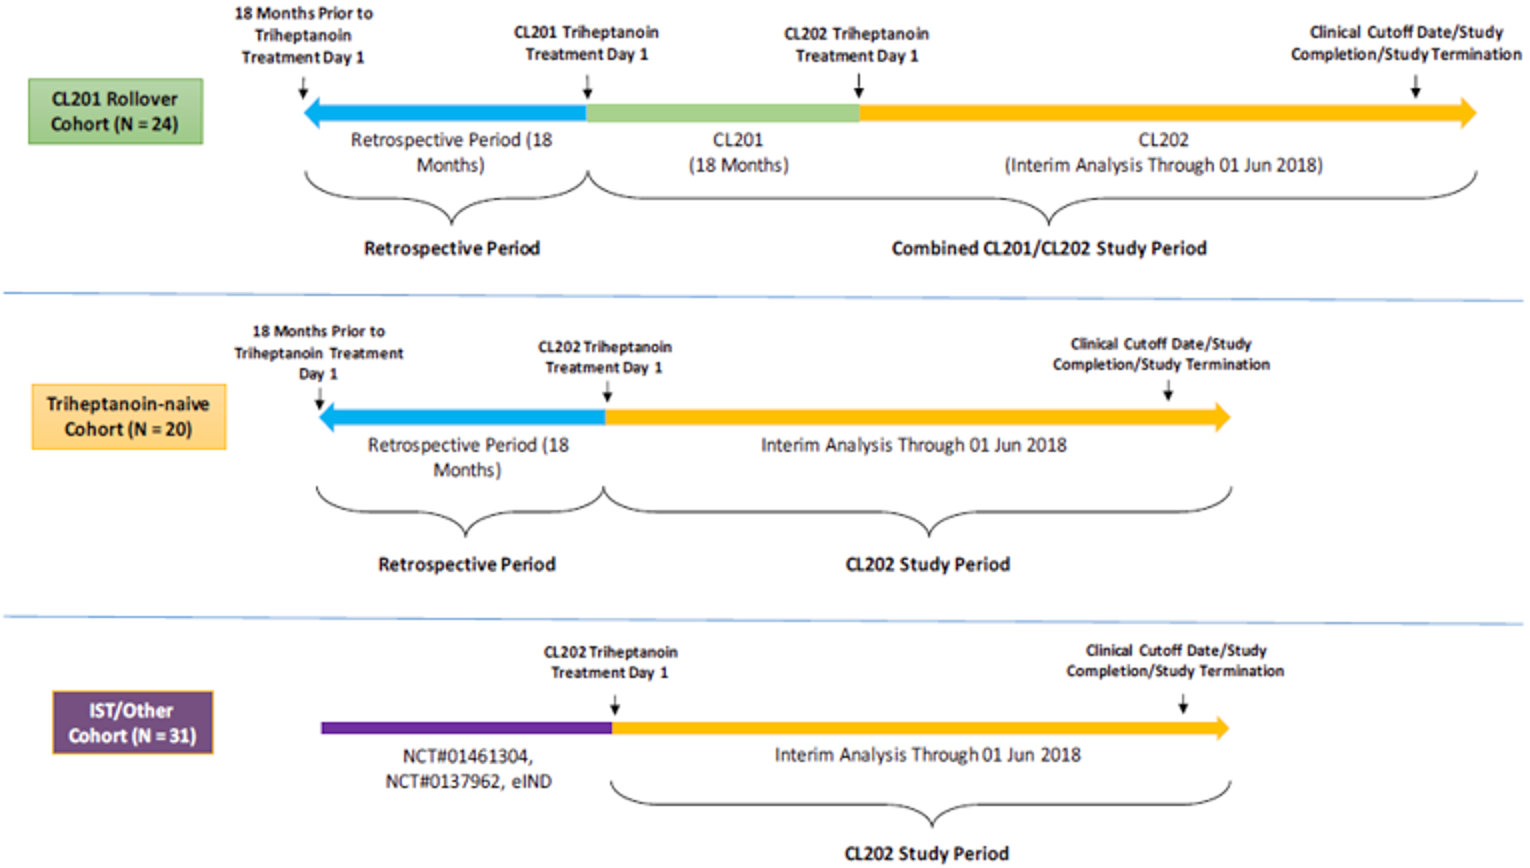
IST = investigator-sponsored trial.
Source: CL202 Clinical Study Report.9
The study by Gillingham et al. (2017, n = 32) was a double-blind RCT that investigated whether triheptanoin has a therapeutic advantage over conventional treatment for LC-FAODs. Adults and children 7 years of age and older were randomized 1:1, using a permuted block randomization scheme, to a diet containing triheptanoin or trioctanoin (an even-chain fatty acid triglyceride). Patient enrolment occurred during November 2011 and February 2015; randomization occurred separately at 2 investigative sites in the US (Oregon Health and Science University and the University of Pittsburgh) and was stratified according to diagnosis (CPT II, VLCAD, or TFP and LCHAD). The randomization table was generated by a study statistician, and all study personnel were blinded to treatment assignment, except for the research pharmacy dispensing the study oil, the kitchen preparing meals, and the primary study coordinator, until data collection was complete. Baseline assessments of TEE, response to a moderate-intensity treadmill exercise test, cardiac function, and LCF acid oxidation capacity were completed at enrolment. Patients were admitted to the research centre for 4 days for outcome measurements. Upon discharge, patients continued treatment with assigned diet and MCT supplementation for 4 months. At the end of 4 months, baseline assessments were repeated (Figure 5).
Figure 5: Study Design for Gillingham et al. (2017)
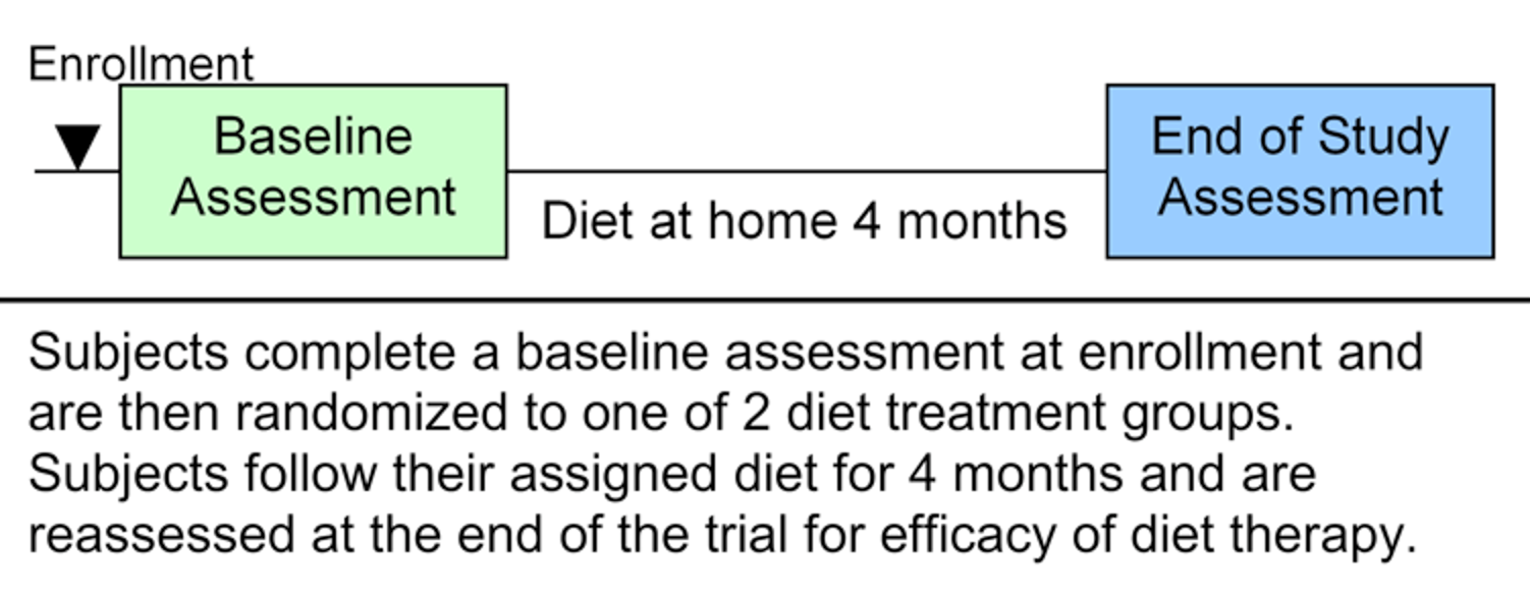
Source: Triheptanoin versus trioctanoin for long-chain fatty acid oxidation disorders: a double blinded, randomized controlled trial. Gillingham MB, Heitner SB, Martin J, et al. J Inherit Metab Dis. 2017;40(6):831-843. © John Wiley and Sons 2017. Reprinted with permission.
Both CL201 and CL202 were sponsored by Ultragenyx Pharmaceutical Inc., whereas the study by Gillingham et al. (2017) was conducted by an independent investigator and funded through a grant from the Orphan Drug Development Program by the US FDA.
Populations
Inclusion and Exclusion Criteria
To be eligible for Study CL201, patients had to be at least 6 months of age and have a confirmed diagnosis of CPT II, VLCAD, LCHAD, or TFP deficiency; patients diagnosed with CPT I or CACT deficiency were excluded. Patients must also have had severe LC-FAOD and must have been receiving stable treatment (i.e., for the past 60 days), which may have included dietary measures and/or MCT. Severe LC-FAOD was defined as having 1 of the following significant clinical manifestations despite management: chronic elevated CK with MCEs, episodic elevated CK with reported muscle dysfunction, highly elevated CK but asymptomatic, frequent severe major medical episodes, severe susceptibility to hypoglycemia, or evidence of functional cardiomyopathy (detailed definitions found in footnote of Table 7).
To be eligible for Study CL202, patients were also required to be at least 6 months of age; however, the trial enrolled patients with CACT or CPT I deficiency in addition to CPT II, VLCAD, LCHAD, and TFP deficiencies. Because this was an extension study, patients must have participated in a clinical study assessing triheptanoin treatment for LC-FAODs as part of clinical programs with the 2 study sites (Oregon Health and Science University or the University of Pittsburgh) and/or study sponsor (e.g., CL201). The study also enrolled, at the discretion of the sponsor, patients who had received triheptanoin through other clinical studies, ISTs, or expanded access or compassionate use programs, as well as treatment-naive patients who had failed conventional treatment and had documented severe unmet need.
In the Gillingham et al. (2017) study, age of eligibility was 7 years or older to ensure the patient was able to comply with the protocol, such as completing a 45-minute exercise treadmill test. Each individual was evaluated to determine whether they could complete the study protocol. Patients must have had a confirmed diagnosis of CPT II, VLCAD, LCHAD, or TFP deficiency. Similar to CL201, patients with CPT I or CACT deficiencies were not included in the study. To be eligible for participation, patients must also have had at least an episode of rhabdomyolysis and be on a stable diet that included MCT. Patients with anemia, history of myocardial infarction, or peripheral neuropathy that limited ability to complete treadmill studies were excluded from the trial.
Baseline Characteristics
There were notable differences in baseline characteristics across the trials, particularly between the 2 sponsor-funded trials and the Gillingham et al. (2017) study, as shown in Table 8. In general, patients in CL201 and CL202 were younger than those in the Gillingham et al. (2017) trial, and the former trials involved mainly pediatric patients (< 18 years); the mean age was 12.06 years (SD = 13.21) in CL201, 13.87 (SD = 13.19) in CL202, and 24.75 (SD = 14.3) in the Gillingham et al. (2017) study. Half of the patients in CL201 were children younger than 6 years of age. In CL202, most patients were younger than 18 years of age, although the median age in the IST or other cohort (14.41 years) was older than that in the other 2 cohorts. More male patients (approximately 60%) were enrolled in CL201 and CL202, with the exception of the IST or other cohort of CL202, in which approximately 60% were female. Approximately 60% of patients enrolled in the Gillingham et al. (2017) study were female. Most patients enrolled in CL201 and CL202 were White; no data on race or ethnicity were reported in the Gillingham et al. (2017) study.
In CL201 and CL202, most patients were diagnosed with an LC-FAOD during infancy (often < 3 months of age); a few patients were diagnosed in adulthood, with the exception of the triheptanoin-naive cohort in CL202, in which none were diagnosed as adults. Common methods of diagnoses included acylcarnitine profile, mutation analysis, and fatty acid oxidation probe studies. The most common LC-FAOD subtypes that patients had in CL201 and CL202 were VLCHAD deficiency and LCHAD deficiency. In the Gillingham et al. (2017) study, LCHAD deficiency and TFP deficiency were combined; thus, the exact breakdown of patients with either specific subtype is unknown. Otherwise, there was a similar number of patients diagnosed with VLCAD, LCHAD and TFP, or CPT II deficiencies. Most patients enrolled in CL201 and CL202 had experienced common manifestations of LC-FAODs, including rhabdomyolysis, muscle pain, exercise intolerance, hypoglycemia, muscle weakness, and cardiomyopathy.
Compared to studies CL201 and CL202, there was little information available on the medical history of patients enrolled in the Gillingham et al. (2017) study. According to the limited data, the mean age of patients in the triheptanoin treatment group (27.2 years, SD 15.9) was slightly older than patients in the trioctanoin group (22.3 years, SD 12.7). Gender and type of LC-FAOD was generally well-balanced between the 2 treatment groups.
According to available data (i.e., excluding the IST or other cohort of CL202), the majority of patients enrolled in all 3 studies had received prior treatment with an MCT formulation, and all were being treated with dietary measures. In CL201 and CL202, approximately 65% of patients were receiving carnitine supplementation. The type of MCT formulation varied; examples provided in the CL201 Clinical Study Report include Enfaport, Lipistart, Liquigen, MCT Procal, Monogen, Portagen, and Pregestimil Lipil. Before enrolment, patients in the CL201 study had received approximately 17% of DCI as medium-chain fat from MCTs. A detailed breakdown of dietary management before triheptanoin treatment was available only for patients enrolled in CL201 (Table 9).
Table 8: Summary of Baseline Characteristics of Pivotal Studies — Full Analysis Set
Characteristic | Study CL201 | Study CL202 | Gillingham et al. (2017) | |||
|---|---|---|---|---|---|---|
Triheptanoin N = 29 | CL201 rollover N = 24 | Triheptanoin-naive N = 20 | IST/other N = 31 | Triheptanoin N = 16 | Trioctanoin N = 16 | |
Age, years | ||||||
Mean (SD) | 12.06 (13.21) | 13.16 (14.31) | 8.89 (7.77) | 17.63 (14.22) | 27.2 (15.9) | 22.3 (12.7) |
Median | 5.26 | 6.57 | 7.33 | 14.41 | 26.5 | 18 |
Min to max | 0.87 to 58.78 | 2.4 to 60.2 | 0.3 to 23.0 | 1.5 to 63.3 | 7.0 to 64.0 | 8.0 to 43.0 |
Age group, n (%) | ||||||
0 to < 6 years | 15 (51.7) | 9 (37.5) | 9 (45.0) | 4 (12.9) | 0 (0.0) | 0 (0.0) |
≥ 6 to < 18 years | 8 (27.6) | 9 (37.5) | 7 (35.0) | 16 (51.6) | 5 (31.3) | 8 (50.0) |
≥ 18 years | 6 (20.7) | 6 (25.0) | 4 (20.0) | 11 (35.5) | 11 (68.8) | 8 (50.0) |
Gender, n (%) | ||||||
Male | 17 (58.6) | 14 (58.3) | 12 (60.0) | 13 (41.9) | 6 (37.5) | 6 (37.5) |
Female | 12 (41.4) | 10 (41.7) | 8 (40.0) | 18 (58.1) | 10 (62.5) | 10 (62.5) |
Race, n (%) | ||||||
White | 25 (86.2) | 21 (87.5) | 16 (80.0) | 29 (93.5) | NR | NR |
Asian | 2 (6.9) | 1 (4.2) | 1 (5.0) | 0 (0.0) | NR | NR |
Black or African-American | 1 (3.4) | 1 (4.2) | 2 (10.0) | 1 (3.2) | NR | NR |
Other | 1 (3.4) | 1 (4.2) | 1 (5.0) | 1 (3.2) | NR | NR |
LC-FAOD type, n (%) | ||||||
VLCAD deficiency | 12 (41.4) | 9 (37.5) | 6 (30.0) | 11 (35.5) | 4 (25.0) | 5 (31.3) |
LCHAD deficiency | 10 (34.5) | 9 (37.5) | 6 (30.0) | 9 (29.0) | 7 (43.8)a | 5 (31.3)a |
CPT II deficiency | 4 (13.8) | 3 (12.5) | 2 (10.0) | 6 (19.4) | 5 (31.3) | 6 (37.5) |
TFP deficiency | 3 (10.3) | 3 (12.5) | 3 (15.0) | 4 (12.9) | NRa | NRa |
CACT deficiency | NAb | 0 (0.0) | 2 (10.0) | 1 (3.2) | NAb | NAb |
CPT I deficiency | NAb | 0 (0.0) | 1 (5.0) | 0 (0.0) | NAb | NAb |
Age at LC-FAOD diagnosis, year | ||||||
Mean (SD) | 5.50 (12.90) | 6.01 (13.93) | 2.68 (5.46) | 6.32 (12.28) | 16.5 (19.7) | 15.7 (14.2) |
Median | 0.07 | 0.05 | 0.06 | 0.26 | 6.50 | 14.50 |
Min to max | 0.0 to 56.7 | 0.0 to 56.7 | 0.0 to 17.5 | 0.0 to 49.2 | 0.0 to 63.0 | 0.0 to 42.0 |
Age group at LC-FAOD diagnosis, n (%) | ||||||
0 to < 3 months | 18 (62.1) | 15 (62.5) | 14 (70.0) | 15 (48.4) | NR | NR |
≥ 3 to < 12 months | 3 (10.3) | 2 (8.3) | 1 (5.0) | 4 (12.9) | NR | NR |
≥ 1 to < 6 years | 2 (6.9) | 2 (8.3) | 1 (5.0) | 3 (9.7) | NR | NR |
≥ 6 to < 18 years | 3 (10.3) | 2 (8.3) | 4 (20.0) | 6 (19.4) | NR | NR |
≥ 18 years | 3 (10.3) | 3 (12.5) | 0 (0.0) | 3 (9.7) | NR | NR |
LC-FAOD diagnosis method, n (%) | ||||||
Acylcarnitine profile | 23 (79.3) | 21 (87.5) | 10 (50.0) | 17 (54.8) | 13 (81.3) | 15 (93.8) |
Mutation analysis obtained from medical records | 21 (72.4) | 17 (70.8) | 17 (85.0) | 12 (38.7) | 16 (100.0) | 16 (100.0) |
Fatty acid oxidation probe studies in cultured fibroblasts | 9 (31.0) | 8 (33.3) | 3 (15.0) | 4 (12.9) | 4 (25.0) | 5 (31.3) |
Newborn screening | 2 (6.9) | 1 (4.2) | 2 (10.0) | 8 (25.8) | NR | NR |
Skin biopsy | NR | 0 (0.0) | 0 (0.0) | 11 (35.5) | NR | NR |
Prenatal screening | NR | 0 (0.0) | 0 (0.0) | 2 (6.5) | NR | NR |
Abnormal newborn screen | NR | 1 (4.2) | 0 (0.0) | 0 (0.0) | NR | NR |
Family history | NR | 0 (0.0) | 0 (0.0) | 1 (3.2) | NR | NR |
Fibroblast | NR | 0 (0.0) | 0 (0.0) | 1 (3.2) | NR | NR |
First documented hospital medical record | NR | 1 (4.2) | 0 (0.0) | 0 (0.0) | NR | NR |
Organic acid profile | NR | 0 (0.0) | 0 (0.0) | 1 (3.2) | NR | NR |
Other | 2 (6.9) | NR | NR | NR | 4 (25.0)c | 3 (18.8)c |
Disease history, n (%)d | ||||||
Rhabdomyolysis | 26 (89.7) | 21 (87.5) | 17 (85.0) | 25 (80.6) | NR | NR |
Muscle pain | 22 (75.9) | 17 (70.8) | 10 (50.0) | 27 (87.1) | NR | NR |
Exercise intolerance | 21 (72.4) | 16 (66.7) | 4 (20.0) | 13 (41.9) | NR | NR |
Hypoglycemia | 18 (62.1) | 16 (66.7) | 11 (55.0) | 19 (61.3) | NR | NR |
Muscle weakness | 16 (55.2) | 12 (50.0) | 5 (25.0) | 10 (32.3) | NR | NR |
Cardiomyopathy | 13 (44.8) | 12 (50.0) | 5 (25.0) | 14 (45.2) | NR | NR |
Failure to thrive | 9 (31.0) | 8 (33.0) | 7 (35.0) | 10 (32.3) | NR | NR |
Abnormal gait | 6 (20.7) | 6 (25.0) | 1 (5.0) | 6 (19.4) | NR | NR |
Respiratory distress | 6 (20.7) | 5 (20.8) | 1 (5.0) | 11 (35.5) | NR | NR |
Altered mental status and/or coma | 5 (17.2) | 5 (20.8) | 0 (0.0) | 6 (19.4) | NR | NR |
Hepatomegaly | 5 (17.2) | 4 (16.7) | 1 (5.0) | 8 (25.8) | NR | NR |
Hypotonia | 5 (17.2) | 4 (16.7) | 2 (10.0) | 10 (32.3) | NR | NR |
Retinopathy | 5 (17.2) | 5 (20.8) | 2 (10.0) | 5 (16.1) | NR | NR |
Developmental delay | 2 (6.9) | 2 (8.3) | 2 (10.0) | 11 (35.5) | NR | NR |
Maternal HELLP syndrome | 4 (13.8) | 3 (12.5) | 3 (15.0) | 4 (12.9) | 2 (12.5) | 1 (6.3) |
Peripheral neuropathy | 1 (3.4) | 1 (4.2) | 3 (15.0) | 6 (19.4) | NR | NR |
Seizures | 4 (13.8) | 4 (16.7) | 1 (5.0) | 3 (9.7) | NR | NR |
Enrolment criteria, n (%) | ||||||
Elevated CK | 25 (86.2) | NA | NA | NA | NA | NA |
Chronic elevated CK with MCEs | 4 (13.8) | NA | NA | NA | NA | NA |
Episodic elevated CK with reported muscle dysfunction | 17 (58.6) | NA | NA | NA | NA | NA |
Highly elevated CK but asymptomatic | 6 (20.7) | NA | NA | NA | NA | NA |
Frequent severe major medical episodes | 8 (27.6) | NA | NA | NA | NA | NA |
Severe susceptibility to hypoglycemia | 3 (10.3) | NA | NA | NA | NA | NA |
Evidence of functional cardiomyopathy | 2 (6.9) | NA | NA | NA | NA | NA |
CACT = carnitine-acylcarnitine translocase; CK = creatine kinase; CPT = carnitine palmitoyltransferase; HELLP = hemolysis, elevated liver enzymes, low platelets; IST = investigator-sponsored trial; LC-FAOD = long-chain fatty acid oxidation disorder; LCHAD = long-chain 3-hydroxy-acyl-CoA dehydrogenase; MCE = major clinical event; NA = not applicable; NR = not reported; SD = standard deviation; TFP = trifunctional protein; VLCAD = very long chain acyl-CoA dehydrogenase.
aThe LCHAD and TFP types were combined in the Gillingham et al. study.
bThe CL201 and Gillingham et al. (2017) studies did not include CPT I and CACT in their inclusion criteria.
cOther diagnosis methods for Gillingham et al. (2017) included enzyme assay.
dFrequency > 15% in any group.
Source: CL201 Clinical Study Report,8 CL202 Clinical Study Report,9 Gillingham et al. (2007),10 Sponsor’s Submission Materials (Common Technical Document),5 Sponsor’s Response to Additional Information Request.33
Table 9: Summary of Treatment From Retrospective Pre-Triheptanoin Period — Full Analysis Set for Studies CL201 and CL202
Treatment | Study CL201 N = 29 | Study CL202 | ||
|---|---|---|---|---|
CL201 rollover N = 24 | Triheptanoin-naive N = 20 | IST/other N = 31 | ||
Retrospective period lengtha | 78 weeks (18 months) | 78 weeks (18 months) | ||
Prior therapies for LC-FAOD,b n (%) | ||||
MCT formulation | 27 (93.1) | 23 (95.8) | 18 (90.0) | NRc |
High-carbohydrate, low-fat diet | 29 (100) | 24 (100) | 20 (100) | NRc |
Carnitine supplementation | 19 (65.5) | 15 (62.5) | 14 (70.0) | NRc |
Other dietary management | 20 (69.0) | 17 (70.8) | 15 (75.0) | NRc |
Zea mays (corn) seed | 6 (20.7) | 6 (25.0) | 1 (5.0) | NRc |
Nutrients NOS | 6 (20.7) | 5 (20.8) | 2 (10.0) | NRc |
Linseed (Linum usitatissimum) oil | 6 (20.7) | 4 (16.7) | 1 (5.0) | NRc |
Docosahexaenoic acid | 5 (17.2) | 4 (16.7) | 5 (25.0) | NRc |
Herbal and traditional medicine | NR | 4 (16.7) | 3 (15.0) | NRc |
Dietary management | ||||
Macronutrient breakdown, treatment period average,d mean % of DCI (SD) | ||||
Protein | 13.7 (4.31) | 13.6 (4.61) | NR | NRc |
Carbohydrate | 55.3 (8.98) | 54.8 (8.68) | NR | NRc |
Total fat | 30.9 (8.21) | 31.4 (7.97) | NR | NRc |
Medium-chain fat (from MCT) | 17.4 (8.88) | 17.9 (8.42) | NR | NRc |
Long-chain fat | 13.1 (6.20) | NR | NR | NRc |
DCI = daily caloric intake; IST = investigator-sponsored trial; LC-FAOD = long-chain fatty acid oxidation disorder; MCT = medium-chain triglyceride; NOS = not otherwise specified; NR = not reported; SD = standard deviation.
aRetrospective pre-triheptanoin period is 18 months before triheptanoin initiation. If patient’s age was less than 18 months at triheptanoin initiation, the pre-triheptanoin period was between the birth date and the day before triheptanoin initiation.
bIncludes LC-FAOD treatments for both acute management of MCEs and for general maintenance for the underlying LC-FAOD disease. Categories under other dietary management categories were presented if any treatment group included greater than 15% of patients who received such prior treatment.
cInformation on treatment before enrolment for the IST/other cohort was limited to prior exposure on triheptanoin from the parent program and does not include pre-triheptanoin management history. Thus, the IST/other cohort was not analyzed in pre-treatment comparisons.
dFor CL201, treatment period average values are based on average value of the run-in and baseline visits. For CL202, treatment period refers to the run-in period only; similar values occurred at baseline.
Source: CL201 Clinical Study Report,8 CL202 Clinical Study Report.9
Interventions
In all 3 studies, any prior MCT product taken by patients was discontinued before starting study treatment. Because CL201 and CL202 were single-arm trials, all patients received triheptanoin treatment, as outlined in Table 10. In the Gillingham et al. (2017) study, patients were randomized in a 1:1 ratio to 1 of 2 treatment arms. Study treatment included either triheptanoin (C7, odd-chain MCT) or trioctanoin (C8, even-chain MCT). In all 3 studies, triheptanoin was provided as an oil. In the Gillingham et al. (2017) study, trioctanoin was synthesized in a comparable manner to eliminate fatty acid variation in the composition of commercial even-chain MCT products.
Table 10: Treatment Details of Pivotal Studies
Detail | Study CL201 | Study CL202 | Gillingham et al. (2017) | |
|---|---|---|---|---|
Triheptanoin N = 29 | Triheptanoin N = 75 | Triheptanoin N = 16 | Trioctanoin N = 16 | |
Dose of study drug | Target 25% to 35% of DCI or maximum tolerated dosage
DCI established based on initial 3-day diet history recorded before first run-in period visit and collected periodically during the study | Target 25% to 35% of DCI
DCI established based on the most recent dietary analysis in the medical record at baseline and collected periodically during this study using 3-day diet diaries | 20% of estimated DCI
A detailed diet was developed based on the measured resting energy needs of the patient plus 40% for activity and growth A 3-day diet record was completed at the start of the study and was collected at the midpoint and end of the study | |
Dosing modifications | Permitted if AEs occurred | |||
Measures of treatment adherence | Diary recording daily consumption | Weekly diary recording adherence | Weekly communication with the study coordinator, as well as analyses of 3-day diet records and the amount of supplemental oil consumed The percentage of the total prescribed oil consumed was estimated from the remaining oil at the end of the trial | |
Other dietary measures | Each patient’s diet consisted of an isocaloric balance allowing for consistency in percentage of fat, protein, and carbohydrates throughout the study. The recommended dietary content was 25% to 35% DCI from triheptanoin, approximately 15% from protein, up to 15% to 20% from LCFA (ensuring that essential fatty acid needs were met), and the balance in the form of carbohydrates | The dietary content consisted of 20% DCI from MCT or triheptanoin, 15% from protein, 10% from LCFA, and 55% from carbohydrates | ||
Further dietary modifications | Not permitted – guidelines were provided to minimize dietary percentage variation between patients | Patients were not required to eat all the calories given in their diet plan but were required to follow the general types of foods included in the plan | ||
Prohibited medications |
|
| NR | |
AE = adverse event; DCI = daily caloric intake; G-tube = gastronomy tube; LCFA = long-chain fatty acid; MCT = medium-chain triglyceride; NR = not reported; p.o. = orally; q.i.d. = 4 times a day.
Source: CL201 Clinical Study Report,8 CL202 Clinical Study Report,9 Gillingham et al. (2017).10
Outcomes
A list of efficacy end points identified in the CADTH review protocol that were assessed in the clinical trials included in this review is provided in Table 11. These end points are further summarized. A detailed discussion and critical appraisal of the outcome measures are provided in Appendix 4.
Of note, the CL201 study did not explicitly identify primary and secondary efficacy end points. Rather, the study categorized end points as either key or supportive. Key efficacy end points demonstrated efficacy of the triheptanoin, and supportive efficacy end points provided supplemental information on the efficacy evaluation of triheptanoin.
Table 11: Summary of Outcomes of Interest Identified in the CADTH Review Protocol
Outcome measure | Study CL201 | Study CL202 | Gillingham et al. (2017) |
|---|---|---|---|
Survival | |||
Length of survival | Not measured | Not measured | Not measured |
Clinical eventsa | |||
Total major clinical events | |||
Annualized event rate | Not pre-specified | Primary | Not measured |
Annualized event days | Not pre-specified | Secondary | Not measured |
Major rhabdomyolysis event (annualized) | |||
Annualized event rate | Key | Secondary | Not measured |
Annualized event days | Key | Secondary | Not measured |
Major hypoglycemia event (annualized) | |||
Annualized event rate | Key | Secondary | Not measured |
Annualized event days | Key | Secondary | Not measured |
Major cardiomyopathy event (annualized) | |||
Annualized event rate | Key | Secondary | Not measured |
Annualized event days | Key | Secondary | Not measured |
Hospitalization due to clinical events (e.g., frequency, length of stay) | |||
Hospitalizations for all major clinical events | |||
Annualized hospitalization rate | Not pre-specified | Part of primary end point | Not measured |
Annualized hospitalization days | Not pre-specified | Part of secondary end point | Not measured |
Hospitalizations for rhabdomyolysis events | |||
Annualized hospitalization rate | Part of key end point | Part of secondary end point | Not measuredb |
Annualized hospitalization days | Part of key end point | Part of secondary end point | Not measuredb |
Hospitalizations for hypoglycemic events | |||
Annualized hospitalization rate | Part of key end point | Part of secondary end point | Not measured |
Annualized hospitalization days | Part of key end point | Part of secondary end point | Not measured |
Hospitalizations for cardiac events | |||
Annualized hospitalization rate | Part of key end point | Part of secondary end point | Not measured |
Annualized hospitalization days | Part of key end point | Part of secondary end point | Not measured |
ED utilization | |||
Number of ED visits for major clinical event | Not pre-specified | Part of primary end point | Not measured |
Number of ED visits for rhabdomyolysis | Part of key end point | Part of secondary end point | Secondary |
Number of ED visits for hypoglycemia | Part of key end point | Part of secondary end point | Not measured |
Number of ED visits for cardiomyopathy | Part of key end point | Part of secondary end point | Not measured |
Annualized ED visit rate for rhabdomyolysis | Part of key end point | Not measured | Not measured |
Annualized ED visit rate for to hypoglycemia | Part of key end point | Not measured | Not measured |
Annualized ED visit rate for cardiac event | Part of key end point | Not measured | Not measured |
Health-related quality of life | |||
SF-10 (change from baseline) | Key | Exploratory | Not measured |
SF-12v2 (change from baseline) | Key | Exploratory | Not measured |
Measures of physical function or exercise tolerance | |||
12MWT (change from baseline) | Key | Not measured | Not measured |
Cycle ergometry (change from baseline) | Key | Not measured | Not measured |
Treadmill ergometry (maximum) | Not measured | Not measured | Primary |
Phosphocreatine recovery | Not measured | Not measured | Primary |
Symptom relief | |||
Muscle pain, weakness, fatigue | Not reportedc | Not measured | Not measured |
Cardiac function parameters | |||
LVEF (change from baseline) | Supportive | Secondary | Primary |
LVSF (change from baseline) | Not measured | Secondary | Primary |
Ventricular size (change from baseline) | Not measured | Secondary | Primary |
Concomitant medications | |||
Reduction in use | Not reportedc | Not measured | Not measured |
Productivity | |||
Days lost from school attendance | Not measured | Not measured | Not measured |
Days lost from work attendance | Not measured | Not measured | Not measured |
12MWT = 12-minute walk test; ED = emergency department; LVEF = left ventricular ejection fraction; LVSF = left ventricular shortening fraction; SF-10 = Short Form (10) Health Survey; SF-12v2 = Short Form (12) Health Survey – version 2.
Note: Not measured = end point was not included in the study protocol; Not pre-specified = end point was not in the study protocol but was reported in the results presented in the Clinical Study Report; Not reported = end point was included in the study protocol, but results were not presented in the Clinical Study Report.
aMajor events were defined as musculoskeletal (rhabdomyolysis), hepatic (hypoglycemia), and cardiac disease (cardiomyopathy) events caused by LC-FAODs, or an intercurrent illness complicated by LC-FAODs, resulting in any hospitalization, ED or acute care visit, or emergency intervention (any unscheduled administration of therapeutics at home or in the clinic).
bThe Gillingham et al. (2017) study reported the number of hospitalizations that occurred due to acute rhabdomyolysis but not annualized rates or comparative data.
cIn CL201, collection of data on symptom relief and cardiac medication requirement for maintenance treatment were specified in the study protocol. A diary was used to capture activity level, muscle weakness, and fatigue; however, due to issues with the electronic diaries, analyses could not be performed. Also, data and analyses on changes in required concomitant cardiac medications were not presented in the Clinical Study Report.
Evaluation Time Points for Study CL201
In CL201, data analyses were conducted in 2 stages to assess the effects of triheptanoin treatment in patients with LC-FAODs. The first analysis, conducted after the 24-week (6-month) treatment period, evaluated the effects of triheptanoin on energy physiology. Specifically, clinical and biologic disease during the 24 weeks of treatment was assessed in 3 relevant disease areas: skeletal myopathy (e.g., hypotonia, exercise intolerance, motor development, functional disability, non-acute CK levels not associated with rhabdomyolysis), hepatic disease (e.g., interventions and complications related to hypoglycemia, hepatomegaly, markers of hepatic function), and cardiac disease (e.g., LVEF, LV shortening fraction, cardiac biomarkers). Comparisons were made primarily against the baseline 4-week run-in period for each patient. The second analysis, which evaluated the effects of triheptanoin treatment on MCEs associated with LC-FAODs, such as hospitalization, medical interventions, and related clinical manifestations, was conducted after the total 78-week (18-month) treatment extension period. Comparisons were made against the historical data from 18 months to 24 months before study entry (or from birth, for patients less than 18 months of age).
Clinical Events
In both CL201 and CL202, major events were defined as musculoskeletal (rhabdomyolysis), hepatic (hypoglycemia), and cardiac disease (cardiomyopathy) events caused by LC-FAODs, or an intercurrent illness complicated by LC-FAODs, resulting in any hospitalization, ED or acute care visit, or emergency intervention (any unscheduled administration of therapeutics at home or in the clinic). In both studies, major rhabdomyolysis events, hypoglycemia events, and events due to decompensation of cardiomyopathy were measured separately, with the number and duration of events captured for each. Although various biomarkers, clinical evaluations, and laboratory parameters were measured to characterize these clinical events, an exact definition for each event was not provided in the studies, except for clinically important hypoglycemia, which was defined in CL201 as serum glucose levels less than 60 mg/dL (3.3 mmol/L). The total number and duration of each major event (ED or acute care visits, hospitalizations, or emergency intervention) were recorded. Data for the 3 MCEs were presented as annualized event rates and annualized event days (also referred to as annualized duration rate). In Study CL202, the annualized event rate and annualized event days were also calculated for MCEs overall. The number of MCEs was annualized for each patient by dividing the total number of MCEs of interest by the total duration of data collection divided by 365.25. The duration of MCEs was also annualized by dividing the total duration (days) of MCEs of interest by the duration of data collection divided by 365.25.
In Study CL201, the key efficacy end points included the annualized event rate, annualized event days, total number of events, and total duration (days) for each of the clinical event types (rhabdomyolysis, hypoglycemia, or cardiac events) resulting in hospitalization, ED visit, or emergency intervention. Of note, the end point measuring annualized event rate and annualized event days for total MCEs (i.e., for the combination of rhabdomyolysis, hypoglycemia, and cardiomyopathy events) to evaluate the aggregate effect of triheptanoin on metabolic crises was not pre-specified and was added after the final database lock. The MCEs captured over 78 weeks of triheptanoin treatment were compared with MCEs those during 78 weeks before triheptanoin initiation, collected through a retrospective review of medical records.
In Study CL202, the primary efficacy end point was the annualized LC-FAOD major event rate, inclusive of skeletal myopathy (rhabdomyolysis), hepatic (hypoglycemia), and cardiomyopathy events. Annualized duration of all MCEs was considered a secondary efficacy end point, as were the annualized event rate and annualized event days of each of the MCEs (rhabdomyolysis, hypoglycemia, and cardiomyopathy). Two cohorts (CL201 rollover and triheptanoin-naive) out of the 3 in CL202 had retrospective data on MCEs collected from medical records, which were compared to MCE data collected during triheptanoin treatment. For patients in the CL201 rollover cohort, pre-triheptanoin data captured from retrospective medical record reviews during CL201 were used for comparison; MCEs were collected during CL202 using the same methodology as CL201. Retrospective data were compared to MCEs collected over 36 months of triheptanoin treatment in the CL201 rollover cohort and over 18 months in the triheptanoin-naive cohort.
In both CL201 and CL202, all MCEs were identified, recorded, and analyzed in the same manner, both before and during triheptanoin treatment. To reduce potential differences in MCE identification before or during treatment with triheptanoin, each patient was assessed by the same investigator. For collection of retrospective data in CL201 and 2 cohorts in CL202 (i.e., CL201 rollover and triheptanoin-naive), at the screening visit, MCEs that occurred 18 to 24 months before study initiation were identified by investigators through a review of medical records of patients at their clinical sites. The events were source-verified from medical charts using discharge summaries, history and physical examinations, and progress notes. For patients younger than 18 months of age at the time of study drug initiation, retrospective data collection included all MCEs reported from the date of birth until the day before initiation of triheptanoin. During triheptanoin treatment, the same events were captured through reporting by subjects or caregivers at clinic visits and telephone calls; data were confirmed with review of medical records and source document verification in the same manner as the pre-triheptanoin period. Data on the event type, the number of days in hospital or the intensive care unit, and the type and number of days of treatment and intervention were recorded. MCEs that occurred at the same time or during the same hospitalization were counted separately.
The trial by Gillingham et al. (2017) did not investigate MCEs as a part of the study’s outcomes.
Hospitalizations Due to Clinical Events
Details on hospitalizations due to an MCE were captured as part of the composite measure of MCEs, as previously described in studies CL201 and CL202. The Gillingham et al. (2017) study reported the number of hospitalizations due to acute rhabdomyolysis; no other hospitalization event was captured in the study.
Emergency Department Utilization
Details on ED visits due to an MCE were captured as part of the composite measure of MCEs, as previously described in studies CL201 and CL202. The Gillingham et al. (2017) study did not capture ED usage as part of the study’s outcomes.
Health-Related Quality of Life
In both CL201 and CL202, HRQoL was measured as part of the assessment for functional disability. Age-appropriate questionnaires (SF-10 or SF-12) were used to measure HRQoL, and the change from baseline in the scores measured by these instruments were key efficacy end points in CL201 and exploratory end points in CL202. In CL201, the surveys were administered at baseline and weeks 12, 24, 48, and 78 (or early termination) visits. The primary statistical comparison was the change from baseline at week 24. In CL202, the surveys were administered at baseline and then at 6-month intervals thereafter (or the early termination visit). Refer to Appendix 4 for further description and appraisal of SF-10 and SF-12. The changes from baseline in t scores were measured at these time points. HRQoL was not measured in the Gillingham et al. (2017) study.
Short Form (10) Health Survey
The SF-10 is a 10-item questionnaire completed by caregivers. It is a generic measure of HRQoL and is designed for healthy and ill adults. In the studies, the 10 items used a 4-week recall period. Responses were used to generate 2 component summary scores: PHS and PSS. Higher global scores are associated with better quality of life. The 2 summary measures were calculated from raw scores to have a mean of 50 and SD of 10. In the 2 pivotal studies,8,9 the t score-based scoring was used to score the SF-10 summary scales. The scale scores were centred, so that a score of 50 corresponds to the average score in a comprehensive 2006 US sample (a combination of general population and supplemental disability and chronic condition samples). According to both CL201 and CL202 study protocols, the SF-10 was administered to children 6 years through 17 years at the time of informed consent. However, during the study, the survey was conducted and assessed in some younger children (5 years through 17 years). According to the study report, the instrument is valid for this age range; however, information on validity of SF-10 in patients with LC-FAODs was not identified in the CADTH literature search. An estimated MID was not identified from the literature for patients with LC-FAODs.
Short Form (12) Health Survey Version 2
The SF-12 version 2 is a 12-item interview and self-administered questionnaire. It is a generic measure of HRQoL designed for healthy and ill adults. The standard version with a 4-week recall period was used in the studies. The 12 items in the SF-12 are a subset of the items in the SF-36 and measure the following 8 domains: physical functioning, role limitations due to physical health problems, bodily pain, general health, vitality (energy and fatigue), social functioning, role limitations due to emotional problems, and mental health. Responses were used to generate 2 component summary scores for physical health (PCS) and mental health (MCS). The raw scores range from 0 to 100, with higher global scores associated with better health and quality of life. Domain and component summary scores were calculated from raw scores to have a mean of 50 and SD of 10. Scoring the SF-12 version 2 was accomplished using t score-based scoring, which is standardized using the means and SDs from the 2009 US general population. Thus, a score of 50 constitutes the normalized base score, while each factor of 10 (± 5) represents an SD above or below the mean (i.e., of the US general population t score). The SF-12 was administered to patients 18 years of age and older at the time of informed consent. An estimated MID was not identified from the literature for patients with LC-FAODs.
Measures of Physical Function or Exercise Tolerance
12-Minute Walk Test
In Study CL201, the 12MWT was a key efficacy end point. In CL202, the 12MWT efficacy assessment was originally included as part of the study’s exploratory end points. However, this was removed from the protocol in an amendment (protocol amendment 4) to reduce the burden on patients and investigational sites, with the rationale that continuing to use the 12MWT assessment in the open-label, single-arm extension was unlikely to yield informative data. The Gillingham et al. (2017) study did not conduct a 12MWT as part of the outcome measures.
In Study CL201, parameters of muscle function were evaluated using the 12MWT, which is a variation of the 6-minute walk test (6MWT) that is used to assess endurance through walking. The longer 12MWT was selected based on a hypothesis that longer walking times would put greater demands on the muscle, by stressing the physiologic deficit caused by LC-FAODs. Thus, the impact and potential treatment response on muscle function in patients with LC-FAODs may be better distinguished with the 12MWT than the 6MWT. The 12MWT was administered to patients 6 years of age or older who were able to safely perform the assessment. In children who turned 6 years old during the study or achieved mastery of all Peabody Developmental Motor Scales, 2nd edition (PDMS-2) skill sets measuring gross motor development, the 12MWT could be administered at the next scheduled visit. Patients who met the safety criteria were instructed to walk the length of a pre-measured 20 m course in a hallway for 12 consecutive minutes. The lap distance was standardized using traffic cones, and patients walked around the cones until the end of the time period. Instructions and encouragement were given according to American Thoracic Society guidelines. The distance walked at the end of 12 minutes was recorded in metres, along with the distance walked after the first and second 6 minutes. The percentage of predicted normal values was calculated for the 6MWT distance using age-appropriate reference data, and the patient’s HR and blood pressure were checked before and after the test. The efficacy assessment following the 12MWT also included additional measures of perceived exertion (before and after the 12MWT) using the OMNI Scale as well as the perceived muscle pain (before and after the 12MWT) using a visual analogue scale (patients ≥ 18 years) or Faces Pain Scale – revised (patients < 18 years). To measure walking efficiency, the EEI (the ratio of HR per metre walked, in beats/m) was also calculated for the 12MWT.
The test was administered to patients during the run-in period (week 4) and at weeks 8, 18, 36, and 60 (or at the early termination visit). Approximately 2 hours before the test, patients were fed a standardized macronutrient meal including either MCT oil (at the run-in visit, if applicable) or triheptanoin (all visits post-baseline). The test was administered by a trained clinician according to American Thoracic Society guidelines established for the 6MWT. The 12MWT was not performed if there were any concerns with the patient completing the test reliably and safely. For example, the test was not performed if significant muscle pain was reported before starting the test, and the test could be discontinued at any time if there were any concerns about induction of a major safety event, such as rhabdomyolysis.
The CL201 statistical plan noted that the impact of 24 weeks of triheptanoin treatment on muscle function would be evaluated by comparing EEI and distance travelled during the 12MWT at weeks 8 and 18 to baseline (last assessment during the run-in period). A similar analysis was conducted to evaluate changes from baseline at weeks 36 and 60. According to the Clinical Study Report, the primary analysis for the 12MWT was assessed at week 18. As muscle function increases, EEI during the 12MWT is expected to decrease, whereas the distance travelled is expected to increase. An estimated MID was not identified from the literature for patients with LC-FAODs.
Cycle Ergometry
In CL201, cycle ergometry was a key efficacy end point. In the CL202 and Gillingham et al. (2017) studies, cycle ergometry was not included as part of the efficacy assessment.
In CL201, exercise tolerance was assessed using cycle ergometry, a submaximal exercise test. The aerobic exercise testing to measure workload was performed in all patients aged 6 years or older at the screening visit. Patients who turned 6 years old within 6 months of the baseline visit could also be considered for the cycle ergometry test at screening. If valid testing was feasible, additional testing at baseline and weeks 4, 12, 24, 48, and 78 (or at the early termination visit) was performed. The main end point of the cycle ergometry test was energy expenditure. Gas exchange variables, respiratory exchange rate (RER), blood pressure, HR, pain and exertion, blood lactate, acylcarnitine, and CK levels were also measured. A 40-minute cycle ergometry protocol at 60% of age-predicted maximal HR was performed in patients who were able to safely perform the test. To stress the physiologic deficit in LC-FAODs, a multi-modal approach (HR, perceived exertion, and perceived pain) was used to target a zone of exercise intensity in which fat would be the preferential energy source, if available. Workload at a fixed HR, duration of test protocol, and RER (an indicator of whether carbohydrates or fats are being consumed as fuel) were evaluated. The workload performed at the baseline visit was repeated for all subsequent cycle ergometer tests. Approximately 2 hours before the test, patients were fed a standardized macronutrient meal, including either MCT oil (at screening and baseline, if applicable) or triheptanoin (all visits after baseline). To standardize the administration of the test, cycle ergometry was administered in an exercise testing laboratory by trained clinicians. The cycle ergometry test was not performed if there were any concerns with the patient completing the test reliably and safely. For example, the test was not performed if significant muscle pain was reported before starting the test, and the test could be discontinued at any time if there were any concerns about induction of a major safety event, such as rhabdomyolysis. Cycle ergometry was performed at separate time points from the 12MWT to ensure patients had time to recover.
In CL201, the impact of 24 weeks of triheptanoin treatment on exercise intolerance was evaluated by comparing the total workload, time-adjusted area under the curve for RER, and actual duration of exercise during cycle ergometry at weeks 4, 12, and 24 to baseline. The primary statistical comparison was between baseline and week 24 for all 3 parameters. A similar analysis was conducted to evaluate changes from baseline at week 78. Total workload and duration of exercise during cycle ergometry are expected to increase as intolerance to exercise decreases.
Treadmill Ergometry
In the Gillingham et al. (2017) study, exercise tolerance was considered 1 of the primary outcomes. It was measured using a 45-minute moderate-intensity treadmill test with continuous ECG monitoring and collection of respiratory gases. In the CL201 and CL202 studies, treadmill ergometry was not included as part of the efficacy assessment.
Treadmill ergometry in the Gillingham et al. (2017) study was performed 2 hours after the patient finished a standardized lunch. At baseline, all patients received trioctanoin in their lunch and again as an oral bolus 20 minutes before the exercise test. At 4 months, patients repeated the treadmill ergometry and received either triheptanoin or trioctanoin before exercise based upon treatment randomization. The bolus dose was 0.3 g oil/kg lean body mass.
During the test at baseline, the rate and incline of the treadmill were increased until the patient’s HR was 50% to 60% of his or her predicted maximum. The same grade, speed, and duration were repeated at the follow-up visit to keep the workload (and therefore oxygen consumption) constant. Perceived physical exertion using the Borg perceived exertion scale (a scale of 1 to 20 of increasing exertion), blood pressure, HR, and ventilation at a given workload were measured during the treadmill exercise. Levels of blood lactate and CK concentrations before and after exercise were also measured as indicators of rhabdomyolysis. The exercise test was terminated early if any unexpected adverse symptoms developed.
Phosphocreatine Recovery
In the Gillingham et al. (2017) study, phosphocreatine recovery following acute exercise was considered 1 of the primary outcomes. In the CL201 and CL202 studies, phosphocreatine recovery was not measured as part of the efficacy assessment.
Phosphocreatine recovery, a measure of muscle ATP synthesis, was measured after a bout of acute phosphocreatine-depleting exercise using the lower leg. The Gillingham et al. (2017) employed a defined exercise protocol that involved repetitive leg or ankle flexion and extension against resistance (e.g., foot peddle or latex band) while evaluating the isolated working muscle using phosphorus spectroscopy. The exercise was performed approximately 3 hours after lunch, and patients practised the movement before starting the test; during the test, patients were instructed to push their foot repeatedly as fast and hard as they were able to for 30 seconds. Magnetic resonance spectroscopy was used to evaluate high-energy phosphate metabolism, to measure how quickly muscles make energy (ATP) after a depleting exercise. In addition to imaging, absolute concentrations of phosphocreatine, ATP, inorganic phosphate, and other phosphorus metabolites in the tibialis were measured. Data were collected from the muscle at rest and then before, during, and after the exercise. Phosphocreatine synthesis was measured during the recovery phase of each patient at baseline and was compared to results after 4 months of treatment. Not all subjects completed this exercise, and phosphocreatine recovery was not measured in children younger than 16 years of age.
Symptom Relief
In CL201, a diary was used to capture daily incidence of muscle weakness and fatigue by the patient and/or caregiver. The number of episodes of muscle pain and leg cramps each day was also recorded, along with the activity level corresponding with each incidence of muscle pain or leg cramps and weakness or fatigue. In CL202, the incidence and frequency of fatigue, exercise tolerance, muscle pain, and activity level were reported weekly by the patients or caregiver in a diary. This information was gathered as part of the study’s exploratory end points. However, the patient diary was removed from the protocol in an amendment (protocol amendment 4) to reduce the burden on patients, with the rationale that continuing to record patient-reported symptoms of muscle weakness and fatigue in the open-label, single-arm extension was unlikely to yield informative data. New or worsened events of fatigue and muscle pain were still collected as AEs. In the Gillingham et al. (2017) study, symptom relief from triheptanoin treatment was not captured as an efficacy end point; however, musculoskeletal pain, cramping, or elevated CK were collected as part of data on AEs.
Cardiac Function Parameters
In CL201, the change from baseline in LVEF was considered a supportive end point. In CL202, cardiomyopathy and cardiac function, including ventricle size, ejection fraction, and shortening fraction at each visit and change from baseline were among the secondary efficacy end points. In both studies, cardiac disease was assessed by echocardiography and electrocardiography at the baseline visit. Thereafter, in CL201, the tests were repeated at week 24 (or at the early termination visit if that visit was before the week 24 assessment), whereas, in CL202, cardiac function was measured annually (or at the early termination visit if it had not been performed within 6 months before termination). In both studies, additional tests could be performed if any abnormalities were detected or if medically indicated, and clinically significant changes from baseline in echocardiograms were also recorded as an AE, if appropriate.
In the Gillingham et al. (2017) study, cardiac function, as measured by echocardiography, was 1 of the primary outcomes. At baseline and after 4 months of treatment, a comprehensive echocardiographic evaluation was performed in the echocardiography laboratories at each institution. Cardiac function was assessed at baseline and after treatment, approximately 1 hour after lunch, and was measured at rest. Right and left ventricle chamber volumes, ejection fraction, and cardiac muscle strain were evaluated. Analysis of echocardiographic variables was blinded. Intra-observer concordance correlation (correlation for repeated echocardiographic analysis by 1 evaluator) was r = 0.75 (95% CI, 0.09 to 0.95), and inter-observer concordance correlation (between 2 evaluators) was r = 0.89 (95% CI, 0.51 to 0.98).
Concomitant Medications
In the CL201 study protocol, clinical outcomes for cardiac disease included cardiac medication requirement for maintenance treatment (e.g., diuretics, digitalis), although it is unclear whether this was considered as part of key or supportive efficacy end points. Interventions that were required for the maintenance treatment of cardiomyopathy were assessed at each treatment visit, in conjunction with the review of concomitant medications taken by the patient, and through the extension period (week 78). Start and stop dates, dosage, and dosing interval were recorded. Changes in the use of concomitant medications were not explored in CL202 or the Gillingham et al. (2017) studies.
Productivity
The effect of triheptanoin treatment on productivity at school or work was not measured in any of the 3 studies included in this review.
Safety
In CL201, safety and tolerability of triheptanoin were routinely recorded at each visit and monitored through weekly phone calls by the study coordinator from baseline to week 4, and then once between each subsequent study visit. Safety was also monitored throughout the study by a data monitoring committee and included the collection of AEs and SAEs. Specifically, TEAEs, serious TEAEs, fatal AEs, TEAEs leading to discontinuation, treatment-related TEAEs, and treatment-related serious TEAEs were collected. GI TEAEs categorized using the standardized MedDRA query (SMQ) were also assessed. Selected clinical laboratory parameters and changes from baseline values, electrocardiograms, echocardiograms, height, weight, and body mass index were also included as part of the safety end points. AEs were assessed at all visits and throughout the course of the study. An AE was considered as treatment-emergent if it occurred on or after the date of the first treatment of triheptanoin.
In CL202, there was no formal data monitoring committee; conduct of the study and safety of the patients were monitored by the sponsor regularly. AEs were recorded at each visit, as well as through weekly phone calls by the study coordinator from baseline to month 6, and then once between each subsequent study visit through month 60. Safety assessments included the collection of AEs and SAEs; the safety end points in CL202 included incidence and severity of TEAEs (primary safety end points), vital signs, incidence of laboratory abnormalities, and concomitant medications. Specifically, the incidence, frequency, severity, and relatedness of AEs and SAEs were collected, and these included clinically significant changes from baseline to scheduled time points in vital signs, weight, physical examination, and clinical laboratory evaluations. An AE was considered treatment-emergent if it occurred on or after the first triheptanoin dose during the CL202 study period.
In the Gillingham et al. (2017) study, safety, and efficacy were monitored by a data safety and monitoring board. Patients were monitored for AEs and SAEs throughout the study. During weekly communication with the study coordinator, patients and/or parents were asked about AEs from treatment. Strategies to minimize GI upset were also discussed.
For all 3 studies, the severity of AEs was graded using the National Cancer Institute Common Terminology Criteria for Adverse Events (NCI CTCAE) version 4.0. During regular communications with study personnel, patients were solicited for information specifically on the following potential AEs: GI upset, steatorrhea or frequent loose stools, and weight gain in CL201 and CL202; and GI upset, steatorrhea or frequent loose stools, weight gain, muscle pain, and lethargy in the Gillingham et al. (2017) study.
Statistical Analysis
Study CL201
In Study CL201, approximately 30 patients with severe LC-FAODs were planned for enrolment. This planned sample size was not based on powering for hypothesis testing of a specific end point. Rather, the sample size was intended to provide the maximum amount of information regarding triheptanoin tolerability and dosing regimen, and to provide long-term safety and efficacy data following 78 weeks’ maintenance treatment with triheptanoin. No further details on recruitment or determination of this sample size were provided in the statistical plan. A pre-specified interim analysis was planned for week 12 per the protocol; however, this analysis was not performed, and the reason was not provided in the Clinical Study Reports. An interim analysis was also scheduled for week 48 but was removed in a protocol amendment, as this time point was deemed premature to accurately perform an analysis on the rate of MCEs. To assess the effects of triheptanoin treatment, analyses of data were conducted in 2 stages: the week 24 assessment was the main analysis for non-acute clinical disease (i.e., energy physiology through biologic and clinical assessments focusing on skeletal myopathy, hepatic disease, and cardiac disease) associated with LC-FAODs, where comparisons were based primarily on a change from the baseline (or run-in) value. Analyses were performed to assess MCEs following 78 weeks of treatment compared to historical data collected for the 18- to 24-month before study entry.
All statistical tests were 2-sided, and results showing a P value of less than or equal to 0.05 were considered statistically significant. No adjustments for multiplicity were made.
For MCEs, the annualized event rate and annualized event days of over the 78 weeks of triheptanoin treatment were compared with the pre-triheptanoin period using the paired t-test. For end points measuring change from baseline over time (e.g., 12MWT, cycle ergometry, and HRQoL), assessments were analyzed using a generalized estimation equation (GEE) model that included time as the categorical variable and adjusted for baseline measurement. Compound symmetry, which specified constant variance for the assessments and constant covariance between the assessments over time, was used as the covariance structure for the GEE model. For the study’s primary objectives, P values were provided for testing the statistical significance of change from baseline to week 24 and week 78 assessments. For the week 24 analysis (treatment period), only measurements up to week 24 were included in the model. For the week 78 analysis (treatment plus extension periods), all measurements were included in the model. Based on the scheduling of assessments, the 12MWT measurements taken at weeks 18 and 60 were considered the primary time point for the week 24 and 78 analyses, respectively. For analyses with insufficient observations for a GEE model, a descriptive summary was provided, and analyses using observations at a single time point (e.g., paired t-test or other nonparametric methodologies) were considered.
After final database lock, several analyses were added, including annualized event rate and annualized event days for total MCEs (i.e., for the composite of rhabdomyolysis, hypoglycemia, and cardiomyopathy events) to evaluate the aggregate effect of triheptanoin on metabolic crises. Sensitivity analyses for handling missing data using a negative binomial regression model, to account for different follow-up times and address impact on MCEs of patients who discontinued the study prematurely, were also added. Furthermore, subgroup analyses of MCEs were performed for age group at initial treatment with triheptanoin, age of presentation, LC-FAOD subtype, and administration route of triheptanoin. These analyses were also added after database lock. Ad hoc sensitivity analyses were performed for 12MWT and cycle ergometry results after 1 patient in each test was noted to have performed very differently from others in the group; sensitivity analyses were performed after excluding these patients.
MCEs with completely missing dates were excluded from both the number and duration of event calculations during both treatment periods. MCEs with either an admission or start date were counted in the number of events but were excluded from the total duration for both treatment periods. For each patient, randomly missing assessments remained as missing data. When a change from baseline was assessed, only patients with a baseline and at least 1 post-baseline measurement were included in the analysis. As previously mentioned, to address the impact of missing data due to premature discontinuation, a negative binomial regression model was used to compare MCEs before and during triheptanoin treatment.
Study CL202
Approximately 100 patients meeting the eligibility criteria were planned to be enrolled in the study. The sample size was intended to provide information regarding the long-term safety of triheptanoin, as well as indicators of sustained efficacy and durability of response. Further details on recruitment or determination of this sample size were provided in the statistical plan. No formal interim analysis was planned for CL202; however, an interim analysis including both efficacy and long-term safety data was conducted to support a regulatory filing (data cut-off of June 1, 2018).
Statistical analyses were mainly descriptive. Statistical tests were performed for selected end points; all were 2-sided and tested at a statistical significance level of 0.05.
The annualized MCE event rate (combination of rhabdomyolysis, hypoglycemia, and cardiomyopathy events) during the CL202 study period (i.e., study period 1) was calculated for the full analysis set (FAS; refer to the Analysis Populations section for definition) in the primary efficacy analysis; the annualized MCE event rate was also calculated by 18-month intervals. For secondary efficacy analyses, observed values and corresponding changes from baseline by visit during the CL202 study period were summarized for echocardiographic variables (ventricle size, ejection fraction, and shortening fraction), and annualized MCE event rate and event days were summarized for the FAS, as described for the primary efficacy end point. Summary statistics were produced for all exploratory end points using all available assessments in the CL202 study period. No covariates were planned for use in the analysis of primary and secondary efficacy end points.
When sample size and number of observations were allowed, end points measuring change from baseline over time were analyzed using a GEE model that included time as the categorical variable and adjusted for the baseline measurement. Compound symmetry, which specifies constant variance for the assessments and constant covariance between the assessments over time, was used as the covariance structure for the GEE model. For analyses with insufficient observations for a GEE model, a descriptive summary was provided, and analyses using observations at a single time point (e.g., paired t-test or other nonparametric methodologies) could be considered.
For patients in the CL201 rollover cohort, the long-term effects of triheptanoin treatment were assessed on the basis of MCE rates and echocardiographic variables (ventricle size, ejection fraction, and shortening fraction) using an integrated analysis by combining data collected from the CL201 an CL202 study periods. Annualized event rate and annualized event days of MCE (total and by type) were calculated for 3 periods (18 months pre-triheptanoin, 18-month triheptanoin treatment in CL201, and triheptanoin treatment in CL202). Baseline measures from Study CL201 were used for echocardiographic variables (ventricle size, ejection fraction, and shortening fraction). Statistical significance and P values were assessed, comparing the frequency and duration of MCEs between the pre-triheptanoin period and the first 36 months of triheptanoin treatment. The 36-month treatment window was selected to mitigate variability that may have been introduced from different triheptanoin treatment durations and to confirm the primary findings from Study CL201 over an extended treatment period.
For patients in the triheptanoin-naive cohort, statistical comparisons for all MCE-related end points (i.e., annualized event and annualized event days of MCEs overall and by event type) were made by comparing the retrospective period (18 months pre-triheptanoin) with the first 18 months of triheptanoin treatment. The comparison between pre-triheptanoin and triheptanoin treatment in MCE rates was also performed using a negative binomial regression model to account for different follow-up times during either the pre-triheptanoin period (for infants with less than 18 months of retrospective data collection) or triheptanoin treatment (for patients who discontinued the study early, before reaching 18 months of participation). The ratio of the event rate during triheptanoin treatment to the pre-triheptanoin event rate was provided, along with the 2-sided 95% CI and P values. For non-MCE end points measuring changes from baseline, 2-sided 95% CIs were provided for the current interim analysis; statistical significance and P values are planned for the final analysis.
For MCE-related end points measured in both cohorts, pre-triheptanoin and triheptanoin treatment comparisons were made using the paired t-test. For distributions that violated the normality assumption due to heavily skewed underlying distributions (i.e., P value from the Shapiro-Wilk normality test was less than 0.05), the Wilcoxon signed rank test was used instead of the paired t-test.
Several changes were made to the planned analyses, most notably to the CL201 rollover cohort. This included adding a pre-triheptanoin and triheptanoin treatment comparison, as previously described (i.e., statistical significance of annualized event rates and duration of MCEs during the pre-triheptanoin period compared to first 36 months of treatment). A negative binomial regression model was also performed to account for different follow-up times. Furthermore, for both CL201 rollover and triheptanoin-naive cohorts, sensitivity analyses to remove outliers that were identified for annualized event rate and event days of MCEs and MCE hospitalizations were added. An outlier was defined as a value that lies outside the interval (Q1 − 1.5 × IQR, Q3 + 1.5 × IQR), where IQR is the interquartile range (i.e., Q3 – Q1 of the underlying distribution during either the pre-triheptanoin or triheptanoin treatment period).
Subgroup analyses of MCE end points (annualized event rate and annualized duration of overall MCEs and MCE hospitalizations) were performed for the following subgroups in the CL201 rollover and triheptanoin-naive cohorts: age group at initial treatment with triheptanoin, age of presentation, LC-FAOD diagnosis, and administration route of triheptanoin. For the CL201 rollover cohort, the analysis included the pre-triheptanoin period and then first 36 months of total triheptanoin treatment, whereas, for the triheptanoin-naive cohort, the analysis included the pre-triheptanoin period and the first 18 months of treatment. However, due to limited sample size within each group, statistical testing was not conducted.
Missing assessments for each patient remained as missing, unless otherwise specified. When a change from baseline was assessed, only patients with a baseline measurement and at least 1 post-baseline measurement were included in the analysis. Furthermore, only observed data (not imputed data) were presented.
Gillingham et al. (2017) Study
In the Gillingham et al. (2017) study, a sample size of 32 patients (16 in each treatment group) was planned for enrolment. The authors targeted 5 to 6 patients per diagnostic group (i.e., CPT II, VLCAD, or TFP and LCHAD deficiency) at each study centre. Sample size calculations were based on a previous preliminary trial in patients with LC-FAODs, in which 6 patients were randomized to a standard high-carbohydrate diet and 6 were randomized to a high-protein diet, and the change in adjusted TEE was compared between treatment groups. The adjusted TEE outcome used was a z score for TEE, which was measured via doubly labelled water, and normed based on age, height, weight, and sex. The mean adjusted TEE z score from the preliminary data on the 12 patients was −1.12 (SD = 3.12) for the group on a high-protein diet, compared to −5.22 (SD = 1.82) for patients on a standard diet, with the mean difference of 4.1 observed in the TEE z score between the 2 diets. The study investigators anticipated a similar difference in change from baseline between triheptanoin and MCT diets. Using these SDs and an assumption that the SDs at baseline and follow-up are the same within each treatment group, the investigators calculated that the sample sizes per group needed to detect a 4.1 mean difference in z score change for a range of correlations between 0 and 0.75. A simple 2-sample t-test for change was used for the calculations. Specifically, a sample size of 14 patients was required to detect a mean difference of 4.1 in TEE z score with 80% power at significance level 0.05. This assumed zero correlation between baseline and follow-up TEE z scores, with an estimated SD of TEE z score difference from baseline of 2.57 for MCT and 4.41 for triheptanoin. Thus, a sample size of 32 patients was deemed sufficient to achieve greater than 80% power, and enrolment of sufficient patients was achieved.
The primary analyses, comparing change in energy expenditure, cardiac function, and exercise tolerance between the 2 treatment groups, were performed using linear mixed models, with a separate model for each outcome.
All models treated patients as a random effect, while treatment group (triheptanoin versus trioctanoin), time (baseline versus 4-month follow-up), and the interaction between these dichotomous factors, were held as fixed effects. Randomization factors (i.e., medical diagnostic group and investigation site) were also included as fixed effects. The formal test for comparing change between groups was based on an interaction assessing whether change over time (baseline versus 4-month time point) differs by treatment and serves as the effect of interest. In instances where pronounced (positive) skewness or extreme ranges (i.e., > 3-fold separation between the maximum and minimum observation) occurred, responses were log-transformed before fitting the models. End points involving a series of measurements over time (e.g., treadmill test) had mixed-effects models fit to the observed change between follow-ups. All P values were 2-sided and tested at a statistical significance level of 0.05 for each end point considered. No details were provided on subgroup analyses or the handling of missing data.
Analysis Populations
In CL201, the FAS included all patients enrolled (e.g., who participated in the run-in period) in the study. The primary analysis set (PAS) consisted of patients in the FAS who completed the 4-week run-in period and received at least 1 dose of triheptanoin. In general, the PAS set was used for analyses of the efficacy data. The PAS for a specific assessment was defined as follows:
cycle ergometry: the subset of patients in the PAS who had at least 1 cycle ergometry test performed with any duration
12MWT: the subset of patients in the PAS who had at least 1 12MWT performed with any distance walked
SF-10: the subset of patients in the PAS who had at least 1 SF-10 test performed
SF-12: the subset of patients in the PAS who had at least 1 SF-12 test performed
As the number of patients who were included in the PAS was the same as the FAS (n = 29), the 2 were considered interchangeable for the purposes of this CADTH review, and the PAS data have been reported and referred to as the FAS in the following tables. The per-protocol analysis set consisted of patients in the safety analysis set who completed at least 80% of triheptanoin doses and did not have a major protocol deviation recorded in the category of treatment compliance. A complete treatment dosage was defined as at least 25% of DCI from triheptanoin. The per-protocol analysis set was used for additional analyses of the key efficacy end points in cycle ergometry and 12MWT. The analysis of the MCEs was also assessed with the per-protocol analysis set. The safety analysis set included all patients who received at least 1 dose of triheptanoin and was used for all safety analyses.
In CL202, the FAS included all patients enrolled who had at least 1 post-baseline efficacy assessment. Unless noted otherwise, all efficacy analyses were based on the FAS. The FASs for specific assessments are defined as follows:
SF-10: subset of patients in the FAS whose age at enrolment was 6 or older to less than 18 years and who had at least 1 SF-10 test performed while in the CL202 study
SF-12v2: subset of patients in the FAS whose age at enrolment was 18 years or older and who had at least 1 SF-12v2 test performed while in the CL202 study
The safety analysis set included all patients who were enrolled and treated with at least 1 dose of triheptanoin while in the CL202 study.
In the Gillingham et al. (2017) study, the primary analysis, comparing change in energy expenditure, cardiac function, and exercise tolerance between triheptanoin and MCT supplementation, was performed on the intention-to-treat population, which included all randomized patients.
Protocol Amendments
Several amendments were made to the protocols of all 3 studies. The protocol for Study CL201 was amended 4 times. Notable amendments included an increase in number of patients planned for enrolment from 20 to 30, a change in the age criteria to change the lower limit to 6 months and remove the upper limit (original protocol was 6 to 25 years). The definition of severe LC-FAODs was also expanded in the inclusion criteria to capture more patients with severe disease. Also, TFP deficiency was added to the inclusion criteria. Due to unexpected performance issues, electronic diaries were discontinued and replaced by paper versions. Interim analysis at week 48 was removed. All protocol amendments were made before the first patient signing consent; only protocol amendment 4 (i.e., removal of the week 48 interim analysis and electronic diaries) occurred during patient enrolment.
The protocol for Study CL202 was amended 5 times. Notable amendments include expansion of study eligibility criteria by allowing patients who had failed conventional therapy and who had documented severe unmet need, and extending the study duration to 5 years (previously 3 years). The 12MWT, PEDI-CAT, and patient diaries for patient-reported fatigue, exercise tolerance, muscle pain, and activity level were removed, as they were deemed unlikely to provide informative data in a single-arm, open-label study setting (although fatigue and muscle pain were still considered AEs). Also, primary, secondary, and exploratory end points were clarified based on the study objectives. Exploratory end points were identified to characterize the potential effect of triheptanoin treatment on functional disability and cognitive development, clinical biomarkers, and growth measurements. All protocol amendments were made during patient enrolment.
The protocol for the Gillingham et al. (2017) RCT was amended 4 times. Notable amendments include the following. The age criteria were initially restricted to 7 to 45 years due to concerns about patients completing the exercise treadmill test, but the upper age limit was later removed, with no scientific justification given. The exclusion criterion of history of myocardial infarction was added. The number of patients recruited at each site was adjusted owing to institutional limitations; as a result, 20 patients were recruited at the Oregon Health and Science University and 12 patients were recruited at the University of Pittsburgh (total remained unchanged). Cardiac MRI was eliminated and was replaced by standard echocardiogram. Also, the end point measuring phosphocreatine depletion and recovery was added. All protocol amendments were made during patient enrolment.
Several analyses added after database lock for studies CL201 and CL202 are discussed in the Statistical Analysis section.
Results
Patient Disposition
Patient disposition is summarized in Table 12 for Study CL201 and Study CL202, and Table 13 for Gillingham et al. (2017).
Study CL201
In Study CL201, 30 patients were screened, 29 of whom were enrolled in the study as part of the FAS as well as the safety analysis set. Twenty-two patients were included in the per-protocol analysis, which reflected patients who were compliant with treatment (i.e., consumed at least 80% of triheptanoin doses and had no major protocol deviations). A significantly smaller group of patients relative to the enrolled population were included in the assessments of muscle function or exercise tolerance and HRQoL. By the data cut-off date, 5 patients (17.2%) had discontinued from the study, 25 patients (86.2%) had completed 24 weeks of triheptanoin treatment, and 24 patients (82.8%) had completed 78 weeks of treatment.
Study CL202
In Study CL202, a total of 75 patients were enrolled by the data cut-off date. Of these 75 patients, 24 had completed Study CL201 (CL201 rollover cohort), 20 were enrolled into the triheptanoin-naive cohort, and 31 had received previous triheptanoin treatment through ISTs or other mechanisms and were enrolled in the IST or other cohort. The mean duration of treatment was 25.92 months overall. The mean duration for each treatment cohort was as follows: 23.01 months for the CL201 rollover cohort (excludes CL201 study duration), 15.68 months for triheptanoin-naive cohort, and 34.77 months for the IST or other cohort.
One patient in the triheptanoin-naive cohort had been enrolled in the CL201 study but had discontinued the study after taking triheptanoin for 3 days, and subsequently did not receive triheptanoin for 2 years before enrolling in CL202. As a result, this patient was considered triheptanoin-naive. In the IST or other cohort, most patients (n = 27) had received triheptanoin under a compassionate use program. Seven patients who were previously enrolled in the Gillingham et al. (2017) trial were also included in the IST or other cohort, including 4 who also had received triheptanoin through the compassionate use program before enrolling in CL202.
All patients enrolled in CL202 were included in the FAS as well as the safety analysis set in their respective cohorts. Data for a per-protocol analysis set were not presented for this study. A significantly smaller group of patients relative to the enrolled population were included in the assessments of HRQoL. Ten patients (13.3%) had discontinued from the study; as CL202 is ongoing, no patients had completed the study at the time of the data cut-off.
Gillingham et al. (2017) Study
In the Gillingham et al. (2017) study, 39 patients were screened and 32 were randomized, with 16 in each treatment group. All patients had completed the study by the data cut-off date. However, patients were excluded from some planned analyses due to uninterpretable or missing data. A smaller group of patients relative to the enrolled population were included in the exercise protocol for assessment of phosphocreatine recovery. Also, echocardiogram evaluations were not available for 11 patients due to a logistic change in the protocol from cardiac MRI to echocardiogram after the first 7 patients were enrolled and technical difficulties leading to uninterpretable echocardiograms in 4 patients.
Table 12: Patient Disposition in Studies CL201 and CL202
Disposition | Study CL201 | Study CL202 | |||
|---|---|---|---|---|---|
Triheptanoin | CL201 rollover | Triheptanoin-naive | IST/other | Total | |
Screened, N | 30 | NA | NA | NA | NA |
Randomized, N | NA | NA | NA | NA | NA |
Enrolled, N | 29 | 24a | 20 | 31 | 75 |
Discontinued from study, N (%) | 5 (17.2) | 2 (8.3) | 3 (15.0) | 5 (16.1) | 10 (13.3) |
Reason for discontinuation, N (%) | |||||
Adverse events | 1 (3.4) | 0 (0.0) | 0 (0.0) | 0 (0.0) | 0 (0.0) |
Subject withdrew consent | 4 (13.8) | 1 (4.2) | 1 (5.0) | 0 (0.0) | 2 (2.7) |
Subject non-compliance | 0 (0.0) | 0 (0.0) | 0 (0.0) | 2 (6.5) | 2 (2.7) |
Death | 0 (0.0) | 0 (0.0) | 1 (5.0) | 1 (3.2) | 2 (2.7) |
Sponsor decision | 0 (0.0) | 0 (0.0) | 0 (0.0) | 2 (6.5) | 2 (2.7) |
Protocol violation | 0 (0.0) | 1 (4.2) | 0 (0.0) | 0 (0.0) | 1 (1.3) |
Physician decision | 0 (0.0) | 0 (0.0) | 1 (5.0) | 0 (0.0) | 1 (1.3) |
Completed 24 weeks of treatment, N (%) | 25 (86.2) | NA | NA | NA | NA |
Completed study, N (%) | 24 (82.8) | NA | NA | NA | NA |
FAS, N | 29 (100) | 24 (100.0) | 20 (100.0) | 31 (100.0) | 75 (100.0) |
Cycle ergometry | 10 (34.5) | NA | NA | NA | NA |
12MWT | 16 (55.2) | NA | NA | NA | NA |
SF-10 | 10 (34.5) | 6 (25.0) | 4 (20.0) | 11 (35.5) | 21 (28.0) |
SF-12 | 6 (20.7) | 9 (37.5) | 7 (35.0) | 16 (51.6) | 32 (42.7) |
PP analysis set, N | 22 (75.9) | NA | NA | NA | NA |
Cycle ergometry | 7 (24.1) | NA | NA | NA | NA |
12MWT | 13 (44.8) | NA | NA | NA | NA |
SF-10 | 6 (20.7) | NA | NA | NA | NA |
SF-12 | 5 (17.2) | NA | NA | NA | NA |
Safety, N | 29 (100) | 24 (100.0) | 20 (100.0) | 31 (100.0) | 75 (100.0) |
12MWT = 12-minute walk test; FAS = full analysis set; IST = investigator-sponsored trial; NA = not applicable; PP = per-protocol.
aOne patient who participated in CL201 study but was off triheptanoin for more than 2 years was enrolled as a triheptanoin-naive patient in CL202.
Source: CL201 Clinical Study Report,8 CL202 Clinical Study Report.9
Table 13: Patient Disposition in the Gillingham et al. (2017) Study
Disposition | Triheptanoin | Trioctanoin |
|---|---|---|
Screened, N | 39 | |
Randomized, N | 16 | 16 |
Discontinued from study, N (%) | 0 (0) | 0 (0) |
Completed study, N (%) | 16 (100) | 16 (100) |
Select analysis populations,a N (%) | ||
PCr MRS | 8 (50.0) | 7 (43.8) |
Echocardiogram | 10 (62.5) | 11 (68.8) |
MRS = magnetic resonance spectroscopy; PCr = phosphocreatine.
aSome patients were excluded from planned analyses due to a lack of, or uninterpretable, data. The lack of echocardiogram data in 6 triheptanoin patients and 5 trioctanoin patients was due to a change in the protocol from cardiac MRI to echocardiogram after the randomization of the first 7 patients and technical issues that resulted in uninterpretable data in 4 patients.
Exposure to Study Treatments
A summary of treatment exposure and concomitant therapies can be found in Table 14.
Study CL201
In Study CL201, the mean duration of treatment was 15.86 months (SD = 6.07). On average, patients were prescribed a mean triheptanoin dosage of 66.8 mL (SD = 33.85), which corresponded to a mean DCI percentage of 31.20% (SD = 8.88%). The mean dosage of triheptanoin consumed was 27.5% (SD = 4.58) of DCI. During the study, patients received the prescribed breakdown of macronutrients consistent with dietary guidelines for management of patients with LC-FAODs, and macronutrient breakdown (percentage of DCI) was relatively stable between the pre-triheptanoin and triheptanoin treatment periods. The most notable change was a 10% DCI increase (from average 17.4% to 27.5%) in the amount of medium-chain fat consumed compared to the pre-triheptanoin period. Various other dietary management was prescribed during the study; of note, 69.0% of patients received carnitine supplementation.
Study CL202
As of the data cut-off date, the mean duration of treatment was 25.92 months (SD = 11.080). Patients in the IST or other cohort had the longest mean duration of treatment (34.77 months; SD = 5.628) and triheptanoin-naive patients had the shortest duration (15.68 months; SD = 11.530). Patients in the CL201 rollover cohort received a mean duration of triheptanoin of 23.01 months (SD = 6.186) while enrolled in CL202, in addition to approximately 18 months of triheptanoin treatment while enrolled in CL201 (mean duration of study participation for combined CL201 and CL202 of 41.4 months). The mean dosage of triheptanoin prescribed was 64.35 mL (SD = 24.610), which corresponded to a mean DCI percentage of 26.95% (SD = 7.48); the mean prescribed dosage and percentage of DCI were overall similar among the 3 cohorts. The mean triheptanoin dosage (percentage of DCI) actually consumed was not reported, although most patients consumed more than 90% of their prescribed dosage. According to the Clinical Study Report, patients received the prescribed breakdown of macronutrients consistent with dietary guidelines for the study and management of patients with LC-FAODs. However, a detailed breakdown of macronutrients received (percentage of DCI) averaged over visits throughout the study was not reported for each cohort separately. Various other dietary management was also received by patients in the CL201 rollover and triheptanoin-naive cohorts; most notably, 66.7% and 80.0% of patients in the CL201 rollover and triheptanoin-naive cohorts, respectively, received carnitine supplementation during the CL202 study. Details of concomitant treatment in the IST or other cohort were not available.
Gillingham et al. (2017) Study
Based on analysis of the 3-day diet records in the Gillingham et al. (2017) study, patients consumed 16.62% (SD = 2.66) and 14.83% (SD = 3.40) of DCI from triheptanoin and trioctanoin, respectively. During the 4 months of study treatment, based on measures of compliance (i.e., amount of oil dispensed minus amount returned), patients had consumed 73.94% (SD = 22.59) and 75.59% (SD = 19.04) of the prescribed triheptanoin and trioctanoin, respectively. A detailed breakdown of the actual percentage of DCI of macronutrients received by the patients during the study was not reported, nor were concomitant treatments taken during the study.
Table 14: Treatment Exposure and Concomitant Therapies for Studies CL201, CL202, and Gillingham et al. (2017) — Full Analysis Set
Treatment | CL201 | CL202 | Gillingham et al. (2017) | |||
|---|---|---|---|---|---|---|
Triheptanoin N = 29 | CL201 rollover N = 24 | Triheptanoin-naive N = 20 | IST/other N = 31 | Triheptanoin N = 16 | Trioctanoin N = 16 | |
Exposure to study drug | ||||||
Average % of daily caloric intake prescribed | ||||||
Mean (SD) | 31.20 (8.875) | 30.06 (4.607) | 27.27 (5.160) | 24.33 (9.492) | NR | NR |
Median (IQR) | 31.9 (26.8 to 34.6) | 30.93 (26.00 to 34.63) | 28.24 (24.00 to 30.68) | 26.29 (16.53 to 30.94) | NR | NR |
Average % of daily caloric intake consumed | ||||||
Mean (SD) | 27.5 (4.58) | NR | NR | NR | 16.62 (2.66) | 14.83 (3.40) |
Median (IQR) | 28.5 (22.7 to 30.9) | NR | NR | NR | NR | NR |
Overall average daily dosage (mL) | ||||||
Mean (SD) | 66.81 (33.849) | 68.40 (19.958) | 59.33 (21.400) | 64.46 (29.472) | NR | NR |
Median (IQR) | 56.4 (46.5 to 72.0) | 66.51 (54.17 to 82.00) | 58.34 (44.06 to 79.06) | 65.00 (42.90 to 77.86) | NR | NR |
Duration of treatment (months) | ||||||
Mean (SD) | 15.86 (6.07)a | 23.01 (6.186) | 15.68 (11.530) | 34.77 (5.628) | NA | NA |
Median (IQR) | 18.14 (17.68 to 18.40) | 24.30 (22.14 to 25.18) | 14.54 (5.98 to 26.15) | 36.60 (33.51 to 37.98) | NA | NA |
Triheptanoin treatment compliance | ||||||
Patients with compliance ≥ 80%,b n (%) | 25 (86.2) | 21 (87.5) | 14 (70.0) | 29 (93.5) | NR | NR |
Overall mean dosage consumption,c % (SD) | NR | 95.76 (11.169) | 94.32 (11.880) | 94.57 (11.517) | 73.94 (22.59) | 75.59 (19.04) |
Concomitant treatment | ||||||
Any LC-FAOD treatment, n (%)d | 28 (96.6) | 23 (95.8) | 20 (100.0) | NRe | NR | NR |
Carnitine supplementation | 20 (69.0) | 16 (66.7) | 16 (80.0) | NRe | NR | NR |
MCT formulationf | 2 (13.3) | 2 (8.3) | 3 (15.0) | NRe | NR | NR |
Other dietary management n (%) | 22 (75.9) | 19 (79.2) | 17 (85.0) | NRe | NR | NR |
Nutrients NOS | 9 (31.0) | 8 (33.3) | 2 (10.0) | NRe | NR | NR |
Zea mays (corn) seed | 7 (24.1) | 7 (29.2) | 2 (10.0) | NRe | NR | NR |
Docosahexaenoic acid | 6 (20.7) | 6 (25.0) | 7 (35.0) | NRe | NR | NR |
Linseed (Linum usitatissimum) oil | 5 (17.2) | 3 (12.5) | 2 (10.0) | NRe | NR | NR |
Herbal and traditional medicine | NR | 9 (37.5) | 4 (20.0) | NRe | NR | NR |
Any treatment for acute management of MCE, n (%) | 5 (17.2) | 6 (25.0) | 2 (10.0) | NRe | NR | NR |
Dietary management during study | ||||||
N | 25 | NR | NR | NR | ||
Macronutrient breakdown, treatment period average,g mean % of DCI (SD) | ||||||
Protein | 14.5 (3.33) | 15 (NR) | NR | NR | ||
Carbohydrates | 47.1 (7.39) | 48 (NR) | NR | NR | ||
Total fat | 37.7 (5.66) | 36 (NR) | NR | NR | ||
Medium-chain fat | 27.5 (4.58) | 25 (NR) | NR | NR | ||
Long-chain fat | 10.5 (3.82) | 11 (NR) | NR | NR | ||
DCI = daily caloric intake; IST = investigator-sponsored trial; IQR = interquartile range; LC-FAOD = long-chain fatty acid oxidation disorder; MCE = major clinical event; MCT = medium-chain triglyceride; NOS = not otherwise specified; NR = not reported; SD = standard deviation.
aIn the Clinical Study Reports, duration of treatment was reported as days in CL201 and months in CL202. For consistency, reported days was converted to months using 30.4375 as a denominator, as defined in the CL202 statistical analysis plan.
bAlso measured as dosage completion percentage and refers to the percentage of total treatment days on dosage of at least 25% of DCI.
cIn CL202, overall triheptanoin dosage completion percentage was calculated as: sum of (percentage of prescribed triheptanoin taken × duration) / sum of duration of each dosage compliance diary. In the Gillingham et al. (2017) study, data were reported as the percentage of prescribed dosage consumed.
dIncludes LC-FAOD treatments for both acute management of MCEs and for general maintenance for the underlying LC-FAOD disease. Categories under other dietary management were included if any treatment group included greater than 15% of patients who received such prior treatment.
eInformation on treatment before enrolment for the IST/other cohort was limited to prior exposure on triheptanoin from the parent program and did not include pre-triheptanoin management history. Thus, the IST/other cohort data were not presented in the Clinical Study Report.
fIn CL201, 2 patients started back on MCT after discontinuing triheptanoin dosage and continued MCT through study termination visit. In CL202, 2 patients in the CL201 rollover group and 3 patients in the triheptanoin-naive group took MCT while on triheptanoin.
gTreatment period average values are based on average value of week 12, 24, 48, and 78 visits in CL201. For CL202, approximate values were reported based on intake throughout the study.
Source: CL201 Clinical Study Report,8 CL202 Clinical Study Report.9
Efficacy
Only efficacy outcomes and analyses of subgroups identified in the review protocol are reported as follows. Refer to Appendix 3 for detailed efficacy data.
No data were available for the following key efficacy outcomes identified in the CADTH review protocol: survival, symptom relief, concomitant medication, and productivity. Also, for efficacy outcomes with available data, many were not evaluated across all 3 studies.
Survival
Survival was not an efficacy end point in any of the studies included in this review. However, deaths that occurred during CL201 and CL202 are summarized in the Harms section.
Major Clinical Events
In studies CL201 and CL202, the majority of MCEs, both before and during triheptanoin treatment, were supported by clinical and/or laboratory assessments. Rhabdomyolysis events were associated with elevated CK levels. Hypoglycemia events were defined by clinical symptoms (e.g., altered mental status, fatigue, pallor, palpitations, slurred speech, excessive sweating, shakiness, and/or light-headedness) or by glucose level readings below the lower limits of the reference range used by the institution. Cardiomyopathy events showed reduced LVEF by echocardiography.
Study CL201
Key efficacy end points for CL201 included the annualized event rate and event days (i.e., duration rate) of MCEs, which was a measure of hospitalization, ED or acute care visits, or emergency interventions due to pre-specified clinical manifestations. Pre-specified key efficacy end points were MCEs due to rhabdomyolysis, hypoglycemia, and cardiomyopathy events individually; a composite end point including all 3 clinical manifestations to evaluate the aggregate effect was added after final database lock. Analyses was performed at week 78, with data compared between the pre-triheptanoin and triheptanoin treatment periods.
In total, 70 MCEs occurred in 22 patients during the pre-triheptanoin period, and 39 events occurred in 16 patients through week 78 of the triheptanoin treatment period (Table 36). Of note, 4 events that had occurred during the pre-triheptanoin period were excluded from analyses due to missing dates. The majority of MCEs were due to rhabdomyolysis. A reduction in annualized event rates and event days occurred across all 3 clinical manifestations with triheptanoin treatment but was most favourable for the aggregate measure including all event types. For total MCEs, including all event subtypes, the difference in the mean annualized event rate was 0.813 events per year, and the difference in mean annualized event days was 2.997 in favour of triheptanoin (Table 15). Figure 7 and Figure 8 in Appendix 3 present individual-level data for MCEs as well as annualized events and duration rates.
Study CL202
The primary efficacy end point for CL202 was the annualized MCE rate, including skeletal myopathy (rhabdomyolysis), hepatic (hypoglycemia), and cardiomyopathy events. Secondary efficacy end points for CL202 included annualized event days of all MCEs, as well as annualized event rates and annualized event days of each MCE type (i.e., rhabdomyolysis, hypoglycemia, and cardiomyopathy). The definition of MCE was the same as for CL201 and included any visit to the ED or acute care, hospitalization, emergency intervention, or any similar event due to or complicated by LC-FAODs. The focus of the interim analysis was on the effects of triheptanoin on patients in the CL201 rollover and triheptanoin-naive cohorts. Statistical comparisons were performed after 36 months of treatment in the CL201 rollover group (including CL201 and CL202 studies) and after 18 months of treatment in the triheptanoin-naive cohort, with data compared between the pre-triheptanoin and triheptanoin treatment periods.
As of the data cut-off date of June 1, 2018, there were 259 MCEs experienced by 47 patients in the overall population. The majority of MCEs were due to rhabdomyolysis. Of the 3 cohorts, patients enrolled in the IST or other cohort had the highest number of MCEs (as well as the longest duration of participation). However, comparative analyses were not performed for the IST or other cohort. Annualized MCE event rate and event days during the CL202 study in all 3 cohorts, plus the overall population, are presented in Table 37.
In the CL201 rollover cohort, 22 of the 24 patients (91.7%) had at least 36 months of study participation. In total, 60 MCEs occurred in 18 patients during the pre-triheptanoin period, and 67 MCEs occurred in 17 patients through the first 36 months of the triheptanoin treatment period (Table 38). The majority of MCEs were due to rhabdomyolysis events. The most notable improvement with triheptanoin was in the annualized event rate of total MCEs. For this primary efficacy end point, the difference in the mean annualized event rate of total MCEs, including all event subtypes, was 0.8 events per year in favour of triheptanoin (Table 16). For the remaining annualized event rates and event days (secondary efficacy end points), reductions was generally occurred favour of triheptanoin across all comparisons, but none were significant. The exception was major rhabdomyolysis events, for which the mean annualized event days appeared to increase with treatment, although median days decreased. This may be due to the highly skewed distribution of annualized event days observed in this cohort; thus, the Clinical Study Report used median values to describe annualized event days.
In the triheptanoin-naive cohort, 7 of the 20 patients (35.0%) had reached 18 months of study participation or MCE data collection as of the data cut-off date. In total, 84 MCEs occurred in 16 patients during the pre-triheptanoin period, and 27 MCEs occurred in 12 patients during the 18 months of triheptanoin treatment (Table 39). The majority of MCEs were due to rhabdomyolysis events. Due to heavily skewed distributions observed in this cohort, median values were used to describe annualized event rates and event days in the Clinical Study Report. The mean values for total MCEs and for rhabdomyolysis events appeared to increase with treatment; however, median values decreased. The mean annualized event rates and event days for hypoglycemia and cardiomyopathy decreased, although no change occurred in the median values due to the small number of events. None of the changes were significant (Table 17).
In Study CL202, outliers skewed the distribution for the total MCE end points. Specifically, in the CL201 rollover cohort, outliers were identified for annualized event rate (n = 1) and event days (n = 4); in the triheptanoin-naive cohort, outliers were identified for identified for annualized event rate (n = 3) and event days (n = 5). Ad hoc sensitivity analyses were performed to remove outlier values. In the CL201 rollover cohort, results of this sensitivity analysis were consistent with the original dataset of this cohort, whereas, in the triheptanoin-naive patients, results were consistent with the CL201 study, in which a notable difference in favour of triheptanoin occurred in the annualized event rate and event days.
Gillingham et al. (2017) Study
MCEs were not measured as part of the efficacy analyses in the Gillingham et al. (2017) study.
Table 15: Annualized Major Clinical Events Pre- and Post-Triheptanoin for Study CL201 —Full Analysis Set
Clinical event | Pre-triheptanoin (78-week retrospective period) N = 29 | Triheptanoin (78-week treatment) N = 29 |
|---|---|---|
Total major clinical events (all event subtypes) | ||
Annualized event rate (events per year) | ||
Mean (SD) | 1.690 (1.6081) | 0.877 (1.1420) |
Median (IQR) | 1.333 (0.667 to 2.250) | 0.659 (0.000 to 1.311) |
P valuea | 0.0208 | |
Annualized event days (days per year) | ||
Mean (SD) | 5.961 (6.0783) | 2.964 (3.9733) |
Median (IQR) | 5.332 (0.667 to 8.665) | 1.244 (0.000 to 4.666) |
P valuea | 0.0284 | |
Major rhabdomyolysis event | ||
Annualized event rate (events per year) | ||
Mean (SD) | 1.303 (1.5077) | 0.833 (1.1513) |
Median (IQR) | 0.667 (0.000 to 2.000) | 0.619 (0.000 to 1.311) |
P valuea | 0.1189 | |
Annualized event days (days per year) | ||
Mean (SD) | 3.949 (4.3687) | 2.792 (3.8452) |
Median (IQR) | 2.666 (0.000 to 5.999) | 1.244 (0.000 to 4.333) |
P valuea | 0.2043 | |
Major hypoglycemia events | ||
Annualized event rate (events per year) | ||
Mean (SD) | 0.318 (0.9053) | 0.023 (0.1224) |
Median (IQR) | 0.000 (0.000 to 0.000) | 0.000 (0.000 to 0.000) |
P valuea | 0.0677 | |
Annualized event days (days per year) | ||
Mean (SD) | 1.414 (4.3025) | 0.023 (0.1224) |
Median (IQR) | 0.000 (0.000 to 0.000) | 0.000 (0.000 to 0.000) |
P valuea | 0.0852 | |
Cardiomyopathy events | ||
Annualized event rate (events per year) | ||
Mean (SD) | 0.069 (0.2728) | 0.021 (0.1150) |
Median (IQR) | 0.000 (0.000 to 0.000) | 0.000 (0.000 to 0.000) |
P valuea | 0.3090 | |
Annualized event days (days per year) | ||
Mean (SD) | 0.598 (2.4054) | 0.149 (0.8047) |
Median (IQR) | 0.000 (0.000 to 0.000) | 0.000 (0.000 to 0.000) |
P valuea | 0.2882 | |
IQR = interquartile range; SD = standard deviation.
Note: MCEs included rhabdomyolysis, hypoglycemia, and cardiomyopathy events caused by LC-FAODs, resulting in any hospitalization, ED or acute care visits, or emergency interventions. The pre-triheptanoin period is 18 months before triheptanoin initiation. If a patient’s age was less than 18 months at triheptanoin initiation, the pre-triheptanoin period was between the birth date and the day before triheptanoin initiation. The triheptanoin treatment period is between the triheptanoin initiation date and completion date or the early termination date, whichever is earlier.
aP value calculated using a paired t-test, Analyses were not adjusted for multiple testing (i.e., the type I error rate had not been controlled).
Source: CL201 Clinical Study Report.8
Table 16: Annualized Major Clinical Events Pre- and Post-Triheptanoin in the CL201 Rollover Cohort in Study CL202 — Full Analysis Set
Clinical event | Pre-triheptanoin (18-month retrospective period) N = 24 | Triheptanoin (36-month treatment) N = 24 |
|---|---|---|
Total major clinical events (all event subtypes) | ||
Annualized event rate (events per year) | ||
Mean (SD) | 1.76 (1.640) | 0.96 (1.089) |
Median (IQR) | 1.53 (0.33 to 2.73) | 0.50 (0.0 to 1.62) |
P valuea | 0.0319 | |
Annualized event days (days per year) | ||
Mean (SD) | 6.31 (6.35) | 5.78 (11.501) |
Median (IQR) | 5.33 (0.33 to 9.00) | 1.83 (0.0 to 5.67) |
P valueb | 0.3002 | |
Major rhabdomyolysis event | ||
Annualized event rate (events per year) | ||
Mean (SD) | 1.30 (1.530) | 0.89 (1.054) |
Median (IQR) | 0.90 (0.00 to 2.00) | 0.50 (0.00 to 1.33) |
P valueb | 0.2598 | |
Annualized event days (days per year) | ||
Mean (SD) | 3.88 (4.394) | 5.16 (11.166) |
Median (IQR) | 3.33 (0.00 to 6.00) | 1.83 (0.00 to 5.50) |
P valueb | 0.7086 | |
Major hypoglycemia events | ||
Annualized event rate (events per year) | ||
Mean (SD) | 0.38 (0.984) | 0.01 (0.068) |
Median (IQR) | 0.00 (0.00 to 0.00) | 0.00 (0.00 to 0.00) |
P valueb | 0.1250 | |
Annualized event days (days per year) | ||
Mean (SD) | 1.71 (4.681) | 0.01 (0.068) |
Median (IQR) | 0.00 (0.00 to 0.00) | 0.00 (0.00 to 0.00) |
P valueb | 0.1250 | |
Cardiomyopathy events | ||
Annualized event rate (events per year) | ||
Mean (SD) | 0.08 (0.299) | 0.06 (0.212) |
Median (IQR) | 0.00 (0.00 to 0.00) | 0.00 (0.00 to 0.00) |
P valueb | 1.0000 | |
Annualized event days (days per year) | ||
Mean (SD) | 0.72 (2.636) | 0.61 (2.091) |
Median (IQR) | 0.00 (0.00 to 0.00) | 0.00 (0.00 to 0.00) |
P valueb | 1.0000 | |
IQR = interquartile range; SD = standard deviation.
Note: Pre-triheptanoin period comprises the 18 months preceding triheptanoin initiation (or from birth to triheptanoin initiation for infants) during the retrospective period (study period 3). Triheptanoin treatment period comprises the first 36 months following triheptanoin initiation during the combined CL201 and CL202 study period (study period 2), or from triheptanoin initiation to discontinuation for subjects who discontinued.
aP values from paired t-test are presented (the P value from the Shapiro-Wilk normality test for annualized event rate was 0.1387). Analyses were not adjusted for multiple testing (i.e., the type I error rate had not been controlled).
bP values from Wilcoxon signed rank test are presented, as the normality assumption was violated (Shapiro-Wilk normality test P value < 0.05). Analyses were not adjusted for multiple testing (i.e., the type I error rate had not been controlled).
Source: CL202 Clinical Study Report.9
Table 17: Annualized Major Clinical Events Pre- and Post-Triheptanoin in the Triheptanoin-Naive Cohort in Study CL202 — Full Analysis Set
Clinical event | Pre-triheptanoin (18-month retrospective period) N = 20 | Triheptanoin (18-month treatment) N = 20 |
|---|---|---|
Total major clinical events (all event subtypes) | ||
Annualized event rate (events per year) | ||
Mean (SD) | 2.95 (3.010) | 7.72 (27.054) |
Median (IQR) | 2.33 (1.00 to 3.83) | 0.71 (0.0 to 1.90) |
P valuea | 0.1072 | |
Annualized EVENT DAYS (days per year) | ||
Mean (SD) | 18.86 (28.919) | 28.89 (85.178) |
Median (IQR) | 10.00 (3.33 to 19.00) | 2.00 (0.0 to 6.58) |
P valuea | 0.1475 | |
Major rhabdomyolysis event | ||
Annualized event rate (events per year) | ||
Mean (SD) | 2.63 (3.107) | 7.69 (27.063) |
Median (IQR) | 2.00 (0.00 to 3.00) | 0.71 (0.00 to 1.90) |
P valuea | 0.2734 | |
Annualized event days (days per year) | ||
Mean (SD) | 12.76 (20.871) | 28.85 (85.190) |
Median (IQR) | 7.00 (0.00 to 16.33) | 2.00 (0.00 to 6.58) |
P valuea | 0.3335 | |
Major hypoglycemia events | ||
Annualized event rate (events per year) | ||
Mean (SD) | 0.22 (0.823) | 0.00 (0.000) |
Median (IQR) | 0.00 (0.00 to 0.00) | 0.00 (0.00 to 0.00) |
P valuea | 0.5000 | |
Annualized event days (days per year) | ||
Mean (SD) | 5.40 (23.666) | 0.00 (0.000) |
Median (IQR) | 0.00 (0.00 to 0.00) | 0.00 (0.00 to 0.00) |
P valuea | 0.5000 | |
Cardiomyopathy events | ||
Annualized event rate (events per year) | ||
Mean (SD) | 0.10 (0.326) | 0.03 (0.149) |
Median (IQR) | 0.00 (0.00 to 0.00) | 0.00 (0.00 to 0.00) |
P valuea | 1.0000 | |
Annualized event days (days per year) | ||
Mean (SD) | 0.700 (2.832) | 0.03 (0.149) |
Median (IQR) | 0.00 (0.00 to 0.00) | 0.00 (0.00 to 0.00) |
P valuea | 0.5000 | |
IQR = interquartile range; SD = standard deviation.
aAll P values presented are from Wilcoxon signed rank test as the normality assumption was violated (Shapiro-Wilk normality test P value < 0.05). Analyses were not adjusted for multiple testing (i.e., the type I error rate had not been controlled).
Note: Pre-triheptanoin period comprises the 18 months preceding triheptanoin initiation (or from birth to triheptanoin initiation for infants) during the retrospective period (study period 3). Triheptanoin treatment period is the first 18 months following triheptanoin initiation during the CL202 study period (study period 1), or from triheptanoin initiation to discontinuation for subjects who discontinued.
Source: CL202 Clinical Study Report.9
Subgroup Analyses
Ad hoc analyses of the following 2 relevant subgroups, as identified in the CADTH systematic review protocol, were performed in CL201 and CL202: age at triheptanoin initiation and LC-FAOD diagnosis subtype.
Age at Treatment Initiation
To evaluate the effect of triheptanoin on MCEs by age at treatment initiation, annualized event rates and event days were examined according to the following age categories: younger than 6 years, 6 to less than 18 years, and 18 years or older. In Study CL201, the youngest age group (children < 6 years) experienced higher annualized event rates and annualized event days, both before and during triheptanoin treatment, compared with older children and adults. Overall, results were generally consistent with the overall patient population. Across all age subgroups, the mean annualized event rates and event days decreased during triheptanoin treatment compared with the pre-triheptanoin period. The most notable reduction was in children younger than 6 years of age (Table 40).
In the CL201 rollover cohort of Study CL202, the mean annualized event rates decreased during triheptanoin treatment compared with the pre-triheptanoin period across all age groups, although the median increased in the 2 older age groups. The mean annualized event days decreased in young children (< 6 years) but showed an increase in older children and adults; the median annualized event days also decreased in the pediatric age groups but increased in adults (Table 41).
In the triheptanoin-naive cohort of Study CL202, the median annualized event rates decreased during triheptanoin treatment compared with the pre-triheptanoin period across all age categories. The median annualized event days decreased in the pediatric age groups but showed an increase in the adult age group. Change in mean values were variable across the age groups. Of note, 2 of the 4 adult patients were identified as outliers and skewed the annualized event rate and event days calculations, limiting the interpretability of the results (Table 42).
LC-FAOD Diagnosis Subtype
To evaluate the effect of triheptanoin on MCEs in LC-FAOD subtypes, annualized event rates and days were examined according to the following LC-FAOD subtypes: LCHAD, VLCAD, CPT II, and TFP deficiency.
In Study CL201, patients with the more common LC-FAOD subtypes (LCHAD and VLCAD deficiencies) experienced reductions in annualized event rate and event days with triheptanoin treatment compared to the pre-triheptanoin period. The 4 patients with CPT II deficiency also experienced a reduction in annualized event and event days during triheptanoin treatment. Only 3 patients with TFP were enrolled in the study; a reduction in annualized event rate occurred, but not in annualized event duration (Table 43).
In the CL201 rollover cohort of Study CL202, patients with the more common LC-FAOD subtypes (LCAD and VLCAD deficiencies) also experienced reductions in annualized event rates and event days with triheptanoin treatment compared to the pre-triheptanoin period. The 3 patients with CPT II deficiency also experienced a reduction in annualized event rate and event days during triheptanoin treatment. Similar to CL201, only 3 patients with TFP deficiency were enrolled in the study, and they experienced an increase in annualized event rate and annualized event days. However, 2 of the 3 patients were identified as outliers in the study, which limits the interpretability of the results (Table 44).
In the triheptanoin-naive cohort of Study CL202, patients with the more common LC-FAOD subtypes (LCHAD and VLCAD deficiencies) experienced reductions in median annualized event rate and annualized event days with triheptanoin treatment compared to the pre-triheptanoin period. The 2 patients with CPT II deficiency both also experienced a reduction in annualized event rate and annualized event days during triheptanoin treatment. Only 3 patients with TFP deficiency were enrolled, and no changes in the median annualized event rates or event days were noted. Changes in mean values were variable across the diagnosis subtypes. Two CACT patients and 1 CPT patient were excluded from the subgroup analysis due to the small sample size in the respective subgroup (Appendix 3, Table 19).
Hospitalizations
Hospitalizations were captured as part of the MCEs in CL201 and CL202.
Study CL201
Most MCEs during the pre-triheptanoin and triheptanoin treatment periods were hospitalizations. In total, there were 57 hospitalizations (81.4% of the 70 total MCEs) in 21 patients during the pre-triheptanoin period and 29 hospitalizations (74.4% of the 39 total MCEs) in 13 patients during triheptanoin treatment (Table 46). The majority of hospitalizations were due to rhabdomyolysis. Although few events due to cardiomyopathy occurred during the study, all led to hospitalization due to the serious nature of the event. A reduction in annualized hospitalization rates and hospitalization days occurred across all 3 clinical manifestations with triheptanoin treatment but was most favourable for the aggregate measure including all event types. For hospitalizations due to total MCEs, including all event subtypes, the difference in the mean annualized event rate was 0.739 hospitalizations per year, and the difference in mean annualized event days was 2.923 in favour of triheptanoin (Table 18).
Study CL202
As of the data cut-off date of June 1, 2018, there were 188 hospitalizations for MCEs experienced by 43 patients in the overall population. The majority of hospitalizations were due to rhabdomyolysis. Of the 3 cohorts, patients enrolled in the IST or other cohort had the highest number of hospitalizations. However, comparative analyses were not performed for the IST or other cohort. Annualized hospitalization rate and duration during the CL202 study in all 3 cohorts, plus the overall population, are shown in Table 48.
In the CL201 rollover cohort, there were 48 hospitalizations (80.0% of 60 total MCEs) in 17 patients during the pre-triheptanoin period and 53 hospitalizations (79.1% of 67 total MCEs) in 15 patients during the first 36 months of the triheptanoin treatment period (Table 49). The majority of MCEs were due to rhabdomyolysis. The greatest improvement with triheptanoin treatment occurred in the annualized hospitalization rate of total MCEs. The difference in the mean annualized hospitalization rate of total MCEs, including all event subtypes, was 0.67 events per year in favour of triheptanoin (Table 19). For the remaining annualized hospitalization rates and hospitalization days, reductions were generally in favour of triheptanoin across all comparisons, but none were significant. The exception was hospitalization for major rhabdomyolysis events, for which the mean annualized event days appeared to increase with treatment, although median days decreased. This may be due to the highly skewed distribution of annualized event days observed in this cohort; thus, the Clinical Study Report used median values to describe annualized event days.
In the triheptanoin-naive cohort, there were 64 hospitalizations (76.2% of 84 total MCEs) in 16 patients during the pre-triheptanoin period and 23 hospitalizations (85.2% of 27 MCEs) in 10 patients during the 18 months of triheptanoin treatment (Appendix 3, Table 50). The majority of MCEs were due to rhabdomyolysis. Due to heavily skewed distributions observed in this cohort, median values were used to describe annualized event rates and event days in the Clinical Study Report. The mean values for hospitalization due to total MCEs and rhabdomyolysis appeared to increase with treatment; however, median values decreased. The mean annualized event rates and event days for hypoglycemia and cardiomyopathy decreased, although there was no change in the median values due to the small number of events. None of the changes observed were significant (Table 20).
Gillingham et al. (2017) Study
In the Gillingham et al. (2017) study, 7 hospitalizations for acute rhabdomyolysis were reported in each treatment group. There was no difference in length of hospital stay.
Table 18: Annualized Hospitalizations for Major Clinical Events in Study CL201 — Full Analysis Set
Hospitalizations | Pre-triheptanoin (78-week retrospective period) N = 29 | Triheptanoin (78-week treatment) N = 29 |
|---|---|---|
Hospitalizations for major clinical events (all event types) | ||
Annualized event rate (events per year) | ||
Mean (SD) | 1.391 (1.3453) | 0.652 (1.0076) |
Median (IQR) | 1.145 (0.000 to 2.000) | 0.000 (0.000 to 0.678) |
P valuea | 0.0160 | |
Annualized event days (days per year) | ||
Mean (SD) | 5.662 (6.1092) | 2.739 (3.9413) |
Median (IQR) | 4.328 (0.000 to 7.998) | 0.000 (0.000 to 4.158) |
P valuea | 0.0316 | |
Hospitalizations for rhabdomyolysis events | ||
Annualized event rate (events per year) | ||
Mean (SD) | 1.027 (1.898) | 0.630 (1.0013) |
Median (IQR) | 0.667 (0.000 to 1.731) | 0.000 (0.000 to 0.668) |
P valuea | 0.1044 | |
Annualized event days (days per year) | ||
Mean (SD) | 3.674 (4.3564) | 2.589 (3.7876) |
Median (IQR) | 2.000 (0.000 to 5.725) | 0.000 (0.000 to 4.158) |
P valuea | 0.2232 | |
Hospitalizations for hypoglycemia events | ||
Annualized event rate (events per year) | ||
Mean (SD) | 0.295 (0.8315) | 0.000 (0.0000) |
Median (IQR) | 0.000 (0.000 to 0.000) | 0.000 (0.000 to 0.000) |
P valuea | 0.0666 | |
Annualized event days (days per year) | ||
Mean (SD) | 1.391 (4.2677) | 0.000 (0.0000) |
Median (IQR) | 0.000 (0.000 to 0.000) | 0.000 (0.000 to 0.000) |
P valuea | 0.0901 | |
Hospitalizations for cardiac events | ||
Annualized event rate (events per year) | ||
Mean (SD) | 0.069 (0.2728) | 0.021 (0.1150) |
Median (IQR) | 0.000 (0.000 to 0.000) | 0.000 (0.000 to 0.000) |
P valuea | 0.3090 | |
Annualized event days (days per year) | ||
Mean (SD) | 0.598 (2.4054) | 0.149 (0.8047) |
Median (IQR) | 0.000 (0.000 to 0.000) | 0.000 (0.000 to 0.000) |
P valuea | 0.2882 | |
IQR = interquartile range; SD = standard deviation.
Note: Major clinical events included rhabdomyolysis, hypoglycemia, and cardiomyopathy events caused by LC-FAODs, resulting in any hospitalization, ED or acute care visits, or emergency interventions.
The pre-triheptanoin period is 18 months before triheptanoin initiation. If a patient was younger than 18 months at triheptanoin initiation, the pre-triheptanoin period was between the birth date and the day before triheptanoin initiation. The triheptanoin treatment period is between the triheptanoin initiation date and completion date or the early termination date, whichever is earlier.
Time on study is the duration of each subject being observed for MCE data collection in each period.
aP value calculated using a paired t-test. Analyses were not adjusted for multiple testing (i.e., the type I error rate had not been controlled).
Source: CL201 Clinical Study Report.8
Table 19: Annualized Hospitalization for Major Clinical Events Pre- and Post-Triheptanoin in the CL201 Rollover Cohort in Study CL202 — Full Analysis Set
Hospitalizations | Pre-triheptanoin (18-month retrospective period) N = 24 | Triheptanoin (36-month treatment) N = 24 |
|---|---|---|
Hospitalization for total major clinical events (all event subtypes) | ||
Annualized event rate (events per year) | ||
Mean (SD) | 1.430 (1.3234) | 0.760 (1.0061) |
Median (IQR) | 1.333 (0.000 to 2.122) | 0.333 (0.000 to 1.457) |
P valuea | 0.0429 | |
Annualized event days (days per year) | ||
Mean (SD) | 5.977 (6.3802) | 5.589 (11.5364) |
Median (IQR) | 4.825 (0.000 to 8.665) | 1.833 (0.000 to 5.332) |
P valueb | 0.4390 | |
Hospitalization for major rhabdomyolysis event | ||
Annualized event rate (events per year) | ||
Mean (SD) | 0.991 (1.1288) | 0.705 (0.9456) |
Median (IQR) | 0.667 (0.000 to 1.863) | 0.333 (0.000 to 1.333) |
P valueb | 0.3958 | |
Annualized event days (days per year) | ||
Mean (SD) | 3.576 (4.3587) | 4.974 (11.1841) |
Median (IQR) | 2.333 (0.000 to 5.853) | 1.833 (0.000 to 5.165) |
P valueb | 0.9138 | |
Hospitalization for major hypoglycemia events | ||
Annualized event rate (events per year) | ||
Mean (SD) | 0.356 (0.9036) | 0.000 (0.0000) |
Median (IQR) | 0.000 (0.000 to 0.000) | 0.000 (0.000 to 0.000) |
P valueb | 0.1250 | |
Annualized event days (days per year) | ||
Mean (SD) | 1.679 (4.6441) | 0.000 (0.0000) |
Median (IQR) | 0.000 (0.000 to 0.000) | 0.000 (0.000 to 0.000) |
P valueb | 0.1250 | |
Hospitalization for cardiomyopathy events | ||
Annualized event rate (events per year) | ||
Mean (SD) | 0.083 (0.2989) | 0.056 (0.2123) |
Median (IQR) | 0.000 (0.000 to 0.000) | 0.000 (0.000 to 0.000) |
P valueb | 1.0000 | |
Annualized event days (days per year) | ||
Mean (SD) | 0.722 (2.6363) | 0.611 (2.0908) |
Median (IQR) | 0.000 (0.000 to 0.000) | 0.000 (0.000 to 0.000) |
P valueb | 1.0000 | |
IQR = interquartile range; SD = standard deviation.
Note: Pre-triheptanoin period comprises the 18 months preceding triheptanoin initiation (or from birth to triheptanoin initiation for infants) during the retrospective period (study period 3). Triheptanoin treatment period comprises the first 36 months following triheptanoin initiation during the combined CL201 and CL202 study period (study period 2), or from triheptanoin initiation to discontinuation for subjects who discontinued.
aP values from paired t-test are presented (the P value from the Shapiro-Wilk normality test for annualized event rate was 0.0554). Analyses were not adjusted for multiple testing (i.e., the type I error rate had not been controlled).
bP values from Wilcoxon signed rank test are presented as the normality assumption was violated (Shapiro-Wilk normality test P value < 0.05). Analyses were not adjusted for multiple testing (i.e., the type I error rate had not been controlled).
Source: CL202 Clinical Study Report.9
Table 20: Annualized Hospitalization for Major Clinical Events Pre- and Post-Triheptanoin in the Triheptanoin-Naive Cohort in Study CL202 — Full Analysis Set
Hospitalizations | Pre-triheptanoin (18-month retrospective period) N = 20 | Triheptanoin (18-month treatment) N = 20 |
|---|---|---|
Hospitalization for total major clinical events (all event subtypes) | ||
Annualized event rate (events per year) | ||
Mean (SD) | 2.282 (2.0432) | 7.585 (27.0891) |
Median (IQR) | 2.000 (0.667 to 3.826) | 0.333 (0.000 to 1.562) |
P valuea | 0.2764 | |
Annualized event days (days per year) | ||
Mean (SD) | 18.193 (28.9257) | 28.753 (85.2225) |
Median (IQR) | 9.664 (2.333 to 17.996) | 1.333 (0.000 to 6.247) |
P valuea | 0.2918 | |
Hospitalization for major rhabdomyolysis event | ||
Annualized event rate (events per year) | ||
Mean (SD) | 1.966 (2.0795) | 7.585 (27.0891) |
Median (IQR) | 1.666 (0.000 to 2.999) | 0.333 (0.000 to 1.562) |
P valuea | 0.5874 | |
Annualized event days (days per year) | ||
Mean (SD) | 12.097 (20.6741) | 28.753 (85.2225) |
Median (IQR) | 6.998 (0.000 to 15.996) | 1.333 (0.000 to 6.247) |
P valuea | 0.6578 | |
Hospitalization for hypoglycemia events | ||
Annualized event rate (events per year) | ||
Mean (SD) | 0.216 (0.8225) | 0.000 (0.0000) |
Median (IQR) | 0.000 (0.000 to 0.000) | 0.000 (0.000 to 0.000) |
P valuea | 0.5000 | |
Annualized event days (days per year) | ||
Mean (SD) | 5.396 (23.6657) | 0.000 (0.0000) |
Median (IQR) | 0.000 (0.000 to 0.000) | 0.000 (0.000 to 0.000) |
P valuea | 0.5000 | |
Hospitalization for cardiomyopathy events | ||
Annualized event rate (events per year) | ||
Mean (SD) | 0.100 (0.3262) | 0.000 (0.0000) |
Median (IQR) | 0.000 (0.000 to 0.000) | 0.000 (0.000 to 0.000) |
P valuea | 0.5000 | |
Annualized event days (days per year) | ||
Mean (SD) | 0.700 (2.8317) | 0.000 (0.0000) |
Median (IQR) | 0.000 (0.000 to 0.000) | 0.000 (0.000 to 0.000) |
P valuea | 0.5000 | |
IQR = interquartile range; SD = standard deviation.
Note: The pre-triheptanoin period comprises the 18 months preceding triheptanoin initiation (or from birth to triheptanoin initiation for infants) during the retrospective period (study period 3). Triheptanoin treatment period is the first 18 months following triheptanoin initiation during the CL202 study period (study period 1), or from triheptanoin initiation to discontinuation for subjects who discontinued.
aAll P values presented are from Wilcoxon signed rank test as the normality assumption was violated (Shapiro-Wilk normality test P value < 0.05). Analyses were not adjusted for multiple testing (i.e., the type I error rate had not been controlled).
Source: CL202 Clinical Study Report.9
Emergency Department Usage
ED visits were captured as part of the MCEs in CL201 and CL202.
Study CL201
Very few ED visits occurred during the pre-triheptanoin and triheptanoin treatment periods. In total, 2 ED visits (2.9% of the 70 total MCEs) in 2 patients occurred during the pre-triheptanoin period and 2 ED visits (5.1% of the 39 total MCEs) occurred in 1 patient during triheptanoin treatment. All ED visits were due to rhabdomyolysis. There was no meaningful difference in annualized ED visit rates due to rhabdomyolysis (Table 21).
Study CL202
Similar to results for Study CL201, very few ED visits occurred during pre-triheptanoin and triheptanoin treatment periods in Study CL202. As of the data cut-off date, there were 16 ED visits for MCEs in 8 patients in the overall population; all were due to rhabdomyolysis (Table 51). In the CL201 rollover cohort, there was 1 ED visit (1.7% of 60 total MCEs) involving 1 patient during the pre-triheptanoin period and 4 ED visits (6.0% of 67 total MCEs) involving 2 patients during the first 36 months of the triheptanoin treatment period (Table 22). In the triheptanoin-naive cohort, there were 6 ED visits (7.1% of 84 total MCEs) in 4 patients during the pre-triheptanoin period and 2 ED visits (7.4% of 27 total MCEs) in 1 patient during the 18 months of triheptanoin treatment period (Table 23). No statistical analyses were performed to compare ED visits between the pre-triheptanoin and triheptanoin treatment periods.
Gillingham et al. (2017) Study
ED usage was not measured as part of the efficacy analyses in the Gillingham et al. (2017) study.
Table 21: Emergency Department Visits for Major Clinical Events in Study CL201 — Full Analysis Set
ED visits | Pre-triheptanoin (N = 29) (78-week retrospective period) | Triheptanoin (N = 29) (78-week treatment) |
|---|---|---|
ED visits for rhabdomyolysis events | ||
Event occurrence | ||
Number of ED visits due to rhabdomyolysis | 2 | 2 |
Total patients experiencing ≥ 1 event, n (%) | 2 (6.9) | 1 (3.4) |
Total patients with zero events, n (%) | 27 (93.1) | 28 (96.6) |
Annualized event rate (events per year) | ||
Mean (SD) | 0.046 (0.1719) | 0.045 (0.2440) |
Median (range) | 0.000 (0.000 to 0.000) | 0.000 (0.000 to 0.000) |
P valuea | 0.9908 | |
ED visits for hypoglycemia events | ||
Event occurrence | ||
Number of ED visits due to hypoglycemic events | 0 | 0 |
Total patients experiencing ≥ 1 event, n (%) | 0 (0) | 0 (0) |
Total patients with zero events, n (%) | 29 (100) | 29 (100) |
Annualized event rate (events per year) | ||
Mean (SD) | 0.000 (0.0000) | 0.000 (0.0000) |
Median (range) | 0.000 (0.000 to 0.000) | 0.000 (0.000 to 0.000) |
P valuea | NA | |
ED visits for cardiac events | ||
Event occurrence | ||
Number of ED visits due to cardiac events | 0 | 0 |
Total patients experiencing ≥ 1 event, n (%) | 0 (0) | 0 (0) |
Total patients with zero events, n (%) | 29 (100) | 29 (100) |
Annualized event rate (events per year) | ||
Mean (SD) | 0.000 (0.0000) | 0.000 (0.0000) |
Median (range) | 0.000 (0.000 to 0.000) | 0.000 (0.000 to 0.000) |
P valuea | NA | |
ED = emergency department; NA = not applicable; SD = standard deviation.
Note: Major clinical events included rhabdomyolysis, hypoglycemia, and cardiomyopathy events caused by LC-FAODs. The pre-triheptanoin period is 18 months before triheptanoin initiation. If a patient’s age was less than 18 month at triheptanoin initiation, the pre-triheptanoin period was between the birth date and the day before triheptanoin initiation. The triheptanoin treatment period is between the triheptanoin initiation date and completion date or the early termination date, whichever is earlier.
aP value calculated using a paired t-test. Analyses were not adjusted for multiple testing (i.e., the type I error rate had not been controlled).
Source: CL201 Clinical Study Report.8
Table 22: Emergency Department Visits for Major Clinical Events Pre- and Post-Triheptanoin in the CL201 Rollover Cohort in Study CL202 — Full Analysis Set
ED visits | Pre-triheptanoin (18-month retrospective period) N = 24 | Triheptanoin (36-month treatment) N = 24 |
|---|---|---|
ED visits for total major clinical events (all event subtypes) | ||
Event occurrence | ||
Total number of events | 1 | 4 |
Total patients experiencing ≥ 1 event, n | 1 | 2 |
ED visits for major rhabdomyolysis event | ||
Event occurrence | ||
Total number of events | 1 | 4 |
Total patients experiencing ≥ 1 event, n | 1 | 2 |
ED visits for major hypoglycemia events | ||
Event occurrence | ||
Total number of events | 0 | 0 |
Total patients experiencing ≥ 1 event, n | 0 | 0 |
ED visits for cardiomyopathy events | ||
Event occurrence | ||
Total number of events | 0 | 0 |
Total patients experiencing ≥ 1 event, n | 0 | 0 |
ED = emergency department.
Note: Pre-triheptanoin period comprises the 18 months preceding triheptanoin initiation (or from birth to triheptanoin initiation for infants) during the retrospective period (study period 3). Triheptanoin treatment period comprises the first 36 months following triheptanoin initiation during the combined CL201/CL202 study period (study period 2), or from triheptanoin initiation to discontinuation for subjects who discontinued.
Source: CL202 Clinical Study Report.9
Table 23: Emergency Department Visits for Major Clinical Events Pre- and Post-Triheptanoin in the Triheptanoin-Naive Cohort in Study CL202 — Full Analysis Set
ED visits | Pre-triheptanoin (18-month retrospective period) N = 20 | Triheptanoin (18-month treatment) N = 20 |
|---|---|---|
ED visits for total major clinical events (all event subtypes) | ||
Event occurrence | ||
Number of ED visits due to rhabdomyolysis | 6 | 2 |
Total patients experiencing ≥ 1 event, n (%) | 4 | 1 |
ED visits for rhabdomyolysis events | ||
Event occurrence | ||
Number of ED visits due to rhabdomyolysis | 6 | 2 |
Total patients experiencing ≥ 1 event, n (%) | 4 | 1 |
ED visits for hypoglycemia events | ||
Event occurrence | ||
Number of ED visits due to hypoglycemic events | 0 | 0 |
Total patients experiencing ≥ 1 event, n (%) | 0 | 0 |
Total patients with zero events, n (%) | — | — |
ED visits for cardiac events | ||
Event occurrence | ||
Number of ED visits due to cardiac events | 0 | 0 |
Total patients experiencing ≥ 1 event, n (%) | 0 | 0 |
ED = emergency department.
Note: Pre-triheptanoin period comprises the 18 months preceding triheptanoin initiation (or from birth to triheptanoin initiation for infants) during the retrospective period (study period 3). Triheptanoin treatment period is the first 18 months following triheptanoin initiation during the CL202 study period (study period 1), or from triheptanoin initiation to discontinuation for subjects who discontinued.
Source: CL202 Clinical Study Report.9
Health-Related Quality of Life
In studies CL201 and CL202, changes in HRQoL were measured using SF-10 in children 5 to 17 years of age, and SF-12v2 in adults 18 years and older. For both assessments, a score of 50 constituted the normalized base score, and each factor of 10 represented 1 SD above or below the mean. Overall, the population included in the assessments of HRQoL was much smaller than the number of patients enrolled in each study or cohort.
Study CL201
The primary statistical comparison was the change from baseline at week 24 (Table 24).
Five children (aged 5 to 17 years) completed the SF-10 via proxy at baseline and weeks 12, 24, and 48; 3 patients participated at week 78. At baseline, the mean PHS indicated impairment in physical health that impacts HRQoL, whereas the PSS score was similar to that in the general population. At week 24, no notable changes from baseline were observed in PHS or PSS scores. Over time, the PHS improved with treatment across week 48 and week 78; however, scores remained below the population norm. Although the PSS score notably improved at week 48, this was not maintained at week 78.
Five adults completed the SF-12 questionnaire at baseline and weeks 12, 24, 48, and 78. At baseline, the mean PCS score was lower than the population mean; the MCS score was slightly below the norm. At week 24, there was notable improvement in both PCS and MCS scores with treatment. This benefit was maintained through weeks 48 and 78 for the PCS score, but not the MCS score. Despite improvement, mean PCS scores remained below the population norm.
Study CL202
In CL202, no statistical tests were performed to compare the change in scores over time; thus, observations can only be made regarding the general direction in scores with treatment in each of the 3 cohorts (Table 25,Table 26, Table 27).
In the CL201 rollover cohort, 8 children (aged 5 to 17 years) completed the SF-10 via proxy at baseline for Study CL202 and months 6, 12, and 18. The SF-10 PHS scores appeared to decline over the 18 months of treatment during CL202; however, scores remained above baseline taken before starting triheptanoin in CL201 (mean 22.573, SD 19.205). The SF-10 PSS scores remained generally stable from baseline through studies CL201 and CL202; these scores were similar to the population norm. For SF-12v2, 4 adults completed the SF-12 questionnaire at baseline and at months 6, 12, and 18. The PCS scores were relatively stable during CL202. Although an improvement in the PCS scores occurred during CL201, scores during CL202 were similar to pre-treatment levels. The Clinical Study Report attributed this phenomenon to adults who may have a tendency to “reset their baseline” to a more recent time point when measures of HRQoL extend beyond 12 to 18 months after treatment. The MCS scores of SF-12 were also relatively stable during CL202, although they appeared to decline slightly over time. However, mean values remained within the population norm.
In the triheptanoin-naive cohort, the number of children (aged 5 years to 17 years) who completed the SF-10 at baseline and the various time points declined over time (month 6: n = 5; month 18: n = 2). The baseline mean PHS scores for SF-10 was lower than the population norm, indicating impairment. Scores appeared to improve over time and were similar to the population average while subjects were receiving treatment. The mean SF-10 PSS scores were similar to the population norm at baseline and remained within this range throughout CL202. For SF-12v2, only 2 adults completed the SF-12 questionnaire at baseline and months 6 and 12; only 1 patient participated at month 18. Thus, the changes in HRQoL were difficult to assess due to the small number of patients in each post-baseline assessment. Both PCS and MCS baseline scores were similar to the scores of the CL201 rollover cohort. In 2 patients, PCS and MCS scores appeared to improve over time up to 12 months of treatment. However, the PCS score remained below the population norm.
In the IST or other cohort, the number of children (aged 5 to 17 years) who completed the SF-10 at baseline and the various time points varied slightly, between 14 and 16 patients. The baseline scores for SF-10 were similar to those in the other cohorts. The mean baseline PHS score indicated impairment in physical health that affects HRQoL, whereas the PSS score was similar to that in the general population. Over 18 months of treatment, mean PHS and PCS scores both remained relatively stable, with little change from baseline. Ten adults completed the SF-12 questionnaire at baseline and at months 6, 12, and 18. Both baseline mean PCS and MCS scores for SF-12 were similar to the population norm and remained relatively stable throughout CL202.
Gillingham et al. (2017) Study
HRQoL was not measured in the Gillingham et al. (2017) study.
Table 24: Summary of Component T Scores in SF-10 and SF-12 in Study CL201 — Full Analysis Set
Visit | Week 24 | Week 48 | Week 78 |
|---|---|---|---|
SF-10 | |||
Physical summary score | |||
N | 5 | 5 | 3 |
Baseline mean (SD) | 13.938 (11.9110) | 13.938 (11.9110) | 18.917 (12.0846) |
LS mean (SE) change from baseline | 2.162 (2.4395) | 12.384 (2.7004) | 17.300 (1.4245) |
95% CI | −2.62 to 6.94 | 7.09 to 17.68 | 14.51 to 20.09 |
P value | 0.3754 | < 0.0001 | < 0.0001 |
Psychosocial summary score | |||
N | 5 | 5 | 3 |
Baseline mean (SD) | 46.774 (14.5720) | 46.774 (14.5720) | 49.803 (9.3919) |
LS mean (SE) change from baseline | 0.816 (2.6307) | 7.768 (1.5634) | 2.105 (2.9146) |
95% CI | −4.34 to 5.97 | 4.70 to 10.83 | −3.61 to 7.82 |
P value | 0.7564 | < 0.0001 | 0.4702 |
SF-12 | |||
Physical component summary score | |||
N | 5 | 5 | 5 |
Baseline mean (SD) | 28.608 (6.5123) | 28.608 (6.5123) | 28.608 (6.5123) |
LS mean (SE) change from baseline | 8.874 (1.6344) | 12.736 (5.4001) | 3.620 (1.7204) |
95% CI | 5.67 to 12.08 | 2.15 to 23.32 | 0.25 to 6.99 |
P value | < 0.0001 | 0.0184 | 0.0354 |
Mental component summary score | |||
N | 5 | 5 | 5 |
Baseline mean (SD) | 42.538 (20.8083) | 42.538 (20.8083) | 42.538 (20.8083) |
LS mean (SE) change from baseline | 9.704 (3.9986) | 2.960 (5.4225) | 4.420 (6.7359) |
95% CI | 1.87 to 17.54 | −7.67 to 13.59 | −8.78 to 17.62 |
P value | 0.0152 | 0.5852 | 0.5117 |
CI = confidence interval, LS = least squares, SD = standard deviation; SE = standard error; SF-10 = Short Form (10) Health Survey; SF-12 = Short Form (12) Health Survey.
Note: The SF-10 was assessed for children 5 to 17 years of age, whereas the SF-12 was assessed for adults 18 years of age and older. The LS mean, SE, 95% CI, and 2-sided P value are from the GEE model. The GEE model included the change from baseline for each parameter as the dependent variable and time as the categorical variable and adjusted for baseline measurement with compound symmetry covariance structure. Analyses were not adjusted for multiple testing (i.e., the type I error rate had not been controlled).
Source: CL201 Clinical Study Report.8
Table 25: Summary of Component T Scores in SF-10 and SF-12 in the CL201 Rollover Cohort in Study CL202 — Full Analysis Set
Visit | Study CL201 (N = 10) | Study CL202 (N = 12) | ||||
|---|---|---|---|---|---|---|
Week 24 | Week 48 | Week 78 | Month 6 | Month 12 | Month 18 | |
SF-10 | ||||||
N | 5 | 5 | 3 | 8 | 8 | 8 |
Physical summary score | ||||||
Baseline mean (SD) | 13.938 (11.9110) | 13.938 (11.9110) | 18.917 (12.0846) | 39.62 (9.926) | 39.62 (9.926) | 39.62 (9.926) |
Mean (SD) change from baseline | 2.912 (8.8183) | 13.134 (13.6382) | 12.643 (7.6479) | –4.22 (13.366) | –7.26 (13.324) | –4.00 (12.864) |
Psychosocial summary score | ||||||
Baseline mean (SD) | 46.774 (14.5720) | 46.774 (14.5720) | 49.803 (9.3919) | 52.03 (7.787) | 52.03 (7.787) | 52.03 (7.787) |
Mean (SD) change from baseline | 1.068 (7.9609) | 8.020 (9.4519) | 0.590 (3.6027) | 0.45 (2.383) | 0.22 (4.758) | −0.89 (4.204) |
SF-12 | ||||||
N | 5 | 5 | 5 | 4 | 4 | 4 |
Physical component summary score | ||||||
Baseline mean (SD) | 28.608 (6.5123) | 28.608 (6.5123) | 28.608 (6.5123) | 30.81 (8.185) | 30.81 (8.185) | 30.81 (8.185) |
Mean (SD) change from baseline | 8.874 (4.1560) | 12.736 (13.5406) | 3.620 (4.2892) | 0.26 (1.918) | 5.04 (4.609) | 2.15 (10.606) |
Mental component summary score | ||||||
Baseline mean (SD) | 42.538 (20.8083) | 42.538 (20.8083) | 42.538 (20.8083) | 53.85 (11.359) | 53.85 (11.359) | 53.85 (11.359) |
Mean (SD) change from baseline | 9.704 (21.9873) | 2.960 (25.6418) | 4.420 (18.7642) | 3.55 (8.949) | −1.24 (9.696) | −2.90 (6.828) |
SD = standard deviation; SF-10 = Short Form (10) Health Survey; SF-12 = Short Form (12) Health Survey.
Note: The SF-10 Health Survey was assessed for children 5 to 17 years of age, whereas the SF-12 was assessed for adults 18 years of age and older.
Source: CL201 Clinical Study Report,8 CL202 Clinical Study Report.9
Table 26: Summary of Component T Scores in SF-10 and SF-12 in the Triheptanoin-Naive Cohort in Study CL202 — Full Analysis Set
Visit | Month 6 | Month 12 | Month 18 |
|---|---|---|---|
SF-10 | |||
N | 5 | 3 | 2 |
Physical summary score | |||
Baseline mean (SD) | 29.19 (13.203) | 25.42 (16.541) | 21.12 (20.882) |
Mean (SD) change from baseline | 13.58 (5.217) | 17.50 (19.838) | 34.39 (23.290) |
Psychosocial summary score | |||
Baseline mean (SD) | 42.85 (11.523) | 42.07 (4.489) | 41.78 (6.307) |
Mean (SD) change from baseline | 13.01 (8.444) | 12.19 (1.025) | 13.82 (0.635) |
SF-12v2 | |||
N | 2 | 2 | 1 |
Physical component summary score | |||
Baseline mean (SD) | 29.97 (4.151) | 29.97 (4.151) | 32.90 (NA) |
Mean (SD) change from baseline | 3.86 (13.916) | 6.88 (12.049) | 17.71 (NA) |
Mental component summary score | |||
Baseline mean (SD) | 43.47 (11.802) | 43.47 (11.802) | 51.81 (NA) |
Mean (SD) change from baseline | 7.08 (11.597) | 7.62 (10.105) | −14.92 (NA) |
NA = not applicable; SD = standard deviation; SF-10 = Short Form (10) Health Survey; SF-12 = Short Form (12) Health Survey.
Note: The SF-10 Health Survey was assessed for children 5 to 17 years of age, whereas the SF-12 was assessed for adults 18 years of age and older.
Source: CL202 Clinical Study Report.9
Table 27: Summary of Component T Scores in SF-10 and SF-12 in the IST or Other Cohort in Study CL202 — Full Analysis Set
Visit | Month 6 | Month 12 | Month 18 |
|---|---|---|---|
SF-10 | |||
N | 14 | 16 | 15 |
Physical summary score | |||
Baseline mean (SD) | 34.22 (18.349) | 31.78 (19.436) | 34.09 (17.689) |
Mean (SD) change from baseline | −1.45 (19.028) | 3.64 (18.385) | −4.00 (12.864) |
Psychosocial summary score | |||
Baseline mean (SD) | 49.29 (8.953) | 48.91 (9.716) | 49.98 (9.029) |
Mean (SD) change from baseline | −2.74 (10.334) | −0.89 (13.557) | −1.78 (9.147) |
SF-12v2 | |||
N | 10 | 10 | 10 |
Physical component summary score | |||
Baseline mean (SD) | 44.02 (12.368) | 44.02 (12.368) | 44.02 (12.368) |
Mean (SD) change from baseline | 0.18 (5.259) | 0.77 (6.812) | 1.38 (10.109) |
Mental component summary score | |||
Baseline mean (SD) | 47.09 (15.113) | 47.09 (15.113) | 47.09 (15.113) |
Mean (SD) change from baseline | 2.73 (4.723) | 3.89 (9.032) | 4.43 (11.294) |
SD = standard deviation; SF-10 = Short Form (10) Health Survey; SF-12 = Short Form (12) Health Survey.
Note: The SF-10 Health Survey was assessed for children 5 to 17 years of age, whereas the SF-12 was assessed for adults 18 years of age and older.
Source: CL202 Clinical Study Report.9
Physical Function or Exercise Tolerance
Physical function and exercise tolerance were measured using the 12MWT and cycle ergometry tests in CL201, and treadmill ergometry and phosphocreatine recovery in the Gillingham et al. (2017) study. Study CL202 did not assess physical function or exercise tolerance.
Study CL201
12-Minute Walk Test
Results for various parameters of the 12MWT are presented in Table 28. The primary analysis for the 12MWT was conducted at week 18; data for week 60 are also included to show long-term trends. In total, 12 patients participated in the baseline assessment, and 8 patients performed the 12MWT at all key assessment points. The 8 patients included 4 adults, 3 adolescents, and 1 pediatric patient. Although results showed overall improvement in the various parameters, most were not significant and the mean change from baseline was often associated with wide CIs, reducing the certainty of the results. Nevertheless, results were consistent over time, and similar improvements occurred at both weeks 18 and 60. The only notable improvement in the 12MWT parameters was in the EEI, which measured energy expenditure while walking based on HR and walking speed. There was an improvement from baseline to week 18, although baseline EEI was already within the normal range, as identified in the study (0.14 to 0.89 beats/m). This improvement was not maintained at week 60. In those who completed the 12MWT, the distance walked in the second 6 minutes of the 12MWT was similar to the distance walked during the first 6 minutes, indicating that patients were able to maintain their pace throughout the assessment. The percentage predicted distance in the first 6 minutes was approximately 54% of predicted at baseline, suggesting impaired walking ability and functional capacity, and despite some improvement, remained impaired through week 60.
Cycle Ergometry
Results for various parameters of the cycle ergometry test are presented in Table 29. The primary analysis for the cycle ergometry test was assessed at week 24; data for week 78 are also included to show long-term trends. In total, 10 patients participated in the baseline assessment, and 7 patients performed the cycle ergometry test at week 24; only 4 patients performed the test at week 78. Of the remaining 4 patients, 1 experienced interruption of triheptanoin treatment before the week 78 assessment, and another was unable to generate any workload at any time during the protocol.
At week 24, although there was overall improvement in cycle ergometry workload and duration, neither was significant. The change from baseline in workload was associated with wide CIs, which reduces the certainty of the results. Results for change in workload and duration from baseline at week 78 were inconsistent with those at week 24, likely due to the reduction in patients who completed the assessment. There was no significant change from baseline in RER at both weeks 24 and 78.
Gillingham et al. (2017) Study
Treadmill Ergometry
All patients completed the protocol to measure exercise tolerance in the Gillingham et al. (2017) study. After 4 months of treatment, the only notable difference between the 2 treatment groups was in maximum HR during the treadmill exercise test (Figure 6) . For maximum HR, the mean difference in change from baseline was 6.98 beats per minute (95% CI, 0.34 to 13.63) in favour of triheptanoin. Systolic blood pressure remained constant over the 45 minutes of the treadmill exercise. There was no difference between the 2 treatment groups for VO2 or peak double product, a marker of cardiac workload obtained by multiplying systolic blood pressure by HR.
Phosphocreatine Recovery
Muscle ATP synthesis was evaluated by measuring phosphocreatine recovery with magnetic resonance spectroscopy following a repetitive isolated acute phosphocreatine-depleting lower leg exercise. Of the enrolled patients, 8 adults in the triheptanoin group and 7 adults in the trioctanoin group completed the exercise protocol. A decrease in phosphocreatine occurred with the isolated exercise; however, there was no difference between the 2 treatment groups in the magnitude of decrease. There was also no apparent difference between the treatment groups in the rate of recovery with rest. Specifically, there was no difference in the mean change from baseline to 4 months in the rate constant of phosphocreatine synthesis (kPCr) during the recovery phase (Figure 6).
Table 28: Change From Baseline in 12MWT Parameters in Study CL201 — Full Analysis Set
12MWT parameter | Baseline | Week 18 | Week 60 |
|---|---|---|---|
Distance walked in 12MWT | |||
N | 12 | 8 | 8 |
Baseline mean (SD), m | 697.8 (347.36) | 673.4 (296.34) | 673.4 (296.34) |
Observed mean (SD), m | NA | 861.4 (467.50) | 1,000.0 (594.75) |
LS mean (SE) change from baseline, m | NA | 181.874 (106.2177) | 193.125 (120.5121) |
95% Cl | NA | −26.31 to 390.06 | −43.07 to 429.32 |
P value | NA | 0.0868 | 0.1090 |
Distance walked in first 6 minutes | |||
N | 12 | 8 | 8 |
Baseline mean (SD), m | 371.8 (168.45) | 366.6 (148.06) | 366.6 (148.06) |
Observed mean (SD), m | NA | 457.8 (215.59) | 541.8 (294.90) |
LS mean (SE) change from baseline, m | NA | 90.034 (53.1944) | 117.549 (69.8873) |
95% Cl | NA | −14.23 to 194.29 | −19.43 to 254.53 |
P value | NA | 0.0905 | 0.0926 |
Distance walked in second 6 minutes | |||
N | 10 | 7 | 7 |
Baseline mean (SD), m | 391.2 (114.76) | 350.6 (100.01) | 350.6 (100.01) |
Observed mean (SD), m | NA | 461.3 (217.83) | 515.5 (271.36) |
LS mean (SE) change from baseline, m | NA | 103.905 (63.4734) | 89.694 (62.1774) |
95% Cl | NA | −20.50 to 228.31 | −32.17 to 211.56 |
P value | NA | 0.1016 | 0.1491 |
% predicted distance in first 6 minutes | |||
N | 12 | 8 | 8 |
Baseline mean (SD), % predicted | 55.665 (25.6392) | 54.070 (21.6124) | 54.070 (21.6124) |
Observed mean (SD), % predicted | NA | 66.450 (28.6391) | 82.699 (49.4690) |
LS mean (SE) change from baseline, % predicted | NA | 12.129 (7.2546) | 16.149 (9.7452) |
95% Cl | NA | −2.09 to 26.35 | −2.95 to 35.25 |
P value | NA | 0.0945 | 0.0975 |
EEI | |||
N | 12 | 8 | 8 |
Baseline mean (SD), beats/m | 0.249 (0.1973) | 0.263 (0.2031) | 0.263 (0.2031) |
Observed mean (SD), beats/m | NA | 0.080 (0.2580) | 0.203 (0.1946) |
LS mean (SE) change from baseline, beats/m | NA | −0.178 (0.0903) | −0.050 (0.0650) |
95% Cl | NA | −0.35 to 0.00 | −0.18 to 0.08 |
P value | NA | 0.0487 | 0.4428 |
12MWT = 12-minute walk test; CI = confidence interval; EEI = energy expenditure index; LS = least squares; NA = not applicable; SD = standard deviation; SE = standard error.
Note: The 12MWT was performed for patients ≥ 6 years old. The LS mean, SE, 95% CI, and 2-sided P value are from the GEE model. The GEE model includes the change from baseline for each parameter as the dependent variable and time as the categorical variable, and adjusted for baseline measurement, with compound symmetry covariance structure. Analyses were not adjusted for multiple testing (i.e., the type I error rate had not been controlled).
Source: CL201 Clinical Study Report.8
Table 29: Change From Baseline in Cycle Ergometry Parameters in Study CL201 — Full Analysis Set
Cycle ergometry parameter | Baseline | Week 24 | Week 78 |
|---|---|---|---|
AUC of workload of 40-minute test | |||
N | 10 | 7 | 4 |
Baseline mean (SD), watts | 799.0 (728.28) | 744.6 (780.19) | 575.0 (784.02) |
Observed mean (SD), watts | NA | 1,191.4 (1,143.74) | 246.9 (461.02) |
LS mean LS mean (SE) change from baseline | NA | 409.323 (283.6913) | −449.237 (276.9440) |
95% Cl | NA | −146.70 to 965.35 | −992.04 to 93.56 |
P value | NA | 0.1491 | 0.1048 |
Duration of 40-minute test | |||
N | 10 | 7 | 4 |
Baseline mean (SD), minutes | 28.6 (15.12) | 26.9 (16.65) | 23.3 (19.37) |
Observed mean (SD), minutes | NA | 31.6 (14.35) | 20.0 (15.81) |
LS mean (SE) change from baseline | NA | 4.480 (2.5057) | −1.009 (3.5826) |
95% CI | NA | −0.43 to 9.39 | −8.03 to 6.01 |
P value | NA | 0.0738 | 0.7782 |
Time-adjusted AUC of RER | |||
n | 10 | 7 | 4 |
Baseline mean (SD) | 0.980 (0.0527) | 0.973 (0.0543) | 0.981 (0.0550) |
Observed mean (SD) | NA | 0.964 (0.0595) | 0.980 (0.0428) |
LS mean (SE) change from baseline | NA | −0.012 (0.0124) | −0.003 (0.0152) |
95% CI | NA | −0.04 to 0.01 | −0.03 to 0.03 |
P value | NA | 0.3413 | 0.8221 |
AUC = area under the curve; CI = confidence interval, LS = least squares, NA = not applicable; RER = respiratory exchange ratio; SD = standard deviation; SE = standard error.
Note: The cycle ergometry was performed for patients ≥ 6 years old. The LS mean, SE, 95% CI, and 2-sided P value are from the GEE model. The GEE model includes the change from baseline for each parameter as the dependent variable, time as the categorical variable and adjusted for baseline measurement, with compound symmetry covariance structure. Analyses were not adjusted for multiple testing (i.e., the type I error rate had not been controlled).
Source: CL201 Clinical Study Report.8
Figure 6: Primary Outcome Measures in the Gillingham et al. (2017) Study — ITT Population
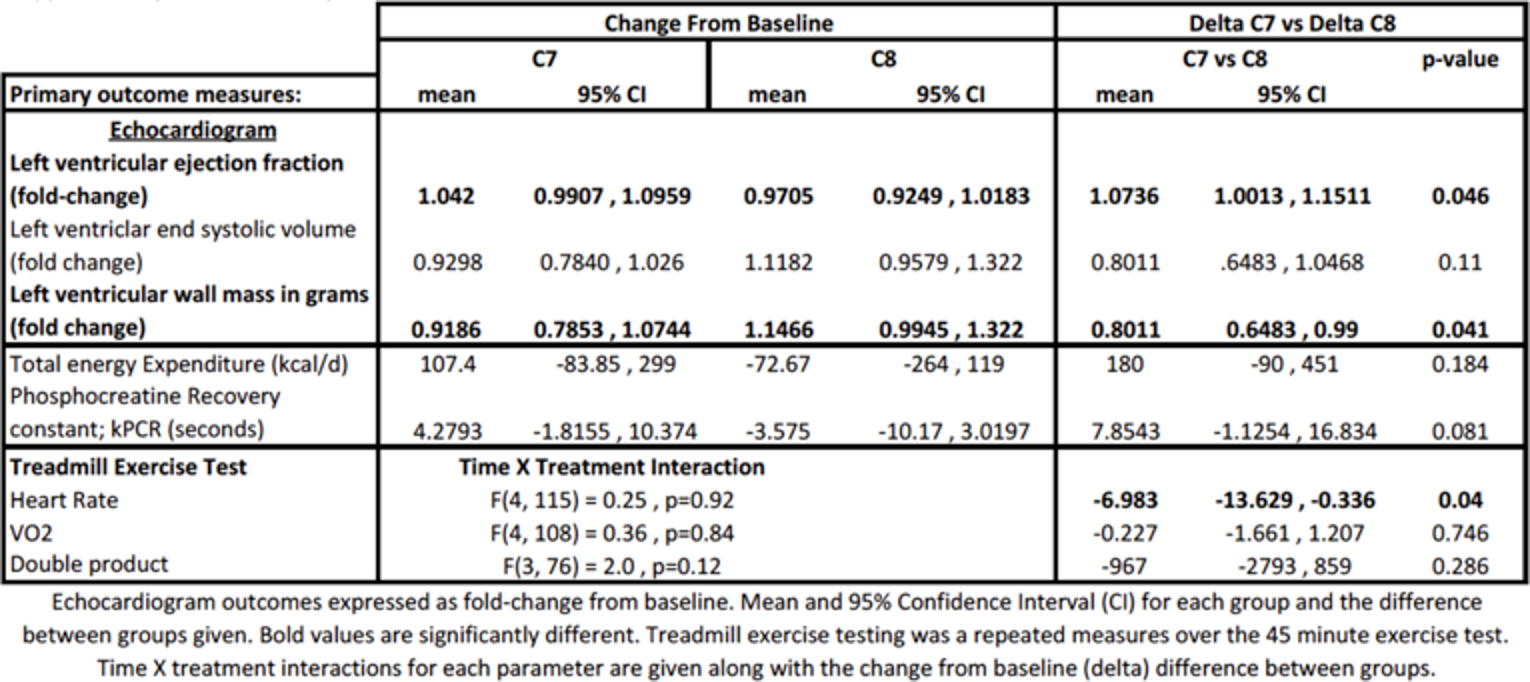
C7 = triheptanoin; C8 = trioctanoin; CI = confidence interval.
Source: Triheptanoin versus trioctanoin for long-chain fatty acid oxidation disorders: a double blinded, randomized controlled trial. Gillingham MB, Heitner SB, Martin J, et al. J Inherit Metab Dis. 2017;40(6):831-843. © John Wiley and Sons 2017. Reprinted with permission.
Symptom Relief
In the CL201 study, patient diaries were used to measure activity level, muscle weakness, and fatigue daily. However, due to unexpected performance issues with the electronic diaries, data were not properly recorded during the run-in period. As a result, analysis of change from baseline for these measures could not be performed and was not included in the Clinical Study Report. The effect of triheptanoin on patient-reported symptoms was not captured in CL202 or the Gillingham et al. (2017) studies.
Cardiac Function Parameters
Cardiac function was measured using echocardiography in all 3 included studies. In CL201, only the change from baseline of LVEF was include as part of the efficacy end points and was considered supportive. CL202 presented LV size, ejection fraction, and shortening fraction as secondary end points, whereas the Gillingham et al. (2017) study considered cardiac function by echocardiogram as 1 of the primary end points and included LV wall mass, LVEF, and systolic volume.
Study CL201
Evaluation of echocardiograms was performed for all patients at baseline and for 35 patients at week 24. At baseline, mean LVEF was within the normal rage specified in the study (55% to 70%). Mean values remained within the normal range at week 24, and no significant change between the 2 time points was observed (Figure 6).
Study CL202
Results of echocardiogram parameters at month 12 and month 24 for all patients, along with all 3 cohorts, are summarized in Table 31. No statistical tests were performed to compare the change in scores over time. Thus, observations can only be made regarding the general trend in parameters for each of the 3 cohorts. Also, the Clinical Study Report discussed results at month 36; however, at this time point, results were available only for the IST or other cohort. No patients from the CL201 rollover or triheptanoin-naive groups had echocardiogram results at month 36. Thus, results from month 12 and month 24 are presented instead in Table 31, although fewer patients had echocardiogram results at month 24 compared to the number enrolled in each cohort. Overall, there were no notable changes in the echocardiogram parameters. The largest mean changes from baseline were at month 24 in the triheptanoin-naive cohort (i.e., reduction in LV mass index and LV mass; increase in LVEF). However, the small number of patients in the analysis limits the interpretability of the data. In all 3 cohorts, the mean LVEF at baseline was also within the normal range, as previously defined.
Gillingham et al. (2017) Study
Echocardiography was assessed in 21 patients (10 in the triheptanoin and 11 in the trioctanoin group) in the Gillingham et al. (2017) study. Evaluations were not available for 11 patients due to a logistic change in the protocol from cardiac MRI to echocardiography after the first 7 patients were enrolled and due to technical difficulties leading to uninterpretable echocardiograms in 4 patients. Differences were reported as fold-changes between the 2 assessment points (Figure 6). After 4 months of treatment, there was a notable difference between the 2 treatment groups in change from baseline in LVEF as well as LV wall mass. There was no difference in LV systolic volume. For LVEF, patients treated with triheptanoin saw a mean increase, compared to a mean reduction in the trioctanoin group; the difference between triheptanoin and trioctanoin in mean change from baseline was 7.4% (95% CI, −0.1% to 15%) in favour of triheptanoin. For LV wall mass, patients treated with triheptanoin saw a mean decrease, whereas patients treated with trioctanoin saw a mean increase after 4 months; the mean difference in relative change from baseline between the 2 treatments was 20% in favour of triheptanoin. Of note, all patients except for 1 had normal cardiac function at baseline; the majority of the observed changes were within the normal range.
Table 30: Change From Baseline in LVEF in Study CL201 — Full Analysis Set
LVEF | Baseline | Week 24 |
|---|---|---|
N | 29 | 25 |
Baseline mean, % (SD) | 61.759 (8.6630) | 61.360 (9.2821) |
Reported mean, % (SD) | NA | 62.440 (6.4941) |
Mean change from baseline, % (SD) | NA | 1.080 (1.067) |
P value | NA | 0.473 |
LVEF = left ventricular ejection fraction; NA = not applicable; SD = standard deviation.
Note: The 2-sided P value is from the paired t-test to compare between baseline and week 24. Analyses were not adjusted for multiple testing (i.e., the type I error rate had not been controlled).
Source: CL201 Clinical Study Report.8
Table 31: Change From Baseline in Echocardiogram Parameters at Month 24 in Study CL202 — Full Analysis Set
Echocardiogram parameters | All patients (N = 75) | CL201 rollover (N = 24) | Triheptanoin-naïve (N = 20) | IST/other (N = 31) | ||||
|---|---|---|---|---|---|---|---|---|
Month 12 | Month 24 | Month 12 | Month 24 | Month 12 | Month 24 | Month 12 | Month 24 | |
LVMI (g/m) | ||||||||
n | 53 | 37 | 15 | 6 | 9 | 4 | 29 | 27 |
Baseline mean (SD) | 72.79 (21.590) | 73.27 (22.334) | 73.73 (28.336) | 75.00 (35.440) | 67.00 (24.673) | 65.50 (34.924) | 74.10 (16.650) | 74.04 (17.257) |
Observed mean (SD) | 73.93 (22.421) | 79.33 (30.265) | 67.82 (19.311) | 72.05 (20.619) | 70.27 (28.664) | 54.00 (16.876) | 78.58 (21.232) | 73.57 (15.643) |
Mean (SD) change from baseline | 1.15 (23.535) | −2.92 (21.379) | −5.27 (21.433) | −2.67 (31.252) | 0.89 (31.593) | −20.50 (23.173) | 4.55 (21.903) | −0.37 (18.132) |
LVM (g) | ||||||||
n | 59 | 43 | 18 | 10 | 10 | 5 | 31 | 28 |
Baseline mean (SD) | 101.51 (56.563) | 102.67 (51.665) | 91.78 (61.026) | 77.80 (39.662) | 70.50 (49.244) | 70.60 (51.738) | 117.16 (52.126) | 117.29 (50.893) |
Observed mean (SD) | 106.67 (56.926) | 106.78 (47.164) | 90.28 (60.034) | 86.82 (47.150) | 71.67 (32.323) | 68.17 (31.115) | 129.74 (53.427) | 122.89 (43.120) |
Mean (SD) change from baseline | 6.00 (26.806) | 5.14 (34.310) | −1.50 (29.374) | 13.20 (32.297) | −0.90 (31.250) | −13.60 (37.320) | 12.58 (22.648) | 5.61 (34.465) |
LVD (mm) | ||||||||
n | 57 | 42 | 18 | 9 | 11 | 6 | 28 | 27 |
Baseline mean (SD) | 41.05 (10.929) | 41.66 (11.421) | 39.14 (11.941) | 35.28 (13.198) | 36.91 (9.257) | 37.67 (9.791) | 43.90 (10.412) | 44.67 (10.318) |
Observed mean (SD) | 43.07 (7.485) | 45.13 (7.147) | 41.26 (6.539) | 42.60 (6.931) | 38.25 (7.593) | 38.50 (7.503) | 46.24 (6.733) | 47.38 (6.149) |
Mean (SD) change from baseline | 2.41 (8.043) | 3.72 (9.312) | 2.19 (9.138) | 7.83 (13.048) | 1.91 (4.230) | 0.83 (4.070) | 2.75 (8.643) | 3.00 (8.535) |
LVSF (%) | ||||||||
N | 61 | 47 | 20 | 12 | 10 | 6 | 31 | 29 |
Baseline mean (SD) | 35.82 (5.688) | 35.40 (5.428) | 35.30 (6.088) | 35.25 (4.693) | 36.30 (6.499) | 34.33 (7.789) | 36.00 (5.317) | 35.69 (5.346) |
Observed mean (SD) | 34.65 (7.006) | 35.66 (6.478) | 34.00 (4.910) | 32.67 (7.088) | 34.09 (7.752) | 35.67 (5.538) | 35.26 (7.983) | 36.90 (6.190) |
Mean (SD) change from baseline | −1.16 (6.391) | 0.26 (6.027) | −1.30 (5.564) | −2.58 (5.143) | −2.20 (7.997) | 1.33 (6.470) | −0.74 (6.506) | 1.21 (6.097) |
LVEF (%) | ||||||||
N | 60 | 43 | 21 | 12 | 10 | 6 | 29 | 25 |
Baseline mean (SD) | 61.48 (7.721) | 61.49 (7.735) | 62.05 (7.820) | 62.75 (6.326) | 60.40 (6.077) | 57.50 (4.764) | 61.45 (8.331) | 61.84 (8.759) |
Observed mean (SD) | 61.97 (8.059) | 62.49 (8.215) | 62.48 (7.339) | 60.75 (12.389) | 61.50 (7.180) | 65.83 (4.750) | 61.81 (9.016) | 62.52 (6.399) |
Mean (SD) change from baseline | 0.30 (7.601) | 1.02 (8.975) | 0.43 (8.140) | −2.00 (11.021) | 1.70 (9.154) | 8.33 (4.676) | −0.28 (6.813) | 0.72 (7.919) |
IST = investigator-sponsored trial; LVM = left ventricular mass; LVMI = left ventricular mass index; LVD = left ventricular diameter; LVSF = left ventricular shortening fraction; LVEF = left ventricular ejection fraction; SD = standard deviation.
Source: CL202 Clinical Study Report.9
Reduction in Concomitant Medications
Although the CL201 study protocol listed cardiac medication requirement for maintenance treatment as a clinical end point for cardiac disease, analyses of any changes in required medications were not presented in the Clinical Study Report. According to the sponsor, only 4 patients enrolled in Study CL201 required concomitant medication for cardiomyopathy during the study, and this small number of patients precludes meaningful analysis of this end point.34 Reduction in concomitant medications was not explored in the CL202 or the Gillingham et al. (2017) studies.
Work or School Productivity
The effect of triheptanoin treatment on productivity at school or work was not measured in any of the 3 studies included in this review.
Harms
Only those harms identified in the review protocol are reported here. Detailed harms data for studies CL201 and CL202 are summarized in Table 32, whereas detailed harms data for the study by Gillingham et al. (2017) can be found in Table 33.
Adverse Events
In Study CL201, all patients reported at least 1 TEAE. The most frequently reported TEAEs (occurring in ≥ 20% of patients) were diarrhea (55.2%), rhabdomyolysis (48.3%), vomiting (48.3%), upper respiratory tract infection (41.4%), viral gastroenteritis (34.5%), headache (31.0%), pyrexia (31.0%), abdominal pain (27.6%), and gastroenteritis (20.7%). Some similar AEs were reported separately. For example, abdominal pain terms included abdominal pain (27.6%), abdominal pain upper (13.8%), and GI pain (10.3%). In total, the abdominal pain and similar terms were reported in 13 patients (44.8%). Of note, complications of the underlying LC-FAOD disease (e.g., rhabdomyolysis, pyrexia, myalgia) were reported also as TEAEs or SAEs. Most TEAEs reported were Grade 1 or 2 in severity. Grade 3 (severe) AEs were reported in 18 patients (62.1%), the majority of which were due to underlying LC-FAODs or acute infectious illness.
In Study CL202, almost all patients (98.7%) reported at least 1 TEAE, with similar proportions reported across the 3 cohorts. The most frequently reported TEAEs (occurring in ≥ 20% of patients) were rhabdomyolysis (61.3%), upper respiratory tract infection (50.7%), viral upper respiratory tract infection (37.3%), vomiting (34.7%), diarrhea (30.7%), GI disorder (24.0%), gastroenteritis (22.7%), and pyrexia (21.3%). Of note, complications of the underlying LC-FAOD disease, including rhabdomyolysis, hypoglycemia, and cardiomyopathy, were also reported as TEAEs or SAEs. Most TEAEs reported were Grade 1, 2, or 3. Grade 3 events were reported in 45 patients (60.0%), the majority of which were rhabdomyolysis.
In the Gillingham et al. (2017) study, there was a similar frequency of AEs in the triheptanoin and trioctanoin treatment groups. Although the total number of patients who experienced at least 1 TEAE was not reported, it appears that the majority of patients did experience 1 or more TEAEs (Table 33). The most common AEs were viral illness (93.8% versus 68.8% for triheptanoin and trioctanoin, respectively), GI upset (68.8% versus 75.0%), musculoskeletal pain and/or elevated CK (62.5% versus 68.8%), and diarrhea or loose stools (31.3% versus 37.5%). Emesis or vomiting was reported in 37.5% of patients (n = 6) in the triheptanoin group but was not reported in patients treated with trioctanoin. The study publication did not elaborate further on the severity of reported AEs.
Serious Adverse Events
In Study CL201, 19 patients (65.5%) experienced at least 1 treatment-emergent SAE. The most frequently reported SAEs were rhabdomyolysis (37.9%), gastroenteritis (20.7%), viral gastroenteritis (20.7%), viral GI infection (6.9%), and upper respiratory tract infection (6.9%). Of note, MCEs requiring inpatient hospitalization or prolongation of existing hospitalization, or that caused persistent or significant incapacity or substantial disruption of the ability to conduct normal life functions, were also reported as SAEs. As a result, a high number of SAEs were reported during the study.
In Study CL202, 57 patients (76.0%) experienced SAEs, most of which were hospitalizations for rhabdomyolysis, complications of underlying LC-FAOD disease, or acute infectious disease. Proportions of patients who experienced at least 1 SAE during the study were similar across the 3 cohorts. Similar to CL201, the study required reporting for MCEs as AEs and SAEs.
Although the Gillingham et al. (2017) study does not explicitly mention SAEs, the definition of SAE in the protocol included any event that results in hospitalization. During the study, there were 7 hospitalizations for acute rhabdomyolysis in both treatment groups (14 total). These hospitalizations occurred in 5 patients treated with triheptanoin and 4 patients treated with trioctanoin.
Withdrawals Due to Adverse Events
In Study CL201, 4 patients discontinued triheptanoin treatment due to TEAEs, most of which were GI-related. In CL202, 1 patient discontinued triheptanoin treatment due to a TEAE (non-serious rhabdomyolysis). In the Gillingham et al. (2017) study, no patients withdrew treatment due to AEs.
Mortality
There were no deaths in CL201 or the Gillingham et al. (2017) studies. In CL202, a total of 2 deaths were reported, but neither were considered to be due to triheptanoin (1 death due to worsening cardiomyopathy in the IST or other cohort; 1 death due to cardiorespiratory arrest in the triheptanoin-naive cohort).
Notable Harms
GI-related AEs and weight gain were identified as notable harms in the CADTH review protocol (Table 7). In Study CL201, details of GI-related TEAEs, using the GI-nonspecific symptoms and therapeutic procedures SMQ version 17.1, were presented. A total of 26 patients (89.7%) experienced a TEAE from within the GI Disorders SOC, and the most common GI TEAE was diarrhea (55.2%), followed by vomiting (48.3%). Although weight gain was identified as an AE of interest in the CADTH review protocol, it was not captured as an AE in CL201. However, height and weight changes were measured throughout the study, and there were no clinically significant changes in z scores for either height or weight in patients younger than 18 years of age.
In Study CL202, total of 56 patients (74.7%) experiencing at least 1 TEAE from the GI Disorders SOC. The most commonly reported terms were vomiting, diarrhea, and abdominal or GI pain or discomfort, and the majority of events were non-serious. Similar to CL201, weight gain was not captured as an AE in CL202, although growth measurements were collected over the course of the study. There were no notable changes in these parameters, including z scores for height and weight (in boys 18 years of age or younger and girls 15 years of age or younger).
In the Gillingham et al. (2017) study, GI-related AEs were reported commonly, as previously mentioned. During treatment, no weight gain or change in overall body composition was observed, and there was no difference between the 2 treatment groups.
Table 32: Summary of Harms in Studies CL201 and CL202 — Safety Analysis Set
Harms | N = 29 | CL201 rollover N = 24 | Triheptanoin-naive N = 20 | IST/other N = 31 | Total N = 75 |
|---|---|---|---|---|---|
Patients with ≥ 1 adverse event | |||||
n (%) | 29 (100.0) | 24 (100.0) | 19 (95.0) | 31 (100.0) | 74 (98.7) |
Most common events,a n (%) | |||||
Diarrhea | 16 (55.2) | 5 (20.8) | 8 (40.0) | 10 (32.3) | 23 (30.7) |
Rhabdomyolysis | 14 (48.3) | 12 (50.0) | 11 (55.0) | 23 (74.2) | 46 (61.3) |
Vomiting | 14 (48.3) | 11 (45.8) | 7 (35.0) | 8 (25.8) | 26 (34.7) |
Upper RTI | 12 (41.4) | 13 (54.2) | 6 (30.0) | 19 (61.3) | 38 (50.7) |
Gastroenteritis, viral | 10 (34.5) | 3 (12.5) | 3 (15.0) | 3 (9.7) | 9 (12.0) |
Headache | 9 (31.0) | 4 (16.7) | 0 (0.0) | 3 (9.7) | 7 (9.3) |
Pyrexia | 9 (31.0) | 6 (25.0) | 5 (25.0) | 5 (16.1) | 16 (21.3) |
Abdominal pain | 8 (27.6) | 2 (8.3) | 3 (15.0) | 2 (6.5) | 7 (9.3) |
Gastroenteritis | 6 (20.7) | 6 (25.0) | 2 (10.0) | 9 (29.0) | 17 (22.7) |
Ear infection | 5 (17.2) | 4 (16.7) | 0 (0.0) | 1 (3.2) | 5 (6.7) |
GI viral infection | 5 (17.2) | 2 (8.3) | 2 (10.0) | 0 (0.0) | 4 (5.3) |
Myalgia | 5 (17.2) | 5 (20.8) | 1 (5.0) | 7 (22.6) | 13 (17.3) |
Nasopharyngitis | 5 (17.2) | NR | NR | NR | NR |
Viral upper RTI | 5 (17.2) | 7 (29.2) | 6 (30.0) | 15 (48.4) | 28 (37.3) |
Abdominal pain upper | 4 (13.8) | 6 (25.0) | 2 (10.0) | 4 (12.9) | 12 (16.0) |
Bronchitis | 4 (13.8) | 1 (4.2) | 1 (5.0) | 0 (0.0) | 2 (2.7) |
Conjunctivitis | 4 (13.8) | 1 (4.2) | 0 (0.0) | 0 (0.0) | 1 (1.3) |
Cough | 4 (13.8) | 3 (12.5) | 2 (10.0) | 2 (6.5) | 7 (9.3) |
Decreased appetite | 4 (13.8) | NR | NR | NR | NR |
Rhinitis | 4 (13.8) | 3 (12.5) | 1 (5.0) | 0 (0.0) | 4 (5.3) |
Acne | 3 (10.3) | 0 (0.0) | 1 (5.0) | 2 (6.5) | 3 (4.0) |
Arthropod bite | 3 (10.3) | 0 (0.0) | 0 (0.0) | 1 (3.2) | 1 (1.3) |
Blood CK increased | 3 (10.3) | 5 (20.8) | 1 (5.0) | 0 (0.0) | 6 (8.0) |
Fall | 3 (10.3) | 2 (8.3) | 1 (5.0) | 0 (0.0) | 3 (4.0) |
GI pain | 3 (10.3) | 2 (8.3) | 1 (5.0) | 0 (0.0) | 3 (4.0) |
GERD | 3 (10.3) | 0 (0.0) | 2 (10.0) | 2 (6.5) | 4 (5.3) |
Nasal congestion | 3 (10.3) | 3 (12.5) | 2 (10.0) | 2 (6.5) | 7 (9.3) |
Oropharyngeal pain | 3 (10.3) | 2 (8.3) | 1 (5.0) | 2 (6.5) | 5 (6.7) |
Otitis media | 3 (10.3) | 1 (4.2) | 4 (20.0) | 2 (6.5) | 7 (9.3) |
Pain | 3 (10.3) | 2 (8.3) | 0 (0.0) | 1 (3.2) | 3 (4.0) |
RTI, viral | 3 (10.3) | 0 (0.0) | 2 (10.0) | 1 (3.2) | 3 (4.0) |
Sinusitis | 3 (10.3) | 3 (12.5) | 1 (5.0) | 5 (16.1) | 9 (12.0) |
UTI | 3 (10.3) | 1 (4.2) | 1 (5.0) | 6 (19.4) | 8 (10.7) |
Nausea | 2 (6.9) | 3 (12.5) | 2 (10.0) | 4 (12.9) | 9 (12.0) |
Constipation | 2 (6.9) | 2 (8.3) | 3 (15.0) | 4 (12.9) | 9 (12.0) |
Dehydration | 2 (6.9) | 2 (8.3) | 1 (5.0) | 4 (12.9) | 7 (9.3) |
Rash | 1 (3.4) | 4 (16.7) | 2 (10.0) | 2 (6.5) | 8 (10.7) |
GI disorder | 1 (3.4) | 3 (12.5) | 4 (20.0) | 11 (35.5) | 18 (24.0) |
Pain in extremity | 1 (3.4) | 2 (8.3) | 5 (25.0) | 1 (3.2) | 8 (10.7) |
Influenza | 1 (3.4) | 1 (4.2) | 1 (5.0) | 5 (16.1) | 7 (9.3) |
Croup infectious | 1 (3.4) | 1 (4.2) | 2 (10.0) | 1 (3.2) | 4 (5.3) |
Pharyngitis, streptococcal | 1 (3.4) | 0 (0.0) | 4 (20.0) | 0 (0.0) | 4 (5.3) |
Poor venous access | NR | 3 (12.5) | 0 (0.0) | 1 (3.2) | 4 (5.3) |
Abdominal discomfort | NR | 2 (8.3) | 5 (25.0) | 2 (6.5) | 9 (12.0) |
Acute kidney injury | NR | 1 (4.2) | 0 (0.0) | 4 (12.9) | 5 (6.7) |
Patients with ≥ 1 SAE | |||||
n (%) | 19 (65.5) | 18 (75.0) | 15 (75.0) | 24 (77.4) | 57 (76.0) |
Most common events,b n (%) | |||||
Rhabdomyolysis | 11 (37.9) | 11 (45.8) | 9 (45.0) | 22 (71.0) | 42 (56.0) |
Gastroenteritis | 6 (20.7) | 4 (16.7) | 2 (10.0) | 5 (16.1) | 11 (14.7) |
Gastroenteritis, viral | 6 (20.7) | 3 (12.5) | 2 (10.0) | 2 (6.5) | 7 (9.3) |
GI viral infection | 2 (6.9) | 0 (0.0) | 1 (5.0) | 0 (0.0) | 1 (1.3) |
Upper RTI | 2 (6.9) | 2 (8.3) | 0 (0.0) | 0 (0.0) | 2 (2.7) |
Viral upper RTI | 1 (3.4) | 2 (8.3) | 1 (5.0) | 0 (0.0) | 3 (4.0) |
GI disorder | 1 (3.4) | 1 (4.2) | 2 (10.0) | 6 (19.4) | 9 (12.0) |
Croup | 1 (3.4) | 1 (4.2) | 1 (5.0) | 1 (3.2) | 3 (4.0) |
Vomiting | 1 (3.4) | 1 (4.2) | 3 (15.0) | 1 (3.2) | 5 (6.7) |
Congestive cardiomyopathy | NR | 2 (8.3) | 0 (0.0) | 0 (0.0) | 2 (2.7) |
Influenza | NR | 1 (4.2) | 1 (5.0) | 4 (12.9) | 6 (8.0) |
Pyelonephritis | NR | 0 (0.0) | 0 (0.0) | 2 (6.5) | 2 (2.7) |
Diarrhea | NR | 0 (0.0) | 1 (5.0) | 1 (3.2) | 2 (2.7) |
Patients who stopped treatment due to adverse events | |||||
n (%) | 4 (13.8) | 0 (0.0) | 1 (5.0) | 0 (0.0) | 1 (1.3) |
Most common events, n (%) | |||||
Diarrhea | 1 (3.4) | NA | NA | NA | NA |
Diarrhea, abdominal pain, myalgia | 1 (3.4) | NA | NA | NA | NA |
GERD | 1 (3.4) | NA | NA | NA | NA |
Vomiting and pain | 1 (3.4) | NA | NA | NA | NA |
Rhabdomyolysis | NA | NA | 1 (5.0) | NA | 1 (1.3) |
Deaths | |||||
n (%) | 0 (0.0) | 0 (0.0) | 1 (5.0) | 1 (3.2) | 2 (2.7) |
Cause of death, n (%) | |||||
Cardiorespiratory arrest | NA | NA | NA | 1 (3.2) | 1 (1.3) |
Worsening cardiomyopathy | NA | NA | 1 (5.0) | NA | 1 (1.3) |
Notable harms, n (%) | |||||
Diarrhea | 16 (55.2) | 5 (20.8) | 8 (40.0) | 10 (32.3) | 23 (30.7) |
Vomiting | 14 (48.3) | 11 (45.8) | 7 (35.0) | 8 (25.8) | 26 (34.7) |
Abdominal pain | 8 (27.6) | 2 (8.3) | 3 (15.0) | 2 (6.5) | 7 (9.3) |
Abdominal pain upper | 4 (13.8) | 6 (25.0) | 2 (10.0) | 4 (12.9) | 12 (16.0) |
GI pain | 3 (10.3) | 2 (8.3) | 1 (5.0) | 0 (0.0) | 3 (4.0) |
Abdominal distension | 2 (6.9) | 0 (0.0) | 0 (0.0) | 1 (3.2) | 1 (1.3) |
Constipation | 2 (6.9) | 2 (8.3) | 3 (15.0) | 4 (12.9) | 9 (12.0) |
Flatulence | 2 (6.9) | NR | NR | NR | NR |
Nausea | 2 (6.9) | 3 (12.5) | 2 (10.0) | 4 (12.9) | 9 (12.0) |
CK = creatine phosphokinase; GERD = gastroesophageal reflux disease; GI = gastrointestinal; IST = investigator-sponsored trial; NR = not reported; RTI = respiratory tract infection; SAE = serious adverse event; UTI = urinary tract infection.
aFrequency > 10% in any group.
bFrequency > 5% in any group.
Source: CL201 Clinical Study Report,8 CL202 Clinical Study Report.9
Table 33: Summary of Harms in the Gillingham et al. (2017) Study
Harms | Triheptanoin N = 16 | Trioctanoin N = 16 |
|---|---|---|
Patients with ≥ 1 adverse event | ||
Most common events,a n (%) | ||
Viral illness | 15 (93.8) | 11 (68.8) |
GI upset | 11 (68.8) | 12 (75.0) |
Musculoskeletal pain, cramping, or elevated CK | 10 (62.5) | 11 (68.8) |
Emesis or vomiting | 6 (37.5) | 0 |
Diarrhea, loose stools, or steatorrhea | 5 (31.3) | 6 (37.5) |
Rhabdomyolysis | 5 (31.3) | 4 (25.0) |
Headache | 5 (31.3) | 3 (18.8) |
Localized pain not associated with rhabdomyolysis | 4 (25.0) | 2 (12.5) |
Fatigue or lethargy | 3 (18.8) | 2 (12.5) |
Dermatitis | 0 | 4 (25.0) |
Patients who stopped treatment due to adverse events | ||
n (%) | 0 (0.0) | 0 (0.0) |
Deaths | ||
n (%) | 0 (0.0) | 0 (0.0) |
Notable harms, (%) | ||
GI upset | 11 (68.8) | 12 (75.0) |
Emesis or vomiting | 6 (37.5) | 0 |
Diarrhea, loose stools, or steatorrhea | 5 (31.3) | 6 (37.5) |
CK = creatine phosphokinase; GI = gastrointestinal.
Note: According to the Common Technical Document, there were minor discrepancies between the publication and source data with regard to AEs and patient characteristics. These discrepancies do not affect the study conclusion.
aFrequency > 10% in either group.
Source: Gillingham et al. (2017),10 Sponsor’s Submission Materials (Common Technical Document).5
Critical Appraisal
Internal Validity
The Gillingham et al. (2017) study used accepted methods to conceal allocation and randomize patients to treatments. The patients’ characteristics appear to be overall balanced at baseline, although patients randomized to triheptanoin were slightly older (median age of 27 versus 18 years). This RCT hypothesized that a diet supplemented with triheptanoin would improve energy production, exercise tolerance, and cardiac function in these patients, although the sample size was determined based on detecting a difference between the treatment groups in adjusted TEE only, and no adjustments for multiplicity were made for the multiple outcomes.
In all 3 trials (CL201, CL202, and Gillingham et al. [2017]), the sample size of each treatment group was small. For example, in the triheptanoin-naive cohort of CL202, only 7 patients (35%) had completed 18 months of treatment, and in the Gillingham et al. (2017) study, only 16 patients were enrolled in each treatment group. As a result, differences in 1 or 2 patients could have a substantial impact on results, leading to a high degree of uncertainty about the differences observed due to random variation and the ability to detect small but potentially clinically significant mean or median treatment effects. Nevertheless, due to the rarity of this disease, such a small sample size is not unusual. In CL201, there was lack of pre-specified primary outcomes, as the end points were categorized as key or supportive. In all 3 studies, there were no adjustments made for multiple testing among any of the outcomes analyzed. Consequently, statistically significant results should be interpreted with consideration of the potential for inflated type I error.
In both CL201 and CL202, study objectives and end points of interest were pre-specified, but the study was not powered for hypothesis testing of a specific end point. Both trials were single-arm, phase II trials that did not include a comparator for treatment. Several inherent limitations in the study design contributed to a high risk of bias and uncertainty in the evidence.
Due to the heterogeneity of clinical manifestations associated with LC-FAODs, analyses of MCEs in Study CL201 and 2 cohorts in CL202 (CL201 rollover and triheptanoin-naive) were conducted using a before-after design. The MCEs were evaluated before and after initiation of triheptanoin, with each patient serving as his or her own control, using retrospective data. Several potential biases may arise with this study design, from the influence of concurrent therapies and carry-over effects. Other confounding factors include the natural history of the disease and progression over time, as well as growth and maturation of the patients themselves. For example, if patients and/or caregivers are better able to recognize early signs of metabolic deficit over time, they may be able to avoid crises that require medical intervention; this may bias results in favour of the new treatment. In Study CL201, there was an increase of approximately 10% DCI in the dosage of MCT when patients transitioned from MCT oil to triheptanoin after study enrolment. Although this reflects the study protocol targeting a higher dosage, the increase may have confounded the results observed with triheptanoin treatment. To explore the potential influence of diet (i.e., increase in MCT dosage), study investigators conducted an ad hoc analysis. Results identified weak association between improvement in MCEs and changes in percentage DCI from MCT oil to triheptanoin, with wide variability (Spearman rank correlation r = −0.38; 95% CI, −0.675 to 0.016). No details on the difference in MCT dosage before and after study enrolment were presented for the 2 relevant cohorts of Study CL202. Thus, it is difficult to ascertain whether and how much an increase in MCT dosage had an impact on effects. Nevertheless, confounding due to the change in percentage of MCT intake cannot be ruled out. Also, there was no washout period when patients switched from previous MCT to triheptanoin; carry-over effects of the even-chain MCT oil may affect the results with triheptanoin. The Clinical Study Report notes that, due to the serious consequences of LC-FAODs, particularly in children, a washout period from prior treatment to study enrolment was not considered appropriate. Also, given the length of follow-up for the studies, and that the target dose of MCT was higher for triheptanoin, the residual effects of previously administered MCT are unlikely to impact results throughout the trials.
To standardize the administration of the tests, the 12MWT and cycle ergometry tests in Study CL201 were conducted by trained clinicians. However, the absence of a parallel comparator group makes it challenging to interpret small changes from baseline, especially if the patient’s maturation may be responsible for changes in certain relevant outcomes, such exercise tests. Also, only 8 qualified patients performed the 12MWT at baseline and all key assessment points, which is less than one-third of all patients enrolled. As a result, strong inferences cannot be drawn about any differences in results.
Both studies CL201 and CL202 were open-label, and patients were aware of the treatment allocation. As a result, the evaluation of patient-reported outcomes (e.g., HRQoL), exercise tests that depended on patient effort, or AEs may have been influenced by the unblinded treatment regimen, resulting in reporting bias. The effects of treatment on such subjective outcomes may have been overestimated as a consequence of patients’ expectations. According to the studies, the objectivity of MCEs was expected to reduce the potential influence of bias. However, aside from the serum glucose threshold for hypoglycemia in CL201, no specific definitions were provided for diagnosing MCEs. Due to lack of standardized criteria, combined with the open-label study design, there is potential for variability between investigators in the assessment and classification of presenting symptoms.
Ad hoc subgroup analyses of MCEs, based on age group at initial triheptanoin treatment, age of presentation, and LC-FAOD diagnoses, were conducted in the CL201 and CL202 studies. However, due to limited sample size, statistical testing was not conducted, nor was a test for interaction to compare treatment effects in subgroups. Thus, the interpretability of results is limited.
In Study CL201, the 12MWT and cycle ergometry tests were conducted in patients 6 years of age and older who were safely able to perform the tests. In both CL201 and CL202, SF-10 and SF-12 were conducted in specific age-specific groups (5 to 17 years for SF-10; 18 years and older for SF-12). This resulted in a substantially smaller sample sizes relative to the enrolled population for these end points, which contributes to the uncertainty in results. General limitations of the 12MWT are also discussed in Appendix 4.
There was a lack of data imputation for missing patient-reported outcomes data; such missing data are unlikely to be missing at random (generally, data are missing for sicker patients). This could lead to overestimates of HRQoL. The SF-10 used to measure HRQoL in pediatric patients was completed by proxy (by parents or caregivers). It is unclear whether there was appropriate training and there were measures in place to ensure consistent reporting that was representative of the true experience of the child. Also, an estimated MID has not been identified in the LC-FAOD population for SF-10, SF-12, or the 12MWT, nor have these tests been validated in patients with LC-FAOD (Appendix 4). Thus, the clinical significance of the HRQoL findings is unclear.
After database lock, several changes to the planned analysis were made in both CL201 and CL202. According to the Clinical Study Reports, these were mainly in response to feedback from regulators and also to further characterize the treatment effect of triheptanoin on MCEs. The most notable change for CL201 was the addition of annual event rate and annualized event days (duration rate) for total MCEs (i.e., aggregate of rhabdomyolysis, hypoglycemia, and cardiomyopathy events) to evaluated end points. For Study CL202, the most notable change was adding statistical analyses for annualized event rates and annualized event days, as well as comparing MCEs before and during triheptanoin treatment for the CL201 rollover cohort. A sensitivity analysis removing outliers in the statistical comparison of MCE rates was also added. For both studies, several additional analyses were added, including subgroup analyses of MCE end points, sensitivity analyses for MCEs to handle missing data using negative binomial regression model, as well as assessment of confounding factors, including diet, laboratory parameters, and concomitant medications. Furthermore, results from CL202 are presented in an interim analysis that was not pre-specified in the protocol. There was no formal data monitoring committee for this study, and the conduct was monitored by the sponsor. As a consequence, data from these analyses should be interpreted with caution.
For the CL202 and Gillingham et al. (2017) studies, no baseline dietary treatment information was available, so it is unknown whether dietary changes could have confounded the results.
External Validity
The study populations overall reflect the patient population with LC-FAODs in Canada. However, a greater proportion of individuals enrolled in the sponsor-funded trials (approximately 65% to 70% of CL201 and CL202 triheptanoin-naive patients) received carnitine supplementation before and during the study than what normally occurs in Canadian clinical practice. According to the clinical experts consulted on this review, the difference in carnitine prescribing is not expected to greatly affect the results.
Patients with diagnoses of CACT or CPT I deficiencies were not included in the CL201 or Gillingham et al. (2017) studies. According to the CL201 study, these 2 LC-FAOD types were excluded due to the rarity and greater severity (i.e., mortality) of disease. Furthermore, although these 2 LC-FOAD types were part of the inclusion criteria for Study CL202, the actual number of enrolled patients with either of these 2 deficiencies was low (n = 3 for CACT and n = 1 for CPT I deficiencies). Thus, results cannot be generalized to patients with these LC-FAOD types. Most notably, in Canada, there are CPT IA variants that are prevalent in the Indigenous communities (e.g., British Columbia First Nations and Inuit populations) and as well as Hutterite communities, but data on the efficacy of triheptanoin in these groups are lacking.11,12 However, the clinical experts consulted on this review noted that patients with these CPT IA variants typically have mild disease or are asymptomatic and generally do not require active treatment with MCTs.
There are important differences in the enrolled study population, in particular between the CL201 and CL202 and Gillingham et al. (2017) trials. The CL201 enrolled patients with severe LC-FAODs, whereas those enrolled in the Gillingham et al. (2017) study likely had less severe disease due to the enrolment criteria that ensured patients were older and could safely perform all activities in the protocol (i.e., exercise tests). As a consequence, the results of the comparative efficacy of triheptanoin over an even-chain MCT is not fully generalizable to patients with severe disease. Additionally, the clinical experts consulted on this review note that the definition of “severe disease” used in the CL201 inclusion criteria may not be entirely consistent with the definition used in clinical practice. For example, elevated CK levels are rarely used to classify severity of disease, and other patient-specific factors are considered. Nonetheless, due to the heterogeneous presentation of the disease and difficulties with categorization of severity in patients with LC-FAODs, the criteria used in CL201 were considered reasonable to capture those who may require triheptanoin.
The majority of patients (≥ 90%) in Study CL201 and in the CL201 rollover and triheptanoin-naive cohorts of Study CL202 had received prior treatment with a MCT formulation. As per inclusion criteria, all patients enrolled into the Gillingham et al. (2017) study had received prior supplementation with MCT. Thus, the effects of triheptanoin as first-line treatment in patients who have not received any form of prior MCT supplementation require further investigation.
Currently available MCT formulations are often a mix of C8, C10, and C12 triglycerides, with content and proportions varying among different products. The Gillingham et al. (2017) study used purified C8 oil specifically formulated for their study to eliminate the variation in the fatty acid composition of commercially available MCTs.10 Currently, there is no evidence showing any similarities or differences among the available MCT formulations, and the clinical experts indicated the choice is strongly influenced by availability. Thus, trioctanoin alone is an appropriate comparator to represent MCT supplements included as part of standard of care.
Although dosages used in CL201 and CL202 are reflective of the dosage approved by Health Canada (target up to 35% of the patient’s total prescribed DCI), the clinical experts consulted on this review noted that triheptanoin may be prescribed using weight-based dosage (e.g., 2 g/kg to 3 g/kg in infants, 2 g/kg in older children, and 1 g/kg in adults). Importantly, the experts noted that many patients, particularly adults, often have difficult tolerating MCTs. As a result, the consumed dosage is often lower than what is recommended in the product monograph. Reflective of this, patients in Study CL201 consumed an average dosage of 27.5% of DCI. On the contrary, by study design, the dosage of MCT prescribed in the Gillingham et al. (2017) study was lower, and the consumed dosage was approximately 15% of DCI, which is likely lower than the dosage that patients will receive in clinical practice.
None of the studies measured survival, 1 of the most important clinical outcomes identified by clinical experts. As well, the majority of MCEs documented in studies CL201 and CL202 were due to rhabdomyolysis. The small number of events and patients who had cardiomyopathy or experienced hypoglycemia limits the interpretation of efficacy for MCEs other than rhabdomyolysis. Furthermore, the clinical experts consulted on the review identified retinopathy and peripheral neuropathy as significant manifestations of LC-FAODs. None of the 3 pivotal studies measured change in retinopathy or peripheral neuropathy as an end point; thus, the efficacy of triheptanoin in the treatment of such clinical manifestations is unknown. The clinical experts considered this a noteworthy gap in the evidence.
Measure of phosphocreatine recovery after acute exercise was measured in the Gillingham et al. (2017) study; however, the authors note that the short duration of exercise (2 minutes) may not have been sufficient to engage muscle fatty acid oxidation. As well, patients with LC-FAODs have been shown to have normal phosphocreatine recovery rates, which limits the clinical meaningfulness of this end point.
It is unclear whether there were specific criteria employed in deciding whether or when a patient is admitted to the hospital or sent to the ED in the CL201 and CL202 studies. The clinical experts noted that, in the Canadian setting, several considerations are involved in the decision to hospitalize a patient, which were unlikely to be captured in the CL201 and CL202 studies. Canadian patients live in diverse geographic locations, and access to hospitals may be difficult or limited. In certain circumstances, physicians and patients may opt for treatment as an outpatient first, if appropriate, rather than admission to a hospital. Thus, the rate of hospitalization reported in the studies may not reflect the Canadian experience.
Indirect Evidence
No indirect evidence was submitted by the sponsor. Publications of relevant indirect treatment comparisons were also not identified in the literature search.
Other Relevant Evidence
No other relevant studies that addressed important gaps in the evidence in the systematic review were identified in the literature search.
Discussion
Summary of Available Evidence
A total of 3 sponsor-submitted studies were included in this report, none of which met the inclusion criteria for the CADTH systematic review. Study CL201 (N = 29) was a multi-centre, open-label, single-arm phase II study investigating the efficacy and safety of triheptanoin over 78 weeks in patients exhibiting serious clinical manifestations of LC-FAODs despite current management. Study CL202 (n = 75) is an ongoing open-label extension study investigating the long-term safety and efficacy of triheptanoin and comprises 3 single-arm cohorts: a CL201 rollover cohort (N = 24), a triheptanoin-naive cohort (N = 20), and an IST or other cohort (N = 31). Both trials enrolled adults and children 6 months and older, and in both triheptanoin was administered at a target dosage of 25% to 35% of DCI. The study by Gillingham et al. (2017, N = 32) was a double-blind RCT conducted at 2 investigative sites, in which patients were randomized in a 1:1 ratio to a diet including target of 20% DCI of triheptanoin or trioctanoin (an even-chain triglyceride). Prior to study enrolment, patients must have had at least 1 episode of rhabdomyolysis and be on a stable diet that included MCT. Adults and children 7 years of age who met eligibility criteria were admitted to the research centre for 4 days for outcomes measurements at baseline and for follow-up after 4 months of treatment.
At baseline, the average age of patients in CL201 and CL202 were younger and involved mainly pediatric patients (< 18 years) compared to patients enrolled in the Gillingham et al. (2017) trial, who were, on average, young adults. In the Gillingham et al. (2017) study, the mean age of patients in the triheptanoin treatment group (mean = 27.2 years, SD = 15.9) was slightly older than that of patients in the trioctanoin group (22.3 years, SD 12.7). According to available data (i.e., excluding the IST or other cohort of CL202), the majority of patients enrolled in all 3 studies had received prior treatment with a MCT formulation, and all were being treated with dietary measures.
Numerous different outcomes were assessed across all 3 trials; however, none employed a hierarchical testing procedure or strategy to control for the overall type I error rate. The CL201 study did not explicitly identify primary and secondary efficacy end points; rather, the study grouped several end points as key or supportive. The primary end point in Study CL202 was the annualized rate of MCEs, defined as rhabdomyolysis, hypoglycemia, or cardiomyopathy events resulting in any hospitalization, ED or acute care visits, or emergency interventions. Results from CL202 were presented from an interim analysis (data cut-off of June 1, 2018). The primary outcomes in the Gillingham et al. (2017) study included energy expenditure, cardiac function, and exercise tolerance.
Interpretation of Results
Efficacy
End Points
Patients with LC-FAODs present with a spectrum of heterogenous clinical manifestations. The important outcome measure of survival was not included in any of the 3 studies. To capture the morbidity associated with LC-FAODs, studies CL201 and CL202 investigated the most common clinical manifestations (i.e., rhabdomyolysis, hypoglycemia, and cardiomyopathy) leading to significant events (i.e., hospitalizations, ED visits, unanticipated interventions) as composite outcomes. Aggregate data from Study CL201, including all 3 manifestations, showed a notable improvement in annualized rate and duration of MCEs after patients started triheptanoin treatment. Although the absolute reduction in mean annualized event rates and durations was small, it was considered clinically meaningful by the experts consulted on this review. According to the clinical experts, individual-level data for MCEs are also informative in this disease state, and visual results from CL201 are presented in Appendix 3, Figure 7, and Figure 8. Notably, Figure 8 shows that not all patients responded to triheptanoin treatment (i.e., experienced reduction in annualized event rate and duration), despite aggregate data showing overall improvement. Also, results were less consistent in CL202, in which there was a notable improvement only with the annualized rate of MCEs in the CL201 rollover cohort. This indicated that patients who rolled over into CL202 after CL201 maintained the improvement in the frequency of MCEs, but the impact on triheptanoin-naive patients is unclear. Most MCEs that occurred in both studies were hospitalizations due to rhabdomyolysis. Thus, there were consistent results for the end point measuring annualized rates and duration of hospitalization. Due to the small number of patients who experienced hypoglycemia or cardiomyopathy, and the few ED visits made during the study, no firm conclusions can be drawn for these outcomes. Ad hoc subgroup analyses were performed to investigate the effect of triheptanoin on different age groups at triheptanoin initiation as well as on different LC-FAOD types. For Study CL201, results were generally consistent with the overall population; however, inconsistent and variable results were observed in CL202. The analyses and interpretability of subgroup data are limited by the small sample sizes of individual subgroups and skewed data of CL202. Importantly, MCEs were not measured as an outcome in the Gillingham et al. (2017) study; thus, the comparative efficacy of triheptanoin and trioctanoin (an even-chain MCT) is unknown.
HRQoL was identified as an important outcome for patients and was measured in studies CL201 and CL202 using SF-10 in the pediatric population and SF-12 in adults. However, the data presented in CL202 were descriptive, and statistical comparisons were reported only in CL201. In both studies, the psychosocial and mental scores in both pediatric and adult patients were generally similar to the population norm and remained within this range throughout treatment. The results for the physical scores varied. In CL201, results showed that physical component scores in both pediatric and adult patients improved over time with treatment, but scores remained below the population norm. In CL202, PHSs generally remained stable over time. The small number of patients included in each post-baseline assessment, particularly in the triheptanoin-naive cohort of CL202, precluded meaningful assessments for changes in HRQoL during treatment. Although there was no overall decrement in HRQoL in CL201 or CL202, it is unclear whether there is any sustained benefit with the new treatment, and, thus, the overall effect of triheptanoin on HRQoL is inconclusive. Importantly, the SF-10 and SF-12 have not been validated in patients with LC-FAODs; also, an estimated MID has not been identified in this patient population. Patient-reported outcomes and HRQoL were not measured in the Gillingham et al. (2017) study; thus, the comparative efficacy of triheptanoin and trioctanoin (an even-chain MCT) on HRQoL is unknown.
Exercise tolerance was measured using different methods in the CL201 and Gillingham et al. (2017) studies. In Study CL201, physical function and exercise tolerance were measured using the 12MWT and cycle ergometry tests. Although results showed overall improvement in the various parameters, most were not significant. The mean changes from baseline were often associated with wide CIs, reducing the certainty of the results. In the Gillingham et al. (2017) study, treadmill ergometry and phosphocreatine recovery were measured to assess exercise tolerance. Of all parameters measured across these 2 tests, the only notable difference between the 2 treatment groups was maximum HR during the treadmill test. After 4 months of treatment, the mean difference in change from baseline was 6.98 beats per minute (95% CI, 0.34 to 13.63), in favour of triheptanoin. However, the relationship of this modest difference on longer-term exercise tolerance is unknown.
Cardiac function parameters were measured in all 3 studies using echocardiography, and almost all enrolled patients had a normal cardiac function at baseline. In the Gillingham et al. (2017) study, there was a difference between the 2 treatment groups for mean LVEF (7.4%; 95% CI, −0.1% to 15%) and mean LV wall mass (20% or 0.80-fold change; 95% CI, 0.65 to 0.99) in favour of triheptanoin. However, the Gillingham et al. (2017) trial was not intended to look at long-term cardiac outcomes and, given that cardiac function parameters at baseline were in the normal range, it is difficult to determine the clinical relevance of this finding.
Study Design
Although 3 studies investigated a wide variety of end points, there remains a high degree of uncertainty regarding the clinical efficacy of triheptanoin in the treatment of patients with LC-FAODs. All 3 studies submitted by the sponsor have significant limitations. More importantly, the comparative efficacy of triheptanoin and even-chain MCTs was investigated only in the Gillingham et al. (2017) trial. Although there are also numerous limitations in this study, it is nevertheless the most adequately designed trial out of the 3 submitted by the sponsor and provides comparative data between triheptanoin and a relevant comparator.
For studies CL201 and CL202, while efforts were made to capture the heterogeneity of clinical presentation of LC-FAODs by investigating numerous diverse end points and to address the lack of a parallel control arm by using an internal retrospective control, the inherent limitations of open-label, non-randomized, phase II trials preclude definitive conclusions about the clinical benefit of triheptanoin. Specifically, the risk of significant bias due to the lack of a relevant comparator as a control as well as the lack of blinding of treatment limits the study’s usefulness in providing meaningful data to characterize the comparative efficacy of triheptanoin. Moreover, the unclear definitions used for MCEs and the increase in the amount of medium-chain fat consumed during triheptanoin treatment can contribute to the risk of biasing effects in favour of triheptanoin.
The results from Study CL202 were from an interim analysis that was not predefined in the protocol; although the study enrolled 3 cohorts, results for MCEs were only available for 2 (CL201 rollover and triheptanoin-naive cohorts). The Clinical Study Report notes that the final clinical report will include full results on the IST or other cohort, after all patients have completed the full term of the study. Until then, the long-term efficacy of triheptanoin is unknown in the IST or other cohort and remains unclear in the other 2 cohorts (CL201 rollover and triheptanoin-naive).
The Gillingham et al. (2017) study identified 4 primary outcomes. The sample size was based on 1 of the primary outcomes — specifically, change in TEE measured using the doubly labelled water technique — which was not identified as an outcome of interest in the CADTH review protocol. After 4 months of treatment, there was no difference between the 2 treatment groups in TEE. Furthermore, differences between the 2 treatment groups were notable for only a few parameters that may not reflect the efficacy for the outcome in its entirety. For example, triheptanoin was favoured over trioctanoin for the selective measures of HR during the treadmill exercise; however, there was a lack of difference reported for other parameters. Without appropriate control of multiplicity, the difference may have arisen by chance. As previously mentioned, the longer-term effects of triheptanoin, as well as the clinical meaningfulness of the modest benefits for maximum HR during treadmill exercise and mean LVEF and LV wall mass on echocardiography, in the context of normal baseline values, are uncertain. Notably, the study did not include end points that were deemed as important by clinicians and patient groups, including survival, clinical events, symptoms such as fatigue, or HRQoL. Thus, the relative efficacy of triheptanoin compared to even-chain MCTs (i.e., trioctanoin) for these important outcomes is unknown, and available data do not provide evidence to support the use of triheptanoin over trioctanoin to prevent or reduce clinical events. Furthermore, conclusions regarding the long-term efficacy of triheptanoin compared to trioctanoin cannot be drawn due to the short duration of the study relative to the chronic nature of LC-FAOD. The longer follow-up used in CL201 and CL202 could allow better characterization of triheptanoin treatment; however, long-term effects compared to currently used even-chain MCTs remain unaddressed.
Numerous limitations associated with the statistical analyses also preclude drawing definitive conclusions from the 3 trials. In CL201 and CL202, no formal hypothesis testing was performed. The sample sizes were intended to provide the maximum amount of information regarding the safety, tolerability, and efficacy of triheptanoin and were not powered to test the hypothesis of a specific end point. In all 3 studies, results of statistical tests were reported for multiple end points; however, none employed a hierarchical testing strategy or made adjustments for multiplicity, which increases the risk of type I error. Furthermore, the small sample sizes in each study, and particularly within different analyses (e.g., echocardiography, HRQoL), all affect the internal validity and limit the interpretability, reliability, and certainty of results. Overall, robust long-term comparative data are required to better characterize the efficacy profile of triheptanoin compared to available even-chain MCT supplements.
Indication and Unmet Need
The sponsor’s funding request does not specify the place in therapy of triheptanoin. According to available data from all 3 trials (i.e., except IST or other cohort of CL202), the majority of patients (≥ 90%) who enrolled in the studies had previously been treated with an MCT product. Thus, there is insufficient information on the efficacy of triheptanoin in the first-line setting in patients who have not received prior MCT supplementation. Consistent with this, the clinical experts consulted on this review noted that triheptanoin will most likely be used after failure of treatment with an even-chain product. That is, triheptanoin will likely be considered as an alternative source of MCTs in patients with uncontrolled LC-FAODs. An exception to this would be for infants who present with severe catastrophic symptoms, in which case triheptanoin would be considered for first-line therapy. Younger patients often experience a high number or severe forms of clinical events, reflecting the greatest unmet need.
It is recognized that LC-FAODs can present very differently among patients with regards to type, frequency, and severity of symptoms experienced. Hence, the clinical experts consulted on this review highlighted that practice patterns in treatment of this metabolic disorder have been guided by case studies and case series that provide insight into improvements that been reported with triheptanoin. In particular, improvements in chronic cardiomyopathy, rhabdomyolysis, and muscle weakness have been reported in individuals.35,36 These cases provide examples of marked change with triheptanoin, particularly in young children with LC-FAODs and cardiomyopathy, who continue to experience significant morbidity and mortality despite standard treatment. The clinical experts also emphasized the importance of individualizing treatment and noted that aggregate data reported in clinical trials may not fully characterize the effects of triheptanoin in this population. However, the number of caveats associated with inferring efficacy from case reports (e.g., publication or selection bias, overinterpretation, lack of generalizability) preclude making definitive conclusions concerning the new treatment. Furthermore, these case studies fall outside of the rigorous standards of the CADTH review protocol and do not provide robust data or high-quality evidence, which are pertinent for public reimbursement decisions, in comparing triheptanoin to standard treatment.
The patient input identified the following outcomes as important: increasing energy levels, improving physical activity, improving cognitive functioning, reduced stress on organ systems, reducing hospitalizations, and improving quality of life. Different end points were measured across the 3 studies, and only LVEF, a measure of cardiac function (i.e., stress on an organ), and hospitalization due to rhabdomyolysis was measured in all of them. Thus, it is unclear whether triheptanoin would adequately address all outcomes that are important to patients.
Importantly, both Health Canada and the US FDA regulatory reviews noted that the results from Study CL201 could not be relied on to support the clinical efficacy of triheptanoin, and they focused on the Gillingham et al. (2017) trial for their decisions.5,32 Both regulatory agencies emphasized the lack of robust data to support the claim of reducing the frequency and duration of MCEs. When drawing conclusions, the uncertainty regarding benefit was accepted due to the life-threatening, serious nature of the disease, the lack of other approved treatments, and the acceptable safety profile. As a result, both regulatory agencies approved a limited nutritional support indication, specifying the use of triheptanoin as a source of calories and fatty acids in the treatment of LC-FAODs. For the purposes of this CADTH reimbursement review, it was felt that clinical events and HRQoL measures are important to determine the relative efficacy of triheptanoin and impact on patients’ lives. Thus, these were included as relevant outcomes in the review protocol. Growth and development parameters were not included in the review protocol, as they were not identified as major outcomes that would determine the use or place in therapy of triheptanoin. Functional disability and cognitive development were measured only in Study CL201, using Peabody Development Motor Scales, 2nd Edition (PDMS-2) in children under 6 years of age, and Pediatric Evaluation of Disability Inventory – Computer Adaptive Test (PEDI-CAT) in patients under 18 years of age. Growth evaluations were performed in all 3 studies, and no clinically significant physical findings, including changes to height and weight, were reported. Overall, the effect of triheptanoin on growth and development parameters in children is unclear, particularly when compared to even-chain MCT supplements.
Harms
Overall, AEs reported in the CL201, CL202, and Gillingham et al. (2017) studies were generally consistent with the known AE profile of MCTs. Complications of the underlying LC-FAODs (e.g., rhabdomyolysis) were also captured as AEs, which likely contributed to the high rates of reported TEAEs. Overall, the reported types of TEAEs were similar across studies. The most commonly reported TEAEs were rhabdomyolysis, GI-related (e.g., diarrhea, vomiting, GI upset), or acute infections (e.g., upper respiratory tract infections, other viral illnesses). Although the relation with triheptanoin is unclear, viral infections are common in the pediatric population and can trigger acute LC-FAOD metabolic crises and manifestations such as rhabdomyolysis, which was reported frequently in all 3 studies. Compared to the study by Gillingham et al. (2017), CL201 enrolled patients with severe disease and potentially higher risk of AEs.
Treatment-emergent SAEs were reported in 65.5% of patients in CL201 and 76.0% of patients in CL202; these numbers included MCEs that were also reported as SAEs. The most common SAEs were related to the underlying LC-FAOD (e.g., rhabdomyolysis) or acute infectious disease, including GI infections. The number of patients who discontinued triheptanoin treatment due to TEAEs was generally low and mainly due to GI-related AEs. Two deaths were reported in Study CL201 but were not attributed to study treatment.
Although the total number of patients who experienced at least 1 TEAE was not reported in the Gillingham et al. (2017) study, it appears that the majority of patients did experience 1 or more TEAEs, based on number of patients who reported individual AEs. There were similar frequency and type of TEAEs between the triheptanoin and trioctanoin treatment groups; however, TEAEs were not categorized by severity or seriousness. Of note, the dosage used in the Gillingham et at. (2017) study was lower than that recommended in the product monograph. This difference may have resulted in a lower incidence of some dosage-related AEs (e.g., diarrhea) compared to the other 2 studies. Furthermore, long-term tolerability of triheptanoin compared to trioctanoin is unknown, due to the limited trial duration (4 months). As a result, the safety information from Gillingham et al. (2017) can be considered supportive but may not be representative of the full AE profile of triheptanoin when used in clinical practice.
Weight gain was identified as notable harm in the CADTH review protocol; however, this was not reported as an AE in any of the 3 studies. According to growth measures collected throughout the study, there were no clinically significant changes in weight.
Conclusions
LC-FAODs are a complex group of diseases with a wide spectrum of disease manifestations and heterogenous presentations. Based on the 3 sponsor-submitted studies, current evidence does not adequately address the clinical question of whether triheptanoin improves relevant outcomes compared to the current standard of care in patients with LC-FAODs who require treatment.
The 2 single-arm, phase II, open-label trials (CL201 and CL202) appear to show a reduction in annualized rate and duration of MCEs, mainly driven by hospitalizations due to rhabdomyolysis, when comparing events that occurred during triheptanoin treatment to a retrospective pre-treatment period. The clinical experts consulted by CADTH noted that these results are clinically meaningful; however, not all patients responded favourably. Due to the significant risk of bias, potential confounding factors, and statistical uncertainty, it cannot be stated with confidence whether any benefits observed in these trials are attributable to triheptanoin treatment.
The double-blind RCT by Gillingham et al. (2017) appears to show some benefit of triheptanoin over trioctanoin, an even-chain MCT, in exercise tolerance (i.e., maximum HR on treadmill ergometry), as well as cardiac parameters (i.e., LVEF and LV mass on echocardiography). However, the relationship between the modest difference in HR and longer-term exercise tolerance is unknown, and the clinical relevance of cardiac parameter findings is difficult to determine, considering that patients had normal cardiac function at baseline. The short duration of treatment (4 months) and lower dosage of triheptanoin consumed than recommended in the product monograph further add to the limitations in generalizability of the study results to clinical practice. At this time, there is no evidence showing superiority of triheptanoin over other sources of MCTs for clinically relevant end points of mortality, morbidity (such as reduction in clinical events or hospitalization), or HRQoL. As a result, firm conclusions on the clinical benefit of triheptanoin over even-chain MCTs cannot be made.
With its odd-carbon-chain structure, triheptanoin is thought to act as an anaplerotic compound to directly address the TCA cycle deficiencies that arise in LC-FAODs, which are not addressed by even-chain MCTs.1 However, based on currently available aggregate data, it is unclear whether the advantage at the cellular level translates to definitive clinical benefit. Overall, whether triheptanoin will improve the lives of patients with LC-FAODs, compared to even-chain MCTs, has not been adequately addressed with available data. It is highly uncertain whether triheptanoin is better than the alternative MCT formulations currently available. Evidence gaps also remain for other clinical manifestations of LC-FAODs that have not been investigated — for example, retinopathy or peripheral neuropathy. The clinical experts consulted on this review emphasized the unmet need in previously undiagnosed patients who present with acute, life-threatening cardiovascular or metabolic decompensation. In these crisis situations, the experts anticipate patients will start on triheptanoin as inpatients and continue on treatment upon discharge if there is a response.
References
1.Vockley J. Long-chain fatty acid oxidation disorders and current management strategies. Am J Manag Care. 2020;26(7 Suppl):S147-s154. PubMed
2.Merritt JL, 2nd, Norris M, Kanungo S. Fatty acid oxidation disorders. Ann Transl Med. 2018;6(24):473-473. PubMed
3.Kim ES, Keam SJ. Triheptanoin in the management of long-chain fatty acid oxidation disorders: a profile of its use. Drugs and Therapy Perspectives. 2021.
4.Merritt JL, Vockley J. Overview of fatty acid oxidation disorders. In: Hahn S, ed. UpToDate. Waltham (MA): UpToDate; 2020. Accessed 2021 May 16.
5.Drug Reimbursement Review sponsor submission: Dojolvi (triheptanoin oral liquid) [internal sponsor's package]. Novato (CA): Ultragenyx Pharmaceutical Inc.; 2021 Apr.
6.Dojolvi (triheptanoin): Liquid, 100% w/w triheptanoin, oral [product monograph]. Novato(CA): Ultragenyx Pharmaceutical Inc.; 2021 Feb 12.
7.Ultragenyx Canada Inc. response to July 16 2021 DRR request for additional information regarding Dojolvi DRR review: extension data for Study CL202 [response received July 20 2021] [internal additional sponsor's information]. Vancouver (BC): Ultragenyx; 2021.
8.Clinical Study Report: UX007-CL201. An open-label phase 2 study to assess safety and clinical effects of UX007 in subjects with long-chain fatty acid oxidation disorders (LC-FAOD) [internal sponsor's report]. Novato (CA) Ultragenyx Pharmaceutical Inc.; 2019 Jun 11.
9.Clinical Study Report: UX007-CL202. An open-label long-term safety and efficacy extension study in subjects with long-chain fatty acid oxidation disorders (lc-faod) previously enrolled in UX007 or triheptanoin studies [internal sponsor's report]. Novato (CA) Ultragenyx Pharmaceutical Inc.; 2019 Jul 10.
10.Gillingham MB, Heitner SB, Martin J, et al. Triheptanoin versus trioctanoin for long-chain fatty acid oxidation disorders: a double blinded, randomized controlled trial. J Inherit Metab Dis. 2017;40(6):831-843. PubMed
11.Sinclair G, Collins S, Arbour L, Vallance H. The p.P479L variant in CPT1A is associated with infectious disease in a BC First Nation. Paediatr Child Health. 2019;24(2):e111-e115. PubMed
12.Prasad C, Johnson JP, Bonnefont JP, et al. Hepatic Carnitine Palmitoyl Transferase 1 (CPT1 A) Deficiency in North American Hutterites (Canadian and American): Evidence for a Founder Effect and Results of a Pilot Study on a DNA-Based Newborn Screening Program. Mol Genet Metab. 2001;73(1):55-63. PubMed
13.Annual Report to the Newborn Screening Ontario Advisory Council. Ottawa (ON): Newborn Screening Ontario; 2019: https://www.newbornscreening.on.ca/sites/default/files/2019_nso_annual_report_final_public.pdf. Accessed 2021 Apr 22.
14.Shirley M. Triheptanoin: First Approval. Drugs. 2020;80(15):1595-1600. PubMed
15.Natural and Non-prescription Health Products Directorate (NNHPD). Licensed Natural Health Products Database (LNHPD). Ottawa (ON): Health Canada: https://health-products.canada.ca/lnhpd-bdpsnh/search-recherche.do;jsessionid=7CF1722E40EC04C451FB9DCC8F7B64FB. Accessed 2021 Apr 22.
16.Ontario Ministry of Health and Long-Term Care. Publicly Funded Drug Programs. Inherited Metabolic Diseases Program. List of Disorders, Covered Drugs, Supplements and Specialty Foods. Effective December 2019. Accessed 22 April 2021. https://www.health.gov.on.ca/en/pro/programs/drugs/funded_drug/pdf/list_food.pdf.
17.Potter BK, Little J, Chakraborty P, et al. Variability in the clinical management of fatty acid oxidation disorders: results of a survey of Canadian metabolic physicians. J Inherit Metab Dis. 2012;35(1):115-123. PubMed
18.Spiekerkoetter U, Lindner M, Santer R, et al. Treatment recommendations in long-chain fatty acid oxidation defects: consensus from a workshop. J Inherit Metab Dis. 2009;32(4):498-505. PubMed
19.Van Calcar SC, Sowa M, Rohr F, et al. Nutrition management guideline for very-long chain acyl-CoA dehydrogenase deficiency (VLCAD): An evidence- and consensus-based approach. Mol Genet Metab. 2020;131(1-2):23-37. PubMed
20.Wilcken B. Fatty acid oxidation disorders: outcome and long-term prognosis. J Inherit Metab Dis. 2010;33(5):501-506. PubMed
21.Spiekerkoetter U, Lindner M, Santer R, et al. Management and outcome in 75 individuals with long-chain fatty acid oxidation defects: results from a workshop. J Inherit Metab Dis. 2009;32(4):488-497. PubMed
22.Ryder B, Inbar-Feigenberg M, Glamuzina E, et al. New insights into carnitine-acylcarnitine translocase deficiency from 23 cases: Management challenges and potential therapeutic approaches. J Inherit Metab Dis. 2021;26:26. PubMed
23.Norris MK, Scott AI, Sullivan S, et al. Tutorial: Triheptanoin and Nutrition Management for Treatment of Long-Chain Fatty Acid Oxidation Disorders. JPEN J Parenter Enteral Nutr. 2021;45(2):230-238. PubMed
24.Vockley J, Burton B, Berry GT, et al. Results from a 78-week, single-arm, open-label phase 2 study to evaluate UX007 in pediatric and adult patients with severe long-chain fatty acid oxidation disorders (LC-FAOD). J Inherit Metab Dis. 2019;42(1):169-177. PubMed
25.McGowan J, Sampson M, Salzwedel DM, Cogo E, Foerster V, Lefebvre C. PRESS Peer Review of Electronic Search Strategies: 2015 guideline statement. J Clin Epidemiol. 2016;75:40-46. PubMed
26.Grey matters: a practical tool for searching health-related grey literature. Ottawa (ON): CADTH; 2019: https://www.cadth.ca/grey-matters. Accessed 2021 Apr 16.
27.Vockley J, Burton B, Berry GT, et al. UX007 for the treatment of long chain-fatty acid oxidation disorders: Safety and efficacy in children and adults following 24weeks of treatment. Mol Genet Metab. 2017;120(4):370-377. PubMed
28.Vockley J, Longo N, Madden M, et al. Dietary management and major clinical events in patients with long-chain fatty acid oxidation disorders enrolled in a phase 2 triheptanoin study. Clinical Nutrition ESPEN. 2021;41:293-298. PubMed
29.Vockley J, Burton B, Berry G, et al. Effects of triheptanoin (UX007) in patients with long-chain fatty acid oxidation disorders: Results from an open-label, long-term extension study. J Inherit Metab Dis. 2021;44(1):253-263. PubMed
30.Health Canada reviewer's report_pivotal: Dojolvi (triheptanoin) [internal sponsor's report]. In: Drug Reimbursement Review sponsor submission: Dojolvi (triheptanoin oral liquid) [internal sponsor's package]. Ottawa (ON): Health Canada; 2021 Jan 20.
31.Health Canada reviewer's report_pediatric: Dojolvi (triheptanoin) [internal sponsor's report]. In: Drug Reimbursement Review sponsor submission: Dojolvi (triheptanoin oral liquid) [internal sponsor's package]. Ottawa (ON): Health Canada; 2021 Jan 24.
32.Center for Drug Evaluation Research. Integrated Review. Dojolvi (Triheptanoin) oral liquid. Company: Ultragenyx. Application No.:213687. Approval date: 06/30/2020 (FDA approval package). Silver Spring (MD): U.S. Food and Drug Administration (FDA); 2020: https://www.accessdata.fda.gov/drugsatfda_docs/nda/2020/213687Orig1s000IntegratedR.pdf. Accessed 2021 May 5.
33.Ultragenyx Canada Inc. response to May 17, 2021 DRR request for additional information regarding Dojolvi DRR review. [Response received May 25, 2021]. Vancouver (BC): Ultragenyx Canada Inc.; 2021.
34.Ultragenyx Canada Inc. response to June 1, 2021 DRR request for additional information regarding Dojolvi DRR review. [Response received June 9, 2021]. Vancouver (BC): Ultragenyx Canada Inc.; 2021.
35.Roe CR, Sweetman L, Roe DS, David F, Brunengraber H. Treatment of cardiomyopathy and rhabdomyolysis in long-chain fat oxidation disorders using an anaplerotic odd-chain triglyceride. J Clin Invest. 2002;110(2):259-269. PubMed
36.Vockley J, Charrow J, Ganesh J, et al. Triheptanoin treatment in patients with pediatric cardiomyopathy associated with long chain-fatty acid oxidation disorders. Mol Genet Metab. 2016;119(3):223-231. PubMed
37.McGavin CR, Gupta SP, McHardy GJR. Twelve-minute walking test for assessing disability in chronic bronchitis. BMJ 1976;1:822–823. PubMed
38.ATS statement: guidelines for the six-minute walk test. . Am J Respir Crit Care Med. 2002 Jul 1;166(1):111-117. PubMed
39.Redelmeier DA, Bayoumi AM, Goldstein RS, Guyatt GH. Interpreting small differences in functional status: The six minute walk test in chronic lung disease patients. Am J Respir Crit Care Med 1997;155:1278–1282. 1997;155:1278–1282.
40.O’Keeffe ST, Lye M, Donnnellan C, Carmichael DN. Reproducibility and responsiveness of quality of life assessment and six minute walk test in elderly heart failure patients. Heart. 1998;80:377-382. PubMed
41.Ware J, Kosinski M, Keller S. A 12-item short-form health survey: construction of scales and preliminary tests of reliability and validity. Medical Care. 1996;34(3):220-233. PubMed
42.Díaz-Arribas MJ, Fernández-Serrano M, Royuela A, et al. Minimal Clinically Important Difference in Quality of Life for Patients With Low Back Pain. Spine (Phila Pa 1976). 2017;42(24):1908-1916. PubMed
43.Cooper K. A means of assessing maximal oxygen intake. Correlation between field and treadmill testing. J Am Med Assoc. 1968;203:135. PubMed
44.Katch FI. Optimal Duration of Endurance Performance on the Cycle Ergometer in Relation to Maximal Oxygen Intake. Ergonomics. 1973;16(2):227-235. PubMed
45.Guyatt GH, Pugsley SO, Sullivan MJ, al. e. Effect of encouragement on walking test performance. Thorax. 1984;39(11):818-822. PubMed
46.Priesnitz CV, Rodrigues GH, Stumpf CS, Viapiana G, Cabral CP, Stein RT, et al. Reference values for the 6-min walk test in healthy children aged 6-12 years. Pediatr Pulmonol. 2009 Dec;44(12):1174-9. PubMed
47.Ben Saad H, Prefaut C, Missaoui R, Mohamed IH, Tabka Z, Hayot M. Reference equation for 6-min walk distance in healthy North African children 6-16 years old. Pediatr Pulmonol. 2009 Apr;44(4):316-24. PubMed
48.Saris-Baglama, RN, DeRosa, MA, Raczek, AE, Bjorner, JB, and Ware, JE. 2006. “Development, validation, and norming of the SF-10 for Children Health Survey.” Quality of Life Research 15 (S1):A-145.
49.Short-form 10 for Children 2020 Oct 20: https://hsrr.nlm.nih.gov/hsrr_search/record_details/1736. Accessed 2021 Apr 21.
Appendix 1: Literature Search Strategy
Note that this appendix has not been copy-edited.
Clinical Literature Search
Overview
Interface: Ovid
Databases:
MEDLINE All (1946-present)
Embase (1974-present)
Note: Subject headings and search fields have been customized for each database. Duplicates between databases were removed in Ovid.
Date of search: February 26, 2021
Alerts: Weekly search updates until project completion
Study types: None applied.
Limits:
Publication date limit: None used
Humans
Language limit: None used
Conference abstracts: Excluded
Syntax | Description |
|---|---|
/ | At the end of a phrase, searches the phrase as a subject heading |
MeSH | Medical Subject Heading |
.fs | Floating subheading |
exp | Explode a subject heading |
* | Before a word, indicates that the marked subject heading is a primary topic; or, after a word, a truncation symbol (wildcard) to retrieve plurals or varying endings |
# | Truncation symbol for 1 character |
? | Truncation symbol for 1 or no characters only |
adj# | Requires terms to be adjacent to each other within # number of words (in any order) |
.ti | Title |
.ot | Original title |
.ab | Abstract |
.hw | Heading word; usually includes subject headings and controlled vocabulary |
.kf | Author keyword heading word (MEDLINE) |
.kw | Author keyword (Embase); |
.dq | Candidate term word (Embase) |
.pt | Publication type |
.mp | Mapped term |
.rn | Registry number |
.nm | Name of substance word (MEDLINE) |
.yr | Publication year |
.jw | Journal title word (MEDLINE) |
.jx | Journal title word (Embase) |
freq=# | Requires terms to occur # number of times in the specified fields |
medall | Ovid database code: MEDLINE All, 1946 to present, updated daily |
oemezd | Ovid database code; Embase, 1974 to present, updated daily |
cctr | Ovid database code; Cochrane Central Register of Controlled Trials |
Multi-Database Strategy
triheptanoin/ (182)
(triheptanoin* or dojolvi* or ux007 or "ux 007" or 2P6O7CFW5K).ti,ab,rn,ot,nm,kf. (315)
(dermofeel tc7 or glycerol trienanthate or glycerol triheptanoate or glycerol trionanthate or glyceryl trienanthate or glyceryl triheptanoate or glyceryl trionanthate or lanol 37t or lanol37t or EC-210-647-2 or EINECS 210-647-2 or BRN 1807724 or BRN1807724 or radiamuls 2375 or radiamuls2375 or trienanthoin or triheptanoic glyceride or triheptylin or trioenanthoin or glyceroltriheptanoinate).ti,ab,kf,ot,rn,nm. (13)
1 or 2 or 3 (327)
4 use medall (106)
*triheptanoin/ (97)
(triheptanoin* or dojolvi* or ux007 or "ux 007").ti,ab,dq,kw. (262)
(dermofeel tc7 or glycerol trienanthate or glycerol triheptanoate or glycerol trionanthate or glyceryl trienanthate or glyceryl triheptanoate or glyceryl trionanthate or lanol 37t or lanol37t or EC-210-647-2 or EINECS 210-647-2 or BRN 1807724 or BRN1807724 or radiamuls 2375 or radiamuls2375 or trienanthoin or triheptanoic glyceride or triheptylin or trioenanthoin or glyceroltriheptanoinate).ti,ab,kw,dq. (13)
6 or 7 or 8 (276)
9 use oemezd (174)
5 or 10 (280)
conference abstract.pt. (4,080,457)
conference review.pt. (12,930)
12 or 13 (4,093,387)
11 not 14 (217)
remove duplicates from 15 (120)
Clinical Trials Registries
ClinicalTrials.gov
Produced by the US National Library of Medicine. Targeted search used to capture registered clinical trials.
[Search – dojolvi/triheptanoin]
WHO ICTRP
International Clinical Trials Registry Platform, produced by the World Health Organization. Targeted search used to capture registered clinical trials.
[Search terms -- (dojolvi/triheptanoin)]
Health Canada’s Clinical Trials Database
Produced by Health Canada. Targeted search used to capture registered clinical trials.
[Search terms -- (dojolvi/triheptanoin)]
EU Clinical Trials Register
European Union Clinical Trials Register, produced by the European Union. Targeted search used to capture registered clinical trials.
[Search terms -- (dojolvi/triheptanoin)]
Grey Literature
Search dates: April 21, 2021
Keywords: [(dojolvi/triheptanoin) / long-chain fatty acid oxidation disorders]
Limits: Publication years: None used
Updated: Regulatory sections of search updated 3 weeks prior to the CADTH Canadian Drug Expert Committee meeting
Relevant websites from the following sections of the CADTH grey literature checklist Grey Matters: A Practical Tool For Searching Health-Related Grey Literature were searched:
Health Technology Assessment Agencies
Health Economics
Clinical Practice Guidelines
Drug and Device Regulatory Approvals
Advisories and Warnings
Drug Class Reviews
Clinical Trials Registries
Databases (free)
Health Statistics
Internet Search
Appendix 2: Excluded Studies
Note this appendix has not been copy-edited.
Reference | Reason for exclusion |
|---|---|
ZOGGELER, T., et al. Long-term experience with triheptanoin in 12 Austrian patients with long-chain fatty acid oxidation disorders. Orphanet Journal of Rare Diseases 2021 16(1):28. VOCKLEY, J., et al. Dietary management and major clinical events in patients with long-chain fatty acid oxidation disorders enrolled in a phase II triheptanoin study. Clinical Nutrition ESPEN 2021 41(293-298. VOCKLEY, J., et al. Effects of triheptanoin (UX007) in patients with long-chain fatty acid oxidation disorders: Results from an open-label, long-term extension study. Journal of Inherited Metabolic Disease 2021 44(1):253-263. RYDER, B., et al. New insights into carnitine-acylcarnitine translocase deficiency from 23 cases: Management challenges and potential therapeutic approaches. Journal of Inherited Metabolic Disease 2021 26(26. NORRIS, M. K., et al. Tutorial: Triheptanoin and Nutrition Management for Treatment of Long-Chain Fatty Acid Oxidation Disorders. JPEN: Journal of Parenteral and Enteral Nutrition 2021 45(2):230-238. GUFFON, N., et al. Clinical outcomes in a series of 18 patients with long chain fatty acids oxidation disorders treated with triheptanoin for a median duration of 22 months. Molecular Genetics and Metabolism 2021 132(4):227-233. VOCKLEY, J., et al. Results from a 78-week, single-arm, open-label phase II study to evaluate UX007 in pediatric and adult patients with severe long-chain fatty acid oxidation disorders (LC-FAOD). Journal of Inherited Metabolic Disease 2019 42(1):169-177. MAHAPATRA, S., et al. Triheptanoin: A Rescue Therapy for Cardiogenic Shock in Carnitine-acylcarnitine Translocase Deficiency. Jimd Reports 2018 39(19-23. VOCKLEY, J., et al. UX007 for the treatment of long chain-fatty acid oxidation disorders: Safety and efficacy in children and adults following 24weeks of treatment. Molecular Genetics and Metabolism 2017 120(4):370-377. GILLINGHAM, M. B., et al. Triheptanoin versus trioctanoin for long-chain fatty acid oxidation disorders: a double blinded, randomized controlled trial. Journal of Inherited Metabolic Disease 2017 40(6):831-843. VOCKLEY, J., et al. Triheptanoin treatment in patients with pediatric cardiomyopathy associated with long chain fatty acid oxidation disorders. Molecular Genetics and Metabolism 2016 119(3):223-231. VOCKLEY, J., et al. Long-term major clinical outcomes in patients with long chain fatty acid oxidation disorders before and after transition to triheptanoin treatment--A retrospective chart review. Molecular Genetics and Metabolism 2015 116(1-2):53-60. ROE, C. R., et al. Anaplerotic treatment of long-chain fat oxidation disorders with triheptanoin: Review of 15 years Experience. Molecular Genetics and Metabolism 2015 116(4):260-8. | Study Design |
ROE, C. R., et al. Carnitine palmitoyltransferase II deficiency: successful anaplerotic diet therapy. Neurology 2008 71(4):260-4. ROE, C. R., et al. Treatment of cardiomyopathy and rhabdomyolysis in long-chain fat oxidation disorders using an anaplerotic odd-chain triglyceride. Journal of Clinical Investigation 2002 110(2):259-69. | Study Design |
KIM, E. S., et al. Triheptanoin in the management of long-chain fatty acid oxidation disorders: a profile of its use. Drugs and Therapy Perspectives. 2021. WEHBE, Z., et al. Therapeutic potential of triheptanoin in metabolic and neurodegenerative diseases. Journal of Inherited Metabolic Disease 2020 43(3):385-391. SKLIROU, E., et al. Physiological Perspectives on the Use of Triheptanoin as Anaplerotic Therapy for Long Chain Fatty Acid Oxidation Disorders. Frontiers in Genetics 2020 11(598760. SHIRLEY, M. Triheptanoin: First Approval. Drugs 2020 80(15):1595-1600. | Review |
ZAND, D., et al. Regulatory news: Dojolvi (triheptanoin) as a source of calories and fatty acids in long-chain fatty acid oxidation disorders: FDA approval summary. Journal of Inherited Metabolic Disease 2021 17(17. SHOFFNER, J. M. Concerning "Triheptanoin vs trioctanoin for long-chain fatty acid oxidation disorders: A double blinded, randomized controlled trial" by Gillingham et al. Journal of Inherited Metabolic Disease 2019 42(3):394-395. GILLINGHAM, M. B., et al. Response to Letter to the editor. Journal of Inherited Metabolic Disease 2019 42(3):396-397. | Commentary / Editorial / Letter |
SHIRLEY, M. Correction to: Triheptanoin: First Approval. Drugs 2020 80(17):1873. VOCKLEY, J., et al. Corrigendum to 'Long-term major clinical outcomes in patients with long chain fatty acid oxidation disorders before and after transition to triheptanoin treatment-A retrospective chart review', Molecular Genetics and Metabolism (2015) 53-60. Molecular Genetics and Metabolism 2015 116(3):221. | Correction / Corrigendum |
VOCKLEY, J., et al. Results from a 78-week, single-arm, open-label phase II study to evaluate UX007 in pediatric and adult patients with severe long-chain fatty acid oxidation disorders (LC-FAOD). Journal of Inherited Metabolic Disease 2018 1-8. | Duplicate |
LEE, S. K., et al. The Pharmacokinetics of Triheptanoin and Its Metabolites in Healthy Subjects and Patients With Long-Chain Fatty Acid Oxidation Disorders. Clinical Pharmacology in Drug Development 2021 31(31. | Outcomes not of interest |
Appendix 3: Detailed Outcome Data
Note this appendix has not been copy-edited.
Figure 7: Major Clinical Events in All Patients in Study CL201
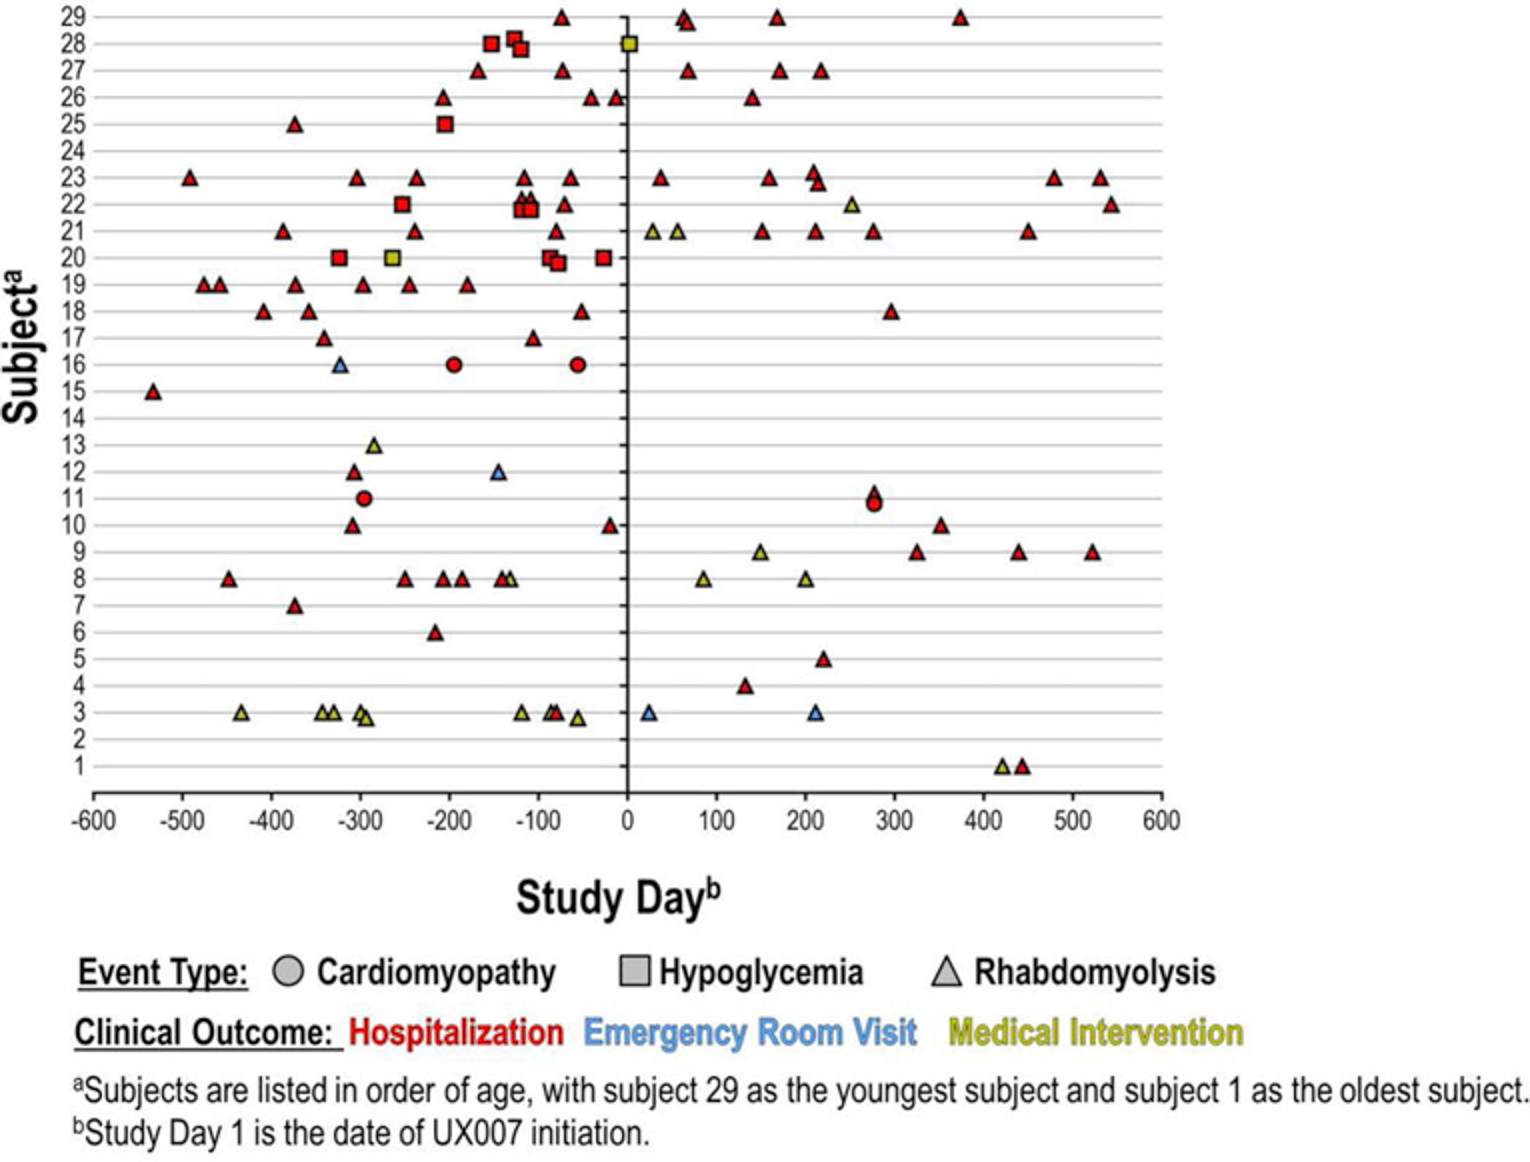
UX007 = triheptanoin.
Note: The patients are presented on the Y-axis in order of age with individual events shown on the X-axis. The vertical line represents the day of triheptanoin initiation, with pre-triheptanoin time (78 weeks) on the left and triheptanoin time (78 weeks) on the right.
Source: Vockley J, Burton B, Berry GT, et al. Results from a 78-week, single-arm, open-label phase II study to evaluate UX007 in pediatric and adult patients with severe long-chain fatty acid oxidation disorders (LC-FAOD). J Inherit Metab Dis. 2019;42(1):169-177. Reprinted in accordance with CC BY-NC 4.0. (https://creativecommons.org/licenses/by/4.0/).
Figure 8: Individualized Patient Annualized Event and Event Days in Study CL201 — Full Analysis Set

UX007 = triheptanoin.
Note: Coloured lines represent individual subject responses. All 29 patients are depicted. Annualized event days was originally referred to as annualized duration rate in the study protocol and statistical analysis plan.
Source: Vockley J, Burton B, Berry GT, et al. Results from a 78-week, single-arm, open-label phase II study to evaluate UX007 in pediatric and adult patients with severe long-chain fatty acid oxidation disorders (LC-FAOD). J Inherit Metab Dis. 2019;42(1):169-177. Reprinted in accordance with CC BY-NC 4.0. (https://creativecommons.org/licenses/by/4.0/).
Table 36: Event Details of Major Clinical Events Pre- and Post-Triheptanoin in Study CL201 — Full Analysis Set
Major clinical events | Pre-triheptanoin (78-week retrospective period) N = 29 | Triheptanoin (78-week treatment) N = 29 |
|---|---|---|
Time on study, years | ||
Mean (SD) | 1.44 (0.165) | 1.34 (0.479) |
Median (IQR) | 1.50 (1.50 to 1.50) | 1.51 (1.48 to 1.55) |
Total major clinical events (all event subtypes) | ||
Event occurrence | ||
Total number of eventsa | 70 | 39 |
Total patients experiencing ≥ 1 event, n (%) | 22 (75.9) | 16 (55.2) |
Total patients with zero events, n (%) | 7 (24.1) | 13 (44.8) |
Difference in % of patients with zero events | 20.7 | |
Total Number of Events per Individual | ||
Mean (SD) | 2.414 (2.3832) | 1.345 (1.7582) |
Median (IQR) | 2.000 (1.000 to 3.000) | 1.000 (0.000 to 2.000) |
P valueb | NR | |
Total Event Days per Individual | ||
Mean (SD) | 8.310 (8.3585) | 4.552 (6.1736) |
Median (IQR) | 6.000 (1.000 to 13.000) | 2.000 (0.000 to 7.000) |
P valueb | NR | |
Major rhabdomyolysis event | ||
Event occurrence | ||
Total number of events | 55 | 37 |
Total patients experiencing ≥ 1 event, n (%) | 19 (65.5) | 15 (51.7) |
Total patients with zero events, n (%) | 10 (34.5) | 14 (48.3) |
Total Number of Events per Individual | ||
Mean (SD) | 1.897 (2.2574) | 1.276 (1.7707) |
Median (IQR) | 1.000 (0.000 to 3.000) | 1.000 (0.000 to 2.000) |
P valueb | NR | |
Total Event Days per Individual | ||
Mean (SD) | 5.690 (6.4482) | 4.276 (5.9456) |
Median (IQR) | 4.000 (0.000 to 9.000) | 2.000 (0.000 to 7.000) |
P valueb | NR | |
Major hypoglycemia events | ||
Event occurrence | ||
Total number of events | 12 | 1 |
Total patients experiencing ≥ 1 event, n (%) | 4 (13.8) | 1 (3.4) |
Total patients with zero events, n (%) | 25 (86.2) | 28 (96.6) |
Total Number of Events per Individual | ||
Mean (SD) | 0.414 (1.1807) | 0.034 (0.1857) |
Median (IQR) | 0.000 (0.000 to 0.000) | 0.000 (0.000 to 0.000) |
P valueb | NR | |
Total Event Days per Individual | ||
Mean (SD) | 1.724 (4.7801) | 0.034 (0.1857) |
Median (IQR) | 0.000 (0.000 to 0.000) | 0.000 (0.000 to 0.000) |
P valueb | NR | |
Cardiomyopathy events | ||
Event occurrence | ||
Total number of events | 3 | 1 |
Total patients experiencing ≥ 1 event, n (%) | 2 (6.9) | 1 (3.4) |
Total patients with zero events, n (%) | 27 (93.1) | 28 (96.6) |
Total Number of Events per Individual | ||
Mean (SD) | 0.103 (0.4093) | 0.034 (0.1857) |
Median (IQR) | 0.000 (0.000 to 0.000) | 0.000 (0.000 to 0.000) |
P valueb | NR | |
Total Event Days per Individual | ||
Mean (SD) | 0.897 (3.6090) | 0.241 (1.2999) |
Median (IQR) | 0.000 (0.000 to 0.000) | 0.000 (0.000 to 0.000) |
P valueb | NR | |
IQR = interquartile range; NR = not reported; SD = standard deviation.
Note: Major clinical events included rhabdomyolysis, hypoglycemia, and cardiomyopathy events caused by LC-FAOD, resulting in any hospitalization, ED or acute care visits, or emergency interventions. The Pre- triheptanoin period is 18 months prior to triheptanoin initiation. If a patient’s age was less than 18 month at triheptanoin initiation, the pre-triheptanoin period was between the birth date and the day before triheptanoin initiation. The triheptanoin treatment period is between the triheptanoin initiation date and completion date or the early termination date, whichever is earlier. Time on study is the duration of each subject being observed for MCE data collection in each period.
aFour MCEs during the pre-triheptanoin period were excluded from the analysis due to missing dates.
bP value calculated using a paired t-test. Analyses were not adjusted for multiple testing (i.e., the type I error rate had not been controlled).
Source: Source: CL201 Clinical Study Report8
Table 37: Annualized Major Clinical Event During Period 1 in Study CL202 — Full Analysis Set
Major clinical events | Overall population N = 75 | CL201 rollover N = 24 | Triheptanoin naive N = 20 | IST/other N = 31 |
|---|---|---|---|---|
Total major clinical events (all event subtypes) | ||||
Annualized event rate (events per year) | ||||
Mean (SD) | 3.22 (14.183) | 1.24 (1.738) | 7.61 (27.081) | 1.92 (3.413) |
Median (IQR) | 0.65 (0 to 2.07) | 0.21 (0 to 1.96) | 0.56 (0 to 1.49) | 0.67 (0 to 2.14) |
Annualized event days (days per year) | ||||
Mean (SD) | 15.96 (53.004) | 14.21 (48.807) | 28.63 (85.258) | 9.13 (18.500) |
Median (IQR) | 2.00 (0 to 7.38) | 0.84 (0 to 7.35) | 1.18 (0 to 5.86) | 3.18 (0 to 7.48) |
Rhabdomyolysis events | ||||
Annualized event rate (events per year) | ||||
Mean (SD) | 3.13 (14.181) | 1.13 (1.588) | 7.60 (27.086) | 1.81 (3.338) |
Median (IQR) | 0.65 (0 to 1.95) | 0.21 (0 to 1.76) | 0.56 (0 to1.49) | 0.67 (0 to 2.14) |
Annualized event days (days per year) | ||||
Mean (SD) | 15.01 (52.409) | 13.28 (48.730) | 28.61 (85.264) | 7.58 (12.944) |
Median (IQR) | 2.00 (0 to 7.36) | 0.84 (0 to 7.35) | 1.18 (0 to5.86) | 3.18 (0 to 7.38) |
Hypoglycemia events | ||||
Annualized event rate (events per year) | ||||
Mean (SD) | 0 (0.037) | 0 (0, 0) | 0 (0, 0) | 0.01 (0.057) |
Median (IQR) | 0 (0, 0) | 0 (0 to 0) | 0 (0 to 0) | 0 (0 to 0) |
Annualized event days (days per year) | ||||
Mean (SD) | 0 (0.037) | 0 (0, 0) | 0 (0, 0) | 0.01 (0.057) |
Median (IQR) | 0 (0 to 0) | 0 (0 to 0) | 0 (0 to 0) | 0 (0 to 0) |
Cardiomyopathy events | ||||
Annualized event rate (events per year) | ||||
Mean (SD) | 0.08 (0.431) | 0.12 (0.414) | 0.02 (0.076) | 0.10 (0.566) |
Median (IQR) | 0 (0 to 0) | 0 (0 to 0) | 0 (0 to 0) | 0 (0 to 0) |
Annualized event days (days per year) | ||||
Mean (SD) | 0.94 (5.771) | 0.93 (3.156) | 0.02 (0.076) | 1.54 (8.577) |
Median (IQR) | 0 (0 to 0) | 0 (0 to 0) | 0 (0 to 0) | 0 (0 to 0) |
IST = investigator-sponsored trial; IQR = interquartile range; SD = standard deviation
Note: As of the data cut-off date of June 1, 2018, the 75 patients in the overall population had a mean duration of study participation of approximately 26 months. For individual treatment groups: the IST/other cohort (N = 31) had the longest duration of study participation (mean of 34.7 months), the CL201 rollover cohort (N = 24) had a mean duration of study participation of 23.0 months, and the triheptanoin-naive cohort (N = 20) of 15.7 months.
Source: CL202 Clinical Study Report9
Table 38: Event Details of Major Clinical Events Pre- and Post-Triheptanoin in the CL201 Rollover Cohort in Study CL202 — Full Analysis Set
Major clinical events | Pre-triheptanoin (18-month retrospective period) N = 24 | Triheptanoin (36-month treatment) N = 24 |
|---|---|---|
Time on study, years | ||
Mean (SD) | 1.43 (0.178) | 2.92(0.277) |
Median (IQR) | 1.50 (1.50 to 1.50) | 3.00 (3.00 to 3.00) |
Duration ≥ 18 months, n (%) | 20 (83.3) | 24 (100.0) |
Duration ≥ 36 months, n (%) | NA | 22 (91.7) |
Total major clinical events (all event subtypes) | ||
Event occurrence | ||
Total number of events | 60 | 67 |
Total patients experiencing ≥ 1 event, n (%) | 18 (75.0) | 17 (70.8) |
Total patients with zero events, n (%) | 6 (25.0) | 7 (29.2) |
Major rhabdomyolysis event | ||
Event occurrence | ||
Total number of events | 45 | 62 |
Total patients experiencing ≥ 1 event, n (%) | 15 (62.5) | 16 (66.7) |
Total patients with zero events, n (%) | 9 (37.5) | 8 (33.3) |
Major hypoglycemia events | ||
Event occurrence | ||
Total number of events | 12 | 1 |
Total patients experiencing ≥ 1 event, n (%) | 4 (16.7) | 1 (4.2) |
Total patients with zero events, n (%) | 20 (83.3) | 23 (95.8) |
Cardiomyopathy events | ||
Event occurrence | ||
Total number of events | 3 | 4 |
Total patients experiencing ≥ 1 event, n (%) | 2 (8.3) | 2 (8.3) |
Total patients with zero events, n (%) | 22 (91.7) | 22 (91.7) |
IQR = interquartile range; NA = not applicable; SD = standard deviation
Note: Pre-triheptanoin period comprises the 18 months preceding triheptanoin initiation (or from birth to triheptanoin initiation for infants) during the retrospective period. UX triheptanoin 007 treatment period comprises the first 36 months following triheptanoin initiation during the combined CL201/CL202 study period (or from triheptanoin initiation to discontinuation for subjects who discontinued).
Source: CL202 Clinical Study Report9
Table 39: Event Details of Major Clinical Events Pre- and Post-Triheptanoin in the Triheptanoin-Naive Cohort in Study CL202 — Full Analysis Set
Major clinical events | Pre-triheptanoin (18-month retrospective period) N = 20 | Triheptanoin (18-month treatment) N = 20 |
|---|---|---|
Time on study, years | ||
Mean (SD) | 1.35 (0.377) | 0.98 (0.548) |
Median (IQR) | 1.50 (1.50 to 1.50) | 1.21 (0.50 to 1.50) |
Duration ≥ 18 months, n (%) | 17 (85.0) | 7 (35.0) |
Total major clinical events (all event subtypes) | ||
Event occurrence | ||
Total number of events | 84 | 27 |
Total patients experiencing ≥ 1 event, n (%) | 16 (80.0) | 12 (60.0) |
Total patients with zero events, n (%) | 4 (20.0) | 8 (40.0) |
Major rhabdomyolysis event | ||
Event occurrence | ||
Total number of events | 79 | 26 |
Total patients experiencing ≥ 1 event, n (%) | 14 (70.0) | 11 (55.0) |
Total patients with zero events, n (%) | 6 (30.0) | 9 (45.0) |
Major hypoglycemia events | ||
Event occurrence | ||
Total number of events | 2 | 0 |
Total patients experiencing ≥ 1 event, n (%) | 2 (10.0) | 0 (0.0) |
Total patients with zero events, n (%) | 18 (90.0) | 20 (100.0) |
Cardiomyopathy events | ||
Event occurrence | ||
Total number of events | 3 | 1 |
Total patients experiencing ≥ 1 event, n (%) | 2 (10.0) | 1 (5.0) |
Total patients with zero events, n (%) | 18 (90.0) | 19 (95.0) |
IQR = interquartile range; SD = standard deviation.
Note: Pre-triheptanoin period comprises the 18 months preceding triheptanoin initiation (or from birth to triheptanoin initiation for infants) during the retrospective period. Triheptanoin treatment period is the first 18 months following triheptanoin initiation during the CL202 study period (or from triheptanoin initiation to discontinuation for subjects who discontinued).
Source: CL202 Clinical Study Report9
Table 40: Subgroup Analysis of Annualized Total Major Clinical Events by Age at Triheptanoin Initiation in Study CL201 — Full Analysis Set
Major clinical events | Pre-triheptanoin (78-week retrospective period) N = 29 | Triheptanoin (78-week treatment) N = 29 |
|---|---|---|
< 6 years | ||
n | 15 | 15 |
Annualized event rate (events per year) | ||
Mean (SD) | 2.244 (1.2626) | 1.045 (1.4077) |
Median (IQR) | 2.000 (1.333 to 3.333) | 0.652 (0.000 to 2.007) |
Annualized event days (days per year) | ||
Mean (SD) | 9.170 (6.5115) | 3.472 (4.7931) |
Median (IQR) | 7.998 (4.328 to 12.664) | 0.659 (0.000 to 6.690) |
6 to < 18 years | ||
n | 8 | 8 |
Annualized event rate (events per year) | ||
Mean (SD) | 1.083 (1.2814) | 0.716 (0.9310) |
Median (IQR) | 0.667 (0.333, 1.333 | 0.333 (0.000 to 1.241) |
Annualized event days (days per year) | ||
Mean (SD) | 2.833 (3.0178) | 2.708 (3.5853) |
Median (IQR) | 2.000 (0.333 to 4.666) | 0.622 (0.000 to 5.876) |
≥ 18 years | ||
n | 6 | 6 |
Annualized event rate (events per year) | ||
Mean (SD) | 1.111 (2.4093) | 0.673 (0.6042) |
Median (IQR) | 0.000 (0.000 to 0.667) | 0.669 (0.000 to 1.314) |
Annualized event days (days per year) | ||
Mean (SD) | 2.111 (3.3304) | 2.035 (2.0427) |
Median (IQR) | 0.000 (0.000 to 5.332) | 1.648 (0.000 to 4.066) |
IQR = interquartile range; SD = standard deviation.
Note: The pre-triheptanoin period is 18 months prior to triheptanoin initiation. If a patient’s age was less than 18 month at triheptanoin initiation, the pre-triheptanoin period was between the birth date and the day before triheptanoin initiation. The triheptanoin treatment period is between the triheptanoin initiation date and completion date or the early termination date, whichever is earlier.
Source: Source: CL201 Clinical Study Report8
Table 41: Subgroup Analysis of Annualized Total Major Clinical Events by Age at Triheptanoin Initiation in the CL201 Rollover Cohort in Study CL202 — Full Analysis Set
Major clinical events | Pre-triheptanoin (18-month retrospective period) N = 24 | Triheptanoin (36-month treatment) N = 24 |
|---|---|---|
< 6 years | ||
n | 14 | 14 |
Annualized event rate (events per year) | ||
Mean (SD) | 2.12 (1.209) | 1.05 (1.280) |
Median (IQR) | 2.00 (1.33 to 3.20) | 0.50 (0.00 to 1.67) |
Annualized event days (days per year) | ||
Mean (SD) | 8.96 (6.701) | 3.90 (4.777) |
Median (IQR) | 7.00 (4.32 to 12.66) | 1.83 (0.00 to 6.00) |
6 to < 18 years | ||
n | 5 | 5 |
Annualized event rate (events per year) | ||
Mean (SD) | 1.33 (1.563) | 1.05 (0.942) |
Median (IQR) | 0.67 (0.67 to 1.33) | 1.00 (0.33 to 1.58) |
Annualized event days (days per year) | ||
Mean (SD) | 3.73 (3.546) | 14.96 (23.395) |
Median (IQR) | 4.00 (0.67 to 5.3) | 1.67 (1.00 to 17.33) |
≥ 18 years | ||
n | 5 | 5 |
Annualized event rate (events per year) | ||
Mean (SD) | 1.20 (2.683) | 0.60 (0.641) |
Median (IQR) | 0.00 (0.00 to 0.00) | 0.33 (0.33 to 0.67) |
Annualized event days (days per year) | ||
Mean (SD) | 1.47 (3.279) | 1.87 (1.502) |
Median (IQR) | 0.00 (0.00 to 0.00) | 2.00 (1.00 to 2.33) |
IQR = interquartile range; SD = standard deviation.
Note: Pre-triheptanoin period comprises the 18 months preceding triheptanoin initiation (or from birth to triheptanoin initiation for infants) during the retrospective period (study period 3). Triheptanoin treatment period comprises the first 36 months following triheptanoin initiation during the combined CL201/CL202 study period (study period 2), or from triheptanoin initiation to discontinuation for subjects who discontinued.
Source: CL202 Clinical Study Report.9
Table 42: Subgroup Analysis of Annualized Total Major Clinical Events by Age at Triheptanoin Initiation in the Triheptanoin-Naive Cohort in Study CL202 — Full Analysis Set
Major clinical events | Pre-triheptanoin (18-month retrospective period) N = 20 | Triheptanoin (18-month treatment) N = 20 |
|---|---|---|
< 6 years | ||
n | 9 | 9 |
Annualized event rate (events per year) | ||
Mean (SD) | 2.04 (2.310) | 13.98 (40.420) |
Median (IQR) | 1.33 (0.00 to 3.65) | 0.00 (0.00 to 1.33) |
Annualized event days (days per year) | ||
Mean (SD) | 19.18 (33.668) | 42.11 (121.199) |
Median (IQR) | 6.61 (0.00 to19.33) | 0.00 (0.00 to 4.00) |
6 to < 18 years | ||
n | 7 | 7 |
Annualized event rate (events per year) | ||
Mean (SD) | 3.81 (3.705) | 1.28 (1.472) |
Median (IQR) | 2.67 (2.00 to 4.00) | 0.91 (0.00 to 1.79) |
Annualized event days (days per year) | ||
Mean (SD) | 13.71 (7.520) | 5.32 (8.451) |
Median (IQR) | 12.66 (7.33 to 18.66) | 1.33 (0.00 to 7.16) |
≥ 18 years | ||
n | 4 | 4 |
Annualized event rate (events per year) | ||
Mean (SD) | 3.50 (3.327) | 4.89 (7.026) |
Median (IQR) | 3.00 (1.33 to 5.67) | 2.21 (0.33 to 9.45) |
Annualized event days (days per year) | ||
Mean (SD) | 27.16 (44.798) | 40.38 (68.112) |
Median (IQR) | 7.33 (1.67 to 52.66) | 9.78 (1.33 to 79.42) |
IQR = interquartile range; SD = standard deviation.
Note: Pre-triheptanoin period comprises the 18 months preceding triheptanoin initiation (or from birth to triheptanoin initiation for infants) during the retrospective period (study period 3). Triheptanoin treatment period is the first 18 months following triheptanoin initiation during the CL202 study period (study period 1), or from triheptanoin initiation to discontinuation for subjects who discontinued.
Source: CL202 Clinical Study Report9
Table 43: Subgroup Analysis of Annualized Total Major Clinical Events by LC-FAOD Subtype in Study CL201 — Full Analysis Set
Major clinical events | Pre-triheptanoin (78-week retrospective period) N = 29 | Triheptanoin (78-week treatment) N = 29 |
|---|---|---|
LCHAD | ||
n | 10 | 10 |
Annualized event rate (events per year) | ||
Mean (SD) | 1.931 (1.5263) | 0.851 (1.2559) |
Median (IQR) | 1.865 (0.667 to 3.333) | 0.334 (0.000 to 1.311) |
Annualized event days (days per year) | ||
Mean (SD) | 7.148 (7.5249) | 3.210 (4.6913) |
Median (IQR) | 6.163 (0.667 to 10.500) | 1.335 (0.000 to 4.066) |
VLCAD | ||
n | 12 | 12 |
Annualized event rate (events per year) | ||
Mean (SD) | 1.934 (1.9915) | 1.038 (1.2025) |
Median (IQR) | 1.666 (0.000, 3.606) | 0.660 (0.000 to 1.350) |
Annualized event days (days per year) | ||
Mean (SD) | 5.473 (6.1194) | 2.415 (2.9502) |
Median (IQR) | 4.666 (0.000 to 7.998) | 1.279 (0.000 to 4.056) |
CPT II | ||
n | 4 | 4 |
Annualized event rate (events per year) | ||
Mean (SD) | 0.953 (0.8411) | 0.641 (1.2816) |
Median (IQR) | 0.906 (0.333 to 1.572) | 0.000 (0.000 to 1.282) |
Annualized event days (days per year) | ||
Mean (SD) | 5.930 (5.1932) | 2.884 (5.7671) |
Median (IQR) | 5.529 (2.666 to 9.194) | 0.000 (0.000 to 5.767) |
TFP | ||
n | 3 | 3 |
Annualized event rate (events per year) | ||
Mean (SD) | 0.889 (0.3848) | 0.635 (0.6197) |
Median (IQR) | 0.667 (0.667. 1.333) | 0.667 (0.000 to 1.238) |
Annualized event days (days per year) | ||
Mean (SD) | 3.999 (1.3330) | 4.444 (4.3377) |
Median (IQR) | 3.999 (2.666, 5.332) | 4.666 (0.000, 8.667) |
CPTII = carnitine palmitoyltransferase II; IQR = interquartile range; LCHAD=long-chain 3-hydroxy-acyl-coA dehydrogenase; SD = standard deviation; TFP = trifunctional protein; VLCAD = very long-chain acyl-CoA dehydrogenase.
Note: The Pre- triheptanoin period is 18 months prior to triheptanoin initiation. If a patient’s age was less than 18 month at triheptanoin initiation, the pre-triheptanoin period was between the birth date and the day before triheptanoin initiation. The triheptanoin treatment period is between the triheptanoin initiation date and completion date or the early termination date, whichever is earlier.
Source: Source: CL201 Clinical Study Report8
Table 44: Subgroup Analysis of Annualized Total Major Clinical Events by LC-FAOD Subtype in the CL201 Rollover Cohort in Study CL202 — Full Analysis Set
Major clinical events | Pre-triheptanoin (18-month retrospective period) N = 24 | Triheptanoin (36-month treatment) N = 24 |
|---|---|---|
LCHAD | ||
n | 9 | 9 |
Annualized event rate (events per year) | ||
Mean (SD) | 1.997 (1.6035) | 1.000 (1.4716) |
Median (IQR) | 2.000 (0.667 to 3.333) | 0.333 (0.000 to 1.000) |
Annualized event days (days per year) | ||
Mean (SD) | 7.717 (7.7469) | 3.592 (4.8316) |
Median (IQR) | 7.998 (0.667 to 10.478) | 1.666 (0.000 to 4.999) |
VLCAD | ||
n | 9 | 9 |
Annualized event rate (events per year) | ||
Mean (SD) | 2.059 (2.0569) | 0.96 (0.772) |
Median (IQR) | 2.000 (0.000 to 3.204) | 0.667 (0.333 to 1.666) |
Annualized event days (days per year) | ||
Mean (SD) | 5.735 (6.3732) | 3.147 (3.7449) |
Median (IQR) | 5.332 (0.000 to 7.332) | 2.333 (1.000 to 3.999) |
CPT II | ||
n | 3 | 3 |
Annualized event rate (events per year) | ||
Mean (SD) | 1.047 (1.0031) | 0.444 (0.7696) |
Median (IQR) | 1.141 (0.000 to 2.000) | 0.000 (0.000 to 1.333) |
Annualized event days (days per year) | ||
Mean (SD) | 6.124 (6.3422) | 2.000 (3.4633) |
Median (IQR) | 5.707 (0.000, 12.664) | 0.000 (0.000 to 5.999) |
TFP | ||
n | 3 | 3 |
Annualized event rate (events per year) | ||
Mean (SD) | 0.889 (0.3848) | 1.305 (1.1907) |
Median (IQR) | 0.667 (0.667 to 1.333) | 1.581 (0.000 to 2.333) |
Annualized event days (days per year) | ||
Mean (SD) | 3.999 (1.3330) | 24.048 (28.0177) |
Median (IQR) | 3.999 (2.666 to 5.332) | 17.329 (0.000 to 54.814) |
CPTII = carnitine palmitoyltransferase II; IQR = interquartile range; LCHAD=long-chain 3-hydroxy-acyl-coA dehydrogenase; SD = standard deviation; TFP = trifunctional protein; VLCAD = very long-chain acyl-CoA dehydrogenase.
Note: Pre-triheptanoin period comprises the 18 months preceding triheptanoin initiation (or from birth to triheptanoin initiation for infants) during the retrospective period (study period 3). Triheptanoin treatment period comprises the first 36 months following triheptanoin initiation during the combined CL201 and CL202 study period (study period 2), or from triheptanoin initiation to discontinuation for subjects who discontinued.
Source: CL202 Clinical Study Report9
Table 45: Subgroup Analysis of Annualized Total Major Clinical Events by LC-FAOD Subtype in the Triheptanoin-Naive Cohort in Study CL202 — Full Analysis Set
Major clinical events | Pre-triheptanoin (18-month retrospective period) N = 20 | Triheptanoin (18-month treatment) N = 20 |
|---|---|---|
LCHAD | ||
n | 6 | 6 |
Annualized event rate (events per year) | ||
Mean (SD) | 4.332 (2.7882) | 23.885 (48.2655) |
Median (IQR) | 3.999 (3.333 to 6.665) | 2.878 (0.667 to 15.140) |
Annualized event days (days per year) | ||
Mean (SD) | 27.660 (33.4820) | 88.459 (146.2367) |
Median (IQR) | 18.996 (11.331 to 22.661) | 11.450 (0.667 to 141.937) |
VLCAD | ||
n | 6 | 6 |
Annualized event rate (events per year) | ||
Mean (SD) | 3.444 (4.2452) | 1.433 (1.4745) |
Median (IQR) | 2.000 (1.333 to 2.666) | 1.122 (0.752 to 1.333) |
Annualized event days (days per year) | ||
Mean (SD) | 10.886 (8.8991) | 6.190 (8.6577) |
Median (IQR) | 6.998 (5.999, 14.663) | 3.878 (1.333 to 4.554) |
CPT II | ||
n | 2 | 2 |
Annualized event rate (events per year) | ||
Mean (SD) | 3.159 (0.6975) | 0.000 (0.0000) |
Median (IQR) | 3.159 (2.666 to 3.653) | 0.000 (0.000 to 0.000) |
Annualized event days (days per year) | ||
Mean (SD) | 60.626 (64.0587) | 0.000 (0.0000) |
Median (IQR) | 60.626 (15.330 to 105.923) | 0.000 (0.000 to 0.000) |
TFP | ||
n | 3 | 3 |
Annualized event rate (events per year) | ||
Mean (SD) | 0.667 (1.1544) | 0.597 (1.0337) |
Median (IQR) | 0.000 (0.000 to 2.000) | 0.000 (0.000 to 1.790) |
Annualized event days (days per year) | ||
Mean (SD) | 2.888 (5.0026) | 2.387 (4.1348) |
Median (IQR) | 0.000 (0.000 to 8.665) | 0.000 (0.000 to 7.162) |
CPTII = carnitine palmitoyltransferase II; IQR = interquartile range; LCHAD=long-chain 3-hydroxy-acyl-coA dehydrogenase; SD = standard deviation; TFP = trifunctional protein; VLCAD = very long-chain acyl-CoA dehydrogenase.
Note: Pre-triheptanoin period comprises the 18 months preceding triheptanoin initiation (or from birth to triheptanoin initiation for infants) during the retrospective period (study period 3). Triheptanoin treatment period is the first 18 months following triheptanoin initiation during the CL202 study period (study period 1), or from triheptanoin initiation to discontinuation for subjects who discontinued.
Source: CL202 Clinical Study Report.9
Table 46: Event Details of Hospitalization for Major Clinical Events in Study CL201 — Full Analysis Set
Major clinical events | Pre-triheptanoin (78-week retrospective period) n = 29 | Triheptanoin (78-week treatment) N = 29 |
|---|---|---|
Time on study, years | ||
Mean (SD) | 1.44 (0.165) | 1.34 (0.479) |
Median (IQR) | 1.50 (1.50 to 1.50) | 1.51 (1.48 to 1.55) |
Hospitalizations for major clinical events (all event types) | ||
Event occurrence | ||
Number of hospitalizations | 57 | 29 |
Total patients experiencing ≥ 1 event, n (%) | 21 (72.4) | 13 (44.8) |
Total patients with zero events, n (%) | 8 (27.6) | 16 (55.2) |
Total number of events per Individual | ||
Mean (SD) | 1.966 (1.9545) | 1.000 (1.5584) |
Median (IQR) | 1.000 (0.000 to 3.000) | 0.00 (0.000 to 1.000) |
Total event days per Individual | ||
Mean (SD) | 7.862 (8.3740) | 4.207 (6.1318) |
Median (IQR) | 6.000 (0.000 to 12.000) | 0.000 (0.000 to 6.000) |
Hospitalizations for rhabdomyolysis events | ||
Event occurrence | ||
Number of hospitalizations due to rhabdomyolysis | 43 | 28 |
Total patients experiencing ≥ 1 event, n (%) | 17 (58.6) | 13 (44.8) |
Total patients with zero events, n (%) | 12 (41.4) | 16 (55.2) |
Total number of events per Individual | ||
Mean (SD) | 1.483 (1.7652) | 0.966 (1.5465) |
Median (IQR) | 1.000 (0.000 to 2.000) | 0.000 (0.000 to 1.000) |
Total event days per Individual | ||
Mean (SD) | 5.276 (6.4137) | 3.966 (5.8644) |
Median (IQR) | 3.000 (0.000 to 8.000) | 0.000 (0.000 to 6.000) |
Hospitalizations for hypoglycemia events | ||
Event occurrence | ||
Number of hospitalizations due to hypoglycemia | 11 | 0 |
Total patients experiencing ≥ 1 event, n (%) | 4 (13.8) | 0 (0) |
Total patients with zero events, n (%) | 25 (86.2) | 29 (100) |
Total number of events per Individual | ||
Mean (SD) | 0.379 (1.0493) | 0.000 (0.0000) |
Median (IQR) | 0.000 (0.000 to 0.000) | 0.000 (0.000 to 0.000) |
Total event days per Individual | ||
Mean (SD) | 1.690 (4.7064) | 0.000 (0.0000) |
Median (IQR) | 0.000 (0.000, 0.000) | 0.000 (0.000 to 0.000) |
Hospitalizations for cardiac events | ||
Event occurrence | ||
Number of hospitalizations due to cardiac events | 3 | 1 |
Total patients experiencing ≥ 1 event, n (%) | 2 (6.9) | 1 (3.4) |
Total patients with zero events, n (%) | 27 (93.1) | 28 (96.6) |
Total number of events per Individual | ||
Mean (SD) | 0.103 (0.4093) | 0.034 (0.1857) |
Median (IQR) | 0.000 (0.000 to 0.000) | 0.000 (0.000 to 0.000) |
Total event days per Individual | ||
Mean (SD) | 0.897 (3.6090) | 0.241 (1.2999) |
Median (IQR) | 0.000 (0.000 to 0.000) | 0.000 (0.000 to 0.000) |
NR = not reported; SD = standard deviation.
Note: Major clinical events included rhabdomyolysis, hypoglycemia, and cardiomyopathy events caused by LC-FAOD, resulting in any hospitalization, ED or acute care visits, or emergency interventions. The Pre- triheptanoin period is 18 months prior to triheptanoin initiation. If a patient’s age was less than 18 month at triheptanoin initiation, the pre-triheptanoin period was between the birth date and the day before triheptanoin initiation. The triheptanoin treatment period is between the triheptanoin initiation date and completion date or the early termination date, whichever is earlier. Time on study is the duration of each subject being observed for MCE data collection in each period.
Source: CL201 Clinical Study Report8
Table 47: Annualized Hospitalization for Major Clinical Events During Period 1 in Study CL202 — Full Analysis Set
Major clinical events | Overall population N = 75 | CL201 rollover N = 24 | Triheptanoin naive N = 20 | IST/other N = 31 |
|---|---|---|---|---|
Hospitalization for total major clinical events (all event subtypes) | ||||
Annualized event rate (events per year) | ||||
Mean (SD) | 2.881 (14.1044) | 1.049 (1.6238) | 7.533 (27.1025) | 1.299 (1.9420) |
Median (IQR) | 0.417 (0.000 to 1.599) | 0.000 (0.000 to 1.565) | 0.185 (0.000 to 1.491) | 0.649 (0.000 to 1.599) |
Annualized event days (days per year) | ||||
Mean (SD) | 15.616 (52.9171) | 14.015 (48.8334) | 28.551 (85.2852) | 8.510 (17.5095) |
Median (IQR) | 1.974 (0.000 to 6.892) | 0.000 (0.000 to 6.336) | 0.742 (0.000 to 5.858) | 2.370 (0.000 to 6.892) |
Hospitalization for rhabdomyolysis events | ||||
Annualized event rate (events per year) | ||||
Mean (SD) | 2.809 (14.1041) | 0.933(1.4718) | 7.533 (27.1025) | 1.215(1.8672) |
Median (IQR) | 0.417 (0.000 to 1.574) | 0.000 (0.000 to 1.565) | 0.185 (0.000 to 1.491) | 0.649 (0.000 to 1.574) |
Annualized event days (days per year) | ||||
Mean (SD) | 14.689 (52.3382) | 13.086 (48.7611) | 28.551 (85.2852) | 6.986(11.6617) |
Median (IQR) | 1.974 (0.000 to 365.250) | 0.000 (0.000 to 6.336) | 0.742 (0.000 to 5.858) | 2.370 (0.000 to 6.892) |
Hospitalization for hypoglycemia events | ||||
Annualized event rate (events per year) | ||||
Mean (SD) | 0.000 (0.0000) | 0.000 (0.0000) | 0.000 (0.0000) | 0.000 (0.0000) |
Median (IQR) | 0.000 (0.000 to 0.000) | 0.000 (0.000 to 0.000) | 0.000 (0.000 to 0.000) | 0.000 (0.000 to 0.000) |
Annualized event days (days per year) | ||||
Mean (SD) | 0.000 (0.0000) | 0.000 (0.0000) | 0.000 (0.0000) | 0.000 (0.0000) |
Median (IQR) | 0.000 (0.000 to 0.000) | 0.000 (0.000 to 0.000) | 0.000 (0.000 to 0.000) | 0.000 (0.000 to 0.000) |
Hospitalization for cardiomyopathy events | ||||
Annualized event rate (events per year) | ||||
Mean (SD) | 0.072 (0.3812) | 0.116 (0.4137) | 0.000 (0.0000) | 0.085 (0.4713) |
Median (IQR) | 0.000 (0.000 to 0.000) | 0.000 (0.000 to 0.000) | 0.000 (0.000 to 0.000) | 0.000 (0.000 to 0.000) |
Annualized event days (days per year) | ||||
Mean (SD) | 0.927 (5.7140) | 0.929 (3.1562) | 0.000 (0.0000) | 1.524 (8.4829) |
Median (IQR) | 0.000 (0.000 to 0.000) | 0.000 (0.000 to 0.000) | 0.000 (0.000 to 0.000) | 0.000 (0.000 to 0.000) |
IST = investigator-sponsored trial; IQR = interquartile range; SD = standard deviation
Source: CL202 Clinical Study Report9
Table 48: Event Details of Hospitalization for Major Clinical Events During Period 1 of CL202 — Full Analysis Set
Major clinical events | Overall population N = 75 | CL201 rollover N = 24 | Triheptanoin naive N = 20 | IST/other N = 31 |
|---|---|---|---|---|
Time on study, days | ||||
Mean (SD) | 790.1 (336.07) | 703.0 (180.53) | 477.6 (350.93) | 1,059.2 (172.09) |
Median (Range) | 792.0 (3 to 1,271) | 739.5 (147 to 974) | 442.5 (3 to 1,071) | 1 to114.0 (554 to 1,271) |
Hospitalization for total major clinical events (all event subtypes) | ||||
Event occurrence | ||||
Total number of events | 188 | 44 | 23 | 121 |
Total patients experiencing ≥ 1 event, n | 43 | 11 | 10 | 22 |
Hospitalization for rhabdomyolysis events | ||||
Event occurrence | ||||
Total number of events | 177 | 38 | 23 | 116 |
Total patients experiencing ≥ 1 event, n | 43 | 11 | 10 | 22 |
Hospitalization for hypoglycemia events | ||||
Event occurrence | ||||
Total number of events | 0 | 0 | 0 | 0 |
Total patients experiencing ≥ 1 event, n | 0 | 0 | 0 | 0 |
Hospitalization for cardiomyopathy events | ||||
Event occurrence | ||||
Total number of events | 11 | 6 | 0 | 5 |
Total patients experiencing ≥ 1 event, n | 3 | 2 | 0 | 1 |
IST = investigator-sponsored trial; IQR = interquartile range; SD = standard deviation.
Source: CL202 Clinical Study Report.9
Table 49: Event Details of Hospitalization for Major Clinical Events Pre- and Post-Triheptanoin in the CL201 Rollover Cohort in Study CL202 — Full Analysis Set
Major clinical events | Pre-triheptanoin (18-month retrospective period) N = 24 | Triheptanoin (36-month treatment) N = 24 |
|---|---|---|
Time on study, years | ||
Mean (SD) | 1.43 (0.178) | 2.92 (0.277) |
Median (IQR) | 1.50 (1.50. 1.50) | 3.00 (3.00 to 3.00) |
Duration ≥ 18 months, n (%) | 20 (83.3) | 24 (100.0) |
Duration ≥ 36 months, n (%) | NA | 22 (91.7) |
Hospitalization for total major clinical events (all event subtypes) | ||
Event occurrence | ||
Total number of events | 48 | 53 |
Total patients experiencing ≥ 1 event, n (%) | 17 (70.8) | 15 (62.5) |
Total patients with zero events, n (%) | 7 (29.2) | 9 (37.5) |
Hospitalization for major rhabdomyolysis event | ||
Event occurrence | ||
Total number of events | 34 | 49 |
Total patients experiencing ≥ 1 event, n (%) | 13 (54.2) | 15 (62.5) |
Total patients with zero events, n (%) | 11 (45.8) | 9 (37.5) |
Hospitalization for major hypoglycemia events | ||
Event occurrence | ||
Total number of events | 11 | 0 |
Total patients experiencing ≥ 1 event, n (%) | 4 (16.7) | 0 (0.0) |
Total patients with zero events, n (%) | 20 (83.3) | 24 (100.0) |
Hospitalization for cardiomyopathy events | ||
Event occurrence | ||
Total number of events | 3 | 4 |
Total patients experiencing ≥ 1 event, n (%) | 2 (8.3) | 2 (8.3) |
Total patients with zero events, n (%) | 22 (91.7) | 22 (91.7) |
IQR = interquartile range; SD = standard deviation
Note: Pre-triheptanoin period comprises the 18 months preceding triheptanoin initiation (or from birth to triheptanoin initiation for infants) during the retrospective period (study period 3). Triheptanoin treatment period comprises the first 36 months following triheptanoin initiation during the combined CL201/CL202 study period (study period 2), or from triheptanoin initiation to discontinuation for subjects who discontinued.
Source: CL202 Clinical Study Report9
Table 50: Event Details of Hospitalization for Major Clinical Events Pre- and Post-Triheptanoin in the Triheptanoin-Naive Cohort in Study CL202 — Full Analysis Set
Major clinical events | Pre-triheptanoin (18-month retrospective period) N = 20 | Triheptanoin (18-month treatment) N = 20 |
|---|---|---|
Time on study (year) | ||
Mean (SD) | 1.35 (0.377) | 0.98 (0.548) |
Median (IQR) | 1.50 (1.50 to 1.50) | 1.21 (0.50 to 1.50) |
Duration ≥ 18 months, n (%) | 17 (85.0) | 7 (35.0) |
Hospitalization for total major clinical events (all event subtypes) | ||
Event occurrence | ||
Total number of events | 64 | 23 |
Total patients experiencing ≥ 1 event, n (%) | 16 (80.0) | 10 (50.0) |
Total patients with zero events, n (%) | 4 (20.0) | 10 (50.0) |
Hospitalization for major rhabdomyolysis event | ||
Event occurrence | ||
Total number of events | 59 | 23 |
Total patients experiencing ≥ 1 event, n (%) | 14 (70.0) | 10 (50.0) |
Total patients with zero events, n (%) | 6 (30.0) | 10 (50.0) |
Hospitalization for hypoglycemia events | ||
Event occurrence | ||
Total number of events | 2 | 0 |
Total patients experiencing ≥ 1 event, n (%) | 2 (10.0) | 0 (0.0) |
Total patients with zero events, n (%) | 18 (90.0) | 20 (100.0) |
Hospitalization for cardiomyopathy events | ||
Event occurrence | ||
Total number of events | 3 | 0 |
Total patients experiencing ≥ 1 event, n (%) | 2 (10.0) | 0 (0.0) |
Total patients with zero events, n (%) | 18 (90.0) | 20 (100.0) |
IQR = interquartile range; SD = standard deviation
Note: Pre-triheptanoin period comprises the 18 months preceding triheptanoin initiation (or from birth to triheptanoin initiation for infants) during the retrospective period (study period 3). Triheptanoin treatment period is the first 18 months following triheptanoin initiation during the CL202 study period (study period 1), or from triheptanoin initiation to discontinuation for subjects who discontinued.
Source: CL202 Clinical Study Report9
Table 51: Emergency Department Visits for Major Clinical Events During Period 1 of Study CL202 — Full Analysis Set
ED visits | Overall population N = 75 | CL201 rollover N = 24 | Triheptanoin-naive N = 20 | IST/other N = 31 |
|---|---|---|---|---|
ED visits for total major clinical events (all event subtypes) | ||||
Event occurrence | ||||
Total number of events | 16 | 4 | 2 | 10 |
Total patients experiencing ≥ 1 event, n | 8 | 2 | 1 | 5 |
ED visits for rhabdomyolysis events | ||||
Event occurrence | ||||
Total number of events | 16 | 4 | 2 | 10 |
Total patients experiencing ≥ 1 event, n | 8 | 2 | 1 | 5 |
ED visits for hypoglycemia events | ||||
Event occurrence | ||||
Total number of events | 0 | 0 | 0 | 0 |
Total patients experiencing ≥ 1 event, n | 0 | 0 | 0 | 0 |
ED visits for cardiomyopathy events | ||||
Event occurrence | ||||
Total number of events | 0 | 0 | 0 | 0 |
Total patients experiencing ≥ 1 event, n | 0 | 0 | 0 | 0 |
ED = emergency department; IST = investigator-sponsored trial; IQR = interquartile range; SD = standard deviation
Source: CL202 Clinical Study Report9
Appendix 4: Description and Appraisal of Outcome Measures
Note this appendix has not been copy-edited.
Aim
To describe the following outcome measures and review their measurement properties (validity, reliability, responsiveness to change, and MID):
12-minute and Six-minute walk tests (12MWT and 6MWT)
12-item.version 2 and 10-item Short Form Health Survey (SF-12v2 and SF-10)
Findings
Table 52: Summary of Outcome Measures and Their Measurement Properties
Outcome measure | Type | Conclusions about Measurement Properties | MID |
|---|---|---|---|
12-Minute Walk Test (12MWT) | A supervised test that measures the distance a patient can walk on a hard flat surface over a 12-minute period. | The 12MWT is a commonly used test to evaluate global function of organ systems involved in exercise, namely the heart, lungs, peripheral circulation, blood, nervous system, muscles, bones, and joints, during walking, a self-paced activity. Validity information has been briefly described in patients with bronchitis37 No validity information was identified in patients with LC-FAOD. | No MID information was identified in the patients with LC-FAOD |
Six-Minute Walk Test (6MWT) | A supervised test that measures the distance a patient can walk on a hard flat surface over a 6-minute period. | The 6MWT is a commonly used test to evaluate global function of organ systems involved in exercise, namely the heart, lungs, peripheral circulation, blood, nervous system, muscles, bones, and joints, during walking, a self-paced activity Validity information has been described in patients with COPD and patients with heart failure.38-40 No validity information was identified in patients with LC-FAOD. | 43 metres for patients with heart failure.40 No MID information was identified in the patients with LC-FAOD |
12-item Short Form Health Survey, version 2 (SF-12 v.2) | Patient-reported measure of HRQoL based on a 4-week recall period. 12-item version of the Short Form Health Survey composed of 8 concepts belonging to either the PCS or MCS. The PCS and MCS range from 0 to 100, where higher scores indicate better HRQoL. | Validity and reliability have been demonstrated in a diverse population.41,42 No literature was identified that assessed the SF-12 for validity, reliability, or responsiveness in patients with LC-FAOD. | Not identified in populations with LC-FAOD. |
10-item Short Form Health Survey (SF-10) | Patient-reported measure of HRQoL based on a 4-week recall period.8 | No literature was identified that assessed the SF-10 for validity, reliability, or responsiveness in patients with LC-FAOD. | Not identified in population with LC-FAOD |
COPD = chronic obstructive pulmonary disease; HRQoL = health-related quality of life; LC-FAOD = MCS = mental component summary; MID = minimal important difference; PCS = physical component summary; SF-10 = Short Form (10) Health Survey; SF-12 v.2 = Short Form (12) Health Survey, version 2.
12MWT and 6MWT
Walk tests were originally developed to primarily evaluate cardiopulmonary function in cardiac and pulmonary conditions (e.g., chronic obstructive pulmonary disease [COPD], heart failure, pulmonary hypertension), but studies have been performed to validate these tests in musculoskeletal conditions such as fibromyalgia.38 A 12-minute test was originally described by Cooper (1968)43 as a guide to physical fitness. In this study, Cooper et al.43 reported a close relation in healthy young men between the distance in 12 -minute running and the maximum oxygen uptake measured on a treadmill. Later, Cooper published tables relating to oxygen consumption, fitness, and 12-minute distance in both sexes over a range of ages.37 McGavine et al.37 described the 12MWT and indicated that 12MWT provided useful objective information about exercise tolerance in chronic bronchitis.37 It was indicated that the distance in 12MWT was a reproducible measure of effort tolerance in patients with chronic bronchitis. The advantage of the walk test was that the test requires no apparatus and was applicable to patients with disease of all grades of severity. Unlike exercise on a bicycle ergometer or treadmill, the walk test is very simple and is familiar to all patients. In addition, the patient can choose and adjust their own pace throughout the test, pausing for rest if necessary.37 12MWT in other studies been shown to be an appropriate length of time to test oxygen uptake and endurance.44
The 6-minute walk test (6MWT) is also a supervised test that measures the distance a patient can walk on a hard flat surface over a 6-minute period, whereas the 12MWT prolongs the evaluation to 12 minutes.38 The American Thoracic Society (ATS) provides guidelines for standardization of this test in order to maximize reliability.38 Walk tests aim to evaluate global function of organ systems involved in exercise, namely the heart, lungs, peripheral circulation, blood, nervous system, muscles, bones, and joints, during walking, a self-paced activity.8,38
Key limitations of these walk tests, especially in pediatric patients, include: a learning effect with repeated testing; confounding effect of patient motivation, encouragement and cooperation; and impact of age, height, and weight on walk distance.38 The learning effect could result in performance and detection bias (i.e., false-positive apparent benefits) when evaluating an intervention using these walk tests in a non-blinded, uncontrolled study. Additionally, differences in patient motivation, encouragement and cooperation between assessments can impact walking distance by a similar magnitude as the effect of interventions,45 which can produce substantial variability and be a source of performance bias in a non-blinded, uncontrolled study. Finally, previous studies have identified that age, height and weight impact distance travelled in 6 minutes,46,47 which may affect 6MWT results obtained from trials of longer duration.
Patients with LC-FAOD have shown physiological deficit.8 A literature search was conducted to identify validation studies of the 12MWT and 6MWT in patients with LC-FAOD; none were identified.
No MID has been identified or proposed in LC-FAOD. 6MWT MIDs for distances reported for other conditions such as COPD (54 m)38,39 and heart failure (43 m)38,40 do not necessarily generalize to LC-FAOD given key differences between patient populations.
12-Item Short Form Health Survey, Version 2 (SF-12 v.2)
The 12-item Short Form Health Survey (SF-12) is a generic, patient-reported measure of HRQoL based on the 36-item version of the survey (SF-36). Patients answer based on a 4-week recall period. Each item falls into 1 of 8 health scales, including:
physical functioning (PF), 2 items
role physical (RP), 2 items
bodily pain (BP), 1 item
general health (GH), 1 item
vitality (VT), 1 item
social functioning (SF), 1 item
role emotional (RE), 2 items
and mental health (MH), 2 items.41
The “physical functioning” scale assesses the extent to which daily life is affected, “role physical” measures limitations in roles due to problems with physical health, “bodily pain” measures the frequency of pain and how much pain interferes with normal functioning, “general health” measures the patient’s perception of their overall health, “vitality” assesses fatigue and energy levels, “social functioning” measures how much a patient’s illness affects social functioning, “role emotional” assesses role limitation due to emotional issues, and “mental health” assesses psychological distress.41 The first 4 scales (PF, RP, BP, and GH) make up the PCS, while the latter 4 (VT, SF, RE, and MH) fall under the MCS. The PCS and MCS correspond to the physical and psychological burden of disease, respectively. The component summaries are standardized to have a mean of 50 and SD of 10 based on the general US population and higher scores reflect better HRQoL.41
Test-retest reliability of the SF-12 summary scores have been demonstrated in the general US and UK populations with coefficients of 0.890 and 0.864, respectively, for the PCS, and 0.760 and 0.774 for the MCS.41 Discriminant validity was demonstrated for groups known to differ in physical and mental conditions, and cross-validation was assessed between the SF-12 and SF-36 with correlations of 0.951 and 0.969 for the PCS and MCS, respectively. No literature was identified that assessed the SF-12 for validity, reliability, or responsiveness in patients with LC-FAOD.
MIDs for the SF-12 PCS and MCS have been estimated based on a study of 458 patients with lower back pain.42 The 4 methods used to calculate the MID included the minimum detectable change (MDC), average change (AC), change difference (CD), and receiver operating characteristic curve (ROC) which allowed for calculation of the area under the curve. MID estimates ranged from 0.56 to 3.29 based on the MDC and CD methods, respectively, for the PCS. The MID for the MCS was suggested to range from 1.13 to 3.77 based on the CD and MDC methods, respectively. Overall, the authors suggested that an improvement of at least 3.29 on the PCS and 3.77 on the MCS would be clinically meaningful to patients with low back pain.42 No MID was identified in populations with LC-FAOD.
10-Item Short Form Health Survey (SF-10)
The Medical Outcomes Study 10-item Short Form Health Survey (SF-10) is a generic questionnaire completed by caregivers (such as a child’s parent or guardian), and designed to assess generic HRQoL in healthy and ill pediatric populations.8,48,49 The SF-10 was designed for being used in patients aged 5-17 years.8,9,48,49 The SF-10 uses a 4-week recall period. Responses are used to generate 2 component summary scores: PHS and PSS. Higher global scores are associated with better quality of life. The validity information of SF-10 was briefly reported in 2 groups of parents or guardians of children aged 5-18 with or without chronic conditions or disability.48 It was reported that the internal consistence was satisfactory (PHS, alpha=0.70; PSS, alpha=0.78).48 As with SF-12 v.2, SF-10 utilizes norm-based scoring with a mean = 50 and SD = 10; higher scores reflect better health.8,9 In the included 2 pivotal studies,8,9 the t score-based scoring was used to score the SF-10 Health Survey for Children summary scales. The SF-10 survey can be easily completed in various settings (such as at medical clinics, at home, and at school) and can be administered as a mail-in form or telephone or face-to-face interviews. The brevity of the SF-10 makes it an ideal survey for use in pediatric populations.49 However, no validity information was identified for patients with LC-FAOD.
Appendix 5: Study CL202 Final Analysis Summary
Note this appendix has not been copy-edited.
As part of the sponsor’s feedback on this CADTH reimbursement review report, CADTH received a summary of updated analysis for certain outcomes in Study CL202 from the sponsor. Due to the brief and selective nature of the provided information, CADTH could not use the summary to update all the relevant CL202 interim data and is unable to provide critical appraisal of the updated analysis. The additional results are included in Appendix 5; these results have not been assessed by CADTH.7
CL202 is a prospective study of the long-term efficacy and safety of triheptanoin in children and adults with LC-FAOD. Subjects who completed CL201 could continue treatment in the ongoing, long-term phase II Study CL202 to gain additional data on the sustainability of treatment effect. In addition to enrolling the CL201 rollover subjects, the CL202 study also enrolled new subjects who had no prior exposure to triheptanoin who continued to elicit clinical manifestations of LC-FAOD despite current management (triheptanoin-naive cohort). For the triheptanoin-naive cohort, collection of retrospective MCE data allowed for a within-patient comparison to the pre-triheptanoin period, similar to the conduct of CL201, and allowed for the opportunity to verify the prior findings in a new group of subjects. In all subjects, Study CL202 evaluated the frequency and duration of acute metabolic crises (evaluated as MCEs).
Study CL202 enrolled |||||||||| patients in the triheptanoin-naive cohort with 1 patient excluded from the analysis, as the patient withdrew from the study after only 1 day of treatment. The efficacy of triheptanoin in the naive cohort was assessed based on the frequency and duration of MCEs over an average of |||||||| months of treatment (range from ||||| to ||||| months), compared to retrospective chart review for the 18 months period prior. MCEs included rhabdomyolysis, hypoglycemia, and cardiomyopathy events, resulting in any hospitalization, visit to the ED or acute care, or emergency intervention.
In the triheptanoin-naive cohort, a total of ||||| MCEs were reported of which ||||||| events (|||||) led to hospitalization. During the |||| month triheptanoin treatment period, total MCEs of ||||| events were reported with ||||| events (|||||%) leading to hospitalization.
The median annualized event rate was reduced by |||||% and the median annualized event days reduced by |||||% (Table 53). The median annualized event rate of MCE hospitalizations was reduced by |||||% (from ||||| events/year to ||||| events/year). The median total duration of hospitalization days resulting from MCEs in a year, averaged across all years and all patients, were reduced by |||||% (from ||||| days/year to ||||| days/year).
Table 53: Median Change in MCE Annualized Event Rate in the Triheptanoin-Naive Cohort in Study CL202
|||||||||||||||||||||||||||||||||||| | ||||||||||||| | ||||||||||||| | ||||||||||||| | ||||||||||||| |
|---|---|---|---|---|
|||||||||||||||||||||||||| | ||||||||||||| | ||||||||||||| | ||||||||||||| | ||||||||||||| |
|||||||||||||||||||||||||| | ||||||||||||| | ||||||||||||| | ||||||||||||| | ||||||||||||| |
Source: Additional new data provided by the sponsor.7
For subjects in the Study CL201 rollover cohort, the efficacy of triheptanoin was assessed over an integrated CL201 and CL202 triheptanoin treatment period, an average of ||||| months (range from ||||| to ||||| months), compared to the 18 months prior to triheptanoin treatment.
Within the 18 months prior to treatment with triheptanoin, a total of ||||| MCEs were reported of which ||||| events (|||||%) led to hospitalization. During the ||||||| to ||||||| months triheptanoin period, a total of ||||| MCEs were reported with ||||| events (|||||%) leading to hospitalization. The median annualized event rate was reduced by |||||% and the median annualized event days reduced by |||||% during the ||||| to ||||| months triheptanoin treatment period treatment in CL201 subjects (Table 54).
The median number of clinical events leading to hospitalization that took place in a year was reduced by |||||% (from ||||| events/year to ||||| events/year). The median total duration of hospitalization days resulting from MCEs in a year, averaged across all years and all patients, were reduced by |||||% (from ||||| days/year to ||||| days/year).
Table 54: Change in MCE Annualized Event Rate — CL201 and CL202 Combined Analysis
|||||||||||||||||||||||||||||||||||| | ||||||||||||| | ||||||||||||| | ||||||||||||| | ||||||||||||| |
|---|---|---|---|---|
|||||||||||||||||||||||||| | ||||||||||||| | ||||||||||||| | ||||||||||||| | ||||||||||||| |
|||||||||||||||||||||||||| | ||||||||||||| | ||||||||||||| | ||||||||||||| | ||||||||||||| |
Source: Additional new data provided by the sponsor.7
The final results of Study CL202 for the CL201 rollover cohort, with a minimum exposure to treatment with triheptanoin of ||||| month and a maximum of ||||| months, demonstrated that the effect of triheptanoin was significant and maintained with longer exposure. In addition, the results of the s cohort in Study CL202, with a minimum exposure to treatment with triheptanoin of ||||| months and a maximum of ||||| months and N = ||||| patients (N = 20 were previously reported) demonstrated that the effect of triheptanoin was significant, maintained with long exposure, and consistent with those of Study CL201.
Pharmacoeconomic Review
Abbreviations
DCI
caloric intake
ICER
incremental cost-effectiveness ratio
LC-FAOD
long-chain fatty acid oxidation disorder
LY
life-year
MCE
major clinical event
MCS
mental component summary
MCT
medium-chain triglyceride
PCS
physical component summary
PHS
physical health summary
PSS
psychosocial health summary
QALY
quality-adjusted life-year
SF-10
Short Form (10) Health Survey
SF-12
Short Form (12) Health Survey
SoC
standard of care
w/w
weight per weight
Executive Summary
The executive summary comprises 2 tables (Table 1 and Table 2) and a conclusion.
Item | Description |
|---|---|
Drug product | Triheptanoin (Dojolvi), liquid oral solution |
Submitted price | Triheptanoin, 500 mL bottle: $6,365.00 |
Indication | As a source of calories and fatty acids for the treatment of adult and pediatric patients with long-chain fatty acid oxidation disorders (LC-FAODs) |
Health Canada approval status | NOC |
Health Canada review pathway | Priority review |
NOC date | February 15, 2021 |
Reimbursement request | As per indication |
Sponsor | Ultragenyx Canada Inc. |
Submission history | Previously reviewed: No |
LC-FAOD = long-chain fatty acid oxidation disorder; NOC = Notice of Compliance.
Table 2: Summary of Economic Evaluation
Component | Description |
|---|---|
Type of economic evaluation | Cost-utility analysis Markov model |
Target population | Patients exhibiting serious clinical manifestations of LC-FAODs despite current management |
Treatment | Triheptanoin |
Comparator | Standard of care consisting of over-the-counter medium-chain triglyceride oil |
Perspective | Canadian publicly funded health care payer |
Outcomes | QALYs, LYs |
Time horizon | Lifetime (97 years) |
Key data source |
|
Submitted results | ICER = $1,014,013 per QALY for triheptanoin vs. SoC (incremental QALYs: 4.98; incremental costs: $5,462,581) |
Key limitations |
|
CADTH reanalysis results | CADTH made one change for the revised base case that involved deriving utility values solely from the SF-12 measure. In the paper cited by the sponsor, the SF-12 alone (not the SF-10) was the only health-related quality of life measure used for mapping to the EQ-5D. In the CADTH base case, the ICER for triheptanoin was $1,347,825 per QALY compared with SoC; the probability of triheptanoin being cost-effective at a WTP threshold of $50,000 per QALY was 0%. A price reduction of 96% would be required for triheptanoin to be cost-effective at this threshold. Scenario analyses were performed to assess the other aspects of uncertainty, particularly as they related to health state utilities, treatment discontinuation, triheptanoin dosage, and treatment adherence. The scenario with the largest impact on the ICER involved equating health state utilities to address clinical uncertainty, which led to an ICER of $16,487,953 per QALY. |
AE = adverse event; CIHI = Canadian Institute for Health Information; ICER = incremental cost-effectiveness ratio; LC-FAOD = long-chain fatty acid oxidation disorder; LY = life-years; MCE = major clinical event; OCCI = Ontario Case Costing Initiative; QALY = quality-adjusted life-year; SF-10 = Short Form (10) Health Survey; SF-12 = Short Form (12) Health Survey; SoC = standard of care; WTP = willingness-to-pay; vs. = versus.
Conclusions
The CADTH clinical review noted that the evidence provided for this submission does not adequately address the research question of whether triheptanoin improves relevant outcomes for patients with long-chain fatty acid oxidation disorders (LC-FAODs) compared to the current standard of care (SoC). Due to the significant risk of bias, potential confounding factors, and statistical uncertainty, it cannot be stated with confidence whether any benefit observed in the trials is attributable to triheptanoin treatment. At this time, there is no evidence showing the superiority of triheptanoin over other sources of medium-chain triglycerides (MCTs) for clinically relevant end points of mortality or morbidity. Overall, it is highly uncertain whether triheptanoin is better than the alternative MCT formulations currently available.
In addition to a lack of long-term data to inform clinical effectiveness, CADTH identified several limitations of the sponsor’s pharmacoeconomic model, including uncertainty with utility values and failure to properly model the disease or consider treatment waning or nonresponse to triheptanoin. CADTH made 1 change to derive a CADTH base case, which calculated utility values based on Short Form (12) Health Survey (SF-12) scores only, and the resulting incremental cost-effectiveness ratio (ICER) was $1,347,825 per quality-adjusted life-year (QALY). Based on the CADTH base case, triheptanoin had a 0% chance of being cost-effective compared to SoC at a threshold of $50,000 per QALY and would require a 96% price reduction to be cost-effective at this threshold.
The economic model is driven by the health state utility values and the drug acquisition cost of triheptanoin. The ICER resulting from the scenario analysis that equated the health state utility values was $16,487,953 per QALY, indicating that the difference in utility values in the sponsor’s base case is largely responsible for any incremental QALY gains. Given the high degree of clinical uncertainty, it is unlikely that these utility values reflect a patient’s quality of life, and the true ICER likely lies somewhere between the CADTH base case and this scenario analysis.
Stakeholder Input Relevant to the Economic Review
This section is a summary of the feedback received from the patient groups, registered clinicians, and drug plans that participated in the CADTH review process.
MitoAction, a non-profit organization comprised of patients, parents, and Boston health care leaders focused on mitochondrial diseases, provided patient input in response to CADTH’s call. MitoAction engaged with the US patient community through weekly support calls, Facebook groups, and a Mito411 Support line. Input was not received from any Canadian patient groups for this review. Patients’ only treatment option is over-the-counter MCT oils, which are not nationally regulated and are subject to different dosages and quality. Compliance is difficult to manage, and the product can also be costly. Symptoms include energy depletion and exhaustion; the ideal treatment would increase energy levels and physical capability, improve cognitive functioning, decrease stress on organ systems, and reduce hospitalizations. Several patients had experience with triheptanoin because it is available in the US. Patients reported improved energy levels, allowing participation in extracurricular activities, and reduced levels of creatine kinase, leading to decreased hospitalization due to rhabdomyolysis.
CADTH received registered clinician input from the Garrod Association Guideline Committee, which formulates clinical guidelines and provides other guidance pertaining to specific inherited metabolic diseases. The group currently consists of 6 clinicians, a biochemical geneticist, and 2 methodologists. Current treatment options include medical nutrition therapy and dietary management, such as limiting fasting and having emergency treatment regimens. Patients typically restrict intake of long-chain fatty acids and supplement their diet with MCTs through the consumption of MCT in an oil or powdered formula. Triheptanoin is expected to replace MCT supplementation, not used in combination with MCTs. Triheptanoin may be trialled after MCT supplementation fails or after infants on complete MCT formulas are weaned. Triheptanoin might be considered first-line therapy in patients presenting with cardiomyopathy or high-risk infants and neonates, based on clinical judgment. Triheptanoin is expected to cause a shift in the current treatment paradigm by providing an alternative treatment option for patients.
Drug plan input was received for this review. Drug plans noted potential issues with implementation, particularly if patients are required to have tried MCT supplementation before initiating triheptanoin. MCT supplementation is funded in Ontario through the Inherited Metabolic Diseases Program and in Manitoba for the treatment of epilepsy, but it is not covered in most other jurisdictions. The plans noted accessibility issues because access to metabolic specialists may be limited in some regions. LC-FAODs are diagnosed through newborn screening, but the genetic markers screened for vary among jurisdictions.
Several of these concerns were addressed in the sponsor’s model:
The sponsor considered the frequency and duration of major clinical events (MCEs), including rhabdomyolysis, hypoglycemia, and cardiomyopathy.
The main comparator for this analysis was SoC, which includes supplementation with MCT oil.
CADTH was unable to address the following concerns raised in stakeholder input:
The model did not consider other important outcomes for patients, such as energy levels, physical capability, and cognitive functioning.
The model structure did not allow for consideration of the cost-effectiveness of triheptanoin as a first-line therapy.
Economic Review
The current review is for triheptanoin (Dojolvi) for patients with LC-FAODs.
Economic Evaluation
Summary of Sponsor’s Economic Evaluation
Overview
The sponsor submitted a cost-utility analysis assessing triheptanoin compared to SoC for the treatment of patients with LC-FAODs. The modelled population aligned with the Health Canada indication and reimbursement request.1
Triheptanoin is available as an oral solution containing 100% weight per weight (w/w) triheptanoin. The recommended target daily dosage of triheptanoin according to the product monograph is up to 35% of the patient’s total prescribed daily caloric intake (DCI) divided into at least 4 doses, administered at mealtimes or with snacks, at 3-hour to 4-hour intervals.1 Patients’ DCI varies based on age, sex, weight, height, and activity level, and can be calculated according to national guidelines.2 For patients not currently taking MCT supplementation, triheptanoin should be initiated at a total daily dosage of approximately 10% DCI, divided into at least 4 doses, and increased to the recommended dosage of 35% DCI over a period of 2 weeks to 3 weeks. For patients switching from another MCT product, triheptanoin should be initiated at the last tolerated daily dosage of MCT and increased by approximately 5% every 2 days to 3 days until the target dosage of 35% DCI is achieved.1 Patients’ DCI should be monitored during dosage titration, and dosage reductions should be considered in patients with gastrointestinal adverse reactions.
In the model, over a 3-month model cycle length, the sponsor calculated the cost of triheptanoin as between $15,715 and $83,065, based on patient characteristics and an average daily target dosage of between 26.0% and 29.3% of DCI, as per the CL201 trial.3 The annual cost ranged from $62,858 to $332,261, based on an assumed patient adherence of 80%. No wastage was considered in the base case, which assumed perfect measurement and bottle sharing. The comparator for this economic analysis was SoC, consisting of over-the-counter MCT oil and dietary considerations (e.g., avoidance of fasting). As the reimbursement status of MCT oil varies across jurisdictions, the cost of this comparator was assumed to be zero dollars.4 Clinical outcomes that were important to the model were the rates of the MCEs rhabdomyolysis, hypoglycemia, and cardiomyopathy.
The submitted model reported both QALYs and life-years (LYs) over a lifetime horizon. The base-case analysis was conducted from the perspective of the Canadian public health care system, with discounting (1.5% per annum) applied to both costs and outcomes.
Model Structure
The sponsor submitted a Markov model with 3 health states: alive (on triheptanoin treatment), alive (off triheptanoin treatment – on SoC), and death (Figure 1). All patients began in the alive (on triheptanoin) state and could transition to the alive (off triheptanoin), the death state, or remain in their current state. The rate at which patients transitioned to the alive (off triheptanoin) state was defined by the rate of discontinuation of triheptanoin in the CL201 trial.3 Upon transitioning to the alive (off triheptanoin) state, patients could remain there until death and were assumed not to re-initiate treatment with triheptanoin. While in the alive states, patients were assumed to be at risk of MCEs, including rhabdomyolysis, hypoglycemia, and cardiomyopathy, the rates of which were determined from the CL201 trial.3 Specifically, rates of MCEs in the alive (off triheptanoin) state were based on data from the 78-week pre-treatment period of the CL201 trial (i.e., the 78 weeks before initiating triheptanoin). Rates of MCEs in the alive (on triheptanoin) state were based on data from the 78-week treatment period of the CL201 trial.3 Risk of death was determined according to the general population mortality based on Canadian life tables, with an increased mortality risk assumed for hospitalizations due to rhabdomyolysis, hypoglycemia, and cardiomyopathy.
Model Inputs
The population for this model was based on the trial population of the phase II, single-arm CL201 study. Patients enrolled in this study were at least 6 months of age with significant clinical manifestations of LC-FAODs despite a stable treatment regimen for 60 days before enrolment. Most patients (27 of the 29 enrolled) were on MCT oil therapy before initiating triheptanoin.5 Patients in the model were divided into 3 age groups with the following distributions: from 0 to younger than 6, 51.7%; 6 to younger than 18, 27.6%; and 18 years or older, 20.7%.3 The average age and weight of patients per age group was 3.3 years, 13.3 years, and 32.2 years and 16.6 kg, 57.4 kg, and 85.9 kg in the 0 to younger than 6, 6 to younger than 18, and 18 years or older age groups, respectively. Rates of MCEs differed between age groups and by treatment arms, and 41.4% of the population was female. The sponsor reported the costs, QALYs, and ICERs for each of the age groups, and then calculated a weighted ICER based on the baseline distribution of ages in the CL201 trial. A breakdown of the sponsor’s results by age is available in Appendix 3, Table 12.
The submitted model consisted of 3 health states that were defined by treatment status (“on” or “off”) rather than disease-specific states. Patients in the alive (on triheptanoin) and alive (off triheptanoin) health states could experience 3 types of MCEs: rhabdomyolysis, hypoglycemia, and cardiomyopathy (Table 3). Rates of MCEs in the alive (on triheptanoin) state were based on data from the 78-week treatment period of the CL201 trial, and rates in the alive (off triheptanoin) were based on the 78-week pre-treatment period.3 Length of hospital stay associated with each MCE was derived from data observed in CL201.3 Additionally, patients in the alive (on triheptanoin) state were assumed to be at risk for gastroenteritis adverse events, the rate of which was informed by CL201.3 No gastroenteritis adverse events were assumed to occur in the alive (off triheptanoin) state. Risk of death was determined according to the general population mortality rate based on Canadian life tables, with an increased mortality risk assumed for hospitalizations due to rhabdomyolysis, hypoglycemia, and cardiomyopathy. Using the Healthcare Cost and Utilization Project 2016 data, the probability of death was 0.57% for a rhabdomyolysis hospitalization, 2.44% for a hypoglycemia hospitalization, and 3.81% for a cardiomyopathy hospitalization.6 The mortality rate for nonhospitalization MCEs was assumed to be 0%.
Table 3: Annualized Major Clinical Event Rates Used to Inform the Economic Model
Age group and event type | On triheptanoin | Off triheptanoin |
|---|---|---|
Children and infants (0 to < 6 years) | ||
Rhabdomyolysis | 1.001 | 1.541 |
Hypoglycemia | 0.044 | 0.614 |
Cardiomyopathy | 0.000 | 0.089 |
Adolescents (≥ 6 to < 18 years) | ||
Rhabdomyolysis | 0.638 | 1.000 |
Hypoglycemia | 0.000 | 0.000 |
Cardiomyopathy | 0.077 | 0.083 |
Adults (≥ 18 years) | ||
Rhabdomyolysis | 0.673 | 1.111 |
Hypoglycemia | 0.000 | 0.000 |
Cardiomyopathy | 0.000 | 0.000 |
The comparative data were derived from the single-arm CL201 trial, with data for the patients on SoC derived from the pre-treatment period of the trial.3 Rates of MCEs in the SoC arm were based on the 78 weeks before initiating triheptanoin.
The dosage of triheptanoin was calculated based on a hypothetical patient cohort with various ages and weights. Age- and sex-specific total caloric intake per day was approximated based on guideline recommendations from the US Department of Agriculture for individuals with a moderate activity level.7 The percentage of total DCI assumed was based on observed data from CL201 and ranged from 26.0% to 29.3%, depending on the age group.3 The sponsor assumed 80% adherence to triheptanoin therapy for all patients, which effectively reduces the daily and annual costs by 20%, as the product is assumed to last longer if patients skip doses. Perfect bottle sharing was assumed, with no wastage of triheptanoin in the base case. The total daily dosage of triheptanoin was calculated according to the following formula:

The annual cost of triheptanoin in the base case ranged from $62,858 to $332,261, depending on age. Cost inputs for MCEs were derived from various sources, including the Ontario Case Costing Initiative,8 the Canadian Institute for Health Information,9 and the Ontario Drug Benefit Formulary.10 The cost of a rhabdomyolysis episode was assumed to consist of $10,946 for an inpatient hospitalization stay, $359 for an emergency room visit, and $167 for emergency IV fluids, sodium bicarbonate, and levocarnitine, diagnostic serum creatinine laboratory testing, and an outpatient visit. The cost of hypoglycemia was assumed to consist of $6,816 per hospitalization and $96 for a glucagon emergency kit. The cost of a hospitalization for cardiomyopathy was assumed to be $10,634. The cost for a gastroenteritis adverse event was assumed to be $11,140 for a 6-day stay and $387 for an emergency room visit. A 1-time terminal care cost of $57,407 was applied in the cycle before death. The cost was derived from published literature11 and represented the average health care cost in the last year of life, converted to 2020 Canadian dollars.
Utility values used in the model were based on the scores collected in the CL201 trial using the Short Form (10) Health Survey (SF-10), in patients aged 5 through 17 years, and the SF-12 for patients 18 years or older. These measures were converted to EQ-5D utility values using the algorithm developed by Lawrence et al.12 This algorithm estimates EQ-5D utility as a function of the physical component summary (PCS) and mental component summary (MCS) scores of the SF-12 questionnaire. To estimate an EQ-5D utility value from the SF-10 scores, the sponsor assumed that the physical health summary (PHS) and psychosocial health summary (PSS) of the SF-10 represented similar constructs as the SF-12 PCS and MCS, respectively. The SF-12 and SF-10 were administered at baseline and after 24 weeks of triheptanoin treatment, with the baseline value being used to calculate utility in the alive (off triheptanoin) state. Because the SF-12 and SF-10 scales in the CL201 trial were measured when the patients were not experiencing an MCE, these utilities were considered to be the reference utilities associated with being event-free in the alive (on triheptanoin) and alive (off triheptanoin) health states, with further disutilities applied for each MCE. The base utility in the alive (on triheptanoin) state was 0.629 and in the alive (off triheptanoin) state was 0.365.4 Disutilities pertaining to MCEs were derived from published literature. For rhabdomyolysis, a disutility of −0.139 was applied for the duration of the clinical event, regardless of whether the patient was hospitalized.13 For hypoglycemia, a disutility of −0.057 for hospitalizations and −0.024 for nonhospitalizations was applied.14,15 All cardiomyopathy MCEs were assumed to result in hospitalization and were associated with a disutility of −0.105 for the duration of the clinical event.16 The mean length of hospitalization for rhabdomyolysis was 4.11 and 3.56 days for those on and off triheptanoin, respectively. For hypoglycemia, patients off triheptanoin had a mean length of stay of 4.46 days, and for cardiomyopathy the mean length of stay was 7.09 and 8.71 days for those on and off triheptanoin, respectively. The disutility for a gastroenteritis adverse event was −0.0018, with an average duration of 7 days, based on published literature.17
Summary of Sponsor’s Economic Evaluation Results
The sponsor submitted a probabilistic analyses for the base case, based on 1,000 iterations of a Monte Carlo simulation. The base case and all sensitivity analyses were based on 1,000 iterations. The probabilistic findings are presented in this section; deterministic and probabilistic results were similar.
Base-Case Results
Over a lifetime horizon, triheptanoin was associated with incremental costs of $5,049,887 and QALYs of 4.98 in comparison with SoC, for an ICER of $1,014,013 per QALY (Table 4). In the sponsor’s base case, triheptanoin had a 0% probability of being cost-effective at a willingness-to-pay threshold of $50,000 per QALY.
Table 4: Summary of the Sponsor’s Economic Evaluation Results
Drug | Total costs ($) | Incremental costs ($) | Total QALYs | Incremental QALYs | ICER vs. SoC ($/QALY) |
|---|---|---|---|---|---|
SoC | $412,694 | Reference | 14.73 | Reference | Reference |
Triheptanoin | $5,462,581 | $5,049,887 | 19.71 | 4.98 | $1,014,013 |
ICER = incremental cost-effectiveness ratio; QALY = quality-adjusted life-year; SoC = standard of care.
Source: Sponsor’s pharmacoeconomic submission.4
Sensitivity and Scenario Analysis Results
The sponsor conducted a number of sensitivity and scenario analyses. In these analyses, the ICERs for triheptanoin compared to SoC were most sensitive to the activity level used for DCI calculations (e.g., sedentary, active). The analyses assumed adherence to triheptanoin and based utility values solely on the SF-12, with ICERs ranging from $758,985 to $1,354,319.
CADTH Appraisal of the Sponsor’s Economic Evaluation
CADTH identified several key limitations of the sponsor’s analysis that have notable implications for the economic analysis:
Indirect calculation of health state utilities: The sponsor calculated EQ-5D utilities for use in the model as a function of the component scores of the SF-10 and SF-12 scales, which were collected in the CL201 trial. The SF-10 was used for patients aged 5 to 17 and the SF-12 for patients 18 years or older. The PCS and MCS scores of the SF-12 questionnaire, and PHS and PSS scores of the SF-10 questionnaire, were mapped to EQ-5D utilities using an algorithm published in 2004.12 This method of mapping Short Form Health Survey scores onto EuroQol scores is an indirect measure of utility and adds considerable uncertainty to the analysis. Furthermore, the paper cited for this conversion algorithm is based solely on mapping SF-12 scores to EQ-5D, leading to an additional assumption that the PHS and PSS components of the SF-10 questionnaire are equivalent to the PCS and MCS scores of the SF-12 questionnaire, an assertion not supported by evidence.
In addition, the clinical review noted that an estimated minimally important difference has not been identified in the LC-FAOD population for the SF-10 and SF-12, nor have these tests been validated in patients with LC-FAODs. For these reasons, along with the small sample sizes used in the CL201 trial, the clinical significance of the health-related quality of life findings are unclear.
Finally, use of these utility values in the model may not be appropriate, considering the time point at which they were assessed in CL201. Baseline visit measurements of SF-12 and SF-10 were used to compute utility in the alive (off triheptanoin) state, while the measures taken at the follow-up visits at weeks 12 and 24 were used to compute utility in the alive (on triheptanoin) state. However, in the model, patients are assumed to start on triheptanoin and only transition to the alive (off triheptanoin) when they discontinue and return to an SoC regimen that includes MCT oil. The baseline utility measure taken in the CL201 trial may not be applicable to the modelled population that has tried triheptanoin. In addition, the clinical experts consulted by CADTH felt that, at an aggregate level, the utility value of 0.629 in patients on triheptanoin was too high relative to patients off triheptanoin. The experts noted that there will certainly be patients in whom quality of life will be greatly improved owing to triheptanoin if they would otherwise be hospitalized with a serious MCE. But, at an aggregate level, it was felt that, compared to the value of 0.365 in the alive (off triheptanoin) state, an average patient would not experience such a drastic improvement in quality of life.
The sponsor provided an alternative method for estimating utilities, in which only the SF-12 values were mapped to EQ-5D. This removes the assertion of equivalency between the components of the SF-10 and SF-12, which is a tenuous assumption. It does, however, exclude the utility measures taken in those aged 5 to 17 in the CL201 trial. Nevertheless, CADTH asserts that this method of calculating utilities is associated with lower uncertainty. CADTH notes that the sponsor’s model includes patients age 3 and older, so the utilities for children from birth to younger than age 3 are already lacking in the sponsor’s base case. As stated, the mapping of SF-10 scores to EQ-5D is associated with considerable uncertainty, which CADTH sought to reduce by choosing the sponsor-provided option that estimated utility based on the SF-12 alone.
As part of the base case, CADTH incorporated the aforementioned change to the utility assumption.
The model structure does not explicitly model the disease: The clinical effectiveness of triheptanoin is incorporated into the model via the inclusion of rates and durations of MCEs, which differ depending on treatment status (Table 3). However, other potential benefits of triheptanoin are not explicitly modelled. As noted in the patient input, the ideal treatment for LC-FAODs would increase energy levels and physical capability (to allow participation in extracurricular activities) and improve cognitive functioning.
The sponsor has used different health state utility values for patients in the alive (on triheptanoin) and alive (off triheptanoin) health states. This implies that patients who are currently being managed on triheptanoin will have an improved quality of life compared to those on MCT oil, irrespective of any improvement in the rate of MCEs. These benefits could be assumed to be shown in an improved energy expenditure index or exercise tolerance, as explored in the CL201 and Gillingham et al. (2017) studies.5,18 However, these benefits were not explicitly modelled, and it is unlikely that the utility measures are sensitive to these differences in energy parameters. As noted, the minimally important difference for the SF-10 and SF-12 has not been identified, nor have these tests been validated in the LC-FAOD population.
Due to the limitations with the model structure, CADTH was unable to explore the nuances of the clinical uncertainty. The clinical review noted that, at this time, there is no evidence showing superiority of triheptanoin over other sources of MCT for clinically relevant end points of mortality or morbidity, such as reduction in clinical events or hospitalization, and improvement in health-related quality of life. As a result, firm conclusions about the clinical benefit of triheptanoin over even-chain MCTs cannot be made.
To address the issue of clinical uncertainty, CADTH equated the health state utility values in both arms in a scenario analysis, thereby removing any theoretical benefit of triheptanoin that was not explicitly modelled via rates and durations of MCEs.
The model fails to adequately consider patients who do not respond to triheptanoin: The rate of transition between the alive (on triheptanoin) and alive (off triheptanoin) state was defined according to the rate of triheptanoin discontinuation observed in the CL201 trial. During the first 3 months (i.e., the first model cycle), 3 out of 29 patients discontinued triheptanoin, with a further 1 patient discontinuing before the end of the study at 78 weeks. Thus, the sponsor applied a discontinuation rate of 10.3% (i.e., 3/29 = 0.103) in the first model cycle, and a lower but constant rate of discontinuation of 0.8% in each subsequent cycle. This approach, however, fails to consider that some patients will not initially respond to triheptanoin. In the CL201 trial, some patients experienced an increase in either MCE frequency or duration (or both), in spite of triheptanoin treatment.5 Furthermore, the patients enrolled in CL201 were those with significant clinical manifestations of LC-FAODs and could thus be considered more likely to respond than an average patient with LC-FAOD. As the product monograph indicates triheptanoin for adult and pediatric patients with LC-FAODs, regardless of clinical manifestation, it is unclear what the response rate of triheptanoin is expected to be in an average LC-FAOD patient.
Clinical experts consulted by CADTH suggested that about half of patients are not expected to respond to triheptanoin and that continued treatment in this population would be inappropriate. This assertion is supported by the individualized events rates reported in CL201, in which some patients did not experience a reduction in the rate of MCEs.5 The clinical experts suggested a trial period of 1 year with triheptanoin, after which the patients who are nonresponsive, based on rates and duration of MCEs, would discontinue and return to MCT oil. This nonresponse to triheptanoin was not reflected in the discontinuation rates used by the sponsor.
CADTH attempted to address this limitation in a scenario analysis. However, the sponsor’s submitted model allowed only 2 different discontinuation inputs — an initial discontinuation rate in the first cycle and another constant discontinuation rate for all subsequent cycles. Because the cycle length was 3 months, it was impossible to apply a “nonresponse” discontinuation rate after 1 year (i.e., 4 model cycles). CADTH, therefore, assumed that 50% of patients would discontinue treatment with triheptanoin after the first 3 months (first cycle) as part of a scenario analysis.
There is a lack of long-term data to inform clinical effectiveness: The clinical effectiveness of triheptanoin was incorporated in the model by considering MCEs that occurred in the on and off triheptanoin health states. Specifically, the rates and durations for rhabdomyolysis, hypoglycemia, and cardiomyopathy clinical events observed in the CL201 trial (Table 3) were included in the model calculations. These rates were then extrapolated throughout the lifetime time horizon (up to 97 years in the cohort aged 0 to younger than 6). This approach fails to consider the potential for treatment waning, as it implicitly assumes the same effectiveness of triheptanoin for the entire model duration. Yet, the CL201 trial had a treatment duration for triheptanoin of only 78 weeks, for a treatment that is expected to be used lifelong. Clinical experts consulted by CADTH were unsure whether the benefits of triheptanoin would be maintained throughout a patient’s lifetime. This lack of long-term data causes significant uncertainty in evaluating the cost-effectiveness of triheptanoin after many years of treatment (after more than 80 years).
The model did not consider treatment response or the possibility of re-treatment with triheptanoin. The sponsor noted in their report that, while patients may return to triheptanoin treatment after a period of discontinuation, the lack of data from the trial made it challenging to incorporate this consideration in the model. Clinical experts noted that some patients may discontinue the drug after symptom resolution but may be interested in taking the drug again if symptoms return. CADTH agrees with the sponsor that this consideration is difficult to incorporate in the given model structure and further emphasizes the lack of long-term data.
Last, the 3 MCEs included by the sponsor do not represent all relevant outcomes for patients, as clinical experts noted that people with LC-FAODs may experience encephalopathy, peripheral neuropathy, and retinopathy. Patients may also be restricted to a sedentary lifestyle as a result of their condition, characterized by anxiety and pain when going about regular day-to-day activities. These important patient-related outcomes were not captured in the sponsor’s model.
CADTH was unable to address these limitations in reanalysis due to the lack of long-term clinical data.
The dosage of triheptanoin was calculated based on a hypothetical patient cohort: In the base case, the sponsor calculated the dosage of triheptanoin based on a hypothetical cohort of patients with a moderate activity level at every age in the model. Age- and sex-specific DCI was calculated based on guideline recommendations from the US Department of Agriculture for individuals with a moderate activity level at every age.7 It is unclear why the sponsor chose this approach instead of basing their DCI calculations on the Canadian guidelines that were also referred to in their submission.2 The percentage of total DCI assumed was based on observed data from CL201 and was reported to be from 26.0% to 29.3% of DCI, depending on age group.3 The sponsor multiplied these percentages by the DCI of the hypothetical patient cohort at every age in the model cycles. This approach, while explicit in its calculation of drug acquisition costs for the cohort, may not necessarily reflect the dosage of triheptanoin received by patients in CL201, as the average weight of patients with LC-FAODs may differ from the average weight assumed by the DCI calculation. It may have been more appropriate to use the dosage of triheptanoin directly observed in the CL201 trial, as the clinical effectiveness data (e.g., utilities, MCE rates) are also based on the trial’s cohort.
The sponsor’s model allowed users to select triheptanoin dosage based on the dosage observed in the trial. However, given the small sample size of CL201, these observed dosages only provide dosage information for 29 unique patients and do not represent the dosages required for every patient at every age, which is why the sponsor used the approach previously described in the base case. This uncertainty led CADTH to test an alternative assumption about triheptanoin dosage in a scenario analysis, using the sponsor-provided method of incorporating the observed dosages from CL201.
Additional limitations were identified but were not considered to be key limitations:
CADTH emphasizes that the evidence submitted as part of the pharmacoeconomic dossier is relevant in assessing the cost-effectiveness of triheptanoin only in a second-line setting. The majority of patients (27 of 29) enrolled in CL201 were on MCT oil therapy before initiating triheptanoin, and inclusion criteria stipulated patients must have had significant clinical manifestations of LC-FAODs despite having been on a stable treatment regimen for 60 days before enrolment.3 Therefore, the population represented in the pharmacoeconomic model is 1 in which MCT oil has been tested and shown to be ineffective in managing symptoms. This is also the population that the clinical experts emphasized is best suited for treatment with triheptanoin. However, as previously stated, the product monograph for triheptanoin indicates that it is a source of calories and fatty acids for patients with LC-FAODs, regardless of prior treatment status. The cost-effectiveness of triheptanoin as a first-line treatment for patients with LC-FAODs was not modelled and is, therefore, unknown. However, triheptanoin is likely significantly less cost-effective in a first-line setting if patients could otherwise be managed by MCT oil therapy.
More than half of patients in the CL201 trial experienced at least 1 adverse event affecting the gastrointestinal system that was considered related to triheptanoin treatment. The events occurring in more than 5% of patients included diarrhea, pain, nausea and vomiting, abdominal distention, flatulence, gastroenteritis, and acne.5 The sponsor failed to consider all previously mentioned adverse events other than gastroenteritis in their model.
The key assumptions in Table 5 were made by the sponsor and were appraised by CADTH,
Table 5: Key Assumptions of the Submitted Economic Evaluation Not Noted as Limitations to the Submission
Sponsor’s key assumption | CADTH comment |
|---|---|
The sponsor assumed no cost for dietary supplements such as MCT oil in the SoC arm. | Uncertain. CADTH contacted participating jurisdictions to inquire about the reimbursement status of MCT oil. Of the 7 responses received, only 3 jurisdictions would consider funding MCT oil, and only on a highly restricted or case-by-case basis. (Ontario makes it available through the Inherited Metabolic Diseases Program.) Given the heterogeneous nature of reimbursement for MCT oil, CADTH did not alter the sponsor’s base-case assumption but did conduct a scenario analysis that included the cost of MCT oil. |
The sponsor assumes an adherence rate of 80% to triheptanoin. | Uncertain. Clinical experts consulted by CADTH noted that patients may frequently skip doses, because of palatability, gastrointestinal side effects, or lack of benefit. The clinical experts were unsure what adherence might be, so CADTH did not alter the sponsor’s base-case assumption but examined different adherence rates in scenario analyses. |
Gastroenteritis adverse events were assumed to occur only for patients taking triheptanoin. | Not appropriate. Clinical experts consulted by CADTH noted that patients on MCT oil could also experience gastrointestinal AEs. Ultimately, however, the transient nature of these AEs and minimal disutility are unlikely to affect the results. |
AE = adverse event; MCT = medium-chain triglyceride; SoC = standard of care.
CADTH Reanalyses of the Economic Evaluation
Base-Case Results
The CADTH base case was derived by making 1 change to the model assumptions. Specifically, the utility values used in the model were based solely on SF-12 scores being converted to EQ-5D. This change is summarized in Table 6.
Table 6: CADTH Revisions to the Submitted Economic Evaluation
Stepped analysis | Sponsor’s value or assumption | CADTH value or assumption |
|---|---|---|
Changes to derive the CADTH base case | ||
1. Utility values | Utility on triheptanoin: 0.629 Utility off triheptanoin: 0.365 | Utility on triheptanoin: 0.690 Utility off triheptanoin: 0.498 |
CADTH base case | — | Reanalysis 1 |
In the CADTH base case, triheptanoin was associated with estimated total costs of $5,489,797 and total QALYs of 23.96, compared to total costs and QALYs of $442,733 and 20.22 for patients receiving SoC. The ICER for triheptanoin compared to SoC was $1,347,825 per QALY, and the probability of cost-effectiveness at a threshold of $50,000 per QALY was 0%. A detailed breakdown of the disaggregate results are available in Appendix 4, Table 13.
Table 7: Summary of the Stepped Analysis of the CADTH Reanalysis Results
Stepped analysis | Drug | Total costs ($) | Total QALYs | ICER ($/QALYs) |
|---|---|---|---|---|
Sponsor’s base case | SoC | 412,694 | 14.73 | Reference |
Triheptanoin | 5,462,581 | 19.71 | 1,014,013 | |
CADTH reanalysis 1 and base case | SoC | 442,733 | 20.22 | Reference |
Triheptanoin | 5,489,797 | 23.96 | 1,347,825 |
SoC = standard of care.
Scenario Analysis Results
CADTH undertook price reduction analyses based on the sponsor’s and CADTH’s base case. Based on the CADTH base case, a price reduction of 96% would be necessary to achieve cost-effectiveness at a threshold of $50,000 per QALY (Table 8).
Table 8: CADTH Price Reduction Analyses — Probabilistic
Analysis | ICERs for triheptanoin vs. SoC ($/QALY) | |
|---|---|---|
Price reduction | Sponsor base case | CADTH reanalysis |
No price reduction | 1,014,013 | 1,347,825 |
10% | 900,090 | 1,205,064 |
20% | 805,017 | 1,074,603 |
30% | 698,182 | 925,229 |
40% | 602,583 | 799,271 |
50% | 502,112 | 663,180 |
60% | 396,629 | 528,809 |
70% | 294,297 | 394,181 |
80% | 190,295 | 255,100 |
90% | 89,189 | 117,119 |
96%a | 25,665 | 36,469 |
ICER = incremental cost-effectiveness ratio; QALY = quality-adjusted life-year; SoC = standard of care; vs. = versus.
aFor the age birth to 6 group only, a 95% price reduction would be required to achieve cost-effectiveness at a threshold of $50,000 per QALY. A 96% price reduction would be required for those aged 6 to younger than 18 years and 18 years or older.
CADTH undertook a series of exploratory analyses to determine the impact of alternative assumptions on the cost-effectiveness of triheptanoin:
An equal health state utility of 0.498 (the utility associated with the alive [off triheptanoin] health state) was assumed to explore the clinical uncertainty of the benefits of triheptanoin.
Half (50%) of patients were assumed to discontinue triheptanoin after the first model cycle (i.e., first 3 months).
The dosage of triheptanoin was based on mL received in trial and extrapolated to all patients using a linear method, rather than being based on the DCI in a theoretical cohort of patients with different ages and weights.
A triheptanoin adherence rate of 60% was applied.
A triheptanoin adherence rate of 100% was applied.
A cost of $11.40 per 250 mL for MCT oil was assumed.19
The results of these analyses are presented in Appendix 4, Table 15. The ICERs resulting from these analyses ranged from $1,000,833 to $16,487,953 per QALY, with the scenario involving the health state utilities having the highest impact. CADTH noted that the only drivers of the ICER were the health state utility values and the drug acquisition costs of triheptanoin, as evidenced by the scenarios in which dosage and adherence were varied. The scenario increasing discontinuation rate in the first cycle only had a marginal effect on the ICER due to the model’s structure, as the clinical benefits of triheptanoin are experienced only while the patient is receiving the drug. The scenario that included a cost for MCT oil also had little effect, as this drug cost is vastly outweighed by the acquisition cost of triheptanoin.
Issues for Consideration
Clinical experts noted that, in clinical practice, the triheptanoin dosage may be determined based on body mass (g/kg) rather than as a percentage of DCI. As this is not the method of triheptanoin dosage used in the product monograph, nor in the clinical trial on which the pharmacoeconomic model was based, CADTH did not make any changes to the analysis but noted that the dosage used in clinical practice may differ than the dosage studied.
Clinical experts noted that, in rare cases in which palatability or treatment-related gastrointestinal adverse events prevent a patient from continuing treatment with triheptanoin, installation of a gastrointestinal tube may be considered if there are no other options. This would likely improve adherence in patients for whom tolerability precludes treatment with triheptanoin.
The clinical experts noted that there may be other conditions for which triheptanoin may be considered as treatment in the future, including pyruvate carboxylase deficiency, glucose transporter type 1 (GLUT1) deficiency syndrome, and medically intractable epilepsy. CADTH emphasizes that the evidence provided for this dossier does not consider patients with these conditions, therefore the cost-effectiveness of triheptanoin is unknown.
Overall Conclusions
The CADTH clinical review noted that the evidence provided for this submission does not adequately address the research question of whether triheptanoin improves relevant outcomes for patients with LC-FAODs compared to SoC. Due to the significant risk of bias, potential confounding factors, and statistical uncertainty, it cannot be stated with confidence whether any benefit observed in the trials is attributable to triheptanoin treatment. At this time, there is no evidence showing the superiority of triheptanoin over other sources of MCT for clinically relevant end points of mortality or morbidity. Overall, it is highly uncertain whether triheptanoin is better than the alternative MCT formulations that are currently available.
In addition to a lack of long-term data to inform clinical effectiveness, CADTH identified several limitations of the sponsor’s pharmacoeconomic model, including uncertainty with utility values and failure to properly model the disease or consider treatment waning or nonresponse to triheptanoin. CADTH made 1 change to derive a CADTH base case, which calculated utility values based on SF-12 scores only. The resulting ICER was $1,347,825 per QALY. Based on the CADTH base case, triheptanoin had a 0% chance of being cost-effective compared to SoC at a threshold of $50,000 per QALY and would require a 96% price reduction to be cost-effective at this threshold.
The economic model is driven by the health state utility values and the drug acquisition cost of triheptanoin. The ICER resulting from the scenario analysis that equated the health state utility values was $16,487,953, indicating that the difference in utility values in the sponsor’s base case is largely responsible for any incremental QALY gains. Given the high degree of clinical uncertainty, it is unlikely that these utility values reflect a patient’s quality of life, and the true ICER likely lies somewhere between the CADTH base case and this scenario analysis. The ICERs for the scenario analyses that explored different dosages of triheptanoin and drug adherence ranged from $1,000,833 to $1,804,215 per QALY. As triheptanoin acquisition costs make up approximately 93% of the total treatment costs in that arm, any corresponding reduction in hospitalization or terminal care costs attributed to triheptanoin are vastly outweighed by the cost of the drug. The analyses pertaining to patient discontinuation and cost of MCT oil had a marginal effect on the ICER.
References
1.Dojolvi (triheptanoin): Liquid, 100% w/w triheptanoin, oral [product monograph]. Novato(CA): Ultragenyx Pharmaceutical Inc.; 2021 Feb 12.
2.Government of Canada. Dietary Reference Intakes Tables. 2006; https://www.canada.ca/en/health-canada/services/food-nutrition/healthy-eating/dietary-reference-intakes/tables.html#eeer. Accessed May 7, 2021.
3.Clinical Study Report: UX007-CL201. An open-label phase 2 study to assess safety and clinical effects of UX007 in subjects with long-chain fatty acid oxidation disorders (LC-FAOD) [internal sponsor's report]. Novato (CA) Ultragenyx Pharmaceutical Inc.; 2019 Jun 11.
4.Pharmacoeconomic evaluation [internal sponsor's report]. In: Drug Reimbursement Review sponsor submission: Dojolvi (triheptanoin oral liquid) [internal sponsor's package]. Novato (CA): Ultragenyx Pharmaceutical Inc.; 2021 Apr.
5.Vockley J, Burton B, Berry G, et al. Results from a 78-week single-arm, open-label Phase 2 study to evaluate UX007 in pediatric and adult patients with severe long-chain fatty acid oxidation disorders (LC-FAOD). J Inherit Metab Dis. 2019;42(1):169-177. PubMed
6.Quality AfHRa. Healthcare Cost and Utilization Project. https://hcupnet.ahrq.gov/#setup. Accessed May 20, 2021.
7.USDA. Infant Nutrition and Feeding Guide. 2019; https://wicworks.fns.usda.gov/resources/infant-nutrition-and-feeding-guide.
8.Ontario Case Costing Initiative (OCCI). Toronto (ON): Ontario Health and Long-Term Care; 2017: https://data.ontario.ca/dataset/ontario-case-costing-initiative-occi. Accessed 1800 Mth Dd.
9.Canadian Institute for Health Information. Sources of Potentially Avoidable Emergency Department Visits. hcq. 2014;14(4):82-82.
10.Ontario Ministry of H, Ontario Ministry of Long-Term C. Ontario drug benefit formulary/comparative drug index. 2021; https://www.formulary.health.gov.on.ca/formulary/. Accessed 1800 Mth Dd.
11.Tanuseputro P. The Health care cost of dying: a population-based retrospective cohort study of the last year of life in Ontario, Canada. 2015.
12.Lawrence W, Fleishman J. Predicting EuroQol EQ-5D preference scores from the SF-12 health survey in a nationally representative sample. Med Decis Making. 2004;24:160-169. PubMed
13.Mitchell D, Guertin J, Iliza A, Fiorella F, LeLorier J. Economic evaluation of a pharmacogenomics test for statin-induced myopathy in cardiovascular high-risk patients initiating a statin. Mol Diagn Ther. 2017;21:95-105. PubMed
14.Pollock R, Valentine W, Marso S. Long-term cost-effectiveness of insulin degludec versus insulin glargine u100 in the UK: evidence from the basal-bolus subgroup of the DEVOTE trial (DEVOTE 16). Appl Health Econ Health Policy. 2019;17(5):615-627. PubMed
15.Harris S, Mamdani M, Galbo-Jorgensen C, Bogelund M, Gundgaard J, Groleau D. The effect of hypoglycemia on health-related quality of life: Canadian results from a multinational time trade-off survey. Canadian Journal of Diabetes. 2014;38(1):45-52. PubMed
16.McMurray J, Trueman D, Hancock E. Cost-effectiveness of sacubitril/valsartan in the treatment of heart failure with reduced ejection fraction. Heart. 2018;104(12):1006. PubMed
17.Milne R, Grimwood K. Budget Impact and cost-effectiveness of including a pentavalent rotavirus vaccine in the New Zealand childhood immunization schedule. Value Health. 2009;12(6):888-898. PubMed
18.Gillingham M, Heitner S, Martin J, Rose S, Goldstein A. Triheptanoin versus trioctanoin for long-chain fatty acid oxidation disorders: a double blinded, randomized controlled trial. J Inherit Metab Dis. 2017;40(6):831-843. PubMed
19.KetoCal N. Liquigen. 2021; https://shop.myketocal.com/product/liquigen.
20.WHO. WHO Growth Charts for Canada. 2014.
21.Table: 13-10-0114-01. Life expectancy and other elements of the life table, Canada, all provinces except Prince Edward Island. Ottawa (ON): Statistics Canada; 2020: https://www150.statcan.gc.ca/t1/tbl1/en/tv.action?pid=1310011401. Accessed 1800 Mth Dd.
22.Merrit J, Vockley J. Overview of fatty acid oxidation disorders. 2020; https://www.uptodate.com/contents/overview-of-fatty-acid-oxidation-disorders.
Appendix 1: Cost Comparison Table
Note this appendix has not been copy-edited.
The comparators presented in the above table have been deemed to be appropriate based on feedback from clinical expert(s). Comparators may be recommended (appropriate) practice or actual practice. Existing Product Listing Agreements are not reflected in the table and as such, the table may not represent the actual costs to public drug plans.
Table 9: CADTH Cost Comparison Table for the Treatment of Long-Chain Fatty Acid Oxidation Disorders
Treatment | Strength / concentration | Form | Price | Age | Sex | Average daily caloric intake (kcal)a | Daily costb | Annual cost |
|---|---|---|---|---|---|---|---|---|
Triheptanoin (Dojolvi) | 100% w/w | Oral liquid 500 mL | $6,365.0000c | 0 to < 1 | Male | 668 | $358.59 | $130,884 |
Female | 606 | $325.14 | $118,678 | |||||
1 to < 6 | Male | 1,209 | $648.84 | $236,826 | ||||
Female | 1,122 | $602.38 | $219,870 | |||||
6 to < 18 | Male | 1,754 | $941.30 | $343,574 | ||||
Female | 1,611 | $865.04 | $315,740 | |||||
≥ 18 | Male | 2,383 | $1,279.37 | $466,971 | ||||
Female | 1,692 | $908.05 | $331,440 |
DCI = daily caloric intake; w/w = weight per weight.
aAverage DCIs were calculated based on the Canadian Dietary Reference Intakes Tables for patients aged 6 months, 3.5 years, 12 years (midpoints of age categories), and 18 years.2 Values for weight and height used in the formulas were derived from Canada-specific WHO Growth Curve datasets.20 All patients were assumed to be ‘sedentary’ (activity coefficient of 1) based on the physiology of the disease leading to the requirement to modulate physical activity.
bDaily and annual costs are based on a target daily dose of triheptanoin of 35% of the patients daily caloric intake as per the product monograph.1 The amount of triheptanoin required was calculated according to the following formula: daily dose (mL) = (DCI × target % dose) / 8.3 (kcal/mL).
cSponsor submitted price.4
Appendix 2: Submission Quality
Note this appendix has not been copy-edited.
Description | Yes/No | Comments |
|---|---|---|
Population is relevant, with no critical intervention missing, and no relevant outcome missing | No | The population studied in the CL201 trial differs from the Health Canada indication. Patients enrolled in CL201 were those with significant clinical manifestations of LC-FAODs despite being on a stable treatment regimen, while the Health Canada indication simply states that triheptanoin may be used as a source of calories and fatty acids for patients with LC-FAODs. The cost-effectiveness of triheptanoin in this broader population is unknown. |
Model has been adequately programmed and has sufficient face validity | Yes | No comment. |
Model structure is adequate for decision problem | No | The model structure failed to account for treatment waning, or the possibility of re-treatment with triheptanoin, 2 plausible scenarios for patients being managed for LC-FAODs. |
Data incorporation into the model has been done adequately (e.g., parameters for probabilistic analysis) | Yes | It would be more appropriate to use a gamma or log-normal distribution for disutilities. |
Parameter and structural uncertainty were adequately assessed; analyses were adequate to inform the decision problem | No | Some aspects of the programming of the probabilistic analysis are unconventional and it is difficult to validate the approach used by the sponsor. However, the probabilistic and deterministic results are similar. |
The submission was well organized and complete; the information was easy to locate (clear and transparent reporting; technical documentation available in enough details) | Yes | No comment. |
LC-FAODs = long-chain fatty acid oxidation disorders.
Appendix 3: Additional Information on the Submitted Economic Evaluation
Note this appendix has not been copy-edited.
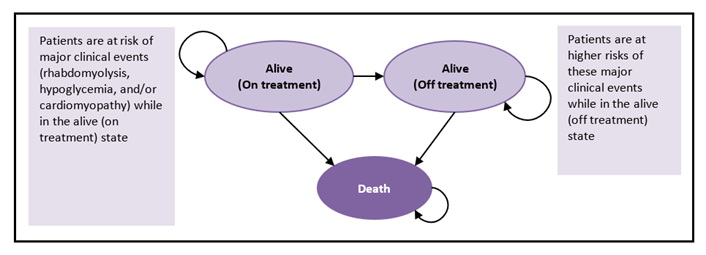
Table 11: Detailed Results of the Sponsor’s Base Case
Category | Triheptanoin | SoC | Incremental |
|---|---|---|---|
Costs | |||
Drug cost | $5,114,451 | $0 | $5,114,451 |
Major clinical event cost | $321,312 | $390,350 | -$69,037 |
Rhabdomyolysis cost | $315,012 | $377,499 | -$62,487 |
On triheptanoin | $102,038 | $0 | $102,038 |
Off triheptanoin | $212,974 | $377,499 | -$164,525 |
Hypoglycemia | $730 | $5,510 | -$4,781 |
On triheptanoin | $5 | $0 | $5 |
Off triheptanoin | $725 | $5,510 | -$4,786 |
Cardiomyopathy | $5,570 | $7,340 | -$1,770 |
On triheptanoin | $3,724 | $0 | $3,724 |
Off triheptanoin | $1,847 | $7,340 | -$5,493 |
Adverse events | $4,929 | $0 | $4,929 |
Terminal care | $21,889 | $22,344 | -$455 |
Total | $5,462,581 | $412,694 | $5,049,887 |
LYs | |||
On triheptanoin | 18.14 | 0.00 | 18.14 |
Off triheptanoin | 23.18 | 40.79 | -17.62 |
Total | 41.32 | 40.79 | 0.53 |
QALYs | |||
On triheptanoin | 11.38 | 0.00 | 11.38 |
Off triheptanoin | 8.45 | 14.88 | -6.42 |
MCE disutility | -0.13 | -0.15 | 0.02 |
Rhabdomyolysis | -0.13 | -0.15 | 0.02 |
Hypoglycemia | 0.00 | 0.00 | 0.00 |
Cardiomyopathy | 0.00 | 0.00 | 0.00 |
Adverse event disutility | 0.00 | 0.00 | 0.00 |
Total | 19.71 | 14.73 | 4.98 |
ICER ($/QALY) | — | — | $1,014,013 |
LY = life-years; MCE = major clinical event; QALY = quality-adjusted life-year; SoC = standard of care.
Table 12: Summary of the Sponsor’s Base Case Stratified by Age Group — Deterministic
Age group | Drug | Total costs ($) | Incremental costs ($) | Total QALYs | Incremental QALYs | ICER versus SoC ($/QALY) |
|---|---|---|---|---|---|---|
Overall | SoC | 412,694 | Reference | 14.73 | Reference | Reference |
Triheptanoin | 5,462,581 | 5,049,887 | 19.71 | 4.98 | 1,014,013 | |
0 to 6 years | SoC | 457,935 | Reference | 15.68 | Reference | Reference |
Triheptanoin | 5,294,107 | 4,836,172 | 20.87 | 5.19 | 932,334 | |
≥ 6 to 18 years | SoC | 413,710 | Reference | 14.82 | Reference | Reference |
Triheptanoin | 5,924,782 | 5,511,072 | 19.77 | 4.95 | 1,114,120 | |
≥ 18 years | SoC | 352,951 | Reference | 12.29 | Reference | Reference |
Triheptanoin | 5,305,296 | 4,952,346 | 16.90 | 4.61 | 1,074,149 |
QALY = quality-adjusted life-year; SoC = standard of care.
Appendix 4: Additional Details on the CADTH Reanalyses and Sensitivity Analyses of the Economic Evaluation
Note this appendix has not been copy-edited.
Detailed Results of CADTH Base Case
Table 13: Detailed Results of CADTH Base Case
Category | Triheptanoin | SoC | Incremental |
|---|---|---|---|
Costs | |||
Drug cost | $5,117,322 | $0 | $5,11,322 |
Major clinical event cost | $345,712 | $420,395 | -$74,683 |
Rhabdomyolysis cost | $339,230 | $407,656 | -$68,426 |
On triheptanoin | $107,260 | $0 | $107,260 |
Off triheptanoin | $231,970 | $407,656 | -$175,686 |
Hypoglycemia | $726 | $5,475 | -$4,750 |
On triheptanoin | $6 | $0 | $6 |
Off triheptanoin | $720 | $5,475 | -$4,756 |
Cardiomyopathy | $5,757 | $7,264 | -$1,507 |
On triheptanoin | $3,921 | $0 | $3,921 |
Off triheptanoin | $1,836 | $7,264 | -$5,428 |
Adverse events | $4,879 | $0 | $4,879 |
Terminal care | $21,884 | $22,338 | -$455 |
Total | $5,489,797 | $442,733 | $5,047,063 |
LYs | |||
On triheptanoin | 18.14 | 0.00 | 18.14 |
Off triheptanoin | 23.18 | 40.80 | -17.62 |
Total | 41.32 | 40.80 | 0.52 |
QALYs | |||
On triheptanoin | 12.52 | 0.00 | 11.38 |
Off triheptanoin | 11.58 | 20.38 | -6.42 |
MCE disutility | -0.13 | -0.16 | 0.02 |
Rhabdomyolysis | -0.13 | -0.15 | 0.02 |
Hypoglycemia | 0.00 | 0.00 | 0.00 |
Cardiomyopathy | 0.00 | 0.00 | 0.00 |
Adverse event disutility | 0.00 | 0.00 | 0.00 |
Total | 23.96 | 20.22 | 3.74 |
ICER ($/QALY) | — | — | $1,347,825 |
SoC = standard of care; QALY = quality-adjusted life-year.
Table 14: Summary of the CADTH Base Case Stratified by Age Group — Deterministic
Age group | Drug | Total costs ($) | Incremental costs ($) | Total QALYs | Incremental QALYs | ICER versus SoC ($/QALY) |
|---|---|---|---|---|---|---|
Overall | SoC | 442,733 | Reference | 20.22 | Reference | Reference |
Triheptanoin | 5,489,797 | 5,047,063 | 23.96 | 3.74 | 1,347,825 | |
0-6 years | SoC | 457,935 | Reference | 21.45 | Reference | Reference |
Triheptanoin | 5,294,107 | 4,836,172 | 25.41 | 3.95 | 1,222,968 | |
≥ 6 to 18 years | SoC | 413,710 | Reference | 20.28 | Reference | Reference |
Triheptanoin | 5,924,782 | 5,511,072 | 23.95 | 3.68 | 1,499,601 | |
≥ 18 years | SoC | 352,951 | Reference | 16.81 | Reference | Reference |
Triheptanoin | 5,305,296 | 4,952,346 | 20.22 | 3.41 | 1,451,649 |
QALY = quality-adjusted life-year; SoC = standard of care.
Scenario Analyses
Table 15: Summary of Scenario Analyses Conducted on CADTH Base Case
Scenario | Drug | Total costs ($) | Total QALYs | ICER ($/QALY) |
|---|---|---|---|---|
CADTH base case | SoC | 442,733 | 20.22 | Reference |
Triheptanoin | 5,489,797 | 23.96 | 1,347,825 | |
1. Assumed equal health state utilities of 0.498 for patients on and off triheptanoin | SoC | 419,330 | 20.09 | Reference |
Triheptanoin | 5,470,292 | 20.40 | 16,487,953 | |
2. Assume 50% of patients discontinue in cycle 1 of the model | SoC | 431,650 | 20.20 | Reference |
Triheptanoin | 3,256,634 | 22.30 | 1,345,018 | |
3. Triheptanoin dose based on millilitres received in CL201 | SoC | 419,314 | 20.25 | Reference |
Triheptanoin | 7,123,426 | 23.97 | 1,804,215 | |
4. Adherence rate of 60% | SoC | 424,014 | 20.17 | Reference |
Triheptanoin | 4,192,193 | 23.93 | 1,000,833 | |
5. Adherence rate of 100% | SoC | 433,856 | 20.16 | Reference |
Triheptanoin | 6,752,800 | 23.93 | 1,679,478 | |
6. Assumed cost of MCT oil of $11.40 per 250 mL19 | SoC | 448,531 | 20.17 | Reference |
Triheptanoin | 5,470,401 | 23.93 | 1,333,815 |
MCT = medium-chain triglyceride; SoC = standard of care.
Appendix 5: Submitted Budget Impact Analysis and CADTH Appraisal
Note this appendix has not been copy-edited.
Table 16: Summary of Key Take-Aways
Key take-aways of the business impact analysis |
|---|
|
Summary of Sponsor’s Budget Impact Analysis
The submitted budget impact analysis (BIA) assessed the introduction of triheptanoin as a source of calories and fatty acids for patients with long-chain fatty acid oxidation disorders (LC-FAOD). Although not explicitly stated, the analysis was taken from the perspective of the Canadian public drug plans using an epidemiology-based approach, with only drug acquisition costs considered. A 3-year time horizon was used, from 2022 to 2024, with 2021 as a base year. The population size was derived using the estimated prevalence of LC-FAOD.
In Canada, the SoC for patients with LC-FAOD is over-the-counter MCT oil coupled with dietary considerations such as avoidance of fasting. However, public reimbursement for MCT oil varies by jurisdiction, with most jurisdictions not including it on public formularies. Therefore, the sponsor assumed MCT oil was a costless comparator. The reference case scenario consisted of SoC with MCT oil (no cost), and the new drug scenario included triheptanoin and SoC. Market share estimates were based on clinical expert opinion captured through market research. Key inputs to the BIA are documented in Table 17.
Table 17: Summary of Key Model Parameters
Parameter | Sponsor’s estimate (reported as year 1 / year 2 / year 3 if appropriate) |
|---|---|
Target population | |
Canadian population | 30,656,89021 |
Prevalence of LC-FAOD | 1/100,00022 |
Proportion of cases that are children | 58% (assumption) |
Proportion of cases that are adults | 42% (assumption) |
Proportion of pediatric patients diagnosed | 90% (assumption) |
Proportion of adult patients diagnosed | 46% (assumption) |
Number of pediatric patients eligible for drug under review | 162 / 164 / 167 |
Number of adult patients eligible for drug under review | 60 / 61 / 62 |
Market uptake (3 years) | |
Uptake (reference scenario) SoC | 100% / 100% / 100% |
Uptake (new drug scenario) Pediatric population Triheptanoin SoC | 28% / 35% / 40% 72% / 65% / 60% |
Adult population Triheptanoin SoC | 14% / 20% / 25% 86% / 80% / 75% |
Cost of treatment (per patient) | |
Cost of treatment annually Triheptanoin (pediatrics) Triheptanoin (adults) SoC | $246,297 $377,644 $0 |
LC-FAOD = long-chain fatty acid oxidation disorders; SoC = standard of care.
Summary of the Sponsor’s Budget Impact Analysis Results
The estimated budget impact of funding triheptanoin as a source of calories for patients with LC-FAOD was $13,349,226 in year 1, $18,193,011 in year 2, and $22,166,557 in year 3 for a 3-year total of $53,708,794.
CADTH Appraisal of the Sponsor’s Budget Impact Analysis
CADTH identified several key limitations to the sponsor’s analysis that have notable implications on the results of the BIA:
Underestimation of the prevalence of LC-FAODs: The sponsor estimated the prevalence of LC-FAODs to be 1 in 100,000, which appears to be an oversimplification of the data provided in the paper from which it was derived.22 Using the same reference, CADTH calculated the prevalence of LC-FAODs to be between 1.94 and 3.46 per 100,000, based on the prevalence values for very long-chain acyl coenzyme A dehydrogenase (VLCAD) deficiency, long-chain 3-hydroxy-acyl-coA dehydrogenase (LCHAD) deficiency, and carnitine palmitoyltransferase (CPT I) deficiency presented in the paper.22 As these are only 3 of the 6 subtypes of LC-FAODs considered by the sponsor in their analysis, the prevalence is likely still underestimated, even with CADTH’s re-calculation.
As part of the base case, CADTH estimated the prevalence of LC-FAODs to be the average of the 2 values calculated from the cited paper (2.70 per 100,000).22
Uncertainty regarding the prevalence of adult versus pediatric cases: The sponsor assumed a split of 58% to 42% of prevalence cases being pediatric and adult patients, respectively. This is based on the assumption that a number of patients with LC-FAOD may not survive to adulthood, thus skewing the percentage toward the pediatric cases. Clinical experts were unsure about this assumption and noted that the adult age group of ≥ 18 years old will likely represent a larger population than those aged 0 to 18, as a function of their life expectancy, and that this would result in more adult than pediatric prevalent cases.
CADTH altered the proportion of adult and pediatric cases as part of a scenario analysis.
CADTH Reanalyses of the Budget Impact Analysis
Based on the limitations identified, CADTH increased the prevalence of LC-FAODs as part of the base case.
Table 18: CADTH Revisions to the Submitted Budget Impact Analysis
Stepped analysis | Sponsor’s value or assumption | CADTH value or assumption |
|---|---|---|
Corrections to sponsor’s base case | ||
None | — | — |
Changes to derive the CADTH base case | ||
1. Increased prevalence of LC-FAODs | 1 per 100,000 | 2.7 per 100,000 |
CADTH base case | Reanalysis 1 | |
LC-FAODs = long-chain fatty acid oxidation disorders.
The results of the CADTH step-wise reanalysis are presented in summary format in Table 19 and a more detailed breakdown is presented in Table 20. Based on the CADTH base case, the budget impact of the reimbursement of triheptanoin as a source of calories and fatty acids for patients with LC-FAODs is expected to be $39,226,635 in year 1, $51,508,521 in year 2, and $59,816,860 in year 3, with a 3-year total of $150,522,015. Scenario analyses tested ranged from $129,698,448 to $191,519,126 over 3 years, and $6,022,081 when the recommended price reduction of 96% from the pharmacoeconomic model was incorporated.
Table 19: Summary of the CADTH Reanalyses of the Budget Impact Analysis
Stepped analysis | Three-year total |
|---|---|
Submitted base case | $53,708,794 |
CADTH reanalysis 1 and base case | $150,552,015 |
Table 20: Detailed Breakdown of the CADTH Reanalyses of the Budget Impact Analysis
Stepped analysis | Scenario | Year 0 (current situation) | Year 1 | Year 2 | Year 3 | Three-year total |
|---|---|---|---|---|---|---|
Submitted base case | Reference | $0 | $0 | $0 | $0 | $0 |
New drug | $0 | $13,349,226 | $18,193,011 | $22,166,557 | $53,708,794 | |
Budget impact | $0 | $13,349,226 | $18,193,011 | $22,166,557 | $53,708,794 | |
CADTH base case | Reference | $0 | $0 | $0 | $0 | $0 |
New drug | $0 | $39,226,635 | $51,508,521 | $59,816,860 | $150,552,015 | |
Budget impact | $0 | $39,226,635 | $51,508,521 | $59,816,860 | $150,552,015 | |
CADTH scenario analysis 1: prevalence of LC-FAODs of 3.46 per 100,000 | Reference | $0 | $0 | $0 | $0 | $0 |
New drug | $0 | $49,488,951 | $64,874,145 | $77,156,031 | $191,519,126 | |
Budget impact | $0 | $49,488,951 | $64,874,145 | $77,156,031 | $191,519,126 | |
CADTH scenario analysis 2: 60% of population is adult | Reference | $0 | $0 | $0 | $0 | $0 |
New drug | $0 | $32,658,610 | $43,971,707 | $53,068,131 | $129,698,448 | |
Budget impact | $0 | $32,658,610 | $43,971,707 | $53,068,131 | $129,698,448 | |
CADTH scenario analysis 3: included cost of MCT oil | Reference | $0 | $17,179 | $25,396 | $30,624 | $73,199 |
New drug | $0 | $39,226,635 | $51,508,521 | $59,816,860 | $150,552,015 | |
Budget impact | $0 | $39,209,456 | $51,483,125 | $59,786,236 | $150,478,816 | |
CADTH scenario analysis 4: 96% price reduction from pharmaco-economic model | Reference | $0 | $0 | $0 | $0 | $0 |
New drug | $0 | $1,569,065 | $2,060,341 | $2,392,674 | $6,022,081 | |
Budget impact | $0 | $1,569,065 | $2,060,341 | $2,392,674 | $6,022,081 |
ISSN: 2563-6596
Disclaimer: The information in this document is intended to help Canadian health care decision-makers, health care professionals, health systems leaders, and policy-makers make well-informed decisions and thereby improve the quality of health care services. While patients and others may access this document, the document is made available for informational purposes only and no representations or warranties are made with respect to its fitness for any particular purpose. The information in this document should not be used as a substitute for professional medical advice or as a substitute for the application of clinical judgment in respect of the care of a particular patient or other professional judgment in any decision-making process. The Canadian Agency for Drugs and Technologies in Health (CADTH) does not endorse any information, drugs, therapies, treatments, products, processes, or services.
While care has been taken to ensure that the information prepared by CADTH in this document is accurate, complete, and up-to-date as at the applicable date the material was first published by CADTH, CADTH does not make any guarantees to that effect. CADTH does not guarantee and is not responsible for the quality, currency, propriety, accuracy, or reasonableness of any statements, information, or conclusions contained in any third-party materials used in preparing this document. The views and opinions of third parties published in this document do not necessarily state or reflect those of CADTH.
CADTH is not responsible for any errors, omissions, injury, loss, or damage arising from or relating to the use (or misuse) of any information, statements, or conclusions contained in or implied by the contents of this document or any of the source materials.
This document may contain links to third-party websites. CADTH does not have control over the content of such sites. Use of third-party sites is governed by the third-party website owners’ own terms and conditions set out for such sites. CADTH does not make any guarantee with respect to any information contained on such third-party sites and CADTH is not responsible for any injury, loss, or damage suffered as a result of using such third-party sites. CADTH has no responsibility for the collection, use, and disclosure of personal information by third-party sites.
Subject to the aforementioned limitations, the views expressed herein are those of CADTH and do not necessarily represent the views of Canada’s federal, provincial, or territorial governments or any third party supplier of information.
This document is prepared and intended for use in the context of the Canadian health care system. The use of this document outside of Canada is done so at the user’s own risk.
This disclaimer and any questions or matters of any nature arising from or relating to the content or use (or misuse) of this document will be governed by and interpreted in accordance with the laws of the Province of Ontario and the laws of Canada applicable therein, and all proceedings shall be subject to the exclusive jurisdiction of the courts of the Province of Ontario, Canada.
The copyright and other intellectual property rights in this document are owned by CADTH and its licensors. These rights are protected by the Canadian Copyright Act and other national and international laws and agreements. Users are permitted to make copies of this document for non-commercial purposes only, provided it is not modified when reproduced and appropriate credit is given to CADTH and its licensors.
Redactions: Confidential information in this document may be redacted at the request of the sponsor in accordance with the CADTH Drug Reimbursement Review Confidentiality Guidelines
Stakeholder Input: The views expressed in each submission are those of the submitting organization or individual; not necessarily the views of CADTH or of other organizations. As such, they are independent of CADTH and do not necessarily represent or reflect the view of CADTH. No endorsement by CADTH is intended or should be inferred. By filing with CADTH, the submitting organization or individual agrees to the full disclosure of the information. CADTH does not edit the content of the submissions.
CADTH does use reasonable care to prevent disclosure of personal information in posted material; however, it is ultimately the submitter’s responsibility to ensure no identifying personal information or personal health information is included in the submission. The name of the submitting organization or individual and all conflict of interest information are included in the submission; however, the name of the author, including the name of an individual patient or caregiver submitting the patient input, are not posted.
Accessibility: CADTH is committed to treating people with disabilities in a way that respects their dignity and independence, supports them in accessing material in a timely manner, and provides a robust feedback process to support continuous improvement. All materials prepared by CADTH are available in an accessible format. Where materials provided to CADTH by a submitting organization or individual are not available in an accessible format, CADTH will provide a summary document upon request. More details on CADTH’s accessibility policies can be found here.
About CADTH: CADTH is an independent, not-for-profit organization responsible for providing Canada’s health care decision-makers with objective evidence to help make informed decisions about the optimal use of drugs, medical devices, diagnostics, and procedures in our health care system.
Funding: CADTH receives funding from Canada’s federal, provincial, and territorial governments, with the exception of Quebec.