CADTH Reimbursement Review
Liraglutide (Saxenda)
Sponsor: Novo Nordisk Canada Inc.
Therapeutic area: Chronic weight management in adults
This multi-part report includes:
Clinical Review
Pharmacoeconomic Review
Clinical Review
Abbreviations
AE
adverse event
AHI
apnea-hypopnea index
ANCOVA
analysis of covariance
BMI
body mass index
CI
confidence interval
CMS-IBT
Centers for Medicare and Medicaid Services–Intensive Behavioral Therapy
CPAP
continuous positive airway pressure
Crl
credible interval
CTFPHC
Canadian Task Force on Preventive Health Care
CV
cardiovascular
DBP
diastolic blood pressure
DSM-IV
Diagnostic and Statistical Manual of Mental Disorders, Fourth Edition
DTSQ
Diabetes Treatment Satisfaction Questionnaire
EOSS
Edmonton Obesity Staging System
FAS
full analysis set
FFA
free fatty acids
FPG
fasting plasma glucose
GI
gastrointestinal
GLP-1
glucagon-like peptide-1
HDL
high-density lipoprotein
HRQoL
health-related quality of life
IBT
intensive behavioural therapy
ITT
intention-to-treat
IV/WRS
Interactive Voice/Web Response System
IWQoL
Impact of Weight on Quality of Life
IWQOL-Lite
Impact of Weight on Quality of Life-Lite
LDL
low-density lipoprotein
LOCF
last observation carried forward
LSM
least squares mean
MCS
mental component summary
MID
minimal important difference
NB
naltrexone hydrochloride and bupropion hydrochloride
NMA
network meta-analysis
OAD
oral antidiabetic drug
OR
odds ratio
OSA
obstructive sleep apnea
PCS
physical component summary
PHQ-9
Patient Health Questionnaire-9
PT
phentermine-topiramate
RCT
randomized controlled trial
SAE
serious adverse event
SAS
safety analysis set
SBP
systolic blood pressure
SD
standard deviation
SEM
standard error of the mean
SF-36
Short Form (36) Health Survey
SU
sulphonylurea
T2DM
type 2 diabetes mellitus
TEAE
treatment-emergent adverse event
TRIM-Weight
Treatment Related Impact Measure of Weight
WDAE
withdrawal due to adverse event
Executive Summary
An overview of the submission details for the drug under review is provided in Table 1.
Item | Description |
|---|---|
Drug product | Liraglutide 6 mg/mL (Saxenda) |
Indication under review | Indicated as an adjunct to a reduced-calorie diet and increased physical activity for chronic weight management in adult patients with an initial BMI of:
|
Reimbursement request | As an adjunct to a reduced-calorie diet and increased physical activity for chronic weight management in adult patients who have been diagnosed with:
|
Health Canada approval status | NOC |
Health Canada review pathway | Standard |
NOC date | February 26, 2015 |
Sponsor | Novo Nordisk Canada Inc. |
BMI = body mass index; NOC = Notice of Compliance.
Introduction
The WHO (WHO) defines overweight and obesity as abnormal or excessive fat accumulation that presents a risk to health.1 The 2 are distinguished from each other based on body mass index (BMI), where a BMI over 25 kg/m2 is considered overweight, and over 30 kg/m2 is obese.1 Identified determinants of overweight and obesity include physical activity, diet, socioeconomic status (such as income and education), ethnicity, immigration, and environmental factors.2 In 2019, overweight and obesity rates among adults aged 18 years to 79 years in Canada were 35.5% and 24.3%, respectively.3 The Canadian Task Force on Preventive Health Care (CTFPHC) has reported that over 2-thirds of Canadian men (67%) and more than half of Canadian women (54%) are overweight or living with obesity.4
Obesity is associated with an increased risk of a wide range of illnesses and long-term conditions, including type 2 diabetes, hypertension, gallstones, gastroesophageal reflux disease, and cancer, as well as psychological and psychiatric morbidities.5 WHO has reported that more than 4 million people die each year as a result of being overweight or living with obesity.1 It is estimated that median survival is reduced by 2 years to 4 years for those with a BMI of 30 kg/m2 to 35 kg/m2 and by 8 years to 10 years for those with a BMI of 40 kg/m2 to 50 kg/m,2 whereas weight loss of 5 kg to 10 kg reduces the long-term risk of diseases associated with obesity.5 For example, it has been estimated that a loss of 10 kg may lead to a reduction in total cholesterol of 0.25 mmol/L and a reduction in diastolic blood pressure (DBP) of 4 mm Hg.6
The treatment of choice to manage overweight and obesity is a multi-component interventions approach with respect to provider discipline, as well as length and format of treatment.4,7 The CTFPHC has stated that behavioural interventions focusing on diet, increasing exercise, making lifestyle changes, or any combination of these are the preferred options, as the benefit-to-harm ratio appears more favourable than for pharmacologic interventions.4 However, while initially effective for many individuals, diet or behaviour modification alone is often difficult to sustain and many individuals regain weight upon discontinuation.8 Therefore, drug therapy for chronic weight management as an adjunct to lifestyle intervention may help individuals to achieve and sustain clinically relevant weight loss.8 Pharmacotherapy for weight management is indicated only for those with a BMI of at least 30 kg/m2, or those with a BMI of at least 27 kg/m2 with at least 1 comorbidity who have failed a previous lifestyle attempt at weight loss,9 and may be considered only after dietary, exercise, and behavioural approaches have been started and evaluated, and for patients who have not reached their target weight loss or have reached a plateau on dietary, activity, and behavioural changes.7 Two other drugs approved for use in Canada with similar indications are orlistat and the naltrexone hydrochloride and bupropion hydrochloride (NB) combination tablet.
The drug under review is liraglutide 3 mg (Saxenda), which is a human glucagon-like peptide-1 (GLP-1) analogue with Health Canada approval to be used as an adjunct to a reduced-calorie diet and increased physical activity for chronic weight management as detailed in Table 1.10 The drug regulates appetite by increasing feelings of fullness and satiety, while lowering feelings of hunger and prospective food consumption.10 Liraglutide 3 mg is available as a solution for subcutaneous injection at a strength of 6 mg/mL in a pre-filled, multi-dose pen.10 Treatment is initiated at a dose of 0.6 mg daily for 1 week, after which the daily dose is escalated at weekly increments of 0.6 mg over 4 weeks to reach the recommended daily maintenance dose of 3 mg daily.10
The objective of this systematic review is to evaluate the beneficial and harmful effects of liraglutide 6 mg/mL for subcutaneous injection as an adjunct to a reduced-calorie diet and increased physical activity for chronic weight management in adults.
Stakeholder Perspectives
The information in this section is a summary of input provided by the patient groups that responded to CADTH’s call for patient input and from clinical expert(s) consulted by CADTH for the purpose of this review.
Patient Input
Three Canadian patient organizations — Obesity Canada, Diabetes Canada, and the Gastrointestinal (GI) Society — provided input for this submission. Obesity Canada is Canada’s leading obesity registered charity association for professionals and patients, contributing research, education, and advocacy for Canadians living with obesity. Diabetes Canada is a national health charity that represents Canadians living with, or at risk of, diabetes and focuses on research and policy initiatives for diabetes prevention, care, and cure at the population level. The GI Society is a national charity committed to improving the lives of people with GI and liver conditions through research, advocating for increased access to health care, and promoting GI and liver health.
Obesity Canada conducted patient interviews and an online survey, where 5 of the individuals interviewed and 60% of the survey respondents had used liraglutide 3 mg for obesity management. Diabetes Canada submitted patient input using data from 2 online surveys conducted in July and August 2020 and in December 2020 and January 2021. The GI Society used data from patient and patient caregiver interviews, the results of published studies, and a survey conducted from October 6, 2020, to January 10, 2021, among individuals living with obesity. All 3 patient input groups submitted conflict of interest disclosures, which can be found on the CADTH website.
Patient groups reported that obesity not only increases the potential for the development of further disease(s), but it leads to inequities in access to employment, health care, and education due to the strong stigma associated with it. The GI Society reported that 72% of their survey respondents experienced social stigma as a result of living with obesity, with many reporting that they avoid getting medical care because they feel as though their physician shames them because of their weight. Individuals living with obesity also report frustration with the impact that the chronic and often misunderstood disease has on their overall quality of life.
Currently, most Canadians living with obesity reported using diet and exercise, medications, or bariatric surgery to combat the disease. Many who diet and exercise have difficulty sustaining their efforts or finding a program that suits their needs, which can lead to depression, hopelessness, and further weight gain. Approved medications include NB (Contrave), liraglutide (Saxenda), and orlistat (Xenical), all of which have undesirable side effects. Despite the availability of these drugs, the GI Society reported many concerns about obtaining and paying for the prescriptions of these drugs.
Patient groups reported that many patients would like a treatment that is effective in the long-term, is affordable, and has no or minimal side effects. Patient groups hope that liraglutide 3 mg may help people to better manage their weight, potentially delaying or preventing the development of comorbidities, such as the progression of prediabetes to type 2 diabetes. Furthermore, when asked about outcomes to consider, it was reported that patients focused less on improved weight than on improved health-related comorbidities (e.g., diabetes, hypertension, and sleep apnea) as well as outcomes related to everyday life such as productivity, energy levels, sleep, activity, and mental health.
Clinician Input
Input From Clinical Experts Consulted by CADTH
The clinical expert consulted for this review noted that side effects limit the use of all 3 pharmacotherapies approved in Canada, with some patients needing to stop the medication completely due to side effects. The clinical expert acknowledged that the weight loss seen with medications for obesity will often fall within a range of 5% to 10%, which is considered adequate to ameliorate weight-related comorbidities such as type 2 diabetes and osteoarthritis. However, in an ideal world, we would have pharmacotherapy that promotes larger amounts of weight loss.
The expert indicated that in accordance with the Obesity Canada 2020 guidelines, pharmacotherapy can realistically be used anywhere in a patient’s weight management journey. Further, although the expert indicated that it is reasonable for a patient to try lifestyle intervention first before starting liraglutide 3 mg, that approach is not necessary, particularly for patients at higher BMIs. Since the mechanism of action is very different from NB and orlistat, some physicians are prescribing combinations of these agents for weight loss, despite minimal evidence to support this.
The clinical expert stated that currently, there is no way to predict which patients will lose the most weight with liraglutide, but that qualifying patients can be identified using the traditional definition of overweight and obesity based on BMI category. Patients most in need of intervention for weight loss are those who have the highest burden of weight-related comorbidities, those with Edmonton Obesity Staging System (EOSS) score ranging from EOSS 1 to EOSS 3, and patients with Class III obesity (i.e., BMI > 40 kg/m2).
The clinical expert consulted for this review stated that in general, weight-loss outcomes are assessed based on change in BMI and weight, whereas weight-related comorbidity outcomes are evaluated using change in parameters such as blood pressure, glycemic control, and lipid profile. Weight-loss response is assessed after 12 weeks to 16 weeks at the maximum dose (along with behavioural and lifestyle changes) to decide whether to continue the medication at that point. The expert indicated that most physicians would agree that a 5% to 10% total body weight loss is clinically meaningful and is typically felt to be associated with improved metabolic parameters. Based on experience, the expert stated that once the patient is successful on a stable dose of liraglutide 3 mg, assessments could be spaced at 3-month intervals, and eventually every 6 months.
According to the clinical expert consulted for this review, treatment discontinuation decisions are influenced by patients’ preferences, side effects (most commonly, GI side effects), and rare but serious adverse effects such as pancreatitis, worsening in mood, or increase in anxiety.
According to the clinical expert, primary care providers can diagnose obesity and overweight, safely prescribe liraglutide 3 mg, and monitor their patients over time.
Clinician Group Input
No clinician group input was received for this review.
Drug Program Input
The drug plans requested clarification regarding the potential target patient population and the anticipated treatment duration of liraglutide. The clinical expert considered that it would be reasonable to consider pharmacotherapy in patients with a BMI between 27 kg/m2 and 30 kg/m2 without comorbidity as second-line after lifestyle changes, although this would be beyond the Health Canada–approved indication. The expert felt that patients would regain the weight they had lost if pharmacologic treatment for weight management was discontinued; therefore, such treatments would need to be continued in the long-term, even in patients whose BMI dropped below 30 kg/m2 (or 27 kg/m2 in patients with weight-related comorbidities). The public drug plans also requested clarification regarding re-treatment in patients who regain weight, or if liraglutide 3 mg becomes ineffective over time after an initial desired response. The clinical expert noted that if there is no benefit after a patient tries weight-loss medication for the first time, it is unlikely they will respond better to it in the future. Therefore, it is unlikely that the drug will be prescribed for the same indication again in that patient.
Clinical Evidence
Pivotal Studies and Protocol Selected Studies
Description of Studies
A total of 4 phase III RCTs (i.e., Study 1839,11 Study 1922,12 Study 1923,13 and Study 397014) met the inclusion criteria of this CADTH systematic review. They were all parallel-group, multi-centre, double-blind, placebo-controlled trials, conducted in multiple sites and in 2 countries or more, including Canada. A total of 5,358 adult patients were randomized across the 4 studies. Study 1839 consisted of a 56-week main phase and a 104-week extension phase. The primary objective of the main phase of Study 183911 was to establish the efficacy of liraglutide 3 mg compared with placebo in inducing and maintaining weight loss in patients who are overweight or living with obesity without diabetes over 56 weeks, whereas the objective of the extension phase15 was to investigate the long-term efficacy of liraglutide 3 mg compared to placebo in delaying the onset of type 2 diabetes mellitus (T2DM) in patients who are overweight or living with obesity, and who had prediabetes at screening, after a total of 160 weeks of treatment in the main and extension phases. Of the total 3,731 patients randomized to take part in the main phase of the trial, 2,200 patients with prediabetes at screening continued into the 104-week extension phase.15 The primary objectives of the other trials were as follows:
to investigate the efficacy of liraglutide 3 mg compared to placebo in inducing and maintaining weight loss in patients who are overweight or living with obesity with T2DM after 56 weeks (Study 1922)12
to compare the efficacy of liraglutide 3 mg versus placebo in maintaining run-in weight loss (≥ 5% achieved in a 4-week to-12-week low-calorie run-in period) over 56 weeks in patients living with obesity or patients who are overweight with comorbidities (Study 1923)13
to compare the efficacy of liraglutide 3 mg versus placebo in inducing weight loss beyond that achieved in run-in (≥ 5% achieved in a 4-week to 12-week low-calorie run-in period) over 56 weeks in patients living with obesity or patients who are overweight with comorbidities (Study 1923)13
to investigate if treatment with liraglutide 3 mg reduces the severity of obstructive sleep apnea (OSA) (assessed by the apnea-hypopnea index [AHI]) compared to placebo, both in combination with lifestyle intervention in patients living with obesity and moderate or severe OSA who were unable or unwilling to use continuous positive airway pressure (CPAP) treatment (Study 3970).14
In all the studies, patients were randomly assigned to receive once-daily subcutaneous injections of liraglutide 3 mg or placebo that matched the active drug in appearance, quantity, and route of administration. Treatments were started in accordance with the product monograph recommendation of 0.6 mg daily for 1 week, titrated at weekly increments of 0.6 mg over 4 weeks to reach the recommended daily maintenance dose of 3 mg to mitigate GI side effects. Patients in both the liraglutide 3 mg and placebo groups received counselling on lifestyle modification from randomization and throughout the entire trials. Counselling was provided by a qualified dietitian according to local standards and the patients were put on a reduced-calorie diet containing a maximum of 30% of energy from fat, approximately 20% of energy from protein, and approximately 50% of energy from carbohydrates, and with an energy deficit of approximately 500 kcal/day compared with the patients’ estimated total energy expenditure.
Three studies11-13 had 3 co-primary end points assessed after 56 weeks of treatment. These comprised the percentage change in fasting body weight from baseline,11-13 the proportion of patients losing 5% or more of baseline fasting body weight (5% responders),11-13 the proportion of patients losing more than 10% of baseline fasting body (10% responders),11,12 and the percentage of patients maintaining run-in fasting weight loss from baseline.13 The primary end point for the extension phase of Study 1839 was the proportion of patients with onset of T2DM at week 160 among patients who had prediabetes at baseline,15 and the primary end point for Study 3970 was change from baseline in AHI after 32 weeks.14 Secondary end points reported by the trials that met the protocol’s listed outcomes for this review included changes in BMI, health-related quality of life (HRQoL), glycemic control, and weight-related comorbidity (i.e., blood pressure and lipid profile parameters outcomes), though no secondary end points were controlled for multiple comparisons.
Overall, the treatment groups in all the included studies appeared well balanced with respect to baseline demographics and other characteristics. The study populations in all the trials were predominantly White, with percentages ranging from 72% to 88%, and most of the patients (> 85%) had a BMI of 30 kg/m2 or more. In 3 of the studies, the percentage of female participants was between 54% and 78%. Patients’ mean ages ranged between 45 years and 55 years across the studies. In Study 1923, only patients who achieved at least 5% loss in body weight on a low-calorie diet during the run-in period continued to the randomization phase for allocation to either liraglutide 3 mg or placebo for 56 weeks.
Efficacy Results
Table 2 presents a summary of key end point results from the included studies.
Percentage Change in Body Weight From Baseline
Primary analysis results from the main phase of Study 1839 showed that liraglutide 3 mg was superior to placebo regarding the percentage weight loss from baseline after 56 weeks of treatment, with a treatment difference of −5.39 (95% CI, −5.82 to −4.95; P < 0.0001). The other studies reported consistent findings with the main phase of Study 1839, as shown by the following treatment estimate differences:
Study 1839 extension: Difference = –4.32 (95% CI, –4.94 to −3.70; not controlled for multiplicity)
Study 1922: Difference = –3.97 (95% CI, –4.84 to –3.11; P < 0.0001)
Study 1923: Difference = –6.06 (95% CI, –7.50 to –4.62; P < 0.0001)
Study 3970: Difference = –4.15 (95% CI, –5.21 to –3.09; not controlled for multiplicity)
5% Responders
Primary analysis results from the main phase of Study 1839 showed that liraglutide 3 mg was superior to placebo for the odds of achieving at least 5% reduction from baseline body weight after 56 weeks of treatment. The odds ratio (OR) was 4.80 (95% CI, 4.12 to 5.60; P < 0.0001). The other studies reported consistent findings, as shown by the following ORs:
Study 1839 extension: OR = 3.22; (95% CI, 2.63 to 3.94; not controlled for multiplicity)
Study 1922: OR = 6.81 (95% CI, 4.34 to 10.68; P < 0.0001)
Study 1923: OR = 3.86 (95% CI, 2.44 to 6.09; P < 0.0001)
Study 3970: OR = 3.92 (95% CI, 2.41 to 6.38; not controlled for multiplicity)
10% Responders
Primary analysis results from the main phase of Study 1839 showed that liraglutide 3 mg was superior to placebo for the odds of achieving greater than 10% reduction from baseline body weight after 56 weeks of treatment. The OR was 4.34 (95% CI, 3.54 to 5.32; P < 0.0001). The other studies reported consistent findings with the pivotal study, as shown by the following ORs:
Study 1839 extension: OR = 3.09 (95% CI, 2.35 to 4.05; not controlled for multiplicity)
Study 1922: OR = 7.10 (95% CI, 3.48 to 14.48; P < 0.0001)
Study 1923: OR = 5.30 (95% CI, 2.79 to 10.08; not controlled for multiplicity)
Study 3970: OR = 18.96 (95% CI, 5.69 to 63.14; not controlled for multiplicity)
Maintaining Run-In Weight Loss
Primary analysis results from Study 1923 showed that liraglutide 3 mg was superior to placebo for the odds of maintaining run-in weight loss after 56 weeks of treatment. The OR was 4.82 (95% CI, 3.01 to 7.71; P < 0.0001). No other study measured this outcome.
Time to Onset of Type 2 Diabetes Mellitus
Primary analysis results from the extension phase of Study 1839 showed that liraglutide 3 mg was superior to placebo in delaying the progression to T2DM among patients with prediabetes after 160 weeks of treatment in the trial’s main and extension phases. A Weibull analysis showed an annualized T2DM incidence rate of 0.8 for liraglutide 3 mg versus 3.2 for placebo, with a treatment estimate of 2.681 (95% CI, 1.856 to 3.872; P < 0.0001). Thus, after 160 weeks of treatment, the estimated time to onset of T2DM for prediabetes patients treated with liraglutide 3 mg was close to 3 times longer than prediabetes patients treated with placebo. No other study measured this outcome.
Secondary outcomes identified as relevant to the CADTH review included change in BMI, HRQoL, and outcomes associated with weight-related comorbidities such as the development of T2DM, glycemic control, and change in other medications. However, none of these outcomes was controlled for multiplicity; therefore, results must be considered with regard to type I error.
Harms Results
Key harms results have been summarized in Table 3. Treatment-emergent adverse events (TEAEs) were more common with liraglutide 3 mg than placebo in all the trials. The overall adverse event (AE) rates associated with liraglutide 3 mg were between 80.1% and 94.7%, whereas the incidence of AEs was between 69.3% and 89.4% with placebo. The most common AEs (i.e., occurring in ≥ 5% of patients) with liraglutide 3 mg across all the included studies were nausea (26.7% to 47.6%), diarrhea (16.5% to 25.6%), and constipation (11.9% to 26.9%).
Serious adverse event (SAE) rates were between 3.4% and 15.1% with liraglutide 3 mg compared with 2.4% to 12.9% with placebo. The most frequent SAEs with liraglutide 3 mg (i.e., occurring in 1% or more of patients) were hepatobiliary disorders (2.5% or less, only in Study 1839), and infections and infestations (2.3%, in Study 1839 only). Rates of neoplasms (i.e., benign, malignant, and unspecified) were 1.7%, 1.9%, and 2.1% in Study 1922, Study 1923, and the Study 1839 extension, respectively.
The percentage of patients who discontinued treatment prematurely due to AEs was higher with liraglutide 3 mg than with placebo in all the studies. The rate of discontinuation due to AEs ranged from 8.6% to 13.3% in the liraglutide 3 mg group compared with 3.3% to 11.1% in the placebo group.
Briefly, in Study 1839, 1 death occurred in the liraglutide 3 mg group and 2 deaths occurred in the placebo group during the main phase of the study. By the end of the study’s extension phase, each group had a total of 2 deaths, corresponding to mortality rates of 0.1% and 0.3% for the liraglutide 3 mg and placebo groups, respectively. No deaths were reported during Study 1922 or Study 3970, and 1 death occurred in the placebo group in Study 1923.
GI symptoms were the most frequent AEs overall, and they were also the most common notable harms. The clinical expert consulted for the review noted that GI AEs are common with all drugs approved in Canada for chronic weight management, adding that they can be managed by introducing the drug gradually over a period of time to get to the maximum effective dose. The product monograph of liraglutide 3 mg provides a dose escalation schedule intended to help mitigate GI AEs.
Table 2: Summary of Key Efficacy Outcomes — Change in Body Weight–Related End Points From Pivotal and Protocol Selected Studies, Full Analysis Seta
Efficacy outcomes | Study 1839, 56 weeks | Study 1839 extension, 104 weeks | Study 1922, 56 weeks | Study 1923, 56 weeks | Study 3970, 32 weeks | |||||
|---|---|---|---|---|---|---|---|---|---|---|
Treatment | LIRA 3 mg | PL | LIRA 3 mg | PL | LIRA 3 mg | PL | LIRA 3 mg | PL | LIRA 3 mg | PL |
N | 2,432 | 1,225 | 1,472 | 738 | 412 | 211 | 207 | 206 | 180 | 179 |
Change (%) in baseline body weightb | ||||||||||
End point | First co-primaryc | Secondaryd | First co-primaryc | First co-primaryc | First co-primaryc | |||||
Change (%), mean (SD) | –7.98 (6.67) | –2.62 (5.74) | –6.14 (7.34) | –1.89 (6.27) | –5.9 (5.5) | –2.0 (4.3) | –6.2 (7.3) | –0.2 (7.0) | –5.72 (5.59) | –1.59 (4.46) |
Difference, LIRA vs. placebo (95% CI) | –5.39 (–5.82 to –4.95) | 3.22 (2.637 to 3.94) | –3.97 (–4.84 to –3.11) | –6.06 (–7.50 to –4.62) | –4.15 (–5.21 to –3.09) | |||||
P value | < 0.0001 | < 0.0001 | < 0.0001 | < 0.0001 | < 0.0001 | |||||
≥ 5% baseline body weight losse | ||||||||||
End point | Second co-primaryc | Secondaryd | Second co-primaryc | Third co-primaryc | Secondaryd | |||||
5% responders, n (%) | 1,536 (63.2) | 331 | 727 (49.6) | 174 (23.7) | 205 (49.9) | 29 (13.8) | 96 (46.4) | 43 (20.9) | 175 (46.4) | 178 (18.1) |
OR, LIRA vs. placebo (95% CI) | 4.80 (4.12 to 5.60) | 3.22 (2.637 to 3.94) | 6.81 (4.34 to 10.68) | 3.86 (2.44 to 6.09) | 3.92 (2.41 to 6.38) | |||||
P value | < 0.0001 | < 0.0001 | < 0.0001 | < 0.0001 | < 0.0001 | |||||
> 10% baseline body weight losse | ||||||||||
End point | Third co-primaryd | Secondaryd | Third co-primaryd | Secondaryd | Secondaryd | |||||
10% responders, n (%) | 805 (33.1) | 129 | 364 (24.8) | 73 | 96 (23.4) | 9 | 54 (26.1) | 13 | 41 (23.4) | 3 |
OR, LIRA vs. placebo (95% CI) | 4.34 (3.54 to 5.32) | 3.086 (2.350 to 4.052) | 7.10 (3.48 to 14.48) | 5.30 (2.79 to 10.08) | 18.96 (5.69 to 63.14) | |||||
P value | < 0.0001 | < 0.0001 | < 0.0001 | < 0.0001 | < 0.0001 | |||||
Maintaining run-in weight losse | ||||||||||
End point | NA | NA | NA | NA | Second | |||||
Maintained run-in weight loss, n (%) | NR | NR | NR | NR | 170 (82.1) | 69 (47.9) | ||||
OR, LIRA vs. placebo (95% CI) | NR | NR | NR | NR | 4.82 (3.01 to 7.71) | |||||
P value | NR | NR | NR | NR | < 0.0001 | |||||
Time to onset of T2DM | ||||||||||
Annualized T2DM incidence rate | NR | NR | 0.8 | 3.2 | NR | NR | NR | |||
Treatment estimate (Weibull analysis), LIRA 3 mg vs. placebo (95% CI) | NR | 2.681 (1.856 to 3.872) | NR | NR | NR | |||||
Hazard ratio, LIRA vs. placebo | NR | 0.207 | NR | NR | NR | |||||
P value | NR | < 0.0001 | NR | NR | NR | |||||
CI = confidence interval; FAS = full analysis set; LIRA = liraglutide; LOCF = last observation carried forward; NA = not applicable; NR = not reported; OR = odds ratio; PL. = placebo; SD = standard deviation; T2DM = type 2 diabetes mellitus; vs. = versus.
aThe FAS included all randomized patients exposed to at least 1 dose of the trial product and with at least 1 post-baseline measurement of the pre-specified end points.
bThe change from baseline was analyzed using an ANCOVA model, and missing data were imputed using the LOCF method.
cAnalyses comparing liraglutide 3 mg with placebo for the primary end points used a hierarchical approach to control for multiplicity.
dThe results of secondary analyses were not controlled for multiplicity and should be interpreted with consideration for risk of type I error.
eThe proportion of patients losing at 5% or more of baseline body weight or more than 10% of baseline body weight and the percentage of patients maintaining run-in weight loss (i.e., gaining ≤ 0.5% after randomization) were analyzed using logistic regression analysis. Missing data were imputed using the LOCF method.
Sources: Clinical Study Reports for Study 1839,11 Study 1839 extension,15 Study 1922,12 Study 1923,13 and Study 3970.14
Table 3: Summary of Key Safety Results From Pivotal and Protocol Selected Studies, Safety Analysis Seta
Harms outcomes | Study 1839, 56 weeks | Study 1839 ext., 104 weeks | Study 1922, 56 weeks | Study 1923, 56 weeks | Study 3970, 32 weeks | |||||
|---|---|---|---|---|---|---|---|---|---|---|
Treatment | LIRA 3 mg | PL | LIRA 3 mg | PL | LIRA 3 mg | PL | LIRA 3 mg | PL | LIRA 3 mg | PL |
Harms, n (%) | ||||||||||
N | 2,481 | 1,242 | 1,501 | 747 | 422 | 212 | 212 | 210 | 176 | 179 |
AEs | 2,285 (92.1) | 1,043 (84.0) | 1,421 (94.7) | 668 (89.4) | 392 (92.9) | 182 (85.8) | 194 (91.5) | 186 (88.6) | 141 (80.1) | 124 (69.3) |
SAEs | 154 (6.2) | 62 | 227 (15.1) | 96 (12.9) | 37 | 13 (6.1) | 9 (4.2) | 5 (2.4) | 6 (3.4) | 14 (15.6) |
WDAEs (from study treatment) | 238 (9.6) | 47 (3.8) | 200 (13.3) | 43 (5.6) | 39 (9.2) | 7 (3.3) | 18 (8.5) | 18 (8.6) | 20 (11.1) | 6 (3.4) |
Deaths | 1 (0.0) | 2 (0.2) | 2 (0.1) | 2 (0.3) | 0 (0.0) | 0 (0.0) | 0 (0.0) | 1 (0.5) | NR | NR |
Notable harms, n (%) | ||||||||||
Nausea | 997 (40.2) | 163 (14.7) | 614 (40.9) | 125 (16.7) | 138 (32.7) | 29 (13.7) | 101 (47.6) | 36 (17.1) | 47 (26.7) | 12 (6.7) |
Diarrhea | 518 (20.9) | 115 (9.3) | 379 (25.2) | 107 (14.3) | 108 (25.6) | 27 (12.7) | 38 (17.9) | 26 (12.4) | 29 (16.5) | 14 (7.8) |
Vomiting | 404 (16.3) | 51 (4.1) | 295 (19.7) | 40 (5.4) | 66 (15.6) | 12 (5.7) | 35 (16.5) | 5 (2.4) | 13 (7.4) | 5 (2.8) |
Hypoglycemia | 296 (11.9) | 41 (3.3) | 296 (19.7) | 35 (4.7) | 187 (44.3) | 59 (27.8) | 11 (5.2) | 5 (2.4) | NR | NR |
Dyspepsia | 236 (9.5) | 39 (3.1) | 154 (10.3) | 35 (4.7) | 47 (11.1) | 5 (2.4) | 20 (9.4) | 4 (1.9) | 15 (8.5) | 2 (1.1) |
Abdominal pain | 130 (5.2) | 43 (3.5) | 112 (7.5) | 39 (5.2) | 15 (3.6) | 2 (0.9) | 14 (6.6) | 3 (1.4) | NR | NR |
GERD | 122 (4.9) | 23 (1.9) | 98 (6.5) | 18 (2.4) | 16 (3.8) | 3 (1.4) | NR | NR | 10 (5.7) | 1 (0.6) |
Gallbladder disease | 55 (2.2) | 10 (0.8) | 66 (4.4) | 14 (1.9) | 4 (0.9) | 1 (0.5) | NR | NR | NR | NR |
Depression | 48 (1.9) | 25 (2.0) | 56 (3.7) | 31 (4.1) | NR | NR | NR | NR | NR | NR |
Cholelithiasis | 37 (1.5) | 8 (0.6) | 45 (3.0) | 11 (1.5) | 3 (0.7) | 1 (0.5) | NR | NR | NR | NR |
AE = adverse event; ext. = extension; GERD = gastroesophageal reflux disease; LIRA = liraglutide; NR = not reported; PL = placebo; SAE = serious adverse event; WDAE = withdrawal due to adverse event.
aThe safety analysis set comprised all randomized patients who had been exposed to at least 1 dose of the trial product.
Critical Appraisal
Although all the trials were double-blind randomized studies with a placebo control group, the proportion of patients who discontinued prematurely was high in all of the studies, resulting in significant amounts of missing data, which were imputed using last observation carried forward (LOCF). However, the higher rate of discontinuation due to AEs and the significant difference in weight loss with liraglutide 3 mg compared with placebo, as well as the larger proportion of patients who discontinued the study due to ineffective therapy in the placebo group, may have resulted in unblinding for some patients. In all the trials, statistical testing procedures were based on the primary end point such that the determination of study power and sample sizes did not consider secondary outcomes. Thus, there is a risk of type I error inflation in key outcomes such as HRQoL, glycemic control, and weight-related CV comorbidities. Moreover, depending on a patient’s response to treatment after 28 weeks, the study permitted the recalculation of dietary portions. However, there was no data to independently verify how often the diet adjustments happened and if they occurred in a balanced manner across treatment groups. It is important to note that considering the critical importance of calorie intake to weight management, an imbalance in this component of the co-intervention has the potential to tilt the outcomes in favour of 1 group over the other.
In all the trials, patients within the BMI bracket of 30 kg/m2 to 40 kg/m2 or more accounted for more than 85% of the study population. This indicates that a group of patients specified in the indication (i.e., patients who are overweight with a BMI of 27 kg/m2 to less than 30 kg/m2 with comorbidities) was not adequately represented in any of the studies. Further, the trials enrolled predominantly White patients (72% to 88%) and in 3 of the studies, the patients were mostly women (54% to 78%). According to the clinical expert consulted in this review, the study population does not reflect the ethnicity mix of patients who are overweight or living with obesity in Canada. Also, the high proportion of women in the study populations differs from the 67% rate of obesity in adult males in Canada, as reported by CTFPHC.4 The exclusion criteria denied entry to some patients, such as those on medication that causes weight gain and those regaining weight after a previous bariatric surgery, who would be considered clinically relevant patients and who may require pharmacotherapy for chronic weight management. The extent to which these issues affect the generalizability of the reported findings is unknown.
Indirect Treatment Comparisons
Description of Studies
One systematic review with network meta-analysis (NMA)16 published in 2016 was included in the review. It compared 5 FDA-approved weight-loss drugs for efficacy and adverse effects in patients living with obesity (BMI ≥ 30 kg/m2) or overweight (BMI ≥ 27 kg/m2) with at least 1 weight-related comorbidity. The drugs tested were liraglutide 3 mg, orlistat, naltrexone hydrochloride 8 mg and bupropion hydrochloride 90 mg combination in extended-release tablets, lorcaserin, and phentermine-topiramate [PT]). Eligible studies had to be RCTs using the most effective FDA-approved dosage of the drug for at least 1 year and reporting outcomes on differences in mean weight loss between treatment groups or the proportion of patients achieving at least 5% weight loss. Primary studies for the systematic review of the NMA were identified through a systematic literature search of multiple databases from inception until March 2016. Study screening and data extraction were performed independently by 2 reviewers, resolving conflicts by consensus involving a third reviewer. The quality of the primary RCTs was assessed using the Cochrane Risk of Bias tool, and the GRADE method17 was used to evaluate the quality of evidence in the NMA.
The primary efficacy outcome of the NMA was the proportion of patients with 5% or more weight loss from baseline at 1 year. Other efficacy outcomes assessed were the proportion of patients with at least 10% weight loss and the incremental change in weight in kilograms from baseline over placebo after 1 year of follow-up. The NMA did not assess efficacy outcomes concerning weight-related comorbidities or HRQoL. The only harms outcome assessed was the proportion of patients discontinuing treatment due to AEs. Overall AEs and SAEs were not evaluated.
Random-effects Bayesian NMAs with Markov chain Monte Carlo methods. Publication bias was assessed by examining the funnel plot and using the Egger regression test. However, clinical heterogeneity was not assessed among RCTs for the different direct or pairwise comparisons.
Efficacy Results
A total of 28 relevant RCTs were included. There were 16 RCTs of orlistat versus placebo, 2 RCTs of liraglutide 3 mg versus placebo, 4 RCTs of NB versus placebo, 3 RCTs of lorcaserin versus placebo, 2 RCTs of PT versus placebo, and 1 3-armed RCT comparing orlistat and liraglutide 3 mg with placebo. The mean weight of the study populations across the RCTs was between 95.3 kg and 115.8 kg but was similar for treatment groups in each study. Liraglutide 3 mg and the relevant comparators (orlistat) were administered at the Health Canada–approved dosages, each as an adjunct to low-calorie diet and physical activity co-intervention. Outcome from comparisons between liraglutide 3 mg versus orlistat are reported as follows.
Achieving Weight Loss of 5% or More
The results of a direct meta-analysis of data from 3 studies (N = 4,563) showed that patients treated with liraglutide 3 mg had greater odds of achieving at least 5% weight loss compared with orlistat, as indicated by an OR of 3.66 (95% credible interval [CrI], 1.79 to 7.46). The NMA also found that treatment with liraglutide 3 mg increases the odds of a patient losing at least 5% of body weight compared with orlistat (OR = 2.06; 95% CrI, 1.51 to 2.96).
Achieving Weight Loss of 10% or More
The results of a direct meta-analysis of data from 3 studies (N = 4,563) showed that patients treated with liraglutide 3 mg had greater odds of achieving at least 10% weight loss compared with orlistat, as indicated by an OR of 3.87 (95% CrI, 1.65 to 9.04). The results of the NMA comparison between liraglutide 3 mg and orlistat were consistent with this finding, with an OR of 2.07 (95% CrI, 1.48 to 3.20) in favour of liraglutide 3 mg.
Mean Weight Loss in Excess of Placebo
Treatment with liraglutide 3 mg resulted in greater incremental weight loss (in kilograms) over placebo compared with orlistat, as indicated by results of both the direct meta-analysis (weighted mean difference = − 3.99; 95% CrI, −5.18 to −2.62) and the NMA (weighted mean difference = –2.68; 95% CrI, –3.35 to –1.83).
Discontinuation of Therapy Due To Adverse Events
The direct meta-analysis found no difference between liraglutide 3 mg and orlistat regarding discontinuation of therapy as due to AEs (weighted mean difference = 3.50; 95% CrI, 0.70 to 17.49). However, findings from the NMA indicate that treatment discontinuation due to adverse AEs occurs more with liraglutide 3 mg than with orlistat (weighted mean difference = 1.6; 95% CrI, 1.10 to 2.40).
Harms Results
The NMA reported on therapy discontinuation due to AEs. The direct meta-analysis found no difference between liraglutide 3 mg and orlistat regarding discontinuation of therapy due to AEs (weighted mean difference = 3.50; 95% CrI, 0.70 to 17.49). However, findings from the NMA indicate that treatment discontinuation due to adverse AEs occurred more with liraglutide 3 mg than with orlistat (weighted mean difference = 1.6; 95% CrI, 1.10 to 2.40).
Critical Appraisal
The following limitations have potential to impact the findings of the NMA:
The primary RCTs were low in quality and the high attrition in all the RCTs undermined confidence in the outcomes due to a high risk of attrition bias.
There were variations in the dietary component of the co-intervention between orlistat and liraglutide that may have contributed to the statistical heterogeneity and distorted the outcomes.
A closed loop could be formed by orlistat, liraglutide, and placebo. Therefore, consistency throughout the network could not be assessed. Also, the portion of the loop connecting orlistat and liraglutide 3 mg was contributed by a single phase II RCT18 with 4 different liraglutide doses, including liraglutide 3 mg once daily, in which the placebo-controlled portion was double-blind whereas the orlistat comparator was open label. Thus, there is a low-quality issue that limits the evidence.
A run-in placebo treatment phase was more common in the orlistat versus placebo RCTs than in the RCTs of other comparators versus placebo. As a run-in phase may enrich the trial population with patients more likely to adhere to treatment, there may have been a bias in the results for any of the outcomes in favour of orlistat relative to the other comparators.
The encouragement of patients to continue with study assessment or return for the end-of-study assessment following treatment discontinuation was more common in the non-orlistat RCTs than in the orlistat RCTs. The potential direction of bias from this source of heterogeneity is unclear.
The GRADE quality of evidence assessment for the NMA’s comparisons was low for NB versus liraglutide 3 mg.
An assessment of clinical heterogeneity or the appropriateness of pooling trial results was not done. Also, an evaluation of heterogeneity was not feasible for NB versus orlistat or liraglutide 3 mg in the absence of any direct comparisons.
Other Relevant Evidence
Description of Studies
Two additional studies of comparative RCTs evaluating liraglutide 3 mg with intensive lifestyle intervention were identified as relevant to this review. Both trials provide additional evidence of liraglutide 3 mg compared with intensive lifestyle modification, which was identified as a comparator of interest in the CADTH review protocol.
Study 4274 was a prospective, multi-centre, double-blind, placebo-controlled, phase IIIb randomized trial to evaluate the health benefits of combining intensive behavioural therapy (IBT) with liraglutide 3 mg in adult patients living with obesity without diabetes, and Study NCT02911818 was a single-site, open-label, parallel-group randomized trial to assess whether the addition of liraglutide 3 mg to an IBT intervention would increase weight loss compared to IBT alone in adult patients living with obesity.
Across the 2 studies, a total of 432 patients were randomly assigned to be treated with liraglutide 3 mg or placebo. The participants were predominantly female (79% to 84%) and the mean age of patients was between 45 years and 49 years. The patients in Study 4274 were mostly White (79% and 82% for the liraglutide 3 mg and placebo groups, respectively), whereas for Study NCT02911818, 54.0% self-identified as non-Hispanic White, 44.7% as Black, and 6.7% as Hispanic. Overall, baseline characteristics appeared similar for the treatment groups of each study. However, in Study 4274, the liraglutide 3 mg group had a greater proportion of patients with a BMI of 40 kg/m2 or more than the placebo group (40.8% versus 30.7%).
In both trials, liraglutide 3 mg was used as an adjunct to the US Centers for Medicare and Medicaid Services (CMS)-IBT (CMS-IBT) at the approved dose and following recommended titration strategies previously described. The CMS-IBT consisted of weekly, 15-minute, in-person lifestyle counselling visits the first month, followed by visits every other week the next 5 months, approximating 14 contacts to 15 contacts over 6 months together with increased physical activity and specific daily energy intake based on patients’ weight. In Study 4274, the comparator was placebo plus CMS-IBT, whereas in Study NCT02911818, the comparator was CMS-IBT alone.
Study 4274 had 2 co-primary end points: change in body weight (%) from baseline to week 56, and the proportion of patients losing at least 5% of baseline body weight at week 56. The primary end point of Study NCT02911818 was the mean percentage reduction in baseline body weight at week 52.
Efficacy Results
Primary analysis results from Study 4274 showed that liraglutide 3 mg was superior to placebo with respect to relative mean change (%) in body weight and proportion of patients reaching a clinically relevant weight loss of 5% at week 56, shown as follows:
The mean change (%) baseline body weight at week 56 was −7.46% versus −4.01% for liraglutide 3 mg versus placebo, respectively, with an estimated treatment difference of −3.45% (95% CI, −5.31 to −1.59) in favour of the liraglutide 3 mg group (P = 0.0003).
The probability for achieving 5% or more loss of baseline body weight at week 56 was 60.6% versus 32.9% for liraglutide 3 mg versus placebo, respectively, with an OR of 2.51 (95% CI, 1.53 to 4.14; P = 0.0003).
The findings were consistent for the secondary outcome of the proportion of patients losing at least 10% of baseline body weight at week 56.
In Study NCT02911818, liraglutide 3 mg resulted in a significant reduction from baseline in body weight (%) at week 52, where the mean reduction in the IBT-liraglutide 3 mg group was 11.5% (standard error of the mean [SEM]) = ± 1.3), 6.1% (SEM = ± 1.3) in the IBT-alone group, and 11.8% (SEM = ± 1.3) in the multi-component group in favour of the IBT-liraglutide 3 mg group (P = 0.005) and the multi-component group (P = 0.003). Further, the mean reduction from baseline in BMI at week 52 in the IBT-liraglutide 3 mg group was 4.3 (SEM = ± 0.5), 2.3 (SEM = ± 0.5) in the IBT-alone group, and 4.6 (SEM = ± 0.5) in the multi-component group. Compared to the IBT-alone group, the results favoured the IBT-liraglutide 3 mg group (P = 0.003) and the multi-component group (P = 0.001).
Overall, after a year of treatment, results from both studies suggest that the patients in the liraglutide-based treatment groups had better outcomes than those in the placebo plus IBT group or IBT-alone group regarding percent mean weight loss from baseline and the proportion of patients losing 5% or more of baseline body weight. Results from Study 4274 also showed that significantly more individuals on liraglutide 3 mg than placebo achieved more than 10% weight loss and more than 15% weight loss relative to baseline body weight. The clinical expert consulted for this review noted that there are not many intensive lifestyle intervention programs available in Canada and that the number of patients accessing such programs is likely limited.
Harms Results
The overall AE rate for liraglutide 3 mg plus IBT was 96% in Study 4274 and 90% in NCT02911818. The corresponding rates for placebo plus IBT and IBT alone was 89% and 60%, respectively. SAE rates for the liraglutide 3 mg group and the placebo group were 4.2% and 1.4%, respectively, in Study 4274. In Study NCT02911818, the SAE rate was 4.0% in the IBT-alone group, whereas there were no SAEs reported in the IBT plus liraglutide group. No deaths were reported in either study. In Study 4274, premature discontinuation of treatment due to AEs was 9% and 4% in the liraglutide 3 mg and placebo groups, respectively. Study NCT02911818 did not report treatment discontinuations due to AEs. Similar to the AEs reported in the studies in the systematic review, GI symptoms were the most frequent AEs overall, and they were also the most common notable harms.
Critical Appraisal
Both Study 4274 and Study NCT02911818 used appropriate randomization methods — a web-based randomization system (Interactive Voice/Web Response System [IV/WRS]) to allocate patients to their treatment group. Study 4274 was a double-blind trial with blinding maintained over the entire treatment period, whereas Study NCT02911818 was an open-label study with an attempt at concealment or blinding. However, even for Study 4274, which implemented blinding, the high and unbalanced attrition rate driven by AEs in the liraglutide 3 mg group and less effective therapy within the placebo group may have resulted in unblinding for some patients. Thus, there was a risk of altered response and assessor bias caused by the study design of Study NCT02911818 and easily distinguishable effects of the intervention and control groups. Further, Study NCT02911818 was a single-site, open-label study, with a relatively small sample size (50 patients in each group). Therefore, evidence provided by this study is limited and unlikely to have a confirmatory value.
The patients enrolled in both Study 4274 and Study NCT02911818 were predominantly women, and for Study 4274, also mostly White. Furthermore, both studies excluded patients with a history of bariatric surgery and those with recent use of medications that cause weight loss, who make up a clinically relevant proportion of individuals seeking pharmacotherapy for management of obesity in real life. As previously discussed, these issues indicate that the study populations in these 2 trials may not be representative of Canadian patients living with obesity who have clinical needs for drug therapy to manage a chronic problem. Thus, there is uncertainty about the generalizability of the conclusion of the studies regarding the effectiveness and safety of liraglutide 3 mg-based interventions in the diverse population of patients in Canada who are overweight or living with obesity.
Conclusions
Overall, the results of 4 RCTs demonstrated that once-daily treatment with liraglutide 3 mg in addition to a background regimen of diet and exercise resulted in statistically significant and clinically meaningful reductions in body weight compared with placebo (in addition to diet and exercise). Further, results demonstrated that liraglutide 3 mg increased the likelihood of achieving 5% or less or more than 10% reduction in body weight. These results were consistently observed in a variety of patient populations, including those without diabetes, those with prediabetes, those with T2DM, and those with OSA. Results of subgroup analyses based on baseline BMI and prediabetes status at screening were consistent with these results. In patients with prediabetes, liraglutide 3 mg also showed superiority over placebo in delaying progression to T2DM. HRQoL was a secondary outcome in each of the trials, but results were inconsistent across measures and studies. Other outcomes of interest to the CADTH review included change in BMI, HRQoL, and glycemic control, and change in other medications. However, none of these outcomes was controlled for multiplicity; therefore, results must be considered with regard to type I error.
TEAEs occurred more frequently with liraglutide 3 mg than placebo. GI disorders were the most common AEs with liraglutide 3 mg and are generally manageable with a dose escalation strategy, as used in the 4 studies and as recommended in the product monograph.
Key limitations associated with the evidence reviewed are that patients with comorbidities and a BMI between 27 kg/m2 and less than 30 kg/m2 appeared to be underrepresented, and that there was a lack of comparative evidence.
Although indirect evidence from 1 NMA may suggest that patients treated with liraglutide 3 mg had greater odds of achieving clinically relevant weight loss (5% to 10%) compared with orlistat, confidence in these results is limited by significant heterogeneity and high attrition rates across all the included primary studies and by significant limitations involving the quality of the primary studies and methodological rigour.
Introduction
Disease Background
WHO defines overweight and obesity as abnormal or excessive fat accumulation that presents a risk to health.1 The 2 are distinguished from each other based on BMI, where a BMI over 25 kg/m2 is considered overweight, and over 30 kg/m2 is obese.1 Determinants associated with obesity have been identified as physical activity, diet, socioeconomic status (such as income and education), ethnicity, immigration, and environmental factors.2 WHO has reported that the problem of overweight and obesity has grown to epidemic proportions,1 and the Canadian Health Measures Survey found that in 2019, overweight and obesity rates among adults aged 18 years to 79 years in Canada were 35.5% and 24.3%, respectively.3 The CTFPHC has reported that more than 2-thirds of Canadian men (67%) and more than half of Canadian women (54%) are overweight or living with obesity.4
Obesity is associated with an increased risk of a wide range of illnesses and long-term conditions, including type 2 diabetes, hypertension, gallstones, gastroesophageal reflux disease, and cancer, as well as psychological and psychiatric morbidities.5 For instance, a positive association has been established between BMI and some psychiatric disorders, including depression and anxiety, and it has been reported that individuals living with obesity were 1.5 times more likely than individuals of normal weight to report such disorders.19 Also, a relationship has been established between obesity and sleep disturbances such as insomnia and OSA. Individuals living with obesity are also more likely to experience insomnia.20 According to the clinical expert consulted for this review, other weight-related comorbidities are extensive and include metabolic complications such as prediabetes, T2DM, and dyslipidemia, as well as osteoarthritis, certain types of cancers (e.g., endometrial, colon, renal, esophageal, and breast cancer in women), infertility, gallbladder disease, nonalcoholic fatty liver disease, and gout. Therefore, the goal of therapy in managing excess weight goes beyond weight loss to also target a reduction or improvement in weight-related comorbidities, and improve longevity and the patient’s quality of life.
WHO has reported that more than 4 million people die each year as a result of being overweight or living with obesity, according to the global burden of disease.1 It is estimated that median survival is reduced by 2 years to 4 years for those with a BMI of 30 kg/m2 to 35 kg/m2 and by 8 years to 10 years for those with a BMI of 40 kg/m2 to 50 kg/m2.5 Also, weight loss of 10 kg may lead to a reduction in total cholesterol of 0.25 mmol/L and DBP of 4 mm Hg.6 Thus, the treatment of overweight and obesity has health benefits, with weight loss of 5 kg to 10 kg reported to reduce the long-term risk of diseases associated with obesity.5
Standards of Therapy
The clinical expert consulted for this review stated that diagnosis of all weight-related comorbidities can be performed within the scope of any primary care provider without any foreseeable challenges with diagnosing overweight, obesity, or comorbidities. Thus, community care facilities and hospital outpatient clinics are appropriate settings for diagnosis and treatment. This is in consonance with recommendations of CTFPHC that interventions could be offered in primary care settings or settings where primary care practitioners may refer patients, such as credible commercial or community programs.4
The treatment of choice to manage overweight and obesity is a multi-component interventions approach with respect to provider discipline, length, and format.4,7 A critical component of this strategy is to support patients to achieve sustainable weight loss through the modification of diet, physical activity, and behaviour.7 The CTFPHC has stated that behavioural interventions focusing on diet, increasing exercise, making lifestyle changes, or any combination of these are the preferred option, as the benefit-to-harm ratio appears more favourable than for pharmacologic interventions.4 It has been estimated that a diet that provides a deficit of 600 kcal/day may be expected to produce weight loss of 5 kg over 1 year, whereas exercise and behavioural therapy may provide weight loss of approximately 2 kg and 8 kg, respectively, when added to a calorie-restricted diet.6
However, while initially effective for many individuals, diet or behaviour modification alone is often difficult to sustain and many individuals regain weight upon discontinuation.8 Therefore, drug therapy for chronic weight management as an adjunct to lifestyle intervention may help individuals to achieve and sustain clinically relevant weight loss.8 According to the Obesity Canada 2020 guidelines, drug therapy for weight management is indicated only for those with a BMI of 30 kg/m2 or more, or those with a BMI of 27 kg/m2 or more with at least 1 comorbidity who have failed a previous lifestyle attempt at weight loss.9 The UK’s National Institute for Health and Care Excellence advises that pharmacologic treatment be considered only after dietary, exercise, and behavioural approaches have been started and evaluated, and drug treatment should be considered for people who have not reached their target weight loss or have reached a plateau on dietary, activity, and behavioural changes.7
Currently, 3 drugs (liraglutide 3 mg, NB fixed-dose combination, and orlistat) have been approved in Canada for chronic weight management in adult patients with an initial BMI of 30 kg/m2 or greater or 27 kg/m2 or greater in the presence of at least 1 weight-related comorbidity (e.g., hypertension, type 2 diabetes, or dyslipidemia) and who have failed a previous weight management intervention. The clinical expert consulted for this review stated that it is likely that the most used off-label medication for weight loss currently is weekly injectable semaglutide, a GLP-1 receptor agonist that is indicated in Canada for the treatment of T2DM. The expert noted that there is some evidence for the use of metformin to prevent weight gain associated with the use of antipsychotic medications, and topiramate may be chosen for patients with migraines and seizures who need drug therapy for weight loss since the drug is indicated for those conditions.
Obesity Canada guidelines recommend that bariatric surgery may be considered for people with a BMI of 40 kg/m2 or more or a BMI of 35 kg/m2 or more with at least 1 obesity-related disease. The decision regarding the type of surgery should be made in collaboration with a multidisciplinary team, balancing the patient’s expectations, medical condition, and expected benefits and risks of the surgery.9
Concerning goals of therapy, the clinical expert consulted for this review stated that most physicians would agree that a 5% to 10% total body weight loss is clinically meaningful because it can ameliorate weight-related comorbidities such as type 2 diabetes and osteoarthritis. The clinical expert noted that improved weight or BMI alone is the least clinically meaningful outcome; therefore, treatments should target a reduction or improvement in weight-related comorbidities and improve longevity. However, weight stability for some patients may be a reasonable goal, especially in those with a rapid upwards weight trajectory (e.g., for some patients with weight regain after bariatric surgery, stabilizing weight is a success).
Drug
Liraglutide is a human GLP-1 analogue, which acts as a GLP-1 receptor agonist to regulate appetite by increasing feelings of fullness and satiety, while lowering feelings of hunger and prospective food consumption.10
Liraglutide 3 mg (Saxenda) is available as a solution for subcutaneous injection at a strength of 6 mg/mL in a pre-filled, multi-dose pen that delivers doses of 0.6 mg, 1.2 mg, 1.8 mg, 2.4 mg, or 3 mg.10 The initial dose of liraglutide 3 mg is 0.6 mg daily for 1 week, after which the daily dose is escalated at weekly increments of 0.6 mg to reach the recommended daily maintenance dose of 3 mg per day over 4 weeks.10
Liraglutide 3 mg received a Health Canada Notice of Compliance on February 26, 2015, with an initial indication to be used as an adjunct to a reduced-calorie diet and increased physical activity for chronic weight management in adult patients with an initial BMI of 30 kg/m2 or greater (obese), or 27 kg/m2 or greater (overweight) in the presence of at least 1 weight-related comorbidity (e.g., hypertension, type 2 diabetes, or dyslipidemia) and who have failed a previous weight management intervention.10 The sponsor has requested that liraglutide 3 mg be listed as an adjunct to a reduced-calorie diet and increased physical activity for chronic weight management in adult patients who have been diagnosed with obesity (BMI ≥ 30 kg/m2) and prediabetes, or overweight (BMI ≥ 27 kg/m2 and < 30 kg/m2) with 1 or more weight-related comorbidity and prediabetes.21
On February 25, 2021, Health Canada–approved the indication for liraglutide 3 mg for chronic weight management in adolescent patients. Thus, in addition to the previously stated indication, liraglutide 3 mg is indicated as an adjunct to a reduced-calorie diet and increased physical activity for chronic weight management in pediatric patients aged 12 years to less than 18 years with the following10:
an inadequate response to a reduced-calorie diet and increased physical activity alone
a body weight above 60 kg (132 lbs.)
an initial BMI corresponding to 30 kg/m2 or more for adults (obesity).
However, the sponsor’s requested reimbursement criteria for this review remains the same as previously stated with no changes to the submission. Thus, the requested reimbursement is focused only on a subset of patients with prediabetes and not the entire population for which the drug has received Health Canada approval.
Two other drugs approved for use in Canada with similar indications are orlistat and the NB combination tablet. Table 4 summarizes the characteristics of key treatments currently available for chronic weight management.
Table 4: Key Characteristics of Liraglutide 3 Mg, Naltrexone Hydrochloride and Bupropion Hydrochloride, and Orlistat
Characteristic | Liraglutide 3 mg | Naltrexone hydrochloride and bupropion hydrochloride | Orlistat |
|---|---|---|---|
Mechanism of action | Acylated human GLP-1 receptor agonist that regulates appetite by increasing feelings of fullness and satiety, while lowering feelings of hunger and prospective food consumption | Non-clinical studies suggest that naltrexone hydrochloride and bupropion hydrochloride have effects on 2 separate areas of the brain involved in the regulation of food intake: the hypothalamus (appetite regulatory centre) and the mesolimbic dopamine circuit (reward system). The exact neurochemical effects leading to weight loss are not fully understood. | Reversible inhibitor of lipases acting in the lumen of the stomach and small intestine |
Indicationa | Indicated as an adjunct to a reduced-calorie diet and increased physical activity for chronic weight management in adult patients with an initial BMI of:
| Indicated as an adjunct to a reduced-calorie diet and increased physical activity for chronic weight management in adults with an initial BMI of:
| When used in conjunction with a mildly hypocaloric diet, is indicated for:
These indications apply to patients living with obesity (i.e., BMI ≥ 30 kg/m2) or who are overweight (i.e., with BMI ≥ 27 kg/m2) in the presence of other risk factors (e.g., hypertension, type 2 diabetes, dyslipidemia, excess visceral fat). |
Route of administration | Subcutaneous injection | Oral | Oral |
Recommended dosage | In adults with an initial BMI of 27 kg/m2 or greater, the recommended daily maintenance dosage is 3 mg/day. Daily doses higher than 3 mg are not recommended. At initiation, dosage should be escalated in 0.6 mg increments every week to reduce the likelihood of gastrointestinal symptoms. Treatment should be discontinued after 12 weeks at the maintenance dosage if the patient has not lost at least 5% of their initial body weight. | Two 8 mg naltrexone hydrochloride and 90 mg bupropion hydrochloride extended-release tablets taken twice daily for a total daily dose of 32 mg and 360 mg At initiation, dosage should be escalated as follows. Week 1: 1 tablet in the a.m. Week 2: 1 tablet in the a.m. and p.m. each Week 3: 2 tablets in the a.m. and 1 tablet in the p.m. Week 4 onwards: 2 tablets in the a.m. and p.m. each The maximum recommended daily dose is 1 tablet in the a.m. and p.m. each for patients with moderate to severe renal impairment. Treatment should be discontinued after 12 weeks at the maintenance dosage if the patient has not lost at least 5% of their initial body weight. | One 120 mg capsule 3 times daily with each main meal |
Serious adverse effects or safety issues | Contraindicated in patients who:
| Contraindicated in:
| Contraindicated in patients with:
Warnings:
|
Serious adverse effects or safety issues (continued) | Serious warning: causes dose-dependent and treatment duration–dependent thyroid C-cell tumours at clinically relevant exposures in both genders of rats and mice Warnings:
|
Warnings based on experience with bupropion hydrochloride:
|
|
Serious adverse effects or safety issues (continued) |
|
BMI = body mass index; GLP-1 = glucagon-like peptide-1; T2DM = type 2 diabetes mellitus.
aHealth Canada–approved indication.
Source: Product monographs for Saxenda,10 Contrave,22 and Xenical.23
Stakeholder Perspectives
Patient Group Input
This section was prepared by CADTH staff based on the input provided by patient groups.
About the Patient Groups and Information Gathered
Three Canadian patient organizations — Obesity Canada, Diabetes Canada, and the GI Society — provided input for this submission. Obesity Canada is Canada’s leading obesity registered charity association for professionals and patients, contributing research, education, and advocacy for Canadians living with obesity. Diabetes Canada is a national health charity that represents Canadians living with, or at risk of, diabetes and focuses on research and policy initiatives for diabetes prevention, care, and cure at the population level. The GI Society is a national charity committed to improving the lives of people with GI and liver conditions through research, advocating for increased access to health care, and promoting GI and liver health.
The groups submitted input gathered through a variety of sources, including surveys, interviews, and published studies. Obesity Canada conducted patient interviews and an online survey, where 5 of the individuals interviewed and 60% of the survey respondents had used liraglutide 3 mg for obesity management. Diabetes Canada submitted patient input using data from 2 online surveys conducted in July and August 2020 and in December 2020 and January 2021. They declared that the survey in July and August 2020 was jointly created by themselves, a research and advocacy organization for type 1 diabetes (JDRF), and an advocacy organization for individuals living with type 1 diabetes (Type 1 Together). They also declared that they consulted with Obesity Canada regarding the creation of the December 2020 and January 2021 patient input survey but drafted it independently. The GI Society used data from patient and patient caregiver interviews, the results of published studies, and a survey conducted from October 6, 2020, to January 10, 2021, among individuals living with obesity. All 3 patient input groups submitted conflict of interest disclosures, which can be found on the CADTH website.
Disease Experience
Patient group input identified obesity as a chronic, multifactorial, relapsing disease characterized by excessive or abnormal body fat that can impair health. Due to the influence that adipose tissue has on the central regulation of energy homeostasis, excessive adiposity can lead to the development of a variety of health complications such as diabetes, high blood pressure, heart disease, sleep apnea, mental health problems, and osteoarthritis.
Patient group input reported that an estimated 80% to 90% of people with type 2 diabetes live with overweight or obesity. Prediabetes is a precursor to type 2 diabetes, and for those living with both prediabetes and overweight or obesity, various weight management approaches can help reduce the likelihood of progression to diabetes.
Patient groups reported that obesity not only increases the potential for the development of further disease(s), but it leads to inequities in access to employment, health care, and education due to the strong stigma associated with it. Many individuals have an incorrect perception that obesity is a self-inflicted disease, demonstrating a societal misunderstanding of obesity. The GI Society reported that 72% of their survey respondents experienced social stigma as a result of living with obesity, with many reporting that they avoid getting medical care because they feel as though their physician shames them because of their weight:
“I don’t go to the doctor as often as I should because I feel like a failure and that all my medical issues are caused by my obesity.”
“I’ve received the most shame about my weight from doctors to the point I’m scared to go. They should help, not shame.”
Individuals living with obesity also report frustration with the impact that the chronic and often misunderstood disease has on their overall quality of life:
“It’s frustrating to know that no matter what you do, weight management will always be an issue. Eating right is not always good enough – and the older I get the more difficult it is to keep the weight off.”
“It’s like I’m in my very own prison that I have a hard time fitting into.”
Not only does obesity affect the individual, but it also affects families and society as well. Despite its widespread impact, patient groups that provided input expressed that few provincial or territorial governments in Canada have implemented health promotion efforts or treatment programs for children and adults living with obesity, forcing individuals to self-manage their disease.
Experience With Treatment
Although there are treatments currently available in Canada, patient groups reported that there is a lack of access to these treatments:
“It is so frustrating and demoralizing that the things that work for me are unattainable, I cannot afford the medications or to see a therapist regularly and the wait time for surgery is several years. I am left to try and manage on my own and it is just not possible.”
Currently, most Canadians living with obesity report using diet and exercise, medications, or bariatric surgery to combat the disease. Patient groups report that diet and exercise do not address biologic, psychological, or environmental factors contributing to the disease and instead place the blame on the individual. Additionally, due to stigma and discrimination, many individuals do not turn to licensed health care professionals for obesity management and instead rely on commercial weight-loss programs that are unregulated and untested. Many who diet and exercise have difficulty sustaining their efforts or finding a program that suits their needs, which can lead to depression, hopelessness, and further weight gain:
“I have tried countless diets and participate in a number of activities that support physical health. They are not effective at lowering weight and keeping weight at a healthy level for a long period of time. I have ended up gaining back the lost weight and even gaining more. It was very frustrating and took away from my quality of life.”
In the survey conducted by Diabetes Canada, only 1 of 12 respondents with type 2 diabetes or prediabetes reported taking liraglutide 3 mg (Saxenda) for overweight or obesity, or any medication, for that matter. The individual did report that weight loss was much improved on the medication. The lack of reported use of medications for overweight or obesity may be because there are few medication options available in Canada, and the options do not have full public or private coverage. Approved medications include NB (Contrave), liraglutide (Saxenda), and orlistat (Xenical), all of which have undesirable side effects. The side effects of the medications include nausea, diarrhea, constipation, oily stools, bowel urgency, low blood sugar, headaches, and dizziness. Despite the availability of these drugs, the GI Society reported many concerns obtaining and paying for the prescriptions of these drugs:
“Most of us who could benefit from the medication do not have coverage to use the medication that could actually be beneficial.”
“I have tried going on weight loss medication but unfortunately it has never gone past the discussion point. I have been eagerly looking forward to trying any sort of medication for my weight loss.”
“My doctor refused to try any weight loss drugs for me.”
The patient groups reported that individuals who have experience with liraglutide have reported weight loss while on the drug. Specifically, Obesity Canada reported that the respondents in their survey who had experience with Saxenda reported an average of 11% weight loss. Among reports of weight loss, patient groups also noted that although the participants did find the side effects undesirable, they were manageable and not significant enough to deter them from taking the drug.
“I have been on Saxenda for 8 months and lost 40 lbs, sustained loss for the 9th month, and will continue to use it.”
Although bariatric surgery is currently considered the gold standard for treating obesity, it is often used as a last resort due to the potential serious side effects. According to the GI Society, 33% of respondents would not consider the surgery. For individuals in Canada who would consider the surgery, wait lists and the cost of the service are significant barriers. The surgery can lead to complications, hospital readmission, severe nutritional deficiencies, and GI symptoms.
Improved Outcomes
Currently, no provincial drug formularies include anti-obesity medication. As well, treatments that are currently available are not effective in the long-term. Due to this, patient groups report that many patients would like a treatment that is effective in the long-term, is affordable, and has no or minimal side effects:
“Reduce the costs if possible to make them more affordable.”
“No side effects that can add to my stress.”
Patient groups hope that liraglutide 3 mg may help people to better manage their weight, potentially delaying or preventing the development of comorbidities, such as the progression of prediabetes to type 2 diabetes. Furthermore, when asked about outcomes to consider, it was reported that patients focused less on improved weight than improved related comorbidities (e.g., diabetes, hypertension, and sleep apnea) as well as outcomes related to everyday life such as productivity, energy levels, sleep, activity, and mental health:
“I need to lose weight so I can have the energy and mobility to play with my kids/grandkids”
“I am so preoccupied with worrying about my weight that my productivity and mental health suffer, if I can lose some weight, everything else will get better.”
“Steady weight loss would help reduce joint pain so I can return to work, steady blood glucose levels would reduce the stress of always starving myself to keep sugars under control without insulin.”
Patient organizations noted that even when individuals lose a significant amount of weight, many of them gain it back within 5 years. This, in combination with a lack of effective treatments, has led to a 455% increase in severe obesity within Canada over the past 3 decades. Given the impact of obesity on multiple comorbidities and an individuals’ quality of life, patient groups hope for an effective, affordable, and accessible treatment for individuals living with obesity that will improve lives and avoid further direct health care costs.
Clinician Input
All CADTH review teams include at least 1 clinical specialist with expertise regarding the diagnosis and management of the condition for which the drug is indicated. Clinical experts are a critical part of the review team and are involved in all phases of the review process (e.g., providing guidance on the development of the review protocol, assisting in the critical appraisal of clinical evidence, interpreting the clinical relevance of the results, and providing guidance on the potential place in therapy). The following input was provided by 1 clinical specialist with expertise in chronic weight management.
Input From Clinical Experts Consulted by CADTH
Unmet Needs
The clinical expert noted that drug therapies are most effective when combined with lifestyle and behavioural changes. However, there is a lack of funded lifestyle programs in Canada. Although 3 medications have been approved for the treatment of obesity in Canada, the minimal coverage for these drugs outside private insurance plans limits access for many patients. Therefore, it is up to the patient and health care provider to decide which lifestyle changes will be implemented along with pharmacotherapy. Access to bariatric surgery for those meeting the criteria is limited in some Canadian provinces.
The clinical expert noted that side effects limit the use of all 3 pharmacotherapies, with some patients needing to stop the medication completely due to side effects. More typically, however, the dose would be limited by side effects. For example, a patient may be able to tolerate a half dose of NB or take only 1.2 mg or 1.8 mg daily of liraglutide, and still see some weight-lowering efficacy while avoiding side effects.
The clinical expert acknowledged that the weight loss seen with medications for obesity will often fall within a range of 5% to 10%, which is considered adequate to ameliorate weight-related comorbidities such as type 2 diabetes and osteoarthritis. However, in an ideal world, we would have pharmacotherapy that promotes larger amounts of weight loss.
Place in Therapy
The clinical expert consulted for this review stated that liraglutide is used both before and following bariatric surgery, and it is a common treatment strategy to prescribe liraglutide 3 mg in patients experiencing weight regain after bariatric surgery. The expert indicated that in accordance with the Obesity Canada 2020 guidelines, pharmacotherapy can realistically be used anywhere in a patient’s weight management journey. It was explained further that though it is reasonable for a patient to try lifestyle intervention first before starting liraglutide 3 mg, that approach is not necessary, particularly for patients at higher BMIs. The expert added that the long-term data for behavioural and lifestyle interventions alone is very discouraging and suggests that weight is typically regained within a relatively short period because of compensatory mechanisms in the brain that promote positive caloric intake by increasing hunger and ultimately causing weight gain. However, the clinical expert stated that liraglutide 3 mg for chronic weight management should always be combined with at least some behavioural changes or lifestyle interventions. Since the mechanism of action is very different from NB and orlistat, some physicians are prescribing combinations of these agents for weight loss. There is minimal evidence to support this; however, combination therapy is a well-established treatment paradigm for treatment of type 2 diabetes and hypertension.
On the question of whether liraglutide addresses the underlying process or manages symptoms of the condition, the clinical expert stated that liraglutide slows postprandial emptying of the stomach, acts centrally on the brain to increase satiety, reduces hunger, and (when blood glucose is elevated) stimulates insulin secretion and reduces glucagon secretion from the pancreas. Patients typically report being less interested in food, being able to reduce portion sizes more easily at meals, and having an overall lower appetite. Therefore, liraglutide targets 1 of the many underlying hormonal mechanisms for obesity and is not just managing symptoms. The clinical expert thought that the approval of liraglutide 3 mg (along with the NB combo) in Canada has started to shift the treatment paradigm for obesity management, in that the availability of pharmacotherapy options has appropriately given more legitimacy to the idea that obesity should be managed as a chronic disease.
Patient Population
The clinical expert consulted for this review stated that currently, there in no way to predict which patients will lose the most weight with liraglutide. The clinical expert consulted for this review stated that qualifying patients can be identified using the traditional definition of overweight and obesity based on BMI category. Patients most in need of intervention for weight loss are those who have the highest burden of weight-related comorbidities, which can be diagnosed using condition-dependent applicable diagnosis techniques, including laboratory tests, ultrasound, X-rays, and other clinical examination strategies. The expert indicated that patients with an EOSS score ranging from EOSS 1 to EOSS 3 could most typically benefit from a weight-loss intervention, noting that it is reasonable to intervene with liraglutide 3 mg at the EOSS 1 category to prevent future progression to the later stages of obesity. The clinical expert noted that patients with Class III obesity (i.e., BMI > 40) could be considered an important category for liraglutide 3 mg since they have the most excess weight. However, in such patients, a more intensive intervention such as bariatric surgery should also be considered or offered.
The clinical expert indicated that some patients have BMI below the traditional cut-off for overweight (i.e., < 27 kg/m2) but have metabolic complications from their weight, especially in ethnicities shown to have metabolic risk at lower BMIs. In such patients, it is reasonable to consider pharmacotherapy as second-line after lifestyle changes; however, that would be off-label use of the medication.
The clinical expert stated that at this time, the only way to know how a patient will respond to a medication is to try it. However, it was expected that patients who complain of a large amount of physical hunger limiting their weight-loss efforts tend to respond very well to the drug, since it promotes satiety. However, this was based on clinical observation and not on evidence.
Patients who would be unsuitable for treatment with liraglutide would be those with an absolute contraindication for the drug (e.g., planning pregnancy, pregnant, breastfeeding, personal or family history of medullary thyroid cancer or multiple endocrine neoplasia type 1). Patients with a history of pancreatitis should also usually not be prescribed the drug. Patients who are also unwilling to take an injectable therapy or adhere to any sort of behavioural intervention or changes are also not good candidates.
Assessing Response to Treatment
The expert indicated that most physicians would agree that a 5% to 10% total body weight loss is clinically meaningful and is typically felt to be associated with improved metabolic parameters. However, improved weight or BMI alone are the least clinically meaningful outcomes. Other meaningful responses to treatment include improvement in weight-related comorbidities (e.g., type 2 diabetes, prediabetes, hypertension, dyslipidemia, OSA), the prevention of progression of preclinical conditions (e.g., reduced progression from prediabetes to diabetes, from prehypertension to hypertension), improved quality of life, improved survival, reduced cardiovascular (CV) and renal events, and reduced osteoarthritis symptoms.
The clinical expert consulted for this review stated that, in general, weight-loss outcomes are assessed based on change in BMI and weight, whereas weight-related comorbidity outcomes are evaluated using change in parameters such as blood pressure, glycemic control, and lipid profile. Initial assessment takes place between 4 weeks to 6 weeks. Weight-loss response is assessed after 12 weeks to 16 weeks at the maximum dose (along with behavioural and lifestyle changes) to decide whether to continue the medication at that point. Based on experience, the expert stated that once the patient is successful on a stable dose of liraglutide 3 mg, assessments could be spaced at 3-month intervals, and eventually every 6 months.
Discontinuing Treatment
According to the clinical expert consulted for this review, treatment discontinuation decisions are influenced by patients’ preference not to rely on long-term medication for weight management, experiences of side effects (most commonly, GI side effects) with even the lowest dose of liraglutide, and rare but serious adverse effects such as pancreatitis, worsening in mood, or increase in anxiety. Where a patient decides not to use the drug for long-term weight management, a gradual tapering-off with close follow-up and of weight monitoring is a reasonable approach. Liraglutide would be stopped during the post-operative period for a patient who goes for a bariatric surgery. However, it could be reintroduced 18 months to 24 months after surgery if the patient experienced weight regain.
Prescribing Conditions
The clinical expert consulted for this review stated that community care facilities (either specialist or primary care) and hospital outpatient clinics (either bariatric clinics or specialty clinics) are appropriate settings for treatment with liraglutide. The expert pointed out that the inability for long-term patients to follow-up at some hospital-based specialty clinics (e.g., tertiary care centres) may be a barrier to liraglutide 3 mg treatment. Therefore, discharge back to primary care for ongoing treatment with liraglutide 3 mg and management of obesity may be necessary.
According to the clinical expert, primary care providers can diagnose obesity and overweight, safely prescribe liraglutide 3 mg, and monitor their patients over time. It was stated that some family physicians and a variety of specialists, including endocrinologists, general internists, and nephrologists, offer weight management services.
Clinician Group Input
No clinician group input was received for this review.
Drug Program Input
The drug programs provide input on each drug being reviewed through CADTH’s reimbursement review processes by identifying issues that may impact their ability to implement a recommendation. The implementation questions and corresponding responses from the clinical experts consulted by CADTH are summarized in Table 5.
Table 5: Summary of Drug Plan Input and Clinical Expert Response
Drug program implementation questions | Clinical expert response |
|---|---|
Is it possible to define demonstration of failure to respond to chronic obesity management therapies? | There is no known common definition of failure. It will depend on physician discretion based on a patient’s history. |
Do patients with BMI between 27 kg/m2 and 30 kg/m2 require therapies for chronic obesity management? If so, what pharmacologic options may be suitable for them? | It is reasonable to consider pharmacotherapy in such patients as second-line after lifestyle changes; however, that would be off-label use of the medication if there are no weight-related comorbidities. |
How is adherence to diet and exercise monitored? | Some monitoring, such as journaling of what patients eat, must be done but there is no 1 method that fits everyone. So, it is at the discretion of the attending physician, in decision with the patient. |
Would there be a need for continuation of therapy once BMI drops below 30 kg/m2, or 27 kg/m2 in patients with weight-related comorbidities who failed chronic weight management treatment with lifestyle changes? | If the medication is stopped, it is expected that patients will regain the weight they lost with the drug. Therefore, medications need to be continued in the long-term. There are primary care providers who will not prescribe weight-loss medications for various reasons, including concern that these medications need to be continued long-term to maintain weight loss. That view should be reframed since it is not used as a reason to not prescribe medications for other chronic diseases such as diabetes or hypertension. |
Specific diagnostics associated with weight-related comorbidities need clearer definition. | Diagnosis of comorbidities relies on different types of strategies (e.g., physical examinations, lab work, ultrasound, X-rays). Diagnosis of all weight-related comorbidities should not be challenging and should be within the scope of any primary care provider. It does not appear that there are any major difficulties with diagnosing either obesity/overweight (based on BMI) or comorbidities. |
Do patients on liraglutide 3 mg for chronic weight management require regular monitoring of serum calcitonin or thyroid ultrasound to monitor the risk of thyroid C-cell tumour? | There is no monitoring required. |
Are patients on a sulfonylurea at an amplified risk for hypoglycemia when using liraglutide 3 mg for chronic weight management? If so, how is that managed? | The risk is analogous to adding insulin to sulfonylurea and will be handled using similar strategies, such as monitoring hemoglobin A1C and blood glucose more often, reducing the dose of the sulfonylurea, and switching to another medication or stopping it altogether. The use of sulfonylurea has become less and less with so many newer treatment options available. It has become a last option of sorts. |
Is there a criterion for eligibility for re-treatment in case a patient regains weight or if liraglutide 3 mg becomes ineffective over time after an initial desired response? | If there is no benefit after a patient tries weight-loss medication for the first time, it is unlikely they will respond better to it in the future. Therefore, it is unlikely that the drug will be prescribed for the same indication again in that patient. However, it is tricky deciding the next steps after a patient who initially showed weight-loss benefits starts regaining the weight. There is no evidence that patients become refractory to pharmacotherapy for weight loss. However, if the medication is stopped, it is expected that patients will regain the weight they lost with the drug. Therefore, medications need to be continued in the long-term. It is important to monitor lifestyle changes carefully because in the long-term, the drug alone may not be enough to achieve the desired weight-loss goals. Thus, rather than stopping treatment because a patient appears to be losing the initial benefit, it is preferable to evaluate background lifestyle changes to ascertain adjustments that can be made to get the patient back on the right course. |
BMI = body mass index.
Clinical Evidence
The clinical evidence included in the review of liraglutide 3 mg is presented in 3 sections. The first section, the systematic review, includes pivotal studies provided in the sponsor’s submission to CADTH and Health Canada, as well as those studies that were selected according to an a priori protocol. The second section includes indirect evidence selected from the literature that met the selection criteria specified in the review. The third section includes sponsor-submitted long-term extension studies and additional relevant studies that were considered to address important gaps in the evidence included in the systematic review.
Systematic Review (Pivotal and Protocol Selected Studies)
Objectives
To perform a systematic review of the beneficial and harmful effects of liraglutide 6 mg/mL for subcutaneous injection as an adjunct to a reduced-calorie diet and increased physical activity for chronic weight management in adults
Methods
Studies selected for inclusion in the systematic review included pivotal studies provided in the sponsor’s submission to CADTH and Health Canada, as well as those meeting the selection criteria in Table 6. Outcomes included in the CADTH review protocol reflect outcomes considered to be important to patients, clinicians, and drug plans.
Table 6: Inclusion Criteria for the Systematic Review
Criteria | Description |
|---|---|
Patient population | Adult patients with an initial BMI of:
Subgroups:
|
Intervention | Liraglutide 6 mg/mL administered once daily as a subcutaneous injection using a dose escalation schedule with an initial dosage of 0.6 mg once a day for the first week, after which the dosage should be increased weekly by 0.6 mg/day for 4 weeks to reach the 3 mg daily dose |
Comparators | A reduced-calorie diet and increased physical activity with any of the following:
|
Outcomes | Efficacy outcomes:
|
Outcomes (continued) |
Harms outcomes:
|
Study design | Published and unpublished phase III and phase IV RCTs |
AE = adverse event; BMI = body mass index; CV = cardiovascular; GERD = gastroesophageal reflux disease; HRQoL = health-related quality of life; NAFLD = nonalcoholic fatty liver disease; OA = osteoarthritis; OSA = obstructive sleep apnea; PCOS = polycystic ovary syndrome; RCT = randomized controlled trial; SAE = serious adverse event; T2DM = type 2 diabetes mellitus; TIA = transient ischemic attack; vs. = versus; WDAE = withdrawal due to adverse event.
The literature search was performed by an information specialist using a peer-reviewed search strategy. The literature search for clinical studies was performed by an information specialist using a peer-reviewed search strategy according to the PRESS Peer Review of Electronic Search Strategies checklist.24
Published literature was identified by searching the following bibliographic databases: MEDLINE All (1946–) via Ovid and Embase (1974–) via Ovid. The search strategy comprised both controlled vocabulary, such as the National Library of Medicine’s MeSH (Medical Subject Headings), and keywords. The main search concepts were Saxenda (liraglutide) and weight management. Clinical trials registries were searched: the US National Institutes of Health’s clinicaltrials.gov, WHO’s International Clinical Trials Registry Platform search portal, Health Canada’s Clinical Trials Database, and the European Union Clinical Trials Register.
Search filters were applied to limit retrieval to randomized controlled trials (RCTs) or controlled clinical trials. Retrieval was not limited by publication date or by language. Where possible, retrieval was limited to the human population. Conference abstracts were excluded from the search results. See Appendix 1 for the detailed search strategies.
The initial search was completed on January 27, 2021. Regular alerts updated the search until the meeting of the CADTH Canadian Drug Expert Committee on May 19, 2021.
Grey literature (literature that is not commercially published) was identified by searching relevant websites from the Grey Matters: A Practical Tool For Searching Health-Related Grey Literature checklist25 Included in this search were the websites of regulatory agencies (the FDA and European Medicines Agency). Google was used to search for additional internet-based materials. See Appendix 1 for more information on the grey literature search strategy.
These searches were supplemented through contacts with appropriate experts. In addition, the sponsor of the drug was contacted for information regarding unpublished studies.
Two CADTH clinical reviewers independently selected studies for inclusion in the review based on titles and abstracts, according to the predetermined protocol. Full-text articles of all citations considered potentially relevant by at least 1 reviewer were acquired. Reviewers independently made the final selection of studies to be included in the review, and differences were resolved through discussion.
A focused literature search for NMAs dealing with weight management was run-in MEDLINE All (1946–) on January 27, 2021. The search was limited to selected subject headings and keywords appearing in the title only. No other limits were applied.
Findings From the Literature
A total of 4 studies were identified from the literature for inclusion in the systematic review (Figure 1). The included studies are summarized in Table 7 through Table 10. A list of excluded studies is presented in Appendix 2.
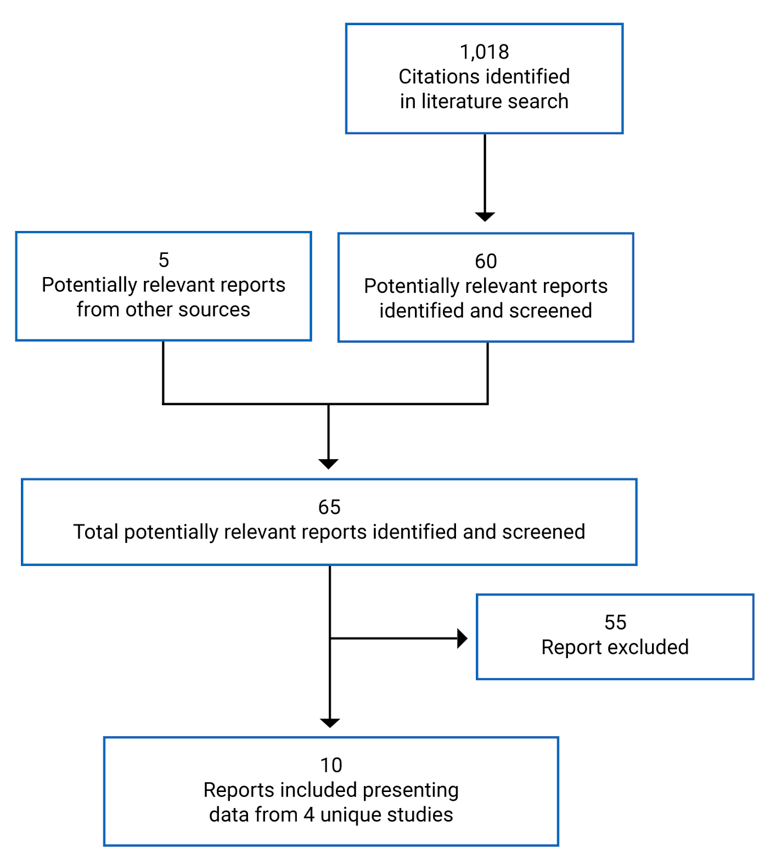
Table 7: Study 1839 — Details of Study in Patients Without Diabetes and With Prediabetes
Study details | Study 1839 | Study 1839 extension |
|---|---|---|
Designs and populations | 56-week main study phase of RCT in patients who are overweight or living with obesity without diabetes | 104-week extension phase patients who are overweight or living with obesity, and with prediabetes at baseline |
Study design | DB, placebo-controlled, parallel-group, multi-centre, multinational phase IIIa RCT | |
Locations | 191 sites in 27 countries, including 17 in Europe, 3 in North America (including Canada with 11 sites), and Australia, Brazil, Hong Kong, India, Israel, Russia, and South Africa | |
Trial initiation date | June 1, 2011 | |
Randomized (N) | 3,731 | 2,254 (out of the total 3,731 at baseline) |
Inclusion criteria |
| |
Exclusion criteria |
| |
Drugs | ||
Intervention | Liraglutide 3 mg, administered once daily as subcutaneous injection for 56 weeks in main phase, and additional 12 weeks for patients without prediabetes at screening who were re-randomized | Liraglutide 3 mg, administered once daily as subcutaneous injection for 160 weeks |
Comparator(s) | Placebo matching liraglutide 3 mg in appearance and frequency of dosing for 56 weeks in main phase, and additional 12 weeks for patients without prediabetes at screening who were re-randomized | Placebo matching liraglutide 3 mg in appearance and frequency of dosing for 160 weeks |
Duration | ||
Phase | ||
Screening | 2 weeks | |
Double-blind | 68 weeks, comprising:
| 104 weeks, for a total of 160 weeks, which includes the 56-week main trial period |
Follow-up | 2-week follow-up following the 12-week re-randomization period | 12-week off-drug follow-up |
Outcomes | ||
Primary end point | Co-primary end point at week 56:
| Proportion of patients with onset of T2DM at week 160 among patients who had prediabetes at baseline — evaluated as time to onset of T2DM |
Secondary and exploratory end points | Changes from baseline to week 56 in:
|
|
Notes | ||
Publications | Pi-Sunyer et al. (2015)27 | Le Roux et al. (2017)26 |
BMI = body mass index; CV = cardiovascular; DB = double-blind; DBP = diastolic blood pressure; FFA = free fatty acids; FPG = fasting plasma glucose; GLP-1 = glucagon-like peptide-1; HDL = high-density lipoprotein; HOMA = homeostasis model assessment; HOMA-beta = homeostasis model assessment beta-cell function; HOMA-IR = insulin resistance homeostasis model assessment index R; hs-CRP = high-sensitivity C-reactive protein; LDL = low-density lipoprotein; IWQOL-Lite = Impact of Weight on Quality of Life-Lite; OAD = oral antidiabetic drug; OGTT = oral glucose tolerance test; PAI-1 = plasminogen activator inhibitor-1; PG = plasma glucose; PRO = patient-reported outcome; RCT = randomized controlled trial; SBP = systolic blood pressure; SF-36 = Short Form (36) Health Survey; T2DM = type 2 diabetes mellitus; TG = triglyceride; TRIM-Weight = Treatment Related Impact Measure of Weight; TSH = thyroid-stimulating hormone; VLDL = very low-density lipoprotein; UACR = urinary albumin-to-creatinine ratio.
aDyslipidemia was defined as LDL of at least 160 mg/dL, or triglycerides of at least 150 mg/dL, or HDL of less than 40 mg/dL for males and less than 50 mg/dL for females.
bHypertension was defined as SBP of 140 mm Hg or more or DBP of 90 mm Hg or more.
Sources: Clinical Study Reports for Study 183911 and the Study 1839 extension.15
Table 8: Study 1922 — Details of Study in Patients With Type 2 Diabetes
Study details | Study 1922 |
|---|---|
Designs and populations | A 56-week RCT in patients who are overweight or living with obesity and T2DM |
Study design | DB, placebo-controlled, 3-armed, parallel-group, multi-centre, phase IIIa trial |
Locations | 126 sites in 9 countries: France, Germany, Israel, South Africa, Spain, Sweden, Turkey, the UK, and the US |
Trial initiation date | June 1, 2011 |
Randomized (N) | 846 |
Inclusion criteria |
|
Exclusion criteria |
|
Drugs | |
Intervention |
|
Comparator(s) | Placebo matching liraglutide 3 mg in appearance and frequency of dosing for 56 weeks |
Duration | |
Phase | |
Screening | 2 weeks |
Double-blind | 56 weeks (including a dose escalation period of up to 4 weeks) |
Follow-up | 12-week observational follow-up |
Outcomes | |
Primary end point | Co-primary end point at week 56
|
Secondary and exploratory end points | Changes from baseline to week 56 in:
|
Notes | |
Publications | Davies et al. (2016)27 |
ADA = American Diabetes Association; BMI = body mass index; CV = cardiovascular; DB = double-blind; DBP = diastolic blood pressure; DPP-4 = dipeptidyl peptidase-4; DTSQs = Diabetes Treatment Satisfaction Questionnaire status; FFA = free fatty acids; FPG = fasting plasma glucose; GLP-1 = glucagon-like peptide-1; HDL = high-density lipoprotein; hs-CRP = high-sensitivity C-reactive protein; LDL = low-density lipoprotein; IWQOL-Lite = Impact of Weight on Quality of Life-Lite; OAD = oral antidiabetic drug; PAI-1 = plasminogen activator inhibitor-1; PRO = patient-reported outcome; RCT = randomized controlled trial; SBP = systolic blood pressure; SU = sulfonylurea; T2DM = type 2 diabetes mellitus; TG = triglyceride; TSH = thyroid-stimulating hormone; VLDL = very low-density lipoprotein; UACR = urinary albumin-to-creatinine ratio.
aDyslipidemia was defined as LDL of 160 mg/dL or more, or TGs of 150 mg/dL or more, or HDL of less than 40 mg/dL for males and less than 50 mg/dL for females.
bHypertension was defined as SBP of 140 mm Hg or more, or DBP of 90 mm Hg or more.
Source: Clinical Study Report for Study 1922.12
Table 9: Study 1923 — Details of Study in Patients Without Diabetes
Study details | Study 1923 |
|---|---|
Designs and populations | 56-week study phase |
Study design | DB, placebo-controlled, parallel-group, multi-centre phase IIIa RCT |
Locations | 36 sites in 2 countries: 26 sites in the US and 10 sites in Canada |
Trial initiation date | October 30, 2008 |
Randomized (N) | 422 |
Inclusion criteria |
|
Exclusion criteria |
|
Drugs | |
Intervention | Liraglutide 3 mg, administered once daily as subcutaneous injection for 56 weeks |
Comparator(s) | Placebo matching liraglutide in appearance and frequency of dosing for 56 weeks |
Duration | |
Phase | |
Run-in | 4 weeks–12 weeks |
Double-blind | 56 weeks |
Follow-up | 12 weeks |
Outcomes | |
Primary end point | Co-primary end points at week 56:
|
Secondary and exploratory end points | Change from baseline (randomization at week 0) at week 56 in:
|
Notes | |
Publications | Wadden at al. (2013)28 |
ATP III = Third Report of the National Cholesterol Education Program (NCEP) Expert Panel on Detection, Evaluation, and Treatment of High Blood Cholesterol in Adults (Adult Treatment Panel III) Final Report; BMI = body mass index; CV = cardiovascular; DB = double-blind; FPG = fasting plasma glucose; GLP = glucagon-like peptide-1;
HOMA-beta = homeostasis model assessment beta-cell function; HOMA-IR = insulin resistance homeostasis model assessment index R; hs-CRP = high-sensitivity C-reactive protein; TSH = thyroid-stimulating hormone.
Source: Clinical Study Report for Study 1923.13
Table 10: Study 3970 — Details of Study in Patients With Moderate or Severe Obstructive Sleep Apnea
Study details | Study 3970 |
|---|---|
Designs and populations | 32-week study phase |
Study design | DB, placebo-controlled, parallel-group, multi-centre, multinational IIIa RCT |
Locations | 40 sites in 2 countries: 35 sites in the US and 5 sites in Canada |
Trial initiation date | June 7, 2012 |
Randomized (N) | 359 |
Inclusion criteria |
|
Exclusion criteria |
|
Drugs | |
Intervention | Once-daily liraglutide 3 mg administered for 32 weeks |
Comparator(s) | Placebo matching liraglutide in appearance and frequency of dosing for 32 weeks |
Duration | |
Phase | |
Run-in | 2 weeks |
Double-blind | 32 weeks, including 4 weeks of dose escalation and 28 weeks of a maintenance period |
Follow-up | 2 weeks |
Outcomes | |
Co-primary end point | Change from baseline in AHI (events/hour) after 32 weeks |
Secondary and exploratory end points | Change from baseline (randomization at week 0) at week 32 in:
|
Notes | |
Publications | Blackman et al. (2016)29 |
AE = adverse event; AHI = apnea-hypopnea index; BMI = body mass index; CPAP = continuous positive airway pressure; C-SSRS = Columbia-Suicide Severity Rating Scale; CV = cardiovascular; ECG = electrocardiogram; FOSQ = Functional Outcomes of Sleep Questionnaire; GLP-1 = glucagon-like peptide-1; ODI = oxygen desaturation index; OSA = obstructive sleep apnea; PHQ-9 = Patient Health Questionnaire-9; PRO = patient-reported outcome; SF-36 = Short Form (36) Health Survey; TSH = thyroid-stimulating hormone; WASO = wake after sleep onset.
Source: Clinical Study Report for Study 3970.14
Description of Studies
A total of 4 phase III RCTs (i.e., Study 1839, Study 1922, Study 1923, and Study 3970) met the inclusion criteria of this CADTH systematic review. The primary objectives of the sponsor-submitted pivotal study (i.e., Study 1839) were to establish the efficacy of liraglutide 3 mg compared with placebo in inducing and maintaining weight loss over 56 weeks in adults without diabetes, and to investigate the long-term efficacy of liraglutide 3 mg in delaying the onset of type 2 diabetes in patients living with obesity with prediabetes and in patients who are overweight with prediabetes and treated or untreated comorbidities such as dyslipidemia and/or hypertension. Thus, the trial had 2 phases: a main phase with primary analysis based on results after 56 weeks of treatment (N = 3,731) and a 104-week extension phase (N = 2,254) that included only patients who had prediabetes at screening. Study 1839 was a global, randomized, parallel-group, multi-centre, double-blind trial conducted at 191 sites in 27 countries in Africa, Asia, Australia, Europe, North America, and South America. Patients were randomized to receive treatment with liraglutide 3 mg or matched placebo. After a 2-week screening period, patients were randomly assigned in a 2:1 ratio to either the liraglutide or placebo treatment groups using a telephone or web-based system. The randomization was stratified according to prediabetes status and baseline BMI (BMI ≥ 30 kg/m2 or < 30 kg/m2) at screening in the main phase and by BMI alone in the extension phase. Patients classified as not having prediabetes at screening were treated with either liraglutide 3 mg or placebo for 56 weeks whereas patients classified as having prediabetes at screening received either liraglutide 3 mg or placebo for 160 weeks (56 weeks during the main trial plus 104 weeks for the extension study). Following 56 weeks of treatment, patients without prediabetes at screening were re-randomized in a 1:1 manner to either continue treatment with liraglutide 3 mg (liraglutide/liraglutide group), switch to placebo (liraglutide/placebo group) or continue with placebo (placebo group) for 12 weeks. However, this 12-week period was not considered part of the main study phase; rather, it was meant to assess the effects of drug cessation on weight control, possible withdrawal, and rebound effects. The non-drug follow-up period was 2 weeks for the main phase and 12 weeks for the extension phase. Further details about the main and extension phases of Study 1839 have been summarized in Table 7.
Study 1922 (N = 846) was a phase IIIa, double-blind, placebo-controlled, 3-armed, parallel-group, multi-centre, multinational trial to investigate the efficacy of liraglutide compared to placebo after 56 weeks of treatment in inducing and maintaining weight loss in patients with type 2 diabetes who were overweight or living with obesity. The trial was conducted at 126 sites in 9 countries, including 6 European countries, Israel, South Africa, and the US. In addition to the liraglutide 3 mg and placebo arms, there was a third treatment arm for liraglutide 1.8 mg, which was included upon request from regulatory agencies. The patients were randomized in a 2:1:1 manner using a centralized IV/WRS to receive 3 mg of liraglutide, 1.8 mg of liraglutide, or placebo as an add-on to their background diabetes treatment. Randomization was stratified according to background treatment. The results of the liraglutide 1.8 mg dose will not be presented in the current review as this is not an approved dose for the indication under review. Other aspects of the design of Study 1922 were similar to the main phase of Study 1839 as previously described. Further details about Study 1922 have been summarized in Table 8.
Study 1923 (N = 422) was a 56-week, phase IIIa, randomized, double-blind, placebo-controlled, parallel-group, multi-centre trial in patients who were overweight with comorbidities or living with obesity. The primary objectives of the study were to compare the efficacy of liraglutide 3 mg versus placebo in maintaining run-in weight loss over 56 weeks, and to compare the efficacy of liraglutide 3 mg versus placebo in inducing weight loss beyond what was achieved during run-in over the same treatment period. The trial was conducted at 36 sites in Canada and the US. Prior to randomization, patients were treated with a low-calorie diet (total energy intake of 1,200 kcal/day to 1,400 kcal/day) in the run-in period lasting up to 12 weeks under the instruction and supervision of a qualified nutritionist. Those who achieved at least 5% loss in body weight on the low-calorie diet during the run-in period were randomized in a 1:1 manner to receive either liraglutide 3 mg or placebo for 56 weeks. Randomization was stratified according to comorbidity status (i.e., the presence or absence of treated or untreated hypertension or dyslipidemia). Further details about Study 1923 have been summarized in Table 9.
Study 3970 (N = 359) was a 32-week phase IIIa, randomized, double-blind, placebo-controlled, parallel-group, multi-centre, multinational trial conducted at 5 sites in Canada and 35 sites in the US. The primary objective of the trial was to investigate if treatment with liraglutide 3 mg reduces the severity of OSA, as assessed by the AHI, compared to placebo both in combination with lifestyle intervention in patients living with obesity and moderate or severe OSA unable or unwilling to use CPAP treatment. After a 2-week screening period, patients were randomized using an IV/WRS in a 1:1 manner to receive either once-daily liraglutide 3 mg or placebo using IV/WRS, without stratification. Randomization was not stratified. Further details about Study 3970 have been summarized in Table 10.
Populations
Inclusion and Exclusion Criteria
Study 1839 enrolled adult patients without diabetes who were living with obesity (i.e., having a stable BMI of ≥ 30 kg/m2) or were overweight (i.e., BMI ≥ 27 kg/m2) with comorbidities such as dyslipidemia or hypertension. The major inclusion and exclusion criteria have been summarized in Table 7. Of note, patients were eligible for inclusion if they were adults without diabetes diagnosed with obesity or overweight and had failed previous dietary interventions to manage weight. Patients were not eligible to be included in the study if they had type 1 or type 2 diabetes, a family or personal history of multiple endocrine neoplasia type 2 or familial medullary thyroid carcinoma, obesity induced by drug treatment, previous surgical treatment of obesity, or uncontrolled hypertension, among others. Of the total 3,731 patients randomized to take part in the main phase of Study 1839, 2,200 patients who were identified as having prediabetes at screening continued into the 104-week extension phase that investigated the long-term efficacy of liraglutide 3 mg in delaying the onset of type 2 diabetes in patients who are overweight or living with obesity with prediabetes, for a total treatment period of 160 weeks.
Study 1922 enrolled adult patients with type 2 diabetes who were on diet and exercise treatment alone, or with 1 to 3 oral antidiabetic drugs (OADs) (i.e., metformin, SU, or glitazone, either as monotherapy or in combination with any of the other 2 compounds). To be eligible for inclusion in the study, patients had to have hemoglobin A1C between 7.0% and 10.0% (both inclusive) and BMI of 27.0 kg/m2 or more and failed a previous dietary effort for weight management. Patients were excluded from the study if they experienced recurrent major hypoglycemia or hypoglycemic unawareness as judged by the investigator, received treatment with any hypoglycemic agent(s) other than metformin, SU, and glitazone in the 3 months before screening, or used any drug (except for metformin, SU, or glitazone) that, in the investigator’s opinion, could interfere with their glucose level. Other exclusion criteria were like those previously described for the main phase of Study 1839. The major inclusion and exclusion criteria of Study 1922 have been summarized in Table 8.
Study 1923 enrolled adult patients with BMI of 30 kg/m2 or more or with BMI of 27 kg/m2 or more with the presence of comorbidities of treated or untreated dyslipidemia and/or hypertension. Untreated dyslipidemia was defined as low-density lipoprotein (LDL) of 160 mg/dL or more (i.e., ≥ 8.9 mmol/L) or triglycerides of 150 mg/dL or more (i.e., ≥ 8.3 mmol/L), or high-density lipoprotein (HDL) of less than 40 mg/dL (i.e., ≥ 2.2 mmol/L) for males and less than 50 mg/dL (i.e., ≥ 2.8 mmol/L) for females. Untreated hypertension was defined as systolic blood pressure (SBP) of 140 mm Hg or more and/or DBP of 90 mm Hg or more. To be eligible for consideration for inclusion in the trial, patients had to have a stable body weight during the previous 3 months (< 5 kg self-reported weight change) and must have undergone a previous weight loss with dietary adjustments without being able to maintain reduced weight. Exclusion criteria included patients with type 1 or type 2 diabetes, a history of cancer, a positive screening for hepatitis B surface antigen, hepatitis C antibodies, and HIV antibodies, and other criteria as previously described for the main phase of Study 1839. A summary of the key inclusion and exclusion criteria of Study 1923 have been provided in Table 9.
In Study 3970, patients living with obesity who had moderate to severe OSA were enrolled. Key inclusion criteria were BMI of 30 kg/m2 or more, a diagnosis of moderate or severe OSA, unwillingness or inability to use CPAP, and a stable body weight (defined as < 5% self-reported change during the previous 3 months). Exclusion criteria included patients with type 1 or type 2 diabetes, significant craniofacial abnormalities that may be causing OSA, respiratory and neuromuscular diseases that could interfere with the results of the trial in the opinion of the investigator, and use of central stimulants, hypnotics, mirtazapine, opioids, or trazodone within the 3 months before screening. Other exclusion criteria were similar to those described for the main phase of Study 1839. The major inclusion and exclusion criteria of Study 3970 have been summarized in Table 10.
Baseline Characteristics
Overall, the treatment groups in all the included studies appeared well balanced with respect to baseline demographics and other characteristics.
For Study 1839, the mean age of included patients at baseline was 45 years in both treatment groups, and the study populations were predominantly White (85%) and female (≥ 78%). Most patients enrolled had a BMI of 30 or more, with less than 4% of patients having a BMI between 27.0 kg/m2 and less than 30 kg/m2. Also, most of the patients were designated as having prediabetes (61%) at screening and having no history of CV disease (> 57%) or gallbladder disease (> 85%). Cardiometabolic disease markers were reported in the form of dyslipidemia (≥ 29%), hypertension (≥ 34%), or both dyslipidemia and hypertension (17%) in both treatment groups. In general, the baseline characteristics were similar for patients in both the 56-week main study phase and those who continued into the 104-week extension phase, except for the fact that all patients in the extension phase had prediabetes, had a history of CV disease, and were taking antihypertensive drugs. Further details about the baseline characteristics of the main and extension phases of Study 1839 have been summarized in Table 11.
The mean age of patients in Study 1922 was 55 years at baseline and the study population was predominantly White (83%). The proportion of female patients and male patients was similar across treatment groups. Most enrolled patients had a BMI of 30 kg/m2 or more. As at the time of randomization, the duration of diabetes was 7.4 years in the liraglutide 3 mg group and 6.7 years in the placebo group. More than 70% of patients in each group had a history of CV disease, and cardiometabolic disease markers were reported in a large proportion of patients in both treatment groups in the form of dyslipidemia (> 59%), hypertension (> 68%), or both dyslipidemia and hypertension (> 43%). The uses of concomitant medication and background diabetes treatment were similar across the study groups. Further details about the baseline characteristics of Study 1922 have been summarized in Table 12.
For Study 1923, the mean age of enrolled patients at baseline was about 46 years in both treatment groups and most patients were female (> 78%). Most patients enrolled had a BMI of 30 kg/m2 or more, with fewer than 3% of patients having a BMI between 27.0 kg/m2 and less than 30 kg/m2. The proportion of patients with a history of CV disease or gallbladder disease and concomitant medication use were low (< 2.5%) at baseline. However, 33% and 28% of patients in the liraglutide group and placebo group, respectively, had hypertension at baseline. Further details about the baseline characteristics of Study 1923 have been summarized in Table 13.
The mean age of patients in Study 3970 was 48.5 years. The study enrolled mostly male patients (72% in each group). Most patients enrolled had a BMI of 30 kg/m2 or more. One (0.6%) patient in the placebo group had a BMI between 27.0 kg/m2 and less than 30 kg/m2 but there was no patient in that BMI category in the liraglutide 3 mg group. Like other characteristics, the baseline OSA-related parameters were similar across study groups. More than 60% of patients in each treatment group had prediabetes. Further details about the baseline characteristics of Study 1922 have been summarized in Table 14.
Table 11: Study 1839 — Summary of Baseline Characteristics in Patients Without Diabetes and With Prediabetes at Screening
Characteristic | Study 1839 (FAS) | Study 1839 extension (FAS) | ||
|---|---|---|---|---|
LIRA 3 mg N = 2,487 | Placebo N = 1,244 | LIRA 3 mg N = 1,505 | Placebo N = 749 | |
Age (years), mean (SD) | 45.2 (12.1) | 45.0 (12.0) | 47.5 (11.7) | 47.3 (11.8) |
Female, n (%) | 1,957 (78.7) | 971 (78.1) | 1,141 (75.8) | 573 (76.5) |
Male, n (%) | 530 (21.3) | 273 (21.9) | 364 (24.2) | 176 (23.5) |
Height (m), mean (SD) | 1.66 (0.09) | 1.66 (0.09) | 1.66 (0.09) | 1.66 (0.09) |
Body weight (kg), mean (SD) | 106.2 (21.2) | 106.2 (21.7) | 107.5 (21.6) | 107.9 (21.8) |
BMI (kg/m2), mean (SD) | 38.3 (6.4) | 38.3 (6.3) | 38.8 (6.4) | 39.0 (6.3) |
BMI category, n (%) | ||||
27.0 to < 30.0 | 66 (2.7) | 44 (3.5) | 39 (2.6) | 23 (3.1) |
30.0 to 34.9 | 806 (32.4) | 388 (31.2) | 427 (28.4) | 197 (26.3) |
35.0 to 39.9 | 787 (31.6) | 398 (32.0) | 492 (32.7) | 245 (32.7) |
≥ 40 | 828 (33.3) | 414 (33.3) | 547 (36.3) | 284 (37.9) |
Race, n (%) | ||||
White | 2,107 (84.7) | 1,061 (85.3) | 1,256 (83.5) | 628 (83.8) |
Black | 242 (9.7) | 114 (9.2) | 146 (9.7) | 71 (9.5) |
Asian | 90 (3.6) | 46 (3.7) | 75 (5.0) | 39 (5.2) |
American Indian or Alaska Native | 5 (0.2) | 4 (0.3) | 5 (0.3) | 2 (0.3) |
Native Hawaiian or Pacific Islander | 2 (< 0.1) | 2 (0.2) | 1 (< 0.1) | 1 (0.1) |
NA | NR | NR | NR | NR |
Other | 41 (1.6) | 17 (1.4) | 22 (1.5) | 8 (1.1) |
Prediabetes status at screening, n (%) | ||||
With prediabetes | 1,528 (61.4) | 757 (60.9) | 1,501 (100) | 749 (100) |
Without prediabetes | 959 (38.6) | 487 (39.1) | NA | NA |
Smoker status, n (%) | ||||
Current smoker | 373 (15.0) | 203 (16.3) | 217 (14.4) | 124 (16.6) |
Never smoked | 1,477 (59.4) | 729 (58.6) | 886 (58.9) | 432 (57.7) |
Previous smoker | 637 (25.6) | 312 (25.1) | 402 (26.7) | 193 (25.8) |
Glycemic control | ||||
Hemoglobin A1C (%), mean (SD) | 5.6 (0.4) | 5.6 (0.4) | 5.8 (0.3) | 5.7 (0.3) |
FPG (mmol/L), mean (SD) | 5.3 (0.6) | 5.3 (0.5) | 5.5 (0.6) | 5.5 (0.5) |
History of CV disease, n (%) | ||||
Yes | 973 (39.1) | 500 (40.2) | 682 (45.3) | 336 (44.9) |
No | 1,470 (59.1) | 710 (57.1) | 793 (52.7) | 393 (52.5) |
Unknown | 42 (1.7) | 34 (2.7) | 29 (1.9) | 20 (2.7) |
NA | 2 (< 0.1) | 0 | 1 (< 0.1) | 0 (0.0) |
History of gallbladder disease, n (%) | ||||
Yes | 349 (14.0) | 163 (13.1) | 208 (13.8) | 112 (15.0) |
No | 2,120 (85.2) | 1,075 (86.4) | 1,286 (85.4) | 632 (84.4) |
Unknown | 18 (0.7) | 5 (0.4) | 11 (0.7) | 4 (0.5) |
NA | NR | NR | 0 (0.0) | 1 (0.1) |
Cardiometabolic markers, n (%) | ||||
Dyslipidemia | 737 (29.6) | 359 (28.9) | 499 (33.2) | 249 (33.2) |
Hypertension | 850 (34.2) | 446 (35.9) | 635 (42.2) | 312 (41.7) |
Dyslipidemia and hypertension | 417 (16.8) | 213 (17.1) | 317 (21.1) | 156 (20.8) |
Concomitant medication at baseline, n (%) | ||||
Antihypertensive drugs | 754 (30.9) | 404 (33.0) | 577 (39.2) | 291 (39.4) |
Lipid-lowering agents | 386 (15.8) | 183 (14.9) | 288 (19.6) | 134 (18.2) |
Oral antidiabetic drugs | 1 (0.0) | NR | 1 (0.1) | 0 (0) |
BMI = body mass index; CV = cardiovascular; FAS = full analysis set; FPG = fasting plasma glucose; LIRA = liraglutide; NA = not applicable; NR = not reported; SD = standard deviation.
Sources: Clinical Study Reports for Study 183911 and the Study 1839 extension.15
Table 12: Study 1922 — Summary of Baseline Characteristics in Patients With Type 2 Diabetes
Characteristic | Study 1922 (FAS) | |
|---|---|---|
LIRA 3 mg N = 423 | Placebo N = 212 | |
Age (years), mean (SD) | 55.0 (10.8) | 54.9 (9.8) |
Female, n (%) | 203 (48) | 115 (54.2) |
Male, n (%) | 220 (52) | 97 (45.8) |
Height (m), mean (SD) | 1.69 (0.11) | 1.69 (0.10) |
Body weight (kg), mean (SD) | 105.7 (21.9) | 106.5 (21.3) |
BMI (kg/m2), mean (SD) | 37.1 (6.5) | 37.4 (7.1) |
BMI category, n (%) | ||
27.0 to < 30.0 | 52 (12.3) | 30 (14.2) |
30.0 to 34.9 | 139 (32.9) | 59 (27.8) |
35.0 to 39.9 | 108 (25.5) | 60 (28.3) |
≥ 40 | 124 (29.3) | 53 (29.7) |
Race, n (%) | ||
White | 353 (83.5) | 175 (82.5) |
Black | 44 (10.4) | 27 (12.7) |
Asian | 11 (2.6) | 4 (1.9) |
American Indian or Alaska Native | 4 (0.9) | 0 (0.0) |
Native Hawaiian or Pacific Islander | 0 (0.0) | 0 (0.0) |
Other | 2 (0.5) | 0 (0.0) |
Smoker status, n (%) | ||
Current smoker | 52 (12.3) | 20 (9.4) |
Never smoked | 231 (54.6) | 118 (55.7) |
Previous smoker | 140 (33.1) | 74 (34.9) |
Glycemic control | ||
Hemoglobin A1C (%), mean (SD) | 7.9 (0.8) | 7.9 (0.8) |
FPG (mmol/L), mean (SD) | 8.8 (1.9) | 8.6 (1.8) |
Duration of diabetes (years), mean (SD) | 7.4 (5.65) | 6.71 (5.07) |
History of CV disease, n (%) | ||
Yes | 299 (70.7) | 149 (70.3) |
No | 118 (27.9) | 61 (28.8) |
Unknown | 4 (0.9) | 1 (0.5) |
Not applicable | 2 (0.5) | 1 (0.5) |
History of gallbladder disease, n (%) | ||
Yes | 55 (13.0) | 23 (10.8) |
No | 363 (85.8) | 185 (87.3) |
Unknown | 5 (1.2) | 4 (1.9) |
Not applicable | NR | NR |
Cardiometabolic markers, n (%) | ||
Dyslipidemia | 295 (69.7) | 126 (59.4) |
Hypertension | 293 (69.3) | 145 (68.4) |
Dyslipidemia and hypertension | 220 (52.0) | 94 (43.4) |
Concomitant medication at baseline, n (%) | ||
Antihypertensive drugs | 278 (67.5) | 132 (64.7) |
Lipid-lowering agents | 250 (60.7) | 110 (52.1) |
Oral antidiabetic drugs | 366 (88.8) | 175 (85.8) |
Background diabetes treatment | ||
Diet and exercise/metformin monotherapy | 283 (68.7) | 146 (69.2) |
Diet and exercise only | 46 (11.2) | 20 (9.5) |
Metformin only | 237 (57.5) | 126 (59.7) |
Combination/SU | 129 (31.3) | 65 (30.8) |
Metformin + glitazone | 22 (5.3) | 10 (4.7) |
Metformin + SU | 86 (20.9) | 48 (22.7) |
Metformin + SU + glitazone | 10 (2.4) | 4 (1.9) |
SU | 7 (1.7) | 2 (0.9) |
SU + glitazone | 4 (1.0) | 1 (0.5) |
BMI = body mass index; CV = cardiovascular; FAS = full analysis set; FPG = fasting plasma glucose; LIRA = liraglutide; NR = not reported; SD = standard deviation, SU = sulfonylurea.
Source: Clinical Study Report for Study 1922.12
Table 13: Study 1923 — Summary of Baseline Characteristics in Patients Without Diabetes
Characteristic | Study 1923 (FAS) | |
|---|---|---|
LIRA 3 mg N = 212 | Placebo N = 210 | |
Age (years), mean (SD) | 45.9 (11.9) | 46.5 (11) |
Female, n (%) | 178 (84.0) | 265 (78.6) |
Male, n (%) | 34 (16.0) | 45 (21.4) |
Height (m), mean (SD) | 1.67 (0.1) | 1.67 (0.1) |
Body weight (kg), mean (SD) | 100.4 (20.8) | 98.7 (21.2) |
BMI (kg/m2), mean (SD) | 36 (5.9) | 35.2 (5.9) |
BMI category, n (%) | ||
27.0 to < 30.0 | 3 (1.4) | 6 (2.9) |
30.0 to 34.9 | 69 (32.5) | 80 (38.1) |
35.0 to 39.9 | 69 (32.5) | 58 (27.6) |
≥ 40 | 71 (33.5) | 66 (31.4) |
Race, n (%) | ||
White | 170 (80.2) | 185 (88.1) |
Black | 32 (15.1) | 24 (11.4) |
Asian | 1 (0.5) | 0 |
American Indian or Alaska Native | 0 | 0 |
Native Hawaiian or Pacific Islander | 2 (0.9) | 0 |
Other | 7 (3.3) | 1 (0.5) |
Smoker status, n (%) | ||
Current smoker | 20 (9.4) | 22 (10.5) |
Never smoked | NR | NR |
Previous smoker | NR | NR |
Glycemic control | ||
Hemoglobin A1C (%), mean (SD) | 5.6 (0.4) | 5.6 (0.4) |
FPG (mmol/L), mean (SD) | 5.4 (0.5) | 5.5 (0.5) |
History of CV disease, n (%) | ||
Yes | 2 (0.9) | 5 (2.4) |
History of gallbladder disease, n (%) | ||
Yes | 0 | 1 (0.5) |
Cardiometabolic markers, n (%) | ||
Dyslipidemia | 13 (6.1) | 17 (8.1) |
Hypertension | 69 (32.5) | 59 (28.1) |
Dyslipidemia and hypertension | NR | NR |
Concomitant medication at baseline, n (%) | ||
Antihypertensive drugs | 1 (0.5) | 0 |
Lipid-lowering agents | 2 (0.9) | 5 (2.4) |
Oral antidiabetic drugs | NA | NA |
BMI = body mass index; CV = cardiovascular; FAS = full analysis set; FPG = fasting plasma glucose; LIRA = liraglutide; NA = not applicable; NR = not reported; SD = standard deviation.
Source: Clinical Study Report for Study 1923.13
Table 14: Study 3970 — Summary of Baseline Characteristics in Patients With Moderate or Severe Obstructive Sleep Apnea
Characteristic | Study 3970 (FAS) | |
|---|---|---|
LIRA 3 mg N = 180 | Placebo N = 179 | |
Age (years), mean (SD) | 48.6 (9.9) | 48.4 (9.5) |
Female, n (%) | 51 (28.3) | 50 (27.9) |
Male, n (%) | 129 (71.7) | 129 (72.1) |
Height (m), mean (SD) | 1.73 (0.09) | 1.73 (0.09) |
Body weight (kg), mean (SD) | 116.5 (23.0) | 118.7 (25.4) |
BMI (kg/m2), mean (SD) | 38.9 (6.4) | 39.4 (7.4) |
BMI category, n (%) | ||
27.0 to < 30.0 | 0 (0.0) | 1 (0.6) |
30.0 to 34.9 | 58 (32.2) | 51 (28.5) |
35.0 to 39.9 | 59 (32.8) | 62 (34.6) |
≥ 40 | 63 (35.0) | 65 (36.3) |
Race, n (%) | ||
White | 130 (72.2) | 135 (75.4) |
Black | 33 (18.3) | 36 (20.1) |
Asian | 13 (7.2) | 3 (1.7) |
American Indian or Alaska Native | 0 (0.0) | 0 (0.0) |
Native Hawaiian or Pacific Islander | 1 (0.6) | 2 (1.1) |
Other | 3 (1.7) | 3 (1.7) |
Prediabetes status | ||
With prediabetes | 115 (63.9) | 112 (62.6) |
Without prediabetes | 65 (36.1) | 67 (37.4) |
Smoker status, n (%) | ||
Current smoker | 27 (9.4) | 26 (14.5) |
Never smoked | 109 (60.6) | 98 (54.7) |
Previous smoker | 44 (24.4) | 55 (30.7) |
Glycemic control | ||
Hemoglobin A1C (%), mean (SD) | 5.7 (0.4) | 5.6 (0.4) |
FPG (mmol/L), mean (SD) | 5.4 (0.6) | 5.4 (0.9) |
History of CV disease, n (%) | ||
Yes | 76 (42.2) | 81 (45.3) |
No | NR | NR |
Unknown | NR | NR |
Not applicable | NR | NR |
History of gallbladder disease, n (%) | ||
Yes | 21 (11.7) | 17 (9.5) |
No | 159 (88.3) | 162 (90.5) |
Cardiometabolic markers, n (%) | ||
Dyslipidemia | 65 (36.1) | 55 (30.7) |
Hypertension | 75 (41.7) | 77 (43.0) |
Dyslipidemia and hypertension | 41 (22.8) | 35 (19.6) |
OSA-related parameters, mean (SD) | ||
AHI score | 49.0 (27.5) | 49.3 (27.5) |
Oxygen desaturation saturation index ≥ 4% | 43.7 (26.1) | 44.1 (26.1) |
Lowest oxygen saturation | 74.2 (10.5) | 74.7 (10.4) |
Total sleep time (in minutes) | 356.3 (62.2) | 348.4 (63.6) |
AHI = apnea-hypopnea index; BMI = body mass index; CV = cardiovascular; FAS = full analysis set; FPG = fasting plasma glucose; LIRA = liraglutide; NR = not reported; OSA = obstructive sleep apnea; SD = standard deviation.
Source: Clinical Study Report for Study 3970.14
Interventions
Study 1839 randomly assigned patients in a 2:1 ratio to receive once-daily subcutaneous injections of liraglutide at a dose of 3 mg (n = 2,487) or placebo (n = 1,244). To mitigate any potential GI side effects, treatment with liraglutide was initiated using a 4-week dose titration schedule, as follows: 0.6 mg for week 1; 1.2 mg for week 2; 1.8 mg for week 3; 2.4 mg for week 4 and 3 mg for week 5, and thereafter. Liraglutide was available in a concentration of 6 mg/mL in a 3 mL FlexPen. The placebo volume was adjusted to match the corresponding dose of liraglutide. Liraglutide 3 mg or placebo was administered once daily by subcutaneous injections either in the abdomen, thigh, or upper arm at any time of day, regardless of meals. However, it was preferable that injections were performed at approximately the same time on a day-to-day basis. Although not stated, it is reasonable to assume that the injections were self-administered by patients, given their outpatient status and the daily dosing requirement.
Patients in both the liraglutide group and placebo group received counselling on lifestyle modification from randomization and throughout the entire trial. Counselling was provided by a qualified dietitian according to local standards and the patients were put on a reduced-calorie diet containing a maximum of 30% of energy from fat, approximately 20% of energy from protein, and approximately 50% of energy from carbohydrates, and with an energy deficit of approximately 500 kcal/day compared with the patients’ estimated total energy expenditure. All patients were instructed by a qualified dietitian to keep a 3-day food diary every second month for the purpose of diet counselling. Compliance with the prescribed diet was at the discretion of the dietitian based on review of the food diary.
After 28 days of treatment (liraglutide 3 mg plus diet and exercise), it was acceptable for the recommended energy intake to be recalculated with no kcal deficit if patients were unable to lose additional weight despite having a BMI of 25 kg/m2 or more. Also, if a BMI 22 kg/m2 or less was reached, the recommended energy intake was recalculated with no kcal deficit (maintenance diet) for the remainder of the trial. An increase in physical activity (recommended for a minimum 150 minutes per week) was encouraged and re-enforced by use of pedometers.
Concomitant medications were to be taken as usual during the conduct of the trial, except on pre-specified clinic visits where they were withheld until after blood sampling had been done. The proportion of patients with change in concomitant medication from baseline to week 56 in antihypertensive drugs, lipid-lowering agents, and OADs were analyzed and the results reported in the Efficacy section of this report.
For Study 1922, 423 patients were randomized to receive treatment with liraglutide 3 mg, while 210 patients and 212 patients were allocated to receive liraglutide 1.8 mg and placebo, respectively. The placebo treatment group was further subdivided into 2 treatment groups, with different injection volumes corresponding to the different dose levels of liraglutide. Treatment initiation and dose titration was given to the recommended maintenance 3 mg daily dose, as well as counselling on diet and physical activity, and provision for recalculating energy intake followed a similar manner as previously described for Study 1839. Concomitant medication use was limited to metformin, SU, and glitazone, either as monotherapy or a combination of any of the 3.
In Study 1923, a total of 422 patients who lost 5% body weight or more on a reduced-calorie diet during the 4-week to 12-week run-in period were randomly assigned to treatment with liraglutide 3 mg (n = 212) or placebo (n = 210). Treatment initiation and dose titration were given to the recommended maintenance level of a 3 mg daily dose, as well as counselling on diet and physical activity, and provision for recalculating energy intake followed a similar manner as previously described for Study 1839.
Study 3970 randomly assigned a total of 359 eligible patients in a 1:1 ratio to receive either once-daily liraglutide 3 mg (n = 180) or placebo (n = 179). Initiation of treatment followed the dose escalation procedure as previously described. Patients in both groups were counselled throughout the trial by a dietitian, were maintained on a 500 kcal/day deficit diet and encouraged to exercise for a minimum of 150 minutes per week. The counselling on diet and physical activity, with provision for recalculating energy intake after 28 weeks of BMI review, followed in a similar manner as previously described for Study 1839.
Outcomes
A list of efficacy end points identified in the CADTH review protocol that were assessed in the clinical trials included in this review is provided in Table 15. These end points are further summarized as follows. A detailed discussion and critical appraisal of the outcome measures is provided in Appendix 4.
Table 15: Summary of Outcomes of Interest Identified in the CADTH Review Protocol
Outcome measure | Study 1839: Main phase | Study 1839: Extension phase | Study 1922 | Study 1923 | Study 3970 |
|---|---|---|---|---|---|
Mortality | Safety | Safety | Safety | NR | NR |
Body weight | Primary and secondary | Secondary | Primary | Primary and secondary | Secondary |
BMI | Secondary | Secondary | Secondary | Secondary | Secondary |
HRQoL | Secondary | Secondary | Secondary | NR | Secondary |
Development of T2DM | Secondary | Primary | NA | NR | NR |
Time to T2DM | Secondary | Primary | NA | NR | NR |
Glycemic control | Secondary | Secondary | Secondary | Secondary | Secondary |
Weight-related comorbidities | NR | NR | NR | NR | Primary (AHI change) Secondary (OSA remission) |
Dose reduction or complete withdrawal of concomitant medication for weight-related comorbidities | Secondary | Secondary | NR | Secondary | NR |
Severity of depression | NR | NR | NR | Secondary | Secondary |
Physical function | Secondary (as part of HRQoL) | Secondary (as part of HRQoL) | Secondary (as part of HRQoL) | NR | Secondary (as part of HRQoL) |
Impact on work and daily activities | Secondary (as part of HRQoL) | Secondary (as part of HRQoL) | Secondary (as part of HRQoL) | NR | Secondary (as part of HRQoL) |
Food craving | NR | NR | NR | Secondary (binge eating) | NR |
AHI = apnea-hypopnea index; BMI = body mass index; HRQoL = health-related quality of life; NR = not reported; OSA = obstructive sleep apnea; T2DM = type 2 diabetes mellitus.
Sources: Clinical Study Reports for Study 1839,11 Study 1839 extension,15 Study 1922,12 Study 1923,13 and Study 3970.14
Mortality
Mortality was not measured as an efficacy outcome in any of the included trials. However, where it occurred, the number and percentage of deaths were reported under the safety evaluation in the manner described as follows.
Body Weight
Weight was measured at all study visits except for screening visit 2. The same calibrated scales were preferably to be used throughout the trial. Measurements were made in the fasting state with an empty bladder, without shoes, only wearing light clothing, and recorded to the nearest 0.1 kg. Patients’ body weight measured at baseline was used in the assessment of change in body weight. The percentage change in fasting body weight from baseline, the proportion of patients losing 5% or more of body weight, and the proportion of patients losing more than 10% of baseline body weight after 56 weeks of treatment were co-primary efficacy end points in the main phase of Study 1839 and Study 1922. In Study 1923, the percentage change in weight, the percentage of patients maintaining run-in fasting weight loss, and the proportion of patients losing 5% or more baseline weight after 56 weeks of treatment were the co-primary end points, whereas in Study 3970, body weight outcomes were secondary end points.
Body Mass Index
BMI was calculated as follows: BMI is equal to weight (kg) divided by height2 (m2), where change in BMI was calculated using weight and height as measured and recorded at screening visit 1. The change in BMI from baseline to the end of study was a secondary outcome in all the included studies.
Health-Related Quality of Life
Patient-reported HRQoL was assessed with tools such as the Impact of Weight on Quality of Life-Lite (IWQOL-Lite) questionnaire, the Short Form (36) Health Survey (SF-36) questionnaire, the Treatment Related Impact Measure of Weight (TRIM-Weight), and the Diabetes Treatment Satisfaction Questionnaire (DTSQ).
IWQOL-Lite
The IWQOL-Lite was assessed as a secondary outcome in Study 1839 and Study 1922. It is a disease-specific questionnaire designed to assess the effect of obesity on quality of life. The IQWOL-Lite has 31 self-administered items with 5 domains: self-esteem (7 items), sexual life (4 items), physical function (11 items), public distress (5 items), and work (4 items). Total scores and subscale scores on the IWQOL-Lite are transformed to a range from 0 to 100, with 100 being the best and a 0 being the poorest quality of life. The reliability of the IWQOL-Lite has been validated in patients living with obesity seeking treatment. The minimal important difference (MID) for an improvement in the IWQOL-Lite total score ranges from 7.7 to 12, depending on the baseline score. The MIDs for improvement were 7.7 to 7.8 for patients with no impairment at baseline (depending on exact baseline score), 7.9 to 8.1 for patients with mild impairment, 8.1 to 8.4 for patients with moderate impairment, and 12.0 for patients with severe impairment.30 The MIDs for deterioration that were determined using the distribution-based method ranged from –7.8 to –4.4, depending on baseline severity of impairment.30 Further information on the IWQOL-Lite questionnaire is provided in Appendix 4.
Short-Form (36) Health Survey
The SF-36 (version 2.0) tool was used to assess HRQoL as a secondary outcome in Study 1839 and Study 3970. It is a 36-item generic instrument used to measure general health, which has been used extensively in clinical trials. It has 8 health domains for scoring: physical functioning, role-physical, bodily pain, general health, vitality, social functioning, role-emotional, and mental health. Scores from these 8 domains are summarized using a scoring algorithm into the 2 component summaries of the SF-36: the physical component summary (PCS) and the mental component summary (MCS). Scores on the PCS and MCS range from 0 to 100, with higher scores indicating better health status. The SF-36 has been validated in a variety of disease conditions. There is evidence of SF-36 MCS and PCS validity in the community-based population living with obesity. In the general population, clinically meaningful improvement is indicated by a change of 2 points in the SF-36 PCS and 3 points in the SF-36 MCS.31 Based on anchor data, the following minimal mean group differences, in terms of t score points, are described for SF-36 version 2.0 individual dimension scores: physical functioning, 3; role-physical, 3; bodily pain, 3; general health, 2; vitality, 2; social functioning, 3; role-emotional, 4; and mental health, 3.31 These MID values were determined as appropriate for groups with mean t score ranges of 30 to 40.31 For higher t score ranges, MID values may be higher.31 No information about the MID of the SF-36 in the population living with obesity was located. Further information on the SF-36 is provided in Appendix 4.
Treatment Related Impact Measure of Weight
The TRIM-Weight scale was assessed as a secondary outcome in Study 1839. It is a treatment-specific outcomes measure used in patients living with obesity to assess the impacts of anti-obesity medications. The TRIM-Weight scale is a validated 22-item instrument with 5 domains: daily life (6 items), weight management (3 items), treatment burden (4 items), experience of side effects (5 items), and psychological health (4 items). A higher TRIM-Weight score indicates greater improvement. No information was identified about the MID of the TRIM-Weight scale for adult patients who are overweight or living with obesity. However, it was estimated that the MID threshold met ½ standard deviation (SD) criteria for the total score, and all the domain scores.32 No significant relationships were found between the TRIM-Weight total score and BMI category, gender, age, or educational level.32
Diabetes Treatment Satisfaction Questionnaire
Study 1922 reported mean change from baseline in total DTSQ score as a secondary outcome. The DTSQ is an 8-item questionnaire used to evaluate patients’ satisfaction with treatment regarding convenience, flexibility, and general feelings. The first 36 items measure treatment satisfaction and are summed up to derive a total response score between 0 and 36, with higher DTSQ scores indicating greater satisfaction with treatment.33,34 The remaining 2 items assess patients’ perceived frequency of hyperglycemia or hypoglycemia, with responses scored on a 7-point scale from 0 (none of the time) to 6 (most of the time). Lower scores on these 2 items indicate greater perceived blood glucose control.33,34 While the limited number of questionnaire items makes DTSQ convenient to use, it also limits the range that can be assessed concerning the impact and satisfaction that treatment had on patients’ quality of life. No evidence assessing the validity and reliability of the DTSQ in patients living with obesity was identified in the literature. No MID was identified for the change in DTSQ scores.
Development of T2DM and Time of Onset of T2DM
Development of T2DM was reported as a secondary end point in the main study and a primary end point in the extension phase of Study 1839. The presence of T2DM was determined through assessment of glycemic control parameters. In the event of hemoglobin A1C of 6.5% or more at any time during the trial, a repeated measurement was to be taken within 4 weeks to confirm or exclude a diagnosis of diabetes. The time of onset of T2DM was assessed as the annualized incidence rate, defined as the number of new cases of T2DM per 100 patient-years of exposure.
Glycemic Control
Glycemic control was assessed as a secondary outcome using a variety of measures in each of the included studies. However, glycemic control parameters listed in this review’s protocol were hemoglobin A1C and fasting plasma glucose (FPG). According to information provided by the sponsor, the assay method used to assess hemoglobin A1C was certified under the National Glycohemoglobin Standardization Program. Hemoglobin A1C and FPG assessments were performed on blood samples drawn at pre-specified clinic visits.
Weight-Related Comorbidity
Change in weight-related comorbidity was assessed in Study 3970, which investigated the efficacy of liraglutide 3 mg in reducing the severity of OSA, as assessed by the AHI. The AHI is the number of apneas or hypopneas recorded during the study per hour of sleep, expressed as the number of events per hour.35 Polysomnography recordings show the episodes of apneas or hypopneas and the severity of OSA is classified into 4 categories according to AHI scores, as follows35:
AHI score of less than 5 per hour — None/minimal
AHI score of 5 or higher per hour but less than 15 per hour — Mild
AHI score of 15 per hour or higher but less than 30 per hour — Moderate
AHI score of 30 or higher per hour — Severe
Non-Fatal Cardiovascular Events
This outcome was not measured in any of the included trials as a measure of efficacy. However, Study 1839 reported tachycardia and atrioventricular block as AEs in the manner described as follows in the Safety section.
Renal Outcomes
This outcome was not measured in any of the included trials as a measure of efficacy. However, Study 1839 and Study 1922 reported on renal and urinary outcomes as AEs in the manner as described as follows in the Safety section.
Severity of Depression
This was a secondary outcome reported in Study 1923 using the 9-item Patient Health Questionnaire (PHQ-9) score. The PHQ-9 is a general measure of HRQoL and is a 9-item self-administered Likert scale. It is a reliable, validated scale comprising 9 items that directly correspond to the Diagnostic and Statistical Manual of Mental Disorders, Fourth Edition (DSM-IV) criteria for major depression. The total score ranges from 0 to 27, with cut-off scores recommended at 5 for mild, 10 for moderate, 15 for moderately severe, and 20 for severe depressive symptoms. The standard cut-off score of 10 is typically recommended for depression screening. The MID of PHQ-9 has been estimated at 5 points on a scale of 0 to 27 points.36 The reliability and validity of PHQ-9 have been established in patients with persistent major depression, partial remission, and full remission.36 Validity was not assessed in patients living with obesity.37 However, there is some evidence of reliability for adult patients living with obesity awaiting bariatric surgery, although the applicable cut-off score is unclear.37
Physical Function
This outcome was not measured in any of the included trials as a stand-alone efficacy measure. However, the IWQOL-Lite instrument used in Study 1839 and Study 1922 and SF-36 tools used in Study 1839 and Study 3970 have domain items for physical functioning in assessing patients’ HRQoL.
Impact on Work and Daily Activities
This outcome was not measured in any of the included trials as a stand-alone efficacy measure. However, the IWQOL-Lite tool used in Study 1839 and Study 1922 has a work score as 1 of the domain items in assessing patients’ HRQoL.
Health care resource utilization, dose reduction or complete withdrawal of concomitant medications for weight-related comorbidities, the elimination of non-drug interventions for weight-related comorbidities, fatigue, and pain intensity were identified as outcomes of interest in the CADTH review protocol but were not measured in any of the included trials.
Safety
TEAEs, SAEs, and AEs leading to premature withdrawal (withdrawal due to adverse events, or WDAEs) or discontinuation of treatment, as well as deaths, were reported as safety outcomes in the included studies. TEAEs were defined as an event that had onset on or after the first day of randomized treatment and no later than 14 days after the last day of randomized treatment. According to information provided by the sponsor, all AEs either observed by the investigator or reported spontaneously by the patients were to be recorded by the investigator on the AE form in the electronic data capture (the electronic case report form) and evaluated. Also, at each contact with the trial site, the patients were asked whether they had had any AEs (including any changes in concomitant illness or new illnesses) since their last visit. The safety items were summarized descriptively and presented in terms of the number of patients with at least 1 event (N), the percentage of patients with at least 1 event, and the event rate per 100 years (R).
Statistical Analysis
The sponsor-submitted pivotal study (Study 1839) had 3 co-primary end points for the 56-week main phase: 5% or more of baseline body weight, and the proportion of patients losing more than 10% of baseline body weight after 56 weeks of treatment. The primary end point of the study’s 104-week extension phase (i.e., the fourth co-primary end point of Study 1839) was new onset of T2DM among patients with prediabetes after 160 weeks of treatment. Each comparison of liraglutide 3 mg and placebo with respect to the primary end points were tested in a hierarchical manner, based on a predefined fixed sequence of the 4 primary end points (Table 16 and Table 17). The order of testing was as follows:
relative change from baseline fasting body weight at 56 weeks
the proportion of patients losing 5% or more of baseline fasting body weight at 56 weeks
the proportion of patients losing more than 10% of baseline fasting body weight at 56 weeks
time to onset of T2DM at 160 weeks (extension phase among patients with prediabetes).
The test for each primary end point was carried out based on a 2-sided test with a significance level of 0.05 (provided that superiority of liraglutide is demonstrated for all previous end points).
Relative change from baseline body weight was analyzed using an analysis of covariance (ANCOVA) model with adjustment for country, a BMI stratification factor, the prediabetes status at screening, an interaction between BMI strata and prediabetes status at screening and gender, and baseline fasting body weight. The expected differences between the treatment groups were estimated together with the corresponding 95% confidence interval (CI) and P value. The 2 end points of proportion of patients losing 5% or more and more than 10% of baseline body weight were both analyzed using a logistic regression model, adjusting for the same factors as those in the ANCOVA model. The proportion of patients with onset of T2DM at week 160 among patients with prediabetes at baseline was evaluated at specific visits during the trial and was modelled as a time-to-onset-of-T2DM ratio using Weibull analysis to account for interval censoring. The model adjusted for sex, the BMI stratification factor, and baseline FPG. The findings were presented as a time-to-event ratio along with a corresponding 95% CI and P value, as well as an equivalent estimated treatment hazard ratio.
Study 1922 had the same 3 co-primary end points as described earlier for the 56-week main phase of Study 1839. The hierarchical testing structure and analyses of the 3 primary end points were also similar to that of Study 1839. The factors adjusted for in each comparison for Study 1922 include country, hemoglobin A1C stratification factor, background treatment stratification factor, interaction between stratification factors, sex, and baseline body weight.
Study 1923 had 3 co-primary end points: the percentage of body weight loss, the proportion of patients who maintain run-in fasting weight loss after 56 weeks of treatment, and the proportion of patients losing at least 5% of baseline weight. Patients were deemed to have maintained run-in weight loss if they regained no more than 0.5% of weight from baseline. Each comparison of liraglutide 3 mg and placebo was tested in a hierarchical manner based on a predefined fixed sequence in the order in which the end points are mentioned. Each comparison was made based on a 2-sided test at the significance level of 0.05. The continuous and categorical end points of Study 1923 were similarly analyzed using ANCOVA and logistic regression, respectively. Each model adjusted for sex, country, comorbidities stratification, and baseline weight.
For Study 3970, the primary end point was the change from baseline in AHI (events per hour) after 32 weeks. The comparison between liraglutide 3 mg and placebo was made using ANCOVA, with adjustment for sex, country, baseline AHI, baseline BMI, and baseline age.
Each analysis for the primary outcomes of all studies was carried out using the full analysis set (FAS) and missing data were imputed using LOCF. In all the studies, secondary end points were tested using the same models as primary analyses (i.e., ANCOVA for continuous data and regression analysis for categorical data), but without control for multiplicity. Where continuous data were analyzed using a log-transformed value, an analogous model was applied, but with the corresponding baseline value also log-transformed. Secondary end points were summarized descriptively by visit using observed data based on the FAS.
Table 16: Statistical Analysis of Efficacy End Points
End point | Statistical model | Adjustment factors | Sensitivity analyses | Analysis set | Imputation method |
|---|---|---|---|---|---|
Study 1839 | |||||
Co-primary end point at week 56 and week 160:
Co-primary end point at week 160:
| Continuous data:
Categorical data:
| Fixed factors
Covariate
| Repeated primary analysis considering the following factors:
| FAS | LOCF |
Study 1922 | |||||
Co-primary end point at week 56:
| Continuous data:
Categorical data:
| Fixed factors
Covariate
| Repeated primary analysis considering the following factors:
| FAS | LOCF |
Study 1923 | |||||
Co-primary end point, and continuous and categorical secondary end points | Continuous data:
Categorical data:
| Fixed factors
Covariate
| Repeated primary analysis considering the following factors:
| FAS | LOCF |
Changes in concomitant medication of antihypertensive drugs, lipid-lowering drugs, and anti-depressive medications | Descriptive statistics | NA | NA | NA | |
Study 3970 | |||||
Primary end point:
| ANCOVA using the LOCF approach | Fixed factors
Covariates
| Repeated primary analysis considering the following factors:
| FAS | LOCF |
Secondary end points | Continuous end points:
Categorical end points:
| Fixed factors
Covariates
| Repeated primary analysis considering the following factors:
| FAS | LOCF |
AHI = apnea-hypopnea index; ANCOVA = analysis of covariance, ANCOVA-L = analysis of covariance on log-transformed data; BMI = body mass index; EOT = end of treatment; FAS = full analysis set; LOCF = last observation carried forward; NA = not applicable; PSG = polysomnography; T2DM = type 2 diabetes mellitus.
Sources: Clinical Study Reports for Study 1839,11 Study 1839 extension,15 Study 1922,12 Study 1923,13 and Study 3970.14
Table 17: Statistical Testing Procedures
Study | Statistical testing procedure |
|---|---|
Study 1839: Main phase | LIRA 3 mg vs. placebo, tested in a hierarchical manner in the order in which the end points are presented as follows:
|
Study 1839: Extension phase | LIRA 3 mg vs. placebo, tested as the fourth primary end point provided that all end points were met for the main phase of the trial. Assessed by the survival end point describing the time until onset of T2DM
|
Study 1922 | LIRA 3 mg vs. placebo for the 3 co-primary end points, tested in a hierarchical manner in the following order:
|
Study 1923 | LIRA 3 mg vs. placebo, tested in a hierarchical manner in the order in which the end points are presented as follows:
|
Study 3970 | LIRA 3 mg vs. placebo for a single primary end point:
|
AHI = apnea-hypopnea index; LIRA = liraglutide; T2DM = type 2 diabetes mellitus; vs. = versus.
Sources: Clinical Study Reports for Study 1839,11 Study 1839 extension,15 Study 1922,12 Study 1923,13 and Study 3970.14
Subgroup Analyses
All the included studies performed pre-specified subgroup analyses to compare the efficacy of liraglutide in various subgroups. The subgroup analyses pre-specified in the protocol for this systematic review are diabetes status (e.g., prediabetes, T2DM), baseline BMI (e.g., BMI 30 kg/m2 or greater versus 27 kg/m2 to less than 30 kg/m2), the number and/or type of weight-related comorbidities, patients with or without previous bariatric surgery, and ethnicity.
In Study 1839, subgroup analyses were conducted according to prediabetes status and baseline BMI (BMI ≥ 30 kg/m2 or 27 kg/m2 to < 30 kg/m2) at screening in the main phase and for BMI alone in the extension phase. Study 1922 performed subgroup analyses based on background treatment (i.e., metformin, SU, and glitazone) whereas Study 1923 conducted subgroup analysis according to comorbidity status (i.e., the presence or absence of treated or untreated hypertension or dyslipidemia. Three subgroup analyses were performed in Study 3970 to investigate the treatment effect for the genders (i.e., female and male), the initial AHI condition (moderate or severe sleep apnea), and initial BMI (30.0 kg/m2 to 34.9 kg/m2, 35.0 kg/m2 to 39.9 kg/m2, and ≥ 40.0 kg/m2).
For Study 1839, Study 1922, and Study 1923, it was unclear if statistical tests were performed to evaluate for differences in effects between subgroups. The model for assessing subgroups in Study 3970 tested the interaction of subgroups with fixed factors and covariates of the statistical analysis.
Sensitivity Analyses
All the included studies performed pre-specified sensitivity analyses to support the robustness of the evidence from the primary analyses. In this regard, the same methodologies used in analyzing the primary end points were applied using different analysis sets in all the studies. The key analyses sets that were used in sensitivity testing in the main phase of Study 1839 were:
a set of completers
all randomized patients for patients without post-baseline measurements, baseline values were carried forward
the FAS, including fasting and non-fasting weight measurements and using follow-up measurements of fasting body
the FAS, including fasting and non-fasting weight measurements, off-drug weight measurements, and follow-up weight measurements
the FAS, but by imputing missing post-baseline observations of the primary end point using a multiple imputation procedure.
Similar analyses sets were used in sensitivity testing in Study 1922, Study 1923, and Study 3970, each according to their primary end points and end of treatment. In addition to the analysis sets described earlier, the 3 studies also applied the same methodologies used in analyzing their primary end points to the FAS but imputing missing observations with the regression method. Study 1923 also performed a sensitivity analysis using the FAS without imputation, by treating patients without a valid assessment of weight at the end of treatment as nonresponders.
For the extension phase of Study 1839, 7 sensitivity analyses of the primary end point, the onset of T2DM, were performed. This included applying the Weibull model and Cox regression to a set of completers. Other sensitivity analyses sets were as follows:
patients without prediabetes stratified to join the extension phase
patients with prediabetes who were re-randomized instead of continuing in the 160-week treatment period, and excluding patients who had normal glycemic parameters at baseline but were stratified to 160 weeks of treatment
patients with possible T2DM, but without confirmation as having T2DM
patients who were potentially unblinded during the trial.
Analysis Populations
All the included studies used the FAS in analyzing efficacy outcomes and the safety analysis set (SAS) for analyzing harms outcomes. The FAS was defined as all randomized patients exposed to at least 1 dose of the trial product and with at least 1 post-baseline assessment of any end point. Patients in the FAS were analyzed according to the treatment group to which they were originally randomized.
The SAS included all randomized patients exposed to at least 1 dose of trial product. If a patient received a treatment different than that to which they were randomized, data for the patient was analyzed, tabulated, and/or listed according to the actual treatment they had received.
Results
Patient Disposition
Patient disposition data for the included studies are summarized in Table 18, Table 19, Table 20, Table 21, and Table 22. For Study 1839 (both the main phase and extension phase) as well as Study 1922 and Study 1923, the study discontinuation rate was lower in the liraglutide 3 mg group (%) than in the placebo group (%), indicating a greater proportion of completers with liraglutide than with placebo. AEs were the most common reason for discontinuation in the liraglutide 3 mg group (8.5% to 13.5%), whereas the most common reason for discontinuation in the placebo group was withdrawal of consent (11.2% to 31.1%). The overall rates of discontinuation from the study were lower with liraglutide than with placebo in Study 1839 (liraglutide versus placebo: 28.1% versus 35.6% in the main phase, and 31.1% versus 55.0% in the extension phase, respectively), Study 1922 (liraglutide: 23.4%; placebo: 34.0%), and Study 1923 (liraglutide: 25.0%; placebo: 30.5%), but were lower in the placebo group in Study 3970 (liraglutide: 25.6%; placebo: 20.7%). Although the overall rates of discontinuation due to ineffective therapy were low across the study groups, they were lower with liraglutide than with placebo in Study 1839 (liraglutide versus placebo: 0.9% versus 2.9% in the main phase, and 1.9% versus 4.8% in the extension phase, respectively), Study 1922 (liraglutide: 0.0%; placebo: 1.4%), and Study 1923 (liraglutide: 0.0%; placebo: 1.0%), but were lower in the placebo group in Study 3970 (liraglutide: 1.1%; placebo: 0.6%). There was no consistency across the trials regarding discontinuation due to non-compliance with the study protocols. Table 19 summarizes the disposition of patients without prediabetes who were re-randomized after the 56-week main phase of the study for an additional 12 weeks to evaluate the effects of drug cessation on weight control, possible withdrawal, and rebound effects.
Table 18: Study 1839 — Patient Disposition in Patients Without Diabetes and With Prediabetes
Description | 56-week main study phase | 104-week extension phase | ||
|---|---|---|---|---|
Study details | LIRA 3 mg | Placebo | LIRA 3 mg | Placebo |
Screened, N | 4,992 | |||
Randomized, N (%) | 2,487 (100.0) | 1,244 (100.0) | 1,505 (100) | 749 (100) |
Completed study, N (%) | 1,789 (71.9) | 601 (64.4) | 791 (52.6) | 337 (45.0) |
Discontinued study, N (%) | 698 (28.1) | 443 (35.6) | 714 (47.4) | 412 (55.0) |
Reason for discontinuation, N (%) | ||||
Adverse events | 238 (9.6) | 47 (3.8) | 200 (13.3) | 43 (5.6) |
Ineffective therapy | 23 (0.9) | 36 (2.9) | 29 (1.9) | 36 (4.8) |
Non-compliance with protocol | 65 (2.6) | 38 (3.1) | 73 (4.9) | 34 (4.5) |
Withdrawal of consent | 264 (10.6) | 249 (20.0) | 324 (21.5) | 233 (31.1) |
Other | 78 (3.1) | 63 (5.1) | 60 (4.0) | 50 (6.7) |
Entered re-randomization period, N (%) | 701 (28.2) | 304 (24.4) | NA | NA |
FAS,a N (%) | 2,437 (98.0) | 1,225 (98.5) | 1,472 (97) | 738 (98.5) |
SAS,b N (%) | 2,481 (99.8) | 1,242 (99.8) | 1,501 (99.7) | 747 (99.7) |
EOT = end of treatment; FAS = full analysis set; LIRA = liraglutide; NA = not applicable; SAS = safety analysis set.
aThe FAS included all randomized patients exposed to at least 1 dose of the trial product and with at least 1 post-baseline measurement of the pre-specified end points.
bThe SAS comprised all randomized patients who had been exposed to at least 1 dose of the trial product.
Sources: Clinical Study Reports for Study 183911 and the Study 1839 extension.15
Table 19: Study 1839 — Patient Disposition in Patients Without Prediabetes at Screening Re-Randomized for an Additional 12-Week Treatment (Week 56 to Week 68)
Description | LIRA/LIRA | LIRA/placebo | Placebo |
|---|---|---|---|
Entered re-randomization period, N (%) | 351 (100) | 350 (100) | 304 (100) |
Completed week 68, N (%) | 342 (97.4) | 343 (98.0) | 289 (95.1) |
Discontinued by week 68, N (%) | 9 (2.6) | 7 (2.0) | 15 (4.9) |
Reason for discontinuation, N (%) | |||
Adverse events | 1 (0.3) | 1 (0.3) | 2 (0.7) |
Ineffective therapy | 0 (0.0) | 0 (0.0) | 1 (0.3) |
Non-compliance with protocol | 1 (0.3) | 0 (0.0) | 1 (0.3) |
Withdrawal of consent | 6 (1.7) | 4 (1.1) | 6 (2.0) |
Other | 1 (0.3) | 2 (0.6) | 2 (0.7) |
FAS,a N (%) | 351 (100) | 350 (100) | 304 (100) |
SAS,b N (%) | 351 (100) | 350 (100) | 304 (100) |
FAS = full analysis set; LIRA = liraglutide; SAS = safety analysis set.
Note: Liraglutide/liraglutide patients were randomized from the liraglutide 3 mg group in the main phase of Study 1839 to continue liraglutide 3 mg for an additional 12 weeks. Liraglutide/placebo patients were randomized from the liraglutide 3 mg group in the main phase to continue placebo for an additional 12 weeks.
aThe FAS included all randomized patients exposed to at least 1 dose of the trial product and with at least 1 post-baseline measurement of the pre-specified end points.
bThe SAS comprised all randomized patients who had been exposed to at least 1 dose of the trial product.
Source: Clinical Study Report for Study 1839.11
Table 20: Study 1922 — Patient Disposition in Patients With Type 2 Diabetes
Description | Study 1922 | |
|---|---|---|
LIRA 3 mg | Placebo | |
Screened, N | 1,361 | |
Randomized, N (%) | 423 (100) | 212 (100) |
Completed study, N (%) | 324 (76.6) | 164 (77.7) |
Discontinued study, N (%) | 99 (23.4) | 72 (34.0) |
Reason for discontinuation, N (%) | ||
Adverse events | 39 (9.2) | 7 (3.3) |
Ineffective therapy | 0 (0.0) | 3 (1.4) |
Non-compliance with protocol | 12 (2.8) | 13 (6.1) |
Withdrawal of consent | 27 (6.4) | 28 (13.2) |
Unacceptable hyperglycemia | 5 (1.2) | 9 (4.2) |
Other | 16 (3.8) | 12 (5.7) |
FAS,a N (%) | 412 (97.4) | 211 (99.5) |
SAS,b N (%) | 422 (99.8) | 212 (100) |
FAS = full analysis set; LIRA = liraglutide; SAS = safety analysis set.
aThe FAS included all randomized patients exposed to at least 1 dose of the trial product and with at least 1 post-baseline measurement of the pre-specified end points.
bThe SAS comprised all randomized patients who had been exposed to at least 1 dose of the trial product.
Source: Clinical Study Report for Study 1922.12
Table 21: Study 1923 — Patient Disposition in Patients Without Diabetes
Description | Study 1923 | |
|---|---|---|
LIRA 3 mg | Placebo | |
Screened, N | 675 | |
Randomized, N (%) | 212 (100.0) | 210 (100.0) |
Completed study, N (%) | 159 (75.0) | 146 (69.5) |
Discontinued study, N (%) | 53 (25.0) | 64 (30.5) |
Reason for discontinuation, N (%) | ||
Adverse events | 18 (8.5) | 18 (8.6) |
Ineffective therapy | 0 (0.0) | 2 (1.0) |
Non-compliance with protocol | 8 (3.8) | 5 (2.4) |
Withdrawal of consent | 17 (8.0) | 24 (11.4) |
Other | 10 (4.7) | 15 (7.1) |
FAS,a N (%) | 207 (97.6) | 206 (98.1) |
SAS,b N (%) | 212 (100.0) | 210 (100.0) |
FAS = full analysis set; LIRA = liraglutide; SAS = safety analysis set.
aThe FAS included all randomized patients exposed to at least 1 dose of the trial product and with at least 1 post-baseline measurement of the pre-specified end points.
bThe SAS comprised all randomized patients who had been exposed to at least 1 dose of the trial product.
Source: Clinical Study Report for Study 1923.13
Table 22: Study 3970 — Patient Disposition in Patients With Moderate or Severe Obstructive Sleep Apnea
Description | Study 3970 | |
|---|---|---|
LIRA 3 mg | Placebo | |
Screened, N | 813 | |
Randomized, N (%) | 180 (100.0) | 179 (98.9) |
Completed study, N (%) | 134 (74.4) | 142 (79.3) |
Discontinued study, N (%) | 46 (25.6) | 37 (20.7) |
Reason for discontinuation, N (%) | ||
Adverse events | 20 (11.1) | 6 (3.4) |
Ineffective therapy | 2 (1.1) | 1 (0.6) |
Non-compliance with protocol | 8 (4.4) | 5 (2.8) |
Withdrawal of consent | 12 (6.7) | 20 (11.2) |
Other | 2 (1.1) | 5 (2.8) |
FAS,a N (%) | 180 (100.0) | 179 (100.0) |
SAS,b N (%) | 176 (97.8) | 179 (100.0) |
FAS = full analysis set; LIRA = liraglutide; SAS = safety analysis set.
aThe FAS included all randomized patients exposed to at least 1 dose of the trial product and with at least 1 post-baseline measurement of the pre-specified end points.
bThe SAS comprised all randomized patients who had been exposed to at least 1 dose of the trial product.
Source: Clinical Study Report for Study 3970.14
Exposure to Study Treatments
For Study 1839, Study 1922, and Study 3970, the total exposure was expressed as patient-years of exposure to treatments and reflected the randomization ratio used for each study. The computation was based on the SAS.
In the 56-week main phase of Study 1839, the total exposure was 2,234.7 years and 1,067.4 years with liraglutide 3 mg and placebo, respectively. Thus, the mean duration of exposure was the same for the 2 treatments (0.9 years) based on 2,481 patients and 1,242 patients in the liraglutide and placebo groups, respectively. Most of the patients were exposed for 53 weeks to 56 weeks, with 62.0% and 56.6% of patients in the liraglutide 3 mg and placebo groups, respectively, achieving that level of exposure. The difference reflects the higher withdrawal rate with placebo. In the 12-week re-randomization period, the total exposure was 80.2 years, 78.6 years, and 68.2 years for the liraglutide/liraglutide group, the liraglutide/placebo group, and the placebo group, respectively. Most of the patients were exposed 9 weeks to 12 weeks, with 84.6%, 87.1%, and 80.9% of patients in the liraglutide/liraglutide group, the liraglutide/placebo group, and the placebo group, respectively, achieving that level of exposure.
In the extension phase, the total exposure was 3,161 years with liraglutide 3 mg and 1,442 years with placebo, with respective mean exposures of 2.1 years and 1.9 years. Approximately half of all treated patients in the extension phase were exposed to the trial product for 36 months, although the proportion of patients exposed for 36 months or more was higher with liraglutide 3 mg (52.8%) than with placebo (45.2%), reflecting the higher withdrawal rate in the placebo group.
According to information provided by the sponsor, treatment adherence was good, in general, for both the main phase and the extension phase of the study, with most patients reaching the target daily dose of 3 mg. However, protocol deviations regarding missing injections and nonadherence with the dose escalation scheme occurred (357 protocol deviations occurred during the main phase; the number of protocol deviations during the extension phase was not reported). None of these deviations was considered to have any effect on the trial results.
The total exposure in Study 1922 was 379.86 years and 179.71 years for liraglutide 3 mg and placebo, respectively, with corresponding mean duration of exposure of 0.9 years and 0.85 years reflecting the higher withdrawal rate with placebo. The level of compliance with the use of trial interventions was not adequately discussed.
In Study 1923, the mean (SD) duration of treatment was 335.0 (115.2) days and 321.1 (124.2) days, and the mean total exposure was 194.5 years and 184.6 years for the liraglutide 3 mg and placebo groups, respectively. The level of compliance with treatment was not adequately discussed in Study 1923. Although it was indicated for 457 important patient-level protocol deviations, 53 of those deviations (11.6%) were related to treatment compliance.
The total exposure in Study 3970 was 89.5 and 96.0 years for liraglutide 3 mg and placebo, respectively. The mean duration of treatment was slightly lower in the liraglutide 3 mg group (26.5 weeks) than the placebo group (28.0 weeks). The difference in the total exposure reflects the higher number of withdrawn patients in the liraglutide 3 mg group and the slightly greater number of patients exposed to placebo. The level of compliance with the use of trial treatment was not adequately discussed.
Efficacy
Only those efficacy outcomes identified in the review protocol are reported as follows. The investigators conducted sensitivity analyses for the primary end points using different analyses sets. Of the subgroups listed in the protocol for this systematic review, Study 1839 reported subgroup results for both the prediabetes and BMI categories, whereas Study 1922, Study 1923, and Study 3970 reported subgroup outcomes for BMI but not for prediabetes. None of the included studies analyzed efficacy data with respect to weight-related comorbidities, bariatric surgery history, or ethnicity subgroups. The results of the subgroup analyses and sensitivity analyses were consistent with the findings of the primary analyses for each study. A summary of results for subgroup analyses is available in Appendix 3.
Mortality
Mortality was not reported as an efficacy outcome in any of the included studies. A detailed presentation and description of mortality is presented in the Harms section of this report. Briefly, in Study 1839, 1 death occurred in the liraglutide 3 mg group and 2 deaths occurred in the placebo group during the main phase of the study. By the end of the study’s extension phase, each group had a total of 2 deaths, corresponding to mortality rates of 0.1% and 0.3% for the liraglutide 3 mg and placebo groups, respectively. No deaths were reported during Study 1922 or Study 3970, and 1 death occurred in the placebo group in Study 1923.
Change From Baseline in Body Weight
Body weight outcomes reported in the studies were the percentage change in body weight from baseline, the proportion of patients losing at least 5% of baseline body weight, the proportion of patients losing more than 10% of baseline body weight, and the change in kilogram body weight from baseline. In addition, Study 1923 reported on patients maintaining run-in weight loss as well as maintaining more than 50% or more than 75% of baseline body weight loss. The results of body weight outcomes from the included studies are summarized in Table 23, Table 24, Table 25, Table 26, and Table 27.
Percentage of Body Weight Change
The percentage change in body weight from baseline after 56 weeks of treatment was a co-primary end point in the main phase of Study 1839, as well as in Study 1922 and Study 1923. Study 3970 and the extension phase of Study 1839 reported this outcome as a secondary end point after 32 weeks and 160 weeks of treatment, respectively, and neither study controlled for multiplicity for percentage change in body weight from baseline. In Study 1839, at week 56, the mean percentage change in body weight from baseline was –7.98% (SD = 6.67%) in the liraglutide 3 mg group and –2.62% (SD = 5.74%) in the placebo group, with a between-groups difference of –5.39% (95% CI, –5.82 to –4.95; P < 0.0001) in favour of liraglutide 3 mg.
In the extension phase of Study 1839, the mean percentage body weight change from baseline at week 160 was –6.14% (SD = 7.34%) in the liraglutide 3 mg group and –1.89% (SD = 6.27%) in the placebo group, with a between-groups difference of –3.97% (95% CI, –4.84 to –3.11; P < 0.0001), although the analyses did not control for multiplicity.
In Study 1922, the mean percent body weight change from baseline at week 56 was –5.9% (SD = 5.5%) in the liraglutide 3 mg group and –2.0% (SD = 4.3%) in the placebo group, with a between-groups difference of –4.32% (95% CI, –4.94 to –3.70; P < 0.0001) in favour of liraglutide 3 mg.
In Study 1923, the mean percentage body weight change from baseline at week 56 was –6.2% (SD = 7.3%) in the liraglutide 3 mg group and –0.2 (SD = 7.0%) in the placebo group, with a between-groups difference of –6.06% (95% CI, –7.50 to –4.62; P < 0.0001) in favour of liraglutide 3 mg.
Consistent results in favour of liraglutide 3 mg were reported in Study 3970 (–4.15; 95% CI, –5.21 to –3.09; P < 0.0001), as well as in the extension phase of Study 1839 (–4.32; 95% CI, –4.94 to –0.70; P < 0.0001), although this outcome was not controlled for multiplicity.
In the re-randomization phase of Study 1839, the mean percentage change in body weight from baseline was –9.09% (SD = 6.91%) in the liraglutide/liraglutide group, –9.33% (SD = 7.58%) in the liraglutide/placebo group, and –3.47% (SD = 5.74%) in the placebo group, with a between-groups difference (liraglutide/liraglutide versus liraglutide/placebo) of –2.18% (95% CI, –2.60 to –1.75; P < 0.0001) in favour of the liraglutide/liraglutide group, although the analysis did not control for multiplicity.
Responders, 5%
Patients losing 5% or more in baseline body weight was a co-primary end point assessed after 56 weeks of treatment in the main phase of Study 1839, and in Study 1922 and Study 1923. Study 3970 and the extension phase of Study 1839 reported this as a secondary outcome after 32 weeks and 160 weeks of treatment, respectively, and neither study controlled for multiplicity for this end point.
In the main phase of Study 1839, the proportion of patients who lost 5% or more in baseline body weight after 56 weeks of treatment was higher with liraglutide 3 mg than with placebo (63.3% versus 27.1%, respectively) and the OR indicated greater odds of losing 5% or more of baseline body weight with liraglutide 3 mg than with placebo (OR = 4.80; 95% CI, 4.12 to 5.60; P < 0.0001).
In Study 1922, the proportion of patients who lost 5% or more in baseline body weight after 56 weeks of treatment was higher with liraglutide 3 mg than with placebo (49.9% versus 13.8%, respectively) and the OR indicated greater odds of losing 5% or more of baseline body weight with liraglutide 3 mg than with placebo (OR = 6.81; 95% CI, 4.34 to 10.68; P < 0.0001).
In Study 1923, the proportion of patients who lost 5% or more in baseline body weight after 56 weeks of treatment was higher with liraglutide 3 mg than with placebo (46.4% versus 20.9%, respectively) and the OR indicated greater odds of losing 5% or more of baseline body weight with liraglutide 3 mg than with placebo (OR = 3.86; 95% CI, 2.44 to 6.09; P < 0.0001)
Consistent results were reported in Study 3970 (OR = 3.92; 95% CI, 2.41 to 6.38; P < 0.0001), as well as in the extension phase of Study 1839 (OR = 3.22; 95% CI, 2.63 to 3.94; P < 0.0001).
Responders, 10%
Patients losing more than 10% in baseline body weight after 56 weeks of treatment was a co-primary outcome in the main phase of Study 1839 and in Study 1922. Study 1923 and Study 3970, as well as the extension phase of Study 1839, also reported more than 10% loss in baseline body weight after 56 weeks, 32 weeks, and 160 weeks of treatment, respectively, and none of the studies controlled for multiplicity for this end point.
In the main phase of Study 1839, the proportion of patients who lost more than 10% in baseline body weight after 56 weeks of treatment was higher with liraglutide 3 mg than with placebo (33.1% versus 10.6%, respectively) and the OR indicated a greater likelihood of losing more than 10% baseline body weight with liraglutide 3 mg than with placebo (OR = 4.34; 95% CI, 3.54 to 5.32; P < 0.0001).
In Study 1922, the proportion of patients who lost more than 10% in baseline body weight after 56 weeks of treatment was higher with liraglutide 3 mg than with placebo (26.1% versus 6.3%, respectively) and the OR indicated a greater likelihood of losing more than 10% baseline body weight with liraglutide 3 mg than with placebo (OR = 7.10; 95% CI, 3.48 to 14.48; P < 0.0001).
Consistent results in favour of liraglutide 3 mg were reported in Study 1923 (OR = 5.30; 95% CI, 2.79 to 10.08; P < 0.0001) and Study 3970 (OR = 18.96; 95% CI, 5.69 to 63.14; P < 0.0001), as well as in the extension phase of Study 1839 (OR = 3.086; 95% CI, 2.350 to 4.052; P < 0.0001).
Change In Kilogram Body Weight
Change from baseline in kg body weight was a secondary end point in all the included studies, but was not controlled for multiplicity. For this outcome, the least squares mean (LSM) difference in changes in kg body weight after 56 weeks of treatment was –5.56 (95% CI, –6.04 to –5.09; P < 0.0001) for the main phase of Study 1839, –5.56 (95% CI, –6.04 to –5.09; P < 0.0001) for Study 1922, and –5.86 (95% CI, –7.30 to –4.43; P < 0.0001) for Study 1923, all in favour of liraglutide 3 mg. In Study 3970 and the extension phase of Study 1839, the LSM difference from baseline in kg body weight was –4.92 (95% CI, –6.18 to –3.66; P < 0.0001) after 32 weeks of treatment and −4.57 (95% CI, –5.27 to –3.88; P < 0.0001) after 160 weeks, respectively, both in favour of liraglutide 3 mg.
Maintaining Run-In Weight Loss
The percentage of patients maintaining run-in weight loss after 56 weeks of treatment was a co-primary outcome in Study 1923, assessed after 56 weeks of treatment. In this study, only patients who lost 5% or more body weight during a 4-week to 12-week run-in period on a low-calorie diet were randomized to take part in the 56-week treatment period. To be considered as maintaining run-in weight loss, patients should have regained no more than 0.5% of weight lost during run-in at baseline. The proportion of patients who maintained run-in weight loss after 56 weeks of treatment was higher with liraglutide 3 mg than with placebo (82.1% versus 47.9%, respectively). The odds of maintaining run-in weight loss were significantly increased with liraglutide 3 mg than with placebo (OR = 4.82; 95% CI, 3.01 to 7.71; P < 0.0001).
Study 1923 also reported outcomes for patients who maintained more than 50% or more than 75% baseline weight loss after 56 weeks of treatment as secondary end points, though these end points did not account for multiplicity. For these outcomes, the LSM difference was 5.86 (95% CI, 3.12 to 10.98; P < 0.0001) in patients maintaining more than 50% baseline weight loss and 6.02 (95% CI, 3.65 to 9.92; P < 0.0001) in those maintaining more than 75% baseline weight loss, all in favour of liraglutide 3 mg (Table 26).
Table 23: Study 1839 — Change in Body Weight at Week 56 and Week 160 in Patients Without Diabetes and With Prediabetes, Full Analysis Seta
Outcome measure | 56-week main study phase | 104-week extension phase | ||
|---|---|---|---|---|
LIRA 3 mg | Placebo | LIRA 3 mg | Placebo | |
Change (%) in body wt.b, c | N = 2,437 | N = 1,225 | N = 1,505 | N = 749 |
Number of patients contributing to the analysis | 2,432 | 1,220 | 1,472 | 738 |
Change (%) from baseline, mean (SD) | –7.98 (6.67) | –2.62 (5.74) | –6.14 (7.34) | –1.89 (6.27) |
Change from baseline in body wt. (%), LSM | –7.99 | –2.60 | –6.17 | –1.84 |
Difference, LIRA 3 mg vs. placebo (95% CI) | –5.39 (–5.82 to –4.95) | –4.32 (–4.94 to –3.70) | ||
P value | < 0.0001 | < 0.0001e | ||
5% responders from baselineb, d | N = 2,432 | N = 1,225 | N = 1,472 | N = 738 |
Patients losing ≥ 5% in body wt., n (%) | 1,536 (63.2) | 331 (27.1) | 727 (49.6) | 174 (23.7) |
LSM, odds | 1.74 | 0.36 | 0.984 | 0.305 |
OR, LIRA 3 mg vs. placebo (95% CI) | 4.80 (4.12 to 5.60) | 3.22 (2.637 to 3.94) | ||
P value | < 0.0001 | < 0.0001e | ||
10% responders from baselineb, d | N = 2,432 | N = 1,220 | N = 1,472 | N = 734 |
Patients losing > 10% in body wt., n (%) | 805 (33.1) | 129 (10.6) | 364 (24.8) | 73 (9.9) |
LSM, odds | 0.49 | 0.11 | 0.322 | 0.104 |
OR, LIRA 3 mg vs. placebo (95% CI) | 4.34 (3.54 to 5.32) | 3.086 (2.350 to 4.052) | ||
P value | < 0.0001 | < 0.0001e | ||
Change in body wt. (kg)e | N = 2,432 | N = 1,220 | N = 1,475 | N = 738 |
Body wt. (kg) at baseline, mean (SD) | 106.2 (21.2) | 106.2 (21.7) | 107.5 (21.6) | 107.9 (21.8) |
Change from baseline, mean (SD) | –8.36 (7.29) | –2.83 (6.51) | –6.15 (8.08) | –2.03 (7.29) |
LSM | –8.37 | –2.81 | –6.54 | –1.97 |
Difference, LIRA 3 mg vs. placebo (95% CI) | –5.56 (–6.04 to –5.09) | –4.57 (–5.27 to –3.88) | ||
P value | < 0.0001e | < 0.0001e | ||
ANCOVA = analysis of covariance; CI = confidence interval; FAS = full analysis set; LIRA = liraglutide; LSM = least squares mean; LOCF = last observation carried forward; OR = odds ratio; SD = standard deviation; vs. = versus; wt. = weight.
aThe FAS included all randomized patients exposed to at least 1 dose of the trial product and with at least 1 post-baseline measurement of the pre-specified end points.
bAnalyses comparing liraglutide 3 mg with placebo for the co-primary end points (the change in body weight from baseline, the proportion of patients losing 5% or less baseline body weight, and the proportion of patients losing more than 10% baseline body weight) used a hierarchical approach to control for multiplicity.
cChange from baseline was analyzed using an ANCOVA model, and missing data were imputed using the LOCF method.
dThe proportion of patients losing at 5% or less of baseline body weight or more than 10% of baseline body weight was analyzed using logistic regression analysis. Missing data were imputed using the LOCF method.
eResults of secondary analyses were not controlled for multiplicity and should be interpreted with consideration for risk of type I error.
Sources: Clinical Study Reports for Study 183911 and the Study 1839 extension.15
Table 24: Study 1839 — Percentage Change in Body Weight (%) in Re-Randomized Treatment Period (56 Weeks to 68 Weeks) in Patients Without Prediabetes at Screening, Full Analysis Seta
Outcome measure | 12 weeks re-randomization (56 weeks to 68 weeks)b | ||
|---|---|---|---|
Change (%) in body weightc | LIRA/LIRA N = 351 | LIRA/placebo N = 350 | Placebo N = 304 |
Change from baseline at week 56, mean (SD) | –9.09 (6.91) | –9.33 (7.58) | –3.47 (7.18) |
Change from baseline at week 68, mean (SD) | –8.46 (7.25) | –6.75 (7.68) | –3.11 (7.52) |
Change from week 56 to week 68, mean (SD) | 0.69 (2.58) | 2.91 (3.01) | 0.28 (2.39) |
Change from week 56 to week 68, LSM | 0.71 | 2.88 | NR |
Difference, LIRA/LIRA vs. LIRA/placebo (95% CI) | –2.18 (–2.60 to –1.75) | NA | |
P value | < 0.0001d | ||
ANCOVA = analysis of covariance; CI = confidence interval; FAS = full analysis set; LOCF = last observation carried forward; LIRA = liraglutide; LSM = least squares mean; NR = not reported; SD = standard deviation; vs. = versus.
Note: Liraglutide/liraglutide comprised patients re-randomized from the liraglutide 3 mg group in the main phase of Study 1839 to the liraglutide 3 mg group during the 12-week re-randomization period. Liraglutide/placebo comprised patients re-randomized from the liraglutide 3 mg group in the main phase to the placebo group during the 12-week re-randomization period.
aThe FAS included all randomized patients exposed to at least 1 dose of the trial product and with at least 1 post-baseline measurement of the pre-specified end points.
bThe 12-week re-randomization period did not report outcomes for 5% or 10% responders.
cPercentage change from baseline was analyzed using an ANCOVA model, and missing data were imputed using the LOCF method.
dThe results were not controlled for multiplicity and should be interpreted with consideration for risk of type I error.
Source: Clinical Study Report for Study 1839.11
Table 25: Study 1922 — Change in Body Weight at Week 56 in Patients with Type 2 Diabetes, Full Analysis Seta
Outcome measureb | Study 1922 | |
|---|---|---|
Change (%) in body wt.b, c | LIRA 3 mg N = 423 | Placebo N = 212 |
Number of patients contributing to the analysis | 411 | 210 |
Change (%) from baseline, mean (SD) | –5.9 (5.5) | –2.0 (4.3) |
Change from baseline in body wt. (%), LSM | –5.93 | –1.96 |
Difference, LIRA 3 mg vs. placebo (95% CI) | –3.97 (–4.84 to –3.11) | |
P value | < 0.0001 | |
5% responders from baselineb, d | N = 411 | N = 210 |
Patients losing ≥ 5% in body wt., n (%) | 205 (49.9) | 29 (13.8) |
LSM, odds | 0.99 | 0.15 |
OR, LIRA 3 mg vs. placebo (95% CI) | 6.81 (4.34 to 10.68) | |
P value | < 0.0001 | |
10% responders from baselineb, d | N = 411 | N = 210 |
Patients losing > 10% in body wt., n (%) | 96 (23.4) | 9 (4.3) |
LSM, odds | 0.28 | 0.04 |
OR, LIRA 3 mg vs. placebo (95% CI) | 7.10 (3.48 to 14.48) | |
P value | < 0.0001 | |
Change in body weight (kg) e | N = 411 | N = 210 |
Body wt.(kg) at baseline, mean (SD) | 105.7 (21.9) | 106.5 (21.3) |
Change from baseline, mean (SD) | –8.36 (7.29) | –2.83 (6.51) |
LSM | –8.37 | –2.81 |
Difference, LIRA 3 mg vs. placebo (95% CI) | –5.56 (–6.04 to –5.09) | |
P value | < 0.0001e | |
ANCOVA = analysis of covariance; CI = confidence interval; FAS = full analysis set; LIRA = liraglutide; LOCF = last observation carried forward; LSM = least squares mean; OR = odds ratio; SD = standard deviation; vs. = versus; wt. = weight.
aThe FAS included all randomized patients exposed to at least 1 dose of the trial product and with at least 1 post-baseline measurement of the pre-specified end points.
bAnalyses comparing liraglutide 3 mg with placebo for the co-primary end points (percentage change in body weight from baseline, proportion of patients losing 5% or more of baseline body weight, and proportion of patients losing more than 10% of baseline body weight) used a hierarchical approach to control for multiplicity.
cChange from baseline was analyzed using an ANCOVA model, and missing data were imputed using the LOCF method.
dThe proportion of patients losing at 5% or more of baseline body weight or more than 10% of baseline body weight were analyzed using logistic regression analysis. Missing data were imputed using the LOCF method.
eResults of secondary analyses were not controlled for multiplicity and should be interpreted with consideration for risk of type I error.
Source: Clinical Study Report for Study 1922.12
Table 26: Study 1923 — Change in Body Weight at Week 56 in Patients Without Diabetes After Initial Weight Loss, Full Analysis Seta
Outcome measure | Study 1923 | |
|---|---|---|
Change (%) in body wt.b, c | LIRA 3 mg N = 194 | Placebo N = 188 |
Number of patients contributing to the analysis | 194 | 188 |
Change (%) from baseline, mean (SD) | –6.2 (7.3) | –0.2 (7.0) |
Change from baseline in body wt. (%), LSM | –6.11 | –0.05 |
Difference, LIRA 3 mg vs. placebo (95% CI) | –6.06 (–7.50 to –4.62) | |
P value | < 0.0001 | |
5% responders from baselineb, d | N = 207 | N = 206 |
Patients losing ≥ 5% in body wt., n (%) | 96 (46.4) | 43 (20.9) |
LSM, odds | 0.96 | 0.25 |
OR, LIRA 3 mg vs. placebo (95% CI) | 3.86 (2.44 to 6.09) | |
P value | < 0.0001 | |
10% responders from baselinee | N = 207 | N = 206 |
Patients losing > 10% in body wt., n (%) | 54 (26.1) | 13 (6.3) |
LSM, odds | 0.31 | 0.06 |
OR, LIRA 3 mg vs. placebo (95% CI) | 5.30 (2.79 to 10.08) | |
P value | < 0.0001e | |
Change in body wt. (kg)e | N = 207 | N = 206 |
Body wt. (kg) at baseline, mean (SD) | 100.7 (20.8) | 98.9 (21.2) |
Change from baseline at week 56, mean (SD) | –6.0 (7.3) | –0.1 (6.9) |
LSM | –5.70 | 0.16 |
Difference, LIRA 3 mg vs. placebo (95% CI) | –5.86 (–7.30 to –4.43) | |
P value | < 0.0001e | |
Maintaining run-in weight lossb, d | N = 207 | N = 206 |
Patients maintaining run-in weight loss, n (%) | 170 (82.1) | 69 (47.9) |
LSM, odds | 4.68 | 0.97 |
OR, LIRA 3 mg vs. placebo (95% CI) | 4.82 (3.01 to 7.71) | |
P value | < 0.0001 | |
Patients maintaining > 50% baseline weight losse | N = 207 | N = 206 |
Patients with > 50% weight loss maintained since run-in | 193 (93.2) | 146 (70.9) |
LSM | 11.88 | 2.03 |
Difference, LIRA 3 mg vs. placebo (95% CI) | 5.86 (3.12 to 10.98) | |
P value | < 0.0001e | |
Patients maintaining > 75% baseline weight losse | ||
Patients with > 75% weight loss maintained since run-in | 181 (87.4) | 112 (54.4) |
LSM | 7.09 | 1.18 |
OR, LIRA 3 mg vs. placebo (95% CI) | 6.02 (3.65 to 9.92) | |
P value | < 0.0001e | |
ANCOVA = analysis of covariance; CI = confidence interval; FAS = full analysis set; LIRA = liraglutide; LOCF = last observation carried forward; LSM = least squares mean; OR = odds ratio; SD = standard deviation; vs. = versus; wt. = weight.
aThe FAS included all randomized patients exposed to at least 1 dose of the trial product and with at least 1 post-baseline measurement of the pre-specified end points.
bAnalyses comparing liraglutide 3 mg with placebo for the co-primary end points (the percentage change in body weight from baseline, the percentage of patients maintaining run-in weight loss, and the proportion of patients losing ≥ 5%) used a hierarchical approach to control for multiplicity.
cChange from baseline was analyzed using an ANCOVA model, and missing data were imputed using the LOCF method.
dThe proportion of patients losing at least 5% of baseline body weight and the percentage of patients maintaining run-in weight loss (i.e., gaining ≤ 0.5% after randomization) were analyzed using logistic regression analysis. Missing data were imputed using the LOCF method.
dAnalyses comparing liraglutide 3 mg with placebo for the primary end points used a hierarchical approach to control for multiplicity.
eThe results of secondary analyses were not controlled for multiplicity and should be interpreted with consideration for risk of type I error.
Source: Clinical Study Report for Study 1923.13
Table 27: Study 3970 — Change in Body Weight in Patients With Obstructive Sleep Apnea, Full Analysis Seta
Outcome measure | Study 3970 | |
|---|---|---|
Change (%) in body wt.b | LIRA 3 mg N = 180 | Placebo N = 179 |
Number of patients contributing to the analysis | 175 | 178 |
Change (%) from baseline at week 32, mean (SD) | –5.72 (5.59) | –1.59 (4.46) |
Change from baseline in body wt. (%), LSM | –5.73 | –1.58 |
Difference, LIRA 3 mg vs. placebo (95% CI) | –4.15 (–5.21 to –3.09) | |
P value | < 0.0001b | |
5% responders from baselinec | ||
Patients losing ≥ 5% in body wt., n (%) | 81 (46.3) | 33 (18.5) |
LSM, odds | 0.87 | 0.22 |
OR, LIRA 3 mg vs. placebo (95% CI) | 3.92 (2.41 to 6.38) | |
P value | < 0.0001c | |
10% responders from baselinec | ||
Patients losing > 10% in body wt., n (%) | 41 (23.4) | 3 (1.7) |
LSM, odds | 0.29 | 0.02 |
OR, LIRA 3 mg vs. placebo (95% CI) | 18.96 (5.69 to 63.14) | |
P value | < 0.0001c | |
Change in body wt. (kg)b | ||
Body wt. (kg) at baseline, mean (SD) | 116.74 (23.15) | 118.70 (25.43) |
Change from baseline, mean (SD) | –6.76 | –1.84 |
LSM | –4.92 (–6.18 to –3.66) | |
Difference, LIRA 3 mg vs. placebo (95% CI) | < 0.0001b | |
P value | ||
ANCOVA = analysis of covariance; CI = confidence interval; FAS = full analysis set; LIRA = liraglutide; LOCF = last observation carried forward; LSM = least squares mean; OR = odds ratio; SD = standard deviation; vs. = versus; wt. = weight.
aThe FAS included all randomized patients exposed to at least 1 dose of the trial product and with at least 1 post-baseline measurement of the pre-specified end points.
bAnalyses comparing liraglutide 3 mg with placebo for the secondary end points (the percentage change in body weight from baseline and the change in body weight in kilograms from baseline) used the ANCOVA model, and missing data were imputed using the LOCF method. The results were not controlled for multiplicity.
cAnalyses comparing liraglutide 3 mg with placebo for the secondary end points (the proportion of patients losing at 5% or more of baseline body weight and the proportion of patients losing more than 10% of baseline body weight) used a logistic regression model, imputing missing data by the LOCF method. The results were not controlled for multiplicity.
Source: Clinical Study Report for Study 3970.14
Change From Baseline in Body Mass Index
Change from baseline in BMI was a secondary end point in all the included studies (Table 28, Table 29, Table 30, and Table 31), and was not controlled for multiplicity. For this outcome, the LSM difference after 56 weeks of treatment was –2.04 (95% CI, –2.10 to –1.87; P < 0.0001) for the main phase of Study 1839, –1.50 (95% CI, –1.83 to –1.18; P < 0.0001) for Study 1922, and –2.05 (95% CI, –2.53 to –1.57; P < 0.0001) for Study 1923, all in favour of liraglutide 3 mg. In Study 3970 and the extension phase of Study 1839, the LSM difference from baseline in BMI was –1.59 (95% CI, –2.00 to –1.17; P < 0.0001) after 32 weeks of treatment and –1.69 (95% CI, –1.93 to –1.44; P < 0.0001) after 160 weeks of treatment, respectively, all in favour of liraglutide 3 mg.
Table 28: Study 1839 — Change From Baseline in Body Mass Index in Patients Without Diabetes and With Prediabetes, Full Analysis Seta
Outcome measure | 56-week main study phase | 104-week extension phase (week 160) | ||
|---|---|---|---|---|
Change in BMI, mean (SD)b | LIRA 3 mg N = 2,437 | Placebo N = 1,225 | LIRA 3 mg N = 1,505 | Placebo N = 749 |
Number of patients contributing to the analysis | 2,437 | 1,225 | 1,472 | 738 |
BMI at baseline, mean (SD) | 38.30 (6.41) | 38.36 (6.31) | 38.79 (6.43) | 38.99 (6.32) |
BMI at EOT, mean (SD) | 35.27 (6.56) | 37.35 (6.46) | 36.42 (6.74) | 38.26 (6.67) |
Change from baseline in BMI at EOT, mean (SD) | –3.03 (2.26) | –1.01 (2.31) | –2.37 (2.90) | –0.73 (2.58) |
Change from baseline in BMI, LSM | –3.04 | –1.00 | –2.38 | –0.70 |
Difference, LIRA 3 mg vs. placebo (95% CI) | –2.04 (–2.1 to –1.87) | –1.69 (–1.93 to –1.44) | ||
P value | < 0.0001b | < 0.0001b | ||
ANCOVA = analysis of covariance; BMI = body mass index; CI = confidence interval; EOT = end of treatment; FAS = full analysis set; LIRA = liraglutide; LOCF = last observation carried forward; LSM = least squares mean; SD = standard deviation; vs. = versus.
aThe FAS included all randomized patients exposed to at least 1 dose of the trial product and with at least 1 post-baseline measurement of the pre-specified end points.
bAnalyses comparing liraglutide 3 mg with placebo for BMI, a secondary end point, used the ANCOVA model, and missing data were imputed using the LOCF method. The results were not controlled for multiplicity.
Sources: Clinical Study Reports for Study 183911 and the Study 1839 extension.15
Table 29: Study 1922 — Change From Baseline in Body Mass Index in Patients With Type 2 Diabetes, Full Analysis Seta
Outcome measure | Study 1922 | |
|---|---|---|
Change in BMI b | LIRA 3 mg N = 423 | Placebo N = 212 |
Number of patients contributing to the analysis | 411 | 210 |
BMI at baseline, mean (SD) | 37.1 (6.5) | 37.4 (7.1) |
BMI at week 56, mean (SD) | 34.9 (6.3) | 36.6 (7.1) |
BMI change from baseline at week 56, mean (SD) | –2.2 (2.1) | –0.8 (1.7) |
Change from baseline in BMI, LSM | –2.24 | –0.73 |
Difference, LIRA 3 mg vs. placebo (95% CI) | –1.50 (–1.83 to –1.18) | |
P value | < 0.0001b | |
ANCOVA = analysis of covariance; BMI = body mass index; CI = confidence interval; FAS = full analysis set; LIRA = liraglutide; LOCF = last observation carried forward; LSM = least squares mean; SD = standard deviation; vs. = versus.
aThe FAS included all randomized patients exposed to at least 1 dose of the trial product and with at least 1 post-baseline measurement of the pre-specified end points.
bAnalyses comparing liraglutide 3 mg with placebo for BMI, a secondary end point, used the ANCOVA model, and missing data were imputed using the LOCF method. The results were not controlled for multiplicity.
Source: Clinical Study Report for Study 1922.12
Table 30: Study 1923 — Change From Baseline in Body Mass Index in Patients Without Diabetes After Initial Weight Loss, Full Analysis Seta
Outcome measure | Study 1923 | |
|---|---|---|
Change in BMI b | LIRA 3 mg N = 207 | Placebo N = 206 |
Number of patients contributing to the analysis | 207 | 206 |
BMI at baseline, mean (SD) | 36.0 (5.9) | 35.2 (5.9) |
BMI at week 56, mean (SD) | NR | NR |
BMI change from baseline at week 56, mean (SD) | –2.1 (2.6) | –0.0 (2.3) |
Change from baseline in BMI, LSM | –1.9 | 0.15 |
Difference, LIRA 3 mg vs. placebo (95% CI) | –2.05 (–2.53 to –1.57) | |
P value | < 0.0001b | |
ANCOVA = analysis of covariance; BMI = body mass index; CI = confidence interval; FAS = full analysis set; LIRA = liraglutide; LOCF = last observation carried forward; LSM = least squares mean; NR = not reported; SD = standard deviation; vs. = versus.
aThe FAS included all randomized patients exposed to at least 1 dose of the trial product and with at least 1 post-baseline measurement of the pre-specified end points.
bAnalyses comparing liraglutide 3 mg with placebo for BMI, a secondary end point, used the ANCOVA model, and missing data were imputed using the LOCF method. The results were not controlled for multiplicity.
Source: Clinical Study Report for Study 1923.13
Table 31: Change From Baseline in Body Mass Index in Patients With Obstructive Sleep Apnea, Full Analysis Set
Outcome measure | Study 3970 | |
|---|---|---|
Change in BMIb | LIRA 3 mg N = 180 | Placebo N = 179 |
Number of patients contributing to the analysis | 180 | 179 |
BMI at baseline, mean (SD) | 38.88 (6.39) | 39.36 (7.36) |
BMI at week 32, mean (SD) | 36.71 (6.57) | 38.73 (7.47) |
BMI change from baseline at week 32, mean (SD) | –2.20 (2.16) | –0.62 (1.77) |
Change from baseline in BMI, LSM | –2.21 | –0.62 |
Difference, LIRA 3 mg vs. placebo (95% CI) | –1.59 (–2.00 to –1.17) | |
P value | < 0.0001b | |
ANCOVA = analysis of covariance; BMI = body mass index; CI = confidence interval; FAS = full analysis set; LIRA = liraglutide; LOCF = last observation carried forward; LSM = least squares mean; SD = standard deviation; vs. = versus.
aThe FAS included all randomized patients exposed to at least 1 dose of the trial product and with at least 1 post-baseline measurement of the pre-specified end points.
bAnalyses comparing liraglutide 3 mg with placebo for BMI, a secondary end point, used the ANCOVA model, and missing data were imputed using the LOCF method. The results were not controlled for multiplicity.
Source: Clinical Study Report for Study 3970.14
Health-Related Quality of Life
All the included studies evaluated HRQoL outcomes as secondary end points. Scales used to assess HRQoL were the IWQOL-Lite, SF-36, TRIM-Weight, and DTSQ, and none of these outcomes was controlled for multiplicity.
Impact of Weight on Quality of Life-Lite
The IWQOL-Lite scale was 1 of the HRQoL assessment tools in Study 1839 and Study 1922 (Table 32 and Table 33). The LSM difference in the IWQOL-Lite total score after 56 weeks of treatment was 3.13 (95% CI, 2.24 to 4.01; P < 0.0001) for the main phase of Study 1839 and 2.75 (95% CI, 0.57 to 4.93; P = 0.0136) for Study 1922, suggesting positive treatment effects, all in favour of liraglutide 3 mg. Consistent results were reported for each of the 5 domains. Consistent results were observed in the extension phase of Study 1839, where the LSM difference in the IWQOL-Lite total score after 160 weeks of treatment was 3.35 (95% CI, 2.04 to 4.66; P < 0.0001) in favour of liraglutide 3 mg.
Table 32: Study 1839 — Change From Baseline in IWQOL-Lite Scores in Patients Without Diabetes and With Prediabetes, Full Analysis Seta
Outcome measure | 56-week main study phase | 104-week extension phase (week 160) | ||
|---|---|---|---|---|
IWQOL-Lite scoresb | LIRA 3 mg N = 2,437 | Placebo N = 1,225 | LIRA 3 mg N = 1,505 | Placebo N = 749 |
Total score at baseline, mean (SD) | 73.13 (18.01) | 72.49 (17.86) | 72.13 (18.54) | 70.71 (18.85) |
Total score at EOT, mean (SD) | 83.72 (15.24) | 80.47 (16.74) | 83.03 (16.40) | 78.70 (18.66) |
Change in total score, mean (SD) | 10.63 (13.25) | 7.65 (12.77) | 10.96 (14.23) | 8.11 (14.65) |
LSM | 10.66 | 7.54 | 72.13 | 70.70 |
Estimated difference, LIRA 3 mg vs. placebo (95% CI) | 3.13 (2.24 to 4.01) | 3.35 (2.04 to 4.66) | ||
P value | < 0.0001b | < 0.0001b | ||
ANCOVA = analysis of covariance; CI = confidence interval; EOT = end of treatment; FAS = full analysis set; IWQOL-Lite = Impact of Weight on Quality of Life-Lite; LIRA = liraglutide; LOCF = last observation carried forward; LSM = least squares mean; SD = standard deviation; vs. = versus.
aThe FAS included all randomized patients exposed to at least 1 dose of the trial product and with at least 1 post-baseline measurement of the pre-specified end points.
bAnalyses comparing liraglutide 3 mg with placebo for IWQOL-Lite, a secondary end point, used the ANCOVA model, and missing data were imputed using the LOCF method. The results were not controlled for multiplicity.
Sources: Clinical Study Reports for Study 183911 and the Study 1839 extension.15
Table 33: Study 1922 — Change From Baseline in IWQOL-Lite Score in Patients With Type 2 Diabetes, Full Analysis Seta
Outcome measure | Study 1922 | |
|---|---|---|
IWQOL-Lite scoresb | LIRA 3 mg N = 423 | Placebo N = 212 |
Total score at baseline, mean (SD) | 72.6 (20.4) | 75.7 (18.0) |
Total score at EOT, mean (SD) | 84.6 (15.6) | 83.5 (16.1) |
Change in total score, mean (SD) | 11.68 (14.67) | 7.58 (12.57) |
LSM | 11.15 | 8.41 |
Estimated difference, LIRA 3 mg vs. placebo (95% CI) | 2.75 (0.57 to 4.93) | |
P value | 0.013b | |
ANCOVA = analysis of covariance; CI = confidence interval; EOT = end of treatment; FAS = full analysis set; IWQOL-Lite = Impact of Weight on Quality of Life-Lite; LIRA = liraglutide; LOCF = last observation carried forward; LSM = least squares mean; SD = standard deviation; vs. = versus.
aThe FAS included all randomized patients exposed to at least 1 dose of the trial product and with at least 1 post-baseline measurement of the pre-specified end points.
bAnalyses comparing liraglutide 3 mg with placebo for IWQOL-Lite, a secondary end point, used the ANCOVA model, and missing data were imputed using the LOCF method. The results were not controlled for multiplicity.
Source: Clinical Study Report for Study 1922.12
Short Form (36) Health Survey
The SF-36 questionnaire was used to assess HRQoL in Study 1839 and Study 3970 (Table 34 and Table 35). For overall physical health, the LSM difference in the SF-36 score was 1.73 (95% CI, 1.22 to 2.24; P < 0.0001) for the main phase of Study 1839 after 56 weeks of treatment and 0.86 (95% CI, –0.49 to 2.20; P = 0.2113) for Study 3970 after 32 weeks of treatment. The corresponding LSM difference in overall mental health scores were 0.90 (95% CI, 0.30 to 1.50; P = 0.0034) and 0.59 (95% CI, –0.86 to 2.04; P = 0.4252) for Study 1839 and Study 3970, respectively.
In the extension phase of Study 1839, the LSM difference suggests that liraglutide 3 mg maintained higher positive treatment effects than placebo in the overall physical health score (estimated difference = 0.87; 95% CI, 0.17 to 1.58; P = 0.0034) but not in the overall mental health score (estimated difference = 0.77; 95% CI, −0.09 to 1.68; P = 0.778) after 160 weeks of treatment (Table 34).
Higher mean changes were also reported with liraglutide 3 mg than with placebo for all 8 SF-36 domains in both studies.
Table 34: Study 1839 — Change From Baseline in SF-36 Score in Patients Without Diabetes and With Prediabetes, Full Analysis Seta
Outcome measure | 56-week main study phase | 104-week extension phase (week 160) | ||
|---|---|---|---|---|
SF-36 scores | LIRA 3 mg N = 2,437 | Placebo N = 1,225 | LIRA 3 mg N = 1,505 | Placebo N = 749 |
SF-36 overall scores, mean (SD) | ||||
Overall physical health score at baseline, mean (SD) | 48.25 (8.35) | 47.67 (8.70) | 47.28 (8.66) | 46.57 (8.96) |
Overall physical health score at EOT, mean (SD) | 51.82 (7.30) | 49.68 (8.54) | 50.32 (7.88) | 48.76 (8.80) |
Change in physical health score, mean (SD) | 3.55 (6.81) | 2.15 (7.69) | 3.10 (7.33) | 2.61 (7.58) |
LSM | 3.66 | 1.93 | 3.22 | 2.35 |
Estimated difference, LIRA 3 mg vs. placebo (95% CI) | 1.73 (1.22 to 2.24) | 0.87 (0.17 to 1.58) | ||
P value | < 0.0001b | 0.0156b | ||
Overall mental score at screening, mean (SD) | 53.84 (8.08) | 53.94 (7.93) | 53.90 (8.09) | 54.00 (8.00) |
Overall mental score at EOT, mean (SD) | 54.06 (7.65) | 53.36 (8.56) | 53.48 (8.78) | 52.76 (8.82) |
Change in overall mental score, mean (SD) | 0.19 (8.06) | −0.91 (9.05) | −0.46 (8.69) | −1.40 (9.24) |
LSM | 0.14 | −0.76 | −0.51 | −1.28 |
Estimated difference, LIRA 3 mg vs. placebo (95% CI) | 0.90 (0.30 to 1.50) | 0.77 (−0.09 to 1.68) | ||
P value | 0.0034b | 0.778b | ||
ANCOVA = analysis of covariance; CI = confidence interval; EOT = end of treatment; FAS = full analysis set; LIRA = liraglutide; LOCF = last observation carried forward; LSM = least squares mean; SD = standard deviation; SF-36 = Short Form (36) Health Survey; vs. = versus.
aThe FAS included all randomized patients exposed to at least 1 dose of the trial product and with at least 1 post-baseline measurement of the pre-specified end points.
bAnalyses comparing liraglutide 3 mg with placebo for SF-36, a secondary end point, used the ANCOVA model, and missing data were imputed using the LOCF method. The results were not controlled for multiplicity.
Sources: Clinical Study Reports for Study 183911 and the Study 1839 extension.15
Table 35: Study 3970 — Change From Baseline in SF-36 Score in Patients With Obstructive Sleep Apnea, Full Analysis Seta
Outcome measure | Study 3970 | |
|---|---|---|
SF-36 overall scoresb | LIRA 3 mg N = 180 | Placebo N = 179 |
Overall physical health score at baseline, mean (SD) | 46.52 (9.23) | 46.95 (8.65) |
Overall physical health score at EOT, mean (SD) | 49.38 (9.20) | 48.88 (7.97) |
Change in physical health score, mean (SD) | 2.97 (7.73) | 1.85 (6.42) |
LSM | 2.84 | 1.99 |
Estimated difference, LIRA 3 mg vs. placebo (95% CI) | 0.86 (−0.49 to 2.20) | |
P value | 0.2113b | |
Overall mental score at screening, mean (SD) | 53.04 (8.08) | 52.81 (7.91) |
Overall mental score at EOT, mean (SD) | 54.40 (8.32) | 53.61 (7.75) |
Change in overall mental score, mean (SD) | 1.41 (8.16) | 0.91 (7.48) |
LSM | 1.47 | 0.88 |
Estimated difference, LIRA 3 mg vs. placebo (95% CI) | 0.59 (−0.86 to 2.04) | |
P value | 0.4252b | |
ANCOVA = analysis of covariance; CI = confidence interval; EOT = end of treatment; FAS = full analysis set; LIRA = liraglutide; LOCF = last observation carried forward; LSM = least squares mean; SD = standard deviation; SF-36 = Short Form (36) Health Survey; vs. = versus.
aThe FAS included all randomized patients exposed to at least 1 dose of the trial product and with at least 1 post-baseline measurement of the pre-specified end points.
bAnalyses comparing liraglutide 3 mg with placebo for SF-36, a secondary end point, used the ANCOVA model, and missing data were imputed using the LOCF method. The results were not controlled for multiplicity.
Source: Clinical Study Report for Study 3970.14
Treatment Related Impact Measure of Weight
The TRIM-Weight scale was used to measure HRQoL in Study 1839. The mean total score after 56 weeks of treatment was 83.09 (SD = 10.70) in the liraglutide 3 mg group and 81.03 (SD = 9.35) in the placebo group, with a LSM difference in the TRIM-Weight scale score of 2.14 (95% CI, 1.28 to 3.00; P < 0.0001). In the extension phase of the study, the mean total score after 160 weeks of treatment was 81.55 (SD = 11.21) in the liraglutide 3 mg group and 80.57 (SD = 9.89) in the placebo group, with an LSM difference of 0.95 (95% CI, –0.23 to 2.13; P = 0.1132) (Table 36).
Table 36: Study 1839 — Change From Baseline in TRIM-Weight Score in Patients Without Diabetes and With Prediabetes, Full Analysis Seta
Outcome measure | 56-week main study phase | 104-week extension phase (week 160) | ||
|---|---|---|---|---|
TRIM-Weight scoresb | LIRA 3 mg N = 2,437 | Placebo N = 1,225 | LIRA 3 mg N = 1,505 | Placebo N = 749 |
N | 1,682 | 800 | 985 | 469 |
Total score at EOT, mean (SD) | 83.09 (10.70) | 81.03 (9.35) | 81.55 (11.21) | 80.57 (9.89) |
LSM | 83.11 | 80.97 | 81.55 | 80.60 |
Treatment difference, LIRA 3 mg vs. placebo (95% CI) | 2.14 (1.28 to 3.00) | 0.95 (–0.23 to 2.13) | ||
P value | < 0.0001b | 0.1132b | ||
ANCOVA = analysis of covariance; CI = confidence interval; EOT = end of treatment; FAS = full analysis set; LIRA = liraglutide; LOCF = last observation carried forward; LSM = least squares mean; SD = standard deviation; TRIM-Weight = Treatment Related Impact Measure of Weight; vs. = versus.
aThe FAS included all randomized patients exposed to at least 1 dose of the trial product and with at least 1 post-baseline measurement of the pre-specified end points.
bAnalyses comparing liraglutide 3 mg with placebo for a TRIM-Weight score, a secondary end point, used the ANCOVA model, and missing data were imputed using the LOCF method. The results were not controlled for multiplicity.
Sources: Clinical Study Reports for Study 183911 and the Study 1839 extension.15
Diabetes Treatment Satisfaction Questionnaire
The DTSQ tool was used to assess HRQoL in Study 1922. The mean change in total score after 56 weeks of treatment was 31.9 (SD = 5.2) in the liraglutide 3 mg group and 30.5 (SD = 6.7) in the placebo group. The LSM difference in DTSQ score was 1.44 (95% CI, 1.28 to 3.00; P = 0.0066) (Table 37).
Table 37: Study 1922 — Change From Baseline in DTSQ in Patients With Type 2 Diabetes, Full Analysis Seta
Outcome measure | Study 1922 | |
|---|---|---|
DTSQ scoresb | LIRA 3 mg N = 423 | Placebo N = 212 |
DTSQ | ||
Total score at baseline, mean (SD) | 27.6 (6.7) | 27.9 (6.7) |
Total score at week 56, mean (SD) | 31.9 (5.2) | 30.5 (6.7) |
Change in total score, mean (SD) | 4.15 (7.61) | 2.32 (7.03) |
LSM | 4.08 | 2.63 |
Estimated difference, LIRA 3 mg vs. placebo (95% CI) | 1.44 (0.40 to 2.48) | |
P value | 0.0066b | |
ANCOVA = analysis of covariance; CI = confidence interval; DTSQ = Diabetes Treatment Satisfaction Questionnaire; FAS = full analysis set; LIRA = liraglutide; LOCF = last observation carried forward; LSM = least squares mean; SD = standard deviation; vs. = versus.
aThe FAS included all randomized patients exposed to at least 1 dose of the trial product and with at least 1 post-baseline measurement of the pre-specified end points.
bAnalyses comparing liraglutide 3 mg with placebo for a DTSQ score, a secondary end point, used the ANCOVA model, and missing data were imputed using the LOCF method. The results were not controlled for multiplicity.
Source: Clinical Study Report for Study 1922.12
Development of T2DM and Time of Onset of T2DM
Both the main phase and extension phase of Study 1839 reported on patients who developed T2DM (Table 38). This outcome was a secondary end point for the main phase of the study and was reported without control for multiplicity. However, in the extension phase of the study, the outcome was a primary end point controlled for multiplicity. In the main phase, 0.2% of patients in the liraglutide 3 mg group and 1.1% of patients in the placebo group developed T2DM. The estimated OR was 0.12 (95% CI, 0.04 to 0.39; P = 0.0003) in favour of liraglutide 3 mg, but this outcome was not controlled for multiplicity at this time point. Logistic regression analysis showed that the annualized T2DM incidence rate (i.e., the number of new cases of T2DM per 100 patient-years of exposure) was 0.18 with liraglutide 3 mg and 1.31 with placebo.
Time of onset of T2DM was the primary end point in the extension phase, which involved only patients with prediabetes at screening. At week 160, 26 patients (1.8%) in the liraglutide 3 mg group compared with 46 patients (6.2%) in the placebo group progressed to T2DM. A Weibull analysis showed an annualized T2DM incidence rate of 0, and 3.2 events per 100 years of exposure for the liraglutide 3 mg and placebo groups, respectively, with a time-to-event ratio estimate of 2.681 (95% CI, 1.856 to 3.872; P < 0.0001).
Table 38: Study 1839 — Development of T2DM and Time of Onset of T2DM at Week 56 and Week 160 in Patients Without Diabetes and With Prediabetes, Full Analysis Seta
Outcome measure | 56-week main study phasec | 104-week extension phase (week 160)b | ||
|---|---|---|---|---|
Development of T2DM/time to onset of T2DMb, c | LIRA 3 mg N = 2,437 | Placebo N = 1,225 | LIRA 3 mg N = 1,490 | Placebo N = 742 |
Patients developing T2DM, n (%) | 4 (0.2) | 14 (1.1) | 26 (1.8) | 46 (6.2) |
Annualized T2DM incidence rate | 0.18 | 1.31 | 0.8 | 3.2 |
OR, LIRA 3 mg vs. placebo (95% CI) (logistic regression) | 0.12 (0.04 to 0.39) | NR | ||
P value | 0.0003c | NR | ||
Treatment estimate (Weibull analysis), LIRA 3 mg vs. placebo (95% CI) | NR | 2.681 (1.856 to 3.872) | ||
Hazard ratio, LIRA 3 mg vs. placebo | NR | 0.207 | ||
P value | NR | < 0.0001b | ||
CI = confidence interval; FAS = full analysis set; LIRA = liraglutide; LOCF = last observation carried forward; NR = not reported; OR = odds ratio; T2DM = type 2 diabetes mellitus; vs. = versus.
aThe FAS included all randomized patients exposed to at least 1 dose of the trial product and with at least 1 post-baseline measurement of the pre-specified end points.
bTime to new onset of T2DM was a co-primary outcome for the extension phase of Study 1839. Analyses comparing liraglutide 3 mg with placebo for time to onset to T2DM at week 160 used a hierarchical approach and missing data were imputed using the LOCF method. The analysis used the Weibull model and controlled for multiplicity.
cNew onset of T2DM was a secondary outcome in the main phase of Study 1839. Analyses comparing liraglutide 3 mg with placebo for onset to T2DM at week 56 was based on logistic regression, with missing data imputed by the LOCF method. The results were not controlled for multiplicity.
Sources: Clinical Study Reports for Study 183911 and the Study 1839 extension.15
Glycemic Control
Change in hemoglobin A1C and FPG from baseline were secondary end points in all the included studies (Table 39, Table 40, Table 41, and Table 42) and were not controlled for multiplicity. After 56 weeks of treatment, the LSM difference in mean change in hemoglobin A1C was –0.23 (95% CI, –0.25 to –0.21; P < 0.0001) for the main phase of Study 1839, –0.93 (95% CI, –1.08 to –0.78; P < 0.0001) for Study 1922, –0.27 (95% CI, –0.33 to –0.21; P < 0.0001) for Study 1923, and –0.19 (95% CI, –0.25 to –0.12; P < 0.0001) for Study 3970, all in favour of liraglutide 3 mg. In the extension phase of Study 1839, the LSM difference in mean change in hemoglobin A1C from baseline in patients with prediabetes at screening was –0.21 (95% CI, –0.24 to –0.18; P < 0.0001) after 160 weeks of treatment, in favour of liraglutide 3 mg.
After 56 weeks of treatment, the LSM difference in mean change in FPG was –0.39 (95% CI, –0.42 to –0.35; P < 0.0001) for the main phase of Study 1839, –1.77 (95% CI, –2.11 to –1.42; P < 0.0001) for Study 1922, –0.38 (95% CI, –0.50 to –0.26; P < 0.0001) for Study 1923, and –0.30 (95% CI, –0.44 to –0.16; P < 0.0001) for Study 3970, all in favour of liraglutide 3 mg. In the extension phase of Study 1839, the LSM difference in mean change in FPG from baseline in patients with prediabetes at screening was –0.41 (95% CI, –0.46 to –0.36; P < 0.0001) after 160 weeks of treatment, in favour of liraglutide 3 mg.
Table 39: Study 1839 — Glycemic Control in Patients Without Diabetes and With Prediabetes, Full Analysis Seta
Outcome measure | 56-week main study phase | 104-week extension phase (week 160)a | ||
|---|---|---|---|---|
Glycemic control parameters | LIRA 3 mg N = 2,437 | Placebo N = 1,225 | LIRA 3 mg N = 1,490 | Placebo N = 742 |
Change from baseline in hemoglobin A1C (% point),b mean (SD) | –0.30 (0.28) | –0.06 (0.30) | –0.35 (0.32) | –0.14 (0.32) |
LSM | –0.29 | –0.07 | –0.35 | –0.14 |
Difference, LIRA 3 mg vs. placebo (95% CI) | −0.23 (–0.25 to –0.21) | –0.21 (–0.24 to –0.18) | ||
P value | < 0.0001 | < 0.0001 | ||
Change from baseline in FPG (mmol/L),b mean (SD) | –0.39 (0.60) | 0.00 (0.58) | –0.37 (0.68) | 0.05 (0.62) |
LSM | −0.39 | −0.01 | −0.37 | 0.04 |
Difference, LIRA 3 mg vs. placebo (95% CI) | –0.38 (–0.42 to –0.35) | –0.41 (–0.46 to –0.36) | ||
P value | < 0.0001 | < 0.0001 | ||
ANCOVA = analysis of covariance; CI = confidence interval; FAS = full analysis set; FPG = fasting plasma glucose; LIRA = liraglutide; LOCF = last observation carried forward; LSM = least squares mean; SD = standard deviation; vs. = versus.
aThe FAS included all randomized patients exposed to at least 1 dose of the trial product and with at least 1 post-baseline measurement of the pre-specified end points.
bHemoglobin A1C and FPG were secondary outcomes. Comparisons of liraglutide 3 mg with placebo about changes in hemoglobin A1C and FPG used ANCOVA, with missing data imputed by the LOCF method. The results were not controlled for multiplicity.
Sources: Clinical Study Reports for Study 183911 and the Study 1839 extension.15
Table 40: Study 1922 — Change From Baseline in Glycemic Control in Patients With Type 2 Diabetes, Full Analysis Seta
Outcome measure | Study 1922 | |
|---|---|---|
Glycemic control | LIRA 3 mg N = 423 | Placebo N = 212 |
Hemoglobin A1Cb | ||
Hemoglobin A1C (% point) at baseline, mean (SD) | 7.9 (0.8) | 7.9 (0.8) |
Hemoglobin A1C (% point) at week 56, mean (SD) | 6.6 (1.0) | 7.6 (1.0) |
Change from baseline in hemoglobin A1C (% point), mean (SD) | –1.3 (0.9) | –0.3 (0.9) |
LSM | –1.32 | –0.38 |
Difference, LIRA 3 mg vs. placebo (95% CI) | –0.93 (–1.08 to –0.78) | |
P value | < 0.0001b | |
FPGb | ||
FPG (mmol/L) at baseline, mean (SD) | 8.8 (1.8) | 8.6 (1.8) |
FPG (mmol/L) at week 56, mean (SD) | 6.9 (2.0) | 8.6 (2.2) |
Change in FPG (mmol/L) from baseline, mean (SD) | –1.9 (2.1) | –0.0 (2.1) |
LSM | –1.89 | –0.12 |
Difference, LIRA 3 mg vs. placebo (95% CI) | –1.77 (–2.11 to –1.42) | |
P value | < 0.0001 | |
ANCOVA = analysis of covariance; CI = confidence interval; FPG = fasting plasma glucose; LIRA = liraglutide; LOCF = last observation carried forward; LSM = least squares mean; SD = standard deviation; vs. = versus.
aThe FAS included all randomized patients exposed to at least 1 dose of the trial product and with at least 1 post-baseline measurement of the pre-specified end points.
bHemoglobin A1C and FPG were secondary outcomes. Comparisons of liraglutide 3 mg with placebo about changes in hemoglobin A1C and FPG used ANCOVA, with missing data imputed by the LOCF method. The results were not controlled for multiplicity.
Source: Clinical Study Report for Study 1922.12
Table 41: Study 1923 — Change From Baseline in Glycemic Control in Patients Without Diabetes After Initial Weight Loss, Full Analysis Seta
Outcome measure | Study 1923 | |
|---|---|---|
Glycemic control | LIRA 3 mg N = 207 | Placebo N = 206 |
Hemoglobin A1C (% point)b | ||
Hemoglobin A1C at baseline, mean (SD) | 5.6 (0.4) | 5.6 (0.4) |
Hemoglobin A1C at week 56, mean (SD) | –0.1 (0.3) | 0.1 (0.3) |
Change from baseline in hemoglobin A1C, mean (SD) | –0.14 (0.03) | 5.68 (0.03) |
LSM | 5.41 | 5.68 |
Difference, LIRA 3 mg vs. placebo (95% CI) | –0.27 (–0.33 to –0.21) | |
P value | < 0.0001b | |
FPG (mmol/L)b | ||
FPG at baseline, mean (SD) | 5.4 (0.5) | 5.5 (0.5) |
FPG at week 56, mean (SD) | –0.5 (0.6) | –0.2 (0.7) |
Change in FPG from baseline, mean (SD) | –0.52 (0.05) | –0.14 (0.05) |
LSM | 4.93 (0.05) | 5.31 (0.05) |
Difference, LIRA 3 mg vs. placebo (95% CI) | –0.38 (–0.50 to –0.26) | |
P value | < 0.0001b | |
ANCOVA = analysis of covariance; CI = confidence interval; FAS = full analysis set; FPG = fasting plasma glucose; LIRA = liraglutide; LOCF = last observation carried forward; LSM = least squares mean; SD = standard deviation; vs. = versus.
aThe FAS included all randomized patients exposed to at least 1 dose of the trial product and with at least 1 post-baseline measurement of the pre-specified end points.
bHemoglobin A1C and FPG were secondary outcomes. Comparisons of liraglutide 3 mg with placebo about changes in hemoglobin A1C and FPG used ANCOVA, with missing data imputed by the LOCF method. The results were not controlled for multiplicity.
Source: Clinical Study Report for Study 1923.13
Table 42: Study 3970 — Change From Baseline in Glycemic Control in Patients With Obstructive Sleep Apnea, Full Analysis Seta
Outcome measure | Study 3970 | |
|---|---|---|
Glycemic control | LIRA 3 mg N = 180 | Placebo N = 179 |
Hemoglobin A1C (% point)b | ||
Hemoglobin A1C at baseline, mean (SD) | 5.66 (0.37) | 5.64 (0.40) |
Hemoglobin A1C at week 32, mean (SD) | 5.31 (0.39) | 5.48 (0.45) |
Change from baseline in hemoglobin A1C, mean (SD) | –0.36 (0.30) | –0.17 (0.29) |
LSM | –0.36 | –0.17 |
Difference, LIRA 3 mg vs. placebo (95% CI) | –0.19 (–0.25 to –0.12) | |
P value | < 0.0001b | |
FPGb | ||
FPG (mmol/L) at baseline, mean (SD) | 5.39 (0.61) | 5.38 (0.87) |
FPG (mmol/L) at week 32, mean (SD) | 5.25 (0.61) | 5.55 (0.83) |
Change in FPG (mmol/L) from baseline, mean (SD) | –0.15 (0.68) | 0.11 (0.96) |
LSM | –0.14 | 0.16 |
Difference, LIRA 3 mg vs. placebo (95% CI) | –0.30 (–0.44 to –0.16) | |
P value | < 0.0001b | |
ANCOVA = analysis of covariance; CI = confidence interval; FAS = full analysis set; FPG = fasting plasma glucose; LIRA = liraglutide; LOCF = lost observation carried forward; LSM = least squares mean; SD = standard deviation; vs. = versus.
aThe FAS included all randomized patients exposed to at least 1 dose of the trial product and with at least 1 post-baseline measurement of the pre-specified end points.
bHemoglobin A1C and FPG were secondary outcomes. Comparisons of liraglutide 3 mg with placebo about changes in hemoglobin A1C and FPG used ANCOVA, with missing data imputed by the LOCF method. The results were not controlled for multiplicity.
Source: Clinical Study Report for Study 3970.14
Weight-Related Comorbidities
Obstructive Sleep Apnea
Change from baseline in AHI was the primary end point in Study 3970 (Table 43). After 32 weeks of treatment, AHI decreased by 12.2 events per hour and 6.1 events per hour in the liraglutide 3 mg and placebo groups, respectively, indicating a reduction in OSA severity from baseline in each group. In primary statistical analysis, the estimated treatment difference was –6.10 events per hour (95% CI, –11.0 to –1.19; P = 0.0150) in favour of liraglutide 3 mg.
Secondary analysis showed that the percentages of patients achieving OSA remission (defined as AHI < 5 events per hour) after 32 weeks of treatment were 5.4% and 1.2% with liraglutide 3 mg and placebo, respectively. The analysis did not control for multiplicity.
Table 43: Study 3970 — Weight-Related Comorbidities in Patients With Obstructive Sleep Apnea, Full Analysis Seta
Outcome measure | Study 3970 | |
|---|---|---|
Glycemic control | LIRA 3 mg N = 180 | Placebo N = 179 |
AHIb | ||
AHI score (events/hour) at baseline mean (SD) | 48.99 (27.49) | 49.32 (27.47) |
AHI score (events/hour) at week 32, mean (SD) | 36.80 (27.79) | 44.04 (31.73) |
Change from baseline in AHI at week 32, mean (SD) | –12.22 (23.34) | –6.08 (25.90) |
LSM | –12.17 | –6.07 |
Difference, LIRA 3 mg vs. placebo (95% CI) | –6.10 (–11.0 to –1.19) | |
P value | 0.0150c | |
OSA remissionc | ||
Proportion of patients with remission | 9 (5.4) | 2 (1.2) |
LSM, odds | 0.04 | 0.01 |
OR, LIRA 3 mg vs. placebo (95% CI) | 4.38 (0.91 to 21.02) | |
P value | 0.0650 | |
AHI = apnea-hypopnea index; CI = confidence interval; FAS = full analysis set; LIRA = liraglutide; LOCF = last observation carried forward; LSM = least squares mean; OSA = obstructive sleep apnea; SD = standard deviation; vs. = versus.
aThe FAS included all randomized patients exposed to at least 1 dose of the trial product and with at least 1 post-baseline measurement of the pre-specified end points.
bAHI was a primary outcome and analyses comparing liraglutide 3 mg with placebo for AHI used regression analysis, imputing missing data by the LOCF method.
cOSA remission was a secondary outcome. Comparisons of liraglutide 3 mg with placebo about OSA remission used regression analysis, with missing data imputed by the LOCF method. The results were not controlled for multiplicity.
Source: Clinical Study Report for Study 3970.14
Cardiovascular Comorbidity Parameters
Each of the following outcomes relates to weight-related CV comorbidity. All outcomes related to blood pressure and lipid parameters were secondary end points in each of the included studies and were not controlled for multiplicity (Table 44, Table 45, Table 46, and Table 47).
Blood Pressure
Change from baseline in blood pressure (i.e., SBP and DBP) and lipid profile parameters were secondary end points in all the included studies.
For SBP, the LSM difference after 56 weeks of treatment ranged from –2.82 to –2.75 for the main phase of Study 1839 as well as for Study 1922 and Study 1923. The corresponding LSM difference in DBP for the same period of treatment in the same studies ranged from –0.89 to –0.34. For Study 3970, the LSM difference in SBP and DBP after 32 weeks of treatment was –4.12 and –0.97, respectively. The LSM difference in SBP and DBP in the extension phase of Study 1839 was –2.80 and –0.89, respectively, after 160 weeks of treatment.
Lipid Parameters
High-Density Lipoprotein: After 56 weeks of treatment, the LSM estimate ratio (liraglutide 3 mg versus placebo) for HDL ranged from 0.00 to 1.03 for the main phase of Study 1839, Study 1922, and Study 1923. The estimate ratio was 1.00 for Study 3970 after 32 weeks of treatment, and 0.0 for the extension phase of Study 1839 after 160 weeks of treatment.
Low-Density Lipoprotein: After 56 weeks of treatment, the LSM estimate ratio (liraglutide 3 mg versus placebo) for LDL ranged from –0.09 to 0.98 for the main phase of Study 1839, Study 1922, and Study 1923. The estimate ratio was 0.96 for Study 3970 after 32 weeks of treatment, and 0.95 for the extension phase of Study 1839 after 160 weeks of treatment. The clinical expert consulted for this review did not consider any of the LDL changes as being clinically meaningful.
Very Low-Density Lipoprotein: After 56 weeks of treatment, the LSM estimate ratio (liraglutide 3 mg versus placebo) for VLDL ranged from −0.03 to 0.91 for the main phase of Study 1839, Study 1922, and Study 1923. The estimate ratio was 0.95 for Study 3970 after 32 weeks of treatment, and 0.95 for the extension phase of Study 1839 after 160 weeks of treatment. The clinical expert consulted for this review did not consider any of the VLDL changes as being clinically meaningful.
Triglycerides: After 56 weeks of treatment, the LSM estimate ratio (liraglutide 3 mg versus placebo) for triglycerides ranged from −0.11 to 0.91 for the main phase of Study 1839, Study 1922, and Study 1923. The estimate ratio was 0.94 for Study 3970 after 32 weeks of treatment, and 0.94 for the extension phase of Study 1839 after 160 weeks of treatment. The clinical expert consulted for this review did not consider any of the triglyceride changes as being clinically meaningful.
Total Cholesterol: After 56 weeks of treatment, the LSM estimate ratio (liraglutide 3 mg versus placebo) for total cholesterol ranged from −0.11 to 0.96 for the main phase of Study 1839, Study 1922, and Study 1923. The estimate ratio was 0.98 for Study 3970 after 32 weeks of treatment, and 0.98 for the extension phase of Study 1839 after 160 weeks of treatment. The clinical expert consulted for this review did not consider any of the total cholesterol changes as being clinically meaningful.
Free Fatty Acids: After 56 weeks of treatment, the LSM estimate ratio (liraglutide 3 mg versus placebo) for FFA ranged from −0.02 to 0.96 for the main phase of Study 1839, Study 1922, and Study 1923. The estimate ratio was 0.98 for Study 3970 after 32 weeks of treatment, and 0.95 for the extension phase of Study 1839 after 160 weeks of treatment. The clinical expert consulted for this review did not consider any of the FFA changes as being clinically meaningful.
Table 44: Study 1839 — Weight-Related Cardiovascular Comorbidities in Patients Without Diabetes and With Prediabetes, Full Analysis Seta
Comorbidities | 56-week main study phase | 104-week extension phase (week 160)a | ||
|---|---|---|---|---|
CV comorbidity risk parameters | LIRA 3 mg N = 2,437 | Placebo N = 1,225 | LIRA 3 mg N = 1,490 | Placebo N = 742 |
Blood pressureb | ||||
SBP change from baseline, LSM | –4.28 | –1.46 | –3.24 | –0.44 |
Difference, LIRA 3 mg vs. placebo (95% CI) | –2.82 (–3.56 to –2.09) | –2.80 (–3.81 to –1.79) | ||
P value | < 0.0001b | < 0.0001b | ||
DBP change from baseline, LSM | –2.68 | –1.79 | –2.68 | –1.79 |
Difference, LIRA 3 mg vs. placebo (95% CI) | –0.89 (–1.41 to –0.37) | –0.89 (–1.41 to –0.37) | ||
P value | 0.0009b | 0.0009b | ||
Dyslipidemia: Change from baseline in lipid profile parameters (%)b | ||||
HDL, mmol/Lb | 2.28 | 0.68 | 4.89 | 4.04 |
LSM | 1.36 | 1.34 | 104.91 | 103.85 |
Treatment ratio, LIRA 3 mg vs. placebo (95% CI) | 1.02 (1.01 to 1.03) | 1.01 (0.99 to 1.08) | ||
P value | 0.0011b | 0.2297b | ||
LDL, mmol/Lb | –2.98 | –0.95 | –4.19 | –3.25 |
LSM | 2.80 | 2.87 | 95.42 | 97.37 |
Treatment ratio, LIRA 3 mg vs. placebo (95% CI) | 0.98 (0.96 to 0.99) | 0.98 (0.96 to 1.00) | ||
P value | 0.0019 | 0.0962 | ||
VLDL, mmol/L | –13.11 | –5.54 | –11.06 | –6.39 |
LSM | 0.57 | 0.63 | 88.55 | 94.39 |
Treatment ratio, LIRA 3 mg vs. placebo (95% CI) | 0.91 (0.89 to 0.93) | 0.94 (0.91 to 0.97) | ||
P value | < 0.0001b | 0.0002b | ||
Triglycerides, mmol/Lb | –13.26 | –5.53 | –11.32 | –6.75 |
LSM | 1.25 | 1.38 | 88.27 | 94.09 |
Treatment ratio, LIRA 3 mg vs. placebo (95% CI) | 0.91 (0.88 to 0.93) | 0.94 (0.91 to 0.97) | ||
P value | < 0.0001b | 0.0003b | ||
Total cholesterol, mmol/Lb | –3.07 | –1.02 | –2.62 | –1.60 |
LSM | 4.87 | 4.99 | 97.08 | 98.83 |
Treatment ratio, LIRA 3 mg vs. placebo (95% CI) | 0.98 (0.97 to 0.99) | 0.98 (0.97 to 1.00) | ||
P value | < 0.0001b | 0.274b | ||
FFA, mmol/Lb | 1.65 | 3.45 | 0.22 | 2.55 |
LSM | 0.46 | 0.48 | 99.44 | 104.47 |
Treatment ratio, LIRA 3 mg vs. placebo (95% CI) | 0.96 (0.93 to 0.99) | 0.95 (0.91 to 0.99) | ||
P value | 0.130b | 0.0252b | ||
ANCOVA = analysis of covariance; CI = confidence interval; CV = cardiovascular; DBP = diastolic blood pressure; FAS = full analysis set; FFA = free fatty acids; HDL = high-density lipoprotein; LDL = low-density lipoprotein; LIRA = liraglutide; LOCF = last observation carried forward; LSM = least squares mean; SBP = systolic blood pressure; SD = standard deviation; VLDL = very low-density lipoprotein; vs. = versus.
aThe FAS included all randomized patients exposed to at least 1 dose of the trial product and with at least 1 post-baseline measurement of the pre-specified end points.
bBlood pressure and lipid profile parameters were secondary outcomes. Comparisons of liraglutide 3 mg with placebo about blood pressure and lipid profile parameters used ANCOVA, with missing data imputed by the LOCF method. The results were not controlled for multiplicity.
Sources: Clinical Study Reports for Study 183911 and the Study 1839 extension.15
Table 45: Study 1922 — Weight-Related Cardiovascular Comorbidities in Patients With Type 2 Diabetes, Full Analysis Set
Outcome measure | Study 1922 | |
|---|---|---|
CV comorbidity risk parameters | LIRA 3 mg N = 423 | Placebo N = 212 |
Hypertension (blood pressure status) | ||
SBP at baselineb, mean (SD) | 128.9 (13.6) | 129.2 (13.6) |
SBP at week 56, mean (SD) | 126.1 (14.4) | 128.8 (13.4) |
Change in SBP from baseline, mean (SD) | –2.8 (13.5) | –0.4 (13.4) |
LSM | –2.98 | –0.39 |
Difference, LIRA 3 mg vs. placebo (95% CI) | –2.59 (–4.56 to –0.62) | |
P value | 0.0102b | |
DBP at baselineb, mean (SD) | 79.0 (8.6) | 79.3 (9.5) |
DBP at week 56, mean (SD) | 78.1 (9.5) | 78.7 (9.1) |
DBP change from baseline, mean (SD) | –0.9 (8.7) | –0.5 (9.1) |
LSM | –0.99 | –0.63 |
Difference, LIRA 3 mg vs. placebo (95% CI) | –0.36 (–1.69 to 0.96) | |
P value | 0.5918b | |
Dyslipidemia: Change from baseline in lipid profile parameters (%) | ||
HDL (mmol/L) at baselineb, mean (SD) | 1.21 (0.30) | 1.21 (0.30) |
HDL at week 56, mean (SD) | 1.26 (0.29) | 1.24 (0.33) |
HDL (%) change from baseline, mean (SD) | 105.93 (17.00) | 102.99 (14.75) |
LSM | 1.22 | 1.19 |
Treatment ratio, LIRA 3 mg vs. placebo (95% CI) | 1.03 (1.00 to 1.05) | |
P value | 0.0255b | |
LDL (mmol/L) at baselineb, mean (SD) | 2.40 (0.85) | 2.39 (0.94) |
LDL at week 56, mean (SD) | 2.41 (0.86) | 2.39 (0.84) |
LDL (%) change from baseline, mean (SD) | 105.55 (40.99) | 109.02 (29.73) |
LSM | 2.25 | 2.30 |
Treatment ratio, LIRA 3 mg vs. placebo (95% CI) | 0.98 (0.93 to 1.031) | |
P value | 0.3563 | |
VLDL (mmol/L) at baselineb, mean (SD) | 0.93 (0.54) | 0.90 (0.49) |
VLDL at week 56, mean (SD) | 30.8 (18.7) | 36.2 (26.7) |
Change in VLDL (%) from baseline, mean (SD) | 93.53 (40.20) | 106.52 (37.84) |
LSM | 0.71 | 0.82 |
Treatment ratio, LIRA 3 mg vs. placebo (95% CI) | 0.87 (0.81 to 0.93) | |
P value | < 0.0001b | |
Triglycerides (mmol/L) at baselineb, mean (SD) | 2.12 (1.54) | 2.04 (1.35) |
Triglycerides at week 56, mean (SD) | 1.80 (1.36) | 2.17 (2.10) |
Change in triglycerides (%) from baseline, mean (SD) | 94.05 (44.12) | 107.49 (43.56) |
LSM | 1.57 | 1.82 |
Treatment ratio, LIRA 3 mg vs. placebo (95% CI) | 0.86 (0.80 to 0.92) | |
P value | < 0.0001b | |
Total cholesterol (mmol/L) at baselineb, mean (SD) | 4.53 (0.99) | 4.50 (1.03) |
Total cholesterol at week 56, mean (SD) | 4.47 (1.06) | 4.57 (1.05) |
Change in total cholesterol (%) from baseline, mean (SD) | 99.90 (16.83) | 105.10 (17.00) |
LSM | 4.37 | 4.53 |
Treatment ratio, LIRA 3 mg vs. placebo (95% CI) | 0.96 (0.94 to 0.99) | |
P value | 0.0116b | |
FFA (mmol/L) at baselineb, mean (SD) | 0.60 (0.23) | 0.61 (0.23) |
FFA at week 56, mean (SD) | 0.52 (0.21) | 0.56 (0.21) |
Change in FFA (%) from baseline, mean (SD) | 105.92 (166.27) | 98.31 (41.83) |
LSM | 0.48 | 0.51 |
Treatment ratio, LIRA 3 mg vs. placebo (95% CI) | 0.94 (0.88 to 1.01) | |
P value | 0.0994b | |
ANCOVA = analysis of covariance; CI = confidence interval; CV = cardiovascular; DBP = diastolic blood pressure; FAS = full analysis set; FFA = free fatty acids; HDL = high-density lipoprotein; LDL = low-density lipoprotein; LIRA = liraglutide; LOCF = last observation carried forward; LSM = least squares mean; SBP = systolic blood pressure; SD = standard deviation; VLDL = very low-density lipoprotein; vs. = versus.
aThe FAS included all randomized patients exposed to at least 1 dose of the trial product and with at least 1 post-baseline measurement of the pre-specified end points.
bBlood pressure and lipid profile parameters were secondary outcomes. Comparisons of liraglutide 3 mg with placebo about blood pressure and lipid profile parameters used ANCOVA, with missing data imputed by the LOCF method. The results were not controlled for multiplicity.
Source: Clinical Study Report for Study 1922.12
Table 46: Study 1923 — Weight-Related Cardiovascular Comorbidities in Patients Without Diabetes After Initial Weight Loss, Full Analysis Seta
Outcome measure | Study 1923 | |
|---|---|---|
CV comorbidity risk parameters | LIRA 3 mg N = 207 | Placebo N = 206 |
Hypertension (blood pressure status) | ||
SBP at baselineb, mean (SD) | 116.7 (12.6) | 117.7 (10.8) |
SBP at week 56, LSM | 118.51 (0.90) | 121.23 (0.87) |
SBP change from baseline, LSM | 1.31 | 0.90 |
Difference, LIRA 3 mg vs. placebo (95% CI) | –2.72 (–4.69 to –0.76) | |
P value | 0.0068b | |
DBP at baselineb, mean (SD) | 74.3 (9.0) | 75.8 (7.2) |
DBP at week 56, LSM | 76.86 | 77.20 |
DBP change from baseline, LSM | 1.81 (0.64) | 2.15 (0.61) |
Difference, LIRA 3 mg vs. placebo (95% CI) | –0.34 (–1.74 to 1.07) | |
P value | 0.6386b | |
Dyslipidemia: Change from baseline in lipid profile parameters (%) | ||
HDL (mmol/L) at baselineb, mean (SD) | 1.2 (0.3) | 1.2 (0.3) |
HDL at week 56, LMS (SE) | 1.32 (0.02) | 1.31 (0.02) |
HDL change from baseline, LSM (SE) | 0.12 (0.02) | 0.12 (0.02) |
Treatment difference, LIRA 3 mg vs. placebo (95% CI) | 0.00 (–0.03 to 0.04) | |
P value | 0.8239b | |
LDL (mmol/L) at baselineb, mean (SD) | 2.6 (0.7) | 2.7 (0.8) |
LDL at week 56, LSM (SE) | 2.88 (0.05) | 2.97 (0.05) |
LDL change from baseline, LSM (SE) | 0.24 (0.05) | 0.33 (0.05) |
Treatment ratio, LIRA 3 mg vs. placebo (95% CI) | –0.09 (–0.20 to 0.02) | |
P value | 0.1098b | |
VLDL (mmol/L) at baseline, mean (SD)b, mean (SD) | 0.7 (0.3) | 0.8 (0.3) |
VLDL at week 56, LSM (SE) | 0.63 (0.02) | 0.65 (0.2) |
VLDL from baseline, LSM (SE) | –0.12 (0.02) | –0.10 (0.02) |
Treatment difference, LIRA 3 mg vs. placebo (95% CI) | –0.03 (–0.07 to 0.02) | |
P value | 0.2589b | |
Triglycerides (mmol/L) at baseline, mean (SD)b, mean (SD) | 1.2 (0.6) | 1.3 (0.6) |
Triglycerides at week 56, LSM (SE) | 1.29 (0.04) | 1.39 (0.04) |
Change in triglycerides from baseline, LSM (SE) | 0.02 (0.04) | 0.12 (0.04) |
Treatment difference, LIRA 3 mg vs. placebo (95% CI) | –0.11 (–0.20 to –0.01) | |
P value | 0.0310b | |
Total cholesterol (mmol/L) at baseline, mean (SD)b, mean (SD) | 4.5 (0.9) | 4.7 (0.9) |
Total cholesterol at week 56, LSM (SE) | 4.81 (0.06) | 4.91 (0.06) |
Change in total cholesterol, LSM (SE) | 0.22 (0.06) | 0.33 (0.06) |
Treatment difference, LIRA 3 mg vs. placebo (95% CI) | –0.11 (–0.24 to 0.03) | |
P value | 0.1149b | |
FFA (mmol/L) at baseline, mean (SD)b, mean (SD) | 0.5 (0.2) | 0.5 (0.2) |
FFA at week 56, LSM (SE) | 0.43 (0.02) | 0.44 (0.02) |
Change in FFA from baseline, LSM (SE) | –0.11 (0.02) | –0.10 (0.02) |
Treatment difference, LIRA 3 mg vs. placebo (95% CI) | –0.02 (–0.06 to 0.03) | |
P value | 0.4795b | |
ANCOVA = analysis of covariance; CI = confidence interval; CV = cardiovascular; DBP = diastolic blood pressure; FAS = full analysis set; FFA = free fatty acids; HDL = high-density lipoprotein; LDL = low-density lipoprotein; LIRA = liraglutide; LOCF = last observation carried forward; LSM = least squares mean; SBP = systolic blood pressure; SD = standard deviation; SE = standard error; VLDL = very low-density lipoprotein; vs. = versus.
aThe FAS included all randomized patients exposed to at least 1 dose of the trial product and with at least 1 post-baseline measurement of the pre-specified end points.
bBlood pressure and lipid profile parameters were secondary outcomes. Comparisons of liraglutide 3 mg with placebo about blood pressure and lipid profile parameters used ANCOVA, with missing data imputed by the LOCF method. The results were not controlled for multiplicity.
Source: Clinical Study Report for Study 1923.13
Table 47: Weight-Related Cardiovascular Comorbidities in Patients With Obstructive Sleep Apnea, Full Analysis Seta
Outcome measure | Study 3970 | |
|---|---|---|
Glycemic control | LIRA 3 mg N = 180 | Placebo N = 179 |
CV comorbidity risk parameters | ||
Hypertension (blood pressure status) | ||
SBP at baseline, mean (SD) | 125.80 (11.47) | 127.12 (12.27) |
SBP at week 32, mean (SD) | 122.32 (10.21) | 127.17 (13.32) |
Change in SBP from baseline | –3.40 (12.39) | 0.04 (12.76) |
LSM | –3.74 | 0.38 |
Difference, LIRA 3 mg vs. placebo (95% CI) | –4.12 (–6.33 to –1.90) | |
P value | 0.0003b | |
DBP at baseline, mean (SD) | 81.18 (7.62) | 82.23 (8.79) |
DBP at week 32, mean (SD) | 80.47 (7.46) | 81.84 (8.11) |
DBP change from baseline, LSM | –0.70 (8.60) | –0.39 (8.94) |
LSM | –1.03 | –0.06 |
Difference, LIRA 3 mg vs. placebo (95% CI) | –0.97 (–2.45 to 0.51) | |
P value | 0.1992b | |
Dyslipidemia: Change from baseline in lipid profile parameters (%) | ||
HDL (mmol/L) at baseline, geometric meanb | 1.18 | 1.15 |
HDL at week 32, LSM | 1.18 | 1.18 |
Treatment ratio, LIRA 3 mg vs. placebo (95% CI) | 1.00 (0.7 to 1.03) | |
P value | 0.9423b | |
LDL (mmol/L) at baseline, geometric meanb | 2.89 | 2.89 |
LDL at week 32, LSM | 2.74 | 2.86 |
Treatment ratio, LIRA 3 mg vs. placebo (95% CI) | 0.96 (0.91 to 1.01) | |
P value | 0.0823b | |
VLDL (mmol/L) at baseline, geometric meanb | 0.72 | 0.75 |
VLDL at week 32, LSM | 0.67 | 0.70 |
Treatment ratio, LIRA 3 mg vs. placebo (95% CI) | 0.95 (0.88 to 1.02) | |
P value | 0.1672b | |
Triglycerides (mmol/L) at baseline, geometric meanb | 1.59 | 1.63 |
Triglycerides at week 32, LSM | 1.46 | 1.55 |
Treatment ratio, LIRA 3 mg vs. placebo (95% CI) | 0.94 (0.88 to 1.02) | |
P value | 0.1429b | |
Total cholesterol (mmol/L) at baseline, geometric meanb | 4.93 | 4.94 |
Total cholesterol at week 32, LSM | 4.75 | 4.87 |
Treatment ratio, LIRA 3 mg vs. placebo (95% CI) | 0.98 (0.95 to 1.01) | |
P value | 0.1113b | |
ANCOVA = analysis of covariance; CI = confidence interval; CV = cardiovascular; DBP = diastolic blood pressure; FAS = full analysis set; HDL = high-density lipoprotein; LDL = low-density lipoprotein; LIRA = liraglutide; LOCF = last observation carried forward; LSM = least squares mean; SBP = systolic blood pressure; SD = standard deviation; VLDL = very low-density lipoprotein; vs. = versus.
aThe FAS included all randomized patients exposed to at least 1 dose of the trial product and with at least 1 post-baseline measurement of the pre-specified end points.
bBlood pressure and lipid profile parameters were secondary outcomes. Comparisons of liraglutide 3 mg with placebo about blood pressure and lipid profile parameters used ANCOVA, with missing data imputed by the LOCF method. The results were not controlled for multiplicity.
Source: Clinical Study Report for Study 3970.14
Change in Concomitant Medications for Weight-Related Comorbidities
Changes from baseline in the use of antihypertensive drugs, lipid-lowering agents, and OADs were secondary end points in Study 1839, Study 1922, and Study 1923, and not controlled for multiplicity. The studies reported the number of patients with increased use, decreased use, or maintaining the same level of use for each drug class; however, only descriptive statistics were reported. The percentage of patients with decreased use of medication has been reported (Table 48, Table 49, and Table 50).
Table 48: Study 1839 — Change in Concomitant Medication Use in Patients Without Diabetes and With Prediabetes, Full Analysis Seta
Outcome measure | 56-week main study phase | 104-week extension phase | ||
|---|---|---|---|---|
Change in the use of concomitant medications | LIRA 3 mg N = 2,437 | Placebo N = 1,225 | LIRA 3 mg N = 1,490 | Placebo N = 742 |
Antihypertensive drugs, n (%)b | ||||
Patients on antihypertensive drugs at baseline | 754 (30.9) | 404 (33.0) | 577 (39.2) | 291 (39.4) |
Patients with decreased antihypertensive drugs at EOT | 147 (6.0) | 47 (3.8) | 101 (6.9) | 28 (3.8) |
Lipid-lowering agents, n (%)b | ||||
Patients on lipid-lowering agents at baseline | 386 (15.8) | 183 (14.9) | 288 (19.6) | 134 (18.2) |
Patients with decreased lipid-lowering agents at EOT | 37 (1.5) | 16 (1.3) | 35 (2.4) | 14 (1.9) |
OADs, n (%)b | ||||
Patients on OADs at baseline | 1 (0.0) | NR | 1 (0.1) | 0 (0.0) |
Patients with decreased OADs at EOT | NR | 0 (0.0) | 0 (0.0) | |
EOT = end of treatment; FAS = full analysis set; LIRA = liraglutide; NR = not reported; OAD = oral antidiabetic drug.
aThe FAS included all randomized patients exposed to at least 1 dose of the trial product and with at least 1 post-baseline measurement of the pre-specified end points.
bChange in use of concomitant medication was a secondary outcome, which was reported descriptively without application of any statistical analysis model.
Sources: Clinical Study Reports for Study 183911 and the Study 1839 extension.15
Table 49: Study 1922 — Change in Concomitant Medication in Patients With Type 2 Diabetes, Full Analysis Seta
Outcome measure | Study 1922 | |
|---|---|---|
Change in the use of concomitant medications | LIRA 3 mg (N = 423) | Placebo (N = 212) |
Antihypertensive drugs, n (%)b | ||
Patients on antihypertensive drugs at baseline | 278 (67.5) | 143 (67.8) |
Patients with decreased antihypertensive drugs at week 56 | 23 (5.6) | 7 (3.3) |
Lipid-lowering agents, n (%)b | ||
Patients on lipid-lowering agents at baseline | 250 (60.7) | 110 (52.1) |
Patients with decreased lipid-lowering agents at week 56 | 11 (2.7) | 7 (3.3) |
OADs, n (%)b | ||
Patients on OADs at baseline | 366 (88.8) | 191 (90.5) |
Patients with decreased OADs at week 56 | 54 (13.1) | 12 (5.7) |
FAS = full analysis set; LIRA = liraglutide; OAD = oral antidiabetic drug.
aThe FAS included all randomized patients exposed to at least 1 dose of the trial product and with at least 1 post-baseline measurement of the pre-specified end points.
bChange in use of concomitant medication was a secondary outcome, which was reported descriptively without application of any statistical analysis model.
Source: Clinical Study Report for Study 1922.12
Table 50: Study 1923 — Change in Concomitant Medication Use in Patients Without Diabetes After Initial Weight Loss, Full Analysis Seta
Outcome measure | Study 1923 | |
|---|---|---|
Change in the use of concomitant medications | LIRA 3 mg (N = 207) | Placebo (N = 206) |
Antihypertensive drugs, n (%)b | ||
Patients on antihypertensive drugs at baseline | 62 (30.0) | 53 (25.7) |
Patients with decreased antihypertensive drugs at week 56 | 18 (8.7) | 8 (3.9) |
Lipid-lowering agents, n (%)b | ||
Patients on lipid-lowering agents at baseline | 32 (15.5) | 33 (16.0) |
Patients with decreased lipid-lowering agents at week 56 | 5 (2.4) | 3 (1.5) |
Anti-depressive medications, n (%)b | ||
Patients on anti-depressive medications at baseline | 20 (9.7) | 26 (12.6) |
Patients with decreased anti-depressive medications at week 56 | 6 (2.9) | 7 (3.4) |
FAS = full analysis set; LIRA = liraglutide.
aThe FAS included all randomized patients exposed to at least 1 dose of the trial product and with at least 1 post-baseline measurement of the pre-specified end points.
bChange in use of concomitant medication was a secondary outcome, which was reported descriptively without application of any statistical analysis model.
Source: Clinical Study Report for Study 1923.13
Severity of Depression
Study 1923 reported change from baseline in the severity of depression as a secondary end point, using the PHQ-9 (Table 51). At week 56, the percentage of patients improving from baseline to highest score was similar, with those in the liraglutide 3 mg group and the placebo group at 6 patients (2.8%) versus 6 patients (2.9%), respectively. Also, a similar percentage of patients experienced a worsening in depression scores from baseline, with those in the liraglutide 3 mg group and the placebo group at 41 patients (19.3%) versus 37 patients (17.6%), respectively.
Table 51: Study 1923 — Change From Baseline in PHQ-9 Score in Patients Without Diabetes After Initial Weight Loss, Full Analysis Set
Outcome measure | Study 1923 | |
|---|---|---|
Severity of depression | LIRA 3 mg N = 207 | Placebo N = 206 |
PHQ-9 scores,a mean (SD) (LOCF) | ||
Total score at baseline | 1.2 (2.0) | 1.0 (1.8) |
Total score at week 56 | 1.2 (2.2) | 1.3 (2.3) |
Total number of patients improving from baseline to highest score | 6 (2.8) | 6 (2.9) |
Total number of patients worsening from baseline | 41 (19.3) | 37 (17.6) |
FAS = full analysis set; LIRA = liraglutide; LOCF = last observation carried forward; PHQ-9 = Patient Health Questionnaire-9; SD = standard deviation.
aThe FAS included all randomized patients exposed to at least 1 dose of the trial product and with at least 1 post-baseline measurement of the pre-specified end points.
bThe PHQ-9 score for depression severity was a secondary outcome, which was described descriptively without application of any statistical analysis model.
Source: Clinical Study Report for Study 1923.13
Harms
Only those harms identified in the review protocol are reported as follows. See Table 52, Table 53, Table 54, and Table 55 for detailed harms data.
Adverse Events
After 56 weeks of treatment, the rate of TEAEs occurring in at least 1 patient with liraglutide 3 mg ranged from 91.5% to 92.9% in the main phase of Study 1839, Study 1922, and Study 1923. In the same studies, the overall TEAE rates for placebo were between 69.3% and 89.4%. The TEAE rate in Study 3970 was 80.1% with liraglutide compared with 69.3% with placebo, after 32 weeks of treatment, whereas the TEAE rates in the extension phase of Study 1839 were 94.7% and 89.4% with liraglutide and placebo, respectively, after 160 weeks of treatment. The most common AEs (i.e., occurring in ≥ 5% of patients) with liraglutide 3 mg across all the included studies were nausea (26.7% to 47.6%), diarrhea (16.5% to 25.6%), and constipation (11.9% to 26.9%).
Serious Adverse Events
SAEs with liraglutide 3 mg reported across the included studies ranged from 4.2% to 8.8% compared with 2.4% to 6.1% with placebo after 56 weeks of treatment, and 15.1% versus 12.9% for the 2 groups, respectively, after 160 weeks of treatment. The most frequent SAEs with liraglutide 3 mg (i.e., occurring in 1% or more of patients) were hepatobiliary disorders (2.5% or less, only in Study 1839), and infections and infestations (2.3%, in Study 1839 only). The rates of neoplasms (i.e., benign, malignant, and unspecified) were 1.7%, 1.9%, and 2.1% in Study 1922, Study 1923, and the Study 1839 extension, respectively. SAE rates in Study 3970 were 3.4% with liraglutide and 15.6% with placebo after 32 weeks. For this study, the most common SAE with liraglutide 3 mg was coronary artery disease, occurring in 2 patients (1.1%) versus none in the placebo group. For the placebo group, the most common SAE was angina pectoris, occurring in 6 patients (3.4%) versus 1 patient (0.6%) in the liraglutide 3 mg group.
Withdrawal Due to Adverse Events
The rates of AEs leading to withdrawal (WDAEs) was between 9.2% and 13.3% with liraglutide 3 mg and 3.3% and 6.2% for placebo in all studies included in the CADTH systematic review. For Study 1839 (including the extension), Study 1922, and Study 3970, the most common AEs leading to withdrawal (i.e., occurring in ≥ 1% of patients) with liraglutide 3 mg across all studies were GI symptoms (14.8% to 5.8%), nausea (1.7% to 3.5%), vomiting (1.2% to 2.5%), and diarrhea (1.1% to 2.1%). The WDAE rates with placebo ranged from 0 to less than 1%. In Study 1923, details of WDAEs were reported for individual patients without synthesizing the data, and it was common to find more than 1 WDAE for a single patient. Thus, the available data were not summarized in a suitable manner for this report.
Mortality
In Study 1839, by the end of the 56-week main phase, 1 death had occurred in the liraglutide 3 mg group (due to cardiomegaly and hypertensive heart disease) and 2 deaths had occurred in the placebo group (due to pulmonary fibrosis and cardiorespiratory arrest). At the end of the extension phase of the study (160 weeks), each group had a total of 2 deaths, corresponding to mortality rates of 0.1% and 0.3% for the liraglutide 3 mg group and the placebo group, respectively (Table 52). Both deaths in the liraglutide 3 mg group and the single death in the placebo group were due to CV-related causes and the single death in the placebo group was due to pulmonary fibrosis.
In Study 1923, 1 patient in the placebo group died from cardiac failure.
No deaths were reported during Study 1922 or Study 3970.
Notable Harms
Overall, the most frequently reported notable harms with liraglutide 3 mg were GI disorders, including nausea (27% to 41%), diarrhea (17% to 26%), constipation (12% to 27%), and vomiting (7% to 20%). GI AEs were also the most common notable harms in the placebo group, with up to 17.1% for nausea, 12.4% for diarrhea, 12.4% for constipation, and 5.7% for vomiting. Hypoglycemia was commonly reported by the included studies, and it was the most common notable harm in Study 1922 (44% with liraglutide 3 mg and 28% with placebo), which was conducted in patients with diabetes. Anxiety and depression were also commonly reported across the studies but at relatively much lower rates. Pancreatitis, breast cancer, and cardiac disorders such as angina pectoris, coronary artery disease, and heart failure were rare. In Study 1923, thyroid cancer was reported in 1 patient (0.5%) in the liraglutide 3 mg group. Notable harms occurred more frequently with liraglutide 3 mg than with placebo, consistent with the trend seen with other AE categories (Table 52, Table 53, Table 54, and Table 55).
Table 52: Study 1839 — Summary of Harms in Patients Without Diabetes and With Prediabetes, Safety Analysis Set
Harms outcomes, n (%) | 56-week main study phase | 104-week extension phase (week 160) | ||
|---|---|---|---|---|
AEs, n (%) | LIRA 3 mg N = 2,481 | Placebo N = 1,242 | LIRA 3 mg N = 1,501 | Placebo N = 747 |
AEs overalla | 2,285 (92.1) | 1,043 (84.0) | 1,421 (94.7) | 668 (89.4) |
Most common AEsb | 1,992 (80.3) | 786 (63.3) | 1,322 (88.1) | 579 (77.5) |
Nausea | 997 (40.2) | 183 (14.7) | 614 (40.9) | 125 (16.7) |
Diarrhea | 518 (20.9) | 115 (9.3) | 379 (25.2) | 107 (14.3) |
Constipation | 465 (20.0) | 106 (6.7) | 331 (22.1) | 85 (11.4) |
Nasopharyngitis | 427 (17.2) | 234 (18.8) | 396 (26.4) | 209 (28.0) |
Vomiting | 404 (16.3) | 51 (4.1) | 295 (19.7) | 40 (5.4) |
Headache | 327 (13.2) | 154 (12.4) | 270 (18.0) | 122 (16.3) |
Hypoglycemia | 296 (11.9) | 41 (3.3) | 296 (19.7) | 35 (4.7) |
Respiratory, thoracic, and mediastinal disorders | 271 (10.9) | 165 (13.3) | 321 (21.4) | 170 (22.8) |
Decreased appetite | 267 (10.8) | 30 (3.1) | 164 (10.9) | 26 (3.5) |
Dyspepsia | 236 (9.5) | 39 (3.1) | 154 (10.3) | 35 (4.7) |
Fatigue | 185 (7.5) | 65 (5.2) | 152 (10.1) | 57 (7.6) |
Back pain | 171 (6.9) | 105 (8.5) | 200 (13.3) | 120 (16.1) |
Dizziness | 167 (6.7) | 60 (4.8) | 146 (9.7) | 54 (7.2) |
URTI | 213 (6.6) | 122 (9.8) | 235 (15.7) | 119 (15.9) |
Influenza | 144 (5.8) | 66 (5.3) | 181 (12.1) | 79 (10.6) |
Abdominal pain, upper | 141 (5.7) | 43 (3.5) | 114 (7.6) | 38 (5.1) |
Injection site hematoma | 142 (5.7) | 93 (7.5) | 91 (6.1) | 60 (8.0) |
Abdominal pain | 150 (5.2) | 43 (3.5) | 112 (7.5) | 39 (5.2) |
Sinusitis | 128 (5.2) | 73 (5.9) | 128 (8.5) | 65 (8.7) |
Arthralgia | 125 (5.0) | 71 (5.7) | 184 (12.3) | 97 (13.0) |
SAEs, n (%) | ||||
SAEs overalla | 154 (6.2) | 62 (5.0) | 227 (15.1) | 96 (12.9) |
Most common SAEsc | ||||
Hepatobiliary disorders | 36 (1.5) | 5 (0.4) | 37 (2.5) | 6 (0.8) |
Infections and infestations | 22 (0.9) | 11 (0.9) | 34 (2.3) | 17 (2.3) |
Musculoskeletal and connective | NA | 33 (2.2) | 15 (2.0) | |
Gastrointestinal disorders | NA | 33 (2.2) | 12 (1.6) | |
Neoplasms — benign, malignant, and unspecified | NA | 31 (2.1) | 7 (0.9) | |
Cardiac disorders | NA | 15 (1.0) | 8 (1.1) | |
WDAEs, n (%) | ||||
WDAEs overalla | 244 (9.8) | 47 (3.8) | 199 (13.3) | 46 (6.2) |
Most common WDAEsc | ||||
Gastrointestinal symptoms | 119 (4.8) | 6 (0.5) | 87 (5.8) | 6 (0.8) |
Nausea | 75 (3.0) | 4 (0.3) | 52 (3.5) | 5 (0.7) |
Vomiting | 47 (1.9) | 1 (0.1) | 37 (2.5) | 0 (0.0) |
Deaths | 1 (0.0) | 2 (0.2) | 2 (0.1) | 2 (0.3) |
Notable harms, n (%) | ||||
Nausea | 997 (40.2) | 163 (14.7) | 614 (40.9) | 125 (16.7) |
Diarrhea | 518 (20.9) | 242 (19.5) | 379 (25.2) | 107 (14.3) |
Constipation | 465 (20.0) | 106 (6.7) | 331 (22.1) | 85 (11.4) |
Vomiting | 404 (16.3) | 51 (4.1) | 295 (19.7) | 40 (5.4) |
Hypoglycemia | 296 (11.9) | 41 (3.3) | 296 (19.7) | 35 (4.7) |
Dyspepsia | 236 (9.5) | 39 (3.1) | 154 (10.3) | 35 (4.7) |
Abdominal pain, upper | 141 (5.7) | 43 (3.5) | 114 (7.6) | 38 (5.1) |
Abdominal pain | 130 (5.2) | 43 (3.5) | 112 (7.5) | 39 (5.2) |
GERD | 122 (4.9) | 23 (1.9) | 98 (6.5) | 18 (2.4) |
Gallbladder disease | 55 (2.2) | 10 (0.8) | 66 (4.4) | 14 (1.9) |
Cholelithiasis | 37 (1.5) | 8 (0.6) | 45 (3.0) | 11 (1.5) |
Cholecystitis | 6 (0.2) | NR | 7 (0.5) | 1 (0.1) |
Psychiatric AEs | 207 (8.3) | 110 (8.9) | 233 (15.5) | 117 (15.7) |
Depression | 48 (1.9) | 25 (2.0) | 56 (3.7) | 31 (4.1) |
Anxiety | 45 (1.8) | 24 (1.9) | 233 (15.5) | 117 (15.7) |
Suicidal ideation | 3 (0.1) | NR | 7 (0.5) | 0 (0.0) |
Hypersensitivity reactions | 17 (0.7) | 7 (0.6) | 12 (0.8) | 10 (1.3) |
Cardiac disorders | 81 (3.3) | 40 (3.2) | 87 (5.8) | 52 (7.0) |
Tachycardia | 14 (0.6) | 1 (0.1) | 11 (0.7) | 2 (0.3) |
Atrial fibrillation | 6 (0.2) | 3 (0.2) | 11 (0.7) | 5 (0.7) |
Atrioventricular block | 5 (0.2) | NR | 6 (0.4) | 0 (0.0) |
Breast cancer | 5 (0.2) | 1 (0.1) | 5 (0.3) | 0 (0.0) |
Pancreatitis | 1 (0.0) | NR | 3 (0.2) | 1 (0.1) |
Urinary tract symptoms | 53 (2.1) | 29 (2.3) | 65 (4.3) | 34 (4.6) |
Acute renal failure | 1 (0.0) | 1 (0.1) | 2 (0.1) | 3 (0.4) |
AE = adverse event; GERD = gastroesophageal reflux disease; LIRA = liraglutide; NA = not applicable; NR = not reported; SAE = serious adverse event; URTI = upper respiratory tract infection; WDAE = withdrawal due to adverse event.
aOverall AE, SAE, and WDAE figures refer to events occurring in at least 1 patient.
bThe cut-off frequency for most common AEs refers to AEs occurring in at least 5% of patients.
cThe cut-off frequency for most common SAEs and WDAEs refers to SAEs and WDAEs occurring in at least 1% of patients.
Sources: Clinical Study Reports for Study 183911 and the Study 1839 extension.15
Table 53: Study 1922 — Summary of Harms in Patients With Type 2 Diabetes, Safety Analysis Set
Harms outcomes, n (%) | Study 1922 | |
|---|---|---|
AEs, n (%) | LIRA 3 mg N = 422 | Placebo N = 212 |
AEs overalla | 392 (92.9) | 182 (85.8) |
Most common AEsb | 362 (85.8) | 164 (77.4) |
Hypoglycemia | 187 (44.3) | 59 (27.8) |
Nausea | 138 (32.7) | 29 (13.7) |
Diarrhea | 108 (25.6) | 27 (12.7) |
Nasopharyngitis | 88 (20.9) | 41 (19.3) |
Constipation | 69 (16.1) | 13 (6.1) |
Headache | 66 (15.6) | 29 (13.7) |
Vomiting | 66 (15.6) | 12 (5.7) |
Respiratory, thoracic, and mediastinal disorders | 53 (12.6) | 25 (11.8) |
Dyspepsia | 47 (11.1) | 5 (2.4) |
Back pain | 40 (10.0) | 20 (9.4) |
Decreased appetite | 40 (9.5) | 4 (1.9) |
URTI | 40 (9.5) | 18 (8.5) |
Fatigue | 35 (8.3) | 7 (3.3) |
Arthralgia | 30 (7.1) | 12 (5.7) |
Dizziness | 30 (7.1) | 6 (2.8) |
Abdominal distension | 26 (6.2) | 3 (1.4) |
Abdominal pain | 26 (6.2) | 9 (4.2) |
Flatulence | 22 (5.2) | 4 (1.9) |
Influenza | 22 (5.2) | 15 (7.1) |
SAEs, n (%) | ||
SAEs overalla | 37 (8.8) | 13 (6.1) |
Most common SAEsc | ||
Neoplasms — benign, malignant, and unspecified | 7 (1.7) | 2 (0.9) |
WDAEs, n (%) | ||
WDAEs overalla | 39 (9.2) | 7 (3.3) |
Most common WDAEsc | ||
Nausea | 11 (2.6) | NR |
Diarrhea | 9 (2.1) | NR |
Vomiting | 5 (1.2) | NR |
Deaths | 0 (0.0) | 0 (0.0) |
Notable harms, n (%) | ||
Hypoglycemia | 187 (44.3) | 59 (27.8) |
Nausea | 138 (32.7) | 29 (13.7) |
Diarrhea | 108 (25.6) | 27 (12.7) |
Constipation | 69 (16.1) | 13 (6.1) |
Vomiting | 66 (15.6) | 12 (5.7) |
Dyspepsia | 47 (11.1) | 5 (2.4) |
Abdominal pain | 26 (6.2) | 9 (4.2) |
GERD | 16 (3.8) | 3 (1.4) |
Cardiac disorders | 16 (3.8) | 5 (2.4) |
Cardiac arrhythmias | 10 (2.4) | 1 (0.5) |
Psychiatric AEs | 38 (9.0) | 10 (10.7) |
Anxiety | 9 (2.1) | 4 (1.9) |
Depression | 6 (1.4) | 2 (0.9) |
Urinary tract symptoms | 24 (5.7) | 7 (3.3) |
Nephrolithiasis | 6 (1.4) | 4 (1.9) |
Dysuria | 5 (1.2) | 2 (0.9) |
Gallbladder disease | 4 (0.9) | 1 (0.5) |
Cholelithiasis | 3 (0.7) | 1 (0.5) |
Cholecystitis | 1 (0.2) | 1 (0.5) |
Hypersensitivity reactions | 1 (0.2) | NR |
Breast cancer | 1 (0.2) | NR |
AE = adverse event; GERD = gastroesophageal reflux disease; LIRA = liraglutide; NR = not reported; SAE = serious adverse event; URTI = upper respiratory tract infection; WDAE = withdrawal due to adverse event.
aOverall AE, SAE, and WDAE figures refer to events occurring in at least 1 patient.
bThe cut-off frequency for most common AEs refers to AEs occurring in at least 5% of patients.
cThe cut-off frequency for most common SAEs and WDAEs refers to SAEs and WDAEs occurring in at least 1% of patients.
Source: Clinical Study Report for Study 1922.12
Table 54: Study 1923 — Summary of Harms in Patients Without Diabetes After Initial Weight Loss, Safety Analysis Set
Harms outcomes | Study 1923 | |
|---|---|---|
AEs, n (%) | LIRA 3 mg N = 212 | Placebo N = 210 |
AEs overalla | 194 (91.5) | 186 (88.6) |
Most common AEsb | 177 (83.5) | 163 (77.6) |
Nausea | 101 (47.6) | 36 (17.1) |
Constipation | 57 (26.9) | 26 (12.4) |
Diarrhea | 38 (17.9) | 26 (12.4) |
Vomiting | 35 (16.5) | 5 (2.4) |
Headache | 27 (12.7) | 26 (12.4) |
Dizziness | 22 (10.4) | 18 (8.6) |
Decreased appetite | 21 (9.9) | 3 (1.4) |
Dyspepsia | 20 (9.4) | 4 (1.9) |
Injection site hematoma | 17 (8.0) | 24 (11.4) |
Fatigue | 17 (8.0) | 11 (5.2) |
Abdominal pain | 14 (6.6) | 3 (1.4) |
Cough | 14 (6.6) | 11 (5.2) |
Abdominal distension | 13 (6.1) | 8 (3.8) |
Arthralgia | 12 (5.7) | 13 (6.2) |
Eructation | 11 (5.2) | 0 (0.0) |
Flatulence | 11 (5.2) | 8 (3.8) |
Back pain | 11 (5.2) | 20 (9.5) |
Hypoglycemia | 11 (5.2) | 5 (2.4) |
Injection site pain | 8 (3.8) | 11 (5.2) |
SAEs, n (%) | ||
SAEs overalla | 9 (4.2) | 5 (2.4) |
Most common SAEsc | ||
Neoplasms — benign, malignant, and unspecified | 4 (1.9) | 0 (0.0) |
Hepatobiliary disorders | 2 (0.9) | 0 (0.0) |
WDAEs, n (%) | ||
WDAEs overalla | 18 (8.5) | 18 (8.6) |
Most common WDAEsc, d | NR | NR |
Deaths | 0 (0.0) | 1 (0.5) |
Notable harms, n (%) | ||
Nausea | 101 (47.6) | 36 (17.1) |
Constipation | 57 (26.9) | 26 (12.4) |
Diarrhea | 38 (17.9) | 26 (12.4) |
Vomiting | 35 (16.5) | 5 (2.4) |
Dyspepsia | 17 (8.0) | 24 (11.4) |
Abdominal pain | 14 (6.6) | NR |
Hypoglycemia | 11 (5.2) | 5 (2.4) |
Psychiatric disorders | 24 (11.3) | 26 (12.4) |
Anxiety | 9 (4.2) | 2 (1.1) |
Depression | 4 (1.9) | 3 (1.4) |
Cholelithiasis | 2 (0.9) | 1 (0.5) |
Cardiac disorders | 2 (0.9) | 7 (3.3) |
Atrial fibrillation | 1 (0.5) | 2 (1.0) |
Angina pectoris | 0 (0.0) | 1 (0.5) |
Cardiac failure | 0 (0.0) | 1 (0.5) |
Renal failure | 0 (0.0) | 1 (0.5) |
Breast cancer | 1 (0.5) | NR |
Thyroid cancer | 1 (0.5) | NR |
AE = adverse event; LIRA = liraglutide; NR = not reported; SAE = serious adverse event; WDAE = withdrawal due to adverse event.
aOverall AE, SAE, and WDAE figures refer to events occurring in at least 1 patient.
bThe cut-off frequency for most common AEs refers to AEs occurring in at least 5% of patients.
cThe cut-off frequency for most common SAEs and WDAEs refers to SAEs and WDAEs occurring in at least 1% of patients.
dAEs leading to withdrawal were reported for individual patients without synthesizing data, and it was common to find more than 1 WDAE for a single patient. Thus, the available data were not summarized in a manner suitable for this report.
Source: Clinical Study Report for Study 1923.13
Table 55: Study 3970 — Summary of Harms in Patients With Obstructive Sleep Apnea, Safety Analysis Set
Harms outcomes | Study 3970 | |
|---|---|---|
AEs, n (%) | LIRA 3 mg N = 176 | Placebo N = 179 |
AEs overalla | 141 (80.1) | 124 (69.3) |
Most common AEsb | 117 (66.5) | 84 (46.9) |
Nausea | 47 (26.7) | 12 (6.7) |
Diarrhea | 29 (16.5) | 14 (7.8) |
Headaches | 25 (14.2) | 20 (11.2) |
Constipation | 21 (11.9) | 6 (3.4) |
Upper respiratory tract infection | 18 (10.2) | 19 (10.6) |
Dyspepsia | 15 (8.5) | 2 (1.1) |
Nasopharyngitis | 15 (8.5) | 18 (10.1) |
Vomiting | 13 (7.4) | 5 (2.8) |
GERD | 10 (5.7) | 1 (0.6) |
Influenza | 9 (5.1) | 9 (5.0) |
Lipase, increased | 9 (5.1) | 5 (2.8) |
Injection site hematoma | 7 (4.0) | 13 (7.3) |
Arthralgia | 7 (4.0) | 9 (5.0) |
SAEs, n (%) | ||
SAEs overalla | 6 (3.4) | 14 (15.6) |
Most common SAEsc | ||
Coronary artery disorders | 2 (1.1) | 0 (0.0) |
Angina pectoris | 1 (0.6) | 6 (3.4) |
WDAEs, n (%) | ||
WDAEs overalla | 21 (11.9) | 6 (3.4) |
Most common WDAEsc | ||
Nausea | 3 (1.7) | 0 (0.0) |
Abdominal discomfort | 2 (1.1) | 0 (0.0) |
Diarrhea | 2 (1.1) | 0 (0.0) |
Lipase, increased | 2 (1.1) | 0 (0.0) |
Deaths | 0 (0.0) | 0 (0.0) |
Notable harms, n (%) | ||
Nausea | 47 (26.7) | 12 (6.7) |
Diarrhea | 29 (16.5) | 14 (7.8) |
Headaches | 25 (14.2) | 20 (11.2) |
Constipation | 21 (11.9) | 6 (3.4) |
Dyspepsia | 15 (8.5) | 2 (1.1) |
Vomiting | 13 (7.4) | 5 (2.8) |
GERD | 10 (5.7) | 1 (0.6) |
Hypoglycemia | 6 (3.4) | 3 (1.7) |
Psychiatric disorders | 9 (5.1) | 2 (1.1) |
Anxiety | 4 (2.3) | 1 (0.6) |
Depression | 3 (1.7) | 1 (0.6) |
Cardiac disorders | 2 (1.1) | NR |
Angina pectoris | 2 (1.1) | NR |
Cholelithiasis | 2 (1.1) | NR |
AE = adverse event; GERD = gastroesophageal reflux disease; LIRA = liraglutide; NR = not reported; SAE = serious adverse event; WDAE = withdrawal due to adverse event.
aOverall AE, SAE, and WDAE figures refer to events occurring in at least 1 patient.
bThe cut-off frequency for most common AEs refers to AEs occurring in at least 5% of patients.
cThe cut-off frequency for most common SAEs and WDAEs refers to SAEs and WDAEs occurring in at least 1% of patients.
Source: Clinical Study Report for Study 3970.14
Critical Appraisal
Internal Validity
Randomization, Allocation, and Blinding
All the included studies used appropriate randomization methods and blinding was achieved by matching placebo to the liraglutide through using the same FlexPens to administer equal volumes for corresponding doses. A centralized IV/WRS was used to administer a computer-generated randomization schedule and patients, investigators, and study personnel were blinded to treatment assignment. Baseline demographic and other characteristics were similar across treatment groups, with no notable imbalances. However, the higher rate of discontinuation due to AEs and the significant difference in weight loss with liraglutide 3 mg compared with placebo, as well as the larger proportion of patients who discontinued the study due to ineffective therapy in the placebo group, may have resulted in unblinding for some patients. It was unclear whether this deviation could be explained by the shorter duration of Study 3970 compared with the others (32 weeks versus 56 weeks for the main phase of Study 1839, Study 1922, and Study 1923, and 104 weeks for the Study 1839 extension).
Co-Intervention
All studies included a co-intervention of diet and physical activity across treatment groups. Patients had a recommended minimum period of increased physical activity, received a low-calorie diet of pre-specified proportions of energy from fat, protein, and carbohydrates, and had diet counselling by qualified dietitians according to local standards throughout the trials. As part of this co-intervention strategy, recalculation of the recommended energy intake with no kcal deficit was permitted, if a patient was unable to lose additional weight despite having a BMI of 25 kg/m2 or more after 28 weeks. However, no data were provided to independently verify if this recalculation of energy intake occurred in a way that could lead to bias in the reported results. Considering the importance of diet and physical activity to inducing and maintaining weight loss, it is likely that any significant imbalance in the adjustment may have impacted the outcomes.
Statistical Analyses
Appropriateness of Statistical Tests: ANCOVA and logistic regression methods were appropriately applied to analyze continuous and categorical data, respectively, in all the included studies. The comparisons between liraglutide 3 mg and placebo with respect to the co-primary end points were tested in a hierarchical manner, which appropriately controlled the type I error rate. The statistical testing procedure defining the superiority of liraglutide 3 mg to placebo was clearly described for each co-primary end point in all the included studies. The primary end point (time to new onset of T2DM at week 160) of the Study 1839 extension phase was analyzed using the Weibull model, an appropriate approach for modelling time-to-event data with interval censoring compared to a conventional Cox proportional hazards model, which requires that the exact time of an event be known. The Weibull model does assume proportional hazards with a specific structure of the underlying hazards in the population that conforms to Weibull distribution. Thus, there is an added risk with the Weibull model if the underlying hazards do not conform with the assumed structure of the Weibull model. However, the analysis of the onset to T2DM did not provide any assessment of goodness of fit of the Weibull model to the data; therefore, the level of concern for bias in the results due to Weibull model assumptions is unknown. A sensitivity analysis performed with the Cox model to support the main analysis reported a hazard ratio similar to that reported from the Weibull model. However, no alternative models were explored to assess the sensitivity of the findings to model selection.
It must be noted that the results of all secondary outcomes were not adjusted for multiplicity and must be interpreted with caution due to risk of increased type I error.
Analysis Set: All the included studies analyzed primary efficacy outcomes data using the FAS. In Study 1839, Study 1922, and Study 1923, the FAS included all randomized patients exposed to at least 1 dose of the trial product and with at least 1 post-baseline measurement of the following end points. Thus, the classification of the FAS agrees with FDA draft guidance on studies in weight management products. In Study 3970, the FAS included all randomized patients, and patients were analyzed as randomized. Thus, by definition, the FAS in this study appeared to be consistent with an intention-to-treat (ITT) population. However, in the study, patients without post-baseline observation were not included in the primary analysis. ANCOVA and logistic regression methods were appropriately applied to analyze continuous and categorical data, respectively, in all the included studies.
Treatment Discontinuation: Discontinuation rates were high across study groups in all the included studies. For Study 1839, Study 1922, and Study 1923, the percentage of patients who discontinued treatment prematurely was consistently larger with placebo than with liraglutide 3 mg. Discontinuation rates for the main phase of Study 1839 and for Study 1922 and Study 1923 ranged from 23% to 28% for the liraglutide 3 mg group compared with 30% to 36% for the placebo group. Even higher percentages were recorded for the extension phase of Study 1839 with 47% and 55% of study discontinuation in the liraglutide and placebo groups, respectively. On the other hand, the proportion of patients that discontinued treatment in Study 3970 was larger with liraglutide than with placebo (26% versus 21%, respectively). The high rate of discontinuations and the imbalance in their incidences across study groups may have disrupted the randomization effect that protects against biases.
Data Imputation: Missing data were imputed using the LOCF method. The overall high proportion of patients who discontinued treatment with slightly higher rates among the placebo group implies that LOCF imputation was likely to overestimate the amount of weight loss in both the placebo and liraglutide 3 mg groups, since patients who discontinued would likely regain weight after exiting the study. However, the overall impact on the relative difference in weight loss between the groups is unclear. In addition, the use of LOCF would lead to the underestimation of the variation of the effect due to the single imputation approach, which could lead to anticonservative bias for drawing conclusions for differences between the groups. However, the results of several pre-specified sensitivity analyses that included employing alternative missing data approaches, including the use of multiple imputations, were consistent with that of the primary analyses. Thus, these results were supportive of the robustness of evidence from bias due to the approach to missing data. Despite this evidence, the overall impact of missing data on the results and conclusions of the study remains uncertain.
Control for Multiplicity: Study 1839, Study 1922, and Study 1923 each had 3 co-primary end points. For each of these studies, the comparisons of liraglutide 3 mg to placebo for each of the primary end points were performed in a hierarchical manner in a pre-specified order, which is an effective alpha control strategy to reduce the risk of type I error inflation. Specifically, for Study 1839, the testing structure included the 3 primary end points from the main phase of the study (i.e., the percentage change in body weight at week 56 from baseline, the proportion of patients losing ≥ 5% at week 56 from baseline body weight, and the proportion of patients losing > 10% at week 56 from baseline body weight) as well as the time to onset of T2DM end point from the extension phase through week 160. Control for multiplicity was not applied to secondary outcomes or subgroup analysis. Thus, it is important to note that in the extension phase of Study 1839, the week 160 results concerning the percentage change in body weight from baseline, the proportion of patients losing 5% or more of baseline body weight, and the proportion of patients losing more than 10% of baseline body weight must be interpreted cautiously to avoid increased risk of type I error. The observation concerning weight-related outcomes in the extension phase of Study 1839 is relevant supportive data, given that the requested reimbursement includes chronic weight management in patients with prediabetes, and it was the only study in that population.
Subgroups Analyses and Sensitivity Analyses: Each of the included studies conducted subgroup analyses and several sensitivity analyses to support the evidence from the main analyses. They were all pre-specified. In Study 1839, Study 1922, and Study 1923, subgroups were focused on stratification variables, which further assures balance across groups due to randomization. Although subgroups were pre-specified in the statistical analysis plan for Study 3970, it was unclear if randomization was stratified on these subgroups. Subgroups specified in the protocol for this systematic review are diabetes status (e.g., prediabetes, T2DM), baseline BMI (e.g., BMI ≥ 30 kg/m2 versus 27 kg/m2 to less than 30kg/m2), the number and/or type of weight-related comorbidities, patients with or without previous bariatric surgery, and ethnicity. Of these, BMI outcomes were reported for all the included studies, whereas prediabetes was considered a subgroup in the main phase of Study 1839. The other subgroups listed in the review protocol were not investigated as subgroups in any of the studies. However, Study 1922 enrolled only patients who had been diagnosed with diabetes. The CI reported for outcomes of the subgroup of interest appeared sufficiently narrow — consequently not raising concerns about imprecision. However, subgroup analyses were not adjusted for multiplicity and must be interpreted with caution due to risk of increased type I error.
External Validity
Population
The clinical expert consulted for this review noted that overall, the patients who participated in the included studies reflected patients with diabetes in Canada. However, the clinical expert observed that the exclusion criteria denied entry to some patients, such as those on medication that causes weight gain and those regaining weight after a previous bariatric surgery, who would be considered clinically relevant patients who may require pharmacotherapy for chronic weight management. Also, the study populations in all the trials were predominantly White, with percentages ranging from 72% to 88%, and most of the patients (> 85%) were within the BMI brackets of at least 30 kg/m2, suggesting that patients of other racial origins and patients who were overweight but not living with obesity may be underrepresented. In Study 1923, only patients who achieved a loss of at least 5% of their body weight at screening on a low-calorie diet during a run-in period of up to 12 weeks qualified to be randomized. Thus, the study population was enriched with responders to the co-intervention, which could exaggerate the outcomes. Also, given that the patients were responders to diet, they do not meet the requirements for the indication of liraglutide 3 mg for use in patients who had failed a previous weight management intervention.
Intervention and Comparators
In all the included studies, liraglutide 3 mg was administered in a manner that aligned with the Health Canada–approved dosing, and the drug was titrated to effect as indicated in the product monograph. According to the clinical expert consulted on this review, the co-interventions comprising low-calorie diet and counselling on diet and physical activity were reasonable. However, while primary care physicians advise on lifestyle changes to promote weight management, they may not follow the same structure and intensity of changes as those used in the studies. All the studies were placebo controlled, with no direct comparison with any drug with similar indication approved in Canada. Thus, information on comparative effectiveness with other drugs of similar place in therapy was lacking.
Outcome
Three of the 4 included trials (Study 1839, Study 1922, and Study 1923) had co-primary outcomes related to weight loss, such as percentage change in body weight from baseline, the proportion of patients losing 5% or more of baseline body weight, the proportion of patients losing more than 10% of baseline body weight, and the percentage of patients maintaining run-in weight loss after 56 weeks of treatment. The clinical expert consulted for this review noted that these end points are required by regulatory agencies for licensing and it is widely accepted that these outcomes may translate into reduction in weight-related comorbidities, but that improvements in weight and BMI are, in themselves, less clinically meaningful. According to the clinical expert consulted by CADTH, end points about improvement in weight-related comorbidities, including type 2 diabetes, prediabetes, hypertension, dyslipidemia, and OSA, as well as the prevention of the progression of preclinical conditions such as reduced progression for prediabetes to diabetes and prehypertension to hypertension, would be more clinically meaningful responses to weight-loss treatment. It should be noted that the extension phase of the pivotal study assessed time to onset of T2DM in patients with prediabetes as the primary outcome and Study 3970 evaluated change from baseline in AHI (events per hour) after 32 weeks as a measure of OSA severity. Although changes from baseline in hypertension and parameters linked to weight-related comorbidities such as lipid profile, glycemic control, and HRQoL were outcomes in the included studies, they were investigated as secondary outcomes that were not controlled for multiplicity and cannot support firm conclusions about these end points.
Indirect Evidence
Objectives and Methods for the Summary of Indirect Evidence
In the absence of any head-to-head studies that meet this systematic review’s protocol criteria and directly compared liraglutide 3 mg with any of the relevant active comparators, a targeted literature search was conducted for indirect evidence with respect to the comparative efficacy and safety of liraglutide. Two reviewers independently screened the results of the literature search for relevant studies and resolved disagreements through discussions. Two potentially relevant published NMAs16,38 were identified; however, 1 NMA38 was excluded due to the lack of relevant outcomes.
Description of the Indirect Comparison
One relevant NMA by Khera et al.16 that was published in 2016 was included in the review. The NMA compared weight loss and adverse effects between 5 FDA-approved weight-loss drugs (liraglutide 3 mg, orlistat, NB, lorcaserin, and PT) for long-term use in patients living with obesity (BMI of 30 kg/m2 or more) or overweight (BMI of 27 kg/m2 or more) with at least 1 weight-related comorbidity.
Methods of the Indirect Comparison
Study Selection Methods
The protocol for the systematic review was pre-specified and registered online. The inclusion criteria included RCTs comparing 1 of the 5 FDA-approved drugs with placebo or with another FDA-approved drug in patients living with obesity or overweight and at least 1 weight-related comorbidity. Also, eligible studies must have used the most effective recommended dosage of the drug for at least 1 year and reported outcomes on differences in mean weight loss between treatment groups or the proportion of patients achieving at least 5% weight loss. If a study investigated different dosages of a drug, only the treatment group with the most effective FDA-approved dosage was included. RCTs comparing individual components of NB or PT and RCTs in special populations (e.g., patients with nonalcoholic fatty liver disease or polycystic ovary syndrome) were excluded.
For the NMA, multiple databases (Ovid MEDLINE, Embase, Scopus, Web of Science, and the Cochrane Central Register of Controlled Trials) were searched from their inception to March 23, 2016. Clinical trial registries, conference proceedings, and published systematic reviews were also searched. Study screening and data extraction were performed independently by 2 reviewers, with the involvement of a third reviewer to resolve conflicts by consensus. Data pertaining to primary study characteristics, baseline patient characteristics, treatment characteristics, co-interventions, efficacy end points, and adverse effects was extracted. Baseline patient characteristics were reported for the enrolled population and efficacy data were reported for the modified ITT population (patients who received at least 1 dose of the study drug and had at least 1 post-baseline weight assessment), with missing values imputed using the LOCF approach.
The Cochrane Risk of Bias tool was used to assess study quality in the primary RCTs, though it was not clear whether that was performed in duplicate. Risk of bias was assessed for the primary efficacy outcome alone. The GRADE method17 was used to evaluate the quality of evidence in the NMA, and quality ratings of high, moderate, low, or very low were assigned. The assessments were performed in a stepwise manner in the order of direct comparisons, indirect comparisons, and combination of direct and indirect estimates for each pairwise comparison. There were no plans to exclude studies based on quality.
Indirect Treatment Comparison Analysis Methods
Random-effects Bayesian NMAs with Markov chain Monte Carlo methods were used according to the methods described by Dias et al. (2013).39 The dichotomous outcomes (proportion of patients with 5% or more weight loss and 10% or more weight loss, and rate of discontinuation from AE) were entered into the model as log-odds ratios for each comparison, and a binomial likelihood and a logit link function were used. In analyses involving the 3-arm RCT comparing orlistat, liraglutide, and placebo, between-arm correlations were adjusted for by using a conditional univariate distribution. The continuous outcome (mean weight loss in excess of placebo) was entered into the model as a mean difference and standard error for each comparison, and a normal likelihood and an identity link function were used. Random effects were modelled for both types of outcomes by assuming a single heterogeneity value per pairwise comparison. A summary of the analysis methods used for the NMA is provided in Table 56.
Publication bias was assessed by examining the funnel plot and using the Egger regression test. However, clinical heterogeneity was not assessed among RCTs for the different direct or pairwise comparisons.
Table 56: Indirect Treatment Comparison Analysis Methods
Characteristic | Khera et al. (2016) |
|---|---|
ITC methods | Random-effects Bayesian network meta-analysis using Markov chain Monte Carlo methods (100,000 iterations following a burn-in of 10,000 iterations) Post hoc sensitivity analysis: Frequentist approach that did not assume consistency between direct and indirect estimates and included a trial design covariate to distinguish between the 2 types of estimate |
Priors | Non-informative priors Post hoc sensitivity analyses: Vague priors (uniform, normal, and gamma distributions) with different means and variances |
Assessment of model fit | Total residual deviance |
Assessment of consistency | Node-splitting method in the closed loop formed by placebo, orlistat, and liraglutide |
Assessment of convergence | Trace plots, Monte Carlo error, and the Brooks Gelman-Rubin statistic |
Outcomes | Primary: Proportion of patients with at least 5% weight loss relative to baseline weight Other: Proportion of patients with at least 10% weight loss relative to baseline weight, change in weight in kilograms relative to baseline weight in excess of placebo, rate of discontinuation of treatment due to adverse event |
Follow-up time points | 52 weeks (± 4 weeks) |
Construction of nodes | Each node represents a single drug. For each drug, only the results for the treatment group with the most effective FDA-approved dosage are included. |
Pre-planned sensitivity analyses |
|
Additional post hoc sensitivity analyses |
|
Methods for pairwise meta-analysis | Random-effects direct meta-analysis |
ITC = indirect treatment comparison; RCT = randomized controlled trial.
Source: Khera et al. (2016).16
Results of the Indirect Comparison
Summary of Included Studies
A total of 28 relevant RCTs were included. There were 16 RCTs of orlistat versus placebo, 2 RCTs of liraglutide versus placebo, 4 RCTs of NB versus placebo, 3 RCTs of lorcaserin versus placebo, 2 RCTs of PT versus placebo, and 1 3-armed RCT comparing orlistat and liraglutide with placebo.
Figure 2: Evidence Network for the Primary Efficacy Outcome
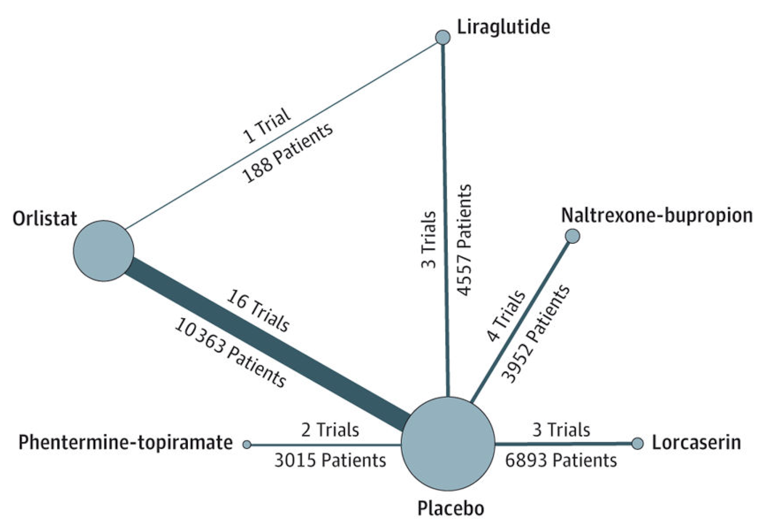
Note: The size of the nodes and the thickness of the edges are weighted according to the number of studies evaluating each treatment and direct comparison, respectively.16
Source: “Association of pharmacological treatments for obesity with weight loss and adverse events: a systematic review and meta-analysis.” JAMA. Reproduced with permission from JAMA. Copyright© 2016 American Medical Association. All rights reserved.16
Patient Populations
The mean weight of the study populations was similar among the RCTs (95.3 kg to 115.8 kg). However, there was notable variation in mean age (ranging from 40 years to 60 years) and the proportion of female patients (45% to 92%). The presence of diabetes, hypertension, and dyslipidemia at baseline also varied among the primary RCTs. Of the 28 RCTs, 8 were in diabetic populations being treated with pharmacologic therapy and 16 were in patients without diabetes or with diet-controlled diabetes. Diabetes status was not reported in 4 RCTs. The proportion of patients with hypertension at baseline ranged from 2% to 100% in 13 RCTs and was not reported in 15 RCTs. The proportion of patients with dyslipidemia at baseline ranged from 2% to 84% in 15 RCTs and was not reported in 13 RCTs.
Interventions
Liraglutide 3 mg was administered at the recommended dose of 3 mg by subcutaneous injection once daily. The dosages of the study medications were as follows: orlistat, 120 mg 3 times a day; NB, 16 mg naltrexone hydrochloride plus 180 mg bupropion hydrochloride twice daily; lorcaserin, 10 mg twice daily; and PT, 15 mg phentermine plus 92 mg topiramate daily. Data were extracted for the first 52 weeks or 56 weeks of treatment. A variety of dietary and physical activity co-interventions was administered in the RCTs and are described in Table 57.
Comparators
The relevant comparator was orlistat at the Health Canada–approved dosages. It should be noted that of the 5 drugs investigated in the NMA, only liraglutide 3 mg, NB, and orlistat are approved to be used as adjunct to a reduced-calorie diet and increased physical activity for chronic weight management in Canada. Non-pharmacologic comparators were not included in the study; therefore, there were no indirect comparisons available for liraglutide 3 mg versus bariatric surgery or IBT.
Outcomes
The proportion of patients with at least 5% weight loss from baseline at 1 year was the primary efficacy outcome of the NMA. Other efficacy outcomes assessed were the proportion of patients with at least 10% weight loss and the change in weight in kilograms relative to baseline weight in excess of placebo after 1 year of follow-up. Efficacy outcomes concerning weight-related comorbidities or HRQoL were not included in the NMA. The only harms outcome assessed was the proportion of patients discontinuing treatment due to AEs. Overall AEs and SAEs were not evaluated.
Quality Assessment
According to the authors, the quality of the RCTs included in the NMA were at high risk of bias due to attrition rates ranging from 30% to 45%. There was a high risk of bias in random sequence generation for 1 RCT and in allocation concealment and blinding of outcome assessment for another RCT. The risk of bias in random sequence generation was described as unclear for several RCTs. The quality of evidence for the primary outcome, as assessed by GRADE, was rated as low for 3 comparisons, and moderate for all others.
Homogeneity Assessment
Assessment of clinical homogeneity among the RCTs was not described in the NMA and measures of heterogeneity for each direct comparison were not provided. The results of the CADTH review team’s assessment of clinical homogeneity are provided in Table 57.
Table 57: Assessment of Homogeneity
Characteristics | Description and handling of potential effect modifiers |
|---|---|
Diabetes status at baseline | 8 RCTs were in diabetic populations being treated with pharmacologic therapy and 16 RCTs featured patients without diabetes or with diet-controlled diabetes. Handling: A pre-planned sensitivity analysis was performed in RCTs with patients without diabetes only. |
Age at baseline | Mean age at baseline ranged from 40 years to 60 years. |
Sex | The proportion of female patients ranged from 45% to 92%. |
Dietary co-intervention |
|
Physical activity co-intervention |
Handling: A post hoc sensitivity analysis was performed that excluded the COR-BMOD study. |
Analysis population | In 21 surveyed RCTs, efficacy results were reported for:
|
Run-in phase | In 21 surveyed RCTs:
|
Titration phase | In 21 surveyed RCTs:
|
End-of-visit assessment for patients who discontinued | Most or all of the orlistat RCTs did not perform end-of-study assessments in patients who discontinued treatment early. Most of the non-orlistat RCTs encouraged patients who discontinued treatment early to continue with study assessments or return for the end-of-study assessment. Study discontinuation rates ranged from 30% to 45%. |
ITT = intention-to-treat; mITT = modified intention-to-treat; NB = naltrexone hydrochloride and bupropion hydrochloride; PT = phentermine-topiramate; RCT = randomized controlled trial.
Sources: Khera et al. (2016)16 and 26 publications for surveyed RCTs.
Evidence Network
The evidence network for the primary efficacy outcome (the proportion of patients with 5% or more weight loss) is provided in Figure 2. It was identical to the evidence network for discontinuation of treatment due to AEs. The RCT comparing liraglutide 3 mg, orlistat, and placebo contributed to 3 different direct comparisons in the evidence network. The evidence network for the other efficacy outcomes (the proportion of patients with 10% or more weight loss and mean change in weight in excess of placebo) were similar. However, they each had 14 trials instead of 16 trials informing the comparison between orlistat and placebo.
Efficacy Results
The results of the direct meta-analyses with both the DerSimonian and Laird41 and the Hartung-Knapp methods42 aligned with the results of the NMA for the efficacy outcomes of comparisons between liraglutide 3 mg and orlistat. According to the authors, a significant heterogeneity was present for direct comparisons.
Achieving 5% or More Weight Loss
The results of a direct meta-analysis of data from 3 studies (N = 4,563) showed that patients treated with liraglutide 3 mg had greater odds of achieving at least 5% weight loss compared with orlistat, as indicated by an OR of 3.66 (95% CrI, 1.79 to 7.46). The NMA also found that treatment with liraglutide 3 mg increases the odds of a patient losing at least 5% of body weight compared with orlistat (OR = 2.06; 95% CrI,1.51 to 2.96).
Achieving 10% or More Weight Loss
The results of a direct meta-analysis of data from 3 studies (N = 4,563) showed that patients treated with liraglutide 3 mg had greater odds of achieving at least 10% weight loss compared with orlistat, as indicated by OR of 3.87 (95% CrI, 1.65 to 9.04). The results of the NMA comparison between liraglutide and orlistat was consistent with this finding, with an OR of 2.07 (95% CrI, 1.48 to 3.20) in favour of liraglutide 3 mg.
Mean Weight Loss in Excess of Placebo
Treatment with liraglutide 3 mg resulted in greater incremental weight loss (in kg) over placebo compared with orlistat as indicated by results of both the direct meta-analysis (weighted mean difference = –3.99; 95% CrI, –5.18 to –2.62) and the NMA (weighted mean difference = –2.68; 95% CrI, –3.35 to –1.83).
Discontinuation of Therapy Due to Adverse Events
The direct meta-analysis found no difference between liraglutide 3 mg and orlistat regarding discontinuation of therapy due to AEs (weighted mean difference = 3.50; 95% CrI, 0.70 to 17.49). However, findings from the NMA indicate that treatment discontinuation due to AEs occurs more with liraglutide 3 mg than with orlistat (weighted mean difference = 1.6; 95% CrI, 1.10 to 2.40).
Table 58: Summary of Results From Meta-Analyses — Khera et al. (2016)
Comparisons | Outcome | Mean weight loss relative to placebo | ≥ 5% weight loss | ≥ 10% weight loss | Discontinuation due to AEs |
|---|---|---|---|---|---|
Direct meta-analysis results | |||||
LIRA 3 mg vs. orlistat | Weighted mean difference (95% CrI) | –3.90 (–5.18 to −2.62) | NA | 3.50 (0.70 to 17.49) | |
OR (95% CrI) | NA | 3.66 (1.79 to 7.46) | 3.87 (1.65 to 9.04) | NA | |
Network meta-analysis results | |||||
LIRA 3 mg vs. orlistat | Weighted mean difference (95% CrI) | –2.68 (–3.35 to –1.83) | NA | 1.6 (1.10 to 2.40) | |
OR (95% CrI) | NA | 2.06 (1.51 to 2.96) | 2.07 (1.48 to 3.20) | NA | |
AE = adverse event; CrI = credible interval; LIRA = liraglutide; NA = not applicable; OR = odds ratio; vs. = versus.
Consistency Between Direct and Indirect Comparisons
No significant differences between the direct and indirect estimates in the closed loop formed by placebo, orlistat, and liraglutide were found for any of the outcomes.
Critical Appraisal of the Indirect Comparison
Overall, the systematic review methods were appropriate for identifying relevant studies, extracting data, and assessing study quality. The evidence network contained all relevant drug comparators identified in CADTH’s systematic review protocol. With regard to the meta-analyses, the statistical methods and sensitivity analyses were appropriate and well reported.
The following limitations were identified in the NMA:
There were variations in the dietary component of the co-intervention between orlistat and liraglutide that may have contributed to the statistical heterogeneity and distorted the outcomes.
A closed loop could be formed by orlistat, liraglutide, and placebo. Therefore, consistency throughout the network could not be assessed. Also, the portion of the loop connecting orlistat and liraglutide 3 mg was contributed by a single phase II RCT18 with 4 different liraglutide doses, including liraglutide 3 mg once daily, in which the placebo-controlled portion was double-blind whereas the orlistat comparator was open label. Thus, there is a low-quality issue that limits the evidence.
A run-in placebo treatment phase was more common in the orlistat versus placebo RCTs than in the RCTs of other comparators versus placebo. As a run-in phase may enrich the trial population with patients more likely to adhere to treatment, there may have been a bias in the results for any of the outcomes in favour of orlistat relative to the other comparators.
The encouragement of patients to continue with study assessment or return for the end-of-study assessment following treatment discontinuation was more common in the non-orlistat RCTs than in the orlistat RCTs. The potential direction of bias from this source of heterogeneity is unclear.
Summary
One relevant indirect treatment comparison, an NMA by Khera et al. published in 2016,16 was identified in the literature search. The NMA compared weight-loss outcomes and discontinuations due to AE between weight-loss drugs approved by the FDA for long-term use in patients living with obesity or overweight with at least 1 weight-related comorbidity. The evidence network contained liraglutide 3 mg and orlistat, which is the only relevant comparator in the protocol for this systematic review. Patients in all the included primary RCTs received dietary and physical activity co-interventions.
The paper presented both direct meta-analysis and NMA results for comparisons of liraglutide 3 mg with orlistat. For efficacy outcomes regarding achieving 5% or more weight loss or 10% or more weight loss and the relative incremental weight loss over placebo, both the direct meta-analysis and NMA were in alignment, indicating greater improvements with liraglutide 3 mg than with orlistat.
Regarding discontinuation of treatment due to AEs, the results from the direct meta-analysis and the NMA were not consistent. While the direct meta-analysis indicated no difference in this outcome between the 2 drugs, the NMA results indicated that treatment with liraglutide 3 mg was associated with a higher incidence of therapy discontinuation due to AEs.
Overall, the confidence in the indirect evidence is limited by high attrition rates (30% to 45%) across all the included primary studies, heterogeneity in study design elements, baseline characteristics, and analysis populations that may have undermined the assumption of similarity between the various pairwise comparisons.
Other Relevant Evidence
This section includes additional relevant studies included in the sponsor’s submission to CADTH and identified through the literature search completed by CADTH that were considered to address important gaps in the evidence included in the systematic review. Specifically, Study 4274 and Study NCT02911818 were comparative RCTs evaluating liraglutide 3 mg with intensive lifestyle intervention.
Study 4274
Study 4274 was a prospective double-blind, placebo-controlled, phase IIIb, randomized trial to evaluate the health benefits of combining IBT with liraglutide 3 mg in adult patients living with obesity without diabetes.43 Details of the trial characteristics are provided in Table 59.
Table 59: Details of Study 4274
Study details | Study 4274 |
|---|---|
Designs and populations | A 56-week RCT in patients with obesity without diabetes |
Study design | DB, placebo-controlled, multi-centre, phase IIIb RCT |
Locations | 17 sites in the US |
Trial initiation date | February 6, 2017 |
Randomized (N) | 282 |
Inclusion criteria |
|
Exclusion criteria |
|
Drugs | |
Intervention | Liraglutide 3 mg administered once daily as subcutaneous injection for 56 weeks |
Comparator(s) | Matched placebo in appearance and frequency of dosing for 56 weeks |
Duration | |
Phase | |
Run-in | 1 week screening |
Double-blind | 56 weeks (including a dose escalation period of 4 weeks) |
Follow-up | 30-day observational follow-up |
Outcomes | |
Primary end point | Co-primary end points at week 56:
|
Secondary and exploratory end points | Proportion of subjects losing ≥ 4% of baseline body weight at week 16 Changes from baseline to week 56 in:
|
Notes | |
Publications | Wadden et al. (2020)44 |
BMI = body mass index; CT = clinical trial; DB = double-blind; DBP = diastolic blood pressure; FPG = fasting plasma glucose; IWQOL-Lite = Impact of Weight on Quality of Life-Lite; RCT = randomized controlled trial; SBP = systolic blood pressure; SF-36 = Short Form (36) Health Survey; TSH = thyroid-stimulating hormone.
Source: Clinical Study Report for Study 4274.43
Methods
Eligible patients (N = 282) were randomized in a 1:1 ratio to once-daily treatment with liraglutide 3 mg or placebo as an adjunct to CMS-IBT. During the first 4 weeks after randomization, participants underwent dose escalation in weekly increments of 0.6 mg (or the equivalent volume of placebo) until they reached 3 mg daily.
The co-primary efficacy measures were the change in body weight (%) from baseline to week 56 and the proportion of patients losing at least 5% of baseline body weight at week 56. Key secondary measures were change from baseline to week 56 in:
the proportion of patients losing more than 10% of baseline body weight
the proportion of patients losing more than 15% of baseline body weight
change in SF-36 (version 2.0) acute physical functioning score
change in IWQOL-Lite for clinical trial, physical function domain (5-item) score
Populations
A detailed summary of inclusion and exclusion criteria for Study 4274 appears in Table 60. Briefly, patients were deemed eligible if they met the following criteria: were an adult of 18 years or older, had a BMI of 30 kg/m2 or more, had maximum 5 kg self-reported weight change in the 90 days following screening, and if increased physical activity was considered safe as deemed by the investigator. Key exclusion criteria included the following: hemoglobin A1C 6.5% or higher at screening, or type 1 or type 2 diabetes, a recent history of CV disease, severe congestive heart failure, or second degree or greater heart block.
A total of 282 patients were enrolled in Study 4274. Overall, baseline characteristics were well balanced between the 2 treatment groups. In total, 235 patients (83.3%) were women and 47 patients (16.7%) were men with a mean age of 47.2, plus or minus 11.5 years, and a BMI of 39.0 kg/m2, plus or minus 7.0 kg/m2. Furthermore, 88.3% of patients self-identified as not Hispanic or Latino and 11.7% identified as Hispanic or Latino. Overall, 80.5% of participants self-reported as White, 17.5% self-identified as Black or African American, 1.8% self-identified as Asian, and 0.4% self-identified as Native Hawaiian or other Pacific Islanders. Approximately 1-third of patients were being treated with antihypertensive medication. Prediabetes status and history of CV disease was not reported. The baseline characteristics of the participants are summarized in Table 60.
Table 60: Summary of Baseline Characteristics in Study 4274
Characteristic | Study 4274 | |
|---|---|---|
LIRA 3 mg N = 142 | Placebo N = 140 | |
Age (years), mean (SD) | 45.4 (11.61) | 49.0 (11.2) |
Female, n (%) | 119 (83.8) | 116 (82.9) |
Male, n (%) | 23 (16.2) | 24 (17.1) |
Height (m), mean (SD) | 1.66 (0.09) | 1.66 (0.09) |
Body weight (kg), mean (SD) | 108.5 (22.1) | 106.7 (22.0) |
BMI (kg/m2), mean (SD) | 39.3 (6.8) | 38.7 (7.2) |
BMI category, n (%) | ||
30.0–34.9 | 38 (26.8) | 51 (36.4) |
35.0–39.9 | 46 (32.4) | 46 (32.9) |
≥ 40 | 58 (40.8) | 43 (30.7) |
Race, n (%) | ||
White | 112 (78.9) | 115 (82.1) |
Black | 27 (19.0) | 22 (15.7) |
Asian | 2 (1.4) | 3 (2.1) |
American Indian or Alaska Native | 0 (0.0) | 0 (0.0) |
Native Hawaiian or Pacific Islander | 1 (0.7) | 0 (0.0) |
Not applicable | NR | NR |
Other | 0 (0.0) | 0 (0.0) |
Smoker status, n (%) | ||
Current smoker | 14 (9.9) | 7 (5.0) |
Never smoked | 96 (67.6) | 102 (72.9) |
Previous smoker | 32 (22.5) | 31 (22.1) |
Glycemic control | ||
Hemoglobin A1C (%), mean (SD) | 5.5 (0.4) | 5.5 (0.4) |
FPG (mmol/L), mean (SD) | 5.4 (0.5) | 5.4 (0.6) |
Duration of diabetes (years), mean (SD) | NR | NR |
History of gallbladder disease, n (%) | ||
Yes | 10 (7.0) | 19 (3.6) |
Cardiometabolic markers, n (%) | ||
Dyslipidemia | 3 (2.1) | 3 (2.1) |
Hypertension | 56 (39.4) | 52 (37.1) |
Dyslipidemia and hypertension | NR | NR |
Concomitant medication at baseline, n (%) | ||
Antihypertensive drugs | 754 (30.9) | 404 (33.0) |
Lipid-lowering agents | 386 (15.8) | 183 (14.9) |
Oral antidiabetic drugs | 1 (0.0) | NR |
BMI = body mass index; FPG = fasting plasma glucose; LIRA = liraglutide; NR = not reported; SD = standard deviation.
Source: Clinical Study Report for Study 4274.43
Interventions
Participants were randomized 1:1 to receive once-daily liraglutide 3 mg or matched placebo in conjunction with CMS-IBT.
Participants in the liraglutide 3 mg group received subcutaneous liraglutide initially at a dosage of 0.6 mg per day, increased by 0.6 mg per day until 3 mg per day was achieved. Participants in the placebo group received an equivalent volume of placebo. If a patient could not tolerate the dose escalation, the investigator could delay dose escalation by 1 week only once, allowing the dose escalation phase to extend to 5 weeks if needed. Both groups received the same 23 sessions of IBT, each lasting 15 minutes, throughout the 56-week treatment period. Participants were prescribed a diet of 1,200 kcal/day to 1,800 kcal/day, determined based on body weight at randomization, which comprised approximately 15% to 20% kcal from protein, 20% to 35% kcal from fat, and the remainder from carbohydrate. Participants were also prescribed to engage in 100 minutes of physical activity spread out over the week in bouts of more than 10 minutes of duration. The participants were to gradually build their physical activity by 25 minutes every 4 weeks until 250 minutes per week was achieved.
Outcomes
The co-primary end points were change in body weight (%) from baseline and the proportion of patients losing at least 5% of baseline body weight at week 56. Other outcomes assessed of interest to this review were the proportion of patients losing more than 10% of baseline body weight at week 56; the proportion of patients losing more than 15% of baseline body weight at week 56; waist circumference; blood pressure; fasting glucose, hemoglobin A1C, and lipids; and SF-36 physical functioning score, and IWQOL-Lite for clinical trial, physical function domain score. A detailed description of outcomes is provided in the Outcomes section of the Systematic Review section and in Appendix 4.
Statistical Analysis
Study 4274 reported results for 2 different target estimands referred to as the treatment policy estimand and the hypothetical estimand. The main difference between these estimands is in how the analysis treats intercurrent events for which the study only considered premature discontinuation of trial product as an intercurrent event. For the treatment policy estimand, intercurrent events do not influence data used in the analysis (i.e., data observed for patients after discontinuing the trial product are included in the analysis). In contrast, for the hypothetical estimand, the analysis only includes data while a patient is on the trial product (i.e., the analysis excluded data from patients after a discontinuation of the trial product). The study pre-specified the treatment policy estimand as the primary estimand for the study. This is also the preferred estimand for this review since it is the estimand that is consistent with the ITT principle. Thus, all results presented in this review were for estimating the treatment policy estimand.
The efficacy outcomes were assessed using the FAS, which incorporated all randomized patients, following the ITT principle. The safety outcomes were assessed using the SAS, which incorporated all randomized patients exposed to at least 1 dose of the trial drug. Any individual who discontinued the trial product could restart their assigned treatment to prevent missing data, with the time spent off the trial drugs included in the analyses.
Change in body weight (%) was analyzed using ANCOVA, and the proportion of patients losing at least 5% of baseline body weight was analyzed using a logistic regression model. To account for missing data at week 56, a jump to a reference approach was used for both groups, with the assumption that any patient who discontinued liraglutide would lose any effect of randomized treatment beyond what could be expected in the placebo group. Sensitivity analyses for the primary end points included a multiple imputation approach, a weighted ANCOVA, a single imputation approach, and a tipping point analysis. For the continuous secondary end points, ANCOVA was used. Binary secondary end points were assessed using a logistic regression model. The authors controlled for the type I error rate by using a hierarchical testing procedure to test each end point in a pre-specified order as detailed in Table 61.
The co-primary end points were tested in a hierarchical manner in the order presented in Table 61.
Table 61: Statistical Analysis of Efficacy End Points in Study 4274
End point in hierarchical testing order | End point type | Statistical model | Adjustment factors | Missing data approach | Sensitivity analyses | Analysis set |
|---|---|---|---|---|---|---|
Co-primary end points | ||||||
Change (%) in fasting body weight from baseline (week 0) to week 56 | Continuous | ANCOVA model | Fixed factors
Covariate
| Jump to reference |
| FAS |
Proportion of patients losing ≥ 5% of baseline fasting body weight at week 56 (5% responders) | Binary | Logistic regression | NR | Jump to reference |
| FAS |
Secondary end points | ||||||
Proportion of patients losing > 10% of baseline fasting body weight at week 56 (10% responders) | Binary | Logistic regression | NR | Jump to reference |
| FAS |
Proportion of patients losing > 15% of baseline fasting body weight at week 56 (15% responders) | Binary | Logistic regression | NR | Jump to reference |
| FAS |
Proportion of patients losing ≥ 4% of baseline fasting body weight at week 16 | Binary | Logistic regression | NR | Not needed, as subjects with missing body weight values at week 16 were considered nonresponders | ||
Change from baseline to week 56 in waist circumference (cm) | Continuous | ANCOVA | Fixed factors
Covariate
| Jump to reference |
| FAS |
Change from baseline to week 56 in SF-36 (version 2.0) acute, physical functioning score | Continuous | ANCOVA | Fixed factors
Covariate
| Jump to reference |
| FAS |
Change from baseline to week 56 in IWQOL-Lite for CT, physical function domain (5-item) score | Continuous | ANCOVA | Fixed factors
Covariate
| Jump to reference |
| FAS |
ANCOVA = analysis of covariance, BMI = body mass index; CT = clinical trial; FAS = full analysis set; IWQOL-Lite = Impact of Weight on Quality of Life-Lite; NR = not reported; SF-36 = Short Form (36) Health Survey; wANCOVA = weighted analysis of covariance.
Source: Clinical Study Report for Study 4274.43
Patient Disposition
A total of 282 patients were randomized in Study 4274; of these, 142 were randomized to the liraglutide 3 mg group and 140 were randomized to the placebo group. In the liraglutide group, 80.3% and 73.6% of patients completed treatment and the end-of-treatment visit in the liraglutide and placebo groups, respectively. More patients in the placebo group discontinued treatment than in the liraglutide 3 mg group (26.4% and 19.7%, respectively), but more patients in the liraglutide 3 mg group discontinued treatment due to AEs than in the placebo group (8.5% and 4.3%, respectively). More patients withdrew from the study in the placebo group than in the liraglutide 3 mg group (7.1% and 0.7%, respectively). A summary can be found in Table 62.
Table 62: Patient Disposition — Study 4274
Description | Study 4274 | |
|---|---|---|
Details | LIRA 3 mg | Placebo |
Screened, N | 328 | |
Randomized, N (%) | 142 (100.0) | 140 (100.0) |
Completed week 56 visit, N (%) | 114 (80.3) | 103 (73.6) |
Discontinued treatment, N (%) | 28 (19.7) | 37 (26.4) |
Reason for treatment discontinuation, N (%) | ||
Adverse events | 12 (8.5) | 6 (4.3) |
Protocol deviation | 2 (1.4) | 1 (0.7) |
Lack of efficacy | 0 (0.0) | 2 (1.4) |
Non-compliance with protocol | 2 (1.4) | 1 (0.7) |
Lost to follow-up | 1 (0.7) | 6 (4.3) |
Other | 13 (9.2) | 22 (15.7) |
Withdrew from trial, N (%) | 1 (0.7) | 10 (7.1) |
Reason for trial withdrawal, N (%) | ||
Withdrawal by patient | 0 (0.0) | 1 (0.7) |
Lost to follow-up | 1 (0.7) | 7 (5.0) |
FAS,a N (%) | 142 (100.0) | 140 (100.0) |
SAS,b N (%) | 142 (100.0) | 140 (100.0) |
FAS = full analysis set; LIRA = liraglutide; SAS = safety analysis set.
aThe FAS included all randomized patients exposed to at least 1 dose of the trial product and with at least 1 post-baseline measurement of the pre-specified end points.
bThe SAS comprised all randomized patients who had been exposed to at least 1 dose of the trial product.
Source: Clinical Study Report for Study 4274.43
Efficacy
Percentage of Body Weight Change
The mean percentage change in body weight from baseline in the liraglutide 3 mg group was –7.46% (SD = 0.65%) and –4.01% (SD = 0.68%) in the placebo group, with an estimated treatment difference of –3.45% (95% CI, –5.31 to –1.59) in favour of the liraglutide 3 mg group (P = 0.0003).
5% Responders From Baseline
The proportion of patients losing at least 5% of baseline body weight at week 56 favoured the liraglutide 3 mg group versus placebo, 61.47% versus 38.82%, with an OR of 2.51 (95% CI, 1.75 to 4.61; P = 0.0003).
10% Responders From Baseline
The proportion of patients losing at least 10% of baseline body weight at week 56 favoured the liraglutide 3 mg group versus placebo, 30.45% versus 19.75%, with an OR of 1.78 (95% CI, 1.01 to 3.14; P = 0.0469).
15% Responders From Baseline
The proportion of patients losing more than 15% of baseline body weight at week 56 favoured the liraglutide 3 mg group versus placebo, 18.11% versus 8.92%, with an OR of 2.26 (95% CI, 1.08 to 4.74; P = 0.0311).
Table 63: Change From Baseline in Body Weight, Full Analysis Set
Outcome measure | Study 4274 | |
|---|---|---|
LIRA 3 mg N = 142 | Placebo N = 140 | |
Change (%) in body wt. from baseline, mean (SD)a | ||
Change from baseline in body wt. (%), mean (SD) | −7.46 | −4.01 |
Difference, LIRA 3 mg vs. placebo (95% CI) | −3.45 (−5.31 to −1.59) | |
P value | 0.0003 | |
5% responders from baselineb | ||
Patients losing ≥ 5% in body wt., n (%) | 86 (60.6) | 50 (35.7) |
Number of patients included in the analysis | 141 | 130 |
LSM, odds | 1.60 | 0.63 |
OR, LIRA 3 mg vs. placebo (95% CI) | 2.51 (1.53 to 4.14) | |
P value | 0.0003 | |
10% responders from baselineb | ||
Patients losing > 10% in body wt., n (%) | 43 (30.3) | 26 (18.6) |
Number of patients included in the analysis | 141 | 130 |
LSM, odds | 0.44 | 0.25 |
OR, LIRA 3 mg vs. placebo (95% CI) | 1.78 (1.01 to 3.14) | |
P value | 0.0469 | |
15% responders from baselineb | ||
Patients losing > 15% in body wt., n (%) | 26 (18.3) | 12 (8.6) |
Number of patients included in the analysis | 141 | 130 |
LSM, odds | 0.22 | 0.10 |
OR, LIRA 3 mg vs. placebo (95% CI) | 2.26 (1.08 to 4.74) | |
P value | 0.0311 | |
Change in body wt. (kg) | ||
Number of patients included in the analysis | 141 | 130 |
Mean (SD) | –7.8 (8.8) | –4.3 (8.1) |
ANCOVA = analysis of covariance; BMI = body mass index; CI = confidence interval; LIRA = liraglutide; LSM = least squares mean; OR = odds ratio; SD = standard deviation; vs. = versus; wt. = weight.
aThe end point was analyzed using an ANCOVA model.
bAnalysis of in-trial data, with missing observations imputed from the placebo group based on a jump to reference a multiple imputation approach. Week 56 responses were analyzed using a logistic regression model, with treatment, BMI groups, and sex as factors and baseline body weight as a covariate.
Source: Clinical Study Report for Study 4274.43
SF-36, Physical Functioning Score
The mean change from baseline in physical functioning score at week 56 was 3.97 (SD = 0.47) in the liraglutide 3 mg group and 3.81 (SD = 0.50) in the placebo group, with an estimated treatment difference that was not statistically significant (0.16; 95% CI, –1.19 to 1.52; P = 0.8137). There was no evidence to show a difference between groups in the changes from baseline to week 56 in any of the other SF-36 domains.
Table 64: Change From Baseline on the SF-36 Scale
Outcome measure | Study 4274 | |
|---|---|---|
LIRA 3 mg N = 142 | Placebo N = 140 | |
SF-36 overall scores, mean (SD) | ||
Overall physical health score at baselinea | 49.50 (8.00) | 47.88 (8.79) |
Overall physical health score at EOT | 52.76 (7.51) | 51.79 (7.54) |
Change in physical health score | 3.75 (0.50) | 3.47 (0.52) |
LSM | 52.44 | 52.17 |
Estimated difference, LIRA 3 mg vs. placebo (95% CI) | 0.28 (–1.16 to 1.71) | |
P value | 0.70626b | |
Overall mental score at screeninga | 54.13 (6.92) | 55.69 (5.99) |
Overall mental score at EOT | 52.86 (8.71) | 53.63 (8.34) |
Change in overall mental score | –1.58 (0.68) | –1.88 (0.71) |
LSM | 53.32 | 53.02 |
Estimated difference, LIRA 3 mg vs. placebo (95% CI) | 0.30 (–1.64 to 2.24) | |
P value | 0.7610b | |
SF-36 domain scores, mean (SD) (LOCF) | ||
Role-physical score functioning at baselinea | 51.04 (8.06) | 49.93 (8.19) |
Role-physical score at week 56 | 52.89 (6.42) | 52.26 (7.32) |
Change in role-physical score functioning | 2.33 (0.49) | 1.77 (0.52) |
LSM | 52.82 | 52.27 |
Estimated difference, LIRA 3 mg vs. placebo (95% CI) | 0.56 (−0.85 to 1.96) | |
P value | 0.4395b | |
Bodily pain score at baselinea | 51.65 (7.73) | 51.10 (8.6) |
Bodily pain score at week 56 | 52.20 (8.44) | 52.16 (8.44) |
Change in bodily pain score | 0.71 (0.62) | 1.15 (0.65) |
LSM | 52.09 | 52.52 |
Estimated difference, LIRA 3 mg vs. placebo (95% CI) | –0.43 (–2.19 to 1.33) | |
P value | 0.6310b | |
General health score at baselinea | 51.49 (8.24) | 51.53 (8.44) |
General health score at week 56 | 53.34 (8.08) | 52.62 (8.46) |
Change in general health score | 1.88 (0.51) | 1.01 (0.53) |
LSM | 53.39 | 52.51 |
Estimated difference, LIRA 3 mg vs. placebo (95% CI) | 0.88 (–0.57 to 2.33) | |
P value | 0.2353b | |
Vitality score at baselinea | 52.53 (9.02) | 52.29 (9.03) |
Vitality score at week 56 | 55.03 (9.08) | 54.91 (8.99) |
Change in vitality score | 2.69 (0.64) | 2.33 (0.67) |
LSM | 55.11 | 54.74 |
Estimated difference, LIRA 3 mg vs. placebo (95% CI) | 0.37 (–1.45 to 2.18) | |
P value | 0.6935b | |
Social functioning score at baselinea | 51.76 (7.46) | 52.54 (6.99) |
Social functioning score at EOT | 52.87 (7.26) | 52.20 (7.93) |
Change in social functioning score | 0.83 (0.64) | −0.12 (0.67) |
LSM | 52.98 | 52.03 |
Estimated difference, LIRA 3 mg vs. placebo (95% CI) | 0.95 (–0.87 to 2.77) | |
P value | 0.3067b | |
Physical functioning at baselinea | 49.07 (7.53) | 47.47 (8.58) |
Physical functioning at week 56 | 52.45 (7.02) | 51.94 (6.98) |
Change in physical functioning | 3.97 (0.47) | 3.81 (0.50) |
LSM | 52.25 | 52.08 |
Estimated difference, LIRA 3 mg vs. placebo (95% CI) | 0.16 (–1.19 to 1.52) | |
P value | 0.8137b | |
Role-emotional at baselinea | 52.06 (5.97) | 53.29 (6.44) |
Role-emotional at EOT | 50.72 (7.99) | 51.35 (8.17) |
Change in role-emotional | –1.60 (0.65) | –1.84 (0.69) |
LSM | 51.07 | 50.83 |
Estimated difference, LIRA 3 mg vs. placebo (95% CI) | 0.24 (–1.64 to 2.11) | |
P value | 0.8049b | |
Mental health score at baselinea | 54.65 (6.38) | 55.31 (5.97) |
Mental health score at EOT | 53.68 (7.90) | 54.67 (7.45) |
Change in mental health score | –1.02 (0.58) | –0.61 (0.61) |
LSM | 53.96 | 54.37 |
Estimated difference, LIRA 3 mg vs. placebo (95% CI) | –0.41 (–2.07 to 1.25) | |
P value | 0.6305b | |
ANCOVA = analysis of covariance; CI = confidence interval; EOT = end of treatment; LIRA = liraglutide; LOCF = last observation carried forward; LSM = least squares mean; SD = standard deviation; SF-36 = Short Form (36) Health Survey; vs. = versus.
aThe end point was analyzed using an ANCOVA model.
bThe P value has not been adjusted for multiple testing.
Source: Clinical Study Report for Study 4274.43
IWQOL-Lite For Clinical Trial, Physical Function Domain Score
The mean change in IWQOL-Lite for clinical trial, physical function domain score, from baseline to week 56 was 14.92 (SD = 1.49) in the liraglutide 3 mg group and 14.05 (SD = 1.57) in the placebo group, with an estimated treatment difference of 0.87 (95% CI, –3.41 to 5.14; P = 0.6916). There was no significant difference between groups in the changes from baseline to week 56 in any of the other IWQOL-Lite for clinical trial scores. Statistical testing for this outcome occurred following testing for the SF-36, which did not reach statistical significance. Therefore, this outcome was not controlled for multiplicity.
Table 65: Change From Baseline on the IWQOL-Lite Clinical Trial Scale, Full Analysis Set
Outcome measure | Study 4274 | |
|---|---|---|
LIRA 3 mg N = 142 | Placebo N = 140 | |
Total score at baseline, mean (SD)a | 64.4 (23.4) | 61.4 (23.7) |
Total score at EOT, mean (SD) | 77.1 (19.2) | 74.4 (21.5) |
Change in total score, mean (SD) | 13.2 (18.5) | 12.8 (20.7) |
LSM | 76.81 | 74.74 |
Estimated difference, LIRA 3 mg vs. placebo (95% CI) | 2.07 (−1.92 to 6.06) | |
P value | 0.3101b | |
Physical function score at baseline, mean (SD)a | 65.5 (25.8) | 60.7 (26.4) |
Physical function score at EOT, mean (SD) | 78.6 (20.4) | 76.8 (22.1) |
Change in physical function score, mean (SD) | 13.5 (21.4) | 15.5 (23.0) |
LSM | 78.04 | 77.17 |
Estimated difference, LIRA 3 mg vs. placebo (95% CI) | 0.87 (−3.41 to 5.14) | |
P value | 0.6916c | |
Pain/discomfort score at baseline, mean (SD)a | 65.4 (26.9) | 64.7 (27.0) |
Pain/discomfort score at EOT, mean (SD) | 75.1 (23.0) | 72.9 (24.4) |
Change in pain/discomfort score, mean (SD) | 10.1 (21.2) | 8.6 (23.1) |
LSM | 75.40 | 72.94 |
Estimated difference, LIRA 3 mg vs. placebo (95% CI) | 2.46 (−2.08 to 7.01) | |
P value | 0.2877b | |
Physical domain score at baseline, mean (SD)a | 65.5 (24.8) | 61.8 (25.3) |
Physical domain at EOT, mean (SD) | 77.6 (19.9) | 75.7 (21.8) |
Change in physical domain score, mean (SD) | 12.5 (19.4) | 13.5 (21.3) |
LSM | 77.20 (1.40) | 76.07 (1.48) |
Estimated difference, LIRA 3 mg vs. placebo (95% CI) | 1.13 (–2.89 to 5.15) | |
P value | 0.5828b | |
Psychosocial domain score at baseline, mean (SD)a | 63.8 (25.4) | 61.2 (24.8) |
Psychosocial domain score at EOT, mean (SD) | 76.9 (20.8) | 73.8 (23.2) |
Change in psychosocial domain score, mean (SD) | 13.5 (20.3) | 12.4 (21.8) |
LSM | 76.61 | 74.02 |
Estimated difference, LIRA 3 mg vs. placebo (95% CI) | 2.60 (–1.72 to 6.92) | |
P value | 0.2386b | |
ANCOVA = analysis of covariance; CI = confidence interval; EOT = end of treatment; IWQOL-Lite = Impact of Weight on Quality of Life-Lite; LIRA = liraglutide; LSM = least squares mean; vs. = versus.
aThe end point was analyzed using an ANCOVA model.
bThe P value has not been adjusted for multiple testing.
cThe P value occurred after a previously failed outcome in the statistical hierarchy.
Source: Clinical Study Report for Study 4274.43
Glycemic Control
Change in hemoglobin A1C from baseline at week 56 was −0.16% in the liraglutide 3 mg group and −0.06% in the placebo group. Change in FPG from baseline to week 56 was 0.23 mmol/L in the liraglutide 3 mg group and 0.01 mmol/L in the placebo group, with an estimated difference of –0.23 mml/L (95% CI, –0.36 to –0.11; P = 0.0002). However, these outcomes were beyond those included in the statistical testing hierarchy and not controlled for multiplicity.
Table 66: Change From Baseline in Glycemic Control, Full Analysis Set
Outcome measure | Study 4274 | |
|---|---|---|
LIRA 3 mg N = 142 | Placebo N = 140 | |
Hemoglobin A1C (% point) | ||
Hemoglobin A1C at baseline, mean (SD)a | 5.5 (0.4) | 5.5 (0.4) |
Hemoglobin A1C at week 56, mean (SD) | 5.4 (0.4) | 5.5 (0.4) |
Change from baseline in hemoglobin A1C, mean (SD) | –0.16 (0.02) | –0.06 (0.02) |
LSM | 5.38 | 5.48 |
Difference, LIRA 3 mg vs. placebo (95% CI) | –0.10 (–0.16 to –0.04) | |
P value | 0.0008b | |
FPG (mmol/L) at baseline, mean (SD)a | 5.4 (0.5) | 5.4 (0.6) |
FPG (mmol/L) at week 56, mean (SD) | 5.2 (0.6) | 5.4 (0.6) |
Change in FPG (mmol/L) from baseline, mean (SD) | –0.2 (0.5) | –0.0 (0.6) |
LSM | 92.94 (0.79) | 97.14 (0.83) |
Difference, LIRA 3 mg vs. placebo (95% CI) | –4.19 (–6.43 to –1.96) | |
P value | 0.0002b | |
ANCOVA = analysis of covariance; CI = confidence interval; FPG = fasting plasma glucose; LIRA = liraglutide; LSM = least squares mean; SD = standard deviation; vs. = versus.
aThe end point was analyzed using an ANCOVA model.
bThe P value has not been adjusted for multiple testing.
Source: Clinical Study Report for Study 4274.43
Weight-Related Cardiovascular Morbidities
Blood Pressure
There was no statistically significant difference in change in SBP (–2.19 mm Hg; 95% CI, –4.89 to 0.51; P = 0.1119) or DBP (–0.17 mm Hg; 95% CI, –2.17 to 1.83; P = 0.8691) from baseline to week 56 between the 2 groups. These outcomes were not accounted for multiplicity.
Lipids
There was no statistically significant difference in change from baseline to week 56 in any of the lipid parameters. The estimated treatment differences for the different parameters were as follows: −0.10 mmol/L for total cholesterol (95% CI, −0.26 to 0.06; P = 0.2163), 0.02 mmol/L for HDL cholesterol (95% CI, −0.02 to 0.07; P = 0.3323), −0.07 mmol/L for LDL cholesterol (95% CI, −0.21 to 0.06; P = 0.2700), −0.05 mmol/L for VLDL cholesterol (95% CI, −0.11 to 0.01; P = 0.1355), −0.12 mmol/L for triglycerides (95% CI, −0.26 to 0.02; P = 0.0951), and −0.61 mmol/L for FFA (95% CI, −2.29 to 1.07; P = 0.4753). These outcomes did not account for multiplicity.
Change In Concomitant Medications for Weight-Related Comorbidities
The number of patients with increased use or decreased use or who were maintaining the same level of use for each drug class was not reported in this trial.
Table 67: Change From Baseline Weight-Related Cardiovascular Comorbidities, Full Analysis Set
Outcome measure | Study 4274 | |
|---|---|---|
LIRA 3 mg N = 142 | Placebo N = 140 | |
Weight-related CV comorbidity | ||
Hypertension (blood pressure status)a | ||
SBP at baseline, mean (SD) | 125 (15) | 127 (14) |
SBP at week 56, mean (SD) | 123 (15) | 125 (12) |
Change in SBP from baseline | –2 (14) | –1 (13) |
LSM | 123.16 (0.95) | 125.35 (0.98) |
Difference, LIRA 3 mg vs. placebo (95% CI) | –2.19 (–4.89 to 0.51) | |
P value | 0.1119b | |
DBP at baseline, mean (SD) | 80 (9) | 81 (8) |
DBP at week 56, mean (SD) | 78 (9) | 79 (9) |
DBP change from baseline, LSM | –2 (10) | –1 (9) |
LSM | 79.34 | 79.51 |
Difference, LIRA 3 mg vs. placebo (95% CI) | –0.17 (–2.17 to 1.83) | |
P value | 0.8691b | |
Dyslipidemia: Change from baseline in lipid profile parameters (%) | ||
HDL (mmol/L) at baselinea | 1.30 (0.28) | 1.36 (0.35) |
HDL at week 56 | 1.35 (0.30) | 1.38 (0.33) |
HDL (%) change from baseline, mean (SD) | 0.06 (0.19) | 0.02 (0.22) |
LSM | 1.38 | 1.36 |
Treatment ratio, LIRA 3 mg vs. placebo (95% CI) | 0.02 (–0.02 to 0.07) | |
P value | 0.3323b | |
LDL (mmol/L) at baselinea | 2.91 (0.81) | 3.12 (0.86) |
LDL at week 56 | 2.92 (0.80) | 3.12 (0.79) |
LDL (%) change from baseline, mean (SD) | –0.01 (0.52) | –0.01 (0.64) |
LSM | 2.98 | 3.05 |
Treatment ratio, LIRA 3 mg vs. placebo (95% CI) | –0.07 (–0.21 to 0.06) | |
P value | 0.2700b | |
VLDL (mmol/L) at baselinea | 0.64 (0.36) | 0.64 (0.30) |
VLDL at week 56 | 0.58 (0.34) | 0.62 (0.27) |
Change in VLDL (%) from baseline, mean (SD) | –0.06 (0.31) | –0.01 (0.26) |
LSM | 0.58 | 0.63 |
Treatment ratio, LIRA 3 mg vs. placebo (95% CI) | –0.05 (–0.11 to 0.01) | |
P value | 0.1355b | |
Triglycerides (mmol/L) at baselinea | 1.48 (1.21) | 1.42 (0.67) |
Triglycerides at week 56 | 1.29 (0.75) | 1.38 (0.60) |
Change in triglycerides (%) from baseline, mean (SD) | –0.19 (1.04) | –0.01 (0.58) |
LSM | 1.28 | 1.40 |
Treatment ratio, LIRA 3 mg vs. placebo (95% CI) | –0.12 (–0.26 to 0.02) | |
P value | 0.0951b | |
Total cholesterol (mmol/L) at baselinea | 4.86 (0.86) | 5.11 (1.01) |
Total cholesterol at week 56 | 4.86 (0.88) | 5.13 (0.97) |
Change in total cholesterol (%) from baseline, mean (SD) | –0.01 (0.59) | 0.00 (0.77) |
LSM | 4.94 | 5.04 |
Treatment ratio, LIRA 3 mg vs. placebo (95% CI) | –0.10 (–0.26 to 0.06) | |
P value | 0.2163b | |
FFA (mmol/L) at baseline, mean (SD)a | 0.50 (0.25) | 0.51 (0.25) |
FFA at week 56, mean (SD) | 12.7 (7.7) | 12.8 (7.2) |
Change in FFA (%) from baseline, mean (SD) | –2.16 (0.59) | –1.55 (0.61) |
LSM | 12.14 (0.59) | 12.75 (0.61) |
Difference, LIRA 3 mg vs. placebo (95% CI) | –0.61 (–0.08 to 0.04) | |
P value | 0.4753b | |
ANCOVA = analysis of covariance; CI = confidence interval; CV = cardiovascular; DBP = diastolic blood pressure; FFA = free fatty acids; HDL = high-density lipoprotein; LDL = low-density lipoprotein; LIRA = liraglutide; LSM = least squares mean; SBP = systolic blood pressure; SD = standard deviation; VLDL = very low-density lipoprotein; vs. = versus.
aThe end point was analyzed using an ANCOVA model.
bThe P value has not been adjusted for multiple testing.
Source: Clinical Study Report for Study 4274.43
Harms
After 56 weeks of treatment, the proportion of overall AEs occurring in at least 1 patient was 95.8% in the liraglutide 3 mg group and 88.5% in the placebo group. The most common AEs in the liraglutide 3 mg group were nausea (47.9%) and constipation (30.3%); these occurred in 17.9% and 18.6% of patients in the placebo group, respectively. The proportion of patients reporting a SAE was 4.2% in the liraglutide 3 mg group and 1.4% in the placebo group. The SAEs in the liraglutide 3 mg group consisted of headache, osteoarthritis, colitis, cholecystitis acute, papillary thyroid cancer, and ovarian cyst. The SAEs in the placebo group consisted of hydrocephalus and ankle fracture. The number of AEs leading to discontinuation from the trial was 12 (8.5%) in the liraglutide 3 mg group and 6 (4.3%) in the placebo group. The most common events leading to premature discontinuation in the liraglutide 3 mg group were nausea (3.5%) and vomiting (2.1%), which occurred in 2.9% and 0% of patients in the placebo group, respectively. No deaths were reported in Study 4274. A summary of the AEs reported in the 2 groups can be found in Table 68.
Table 68: Summary of Harms, Safety Analysis Set
Harms | Study 4274 | |
|---|---|---|
LIRA 3 mg N = 142 | Placebo N = 140 | |
AEs, n (%) | ||
AEs overall, n (%) | 136 (95.8) | 124 (88.6) |
Most common events (i.e., occurring in ≥ 5% of patients), n (%) | 124 (87.3) | 101 (72.1) |
Nausea | 68 (47.9) | 25 (17.9) |
Constipation | 43 (30.3) | 26 (18.6) |
Vomiting | 33 (23.2) | 7 (5.0) |
Upper respiratory tract infection | 32 (22.5) | 15 (10.7) |
Diarrhea | 31 (21.8) | 23 (16.4) |
Headache | 20 (14.1) | 13 (9.3) |
Nasopharyngitis | 13 (9.2) | 9 (6.4) |
Fatigue | 13 (9.2) | 5 (3.6) |
Dizziness | 9 (6.3) | 6 (4.3) |
Sinusitis | 9 (6.3) | 18 (12.9) |
Arthralgia | 9 (6.3) | 6 (4.3) |
Abdominal discomfort | 8 (5.6) | 4 (2.9) |
Dyspepsia | 8 (5.6) | 3 (2.1) |
Urinary tract infection | 8 (5.6) | 3 (2.1) |
Back pain | 8 (5.6) | 13 (9.3) |
Cough | 7 (4.9) | 9 (6.4) |
Ligament sprain | 6 (4.2) | 9 (6.4) |
Influenza | 5 (3.5) | 13 (9.3) |
Gastroenteritis, viral | 3 (2.1) | 9 (6.4) |
Muscle strain | 3 (2.1) | 7 (5.0) |
Migraine | 3 (2.1) | 7 (5.0) |
Oropharyngeal pain | 2 (1.4) | 7 (5.0) |
SAEs, n (%) | 6 (4.2) | 2 (1.4) |
Patients who stopped treatment due to AEs | ||
WDAEs overall, n (%) | 12 (8.5) | 6 (4.3) |
Gastrointestinal disorders | 6 (4.2) | 5 (3.6) |
General disorders and administration site conditions | 3 (2.1) | 1 (0.7) |
Infections and infestations | 1 (0.7) | 1 (0.7) |
Nervous system disorders | 1 (0.7) | 1 (0.7) |
Neoplasms — benign, malignant, and unspecified | 1 (0.7) | 0 (0.0) |
Immune system disorders | 1 (0.7) | 0 (0.0) |
Injury, poisoning and procedural complications | 1 (0.7) | 0 (0.0) |
Deaths | ||
n (%) | 0 (0.0) | 0 (0.0) |
Notable harms | ||
Cardiac disorders | 3 (2.1) | 1 (0.7) |
Tachycardia | NR | NR |
Atrioventricular block | NR | NR |
Endocrine disorders | 2 (1.4) | 1 (0.7) |
Metabolic and nutritional disorders | 12 (8.5) | 5 (3.6) |
Hypoglycemia | 1 (0.7) | 0 (0.0) |
Gallbladder disease | 3 (2.1) | 2 (1.4) |
Cholelithiasis | 1 (0.7) | 1 (0.7) |
Cholecystitis | 1 (0.7) | 0 (0.0) |
Gastrointestinal AEs | 101 (71.1) | 68 (48.6) |
Nausea | 68 (47.9) | 25 (17.9) |
Vomiting | 33 (23.2) | 7 (5.0) |
Dyspepsia | 8 (5.6) | 3 (2.1) |
Abdominal pain, upper | 5 (3.5) | 4 (2.9) |
Abdominal pain | 4 (2.8) | 1 (0.7) |
GERD | 6 (4.2) | 4 (2.9) |
Hypersensitivity reactions | 3 (2.1) | 1 (0.7) |
Neoplasms — benign, malignant, and unspecified | 3 (2.1) | 2 (1.4) |
Breast cancer | NR | NR |
Pancreatitis | NR | NR |
Psychiatric AEs | 11 (7.7) | 9 (6.4) |
Renal and urinary tract disorders | 5 (3.5) | 4 (2.9) |
Hunger | NR | NR |
AE = adverse event; GERD = gastroesophageal reflux disease; LIRA = liraglutide; NR = not reported; SAE = serious adverse event; WDAE = withdrawal due to adverse event.
Source: Clinical Study Report for Study 4274.43
Critical Appraisal
Internal Validity
Study 4274 used appropriate randomization methods, with an IV/WRS to allocate the patients to their treatment group; however, the imbalance between treatment groups in discontinuation rates may have introduced bias. Information on the blinding process was not described in detail and the higher rate of AEs and increased weight loss within the liraglutide 3 mg group compared to the placebo group may have compromised blinding.
Overall, baseline characteristics and demographics were similar between the 2 treatment groups. All participants were prescribed the same co-intervention regardless of treatment group allocation, with targets for energy intake determined based on body weight at randomization, which was recalculated if a participant achieved a BMI of 22 kg/m2 or less. However, no data were provided regarding the balance of recalculation of energy intake across treatment groups. As a result, the impact on the treatment effect is unknown. Missing data due to patients discontinuing from the study causes concern for the internal validity of the study, but appropriate multiple imputation methods were used to account for this missing data.
External Validity
The patients included in this trial were predominantly White and predominantly women; therefore, results may not be generalizable to all Canadians living with obesity. Furthermore, this study excluded patients with a history of bariatric surgery and those with recent use of medications that cause weight loss, who make up a clinically relevant proportion of individuals seeking pharmacotherapy for the management of obesity. Although this study was placebo controlled, all patients were required to be on an intensive lifestyle modification regimen, which was identified as a relevant comparator in the CADTH review protocol. However, the specific regimen used in this study may not be readily accessible to patients living with obesity in Canada. Finally, the co-primary end points related to changes in body weight. While they were relevant for regulatory and licensing purposes and are widely accepted as translating into reducing weight-related comorbidities, these outcomes were deemed the least clinically relevant by the clinical expert, as noted with the studies in the systematic review.
Study NCT02911818
Study NCT02911818 was a single-site, open-label, parallel-group, randomized trial to assess whether the addition of liraglutide to an IBT intervention would increase weight loss compared to IBT alone in adult patients living with obesity. Details of the study design can be found in Table 69.45
Table 69: Details of Study NCT02911818
Study details | Study NCT02911818 |
|---|---|
Designs and populations | A 52-week RCT in patients living with obesity without diabetes |
Study design | Single-site, open-label, parallel-group RCT |
Locations | 1 academic medical centre |
Trial initiation date | NR |
Randomized (N) | 150 |
Inclusion criteria |
|
Exclusion criteria |
|
Drugs | |
Intervention | Liraglutide 3 mg administered once daily as subcutaneous injection for 52 weeks as well as intensive behavioural therapy |
Comparator(s) | Intensive behavioural therapy alone for 52 weeks |
Duration | |
Phase | |
Run-in | NR |
Randomized | 52 weeks |
Follow-up | NR |
Outcomes | |
Primary end point | Mean percentage reduction in baseline body weight at week 52 |
Secondary and exploratory end points |
|
Notes | |
Publications | Wadden et al. (2019)45 |
BMI = body mass index; DBP = diastolic blood pressure; FPG = fasting plasma glucose; NR = not reported; RCT = randomized controlled trial; SBP = systolic blood pressure.
Source: NCT02911818.45
Methods
Eligible patients (N = 150) were assigned, using a computer-generated algorithm and block randomization, to 1 of 3 groups: IBT alone, IBT-liraglutide 3 mg, or a multi-component group. The primary outcome was the mean percentage reduction in baseline body weight at week 52. Other outcomes included waist circumference, blood pressure, fasting glucose, insulin, triglycerides, C-reactive protein, lipids, HRQoL measures, and depression symptoms.
Populations
Patients were deemed eligible if they met the following criteria: adult between the ages of 21 years and 70 years, BMI of 30 kg/m2 to 55 kg/m2, prior lifetime weight-loss effort with diet and exercise (before considering anti-obesity medication), and a commitment to participate for 1 year. Exclusion criteria included the following: personal or family history of medullary thyroid cancer or multiple endocrine neoplasia; type 1 or type 2 diabetes; renal, hepatic, or recent CV disease; blood pressure of 160/100 mm Hg or more; medications that substantially affect body weight; substance abuse; current major depression, suicidal ideation, or a history of suicide attempts; bariatric surgery; use of weight-loss medications or products, as well as weight loss of 4.5 kg or more in past 3 months; pregnancy or lactation; and antidepressant medications that are associated with marked weight gain (e.g., paroxetine) or loss (e.g., bupropion hydrochloride).
A total of 150 patients were enrolled in Study NCT02911818, of whom 119 (79.3%) were women and 31 (20.7%) were men. The mean age was 47.6 years (± 11.8 years), weight was 108.4 kg (± 17.5 kg), and BMI was 38.4 kg/m2 (± 4.9 kg/m2). Furthermore, 54.0% self-identified as non-Hispanic White, 44.7% as Black, and 6.7% as Hispanic.
Interventions
All 3 groups received the same 21 sessions of IBT delivered through 4 initial weekly visits, followed by 10 sessions every other week until the end of month 6, and then followed by 7 sessions delivered every 4 weeks until the end of month 12. Counselling was provided for all participants regardless of weight loss at month 6. Participants were prescribed a diet of 1,200 kcal/day to 1,499 kcal/day if they weighed less than 113.6 kg (250 lb.) and 1,500 kcal/day to 1,800 kcal/day if they weighed 113.6 kg or more. This diet consisted of conventional foods, with approximately 15% to 20% kcal from proteins, 20% to 35% kcal from fat, and the remainder from carbohydrates. Participants were also prescribed to engage in low-intensity to moderate-intensity physical activity 5 days per week, gradually building to 180 minutes or more per week by week 24 and increasing to 225 or more minutes per week from week 25 to week 52.
Participants were randomized to 1 of the following treatment groups:
IBT alone — As described previously
IBT-liraglutide — Patients received IBT as previously described in conjunction with once-daily self-administered liraglutide 3 mg. Liraglutide was initiated at 0.6 mg per day for 1 week and increased in 0.6 mg increments each week to reach the maintenance dose of 3 mg per day.
Multi-component intervention — Patients in this group received treatment identical to that described for the IBT-liraglutide group, with an additional prescribed 1,000 kcal/day to 1,200 kcal/day diet starting at week 4 for 12 weeks.
Outcomes
The primary outcome was mean percentage reduction in baseline body weight at week 52. Other outcomes assessed were waist circumference; blood pressure; fasting glucose, insulin, triglycerides, C-reactive protein, and lipids; HRQoL as measured by the SF-36; and symptoms of depression measured by the PHQ-9. Additional details pertaining to the SF-36 and PHQ-9 are available in Appendix 4.
Statistical Analysis
The mean percentage reduction in baseline weight at week 52 was analyzed in the ITT population using repeated measures linear mixed-effects models. The authors reported that the study had an 80% power to detect a 4.5 percentage-point difference in weight change between the 2 a priori between-groups comparisons: IBT alone versus IBT-liraglutide and between IBT alone versus multi-component, the study’s 2 primary a priori comparisons. To identify differences in at least 1 of the 2 contrasts for reduction in baseline weight, Holm’s procedure was used at P = 0.025. The authors used logistic regression to determine the percentages of participants losing 5% or more, 10% or more, and 15% or more of baseline weight, categorizing those who did not complete the assessments as categorical losses. These analyses, as well as the remaining secondary outcomes, were all completed using P of less than 0.05 with no further adjustment for multiple comparisons.
Patient Disposition
In total, 1,024 patients were prescreened for eligibility and 199 of those underwent in-person screening. Of these, 150 participants underwent randomization: 50 were assigned to the IBT intervention alone, 50 were assigned to the IBT-liraglutide group, and 50 were assigned to the multi-component intervention. The number of patients who completed the 52-week assessment in each group is as follows: IBT alone — 46 patients; IBT-liraglutide — 45 patients; and multi-component — 46 patients. In the IBT-alone group, 4 participants were lost to follow-up. In the IBT-liraglutide group, 5 participants were lost to follow-up. In the multi-component group, 4 participants were lost to follow-up.
Exposure to Study Treatments
Exposure to study treatments was not reported by Wadden et al. (2019).45
Efficacy
Body Weight
The mean (± SEM) reduction from baseline in body weight (%) at week 52 in the IBT-liraglutide 3 mg group was 11.5% (1.3) and 6.1% (1.3) in the IBT-alone group. Compared to the IBT-alone group, the results favoured the IBT-liraglutide 3 mg group (P = 0.005).
Body Mass Index
The mean (± SEM) reduction from baseline in BMI at week 52 in the IBT-liraglutide 3 mg group was 4.3 (0.5) and 2.3 (0.5) in the IBT-alone group. Compared to the IBT-alone group, the results favoured the IBT-liraglutide 3 mg group (P = 0.003).
Categorical Weight Losses
The proportion of participants achieving 5% or more weight loss from baseline at week 52 was 44% in the IBT-alone group and 70% in the IBT-liraglutide group. Compared to the IBT-alone group, the percentage change was found to be significant in the IBT-liraglutide 3 mg group (P = 0.01). The proportion of participants achieving 10% or more weight loss from baseline at week 52 was 26% in the IBT-alone group and 46% in the IBT-liraglutide group. Compared to the IBT-alone group, the percentage change was found to be significant in the IBT-liraglutide 3 mg group (P = 0.039).
Weight-Related Cardiovascular Comorbidities
No between-groups differences at week 52 were observed for SBP and DBP, heart rate, LDL cholesterol, and triglycerides. Significantly greater improvements were reported in the IBT-liraglutide 3 mg group compared with the IBT-alone group in 52-week changes in HDL cholesterol, C-reactive protein, hemoglobin A1C, and fasting glucose.
Health-Related Quality of Life Outcomes
No between-groups differences were observed in the PHQ-9 score at week 52. Using the SF-36 questionnaire, significantly greater improvements were reported in the IBT-liraglutide 3 mg group for the MCS compared to the IBT-alone group.
Harms
The most frequently reported AEs in the IBT-liraglutide group, compared to the IBT-alone group, were nausea, constipation, upper respiratory infection, and gastroenteritis. Two SAEs were reported in the IBT-alone group compared to none in the IBT-liraglutide group. Deaths were not reported by Wadden et al. (2019).45
Critical Appraisal
Internal Validity
Study NCT02911818 published by Wadden et al. (2019) used appropriate randomization methods — a computer-generated algorithm using varying block sizes — to allocate the patients to their treatment group. This study was not blinded, which may have led to response and observer bias. Furthermore, the significantly higher rate of AEs and increased weight loss within the groups receiving liraglutide 3 mg compared to the IBT-alone group may have been impacted by the lack of blinding. Overall, baseline characteristics and demographics were similar between the treatment groups. The authors noted an imbalance at baseline on physical-related quality of life, which was controlled for in relevant analyses. All participants were prescribed the same co-intervention regardless of treatment group allocation or whether they lost 3 kg or more at month 6, with targets for energy intake determined based on body weight at randomization. However, no information was provided regarding whether recalculation of energy intake was completed.
External Validity
The patients included in this trial were predominantly women, causing concern regarding the generalizability of the results, which may not be applicable to all Canadians living with obesity. This study was conducted at a single centre in the US; therefore, racial distribution of the study population may not be representative of Canada. Furthermore, this study excluded patients with a history of bariatric surgery and those with previous use of medications that cause weight loss — patients who make up a clinically relevant proportion of individuals seeking pharmacotherapy for management of obesity in real life. This study did not use a placebo nor compare effectiveness with any drug currently on the market in Canada for the same indication. All patients were required to be on an intensive lifestyle modification regimen, which was identified as a relevant comparator in the CADTH review protocol. However, the specific regimen used in this study may not be readily accessible to patients living with obesity in Canada. The co-primary end points were relevant for regulatory and licensing purposes and may translate into a reduction in weight-related comorbidities, although as noted with the studies in the main body of this report, these outcomes were deemed the least clinically relevant by the clinical expert.
Discussion
Summary of Available Evidence
A total of 4 unique phase III RCTs met the inclusion criteria for the systematic review. All the included studies evaluated liraglutide 3 mg once daily against placebo in adult patients who are overweight or living with obesity. Study 1839 and Study 1923 were conducted in patients without diabetes (N = 3,731 and N = 422, respectively), whereas Study 1922 and Study 3970 were conducted in patients with T2DM (N = 846) and OSA (N = 359), respectively. The treatment duration was 56 weeks for the main phase of Study 1839, and a total of 160 weeks, adding the 104-week extension phase conducted to investigate the time to onset of T2DM in patients who had prediabetes (N = 2,254) at screening. The study duration was 56 weeks for Study 1922 and Study 1923, and 32 weeks for Study 3970.
Three of the included studies had 3 co-primary end points each. The percentage change from baseline in fasting body weight, the proportion of patients losing 5% or more of baseline fasting body weight (5% responders), and the proportion of patients losing more than 10% of baseline fasting body weight (10% responders), in that order, were co-primary end points in Study 1839 and Study 1922, whereas the co-primary end points in Study 1923 were the percentage change from baseline in fasting body weight, the percentage of patients maintaining run-in fasting weight loss from baseline, and 5% responders, in that order. The duration of treatment was 56 weeks for each of these trials and all the co-primary end points were analyzed in the order listed to control for type I error inflation. The primary end point in the extension phase of Study 1839 was the time to new onset of T2DM after 160 weeks of treatment and the primary end point in Study 3970 was change from baseline in the AHI after 32 weeks of treatment. Secondary outcomes identified as relevant to the CADTH review included change in BMI, HRQoL, and outcomes associated with weight-related comorbidities such as development of T2DM, glycemic control, and change in other medications.
Randomization was performed appropriately, allocation blinding was implemented with matching placebo, and baseline characteristics were similar across study groups in all the studies. However, a high and disproportionate rate of discontinuation of treatment driven by AEs (with liraglutide 3 mg) and ineffective therapy (with placebo) risked disrupting the randomization effect and undermining blinding of allocation for some patients. Also, overall, the enrolled patients were predominately White and female, an imbalance that likely does not reflect the mix of patients living with chronic overweight and obesity in the Canadian context. It should be noted that Study 1923 was conducted in patients who achieved at least 5% reduction of screening body weight on a diet during a run-in period of up to 12 weeks. Therefore, given that they were responders to management with diet, the study population may not meet the requirement of liraglutide 3 mg to be used in patients who had previously failed other weight management interventions.
Two other relevant studies were identified: Study 427443 and Study NCT02911818.45 Study 427443 was a prospective double-blind, placebo-controlled, 2-armed, phase IIIb, randomized trial to evaluate the health benefits of liraglutide 3 mg plus IBT compared with placebo plus IBT in adult patients living with obesity. Study NCT0291181845 was a single-site, open-label, parallel-group, randomized trial assessing the weight-loss benefit of liraglutide 3 mg plus IBT to IBT alone.45 It should be noted that IBT was identified as a comparator of interest in the CADTH protocol for this systematic review. In both studies, the IBT was a particular type prescribed by CMS for obesity. The clinical expert consulted for this review noted that there are not many intensive lifestyle intervention programs available in Canada and that the number of patients accessing such programs is likely limited.
Interpretation of Results
Efficacy
Mortality was rare (≤ 3%) in all the studies included in the systematic review, with no deaths reported during Study 1922 and Study 3970, 1 death occurring in Study 1923 in the placebo group, and a total of 2 deaths each in the liraglutide 3 mg group and the placebo group in the entire duration of Study 1839 (i.e., after 160 weeks). However, mortality was reported as a safety end point and not an efficacy outcome in all the included studies.
For relative weight loss from baseline, the primary analyses from 3 studies (Study 1839 during its main phase, Study 1922, and Study 1923) showed that patients treated with liraglutide 3 mg achieved a significantly greater percentage reduction in fasting body weight than those treated with placebo, with a minimum estimated treatment difference of −3.97% after 56 weeks of treatment. Consistent findings were reported in secondary analyses of Study 3970 and the extension phase of Study 1839 after 32 weeks and 160 weeks of treatment, respectively. The results from subgroup analyses of patients based on baseline BMI and prediabetes status aligned with the findings of the primary analyses. However, analyses of secondary end points and subgroups did not control for multiplicity and their results must be interpreted with consideration for type I error. Results from Study 427443 also showed that significantly more individuals on liraglutide 3 mg than on placebo achieved more than 10% weight loss and more than 15% weight loss relative to baseline body weight after 56 weeks of treatment. Study NCT0291181845 reported that after 1 year, mean weight loss from baseline with IBT-liraglutide was 11.5% compared with 6.1% with placebo.
The primary analyses from 3 studies (Study 1839 [main phase], Study 1922, and Study 1923) indicated that treatment with liraglutide 3 mg significantly increased the odds of patients losing 5% or more of baseline fasting body weight compared to placebo after 56 weeks of treatment. Similarly, the primary analyses from 2 studies (Study 1839 [main phase] and Study 1922) indicated that treatment with liraglutide 3 mg significantly increased the odds of patients losing more than 10% of baseline fasting body weight compared to placebo after 56 weeks of treatment. The results of secondary analyses from Study 3970 and the extension phase of Study 1839 and subgroup analyses across all the studies based on BMI subgroups were consistent with the primary analyses findings. Results from Study 427443 showed that after week 56 of treatment, there were statistically significantly more 5% responders and 10% responders with liraglutide plus IBT than with placebo plus IBT, with estimated odds of achieving 5% or more and more than 10% weight loss from baseline favouring liraglutide plus IBT in each comparison. Study NCT0291181845 found that 70.0% of patients treated with IBT plus liraglutide 3 mg lost 5% or more of baseline body weight compared with 44.0% of patients treated with IBT alone. Thus, the results consistently showed that treatment with liraglutide 3 mg resulted in a statistically significantly greater reduction in body weight than placebo, and significantly increased the likelihood of a patient achieving 5% or more or more than 10% reduction in body weight when compared with placebo. The clinical expert consulted for this review noted that relative weight loss from baseline, 5% responders, and 10% responders are widely accepted as clinically meaningful end points that may translate into reduction in weight-related comorbidities, adding that improvement in weight-related comorbidities is a more clinically meaningful response to weight-loss treatment, whereas improved weight or BMI in themselves are less clinically meaningful.
The results from primary analysis of 1 study (Study 1923) showed that liraglutide 3 mg was superior to placebo regarding the odds of maintaining baseline weight loss after 56 weeks of treatment. It is worth noting that because patients in this study were responders to dietary intervention to reduce weight, they do meet the requirement of the liraglutide 3 mg indication for patients who have failed previous attempts of losing weight with other interventions. No other study measured this outcome.
Secondary analyses from the included studies showed that treatment with liraglutide 3 mg resulted in a greater reduction in baseline BMI than placebo. The LSM difference in BMI in Study 1839 was larger after 56 weeks of treatment (main phase) than after 160 weeks of treatment (following the 104-week extension phase), suggesting that the patients regained part of their initial weight loss over time. However, change in BMI results was not controlled for multiplicity and must be interpreted with care for type I error. Patient organizations that provided input for this review noted that even when individuals lose a significant amount of weight, many of them gain it back within 5 years. The clinical expert consulted for this review stated that patients will regain the weight they lost with the drug if the medication is stopped. Therefore, medications need to be continued in the long-term, as for other chronic diseases.
There were inconsistencies in the HRQoL assessment results, and they should be interpreted with caution for type I error since they were not controlled for multiplicity. While the total scores for IWQOL-Lite suggested more positive treatment effects with liraglutide 3 mg than with placebo, the between-groups difference was less than the MID for the tool. For the TRIM-Weight scale, the total score suggested more positive treatment effect for liraglutide 3 mg than placebo after 56 weeks. However, there was no difference between the groups at week 160. No information concerning MID was identified for the TRIM-Weight scale and significant relationships were not found between the TRIM-Weight total score and the BMI category. Therefore, the clinical significance for the results is unknown. For SF-36 assessments, the total PCS and MCS scores in Study 1839 suggested a more positive treatment effect in favour of liraglutide 3 mg at week 56. However, while PCS scores still favoured liraglutide 3 mg at week 160, there was no difference in MCS scores between the treatment groups at this evaluation point. Also, SF-36 scores in Study 3970 showed no intergroup differences in score after 32 weeks of treatment and there was no difference in the DTSQ score between the liraglutide 3 mg and placebo groups in Study 1922. No information about the MID of the SF-36 and DTSQ in the population living with obesity was located, and no evidence assessing the validity and reliability of the DTSQ in patients living with obesity was identified.
Although fewer patients in the liraglutide 3 mg group developed T2DM after 56 weeks of treatment in Study 1839, the rate of developing T2DM was low (≤ 1.1%) in both study groups. Also, the small effect size and wide CI show a high level of imprecision. One of the outcomes patient groups hope for is that liraglutide may help people to better manage their weight, potentially delaying or preventing the development of comorbidities, such as the progression of prediabetes to T2DM. The time to new onset of T2DM after 160 weeks of treatment in patients who had prediabetes at screening was assessed as a primary end point in the extension phase of Study 1839. The results showed that progression from prediabetes to new onset of T2DM was almost 3 times as long for patients treated with liraglutide 3 mg compared with those treated with placebo. However, there were limitations to the analysis, such as failure to show the goodness of fit of the Weibull model used to analyze the data.
Patient groups reported interest in improved outcomes related to comorbidities such as diabetes, hypertension, and sleep apnea. Change in glycemic control as assessed by change from baseline in hemoglobin A1C and FPG were secondary end points in all the included studies. The estimated treatment difference in all comparisons was in favour of liraglutide 3 mg over placebo, which was expected, given that liraglutide is indicated for glycemic control at a lower dose. However, the results were not controlled for multiplicity to minimize type I error. The results of primary analyses in Study 3970 showed that reduction in the severity of OSA as assessed by AHI scores was statistically significantly greater with liraglutide 3 mg than with placebo after 32 weeks of treatment. However, secondary analysis, not controlled for multiplicity, found no difference in the percentage of patients achieving OSA remission (defined as AHI < 5 events per hour) after 32 weeks of treatment. Other weight-related comorbidities for which there were reported outcomes in the studies were CV comorbidities indicators (SBP, DBP, and lipid profile parameter) and severity in depression. They were all secondary outcomes analyzed with adjustment to reduce type I error. The clinical expert consulted for this review did not consider changes in any of the blood pressure and lipid parameters as being clinically meaningful. The PHQ-9 questionnaire score results did not find any difference between liraglutide 3 mg and placebo concerning changes in depression severity. Overall, no firm conclusions regarding the effect of liraglutide 3 mg on comorbidities can be drawn.
Only descriptive statistics were used for changes in concomitant medications; therefore, any potential effect of liraglutide 3 mg on these outcomes remains unknown.
A key limitation of the studies was the exclusion of patients such as those who underwent bariatric surgery and those who used medications that could induce weight gain. The clinical expert consulted for this review noted that the exclusion criteria of the trials denied entry to a significant portion of patients who have a real need of drug therapy to help manage chronic weight issues. Also, because the studies enrolled predominantly White patients with a BMI of 30 kg/m2 or more, they underrepresent other ethnicities and an important part of the population targeted by the indication (i.e., patients with a BMI of 27 kg/m2 and less than 30 kg/m2 with comorbidities). Thus, it is unknown if the conclusions of the studies will be generalizable in patients different from those adequately represented in the studies.
Another limitation is that all the included studies were placebo-controlled with no direct comparison to any of the approved drugs for the same indication. However, according to the clinical expert, there are limited options for other pharmacotherapy for patients who are overweight or living with obesity in Canada, and there is no 1 “gold standard” medication for this indication. Also, no outcome data were reported for the other efficacy outcomes of interest listed in the protocol for this review.
A protocol-based systematic literature search identified 1 published NMA that compared weight-loss outcomes of liraglutide to orlistat, which was identified as a comparator of interest in the CADTH review protocol. Indirect evidence from the NMA indicated greater improvements with liraglutide 3 mg than with orlistat. However, confidence in the evidence from the NMA is limited by significant heterogeneity and high attrition rates across all the included primary studies.
Harms
In each of the studies included in the systematic review, TEAEs occurred more frequently with liraglutide 3 mg than with placebo. The rate of SAEs was between 3.4% and 15.1% for liraglutide 3 mg compared with 3.3% and 8.6% for placebo. The rate of AEs leading to premature discontinuation of treatment was 8.5% to 13% for liraglutide 3 mg compared with 2.4% and 15.6% for placebo. The most common of these were GI AEs. In general, any individual SAE did not occur frequently, with most SAEs occurring at a rate of less than 2%. The most common SAEs with liraglutide 3 mg (i.e., occurring in ≥ 1% of patients) were hepatobiliary disorders (≤ 2.5% for liraglutide versus 0.8% for placebo), infections and infestations (2.3% for both groups), and GI disorders (≤ 2.2% for liraglutide versus 1.6% for placebo). It is worth noting that the upper end of frequencies were reported in the 160-week extension phase of Study 1839. For other studies of shorter duration, the incidence rate of these SAEs was 0 or less than 2%. Patient organizations that contributed input to the review noted that among reports of weight loss, patients who had experience with liraglutide 3 mg found the side effects undesirable, although they were manageable and not significant enough to deter them from taking the drug. Mortality occurred in Study 1839 and Study 1923. By the end of the extension phase of Study 1839 (160 weeks), each group had a total of 2 deaths, corresponding to mortality rates of 0.1% and 0.3% for the liraglutide 3 mg and placebo groups, respectively. One patient in the placebo group of Study 1923 died by the end of the 56-week treatment. No deaths were reported during Study 1922 or Study 3970.
The clinical expert consulted for the review noted that the observed AEs are aligned with the AEs observed with liraglutide treatment in clinical practice, adding that they can be managed by introducing the drug more gradually than the standard up-titration schedule to get to the maximum tolerated dose. That is consistent with information provided in the liraglutide 3 mg product monograph recommending that the drug should be initiated at a dose of 0.6 mg daily for a week and thereafter escalated at increments of 0.6 mg per week over 4 weeks to reach the 3 mg daily dose. The product monograph states that the escalation period can be extended by an additional week and the drug should be discontinued if a patient cannot tolerate the 3 mg daily dose. However, the clinical expert indicated that there are patients who achieve clinically meaningful weight-loss goals on doses that are lower than liraglutide 3 mg. Therefore, treatment may be tailored to individual patients. The expert noted that the AEs of liraglutide 3 mg are also common with the other Health Canada–approved drugs for chronic weight management.
The incidence of psychiatric AEs ranged from 8.3% to 15.3% for liraglutide 3 mg compared with 8.9% to 15.7% for placebo. The clinical expert commented that careful attention needs to be paid to psychiatric conditions in patients who are overweight or living with obesity. The clinical expert appeared puzzled by the rate of hypoglycemia in patients without diabetes (11.9% to 19.7% for liraglutide 3 mg compared with 3.3% to 4.7% for placebo), explaining that because the mechanism of action of liraglutide in glycemic control is blood glucose–dependent, hypoglycemia in patients without diabetes is unusual. Both psychiatric disorders and hypoglycemia were notable harms specified in the protocol for this review. Another notable harm was cardiac disorders (1.1% to 5.5% for liraglutide versus 2.4% to 7.0% for placebo). Other notable harms occurred rarely. For example, the rate of breast cancer was between 0.2% and 0.5% with liraglutide 3 mg and up to 0.1% with placebo. The clinical expert consulted for this review stated that tumours become easier to identify with weight loss and it is important not to confuse such with AEs.
Indirect evidence from the NMA concerning how the rate of therapy discontinuation due to AEs with liraglutide 3 mg compared with that of orlistat was conflicting and inconclusive.
Conclusions
Overall, the results of 4 RCTs demonstrated that once-daily treatment with liraglutide 3 mg in addition to a background regimen of diet and exercise resulted in statistically significant and clinically meaningful reductions in body weight compared with placebo (in addition to diet and exercise). Further, results demonstrated that liraglutide 3 mg increased the likelihood of achieving 5% or more or more than 10% reduction in body weight. These results were consistently observed in a variety of patient populations, including those without diabetes, those with prediabetes, those with T2DM, and those with OSA. The results of subgroup analyses based on baseline BMI and prediabetes status at screening were consistent with these results. In patients with prediabetes, liraglutide 3 mg also showed superiority over placebo in delaying progression to T2DM. HRQoL was a secondary outcome in each of the trials, but results were inconsistent across measures and studies. Other outcomes of interest to the CADTH review included change in BMI, HRQoL, and glycemic control, and change in other medications. However, none of these outcomes was controlled for multiplicity; therefore, results must be considered with regard to type I error.
TEAEs occurred more frequently with liraglutide 3 mg than placebo. GI disorders were the most common AEs with liraglutide 3 mg and are generally manageable with a dose escalation strategy, as used in the 4 studies and as recommended in the product monograph.
Key limitations associated with the evidence reviewed are that patients with comorbidities and a BMI between 27 kg/m2 and less than 30 kg/m2 appeared to be underrepresented, and that there was a lack of comparative evidence.
Although indirect evidence from 1 NMA may suggest that patients treated with liraglutide 3 mg had greater odds of achieving clinically relevant weight loss (5% to 10%) compared with orlistat, confidence in these results is limited by significant heterogeneity and high attrition rates across all the included primary studies and by significant limitations involving the quality of the primary studies and methodological rigour.
References
1.World Health Organization. Obesity. 2021; https://www.who.int/health-topics/obesity#tab=tab_1. Accessed 2021 Mar 24.
2.Public Health Agency of Canada. Obesity in Canada: executive summary. 2011; https://www.canada.ca/en/public-health/services/health-promotion/healthy-living/obesity-canada/summary.html. Accessed 2021 Mar 24.
3.Statistics Canada. Overweight and obesity based on measured body mass index, by age group and sex. Table 13-10-0373-01. 2020; https://www150.statcan.gc.ca/t1/tbl1/en/tv.action?pid=1310037301. Accessed 2021 Mar 24.
4.Canadian Task Force on Preventive Health Care. CTFPHC Recommendation for the prevention and management of adult obesity. [2015]; https://canadiantaskforce.ca/wp-content/uploads/2016/06/2015-obesity-adults-clinician-summary-en-1.pdf. Accessed 2021 Mar 24.
5.Liraglutide for weight management. Drug Ther Bull. 2017;55(7):78-81. PubMed
6.Avenell A, Broom J, Brown TJ, et al. Systematic review of the long-term effects and economic consequences of treatments for obesity and implications for health improvement. Health Technol Assess. 2004;8(21):iii-iv, 1-182. PubMed
7.National Institute for Health and Care Excellence. Obesity: identification assessment and management (Clinical guideline CG189) 2014; https://www.nice.org.uk/guidance/cg189. Accessed 2021 Mar 24.
8.Ferguson C, David S, Divine L, et al. Obesity drug outcome measures. A consensus report of considerations regarding pharmacologic intervention. Washington, DC: The George Washington University; 2012: https://stop.publichealth.gwu.edu/sites/stop.publichealth.gwu.edu/files/images/Timeline%20Docs/obesitydrugmeasures.pdf. Accessed 2021 Mar 24.
9.Wharton S, Lau DCW, Vallis M, et al. Obesity in adults: a clinical practice guideline. CMAJ. 2020;192(31):E875-E891. PubMed
10.Saxenda (liraglutide) 6 mg/mL solution for injection in a pre-filled pen Human Glucagon Like Peptide-1 (GLP-1) [product monograph]. Mississauga (ON): Novo Nordisk Canada Inc.; 2021 Feb 25.
11.Clinical Trial Report: NN8022-1839. Effect of liraglutide on body weight in non-diabetic obese subjects or overweight subjects with comorbidities: A randomised, double-blind, placebo controlled, parallelgroup, multi-centre, multinational trial with stratification of subject to either 56 or 160 weeks of treatment based on pre-diabetes status at randomisation [internal sponsor's report]. Bagsværd (Denmark): Novo Nordisk 2013 Oct 28.
12.Clinical Trial Report: NN8022-1922. Effect of liraglutide on body weight in overweight or obese subjects with type 2 diabetes - A 56 week randomised, doubleblind, placebo-controlled, three armed parallel group, multi-centre, multinational trial with a 12 week observational follow-up period [internal sponsor's report]. Bagsværd (Denmark): Novo Nordisk; 2013 Oct 28.
13.Clinical Trial Report: NN8022-1923. Effect of liraglutide on long-term weight maintenance and additional weight loss induced by a 4 to 12 week low-calorie diet in obese subjects; A 56 week randomised, double-blind, placebo controlled, parallel group, multi-centre trial with a 12 week follow-up period [internal sponsor's report]. Bagsværd (Denmark): Novo Nordisk; 2013 Oct 31.
14.Clinical Trial Report: NN8022-3970. Effect of liraglutide in obese subjects with moderate or severe obstructive sleep apnoea - a 32 week randomised, double-blind, placebo-controlled, parallel group, multi-centre and multinational trial [internal sponsor's report]. Bagsværd (Denmark): Novo Nordisk; 2013 Oct 15.
15.Clinical Trial Report: NN8022-1839 (3-year part). Effect of liraglutide on body weight in non-diabetic obese subjects or overweight subjects with comorbidities: A randomised, double-blind, placebo controlled, parallelgroup, multi-centre, multinational trial with stratification of subject to either 56 or 160 weeks of treatment based on pre-diabetes status at randomisation [internal sponsor's report]. Bagsværd (Denmark): Novo Nordisk; 2016 Jan 18.
16.Khera R, Murad MH, Chandar AK, et al. Association of pharmacological treatments for obesity with weight loss and adverse events: a systematic review and meta-analysis. JAMA. 2016;315(22):2424-2434. PubMed
17.Puhan MA, Schunemann HJ, Murad MH, et al. A GRADE Working Group approach for rating the quality of treatment effect estimates from network meta-analysis. BMJ. 2014;349:g5630. PubMed
18.Astrup A, Rossner S, Van Gaal L, et al. Effects of liraglutide in the treatment of obesity: a randomised, double-blind, placebo-controlled study. The Lancet. 2009;374(9701):1606-1616. PubMed
19.Petry et al. Overweight and obesity are associated with psychiatric disorders: results from the National Epidemiologic Survey on Alcohol and Related Conditions. 2008.
20.Hargens TA, Kaleth AS, Edwards ES, Butner KL. Association between sleep disorders, obesity, and exercise: a review. Nat Sci Sleep. 2013(5):27-35. PubMed
21.Drug Reimbursement Review sponsor submission: Saxenda (liraglutide 3.0 mg) 6 mgl/mL solution for injection, 3 mL pre-filled pen [internal sponsor's package]. Mississauga (ON): Novo Nordisk Canada Inc.; 2020 Dec 23.
22.Contrave (naltrexone hydrochloride 8 mg and bupropion hydrochloride 90mg): extended-release tablets, antiobesity agent [product monograph]. Laval (QC): Valeant Canada LP; 2018 Feb 12.
23.Xenical (orlistat): 120 mg capsules, anti-obesity agent/gastrointestinal lipase inhibitor [product monograph]. Mesekenhagen (Germany): CHEPLAPHARM Arzneimittel GmbH; 2017 Sep 27: https://pdf.hres.ca/dpd_pm/00041463.PDF.
24.McGowan J, Sampson M, Salzwedel DM, Cogo E, Foerster V, Lefebvre C. PRESS Peer Review of Electronic Search Strategies: 2015 guideline statement. J Clin Epidemiol. 2016;75:40-46. PubMed
25.Grey matters: a practical tool for searching health-related grey literature. Ottawa (ON): CADTH; 2019: https://www.cadth.ca/grey-matters. Accessed 2021 Jan 28.
26.Le Roux CW, Astrup AV, Fujioka K, et al. 3 years of liraglutide versus placebo for type 2 diabetes risk reduction and weight management in individuals with prediabetes: a randomised, double-blind trial. The Lancet. 2017;389(10077):1399-1409. PubMed
27.Davies MJ, Bergenstal R, Bode B. Erratum: NN8022-1922 Study Group. Efficacy of liraglutide for weight loss among patients with type 2 diabetes: the SCALE Diabetes randomized clinical trial (JAMA - Journal of the American Medical Association (2015) 314:7 (687-699)). JAMA. 2016;315(1):90.
28.Wadden TA, Hollander P, Klein S, et al. Weight maintenance and additional weight loss with liraglutide after low-calorie-diet-induced weight loss: the SCALE Maintenance randomized study. Int J Obes. 2013;37(11):1443-1451. PubMed
29.Blackman A, Foster GD, Zammit G, et al. Effect of liraglutide 3.0 mg in individuals with obesity and moderate or severe obstructive sleep apnea: the SCALE Sleep Apnea randomized clinical trial. Int J Obes. 2016;40(8):1310-1319. PubMed
30.Crosby RD, Kolotkin RL, Williams GR. An integrated method to determine meaningful changes in health-related quality of life. J Clin Epidemiol. 2004;57(11):1153-1160. PubMed
31.User's manual for the SF-36v2 health survey. Determining important differences in scores. In: Maruish ME, ed. 3rd ed. Lincoln (RI): Quality Metric Inc.; 2011.
32.Brod M, Hammer M, Kragh N, Lessard S, Bushnell DM. Development and validation of the Treatment Related Impact Measure of Weight (TRIM-Weight). Health Qual Life Outcomes. 2010;8:19. PubMed
33.Bradley C, Gamsu DS. Guidelines for encouraging psychological well-being: report of a Working Group of the World Health Organization Regional Office for Europe and International Diabetes Federation European Region St Vincent Declaration Action Programme for Diabetes. Diabet Med. 1994;11(5):510-516. PubMed
34.Kolawole BA, Abodunde O, Ikem RT, Fabiyi AK. A test of the reliability and validity of a diabetes specific quality of life scale in a Nigerian hospital. Qual Life Res. 2004;13(7):1287-1295. PubMed
35.Division of Sleep Medicine at Harvard Medical School. Apnea: understanding the results. 2011; http://healthysleep.med.harvard.edu/sleep-apnea/diagnosing-osa/understanding-results. Accessed 2021 Mar 31.
36.Lowe B, Unutzer J, Callahan CM, Perkins AJ, Kroenke K. Monitoring depression treatment outcomes with the Patient Health Questionnaire-9. Med Care. 2004;42(12):1194-1201. PubMed
37.Cassin S, Sockalingam S, Hawa R, et al. Psychometric properties of the Patient Health Questionnaire (PHQ-9) as a depression screening tool for bariatric surgery candidates. Psychosomatics. 2013;54(4):352-358. PubMed
38.Khera R, Pandey A, Chandar AK, et al. Effects of weight-loss medications on cardiometabolic risk profiles: a systematic review and network meta-analysis. Gastroenterology. 2018;154(5):1309-1319.e1307. PubMed
39.Dias S, Sutton AJ, Ades AE, Welton NJ. Evidence synthesis for decision making 2: a generalized linear modeling framework for pairwise and network meta-analysis of randomized controlled trials. Med Decis Making. 2013;33(5):607-617. PubMed
40.White IR. Multivariate random-effects meta-regression: updates to mvmeta. Stata J. 2011;11(2):255-270.
41.Jackson D, Bowden J, Baker R. How does the DerSimonian and Laird procedure for random effects meta-analysis compare with its more efficient but harder to compute counterparts? J Stat Plan Inference. 2010;140(4):961-970.
42.Jackson D, Law M, Rucker G, Schwarzer G. The Hartung‐Knapp modification for random‐effects meta‐analysis: A useful refinement but are there any residual concerns? Stat Med. 2017;36(25):3923-3934. PubMed
43.Clinical Trial Report: NN8022-4274. SCALE IBT. Effect and safety of liraglutide 3.0 mg as an adjunct to intensive behaviour therapy for obesity in a non-specialist setting. Trial phase: 3b. Bagsvaerd (Denmark): Novo Nordisk; 2018 Dec 19.
44.Wadden TA, Tronieri JS, Sugimoto D, et al. Liraglutide 3.0 mg and intensive behavioral therapy (IBT) for obesity in primary care: the SCALE IBT randomized controlled trial. Obesity. 2020;28(3):529-536. PubMed
45.Wadden TA, Walsh OA, Berkowitz RI, et al. Intensive behavioral therapy for obesity combined with liraglutide 3.0 mg: a randomized controlled trial. Obesity. 2019;27(1):75-86. PubMed
46.Fan S, Shi X, Yao J, Zhong M, Feng P. The efficacy of glucagon-like peptide 1 receptor agonists in patients with non-alcoholic fatty liver disease: a systematic review and meta-analysis of randomized controlled trials. Rev Esp Enferm Dig. 2020;112(8):627-635. PubMed
47.Ferrari F, Fierabracci P, Salvetti G, et al. Weight loss effect of liraglutide in real-life: the experience of a single Italian obesity center. J Endocrinol Invest. 2020;43(12):1779-1785. PubMed
48.Kadouh H, Chedid V, Halawi H, et al. GLP-1 analog modulates appetite, taste preference, gut hormones, and regional body fat stores in adults with obesity. J Clin Endocrinol Metab. 2020;105(5):01.
49.Kalogirou MS, Patoulias D, Haidich AB, Akriviadis E, Sinakos E. Liraglutide in patients with non-alcoholic fatty liver disease: a systematic review and meta-analysis of randomized controlled trials. Clin Res Hepatol Gastroenterol. 2020;11:11. PubMed
50.Milano W, De Biasio V, Di Munzio W, Foggia G, Capasso A. Obesity: the new global epidemic pharmacological treatment, opportunities and limits for personalized therapy. Endocr Metab Immune Disord Drug Targets. 2020;20(8):1232-1243. PubMed
51.Singh AK, Singh R. Pharmacotherapy in obesity: a systematic review and meta-analysis of randomized controlled trials of anti-obesity drugs. Expert Rev Clin Pharmacol. 2020;13(1):53-64. PubMed
52.Tronieri JS, Wadden TA, Walsh O, et al. Effects of liraglutide on appetite, food preoccupation, and food liking: results of a randomized controlled trial. Int J Obes. 2020;44(2):353-361. PubMed
53.Tronieri JS, Fabricatore AN, Wadden TA, et al. Effects of dietary self-monitoring, physical activity, liraglutide 3.0 mg, and placebo on weight loss in the SCALE IBT trial. Obes Facts. 2020;13(6):572-583. PubMed
54.Chao AM, Wadden TA, Walsh OA, et al. Changes in health-related quality of life with intensive behavioural therapy combined with liraglutide 3.0 mg per day. Clin Obes. 2019;9(6):e12340. PubMed
55.Chao AM, Wadden TA, Walsh OA, et al. Effects of liraglutide and behavioral weight loss on food cravings, eating behaviors, and eating disorder psychopathology. Obesity. 2019;27(12):2005-2010. PubMed
56.Khoo J, Hsiang JC, Taneja R, et al. Randomized trial comparing effects of weight loss by liraglutide with lifestyle modification in non-alcoholic fatty liver disease. Liver Int. 2019;39(5):941-949. PubMed
57.Svensson CK, Larsen JR, Vedtofte L, et al. One-year follow-up on liraglutide treatment for prediabetes and overweight/obesity in clozapine- or olanzapine-treated patients. Acta Psychiatr Scand. 2019;139(1):26-36. PubMed
58.Zhang P, Liu Y, Ren Y, Bai J, Zhang G, Cui Y. The efficacy and safety of liraglutide in the obese, non-diabetic individuals: a systematic review and meta-analysis. Afr Health Sci. 2019;19(3):2591-2599. PubMed
59.Capristo E, Panunzi S, De Gaetano A, et al. Intensive lifestyle modifications with or without liraglutide 3mg vs. sleeve gastrectomy: A three-arm non-randomised, controlled, pilot study. Diabetes Metab. 2018;44(3):235-242. PubMed
60.Cuomo A, Bolognesi S, Goracci A, et al. Feasibility, adherence and efficacy of liraglutide treatment in a sample of individuals with mood disorders and obesity. Front Psychiatr. 2018;9:784. PubMed
61.Kolotkin RL, Gabriel Smolarz B, Meincke HH, Fujioka K. Improvements in health-related quality of life over 3 years with liraglutide 3.0 mg compared with placebo in participants with overweight or obesity. Clin Obes. 2018;8(1):1-10. PubMed
62.LeBlanc EL, Patnode CD, Webber EM, Redmond N, Rushkin M, O'Connor EA. Behavioral and pharmacotherapy weight loss interventions to prevent obesity-related morbidity and mortality in adults: an updated systematic review for the U.S. Preventive Services Task Force. (Evidence synthesis, no. 168). Rockville (MD): Agency for Healthcare Research and Quality; 2018.
63.Wang FF, Wu Y, Zhu YH, et al. Pharmacologic therapy to induce weight loss in women who have obesity/overweight with polycystic ovary syndrome: a systematic review and network meta-analysis. Obes Rev. 2018;19(10):1424-1445. PubMed
64.Erratum: 3 years of liraglutide versus placebo for type 2 diabetes risk reduction and weight management in individuals with prediabetes: a randomised, double-blind trial (The Lancet (2017) 389(10077):(1399-1409)/oi: 10.1016/S0140-6736(17)30069-7. Epub 2017 Feb 23. The Lancet. 2017;389(10077):1398.10.1016/S0140-6736(17)30069-7
65.Bays H, Pi-Sunyer X, Hemmingsson JU, Claudius B, Jensen CB, Van Gaal L. Liraglutide 3.0 mg for weight management: weight-loss dependent and independent effects. Curr Med Res Opin. 2017;33(2):225-229. PubMed
66.Dong Z, Xu L, Liu H, Lv Y, Zheng Q, Li L. Comparative efficacy of five long-term weight loss drugs: quantitative information for medication guidelines. Obes Rev. 2017;18(12):1377-1385. PubMed
67.Gadde KM, Pritham Raj Y. Pharmacotherapy of obesity: clinical trials to clinical practice. Curr Diab Rep. 2017;17(5):34. PubMed
68.Halawi H, Khemani D, Eckert D, et al. Effects of liraglutide on weight, satiation, and gastric functions in obesity: a randomised, placebo-controlled pilot trial. Lancet Gastroenterol Hepatol. 2017;2(12):890-899. PubMed
69.Khoo J, Hsiang J, Taneja R, Law NM, Ang TL. Comparative effects of liraglutide 3 mg vs structured lifestyle modification on body weight, liver fat and liver function in obese patients with non-alcoholic fatty liver disease: A pilot randomized trial. Diabetes Obes Metab. 2017;19(12):1814-1817. PubMed
70.le Roux C, Aroda V, Hemmingsson J, Cancino AP, Christensen R, Pi-Sunyer X. Comparison of efficacy and safety of liraglutide 3.0 mg in individuals with BMI above and below 35 kg/m2: a post-hoc analysis. Obes Facts. 2017;10(6):531-544. PubMed
71.le Roux CW, Astrup A, Fujioka K, et al. 3 years of liraglutide versus placebo for type 2 diabetes risk reduction and weight management in individuals with prediabetes: a randomised, double-blind trial. Lancet. 2017;389(10077):1399-1409. PubMed
72.Mancini MC, De Melo ME. The burden of obesity in the current world and the new treatments available: focus on liraglutide 3.0 mg. Diabetol Metab Syndr. 2017;9(1). PubMed
73.Mehta A, Marso SP, Neeland IJ. Liraglutide for weight management: a critical review of the evidence. Obes. 2017;3(1):3-14. PubMed
74.O'Neil PM, Aroda VR, Astrup A, et al. Neuropsychiatric safety with liraglutide 3.0 mg for weight management: Results from randomized controlled phase 2 and 3a trials. Diabetes Obes Metab. 2017;19(11):1529-1536. PubMed
75.Tomlinson B, Hu M, Zhang Y, Chan P, Liu ZM. Liraglutide for weight management: benefits and risks. Curr Med Res Opin. 2017;33(3):537-539. PubMed
76.von Scholten BJ, Davies MJ, Persson F, et al. Effect of weight reductions on estimated kidney function: Post-hoc analysis of two randomized trials. J Diabetes Complications. 2017;31(7):1164-1168. PubMed
77.Liraglutide (saxenda) for weight loss. JAMA. 2016;315(11):1161-1162. PubMed
78.Ard J, Cannon A, Lewis CE, et al. Efficacy and safety of liraglutide 3.0 mg for weight management are similar across races: subgroup analysis across the SCALE and phase II randomized trials. Diabetes Obes Metab. 2016;18(4):430-435. PubMed
79.Christou GA, Katsiki N, Kiortsis DN. The current role of liraglutide in the pharmacotherapy of obesity. Curr Vasc Pharmacol. 2016;14(2):201-207. PubMed
80.Fujioka K, O'Neil PM, Davies M, et al. Early weight loss with liraglutide 3.0 mg predicts 1-year weight loss and is associated with improvements in clinical markers. Obesity. 2016;24(11):2278-2288. PubMed
81.Manigault KR, Thurston MM. Liraglutide: A glucagon-like peptide-1 agonist for chronic weight management. Consult Pharm. 2016;31(12):685-697. PubMed
82.Moore KG, Shealy K, Clements JN. Liraglutide, GLP-1 receptor agonist, for chronic weight loss. Expert Rev Endocrinol Metab. 2016;11(5):373-378. PubMed
83.O'Neil PM, Garvey WT, Gonzalez-Campoy JM, et al. Effects of of liraglutide 3.0 mg on weight and risk factors in hispanic versus non-hipanic populations: subgroup analysis from scale randomized trials. Endocr Pract. 2016;22(11):1277-1287. PubMed
84.Rondanelli M, Perna S, Astrone P, Grugnetti A, Solerte SB, Guido D. Twenty-four-week effects of liraglutide on body composition, adherence to appetite, and lipid profile in overweight and obese patients with type 2 diabetes mellitus. Patient Prefer Adherence. 2016;10:407-413. PubMed
85.Wise J. Weight loss drugs are compared for effectiveness. BMJ (Online). 2016;353 (no pagination).
86.Liraglutide (saxenda) for weight loss. Med Lett Drugs Ther. 2015;57(1471):89-90. PubMed
87.Liraglutide for obesity. Current Psychiatry. 2015;14(5):43-44.
88.Clements JN, Shealy KM. Liraglutide: an injectable option for the management of obesity. Ann Pharmacother. 2015;49(8):938-944. PubMed
89.Feng P, Yu DM, Chen LM, et al. Liraglutide reduces the body weight and waist circumference in Chinese overweight and obese type 2 diabetic patients. Acta Pharmacol Sin. 2015;36(2):200-208. PubMed
90.Mayor S. Liraglutide improves weight loss in people who are overweight or obese, study shows. BMJ (Online). 2015;351 (no pagination).
91.Soe K, Dungan KM. Subcutaneous liraglutide reduces weight and improves metabolic control in obese participants. Evid Based Med. 2015;20(6):203. PubMed
92.Taylor PN, Baglioni P. Liraglutide in weight management. N Engl J Med. 2015;373(18):1779. PubMed
93.Ariel D, Kim SH, Abbasi F, Lamendola CA, Liu A, Reaven GM. Effect of liraglutide administration and a calorie-restricted diet on lipoprotein profile in overweight/obese persons with prediabetes. Nutr Metab Cardiovasc Dis. 2014;24(12):1317-1322. PubMed
94.Lean ME, Carraro R, Finer N, et al. Tolerability of nausea and vomiting and associations with weight loss in a randomized trial of liraglutide in obese, non-diabetic adults. Int J Obes. 2014;38(5):689-697. PubMed
95.Astrup A, Carraro R, Finer N, et al. Safety, tolerability and sustained weight loss over 2 years with the once-daily human GLP-1 analog, liraglutide. Int J Obes. 2012;36(6):843-854. PubMed
96.Hallberg P, Schwan S, Melhus H. Liraglutide for weight loss in obese people. The Lancet. 2010;375(9714):551. PubMed
97.Hutchinson E. Liraglutide induces weight loss. Nat Rev Gastroenterol Hepatol. 2010;7(2):68.
98.Scherbaum WA, Nitschmann S. [Therapy of obesity with liraglutide. NN8022-1807 study]. Internist. 2010;51(8):1064-1066.
99.Astrup A, Rossner S, Van Gaal L, et al. Effects of liraglutide in the treatment of obesity: a randomised, double-blind, placebo-controlled study. Lancet. 2009;374(9701):1606-1616. PubMed
100.Kolotkin RL, Head S, Brookhart A. Construct validity of the Impact of Weight on Quality of Life Questionnaire. Obes Res. 1997;5(5):434-441. PubMed
101.Kolotkin RL, Williams VSL, Ervin CM, et al. Validation of a new measure of quality of life in obesity trials: Impact of Weight on Quality of Life-Lite clinical trials version. Clin Obes. 2019;9(3):e12310. PubMed
102.Kolotkin RL, Head S, Hamilton M, Tse CK. Assessing impact of weight on quality of life. Obes Res. 1995;3(1):49-56. PubMed
103.Kolotkin RL, Crosby RD. Psychometric evaluation of the impact of weight on quality of life-lite questionnaire (IWQOL-lite) in a community sample. Qual Life Res. 2002;11(2):157-171. PubMed
104.Cohen J. A power primer. Psychol Bull. 1992;112(1):155-159. PubMed
105.Reeve BB, Wyrwich KW, Wu AW, et al. ISOQOL recommends minimum standards for patient-reported outcome measures used in patient-centered outcomes and comparative effectiveness research. Qual Life Res. 2013;22(8):1889-1905. PubMed
106.Tessier A, Mayo NE, Cieza A. Content identification of the IWQOL-Lite with the international classification of functioning, disability and health. Qual Life Res. 2011;20(4):467-477. PubMed
107.Kolotkin RL, Crosby RD, Williams GR. Assessing weight-related quality of life in obese persons with type 2 diabetes. Diabetes Res Clin Pract. 2003;61(2):125-132. PubMed
108.Ware JE, Jr., Sherbourne CD. The MOS 36-item short-form health survey (SF-36). I. Conceptual framework and item selection. Med Care. 1992;30(6):473-483. PubMed
109.Al Amer R, Al Khalifa K, Alajlan SA, Al Ansari A. Analyzing the psychometric properties of the Short Form-36 Quality of Life Questionnaire in patients with obesity. Obes Surg. 2018;28(8):2521-2527. PubMed
110.Corica F, Corsonello A, Apolone G, et al. Construct validity of the Short Form-36 health survey and its relationship with BMI in obese outpatients. Obesity. 2006;14(8):1429-1437. PubMed
111.Karlsen TI, Tveita EK, Natvig GK, Tonstad S, Hjelmesaeth J. Validity of the SF-36 in patients with morbid obesity. Obes Facts. 2011;4(5):346-351. PubMed
112.Hirsch A, Bartholomae C, Volmer T. Dimensions of quality of life in people with non-insulin-dependent diabetes. Qual Life Res. 2000;9(2):207-218. PubMed
113.Nicolucci A, Giorgino R, Cucinotta D, et al. Validation of the Italian version of the WHO-Well-Being Questionnaire (WHO-WBQ) and the WHO-Diabetes Treatment Satisfaction Questionnaire (WHO-DTSQ). Diabet Nutr Metab - Clin Exp. 2004;17(4):235-243.
114.Ozmen B, Eser E, Ozkaya Kafesciler S, Pala T, Guclu F, Hekimsoy Z. Psychometric properties and responsiveness of the Turkish version of the Diabetes Treatment Satisfaction Questionnaire (s) on a sample of diabetics of three consecutive monitoring periods. Acta Diabetol. 2010;47 Suppl 1:123-131. PubMed
115.Kontodimopoulos N, Arvanitaki E, Aletras VH, Niakas D. Psychometric properties of the Greek Diabetes Treatment Satisfaction Questionnaire. Health Qual Life Outcomes. 2012;10:17. PubMed
116.Roborel de Climens A, Tunceli K, Arnould B, et al. Review of patient-reported outcome instruments measuring health-related quality of life and satisfaction in patients with type 2 diabetes treated with oral therapy. Curr Med Res Opin. 2015;31(4):643-665. PubMed
117.Posner K, Brown GK, Stanley B, et al. The Columbia-Suicide Severity Rating Scale: initial validity and internal consistency findings from three multisite studies with adolescents and adults. Am J Psychiatry. 2011;168(12):1266-1277. PubMed
118.Zakhour M, Haddad C, Sacre H, et al. Suicidal ideation among Lebanese adults: scale validation and correlates. BMC Psychiatry. 2021;21(1):100. PubMed
Appendix 1: Literature Search Strategy
Note that this appendix has not been copy-edited.
Clinical Literature Search
Overview
Interface: Ovid
Databases:
MEDLINE All (1946-present)
Embase (1974-present)
Note: Subject headings and search fields have been customized for each database. Duplicates between databases were removed in Ovid.
Date of Search: January 27, 2021
Alerts: Bi-weekly search updates until project completion
Study Types: Randomized controlled trials; controlled clinical trials.
Limits:
No publication date limits
Humans
No language limits
Conference abstracts: excluded
Syntax | Description |
|---|---|
/ | At the end of a phrase, searches the phrase as a subject heading |
MeSH | Medical Subject Heading |
exp | Explode a subject heading |
* | Before a word, indicates that the marked subject heading is a primary topic; or, after a word, a truncation symbol (wildcard) to retrieve plurals or varying endings |
# | Truncation symbol for one character |
? | Truncation symbol for one or no characters only |
adj# | Requires terms to be adjacent to each other within # number of words (in any order) |
.ti | Title |
.ot | Original title |
.ab | Abstract |
.hw | Heading word; usually includes subject headings and controlled vocabulary |
.kf | Author keyword heading word (MEDLINE) |
.kw | Author keyword (Embase) |
.dq | Candidate term word (Embase) |
.pt | Publication type |
.rn | Registry number |
.nm | Name of substance word (MEDLINE) |
.yr | Publication year |
.jw | Journal title word (MEDLINE) |
.jx | Journal title word (Embase) |
freq=# | Requires terms to occur # number of times in the specified fields |
medall | Ovid database code: MEDLINE All, 1946 to present, updated daily |
oemezd | Ovid database code; Embase, 1974 to present, updated daily |
Multi-Database Strategy
Search Strategy
liraglutide/
(saxenda* or liraglutid* or victoza* or HSDB-8205 or HSDB8205 or NN-2211 or NN2211 or NN 9924 or NN9924 or NNC 90-1170 or NNC901170 or NNC 901170 or NNC90 1170 or 839I73S42A).ti,ab,ot,kf,hw,nm,rn.
1 or 2
weight loss/ or body mass index/ or exp overweight/ or exp anti-obesity agents/ or weight gain/ or adiposity/ or obesity management/
((weight* or fat) adj4 (loss* or losing or lost or reduc* or decreas* or gain* or increas* or excess* or manag* or chang*)).ti,ab,kf.
(obese or obesity or superobese or superobesity or morbidobese or morbidlyobese or antiobes* or overweight or adiposit* or corpulen*).ti,ab,kf.
(Quetelet Index or Quetelet's Index).ti,ab,kf.
((body mass index or BMI) adj3 (reduc* or lower* or great* or higher* or increase*)).ti,ab,kf.
or/4-8
3 and 9
10 use medall
*liraglutide/
(saxenda* or liraglutid* or victoza* or HSDB-8205 or HSDB8205 or NN-2211 or NN2211 or NN 9924 or NN9924 or NNC 90-1170 or NNC901170 or NNC 901170 or NNC90 1170).ti,ab,kw,dq.
12 or 13
body weight loss/ or body mass/ or exp obesity/ or body weight gain/ or obesity management/ or exp antiobesity agent/ or antiobesity activity/
((weight* or fat) adj4 (loss* or losing or lost or reduc* or decreas* or gain* or increas* or excess* or manag* or chang*)).ti,ab,kw,dq.
(obese or obesity or superobese or superobesity or morbidobese or morbidlyobese or antiobes* or overweight or adiposit* or corpulen*).ti,ab,kw,dq.
(Quetelet Index or Quetelet's Index).ti,ab,kw,dq.
((body mass index or BMI) adj3 (reduc* or lower* or great* or higher* or increase*)).ti,ab,kw,dq.
or/15-19
14 and 20
21 use oemezd
22 not (conference abstract or conference review).pt.
11 or 23
(Randomized Controlled Trial or Controlled Clinical Trial or Pragmatic Clinical Trial or Equivalence Trial or Clinical Trial, Phase III).pt.
Randomized Controlled Trial/
exp Randomized Controlled Trials as Topic/
"Randomized Controlled Trial (topic)"/
Controlled Clinical Trial/
exp Controlled Clinical Trials as Topic/
"Controlled Clinical Trial (topic)"/
Randomization/
Random Allocation/
Double-Blind Method/
Double Blind Procedure/
Double-Blind Studies/
Single-Blind Method/
Single Blind Procedure/
Single-Blind Studies/
Placebos/
Placebo/
Control Groups/
Control Group/
(random* or sham or placebo*).ti,ab,hw,kf,kw.
((singl* or doubl*) adj (blind* or dumm* or mask*)).ti,ab,hw,kf,kw.
((tripl* or trebl*) adj (blind* or dumm* or mask*)).ti,ab,hw,kf,kw.
(control* adj3 (study or studies or trial* or group*)).ti,ab,kf,kw.
(Nonrandom* or non random* or non-random* or quasi-random* or quasirandom*).ti,ab,hw,kf,kw.
allocated.ti,ab,hw.
((open label or open-label) adj5 (study or studies or trial*)).ti,ab,hw,kf,kw.
((equivalence or superiority or non-inferiority or noninferiority) adj3 (study or studies or trial*)).ti,ab,hw,kf,kw.
(pragmatic study or pragmatic studies).ti,ab,hw,kf,kw.
53.((pragmatic or practical) adj3 trial*).ti,ab,hw,kf,kw.
((quasiexperimental or quasi-experimental) adj3 (study or studies or trial*)).ti,ab,hw,kf,kw.
(phase adj3 (III or "3") adj3 (study or studies or trial*)).ti,hw,kf,kw.
or/25-55
24 and 56
exp animals/
exp animal experimentation/ or exp animal experiment/
exp models animal/
nonhuman/
exp vertebrate/ or exp vertebrates/
or/58-62
exp humans/
exp human experimentation/ or exp human experiment/
or/64-65
63 not 66
57 not 67
remove duplicates from 68
Clinical Trials Registries
ClinicalTrials.gov
Produced by the U.S. National Library of Medicine. Targeted search used to capture registered clinical trials.
Search – Studies with results on liraglutide AND (weight management OR obesity)
WHO ICTRP
International Clinical Trials Registry Platform (ICTRP), produced by the World Health Organization. Targeted search used to capture registered clinical trials.
Search – liraglutide AND weight management
Health Canada’s Clinical Trials Database
Produced by Health Canada. Targeted search used to capture registered clinical trials.
Search terms -- liraglutide AND (weight management OR obesity)
EU Clinical Trials
Register European Union Clinical Trials Register, produced by the European Union. Targeted search used to capture registered clinical trials.
Search terms -- liraglutide AND (weight management OR obesity)
Grey Literature
Search dates: January 20, 2021 – January 22, 2021
Keywords: (saxenda OR liraglutide) AND (weight management OR obesity)
Limits: No publication limits
Updated: Search updated prior to the completion of stakeholder feedback period
Relevant websites from the following sections of the CADTH grey literature checklist Grey Matters: A Practical Tool for Searching Health-Related Grey Literature (https://www.cadth.ca/grey-matters) were searched:
Health Technology Assessment Agencies
Health Economics
Clinical Practice Guidelines
Drug and Device Regulatory Approvals
Advisories and Warnings
Drug Class Reviews
Clinical Trials Registries
Databases (free)
Health Statistics
Internet Search
Open Access Journals.
Appendix 2: Excluded Studies
Note that this appendix has not been copy-edited.
Reference | Reason for exclusion |
|---|---|
Fan. S., et al. The efficacy of glucagon-like peptide 1 receptor agonists in patients with non-alcoholic fatty liver disease: a systematic review and meta-analysis of randomized controlled trials. Revista Española de Enfermedades Digestivas 2020;112(8):627-635.46 | Study Design and Population |
Ferrari, F., et al. Weight loss effect of liraglutide in real-life: the experience of a single Italian obesity center. Journal of Endocrinological Investigation 2020;43(12):1779-1785.47 | Study Design |
Kadouh, H., et al. GLP-1 Analog Modulates Appetite, Taste Preference, Gut Hormones, and Regional Body Fat Stores in Adults with Obesity. Journal of Clinical Endocrinology and Metabolism 2020;105(5):01.48 | Intervention and Outcomes |
Kalogirou, M. S., et al. Liraglutide in patients with non-alcoholic fatty liver disease: a systematic review and meta-analysis of randomized controlled trials. Clinics & Research in Hepatology & Gastroenterology 2020;11(11).49 | Study Design and Population |
Milano, W., et al. Obesity: The New Global Epidemic Pharmacological Treatment, Opportunities and Limits for Personalized Therapy. Endocrine, Metabolic & Immune Disorders Drug Targets 2020;20(8):1232-1243.50 | Study Design |
Singh, A. K., et al. Pharmacotherapy in obesity: a systematic review and meta-analysis of randomized controlled trials of anti-obesity drugs. Expert Review of Clinical Pharmacology 2020;13(1):53-64.51 | Study Design |
Tronieri, J. S., et al. Effects of liraglutide on appetite, food preoccupation, and food liking: results of a randomized controlled trial. International Journal of Obesity 2020;44(2):353-361.52 | Intervention and Outcomes |
Tronieri, J. A., et al. Effects of Dietary Self-Monitoring, Physical Activity, Liraglutide 3.0 mg, and Placebo on Weight Loss in the SCALE IBT Trial. Obesity Facts 2020;13(6):572-583.53 | Intervention and Comparator |
Chao, A. M., et al. Changes in health-related quality of life with intensive behavioural therapy combined with liraglutide 3.0 mg per day. Clinical Obesity 2019;9(6):e12340.54 | Intervention |
Chao, A. M., et al. Effects of Liraglutide and Behavioral Weight Loss on Food Cravings, Eating Behaviors, and Eating Disorder Psychopathology. Obesity 2019;27(12):2005-2010.55 | Intervention |
Khoo, J., et al. Randomized trial comparing effects of weight loss by liraglutide with lifestyle modification in non-alcoholic fatty liver disease. Liver International 2019;39(5):941-949.56 | Study Population |
Svensson, C. K., et al. One-year follow-up on liraglutide treatment for prediabetes and overweight/obesity in clozapine- or olanzapine-treated patients. Acta Psychiatrica Scandinavica 2019;139(1):26-36.57 | Study Population |
Zhang, P., et al. The efficacy and safety of liraglutide in the obese, non-diabetic individuals: a systematic review and meta-analysis. African Health Sciences 2019;19(3):2591-2599.58 | Study Design |
Capristo, R., et al. Intensive lifestyle modifications with or without liraglutide 3mg vs. sleeve gastrectomy: A three-arm non-randomised, controlled, pilot study. Diabetes and Metabolism 2018;44(3):235-242.59 | Intervention & Comparator |
Cuomo, A., et al. Feasibility, Adherence and Efficacy of Liraglutide Treatment in a Sample of Individuals With Mood Disorders and Obesity. Frontiers in psychiatry Frontiers Research Foundation 2018 9(784).60 | Study Population |
Kolotkin, R. L., et al. Improvements in health-related quality of life over 3 years with liraglutide 3.0 mg compared with placebo in participants with overweight or obesity. Clinical Obesity 2018 8(1):1-10.61 | Study Design |
LeBlanc, E. L., et al. Behavioral and Pharmacotherapy Weight Loss Interventions to Prevent Obesity-Related Morbidity and Mortality in Adults: An Updated Systematic Review for the U.S. Preventive Services Task Force. Agency for Healthcare Research and Quality 2018;09.62 | Study Design |
Wang, F., et al. Pharmacologic therapy to induce weight loss in women who have obesity/overweight with polycystic ovary syndrome: a systematic review and network meta-analysis. 2018.63 | Study Population |
Anonymous. Erratum: 3 years of liraglutide versus placebo for type 2 diabetes risk reduction and weight management in individuals with prediabetes: a randomised, double-blind trial (The Lancet (2017) 389(10077) (1399-1409) (S0140673617300697) (10.1016/S0140-6736(17)30069-7)). The Lancet 2017;389(10077):1398.64 | Study Design |
Anonymous. Liraglutide for weight management. Drug and Therapeutics Bulletin 2017;55(7):78-81.5 | Study Design |
Bays, H., et al. Liraglutide 3.0 mg for weight management: weight-loss dependent and independent effects. Current Medical Research and Opinion 2017; 33(2):225-229.65 | Study Design & Intervention |
Dong, Z., et al. Comparative efficacy of five long-term weight loss drugs: quantitative information for medication guidelines. Obesity Reviews 2017 18(12):1377-1385.66 | Study Design & Intervention |
Gadde, K. M., et al. Pharmacotherapy of Obesity: Clinical Trials to Clinical Practice. Current Diabetes Reports 2017;17(5):34.67 | Study Design |
Halawi, H., et al. Effects of liraglutide on weight, satiation, and gastric functions in obesity: a randomised, placebo-controlled pilot trial. 2017.68 | Intervention |
Khoo, J., et al. Comparative effects of liraglutide 3 mg vs structured lifestyle modification on body weight, liver fat and liver function in obese patients with non-alcoholic fatty liver disease: A pilot randomized trial. 2017.69 | Study Population |
Le Roux, C., et al. Comparison of Efficacy and Safety of Liraglutide 3.0 mg in Individuals with BMI above and below 35 kg/m2: A Post-hoc Analysis. Obesity Facts 2017;10(6):531-544.70 | Study Design |
Le Roux, C. W., 3 years of liraglutide versus placebo for type 2 diabetes risk reduction and weight management in individuals with prediabetes: a randomised, double-blind trial. Lancet 2017;389(10077):1399-1409.71 | Intervention |
Mancini, M. C., et al. The burden of obesity in the current world and the new treatments available: focus on liraglutide 3.0 mg. Diabetology and Metabolic Syndrome 2017;9(1)72: | Study Design |
Mehta, A., et al. Liraglutide for weight management: a critical review of the evidence. Obesity Science & Practice 2017;3(1):3-14.73 | Study Design |
O’Neil, P. M., et al. Neuropsychiatric safety with liraglutide 3.0 mg for weight management: Results from randomized controlled phase 2 and 3a trials. Diabetes, Obesity & Metabolism 2017;19(11):1529-1536.74 | Study Design |
Tomlinson, B., et al. Liraglutide for weight management: benefits and risks. Current Medical Research and Opinion 2017;33(3):537-539.75 | Study Design |
Von Scholten, B. J., et al. Effect of weight reductions on estimated kidney function: Post-hoc analysis of two randomized trials. Journal of Diabetes and Its Complications 2017;31(7):1164-1168.76 | Study Design |
Anonymous. Liraglutide (Saxenda) for weight loss. JAMA - Journal of the American Medical Association 2016;315(11):1161-1162.77 | Study Design |
Ard, J., et al. Efficacy and safety of liraglutide 3.0 mg for weight management are similar across races: subgroup analysis across the SCALE and phase II randomized trials. Diabetes, Obesity & Metabolism 2016;18(4):430-5.78 | Study Design, Intervention, and Comparator |
Christou, G. A., et al. The Current Role of Liraglutide in the Pharmacotherapy of Obesity. Current Vascular Pharmacology 2016;14(2):201-7.79 | Study Design |
Fujioka, K., et al. Early Weight Loss with Liraglutide 3.0 mg Predicts 1-Year Weight Loss and is Associated with Improvements in Clinical Markers. Obesity 2016;24(11):2278-2288.80 | Study Design |
Khera, R., et al. Association of Pharmacological Treatments for Obesity With Weight Loss and Adverse Events: A Systematic Review and Meta-analysis. JAMA;2016 315(22):2424-34.16 | Study Design |
Manigault, K. R., et al. Liraglutide: A glucagon-like peptide-1 agonist for chronic weight management. Consultant Pharmacist 2016;31(12):685-697.81 | Study Design |
Moore, K. G., et al. Liraglutide, GLP-1 receptor agonist, for chronic weight loss. Expert Review of Endocrinology & Metabolism 2016;11(5):373-378.82 | Study Design |
O’Neil, P. M., et al. Effects of Liraglutide 3.0 Mg on Weight and Risk Factors in Hispanic Versus Non-Hipanic Populations: Subgroup Analysis from Scale Randomized Trials. Endocrine Practice 2016;22(11):1277-1287.83 | Study Design, Intervention, and Comparator |
Rondanelli, M., et al. Twenty-four-week effects of liraglutide on body composition, adherence to appetite, and lipid profile in overweight and obese patients with type 2 diabetes mellitus. Patient Preference and Adherence 2016;10(407-413.84 | Study Design |
Wise, J. Weight loss drugs are compared for effectiveness. BMJ (Online) 2016;353 (no pagination)(Weight loss drugs are compared for effectiveness.85 | Study Design |
Anonymous. Glucose-lowering treatment of type 2 diabetes: Part II - glucose-lowering drugs after metformin: A choice based largely on adverse effects. Prescrire International 2015;24(160):130-135.86 | Study Design |
Anonymous. Liraglutide for obesity. Current Psychiatry 2015;14(5):43-44.87 | Study Design |
Clements, J. N., et al. Liraglutide: an injectable option for the management of obesity. Annals of Pharmacotherapy 2015;49(8):938-44.88 | Study Design |
Feng, P., et al. Liraglutide reduces the body weight and waist circumference in Chinese overweight and obese type 2 diabetic patients. Acta Pharmacologica Sinica 2015;36(2):200-8.89 | Intervention |
Mayor, S. BMJ (Online). 2015;351 (no pagination)(Liraglutide improves weight loss in people who are overweight or obese, study shows).90 | Study Design |
Soe, K., et al. Subcutaneous liraglutide reduces weight and improves metabolic control in obese participants. Evidence-Based Medicine 2015;20(6):203.91 | Study Design |
Taylor, P. N., et al. Liraglutide in weight management. New England Journal of Medicine 2015;373(18):1779.92 | Study Design |
Ariel, D., et al. Effect of liraglutide administration and a calorie-restricted diet on lipoprotein profile in overweight/obese persons with prediabetes. Nutrition Metabolism & Cardiovascular Diseases 2014;24(12):1317-22.93 | Intervention |
Lean, M. E., et al. Tolerability of nausea and vomiting and associations with weight loss in a randomized trial of liraglutide in obese, non-diabetic adults. International Journal of Obesity 2014;38(5):689-97.94 | Intervention |
Astrup, A., et al. Safety, tolerability and sustained weight loss over 2 years with the once-daily human GLP-1 analog, liraglutide. International Journal of Obesity 2012;36(6):843-54.95 | Intervention |
Hallberg, P., et al. Liraglutide for weight loss in obese people. The Lancet 2010;375(9714):551.96 | Study Design |
Hutchinson, E. Liraglutide induces weight loss. Nature Reviews Gastroenterology and Hepatology 2010;7(2):68.97 | Study Design |
Scherbaum, W. A., et al. [Therapy of obesity with liraglutide. NN8022-1807 study]. Internist 2010;51(8):1064-6.98 | Language |
Astrup, A., et al. Effects of liraglutide in the treatment of obesity: a randomised, double-blind, placebo-controlled study. Lancet 2009;374(9701):1606-16.99 | Intervention |
Appendix 3: Detailed Outcome Data
Note that this appendix has not been copy-edited.
Subgroup Analyses
Diabetes Status – With or Without Prediabetes at Screening
Study 1839 – Treatment Effects in Main Treatment Period (0 - 56 Weeks) by Prediabetes Status at Screening – ANCOVA – FAS
Table 72: Study 1839 — Change From Baseline in Fasting Body Weight (%), FAS
Subgroups of co-primary end point | Change (%) in body wt. from baseline to week 56 | |
|---|---|---|
Diabetes status | LIRA 3 mg | Placebo |
Patients with prediabetes | N = 1,495 | N = 746 |
Change from baseline, mean (SD) | −8.01 (6.51) | −2.59 (5.35) |
LSM | −8.04 | −2.53 |
Difference, LIRA 3.0 - Placebo (95% CI) | −5.51 (−6.07 to −4.96) | |
P value | < 0.0001 | |
Patient without prediabetes | N = 942 | N = 479 |
Change from baseline, mean (SD) | −7.92 (6.93) | −2.68 (6.30) |
LSM | −7.93 | −2.66 |
Difference, LIRA 3.0 - Placebo (95% CI) | −5.27 (−5.97 to −4.57) | |
P value | < 0.0001 | |
CI = confidence interval; LIRA 3 mg = liraglutide 3 mg; LSM = least squares.
Source: Clinical Study Report 1839.
Table 73: Study 1839 – Losing At Least 5% of Baseline Fasting Body Weight
Subgroups of co-primary end point | 5% responders at week 56 | |
|---|---|---|
Diabetes status | LIRA 3 mg | Placebo |
Patients with prediabetes | N = 1,495 | N = 746 |
Patients losing ≥ 5% baseline body weight, n (%) | 955 (64.1) | |
LSM, odds | 1.83 | 0.36 |
OR (95% CI) | 5.09 (4.18 to 6.21) | |
P value | < 0.0001 | |
Patient without prediabetes | N = 942 | N = 479 |
Patients losing ≥ 5% baseline body weight, n (%) | 581 (61.7) | 130 (27.2) |
LSM, odds | 1.62 | 0.35 |
OR (95% CI) | 4.64 (3.62 to 5.96) | |
P value | < 0.0001 | |
LSM, odds | 1.94 | 0.33 |
OR (95% CI) | 5.85 (4.43, 7.73) | |
P value | < 0.0001 | |
OR (95% CI) | 4.99 (3.80 to 6.55) | |
P value | < 0.0001 | |
CI = confidence interval; LIRA 3 mg = liraglutide 3 mg; LSM = least squares mean; OR = odds ratio.
Source: Clinical Study Report 1839.
Table 74: Study 1839 – Losing at 10% or More of Baseline Fasting Body Weight, FAS
Subgroups of co-primary end point | 10% responders at week 56 | |
|---|---|---|
Diabetes status | LIRA 3 mg | Placebo |
Patients with prediabetes | N = 1,495 | N = 746 |
Patients Losing > 10% baseline body weight, n (%) | 486 (32.6) | 76 (10.2) |
LSM, odds | 0.47 | 0.11 |
OR (95% CI) | 4.45 (3.42 to 5.80) | |
P value | < 0.0001 | |
Patient without prediabetes | N = 942 | N = 479 |
Patients Losing > 10% baseline body weight, n (%) | 319 (33.9) | 53 (11.1) |
LSM, odds | 0.51 | 0.12 |
OR (95% CI), LIRA / Placebo | 4.17 (3.03 to 5.74) | |
P value | < 0.0001 | |
CI = confidence interval; LIRA 3 mg = liraglutide 3 mg; LSM = least squares mean; OR = odds ratio.
Source: Clinical Study Report 1839.
BMI Subgroup Categories at Baseline
Study 1839 – Treatment Effects in Main Treatment Period (0 to 56 Weeks) in Baseline BMI Subgroups – FAS
Table 75: Study 1839 — Change From Baseline in Fasting Body Weight (%), FAS
Subgroups of co-primary end point | Change (%) in body weight from baseline to week 56 | |
|---|---|---|
BMI category | LIRA 3 mg | Placebo |
27.0 to <30.0 kg/m2 | N = 65 | N = 43 |
LSM change from baseline | −7.46 | −0.94 |
Difference, LIRA - Placebo (95% CI) | −6.52 (−9.16 to −3.88) | |
P value | < 0.0001 | |
30.0 – 34.9 kg/m2, n (%) | N = 790 | N = 380 |
LSM change from baseline | −8.33 | −2.60 |
Difference, LIRA - Placebo (95% CI) | −5.73 (−6.51 to −4.95) | |
P value | < 0.0001 | |
35.0 – 39.9 kg/m2, n (%) | N = 770 | N = 395 |
LSM change from baseline | −9.26 | −3.35 |
Difference, LIRA - Placebo (95% CI) | −5.73 (−6.51 to −4.95) | |
P value | < 0.0001 | |
≥ 40.0 kg/m2, n (%) | N = 812 | N = 407 |
LSM change from baseline | −7.40 | −2.83 |
Difference, LIRA - Placebo (95% CI) | −4.57 (−5.33 to −3.81) | |
P value | < 0.0001 | |
BMI = body mass index; CI = confidence interval; LIRA 3 mg = liraglutide 3 mg; LSM = least squares mean.
Source: Clinical Study Report 1839.
Table 76: Study 1839 — Losing At Least 5% of Baseline Fasting Body Weight, FAS
Subgroups of co-primary end point | 5% responders at week 56 | |
|---|---|---|
BMI category | LIRA 3 mg | Placebo |
27.0 to <30.0 kg/m2 | N = 65 | N = 43 |
LSM, odds | 2.29 | 0.43 |
OR (95% CI) | 5.34 (2.26 to12.59) | |
P value | < 0.0001 | |
30.0 – 34.9 kg/m2, n (%) | N = 790 | N = 380 |
LSM, odds | 1.94 | 0.33 |
OR (95% CI), LIRA/Placebo | 5.85 (4.43 to 7.73) | |
P value | < 0.0001 | |
35.0 – 39.9 kg/m2, n (%) | N = 770 | N = 395 |
LSM, odds | 1.74 | 0.35 |
OR (95% CI), LIRA/Placebo | 4.99 (3.80 to 6.55) | |
P value | < 0.0001 | |
≥ 40.0 kg/m2, n (%) | N = 812 | N = 407 |
LSM, odds | 1.54 | 0.40 |
OR (95% CI), LIRA/Placebo | 3.85 (2.96 to 5.00) | |
P value | < 0.0001 | |
BMI = body mass index; CI = confidence interval; LIRA 3 mg = liraglutide 3 mg; LSM = least squares mean; OR = odds ratio.
Table 77: Study 1839 – Losing At Least 10% or More of Baseline Fasting Body Weight, FAS
Subgroups of co-primary end point | 10% responders at week 56 | |
|---|---|---|
BMI category | LIRA 3 mg | Placebo |
27.0 to <30.0 kg/m2 | N = 65 | N = 43 |
LSM, odds | 0.85 | 0.10 |
OR (95% CI), LIRA/Placebo) | 8.46 (2.66 to 26.95) | |
P value | 0.0003 | |
30.0 – 34.9 kg/m2, n (%) | N = 790 | N = 380 |
LSM, odds | 0.51 | 0.12 |
OR (95% CI), LIRA/Placebo | 4.35 (3.06 to 6.20) | |
P value | < 0.0001 | |
35.0 – 39.9 kg/m2, n (%) | N = 770 | N = 395 |
LSM, odds | 0.51 | 0.08 |
OR (95% CI), LIRA/Placebo | 6.5 (4.34 to 9.75) | |
P value | < 0.0001 | |
≥ 40.0 kg/m2, n (%) | N = 812 | N = 407 |
LSM, odds | 0.43 | 0.14 |
OR (95% CI), LIRA/Placebo | 2.99 (2.14 to 4.17) | |
P value | < 0.0001 | |
BMI = body mass index; CI = confidence interval; LIRA 3 mg = liraglutide 3 mg; LSM = least squares mean; OR = odds ratio.
Study 1839 Extension – Treatment Effects After 160 Weeks of Treatment in Baseline BMI Subgroups – FAS
Table 78: Study 1839 Extension — Change From Baseline in Fasting Body Weight (%), FAS
Subgroups of co-primary end point | Change (%) in body weight from baseline to week 160 | |
|---|---|---|
BMI category | LIRA 3 mg | Placebo |
27.0 to <30.0 kg/m2 | N = 39 | N = 23 |
LSM change from baseline | −5.68 | −1.77 |
Difference, LIRA 3.0 - Placebo (95% CI) | −5.24 (−9.24 to −1.24) | |
P value | 0.0102 | |
30.0 – 34.9 kg/m2, n (%) | N = 415 | N = 192 |
LSM change from baseline | −6.48 | −1.74 |
Difference, LIRA 3.0 - Placebo (95% CI) | −4.83 (−6.05 to −3.62) | |
P value | < 0.0001 | |
35.0 – 39.9 kg/m2, n (%) | N = 480 | N = 243 |
LSM change from baseline | −6.15 | −1.77 |
Difference, LIRA 3.0 - Placebo (95% CI) | −4.65 (−5.75 to −3.55) | |
P value | < 0.0001 | |
≥ 40.0 kg/m2, n (%) | N = 538 | N = 280 |
LSM change from baseline | −5.91 | −2.11 |
Difference, LIRA 3.0 - Placebo (95% CI) | −3.74 (−4.75 to −2.72) | |
P value | < 0.0001 | |
BMI = body mass index; CI = confidence interval; LIRA 3 mg = liraglutide 3 mg; LSM = least squares mean.
Table 79: Study 1839 Extension — Losing At Least 5% of Baseline Fasting Body Weight, FAS
Subgroups of co-primary end point | 5% responders at week 160 | |
|---|---|---|
BMI category | LIRA 3 mg | Placebo |
27.0 to <30.0 kg/m2 | N = 39 | N = 23 |
LSM, odds | 0.139 | 0.028 |
OR (95% CI), LIRA/Placebo | 4.956 (1.323 to 18.573) | |
P value | 0.0176 | |
30.0 – 34.9 kg/m2, n (%) | N = 415 | N = 192 |
LSM, odds | 0.852 | 0.197 |
OR (95% CI) | 4.329 (2.879 to 6.509) | |
P value | < 0.0001 | |
35.0 – 39.9 kg/m2, n (%) | N = 480 | N = 243 |
LSM, odds | 1.011 | 0.346 |
OR (95% CI), LIRA/Placebo | 2.918 (2.070 to 4.115) | |
P value | < 0.0001 | |
≥ 40.0 kg/m2, n (%) | N = 538 | N = 280 |
LSM, odds | 1.030 | 0.364 |
OR (95% CI), LIRA/Placebo | 2.82. (2.044 to 3.915) | |
P value | < 0.0001 | |
BMI = body mass index; CI = confidence interval; LIRA 3 mg = liraglutide 3 mg; LSM = least squares mean; OR = odds ratio.
Table 80: Study 1839 Extension — Losing At 10% or More of Baseline Fasting Body
Subgroups of co-primary end point | 10% responders at week 160 | |
|---|---|---|
BMI category | LIRA 3 mg | Placebo |
27.0 to <30.0 kg/m2 | N = 39 | N = 23 |
LSM, odds | 0.057 | 0.016 |
OR (95% CI), LIRA/Placebo | 3.609 (0.651 to 20.016) | |
P value | 0.1420 | |
30.0 – 34.9 kg/m,2 n (%) | N = 415 | N = 192 |
LSM, odds | 0.315 | 0.085 |
OR (95% CI), LIRA/Placebo | 3.714 (2.165 to 6.370) | |
P value | < 0.0001 | |
35.0 – 39.9 kg/m,2 n (%) | N = 480 | N = 243 |
LSM, odds | 0.349 | 0.100 |
OR (95% CI), LIRA/Placebo | 3.489 (2.136 to 5.699) | |
P value | < 0.0001 | |
≥ 40.0 kg/m,2 n (%) | N = 538 | N = 280 |
LSM, odds | 0.313 | 0.129 |
OR (95% CI), LIRA/Placebo | 2.421 (1.576 to 3.719) | |
P value | < 0.0001 | |
BMI = body mass index; CI = confidence interval; LIRA 3 mg = liraglutide 3 mg; LSM = least squares mean; OR = odds ratio.
Study 1922 – Treatment Effects After 56 Weeks of Treatment in Baseline BMI Subgroups – FAS
Table 81: Study 1922 — Change From Baseline in Fasting Body Weight (%), FAS
Subgroups of co-primary end point | Change (%) in body weight from bassline to week 56 | |
|---|---|---|
BMI category | LIRA 3 mg | Placebo |
27.0 to <30.0 kg/m2 | N = 52 | N = 29 |
LSM change from baseline | −5.10 | −1.10 |
Difference, LIRA 3.0 - Placebo (95% CI) | −4.21 (−6.58 to −1.83) | |
P value | 0.0005 | |
30.0 – 34.9 kg/m2, n (%) | N = 133 | N = 59 |
LSM change from baseline | −5.98 | −2.13 |
Difference, LIRA 3.0 - Placebo (95% CI) | −3.79 (−5.40 to −2.19) | |
P value | < 0.0001 | |
35.0 – 39.9 kg/m2, n (%) | N = 104 | N = 60 |
LSM change from baseline | −6.19 | −2.60 |
Difference, LIRA 3.0 - Placebo (95% CI) | −3.7 (−5.37 to −2.03) | |
P value | < 0.0001 | |
≥ 40.0 kg/m2, n (%) | N = 123 | N = 62 |
LSM change from baseline | −6.04 | −1.62 |
Difference, LIRA 3.0 - Placebo (95% CI) | −4.31 (−5.91 to −2.72) | |
P value | < 0.0001 | |
BMI = body mass index; CI = confidence interval; LIRA 3 mg = liraglutide 3 mg; LSM = least squares mean.
Table 82: Study 1922 — Losing At Least 5% of Baseline Fasting Body Weight, FAS
Subgroups of co-primary end point | 5% responders at week 56 | |
|---|---|---|
BMI category | LIRA 3 mg | Placebo |
27.0 to <30.0 kg/m2 | N = 52 | N = 29 |
LSM, odds | 0.92 | 0.07 |
OR (95% CI), LIRA/Placebo | 14.26 (3.01 to 67.46) | |
P value | 0.0008 | |
30.0 – 34.9 kg/m2, n (%) | N = 133 | N = 59 |
LSM, odds | 0.94 | 0.16 |
OR (95% CI), LIRA/Placebo | 6.0 (2.71 to 13.76) | |
P value | < 0.0001 | |
35.0 – 39.9 kg/m2, n (%) | N = 104 | N = 60 |
LSM, odds | 1.23 | 0.19 |
OR (95% CI), LIRA/Placebo | 6.91 (3.08 to 15.54) | |
P value | < 0.0001 | |
≥ 40.0 kg/m2, n (%) | N = 123 | N = 62 |
LSM, odds | 0.92 | 0.14 |
OR (95% CI), LIRA/Placebo | 6.12 (2.64 to 14.17) | |
P value | < 0.0001 | |
BMI = body mass index; CI = confidence interval; LIRA 3 mg = liraglutide 3 mg; LSM = least squares mean; OR = odds ratio.
Table 83: Study 1922 — Losing At Least 10% or More of Baseline Fasting Body at 56 Weeks, FAS
Subgroups of co-primary end point | 5% responders at week 56 | |
|---|---|---|
BMI category | LIRA 3 mg | Placebo |
27.0 to <30.0 kg/m2 | N = 52 | N = 29 |
LSM, odds | 0.28 | 0.00 |
OR (95% CI), LIRA/Placebo | NA | |
P value | NA | |
30.0 – 34.9 kg/m2, n (%) | N = 133 | N = 59 |
LSM change from baseline | 0.26 | 0.05 |
OR (95% CI), LIRA/Placebo | 5.19 (1.49 to 18.10) | |
P value | 0.0098 | |
35.0 – 39.9 kg/m2, n (%) | N = 104 | N = 60 |
LSM, odds | 0.31 | 0.07 |
OR (95% CI), LIRA/Placebo | 4.92 (1.59 to 15.18) | |
P value | 0.0057 | |
≥ 40.0 kg/m2, n (%) | N = 123 | N = 62 |
LSM, odds | 0.29 | 0.03 |
OR (95% CI), LIRA/Placebo | 9.54 (2.16 to 42.18) | |
P value | 0.0029 | |
BMI = body mass index; CI = confidence interval; LIRA 3 mg = liraglutide 3 mg; LSM = least squares mean; OR = odds ratio.
Study 3970 – Treatment Effects After 32 Weeks of Treatment in Baseline BMI Subgroups – FAS
Table 84: Study 3970 — Change From Baseline in Fasting Body Weight (%), FAS
Subgroups of co-primary end point | Change (%) in body wt. from baseline to week 32 | |
|---|---|---|
BMI category | LIRA 3 mg | Placebo |
30.0 – 34.9 kg/m2, n (%) | N = 52 | N = 55 |
LSM change from baseline | −5.77 | −0.83 |
Difference, LIRA 3.0 - Placebo (95% CI) | −3.59 (−5.41 to −1.76) | |
P value | < 0.0001 | |
35.0 – 39.9 kg/m2, n (%) | N = 58 | N = 62 |
LSM change from baseline | −5.85 | −1.90 |
Difference, LIRA 3.0 - Placebo (95% CI) | −3.59 (−5.41 to −1.76) | |
P value | 0.0001 | |
≥ 40.0 kg/m2, n (%) | N = 62 | N = 64 |
LSM change from baseline | −5.62 | −1.93 |
Difference, LIRA 3.0 - Placebo (95% CI) | −3.45 (−5.27 to −1.64) | |
P value | 0.0002 | |
BMI = body mass index; CI = confidence interval; LIRA 3 mg = liraglutide 3 mg; LSM = least squares mean.
Table 85: Study 3970 — Losing At Least 5% of Baseline Fasting Body Weight, FAS
Subgroups of co-primary end point | 5% responders at week 32 | |
|---|---|---|
BMI category | LIRA 3 mg | Placebo |
30.0 – 34.9 kg/m2, n (%) | N = 55 | N = 52 |
LSM, odds | 0.94 | 0.15 |
OR (95% CI), LIRA/Placebo | 6.36 (2.34 to 17.29) | |
P value | 0.0003 | |
35.0 – 39.9 kg/m2, n (%) | N = 58 | N = 62 |
LSM, odds | 0.65 | 0.22 |
OR (95% CI), LIRA/Placebo | 2.35 (1.01 to 5.51) | |
P value | 0.0485 | |
≥ 40.0 kg/m2, n (%) | N = 62 | N = 64 |
LSM, odds | 0.93 | 0.21 |
OR (95% CI), LIRA/Placebo | 4.20 (1.80 to 9.80) | |
P value | 0.0009 | |
BMI = body mass index; CI = confidence interval; LIRA 3 mg = liraglutide 3 mg; LSM = least squares mean; OR = odds ratio.
Table 86: Study 3970 — Losing At Least 10% of Baseline Fasting Body Weight, FAS
Subgroups of co-primary end point | 5% responders at week 32 | |
|---|---|---|
BMI category | LIRA 3 mg | Placebo |
30.0 – 34.9 kg/m2, n (%) | N = 52 | N = 55 |
LSM, odds | 0.29 | 0.02 |
OR (95% CI), LIRA/Placebo | 17.79 (2.17 to 145.5) | |
P value | 0.0073 | |
35.0 – 39.9 kg/m2, n (%) | N = 58 | N = 62 |
LSM, odds | 0.25 | 0.01 |
OR (95% CI), LIRA/Placebo | 22.06 (2.62 to 185.5) | |
P value | 0.0044 | |
≥ 40.0 kg/m2, n (%) | N = 62 | N = 64 |
LSM, odds | 0.22 | 0.01 |
OR (95% CI), LIRA/Placebo | 15.81 (1.91 to 130.8) | |
P value | 0.0105 | |
BMI = body mass index; CI = confidence interval; LIRA 3 mg = liraglutide 3 mg; LSM = least squares mean; OR = odds ratio.
Health-Related Quality of Life
Table 87: Study 1839 — Change From Baseline in IWQOL-Lite Domain Scores in Patients Without Diabetes and With Prediabetes, FAS
IWQOL-Lite scoresa (LOCF) | LIRA 3 mg N = 2,437 | Placebo N = 1,225 | LIRA 3 mg N = 1,505 | Placebo N = 749 |
|---|---|---|---|---|
Physical function score at baseline | 69.39 (21.65) | 69.04 (21.98) | 66.72 (22.30) | 65.20 (23.22) |
Physical function score at EOT, mean (SD) | 82.64 (17.40) | 77.81 (19.93) | 79.85 (19.20) | 74.15 (21.79) |
Change in physical function score, mean (SD) | 13.30 (16.85) | 8.67 (16.56) | 13.19 (18.05) | 9.59 (19.16) |
LSM | 13.36 | 8.55 | 13.47 | 8.99 |
Estimated difference, LIRA – Placebo (95% CI) | 4.80 (3.72 to 5.89) | 4.48 (2.87 to 6.10) | ||
P value | < 0.0001 | < 0.0001 | ||
Self-esteem score at baseline, mean (SD) | 61.12 (25.90) | 58.99 (26.00) | 62.18 (26.04) | 59.43 (26.75) |
Self-esteem score at EOT, mean (SD) | 82.64 (17.40) | 77.81 (19.93) | 76.95 (23.86) | 72.01 (25.87) |
Change in self-esteem score | 13.74 (20.52) | 10.97 (19.47) | 14.78 (20.90) | 11.82 (19.85) |
LSM | 13.55 | 10.64 | 14.92 | 11.40 |
Estimated difference, LIRA – Placebo (95% CI) | 3.23 (1.84 to 4.64) | 3.53 (1.64 to 5.41) | ||
P value | < 0.0001 | 0.0002 | ||
Sexual life score at baseline, mean (SD) | 77.48 (26.45) | 77.63 (26.20) | 76.64 (26.95) | 76.30 (27.94) |
Sexual life at EOT, mean (SD) | 82.64 (17.40) | 77.81 (19.93) | 85.77 (21.96) | 82.06 (25.48) |
Change in sexual life score | 8.56 (21.86) | 5.95 (20.41) | 9.29 (22.31) | 6.16 (22.16) |
LSM | 8.51 | 6.03 | 9.38 | 6.03 |
Estimated difference, LIRA – Placebo (95% CI) | 2.48 (1.10 to 3.86) | 3.35 (1.46 to 5.25) | ||
P value | 0.0004 | 0.0005 | ||
Public distress score at baseline, mean (SD) | 83.96 (20.59) | 83.58 (20.45) | 83.44 (20.99) | 82.43 (21.02) |
Public distress score at EOT, mean (SD) | 90.01 (16.63) | 88.14 (18.20) | 89.54 (17.37) | 86.55 (20.29) |
Change in public distress score | 5.98 (14.93) | 4.61 (14.68) | 5.99 (15.94) | 4.34 (16.07) |
LSM | 6.03 | 4.44 | 6.13 | 3.97 |
Estimated difference, LIRA – Placebo (95% CI) | 1.59 (0.62 to 2.56) | 2.16 (0.76 to 3.56) | ||
P value | 0.0013 | 0.0026 | ||
Work score at baseline, mean (SD) | 86.78 (18.43) | 86.73 (18.57) | 85.91 (19.14) | 85.55 (19.38) |
Work score at EOT, mean (SD) | 92.38 (14.26) | 91.50 (15.47) | 91.67 (15.49) | 89.88 (17.45) |
Change in work score | 5.63 (15.29) | 4.42 (15.68) | 5.99 (15.94) | 4.34 (16.07) |
LSM | 5.56 | 4.51 | 5.93 | 4.29 |
Estimated difference, LIRA – Placebo (95% CI) | 1.06 (0.11 to 2.00) | 1.64 (0.27 to 3.021) | ||
P value | 0.0281 | 0.0192 | ||
EOT = end of treatment; HRQoL = health-related quality of life; IWQOL-Lite = Impact of Weight on Quality of Life-Lite questionnaire; LIRA 3 mg = liraglutide 3 mg.; LOCF = last observation carried forward; SD = standard deviation.
Source: CSRs-1839 and 1839 Extension.
Table 88: Study 1922 — Change From Baseline in IWQOL-Lite Domain Score in Patients With Type 2 Diabetes, FAS
Outcome measure | 1922 | |
|---|---|---|
IWQOL-Lite scores,a mean (SD) (LOCF) | LIRA 3 mg N = 2,437 | Placebo N = 1,225 |
Physical function score at baseline, mean (SD) | 64.3 (24.6) | 67.6 (21.8) |
Physical function score at EOT, mean (SD) | 80.0 (19.8) | 76.5 (20.8) |
Change in physical function score, mean (SD) | 15.16 (18.02) | 8.92 (16.13) |
LSM | 14.71 | 9.80 |
Estimated difference, LIRA – Placebo (95% CI) | 4.92 (2.12 to 7.71) | |
P value | 0.0006 | |
Self-esteem score at baseline, mean (SD) | 69.7 (27.2) | 72.6 (24.0) |
Self-esteem score at EOT, mean (SD) | 82.5 (20.4) | 82.3 (21.7) |
Change in self-esteem score, mean (SD) | 12.48 (19.31) | 9.61 (18.63) |
LSM | 11.81 | 10.29 |
Estimated difference, LIRA – Placebo (95% CI) | 1.51 (−1.37 to 4.39) | |
P value | 0.3030 | |
Sexual life score at baseline, mean (SD) | 76.3 (28.6) | 80.0 (27.4) |
Sexual life at EOT, mean (SD) | 85.2 (24.5) | 88.0 (20.1) |
Change in sexual life score, mean (SD) | 9.22 (23.72) | 7.78 (21.86) |
LSM | 8.44 | 9.14 |
Estimated difference, LIRA – Placebo (95% CI) | −0.70 (−4.27 to 2.88) | |
P value | 0.7016 | |
Public distress score at baseline, mean (SD) | 83.7 (21.8) | 86.3 (17.8) |
Public distress score at EOT, mean (SD) | 91.1 (15.0) | 90.8 (15.9) |
Change in public distress score, mean (SD) | 7.06 (16.94) | 4.11 (12.57) |
LSM | 6.54 | 4.90 |
Estimated difference, LIRA – Placebo (95% CI) | 1.64 (−0.61 to 3.89) | |
P value | 0.1520 | |
Work score at baseline, mean (SD) | 83.3 (21.1) | 85.7 (19.3) |
Work score at EOT, mean (SD) | 92.4 (13.8) | 92.1 (14.3) |
Change in work score, mean (SD) | 8.80 (17.23) | 5.45 (15.77) |
LSM | 8.14 | 6.59 |
Estimated difference, LIRA – Placebo (95% CI) | 1.54 (−0.76 to 3.85) | |
P value | 0.1887 | |
CI = confidence interval; EOT = end of treatment; HRQoL = health-related quality of life; IWQOL-Lite = Impact of Weight on Quality of Life-Lite questionnaire; LIRA 3 mg = liraglutide 3 mg; LSM = least squares mean; SD = standard deviation.
Table 89: Study 1839 — Change From Baseline in SF-36 Domain Score in Patients Without Diabetes and with Prediabetes, FAS
Outcome measure | 56-week main study phase | 104-week extension phase (week 160) | ||
|---|---|---|---|---|
SF-36 scores (LOCF) | LIRA 3 mg N = 2,437 | Placebo N = 1,225 | LIRA 3 mg N = 1,505 | Placebo N = 749 |
Role-physical score functioning at baseline, mean (SD) | 50.00 (8.25) | 49.59 (8.64) | 49.14 (8.54) | 48.72 (9.06) |
Role-physical score functioning at EOT, mean (SD) | 52.58 (6.92) | 50.98 (8.62) | 51.46 (7.85) | 50.56 (8.60) |
Change in role-physical score functioning, mean (SD) | 2.66 (7.63) | 1.41 (8.80) | 2.43 (8.58) | 2.12 (8.66) |
LSM | 2.76 | 1.29 | 2.55 | 1.94 |
Estimated difference, LIRA – Placebo (95% CI) | 1.47 (0.92 to 2.02) | 0.61 (−0.16 to 1.39) | ||
P value | < 0.0001 | 0.1224 | ||
Bodily pain score at baseline, mean (SD) | 50.80 (9.72) | 50.33 (9.81) | 50.16 (9.80) | 49.51 (9.82) |
Bodily pain score at EOT, mean (SD) | 52.58 (6.92) | 50.98 (8.62) | 50.86 (10.21) | 49.72 (10.09) |
Change in bodily pain score, mean (SD) | 1.81 (9.67) | 0.13 (9.89) | 0.82 (10.00) | 0.51 (9.56) |
LSM | 1.86 | -0.02 | 0.86 | 0.34 |
Estimated difference, LIRA – Placebo (95% CI) | 1.88 (1.17 to 2.59) | 0.52 (−0.43 to 1.47) | ||
P value | < 0.0001 | 0.2819 | ||
General health score at baseline, mean (SD) | 49.50 (8.76) | 49.03 (8.70) | 48.74 (9.06) | 48.11 (8.70) |
General health score at EOT, mean (SD) | 52.75 (7.84) | 50.69 (8.68) | 51.05 (8.58) | 49.24 (8.98) |
Change in general health score, mean (SD) | 3.19 (7.27) | 1.60 (7.82) | 2.25 (7.85) | 1.39 (8.07) |
LSM | 3.30 | 1.43 | 2.41 | 1.10 |
Estimated difference, LIRA – Placebo (95% CI) | 1.87 (1.33 to 2.41) | 1.31 (0.54 to 2.08) | ||
P value | < 0.0001 | 0.0009 | ||
Vitality score at baseline, mean (SD) | 52.57 (8.88) | 52.12 (8.69) | 52.35 (8.88) | 51.80 (8.79) |
Vitality score at EOT, mean (SD) | 55.04 (8.84) | 53.64 (9.24) | 54.23 (9.30) | 52.96 (9.43) |
Change in vitality score, mean (SD) | 2.41 (8.64) | 1.16 (9.05) | 0.25 (8.91) | −0.51 (9.20) |
LSM | 2.43 | 1.10 | 1.89 | 0.95 |
Estimated difference, LIRA – Placebo (95% CI) | 1.32 (0.67 to 1.97) | 0.94 (0.06 to 1.82) | ||
P value | < 0.0001 | 0.0368 | ||
Social functioning score at baseline, mean (SD) | 51.89 (7.80) | 51.91 (7.83) | 51.55 (8.06) | 51.94 (7.72) |
Social functioning score at EOT, mean (SD) | 53.03 (6.88) | 52.10 (8.14) | 51.82 (8.37) | 51.36 (8.30) |
Change in social functioning score, mean (SD) | 1.11 (7.91) | 0.04 (9.13) | 0.25 (8.91) | −0.51 (9.20) |
LSM | 1.11 | 0.09 | 0.17 | −0.37 |
Estimated difference, LIRA – Placebo (95% CI) | 1.02 (0.46 to 1.59) | 0.54 (−0.30 to 1.38) | ||
P value | 0.0004 | 0.2057 | ||
Physical functioning at baseline, mean (SD) | 47.89 (8.47) | 47.53 (8.76) | 47.07 (8.66) | 46.42 (9.05) |
Physical functioning at EOT, mean (SD) | 51.52 (7.10) | 49.69 (8.33) | 50.60 (7.45) | 48.59 (8.64) |
Change in physical functioning, mean (SD) | 3.54 (7.23) | 2.30 (8.12) | 3.50 (7.32) | 2.48 (7.77) |
LSM | 3.64 | 2.08 | 3.65 | 2.18 |
Estimated difference, LIRA – Placebo (95% CI) | 1.57 (1.04 to 2.09) | 1.47 (0.78 to 2.16) | ||
P value | < 0.0001 | < 0.0001 | ||
Role-emotional at baseline, mean (SD) | 51.53 (7.82) | 51.99 (7.16) | 51.28 (8.02) | 51.50 (7.79) |
Role-emotional at EOT, mean (SD) | 52.36 (6.77) | 51.53 (8.09) | 51.61 (7.83) | 50.99 (8.62) |
Change in role-emotional, mean (SD) | 0.83 (8.11) | −0.68 (8.81) | 0.38 (8.74) | −0.60 (9.30) |
LSM | 0.71 | −0.35 | 0.32 | −0.41 |
Estimated difference, LIRA – Placebo (95% CI) | 1.07 (0.50 to 1.63) | 0.73 (−0.09 to 1.55) | ||
P value | 0.0002 | 0.0801 | ||
Mental health score at baseline, mean (SD) | 53.40 (8.29) | 53.00 (8.19) | 53.28 (8.24) | 52.78 (8.24) |
Mental health score at EOT, mean (SD) | 54.10 (8.16) | 52.83 (8.74) | 53.55 (8.73) | 52.00 (9.45) |
Change in mental health score, mean (SD) | 0.69 (8.74) | −0.32 (9.04) | 0.19 (8.88) | −0.81 (9.73) |
LSM | 0.76 | −0.45 | 0.29 | −0.98 |
Estimated difference, LIRA – Placebo (95% CI) | 1.21 (0.58 to 1.85) | 1.27 (0.39 to 2.16) | ||
P value | 0.0002 | 0.0049 | ||
EOT = end of treatment; HRQoL = health-related quality of life; LIRA 3 mg = liraglutide 3 mg.; LOCF = last observation carried forward; SD = standard deviation; SF-36 = Short Form (36) Health Survey.
Source: CSRs-1839 and 1839 Extension.
Table 90: Study 3970 — Change From Baseline in SF-36 Domain Scores in Patients With Obstructive Sleep Apnea, FAS
Outcome measure | 3970 | |
|---|---|---|
SF-36 scores | LIRA 3 mg N = 180 (FAS) | Placebo N = 179 (FAS) |
Role-physical score functioning at baseline, mean (SD) | 48.54 (9.07) | 48.45 (9.20) |
Role-physical score at week 32, mean (SD) | 50.79 (8.79) | 50.81 (7.87) |
Change in role-physical score functioning, mean (SD) | 2.36 (9.67) | 2.31 (7.63) |
LSM | 2.34 | 2.34 |
Estimated difference, LIRA – Placebo (95% CI) | 0.00 (−1.53 to 1.53) | |
P value | 0.9995 | |
Bodily pain score at baseline, mean (SD) | 50.16 (10.45) | 50.26 (9.53) |
Bodily pain score at week 32, mean (SD) | 51.77 (9.79) | 50.57 (9.51) |
Change in bodily pain score, mean (SD) | 1.70 (10.21) | 0.48 (8.04) |
LSM | 1.67 | 0.51 |
Estimated difference, LIRA – Placebo (95% CI) | 1.16 (−0.50 to 2.83) | |
P value | 0.1711 | |
General health score at baseline, mean (SD) | 47.14 (9.18) | 47.56 (9.08) |
General health score at week 32, mean (SD) | 49.63 (9.22) | 48.65 (8.86) |
Change in general health score, mean (SD) | 2.62 (7.41) | 0.98 (6.69) |
LSM | 2.52 | 1.11 |
Estimated difference, LIRA – Placebo (95% CI) | 1.41 (0.05 to 2.78) | |
P value | 0.0426 | |
Vitality score at baseline, mean (SD) | 49.16 (9.78) | 49.00 (9.84) |
Vitality score at week 32, mean (SD) | 54.03 (10.37) | 52.38 (9.31) |
Change in vitality score, mean (SD) | 5.06 (8.65) | 3.60 (8.37) |
LSM | 5.10 | 3.59 |
Estimated difference, LIRA – Placebo (95% CI) | 1.51 (−0.10 to 3.13) | |
P value | 0.0663 | |
Social functioning score at baseline, mean (SD) | 50.64 (9.42) | 50.94 (8.57) |
Social functioning score at EOT, mean (SD) | 2.40 (7.28) | 52.06 (7.70) |
Change in social functioning score, mean (SD) | 1.88 (9.79) | 1.18 (8.70) |
LSM | 1.75 | 1.33 |
Estimated difference, LIRA – Placebo (95% CI) | 0.42 (−1.05 to 1.88) | |
P value | 0.5771 | |
Physical functioning at baseline, mean (SD) | 46.94 (9.26) | 47.57 (9.35) |
Physical functioning at week 32, mean (SD) | 49.76 (9.21) | 49.65 (8.56) |
Change in physical functioning, mean (SD) | 2.83 (8.30) | 1.85 (7.60) |
LSM | 2.58 | 2.13 |
Estimated difference, LIRA – Placebo (95% CI) | 0.45 (−1.02 to 1.91) | |
P value | 0.5471 | |
Role-emotional at baseline, mean (SD) | 51.02 (8.18) | 51.14 (8.52) |
Role-emotional at EOT, mean (SD) | 51.95 (7.96) | 51.47 (8.60) |
Change in role-emotional, mean (SD) | 1.01 (8.94) | 0.27 (7.94) |
LSM | 0.90 | 0.39 |
Estimated difference, LIRA – Placebo (95% CI) | 0.51 (−1.01 to 2.02) | |
P value | 0.5094 | |
Mental health score at baseline, mean (SD) | 53.53 (8.00) | 53.15 (7.32) |
Mental health score at EOT, mean (SD) | 54.57 (8.60) | 53.92 (7.89) |
Change in mental health score, mean (SD) | 0.87 (7.70) | 0.82 (6.96) |
LSM | 0.95 | 0.77 |
Estimated difference, LIRA – Placebo (95% CI) | 0.18 (−1.25 to 1.61) | |
P value | 0.8083 | |
CI = confidence interval; EOT = end of treatment; HRQoL = health-related quality of life; LIRA 3 mg = liraglutide 3 mg; LSM = least squares mean; SD = standard deviation; SF-36 = Short Form (36) Health Survey.
Source: CSR-3970.
Table 91: Study 1839 — Change From Baseline in TRIM-Weight Domain Scores in Patients Without Diabetes and With Prediabetes, FAS
Outcome measure | 56-week main study phase | 104-week extension phase (week 160) | ||
|---|---|---|---|---|
TRIM-Weight scores | LIRA 3 mg N = 2,437 | Placebo N = 1,225 | LIRA 3 mg N = 1,505 | Placebo N = 749 |
Daily life score at EOT, mean (SD) | 93.86 (10.46) | 94.76 (8.37) | 93.06 (11.30) | 94.35 (10.02) |
LSM | 93.86 | 94.76 | 93.06 | 94.38 |
Treatment difference LIRA – Placebo (95% CI) | −0.93 (−1.75 to −0.10) | −1.32 (−2.51 to −0.13) | ||
P value | 0.0284 | 0.0294 | ||
Weight management score at EOT, mean (SD) | 53.87 (25.82) | 35.01 (23.98) | 46.89 (26.70) | 33.46 (24.21) |
LSM | 53.98 | 34.85 | 46.99 | 33.50 |
Treatment difference LIRA – Placebo (95% CI) | 19.13 (17.02 to 21.24) | 13.48 (10.65 to 16.32) | ||
P value | < 0.0001 | < 0.0001 | ||
Treatment burden score at EOT, mean (SD) | 76.03 (20.19) | 73.43 (20.75) | 76.47 (19.51) | 74.01 (20.54) |
LSM | 76.01 | 73.28 | 76.35 | 74.05 |
Treatment difference LIRA – Placebo (95% CI) | 2.73 (1.04 to 4.41) | 2.30 (0.16 to 4.44) | ||
P value | 0.0015 | 0.0354 | ||
Experience of side effects score at EOT, mean (SD) | 85.16 (15.24) | 88.79 (13.74) | 83.97 (16.41) | 88.39 (14.80) |
LSM | 85.18 | 88.75 | 83.96 | 88.42 |
Treatment difference LIRA – Placebo (95% CI) | −3.57 (−4.80 to −2.33) | −4.46 (−6.19 to −2.73) | ||
P value | < 0.0001 | < 0.0001 | ||
Psychological health score at EOT, mean (SD) | 93.28 (13.70) | 92.85 (13.64) | 92.39 (14.53) | 91.95 (14.17) |
LSM | 93.31 | 92.80 | 92.42 | 91.94 |
Treatment difference LIRA – Placebo (95% CI) | 0.51 (−0.64 to 1.66) | 0.49 (−1.09 to 2.07) | ||
P value | 0.3877 | 0.5452 | ||
CI = confidence interval; EOT = end of treatment; HRQoL = health-related quality of life; LIRA 3 mg = liraglutide 3 mg; LSM = least squares mean; SD = standard deviation; TRIM-Weight = Treatment Related Impact Measure of Weight.
Source: CSRs-1839 and 1839 Extension.
Appendix 4: Description and Appraisal of Outcome Measures
Note that this appendix has not been copy-edited.
Aim
To describe the following outcome measures and review their measurement properties (validity, reliability, responsiveness to change, and MID).
Table 92: Summary of Outcome Measures and Their Measurement Properties
Outcome measure | Type | Conclusions about measurement properties | MID |
|---|---|---|---|
Impact of Weight on Quality of Life-Lite, total and individual item scores | Disease-specific measure of HRQoL 31 item self-administered 5-point Likert scale | Acceptable internal consistency has been demonstrated in adult patients who are overweight or living with obesity seeking treatment and with diabetes, as well as individuals in the community. Acceptable test-retest reliability has been demonstrated in the community population. There is evidence of convergent validity of total score and the physical function and work subscale scores with BMI and other quality of life scales. There is little evidence of responsiveness to change. | MID for improvement ranges from 7.7 to 12, depending on baseline score. |
Impact of Weight on Quality of Life-Lite for Clinical Trials, total and individual item scores | Disease-specific measure of HRQoL 22 item self-administered 5-point Likert scale | Satisfactory internal consistency, test-test reliability, and some evidence for validity was identified for adult patients who are overweight or living with obesity. | An MID was not identified for adult patients who are overweight or living with obesity. |
36-Item Short Form Survey | Generic measure of HRQoL 36 item self-administered Likert scale | For adult patients who are overweight or living with obesity in the community, there is some evidence of validity, for the PCS and MCS, however, the validity of the subscales in this patient population has not been confirmed. | General (non–disease-specific) MID: 2 points in PCS; 3 points in MCS; 2 to 4 points for individual dimensions. An MID was not identified for adult patients who are overweight or living with obesity. |
Treatment Related Impact Measure of Weight total and individual scores | Obesity treatment-specific measure of HRQoL 22 item self-administered scale | Acceptable internal consistency was found for adult patients who are overweight or living with obesity seeking treatment with anti-obesity medication. There is evidence of convergent validity for both the total score and the individual domains. | An MID was not identified for adult patients who are overweight or living with obesity, but an estimation of achievable MID was provided. |
Diabetes Treatment Satisfaction Questionnaire status version total scores | Disease-specific measure of HRQoL 8 item self-administered Likert scale | Validity and reliability were not assessed in patients living with obesity. | No literature pertaining to MIDs was identified. |
Patient Health Questionnaire-9 total scores | General measure of HRQoL 9 item self-administered Likert scale | For adult patients living with obesity who were awaiting bariatric surgery, there is some evidence regarding the reliability, with some concerns raised regarding applicable cut-off scores in this population. Validity was not assessed in patients living with obesity. | No literature pertaining to MID was identified. |
Columbia-Suicide Severity Rating Scale, total score | Outcome-specific measure of HRQoL Interviewer administered questionnaire | Psychometric measurement properties were not identified specifically for adult patients who are overweight or living with obesity. | No literature pertaining to MID was identified. |
HRQoL = health-related quality of life; MID = minimal important difference; MCS = mental component summary; PCS = physical component summary.
Impact of Weight on Quality of Life-Lite Questionnaire
The Impact of Weight on Quality of Life-Lite (IWQOL-Lite) questionnaire was a secondary end point in 3 of the identified phase III RCTs for obesity. It is a disease-specific questionnaire that was designed to assess the effect of obesity on quality of life in 8 key areas.100 The IWQOL-Lite Clinical Trials version was a secondary end point in 1 of the identified phase III RCTs for obesity, and was developed in response to the limitations of the IWQOL-Lite version use among patients in clinical trials.101
The IWQOL-Lite is the shorter version of the full 74-item Impact of Weight on Quality of Life (IWQOL) questionnaire.100,102 The original 74-item IWQOL measures areas of quality of life identified by adult patients living with moderate to severe obesity as those of greatest concern to them (health, social/interpersonal, work, mobility, self-esteem, sexual life, activities of daily living, and comfort with food).100,102 The IWQOL-Lite has 31 self-administered items with 5 scales: self-esteem (7 items), sexual life (4 items), physical function (11 items), public distress (5 items), and work (4 items).103 The scale score comprises the sum of all the item scores, and all scale scores are added to create the total score.103 On this scale, higher scores indicate a poorer quality of life.103 The IWQOL-Lite clinical trial version is an even shorter version of the original IWQOL, with 20 self-administered items derived from the IWQOL-Lite in 2 domains (physical – 7 items and psychosocial – 13 items) scored in the same way as the IWQOL-Lite.101
In 1 of the studies that assessed the psychometric properties of the IWQOL-Lite questionnaire, a community-based sample of 492 individuals who are overweight or living with obesity (mean BMI 27.4) who were not undergoing weight-loss treatment completed the IWQOL-Lite.103 Convergent validity of the total score and subscale scores was assessed in individuals with a BMI of at least 25 kg/m2 using BMI, the SF-36 (including the mental and physical component summary scores and each subscale score), the Rosenberg self-esteem scale, the Marlowe-Crowne social desirability scale, and ad hoc sexual life and public distress scales using items from the obesity quality of life instrument (OBQOL).103 The IWQOL-Lite total score demonstrated strong correlations (Pearson correlation coefficient R with a magnitude of more than 0.50104) in the expected direction with BMI, the general health, vitality, and PCS scores of the SF-36, as well as the Rosenberg self-esteem score and the OBQOL-based measures.103 The IWQOL-Lite total score was weakly correlated (magnitude of R between 0.10 and 0.30) with the Marlowe-Crowne social desirability score and SF-35 role-emotional score and moderately correlated (magnitude of R between 0.30 and 0.50) with the rest of the measures.103 The IWQOL-Lite physical function score was strongly correlated with the SF-36 physical functioning, role-physical, bodily pain, general health, PCS scores, moderately correlated with the SF-36 vitality and social functioning scores, the OBQOL-based measures, and weakly correlated with the SF-36 MCS and role-emotional scores.103 The IWQOL-Lite work score was weakly correlated with the SF‑36 role-emotional score and the Marlowe-Crowne score and moderately correlated with the rest of the measures.103 Internal consistency, as assessed with Cronbach alpha, was acceptable for the IWQOL-Lite subscale and total scores. Test-retest reliability was evaluated an average of 14 days apart (SD of 0.7 days) in 112 individuals. Intraclass correlation coefficients (ICCs) for test-retest reliability ranged from 0.81 (public distress) to 0.88 (physical function) for the subscale scores, and 0.94 for the total score.103 These measures of reliability are acceptable relative to the generally accepted threshold of 0.70 or higher.105
The content validity of the IWQOL-Lite was assessed through a study that compared it to the International Classification of Functioning, Disability and Health using the Delphi technique with 21 raters; this study found that content was compatible and had good content validity in English and French.106
In another validation study, IWQOL-Lite data were collected from 1,197 individuals (225 had type 2 diabetes) living with obesity who were seeking weight-loss treatment and gastric-bypass surgery in a clinical trial, in order to determine the impact of weight on quality of life and the psychometric properties of the IWQOL-Lite instrument.107 This study found that internal consistency was acceptable105 for the IWQOL-Lite total score and subscale scores in patients with and without diabetes.107 In order to test the scale structure and construct validity, confirmatory factor analysis was performed as part of the same study.107 These results found that there was comparable factor structure for patients with and without diabetes.107 Moderate to strong correlations104 were found between BMI and IWQOL-Lite for both patients with and without diabetes; suggesting construct validity.107 The correlation coefficient ranged from –0.545 (sexual life) to –0.737 (public distress) for IWQOL-Lite subscale scores and BMI and was 0.705 for IWQOL-Lite total score and BMI among patients with diabetes.107 The correlation coefficient ranged from –0.458 (sexual life) to –0.749 (public distress) for IWQOL-Lite subscale scores and BMI and was 0.683 for IWQOL-Lite total score and BMI among patients without diabetes.107
An MID range was estimated for the IWQOL-Lite total score in patients living with obesity.30 This study used both anchor and distribution-based methods in a study of 1,476 patients in weight-loss trials and compared IWQOL-Lite total scores at baseline and 6 months.30 Patients were categorized according to baseline IWQOL-Lite total score using a normative mean (calculated from a sample of 534 individuals with a BMI of 18 to 29.9 kg/m2 not enrolled in any weight-loss treatment program) for comparison.30 The categories of baseline impairment were: none (less than 1 SD below the normative mean), mild (greater than or equal to 1 but less than 2 SDs from the normative mean), moderate (greater than or equal to 2 but less than 3 SDs from the normative mean), and severe (greater than 3 SDs from normative mean).30 Standard error of measurement corrected for regression to the mean was used to evaluate the precision of the IWQOL-Lite using the Edwards-Nunnally method for the distribution-based method.30 The anchor-based method considered a 5% to 9.9% decrease in weight to represent improvement and anything below this cut-off to represent no change.30 Discrepancies in the change in IWQOL-Lite score corresponding to improvement between the distribution-based and anchor-based methods were resolved by selecting the greater of the 2 cut-offs for a given category of baseline impairment.30 Greater quality of life change was observed with greater weight loss and more severe baseline quality of life impairments.30 The MIDs for improvement were 7.7 to 7.8 for patients with no impairment at baseline (depending on exact baseline score), 7.9 to 8.1 for patients with mild impairment, 8.1 to 8.4 for patients with moderate impairment, and 12.0 for patients with severe impairment.30 The MIDs for deterioration determined using the distribution-based method ranged from –7.8 to –4.4, depending on baseline severity of impairment.30
In terms of the IWQOL-Lite clinical trial version, internal consistency reliability was found to be satisfactory. One publication evaluated the measurement properties of the IWQOL-Lite clinical trial version using 2 different RCTs with semaglutide, 1 using a population of individuals living with obesity (Study 1) and 1 using a population of individuals with type 2 diabetes (Study 2). It was reported that the Cronbach alpha’s for Total score at baseline and end of trial were 0.95 and 0.96, respectively, in Study 1 and 0.93 and 0.94 for Study 2.101 The item and composite-level test-retest reliabilities were found to be satisfactory in both studies, with ICCs ≥ 0.80 for all composite scores.101 For validity, the authors reported strong correlations with the SF-36 scales for physical and physical function scores, role-physical, and vitality subscale score in both studies.101 Both studies also revealed positive construct validity of the composite scores through longitudinal analyses in comparison to changes in the SF-36 scale.101 No MID was reported for this specific version.
Short Form (36) Health Survey
The SF-36 is an instrument that measures general health that has been used extensively in clinical trials in a variety of population groups.108 There are 8 health domains in the SF-36 and for each of these a subscale score can be determined: physical functioning, role-physical, bodily pain, general health, vitality, social functioning, role-emotional, and mental health.108,109 There are 2 component summaries of the SF-36, the PCS and the MCS, that are derived with a scoring algorithm from the 8 domains.108 Scores on the PCS and MCS range from 0 to 100, with higher scores indicating better health status.108 Scoring for the summary scales uses norm-based methods; the general US population is used to derive the regression weights and constants. The PCS and MCS scales are transformed to have a mean of 50 and an SD of 10 in the general US population.31
The SF-36 version 2 (SF-36 version 2) was used as a secondary end point for 3 of the identified phase III RCTs for obesity. It was made available in 1996; it contains minor changes to the original survey. Changes included: reduced ambiguity in instructions, better layout, increased item-level response choices, increased cultural/language comparability, and elimination of a response option from the items in the mental health and vitality dimensions.31
The original version of the SF-36 has some evidence of validity among patients living with obesity. In a study of outpatients living with obesity (N = 475) seeking treatment, the construct validity of the SF-36 was explored through main component analysis.110 This study found that BMI was associated with most factors, but not the mental health-, vitality-, and social functioning-based factors.110 In a study of patients living with morbid obesity (mean BMI of 41.7 kg/m2) with a referral to a rehabilitation centre, a factor analysis suggested that the 2 summary scales (PCS and MCS) had adequate factor loading, but that the validity of the original 8 subscales was not confirmed in this population.111
The construct validity and reliability of the original version of the SF-36 among patients living with obesity scheduled for bariatric surgery (N = 365) was evaluated in another study.109 Principal component analysis revealed 6 factors with an estimated Eigen value of greater than 1, ensuring that 6 factors were obtained.109 The identified 6-factor model was tested for fit using confirmatory factor analysis, which exhibited a good fit.109 Using Pearson’s correlation, the authors found that the correlations were satisfactory, with all factors showing a correlation below 0.70.109 The overall internal consistency reliability was found to be greater than 0.70 (Cronbach alpha = 0.717).109 Overall, the authors found that the main components closely related to increased BMI were physical activity, general health and body pain, physical role, emotional role, and mental health109; which was in agreement with previous studies.
One study found evidence of validity for the original version of the SF-36 scale score in a group of people with type 2 diabetes,112 although it is important to note that these findings may not be applicable to patients living with obesity that do not have type 2 diabetes. A Cronbach alpha consistency value > 0.80 was attained for 6 of the individual scales on the SF-36, the physical functioning, role-physical, bodily pain, vitality, role-emotional, and mental health scales.112 The authors assessed the external validity of the SF-36 by comparing the scale scores at the start of diabetes therapy and education and 4 weeks after completion with the Well-Being Questionnaire, the DTSQ, the Diabetes39, and the Quality of Life with Diabetes questionnaire.112 They found that there were significant differences in treatment satisfaction, role-physical, general health, vitality, and social functioning scores before and 4 weeks after education and diabetes therapy on the SF-36 scale score.112 The authors did note that the SF-36 has a positive bias, as the positive answers receive higher scores.112
In the general population, clinically meaningful improvement is generally indicated by a change of 2 points in the SF-36 PCS and 3 points in the SF-36 version 2 MCS.31 Based on anchor data, following minimal mean group differences, in terms of t score points are described for SF-36 version 2 individual dimension scores: physical functioning, 3; role functioning, 3; bodily pain, 3; general health, 2; vitality, 2; social functioning, 3; role-emotional, 4; and mental health, 3.31 These MID values were determined as appropriate for groups with mean t score ranges of 30 to 40.31 For higher t score ranges, MID values may be higher.31 No information about the MID of the SF-36 version 2 in the population living with obesity was located.
Treatment Related Impact Measure of Weight
The TRIM-Weight scale was a secondary end point for 2 of the identified phase III RCTs for obesity. The TRIM-Weight is an obesity treatment-specific patient-reported outcomes measure that assess the impacts of anti-obesity medications.32
One study evaluated the measurement and psychometric properties of the TRIM-Weight scale in a group of individuals who were either currently living or had lived with obesity at some point in their life (BMI between 30 and 45), as well as were currently taking anti-obesity medication.32 After a factor analysis, all domains were confirmed with comparative fit indices values all above 0.09; with 6 items in the daily life domain, 3 items in weight management, 4 items in treatment burden, 5 items in experience of side effects, and 4 items making up the psychological health domain.32
The same authors confirmed internal consistency through measuring Cronbach alpha consistency value, finding that the total score and all 5 subscales ranged between 0.71 and 0.94.32 The authors also found that the test-retest reliability ranged from 0.75 to 0.86, meeting their hypothesis for internal consistency and reproducibility.32 In analyzing convergent validity with other quality of life measures, multiple components of the TRIM-Weight scale were found to be correlated with other measures.32 The total TRIM‑Weight was found to be significantly correlated (r = 0.62) with the overall life satisfaction scale of the Q-LES-Q, the psychological health subscale of TRIM-Weight was found to have a significant association with the SF-12 MCS (r = 60), The daily life domain was significantly correlated with the AIA total score (r = 0.74), the treatment burden subscale had a correlation of 0.70 with the TRQM-Burden, and the experience of side effects subscale was strongly correlated with the FIBSER total score (0.74).32 The authors also reported that significant correlations were found between all of the self-report overall items and their respective domains or overall score.32
The same study assessed the criterion validity and MID of the TRIM-Weight scale. The authors found that known-group validity met the a priori tests for the total score and all domains, except for the domain of daily life which was later proven in an ad hoc analysis.32 The authors found that the total score and all domains met the MID threshold of ½ SD criteria out of the following: total, weight management, treatment burden, experience of side effects, psychological health, and daily life. In order to approximate MID, self-report items, 1 per domain, were used as anchors as there was no longitudinal data to examine the change in MID over time.32
The authors did note that no significant relationships were found between the TRIM-Weight total score and BMI category, gender, age, or educational level.32
Diabetes Treatment Satisfaction Questionnaire
The DTSQ was a secondary end point for 1 of the identified phase III RCTs for obesity. Evidence on the psychometric properties of the DTSQ was not found for adult patients living with obesity but was investigated among adult patients with diabetes.
The DTSQs questionnaire was used to assess patient’s satisfaction to treatment using 8 items which cover convenience, flexibility, and general feelings regarding treatment. Six of the items are scored on a 7-point scale, with scores ranging from 0 (“very satisfied”) to 6 (“very unsatisfied”), which are then summed to provide a total response between 0 (“very dissatisfied”) and 36 (“very satisfied”). Two of the items assess patients’ perceived frequency of hyperglycemia/hypoglycemia, with responses scored on a 7-point scale from 0 (“none of the time”) to 6 (“most of the time”); lower scores on these 2 items indicate greater perceived blood glucose control.33,34 The limited number of questionnaire items makes the questionnaire convenient for use by patients during clinical trials. However, the limited number of items also limits the range of impact that can be assessed for patient’s satisfaction of treatment on their quality of life.
The DTSQ is globally accepted as an instrument to evaluate treatment satisfaction in patients with T2DM and has been recommended by WHO and the International Diabetes Federation as useful in assessing outcomes of diabetes care.33 The psychometric properties of different language versions of the DTSQs has been assessed in multiple studies, all reporting positive results for patients with type 1113 and type 2 diabetes.113-115 In examining the construct validity, significant and positive correlations were found in the mental domains between the WHO-DTSQ and the SF-36,113 the overall DTSQ scores and the WBQ-12 General Well-being score and its subscale scores as well as with almost all of the domain scores of the WHOQOL,114 and the DTSQ and the SF-36 physical functioning, general health, validity, social functioning, mental health scales, as well as the physical and mental health component scores.115 As for discriminant validity, it was found that a lower level of treatment satisfaction was present among patients with a diabetes duration > 10 years, those suffering from multiple diabetes complications, and those with hemoglobin A1C levels above 7.0%.113 In the study assessing the Turkish version of the DTSQ, Confirmatory Factor analysis revealed satisfactory comparative fit indices and Root Mean Square Error of Approximation (RMSEA) values for baseline (0.996, 0.037), third month (0.925, 0.066), and sixth month (0.917, 0.072) data.114 An analysis of the Greek version of the DTSQ demonstrated satisfactory validity as well, finding a comparative fit indices of 0.97 and RMSEA of 0.08 for the treatment satisfaction.115
The reliability of the 6 items from the Treatment Satisfaction Scale in the DTSQ has been evaluated multiple times with positive results for internal consistency. In 1 study, reliability was evaluated among patients with type 2 diabetes attending a diabetes clinic (N = 83).34 A Cronbach alpha of 0.74 indicated a satisfactory internal consistency with inter-item correlations ranging between −0.22 to 0.79 and the item-total correlations ranging between 0.39-0.78.34 The authors also found that the DTSQ score correlated with general well-being, r = 0.26 p < 0.01, but no significant correlation was found between the DTSQ and age, disease duration, BMI, or glycemic control.34 Another study found supporting results for internal consistency among a population of patients with type 2 diabetes, attaining a Cronbach alpha > 0.80 for the Treatment Satisfaction Scale in the DTSQ.112 In the validation study for the Italian version of the WHO-DTSQ (N = 421) a Cronbach alpha score of 0.86 was identified with item-scale correlations > 0.40 for all the items.113 Further, a systematic review of HRQoL and satisfaction instruments found that Cronbach alpha values ranged from 0.79 to 0.87 for the DTSQ, further supporting internal consistency of the scale.116
No evaluation of the MID of the DTSQ was identified.
Patient Health Questionnaire-9
The Patient Health Questionnaire-9 (PHQ-9) was a secondary end point for 2 of the identified phase III RCTs for obesity. The PHQ-9 is a proven effective tool to detect depression among patients with chronic medical illnesses and has demonstrated high sensitivity and specificity in primary care populations.37 The PHQ-9 uses 9 scales composed of items that directly correspond to the DSM-IV criteria for major depression.37 The total score ranges from 0-27, with cut-off scores recommended at 5 for mild, 10 for moderate, 15 for moderately severe, and 20 for severe depression symptoms.37 The standard cut-off score of 10 is typically recommended for depression screening.37
The reliability of the PHQ-9 scale was evaluated among adult patients living with obesity who were candidates for bariatric surgery.37 The authors completed both an original study (N = 244) and a replication study (N = 275) to assess the psychometric properties of the PHQ-9 scale.37
Accuracy of the cut-off points was assessed through analyzing the area under the receiver operating curve. The AUC was found to be 0.78 with an optimal dichotomization cut-off point ≥ 15 (sensitivity 75%, specificity 75%) in the original study, and 0.8 with an optimal dichotomization cut-off point ≥ 15 (sensitivity 75%, specificity 76%) in the replication study.37 This suggests that the recommended cut-off score of 10 for depression screening may not be applicable for bariatric surgery candidate populations. Interscale concordance with the diagnostic MINI tool found that the PHQ-9 screening tool captured a higher prevalence of patients screening positive for a major depressive disorder in both the original and replication studies; 1.6% to 3.8% of participants met the DSM-IV criteria for a current major depressive disorder using the MINI, whereas 27.6% to 29.1% of participants met the same criteria on the PHQ-9.37 It is important to note that screening tools often do capture larger prevalence rates of health outcomes in patient populations than diagnostic tools due to the nature of their clinical utility, which highlights a potential limitation on the chosen comparator in this study.
No evaluation of validity or MID was identified.
Columbia-Suicide Severity Rating Scale
The Columbia-Suicide Severity Rating Scale (C-SSRS) was a secondary end point for 2 of the identified phase III RCTs for obesity. The C-SSRS is an interview-based assessment tool for evaluating suicidal ideation and behaviour.117 It was developed to monitor changes in suicidality over time by incorporating assessments of lifetime suicidal ideation and behaviour as well as between-visit changes. The C-SSRS has 4 subscales: severity of ideation (e.g., specificity of suicidal thoughts or intent with methods or plans), intensity of ideation (e.g., frequency and duration of suicidal thoughts), behaviour (e.g., preparatory actions, suicide attempts, and non-suicidal injurious behaviour), and lethality (assessment of actual suicide attempts; actual lethality is rated on a 6-point ordinal scale, and if actual lethality is 0, potential lethality of attempts is rated on a 3-point ordinal scale). The items on the ideation and lethality subscales are rated on 3-point to 6-point ordinal scales, and the behaviour subscale uses a nominal scale. A higher total score indicates a higher level of suicidality.
Evidence on the psychometric properties of the C-SSRS was not found for adult patients living with obesity. That being said, 2 studies were identified that assessed the psychometric properties of the C-SSRS within the adult population, although it is important to note that the results may not be entirely applicable to adult patients living with obesity.
One publication assessed the psychometric properties of the C-SSRS within 3 different populations, 1 of which was conducted in adult patients who presented to the emergency department for psychiatric reasons.117 The intensity of ideation subscale demonstrated moderate to high internal consistency in this study. In support of convergent validity, the suicidal ideation and behaviour subscales on the C-SSRS correlated moderately to strongly with the corresponding suicide-related items on the MADRS and Beck Depression Inventory, as well as with the Scale for Suicide Ideation and the Columbia Suicide History Form.117 Predictive validity was not reported for the C-SSRS.
In another study, the validity of the suicidal ideation subscale of the C-SSRS among adults was evaluated. The authors conducted factor analysis using the principal component analysis and found that all factors retained had an Eigenvalue over 1, with a Cronbach alpha of 0.797, indicating good internal consistency.118 The confirmatory factor analysis showed that the Maximum Likelihood Ch-Square was 7.55 with a chi-square to degrees of freedom ratio of 1.51, outside of the recommended values ranging between 2 and 5.118 In analyzing the convergent validity, the authors found that there was a moderate positive correlation between the suicidal ideation score and the Hamilton Depression Rating Scale and the Hamilton Anxiety Rating Scale.118 A moderate positive correlation was also found between suicide ideation score and alcohol dependence, while a moderate negative association was found between suicidal ideation score and emotional intelligence.118 A week positive correlation was found between suicide ideation score and alexithymia, perceived stress, and social anxiety.118 Lastly, a weak negative correlation was found between suicide ideation and self-esteem score.118 Overall, the authors concluded that the suicidal ideation scale of the C-SSRS had satisfactory psychometric properties with adequate internal consistency and adequate construct validity for adults.118
No evaluation of the MID of the C-SSRS was identified.
Pharmacoeconomic Review
Abbreviations
ACS
acute coronary syndrome
BIA
budget impact analysis
BMI
body mass index
CHMS
Canadian Health Measures Survey
ICER
incremental cost-effectiveness ratio
QALY
quality-adjusted life-year
T2DM
type 2 diabetes mellitus
Executive Summary
Item | Description |
|---|---|
Drug product | Liraglutide |
Submitted price | Liraglutide 3 mg subcutaneous injection: $12.50 per day |
Indication | Indicated as an adjunct to a reduced-calorie diet and increased physical activity for chronic weight management in adult patients with an initial BMI of:
|
Health Canada- approval status | NOC |
Health Canada review pathway | Standard |
NOC date | February 26, 2015 |
Reimbursement request | To be listed as an adjunct to a reduced-calorie diet and increased physical activity for chronic weight management in adult patients who have been diagnosed with:
|
Sponsor | Novo Nordisk Canada Inc. |
Submission history | Previously reviewed: No |
BMI = body mass index; NOC = Notice of Compliance.
Table 2: Summary of Economic Evaluation
Component | Description |
|---|---|
Type of economic evaluation | Cost-utility analysis Markov model |
Target populations | Health Canada indication: As an adjunct to a reduced-calorie diet and increased physical activity for chronic weight management in adult patients with an initial BMI of 30 kg/m2 or greater (obese), or 27 kg/m2 or greater (overweight) in the presence of at least 1 weight-related comorbidity (e.g., hypertension, type 2 diabetes, or dyslipidemia) and who have failed a previous weight management intervention Reimbursement request: As an adjunct to a reduced-calorie diet and increased physical activity for chronic weight management in adult patients who have been diagnosed with obesity (BMI ≥ 30 kg/m2) and prediabetes, or overweight (BMI ≥ 27 kg/m2 and < 30 kg/m2) with 1 or more weight-related comorbidity and prediabetes |
Treatments | Health Canada indication: Liraglutide 3 mg daily for no more than 1 year as an adjunct to a reduced-calorie diet and increased physical activity Reimbursement request: Liraglutide 3 mg daily for no more than 3 years as an adjunct to a reduced-calorie diet and increased physical activity |
Comparator | Standard care: Reduced-calorie diet and increased physical activity |
Perspective | Canadian publicly funded health care payer |
Outcome | QALYs, LYs |
Time horizon | 40 years |
Key data source | SCALE clinical trials |
Submitted results for base case (and key scenario analyses as required) | Health Canada indication: ICER = $11,732 per QALY ($405 incremental costs; 0.035 incremental QALYs) Reimbursement request: ICER = $17,319 per QALY ($1,339 incremental costs; 0.077 incremental QALYs) Results were most sensitive to assumptions relating to waning of treatment effect and time horizon. |
Key limitations |
|
CADTH reanalysis results | CADTH undertook reanalyses to address limitations in the sponsor’s submission, including assuming no benefit beyond 2 years of treatment discontinuation, removing complications other than diabetes from the analysis, applying costs to patients with “temporary T2DM reversal,” and focusing only on the reimbursement request population. The ICER was $196,876 per QALY for liraglutide compared with standard of care (incremental costs: $5,652; incremental QALYs: 0.029).
|
BMI = body mass index; HC = Health Canada; ICER = incremental cost-effectiveness ratio; LY = life-year; QALY = quality-adjusted life-year; T2DM = type 2 diabetes mellitus.
Conclusions
Based on the clinical review, liraglutide is effective at improving weight loss and slowing progression to type 2 diabetes mellitus (T2DM) relative to current standard of care. However, there is no evidence to suggest sustained long-term benefit post-treatment discontinuation.
CADTH undertook reanalyses to address limitations in the sponsor’s submission, including assuming no benefit beyond 2 years of treatment discontinuation, removing complications other than diabetes from the analysis, applying costs to patients with “temporary T2DM reversal,” and focusing only on the reimbursement request population. CADTH was unable to address the limitation associated with maximum duration of treatment and could only explore reduced outcomes for liraglutide nonresponders as a scenario analysis.
Based on the reimbursement request population, in the CADTH base case, the incremental cost-effectiveness ratio (ICER) for liraglutide compared with standard care is $196,876 per QALY. However, this assumes that patients who experience no weight loss on liraglutide have better outcomes than patients who experience no weight loss from diet and exercise alone. In a scenario analysis, CADTH assumed that liraglutide responders do as well as placebo responders and vice versa. In this scenario analysis, the ICER increases to $346,556 per QALY. To achieve cost-effectiveness at a $50,000 per QALY threshold, the price of liraglutide would need to be reduced by at least 62%, and perhaps up to 74% when accounting for outcomes for nonresponders. Finally, the results assume that treatment is stopped at 3 years. If taken for longer, the ICER will likely increase and further price reductions will be needed.
Based on the sponsor’s submitted model, the cost-effectiveness for the full Health Canada indication could not be determined due to significant uncertainty regarding long-term use of liraglutide and the inability to explore this within the sponsor’s submitted model. CADTH notes that the ICER in the full indication will likely be higher as the benefits associated with delayed progression to T2DM will be diluted among a wider population that includes patients without prediabetes.
Stakeholder Input Relevant to the Economic Review
This section summarizes feedback received from patient groups, registered clinicians, and drug plans participating in the CADTH review process as the information pertains to the economic submission.
Three Canadian patient organizations — Obesity Canada, Diabetes Canada, and the Gastrointestinal Society — provided input for this submission. Patient group input reported that an estimated 80% to 90% of people with type 2 diabetes live with obesity or being overweight, and that various weight management approaches can help reduce the likelihood that patients who are overweight or living with obesity with prediabetes will progress to having diabetes. Patient groups also reported that obesity leads to inequities in access to employment, health care, and education due to the strong stigma associated with it. Of the 12 respondents to the Diabetes Canada survey who had diabetes or prediabetes, only 1 reported experience with a weight loss medication, which was liraglutide. The patient group emphasized that this may be due to a lack of medication options for obesity available in Canada and a lack of public or private coverage for them, while submitted quotes from patients implied their physicians would not prescribe them weight loss medications. Obesity Canada reported that respondents to their survey who had experience with liraglutide reported an average weight loss of 11% and although patients did find the side effects undesirable, they were manageable and not significant enough to deter them from taking the drug. Patient groups also reported that when asked about outcomes to consider, patients focused less on improved weight than on improvement to comorbidities such as diabetes, hypertension, and sleep apnea.
No clinician groups submitted input for this review. The clinical expert consulted by CADTH for this review indicated that side effects limit the use of all approved pharmacotherapies for obesity in Canada. This expert indicated that weight loss seen with medications often falls within a range of 5% to 10% of body weight, which may ameliorate weight-related comorbidities, but ideally pharmacotherapies would exist that promote larger amounts of weight loss. The expert also stated that while there is no way to predict which patients would lose the most weight with liraglutide, the patients most in need of weight loss intervention are those with an Edmonton Obesity Staging System score from 1 to 3 and patients with Class III obesity (i.e., BMI > 40 kg/m2).
The drug plans requested clarification regarding the potential target patient population and the anticipated treatment duration of liraglutide. The clinical expert considered that in addition to the indicated population, it would be reasonable to consider pharmacotherapy in patients with a BMI between 27 kg/m2 and 30 kg/m2 without comorbidity as second-line after lifestyle changes. The expert felt that patients would regain the weight they had lost if pharmacologic treatment for weight management was discontinued; therefore, such treatments would need to be continued in the long-term, even in patients whose BMI dropped below 30 kg/m2 (or 27 kg/m2 in patients with weight-related comorbidities). The public drug plans also requested clarification regarding re-treatment in patients who regain weight or if liraglutide 3 mg becomes ineffective over time for patients after an initial desired response. The clinical expert noted that if there is no benefit after a patient tries weight loss medication for the first time, it is unlikely they will respond better to it in the future. Therefore, it is unlikely that the drug will be prescribed for the same indication again for that patient.
Several aspects of stakeholder input were addressed in the sponsor’s models:
The modelling of a subpopulation more likely to benefit from liraglutide therapy than the overall indicated population was addressed.
Disutility associated with treatment-related adverse events was included.
CADTH was able to address the following concerns raised from stakeholder input:
There is a shortened time frame to loss of treatment benefit associated with the discontinuation of liraglutide therapy from that assumed by the sponsor.
CADTH was unable to address the following concerns raised from stakeholder input:
While extending the maximum treatment duration beyond 1 year in the indicated population could be partially addressed within the budget impact analysis (BIA), the cost-utility analysis model’s programming prevented extending treatment duration in either modelled population.
Economic Review
The current review is for liraglutide (Saxenda) as an adjunct to a reduced-calorie diet and increased physical activity for chronic weight management in adult patients.
Economic Evaluation
Summary of Sponsor’s Economic Evaluation
Overview
The sponsor submitted an economic model that estimates outcomes in terms of long-term costs and quality-adjusted life-years (QALYs), assessing the cost-effectiveness of liraglutide as an adjunct to a reduced-calorie diet and increased physical activity for chronic weight management in adult patients.1 Analysis relates to 2 patient populations.
Health Canada indication: Adult patients with an initial body mass index (BMI) of 30 kg/m2 or greater (obesity), or 27 kg/m2 or greater (overweight) in the presence of at least 1 weight-related comorbidity (e.g., hypertension, type 2 diabetes, or dyslipidemia) and who have failed a previous weight management intervention.
Reimbursement request: Adult patients who have been diagnosed with obesity (BMI ≥ 30 kg/m2) and prediabetes, or overweight (BMI ≥ 27 kg/m2 and < 30 kg/m2) with 1 or more weight-related comorbidity and prediabetes.
Analysis was conducted from the perspective of a provincial ministry of health with a time horizon of 40 years. A discount rate of 1.5% per annum was applied.2
Liraglutide is delivered daily as a 3 mg subcutaneous injection. Liraglutide is initiated at a dose of 0.6 mg, which is increased weekly up to the 3 mg dose level. After 12 weeks, if a patient has not lost at least 5% of their body weight, treatment should be discontinued. Liraglutide is provided in a pack of 5 pre-filled pens for a total of 90 mg. The unit cost for the pack is $375.10 ($75.02 per pen). Combined with the cost of needles, the monthly cost during the maintenance phase is $383.26.
Within the economic evaluation, liraglutide is compared to standard care comprising diet and exercise. Comparison to other weight loss medications was considered infeasible due to the inability to conduct an appropriate indirect comparison. As liraglutide is an adjunct to diet and exercise, no treatment costs for the comparator therapy are included.
Model Structure
A cohort multi-state Markov model was developed in Microsoft Excel to simulate the progression of adult patients either receiving liraglutide as an adjunct therapy or not receiving liraglutide.
The model estimates the impact of treatments on long-term costs and QALYs. To do this, the model assesses temporal changes on a range of risk factors (BMI, glycemic status, and cardiometabolic risk factors) associated with weight-related complications and events (acute coronary syndrome [ACS], stroke, cancer, sleep apnea, and knee replacement). The probability of patients developing these complications and events was derived from risk prediction models, except for the probability of temporary reversal of prediabetes, which was derived from the SCALE trial.3-18 The risk of death throughout the model is related to the risk of fatal events, the increased risk post events, and the underlying age-gender specific population mortality.19-24 Treatment effectiveness is modelled indirectly through changes in BMI and cardiometabolic risk factors and directly through the effect on progression to diabetes and the temporary reversal of prediabetes.
For the first year, model cycle length is 3 months to allow for treatment discontinuation based on the stopping rule, with a subsequent cycle length of 1 year. Treatment is assumed to be discontinued for all patients at 1 year for the Health Canada indication and at 3 years for the reimbursement request. Treatment discontinuers are assumed to return to their baseline values over a period of 3 years. For nonresponders with liraglutide, the patient pathway is assumed to be consistent with that of all standard care patients.
Model Inputs
For the Health Canada indication, baseline patient characteristics are derived from the SCALE Obesity and Prediabetes trial and the SCALE diabetes trial.3,4,9,10,13,15 For the reimbursement request, only data from the former trial is used.3,4,9,10,13
Treatment effectiveness for both populations was elicited from the same aforementioned trials.3,4,9,10,13,15 Effectiveness relates to treatment response (as measured by a 5% weight loss at 12 weeks), temporary prediabetes reversal, change in systolic blood pressure, change in total cholesterol, and change in high density lipoprotein cholesterol. Risk equations are used to estimate transition probabilities to complications and events.5-8,14,16-18 Mortality is based on literature-based estimates of event-related and complication-related mortality and general population mortality sourced from Statistics Canada life tables.19-24
Health state utilities in the model were based on a regression analysis that mapped SF-36 responses from the SCALE Obesity and Prediabetes study to the EuroQol 5-Dimensions instrument.3,4,9,10,13 Analysis allowed the estimation of utility values by age, presence of heart or circulatory disease, presence of hypertension, smoking status, and BMI (linear, cubic, and quadratic effects). This allowed estimation of the utility scores by BMI. Additional decrements in utility were sourced for literature and related to diabetes, ACS, sleep apnea, cancer, stroke, bariatric surgery knee replacement, and transient ischemic attacks.25,26 Health state utility values for combined states were based on an additive model.
Costs included in the model related to obesity treatment costs, long-term costs of management of obesity-related complications, and acute costs of events related to obesity complications. Treatment cost related to the costs of liraglutide only, as described earlier. Other costs included within the model relate to the incidence of diabetes complications or acute events related to complications and the long-term management of complications. These costs were sourced from the literature.27-30 The model did not include a cost of management of patients who either always had normal glucose levels or who had temporary reversal of prediabetes. Limited details of how costs were derived from the referenced literature were provided.
Summary of Sponsor’s Economic Evaluation Results
The sponsor submitted results for both the Health Canada indication and the reimbursement request based on probabilistic analyses with 1,000 iterations. Several probabilistic scenario analyses were presented.
Base-Case Results
For the Health Canada indication, liraglutide was associated with increased obesity treatment costs of $2,946 (versus $0) but reduced costs of both obesity complications, which were reduced by $2,588 ($119,313 versus $121,901), and events, which were reduced by $19 ($11,565 versus $11,584). Overall liraglutide was associated with incremental costs of $405 ($133,889 versus $133,484). The reduced costs of obesity complications were primarily due to reduced costs of diabetes and prediabetes ($2,453). Liraglutide was associated with increased QALYs of 0.035 (16.939 versus 16.904). Thus, the estimated ICER was $11,732 per QALY.
For the reimbursement request, liraglutide was associated with increased obesity treatment costs of $6,843 (versus $0) but reduced costs of both obesity complications, which were reduced by $5,540 ($114,484 versus $120,024) and events, which were reduced by $43 ($12,077 versus $12,120). Overall liraglutide was associated with incremental costs of $1,340 ($133,491 versus $132,151). The reduced costs of obesity complications were, again, primarily due to reduced costs of diabetes and prediabetes ($5,273). Liraglutide was associated with increased QALYs of 0.077 (16.788 versus 16.711). Thus, the estimated ICER was $17,319 per QALY.
Table 3: Summary of the Sponsor’s Economic Evaluation Results
Intervention | Total costs ($) | Incremental costs vs. standard care ($) | Total QALYs | Incremental QALYs vs. standard care | ICER vs. standard care ($/QALY) |
|---|---|---|---|---|---|
Health Canada indication | |||||
Standard care | 133,484 | Reference | 16.904 | Reference | Reference |
Liraglutide + standard care | 133,889 | 405 | 16.939 | 0.035 | 11,732 |
Reimbursement request | |||||
Standard care | 132,151 | Reference | 16.711 | Reference | Reference |
Liraglutide + standard care | 133,491 | 1,339 | 16.788 | 0.077 | 17,319 |
ICER = incremental cost-effectiveness ratio; QALY = quality-adjusted life-year; vs. = versus.
Source: Sponsor’s Pharmacoeconomic Submission.29
The probability that liraglutide is optimal based on a threshold of $50,000 per incremental QALY was 96.6% for the Health Canada indication and 100% for the reimbursement request.
Sensitivity and Scenario Analysis Results
The results for scenario analyses comparing liraglutide to standard care were generally consistent with the base-case analysis. Higher ICERs were reported for analysis incorporating 1 year of waning of treatment effect ($42,424 per QALY for the Health Canada indication and $44,386 per QALY for the reimbursement request) and time horizon of 20 years ($23,446 per QALY for the Health Canada indication and $31,532 per QALY for the reimbursement request). Scenario analyses incorporating both assumptions were not provided.
CADTH Appraisal of the Sponsor’s Economic Evaluation
CADTH identified several key limitations to the sponsor’s analysis that have notable implications for the economic analysis.
Base-case analysis: The sponsor provided 2 analyses, 1 relating to the Health Canada indication and the other relating to their specific reimbursement request. Major limitations with the analysis based on the Health Canada indication made it unusable for determining cost-effectiveness. This analysis restricts the duration of treatment to 1 year, which is clinically inappropriate given the input from the CADTH clinical expert. This leads treatment to be more cost-effective in this group relative to the narrower reimbursement request population, as the cost of treatment is incurred for 1 year, but benefits continue in terms of weight loss for the same extended period as for the reimbursement request population. The inability to model cost-effectiveness with treatment duration greater than 1 year makes it inappropriate for CADTH to consider within its base case.
CADTH adopted the reimbursement request population for its base case.
The model specifies a maximum treatment period that cannot be extended: The model sets the maximum period of treatment to 1 year for the Health Canada indication and 3 years for the reimbursement request. The CADTH clinical expert argued that it would be unlikely treatment would be curtailed for patients with a continued effect and who were willing to continue.
CADTH was unable to change the maximum period of treatment. CADTH also notes that the ICER for treatment increases the longer the duration of treatment. Thus, caution needs to be taken with the acceptance of the results of the model if treatment duration is longer than specified.
The expected benefits of treatment are assumed to accumulate beyond 5 years: The CADTH clinical expert suggested that 2 years after treatment curtailment, there would be no differences between patients who had received liraglutide and those who had not (i.e., by 5 years for the reimbursement request). CADTH noted that the sponsor assumed continued avoidance of diabetes with those treated with liraglutide, long after treatment curtailment. This is despite it being stated in the sponsor-provided technical report that “glycaemic status will catch-up in full at the end of catch-up period.”13
If it is assumed that patients return to the levels of natural progression, pre-liraglutide use, and have similar outcomes with respect to progression to health states, then there should be no incremental benefits or costs after this point. Based on this, CADTH adopted a 5-year time horizon as the sponsor assumed no treatment use after 3 years and it would take 2 years to return to pre-baseline levels. It should be noted that the estimated ICER using a 5-year time horizon will be identical to the estimate adopting a lifetime horizon if it is assumed that there are no differences in survival at 5 years and no differences in outcomes beyond 5 years.
Inclusion of complications from obesity: As well as the impact of treatment on diabetes and prediabetes, the model incorporates the following complications from obesity: ACS, stroke, cancer, sleep apnea, bariatric surgery, and knee replacement. The SCALE Obesity and Prediabetes trial does not report any effect of liraglutide on these outcomes.3,4,9,10,13
Given the assumption adopted by CADTH that all risk factors will be the same regardless of treatment after 5 years, combined with the lack of evidence of differential rates of complications in the SCALE trial, CADTH used the option within the sponsor’s model and removed complications other than diabetes from the model.
Inability to apply a cost to “temporary reversal of prediabetes”: The model does not allow the user to apply a cost of management of patients who experience a temporary reversal of prediabetes (patients with prediabetes at baseline who temporarily revert to a normal glucose level). CADTH requested that the sponsor provide this capability, but the sponsor declined. The clinical expert consulted by CADTH noted that the costs of management of patients who experience such a temporary reversal of prediabetes are unlikely to be drastically modified and certainly would not be 0, as in the current model. To assume a cost of $0 for the temporary reversal of a prediabetes state requires the assumption that patients who had prediabetes would no longer either have follow-up appointments with their clinician or receive any other form of clinical management.1,13
As the CADTH base case excludes health states related to complications other than diabetes, it was possible for CADTH to derive the time spent in the temporary reversal of prediabetes state. CADTH assumed that the costs of managing patients with a temporary reversal of prediabetes were half the costs of managing a patient with prediabetes, but this may underestimate the true costs.
Nonresponders with liraglutide were assumed to have the same long-term outcomes as all patients on standard care: CADTH noted that within the model, the disease pathway of nonresponders on liraglutide is modelled using efficacy data for the comparator arm from the clinical trials (i.e., standard care).3,4,9,10,13 CADTH notes that more than 20% of patients on placebo, however, achieved a response as defined by a 5% or more weight loss, within the reimbursement population. Thus, assuming that liraglutide nonresponders would have the same long-term outcomes as the average patient on standard care is biased, as they would by definition experience inferior outcomes as standard care responders. On February 9 2021, the sponsor was asked to revise the model to address this issue. On March 9, the sponsor responded with a proposal to leverage an existing scenario analysis conducted for the National Institute for Health and Care Excellence to help address this issue. However, limited details for this analysis were provided and, given the need for expediency, CADTH adopted its own approach to explore this issue.
CADTH attempted to address this issue through interpolation. The approach used the estimates of response (loss of ≥ 5% of body weight) at 160 weeks from the SCALE Obesity and Prediabetes trial3,4,9,10,13 for liraglutide and standard care combined with estimates of QALYs and costs from the CADTH base case for both treatment options to estimate the average costs and QALYs for nonresponders and responders. Further details are provided in Appendix 4. This is an ad hoc approach to addressing this limitation and CADTH suggests it provides a clue to the potential impact on the ICER if this was more adequately addressed. This analysis also assumes that patients who respond have the same outcomes, regardless of whether they achieved this through liraglutide or standard care. Given these limitations, CADTH suggests that this should be considered as a scenario analysis. A further analysis based on the percentage of responders at 12 weeks was conducted. It should be noted that this approach may lead to bias as the assumption that a responder at 12 weeks for either liraglutide or standard care indicates long-term outcomes is not borne out by the data. There is a decrease in responders from week 12 to week 160 with liraglutide (from 68.1% to 49.6%) versus a small positive change with standard care (from 22.5% to 23.7%).
Technical issues with the model: CADTH found that the model lacked transparency. Upon request, the sponsor removed all IFERROR statements and, in most instances, unnecessary sheets and data references. However, some unnecessary sheets remained as the sponsor argued that the “removal of unused sheets would have required a fundamental change in the model structure as well as changes to the model engine.” Thus, the transparency of the model was constrained. The sponsor did not provide a detailed user guide for the model; rather, the user guide was integrated within the Excel workbook. The integrated user guide did not provide details of the purpose for each sheet, nor did it identify how data were processed throughout the workbook. Thus, given the complexity of the model, a detailed user guide explaining how the model functioned would have been appropriate. Concerns over the transparency of the model are illustrated by confusion over what the true total costs of standard care and liraglutide are, based on calculations made within the model. Within the model, the total sum of costs across states differs slightly from the total cost reported in the model. CADTH recognizes that the choice of estimate only has a minor impact on the ICER and has little impact on the conclusions drawn.
Additional limitations were identified, but were not considered to be key limitations.
Cost-effectiveness relative to other pharmacotherapies: It was not feasible to assess the cost-effectiveness of liraglutide versus other pharmacotherapies. However, it was noted that pharmacotherapies for obesity are rarely funded across Canada and, therefore, standard of care was considered the appropriate comparator.
Additionally, further key assumptions were made by the sponsor and have been appraised by CADTH (see Table 4).
Table 4: Key Assumptions of the Submitted Economic Evaluation (Not Noted as Limitations to the Submission)
Sponsor’s key assumption | CADTH comment |
|---|---|
Additive model for combining utility effects within hybrid states | Likely inappropriate Analysis adopts an additive assumption for utility values for hybrid states. This approach leads to the largest assumed utility effect of avoiding complications and is therefore likely to over-estimate QALY benefits and underestimate the ICER. |
Costs for management of obesity complications derived from the literature | Possibly inappropriate Analysis cites literature as the source of cost data for the analysis but the basis upon which the values are estimated is not provided. This is clearly so with respect to the costs associated with prediabetes and diabetes. These were elicited from the Goeree study (2009),a and are key cost drivers within the model A further example is the annual costs associated with sleep apnea, which appear to be based on the initial costs associated with diagnosis and not long-term costs.b |
Adoption of risk equations from the literature to estimate the rate of obesity complications | Unclear. The CADTH base-case analysis does not incorporate modelling of complications other than diabetes. Therefore, the choice of risk equation has no impact. |
ICER = incremental cost-effectiveness ratio; QALY = quality-adjusted life-year.
aGoeree et al. (2009)29
bPendharkar et al. (2017)30
CADTH Reanalyses of the Economic Evaluation
Base-Case Results
The CADTH reanalysis addressed the limitations of the submitted model and report as outlined previously (Table 5).
Table 5: CADTH Revisions to the Submitted Economic Evaluation
Stepped analysis | Sponsor’s value or assumption | CADTH value or assumption |
|---|---|---|
Changes to derive the CADTH base case | ||
1. Adoption of the reimbursement request as the base case | The sponsor provided analysis based on the HC indication and based on the reimbursement request. | CADTH’s base-case analysis was based on the reimbursement request, given the significant limitations associated with the full HC indication analysis. |
2. After 5 years, the outcomes for liraglutide and standard care are the same | Although the sponsor’s model allows for an analysis whereby risk factors return to the natural progression level when doing this, outcomes beyond 5 years are still found to vary by treatment. | CADTH used the functionality of the sponsor’s model to set risk factors to return to their rate of natural progression and by setting the catch-up period to 2 years, CADTH had to adopt a 5-year time horizon. |
3. Inclusion of diabetes as the only obesity-related complication | The sponsor included the following obesity-related complications within its model: acute coronary syndrome, stroke, cancer, sleep apnea, bariatric surgery, and knee replacement. | Given the lack of evidence relating to a link between treatment and these outcomes and the assumption of no differences between treatments after 5 years, CADTH used the functionality in the sponsor-submitted model to exclude complications other than diabetes. |
4. Inclusion of a cost associated with temporary reversal of prediabetes | The sponsor assumed that patients with prediabetes who experienced a temporary reversal would require no health care costs. | Despite CADTH’s request, the sponsor would not allow the implementation of a cost for this state. CADTH reprogrammed the model to allow for a cost for this state, assuming half the cost of prediabetes. In a scenario analysis, CADTH assumed the cost was equal to the cost of prediabetes. |
5. Nonresponders with liraglutide having different outcomes than the average for standard care | The sponsor assumed that nonresponders with liraglutide would have the same outcomes as all patients on standard care. | CADTH attempted to address this limitation through interpolation. |
CADTH base case | 1 + 2 + 3 + 4 | |
CADTH scenario analysis | 1 + 2 + 3 + 4 + 5 | |
HC = Health Canada.
In the CADTH base-case analysis, liraglutide was associated with more QALYs (3.894 versus 3.865) and higher costs ($18,036 versus $12,384) than standard care, leading to an ICER of $196,876 per QALY. The incremental treatment costs associated with liraglutide of $6,854 were partially offset by a reduction in the costs of complications from obesity of $1,202.
At a threshold of $50,000 per QALY, the probability that liraglutide was optimal was 0%.
Table 6: Summary of CADTH’s Base-Case Results — Reimbursement Request
Intervention | Total costs ($) | Incremental costs vs. standard care($) | Total QALYs | Incremental QALYs vs. standard care | ICER vs. standard care ($/QALY) |
|---|---|---|---|---|---|
Standard care | 12,384 | Reference | 3.865 | Reference | Reference |
Liraglutide + standard care | 18,036 | 5,652 | 3.894 | 0.029 | $196,876 |
ICER = incremental cost-effectiveness ratio; QALY = quality-adjusted life-year; vs. = versus.
Table 7: Summary of the Stepped Analysis of the CADTH Reanalysis Results
Stepped analysis | Intervention | Total costs ($) | Total QALYs | ICER vs. standard care ($/QALYs) |
|---|---|---|---|---|
1. Sponsor’s analysis for reimbursement request | Standard care | 132,151 | 16.711 | Reference |
Liraglutide + standard care | 133,491 | 16.788 | 17,319 | |
1 + 2. Equal long-term outcomes after 5 years | Standard care | 15,414 | 3.815 | Reference |
Liraglutide + standard care | 19,611 | 3.847 | 133,178 | |
1 + 2 + 3. Inclusion of diabetes as the only obesity-related complication | Standard care | 10,056 | 3.865 | Reference |
Liraglutide + standard care | 14,631 | 3.894 | 159,349 | |
1 + 2 + 3 + 4. Inclusion of a cost associated with temporary reversal of prediabetes (CADTH base case) | Standard care | 12,384 | 3.865 | Reference |
Liraglutide + standard care | 18,036 | 3.894 | 196,876 | |
1 + 2 + 3 + 4 + 5. | Standard care | 12,384 | 3.865 | Reference |
Liraglutide + standard care | 18,416 | 3.885 | 308,815 |
ICER = incremental cost-effectiveness ratio; QALY = quality-adjusted life-year; vs. = versus .
Scenario Analysis Results
In the scenario analysis that accounted for the overestimated benefits associated with liraglutide nonresponders, the ICER increased to $308,815 per QALY. An additional scenario analysis was conducted (Table 13) that assumed that the costs of managing patients with temporary reversal of prediabetes is equivalent to those with prediabetes. In this analysis, the ICER was $234,402 per QALY. A combination of both scenario analyses leads to an ICER of $346,556 per QALY. A further analysis was conducted based on response rates at 12 weeks. This leads to an estimated ICER of $234,483.
Although reanalysis for the Health Canada indication is not possible given the limitations of the submitted model, it is likely that the ICER for the broader population would be higher than CADTH’s base case, given the reduced effectiveness.
With the sponsor’s submitted analysis, liraglutide is cost-effective at a $50,000 per QALY threshold for the reimbursement request without any price reductions. With the CADTH base-case analysis, the price reduction necessary for liraglutide to be cost-effective at a threshold of $50,000 per QALY is 62%. However, this increases to 74% if accounting for the overestimation of benefit in liraglutide nonresponders.
Table 8: Price Reduction Analysis — Reimbursement Request
Price reduction | Price reduction analysis for liraglutide | ||
|---|---|---|---|
Sponsor base case | CADTH base-case ICER ($/QALY) | CADTH scenario analysis ICER (adjusting benefit associated with nonresponders) ($/QALY) | |
No price reduction | $17,319 | $196,876 | $308,815 |
10% | $8,471 | $173,004 | $272,088 |
20% | Liraglutide dominant over standard care | $149,312 | $237,207 |
30% | Liraglutide dominant over standard care | $125,261 | $202,326 |
40% | Liraglutide dominant over standard care | $101,389 | $167,445 |
50% | Liraglutide dominant over standard care | $77,518 | $132,564 |
60% | Liraglutide dominant over standard care | $53,646 | $97,683 |
70% | Liraglutide dominant over standard care | $29,774 | $62,802 |
ICER = incremental cost-effectiveness ratio; QALY = quality-adjusted life-year; vs. = versus.
Overall Conclusions
Based on the clinical review, liraglutide is effective at improving weight loss and slowing progression to T2DM relative to current standard of care. However, there is no evidence to suggest sustained long-term benefit post-treatment discontinuation.
CADTH undertook reanalyses to address limitations in the sponsor’s submission, including assuming no benefit beyond 2 years of treatment discontinuation, removing complications other than diabetes from the analysis, applying costs to patients with “temporary T2DM reversal,” and focusing only on the reimbursement request population. CADTH was unable to address the limitation associated with the maximum duration of treatment and could only explore reduced outcomes for liraglutide nonresponders as a scenario analysis.
Based on the reimbursement request population, in the CADTH base case, the ICER for liraglutide compared with standard care is $196,876 per QALY. However, this assumes that patients who experience no weight loss on liraglutide have better outcomes than patients who experience no weight loss from diet and exercise alone. In a scenario analysis, CADTH assumed that liraglutide responders do as well as placebo responders and vice versa. In this scenario analysis, the ICER increases to $346,556 per QALY. To achieve cost-effectiveness at a $50,000 per QALY threshold, the price of liraglutide would need to be reduced by at least 62%, and perhaps up to 74% when accounting for outcomes for nonresponders. Therefore, the true level of cost-effectiveness is contingent on how different we expect outcomes to be for patients who experience less than 5% weight loss on liraglutide versus patients who experience less than 5% weight loss on diet and exercise alone.
There are some outstanding uncertainties within the analysis, such as what is the true cost of managing patients with prediabetes who temporarily revert to normal glucose tolerance. CADTH assumed this cost was 50% of the cost of managing prediabetes, but it may be that there is no to little reduction in costs. In this case, the ICER increases to $234,402 per QALY, meaning that further price reductions may be required. CADTH also notes that there is significant uncertainty regarding the BIA, which could be as high as $1.4 billion over 3 years for the full Health Canada indication and $1.2 billion in the reimbursement population. A conservative estimate still places this cost at almost $600 million for the full Health Canada indication and $315 million for the reimbursement population.
Based on the sponsor’s submitted model, the cost-effectiveness for the full Health Canada indication could not be determined due to significant uncertainty regarding long-term use of liraglutide and the inability to explore this within the sponsor’s submitted model. CADTH notes that the ICER in the full indication will likely be higher as the benefits associated with delayed progression to T2DM will be diluted among a wider population that includes patients without diabetes.
References
1.Pharmacoeconomic evaluation [internal sponsor's report]. In: Drug Reimbursement Review sponsor submission: Saxenda (liraglutide 3.0 mg) 6 mgl/mL solution for injection, 3 mL pre-filled pen. Mississauga (ON): Novo Nordisk Canada Inc.; 2020 Dec 23.
2.Guidelines for the economic evaluation of health technologies: Canada. 4th ed. Ottawa (ON): CADTH; 2017: https://www.cadth.ca/dv/guidelines-economic-evaluation-health-technologies-canada-4th-edition. Accessed 2021 Apr 28.
3.Pi-Sunyer X, Astrup A, Fujioka K, et al. A randomized, controlled trial of 3.0 mg of liraglutide in weight management. N Engl J Med. 2015;373(1):11-22. PubMed
4.Lau D, Fujioka K, Greenway F, et al. Early weight loss responders to liraglutide 3.0 mg had greater weight loss, regression to normoglycemia and reduced T2D development at 3 years vs. early non-responders: SCALE obesity and prediabetes. Can J Diabetes. 2016;40(5):S33.
5.Young T, Shahar E, Nieto FJ, et al. Predictors of sleep-disordered breathing in community-dwelling adults: the Sleep Heart Health Study. Arch Intern Med. 2002;162(8):893-900. PubMed
6.Adams KF, Leitzmann MF, Albanes D, et al. Body mass and colorectal cancer risk in the NIH-AARP cohort. Am J Epidemiol. 2007;166(1):36-45. PubMed
7.Renehan AG, Tyson M, Egger M, Heller RF, Zwahlen M. Body-mass index and incidence of cancer: a systematic review and meta-analysis of prospective observational studies. Lancet. 2008;371(9612):569-578. PubMed
8.Schlesinger S, Lieb W, Koch M, et al. Body weight gain and risk of colorectal cancer: a systematic review and meta-analysis of observational studies. Obes Rev. 2015;16(7):607-619. PubMed
9.Blueher M, Wehrhahn T, Hermansen K, et al. Early weight loss with liraglutide 3.0 mg is a good predictor of clinically meaningful weight loss after 56 weeks. Diabetologie und Stoffwechsel. 2016;11(S 01):P206.
10.le Roux CW, Astrup A, Fujioka K, et al. 3 years of liraglutide versus placebo for type 2 diabetes risk reduction and weight management in individuals with prediabetes: a randomised, double-blind trial. Lancet. 2017;389(10077):1399-1409. PubMed
11.Clinical Trial Report: NN8022-1839. Effect of liraglutide on body weight in non-diabetic obese subjects or overweight subjects with comorbidities: A randomised, double-blind, placebo controlled, parallelgroup, multi-centre, multinational trial with stratification of subject to either 56 or 160 weeks of treatment based on pre-diabetes status at randomisation [internal sponsor's report]. Bagsværd (DK): Novo Nordisk; 2013 Oct 28.
12.Clinical Trial Report: NN8022-1839 (3-year part). Effect of liraglutide on body weight in non-diabetic obese subjects or overweight subjects with comorbidities: A randomised, double-blind, placebo controlled, parallelgroup, multi-centre, multinational trial with stratification of subject to either 56 or 160 weeks of treatment based on pre-diabetes status at randomisation [internal sponsor's report]. Bagsværd (DK): Novo Nordisk; 2016 Jan 18.
13.Drug Reimbursement Review sponsor submission: Saxenda (liraglutide 3.0 mg) 6 mgl/mL solution for injection, 3 mL pre-filled pen [internal sponsor's package]. Mississauga (ON): Novo Nordisk Canada Inc.; 2020 Dec 23.
14.D'Agostino RB, Russell MW, Huse DM, et al. Primary and subsequent coronary risk appraisal: new results from the Framingham study. Am Heart J. 2000;139(2 Pt 1):272-281. PubMed
15.Davies MJ, Bergenstal R, Bode B, et al. Efficacy of liraglutide for weight loss among patients with type 2 diabetes: the SCALE diabetes randomized clinical trial. JAMA. 2015;314(7):687-699. PubMed
16.Hayes AJ, Leal J, Gray AM, Holman RR, Clarke PM. UKPDS outcomes model 2: a new version of a model to simulate lifetime health outcomes of patients with type 2 diabetes mellitus using data from the 30 year United Kingdom Prospective Diabetes Study: UKPDS 82. Diabetologia. 2013;56(9):1925-1933. PubMed
17.Hippisley-Cox J, Coupland C. Development and validation of QDiabetes-2018 risk prediction algorithm to estimate future risk of type 2 diabetes: cohort study. BMJ. 2017;359:j5019. PubMed
18.Wendelboe AM, Hegmann KT, Biggs JJ, et al. Relationships between body mass indices and surgical replacements of knee and hip joints. Am J Prev Med. 2003;25(4):290-295. PubMed
19.Table: 13-10-0114-01. Life expectancy and other elements of the life table, Canada, all provinces except Prince Edward Island. Ottawa (ON): Statistics Canada; 2020: https://www150.statcan.gc.ca/t1/tbl1/en/tv.action?pid=1310011401. Accessed 2021 Apr 28.
20.Canadian Cancer Statistics Advisory Committee. Canadian cancer statistics 2019. Toronto (ON): Canadian Cancer Society; 2019: https://www.cancer.ca/~/media/cancer.ca/CW/cancer%20information/cancer%20101/Canadian%20cancer%20statistics/Canadian-Cancer-Statistics-2019-EN.pdf?la=en. Accessed 2021 Apr 28.
21.Johansson S, Rosengren A, Young K, Jennings E. Mortality and morbidity trends after the first year in survivors of acute myocardial infarction: a systematic review. BMC Cardiovasc Disord. 2017;17(1):53. PubMed
22.Singh JA, Jensen MR, Harmsen WS, Gabriel SE, Lewallen DG. Cardiac and thromboembolic complications and mortality in patients undergoing total hip and total knee arthroplasty. Ann Rheum Dis. 2011;70(12):2082-2088. PubMed
23.Townsend N, Wickramasinghe K, Bhatnagar P, et al. Coronary heart disease statistics 2012 edition. London (GB): British Heart Foundation; 2012: https://www.bhf.org.uk/informationsupport/publications/statistics/coronary-heart-disease-statistics-2012. Accessed 2021 Mar 31.
24.Brammas A, Jakobsson S, Ulvenstam A, Mooe T. Mortality after ischemic stroke in patients with acute myocardial infarction: predictors and trends over time in Sweden. Stroke. 2013;44(11):3050-3055. PubMed
25.Gough SC, Kragh N, Ploug UJ, Hammer M. Impact of obesity and type 2 diabetes on health-related quality of life in the general population in England. Diabetes Metab Syndr Obes. 2009;2:179-184. PubMed
26.Sullivan PW, Slejko JF, Sculpher MJ, Ghushchyan V. Catalogue of EQ-5D scores for the United Kingdom. Med Decis Making. 2011;31(6):800-804. PubMed
27.New drugs for type 2 diabetes: second-line therapy - science report. (CADTH Therapeutic review vol.4, no.1b). Ottawa (ON): CADTH; 2017: https://cadth.ca/sites/default/files/pdf/TR0012_T2D_Science_Report.pdf. Accessed 2021 Apr 29.
28.de Oliveira C, Pataky R, Bremner KE, et al. Phase-specific and lifetime costs of cancer care in Ontario, Canada. BMC Cancer. 2016;16(1):809. PubMed
29.Goeree R, Lim ME, Hopkins R, et al. Prevalence, total and excess costs of diabetes and related complications in Ontario, Canada. Can J Diabetes. 2009;33(1):35-45.
30.Pendharkar SR, Povitz M, Bansback N, et al. Testing and treatment for obstructive sleep apnea in Canada: funding models must change. CMAJ. 2017;189(49):E1524-E1528. PubMed
31.CADTH Canadian Drug Expert Committee (CDEC) final recommendation: naltrexone hydrochloride and bupropion hydrochloride (Contrave - Bausch Health, Canada Inc.). Ottawa (ON): CADTH; 2020 Jun: https://cadth.ca/sites/default/files/cdr/complete/SR0610%20Contrave%20-%20CDEC%20Final%20Recommendation%20June%205%2C%202020%20Final_for%20posting.pdf. Accessed 2021 Feb 08.
32.DeltaPA. [Ottawa (ON)]: IQVIA; 2021: https://www.iqvia.com/. Accessed 2021 Feb 08.
33.Budget impact analysis [internal sponsor's report]. In: Drug Reimbursement Review sponsor submission: Saxenda (liraglutide 3.0 mg) 6 mgl/mL solution for injection, 3 mL pre-filled pen. Mississauga (ON): Novo Nordisk Canada Inc.; 2021 Mar 2.
34.Saxenda (liraglutide): 6 mg/mL solution for injection in a pre-filled pen Human Glucagon Like Peptide-1 (GLP-1) [product monograph]. Mississauga (ON): Novo Nordisk Canada Inc.; 2021 Feb 25.
35.Table: 17-10-0005-01. Population estimates on July 1st, by age and sex. Ottawa (ON): Statistics Canada; 2020: https://www150.statcan.gc.ca/t1/tbl1/en/tv.action?pid=1710000501. Accessed 2021 Feb 22.
36.Table: 13-10-0096-17. Contact with a medical doctor in the last 12 months, by age group. Ottawa (ON): Statistics Canada; 2021: https://www150.statcan.gc.ca/t1/tbl1/en/tv.action?pid=1310009617. Accessed 2021 Apr 28.
37.Statistics Canada. Adult obesity prevalence in Canada and the United States. 2015; https://www150.statcan.gc.ca/n1/pub/82-625-x/2011001/article/11411-eng.htm. Accessed 2021 Feb 22.
38.Janssen I. The public health burden of obesity in Canada. Can J Diabetes. 2013;37(2):90-96. PubMed
39.Twells LK JI, Kuk JL. Canadian adult obesity clinical practice guidelines: epidemiology of adult obesity. Edmonton (AB): Obesity Canada; 2020: https://obesitycanada.ca/guidelines/epidemiology/. Accessed 2021 Mar 3.
40.Obesity in Canada: A joint report from the Public Health Agency of Canada and the Canadian Institute for Health Information. Ottawa (ON): Public Health Agency of Canada; 2011: https://www.canada.ca/en/public-health/services/health-promotion/healthy-living/obesity-canada.html. Accessed 2021 Mar 26.
41.Sutherland G, Dinh T. Understanding the gap: a pan-Canadian analysis of prescription drug insurance coverage. Ottawa (ON): The Conference Board of Canada; 2017: https://www.conferenceboard.ca/e-library/abstract.aspx?did=9326. Accessed 2021 Mar 31.
42.Table: 13-10-0096-01. Health characteristics, annual estimates. Ottawa (ON): Statistics Canada; 2019: https://www150.statcan.gc.ca/t1/tbl1/en/tv.action?pid=1310009601. Accessed 2021 Mar 26.
43.Healthy Blood Pressure Framework Steering and Drafting Committee (2012). Pan Canadian framework on the prevention and control of hypertension: a discussion paper on the way forward. Markham (ON): Hypertension Canada; 2012: https://hypertension.ca/wp-content/uploads/2017/11/2012_Final_Hypertension_Framework_English.pdf. Accessed 2021 Mar 23.
44.Public Health Agency of Canada. Hypertension and diabetes (prevalence): report from the Canadian Chronic Disease Surveillance System: hypertension in Canada, 2010. 2010; https://www.canada.ca/en/public-health/services/chronic-diseases/cardiovascular-disease/report-canadian-chronic-disease-surveillance-system-hypertension-canada-2010/adults-with-diagnosed-hypertension-and-diabetes.html. Accessed 2021 Mar 23.
Appendix 1: Cost Comparison Table
Note that this appendix has not been copy-edited.
The comparators presented in the following table have been deemed to be appropriate based on feedback from clinical expert(s). Comparators may be recommended (appropriate) practice or actual practice. Existing Product Listing Agreements are not reflected in the table and as such, the table may not represent the actual costs to public drug plans.
Table 9: CADTH Cost Comparison Table for Obesity
Treatment | Strength | Form | Price | Recommended dosage | Daily cost ($) | Annual cost |
|---|---|---|---|---|---|---|
Liraglutide (Saxenda) | 6 mg / mL | 3 mL pre-filled pen | 75.0200a | Initial dose 0.6 mg once daily, increasing by 0.6 mg daily per week until 3.0 mg daily dose is reached | 2.50, initial week 12.50, once full dose is reached | Year 1: 4,389 Thereafter: 4,564 |
Naltrexone hydrochloride / bupropion (Contrave) | 8 mg / 90 mg | Tablet | 2.2149b | 2 tablets twice daily | 8.86 | 3,234 |
Orlistat (Xenical) | 120 mg | Capsule | 1.6723c | 120 mg 3 times daily with meals | 5.02 | 1,831 |
NA = not applicable. Note: Prices do not include dispensing fees or markups.
aSponsor’s submitted price.1
bPrice submitted to CADTH for the review of Contrave for obesity.31
cIQVIA Delta PA wholesale price (Accessed February 2021).32
Appendix 2: Submission Quality
Note that this appendix has not been copy-edited.
Description | Yes/no | Comments |
|---|---|---|
Population is relevant, with no critical intervention missing, and no relevant outcome missing | Yes | |
Model has been adequately programmed and has sufficient face validity | No | There were concerns with the lack of transparency with the model and lack of a detailed user guide. |
Model structure is adequate for decision problem | No | The assumption that nonresponders on liraglutide have standard care outcomes is inappropriate. |
Data incorporation into the model has been done adequately (e.g., parameters for probabilistic analysis) | Yes | |
Parameter and structural uncertainty were adequately assessed; analyses were adequate to inform the decision problem | No | The inability to provide a model where a cost could be prescribed to the temporary reversal of prediabetes is a limitation. |
The submission was well organized and complete; the information was easy to locate (clear and transparent reporting; technical documentation available in enough details) | No | The lack of a user guide is a limitation. |
Appendix 3: Additional Information on the Submitted Economic Evaluation
Note that this appendix has not been copy-edited.
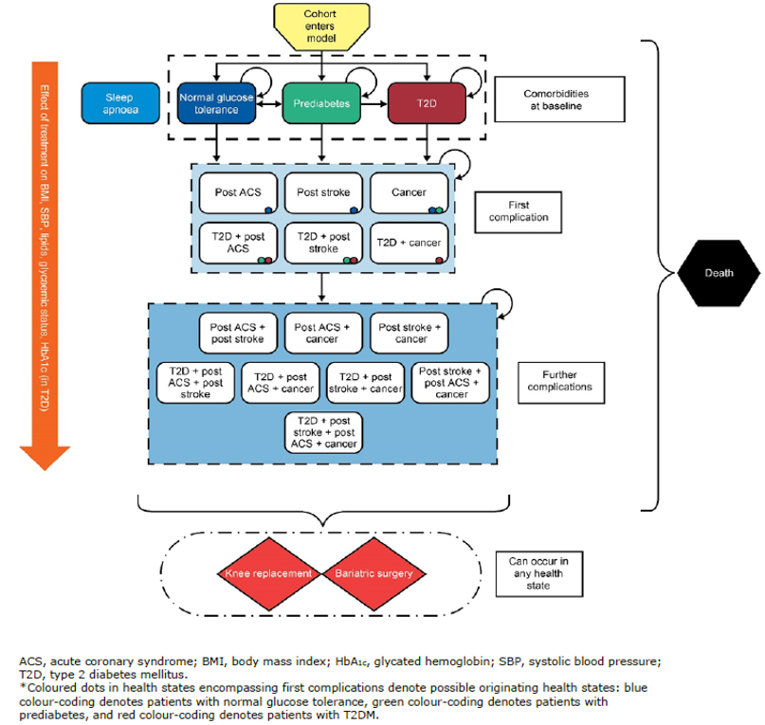
Detailed Results of the Sponsor’s Base Case
Table 11 details the disaggregated results of the sponsor’s base case.
Table 11: Disaggregated Summary of Sponsor’s Base Case (Health Canada indication)
Summary details | Liraglutide | Standard care |
|---|---|---|
TOTAL costs ($) | 133,889 | 133,484 |
Obesity treatment costs ($) | 2,946 | 0 |
Obesity complications: State costs ($) | 119,313 | 121,901 |
OSA ($) | 19,327 | 19,412 |
Pre-T2DM ($) | 15,651 | 16,669 |
T2DM ($) | 69,489 | 70,924 |
Post ACS ($) | 6,857 | 6,884 |
Cancer ($) | 2,585 | 2,580 |
Post stroke ($) | 5,404 | 5,432 |
Obesity complications: Events costs ($) | 11,565 | 11,584 |
Bariatric surgery (non-fatal) ($) | 794 | 793 |
Fatal bariatric surgery ($) | 1 | 1 |
Knee replacement (non-fatal) ($) | 10,738 | 10,758 |
Fatal knee replacement ($) | 32 | 32 |
TOTAL QALYs | 16.939 | 16.904 |
No complication | 3.756 | 3.748 |
Temporary pre-T2DM reversal | 0.897 | 0.488 |
Pre-T2DM | 4.403 | 4.661 |
T2DM | 5.915 | 6.033 |
Post ACS | 0.235 | 0.220 |
Post ACS + T2DM | 0.777 | 0.794 |
Post stroke | 0.141 | 0.132 |
Post stroke + T2DM | 0.458 | 0.468 |
Post ACS + post stroke | 0.037 | 0.034 |
Post ACS + post stroke + T2DM | 0.216 | 0.222 |
Cancer | 0.121 | 0.119 |
Cancer + T2DM | 0.088 | 0.089 |
Cancer + post ACS | 0.005 | 0.005 |
Cancer + post stroke | 0.002 | 0.002 |
Cancer + post ACS + post stroke | 0.001 | 0.0 |
Cancer + post ACS + T2DM | 0.014 | 0.014 |
Cancer + post stroke + T2DM | 0.006 | 0.006 |
Cancer + post ACS + post stroke + T2DM | 0.004 | 0.004 |
OSA | −0.113 | −0.114 |
Stroke (non-fatal) | −0.024 | −0.024 |
Fatal stroke | −0.007 | −0.007 |
TIA | −0.001 | −0.001 |
MI (non-fatal) | −0.017 | −0.017 |
Fatal MI | −0.011 | −0.011 |
Unstable angina (non-fatal) | −0.016 | −0.016 |
Fatal unstable angina | −0.010 | −0.010 |
Bariatric surgery (non-fatal) | −0.011 | −0.011 |
Fatal bariatric surgery | 0.0 | 0.0 |
Knee replacement (non-fatal) | −0.017 | −0.017 |
Fatal knee replacement | 0.0 | 0.0 |
TOTAL LYs | 22.586 | 22.566 |
Appendix 4: Additional Details on the CADTH Reanalysis
Note that this appendix has not been copy-edited.
Table 12: Disaggregated Summary of CADTH’s Base Case (Reimbursement Population)
Item | Liraglutide | Standard care |
|---|---|---|
TOTAL costs | 18,036 | 12,384 |
Obesity treatment costs | 6,854 | 0 |
Obesity complications: State costs | 10,919 | 12,200 |
OSA | 0 | 0 |
Temporary pre-T2DM reversal | 3,406 | 2,328 |
Pre-T2DM | 6,345 | 8,349 |
T2DM | 1,168 | 1,523 |
Post ACS | 0 | 0 |
Cancer | 0 | 0 |
Post stroke | 0 | 0 |
Obesity complications: Events costs | 184 | 184 |
Bariatric surgery (non-fatal) | 183 | 183 |
Fatal bariatric surgery | 0 | 0 |
Knee replacement (non-fatal) | 0 | 0 |
Fatal knee replacement | 0 | 0 |
TOTAL QALYs | 3.894 | 3.865 |
No complication | 0.0 | 0.0 |
Temporary pre-T2DM reversal | 1.565 | 1.051 |
Pre-T2DM | 1.494 | 1.954 |
T2DM | 0.090 | 0.116 |
Post ACS | 0.0 | 0.0 |
Post ACS + T2DM | 0.0 | 0.0 |
Post stroke | 0.0 | 0.0 |
Post stroke + T2DM | 0.0 | 0.0 |
Post ACS + post stroke | 0.0 | 0.0 |
Post ACS + post stroke + T2DM | 0.0 | 0.0 |
Cancer | 0.0 | 0.0 |
Cancer + T2DM | 0.0 | 0.0 |
Cancer + post ACS | 0.0 | 0.0 |
Cancer + post stroke | 0.0 | 0.0 |
Cancer + post ACS + post stroke | 0.0 | 0.0 |
Cancer + post ACS + T2DM | 0.0 | 0.0 |
Cancer + post stroke + T2DM | 0.0 | 0.0 |
Cancer + post ACS + post stroke + T2DM | 0.0 | 0.0 |
OSA | 0.0 | 0.0 |
Stroke (non-fatal) | 0.0 | 0.0 |
Fatal stroke | 0.0 | 0.0 |
TIA | 0.0 | 0.0 |
MI (non-fatal) | 0.0 | 0.0 |
Fatal MI | 0.0 | 0.0 |
Unstable angina (non-fatal) | 0.0 | 0.0 |
Fatal unstable angina | 0.0 | 0.0 |
Bariatric surgery (non-fatal) | −0.003 | −0.003 |
Fatal bariatric surgery | 0.0 | 0.0 |
Knee replacement (non-fatal) | 0.0 | 0.0 |
Fatal knee replacement | 0.0 | 0.0 |
TOTAL LYs | 4.833 | 4.833 |
Table 13: Summary of CADTH’s Scenario Analysis: Costs of Managing Temporary Reversal of Prediabetes and Diabetes are Equivalent (Reimbursement Population)
Intervention | Total costs ($) | Incremental costs vs. standard care ($) | Total QALYs | Incremental QALYs vs. standard care | ICER vs. standard care ($/QALY) |
|---|---|---|---|---|---|
Standard Care | 14,712 | 3.865 | |||
Liraglutide + Standard Care | 21,442 | 6,730 | 3.894 | 0.029 | $234,402 |
ICER = incremental cost-effectiveness ratio; QALY = quality-adjusted life-year; vs. = versus.
Explanation of Methods for Interpolation
CADTH had noted 2 limitations with the sponsor’s submission for which revisions to the model were requested. These requests were not addressed by the sponsor. Without these revisions, the CADTH reanalysis would not fully address the requirements of the decision problem. As the model was not flexible to accommodate these changes CADTH had to revise the model results based on expected changes.
To incorporate a cost for patients who were prediabetic and temporarily revert to normal glucose levels (referred to here after as temporary reversal state) CADTH adopted the following approach.
From the CADTH reanalysis, diabetes is the only included complication in the model. Therefore, patients will be in 1 of 4 states: temporary reversal (TEMP), prediabetes (PRED), diabetes (DIAB) and death (D)
The total time (t) in temporary reversal, prediabetes and diabetes is represented by life expectancy (LE): LE = t(TEMP) + t(PRED) + t(DIAB)
t(PRED) = (total costs associated with PRED)/(annual cost of PRED)
t(DIAB) = (total costs associated with DIAB)/(annual cost of DIAB)
Rearranging from step 2, t(TEMP) is the difference between LE and the sum of t(PRED) and t(DIAB). t(TEMP) = LE - t(PRED) - t(DIAB)
CADTH applied an annual cost (50% of prediabetes cost) to t(TEMP) and added this to the total costs associated with liraglutide and standard care
To ensure nonresponders have the same outcomes regardless of treatment option CADTH adopted the following approach.
From the CADTH reanalysis, estimates of the costs associated with liraglutide and standard care as well as the QALYs for liraglutide and standard care are estimated.
Using these numbers CADTH could calculate the average cost and QALYs associated with responders and nonresponders under the assumption that outcomes for nonresponders are equal regardless of therapy and likewise that outcomes for responders are also equal.
Average cost (response) = (management costs LIR – proportion who do not respond to LIR * management costs for SC) / (proportion who respond to LIR)
Average cost (nonresponders) = (management costs standard care – proportion who respond to SC * Average cost (response)) / (proportion who do not respond to SC)
Average QALYs (response) = (QALYs LIR – proportion who do not respond to LIR * QALYs SC) / (proportion who respond to LIR)
Average QALYs (nonresponders) = (QALYs SC – proportion who respond to SC * Average QALYs (response)) / (proportion who do not respond to SC)
Using the aforementioned calculations, the costs and QALYs for LIR can be recalculated as so:
Recalculated costs for LIR = probability of response * average cost (response) + probability of no response * average cost (no response) + LIR drug costs
Recalculated QALYs for LIR = probability of response * average QALYs (response) + probability of no response * average QALYs (no response)
Based on Table 12 the following values were used to make the calculations:
Management costs LIR = $18,036 - $6,854 = $11,182
Management costs SC = $12,384
QALYs LIR = 3.894
QALYs SC = 3.865
Proportion who respond to LIR = 49.6%
Proportion who do not respond to LIR = 100 - 49.6% = 50.4%
Proportion who respond to SC = 23.7%
Proportion who do not respond to SC = 100 – 23.7% = 76.3%
LIR drug costs = $6,854
Appendix 5: Submitted Budget Impact Analysis and CADTH Appraisal
Note that this appendix has not been copy-edited.
Table 14: CADTH Summary Findings From the Sponsor’s Budget Impact Analysis
Key take-aways of the BIA |
|---|
|
Summary of Sponsor’s Budget Impact Analysis
The sponsor submitted an incidence-based BIA,33 assessing the expected budgetary impact of the reimbursement of liraglutide as an adjunct to a reduced-calorie diet and increased physical activity (standard therapy) for chronic weight management from the perspective of a Canadian public drug plan payer over a 3-year time horizon. Two populations were considered:
The full Health Canada indication population, consisting of adult patients with an initial BMI of 30 kg/m2 or greater or 27 kg/m2 or greater in the presence of at least 1 weight-related comorbidity and who have failed a previous weight management intervention.34
The reimbursement request population, consisting of adults who have been diagnosed with obesity (BMI ≥ 30 kg/m2) and prediabetes, or those diagnosed as overweight (27 kg/m2 ≤ BMI < 30 kg/m2) with 1 or more weight-related comorbidities and prediabetes.13
Data for the model were obtained from various sources, including: the SCALE Obesity and Prediabetes trial,3,10 Statistics Canada,35,36 archived data from the Canadian Health Measures Survey (CHMS),37,38 Obesity Canada,39 the Public Health Agency of Canada,40 and the sponsor’s data on file. Drug acquisition costs were included, with results presented both with and without dispensing fees and markups. As the reference scenario included only standard therapy, which included behavioural therapy, medical nutrition, and physical activity, no costs were assumed to be accrued from the drug plan payer perspective, and thus the new drug scenario cost, where liraglutide is reimbursed, is identical to the budget impact.
Key inputs to the BIA are documented in Table 15. Other assumptions made by the sponsor include:
As standard therapy consists of behavioural therapy, medical nutrition, and physical activity, no costs were assumed for public drug plans.
All patients begin therapy at the start of the year.
BMI is an adequate measure to determine who is overweight and obese.
Table 15: Summary of Key Model Parameters
Parameter | Sponsor’s estimate (full indication population) | Sponsor’s estimate (reimbursement request population) |
|---|---|---|
Target population, pan-Canadian analysis | BMI ≥ 30 kg/m2 OR BMI ≥ 27 kg/m2 with ≥ 1 weight-related comorbidity | BMI ≥ 30 kg/m2 with prediabetes OR BMI ≥ 27 kg/m2 with prediabetes and ≥ 1 other weight-related comorbidity |
Canadian population ≥ 18 years (excl. Quebec) | 23,950,640a | |
Proportion by gender (M/F) | 49.29% / 50.71%a | |
Prevalence of obesity by gender and class (M/F) Overweight (BMI 27 kg/m2 to 29.9 kg/m2) Obesity Class I (BMI 30 kg/m2 to 34.9 kg/m2) Obesity Class II (BMI 35 kg/m2 to 39.9 mg/m2) Obesity Class III (BMI ≥ 40 kg/m2) | 20.4% / 20.4%b 17.6% / 12.7%c 4.5% / 7.2%c 2.2% / 4.0%c | |
Prevalence of eligible comorbidities (M/F) Prediabetes Hypertension | 46.36% overweight patientsd Not applicable | 46.36% all patientsd 24.0% / 23.0% overweight patients |
Percentage patients who see their doctor | 74.0%e | |
Percentage evaluated and diagnosed with obesity Overweight (BMI 27 kg/m2 to 29.9 kg/m2) Obesity Class I (BMI 30 kg/m2 to 34.9 kg/m2) Obesity Class II (BMI 35 kg/m2 to 39.9 mg/m2) Obesity Class III (BMI ≥ 40 kg/m2) | 35% 35% 51% 73% | |
Annual growth rate of weight category Overweight (BMI 27 kg/m2 to 29.9 kg/m2) Obesity Class I (BMI 30 kg/m2 to 34.9 kg/m2) Obesity Class II (BMI 35 kg/m2 to 39.9 mg/m2) Obesity Class III (BMI ≥ 40 kg/m2) | 1.79% 1.79% 4.87% 8.00% | |
Proportion eligible for public coverage | 42.27%f | |
Number of patients eligible for drug under review | 1,112,856 / 1,152,715 / 1,194,643 | 457,163 / 474,589 / 492,957 |
Market uptake (3 years) | ||
Uptake (reference scenario) Standard therapy | 100% / 100% / 100% | |
Uptake (new drug scenario) Liraglutide + standard therapy Standard therapy | 2% / 4% / 7% 98% / 96% / 93% | |
Discontinuation | ||
Proportion responders | 63% | 68% |
Discontinuation rate for responders After 1 year After 2 years Discontinuation time point, for nonresponders | 100% Not applicable 16 weeks | 59.3% 68.1% 16 weeks |
Cost of treatment (per patient) | ||
Cost of treatment over first year of therapy Liraglutide + standard therapy (first year) Liraglutide + standard therapy (other years) Standard therapy | Nonresponders $1,225; responders $4,392 Responders $4,564 $0 | |
BMI = body mass index; M/F = Male / Female; standard therapy consists of behavioural therapy, medical nutrition, physical activity. Data were not available for genders other than male and female.
aStatistics Canada.35
bAppears to be calculated by taking three-fifths of the population reported as having a BMI between 25.0 and 29.9 kg/m2 in Janssen 2013, from the 2009 to 2011 Canadian Health Measures Survey.38
cCanadian Health Measure Survey data, proportion of adults age 20 to 79 who are obese, 2007 to 2009.37
dEstimated by multiplying the estimated number of patients with prediabetes in Canada (5.7 million, cited source no longer available) by the reported average population attributable risk of having diabetes associated with being obese,38 and dividing by the estimated number of obese people in Canada in 2016 (8.3 million).
eStatistics Canada, proportion patients age 18 to 64 who had contact with a medical doctor in past 12 months, 2016.36
fWeighted average of jurisdictional public drug plan eligibility estimates for those aged 25 to 64 and 65+ as reported by the Conference Board of Canada 2017.41
Summary of the Sponsor’s Budget Impact Analysis Results
Results of the sponsor’s base-case BIA revealed that the yearly incremental expenditures, excluding dispensing fees and mark-up, associated with the reimbursement of liraglutide added to standard therapy in the full HC indicated population of adult patients with an initial BMI ≥ 30 kg/m3 or ≥ 27 kg/m3 in the presence of at least 1 weight-related comorbidity, were estimated to be $71,475,110 in year 1, $148,070,155 in year 2, and $268,548,089 in year 3, for a 3-year cumulative budget impact of $488,093,354.
For the population included in the sponsor’s reimbursement request of adult patients who have been diagnosed with obesity (BMI ≥ 30 kg/m2) and prediabetes or diagnosed as overweight (27 kg/m2 ≤ BMI < 30 kg/m2) with 1 or more weight-related comorbidities and prediabetes, the sponsor’s BIA estimated the yearly incremental expenditures associated with liraglutide in addition to standard therapy, excluding dispensing fees and mark-up, would be $30,922,585 in year 1, $67,205,660 in year 2, and $124,459,179 in year 3, for a total 3-year cumulative budget impact of $222,587,425.
When markups and dispensing fees were included, the sponsor’s analysis reported 3-year cumulative budget impacts of $522,373,814 and $238,036,754 for the indicated population and reimbursement request population, respectively.
CADTH Appraisal of the Sponsor’s Budget Impact Analysis
CADTH identified several key limitations to the sponsor’s analysis that have notable implications on the results of the BIA:
Proportion of overweight Canadians likely underestimated: The sponsor cited an archived Statistics Canada source which incorporated data from the 2007 to 2009 CHMS37 to determine the proportion of the Canadian population in each obesity class. More recent CHMS data from 2009 to 2011 was only used to calculate the proportion of Canadians of all genders who are in the overweight category. However, data exists for all obesity categories from the 2009 to 2011 CHMS.38 Additionally, while data were not broken down by obesity category, 2019 Statistics Canada data reported that 37.6% of men and 27.4% of women were overweight, substantially more than that estimated by the sponsor, and that 26.2% of men and 24.0% of women were obese.
Annual prevalence growth rate overestimated: The sponsor estimated the growth in prevalence of obesity in Canada by dividing the increase in prevalence reported by the Public Health Agency of Canada data from 1979 to 2004 by the 25 years between those dates,33 leading to estimates between 1.8% and 8% depending on weight category. However, more recent data indicates that the growth in the number of Canadians who are overweight or obese is substantially smaller than that estimated by the sponsor.42
CADTH lowered the growth rate in the number of people within the overweight and obese weight categories to reflect the average growth of those categories from 2015 to 2020. Data were not available for the individual obesity categories, so the overall growth rate in the number of people who are obese was used for each category.
Discontinuation rates were overestimated: The sponsor assumed that 100% of responding patients in the full indication who initiated liraglutide would discontinue each year, while 59.3% of responding patients in the reimbursement request population would discontinue after 1 year of therapy, rising to 68.1% after 2 years, consistent with that reported in Study 1839 of the SCALE trial.10 As the reimbursement request population is a subset of the full indication population, together these assumptions lack face validity. The clinical expert consulted by CADTH did not agree that responding patients only qualifying under the full indication would discontinue at higher rates than those meeting the reimbursement request population criteria. Additionally, the likelihood of patients in clinical practice discontinuing therapy at 16 weeks having not achieved a weight loss of 5% is also uncertain as this was based on clinical trial data that may diverge from real World practice.
In the absence of other data, CADTH assumed that all included patients who respond to liraglutide would discontinue therapy at rates consistent with those derived from Study 1839.12 As this assumption is highly uncertain, the proportion of people continuing therapy each year was halved and doubled in scenario analyses for both populations. The impact of halving the number of patients who are deemed to be nonresponders and who thus discontinue at 16 weeks was also explored in a scenario analysis
Weight-related comorbidities are not independent: The sponsor calculated the proportion of patients with both prediabetes and hypertension (used as a proxy for all other weight-related comorbidities) by multiplying the proportion of Canadians with diabetes or prediabetes by the proportion of Canadians with hypertension. This method assumes that the occurrence of prediabetes and hypertension are independent, despite the definition in the submission that both are weight-related comorbidities and must thus be correlated. A 2012 framework for the prevention and control of hypertension estimated that of Canadians who knew they had type 2 diabetes, 75% also had hypertension,43 while the Public Health Agency of Canada reported that in 2006, 62.8% of adults with diabetes also had hypertension.44 These proportions would likely be higher when only those with a BMI of more than 27 kg/m2 are considered.
In the absence of more precise data, CADTH used the proportion of Canadians with diabetes who also had hypertension (62.8%) as a proxy for the proportion of overweight Canadians with prediabetes and another weight-related comorbidity in reanalyses. To assess the impact of uncertainty in these proxy values on the results, a scenario analysis was conducted assuming 75% of overweight patients with prediabetes also had hypertension.
The proportion of patients seeking clinician assistance for their weight is uncertain: To estimate the proportion of the populations of interest who saw their doctor and thus might access liraglutide, the sponsor used the proportion of Canadians aged 18 to 64 years who reported contact with a doctor in the past 12 months in 2016.36 However, neither the Health Canada product monograph nor the reimbursement request limited patients to those aged 65 or younger, and the clinical experts consulted by CADTH advised that patients up to their late 70s might be prescribed liraglutide for weight management should it become available.
CADTH reanalyses incorporated patients older than 65 years of age in the weighted average estimate of the proportion of the population who see their doctors per year, raising the proportion to 76.3%.36
Market share uptake likely underestimated in reimbursement request population: While the clinical experts consulted by CADTH found the sponsor’s estimate that 7% of patients in the indicated population who did not meet the criteria for the reimbursement request would be prescribed liraglutide by year 3 to be plausible, they predicted that uptake could be as high as 25% in the population of patients who met the reimbursement request criteria (BMI ≥ 30 kg/m2 and prediabetes, or 27 kg/m2 ≤ BMI < 30 kg/m2 and prediabetes and at least 1 weight-related comorbidity) as all patients in that population would be diagnosed with prediabetes and more likely to be prescribed a glycemic control agent such as liraglutide to assist with weight management should it be reimbursed for such.
In a scenario analysis, CADTH increased the market share capture of liraglutide in patients meeting the reimbursement request criteria to 8% in year 1, 16% in year 2, and 25% in year 3, while the market share for patients in the indicated population who did not meet the reimbursement request criteria remained at 2% in year 1, 4% in year 2, and 7% in year 3.
CADTH Reanalyses of the Budget Impact Analysis
CADTH revised the sponsor’s base case by: updating the prevalence of being overweight or obese, reducing the annual growth rate of in the prevalence of being overweight or obese, decreasing the discontinuation rate of patients in the full indication population, increasing the proportion of patients who have both prediabetes and another weight-related comorbidity, increasing the proportion of patients who see their doctor in a year, and increasing the expected market share capture of liraglutide in patients meeting the reimbursement request criteria. Table 16 outlines the parameters used by the sponsor in comparison to those used by CADTH.
Table 16: CADTH Revisions to the Submitted Budget Impact Analysis
Stepped analysis | Sponsor’s value or assumption | CADTH value or assumption | |
|---|---|---|---|
Corrections to sponsor’s base case | |||
None | None | None | |
Changes to derive the CADTH base case | |||
1. Updated overweight and obesity prevalence (male/female)a | Overweight: 20.4% / 20.4% Obese Class I: 17.6% / 12.7% Obese Class II: 4.5% / 7.2% Obese Class III: 2.2% / 4.0% | Overweight: 37.6% / 27.4% Obese Class I: 18.8% / 12.3% Obese Class II: 5.3% / 6.9% Obese Class III: 2.1% / 4.8% | |
2. Annual prevalence growth rate | Overweight: 1.79% Obese Class I: 1.79% Obese Class II: 4.87% Obese Class III: 8.00% | Overweight: 0.91% Obese Class I: 2.15% Obese Class II: 2.15% Obese Class III: 2.15% | |
3. Full population discontinuation rate | Year 1: 100% Year 2: 100% | Year 1: 59.3% Year 2: 68.1% | |
4. Proportion of overweight population with prediabetes and another weight-related comorbidity | 46.4% x 23.5% = 10.9% | 46.4% x 62.8% = 29.1% | |
5. Proportion of people seeing their doctor | 74.0% | 76.3% | |
CADTH base case | 1 through 5 | ||
aData not available for other genders.
Applying these changes increased the total 3-year budget impact of reimbursing liraglutide for the reimbursement request population to $315,238,245, and for the full indication population to $590,820,493. The results of the CADTH step-wise reanalysis are presented in summary format in Table 17 and a more detailed breakdown by year is presented in Table 18.
Table 17: Summary of the CADTH Reanalyses of the Budget Impact Analysis
Stepped analysis | 3-year total | |
|---|---|---|
Full indication population | Reimbursement request population | |
Submitted base case | $488,093,354 | $222,587,425 |
CADTH reanalysis 1: Updated weight category prevalence | $572,486,906 | $249,651,202 |
CADTH reanalysis 2: Lower prevalence growth rate | $461,613,815 | $209,962,741 |
CADTH reanalysis 3: Full population discontinuation rate lower | $515,819,607 | $222,587,425 |
CADTH reanalysis 4: Proportion overweight patients with prediabetes + comorbidity increased | $488,093,354 | $270,451,113 |
CADTH reanalysis 5: Increased proportion seeing their doctor | $503,088,634 | $229,425,790 |
CADTH base case | $590,820,493 | $315,238,245 |
BIA = budget impact analysis.
CADTH also conducted additional scenario analyses to explore remaining uncertainties:
Markups and dispensing fees are included.
The proportion of patients discontinuing due to nonresponse at 16 weeks is halved in both populations.
75% of overweight patients with prediabetes are assumed to have another weight-related comorbidity.
The market uptake for liraglutide in patients meeting the reimbursement criteria is 8%, 16%, and 25% in years 1, 2, and 3, respectively, in both analyses.
The price of liraglutide was reduced by 62%, the price reduction at which liraglutide would be considered cost-effective at a willingness to pay of $50,000 per QALY in the CADTH base-case reanalysis of the CUA (see Table 8).
Of these scenario analyses, increasing the assumed market share capture of liraglutide in patients meeting the reimbursement criteria had the largest impact on the results, resulting in an estimated budgetary impact of more than $1 billion over 3 years. Changes to most parameters increased or decreased the estimated budget impact by a substantial amount in either population over 3 years, highlighting uncertainty in the magnitude of the budget impact which would results from the reimbursement of liraglutide for weight management.
Table 18: Detailed Breakdown of the CADTH Reanalyses of the Budget Impact Analysis
Scenario analyses | Year 0 (current situation) | Year 1 | Year 2 | Year 3 | 3-year total |
|---|---|---|---|---|---|
Full indication population | |||||
Submitted base case | $0 | $71,475,110 | $148,070,155 | $268,548,089 | $488,093,354 |
CADTH base case | $0 | $83,883,585 | $179,753,794 | $327,183,114 | $590,820,493 |
CADTH scenario A: Fees and markups | $0 | $89,775,031 | $192,267,997 | $349,878,941 | $631,921,969 |
CADTH scenario B: Nonresponding patients halved | $0 | $99,301,029 | $208,711,456 | $376,355,254 | $684,367,739 |
CADTH scenario C: 75% prediabetes + comorbidity | $0 | $83,883,585 | $179,753,794 | $327,183,114 | $590,820,493 |
CADTH scenario D: Liraglutide share up to 25% in patients meeting reimbursement request criteria | $0 | $213,461,692 | $457,426,194 | $765,506,785 | $1,436,394,671 |
CADTH scenario E: Liraglutide price reduction of 62% | $0 | $31,875,762 | $68,306,442 | $124,329,583 | $224,511,787 |
Reimbursement request population | |||||
Submitted base case | $0 | $30,922,585 | $67,205,660 | $124,459,179 | $222,587,425 |
CADTH base case | $0 | $45,058,925 | $96,007,873 | $174,171,446 | $315,238,245 |
CADTH scenario A: Fees and markups | $0 | $48,225,032 | $102,695,482 | $186,261,070 | $337,181,585 |
CADTH scenario B: Nonresponding patients halved | $0 | $51,785,685 | $108,410,609 | $195,069,265 | $355,265,559 |
CADTH scenario C: 75% prediabetes + comorbidity | $0 | $48,317,887 | $102,901,604 | $186,585,431 | $337,804,922 |
CADTH scenario D: Up to 25% in patients meeting reimbursement request criteria | $0 | $180,235,702 | $384,031,491 | $626,804,711 | $1,191,071,903 |
CADTH scenario E: Liraglutide price reduction of 62% | $0 | $17,122,392 | $36,482,992 | $66,185,150 | $119,790,533 |
BIA = budget impact analysis.
Note: Reference and New Drug scenario results are not presented separately as there are no costs associated with the reference scenario.
ISSN: 2563-6596
Disclaimer: The information in this document is intended to help Canadian health care decision-makers, health care professionals, health systems leaders, and policy-makers make well-informed decisions and thereby improve the quality of health care services. While patients and others may access this document, the document is made available for informational purposes only and no representations or warranties are made with respect to its fitness for any particular purpose. The information in this document should not be used as a substitute for professional medical advice or as a substitute for the application of clinical judgment in respect of the care of a particular patient or other professional judgment in any decision-making process. The Canadian Agency for Drugs and Technologies in Health (CADTH) does not endorse any information, drugs, therapies, treatments, products, processes, or services.
While care has been taken to ensure that the information prepared by CADTH in this document is accurate, complete, and up-to-date as at the applicable date the material was first published by CADTH, CADTH does not make any guarantees to that effect. CADTH does not guarantee and is not responsible for the quality, currency, propriety, accuracy, or reasonableness of any statements, information, or conclusions contained in any third-party materials used in preparing this document. The views and opinions of third parties published in this document do not necessarily state or reflect those of CADTH.
CADTH is not responsible for any errors, omissions, injury, loss, or damage arising from or relating to the use (or misuse) of any information, statements, or conclusions contained in or implied by the contents of this document or any of the source materials.
This document may contain links to third-party websites. CADTH does not have control over the content of such sites. Use of third-party sites is governed by the third-party website owners’ own terms and conditions set out for such sites. CADTH does not make any guarantee with respect to any information contained on such third-party sites and CADTH is not responsible for any injury, loss, or damage suffered as a result of using such third-party sites. CADTH has no responsibility for the collection, use, and disclosure of personal information by third-party sites.
Subject to the aforementioned limitations, the views expressed herein are those of CADTH and do not necessarily represent the views of Canada’s federal, provincial, or territorial governments or any third-party supplier of information.
This document is prepared and intended for use in the context of the Canadian health care system. The use of this document outside of Canada is done so at the user’s own risk.
This disclaimer and any questions or matters of any nature arising from or relating to the content or use (or misuse) of this document will be governed by and interpreted in accordance with the laws of the Province of Ontario and the laws of Canada applicable therein, and all proceedings shall be subject to the exclusive jurisdiction of the courts of the Province of Ontario, Canada.
The copyright and other intellectual property rights in this document are owned by CADTH and its licensors. These rights are protected by the Canadian Copyright Act and other national and international laws and agreements. Users are permitted to make copies of this document for non-commercial purposes only, provided it is not modified when reproduced and appropriate credit is given to CADTH and its licensors.
About CADTH: CADTH is an independent, not-for-profit organization responsible for providing Canada’s health care decision-makers with objective evidence to help make informed decisions about the optimal use of drugs, medical devices, diagnostics, and procedures in our health care system.
Funding: CADTH receives funding from Canada’s federal, provincial, and territorial governments, with the exception of Quebec.