CADTH Reimbursement Review
Risdiplam (Evrysdi)
Sponsor: Hoffmann-La Roche Ltd
Therapeutic area: Spinal muscular atrophy (SMA)
This multi-part report includes:
Clinical Review
Pharmacoeconomic Review
Clinical Review
Abbreviations
6MWT
6-minute walk test
AAV9
adeno-associated virus 9
AE
adverse event
AUC0-24,ss
area under the curve from 0 hours to 24 hours at steady state
BSID-III
Bayley Scales of Infant and Toddler Development, Third Edition
CGI-C
Clinical Global Impression–Change
CHOP
INTEND Children’s Hospital of Philadelphia Infant Test of Neuromuscular Disorders
CI
confidence interval
CMAP
compound muscle action potential
CNDR
Canadian Neuromuscular Disease Registry
CNS
central nervous system
CSMAC
Cure SMA Canada
EMA
European Medicines Agency
FEV1
forced expiratory volume in 1 second
FVC
forced vital capacity
GMFM
Gross Motor Function Measure
HFMSE
Hammersmith Functional Motor Scale Expanded
HINE
Hammersmith Infant Neurological Examination
HRQoL
health-related quality of life
ICC
intraclass correlation coefficient
ITC
indirect treatment comparison
ITQOL
Infant Toddler Quality of Life Questionnaire
ITQOL-SF47
Infant Toddler Quality of Life Questionnaire–47-item Short Form
ITT
intention-to-treat
MAIC
matching-adjusted indirect comparison
MATE
multidrug and toxin extrusion
MDC
Muscular Dystrophy Canada
MFM
Motor Function Measure
MFM-20
Motor Function Measure–20 items
MFM-32
Motor Function Measure–32 items
MID
minimal important difference
NeuroNEXT
Network for Excellence in Neuroscience Clinical Trials
NMA
network meta-analysis
NMD4C
Neuromuscular Disease Network for Canada
NOC
Notice of Compliance
OR
odds ratio
PD
pharmacodynamics
PK
pharmacokinetics
RULM
Revised Upper Limb Module
SAE
serious adverse event
SD
standard deviation
SEM
standard error of measurement
SMA
spinal muscular atrophy
SMAIS
Spinal Muscular Atrophy Independence Scale
SMAIS-ULM
Spinal Muscular Atrophy Independence Scale–Upper Limb Module
SMN
survival motor neuron
ULM
Upper Limb Module
WDAE
withdrawal due to adverse event
Executive Summary
An overview of the submission details for the drug under review is provided in Table 1.
Item | Description |
|---|---|
Drug product | Risdiplam (Evrysdi), powder for oral solution |
Indication | Pre-NOC: For the treatment of spinal muscular atrophy Final: For the treatment of spinal muscular atrophy in patients 2 months and older |
Reimbursement request | As per indication |
Health Canada approval status | NOC |
Health Canada review pathway | Priority review |
NOC date | April 14, 2021 |
Sponsor | Hoffmann-La Roche Ltd (Roche) |
NOC = Notice of Compliance.
Introduction
Spinal muscular atrophy (SMA) is a rare, autosomal recessive, neuromuscular disease and is the leading genetic cause of infant death.1,2 The root cause in SMA is a deficiency in the survival motor neuron (SMN) protein, which is essential for the survival of motor neurons.3,4 Specifically, the deficiency in the SMN protein leads to the degeneration of alpha motor neurons in the anterior horn of the spinal cord, causing irreversible loss of motor neurons and motor nerves, and progressive muscle weakness.1 SMN protein is expressed mainly through the survival of motor neuron 1 gene (SMN1).3-5 A second set of genes, the survival of motor neuron 2 gene (SMN2), can express the SMN protein, albeit at a drastically less effective rate than the SMN1 gene because only 10% to 15% of the protein produced by SMN2 is functional.5,6
Traditionally, SMA is classified into 4 clinical subtypes based on the age of disease onset and the highest motor milestone achieved without disease-modifying treatment. These phenotypes differ in their presentations, severity of the disease, and prognosis. In SMA type I, patients show symptoms within their first 6 months of life, never achieve the motor milestone of sitting unsupported without disease-modifying treatment, and have a small chance of survival beyond 2 years of age due to respiratory failure without active symptomatic treatment and airway and respiratory management.1,2,7-9 In SMA type II, patients achieve the milestone of sitting unsupported, but never walk independently without disease-modifying treatment. Symptoms generally appear between 6 months to 18 months after birth and most patients will survive past the age of 25,7,10 with life expectancy improved by symptomatic treatment.10 SMA type III makes up about 10% to 20% of SMA cases11 and manifests after 18 months of age. These patients are able to walk independently.10 Type IV makes up a very small proportion of SMA cases with symptom onset as adults, the mildest form of the disease.
At the time this report was drafted, there were 2 SMA disease-modifying therapies approved in Canada: nusinersen (Spinraza) and onasemnogene abeparvovec (Zolgensma). In Canada, nusinersen is indicated for the treatment of 5q SMA, while onasemnogene abeparvovec is indicated for the treatment of pediatric patients with 5q SMA with bi-allelic mutations in the SMN1 gene and either 3 or fewer copies of the SMN2 gene, or infantile-onset SMA.12
In addition to treatment with nusinersen, current standards of practice involve clinical monitoring and surveillance, anticipatory management of symptoms, and attempts to improve overall quality of life. Additionally, newborn screening for SMA is available in Ontario and may become available in other provinces and territories in the future, which would allow earlier identification and treatment of SMA, and earlier treatment improves the likelihood for patients to achieve treatment goals.
Risdiplam was submitted to CADTH with a proposed (pre-Notice of Compliance [NOC]) indication for the treatment of SMA. Risdiplam received an NOC from Health Canada on April 14, 2021, with a final indication for the treatment of SMA in patients 2 months and older. The product monograph notes that that are no data available in infants younger than 2 months of age and, therefore, risdiplam is not indicated in this patient population. It also notes that there are limited data on risdiplam for patients older than 25 years of age.
Risdiplam is a SMN2 pre-mRNA splicing modifier. Risdiplam corrects the splicing of SMN2 to shift the balance from exon 7 exclusion to exon 7 inclusion into the mRNA transcript, leading to an increased production in functional and stable SMN protein. Thus, risdiplam treats SMA by increasing and sustaining functional SMN protein levels.13 The dose of risdiplam is determined by age and weight as follows:
2 months to less than 2 years of age: 0.20 mg/kg
2 years or older and less than 20 kg of body weight: 0.25 mg/kg
2 years or older and 20 kg or more of body weight: 5 mg.
Stakeholder Perspectives
The information in this section is a summary of input provided by the patient groups and clinician groups that responded to CADTH’s call for input, from clinical experts consulted by CADTH, and the CADTH participating drug programs for the purpose of this review.
Patient Input
There are 2 patient input submissions for this review from Muscular Dystrophy Canada (MDC) and Cure SMA Canada (CSMAC). A disclosure of any conflicts of interest for the organizations is available on the CADTH website; both organizations are registered charities.
The submission was based on semi-structured interviews, virtual interviews, a focus group of 5 adult patients and 8 parent caregivers, and a survey of patients and caregivers that gathered 96 responses. All respondents lived in Canada and all data were collected between October and December 2020.
Six main themes were apparent, which have been listed in order of frequency reported: (1) an enormous impact on activities of daily living; (2) detrimental effects on breathing, swallowing, and mobility in particular; (3) significant dependence on caregiving supports; (4) loss of independence and control; (5) pain, age-related fatigue, and mental health; and (6) fear of falling.
Some of the major health concerns expressed by both patient groups included respiratory function (and illnesses like pneumonia), muscle strength, fine motor skills, falls and safety, nutrition (inability or losing ability to chew and swallow), voice and speech, mental and emotional health, and being easily fatigued. Transportation time and distance along with accessibility when out in public were noted as important considerations in day-to-day life. The desire to maintain or regain independence for as long as possible was common among responses, though there was still the constant fear of progressive loss of function and declining health. Living with SMA requires a high degree of dependence on both caregivers and equipment, additional therapy, and medical appointments, all of which lead to exhaustion for both patients and caregivers as well as increased strain on mental health and relationships.
Responders indicated challenges with treatment with nusinersen that included the intrathecal administration, the need to travel, the possibility of hospitalization, and the side effects experienced after a lumbar puncture. Being aware of risdiplam, respondents felt that a daily, oral treatment would have a positive impact on their lives if it meant fewer hospital visits, less strain on hospital resources and staff, a convenient and easily accessible treatment, and that patients and families would be allowed to have stable careers, education, and family lives.
Clinician Input
Input From Clinical Experts Consulted by CADTH
A panel of 7 clinical experts from across Canada was convened to characterize unmet therapeutic needs, assist in identifying and communicating situations where there are gaps in the evidence that could be addressed through the collection of additional data, promote the early identification of potential implementation challenges, gain further insight into the clinical management of patients living with SMA, and explore the potential place in therapy of risdiplam. The clinical experts stated that there is an unmet need for a therapy with evidence of effectiveness in the treatment of adolescent and adult patients with SMA. Currently, there is no evidence from a controlled trial of the efficacy of nusinersen in adult and adolescent patients, and several jurisdictions do not reimburse nusinersen for adult patients. In pediatric patients with SMA, there is an unmet need for an effective and non-invasive drug in patients who are not eligible for, do not have access to, or opt not to receive onasemnogene abeparvovec. As such, the expert panellists consulted expected that risdiplam will be the first-line treatment for patients who do not receive onasemnogene abeparvovec.
The clinical experts do not see a role for combination therapy. However, the clinical experts can see a place for risdiplam as a bridge between patient diagnosis and the administration of onasemnogene abeparvovec if patients are eligible for onasemnogene abeparvovec and the approval and administration of onasemnogene abeparvovec treatment would take longer to fulfill than risdiplam. Considering the systematic nature of risdiplam, the clinical experts expect to observe better improvements in bulbar function than with nusinersen, which may be a rationale for switching in the cases of some patients. However, considering that failure to respond is likely to be due to a state related to the disease activity and stage, rather than failure of therapy, assuming treatment is delivered reliably, the clinical experts do not necessarily think treatment with risdiplam would produce a different response in patients who have already deteriorated while on nusinersen. The role of subsequent treatment with risdiplam after treatment with onasemnogene abeparvovec is not clear; there is yet to be reliable evidence of the long-term duration of the effect of gene therapy with onasemnogene abeparvovec.
The clinical experts emphasized that, regardless of treatment strategy, the time since diagnosis or symptom onset and the age of the patient are some of the most important factors that would determine the extent of benefit that may be observed in patients with SMA. To this extent, the earlier any disease-modifying therapy is initiated, the more likely that the patient will maintain existing motor function or achieve new motor milestones. Patients who are most likely to benefit from risdiplam are those who might be too old for onasemnogene abeparvovec and have anatomic deformities that make nusinersen administration difficult, if not impossible. Risdiplam would essentially be the only treatment available for them. The clinical experts identified that patients with advanced stages of the disease, who may require invasive ventilation or who have a chronic gastrointestinal condition that might hinder drug absorption could be the least suitable for treatment with risdiplam.
Clinician Group Input
Clinician input was provided by the Neuromuscular Disease Network for Canada (NMD4C). The group is a pan-Canadian network launched in 2020 that aims to bring together clinical, scientific, technical, and patient expertise in neuromuscular disease.
The clinician group was largely in line with the clinical experts’ panel consulted by CADTH.
Drug Program Input
Input from drug programs explored the questions of concomitant use, factors influencing the clinical decision as to the choice of SMA therapy, assessment of ineffective treatment, and the potential use of a higher dose of risdiplam. The responses to the questions are in Table 4.
Clinical Evidence
Pivotal Studies and Protocol-Selected Studies
Description of Studies
One single-arm uncontrolled trial and 1 randomized controlled trial were included in this CADTH reimbursement review.
FIREFISH Part 2 (N = 41) is an ongoing, open-label, single-arm, phase III trial that investigated the efficacy and safety of risdiplam after 12 months of treatment in infants with SMA type I, with 2 copies of the SMN2 gene, and with no invasive ventilation. A total of 41 infants received risdiplam at an age-determined dose. These infants had an average age of 5.2 (standard deviation [SD] = 1.47) months and had 2 SMN2 gene copies, and their onset of symptoms was reported at a mean age of 1.64 (SD = 0.70) months. Average disease duration in FIREFISH Part 2 was reported at 3.59 (SD = 1.35) months. At baseline, |||| of the infants were able to control their head upright, while |||| did not demonstrate any motor milestone achievement, and 70.7% did not require any form of ventilatory support. The primary outcome was sitting for 5 seconds without support after 12 months of treatment, as assessed by the Bayley Scales of Infant and Toddler Development, Third Edition (BSID-III) tool. Other key secondary outcomes that were included in a statistical testing hierarchy were the proportion of patients who achieve a score of 40 or higher in the Children’s Hospital of Philadelphia Infant Test of Neuromuscular Disorders (CHOP INTEND) at month 12, the proportion of patients who achieve an increase of at least 4 points in their CHOP INTEND score from baseline at month 12, the proportion of motor milestone responders as assessed by the Hammersmith Infant Neurological Examination–Section 2 (HINE Section 2) at month 12, the proportion of patients alive without permanent ventilation at month 12, and the proportion of patients sitting without support for 30 seconds (item 26 of BSID-III) at month 24. No minimal important difference (MID) was identified for the BSID-III total score or for the CHOP INTEND total score, while HINE Section 2 had an estimated MID of more than 1 point.
SUNFISH Part 2 (N = 180) is an ongoing, double-blind, placebo-controlled, phase III trial that investigated the efficacy and safety of risdiplam after 12 months of treatments in patients with SMA type II or non-ambulatory patients with SMA type III and who are between 2 years and 25 years of age (inclusive). In SUNFISH Part 2, 180 patients were randomized on a 2:1 ratio to risdiplam and placebo, respectively. The mean age of enrolled patients was 9.9 (SD = 5.8) years in the risdiplam group and 10.3 (SD = 6.1) years in the placebo group. Patients belonging to the age group of 18 years to 25 years formed the smallest age group (11.7% in risdiplam and 13.3% in placebo), followed by the age group of 12 years to 17 years (25.0% in risdiplam and 26.7% in placebo). Most patients had 3 SMN2 gene copies (89.2% in risdiplam and 83.3% in placebo), while more than two-thirds were diagnosed as having SMA type II (70.0% in risdiplam and 73.3% in placebo). At baseline, |||| were able to stand in the risdiplam arm and |||| in the placebo arm. The primary outcome was change from baseline in the Motor Function Measure–32 items (MFM-32) score at month 12. Key secondary outcomes within the statistical testing hierarchy were the proportion of patients with a change from baseline MFM-32 total score of 3 or more at month 12, the proportion of patients with a change from baseline in the total score of the Revised Upper Limb Module (RULM) at month 12, the proportion of patients with a change from baseline in the total score of the Hammersmith Functional Motor Scale Expanded (HFMSE) at month 12, the proportion of patients with a change from baseline in forced vital capacity (FVC) at month 12, the proportion of patients with a change from baseline in caregiver-reported SMA Independence Scale (SMAIS) total score at month 12, and the proportion of individuals rated as “improved” on the Clinical Global Impression–Change (CGI-C) score at month 12. The sponsor proposed that 3 points or more difference on the MFM-32 score may indicate the acquisition of a new function or the improvement of several functions. The RULM score has an estimated MID of 2.9 points, the HFMSE score has an estimated MID of more than 2 points, and the SMAIS score has an MID of 1 to 5 points. No MIDs were identified for the rest of the outcomes.
In addition to the included pivotal study, this Drug Reimbursement Review included a summary of 3 phase II supportive studies: FIREFISH Part 1, SUNFISH Part 1, and JEWELFISH. FIREFISH Part 1 (N = 21) is an ongoing, open-label, single-arm, dose-finding, phase II trial that aimed to determine the appropriate therapeutic dose of risdiplam and reported on exploratory efficacy and safety findings at 12 months of treatment. SUNFISH Part 1 (N = 51) is an ongoing, 12-week, double-blind, dose-ranging, placebo-controlled trial that turns into a 24-month, open-label, single-arm trial. SUNFISH Part 1 aimed to assess the safety, tolerability, pharmacokinetics (PK), and pharmacodynamics (PD) of risdiplam in patients with SMA type II or type III aged from 2 years to 25 years; the results of exploratory efficacy outcomes and safety were reported at 12 months of the study’s duration. JEWELFISH (N = 174) is an ongoing, phase II, open-label, exploratory study to assess safety and tolerability of risdiplam in patients with SMA who received prior disease-modifying therapy. Only interim safety results are currently available from the JEWELFISH trial.
Efficacy Results
FIREFISH Part 2 achieved the primary outcome where 29.3% of infants (12 out of 41 infants) were able to sit without support after 12 months on treatment. This was contrasted with a natural history threshold of 5% (P < 0.0001). Of the reported secondary outcomes that are within the statistical hierarchy (at 12 months of treatment), 56.1% of infants (23 out of 41 infants) had a CHOP INTEND score of 40 or higher (P < 0.0001 against a performance criterion of 17%), 90.2% (37 out of 41 infants) have achieved an increase of at least 4 points in the CHOP INTEND score from baseline (P < 0.0001 against a performance criterion of 17%), and 78.0% (32 out of 41 infants) were considered motor milestone responders assessed through the HINE Section 2 (P < 0.0001 against a performance criterion of 12%). At month 12, 85.4% of patients were alive and did not require permanent ventilation (35 out of 41 infants). This outcome was contrasted with a predefined threshold of 42% (P < 0.0001). These efficacy outcomes are supported by the exploratory efficacy results at month 12 of treatment in FIREFISH Part 1. Efficacy outcomes beyond 12 months are not yet available.
SUNFISH Part 2 achieved its primary end point where patients who received risdiplam had a mean difference versus placebo of 1.55 points (95% confidence interval [CI], 0.30 to 2.81; P = 0.0156) in the change of the MFM-32 score from baseline. The first secondary outcome tested within the statistical testing hierarchy after the primary outcome was the MFM-32 responders (change of 3 points or more from baseline). This outcome showed that 38.3% of patients in the risdiplam arm (44 out of 115 patients) were considered responders, compared to 23.7% in the placebo group (14 out of 59 patients) with an odds ratio (OR) of 2.35 (95% CI, 1.01 to 5.44; P = 0.0469) for risdiplam versus placebo. Subsequently, the change in RULM score was tested, with a mean difference versus placebo of 1.59 points (95% CI, 0.55 to 2.62; P = 0.0028). Subsequently, 2 co-outcomes were tested: change from baseline in the total score of HFMSE, which failed to achieve statistical significance (mean difference = 0.58 points; 95% CI, –0.53 to 1.69; P = 0.3015) and change from baseline in best percentage predicted value FVC (mean difference = –2.05; 95% CI, –6.67 to 2.56; P = 0.3804). Patient- and clinician-reported outcomes, measured through the SMAIS and CGI-C tools, were next on the statistical testing hierarchy, but since the previous outcomes failed to achieve statistical significance, no additional statistical testing could be performed with control of the type I error rate.
The tool used for the primary outcome, MFM-32, did not have a well-established method of assessing the MID. However, the sponsor has indicated that a change of 3 points or more may translate into either the acquisition of a new function or the improvement in performance of several functions. Based on this, the primary outcome failed to demonstrate such a difference, both in point estimate and upper range of the 95% CI (MFM-32 change from baseline mean difference = 1.55 points; 95% CI, 0.30 to 2.81). Two other key motor function measurement tools used by the sponsor had published MIDs: RULM had an MID of 2.9 and HFMSE had an MID of 2. Results of the mean difference versus placebo in both of these outcomes also does not achieve the published MID.
Harms Results
In FIREFISH Part 2, at least 1 adverse event (AE) was reported in all enrolled infants. Upper respiratory tract infection was the most commonly reported AE (46.3%), followed by pneumonia (39.0%), pyrexia (39.0%), and constipation (19.5%). Serious AEs (SAEs) were reported in 58.5% of the infants (24 out of 41 infants); the majority of the SAEs were related to respiratory problems or respiratory infections. Three infants died during the study. Two were attributed to pneumonia and 1 to respiratory failure.
In SUNFISH Part 2, at least 1 AE was reported in 92.5% and 91.7% of enrolled patients in the risdiplam and placebo arms, respectively. Upper respiratory tract infection was the most commonly reported AE (31.7% in the risdiplam arm and 30.0% in the placebo arm), followed by nasopharyngitis (25.8% in the risdiplam arm and 25.0% in the placebo arm), pyrexia (20.8% in the risdiplam arm and 16.7% in the placebo arm), and headache (20.0% in the risdiplam arm and 16.7% in the placebo arm). SAEs were reported in 20.0% of patients who received risdiplam and 18.3% in patients who received placebo. Most of the SAEs were related to respiratory problems or respiratory infections.
Table 2: Summary of Key Results From Pivotal and Protocol-Selected Studies
Outcome measure | Risdiplam | Placebo |
|---|---|---|
Primary outcome: FIREFISH Part 2 (N = 41) | ||
Proportion of infants sitting without support for 5 seconds (item 22 of BSID-III) at month 12 | ||
n (%) | 12 (29.3) | NA |
90% CI | (17.8 to 43.1) | NA |
P value (performance criterion = 5%)a | < 0.0001 | NA |
Motor function–related outcomes: FIREFISH Part 2 (N = 41) | ||
Proportion of infants who achieve a score of 40 or higher in the CHOP INTEND at month 12: First secondary outcome in the hierarchical testing approach | ||
n (%) | 23 (56.1) | NA |
90% CI | (42.13 to 69.38) | NA |
P value (performance criterion = 17%)a | < 0.0001 | NA |
Proportion of motor milestone responders as assessed by the HINE Section 2 at month 12: Third secondary outcome in the hierarchical testing approach | ||
n (%) | 32 (78.0) | NA |
90% CI | (64.8 to 88.0) | NA |
P value (performance criterion = 12%)a | < 0.0001 | NA |
Survival-related outcomes: FIREFISH Part 2 (N = 41) | ||
Proportion of infants alive without permanent ventilation at month 12: Fourth secondary outcome in the hierarchical testing approach | ||
n (%) | 35 (85.4) | NA |
90% CI | (73.4 to 92.2) | NA |
P value (performance criterion = 42%)a | < 0.0001 | NA |
Harms: FIREFISH Part 2 (N = 41) | ||
AEs, n (%) | 41 (100) | NA |
SAEs, n (%) | 24 (58.5) | NA |
WDAEs | 0 | NA |
Deaths | 3 (7.3) | NA |
Primary outcome: SUNFISH Part 2 (risdiplam [N = 120], placebo [N = 60]) | ||
Number of patients contributing to the analysis | 115 | 59 |
Baseline, mean (SD) | 45.48 (12.09) | 47.35 (10.12) |
Month 12, mean (SD) | ||| | ||| |
MMRM change from baseline, least squares mean (95% CI) | 1.36 (0.61 to 2.11) | –0.19 (–1.22 to 0.84) |
MMRM difference from placebo (95% CI) | 1.55 (0.30 to 2.81) | |
P value | 0.0156 | |
Adjusted P valueb | 0.0156 | |
Subgroups | ||
Age group 2 to 5 years (risdiplam: 32 patients; placebo: 17 patients), mean difference (95% CI) | 3.14 (0.81 to 5.46) | |
Age group 6 to 11 years (risdiplam: 39 patients; placebo: 18 patients), mean difference (95% CI) | 1.58 (–0.58 to 3.74) | |
Age group 12 years to 17 years (risdiplam: 30 patients; placebo: 16 patients), mean difference (95% CI) | 1.04 (–1.31 to 3.39) | |
Age group 18 years to 25 years (risdiplam: 14 patients; placebo: 8 patients), mean difference (95% CI) | –0.65 (–4.03 to 2.74) | |
Motor function–related outcomes: SUNFISH Part 2 (risdiplam [N = 120], placebo [N = 60]) | ||
Change from baseline ≥ 3 in MFM-32 total score at month 12 (family 2) | ||
Number of patients contributing to the analysis | 115 | 59 |
Responders, n (%) | 44 (38.3) | 14 (23.7) |
OR (95% CI) | 2.35 (1.01 to 5.44) | |
P value | 0.0469 | |
Adjusted P valueb | 0.0469 | |
Change from baseline in RULM total score at month 12 (family 3) | ||
Number of patients contributing to the analysis | 119 | 58 |
Baseline, mean (SD) | 19.65 (7.22) | 20.91 (6.41) |
Month 12, mean (SD) | ||| | ||| |
MMRM change from baseline, least squares mean (95% CI) | 1.61 (1.00 to 2.22) | 0.02 (–0.83 to 0.87) |
MMRM difference from placebo (95% CI) | 1.59 (0.55 to 2.62) | |
P value | 0.0028 | |
Adjusted P valueb | 0.0469 | |
Change from baseline in total score of the HFMSE at month 12 (family 4) | ||
Number of patients contributing to the analysis | 120 | 60 |
Baseline, mean (SD) | 16.10 (12.46) | 16.62 (12.09) |
Month 12, mean (SD) | ||| | ||| |
MMRM change from baseline, least squares mean (95% CI) | 0.95 (0.29 to 1.61) | 0.37 (–0.54 to 1.28) |
MMRM difference from placebo (95% CI) | 0.58 (–0.53 to 1.69) | |
P value | 0.3015 | |
Adjusted P valueb | 0.3902 | |
Respiratory-related outcomes: SUNFISH Part 2 (risdiplam [N = 120], placebo [N = 60]) | ||
Change from baseline in FVC (best percentage predicted value) at month 12 (family 4) | ||
Number of patients contributing to the analysis | 83 | 40 |
Baseline, mean (SD) | ||| | ||| |
Month 12, mean (SD) | ||| | ||| |
MMRM change from baseline, least squares mean (95% CI) | –5.16 (–7.93 to –2.39) | |
MMRM difference from placebo (95% CI) | –2.05 (–6.67 to 2.56) | |
P value | 0.3804 | |
Adjusted P valueb | 0.3902 | |
Health-related quality of life–related outcomes: SUNFISH Part 2 (risdiplam [N = 120], placebo [N = 60]) | ||
Change from baseline in caregiver-reported SMAIS total score at month 12 (family 5) | ||
Number of caregivers contributing to the analysis | 116 | 60 |
Baseline, mean (SD) | ||| | ||| |
Month 12, mean (SD) | |||||||||||| | ||| |
MMRM change from baseline, least squares mean (95% CI) | 1.65 (0.66 to 2.63) | –0.91 (–2.23 to 0.42) |
MMRM difference from placebo (95% CI) | 2.55 (0.93 to 4.17) | |
Proportion of individuals rated as “improved” on the CGI-C at month 12 (family 6) | ||
Number of patients contributing to the analysis | 120 | 60 |
Proportion of patients rated as “improved,” n (%) | 57 (47.5) | 24 (40.0) |
OR (95% CI) | 1.38 (0.70 to 2.74) | |
Harms: SUNFISH Part 2 (risdiplam [N = 120], placebo [N = 60]) | ||
AEs, n (%) | 111 (92.5) | 55 (91.7) |
SAEs, n (%) | 24 (20.0) | 11 (18.3) |
WDAEs | 0 | 0 |
Deaths | 0 | 0 |
AE = adverse event; BSID-III = Bayley Scales of Infant and Toddler Development, Third Edition; CHOP INTEND = Children’s Hospital of Philadelphia Infant Test of Neuromuscular Disorders; CI = confidence interval; CGI-C = Clinical Global Impression–Change; FVC = forced vital capacity; HFMSE = Hammersmith Functional Motor Scale Expanded; HINE Section 2 = Hammersmith Infant Neurological Examination–Section 2; MFM-32 = Motor Function Measure–32 items; OR = odds ratio; MMRM = mixed model of repeated measures; RULM = Revised Upper Limb Module; SAE = serious adverse event; SD = standard deviation; SMAIS = Spinal Muscular Atrophy Independence Scale; WDAE = withdrawal due to adverse event.
aThe P value was tested at 0.05 1-sided level of significance.
bThe adjusted P value was derived based on all the (unadjusted) P values from end points in order of the hierarchy up to the current end point.
Source: Drug Reimbursement Review sponsor submission.14
Critical Appraisal
FIREFISH Part 2
In the absence of a concurrent control arm in the form of a placebo control or an active control, there is a potential for bias (i.e., an overestimate) in treatment effect estimated with risdiplam in the single-arm trial FIREFISH Part 2. Without a randomized comparison to a control group, natural fluctuations in the disease cannot be adjusted for, nor can the effects of known or unknown confounders. It should be noted that the sponsor method of determining a minimum threshold for testing the null hypothesis is not considered a valid control. While basing these thresholds on well-described literature may be useful to reflect the natural history of the disease, this approach has many limitations that arise due to variations in study characteristics, measurement methods, patients’ characteristics, standards of care, and other potentially unknown or unmeasured confounders. The sponsor attempted to determine the threshold by using the upper 90% CI in the selected natural history studies. However, no other method of adjusting for potential heterogeneities was attempted. These limitations involving the study design and the method used to establish the null hypothesis threshold led to a level of uncertainty regarding the extent of the magnitude of the observed clinical effect that is solely attributed to risdiplam.
Investigators, outcome assessors, and parents were aware that infants had received risdiplam. This may increase the risk of observer and respondent bias in assessing outcome measures. The potential risk of observer bias may be lower for objective outcomes, such as death and permanent ventilation. The sponsor video-recorded the assessment of motor milestone outcomes and used 2 independent central reviewers to determine the outcomes. However, the lack of blinding may be a concern for other outcomes, including health-related quality of life (HRQoL) outcomes.
FIREFISH Part 2 did not include infants who were pre-symptomatic, younger than 2 months of age, older than 6 months, or had more than 2 copies of SMN2. Other SMA infants who were not included in the study may have a more severe presentation of the disease (e.g., older SMA type I patients, patients requiring ventilatory support) and the results of FIREFISH Part 2 cannot inform on the extent of potential benefit offered by risdiplam for these patients.
SUNFISH Part 2
The sponsor randomized patients in a 2:1 ratio to risdiplam or placebo, respectively. Potential challenges that may be associated with such an allocation ratio include the need for a larger sample size to capture differences in treatment effect, and the potential for reducing the effectiveness of blinding as investigators and assessors would be aware that the probability of being allocated to active treatment is twice that of control. Based on the primary end point of the study, it appears to be adequately powered given that statistically significant differences were observed. A reduction in statistical power due to the 2:1 randomization ratio could potentially have an effect on the secondary outcomes and subgroup analyses, considering that there were no a priori power calculations for the subgroups and secondary outcomes.
The sponsor’s original plan aimed to randomize a total of 168 patients, stratified by age groups (2 years to 5 years, 6 years to 11 years, 12 years to 17 years, and 18 years to 25 years at randomization). However, only a maximum of 30 patients were to be included and randomized in the age group of 18 years to 25 years, while a minimum of 45 patients were to be randomized into each of the other age groups. The study ended up randomizing 180 patients, of whom only 22 were in the age group of 18 years to 25 years. This discrepancy in the number of patients in the age groups means that the age group of 18 years to 25 years did not contribute the same magnitude of effect to the assessed outcomes as the other age groups.
While adult SMA patients were included in the SUNFISH Part 2 confirmatory trial, they represented the smallest age group in the study (a total of 12.2%) and have, as such, contributed the least of these age groups to the overall efficacy results. The generalizability of the overall results, in turn, is lowest to the adult age group. This is further illustrated in the potential inconsistency of the magnitude of effect across age groups in all outcomes, as suggested by the point estimates of the treatment effect. In these age group assessments, the adult age group would show the lowest point estimates along with the widest CIs. Thus, the small representation of adult patients with SMA in the SUNFISH study, the high degree of uncertainty in the results of the subgroups analysis, and the pathophysiology of SMA indicate that the generalizability of the overall results of SUNFISH may be limited for adult patients with SMA.
Additionally, SUNFISH Part 2 excluded ambulatory patients. Considering the nature of SMA, where alpha motor neurons are irreversibly lost as disease progresses, patients with higher motor functions may have a greater number of alpha motor neurons than patients who have lost such motor functions. Ambulatory patients may thus exhibit a variation in the response compared to non-ambulatory patients, and the generalizability of the SUNFISH Part 2 results to this patient population may be limited.
Indirect Comparisons
Description of Studies
One sponsor-submitted indirect treatment comparison (ITC) was reviewed. The sponsor-submitted ITC compared risdiplam to nusinersen in 2 distinct patient populations: infantile-onset SMA (SMA type I) and later-onset SMA (SMA type II or SMA type III). An unanchored matching-adjusted indirect comparison (MAIC) was performed for the SMA type I population; the analysis included the FIREFISH study for risdiplam (pooled subgroup of Part 1 with Part 2) and the ENDEAR study for nusinersen. Study design between FIREFISH and ENDEAR was different as FIREFISH was a single-arm trial and ENDEAR was a double-blind, sham-controlled, randomized trial. However, inclusion and exclusion criteria were similar, and the individual patient-level data from the FIREFISH study were weighted to match the mean age at first dose, duration of symptoms, and mean CHOP INTEND baseline score of the ENDEAR study.
An anchored MAIC was used for later-onset SMA and included the SUNFISH study for risdiplam and the CHERISH study for nusinersen, with the placebo arm in the SUNFISH study and the sham arm in the CHERISH study acting as a common comparator. The model was adjusted for age at screening, baseline motor function score, and SMN2 copy number.
Efficacy Results
Within the SMA type I network, and subsequent to matching based on the mean age at first dose, mean disease duration at screening, and mean score on CHOP INTEND, an effective sample size of 36.5 was estimated out of the original 58 patients pooled into FIREFISH. The adjusted population had a higher proportion of female patients, a lower proportion of patients with ventilatory support, and a lower mean HINE Section 2 score than patients in the ENDEAR study. The results of the SMA type I unanchored MAIC suggest a hazard ratio of ventilation-free survival of risdiplam versus nusinersen of 0.20 (95% CI, 0.06 to 0.42), and an overall survival hazard ratio of 0.26 (95% CI, 0.03 to 0.66). Motor function assessment using the HINE Section 2 showed favourable results for risdiplam in the outcomes of motor milestone response, full head control, and sitting without support while the outcome of rolling was favourable in the direction of nusinersen. Two outcomes, sitting with and without support and standing, did not show a clear direction. However, all the HINE Section 2–related outcomes had wide CIs, indicating poor statistical robustness in the data.
Comparison in the SMA type II or SMA type III population showed, subsequent to matching, an estimated effective sample size of 28.3 in the risdiplam arm and 8.8 in the placebo arm. This small sample size translated into results with wide, and sometimes unrealistic, CIs in both the base-anchored base analysis and the network meta-analysis (NMA) sensitivity analysis.
Critical Appraisal
Unanchored MAIC depends on the strong assumption that all known and unknown effect modifiers and prognostic factors are accounted for within the model. This is a very strong assumption that was unlikely to be achieved. There were several factors that the sponsor-submitted ITC identified as important but did not adjust for in the MAIC due to lack of reporting. In addition, the differences in the study design between FIREFISH and ENDEAR are other factors that cannot be accounted for using MAIC. Even after weighting on the feasible factors, the weighted FIREFISH sample showed imbalances in several baseline characteristics compared to ENDEAR. As such, there is considerable uncertainty regarding the actual observed effect that is attributed to risdiplam. And since no attempt was made to assess residual bias, the magnitude of the bias due to effect modifiers and prognostic factors in the reported estimates cannot be estimated. This limitation is relevant to all outcomes that were estimated from the SMA type I evidence network.
The network that included patients with SMA type II or SMA type III was done through an anchored MAIC along with a sensitivity analysis using a Bayesian NMA approach. Due to large discrepancies in the inclusion and exclusion criteria, the sponsor-submitted ITC only used a subset of patients from the SUNFISH Part 2 study that would have been included in the CHERISH study, reducing the sample size of SUNFISH Part 2 by 62% and breaking randomization in SUNFISH Part 2. Subsequently, the weighting of the SUNFISH Part 2 sample produced an effective sample size in the risdiplam arm of 28.3. There were considerable differences in the eligibility criteria between CHERISH and SUNFISH Part 2. These differences included age range, restrictions on ventilatory support, restrictions on baseline motor function scores, and restriction over the existence of anatomic complications due to SMA. The sponsor-submitted ITC attempted to account for these differences through choosing a subset of patients for the SUNFISH Part 2 study that would match the inclusion and exclusion criteria of CHERISH. Only 38% of SUNFISH Part 2 was used and it showed several baseline imbalances between the risdiplam arm and the placebo arm. Upon weighting this subsample, differences in baseline characteristics persisted with the SUNFISH Part 2 subset and between the SUNFISH Part 2 subset and the CHERISH study. The resulting effective sample size was too small to provide a robust analysis, as reflected by the wide CIs.
Other Relevant Evidence
Description of Studies
FIREFISH Part 1 was a multi-centre, open-label, single-arm, phase II study of the safety, tolerability, PK, and PD of risdiplam for treatment of infants with SMA type I. The study enrolled 21 patients for a total 24-month treatment period followed by an additional extension period until risdiplam is commercially available or is no longer produced by the sponsor. Patients in FIREFISH Part 1 had a mean age of 5.81 (SD = 1.38) months at enrolment and 71.4% of patients were female. The majority (81%) were White and the rest were Asian. A proportion of patients was receiving ventilation support (14.3% received bilevel positive airway pressure [BiPAP] for fewer than 16 hours per day and 19.0% received ventilation prophylactically) and most patients (95.2%) were able to swallow.
SUNFISH Part 1 was a multi-centre, open-label, placebo-controlled, dose-ranging, phase II study of the safety, tolerability, PK, and PD of risdiplam in infant and young adult patients with SMA type II or SMA type III. The study enrolled 51 patients separated into 2 groups by age: 2 years to 11 years and 12 years to 25 years. During the initial minimum 12-week, double-blind, placebo-controlled phase, patients in the younger cohort could receive 1 of the 0.02 mg/kg, 0.05 mg/kg, or 0.25 mg/kg doses while those in the older cohort could receive either 3 mg or 5 mg doses. After 12 weeks, patients on placebo were switched to active treatment in the dose group they were assigned until pivotal doses were selected. The selected doses were 5 mg if the patient’s body weight was at least 20 kg and 0.25 mg/kg if body weight was less than 20 kg. All patients then received the pivotal dose for a 24-month treatment period followed by an additional extension period until risdiplam is commercially available or is no longer produced by the sponsor. In SUNFISH Part 1, patients aged 12 years to 25 years made up group A and patients aged 2 years to 11 years made up group B. The younger cohort had a mean (SD) age of |||||||| years while the older cohort had a mean (SD) age of |||||||||| years at screening. Just over half of all patients were female (||||) and |||| were White. Overall, |||| of patients were receiving fewer than 16 hours of BiPAP support per day (|||| and |||| in the younger and older cohorts, respectively) and |||| of the younger patients were not receiving pulmonary care while |||| of the older patients were not. Few patients (13.7%) were ambulatory: 19.4% of those aged 2 years to 11 years and 5% of those aged 12 years to 25 years.
Efficacy Results
For FIREFISH Part 1 at month 12, a larger percentage of patients in the higher risdiplam dose group achieved the motor function and development milestones than those in the lower-dose group. For instance, none of the of patients in the risdiplam lower-dose group and 41.2% in the higher-dose group were able to sit without support for 5 seconds (BSID-III, item 22). A lower percentage of patients showed improved motor skills as measured by the CHOP INTEND and HINE Section 2 in the 700 ng*hour/mL group compared to the 2,000 ng*hour/mL or less group. At the month-12 assessment, there was 1 death in each group and all remaining patients were alive without permanent ventilation. Few patients from either group required no respiratory support and most were able to feed orally. For patient- and caregiver-reported outcomes, measured by the ITQOL-SF47, there was a median change of 0 for both groups.
Some exploratory efficacy outcome data in SUNFISH Part 1 were available at month 12 and month 24. |||||||||||||||||||||||||||||||| |||||||| |||||||||||||||||||||||||||||||||||||||||||||||||||||||||||||||||||||||||||||||||||||||||||||||||||||||||||||||||||||||||||||||||||||||||||||||||||||||||||||||||| |||||| |||||||||||||||||||||||||||||||||||||||||||||||||||||||||||||||||||||||||||||||||||||||||||||||||||||||||||||||||||||||||||||||||||||||||||||||||||||||||||||||| |||||||| |||||||||||||||||||||||||||||||||||||||||||||||||||||||||||||||||||||||||||||||||||||||||||||||||||||||||||||||||||||||||||||||||||||||||||||||||||||||||||||||||||||||||||| |||||||||||||||||||||||||||||||||||||||||||||||||||||||||||||||||||||||||||||||||||||||||||||||||||||||||||||||||||||||||||||||||||||||||||||||||||||||||||||||||||||||| |||||||||||||||||||||||||||||||||||||||||||||||||||||||||||||||||||||||||||||||||||||||||||||||||||||||||||||||||||||||||||||||||||||||||||||||||||||||||||||||||||||||||| ||||||||||||||||||||
Harms Results
Nearly all patients (95.2%) in FIREFISH Part 1 had at least 1 AE. The most common were pyrexia (66.7%), upper respiratory tract infection (47.6%), and cough, diarrhea, and vomiting (28.6% each). SAEs occurred in more than half of patients (61.9%), with pneumonia being the most common (19.0%). Four deaths occurred: 1 in the 700 ng*hour/mL group and 3 in the 2,000 ng*hour/mL or less group. Safety outcomes for SUNFISH Part 1 similarly indicated that almost all patients (96.1%) had at least 1 AE. The 5 most common AEs were pyrexia (54.9%), cough (35.3%), vomiting (33.3%), upper respiratory tract infection (31.4%), and nasopharyngitis (23.5%). Overall, 29.4% of patients experienced at least 1 SAE, with the most common being pneumonia (5.9%). There were no deaths reported.
Critical Appraisal
FIREFISH Part 1 was an open-label, single-arm, dose-finding, phase II clinical trial that provided results on the safety and efficacy of 2 doses of risdiplam in 21 infants with SMA type I. Results from Part 1 were used to inform the dose used in Part 2 of the study. With no placebo or active control arm, it is possible that there was confounding of the treatment effect. Furthermore, without comparison to a randomized control group, natural fluctuations in the course of SMA cannot be adjusted for, nor the effects of known and unknown confounders. Considering the study’s main objective as a dose-finding study, efficacy outcomes are considered exploratory in nature.
SUNFISH Part 1 was a placebo-controlled, dose-finding, phase II clinical trial that provided information on the safety and efficacy of flat and weight-based doses of risdiplam in 51 patients with SMA type II and SMA type III. Results from Part 1 were used to inform the dose used in Part 2 of the study. Initially, the study was double-blinded for a minimum of 12 weeks, at which point patients receiving placebo were switched over to active treatment in their assigned cohort. The pivotal dose was selected and all patients were switched to receive that dose for 24 months. Unblinding occurred at the start of the open-label treatment period. With a limited placebo-control period, it is difficult to know the effects of confounders over time once all patients were receiving active treatment. The Motor Function Measure–20 items (MFM-20) was mistakenly administered to 7 patients who should have completed the MFM-32. As a result, the investigators removed these 7 patients, all of whom were in the 2-year-old to 11-year-old cohort, from efficacy analysis.
Generalizability of FIREFISH Part 1 and SUNFISH Part 1 to the general SMA population was not part of the studies’ objectives, considering the dose-finding nature of the studies and that outcomes were exploratory. In addition, the small number of patients and the single-arm study design make it difficult to generalize beyond the study populations. Results of these phase II studies should best serve as supportive evidence for the phase III confirmatory trials, FIREFISH Part 2 and SUNFISH Part 2.
Conclusions
By month 12 of treatment, patients in the FIREFISH Part 2 study were able to demonstrate the attainment of motor milestones, ventilation-free survival, and overall survival at levels that were statistically significant when compared to natural history thresholds. Patients in the SUNFISH Part 2 study did achieve the primary end point, at month 12 of treatment, with a statistically significant improvement in the MFM-32 score versus placebo, as well as in a secondary end point using the RULM score, though these differences may not have achieved an MID. Additionally, SUNFISH Part 2 failed to achieve statistical significance in the HFMSE and FVC outcomes, and no conclusive result can be determined for the outcomes of the SMA impact scale and the CGI-C “improved” rating. Respiratory and infection-related AEs were most prevalent across the studies and were a related cause of death for 3 patients who died in FIREFISH Part 2.
Indirect evidence suggested that risdiplam could potentially be favoured over nusinersen in ventilation-free survival and overall survival. However, the high level of uncertainty associated with serious limitations imposed by the method used in deriving the indirect estimates coupled with the lack of assessment for residual biases preclude concluding that risdiplam is more efficacious than nusinersen for these outcomes
Evidence gaps exist in the lack of efficacy and safety outcomes in pre-symptomatic SMA patients, SMA patients with prior experience with nusinersen or onasemnogene abeparvovec, infants with a disease duration longer than 6 months, and SMA patients who require permanent ventilation. Additionally, despite adult patients with SMA having been included in the SUNFISH study, there are several limitations associated with generalizing the overall result of SUNFISH to the adult SMA population.
Introduction
Disease Background
SMA is a rare, autosomal recessive, neuromuscular disease and was the leading genetic cause of infant death before the availability of disease-modifying treatments.1,2 The root cause in SMA is a deficiency in the SMN protein, which is essential for the survival of motor neurons.3,4 Specifically, the deficiency in the SMN protein leads to the degeneration of alpha motor neurons in the anterior horn of the spinal cord, causing irreversible loss of motor neurons and motor nerves, and progressive muscle weakness.1 SMN protein is expressed mainly through the SMN1 gene.3-5 A second set of genes, SMN2 gene, can express the SMN protein, albeit at a drastically less effective rate than the SMN1 gene, as only 10% to 15% of the protein produced by SMN2 is functional.5,6 The most common form of SMA, 5q SMA, is the result of bi-allelic mutations in SMN1 on chromosome 5q13, where 95% of the cases are due to homozygous deletion and the rest are due to hemizygous deletion along with point mutation.8,11 As the main source of SMN protein no longer functions in SMA, the number of SMN2 copies becomes an important disease modifier and is inversely related to the severity of SMA.1,2,7,8
There is no Canadian national data on the incidence and prevalence of SMA in Canada. However, the most commonly reported estimate of the incidence of SMA is 10 in 100,000 live births and a prevalence of 5 in 100,000 individuals.9,11 The sponsor of risdiplam estimates the incidence in Canada as 1 in 6,000 to 15,000 live births and the prevalence at 1 to 2 per 100,000.14
Traditionally, SMA is classified into 4 clinical subtypes based on the age of disease onset and the highest motor milestone achieved without disease-modifying treatment. These phenotypes differ in their presentations, severity of the disease, and prognosis. However, while the subtypes provide a convenient means of classifying patients, it should be noted that patients exist along a continuum of disease severity with overlap in symptoms between subtypes. In SMA type I, patients show symptoms within their first 6 months of life, never achieve the motor milestone of sitting unsupported without disease-modifying treatment, and have a small chance of survival beyond 2 years of age due to respiratory failure without appropriate treatment.1,2,7-9 In SMA type II, patients achieve the milestone of sitting unsupported, but never walk independently without disease-modifying treatment. Symptoms generally appear between 6 months and 18 months after birth and most patients will survive past the age of 25,7,10 with life expectancy improved by appropriate treatment.10 SMA type III makes up about 10% to 20% of SMA cases11 and manifests after 18 months of age. These patients are able to walk independently.10 Type IV makes up a very small proportion of SMA cases with symptom onset as adults, the mildest form of the disease. However, while the subtypes provide a convenient means of classifying patients, it should be noted that patients exist along a continuum of disease severity with overlap in symptoms between subtypes. This spectrum is represented in Figure 1 as published in Talbot (2017).15
Figure 1: Continuous Spectrum of SMA Phenotype
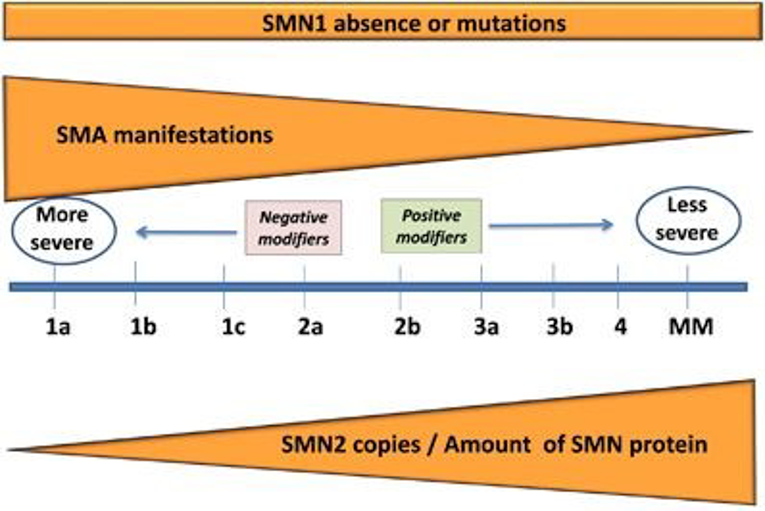
MM = minimal manifestations; SMA = spinal muscular atrophy; SMN = survival motor neuron.
Source: Talbot K, Tizzano EF. The clinical landscape for SMA in a new therapeutic era. Gene Ther. 2017; 24:529 to 533. doi: 10.1038/gt.2017.52 Licensed under: https://creativecommons.org/licenses/by-nc-nd/4.0/
In SMA type I without disease-modifying treatment, patients show symptoms within their first 6 months of life, never achieve the motor milestone of sitting unsupported, and have a small chance of survival beyond 2 years of age due to respiratory failure.1,2,7-9 SMA type I is the most common type of SMA, accounting for about 60% of SMA diagnoses.11 Almost all patients with SMA type I have 2 or 3 copies of SMN2, giving rise to a broad range of phenotypes.16 Additional subtypes of IA (also called SMA type 0), IB, and IC have been proposed based on age of onset, with IA being the earliest and most severe subtype, presenting symptoms at birth with joint contractures, severe weakness and hypotonia, respiratory insufficiency, and a life expectancy of less than 6 months.7,8 SMA type IB patients have symptom onset after 1 week of age but before 3 months of age, and SMA type IC have symptom onset between 3 months and 6 months of age. Muscle weakness in SMA type I is severe to the point where patients typically cannot perform antigravity limb movements and have no head control, though facial muscles are spared.1 Fine motor skills are affected, with infants unable to grasp using their whole hand.4 Weakness in the intercostal muscles in combination with sparing of the diaphragm leads to paradoxical breathing and a bell-shaped chest.1,8 Bulbar weakness results in difficulty swallowing and feeding, with risk of failure to thrive and aspiration.1,8 Reflux and impaired cough and swallowing contribute to risk of aspiration and recurrent pulmonary infections.1,2,7,8 A gastrostomy tube for feeding combined with nighttime and possibly daytime non-invasive ventilation with BiPAP can improve quality of life7,8 and life expectancy.17 Aggressive intervention with a tracheostomy and permanent ventilation is also possible and can prolong life expectancy; however, this is a decision to be made by the family with the support of health care providers.7,8 In 1 study that examined 1,966 patients in the Cure SMA database (with data available between 2010 and 2016), the median survival for type I SMA was 13.6 months.9 In a recent analysis of 307 treatment-naive patients, the median survival was 9 days in SMA type IA, 7.7 months in SMA type IB, and 17 years in SMA type IC.18
In treatment-naive SMA type II, patients achieve the milestone of sitting unsupported, but never walk independently. Some may lose the ability to sit unsupported over time. Symptoms generally appear between 6 months and 18 months after birth and most patients will survive past the age of 25 years,7,10 with life expectancy improved by appropriate treatment.10 Type II patients represent about 20% to 30% of incident SMA cases and most SMA type II patients have 3 copies of SMN2.16 In addition to the inability to walk independently, common symptoms are fine tremors of the upper extremities, tongue fasciculation, joint contractures, and scoliosis.1,8,10 Scoliosis and weak intercostal muscles can cause restrictive lung disease.8 There is a range in severity, with weaker patients requiring non-invasive ventilation.1 Difficulty swallowing is less common than in type I patients and difficulty with feeding comes from masticatory muscle weakness.1 In 1 study that examined 1,966 patients in the Cure SMA database (with data available between 2010 and 2016), the median survival for type II SMA was 59.9 years.9 In a recent analysis of 307 treatment-naive patients with SMA, patients with SMA type IIA had an end point–free survival probability at 40 years of 74.2% and at 60 years of 61.5%.18 The same analysis reported that patients with SMA type IIB had a relatively normal end point–free survival probability at 60 years of age.18
SMA type III makes up about 10% to 20% of SMA incident cases11 and manifests between 18 months of age and adulthood. These patients are able to walk independently, though some may lose this ability over time, and typically have a normal life expectancy.10 Most type III patients have 3 or 4 copies of SMN2.16 An age of onset before 3 years (SMA type IIIA) is associated with estimated probabilities of 73%, 44%, and 34% of walking 10 years, 20 years, and 40 years after onset.19 In those with age of onset after 3 years (SMA type IIIB), the estimated probabilities are 97%, 89%, and 67% for walking 10 years, 20 years, and 40 years after onset.19 SMA type III patients have little or no respiratory weakness.8 Ambulatory patients may exhibit abnormal gait characteristics due to proximal weakness10 while patients who lose the ability to walk often develop scoliosis.1
A very small proportion of SMA cases is type IV or adult-onset SMA, the mildest form of the disease. Although muscle weakness is present, these patients retain the ability to walk, have a normal life expectancy, and do not experience respiratory or nutritional issues.1
The correlation between the genotype, specifically the number of SMN2 genes, and the clinical phenotype (SMA types) is probabilistic in nature. In 1 natural history study, of 39 patients diagnosed as SMA type IB or IC, 16 patients (41%) had 2 copies of the SMN2 gene, 21 patients (54%) had 3 copies of the SMN2 gene, and 1 patient (3%) had 4 copies of the SMN2 gene.16 The same study showed that out of 87 patients diagnosed as SMA type IIA or SMA type IIB, 2 patients (2%) had 2 copies of the SMN2 gene, 75 patients (86%) had 3 copies of the SMN2 gene, and 7 patients (8%) had 4 copies of the SMN2 gene.16 Of 66 patients who were diagnosed as SMA type IIIA or SMA type IIIB assessed in the same study, 1 patient (2%) had 2 copies of the SMN2 gene, 19 patients (29%) had 3 copies of the SMN2 gene, 40 patients (61%) had 4 copies of the SMN2 gene, and 2 patients (3%) had 5 copies of the SMN2 gene.16 The study also assessed 5 patients diagnosed as SMA type IV and of these patients, 4 (80%) had 4 copies of the SMN2 gene and 1 patient was not reported.16 A summary of these subtypes is presented in Figure 2, as published in Talbot (2017).15
Figure 2: Spinal Muscular Atrophy Clinical Classification
![The phenotypic classification of SMA type (1 [A, B, or C], 2, 3 [a or b], and 4) is determined by the age of onset of signs and symptoms, milestones achieved, and the number of copies of the SMN2 gene. A higher number of copies of SMN2 is associated with a less severe phenotype.](https://canjhealthtechnol.ca/index.php/cjht/article/download/sr0661r/version/186/364/1137/SR0661CL-fig02.png)
SMA = spinal muscular atrophy; SMN2 = survival of motor neuron 2.
Source: Talbot K, Tizzano EF. The clinical landscape for SMA in a new therapeutic era. Gene Ther. 2017; 24:529 to 533. doi: 10.1038/gt.2017.52 Licensed under: https://creativecommons.org/licenses/by-nc-nd/4.0/
Standards of Therapy
At the time of drafting this report, there are 2 SMA disease-modifying therapies approved in Canada: nusinersen (Spinraza) and onasemnogene abeparvovec (Zolgensma). In Canada, nusinersen is indicated for the treatment of 5q SMA, while onasemnogene abeparvovec is indicated for the treatment of pediatric patients with 5q SMA with bi-allelic mutations in the SMN1 gene and either 3 or fewer copies of SMN2 gene, or infantile-onset SMA.12
In addition to treatment with disease-modifying therapies, current standards of practice involve clinical monitoring and surveillance, anticipatory management of symptoms, and attempting to improve overall quality of life. SMA patients receive monitoring for growth, gastrointestinal function, and nutrition; respiratory complications; and orthopedic complications (i.e., scoliosis and/or contractures). These standards of practice include respiratory management for all children with type I SMA and some with type II SMA,8 secretion mobilization in patients with weak cough,1,7 management of swallowing difficulties,10 and various multidisciplinary strategies for managing gross motor functions and spinal deformities (e.g., physiotherapeutic, orthopedic, surgical).7
With the introduction of nusinersen, an updated consensus statement on SMA standard care was published.20 The updated consensus statement maintained strong emphasis on the multidisciplinary approach to addressing the various aspects of the disease and the involvement of various organs, and suggested a proactive approach to respiratory care, various approaches to acute manifestations of SMA, and the inclusion of nusinersen with an emphasis on monitoring potentially disproportional improvements in function due to the intrathecal administration route of nusinersen.21
Considering the existence of disease-modifying therapies, newborn screening of SMA to detect pre-symptomatic patients has been included in the Ontario newborn screening for SMA in its screening program,14 while Alberta has an ongoing pilot program for SMA screening.22 For patients with SMA who are identified through a newborn screening program, published clinical guidance suggests immediate treatment in infants with 2 or 3 copies of SMN2.23
Drug
Risdiplam was submitted to CADTH with a pre-NOC indication for the treatment of SMA. An NOC was received during the course of this review (April 14, 2021) with a final indication for the treatment of SMA in patients 2 months and older. The product monograph notes that there are no data available in infants younger than 2 months of age and therefore risdiplam is not indicated in this patient population. It also notes that there are limited data on risdiplam for patients older than 25 years of age.
Risdiplam is a SMN2 pre-mRNA splicing modifier. Risdiplam corrects the splicing of SMN2 to shift the balance from exon 7 exclusion to exon 7 inclusion into the mRNA transcript, leading to an increased production in functional and stable SMN protein. Thus, risdiplam treats SMA by increasing and sustaining functional SMN protein levels.13 The dose of risdiplam is determined by age and weight as follows:
2 months to less than 2 years of age: 0.20 mg/kg
2 years or older and less than 20 kg of body weight: 0.25 mg/kg
2 years or older and 20 kg or more of body weight: 5 mg
Risdiplam underwent Health Canada priority review. The sponsor requested reimbursement as per the indication.14
Risdiplam has gained market approval from the FDA and the European Medicines Agency (EMA). The FDA indication is for “the treatment of spinal muscular atrophy (SMA) in patients 2 months of age and older.”24 The EMA indication is “for the treatment of spinal muscular atrophy.”25
Table 3: Key Characteristics of Risdiplam, Onasemnogene Abeparvovec, and Nusinersen
Characteristic | Risdiplam | Onasemnogene abeparvovec | Nusinersen |
|---|---|---|---|
Mechanism of action | A SMN2 pre-mRNA splicing modifier. Risdiplam corrects the splicing of SMN2 to shift the balance from exon 7 exclusion to exon 7 inclusion into the mRNA transcript, leading to an increased production in functional and stable SMN protein | Adeno-associated virus vector-based gene therapy. Delivers a stable, fully functional human SMN transgene, which provides an alternative source of SMN protein expression in motor neurons | An antisense oligonucleotide that increases the proportion of exon 7 inclusion in SMN2 mRNA transcripts made, through binding to a specific site in the SMN2 pre-mRNA |
Indicationa | For the treatment of SMA in patients 2 months and older | For the treatment of pediatric patients with 5q SMA with bi-allelic mutations in the SMN1 gene and:
| For the treatment of 5q SMA |
Route of administration | Oral solution | IV infusion | Intrathecal administration |
Recommended dosage |
| 1.1 × 10¹⁴ vector genomes/kg single IV infusion | 5 mL solution containing 12 mg of nusinersen, given in a regimen of 4 loading doses at day 0, day 14, day 28, and day 63, with subsequent maintenance doses at a 4-month interval |
Serious adverse effects or safety issues |
|
|
|
mRNA = messenger ribonucleic acid; SMA = spinal muscular atrophy; SMN = survival motor neuron.
aHealth Canada–approved indication.
Sources: Spinraza product monograph26 and Zolgensma product monograph.12
Stakeholder Perspectives
Patient Group Input
This section was prepared by CADTH staff based on the input provided by patient groups.
About the Patient Group(s) and Information Gathered
CADTH received 2 patient input submissions for this review from MDC and CSMAC. A disclosure of any conflicts of interest for the organizations is available on the CADTH website.
MDC is an organization that supports patients and caregivers affected by neuromuscular disorders, including muscular dystrophies and related muscular diseases. The organization represents more than 12,000 patients and nearly 19,000 family members and caregivers in Canada. MDC’s mission is to improve the lives of those impacted by neuromuscular disorders. CSMAC is a national registered charity that supports patients and families affected by SMA from diagnosis throughout life, and after loss of life. CSMAC’s mission is to improve both the quality and quantity of life for patients with SMA. Both organizations help fund research and offer programs and services for education, access to financial support for critical equipment, peer-to-peer networking, information on new treatments, medical advances, clinical trials, and advocacy.
MDC conducted interactive, semi-structured, virtual interviews with patients and caregivers to learn about their experiences with SMA. Between November 10 and December 4, 2020, 92 interviews were conducted.
CSMAC collected information for its submission through semi-structured interviews, a focus group, and a survey of patients and caregivers. All respondents lived in Canada and all data were collected between October 2020 and December 2020. The focus group consisted of 5 adult patients and 8 parent caregivers of patients with SMA. The survey was available in both English and French, and a link to it was distributed to the patient community in CSMAC’s database. Of the 96 responses, 17% represented patients with SMA type I, 58% represented patients with SMA type II, 24% represented patients with SMA type III, and 1% were other. Forty-seven responses were for adult patients, 20 were for patients from 11 years old to 20 years old, 16 were for patients from 5 years old to 10 years old, 8 were for patients from 2 years old to 5 years old, and 5 were for patients younger than 2 years of age.
Disease Experience
MDC asked patients to describe how SMA impacts day-to-day life and quality of life. Six main themes were apparent, which have been listed in order of frequency reported: 1) an enormous impact on activities of daily living; 2) breathing, swallowing, and mobility are mostly affected; 3) significant dependence on caregiving supports; 4) loss of independence and control; 5) pain, age-related fatigue, and mental health; and 6) fear of falling.
Some of the major health concerns expressed by both patient groups included respiratory function (and illnesses like pneumonia), muscle strength, fine motor skills, falls and safety, nutrition (inability or losing ability to chew and swallow), voice and speech, mental and emotional health, and being easily fatigued. Transportation time and distance along with accessibility when out in public were noted as important considerations in day-to-day life. The desire to maintain or regain independence for as long as possible was common among responses, though there was still the constant fear of progressive loss of function and declining health. Living with SMA requires a high degree of dependence on both caregivers and equipment, additional therapy, and medical appointments, all of which lead to exhaustion for both patients and caregivers as well as increased strain on mental health and relationships.
The following is a selection of quotes from patients and caregivers to illustrate living with SMA:
“I have to have a wheelchair vehicle in order to get anywhere and then not only that, but I worry about how accessible the place is going to be once I get there – which is out of my control. What is accessible to one person is not access to the max. Especially if you are in a wheelchair full-time.”
“Daily, I rely heavily on the assistance of PSW’s to meet all of my physical needs from getting dressed, toileting, transferring to my power chair, shifting several times to get comfortable, washing my face, fixing my hair, getting breakfast…the list goes on and on. Basically, I require help to do all things physical, even putting my arms around my son to give him a hug.”
“I need 24/7 care so I can’t live on my own unless it’s in a facility which I never want. So I live with my parents who are pushing 60 and when I don’t have my personal care attendants, they struggle to take care of me.”
“Mobility limitations takes a toll on mental health and happiness, it makes you feel shameful. I cannot enjoy my children’s hockey games and I feel excluded from social events and sporting events.”
“With loss of function, he said at age 11 ‘This is no life, a life not worth living.’”
Experiences With Currently Available Treatments
In general, the major barriers respondents faced include the high cost of treatment and transportation as well as differing access or restrictions among jurisdictions. Caregivers also highlighted the stress that hospital visits caused patients, particularly children, which could lead to anxiety; the sacrifice made by patients and caregivers to take time off for travel, treatment, and recovery; the risks or side effects of treatments; and the lack of insurance coverage for medication. The method of administration was also a concern, and each has its own drawbacks. For example, spinal injection is invasive and would not be an option for patients with spinal fusion while inaccessibility to veins makes IV treatment a challenge.
Patients who had received Spinraza (nusinersen) every 4 months felt that it was a painful, risky, and invasive procedure. It was also noted that this treatment is not always successful and has led to cerebrospinal fluid leaks, headaches, and periods of regression in-between injections for some patients. Moreover, it may be an inappropriate choice since it relies on being able to find access points for administration. Although there is fear around the treatment process itself, patients and caregivers still worry about missing an injection and the impact it would have on the patient.
“Accessing Spinraza initially was a rollercoaster. Without the recommendation for adults, Saskatchewan has determined approval on a case-by-case basis. It took a long time to get provincial approval…. But then not only that, maintaining access to treatment is almost just as difficult. Testing needs to be done with the Hammersmith test and upper extremity test every four months…. One-point difference from the previous testing and I could no longer qualify for Spinraza. That is a constant worry.”
Patients and caregivers shared some of the improvements they’ve seen with new medications:
“My energy level has gone higher than it’s ever been. I have more trunk control and strength and I’m doing things that I haven’t been able to do in 10 years or more. Driving is easier, baking is easier, getting through the day is easier and I no longer need a nap halfway in between.” (adult who received nusinersen)
“The day after she had her infusion she was able to sit unassisted for over 30 minutes which is something that she had never been able to do before. We saw gains almost right away and we have seen prolonged improvement as well as more energy and movement.” (parent of patients who received onasemnogene abeparvovec)
Despite the benefits that treatment can offer, many struggle with gaining access:
“I am not currently on any specialized treatment for SMA. This is due to the fact that there are very few treatments for SMA and they are difficult to access. This is because of prohibitive costs, lengthy and restrictive approval processes, invasive or difficult route of administration, and travel to medical facilities.”
“I am currently not receiving any treatments for SMA. This is due to the current costs of treatments being well outside my financial means and local government not funding treatment for people over 18 currently.”
Improved Outcomes
Many respondents stated that they wanted to see a halting of disease progression and are hopeful for improvements in respiratory ability, mobility, strength, and feeding. Overall, patients and families valued greater independence, longer life expectancy, and improved quality of life, particularly for the patient, but also within the family unit. For new treatments, respondents would like to see ones that are less invasive, have fewer side effects, and are covered through insurance.
“It would be great if a treatment would stop progression and allow me to rebuild muscle and strength and give me everything I desire to do.”
“Stopping the progression is critical, I can still drive a little bit, I love writing and would love to be able to gain a bit of ability to be able to do that. Maintain my eating, would love to be able to stay in my own home and die there, not have to go to LTC.”
Being aware of risdiplam, respondents felt that a daily, oral treatment would have a positive impact on their lives if it meant fewer hospital visits, less strain on hospital resources and staff, a convenient and easily accessible treatment, and that patients and families would be allowed to have stable careers, education, and family lives.
Experience With Drug Under Review
MDC and CSMAC collected responses from 4 patients and 6 patients, respectively, who had previous experience with risdiplam through clinical trials or special access programs. One patient interviewed by MDC had been receiving risdiplam for 2.5 years while the patients from the CSMAC group had been on risdiplam for between 4 months and 2.5 years and were from 3 years to 13 years old.
In general, patient experience was very positive with improvements in motor and respiratory function, strength, energy, appetite, and weight gain, along with decreased illness and dependence on medical equipment. Respondents were pleased that administration could be done at home and that the medication was available from a pharmacy rather than the hospital. When compared to nusinersen, multiple patients and families noted the benefit of being able to avoid the waning effect between doses, have fewer side effects of treatment, and reduce the potential risks of repeated spinal punctures. A few respondents stated that with risdiplam, it took several months to see a noticeable change and that some patients experienced acid reflux that decreased over time.
“All of our experiences have been positive with this treatment. His health has improved in way that we didn’t think it would.”
“…in July of 2020 prior to Risdiplam he was able to sit unassisted out of his brace for 10-15 seconds on occasion, and in his brace for between 30 seconds to 1 minute. Now, in November 2020, he can sit unassisted without his brace for 1-2 minutes on occasion, and in his brace he can sit unassisted for anywhere from 15-30 minutes routinely.”
“It has given us hope for our child’s future. We have less worry because he is gaining muscle strength instead of losing it. He has been able to fight off illness, so we have less fear of him having to go to the hospital. Knowing that a medication has saved your child’s life positively changes everything. ”
Companion Diagnostic Test
Of the 92 responses from the MDC group, 84 stated having a genetic test to confirm SMA diagnosis via blood test. Respondents felt it was a simple procedure, did not cause significant anxiety, was at no additional cost, and provided quick results. While most felt they did not face significant barriers, a few stated that having other family members tested (e.g., siblings of a child with SMA or parents when family planning) was a major hurdle. For instance, 1 parent recounted their experience when attempting to have their other children tested: “I pushed for testing for them as well, and this proved to be extremely frustrating and time consuming for me…. I still do not understand why I encountered so much resistance trying to get these tests performed.”
Additional Information
A few family-centred considerations could be noted in the patient submissions: families having to find care for other children during appointments, the importance of being able to care for all their children equally, having treatments and a lifestyle that improved quality of life for the whole family, and caregivers having the time and energy for things that often came second to caring for their family member with SMA.
“My other kids would not have to deal with being left with other people while I take her to treatments, and I would be way less stressed and better able to better distribute myself among them, avoiding the hypervigilance and focus on my affected child after each treatment that disrupts our family dynamic. Risdiplam would mean WAY less trauma and anxiety for my family and a better quality of life for my daughter, my spouse and I, and for my other 3 small children.”
Respondents also emphasized issues with restrictions on age and ventilator status.
“Do not limit treatment because a child is ‘invasively ventilated.’ He has shown that he can make huge improvements with compassionate access to these drugs, but without compassionate access he would have been locked out of any provincially funded options because he is invasively ventilated.”
Both patient groups clearly expressed that with access to effective treatments, they were hopeful for patients’ futures.
“Parents who have children with SMA are excited about the possibility of having more than one treatment option. Our kids are intelligent, and deserve a chance at a life with greater mobility, and easier breather, and speaking. Given the opportunity to make it to adulthood they will become major contributors to our society.”
“No child or adult should have to wait. It’s a literal matter of life and death for them. The benefits to these SMA patients are enormous too and, if not life-saving, certainly life-changing.”
Lastly, CSMAC emphasized the importance of having new therapies for adult patients with SMA since many are not accessing treatment in Canada and highlighted that these medications can have life-changing results, allowing patients to live their best lives at any age.
Clinician Input
All CADTH review teams include at least 1 clinical specialist with expertise regarding the diagnosis and management of the condition for which the drug is indicated. Clinical experts are a critical part of the review team and are involved in all phases of the review process (e.g., providing guidance on the development of the review protocol, assisting in the critical appraisal of clinical evidence, interpreting the clinical relevance of the results, and providing guidance on the potential place in therapy). In addition, as part of the risdiplam review, a panel of 7 clinical experts from across Canada was convened to characterize unmet therapeutic needs, assist in identifying and communicating situations where there are gaps in the evidence that could be addressed through the collection of additional data, promote the early identification of potential implementation challenges, gain further insight into the clinical management of patients living with SMA, and explore the potential place in therapy of risdiplam (e.g., potential reimbursement conditions). A summary of this panel discussion is presented as follows.
Unmet Needs
In the pediatric population, nusinersen has limitations associated with the route of administration, the distribution of the active substance within the body, an underwhelming effect on respiratory and bulbar function, and a growing clinical experience with diminished response, or a reversal of effect over time. The clinical experts noted that the route of administration of nusinersen can be associated with several concerns, including uncertainty as to whether the appropriate dose has been administered (in part due to cerebrospinal fluid leaks that may contain nusinersen), unequal distribution of nusinersen in the central nervous system (CNS), and the small risk of nerve damage in infants and toddlers. Also, some older patients may have spinal deformities (e.g., scoliosis) that may prevent them from receiving nusinersen. In addition, patients with potential allergies or who have a bleeding disorder would not be eligible for nusinersen. The introduction of onasemnogene abeparvovec may alleviate some of the limitations associated with nusinersen. However, considering the importance of prompt treatment, there remains a group of patients that may need immediate access if onasemnogene abeparvovec is not readily available. In addition, there are patients who might have contraindications to onasemnogene abeparvovec due to potential hepatotoxicity or the existence of anti–adeno-associated virus 9 (AAV9) antibodies, or opt out of treatment with onasemnogene abeparvovec. There is also limited evidence of the benefit of onasemnogene abeparvovec in older children.
Overall, in the pediatric population, there still exists a need for reliable, effective, and non-invasive treatment.
Treatment of adult patients with SMA is limited to nusinersen. However, there is limited evidence of its efficacy and safety in adult patients with SMA. In addition, access to nusinersen across Canada’s provinces and territories for adult patients with SMA is variable. There remains an unmet need for an effective drug in the adult population that can clearly demonstrate benefits in this age group with slow disease progression.
Finally, there remains a need for therapies that may reverse the effect of SMA and therapies that can prove beneficial for patients with invasive ventilation. Currently, all available treatment options can only work on viable alpha motor neurons but cannot reverse the damage already inflicted.
Place in Therapy
Currently, all pediatric patients are treated with nusinersen. With onasemnogene abeparvovec availability, most patients who would be eligible for onasemnogene abeparvovec are likely to be treated with it, unless there exists a contraindication (e.g., liver disease), high titres of anti-AAV9 antibodies, or the refusal of the family to use gene therapy. In SMA patient populations that may not have access to onasemnogene abeparvovec, reimbursement eligibility would determine whether nusinersen or risdiplam would be administered. Should the patient have access to both, it is likely that the oral route of risdiplam administration would be preferable over the intrathecal route of nusinersen to eliminate potential AEs and limitations associated with the nusinersen intrathecal route and overcome some of the administration challenges in patients with scoliosis or contractures. The role of risdiplam in pre-symptomatic patients is not yet clear pending more evidence regarding the efficacy and safety of risdiplam in the pre-symptomatic population.
Pediatric patients with later-onset SMA, who might be too old for onasemnogene abeparvovec, are likely to start treatment with risdiplam. In essence, the clinical experts expect risdiplam to replace nusinersen due to potential differences in the risk-benefit ratio.
Risdiplam will likely be the first-line therapy for adult and adolescent patients, largely due to the paucity of evidence for nusinersen efficacy in this group of patients, the lack of reimbursement of nusinersen in some jurisdictions for adult patients, the systematic distribution of the therapy, the faster time to reach therapeutic concentration, as well as the non-invasive route of administration of risdiplam compared to the intrathecal route of nusinersen.
The clinical experts do not see a role for combination therapy in clinical management of SMA. There is no rigorous and/or longitudinal evidence supporting combined therapy. Moreover, the clinical experts see no biological rationale for combination therapy, irrespective of medication. This is considering that all agents act on upregulating the same protein (SMN), and as long as the delivery of the active ingredients to the target cells is proper, combined therapies would be expected to be redundant.
The clinical experts can see a role where risdiplam is given as a bridge until the patient can be treated with onasemnogene abeparvovec. This takes into consideration the importance of prompt treatment to avoid any irreversible loss of alpha motor neurons. Considering the systematic nature of risdiplam, the clinical experts expect to observe better improvements in bulbar function than with nusinersen. However, the clinical experts do not necessarily think treatment with risdiplam would produce a different response in patients who have already deteriorated while on nusinersen. The role of subsequent treatment with risdiplam after treatment with onasemnogene abeparvovec is not clear; there is yet to be reliable evidence measuring the long-term duration of the effect of gene therapy with onasemnogene abeparvovec.
Patient Population
The clinical experts emphasized that, regardless of treatment strategy, time since diagnosis or symptom onset is the most important factor that would determine the extent of benefit that may be observed in patients with SMA. To this extent, the earlier any disease-modifying treatment is initiated, the more likely that the patient will maintain existing motor function or grow to develop new motor milestones.
However, the clinical experts indicated that patients who would be eligible for onasemnogene abeparvovec are likely to be steered to that intervention, with the exception of the potential for bridging with risdiplam until the administration of onasemnogene abeparvovec.
Patients who are most likely to benefit from risdiplam are those who might be too old for onasemnogene abeparvovec and have anatomic deformities that make nusinersen administration difficult, if not impossible. Risdiplam would essentially be the only treatment available for them.
For adolescent and adult patients with SMA, risdiplam is likely to be the only choice with some evidence of efficacy and safety. Patients with more preserved motor function at baseline will potentially see more benefit from the drug as there are more alpha motor neurons to preserve than in patients who have lost more motor function.
The clinical experts identified that patients with advanced stages of the disease, who may require invasive ventilation or have a chronic gastrointestinal condition that might hinder drug absorption, could be the least suitable for treatment with risdiplam.
Assessing Response to Treatment
Assessment of clinical progress will depend on the age of the patient, the stage of the disease, and the baseline preserved motor function.
In pre-symptomatic patients, an optimistic target is normal motor milestones development, and bulbar and respiratory function.
In patients with infantile-onset or type I SMA, achievement of independent sitting and independent breathing during daytime, the prevention of scoliosis, and functional safe swallowing is considered a good treatment response.
In patients with later-onset SMA who do not walk or type II SMA, the prevention of further deterioration and the prevention of scoliosis would be beneficial. Maintaining baseline motor function is a minimum expectation.
In patients with later-onset SMA who are able to walk or type III SMA patients, maintaining the ability to walk and potentially increasing the distance travelled in the 6-minute walk test (6MWT) would be considered a good treatment response.
Patients with adult-onset SMA or SMA type IV are unlikely to lose motor function of sufficient magnitude that would lead to loss of ambulation or disability. However, clinical experts pointed out that some patients with manual or labouring jobs may lose meaningful employment. The clinical experts do not believe that there exists evidence of the efficacy of disease-modifying therapy in this patient population.
The use of various motor function measurement tools to monitor patient progress is largely centre-dependent. Commonly, the HINE Section 2 is used for infantile-onset SMA, the HFMSE and Upper Limb Module (ULM) for non-ambulatory later-onset patients, and the HFMSE and 6MWT in ambulatory patients. However, the clinical experts have pointed out that these motor function measurement tools are not part of the common clinical practice and are usually only done as part of treatment application or reimbursement requirement. The CHOP INTEND tool was considered a research tool that requires training and resources to administer as part of the usual clinical practice. There has also been discussion regarding the utility of the 6MWT considering some identified limitations of this measuring tool, and that current assessment of motor function in ambulatory adults is largely based on self-reporting. Moreover, the expert committee pointed out that HRQoL measures may be more relevant to patients than motor function testing tools. In addition, clinical experts pointed out that most of these assessment tools require access to specialty clinics and trained staff.
Assessment of response is dependent on age and disease stage. Patients with newly diagnosed infantile-onset SMA who are treated with risdiplam are likely to start showing a response within 6 months. Adult ambulatory patients may not show the benefit of treatment for 1 year to 2 years, since disease progress is much slower in older age groups. Typically, infants are seen every 3 months until 2 years of age, then every 6 months until 4 years to 5 years of age, then annually after 5 years of age. The clinical experts suggested an assessment schedule that would mirror the typical clinical approach would be appropriate.
Discontinuing Treatment
Usual treatment discontinuation decisions would follow a risk-benefit analysis when AEs or tolerability issues are observed. Clear disease progression despite adequate treatment would be a potential reason for treatment discontinuation. However, the clinical experts emphasized that determination of disease progression should be considered carefully and not be based on measures that are single event and non-reproducible, and can potentially be due to processes other than disease progression. Any such measure would need to be objectively reproduced on at least 2 events over a 3-month period, excluding any possible acute or reversible cause.
Prescribing Conditions
Management of pediatric patients with SMA is commonly handled by a pediatric neurologist or a pediatric neuromuscular specialist within an interdisciplinary team. Adult patients with SMA are commonly managed by an adult neurologist or adult neuromuscular specialist. Treatment with risdiplam should be prescribed and administered by a clinician with experience in managing patients with SMA. For patients who are remote to specialty clinics, a hybrid model can be developed, where initial diagnosis and treatment are done at the specialty clinic, and subsequent monitoring (with prescription still coming from a specialist) is done mainly at local outpatient clinics, with periodic monitoring at the specialty clinic. Virtual visits can be considered for monitoring post-therapy initiation.
Clinician Group Input
This section was prepared by CADTH staff based on the input provided by clinician groups.
Clinician Input was provided by the NMD4C. The group is a pan-Canadian network launched in 2020 that aims to bring together clinical, scientific, technical, and patient expertise in neuromuscular disease. NMD4C is funded by the Canadian Institutes of Health Research and MDC and builds on the former neuromuscular network CAN-NMD as well as existing initiatives such as the Canadian Neuromuscular Disease Registry (CNDR) and the Canadian Pediatric Neuromuscular Group.
NMD4C noted that their mission is to improve the care, research, and treatment of neuromuscular diseases for all Canadians. They hope to be a comprehensive, inclusive, open, and enduring network through which Canadian stakeholders can share their expertise and data while also collaborating on joint activities and research. The main goals for NMD4C include formalizing and sustaining a network of neuromuscular disease stakeholders, training and educating stakeholders (clinicians, scientists, and patient advocates), improving the standard of care of neuromuscular disease patients, enabling access to therapies across Canada, and strengthening biomedical and clinical infrastructure to build research capacity in Canada.
NMD4C provided input from clinicians with experience treating SMA and with risdiplam and who are familiar with the data from the clinical trials on treatment of SMA, and specifically for risdiplam. Input was provided by neurologists from Ottawa, Montreal, Toronto, London, Vancouver, Hamilton, Calgary, and Saskatoon and included the following institutions: the CHEO Research Institute, the Montreal Neurological Institute-Hospital, Ottawa Hospital Research Institute, The Hospital for Sick Children, Children’s Hospital–London Health Sciences Centre, BC Children’s Hospital Research Institute, McMaster Children’s Hospital, Alberta Children’s Hospital, Stan Cassidy Centre for Rehabilitation, and the University of Saskatchewan. NMD4C notes that the expert clinicians are involved in clinical and observational research, clinical guidelines development, and health technology assessment.
Unmet Needs
NMD4C notes that nusinersen has been recommended for reimbursement by the CADTH Canadian Drug Expert Committee and most children with SMA are receiving nusinersen as part of their treatment regimen. The clinicians noted that nusinersen is injected into the spinal fluid every 4 months after an initial 4 loading doses, which occur during the first 2 months of treatment. Additionally, the clinician group noted that this procedure is typically done under sedation at an experienced pediatric centre. NMD4C also noted that patients receiving nusinersen showed improvement in motor function, reducing the need for assisted ventilation, and greatly extending survival when compared to sham injection; it is considered to be a significant advancement in treating patients with SMA. However, while nusinersen has significantly changed the standard of care for children and youth with SMA, the clinicians note that this treatment Is not suitable for all patients with SMA. These include patients who have ever walked (any child with type III disease) who are excluded from reimbursement, additionally, in the clinical trials for nusinersen; not all patients with type I SMA and type II SMA responded to treatment. NMD4C added that the use of nusinersen in some patients is also limited by the invasive intrathecal route of administration and that this treatment is more challenging for patients who have severe scoliosis or who have undergone a spinal fusion. The clinicians added that there are a number of children who do not tolerate lumbar puncture procedures due to respiratory fragility or poor access to the spine, and some patients experience side effects from repeated lumbar punctures. Access was also noted as an issue since specialists and facilities who can administer the treatments are not universal and barriers such as long-distance travel exist.
NMD4C added that a very limited number of Canadian children have had access to onasemnogene abeparvovec (Zolgensma). The clinicians noted that onasemnogene abeparvovec is a 1-time IV infusion treatment for infants with SMA type I.
NMD4C added that for patients with early-onset SMA, preserving motor neurons, improving survival, improving motor function, delaying or alleviating the need for assisted ventilation, delaying or alleviating the loss of the ability to speak, and delaying other secondary complications (such as failure to thrive, scoliosis, recurrent pulmonary infections, and so forth), and reducing burden on caregivers are goals that new treatments would address. The clinicians noted that while the therapies discussed previously produce the missing SMN protein, there remains a need for more convenient and less invasive treatments for adults with SMA. Additionally, therapies that improve muscle functions are needed and would play a pivotal role in patient care.
The clinicians noted that for individuals with late-onset SMA, treatment goals are to maintain the current level of motor function (prevent further loss of motor function) and strength, achieve disease stabilization (prevent disease progression, including avoidance of need for ventilation), promote independence, and improve overall HRQoL.
NMD4C noted that risdiplam is important for SMA patients with contraindications for nusinersen or Zolgensma. The following unmet needs were discussed by NMD4C:
Risdiplam is an oral therapy. Oral therapy is required for children (< 18 years) who are unable to receive intrathecal nusinersen by simple lumbar puncture due to severe scoliosis or post-spinal fusion.
Adult SMA patients (≥ 18 years) have a high unmet need for treatment. The clinicians recognize that the evidence available is limited and suggest that provinces support the capture of outcomes data of SMA patients in the CNDR to address uncertainty for this population.
NMD4C clinicians noted that SMA patients have a very high burden of illness and health care resource use; having a choice in therapy that is based on strong evidence and matches their preferences and values should be the goal. Risdiplam was noted as an additional option to treat SMA.
Place in Therapy
NMD4C noted that an oral route of administration has advantages for both patients and caregivers as it does not require specialized procedures to administer treatment and allows patients to take the medication at home, ultimately avoiding frequent travel and reducing health care utilization costs. Additionally, the clinicians added that invasive procedures such as intrathecal injections carry risk and are not an option for all patients due to underlying scoliosis. NMD4C added that they expect risdiplam to be used as an option in the first-line treatment of early-onset type I SMA; however, the treatment could also be used in patients with previous exposure to SMN-splicing agents and could be used as a second-line treatment of patients who have not responded or progressed on first-line treatment such as nusinersen. Patients with later-onset SMA (type II and type III) and patients who are not eligible for nusinersen due to age or physical ability would be considered, though younger patients are expected to achieve the most benefit.
NMD4C noted that Zolgensma may become the preferred initial treatment for babies (under the age of 2 years) if it is approved and reimbursed in Canada. The clinicians added that this is because it is a single IV infusion, and that the systemic (IV) delivery route allows for wider CNS and peripheral tissue distribution, which is important for infants with type I SMA as high levels of SMN protein are required very early in life in peripheral tissues.
Due to the lack of head-to-head comparison, the clinicians noted that there is uncertainty about whether children with SMA would derive more benefit from nusinersen or from risdiplam. Additionally, the clinicians added that risdiplam may be preferred over nusinersen in circumstances where the intrathecal administration (of nusinersen) is not possible. Furthermore, the clinicians noted that risdiplam has an oral route of administration and allows for distribution of SMN protein in both the CNS and peripheral tissues, which may make it the preferred option for patients where stabilization of the disease would mean retention of a vital motor function, the avoidance of ventilator dependency, the continued ability to speak and swallow, and survival.
With respect to sequencing, NMD4C noted that risdiplam would potentially be first-line therapy for patients who are not eligible for Zolgensma or nusinersen as per the drug label or reimbursement criteria. The clinicians added that risdiplam may be preferred when patients cannot receive nusinersen for safety reasons such as scoliosis, allergies, or bleeding disorders, when children experience adverse effects to nusinersen, and where there is lack of access to nusinersen, based on patient preferences and in individuals who have antibodies to AAV9. Risdiplam can also be considered second-line therapy for patients where first-line treatment has been unsuccessful or worn off. The clinicians added that nusinersen has an intrathecal route of administration, which may limit its effects on the CNS because it may not distribute equally along the spinal cord. The clinicians added that it is hypothesized that nusinersen does not reach motor neurons in the upper spinal cord as effectively as motor neurons in the lower spinal cord (where the injection site is at the lumbar spine) and, therefore, bulbar functions such as swallowing are not adequately treated.
Patient Population
NMD4C noted that generally all 3 treatments (nusinersen, Zolgensma, and risdiplam) work best the younger the children are and the earlier the treatment begins. The clinicians added that patients benefiting the most from risdiplam are likely not different from those benefiting the most from nusinersen. The unmet need, according to the clinicians, is for children who cannot receive nusinersen, for reasons discussed earlier, and for adult patients.
NMD4C noted that for many adults living with SMA, the duration of the disease is associated with progressive losses of motor function, deterioration in health, and reduced independence. The clinicians noted that stabilization of the disease can lead to the retention of vital motor function(s), the avoidance of ventilator dependency, the continued ability to speak and swallow, and survival.
NMD4C noted that patients can be identified before initiating treatment through genetic testing and confirmed by the absence of normal copies of the SMN1 gene. The clinicians added that a major disease modifier is the number of SMN2 gene copies, where fewer copies are associated with earlier-onset and more severe SMA. The clinicians also added that identifying infants through newborn screening will allow for maximal therapeutic benefit through the administration of treatment pre-symptomatically.
The clinicians noted that children and adults with SMA are typically followed and managed by specialized clinical teams, and genetic testing to confirm diagnosis and SMN2 gene copies can be obtained if not already available. They added that patients with the “SMA 0” form of 5q SMA are unlikely to benefit and patients with other genetic types of SMA, unrelated to SMN deficiency, are also unlikely to benefit.
NMD4C added that patients with fewer copies of the SMN2 gene would be associated with earlier-onset and more severe SMA. The clinicians added that most patients will benefit from the drug, possibly apart from severely affected cases who are on permanent ventilation. In general, the youngest patients would benefit more.
The clinicians added that children who have been identified through newborn screening and treated with Zolgensma or nusinersen in the pre-symptomatic stage may show normal development, in which case they may not require treatment with risdiplam.
Assessing Response to Treatment
NMD4C noted that outcome tests vary according to age and functional state. The clinicians added that tests may include lung function (FVC), RULM, and 6MWT. NMD4C added that in small children, there are tests that have different sensitivity for the achievement of motor milestones. The Revised Hammersmith Scale was noted as a scale specifically designed for outcome measures for people affected by SMA; however, that scale might lack sensitivity and has a “floor effect,” which may make the 32-item MFM-32 a preferred measure for younger individuals aged 2 years to 5 years. The clinicians noted that MFM-32 may also be preferred in non-ambulant individuals with type II SMA or type III SMA, aged 2 years to 25 years. In Canada, the clinicians noted that the Revised Hammersmith Scale is widely used and accepted as the tool to measure motor function. The group added that in small children, tests will also vary based on whether they achieve motor milestones. All these measures require trained practitioners and would be considered outside the bounds of a traditional clinic visit.
When assessing outcomes, clinician experts generally agree that patient-reported outcome instruments may be useful, although there are no internationally validated and agreed-upon patient-reported outcome instruments to date and data are being developed to inform the selection of such a measure.
NMD4C added that in 2020, Canadian experts in adults with SMA carried out a modified Delphi process exercise to determine a consensus-based recommendation for outcome measures that can be used in adults with SMA at different functional stages.
A clinically meaningful response, as per the clinicians who provided input, would be the achievement of motor milestones, ventilation-free survival, and the improvement or stabilization of motor function in children. For adults, the clinicians noted the stabilization of motor and respiratory function, less disability with the maintenance of independence, and fewer hospitalizations would be considered a clinically meaningful response. The clinicians added that maintaining the ability to speak and avoiding the need for ventilation support have profound effects on a patient’s quality of life, autonomy, and ability to maintain vocational and social roles.
The clinicians noted that with new therapies for SMA introduced to clinical practice, it is important to monitor effectiveness and collect evidence to help determine which treatment option is best suited for each patient. They also noted that quantitative outcome measures require specially trained practitioners, are time consuming, and are not currently covered with provincial and territorial funding programs.
NMD4C provided excerpts from a letter to the provincial government outlining its concerns and recommendations for an alternative timeline for outcome measurements in patients receiving SMA therapies. These recommendations are noted as follows.
Frequency of Monitoring
The natural history of SMA is a slowly progressive functional decline. Patients’ function decreases by a statistically significant amount in a matter of years, not months. As such, any decline in outcome measure scores in the span of months is more likely to be due to inter- or intra-examiner variability (i.e., the normal statistical range of error) or variability in patient effort (i.e., SMA patients having off days and good days just like anyone else) than due to a true effect of the therapy. This potential artificial decline in outcome measure scores could lead to inappropriate termination of therapy provision.
Human Resource Strain and Patient Burden
Motor outcome assessments are time consuming and personnel-intensive, requiring significant time from physical therapists and/or respiratory therapists with specialized training. As such, there are ethical concerns around mandating that these scarce resources be used to provide frequent monitoring for largely stable patients for whom such frequent monitoring is not clinically relevant or evidence-based. Frequent clinic visits can also be fatiguing, time consuming, and costly for patients.
Collection of Real-World Evidence and Proposition for Appropriate Monitoring
The CNDR has a clear plan to assess the effectiveness of novel therapies in a broad population. The CNDR’s SMA working group of expert investigators has evaluated specific outcome assessments by way of a Delphi model to determine best practices (a manuscript is in preparation). They recently agreed that the best timing for outcome measurements is at baseline, 6 months later, then annually thereafter. This timing is appropriate for clinical monitoring, congruent with available evidence in treated adults, and does not put undue burden on provincial and territorial clinical resources or on patients and families.
Discontinuing Treatment
NMD4C notes that factors to consider when deciding to discontinue treatment (and switch to other SMN-splicing modulating treatments) include accelerated deterioration in clinical status while on risdiplam for 12 months, allergic reaction and critical SAEs, and patients with primary retinal disease who may need special protocol and/or assessments. The clinicians noted that a variety of biomarkers are being investigated that may help to predict the variability of response to treatment and may allow for a more individualized treatment pathway.
Prescribing Conditions
NMD4C noted that risdiplam would offer the convenience of oral administration, which can take place at home. The clinicians added that it may also be appropriate when a patient cannot receive nusinersen for safety reasons, when children experience adverse effects to nusinersen, when there is no access to nusinersen within a given jurisdiction, and based on patient preferences, as well as when individuals have contraindications to receiving Zolgensma, such as antibodies for AAV9.
NMD4C noted that neurologists, pediatric neurologists, and physiatrists would be needed to diagnose, treat, and monitor patients who might receive risdiplam.
Additional Considerations
NMD4C added that in Canada, the CNDR has recruited 4,000 patients with various neuromuscular diseases since its launch in 2010. The registry will be further developed to capture information that is useful for the diseases in question and will continue to support academic- and industry-led research, including quality of life, burden of illness, and preference studies.
Drug Program Input
The drug programs provide input on each drug being reviewed through CADTH’s reimbursement review processes by identifying issues that may impact their ability to implement a recommendation. The implementation questions and corresponding responses from the clinical experts consulted by CADTH are summarized in Table 4.
Table 4: Summary of Drug Plan Input and Clinical Expert Response
Drug program implementation questions | Clinical expert response |
|---|---|
What have been, if any, the clinical experiences so far with concomitant use of disease-modifying therapies for SMA? | So far, there has been no direct Canadian experience that the clinical experts are aware of regarding the concomitant use of several disease-modifying therapies. One of the clinical experts pointed to the existence of a number of case reports, but there is no sufficient evidence to support a rationale for concomitant use. |
What are the clinically relevant factors that would determine which disease-modifying therapy is administered? | With the availability of onasemnogene abeparvovec, most patients who would be eligible for onasemnogene abeparvovec are likely to be treated with it, unless contraindications or high titres of anti-AAV9 antibodies exist. In patient populations that may not have access to onasemnogene abeparvovec, reimbursement eligibility will be a major factor. Should the patient have access to nusinersen and risdiplam, it is likely that the oral route of risdiplam administration would be preferable over the intrathecal route of nusinersen to eliminate potential adverse events associated with the lumbar puncture and overcome some of the administration challenges in patients with scoliosis or contractures. |
What are the clinically relevant factors that would lead a clinician to determine that the treatment with risdiplam was ineffective? | Assessment of the clinical progress of patients will depend on the age of the patient, the stage of the disease, and the baseline preserved motor function. Ideally, treatment for pre-symptomatic infants should allow infants to gain and develop new motor milestones on par with normal child development. Patients who might have lost or failed to acquire certain motor functions (e.g., those with SMA type II) would benefit from preventing further deterioration of remaining motor functions. |
Where treatment is determined as ineffective, would a higher dose of risdiplam than indicated be attempted? | It is unlikely that a higher dose than prescribed would be attempted. There is no evidence that such an approach would be helpful. Ineffective treatment is likely a result of an advanced disease state rather than the failure of therapy, assuming that delivery of the treatment was reliable. |
AAV9 = adeno-associated virus 9; SMA = spinal muscular atrophy.
Clinical Evidence
The clinical evidence included in the review of risdiplam is presented in 3 sections. The first section, the systematic review, includes pivotal studies provided in the sponsor’s submission to CADTH and Health Canada, as well as those studies that were selected according to an a priori protocol. The second section includes indirect evidence from the sponsor and indirect evidence selected from the literature that met the selection criteria specified in the review. The third section includes sponsor-submitted long-term extension studies and additional relevant studies that were considered to address important gaps in the evidence included in the systematic review.
Systematic Review (Pivotal and Protocol-Selected Studies)
Objectives
To perform a systematic review of the beneficial and harmful effects of risdiplam for the treatment of SMA, administered once daily as an oral solution at a dose of 0.20 mg/kg for patients 2 months of age and up to 2 years, 0.25 mg/kg for patients 2 years of age or older who weigh less than 20 kg, and 5 mg for patients 2 years of age or older who weigh 20 kg or more
Methods
Studies selected for inclusion in the systematic review include pivotal studies provided in the sponsor’s submission to CADTH and Health Canada, as well as those meeting the selection criteria presented in Table 5. Outcomes included in the CADTH review protocol reflect outcomes considered to be important to patients, clinicians, and drug plans.
Table 5: Inclusion Criteria for the Systematic Review
Criteria | Description |
|---|---|
Population | Subgroups of patients with SMA:
|
Intervention | Once daily risdiplam oral solution, given at the following dose:
|
Comparator |
|
Outcomes | Efficacy outcomes
Harms outcomes
|
Study designs | Published and unpublished phase III and phase IV RCTs |
RCT = randomized controlled trial; SMA = spinal muscular atrophy; SMN2 = survival of motor neuron 2.
Note: The systematic review protocol presented as follows was established before the granting of a Notice of Compliance from Health Canada.
aThese outcomes were identified as being of particular importance to patients in the input received by CADTH from patient groups.
The literature search was performed by an information specialist using a peer-reviewed search strategy. The literature search for clinical studies was performed by an information specialist using a peer-reviewed search strategy according to the PRESS Peer Review of Electronic Search Strategies checklist.27
Published literature was identified by searching the following bibliographic databases: MEDLINE All (1946‒) via Ovid and Embase (1974‒) via Ovid. The search strategy comprised both controlled vocabulary, such as the US National Library of Medicine’s MeSH (Medical Subject Headings), and keywords. The main search concepts were Evrysdi (risdiplam). Clinical trials registries were searched: the US National Institutes of Health’s clinicaltrials.gov, the WHO’s International Clinical Trials Registry Platform (ICTRP) search portal, Health Canada’s Clinical Trials Database, and the European Union Clinical Trials Register.
No filters were applied to limit the retrieval by study type. Retrieval was not limited by publication date or by language. Conference abstracts were excluded from the search results. See Appendix 1 for the detailed search strategies.
The initial search was completed on December 17, 2020. Regular alerts updated the search until the meeting of the CADTH Canadian Drug Expert Committee was held on April 21, 2021.
Grey literature (literature that is not commercially published) was identified by searching relevant websites from the Grey Matters: A Practical Tool For Searching Health-Related Grey Literature checklist.28 Included in this search were the websites of regulatory agencies (the FDA and EMA). Google was used to search for additional internet-based materials. See Appendix 1 for more information on the grey literature search strategy.
These searches were supplemented by reviewing bibliographies of key papers and through contacts with appropriate experts. In addition, the manufacturer of the drug was provided information regarding unpublished studies.
Two CADTH clinical reviewers independently selected studies for inclusion in the review based on titles and abstracts, according to the predetermined protocol. Full-text articles of all citations considered potentially relevant by at least 1 reviewer were acquired. Reviewers independently made the final selection of studies to be included in the review, and differences were resolved through discussion.
In addition, a focused literature search for NMAs dealing with SMA was run in MEDLINE All (1946‒) and Embase (1974‒) on December 17, 2020. No limits were applied to the search.
Findings From the Literature
Two studies were included in the systematic review (Figure 3). The included studies are summarized in Table 6. A list of excluded studies is presented in Appendix 2.
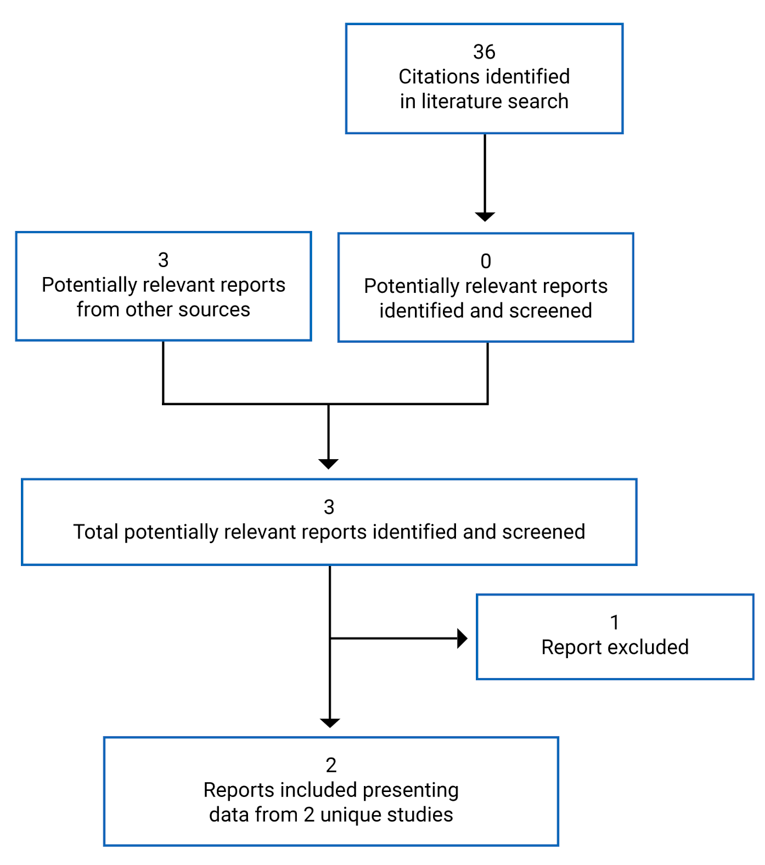
Table 6: Details of Included Studies
Detail | FIREFISHa | SUNFISHa |
|---|---|---|
Designs and populations | ||
Study design | A non-randomized, single-arm, open-label, 2-part seamless phase II and phase III, multi-centre triala | A randomized, double-blind, placebo-controlled, 2-part seamless phase II and phase III, multi-centre triala |
Locations | Belgium, Brazil, China, Croatia, France, Italy, Japan, Poland, Russia, Saudi Arabia, Serbia, Spain, Switzerland, Turkey, Ukraine, and the US | Belgium, Brazil, Canada, China, Croatia, France, Germany, Italy, Japan, Poland, Russia, Serbia, Spain, Turkey, and the US |
Patient enrolment dates |
|
|
Enrolled (N) | 41 | 180 |
Inclusion criteria |
|
|
Inclusion criteria (continued) |
|
|
Exclusion criteria |
|
|
Exclusion criteria (continued) |
| |
Drugs | ||
Intervention | Risdiplam, oral, once daily, at the following doses:
| Risdiplam, oral, once daily, at the following doses:
|
Comparator(s) | None (single-arm study) | Placebo |
Duration | ||
Phase | ||
Screening | 30 days | 30 days |
Active treatment | 24 months |
|
Open-label extension | Until commercial availability of risdiplam | A minimum of 3 years that continues until commercial availability of risdiplam |
Outcomes | ||
Primary end point | Proportion of infants who were sitting without support after 12 months of treatment. Sitting was defined as “sits without support for at least 5 seconds” as assessed in item 22 of the BSID-III gross motor scale. | Change from baseline in the total MFM-32 score at month 12 |
Secondary and exploratory end points | Secondary
| Secondary
|
Secondary and exploratory end points (continued) |
Exploratory
|
|
Secondary and exploratory end points (continued) |
| |
Notes | ||
Publicationsb | None | None |
AE = adverse event; BSID-III = Bayley Scales of Infant and Toddler Development, Third Edition; CGI-C = Clinical Global Impression–Change; CHOP INTEND = Children’s Hospital of Philadelphia Infant Test of Neuromuscular Disorders; CI = confidence interval; CMAP = compound muscle action potential; CYP3A = cytochrome P450, family 3, subfamily A; CYP3A4 = cytochrome P450, family 3, subfamily A, member 4; ECG = electrocardiogram; FEV1 = forced expiratory volume in 1 second; FMO = flavin monooxygenase; FVC = forced vital capacity; HFMSE = Hammersmith Functional Motor Scale Expanded; HINE Section 2 = Hammersmith Infant Neurological Examination–Section 2; ITQOL-SF47 = Infant Toddler Quality of Life Questionnaire–47-item Short Form; MATE = multidrug and toxin extrusion; MEP = maximal expiratory pressure; MFM = Motor Function Measure; MFM-32 = Motor Function Measure–32 items; MIP = maximal inspiratory pressure; OCT-2 = organic cation transporter-2; PCF = peak cough flow; RULM = Revised Upper Limb Module; SMAIS = Spinal Muscular Atrophy Independence Scale; SNIP = sniff nasal inspiratory pressure.
aOnly information pertaining to Part 2 (confirmatory, phase III) is presented here. Part 1 (dose finding, phase II) is summarized in the Other Relevant Evidence section.
bNo publications at the time of completing this review report.
Source: Drug Reimbursement Review sponsor submission.14
Description of Studies
One single-arm uncontrolled trial (FIREFISH) and 1 randomized controlled trial (SUNFISH) were included in this CADTH reimbursement review.
FIREFISH (also known as Study BP39056) is an ongoing, open-label, single-arm, clinical trial to investigate the safety, tolerability, PK, PD, and efficacy of risdiplam in patients with type I SMA. The study was performed at sites in various countries internationally but did not include sites in Canada. FIREFISH was conducted in 2 parts: a phase II exploratory dose-finding part (Part 1) and a phase III confirmatory part (Part 2). Enrolment for Part 1 started on September 23, 2016. Upon establishing the therapeutic dose, the first patient in Part 2 was enrolled on March 13, 2018. SUNFISH (also known as Study BP39055) is an ongoing, randomized, double-blind, placebo-controlled trial to investigate the efficacy, safety, tolerability, PK, and PD of risdiplam in pediatric and adult patients with type II SMA and type III SMA. The study was performed at sites in various countries internationally, including Canada.
In a similar manner to FIREFISH, SUNFISH was conducted in 2 parts: a phase II exploratory dose-finding part (Part 1) and a phase III confirmatory part (Part 2). Enrolment for Part 1 started on October 19, 2016. Upon establishing the therapeutic dose, the first patient in Part 2 was enrolled on October 9, 2017. The 2 parts ran separately and no patients from Part 1 were moved to Part 2. Considering the confirmatory phase III nature of Part 2 and the dose-finding phase II nature of Part 1, only details and results of Part 2 are presented in this section, while a summary of Part 1 is presented in the Other Relevant Evidence section.
FIREFISH Part 2 is an ongoing single-arm study that aimed to assess the efficacy of risdiplam (dose based on age) on patients with infantile-onset SMA aged between 28 days and 3 months with 2 copies of the SMN2 gene. The study used the term “type I SMA” to indicate the diagnosis of the included patients. Patients were treatment-naive, with no invasive ventilation and an arterial oxygen saturation level greater than 94%. The study’s primary outcome was to assess the proportion of infants who are able to achieve the motor milestone of sitting independently for 5 seconds after 12 months of treatment. The study duration is 24 months.
SUNFISH Part 2 is an ongoing, randomized, double-blind, placebo-controlled trial for a 12-month period, followed by a second 12-month period where patients receiving placebo switched to risdiplam in a blinded manner and all patients continued risdiplam until month 24. SUNFISH Part 2 aimed to assess the efficacy of risdiplam compared to placebo over a 12-month treatment period, and to report on the overall efficacy and safety of risdiplam over a 24-month treatment period. Risdiplam was administered orally at a dose of 5 mg once daily for patients with body weight of 20 kg or over and 0.25 mg/kg once daily for patients with body weight less than 20 kg. Matching oral placebo was administered once daily. SUNFISH Part 2 studied the effect of risdiplam in patients aged 2 years to 25 years diagnosed with SMA type II and non-ambulatory patients diagnosed with SMA type III. Patients were randomized on a 2:1 ratio to risdiplam and placebo, respectively, using an interactive response system. Randomization was stratified by age groups (2 years to 5 years, 6 years to 11 years, 12 years to 17 years, and 18 years to 25 years). The study’s primary outcome was to assess the change from baseline in the total score of the MFM-32 at 12 months of treatment. The study duration is 24 months.
Populations
Inclusion and Exclusion Criteria
FIREFISH Part 2 aimed to enrol patients with SMA who have the highest medical need and who would benefit the most from early initiation of risdiplam. This translated into patients who were aged 1 month to 7 months diagnosed with what the sponsor described as type I SMA. This was defined in FIREFISH Part 2 as patients with homozygous or heterozygous deletion or point mutation in the SMN1 gene, showing signs and symptoms attributed to type I SMA, and having 2 SMN2 gene copies. In addition, patients in FIREFISH Part 2 had to be treatment-naive with a relatively normal respiratory function. Specifically, patients who required invasive ventilation were excluded along with patients with awake hypoxemia (oxygen saturation < 95%) regardless of ventilation use. Further exclusion criteria were placed that would exclude patients with potential concomitant conditions or therapeutic uses that, in the opinion of the sponsor, would have interfered with an unbiased assessment of the effects of risdiplam.
SUNFISH Part 2 aimed to include all non-ambulatory patients between the ages of 2 years and 25 years who were diagnosed with SMA type II or SMA type III. Patients had to have a minimum motor function requirement, including a RULM item A of 2 or more and the ability to sit independently. Patients were never to have had a disease-modifying therapy, were not to have been hospitalized in the 2 months before screening due to a pulmonary event, and were not to have had a tracheostomy. Further exclusion criteria were placed that would exclude patients with major illnesses within 1 month, unstable physiology, and a history of ophthalmic diseases as determined by the investigator.
Baseline Characteristics
A total of 41 patients were enrolled in FIREFISH Part 2 and were given risdiplam. These patients had an average age of 5.2 (SD = 1.47) months; 53.7% were females and 53.7% were White. All of the included patients had 2 SMN2 gene copies and the onset of symptoms was reported at a mean age of 1.64 (SD = 0.70) months. Average disease duration in FIREFISH Part 2 was reported at 3.59 (SD = 1.35) months. At baseline, |||| of the patients were able to control their head upright, while |||| did not demonstrate any motor milestone achievement. Of the enrolled patients, 70.7% did not require respiratory support while the rest may have used a non-invasive respiratory support for less than 16 hours per day. Ability to swallow was demonstrated in 97.6% of the enrolled patients at baseline. A summary of baseline characteristics of FIREFISH Part 2 is presented in Table 7.
In SUNFISH Part 2, 120 patients were randomized to risdiplam and 60 patients to placebo. The mean age of enrolled patients was 9.9 (SD = 5.8) years in the risdiplam group and 10.3 (SD = 6.1) years in the placebo group. Patients belonging to the age group of 18 years to 25 years formed the smallest age group (11.7% in risdiplam, 13.3% in placebo), followed by the age group of 12 years to 17 years (25.0% in risdiplam, 26.7% in placebo). There were similar proportions of patients in the 2 youngest age groups: 32.5% and 30.0% were in the risdiplam and placebo arms of the 6 years to 11 years age group, respectively, and 30.8% and 30.0% were in the risdiplam and placebo arms of the 2 years to 5 years age group, respectively. Most patients had 3 SMN2 gene copies (89.2% in risdiplam, 83.3% in placebo), while more than two-thirds were diagnosed as having SMA type II (70.0% in risdiplam, 73.3% in placebo). At baseline, |||| were able to stand in the risdiplam arm and |||| in the placebo arm. Discrepancies in the baseline characteristics can be observed in the proportion of patients with 3 SMN2 copies (89.2% in the risdiplam arm and 83.3% in the placebo arm), and in the |||||||||||||||||||||||||||||||||| |||||| ||||||||||||||||||||||||||||||||||||||||||||||||||||||||||||||||||||||||||||||||||||||||||||||||||||||||||||||||||||||||||||||. A summary of baseline characteristics of SUNFISH Part 2 is presented in Table 8.
Table 7: Summary of Baseline Characteristics — FIREFISH Part 2
Characteristic | FIREFISH Part 2 (N = 41) |
|---|---|
Demographics | |
Age at enrolment (months) | |
Mean (SD) | 5.20 (1.47) |
Median (range) | 5.32 (2.2 to 6.9) |
Gender, n (%) | |
Female, n (%) | 22 (53.7) |
Race, n (%) | |
White | 22 (53.7) |
Asian | 14 (34.1) |
Unknown | 5 (12.2) |
Weight-for-age (WHO Child Growth Standards) | |
≤ 50th percentile, n (%) | 29 (70.7) |
≤ 10th percentile, n (%) | 15 (36.6) |
Median percentile (range) | 24.0 (0.2 to 99.0) |
Length/height-for-age | |
> 50th percentile, n (%) | 26 (63.4) |
Median percentile (range) | 66.2 (0.3 to 100) |
Head circumference for age | |
> 50th percentile, n (%) | 20 (48.8) |
≤ 50th percentile, n (%) | 21 (51.2) |
Median percentile (range) | 47.3 (0.6 to 99.8) |
Disease characteristics | |
SMN2 copy number, n (%) | |
1 | 0 |
2 | 41 (100) |
3 | 0 |
Age at symptom onset (months) | |
Mean (SD) | 1.64 (0.70) |
Median (range) | 1.45 (1.0 to 3.0) |
Age at diagnosis (months) | |
Mean (SD) | 2.81 (1.38) |
Median (range) | 2.79 (0.9 to 6.1) |
Disease duration (months) | |
Mean (SD) | 3.59 (1.35) |
Median (range) | 3.38 (1.0 to 6.0) |
CHOP INTEND score | |
Mean (SD) | 21.71 (7.10) |
Median (range) | 22.00 (8.0 to 37.0) |
HINE Section 2 score | |
Mean (SD) | 0.93 (1.08) |
Median (range) | 1.0 (0.0 to 5.0) |
Highest motor function achieved, n (%) | |
Controls head upright | ||| |
Kicking horizontally | ||| |
Kicking vertically | ||| |
No appropriate function listed | ||| |
Respiratory support, n (%) | |
No pulmonary care | 29 (70.7) |
BiPAP support < 16 hours per day | 10 (24.4) |
BiPAP support ≥ 16 hours per day | 0 |
Cough assist: Used daily for therapy, not illness related | 3 (7.3) |
Cough assist: Used with an illness | 1 (2.4) |
Able to swallow, n (%) | |
Yes | 40 (97.6) |
No | 1 (2.4) |
BiPAP = bilevel positive airway pressure; CHOP INTEND = Children’s Hospital of Philadelphia Infant Test of Neuromuscular Disorders; HINE Section 2 = Hammersmith Infant Neurological Examination–Section 2; SD = standard deviation; SMN2 = survival of motor neuron 2.
Source: Drug Reimbursement Review sponsor submission.14
Table 8: Summary of Baseline Characteristics — SUNFISH Part 2
Characteristic | SUNFISH (N = 180) | |
|---|---|---|
Risdiplam (n = 120) | Placebo (n = 60) | |
Demographics | ||
Age at screening (years) | ||
Mean (SD) | 9.9 (5.8) | 10.3 (6.1) |
Median (range) | 9.0 (2 to 25) | 9.0 (2 to 24) |
Age group (years), n (%) | ||
2 to < 6 | 37 (30.8) | 18 (30.0) |
6 to 11 | 39 (32.5) | 18 (30.0) |
12 to 17 | 30 (25.0) | 16 (26.7) |
18 to 25 | 14 (11.7) | 8 (13.3) |
Gender, n (%) | ||
Female | 61 (50.8) | 30 (50.0) |
Race, n (%) | ||
Asian | 23 (19.2) | 12 (20.0) |
Black or African American | 2 (1.7) | 0 |
White | 80 (66.7) | 41 (68.3) |
Multiple | 1 (0.8) | 0 |
Unknown | 14 (11.7) | 7 (11.7) |
Disease characteristics | ||
SMN2 copy number, n (%) | ||
1 | 0 | 0 |
2 | 3 (2.5) | 1 (1.7) |
3 | 107 (89.2) | 50 (83.3) |
4 | 10 (8.3) | 8 (13.3) |
Unknown | 0 | 1 (1.7) |
SMA type, n (%) | ||
Type II | 84 (70.0) | 44 (73.3) |
Type III | 36 (30.0) | 16 (26.7) |
Age at symptom onset (months) | ||
Mean (SD) | 14.1 (8.4) | 18.5 (21.1) |
Median (range) | 12.3 (0 to 57) | 12.8 (6 to 135) |
Time between onset for initial SMA symptoms to first treatment (months) | ||
Mean (SD) | 111.3 (67.1) | 111.3 (70.2) |
Median (range) | 106.6 (17 to 275) | 96.6 (1 to 271) |
Ability to stand, n (%) | ||
Standing, | ||| | ||| |
Could not stand | ||| | ||| |
Ability to walk, n (%) | ||
Walking | ||| | ||| |
Could not walk | ||| | ||| |
Number of fractures, n (%) | ||
None | ||| | ||| |
1 to 2 | ||| | ||| |
3 to 5 | ||| | ||| |
Scoliosis, n (%) | ||
Yes | 76 (63.3) | 44 (73.3) |
No | 44 (36.7) | 16 (26.7) |
Surgery for scoliosis before screening, n (%) | ||
Yes | 29 (24.2) | 17 (28.3) |
No | 63 (52.5) | 33 (55.0) |
Unknown | 28 (23.3) | 10 (16.7) |
MFM-32 total score | ||
Number of patients with a valid MFM-32 observation at baseline, n | 115 | 59 |
Mean (SD) | 45.48 (12.09) | 47.35 (10.12) |
Median (range) | |||||| | |||||| |
Age group (years), median (range) | ||
2 to 5 | ||| | ||| |
6 to 11 | ||| | ||| |
12 to 17 | ||| | ||| |
18 to 25 | ||| | ||| |
RULM total score | ||
Number of patients with a valid RULM observation at baseline, n | 119 | 58 |
Mean (SD) | 19.65 (7.22) | 20.91 (6.41) |
Median (range) | |||| | || |
Age group (years), median (range) | ||
2 to 5 | |||| | || |
6 to 11 | |||| | || |
12 to 17 | |||| | || |
18 to 25 | |||| | || |
HFMSE total score | ||
Number of patients with a valid HFMSE observation at baseline, n | 120 | 60 |
Mean (SD) | 16.10 (12.46) | 16.62 (12.09) |
Median (range) | |||| | || |
Age group (years), median (range) | ||
2 to 5 | |||| | || |
6 to 11 | |||| | || |
12 to 17 | |||| | || |
18 to 25 | |||| | || |
HFMSE = Hammersmith Functional Motor Scale Expanded; max. = maximum; MFM-32 = Motor Function Measure–32 items; min. = minimum; RULM = Revised Upper Limb Module; SD = standard deviation; SMA = spinal muscular atrophy; SMN2 = survival motor of neuron 2.
Source: Drug Reimbursement Review sponsor submission.14
Interventions
FIREFISH Part 2
Patients enrolled in FIREFISH Part 2 were given risdiplam orally once daily. The dose was determined based on the age of the patient as follows:
infants older than 1 month old and younger than 3 months old at enrolment: 0.04 mg/kg
infants 3 months old or older and younger than 5 months old at enrolment: 0.08 mg/kg
infants 5 months old or older at enrolment: 0.2 mg/kg.
The dose was determined at the age of enrolment and did not change automatically once a patient reached 3 months or 5 months of age, with the exception of cases where a change of dose is requested by the clinical pharmacologist upon review of the PK and safety data. The PK was monitored every 2 weeks to ensure patients stayed within the targeted exposure range of a mean area under the curve from 0 hours to 24 hours at steady state (AUC0-24,ss) of 2,000 ng*hour/mL or less.
Permitted concomitant therapy included any stable regimen therapy for a chronic condition (initiated 6 weeks before enrolment) or therapies to provide symptomatic treatment, with the exception of the following explicitly prohibited medications:
any inhibitor of cytochrome P450, family 3, subfamily A, member 4 (CYP3A4), including, but not limited to, ketoconazole, miconazole, itraconazole, fluconazole, erythromycin, clarithromycin, ranitidine, cimetidine
any inducer of CYP3A4, including, but not limited to, rifampicin, rifabutin, glucocorticoids, carbamazepine, phenytoin, phenobarbital, St. John’s wort
any organic cation transporter-2 (OCT-2) and multidrug and toxin extrusion (MATE) substrates, including, but not limited to, amantadine, cimetidine, memantine, amiloride, famotidine, metformin, pindolol, ranitidine, procainamide, varenicline, acyclovir, ganciclovir, oxaliplatin, cephalexin, cephradine, fexofenadine
any known FMO1 or FMO3 inhibitors or substrates
any medication with known phototoxicity and retinal toxicity liabilities.
SUNFISH Part 2
Patients randomized to the risdiplam arm in SUNFISH Part 2 were given risdiplam orally once daily. The dose was determined based on the weight of the patient as follows:
5 mg once daily for patients with body weight of 20 kg or more
0.25 mg/kg once daily for patients with body weight of less than 20 kg.
Patients who started on the 0.25 mg/kg dose were adjusted according to their weight at the next study visit, if required. The treatment was to be discontinued in cases of pregnancy, lack of compliance with study requirements, in cases of ophthalmic AEs, in cases of significant elevation of alanine transaminase or aspartate transaminase (> 3x upper limit) that is associated with a twofold increase in bilirubin, and other SAEs that suggest dosing should be halted.
Permitted concomitant therapy included any stable regimen therapy (initiated 6 weeks before enrolment) for a chronic condition or therapies to provide symptomatic treatment, with the exception of the following explicitly prohibited medications:
any medication that was part of the exclusion criteria of the study (e.g., nusinersen)
any OCT-2 and MATE substrates (e.g., amantadine, cimetidine, memantine, amiloride, famotidine, metformin, pindolol, ranitidine, procainamide, varenicline, acyclovir, ganciclovir, oxaliplatin, cephalexin, cephradine, fexofenadine)
deferoxamine, topiramate, latanoprost, niacin, rosiglitazone, tamoxifen, canthaxanthin, sildenafil, interferon or any other drugs known to cause retinal toxicity, including the chronic use of minocycline.
Outcomes
A list of efficacy end points identified in the CADTH review protocol that were assessed in the clinical trials included in this review is provided in Table 9. These end points are further summarized as follows. A detailed discussion and critical appraisal of the outcome measures is provided in Appendix 3.
Table 9: Summary of Outcomes of Interest Identified in the CADTH Review Protocol
Outcome measure | End point type |
|---|---|
FIREFISH | |
Proportion of patients sitting without support for 5 seconds (item 22 of BSID-III) at month 12 | Primary end point |
Proportion of patients who achieve a score of 40 or higher in the CHOP INTEND at month 12 | Secondary end point: first secondary outcome in the hierarchical testing approach |
Proportion of patients who achieve an increase of at least 4 points in their CHOP INTEND score from baseline at month 12 | Secondary end point: second secondary outcome in the hierarchical testing approach |
Proportion of patients who achieve head control as assessed by item 12 of the CHOP INTEND | Secondary end point |
Proportion of motor milestone responders as assessed by the HINE Section 2 at month 12 | Secondary end point: third secondary outcome in the hierarchical testing approach |
Proportion of patients able to support weight or stand with support as assessed by the HINE Section 2 at month 12 | Secondary end point |
Proportion of patients able to bounce while assessing the walking item of the HINE Section 2 at month 12 | Secondary end point |
Proportion of patients sitting without support for 30 seconds (item 26 of BSID-III) at month 12 | Secondary end point |
Proportion of patients sitting without support for 30 seconds (item 26 of BSID-III) at month 24 | Secondary end point: fifth secondary outcome in the hierarchical testing approach |
Proportion of patients standing (item 40 of BSID-III) at month 24 | Secondary end point: sixth secondary outcome in the hierarchical testing approach |
Proportion of patients walking (item 42 of BSID-III) at month 24 | Secondary end point: seventh secondary outcome in the hierarchical testing approach |
Mean change in BSID-III score from baseline | Secondary end point |
Proportion of patients alive without permanent ventilation at month 12 | Secondary end point: fourth secondary outcome in the hierarchical testing approach |
Proportion of patients alive at month 12 | Secondary end point |
Proportion of patients with the ability to feed orally at month 12 | Secondary end point |
Time to death | Secondary end point |
Time to permanent ventilation | Secondary end point |
Proportion of patients receiving respiratory support at month 12 | Secondary end point |
Proportion of patients with the ability to feed orally at month 12 | Secondary end point |
Number of hospitalizations per patient-year at month 12 | Exploratory end point |
Proportion of patients with no hospitalizations at month 12 | Exploratory end point |
Change from baseline in the ITQOL-SF47 Questionnaire domains and single-item scores at Month 12 | Exploratory end point |
SUNFISH | |
Mean change from baseline in MFM-32 score at month 12 | Primary end point: Family 1 in the hierarchical testing approach |
Proportion of patients with a change from a baseline MFM-32 total score of 3 or more at month 12 | Secondary end point: Family 2 in the hierarchical testing approach |
Proportion of patients who achieve stabilization or improvement (i.e., a change from baseline ≥ 0) on the total MFM score at month 12 | Secondary end point |
Proportion of patients who achieve an improvement of at least 1 standard error of measurement (calculated at baseline) on the total MFM score at month 12 | Secondary end point |
Mean change from baseline in each of the MFM domain scores of D1, D2, and D3, and the total combined score of (D1 + D2) and D2 + D3 at month 12 | Secondary end point |
Mean change from baseline in the total score of the RULM at month 12 | Secondary end point: Family 3 in the hierarchical testing approach |
Proportion of patients who achieve stabilization or improvement (i.e., a change from baseline ≥ 0) on the total RULM score at month 12 | Secondary end point |
Proportion of patients with a change from baseline RULM total score of 2 or more at month 12 | Secondary end point |
Mean change from baseline in total score of the HFMSE at month 12 | Secondary end point: Family 4 in the hierarchical testing approach |
Proportion of patients who achieve stabilization or improvement (i.e., a change from baseline ≥ 0) on the total HFMSE score at month 12 | Secondary end point |
Proportion of patients with a change from a baseline HFMSE total score of 2 or more at month 12 | Secondary end point |
Mean change from baseline in FEV1 at month 12 | Secondary end point |
Mean change from baseline in FVC at month 12 | Secondary end point: Family 4 in the hierarchical testing approach |
Mean change from baseline in caregiver-reported SMAIS total score at month 12 | Secondary end point: Family 5 in the hierarchical testing approach |
Proportion of individuals rated as “improved” on the CGI-C at month 12 | Secondary end point: Family 6 in the hierarchical testing approach |
BSID-III = Bayley Scales of Infant and Toddler Development, Third Edition; CHOP INTEND = Children’s Hospital of Philadelphia Infant Test of Neuromuscular Disorders; CGI-C = Clinical Global Impression–Change; D = domain; FEV1 = forced expiratory volume in 1 second; FVC = forced vital capacity; HINE Section 2 = Hammersmith Infant Neurological Examination–Section 2; HFMSE = Hammersmith Functional Motor Scale Expanded; ITQOL-SF47 = Infant Toddler Quality of Life Questionnaire–47-item Short Form; MFM = Motor Function Measure; MFM-32 = Motor Function Measure–32 items; RULM = Revised Upper Limb Module; SMAIS = Spinal Muscular Atrophy Independence Scale.
Source: Drug Reimbursement Review sponsor submission.14
FIREFISH Part 2
Sitting Without Support After 12 Months of Treatment and Other BSID-III Gross Motor Scale–Related Outcomes
The BSID-III gross motor scale is 1 of 2 subdomains of the Motor scale in the BSID-III tool. The Motor scale itself is 1 of 5 scales that constitute the BSID-III tool. The BSID-III is a norm-referenced instrument designed to measure the developmental status of children aged 1 month to 42 months. The BSID-III gross motor scale includes a total of 77 items that assess static positioning, dynamic movement, quality of movement, balance, motor planning, and perceptual-motor integration. While there is no established MID, based on the classical phenotypes of the SMA population, type I SMA patients never sit independently while type II SMA patients never walk independently.29-31
The sponsor administered a modified version of the BSID-III, where the gross motor scale consisted of 72 items scored at 0 (unable to perform the activity) or 1 (criteria for item achieved). The total raw score was calculated by summing the item scores to give a maximum possible score of 72. If an individual item was missing or “cannot test” was recorded, the item score was set to 0.
The outcome of sitting without support after 12 months of treatment was the primary end point of the confirmatory Part 2 of the study. Sitting was defined based on the BSID-III gross motor subset item 22, outlined as “sits alone without support for at least 5 seconds.”
Assessment of this outcome, and all other BSID-III gross motor scale–related outcomes, was video-recorded at the study site and responders were determined at the site by the clinical evaluator, and centrally by 2 independent readers. The 2 independent central readers only reviewed and scored items 22, 26, 30, 40, and 42. The assessment of the 2 independent readers will be used for the primary analysis. In cases where there was disagreement between the 2 independent reviewers, they conducted a second assessment of the disagreed-upon result; if disagreement persisted after the second round of assessment, then the patient would not have been considered to have achieved the outcome.
CHOP INTEND Score and Other CHOP INTEND–Related Motor Milestone Outcomes
CHOP INTEND was developed in infants with SMA type I to measure motor function in children with neuromuscular disorders presenting in infancy and possessing an infant’s repertoire of motor skills. The instrument consists of 16 items rated on a uniform scale from 0 to 4, corresponding to no response (0), minimal (1), partial (2), nearly full (3), and complete (4) response levels. The 16 items include spontaneous movement (upper extremity), spontaneous movement (lower extremity), hand grip, head in midline with visual simulation, hip adductors, rolling (elicited from legs), rolling (elicited from arms), shoulder and elbow flexion and horizontal abduction, shoulder flexion and elbow flexion, knee extension, hip flexion and foot dorsiflexion, head control, elbow flexion, neck flexion, head and neck extension, and spinal incurvation. The maximum total score is 64; higher scores indicate more advanced motor development. No published estimated MID for CHOP INTEND was identified.32,33
The sponsor used the CHOP INTEND tool in 3 outcomes: the proportion of patients who achieve a score of 40 or higher in the CHOP INTEND at month 12, the proportion of patients who achieve an increase of at least 4 points in their CHOP INTEND score from baseline at month 12, and the proportion of patients who achieve head control as assessed by item 12 of the CHOP INTEND.
HINE Section 2 Score and Other HINE Section 2–Related Motor Milestone Outcomes
HINE Section 2 is composed of 8 milestones: head control, sitting, voluntary grasp, ability to kick, rolling, crawling, standing, and walking. Each milestone has 3 to 5 possible descriptive ratings, ranging from not performing the task at all to fully demonstrating the milestone; the motor milestones are age-dependent and are not intended to produce a total score. Although the original HINE developers did not define a quantitative scoring system for section 2, scores for each milestone were obtained by assigning a value of 0 to the absence of the activity and adding 1 point for each incremental rating. The total score is calculated by summing the item scores to give a maximum possible score of 26. If an individual item was missing or if “cannot test” was recorded, the item score was set to 0.34
The sponsor defined an improvement in a motor milestone as at least a 2-point increase in ability to kick (or maximal score) or a 1-point increase in head control, rolling, sitting, crawling, standing, or walking. Worsening is similarly defined as a 2-point decrease in ability to kick (or lowest score) or a 1-point decrease in head control, rolling, sitting, crawling, standing, or walking. Voluntary grasp is excluded from the definition. Based on this, an infant was defined as a responder if more motor milestones showed improvement than showed worsening; infants who died or were withdrawn were classified as nonresponders. Infants with a totally missing HINE Section 2 assessment at month 12 or month 24 were classified as nonresponders.
Other outcomes that the sponsor used based on the HINE Section 2 are the proportion of patients able to support weight or stand with support as assessed by the HINE Section 2 at month 12, and the proportion of patients able to bounce while assessing the walking item of the HINE Section 2 at month 12.
Survival, Ventilation-Free Survival, and Respiratory-Related Outcomes
Time to death, time to death or permanent ventilation, and time to permanent ventilation was presented graphically using the Kaplan-Meier curves. Permanent ventilation is defined as 16 hours or more of non-invasive ventilation (e.g., BiPAP) per day or intubation for more than 21 consecutive days in the absence of, or following the resolution of, an acute reversible event; or tracheostomy. A permanent ventilation event was determined through an adjudication committee. Time to event was defined as the time in months from the date of enrolment in the study until the date of the event.
Nutrition
One of the secondary outcomes was the proportion of patients with the ability to feed orally at month 12. A combination of oral and tube feeding was also classified as oral feeding. Infants who had not maintained the ability to feed orally if achieved earlier, or had been withdrawn, or died, were classified as nonresponders for the analysis. Infants with a missing assessment at a visit were also classified as nonresponders.
Health Care Utilization
Hospitalizations were defined as any hospital admission for 2 or more days for any reason that is not due to the study requirement.
The number of hospitalizations per patient-year was defined as the number of hospitalizations observed by month 12 (or month 24) divided by the total patient-years at risk, where the total patient-years at risk were equal to the sum across all patients of the time intervals (in years) between the start of study therapy and the earliest date of study withdrawal or completion of 12 months (or 24 months) of treatment.
Infant Toddler Quality of Life Questionnaire–47-Item Short Form
The Infant Toddler Quality of Life Questionnaire (ITQOL) is a 97-item, caregiver-reported, generic profile measure used to assess health status and HRQoL for infants and children aged 2 months to 5 years. The ITQOL-SF47 is a shortened 47-item version that was used in FIREFISH. It uses a 5-point Likert-style response from “all of the time” to “none of the time” to evaluate physical function (6 items), growth and development (5 items), bodily pain (2 items), temperament and moods (6 items), behaviour (12 items), general health perceptions (5 items), parent emotional health (4 items), and parent time limitations (4 items). The ITQOL also includes single-item questions specific to overall health, change in health, and family cohesion. Higher scores indicate better HRQoL, and raw scale scores are transformed to a scale from 0 to 100. No literature was identified that assessed the ITQOL-SF47 for validity, reliability, or responsiveness in patients with SMA. No MID was identified in populations with SMA.
SUNFISH Part 2
Change From Baseline in MFM-32 Score at Month 12 and Other MFM-32–Related Outcomes
The MFM-32 is used to assess the motor function of patients with neuromuscular disease. The 32 items are categorized in 3 domains (Ds): D1 (13 items) evaluates standing, transfers, and ambulation; D2 (12 items) measures proximal and axial function; and D3 (7 items) assesses distal function.35,36 A patient’s maximal ability without assistance is scored on a 4-point Likert scale: 0 = movement not initiated or starting position not maintained; 1 = exercise partially completed; 2 = exercise completed with compensations, slowness, or obvious clumsiness; and 3 = exercise completed with standard pattern. Subscores can be calculated as a percentage of the maximum possible scores for each domain.36 The raw score (sum of the 32 items, ranging from 0 to 96) is divided by 96 (maximum score) and multiplied by 100 to produce a final score that can be interpreted as a “percentage of normal function;” a lower score indicates lower motor function.37,38 The sponsor indicated that a change of 3 or more points in the MFM-32 may translate into either the acquisition of a new function or the improvement in performance of several functions. As such, the first secondary outcome tested was the proportion of patients with a change from a baseline MFM-32 total score of 3 or more at month 12. Furthermore, the sponsor has presented arguments that — considering the deteriorating nature of the disease — stabilization and the lack of further deterioration may also be an important outcome. This was measured in a secondary outcome that was outside the statistical testing hierarchy: the proportion of patients with a change from a baseline MFM-32 total score of 3 or more at month 12.
In addition, the sponsor reported on the change from baseline in each of the 3 domains individually, the combined score of D1 + D2, and the combined score of D2 + D3.
Change From Baseline in the Total Score of the RULM at Month 12 and Other RULM–Related Outcomes
The original ULM was designed to capture upper limb function in non-ambulatory SMA patients, especially in young children, and was previously validated in this population.39 Due to ceiling effects, it was revised and renamed the RULM. It consists of 19 items that are graded on 3-point scales. With the exception of 1 activity with a binary score, the possible scores are as follows: 0 (unable), 1 (able, with modification), and 2 (able, no difficulty), giving a maximum total score of 37 where a higher score indicates greater function. The patient chooses 1 arm with which to perform the tasks. Stolte et al. calculated MIDs based on the standard error of measurement (SEM) with a range of 1.2 to 2.7 in patients with SMA type II, and a range of 2.7 to 5.9 for patients with SMA type III.40
Change from baseline was a secondary outcome. Other related outcomes included the proportion of patients with a change of 2 or more, and the proportion of patients with a change of 0 or more, both of which were outside the statistical testing hierarchy.
Change From Baseline in Total Score of the HFMSE at Month 12 and Other HFMSE-Related Outcomes
The HFMSE is intended for use in patients with SMA type II and SMA type III and captures higher functioning skills. It consists of 33 activities that can be scored as follows: 0 for unable to perform, 1 for performs with modification and/or adaptation, and 2 for performs without modification. The item scores are summed to give a total score with a maximum of 66. The higher the total score, the greater the patient’s motor functioning.41 An MID calculated based on SEM shows a range of 0.5 to 1.2 in patients with type II SMA, and a range of 2.7 to 5.9 in patients with type III SMA.40
Change from baseline was a secondary outcome. Other related outcomes included the proportion of patients with a change of 2 points or more, and the proportion of patients with a change of 0 or more, both of which were outside the statistical testing hierarchy.
Respiratory-Related Outcomes
Several respiratory-related outcomes were reported in SUNFISH. The most relevant of these is the FVC, which is the total volume that can be exhaled after inhaling maximally, and the forced expiratory volume in 1 second (FEV1), which is the volume forcefully exhaled in the first second of the FVC test. Change from baseline in best predicted FVC was a secondary outcome; other respiratory-related outcomes included the FEV1. FVC and FEV1 were obtained from spirometry tests that were administered to patients who were 6 years to 25 years of age at screening.
Spinal Muscular Atrophy Independence Scale
The SMAIS was developed by the sponsor for the SUNFISH study as a patient-reported outcome tool that is specific to SMA type II patients and non-ambulatory SMA type III patients. The SMAIS consists of 29 items and measures the level of independence a patient requires to perform daily activities.14 It has 2 versions with identical items: 1 that is self-reported for patients older than the age of 12 and another that is caregiver-reported for patients older than 2 years of age. Twenty-two of the 29 items cover activities that use the upper limbs, such as personal hygiene, eating, drinking, and writing. The other 7 items focus on activities that rely on lower limb and proximal and/or axial movements such as mobility and completing chores. Each item is scored on a 3-point scale where 0 = unable to perform task at all without help, 1 = needs a lot to a moderate amount of help, and 2 = needs little to no help. A higher overall score indicates greater independence. An MID was calculated using anchor-based analyses for the ULM of the SMAIS scale (SMAIS-ULM); it was estimated that a 1-point to 5-point change on the SMAIS-ULM would be clinically meaningful.
Change from baseline in caregiver-reported SMAIS total score was a secondary outcome.
Clinical Global Impression–Change
The CGI-C is used to evaluate the change in a patient’s global health from baseline.35 It is a single-item, 7-point Likert scale with the following options: 1 = very much improved; 2 = much improved; 3 = minimally improved; 4 = no change; 5 = minimally worse; 6 = much worse; and 7 = very much worse. No literature was identified that assessed the CGI-C for validity, reliability, or responsiveness in patients with SMA. No MID information was identified in patients with SMA.
The proportion of patients rated as improved at month 12 was a secondary outcome.
Statistical Analysis
FIREFISH Part 2
FIREFISH Part 2 was a single-arm, open-label, uncontrolled, phase III clinical trial.
The primary outcome of Part 2 was the proportion of infants who were able to sit without support at 12 months of treatment; this outcome was tested against a predefined performance criterion of 5%. This 5% threshold was chosen based on the history of type I SMA, in which, as part of the classification, infants never achieve the motor milestone of sitting without support.
Based on the predefined performance criterion of 5%, an assumption was made that the true proportion of infants who would sit upon treatment was 20% and, using an exact binomial test with a 1-sided 5% significance level, that a target sample size of 40 infants would provide at least 90% power to test the null hypothesis H0:P of 5% or less versus the alternative hypothesis Ha:P of more than 5%. As such, a minimum of 5 infants sitting without support would provide a statistically significant difference from the predefined performance criterion. Which would translate into the lower limit of the 2-sided 90% Clopper-Pearson (exact) CI would be above 5%.
To adjust for multiple testing, the sponsor implemented a hierarchical testing approach where hypothesis testing in secondary outcomes would be implemented only if the primary outcome was significant (the proportion of infants who are sitting without support after 12 months of treatment). Then, testing (at 1-sided 5% significance) would adhere to the following hierarchy, where testing cannot proceed beyond a non-statistically significant outcome.
Proportion of patients who achieve a score of 40 or higher in the CHOP INTEND at month 12: This will be contrasted with a predefined threshold of 17%, which was informed by the Network for Excellence in Neuroscience Clinical Trials (NeuroNEXT) SMA infant biomarker study.42
Proportion of patients who achieve an increase of at least 4 points in their CHOP INTEND score from baseline at month 12: This will be contrasted with a predefined threshold of 17%, which was informed by the NeuroNEXT SMA biomarker study.42
Proportion of motor milestone responders as assessed by the HINE Section 2 at month 12: This was defined as an improvement in a motor milestone of at least a 2-point increase in ability to kick (or maximal score) or a 1-point increase in head control, rolling, sitting, crawling, standing, or walking. This will be contrasted with a predefined threshold of 12%, which was based on the results from a study conducted by De Sanctis et al. (2016).4
Proportion of patients alive without permanent ventilation at month 12: This will be contrasted with a predefined threshold of 42%, which was informed by the NeuroNEXT SMA biomarker study.42
Proportion of patients sitting without support for 30 seconds (item 26 of BSID-III) at month 24: This will be contrasted with a predefined threshold of 0%, which was based on the results from a study conducted by De Sanctis et al. (2016).4
Proportion of patients standing (item 40 of BSID-III) at month 24: This will be contrasted with a predefined threshold of 0%, which was based on the results from a study conducted by De Sanctis et al. (2016).4
Proportion of patients walking (item 42 of BSID-III) at month 24: This will be contrasted with a predefined threshold of 0%, which was based on the results from a study conducted by De Sanctis et al. (2016).4
In a similar manner to the primary outcome, the threshold for the null hypothesis was based on the results in natural history studies of a similar population. The sponsor outlined that these tests, at a 1-sided 5% significance level, would only be performed if a predefined benchmark is determined from historical data.
These thresholds were established based on a literature review that the sponsor conducted to identify data describing the natural history of infants with type I SMA. The sponsor aimed to derive these minimum thresholds by selecting a population of type I SMA in the literature that is similar to the 1 included in FIREFISH Part 2. To that aim, the following factors were considered when determining the extent of similarity: 1) the SMN2 copy number, 2) age at symptom onset, 3) age at enrolment, 4) type I classification, 5) similarities in the standard of care, 6) the time period, 7) the region, 8) the type of centre. Through an unclear operationalization mechanism, the sponsor has decided that the NeuroNEXT SMA infant biomarker study was the study most similar to the infants enrolled in FIREFISH Part 2.4 In cases where the outcome was not described in the NeuroNEXT study, the sponsor used the study by De Sanctis et al. (2016) to inform on the minimum threshold. The determination of the threshold was based on the upper limit of the 90% CI in the outcomes of NeuroNEXT or De Sanctis et al. (2016).
In categorical outcomes, infants who do not achieve the outcome, do not maintain a previously achieved outcome at the time of assessment, have been withdrawn from the study, died, or have a missing assessment at the time of the outcome are all considered as not having achieved the outcome. The proportion in categorical outcomes was presented with a 2-sided 90% Clopper-Pearson (exact) CI.
Other continuous measures (e.g., change in CHOP INTEND score from baseline) would use observed data only for the main analysis, with no imputation of missing data.
The median time to event and the proportion of infants without an event at a certain time point was to be estimated using the Kaplan-Meier methodology. Infants who had been withdrawn from the study with no event reported before withdrawal were to be censored at the date of withdrawal. For infants who had been withdrawn from the study and entered into safety follow-up, all events reported from the date of enrolment up to the date of withdrawal were to be included in the analysis.
Several sensitivity analyses were outlined in the protocol for FIREFISH outcomes. These included the following.
Site evaluation of sitting without support for 5 seconds: The outcomes will be based on the assessment of the clinical site evaluator instead of the assessment of 2 independent central readers.
Alternative definition of sitting without support: Sitting will be defined by the HINE Section 2 categories of “stable sit” or “pivots (rotates).” Infants within either of these response categories for the milestone of sitting at month 12 will be classified as responders.
Assuming patients who have been withdrawn from the study without entering safety follow-up as events in the time to death or permanent ventilation analysis.
In patients who have been withdrawn but were entered in the safety follow-up, including any observed event during the safety follow-up in the time to death or permanent ventilation analysis.
Applying the following method for handling missing data in CHOP INTEND–related outcomes: Missing data at baseline will be imputed with the median of an infant’s population stratum (symptom onset ≤ 3 months, or > 3 months), and missing month 12 data will be imputed with a linear interpolation of the values of neighbouring visits, if available, or with the minimum value of the population stratum that the infant belongs to, if neighbouring values are not available.
Subgroup analyses were planned for the following outcomes: the proportion of infants sitting without support for 5 seconds at month 12, the time to death or permanent ventilation, and the proportion of infants who achieved a CHOP INTEND score of 40 or higher at month 12. It included the following subgroups that were specific to our protocol: baseline CHOP INTEND score (≤ median score and > median score), and time between first treatment and the onset of symptoms (≤ 3 months and > 3 months).
SUNFISH Part 2
SUNFISH Part 2 was a randomized, double-blind, placebo-controlled trial. The sample size for SUNFISH Part 2 was calculated with the assumption that the true treatment difference of risdiplam versus placebo would be 3 points in the total MFM-32 score with a common SD of 6. Based on this, a sample size of 168 patients, with a 10% dropout rate allowance, would provide at least 80% power at a 2-sided 5% significance level for testing the null hypothesis (the true treatment difference is 0).
The randomization was stratified based on age groups. These were 2 years to 5 years, 6 years to 11 years, 12 years to 17 years, and 18 years to 25 years at randomization. The sponsor aimed to randomize a maximum of 30 patients into the 18 years to 25 years age group, while a minimum of 45 patients would be randomized into each of the other 3 age groups. No clear justification was provided for this stratification approach.
The sponsor indicated that, in addition to the primary outcome, hypothesis testing was performed on 6 key secondary outcomes. To control for type I error, a gatekeeping approach was applied to the 7 null hypotheses that were grouped into 6 families. Testing was conducted on a hierarchical order with a truncated Hochberg procedure used within families with more than a single hypothesis. An unadjusted P value was the P value obtained when an end point was tested at a 2-sided 0.05 significance level. The adjusted P values were derived based on all the (unadjusted) P values from end points in order of the hierarchy up to the current end point. The hierarchy of and the outcomes in the families were as follows.
Family 1 includes the hypothesis for the primary end point on the change from baseline total MFM-32 score at month 12 comparing risdiplam with placebo: H11 (MFM-32).
Family 2 includes the hypothesis for the proportion of patients who achieve a change from baseline of 3 or more on the total MFM-32 score at month 12 comparing risdiplam with placebo: H21 (proportion with an MFM-32 ≥ 3).
Family 3 includes the hypothesis for the change from baseline total score of RULM at month 12 comparing risdiplam with placebo: H31 (RULM).
Family 4 includes the hypothesis for the change from baseline total score of HFMSE at month 12 comparing risdiplam with placebo and also the hypothesis for the change from baseline best percentage predicted value in FVC at month 12 comparing risdiplam with placebo: H41 (HFMSE), H42 (FVC).
Family 5 includes the hypothesis for the change from baseline total score of SMAIS at month 12 comparing risdiplam with placebo: H51 (SMAIS).
Family 6 includes the hypothesis for the proportion of patients rated by the clinician as improved in the CGI-C scale at month 12 comparing risdiplam with placebo: H61 (CGI-C).
For the primary outcome as well as other outcomes that measure change from baseline, the sponsor used a mixed model of repeated measures analysis that contains fixed effects, random effects, and random error components. In the mixed model of repeated measures model, the dependent variable was the absolute change from baseline score. This was tested at a 2-sided 5% level of significance. The fixed effects variables were baseline score, treatment group, time, treatment-by-time interaction, baseline-by-time interaction, and the randomization stratification age group. Random effect included the patient effect and time as a repeated variable within a patient. Patient, treatment, and time were treated as factor variables and the baseline total MFM-32 score as a covariate. Within-patient variability was modelled with an unstructured variance-covariance matrix. The components of the matrix were estimated by the restricted maximum likelihood method and the degrees of freedom estimated using the Kenward-Roger approximation.
For categorical outcomes representing responder analysis, a logistic regression model was used for the analysis of these end points. The logistic regression model included the baseline total score, treatment, and age group.
Missing data of items within the Motor Function Measure (MFM) were handled through the following rule: D1, D2, and D3 were only calculated if there was less than 15% of missing data, and total scores were only calculated if scores were available for each domain. Missing items that constitute less than 15% of the domain were imputed as 0. Missing MFM total scores were not imputed. For the RULM, if 3 or fewer items are missing, they were imputed as zero, while the RULM total score was not calculated if there were more than 3 missing items. For the HFMSE, if 6 or fewer items are missing, they were imputed as zero, while the HFMSE total score was not calculated if there were more than 6 missing items.
A sensitivity analysis was planned if more than 5% of the intention-to-treat (ITT) population was excluded from the MFM-32 primary end point analysis due to missing data. The sensitivity analysis imputed missing MFM as follows: missing items at baseline were imputed with values from the screening visit, missing items at week 17 or week 35 were imputed by the mean value of the 2 neighbouring visits, and missing items at week 52 were imputed with values from the previous visit. If there were still missing data following this approach, the remaining missing data were to be treated as per the rule for the base MFM-32 analysis.
A treatment policy strategy analysis was also planned to include all data for patients who discontinued the treatment but remained in the study, regardless of whether or not they had initiated a prohibited therapy.
Additional sensitivity analysis to assess the impact of missing data on the primary end point due to study withdrawals was planned. The sensitivity analysis was a tipping point analysis where patients who had monotone missing data were assumed to have worse efficacy outcomes by some amount of delta compared to similar patients with observed data. The analysis was to be performed on a series of increasing values of delta until the analysis conclusion of statistically significant finding no longer held.
Subgroup analysis was performed over the primary outcome and the key secondary outcomes (the secondary outcomes included in the statistical testing hierarchy). It included the following subgroups that were pre-specified in the protocol for this review: age groups (2 years to 5 years, 6 years to 11 years, 12 years to 17 years, 18 years to 25 years at randomization), disease severity (MFM-32 baseline total score first quartile, second and third quartile, and fourth quartile), SMA type (type II and type III), and SMN2 copy number (< 2, 2, 3, ≥ 4, unknown).
A summary of the statistical analysis approach of the efficacy end points in FIREFISH Part 2 and SUNFISH Part 2 is provided in Table 10.
Table 10: Statistical Analysis of Efficacy End Points
End point | Statistical model | Adjustment factors | Sensitivity analyses |
|---|---|---|---|
FIREFISH Part 2 | |||
Proportion of infants sitting without support for 5 seconds (item 22 of BSID-III) at month 12 | Summarized as count and percentage. Proportion is presented with a 2-sided 90% Clopper-Pearson (exact) CI. Test against the null hypothesis at a 1-sided 0.05 significance level using the exact method for binomial proportions. | None |
|
Proportion of infants who achieve a score of 40 or higher in the CHOP INTEND at month 12 | Summarized as count and percentage. Proportion is presented with a 2-sided 90% Clopper-Pearson (exact) CI. Test against the null hypothesis at a 1-sided 0.05 significance level using the exact method for binomial proportions. | None | None |
Proportion of infants who achieve an increase of at least 4 points in their CHOP INTEND score from baseline at month 12 | Summarized as count and percentage. Proportion is presented with a 2-sided 90% Clopper-Pearson (exact) CI. Test against the null hypothesis at a 1-sided 0.05 significance level using the exact method for binomial proportions. | None | None |
Proportion of infants who achieve head control as assessed by item 12 of the CHOP INTEND | Summarized as count and percentage. | None | None |
Proportion of motor milestone responders as assessed by the HINE Section 2 at month 12 | Summarized as count and percentage. Proportion is presented with a 2-sided 90% Clopper-Pearson (exact) CI. Test against the null hypothesis at a 1-sided 0.05 significance level using the exact method for binomial proportions. | None | None |
Proportion of infants able to support weight or stand with support as assessed by the HINE Section 2 at month 12 | Summarized as count and percentage. | None | None |
Proportion of infants able to bounce while assessing the walking item of the HINE Section 2 at month 12 | Summarized as count and percentage. | None | None |
Proportion of infants sitting without support for 30 seconds (item 26 of BSID-III) at month 12 | Summarized as count and percentage. | None | None |
Proportion of infants sitting without support for 30 seconds (item 26 of BSID-III) at month 24 | Results are summarized as number and percentages. Proportion is presented with a 2-sided 90% Clopper-Pearson (exact) CI. Test against the null hypothesis at a 1-sided 0.05 significance level using the exact method for binomial proportions. | None | None |
Proportion of infants standing (item 40 of BSID-III) at month 24 | Summarized as count and percentage. Proportion is presented with a 2-sided 90% Clopper-Pearson (exact) CI. Test against the null hypothesis at a 1-sided 0.05 significance level using the exact method for binomial proportions. | None | None |
Proportion of infants walking (item 42 of BSID-III) at month 24 | Summarized as count and percentage. Proportion is presented with a 2-sided 90% Clopper-Pearson (exact) CI. Test against the null hypothesis at a 1-sided 0.05 significance level using the exact method for binomial proportions. | None | None |
Change in BSID-III score from baseline | Summarized as the difference in the mean between the end point and the baseline values. | None | None |
Proportion of infants alive without permanent ventilation at month 12 | Summarized as count and percentage. | None | None |
Proportion of infants alive at month 12 | Summarized as count and percentage. | None | None |
Proportion of infants with the ability to feed orally at month 12 | Summarized as count and percentage. | None | None |
Time to death | Presented as a Kaplan-Meier curve. The median time to death and the proportion of infants who are surviving at month 12 and month 24 will be estimated using Kaplan-Meier methodology. | None | None |
Time to permanent ventilation | Presented as a Kaplan-Meier curve. The median time to ventilation-free survival and the proportion of infants who are surviving ventilation-free at month 12 and month 24 will be estimated using Kaplan-Meier methodology. | None |
|
Proportion of infants receiving respiratory support at month 12 | Summarized as count and percentage. | None | None |
Proportion of infants with the ability to feed orally at month 12 | Summarized as count and percentage. | None | None |
Number of hospitalizations per patient-year at month 12 | Summarized as count and percentage. | None | None |
Proportion of infants with no hospitalizations at month 12 | Summarized as count and percentage. | None | None |
Change in ITQOL-SF47 from baseline | Summarized as mean, median, with the associated SD and range. | None | None |
SUNFISH Part 2 | |||
Change from baseline in MFM-32 score at month 12 | MMRM analysis. The estimated treatment difference of the least squares mean change from baseline is presented with corresponding 95% CIs. An unadjusted P value was tested at a 2-sided 0.05 significance level. The adjusted P values were derived based on all the (unadjusted) P values from end points in order of the hierarchy up to the current end point. | Model included treatment, total score at baseline, time, treatment-by-time interaction, baseline-by-time interaction, and age group |
|
Proportion of patients with a change from baseline MFM-32 ≥ 3 at month 12 | Logistic regression. The proportion of responders is shown and presented with the corresponding ORs and 95% CIs. An unadjusted P value was tested at a 2-sided 0.05 significance level. The adjusted P values were derived based on all the (unadjusted) P values from end points in order of the hierarchy up to the current end point. | Model included baseline total score, treatment, and age group | None |
Proportion of patients with a change from baseline MFM-32 ≥ 0 score at month 12 | Logistic regression. The proportion of responders is shown and presented with the corresponding ORs and 95% CIs. | Model included baseline total score, treatment, and age group | None |
Proportion of patients who achieve an improvement of at least 1 standard error of measurement on the total MFM score at month 12 | Logistic regression. The proportion of responders is shown and presented with the corresponding ORs and 95% CIs. | Model included baseline total score, treatment, and age group | None |
Change from baseline in each of the MFM domain scores of D1, D2, and D3, and the total combined score of (D1 + D2) and D2 + D3 at month 12 | MMRM analysis. The estimated treatment difference of the least squares mean change from baseline are presented with corresponding 95% CIs. | Model included treatment, total score at baseline, time, treatment-by-time interaction, baseline-by-time interaction, and age group | None |
Change from baseline in the total score of the RULM at month 12 | MMRM analysis. The estimated treatment difference of the least squares mean change from baseline is presented with corresponding 95% CIs. An unadjusted P value was tested at a 2-sided 0.05 significance level. The adjusted P values were derived based on all the (unadjusted) P values from end points in order of the hierarchy up to the current end point. | Model included treatment, total score at baseline, time, treatment-by-time interaction, baseline-by-time interaction, and age group | None |
Proportion of patients with a change from baseline RULM ≥ 0 score at month 12 | Logistic regression. The proportion of responders is shown and presented with the corresponding ORs and 95% CIs. | Model included baseline total score, treatment, and age group | None |
Proportion of patients with a change from baseline RULM ≥ 2 or more at month 12 | Logistic regression. The proportion of responders is shown and presented with the corresponding ORs and 95% CIs. | Model included baseline total score, treatment, and age group | None |
Change from baseline in total score of the HFMSE at month 12 | MMRM analysis. The estimated treatment difference of the least squares mean change from baseline is presented with corresponding 95% CIs. An unadjusted P value was tested at a 2-sided 0.05 significance level. The adjusted P values were derived based on all the (unadjusted) P values from end points in order of the hierarchy up to the current end point. | Model included treatment, total score at baseline, time, treatment-by-time interaction, baseline-by-time interaction, and age group | None |
Proportion of patients with a change from baseline HFMSE ≥ 0 score at month 12 | Logistic regression. The proportion of responders is shown and presented with the corresponding ORs and 95% CIs. | Model included baseline total score, treatment, and age group | None |
Proportion of patients with a change from baseline HFMSE ≥ 2 or more at month 12 | Logistic regression. The proportion of responders is shown and presented with the corresponding ORs and 95% CIs. | Model included baseline total score, treatment, and age group | None |
Change from baseline in FEV1 at month 12 | MMRM analysis. The estimated treatment difference of the least squares mean change from baseline is presented with corresponding 95% CIs. | Model included treatment, total score at baseline, time, treatment-by-time interaction, baseline-by-time interaction, and age group | None |
Change from baseline in FVC at month 12 | MMRM analysis. The estimated treatment difference of the least squares mean change from baseline is presented with corresponding 95% CIs. An unadjusted P value was tested at a 2-sided 0.05 significance level. The adjusted P values were derived based on all the (unadjusted) P values from end points in order of the hierarchy up to the current end point. | Model included treatment, total score at baseline, time, treatment-by-time interaction, baseline-by-time interaction, and age group | None |
Change from baseline SMAIS total score at month 12 | MMRM analysis. The estimated treatment difference of the least squares mean change from baseline is presented with corresponding 95% CIs. An unadjusted P value was tested at a 2-sided 0.05 significance level. The adjusted P values were derived based on all the (unadjusted) P values from end points in order of the hierarchy up to the current end point. | Model included treatment, total score at baseline, time, treatment-by-time interaction, baseline-by-time interaction, and age group | None |
Proportion of individuals rated as “improved” on the CGI-C at month 12 | Logistic regression. The proportion of responders is shown and presented with the corresponding ORs and 95% CIs. An unadjusted P value was tested at a 2-sided 0.05 significance level. The adjusted P values were derived based on all the (unadjusted) P values from end points in order of the hierarchy up to the current end point. | Model included baseline total score, treatment, and age group | None |
BSID-III = Bayley Scales of Infant and Toddler Development, Third Edition; CHOP INTEND = Children’s Hospital of Philadelphia Infant Test of Neuromuscular Disorders; CI = confidence interval; CGI-C = Clinical Global Impression–Change; D = domain; FEV1 = forced expiratory volume in 1 second; FVC = forced vital capacity; HFMSE = Hammersmith Functional Motor Scale Expanded; HINE Section 2 = Hammersmith Infant Neurological Examination–Section 2; ITQOL-SF47 = Infant Toddler Quality of Life Questionnaire–47-item Short Form; ITT = intention-to-treat; MFM-32 = Motor Function Measure–32 items; MMRM = mixed model of repeated measures; OR = odds ratio; RULM = Revised Upper Limb Module; SD = standard deviation; SMAIS = Spinal Muscular Atrophy Independence Scale.
Source: Drug Reimbursement Review sponsor submission.14
Analysis Populations
FIREFISH Part 2
• ITT: Defined as all infants enrolled in FIREFISH Part 2, regardless of whether they received the treatment or not. This population is used in all efficacy analysis.
• Safety population: Defined as all infants who received at least 1 dose of risdiplam.
SUNFISH Part 2
ITT: Defined as all patients randomized in SUNFISH Part 2. This population is used in all efficacy analysis.
Safety population: Defined as all patients who received at least 1 dose of risdiplam or placebo.
Results
Patient Disposition
FIREFISH Part 2
Table 11 summarizes the disposition of enrolled infants. A total of 52 infants were screened; 11 were determined to be a screen failure and 41 patients were administered risdiplam. Of the 11 screen failures, 4 infants died during the screening period and 3 did not meet all inclusion criteria (these 2 categories were the most common reasons for the screen failures). Of the 41 enrolled patients, 38 (92.7%) had completed 12 months of treatment and none have yet completed 24 months of treatment.
SUNFISH Part 2
Table 11 summarizes the disposition of enrolled patients in SUNFISH. A total of || patients were screened; 31 patients were determined to be a screen failure and 180 patients were randomized to risdiplam (n = 120) and placebo (n = 60). Most common reasons for the screen failures were that 5 patients did not achieve the required baseline MFM-32 scores, 5 patients had reasons related to inability to measure their optical coherence tomography, 4 patients were diagnosed with febrile conditions that excluded them from the study, and 3 patients withdrew their consent. Of 120 patients who were randomized into the risdiplam arm, 3 withdrew. Of the 60 patients randomized to the placebo arm, 1 withdrew. The most common reason for withdrawal was access to other SMA treatment.
Disposition | FIREFISH | SUNFISH | |
|---|---|---|---|
Risdiplam | Risdiplam | Placebo | |
Screened, N | 52 | |||||||||||||||||||||||||||||| | |
Randomized/enrolled, N | 41 | 120 | 60 |
Discontinued from study, n (%) | 3 (7.3) | 3 (2.5) | 1 (1.7) |
Reason for discontinuation, n (%) | |||
Death | 2 (4.9) | 0 | 0 |
Progressive disease | 1 (2.4) | 0 | 0 |
Changed to other treatment (nusinersen) | 0 | 3 (2.5) | 1 (1.7) |
Completed 12 months of treatment, n (%) | 38 (92.7) | 117 (97.5) | 59 (98.3) |
Completed 24 months of treatment, n (%) | 0 | 0 | |
ITT population, N | 41 | 120 | 60 |
Safety population, N | 41 | 120 | 60 |
ITT = intention-to-treat.
Source: Drug Reimbursement Review sponsor submission.14
Exposure to Study Treatments
FIREFISH Part 2
All enrolled patients received risdiplam at a median dose intensity (the number of doses actually received divided by the expected number of doses) of 100% (range 98.0% to 100%). As of the clinical cut-off date of the included FIREFISH Part 2 report, of the ITT population (including the patients who died or withdrew) the median treatment period was 15.2 months (range = 1.6 months to 10.2 months).
Most patients received some form of concomitant medication. This included |||| who received medications for AEs, |||||||||||||||||||||||||||||||||||||||||||||||||||||||||||||||||||||||||||||||||||||||||||||||||||||||||||||||||||||||||||||||||||||||||||||||||||||||||||||||||||||| ||||||||||||||||||||||||||||||||||||||
SUNFISH Part 2
The median risdiplam dose intensity was |||||||||||||||||||||||||||||||||||||||||| and |||||| of patients had a dose intensity ||||. As of the clinical cut-off date of the included SUNFISH Part 2 report, the median treatment period was |||||||||||||||||||||||||||||||||||||||| ||||.
|||||||||||||||||||||||||||||||||||||||||||||||||||||||||||||||||||||||||||||||||||||||||||||||||||||||||||||||||||||||||||||||||||||||||||||||||||||||||||||||||||||||| ||||||||||||||||||||||||||||||||||||||||||||||||||||||||||||||||||||||||||||||||||||||||||||||||||
Efficacy: FIREFISH Part 2
Only those efficacy outcomes and analyses of subgroups identified in the review protocol are reported as follows. Table 12 provides a summary of the efficacy results of FIREFISH Part 2.
Primary Outcome: Proportion of Infants Sitting Without Support for 5 Seconds (Item 22 of BSID-III) at Month 12
At 12 months of treatment with risdiplam, 29.3% of infants (12 out of 41 infants; 90% CI, 17.8 to 43.1) were able to able to sit without support for 5 seconds. This proportion was statistically significantly higher than the predefined performance criterion of 5% based on natural history data from the NeuroNEXT cohort (P < 0.0001).
Sensitivity analysis using the assessment of the clinical site indicated that 34.1% of infants (14 out of 41 infants; 90% CI, 22.0 to 48.1) achieved sitting without support for 5 seconds, while a sensitivity analysis using the HINE Section 2 categories of “stable sit” and “pivots (rotates)” indicated that 24.4% of the infants (10 out of 41 infants; 90% CI not available) achieved the outcome.
Subgroup analysis showed that of 14 infants with a disease duration of 3 months or less, |||||||||||||||||||||||||||||||||||||||||||||||||| achieved the primary outcome, while of 27 infants with a disease duration of more than 3 months, |||||||||||||||||||||||||||||||||||||||| |||| achieved the primary outcome. Subgroup analysis based on the baseline CHOP INTEND score showed that 28.6% of the infants (6 out of 21 infants; 90% CI, 13.24 to 48.74) with a score equal to the median or below (≤ 22) achieved the primary outcome, and 30.0% of the infants (6 out of 20 infants; 90% CI, 13.96 to 50.78) with a CHOP INTEND score over the median (> 22) achieved the primary outcome.
Motor Function–Related Outcomes
Since none of the patients have reached the 24 months of treatment end point, only the results at 12 months of treatment are reported.
Of the reported secondary outcomes that are within the statistical hierarchy (at 12 months of treatment), 56.1% of infants (23 out of 41 infants; 90% CI, 42.1 to 69.38) had a CHOP INTEND score of 40 or higher (P < 0.0001 against a performance criterion of 17%), 90.2% of infants (37 out of 41 infants; 90% CI, 79.1 to 96.6) have achieved an increase of at least 4 points in the CHOP INTEND score from baseline (P < 0.0001 against a performance criterion of 17%), and 78.0% of infants (32 out of 41 infants; 90% CI, 64.8 to 88.0) were considered motor milestone responders assessed through the HINE Section 2 (P < 0.0001 against a performance criterion of 12%).
For CHOP INTEND–related outcomes, sensitivity analysis of using a data imputation approach based on the median of the infant’s stratum and linear interpolation of flanking values showed results that did not differ from the base case.
Subgroup analysis showed that of 14 infants with a disease duration of 3 months or less, |||||||||||||||||||||||||||||||||||||||||||||||||||| achieved a CHOP INTEND score of 40 or higher, while of 27 infants with a disease duration of more than 3 months, |||||||||| |||||| |||||||||||||||||||||||||| achieved a CHOP INTEND score of 40 or higher. Subgroup analysis based on baseline CHOP INTEND score showed that 42.9% of the infants (9 out of 21 infants; 90% CI, 24.50 to 62.81) with a score equal to the median or below (≤ 22) achieved a CHOP INTEND score of 40 or higher, and 70.0% of the infants (14 out of 20 infants; 90% CI, 49.22 to 86.04) with a CHOP INTEND score over the median (> 22) achieved a CHOP INTEND score of 40 or higher.
Other motor function–related outcomes, at month 12 treatment, were outside the statistical hierarchy. Results demonstrated that 53.7% of infants achieved head control as assessed through CHOP INTEND item 12, 22.0% were able to support weight or stand with support as assessed by the HINE Section 2, 2.4% were able to bounce while assessing the walking item of the HINE Section 2, |||| were able to sit without support for 30 seconds as assessed by item 26 in BSID-III, and patients showed a mean change of 7.21 (SD = 5.71) points in the raw BSID-III overall score from baseline.
Survival-Related Outcomes
The proportion of infants alive without permanent ventilation at month 12 was the secondary outcome within the statistical testing hierarchy. A total of 85.4% of patients (90% CI, 73.4 to 92.2) were alive and did not require permanent ventilation at month 12 (35 out of 41 patients). This outcome was contrasted with a predefined threshold of 42% to give a statistically significant finding with a P value of less than 0.0001.
Since all study withdrawals were due to an event, planned sensitivity analysis of the impact of a non-event withdrawal of an infant was not presented.
Subgroup analysis showed that of 14 infants with a disease duration of 3 months of less, |||||||||||||||||||||||||||||||||| were event free (death or permanent ventilation) by month 12, while of 27 infants with a disease duration of more than 3 months, ||||||||||||||||||||||||||||| event free by month 12. Subgroup analysis based on baseline CHOP INTEND showed ||||||||||||||||||||||||||| of the infants with a CHOP INTEND score over the median (> 22) were event free by month 12.
Other survival-related outcomes were outside the statistical testing hierarchy. The proportion of patients alive at month 12 was 92.7% (38 out of 41 patients). Median time to event was not presented due to there being too few events to allow its estimation.
Respiratory-Related Outcomes
Outcomes were outside the statistical testing hierarchy, meaning that the type I error rate was not controlled for these statistical tests. The proportion of infants without permanent ventilation at month 12 of treatment was 92.7% (median time to permanent ventilation was not possible to estimate due to few available events). The proportion of infants at month 12 who did not require any type of ventilatory support was 24.4% (10 out of 41 infants).
Nutrition-Related Outcomes
At 12 months of treatment with risdiplam, 82.9% of the enrolled infants (34 out of 41 infants) had the ability to feed orally. This outcome was outside the statistical testing hierarchy.
Health Care Utilization–Related Outcomes
At 12 months of treatment with risdiplam, 48.8% of the enrolled infants (20 out of 41 infants) did not require hospitalization. Hospitalization was defined as any admission that lasted for more than 2 days. Hospitalizations per patient-year were estimated at 1.30 (90% CI, 1.02 to 1.65). These outcomes were outside the statistical testing hierarchy.
Health-Related Quality of Life–Related Outcomes
From baseline to month 12 of treatment, there was a mean change of |||||||||||||||||| in the ITQOL-SF47 overall health domain score, a mean change of |||||||||||||||||| in the ITQOL-SF47 parental impact (emotional) domain score, and a mean change of |||||||||||||| in the ITQOL-SF47 parental impact (time) domain score.
Table 12: Efficacy Outcomes — FIREFISH Part 2
Outcome | Risdiplam N = 41 |
|---|---|
Primary outcome | |
Proportion of infants sitting without support for 5 seconds (item 22 of BSID-III) at month 12 | |
n (%) | 12 (29.3) |
90% CI | 17.8 to 43.1 |
P value (performance criterion = 5%) | < 0.0001 |
Subgroups | |
Disease duration ≤ 3 months (a total of 14 infants), n (%, 90% CI) | |||||||||||||||||||||||||||| |
Disease duration > 3 months (a total of 27 infants), n (%, 90% CI) | |||||||||||||||||||||||||||| |
Baseline median CHOP INTEND score ≤ 22 (a total of 21 infants), n (%) (90% CI) | 6 (28.6) 13.24 to 48.74) |
Baseline median CHOP INTEND score > 22 (a total of 20 infants), n (%) (90% CI) | 6 (30.0) 13.96 to 50.78) |
Motor function–related outcomes | |
Proportion of infants who achieve a score of 40 or higher in the CHOP INTEND at month 12: first secondary outcome in the hierarchical testing approach | |
n (%) | 23 (56.1) |
90% CI | 42.1 to 69.38 |
P value (performance criterion = 17%) | < 0.0001 |
Subgroups | |
Disease duration ≤ 3 months (a total of 14 infants), n (%, 90% CI) | |||||||||||||||||||||||||||||| |
Disease duration > 3 months (a total of 27 infants), n (%, 90% CI) | |||||||||||||||||||||||||||||| |
Baseline median CHOP INTEND score ≤ 22 (a total of 21 infants), n (%) (90% CI) | 9 (42.9) 24.50 to 62.81) |
Baseline median CHOP INTEND score > 22 (a total of 20 infants), n (%) (90% CI) | 14 (70.0) 49.22 to 86.04) |
Proportion of infants who achieve an increase of at least 4 points in their CHOP INTEND score from baseline at month 12: second secondary outcome in the hierarchical testing approach | |
n (%) | 37 (90.2) |
90% CI | 79.1 to 96.6 |
P value (performance criterion = 17%) | < 0.0001 |
Proportion of motor milestone responders as assessed by the HINE Section 2 at month 12: third secondary outcome in the hierarchical testing approach | |
n (%) | 32 (78.0) |
90% CI | 64.8 to 88.0 |
P value (performance criterion = 12%) | < 0.0001 |
Infants who achieve head control as assessed by item 12 of the CHOP INTEND | |
n (%) | 22 (53.7) |
90% CI | (39.77 to 67.1) |
Proportion of infants able to support weight or stand with support as assessed by the HINE Section 2 at month 12 | |
n (%) | 9 (22.0) |
90% CI | NR |
Proportion of infants able to bounce while assessing the walking item of the HINE Section 2 at month 12 | |
n (%) | 1 (2.4) |
90% CI | NR |
Proportion of infants sitting without support for 30 seconds (item 26 of BSID-III) at month 12 | |
n (%) | |||||| |
90% CI | ||| |
Change in BSID-III score from baseline | |
Number of patients contributing to the analysis | 38 |
Baseline, mean (SD) | 1.85 (1.61) |
Month 12 of treatment, mean (SD) | 9.11 (6.37) |
Change from baseline, mean (SD) | 7.21 (5.71) |
Survival-related outcomes | |
Proportion of infants alive without permanent ventilation at month 12: fourth secondary outcome in the hierarchical testing approach | |
n (%) | 35 (85.4) |
90% CI | 73.4 to 92.2 |
P value (performance criterion = 42%) | < 0.0001 |
Subgroups | |
Disease duration ≤ 3 months (a total of 14 infants), Kaplan-Meier estimation of proportion (90% CI) | |||||||||||||||||||| |
Disease duration > 3 months (a total of 27 infants), Kaplan-Meier estimation of proportion (90% CI) | |||||||||||||||||||| |
Baseline median CHOP INTEND score ≤ 22 (a total of 21 infants), Kaplan-Meier estimation of proportion (90% CI) | |||||||||||||||||||| |
Baseline median CHOP INTEND score > 22 (a total of 20 infants), Kaplan-Meier estimation of proportion (90% CI) | |||||||||||||||||||| |
Time to death or permanent ventilation | |
Median time to death or permanent ventilation | Not estimated due to too few events |
Proportion of infants alive at month 12 | |
n (%) | 38 (92.7) |
90% CI | NR |
Time to death | |
Median time to death or permanent ventilation | Not estimated due to too few events |
Respiratory-related outcomes | |
Proportion of infants without permanent ventilation at month 12 | |
n (%) | 38 (92.7) |
90% CI | NR |
Time to permanent ventilation | |
Median time to permanent ventilation | Not estimated due to too few events |
Proportion of infants receiving respiratory support at month 12 | |
No pulmonary care | 10 (24.4) |
BiPAP support < 16 hours per day | |||||||| |
BiPAP support ≥ 16 hours per day | |||| |
Cough assist: Used daily for therapy; not illness related | |||||||| |
Cough assist: Used with an illness | |||| |
Nutrition-related outcomes | |
Proportion of infants with the ability to feed orally at month 12 | |
n (%) | 34 (82.9) |
90% CI | NR |
Health care utilization–related outcomes | |
Proportion of infants who did not require hospitalization by month 12 | |
n (%) | 20 (48.8) |
90% CI | NR |
Hospitalization rate by month 12 | |
Hospitalizations per patient-year (90% CI) | 1.30 (1.02 to 1.65) |
Outcomes related to health-related quality of life | |
ITQOL-SF47 overall health domain scores | |
Number of caregivers contributing to the change from baseline analysis, n | ||| |
Baseline, mean (SD) | |||||||||||||| |
Month 12 of treatment, mean (SD) | |||||||||||||| |
Change from baseline, mean (SD) | |||||||||||| |
ITQOL-SF47 parental impact: Emotional domain scores | |
Number of patients contributing to the change from baseline analysis, n | ||| |
Baseline, mean (SD) | |||||||||||||| |
Month 12 of treatment, mean (SD) | |||||||||||||| |
Change from baseline, mean (SD) | |||||||||||| |
ITQOL-SF47 parental impact: Time domain scores | |
Number of patients contributing to the change from baseline analysis, n | ||| |
Baseline, mean (SD) | |||||||||||||| |
Month 12 of treatment, mean (SD) | |||||||||||||| |
Change from baseline, mean (SD) | |||||||||||| |
BiPAP = bilevel positive airway pressure; BSID-III = Bayley Scales of Infant and Toddler Development, Third Edition; CHOP INTEND = Children’s Hospital of Philadelphia Infant Test of Neuromuscular Disorders; CI = confidence interval; HINE Section 2 = Hammersmith Infant Neurological Examination–Section 2; ITQOL-SF47 = Infant Toddler Quality of Life Questionnaire–47-item Short Form; NR = not reported; OR = odds ratio; SD = standard deviation.
Source: Drug Reimbursement Review sponsor submission.14
Efficacy: SUNFISH Part 2
Only those efficacy outcomes and analyses of subgroups identified in the review protocol are reported as follows. Table 13 provides a summary of the efficacy results of SUNFISH Part 2
Primary Outcome: Change From Baseline in MFM-32 Total Score at Month 12
Valid baseline MFM-32 baseline values were available for 115 patients and 59 patients in the risdiplam and placebo arms, respectively. Patients receiving risdiplam had a mean change from baseline at month 12 of 1.36 points (95% CI, 0.61 to 2.11) as opposed to a mean change in the placebo group of –0.19 (95% CI, –1.22 to 0.84). This translates into a mean difference from placebo of 1.55 points (95% CI, 0.30 to 2.81; P = 0.0156).
|||||||||||||||||||||||||||||||||||||||||||||||||||||||||||||||||||||||||||||||||||||||||||||||||||||||||||||||||||||||||||||||||||||||||||||||||||||||||||||||||||||||||| |||||||||||||||||||||||||||||||||||||||||||||||||||||||||||||||||||||||||||||||||||||||||||||||||||||||||||||||||||||||||||||||||||||||||||||||||||||||||||||||||||||||| |||||||||||||||||||||||||||||||||||||||||||||||||||||||||||||||||||||||||||||||||||||||||||||||||||||||||||||||||||||||||||||||||||||||||||||||||||||||||||||||||||||| |||| ||||||||||||||||||||||||||||||||||||||||||||||||||||||||||||||||||||||||||||||||||||||||||||||||||||||||||||||||||||
Subgroup analyses, presented in Figure 4, suggest that the only groups where the treatment effect excluded the null was observed in the youngest age group (2 years to < 6 years) and in the group with the least disease severity at baseline (MFM-32 total score at baseline ≤ first quartile [Q1]). Overall, all estimates show wide CIs. Numerically, the point estimate of the treatment effect decreased, and the range of the CIs increased as we moved into older age groups.
Figure 4: Subgroup Analyses of Change From Baseline in MFM-32 Total Score at Month 12
![Forest plot that shows that the change from baseline in MFM-32 Total Score at month 12 generally favoured treatment with risdiplam versus placebo in the subgroup analyses by age, disease severity, SMA type, and SMN2 copy number, except for the age group of 18 to 25 years and patients with 2 copies of the SMN2 gene. All the 95% CIs crossed unity, except for the between-group differences for the age group of 2 to ≤ 6 years, disease severity ≤ Q1 (patients with MFM32 baseline total score less than or equal to the first quartile [i.e., ≤ 25th percentile, and patients with 3 copies of the SMN2 gene]).](https://canjhealthtechnol.ca/index.php/cjht/article/download/sr0661r/version/186/364/1139/SR0661CL-fig04.png)
CI = confidence interval; MFM-32 = Motor Function Measure–32 items; SMA = spinal muscular atrophy; SMN2 = survival of motor neuron 2.
Source: Drug Reimbursement Review sponsor submission.14
Motor Function–Related Outcomes
Since none of the patients have reached the 24 months of treatment end point, only the results at 12 months of treatment are reported.
Change From Baseline of 3 or More in MFM-32 Total Score at Month 12 (Family 2)
This outcome was the second end point to be tested within the statistical testing hierarchy. Under this definition, 38.3% of patients in the risdiplam arm (44 out of 115 patients) were considered responders, while 23.7% of patients in the placebo group (14 out of 59 patients) were considered responders. The outcome was statistically significant with an OR of 2.35 (95% CI, 1.01 to 5.44) for risdiplam versus placebo.
Figure 5: Subgroup Analyses of Change From Baseline of 3 or More in MFM-32 Total Score at Month 12 (Family 2)

Figure 5 was removed upon request from the sponsor because it contained confidential information.
MFM-32 = Motor Function Measure–32 items.
Source: Drug Reimbursement Review sponsor submission.14
Change From Baseline of 0 or More in MFM-32 Total Score at Month 12
This outcome was outside the statistical testing hierarchy, meaning that no control for type I error was performed. A total of 69.6% of patients in the risdiplam arm (80 out of 115 patients) achieved this end point, while a total of 54.2% of patients in the placebo group (32 out of 59 patients) achieved it. The difference translates into an OR of 2.00 (95% CI, 1.02 to 3.93) for risdiplam versus placebo.
Change From Baseline in MFM-32 Domain 1 Score at Month 12
|||||||||||||||||||||||||||||||||||||||||||||||||||||||||||||||||||||||||||||||||||||||||||||||||||||||||||||||||||||||||||||||||||||||||||||||||||||||||||||||||||||||| | ||||||||||||||||||||||||||||||||||||||||||||||||||||||||||||||||||||||||||||||||||||||||||||||||||||||||||||||||||||||||||||||||||||||||||||||||||||||||||
Change From Baseline in MFM-32 Domain 2 Score at Month 12
|||||||||||||||||||||||||||||||||||||||||||||||||||||||||||||||||||||||||||||||||||||||||||||||||||||||||||||||||||||||||||||||||||||||||||||||||||||||||||||||||||||||| | ||||||||||||||||||||||||||||||||||||||||||||||||||||||||||||||||||||||||||||||||||||||||||||||||||||||||||||||||||||||||||||||||||||||||||||||||||||||
Change From Baseline in MFM-32 Domain 3 Score at Month 12
|||||||||||||||||||||||||||||||||||||||||||||||||||||||||||||||||||||||||||||||||||||||||||||||||||||||||||||||||||||||||||||||||||||||||||||||||||||||||||||||||||||||| | ||||||||||||||||||||||||||||||||||||||||||||||||||||||||||||||||||||||||||||||||||||||||||||||||||||||||||||||||||||||||||||||||||||||||||||||||||||||||
Change From Baseline in MFM-32 Domain 1 and Domain 2 Scores at Month 12
|||||||||||||||||||||||||||||||||||||||||||||||||||||||||||||||||||||||||||||||||||||||||||||||||||||||||||||||||||||||||||||||||||||||||||||||||||||||||||||||||||||||| | ||||||||||||||||||||||||||||||||||||||||||||||||||||||||||||||||||||||||||||||||||||||||||||||||||||||||||||||||||||||||||||||||||||||||||||||||||||||||
Change From Baseline in MFM-32 Domain 2 and Domain 3 Scores at Month 12
|||||||||||||||||||||||||||||||||||||||||||||||||||||||||||||||||||||||||||||||||||||||||||||||||||||||||||||||||||||||||||||||||||||||||||||||||||||||||||||||||||||||| | ||||||||||||||||||||||||||||||||||||||||||||||||||||||||||||||||||||||||||||||||||||||||||||||||||||||||||||||||||||||||||||||||||||||||||||||||||||||||
Change From Baseline in RULM Total Score at Month 12 (Family 3)
This outcome was the third end point to be tested within the statistical testing hierarchy. Valid RULM baseline values were available for 119 patients and 58 patients in the risdiplam and placebo arms, respectively. Patients receiving risdiplam had a mean change from baseline at month 12 of 1.61 points (95% CI, 1.00 to 2.22) as opposed to a mean change in the placebo group of 0.02 (95% CI, –0.83 to 0.87). The mean difference from placebo was 1.59 points (95% CI, 0.55 to 2.62; P = 0.0028).
Subgroup analyses, presented in Figure 6, show wide CIs in all the estimates and indicate similar patterns related to age groups that were observed in the primary outcome.
Figure 6: Subgroup Analyses of Change From Baseline in RULM Total Score at Month 12
![Forest plot that shows that the change from baseline in RULM Total Score at month 12 generally favoured treatment with risdiplam versus placebo in the subgroup analyses by age, disease severity, SMA type, and SMN2 copy number, except for patients with 2 copies of the SMN2 gene. All the 95% CIs crossed unity, except for the between-group differences for the age group of 2 to ≤ 6 years, disease severity > Q3 (patients with MFM32 baseline total score greater than third quartile [i.e., > 75th percentile]), and patients with 3 copies of the SMN2 gene.](https://canjhealthtechnol.ca/index.php/cjht/article/download/sr0661r/version/186/364/1141/SR0661CL-fig06.png)
CI = confidence interval; RULM = Revised Upper Limb Module; SMA = spinal muscular atrophy; SMN2 = survival of motor neuron 2.
Source: Drug Reimbursement Review sponsor submission.14
Change From Baseline of 0 or More in RULM Total Score at Month 12
This outcome was outside the statistical testing hierarchy. |||| of patients in the risdiplam arm |||||||| achieved this end point, while |||| of patients in the placebo group |||||| achieved it. The difference translates into an OR of |||||||||||||| |||||||||||| for risdiplam versus placebo.
Change From Baseline of 2 or More in RULM Total Score at Month 12
This outcome was outside the statistical testing hierarchy. A total of 47.9% of patients in the risdiplam arm (57 out of 119 patients) achieved this end point, while 31.0% of patients in the placebo group (18 out of 58 patients) achieved it. The difference translates into an OR of 2.18 (95% CI, 1.05 to 4.54) for risdiplam versus placebo.
Change From Baseline in HFMSE Total Score at Month 12 (Family 4)
This outcome was 1 of 2 end points within the fourth family of outcomes to be tested in the statistical hierarchy. Valid HFMSE baseline values were available for all patients. Patients receiving risdiplam had a mean change from baseline at month 12 of 0.95 (95% CI, 0.29 to 1.61) as opposed to a mean change in the placebo group of 0.37 (95% CI, –0.54 to 1.28). Mean difference from placebo was 0.58 points (95% CI, –0.53 to 1.69), which was statistically nonsignificant. As such, all subsequent end points in the statistical hierarchy should no longer be tested against a null hypothesis.
Figure 7: Subgroup Analyses of Change From Baseline in Total Score of the HFMSE at Month 12

Figure 7 was removed upon request from the sponsor because it contained confidential information.
HFMSE = Hammersmith Functional Motor Scale Expanded.
Source: Drug Reimbursement Review sponsor submission.14
Change From Baseline of 0 or More in HFMSE Total Score at Month 12
This outcome was outside the statistical testing hierarchy. |||| of patients in the risdiplam arm |||||||| achieved this end point, while |||| of patients in the placebo group |||||| achieved it. The difference translates into an OR of |||||||||||||| |||||||||||| for risdiplam versus placebo.
Change From Baseline of 2 or More in HFMSE Total Score at Month 12
This outcome was outside the statistical testing hierarchy. |||| of patients in the risdiplam arm |||||||| achieved this end point, while |||| of patients in the placebo group |||||| achieved it. The difference translates into an OR of |||||||||||||| |||||||||||| for risdiplam versus placebo.
Survival-Related Outcomes
No survival-related outcome was reported in the SUNFISH Part 2 study.
Respiratory-Related Outcomes
Change From Baseline in Best Percentage Predicted Value of Forced Vital Capacity at Month 12 for Family 4
Spirometry was performed on patients 6 years of age or older at the time of screening (83 in the risdiplam arm and 42 in the placebo arm). The FVC outcome was 1 of 2 end points within the fourth family of outcomes to be tested in the statistical hierarchy. Valid FVC baseline values were available for 83 patients and 40 patients in the risdiplam group and placebo group, respectively. Patients receiving risdiplam had a mean change from baseline at month 12 of –5.16 (95% CI, –7.93 to –2.39) as opposed to a mean change in the placebo group of –3.11 (95% CI, –6.95 to 0.74). The mean difference from placebo was –2.05 (95% CI, –6.67 to 2.56), which was statistically nonsignificant.
Figure 8: Subgroup Analyses of Change From Baseline in Best Percentage Predicted Value of FEV1 at Month 12

Figure 8 was removed upon request from the sponsor because it contained confidential information.
FEV1 = forced expiratory volume in 1 second.
Source: Drug Reimbursement Review sponsor submission.14
Change From Baseline in Best Percentage Predicted Value of Forced Expiratory Volume in 1 Second at Month 12
This outcome was outside the statistical testing hierarchy. Patients receiving risdiplam had a mean change from baseline at month 12 of –4.22 (95% CI, –7.49 to –0.96) as opposed to a mean change in the placebo group of –1.35 (95% CI, –5.91 to 3.20). This translates into a mean difference of –2.87 (95% CI, –8.36 to 2.62).
Nutrition-Related Outcomes
No nutrition-related outcome was reported in the SUNFISH Part 2 study.
Health Care Utilization–Related Outcomes
No related outcome was reported in the SUNFISH Part 2 study.
Health-Related Quality of Life–Related Outcomes
Change From Baseline in Caregiver-Reported SMAIS Total Score at Month 12 (Family 5)
This outcome was the fifth end point to be tested within the statistical testing hierarchy. However, since the fourth family of outcomes in the statistical hierarchy failed to achieve statistical significance, hypothesis testing was no longer valid for this, or subsequent outcomes, and any reported P value was nominal in nature and type I error was no longer controlled for in such outcomes. Valid baseline values were available for 116 patients and 60 patients in the risdiplam group and placebo group, respectively. Patients receiving risdiplam had a mean change from baseline at month 12 of 1.65 (95% CI, 0.66 to 2.63) as opposed to a mean change in the placebo group of –0.91 (95% CI, –2.23 to 0.42). The mean difference from placebo was 2.55 (95% CI, 0.93 to 4.17).
Change From Baseline in Patient-Reported SMAIS Total Score at Month 12
Valid baseline values were available for 43 patients and 23 patients in the risdiplam and placebo group, respectively. Patients receiving risdiplam had a mean change from baseline at month 12 of 1.04 (95% CI, –0.26 to 2.35) as opposed to a mean change in the placebo group of –0.40 (95% CI, –2.13 to 1.32). The mean difference from placebo was 1.45 (95% CI, –0.68 to 3.57).
Proportion of Individuals Rated as “Improved” on the CGI-C Scale at Month 12 (Family 6)
This outcome was the sixth and last end point to be tested within the statistical testing hierarchy. However, since the fourth family of outcomes in the statistical hierarchy failed to achieve statistical significance, hypothesis testing is no longer valid for this outcome, as there is no control for type I error. Valid baseline values were available for all patients. In all, 47.5% of patients in the risdiplam arm (57 out of 120 patients) achieved this end point, while 40.0% of patients in the placebo group (24 out of 60 patients) achieved it. The difference translates into an OR of 1.38 (95% CI, 0.70, 2.74) for risdiplam versus placebo.
Table 13: Efficacy Outcomes — SUNFISH Part 2
Outcome | Risdiplam N = 120 | Placebo N = 60 |
|---|---|---|
Primary outcome | ||
Change from baseline in MFM-32 total score at month 12 (family 1) | ||
Number of patients contributing to the analysis | 115 | 59 |
Baseline, mean (SD) | 45.48 (12.09) | 47.35 (10.12) |
Month 12, mean (SD) | ||| | ||| |
MMRM change from baseline, least squares mean (95% CI) | 1.36 (0.61 to 2.11) | –0.19 (–1.22 to 0.84) |
MMRM difference from placebo (95% CI) | 1.55 (0.30 to 2.81) | |
P value | 0.0156 | |
Adjusted P valuea | 0.0156 | |
Motor function–related outcomes | ||
Change from baseline ≥ 3 in MFM-32 total score at month 12 (family 2) | ||
Number of patients contributing to the analysis | 115 | 59 |
Responders, n (%) | 44 (38.3) | 14 (23.7) |
OR (95% CI) | 2.35 (1.01 to 5.44) | |
P value | 0.0469 | |
Adjusted P valuea | 0.0469 | |
Change from baseline ≥ 0 in MFM-32 total score at month 12 | ||
Number of patients contributing to the analysis | 115 | 59 |
Proportion of patients with ≥ 0 change, n (%) | 80 (69.6) | 32 (54.2) |
OR (95% CI) | 2.00 (1.02 to 3.93) | |
Subgroups | ||
Age group 2 years to 5 years, n/N (%) | |||| | |||| |
Age group 6 years to 11 years, n (%) | |||| | |||| |
Age group 12 years to 17 years, n (%) | |||| | |||| |
Age group 18 years to 25 years, n (%) | |||| | |||| |
Change from baseline in MFM-32 Domain 1 score at month 12 | ||
Number of patients contributing to the analysis | ||| | ||| |
Baseline, mean (SD) | ||| | ||| |
Month 12, mean (SD) | ||| | ||| |
Change from baseline, mean (95% CI) | |||||||||| | |||||||||||||| |
Change from baseline in MFM-32 Domain 2 score at month 12 | ||
Number of patients contributing to the analysis | ||| | ||| |
Baseline, mean (SD) | ||| | ||| |
Month 12, mean (SD) | ||| | ||| |
Change from baseline, mean (95% CI) | ||| | ||| |
Change from baseline in MFM-32 Domain 3 score at month 12 | ||
Number of patients contributing to the analysis | ||| | ||| |
Baseline, mean (SD) | ||| | ||| |
Month 12, mean (SD) | ||| | ||| |
Change from baseline, mean (95% CI) | ||| | ||| |
Change from baseline in MFM-32 Domains 1 and 2 scores at month 12 | ||
Number of patients contributing to the analysis | ||| | ||| |
Baseline, mean (SD) | ||| | ||| |
Month 12, mean (SD) | ||| | ||| |
Change from baseline, mean (95% CI) | ||| | ||| |
Change from baseline in MFM-32 Domains 2 and 3 scores at month 12 | ||
Number of patients contributing to the analysis | ||| | ||| |
Baseline, mean (SD) | ||| | ||| |
Month 12, mean (SD) | ||| | ||| |
Change from baseline, mean (95% CI) | ||| | ||| |
Change from baseline in RULM total score at month 12 (family 3) | ||
Number of patients contributing to the analysis | 119 | 58 |
Baseline, mean (SD) | 19.65 (7.22) | 20.91 (6.41) |
Month 12, mean (SD) | ||| | ||| |
MMRM change from baseline, least squares mean (95% CI) | 1.61 (1.00 to 2.22) | 0.02 (–0.83 to 0.87) |
MMRM difference from placebo (95% CI) | 1.59 (0.55 to 2.62) | |
P value | 0.0028 | |
Adjusted P valuea | 0.0469 | |
Change from baseline ≥ 0 in RULM total score at month 12 | ||
Number of patients contributing to the analysis | ||| | ||| |
Proportion of patients with ≥ 0 change, n (%) | ||| | ||| |
OR (95% CI) | ||| | |
Change from baseline ≥ 2 in RULM total score at month 12 | ||
Number of patients contributing to the analysis | ||| | ||| |
Proportion of patients with ≥ 2 change, n (%) | ||| | ||| |
OR (95% CI) | ||| | |
Change from baseline in total score of the HFMSE at month 12 (family 4) | ||
Number of patients contributing to the analysis | 120 | 60 |
Baseline, mean (SD) | 16.10 (12.46) | 16.62 (12.09) |
Month 12, mean (SD) | ||| | ||| |
MMRM change from baseline, least squares mean (95% CI) | 0.95 (0.29 to 1.61) | 0.37 (–0.54 to 1.28) |
MMRM difference from placebo (95% CI) | 0.58 (–0.53 to 1.69) | |
P value | 0.3015 | |
Adjusted P valuea | 0.3902 | |
Change from baseline ≥ 0 in HFMSE total score at month 12 | ||
Number of patients contributing to the analysis | ||| | ||| |
Proportion of patients with ≥ 0 change, n (%) | ||| | ||| |
OR (95% CI) | ||| | |
Change from baseline ≥ 2 in HFMSE total score at month 12 | ||
Number of patients contributing to the analysis | ||| | ||| |
Proportion of patients with ≥ 2 change, n (%) | |||||||| | |||||||| |
OR (95% CI) | |||||||||||||||||||| | |
Respiratory-related outcomes | ||
Change from baseline in FVC (best percentage predicted value) at month 12 (family 4) | ||
Number of patients contributing to the analysis | 83 | 40 |
Baseline, mean (SD) | ||| | || |
Month 12, mean (SD) | ||| | || |
MMRM change from baseline, least squares mean (95% CI) | ||| | |||||||||||||| |
MMRM difference from placebo (95% CI) | –2.05 (–6.67 to 2.56) | |
P value | 0.3804 | |
Adjusted P valuea | 0.3902 | |
Change from baseline in FEV1 (best percentage predicted value) at month 12 | ||
Number of patients contributing to the analysis | 83 | 40 |
Baseline, mean (SD) | ||| | || |
Month 12, mean (SD) | ||| | || |
MMRM change from baseline, least squares mean (95% CI) | –4.22 (–7.49 to –0.96) | –1.35 (–5.91 to 3.20) |
MMRM difference from placebo (95% CI) | –2.87 (–8.36 to 2.62) | |
Health-related quality of life–related outcomes | ||
Change from baseline in caregiver-reported SMAIS total score at month 12 (family 5) | ||
Number of caregivers contributing to the analysis | 116 | 60 |
Baseline, mean (SD) | ||| | ||| |
Month 12, mean (SD) | ||| | ||| |
MMRM change from baseline, least squares mean (95% CI) | 1.65 (0.66 to 2.63) | –0.91 (–2.23 to 0.42) |
MMRM difference from placebo (95% CI) | 2.55 (0.93 to 4.17) | |
Change from baseline in patient-reported SMAIS total score at month 12 | ||
Number of patients contributing to the analysis | 43 | 23 |
Baseline, mean (SD) | ||| | ||| |
Month 12, mean (SD) | ||| | ||| |
MMRM change from baseline, least squares mean (95% CI) | 1.04 (–0.26 to 2.35) | –0.40 (–2.13 to 1.32) |
MMRM difference from placebo (95% CI) | 1.45 (–0.68 to 3.57) | |
Proportion of individuals rated as “improved” on the CGI-C at month 12 (family 6) | ||
Number of patients contributing to the analysis | 120 | 60 |
Proportion of patients rated as “improved,” n (%) | 57 (47.5) | 24 (40.0) |
OR (95% CI) | 1.38 (0.70 to 2.74) | |
CI = confidence interval; CGI-C = Clinical Global Impression–Change; FEV1 = forced expiratory volume in 1 second; FVC = forced vital capacity; HFMSE = Hammersmith Functional Motor Scale Expanded; MFM-32 = Motor Function Measure–32 items; MMRM = mixed model of repeated measures; OR = odds ratio; RULM = Revised Upper Limb Module; D = standard deviation; SMAIS = Spinal Muscular Atrophy Independence Scale.
aThe adjusted P value was derived based on all the (unadjusted) P values from end points in order of the hierarchy up to the current end point.
Source: Drug Reimbursement Review sponsor submission.14
Harms: FIREFISH Part 2
Only those harms identified in the review protocol are reported as follows. See Table 14 for detailed harms data.
Adverse Events
At least 1 AE was reported in all enrolled infants. Upper respiratory tract infection was the most commonly reported AE (46.3%), followed by pneumonia (39.0%), pyrexia (39.0%), and constipation (19.5%).
Serious Adverse Events
SAEs were reported in 58.5% of the infants (24 out of 41 infants). The majority of the SAEs were related to respiratory problems or respiratory infections.
Withdrawals Due to Adverse Events
There were no withdrawals due to AEs (WDAEs).
Mortality
Three infants died during the study. Two deaths were attributed to pneumonia, and 1 to respiratory failure.
Notable Harms
Early animal studies with risdiplam suggested potential ophthalmic complications associated with treatment with risdiplam. Ophthalmic assessment in FIREFISH Part 2 identified 1 ophthalmic AE (heterophoria).
Table 14: Summary of Harms — FIREFISH Part 2
Harms | Risdiplam N = 41 |
|---|---|
Patients with ≥ 1 AEs | |
n (%) | 41 (100) |
Most common eventsa | |
Upper respiratory tract infection, n (%) | 19 (46.3) |
Pneumonia, n (%) | 16 (39) |
Pyrexia, n (%) | 16 (39) |
Constipation, n (%) | 8 (19.5) |
Nasopharyngitis, n (%) | 5 (12.2) |
Rhinitis, n (%) | 5 (12.2) |
Diarrhea, n (%) | 4 (9.8) |
Rash maculopapular, n (%) | 4 (9.8) |
Bronchiolitis, n (%) | 3 (7.3) |
Bronchitis, n (%) | 3 (7.3) |
Miliaria, n (%) | 3 (7.3) |
Rash, n (%) | 3 (7.3) |
Respiratory failure, n (%) | 3 (7.3) |
Respiratory tract infection, n (%) | 3 (7.3) |
Teething, n (%) | 3 (7.3) |
Urinary tract infection, n (%) | 3 (7.3) |
Vomiting, n (%) | 3 (7.3) |
Patients with ≥ 1 SAEs | |
n (%) | 24 (58.5) |
Most common eventsb | |
Pneumonia, n (%) | 13 (31.7) |
Bronchiolitis, n (%) | 2 (4.9) |
Respiratory failure, n (%) | 2 (4.9) |
Hypotonia, n (%) | 2 (4.9) |
Patients who stopped treatment due to AEs | |
n (%) | 0 |
Deaths | |
n (%) | 3 (7.3) |
Respiratory failure, n (%) | 1 (2.4) |
Pneumonia, n (%) | 2 (4.9) |
AE = adverse event; SAE = serious adverse event.
aFrequency > 5%.
bFrequency > 1 infant.
Source: Drug Reimbursement Review sponsor submission.14
Harms: SUNFISH Part 2
Only those harms identified in the review protocol are reported as follows. See Table 14 for detailed harms data.
Adverse Events
At least 1 AE was reported in 92.5% and 91.7% of enrolled patients in the risdiplam and placebo arms, respectively. Upper respiratory tract infection was the most commonly reported AE (31.7% in the risdiplam arm and 30.0% in the placebo arm), followed by nasopharyngitis (25.8% in the risdiplam arm and 25.0% in the placebo arm), pyrexia (20.8% in the risdiplam arm and 16.7% in the placebo arm), and headache (20.0% in the risdiplam arm and 16.7% in the placebo arm).
Serious Adverse Events
SAEs were reported in 20.0% of patients who received risdiplam and 18.3% in patients who received placebo. Most of the SAEs were related to respiratory problems or respiratory infections.
Withdrawals Due to Adverse Events
There were no WDAEs.
Mortality
There were no deaths reported.
Notable Harms
Early animal studies with risdiplam suggested potential ophthalmic complications associated with treatment with risdiplam. Ophthalmic assessment in SUNFISH Part 2 did not show any findings suggestive of risdiplam-induced effects.
Table 15: Summary of Harms — SUNFISH Part 2
Harms | Risdiplam N = 120 | Placebo N = 60 |
|---|---|---|
Patients with ≥ 1 AEs | ||
n (%) | 111 (92.5) | 55 (91.7) |
Most common events,a n (%) | ||
Upper respiratory tract infection | 38 (31.7) | 18 (30) |
Nasopharyngitis | 31 (25.8) | 15 (25) |
Pyrexia | 25 (20.8) | 10 (16.7) |
Headache | 24 (20) | 10 (16.7) |
Diarrhea | 20 (16.7) | 5 (8.3) |
Vomiting | 17 (14.2) | 14 (23.3) |
Cough | 17 (14.2) | 12 (20) |
Nausea | 11 (9.2) | 3 (5) |
Pneumonia | 10 (8.3) | 4 (6.7) |
Constipation | 10 (8.3) | 3 (5) |
Gastroenteritis | 9 (7.5) | 7 (11.7) |
Respiratory tract infection | 9 (7.5) | 7 (11.7) |
Rash | 9 (7.5) | 1 (1.7) |
Bronchitis | 8 (6.7) | 10 (16.7) |
Abdominal pain | 8 (6.7) | 5 (8.3) |
Abdominal pain upper | 7 (5.8) | 2 (3.3) |
Pharyngitis | 6 (5) | 3 (5) |
Oropharyngeal pain | 6 (5) | 7 (11.7) |
Arthralgia | 6 (5) | 0 (0) |
Influenza | 5 (4.2) | 3 (5) |
Rhinitis | 5 (4.2) | 3 (5) |
Rhinorrhea | 5 (4.2) | 3 (5) |
Conjunctivitis | 4 (3.3) | 3 (5) |
Varicella | 3 (2.5) | 3 (5) |
Epistaxis | 3 (2.5) | 3 (5) |
Productive cough | 0 (0) | 3 (5) |
Patients with ≥ 1 SAEs | ||
n (%) | 24 (20.0) | 11 (18.3) |
Most common events, n (%) | ||
Pneumonia | 9 (7.5) | 1 (1.7) |
Gastroenteritis | 2 (1.7) | 2 (3.3) |
Bacteremia | 2 (1.7) | 0 (0) |
Influenza | 2 (1.7) | 0 (0) |
Lung infection | 1 (0.8) | 1 (1.7) |
Appendicitis | 0 (0) | 1 (1.7) |
Bronchitis | 1 (0.8) | 0 (0) |
Laryngitis | 1 (0.8) | 0 (0) |
Lower respiratory tract infection, viral | 1 (0.8) | 0 (0) |
Lymph gland infection | 0 (0) | 1 (1.7) |
Pneumonia, bacterial | 1 (0.8) | 0 (0) |
Respiratory tract infection, viral | 0 (0) | 1 (1.7) |
Upper respiratory tract infection, | 1 (0.8) | 0 (0) |
Upper respiratory tract infection, viral | 1 (0.8) | 0 (0) |
Aspiration | 1 (0.8) | 0 (0) |
Asthma | 1 (0.8) | 0 (0) |
Atelectasis | 1 (0.8) | 0 (0) |
Pneumonia aspiration | 1 (0.8) | 0 (0) |
Respiratory failure | 0 (0) | 1 (1.7) |
Sleep apnea syndrome | 0 (0) | 1 (1.7) |
Pyrexia | 2 (1.7) | 0 (0) |
Medical device pain | 1 (0.8) | 0 (0) |
Femur fracture | 1 (0.8) | 1 (1.7) |
Fall | 1 (0.8) | 0 (0) |
Nephrolithiasis | 1 (0.8) | 1 (1.7) |
Hydronephrosis | 1 (0.8) | 0 (0) |
Lung operation | 1 (0.8) | 0 (0) |
Renal stone removal | 0 (0) | 1 (1.7) |
Constipation | 1 (0.8) | 0 (0) |
Oxygen saturation decreased | 0 (0) | 1 (1.7) |
Dehydration | 0 (0) | 1 (1.7) |
Febrile convulsion | 1 (0.8) | 0 (0) |
Patients who stopped treatment due to AEs | ||
n (%) | 0 | 0 |
Deaths | ||
n (%) | 0 | 0 |
AE = adverse event; SAE = serious adverse event.
aFrequency > 5%.
Source: Drug Reimbursement Review sponsor submission.14
Critical Appraisal: FIREFISH Part 2
Internal Validity
FIREFISH Part 2 was a single-arm, open-label, uncontrolled, phase III clinical trial that aimed to assess the efficacy and safety of risdiplam in infants with type I SMA. Specifically, patients were aged 1 month to 7 months with homozygous or heterozygous deletion or point mutation in the SMN1 gene, showing signs and symptoms attributed to type I SMA, and had 2 SMN2 gene copies. The study used information from the literature on the natural history of type I SMA to establish a minimum threshold against which FIREFISH Part 2 outcomes were tested. The study reported minimal missing data. Furthermore, a hierarchal statistical testing model was implemented to adjust for multiple testing in some secondary outcomes.
Limitations to the internal validity of FIREFISH Part 2 revolve around the following points:
Lack of a control group
In the absence of a concurrent control arm in the form of a placebo control or an active control, there is a potential for bias and confounding (i.e., an overestimate) in the treatment effect estimated with risdiplam in the single-arm trial FIREFISH Part 2. Without a randomized comparison to a control group, natural fluctuations in the disease cannot be controlled for, nor can the effects of known or unknown confounders. The sponsor justified the study design on the strong unmet need in the population, the poor prognosis of the disease, and the objective nature of the primary outcome. It should be noted that the sponsor method of determining a minimum threshold for testing the null hypothesis does not reduce the risk of bias and confounding in the same manner as randomization to a concurrent control arm. While basing these thresholds on well-described literature may be useful to reflect the natural history of the disease, this approach has many limitations that arise due to variations in study characteristics, measurement methods, patients’ characteristics, standards of care, and other potentially unknown or unmeasured confounders. The sponsor derived these thresholds from the upper 90% CI in the selected natural history studies. No other method of adjusting for potential differences between the single-arm trial participants and historical control was attempted. These limitations involving the study design and the method of establishing the null hypothesis threshold led to a level of uncertainty regarding the extent of the magnitude of the observed clinical effect that is solely attributed to risdiplam.
Lack of masking for intervention or outcome assessment
Investigators, outcome assessors, and parents were aware that infants received risdiplam. This may increase the risk of observer and respondent bias (on the part of the proxy) in assessing outcome measures. The potential risk of observer bias may not be strong in cases of objective outcomes, such as death and permanent ventilation. The sponsor video-recorded the assessment of motor milestone outcomes and used 2 independent central reviewers to determine the outcomes. The lack of blinding remains a concern for outcomes beyond death or permanent ventilation, especially in patient-reported (on the part of the proxy) outcomes.
Lack of imputation of missing data in continuous outcomes
While missing data were treated as a nonresponder in categorical outcomes, no method for imputing missing data were employed in continuous outcomes. These outcomes included a change in BSID-III score from baseline (||||||||||), and the ITQOL-SF47 results (||||||||||||). The sponsor conducted a sensitivity analysis to assess the potential impact of missing data on the CHOP INTEND–related outcomes, but no similar approach was described for the rest of the outcomes. While the sensitivity analysis of CHOP INTEND did not indicate that missing data have affected the outcome, it is unclear if this is also the case in the change in BSID-III score and in the ITQOL-SF47 outcomes.
Modified use of motor function assessment tools
The sponsor used the BSID-III in a modified way that was not part of the original development of the tool. Although the sponsor indicated that these modifications were established with the help of the original tool developers, the extent at which the validity assessment of the original tool applies to the modified tool is unclear. Similarly, the HINE Section 2 was used with the exclusion of the voluntary grasp item and with a definition of motor responders that is not assessed for validity on the original tool. Additionally, there is no established MID regarding the BSID-III raw score or the quantifiable change in HINE Section 2 scores that is the basis of the definition of motor responder.
The use of a 1-sided 5% significance testing
The sponsor used a 1-sided 5% significance level for determining the statistical significance of the primary outcome. This approach provides a larger threshold to accept treatment differences as causative when compared to a 2-sided test or a 1-sided test at a 2.5% significance level. External Validity
The inclusion and exclusion criteria of FIREFISH Part 2 enrolled patients who are, or most likely to be, diagnosed with type I SMA and are at an early stage of the disease. The outcomes used to inform on the efficacy are clinically meaningful and reflective of clinical practice. They are, specifically, sitting without support, death or permanent ventilation, and other motor functions and respiratory measures.
Limitations to the external validity of FIREFISH Part 2 revolve around the following points:
Narrow inclusion criteria
FIREFISH Part 2 did not include infants who were pre-symptomatic, who were 7 months of age or older, or who had more than 2 copies of SMN2. Other SMA infants who were not included in the study may have had a more severe presentation of the disease (e.g., older SMA type I patients, patients requiring ventilatory support) and the results of FIREFISH Part 2 cannot inform on the extent of potential benefit offered by risdiplam for these patients. In addition, there were no infants younger than 2 months enrolled in the study.
Changes in the clinical practice and the lack of a direct head-to-head comparison to other disease-modifying agents
The clinical trial program investigating risdiplam had started when other SMA disease-modifying agents were not yet available for patients with SMA. At the moment, in Canada, patients with a diagnosed SMA who meet the eligibility criteria for treatment with nusinersen may have already received several doses of nusinersen. In addition, onasemnogene abeparvovec has recently gained market authorization in Canada. As such, the thresholds for efficacy that were used to inform the null hypothesis of various outcomes is no longer truly reflective of the disease progression in the current clinical practice in Canada, and currently treated infants are now expected to live longer and gain certain motor milestones. The results of the efficacy of risdiplam, presented in FIREFISH Part 2, cannot inform on its potential comparative efficacy to nusinersen or onasemnogene abeparvovec.
The use of sitting unsupported for 5 seconds as a primary outcome versus 30 seconds
According to the experts consulted for this review, the 30 seconds is a more clinically relevant outcome than sitting unsupported for 5 seconds. As such, it is not clear why the 5 seconds was chosen over the 30 seconds. There is also a concern that the assessment of sitting unsupported for 5 seconds is less objective than 30 seconds. Although the sponsor has implemented an independent review process in the assessment of the primary outcome, the lack of a control arm limits our ability to judge possible biases in the assessment procedure.
Lack of Canadian sites
No Canadian sites participated in FIREFISH Part 2. While there is no clear reason to assume major differences in the standards of practice and the patient population between the US and Canada, the lack of representation of Canadian patients could potentially reduce the generalizability to Canadian settings if practice variation exists.
Assessment period of 12 months
Considering the lifelong nature of SMA, and the narrow SMA population in FIREFISH Part 2, generalizability of the efficacy and safety results beyond the presented 12 months remains uncertain. It is, however, understood that the study is ongoing until it has reached the 24-month mark and will continue into an open-label extension study until the time of drug commercialization.
Lack of a clearly established MID in the total scores of the motor function tools used in FIREFISH Part 2
The sponsor provided several motor function–related outcomes that are based on achieving a certain threshold of total points or points difference versus baseline in the CHOP INTEND, HINE Section 2, and BSID-III. With the possible exception of HINE Section 2, the CHOP INTEND and BSID-III do not have a clearly established MID for total scores or score difference. This limits our ability to understand the extent of the clinical significance of the observed effect.
The use of motor function tools that are not commonly conducted in clinical practice
The clinical experts consulted on this review indicated that the assessment of motor function may vary from centre to centre, with no uniform approach to motor function assessment throughout Canada. While some centres make use of the CHOP INTEND, some experts were of the opinion that this tool is more relevant in a research setting than in Canadian practices and would require additional resources to routinely administer to patients. Similarly, while individual items of the BSID-III are commonly conducted, the full set of the BSID-III and a calculated score is not.
The definition of hospitalization may provide little value in understanding the health care utilization outside the study
Hospitalization is defined in FIREFISH Part 2 as any admission for 2 or more days for any reason that is not due to the study treatment. It is not clear why admissions of a duration less than 2 days were not considered relevant. Also, considering the open-label, single-arm design of FIREFISH Part 2, there is potential for a biased determination of what constitutes a hospitalization that is not due to the study treatment.
Critical Appraisal: SUNFISH Part 2
Internal Validity
SUNFISH Part 2 was a double-blind, placebo-controlled trial that aimed to assess the efficacy of risdiplam in SMA type II patients and non-ambulatory SMA type III patients. Patients were randomized on a 2:1 ratio to risdiplam and placebo, respectively, using an interactive response system. Randomization was stratified by age groups (2 years to 5 years, 6 years to 11 years, 12 years to 17 years, and 18 years to 25 years). The study measured motor function using several tools, with multiple analyses based on outcome measurement data from each tool. The study instituted a gatekeeping hierarchy approach to adjust for multiple testing and to control the type I error rate.
Limitations to the internal validity of SUNFISH Part 2 revolve around the following points:
Unequal randomization ratio
The sponsor randomized patients in a 2:1 ratio to risdiplam or placebo, respectively. Potential challenges that may be associated with such an allocation ratio include the need for larger sample size to capture differences in treatment effect in secondary outcomes, and the potential for reducing the effectiveness of blinding as investigators and assessors would be aware that the probability of being allocated to active treatment is twice that of control. A reduction in statistical power due to the 2:1 randomization ratio in the secondary outcomes cannot be ruled out as an a priori power calculation was only performed for the primary outcome.
Unequal number of randomized patients in each age group
The sponsor’s original plan aimed to randomize a total of 168 patients, stratified by age groups (2 years to 5 years, 6 years to 11 years, 12 years to 17 years, and 18 years to 25 years at randomization). However, only a maximum of 30 patients were to be included and randomized in the age group of 18 years to 25 years, while a minimum of 45 patients were to be randomized into each of the other age groups. The study ended up randomizing 180 patients, of which only 22 were in the age group of 18 years to 25 years. This discrepancy in the number of patients in the age groups means that the age group of 18 years to 25 years did not contribute the same magnitude of effect to the assessed outcomes as the other age groups. In addition, the clinical experts consulted on this review identified this discrepancy as a source of bias toward the younger patients who are biologically more likely to benefit from the treatment.
Imbalance in the baseline characteristics
Some of the more notable discrepancies in baseline characteristics between the risdiplam arm and the placebo arm was the proportion of patients with 3 SMN2 copies (89.2% in the risdiplam arm and 83.3% in the placebo arm), and in the |||||||||||||||||||||||||||||||||||||||||||||||||||||||||||||||||||||||||||||||||||||||||||||||||||||||||||||||||||||||||||||||||||. However, the clinical experts consulted on this review were of the opinion that these discrepancies are unlikely to have a confounding effect on the results. As such, it is not clear if these discrepancies have a directional bias effect or have any effect at all.
Handling and assessing the impact of missing data
The sponsor provided a clear description of handling missing data for the MFM-32, RULM, and HFMSE outcomes. However, the sponsor only planned to conduct a sensitivity analysis with a different approach to data imputation for the primary outcome. This sensitivity analysis was not reported as the percentage of missing data were below the threshold required in the sponsor’s protocol. There was no clear description on the method of handling missing data in outcomes beyond the MFM-32, RULM, and HFMSE. The SMAIS-related outcomes had a considerable amount of missing data and there was no sensitivity analysis to inform on the impact of the missing data in the SMAIS-related outcomes.
External Validity
The inclusion criteria in SUNFISH Part 2 captured a wide range of SMA patients — specifically, patients diagnosed as type II SMA or non-ambulatory type III SMA with a wide age range from 2 years up until 25 years. The outcomes included several potentially relevant measures, including the proportion of motor function responders and respiratory-related outcomes.
Limitations to the external validity of SUNFISH Part 2 revolve around the following points:
Limited generalizability to the adult population
Only 22 out of the 180 patients randomized were in the age group of 18 years to 25 years, the fewest number among the age groups in the study (11.7% in risdiplam and 13.3% in placebo). This limits the contribution of adult patients to the overall conclusion of the study; it also limits the generalizability from the results to adult patients. This limitation was apparent in the various subgroup analyses, where the point estimate of the treatment effect appeared to be lower than the other age groups with wider CIs spanning the null. There was no clear justification as to why the study was planned to purposefully limit the enrolment of adult patients while bolstering other age groups. Investigating the efficacy of risdiplam in the adult population is of special relevance, considering the unmet need and the irreversible nature of the disease progression. The small number of adult patients and the large uncertainty observed in the subgroup analyses limits the generalizability of the overall result of SUNFISH Part 2 to the adult population.
Changes in the clinical practice and the lack of direct head-to-head comparison to other disease-modifying agents
Although it is understandable that the clinical development program for risdiplam was initiated at a time when disease-modifying agents were not yet available, the current clinical landscape in Canada is one where all SMA patients who meet certain criteria are already on nusinersen, and newly diagnosed patients will have nusinersen as a therapeutic option. The SUNFISH trial cannot inform on the comparative efficacy to nusinersen.
Lack of the inclusion of ambulatory patients
Considering the nature of SMA, where alpha motor neurons are irreversibly lost as disease progresses, patients with higher motor functions may have a greater number of alpha motor neurons than patients who have lost such motor functions. Ambulatory patients may thus exhibit a greater variation in the response than non-ambulatory patients, and the generalizability of the SUNFISH results to this patient population may be limited.
The use of outcome measures without a well-defined MID and results not meeting proposed MID
The tool used for the primary outcome, MFM-32, did not have a well-accepted method of assessing the MID. However, the sponsor has indicated that a change of 3 points or more may translate into either the acquisition of a new function or the improvement in performance of several functions. Based on this, the primary outcome, both in point estimate and upper range of the 95% CI, fails to demonstrate such difference (MFM-32 change from baseline mean difference = 1.55 points [95% CI, 0.30 to 2.81]). Two other key motor function measurement tools that were used by the sponsor had published MIDs: RULM had an MID of 2.9 and HFMSE had an MID of 2. The results of the mean difference versus placebo in both of these outcomes also does not achieve the published MID.
Strong response in the placebo arm
Considering the deteriorating nature of the disease and the irreversible nerve damage to alpha motor neurons, the response observed in the placebo arm would have been expected to be minimal. The presence of a relatively strong response in the placebo arm suggests either the need for validated assessment tools that reflect the disease natural history, a potential learning effect in the used outcomes, and/or further studies into the disease natural history in the population reflected in SUNFISH Part 2. In any case, improvements in motor function scales would need to take into consideration the presence of improvements unrelated to treatment.
Assessment period of 12 months
Considering the lifelong nature of SMA and the narrow SMA population in SUNFISH Part 2, generalizability of the efficacy and safety results beyond the presented 12 months remains uncertain. It is, however, understood that the study is ongoing until it reaches the 24-month mark and will continue into an open-label extension study until the time of drug commercialization.
The use of motor function tools that are not commonly conducted in clinical practice.
The clinical experts consulted on this review indicated that the use of MFM-32 is not common across Canadian practices and may require a change in usual assessment practices to incorporate it.
Indirect Evidence
Objectives and Methods for the Summary of Indirect Evidence
There is an absence of direct head-to-head studies comparing risdiplam against other therapies for patients with SMA; ITCs that include risdiplam can provide information on the comparative effectiveness relative to other therapies. The objective of this section is to summarize and critically appraise the evidence available regarding the indirect comparative efficacy of risdiplam to other treatments of SMA in any available ITC.
Description of Indirect Treatment Comparison
The sponsor-submitted ITC aimed to compare the relative treatment effect of risdiplam versus relevant comparators for the treatment of 2 SMA populations: infantile-onset (type I) SMA with 2 copies of the SNM2 gene, and later-onset SMA. Relevant studies were identified through a systematic search of the literature and ITCs were conducted through an anchored MAIC; where an anchored approach was not possible, an unanchored MAIC was used.
An overview of the included ITC is presented in Table 16.
Table 16: Study Selection Criteria and Methods for Indirect Treatment Comparisons
Criteria | Sponsor-submitted ITC |
|---|---|
Population |
|
Intervention |
|
Comparator |
|
Outcome |
|
Study design |
|
Publication characteristics | English language only |
Exclusion criteria |
|
Databases searched |
|
Selection process | Not specified |
Data extraction process | Not specified |
Quality assessment | NICE checklist |
6MWT = 6-minute walk test; AE = adverse event; BSID-III = Bayley Scales of Infant and Toddler Development, Third Edition; CENTRAL = Cochrane Central Register of Controlled Trials; CHOP INTEND = Children’s Hospital of Philadelphia Infant Test of Neuromuscular Disorders; CMAP = compound muscle action potential; HINE Section 2 = Hammersmith Infant Neurological Examination–Section 2; = HFMS = Hammersmith Functional Motor Scale; HFMSE = Hammersmith Functional Motor Scale Expanded; HRQoL = health-related quality of life; ITC = indirect treatment comparison; MFM-32 = Motor Function Measure–32 items; NICE = National Institute for Health and Care Excellence; PedsQL = Pediatric Quality of Life Inventory; RCT = randomized controlled trial; RULM = Revised Upper Limb Module; SMA = spinal muscular atrophy; ULM = Upper Limb Module.
Source: Drug Reimbursement Review sponsor submission.14
Methods of the Sponsor-Submitted Indirect Treatment Comparison
Objectives
The objective of the sponsor-submitted ITC was to compare the relative treatment effect of risdiplam versus other disease-modifying treatments for SMA. The lack of head-to-head studies comparing risdiplam to other disease-modifying treatments was provided as a rationale for conducting the ITC. The ITC aimed to provide analyses of outcomes related to motor function, respiratory, HRQoL, and safety. The sponsor-submitted ITC aimed to assess the indirect comparative effectiveness of risdiplam in patients with SMA type I and, in a separate analysis, in patients with other SMA types.
Study Selection Methods
The sponsor-submitted ITC described a systematic literature review process that searched several key bibliographic databases and several supplemental sources. The submitted available material did not provide the search strategy or the date at which the search was conducted. In addition, the process of screening retrieved results and extracting data from retrieved results was not outlined in the submitted material. Assessment of the quality of included randomized controlled trials was done through the use of the National Institute for Health and Care Excellence checklist, while assessment of single-arm trials was done through the Agency for Health care Research and Quality tool for risk of bias assessment for single-arm trials. However, the approach for handling poor-quality studies was not outlined in the submitted material.
Efficacy analysis within the SMA type I population included motor function outcomes as measured by the HINE Section 2 and the CHOP INTEND tools, overall survival, and event-free survival. Efficacy analysis in the patient population with type II SMA or type III SMA included motor function outcomes as measured by the HFMSE and RULM tools. For each outcome of interest, the publication must report Kaplan–Meier curves for time-to-event outcomes, mean and/or median for continuous outcomes, or the proportion of individuals for binary outcomes.
Indirect Treatment Comparison Analysis Methods
The sponsor’s overall approach used the MAIC methodology. MAIC is a method used to adjust for between-trial heterogeneity related to differences in baseline patient characteristics to reduce bias in the estimated relative effects between 2 interventions. Under this approach, individual patient-level data from risdiplam studies were weighted to produce a risdiplam-treated sample that resembles the aggregate baseline characteristics of the study of the comparator drug.
Three different MAIC approaches to produce an indirect comparison were outlined in the sponsor-submitted ITC: unanchored MAIC, anchored MAIC, and restricted Bayesian NMA.
Unanchored Matching-Adjusted Indirect Comparison
Unanchored MAIC was needed for the analyses that included the FIREFISH study. Considering the single-arm nature of FIREFISH, there was no possibility to anchor the comparison through a common arm between the risdiplam studies and the comparator study. As such, an unanchored MAIC was performed.
For this analysis, the sponsor treated patients who received the therapeutic dose of risdiplam in the phase II Part 1 of FIREFISH (N = 21) as if they were enrolled in the same study as patients who were in the confirmatory phase III Part 2 of FIREFISH (N = 41). There was no clear description of a method to address potential heterogeneity due to variation in the study design between the 2 parts.
In cases where the comparator study had a shorter duration than FIREFISH, only assessments in FIREFISH conducted at a certain point before the clinical cut-off date were to be included to match the follow-up period of the comparator study.
To determine the effect modifiers and prognostic factors that needed to be included in the weighting model for the indirect comparison, the sponsor conducted a literature search, coupled with a discussion with clinical experts and the internal team. The sponsor ended up adjusting for the following effect modifiers and prognostic factors: mean age at first dose, duration of symptoms, and mean CHOP INTEND score. These were chosen from a list of identified effect modifiers and prognostic factors. Excluded effect modifiers and prognostic factors included mean age at symptom onset, mean age at diagnosis, mean weight, gender, race, mean HINE Section 2 score, ulnar compound muscle action potential (CMAP) amplitude, and peroneal CMAP amplitude. Decisions for the inclusion of effect modifiers and prognostic factors were determined based on the availability of the effect modifiers and prognostic factors in the studies; other reasons for dropped factors were related to a determination by the sponsor that they were already reflected in 1 or more included factors.
A weight for each patient in the FIREFISH study was constructed through a log weight linear regression model where regression parameters were estimated using the method of moments to match effect modifier distribution between trials. Outcomes of patients in the FIREFISH study were then reweighted according to the weight estimates from the model. CIs were obtained through bootstrapping on the whole MAIC process. The sponsor considered methods for estimating the systematic error in the estimates but was unable to implement these approaches due to the small sample size of trials.
Anchored MAIC
An anchored MAIC was conducted for analyses that included the SUNFISH Part 2 study, considering the existence of the placebo arm. When considering the nusinersen study, CHERISH, an assumption was made that placebo was comparable to sham. Based on this assumption, the sponsor aimed to include relevant effect modifiers in the model, but not prognostic factors, as an anchored approach should, theoretically, address the issue of prognostic factors.
The sponsor-submitted ITC chose a subsample of SUNFISH Part 2 in the analysis in an effort to match the inclusion and exclusion criteria of the comparator study (CHERISH).
To determine the effect modifiers that needed to be included in the weighting model for the indirect comparison, the sponsor conducted a literature search, coupled with a discussion with clinical experts and the internal team. The sponsor ended up adjusting for the following effect modifiers: age at screening, baseline motor function score, and SMN2 copy number. These were chosen from a list of identified effect modifiers. Excluded effect modifiers included age at symptom onset, age at diagnosis, disease duration, severe contractures, gender, race, motor milestones achieved, WHO motor milestones achieved, and geographic location. Decisions for the inclusion of effect modifiers were determined based on the availability of the effect modifiers in the studies; other reasons for dropped factors were related to a determination by the sponsor that they were already reflected in 1 or more included factors.
A weight for each patient in the SUNFISH Part 2 study was constructed through a log weight linear regression model where regression parameters were estimated using the method of moments to match effect modifier distribution between trials. Outcomes of patients in the SUNFISH Part 2 study were then reweighted according to the weight estimates by the model. Matching was only conducted on mean baseline characteristics and not on variability, due to the limited number of patients in SUNFISH Part 2. CIs were obtained through bootstrapping on the whole MAIC process.
Restricted Network Meta-Analysis
This was conducted as an alternative approach to the anchored MAIC. The Bayesian approach was performed through a Markov chain Monte Carlo technique. The analysis was performed under both fixed- and random-effects models, where the lower value of the diagnostic information criterion determined the best model fit. Study and treatment-specific terms were given vague priors, while efficacy end points under the random-effects model were given published informative priors due to a paucity of data. The analysis was initiated on 3 chains with different initial values and convergence was assessed using the Brooks-Gelman-Rubin plots. The number of burn-ins, the number of iterations, the assessment of residual deviance, and the assessment of inconsistency were not outlined in the submitted material.
Results of Sponsor-Submitted Indirect Treatment Comparison
Summary of Included Studies
The literature search produced a total of 772 records, of which 64 studies underwent full-text screening. Ultimately, 5 studies were included. Of these 5 studies, 3 addressed the population of infantile-onset type I SMA: FIREFISH (risdiplam), ENDEAR (nusinersen), and STR1VE-US (onasemnogene abeparvovec). The remaining 2 studies addressed SMA type II and SMA type III (symptom onset beyond the infantile period): SUNFISH (risdiplam) and CHERISH (nusinersen).
SMA Type I–Related Studies
The ITC of risdiplam to nusinersen was informed by the FIREFISH and ENDEAR studies. The 2 studies had different designs: FIREFISH consisted of a subgroup of patients who received the high dose in the dose-finding Part 1 pooled with patients from the single-arm design of the confirmatory Part 2 study, while ENDEAR was a double-blind, sham-controlled trial. FIREFISH is an ongoing trial with data available for month 12, and ENDEAR was terminated early and no results were reported at 12 months of treatment, with a median follow-up time in the nusinersen arm of 280 days. In general, enrolment criteria were similar between the 2 trials. Both had similar age restrictions and genetic confirmation of disease, and required infants to have 2 copies of the SMN2 gene.
Overall, the patient characteristics of risdiplam were similar to those of the ENDEAR trial in terms of age and disease duration. The severity of disease at baseline was worse in the FIREFISH patients (CHOP INTEND mean = 22.47 [SD = 6.79] points) when compared with the nusinersen-treated patients (CHOP INTEND mean = 26.63 [SD = 8.13] points), with a similar trend observed in the HINE Section 2 score and in the mean CMAP negative peak amplitude.
To address the discrepancy in the follow-up time, a modified dataset of FIREFISH with a median time in the study of 283 days was used in the base-case analyses of binary end points. In this dataset, any events occurring 6 months before the data cut-off were not considered. For analyses of time-to-event end points (event-free survival, overall survival), all available data from the 12-month data cuts were used.
Outcome definition was similar in terms of the definition of motor responder using the HINE Section 2 score as well as the definition of permanent ventilation.
Although the sponsor-submitted ITC included the STR1VE-US study, unanchored MAIC analysis was not feasible due to lack of overlap between patient populations. As such, a description of the characteristics of STR1VE-US contrasted with FIREFISH is not summarized here.
The sponsor-submitted ITC reported the quality of the included studies as “low risk of bias” or “low to unclear risk of bias.”
SMA Type II– and Type III–Related Studies
The ITC of risdiplam to placebo was informed through the SUNFISH Part 2 (N = 180) and CHERISH (N = 126) studies. Both studies were double-blind, randomized controlled trials. SUNFISH Part 2 was a placebo-controlled study as opposed to the sham-controlled CHERISH study. In addition, SUNFISH is an ongoing study with results available for month 12 of treatment, while CHERISH is a completed study with results of a total follow-up period of 15 months.
There were considerable differences in the inclusion and exclusion criteria of these 2 studies. Specifically, SUNFISH allowed patients up to 25 years of age to enrol, while in CHERISH, only ages up to 12 years were eligible. Restrictions on HFMSE score (a score between 10 and 54) were applied to CHERISH, while no such restrictions were made with SUNFISH. CHERISH excluded patients with severe scoliosis or severe contractures and patients requiring non-invasive ventilation for more than 6 hours during a 24-hour period; however, these exclusion criteria were not applied in SUNFISH.
Baseline characteristics are reflective of the differences in the inclusion and exclusion criteria. Patients in SUNFISH were much older at screening, had a considerably longer disease duration, and a lower HFMSE score. The mean age at symptom onset was similar; however, the range of ages was larger in SUNFISH compared to CHERISH. Gender, RULM score, and SMN2 copy number were similar.
To address the clinical heterogeneity between the 2 trials, only a subset of SUNFISH Part 2 patients was selected according to the following criteria:
age at screening of 9 years or younger (the maximum age enrolled in CHERISH was 9 years)
an HFMSE baseline score of 10 or more (an HFMSE score of 10 or more was a CHERISH inclusion criterion)
no severe scoliosis (the presence of severe scoliosis was a CHERISH exclusion criterion).
In total, 38% of patients enrolled in SUNFISH Part 2 met the subset criteria. Compared to CHERISH, the subset patients were older, had a longer disease duration, and had higher HFMSE and RULM scores. The sponsor-submitted ITC indicated that there were other differences for which there was no way to restrict the subset. These include the presence of severe contractures, difference methods to define independent sitting, and the exclusion of patients requiring non-invasive ventilation of more than 6 hours in CHERISH.
The definition of end points was similar between the studies as both used the RULM and HFMSE scores. The sponsor-submitted ITC report extracted CHERISH outcomes at month 12 where available.
The sponsor-submitted ITC reported the quality of the included studies as “low risk of bias” or “low to unclear risk of bias.”
Results
SMA Type I
The evidence network of the studies informing on the indirect comparison of risdiplam to other disease-modifying therapies is presented in Figure 9. No statistical analysis was possible for the indirect comparison of risdiplam with onasemnogene abeparvovec due to the small overlapping sample post-adjustment.
Subsequent to matching based on the mean age at first dose, mean disease duration at screening, and mean score on CHOP INTEND, an effective sample size of 36.5 was estimated out of the original 58 patients pooled into FIREFISH. The adjusted population had a higher proportion of female patients, a lower proportion of patients with ventilatory support, and a lower mean HINE Section 2 score than patients in the ENDEAR study. These changes are outlined in Table 17.
Ventilation-free survival indicated a hazard ratio of 0.20 (95% CI, 0.06 to 0.42) of risdiplam versus nusinersen. Similarly, overall survival indicated a hazard ratio of 0.26 (95% CI, 0.03 to 0.66). Motor function assessment using the HINE Section 2 showed favourable results for risdiplam in the outcomes of motor milestone response, full head control, and sitting without support, while the outcome of rolling was favourable in the direction of nusinersen. Two outcomes, sitting with and without support and standing, did not show a clear direction. However, all the HINE Section 2–related outcomes had wide CIs, indicating poor statistical robustness in the data. The results are summarized in Table 18.
Beyond weight histograms, no assessment of model diagnostics or residual bias were provided.
Figure 9: Network of Studies Informing Indirect Treatment Comparison in Patients With Type I SMA
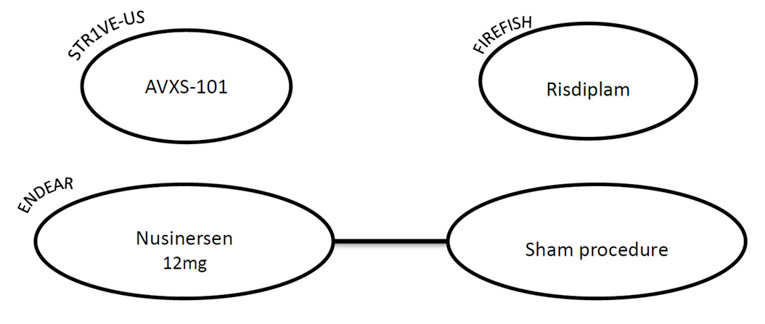
SMA = spinal muscular atrophy.
Source: Drug Reimbursement Review sponsor submission.14
Table 17: FIREFISH Baseline Characteristics Post–ENDEAR Matching
Characteristic | Pre-matching pooled FIREFISH | Post-matching pooled FIREFISH | ENDEAR |
|---|---|---|---|
Risdiplam | Risdiplam | Nusinersen and sham | |
Sample size (ESS) | 58 | 58 (36.5) | 41 |
Mean age at first dose (days) | 163 | 169 | 169 |
Female gender | 57% | 69% | 55% |
Mean age at symptom onset (days) | 51 | 55 | 60 |
Mean disease duration at screening (days) | 91 | 94 | 94 |
Mean age at diagnosis (weeks) | 12.7 | 14.3 | 14.3 |
Mean score on CHOP INTEND | 22.47 | 27.24 | 27.24 |
Mean HINE Section 2 score | 0.93 | 1.28 | 1.37 |
Patients with ventilatory support | 29% | 18% | 22% |
CHOP INTEND = Children’s Hospital of Philadelphia Infant Test of Neuromuscular Disorders; ESS = effective sample size; HINE Section 2 = Hammersmith Infant Neurological Examination–Section 2.
Source: Drug Reimbursement Review sponsor submission.14
Table 18: Results of the Sponsor-Submitted Indirect Treatment Comparison in the SMA Type I Network
Outcome | Unanchored MAIC* | |
|---|---|---|
Risdiplam vs. nusinersen | ESS | |
Survival-related outcomes | ||
Ventilation-free survival, HR (95% CI) | 0.20 (0.06 to 0.42) | 36.5 |
Overall survival, HR (95% CI) | 0.26 (0.03 to 0.66) | 36.5 |
HINE Section 2 motor milestone outcomes | ||
Motor milestone response, OR (95% CI) | ||| | 36.5 |
Full head control, OR (95% CI) | ||| | 36.5 |
Rolling, OR (95% CI) | ||| | 36.5 |
Sitting without support, OR (95% CI) | ||| | 36.5 |
Sitting with and without support, OR (95% CI) | ||| | 36.5 |
Standing, OR (95% CI) | ||| | 36.5 |
CI = confidence interval; ESS = effective sample size; HINE Section 2 = Hammersmith Infant Neurological Examination–Section 2; HR = hazard ratio; MAIC = matching-adjusted indirect comparison; OR = odds ratio; SMA = spinal muscular atrophy; vs. = versus .
Source: Drug Reimbursement Review sponsor submission.14
SMA Type II and SMA Type III
The evidence network of the studies informing on the indirect comparison of risdiplam to other disease-modifying therapies is presented in Figure 10.
Subsequent to anchored matching based on the mean age at screening, mean RULM at baseline, and mean SMN2 copy number, an effective sample size of 28.3 in the risdiplam arm and 8.8 in the placebo arm was estimated. Baseline characteristics before and after weighting are presented in Table 19.
Results of the anchored MAIC analysis produced unrealistically wide CIs, indicating a lack of statistical robustness to provide a valid result. Sensitivity analyses using the restricted NMA approach as well as the Bucher method did not provide a clear result that would favour 1 intervention over another and were accompanied with a wide CI. A summary of the obtained MAIC and NMA results is presented in Table 19.
Beyond weight histograms, no assessment of model diagnostics or residual bias were provided.
Figure 10: Network of Studies Informing Indirect Treatment Comparison in Patients With SMA Type II or SMA Type III
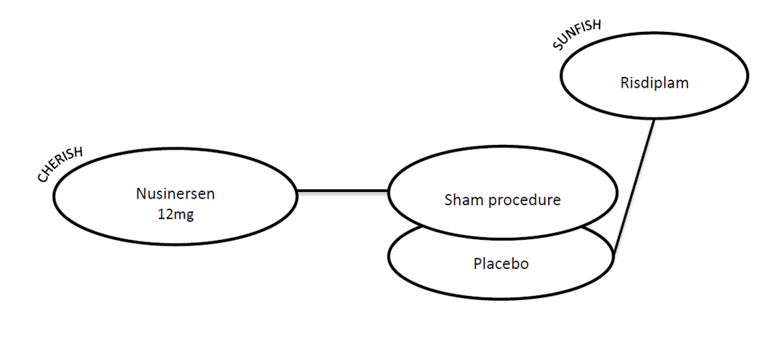
SMA = spinal muscular atrophy.
Source: Drug Reimbursement Review sponsor submission.14
Table 19: SUNFISH Subset Baseline Characteristics Post–CHERISH Matching
Characteristic | Pre-matching SUNFISH subset | Pre-matching SUNFISH subset | Post-matching SUNFISH subset | Post-matching SUNFISH subset | CHERISH |
|---|---|---|---|---|---|
Risdiplam | Placebo | Risdiplam | Placebo | Nusinersen and sham (N = 121) | |
Sample size (ESS) | 43 | 25 | 43 (28.3) | 25 (8.8) | 121 |
Female gender | 53% | 44% | 61% | 43% | 53% |
Mean age at screening (years) | 5.0 | 5.3 | 3.7 | 3.7 | 3.7 |
Mean age at symptom onset (months) | 13.7 | 16.6 | 12.7 | 13.4 | 10.3 |
Mean symptoms duration (months) | 46.3 | 46.8 | 31.6 | 30.7 | 36.0 |
Mean HFMSE baseline score | 24.21 | 23.12 | 21.99 | 22.36 | 21.57 |
Mean RULM baseline score | 21.65 | 22.28 | 19.11 | 19.07 | 19.07 |
Mean SMN2 copy number | 3.09 | 3.08 | 3.00 | 2.94 | 2.94 |
2 copies | 0% | 4% | 0% | 7% | 8% |
3 copies | 91% | 84% | 100% | 91% | 88% |
4 copies | 9% | 12% | 0% | 1% | 2% |
Unknown | 0% | 0% | 0% | 0% | 2% |
ESS = effective sample size; HFMSE = Hammersmith Functional Motor Scale Expanded; RULM = Revised Upper Limb Module; SMN2 = survival of motor neuron 2.
Source: Drug Reimbursement Review sponsor submission.14
Table 20: Results of the Sponsor-Submitted Indirect Treatment Comparison in the SMA Type II or SMA Type III Network
Outcome | Unanchored MAIC | |
|---|---|---|
Risdiplam vs. nusinersen | ESS | |
Anchored MAIC analysis | ||
Change in RULM scale from baseline, mean difference (95% CI) | –0.49 (–3.33 to 2.53) | 37.1 |
Proportion of RULM responders (RULM ≥ 2 points), OR (95% CI) | 2.64 (0 to 117.94) | 37.1 |
Bayesian NMA analysis | ||
Change in RULM score from baseline, mean difference (95% CI) | –0.63 (–2.76 to 1.47) | NA |
Proportion of RULM responders (RULM ≥ 2 points), OR (95% CI) | 2.59 (0.39 to 17.25) | NA |
ESS = effective sample size; MAIC = matching-adjusted indirect comparison; NA = not applicable; OR = odds ratio; RULM = Revised Upper Limb Module; SMA = spinal muscular atrophy; vs. = versus.
Critical Appraisal of Sponsor-Submitted Indirect Treatment Comparison
The sponsor-submitted ITC described approaches for identifying and analyzing evidence. It also aimed to minimize clinical heterogeneity by analyzing the infantile-onset type I SMA in a separate network and by using an MAIC approach. There were aspects related to the conduct of the systematic review that were not reported. These included literature search, screening method, data extraction method, and handling of poor-quality studies.
The sponsor-submitted ITC identified 3 studies in relation to type I SMA and 2 studies in relation to type II SMA or type III SMA. The network of evidence for type I SMA lacked a common comparator. As such, an unanchored MAIC approach was used to estimate the indirect comparison. For the type II SMA or type III SMA, the sponsor-submitted ITC assumed that the sham procedure is similar to placebo and used this as a common comparator to conduct an anchored MAIC with a sensitivity analysis using a Bayesian NMA approach. And while not described in the methods section, the sponsor also conducted a Bucher-adjusted indirect comparison as another form of sensitivity analysis for the type II SMA and type III SMA network.
To identify effect modifiers and prognostic factors, the sponsor-submitted ITC reported conducting a literature search and a consultation process with clinical experts. In addition, the sponsor-submitted ITC provided a list of all identified factors and the justification to either include or exclude each factor from the MAIC model.
Limitations related to the sponsor-submitted ITC included the following points:
The use of unanchored MAIC without assessment of residual bias
An unanchored MAIC depends on the strong assumption that all known and unknown effect modifiers and prognostic factors are accounted for within the model. This is a very strong assumption that we know has not been achieved. There were several factors that the sponsor-submitted ITC identified as important but did not include. In addition, the differences in the study design between FIREFISH and ENDEAR is another factor that is not accounted for. As such, there is considerable uncertainty regarding the actual observed difference in treatment effect that is attributed to risdiplam. And since the sponsor was unable to assess residual bias due to small sample size, there is no way to estimate the magnitude of the bias due to effect modifiers and prognostic factors in the reported estimates. This limitation is relevant to all outcomes that were estimated from the SMA type I evidence network.
Lack of clinically homogeneous population post-adjustment
The adjusted population had a higher proportion of female patients, a lower proportion of patients with ventilatory support, and a lower mean HINE Section 2 score than patients in the ENDEAR study. These persistent differences may indicate that the resulting population is still not sufficiently similar as to allow valid indirect comparison.
Improper pooling of FIREFISH study
To increase the sample size used in the analysis, the sponsor-submitted ITC pooled patients from FIREFISH Part 1 who received the high (pivotal) dose into the FIREFISH Part 2 patients. FIREFISH Part 1 and FIREFISH Part 2 are 2 independent studies that are not identical in design or in aim. As such, the effect of potential variations in study design, outcome definitions, follow-up times, and patient characteristics is not addressed.
Small sample size to robustly capture motor function–related differences between risdiplam and nusinersen
Examining the results of the ITC in the HINE Section 2 outcomes comparing risdiplam with nusinersen reveals wide CIs that may indicate low statistical robustness of the data or the model. The wide CI combined with the lack of assessment of residual bias further increases the uncertainty associated with the HINE Section 2 results.
Insufficient sample size to estimate the indirect results of risdiplam versus onasemnogene abeparvovec
No sufficient overlapping patients from FIREFISH to STR1VE-US were available to conduct an analysis. Thus, no ITC was estimated for nusinersen versus onasemnogene abeparvovec.
Considerable differences in the inclusion and exclusion criteria between CHERISH and SUNFISH
These differences included age range, restrictions on ventilatory support, restrictions on baseline motor function scores, and restrictions over the existence of anatomical complications due to SMA. The sponsor-submitted ITC attempted to account for these differences through choosing a subset of patients for the SUNFISH study that would match the inclusion and exclusion criteria of CHERISH, but the resulting subset exhibited baseline characteristics that were not as similar to CHERISH as would have been expected. The sponsor-submitted ITC outlined that several other discrepancies in the eligibility criteria remained that were not possible to apply to the SUNFISH Part 2 patients. This limitation is relevant to all outcomes that were estimated from the SMA type II or SMA type III network.
In addition, there remained several clinically heterogeneous differences subsequent to adjusting. These included the presence of severe contractures, difference methods to define independent sitting, and the exclusion of patients requiring non-invasive ventilation of more than 6 hours in CHERISH.
The use of a subset of patients from the SUNFISH study
SUNFISH was a randomized, placebo-controlled trial. The main limitation of artificially selecting a subset that is further adjusted for is the potential for increased risk of imbalances within SUNFISH in observed or unobserved factors. This is relevant to the indirect treatment estimates since the placebo group is serving as an anchor in the MAIC, or a bridging node in the NMA analysis approach. This limitation is relevant to all outcomes that were estimated from the SMA type II or SMA type III network.
Small effective sample size resulting in unrealistically wide CIs from the ITCs in the SMA type II or SMA type III network
The wide CIs indicate a lack of statistical precision and prevent any useful interpretation of the presented estimates. The resulting effective sample size was 28.3. This limitation is relevant to all outcomes that were estimated from the SMA type II or SMA type III network.
Summary
One sponsor-submitted ITC was reviewed. The sponsor-submitted ITC compared risdiplam to nusinersen in 2 distinct patient populations: infantile-onset SMA (SMA type I) and later-onset SMA (SMA type II or SMA type III).
Comparison in the SMA type I population was done through an unanchored MAIC between a pooled FIREFISH for and ENDEAR studies. Study design between these 2 studies was different, inclusion and exclusion criteria were similar, and patients in the FIREFISH study were weighted to match the mean age at first dose, duration of symptoms, and the mean CHOP INTEND baseline score of the ENDEAR study. The results of this unanchored MAIC suggest a hazard ratio of ventilation-free survival of risdiplam versus nusinersen of 0.20 (95% CI, 0.06 to 0.42), and an overall survival hazard ratio of 0.26 (95% CI, 0.03 to 0.66). Since this result is the product of an unanchored MAIC with limited adjustment for effect modifiers and prognostic factors, imbalances in trial arms after adjustment, with no assessment of residual bias, it is not clear to what extent is the magnitude of effect due to true treatment difference or to potential measured or unmeasured effect modifiers and prognostic factors. The clinical experts consulted on this review have suggested that there may be a biological rationale to hypothesize why risdiplam could be superior to nusinersen. Specifically, the clinical experts argued that the achievement of drug concentration in the body at a therapeutic level may be faster with risdiplam than nusinersen.
Comparison in the SMA type II or SMA type III population was done through an anchored MAIC along with a sensitivity analysis using a Bayesian NMA approach. Due to discrepancies in the inclusion and exclusion criteria, the sponsor-submitted ITC only used a subset of patients from the SUNFISH Part 2 study that would have been included in the CHERISH study, reducing the sample size of SUNFISH Part 2 by 62%. Subsequently, the weighting of the SUNFISH Part 2 sample produced an effective sample size in the risdiplam arm of 28.3. This small sample size translated into results with wide, and sometimes unrealistic, CIs in both the base-anchored base analysis and the NMA sensitivity analysis. This lack of statistical robustness, as well as the limitations associated with the persistent heterogeneity and the loss of the balanced distribution of characters in the SUNFISH Part 2 after the subset selection, prevents any use of the presented outcomes in a decision-making process.
Other Relevant Evidence
This section includes 4 submitted phase II studies and additional relevant studies included in the sponsor’s submission to CADTH that were considered to address important gaps in the evidence included in the systematic review.
FIREFISH Part 1 provides additional information on the safety and efficacy of risdiplam in infants with SMA type I. SUNFISH Part 1 provides additional information on the safety and efficacy of risdiplam in infant and young adult patients with SMA type II or SMA type III. JEWELFISH will provide evidence of the safety of risdiplam in pediatric and young adult patients with SMA who have been previously treated with RO6885247, nusinersen, olesoxime, or onasemnogene abeparvovec. RAINBOWFISH will provide additional evidence on the safety and efficacy of risdiplam in infants who have been genetically diagnosed with SMA but are pre-symptomatic. The JEWELFISH and RAINBOWFISH studies are ongoing.
Phase II Clinical Trials: FIREFISH Part 1 and SUNFISH Part 1
Methods
FIREFISH Part 1 was a multi-centre, open-label, single-arm, phase II study of the safety, tolerability, PK, and PD of risdiplam for the treatment of infants with SMA type I. It preceded FIREFISH Part 2, which has been described in the main report. Part 1 was conducted at 7 sites in 5 countries (Belgium, France, Italy, Switzerland, and the US). Enrolment began in December 2016 for infants (aged 1 month to 7 months) with SMA type I and included 21 patients separated into 2 cohorts for different dosing targets: 700 ng*hour/mL and 2,000 ng*hour/mL or less. Once doses were selected for FIREFISH Part 2, patients could continue receiving the appropriate dose for a total 24-month treatment period followed by an additional extension period until risdiplam is commercially available or is no longer produced by the sponsor (Figure 11). The selected doses were 0.04 mg/kg for infants from 1 month to 3 months of age, 0.08 mg/kg for infants between 3 months and 5 months, and 0.2 mg/kg for infants older than 5 months.
SUNFISH Part 1 was a multi-centre, open-label, placebo-controlled, dose-ranging, phase II study of the safety, tolerability, PK, and PD of risdiplam in infant and young adult patients with SMA type II or SMA type III. It preceded SUNFISH Part 2, which has been described in the main report. Part 1 was conducted at 5 sites in 4 countries (Italy, Germany, France, and Belgium). Enrolment began in October 2016 for patients (aged 2 years to 25 years) with SMA type II or SMA type III and included 51 patients separated into 2 groups by age: 2 years to 11 years and 12 years to 25 years. During the initial minimum 12-week, double-blind, placebo-controlled phase, patients in the younger cohort could receive 1 of the 0.02 mg/kg, 0.05 mg/kg, or 0.25 mg/kg doses while those in the older cohort could receive either 3 mg or 5 mg doses (Figure 12). After 12 weeks, patients on placebo were switched to active treatment in the dose group they were assigned until pivotal doses were selected. The selected doses were 5 mg if the patient’s body weight was at least 20 kg and 0.25 mg/kg if body weight was less than 20 kg. All patients then received the pivotal dose for a 24-month treatment period followed by an additional extension period until risdiplam is commercially available or is no longer produced by the sponsor. Of the 51 patients, 14 received the pivotal dose from the beginning of treatment, 21 started active treatment at a lower-dose before switching to the pivotal dose, and 16 started on placebo before switching to a lower dose initially (n = 10) or directly receiving the pivotal dose (n = 6).
Figure 11: Study Design of FIREFISH
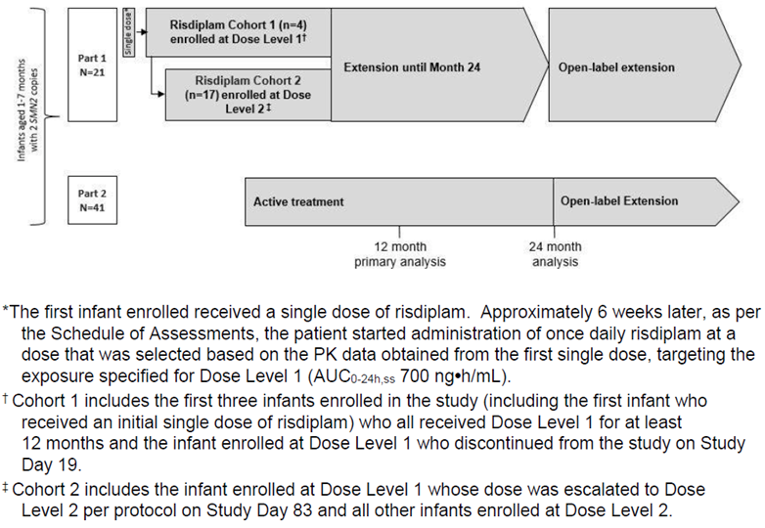
AUC0-24,ss = area under the curve from 0 hours to 24 hours at steady state; PK = pharmacokinetics; SMN2 = survival of motor neuron 2.
Source: Clinical Study Report of FIREFISH.43
Figure 12: Study Design of SUNFISH Part 1
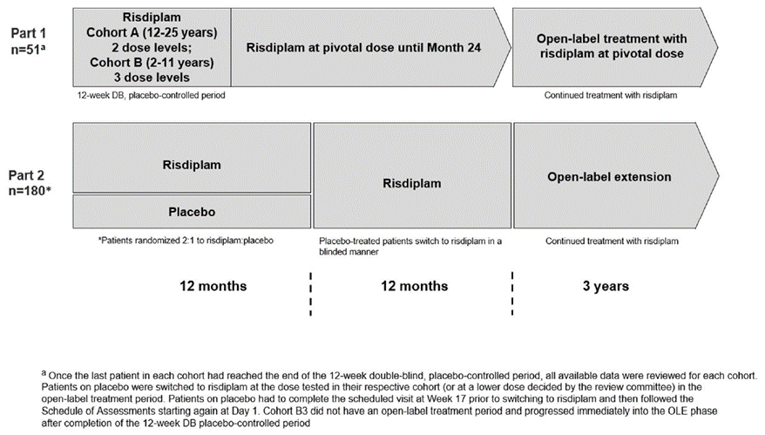
DB = double-blind; OLE = open-label extension.
Source: Clinical Study Report of SUNFISH.44
Populations
The inclusion and exclusion criteria for FIREFISH Part 1 and SUNFISH Part 1 are outlined in Table 21.
Table 21: Summary of Inclusion and Exclusion Criteria for FIREFISH Part 1 and SUNFISH Part 1
FIREFISH Part 1 | SUNFISH Part 1 |
|---|---|
Inclusion criteria | |
|
|
Exclusion criteria | |
|
|
| |
ALT = alanine transaminase; CYP3A4 = cytochrome P450, family 3, subfamily A, member 4; DBP = diastolic blood pressure; ECG = electrocardiogram; FMO = flavin monooxygenase; MATE = multidrug and toxin extrusion; OCT-2 = organic cation transporter-2; SaO2 = oxygen saturation; SBP = systolic blood pressure; SMA = spinal muscular atrophy; SMN2 = survival of motor neuron 2.
Sources: Clinical Study Report of FIREFISH and Clinical Study Report of SUNFISH.43,44
In FIREFISH Part 1, patients were separated into 2 cohorts based on which dose of risdiplam they received. Patients in cohort 1 received dose level 1 (dose of risdiplam that would achieve a target exposure of 700 ng*hour/mL) while those in cohort 2 received dose level 2 (target exposure of ≤ 2,000 ng*hour/mL). Table 22 summarizes the baseline characteristics of patients in FIREFISH Part 1. Briefly, the mean (SD) age was 5.81 (1.38) months at enrolment and 71.4% of patients were female. The majority (81%) were White and the rest were Asian. A proportion of patients was receiving ventilation support (14.3% received BiPAP for fewer than 16 hours per day and 19.0% received ventilation prophylactically) and most (95.2%) were able to swallow.
In SUNFISH Part 1, patients aged 12 years to 25 years made up group A and patients aged 2 years to 11 years made up group B. Table 23 summarizes the baseline characteristics of patients in SUNFISH Part 1. Briefly, the younger cohort had a mean (SD) age of || |||| years while the older cohort had a mean (SD) age of |||||||||| years at screening. Just over half of all patients were female |||||||||||||||||||||| were White. Overall, |||| of patients were receiving fewer than 16 hours of BiPAP support per day (|||||||||| |||| in the younger and older cohorts, respectively) and |||||||||||||||||||||||||||||||||||||||||||||||||||||||||||||||||||||||||||||||||||||||||| |||||||||||||||||||||||||||||||||||||||||||||||||||||||||||||||||||||||||||||||||||||||||||| of the older patients were not. Few patients (13.7%) were ambulatory: 19.4% of those aged 2 years to 11 years and 5% of those aged 12 years to 25 years.
Table 22: Summary of Baseline Characteristics in FIREFISH Part 1 — Intention-to-Treat Population
Characteristic | Risdiplam (700 ng*hour/mL) (n = 4) | Risdiplam (≤ 2,000 ng*hour/mL) (n = 17) | All patients (N = 21) |
|---|---|---|---|
Demographics | |||
Age at enrolment, months, mean (SD) | 6.84 (0.10) | 5.56 (1.43) | 5.81 (1.38) |
Age at onset of symptoms, months, mean (SD) | 2.60 (0.49) | 1.70 (0.67) | 1.87 (0.73) |
Age at diagnosis, months, mean (SD) | 3.53 (1.13) | 3.19 (1.41) | 3.25 (1.34) |
Disease duration, months, mean (SD) | 4.30 (0.38) | 3.90 (1.29) | 3.98 (1.17) |
Female, n (%) | 4 (100) | 11 (64.7) | 15 (71.4) |
Race | |||
White, n (%) | 4 (100) | 13 (76.5) | 17 (81.0) |
Asian, n (%) | 0 | 4 (23.5) | 4 (19.0) |
Disease history | |||
BiPAP support < 16 hours/day, n (%) | 0 | 3 (17.6) | 3 (14.3) |
Ventilation provided prophylactically, n (%) | 0 | 4 (23.5) | 4 (19.0) |
Able to swallow, n (%) | 4 (100) | 16 (94.1) | 20 (95.2) |
Fed orally, n (%) | ||| | ||| | ||| |
Feeding route missing, n (%) | ||| | ||| | ||| |
Genotype | |||
SMN2 copies, n (%) | |||
2 | 4 (100) | 17 (100) | 21 (100) |
SMA type | |||
||| | 4 (100) | 17 (100) | 21 (100) |
BiPAP = bilevel positive airway pressure; SD = standard deviation; SMA = spinal muscular atrophy; SMN2 = survival of motor neuron 2.
Source: Clinical Study Report of FIREFISH.43
Table 23: Patient Baseline Characteristics in SUNFISH Part 1 — Intention-to-Treat Population
Characteristic | Risdiplam (aged 2 years to 11 years) (n = 31) | Risdiplam (aged 12 years to 25 years) (n = 20) | All patients (N = 51) |
|---|---|---|---|
Demographics | |||
Age at screening, years, mean (SD) | ||| | ||| | 9.4 (6.0) |
Age at onset of initial symptoms (months), mean (SD) | ||| | ||| | ||| |
Age at SMA diagnosis, months, mean (SD) | ||| | ||| | ||| |
Time between onset of symptoms and first treatment (months), mean (SD) | ||| | |||| | |||| |
Female, n (%) | 14 (45.2) | 13 (65.0) | 27 (52.9) |
Race | |||
White, n (%) | ||| | ||| | ||| |
Asian, n (%) | ||| | ||| | ||| |
Multiple, n (%) | ||| | ||| | ||| |
Disease history | |||
BiPAP support < 16 hours/day, n (%) | ||| | ||| | ||| |
No pulmonary care, n (%) | ||| | ||| | ||| |
Ambulatory, n (%) | 6 (19.4) | 1 (5.0) | 7 (13.7) |
Genotype | |||
SMN2 copies, n (%) | |||
2 | ||| | ||| | ||| |
3 | ||| | ||| | ||| |
4 | ||| | ||| | ||| |
SMA type | |||
II | 23 (74.2) | 14 (70.0) | 37 (72.5) |
III | 8 (25.8) | 6 (30.0) | 14 (27.5) |
BiPAP = bilevel positive airway pressure; SD = standard deviation; SMA = spinal muscular atrophy; SMN2 = survival of motor neuron 2.
Source: Clinical Study Report of SUNFISH.44
Interventions
In FIREFISH Part 1, the first patient received an initial dose of risdiplam 0.00106 mg/kg based on conservative physiologically based PK modelling. Dose level 1 was determined based on PK data to achieve a target exposure of mean AUC0-24,ss of 700 ng*hour/mL, which would double the patient’s baseline SMN protein levels. Dose level 2 was increased to achieve a target exposure of mean AUC0-24,ss 2,000 ng*hour/mL or less, which would lead to the maximum possible SMN protein level increase.
In SUNFISH Part 1, dose level 1 was administered to group A (patients aged 12 years to 25 years) to achieve a target exposure of mean AUC0-24,ss of 700 ng*hour/mL, which would double the patient’s baseline SMN protein levels. PK data from group A were used to select a dose for group B. Dose level 2 was selected to achieve the maximum possible SMN protein levels and would not exceed a target exposure of mean AUC0-24,ss of 2,000 ng*hour/mL. Patients were randomized to receive risdiplam or placebo in a 2:1 ratio.
The risdiplam drug product was available as 2 bottles of powder (1 with excipients and 1 without excipients) to be reconstituted in water and administered as a solution. All doses were administered once daily with a syringe orally, or via nasogastric or gastrostomy tube where applicable, and flushed with water.
Outcomes
In FIREFISH, efficacy end points in Part 1 were exploratory and summarized descriptively for the ITT population. They included motor function and development milestones as measured by the BSID-III gross motor subscale, CHOP INTEND score, and HINE Section 2; survival and ventilation-free survival; respiratory function; swallowing ability; and parent- and caregiver-reported outcomes using the ITQOL-SF47 version. Safety outcomes were based on the safety population and included AEs, SAEs, WDAEs, and deaths.
All efficacy end points in SUNFISH Part 1 were exploratory and summarized descriptively. Efficacy analyses are mainly presented for the first 12 months of treatment received, regardless of the starting dose. Outcomes included the following: motor function as measured by the MFM, HFMSE, and RULM scores. Safety outcomes were based on the safety population and included AEs, SAEs, WDAEs, deaths, and laboratory and other exam abnormalities.
Statistical Analysis
In FIREFISH Part 1, there was no formal hypothesis testing and analyses were summarized descriptively using summary statistics with 90% CIs. The natural history of individuals with SMA was used to define performance success in the enrolled patients. Part 1 required a minimum sample size of 8 patients to have at least an 80% chance of detecting an AE in at least 1 patient, if the true underlying AE rate was 20%. To select a dose for Part 2, taking into account patient characteristic variability, the sample size in Part 1 could include up to 24 patients. The primary efficacy analysis population was the ITT population and consisted of all enrolled patients, regardless of whether they received treatment or not. Safety analyses were based on the safety population, which included all patients who received at least 1 dose of risdiplam. Missing item scores for the CHOP INTEND at baseline were imputed as the median of the non-missing values of the stratum to which the infant belonged. For item scores missing at month 12, data were imputed by linear interpolation if scores for the previous and subsequent visits were available. If the flanking scores were unavailable, the item score was imputed as the minimum of the non-missing scores for the stratum to which the infant belonged. Infants with missing assessments were considered nonresponders. Missing data for the ITQOL-SF47 items were handled as outlined in the ITQOL user manual. There was no imputation for missing safety data.
In SUNFISH Part 1, the target sample size was determined based on practical considerations for selecting a dose for Part 2 rather than a statistical calculation. To have a || chance of detecting an AE in at least 1 patient, if the true underlying AE rate was |||| | patients need to receive active treatment in each dose cohort in Part 1. The primary efficacy analysis population was the ITT population, which included all patients who were randomized in the study. The safety population consisted of all patients who received at least 1 dose of risdiplam or placebo. Analyses were summarized descriptively using summary statistics with 95% CI. Seven patients who were mistakenly scored on the MFM-20 rather than the MFM-32 had a score of 0 imputed for the 12 missing items. Sensitivity analyses were performed, excluding the group of 7 patients. Motor function assessments that had missing item scores were imputed as 0 although missing total scores were not imputed, which was in accordance with the MFM scoring manual. Patients who had missing total MFM-32 scores were considered nonresponders. There was no imputation for missing safety data.
Patient Disposition
Patient disposition for FIREFISH Part 1 and SUNFISH Part 1 are summarized in Table 24 and Table 25. In FIREFISH Part 1, 26 individuals were screened and 21 were enrolled. The 5 screening failures were for withdrawn consent, inability to obtain ophthalmology results, respiratory failure, and death. Patients were assigned to dose level 1 or dose level 2 and all 21 patients were included in both the ITT and safety sets. In SUNFISH Part 1, 88 individuals were screened and 51 were enrolled. Patients were separated by age into 2 groups: 2 years to 11 years old and 12 years to 25 years old. All patients who were randomized to receive the study drug completed the placebo-controlled period and entered the open-label extension phase, and all 51 patients were included in both the ITT and safety sets.
Table 24: Patient Disposition in FIREFISH Part 1
Disposition | Risdiplam (700 ng*hour/mL) (n = 4) | Risdiplam (≤ 2,000 ng*hour/mL) (n = 17) | All patients (N = 21) |
|---|---|---|---|
Screened | 26 | ||
Enrolled, N (%) | 4 (100) | 17 (100) | 21 (100) |
Ongoing, n (%) | 3 (75.0) | 14 (82.4) | 17 (81.0) |
Reason for discontinuation, n (%) | |||
Progressive disease | 1 (25.0) | 1 (5.9) | 2 (9.5) |
Death | 0 | 1 (5.9) | 1 (4.8) |
Withdrawal by patient | 0 | 1 (5.9) | 1 (4.8) |
Entered OLE phase, n (%) | 3 (75.0) | 5 (29.4) | 8 (38.1) |
Entered safety follow-up, n (%) | 0 | 1 (5.9) | 1 (4.8) |
ITT population, n (%) | 4 (100) | 17 (100) | 21 (100) |
Safety population, n (%) | 4 (100) | 17 (100) | 21 (100) |
ITT = intention-to-treat; OLE = open-label extension.
Source: Clinical Study Report of FIREFISH.43
Table 25: Patient Disposition in SUNFISH Part 1
Disposition | Risdiplam (aged 2 years to 11 years) (n = 31) | Risdiplam (aged 12 years to 25 years) (n = 20) | All patients (N = 51) |
|---|---|---|---|
Screened | 88 | ||
Enrolled, N (%) | 31 (100) | 20 (100) | 51 (100) |
Entered OLE phase, n (%) | 31 (100) | 20 (100) | 51 (100) |
Reason for discontinuation, n (%) | |||
Withdrawal by patient | 0 | 1 (5.0) | 1 (2.0) |
ITT population, n (%) | 31 (100) | 20 (100) | 51 (100) |
Safety population, n (%) | 31 (100) | 20 (100) | 51 (100) |
ITT = intention-to-treat; OLE = open-label extension.
Source: Clinical Study Report of SUNFISH.44
Exposure to Study Treatments
Exposure to risdiplam is summarized in Table 26 and Table 27 for FIREFISH Part 1 and SUNFISH Part 1, respectively. In FIREFISH Part 1, the mean (SD) duration of risdiplam treatment was 24.71 (16.13) months for the lower-dose group and 21.55 months (4.80 months) for the higher-dose group. For SUNFISH Part 1, the mean (SD) duration of treatment was |||||||||||||||| days for the group aged 2 years to 11 years and |||||||||||||||||||| days for the group aged 12 years to 25 years.
Table 26: Exposure to Risdiplam in FIREFISH Part 1 — Safety Population
Exposure | Risdiplam (700 ng*hour/mL) (n = 4) | Risdiplam (≤ 2,000 ng*hour/mL) (n = 17) | All patients (N = 21) |
|---|---|---|---|
Treatment duration, months, mean (SD) | 24.71 (16.13) | 21.55 (4.80) | 22.15 (7.68) |
Treatment duration, months, median (range) | 23.29 (0.6 to 26.0) | 14.78 (7.7 to 18.9) | 14.78 (0.6 to 26.0) |
Number of dose adjustments, n (%) | |||
1 | ||| | ||| | ||| |
2 | ||| | ||| | ||| |
3 | ||| | ||| | ||| |
4 | ||| | ||| | ||| |
≥ 5 | ||| | ||| | ||| |
SD = standard deviation.
Source: Clinical Study Report of FIREFISH.43
Table 27: Exposure to Risdiplam in SUNFISH Part 1 — Safety Population
Exposure | Risdiplam (aged 2 years to 11 years) (n = 31) | Risdiplam (aged 12 years to 25 years) (n = 20) | All patients (N = 51) |
|---|---|---|---|
Active exposure duration, days, mean (SD) | |||||||||| | |||||||||||||| | |||||||||||| |
Active exposure duration, days, median (range) | |||||||||||||||||||||||||| | |||||||||||||||||||||||||||| | |||||||||||||||||||||||||| |
Pivotal dose exposure, days, mean (SD) | |||||||||| | |||||||||||| | |||||||||||| |
Pivotal dose exposure, days, median (range) | |||||||||||||||||||||||| | |||||||||||||||||||||||||| | |||||||||||||||||||||||||| |
SD = standard deviation.
Source: Clinical Study Report of SUNFISH.44
Efficacy
Table 28 summarizes selected efficacy outcomes in FIREFISH Part 1 at month 12. In general, a greater number of patients in the risdiplam higher-dose group achieved the motor function and development milestones. For instance, none of the patients in the risdiplam lower-dose group and 41.2% of the patients in the higher-dose group were able to sit without support for 5 seconds (BSID-III, item 22). Fewer patients showed improved motor skills as measured by the CHOP INTEND and HINE Section 2 in the 700 ng*hour/mL group compared to the 2,000 ng*hour/mL or less group. At the month 12 assessment, there was 1 death in each group and all remaining patients were alive without permanent ventilation. Few patients from either group required no respiratory support and most were able to feed orally. For patient- and caregiver-reported outcomes, measured by the ITQOL-SF47, there was a median change of 0 for both groups.
Table 29 summarizes the efficacy outcomes in SUNFISH Part 1 at month 12 and month 24. |||||||||||||||||||||||||||||||||||||||||||||||||| |||||||||||||||||||||||||||||||||||||||||||||||||||||||||||||||||||||||||||||||||||||||||||||||||||||||||||||||||||||||||||||||||||||||||||||||||||||||||||||||||||||| |||| |||||||||||||||||||||||||||||||||||||||||||||||||||||||||||||||||||||||||||||||||||||||||||||||||||||||||||||||||||||||||||||||||||||||||||||||||||||||||||||||||||||||| |||||||||||||||||||||||||||||||||||||||||||||||||||||||||||||||||||||||||||||||||||||||||||||||||||||||||||||||||||||||||||||||||||||||||||||||||||||||||||||||||||||| |||||||||||||||||||||||||||||||||||||||||||||||||||||||||||||||||||||||||||||||||||||||||||||||||||||||||||||||||||||||||||||||||||||||||||||||||||||||||||||||||||||||| |||||||||||||||||||||||||||||||||||||||||||||||||||||||||||||||||||||||||||||||||||||||||||||||||||||||||||||||||||||||||||||||||||||||||||||||||||||||||||||||||||||||||| ||||||||||||||||||||
Table 28: Summary of Efficacy Outcomes at Month 12 in FIREFISH Part 1 — Intention-to-Treat Population
Outcome | Risdiplam (700 ng*hour/mL) (n = 4) | Risdiplam (≤ 2,000 ng*hour/mL) (n = 17) | All patients (N = 21) |
|---|---|---|---|
Motor function and development milestones | |||
BSID-III | |||
Sitting without support for 5 seconds (item 22), n (%) (90% CI) | 0 (0.0 to 52.7) | 7 (41.2) (21.2 to 63.6) | 7 (33.3) (16.8 to 53.6) |
CHOP INTEND | |||
Score of ≥ 40, n (%) (90% CI) | 1 (25.0) (1.3 to 75.1) | 10 (58.8) (36.4 to 78.8) | 11 (52.4) (32.8 to 71.4) |
Increase of ≥ 4 points from baseline, n (%) (90% CI) | 3 (75.0) (24.9 to 98.7) | 15 (88.2) (67.4 to 97.9) | 18 (85.7) (67.1 to 96.0) |
Head control (defined as a score of ≥ 3 for item 12), n (%) (90% CI) | 2 (50.0) (9.8 to 90.2) | 9 (52.9) (31.1 to 74.0) | 11 (52.4) (32.8 to 71.4) |
HINE Section 2 | |||
Head control (wobbles), n (%) (90% CI) | 2 (50.0) (9.8 to 90.2) | 4 (23.5) (8.5 to 46.1) | 6 (28.6) (13.2 to 48.7) |
Head control (upright all the time), n (%) (90% CI) | 0 (0.0 to 52.7) | 9 (52.9) (31.1 to 74.0) | 9 (42.9) (24.5 to 62.8) |
Motor milestone responders,a n (%) (90% CI) | 1 (25.0) (1.3 to 75.1) | 13 (76.5) (54.0 to 91.5) | 14 (66.7) (46.4 to 83.2) |
Survival and ventilation-free survival | |||
Alive, n (%) (90% CI) | 3 (75.0) (22.3 to 94.6) | 16 (94.1) (73.0 to 98.8) | 19 (90.5) (72.6 to 96.9) |
Alive without permanent ventilation, n (%) (90% CI) | 3 (75.0) (22.3 to 94.6) | 16 (94.1) (73.0 to 98.8) | 19 (90.5) (72.6 to 96.9) |
Respiratory | |||
No requirement for invasive or non-invasive respiratory support, n (%) (90% CI) | 1 (25.0) (1.3 to 75.1) | 3 (17.6) (5.0 to 39.6) | 4 (19.0) (6.8 to 38.4) |
Nutrition | |||
Ability to feed orally,b n (%) (90% CI) | 3 (75.0) (24.9 to 98.7) | 15 (88.2) (67.4 to 97.9) | 18 (85.7) (67.1 to 96.0) |
Patient- and caregiver-reported outcomes (ITQOL-SF47)c | |||
Baseline, n (%) | ||| | ||| | ||| |
Baseline, mean (SD) | ||| | ||| | ||| |
Month 12, n (%) | ||| | ||| | ||| |
Month 12, mean (SD) | ||| | ||| | ||| |
Change from baseline, mean (SD) | ||| | ||| | ||| |
BSID-III = Bayley Scales of Infant and Toddler Development, Third Edition; CHOP INTEND = Children’s Hospital of Philadelphia Infant Test of Neuromuscular Disorders; CI = confidence interval; HINE Section 2 = Hammersmith Infant Neurological Examination–Section 2; ITQOL-SF47 = Infant Toddler Quality of Life Questionnaire–47-item Short Form; SD = standard deviation.
aAn improvement in a motor milestone was defined as at least a 2-point increase in the ability to kick (or maximal score) or a 1-point increase in head control, rolling, sitting, crawling, standing, or walking. Worsening was defined as a 2-point decrease in ability to kick (or lowest score) or a 1-point decrease in head control, rolling, sitting, crawling, standing, or walking. Voluntary grasp was excluded from the definition. An infant was classified as a responder if more motor milestones showed improvement than showed worsening.
bIncludes patients who were fed exclusively orally (15 patients overall) and those who were fed orally in combination with a feeding tube (3 patients overall) at month 12.
cNo imputation was performed for ITQOL-SF47; therefore, n is based on patients with available data at month 12.
Source: Clinical Study Report of FIREFISH.43
Table 29: Summary of Efficacy Outcomes in SUNFISH Part 1 — Intention-to-Treat Population
Outcome | Risdiplam (aged 2 years to 11 years) (n = 31) | Risdiplam (aged 12 years to 25 years) (n = 20) | All patients (N = 51) |
|---|---|---|---|
MFM-32 scorea | |||
Baseline, n | 24 | 20 | 44 |
Baseline score, mean (SD) | 44.4 (11.9) | 40.9 (18.2) | 42.9 (15.0) |
Month 12, n | 24 | 19 | 43 |
Change from baseline score, mean (SD) | 3.47 (3.77) | 1.64 (3.43) | 2.66 (3.70) |
Month 24, n | ||| | ||| | ||| |
Change from baseline score, mean (SD) | ||| | ||| | ||| |
RULM score | |||
Baseline, mean (SD) | ||| | ||| | ||| |
Month 12, n | ||| | ||| | ||| |
Change from baseline score, mean (SD) | ||| | ||| | ||| |
Month 24, n | ||| | ||| | ||| |
Change from baseline score, mean (SD) | ||| | ||| | ||| |
HFMSE score | |||
Baseline, mean (SD) | ||| | ||| | ||| |
Month 12, n | ||| | ||| | ||| |
Change from baseline score, mean (SD) | ||| | ||| | ||| |
Month 24, n | ||| | ||| | ||| |
Change from baseline score, mean (SD) | ||| | ||| | ||| |
HFMSE = Hammersmith Functional Motor Scale Expanded; MFM = Motor Function Measure; MFM-32 = Motor Function Measure–32 items; RULM = Revised Upper Limb Module; SD = standard deviation.
aPatients mistakenly evaluated using the 20-item MFM, rather than the 32-item MFM, were excluded from assessment.
Source: Clinical Study Report of SUNFISH.44
Harms
Safety outcomes for FIREFISH Part 1 are summarized in Table 30. Nearly all patients (95.2%) had at least 1 AE. The most common were pyrexia (66.7%), upper respiratory tract infection (47.6%), and cough, diarrhea, and vomiting (28.6% each). SAEs occurred in more than half of the patients (61.9%), with pneumonia being the most common (19.0%). Four deaths occurred: 1 in the 700 ng*hour/mL group and 3 in the 2,000 ng*hour/mL or less group. Safety outcomes for SUNFISH Part 1 are summarized in Table 31. Likewise, almost all patients (96.1%) had at least 1 AE. The 5 most common AEs were pyrexia (54.9%), cough (35.3%), vomiting (33.3%), upper respiratory tract infection (31.4%), and nasopharyngitis (23.5%). Overall, 29.4% of patients experienced at least 1 SAE, with the most common being pneumonia (5.9%). There were no deaths reported.
Table 30: Summary of Safety Outcomes in FIREFISH Part 1 — Safety Population
Outcome | Risdiplam (700 ng*hour/mL) (n = 4) | Risdiplam (≤ 2,000 ng*hour/mL) (n = 17) | All patients (N = 21) |
|---|---|---|---|
Patients with ≥ 1 AEs, n (%) | 4 (100) | 16 (94.1) | 20 (95.2) |
Most common AEs (frequency > 1 patient), n (%) | |||
Pyrexia | 3 (75.0) | 11 (64.7) | 14 (66.7) |
Upper respiratory tract infection | 1 (25.0) | 9 (52.9) | 10 (47.6) |
Cough | 0 | 6 (35.3) | 6 (28.6) |
Diarrhea | 0 | 6 (35.3) | 6 (28.6) |
Vomiting | 1 (25.0) | 5 (29.4) | 6 (28.6) |
Nasopharyngitis | 0 | 5 (29.4) | 5 (23.8) |
Respiratory tract infection | 2 (50.0) | 3 (17.6) | 5 (23.8) |
Teething | 0 | 5 (29.4) | 5 (23.8) |
Constipation | 1 (25.0) | 3 (17.6) | 4 (19.0) |
Ear infection | 1 (25.0) | 3 (17.6) | 4 (19.0) |
Pneumonia | 2 (50.0) | 2 (11.8) | 4 (19.0) |
Eczema | 0 | 3 (17.6) | 3 (14.3) |
Erythema | 2 (50.0) | 1 (5.9) | 3 (14.3) |
Nasal congestion | 0 | 3 (17.6) | 3 (14.3) |
Rhinitis | 0 | 3 (17.6) | 3 (14.3) |
Upper respiratory tract inflammation | 2 (50.0) | 1 (5.9) | 3 (14.3) |
Viral infection | 0 | 3 (17.6) | 3 (14.3) |
Acute respiratory failure | 1 (25.0) | 1 (5.9) | 2 (9.5) |
Atelectasis | 0 | 2 (11.8) | 2 (9.5) |
Conjunctival hyperemia | 1 (25.0) | 1 (5.9) | 2 (9.5) |
Decreased appetite | 0 | 2 (11.8) | 2 (9.5) |
Fall | 0 | 2 (11.8) | 2 (9.5) |
Flatulence | 1 (25.0) | 1 (5.9) | 2 (9.5) |
Gastroenteritis | 0 | 2 (11.8) | 2 (9.5) |
Gastroesophageal reflux disease | 0 | 2 (11.8) | 2 (9.5) |
Hypoxia | 0 | 2 (11.8) | 2 (9.5) |
Lower respiratory tract infection | 0 | 2 (11.8) | 2 (9.5) |
Rash | 0 | 2 (11.8) | 2 (9.5) |
Respiratory distress | 0 | 2 (11.8) | 2 (9.5) |
Respiratory tract congestion | 0 | 2 (11.8) | 2 (9.5) |
Respiratory tract infection, viral | 1 (25.0) | 1 (5.9) | 2 (9.5) |
Viral upper respiratory tract infection | 0 | 2 (11.8) | 2 (9.5) |
Weight, decreased | 0 | 2 (11.8) | 2 (9.5) |
Patients with ≥ 1 SAEs, n (%) | 4 (100) | 9 (52.9) | 13 (61.9) |
Most common SAEs (frequency > 1 patient), n (%) | |||
Pneumonia | 2 (50.0) | 2 (11.8) | 4 (19.0) |
Respiratory tract infection | 1 (25.0) | 1 (5.9) | 2 (9.5) |
Respiratory tract infection viral | 1 (25.0) | 1 (5.9) | 2 (9.5) |
Acute respiratory failure | 1 (25.0) | 1 (5.9) | 2 (9.5) |
Respiratory distress | 0 | 2 (11.8) | 2 (9.5) |
WDAEs, n (%) | 0 | 0 | 0 |
Deaths, n (%) | 1 (25.0) | 3 (17.6) | 4 (19.0) |
AE = adverse event; SAE = serious adverse event; WDAE = withdrawal due to adverse event.
Source: Clinical Study Report of FIREFISH.43
Table 31: Summary of Safety Outcomes in SUNFISH Part 1 — Safety Population
Outcome | Risdiplam (aged 2 years to 11 years) (n = 31) | Risdiplam (aged 12 years to 25 years) (n = 20) | All patients (N = 51) |
|---|---|---|---|
Patients with ≥ 1 AEs, n (%) | 31 (100) | 18 (90.0) | 49 (96.1) |
Most common AEs (frequency > 1 patient), n (%) | |||
Pyrexia | 20 (64.5) | 8 (40.0) | 28 (54.9) |
Cough | 14 (45.2) | 4 (20.0) | 18 (35.3) |
Vomiting | 11 (35.5) | 6 (30.0) | 17 (33.3) |
Upper respiratory tract infection | 14 (45.2) | 2 (10.0) | 16 (31.4) |
Nasopharyngitis | 9 (29.0) | 3 (15.0) | 12 (23.5) |
Oropharyngeal pain | 5 (16.1) | 6 (30.0) | 11 (21.6) |
Gastroenteritis | 7 (22.6) | 2 (10.0) | 9 (17.6) |
Headache | 5 (16.1) | 4 (20.0) | 9 (17.6) |
Influenza | 4 (12.9) | 4 (20.0) | 8 (15.7) |
Pharyngitis | 5 (16.1) | 3 (15.0) | 8 (15.7) |
Upper respiratory tract inflammation | 4 (12.9) | 4 (20.0) | 8 (15.7) |
Bronchitis | 7 (22.6) | 0 | 7 (13.7) |
Rash | 5 (16.1) | 2 (10.0) | 7 (13.7) |
Abdominal pain | 3 (9.7) | 3 (15.0) | 6 (11.8) |
Abdominal pain upper | 3 (9.7) | 3 (15.0) | 6 (11.8) |
Ear pain | 4 (12.9) | 2 (10.0) | 6 (11.8) |
Pain in extremity | 6 (19.4) | 0 | 6 (11.8) |
Respiratory tract infection | 3 (9.7) | 3 (15.0) | 6 (11.8) |
Back pain | 2 (6.5) | 3 (15.0) | 5 (9.8) |
Diarrhea | 4 (12.9) | 1 (5.0) | 5 (9.8) |
Ear infection | 4 (12.9) | 1 (5.0) | 5 (9.8) |
Fatigue | 3 (9.7) | 2 (10.0) | 5 (9.8) |
Nausea | 3 (9.7) | 2 (10.0) | 5 (9.8) |
Arthralgia | 3 (9.7) | 1 (5.0) | 4 (7.8) |
Constipation | 4 (12.9) | 0 | 4 (7.8) |
Dysmenorrhea | 0 | 4 (20.0) | 4 (7.8) |
Pneumonia | 1 (3.2) | 3 (15.0) | 4 (7.8) |
Rhinitis | 2 (6.5) | 2 (10.0) | 4 (7.8) |
Conjunctivitis | 3 (9.7) | 0 | 3 (5.9) |
Erythema | 3 (9.7) | 0 | 3 (5.9) |
Fall | 3 (9.7) | 0 | 3 (5.9) |
Femur fracture | 3 (9.7) | 0 | 3 (5.9) |
Respiratory tract inflammation | 3 (9.7) | 0 | 3 (5.9) |
Rhinorrhea | 3 (9.7) | 0 | 3 (5.9) |
Tachycardia | 1 (3.2) | 2 (10.0) | 3 (5.9) |
Tonsillitis | 3 (9.7) | 0 | 3 (5.9) |
Viral infection | 2 (6.5) | 1 (5.0) | 3 (5.9) |
Aphthous ulcer | 0 | 2 (10.0) | 2 (3.9) |
Arthropod bite | 2 (6.5) | 0 | 2 (3.9) |
Contusion | 2 (6.5) | 0 | 2 (3.9) |
Decreased appetite | 1 (3.2) | 1 (5.0) | 2 (3.9) |
Dizziness | 2 (6.5) | 0 | 2 (3.9) |
Dry skin | 1 (3.2) | 1 (5.0) | 2 (3.9) |
Eczema | 2 (6.5) | 0 | 2 (3.9) |
Esophagitis | 1 (3.2) | 1 (5.0) | 2 (3.9) |
Hyperchlorhydria | 0 | 2 (10.0) | 2 (3.9) |
Hyperpyrexia | 0 | 2 (10.0) | 2 (3.9) |
Laryngitis | 1 (3.2) | 1 (5.0) | 2 (3.9) |
Ligament sprain | 2 (6.5) | 0 | 2 (3.9) |
Malaise | 1 (3.2) | 1 (5.0) | 2 (3.9) |
Myalgia | 1 (3.2) | 1 (5.0) | 2 (3.9) |
Neck pain | 1 (3.2) | 1 (5.0) | 2 (3.9) |
Ocular hyperemia | 1 (3.2) | 1 (5.0) | 2 (3.9) |
Oral mucosal erythema | 2 (6.5) | 0 | 2 (3.9) |
Palmar erythema | 1 (3.2) | 1 (5.0) | 2 (3.9) |
Rhinitis, allergic | 0 | 2 (10.0) | 2 (3.9) |
Scarlet fever | 2 (6.5) | 0 | 2 (3.9) |
Scoliosis | 2 (6.5) | 0 | 2 (3.9) |
Urinary tract infection | 2 (6.5) | 0 | 2 (3.9) |
Patients with ≥ 1 SAEs, n (%) | 9 (29.0) | 6 (30.0) | 15 (29.4) |
Most common SAEs (frequency > 1 patient), n (%) | |||
Pneumonia | 1 (3.2) | 2 (10.0) | 3 (5.9) |
Femur fracture | 2 (6.5) | 0 | 2 (3.9) |
WDAEs, n (%) | 0 | 0 | 0 |
Deaths, n (%) | 0 | 0 | 0 |
AE = adverse event; SAE = serious adverse event; WDAE = withdrawal due to adverse event.
Source: Clinical Study Report of SUNFISH.44
Critical Appraisal
Internal Validity
FIREFISH Part 1 was an open-label, single-arm, dose-finding, phase II clinical trial that provided results on the safety and efficacy of 2 doses of risdiplam in 21 infants with SMA type I. Results from Part 1 were used to inform the dose used in Part 2 of the study. With no placebo or active control arm, it is possible there was confounding of the treatment effect estimates from the trial. Furthermore, without comparison to a randomized control group, natural fluctuations in the course of SMA cannot be adjusted for, nor the effects of known and unknown confounders. Considering the study’s main objective as a dose-finding study, efficacy outcomes are considered exploratory in nature.
SUNFISH Part 1 was a placebo-controlled study for 12 weeks and then open-label for the rest of the trial. This dose-finding, phase II clinical trial provided information on the safety and efficacy of flat and weight-based doses of risdiplam in 51 infant and young adult patients with SMA type II and SMA type III. Results from Part 1 were used to inform the dose used in Part 2 of the study. Initially, the study was double-blinded for a minimum of 12 weeks, at which point patients receiving placebo were switched over to active treatment in their assigned cohort. The pivotal dose was selected, and all patients were switched to receive that dose for 24 months. Of the 51 patients, 14 patients received the pivotal dose from the beginning of treatment, 21 patients started active treatment at a lower dose before switching to the pivotal dose, and 16 patients started on placebo before switching to a lower dose initially (n = 10) or directly receiving the pivotal dose (n = 6). Unblinding occurred at the start of the open-label treatment period. With a limited placebo-control period, it is difficult to know the effects of confounders over time once all patients were receiving active treatment. The MFM-20 was mistakenly administered to 7 patients who should have completed the MFM-32. As a result, the investigators removed these 7 patients (all of whom were in the 2-year-old to 11-year-old cohort) from efficacy analysis.
External Validity
Generalizability of FIREFISH Part 1 and SUNFISH Part 1 to the general SMA population is not part of the studies' objectives, considering the studies’ dose-finding nature and that outcomes were exploratory. In addition, the small number of patients and the single-arm study design makes it difficult to generalize beyond the study populations. The results of these phase II studies should best serve as supportive evidence for the phase III confirmatory trials, FIREFISH Part 2 and SUNFISH Part 2.
Phase II Clinical Trial (Ongoing): JEWELFISH
Methods
JEWELFISH is a multi-centre, exploratory, open-label, phase II study of the safety, tolerability, PK, and PD of risdiplam for treatment of pediatric and adult patients who have previously received treatment for SMA. JEWELFISH was conducted at 24 sites in 9 countries (Belgium, France, Germany, Italy, the Netherlands, Poland, Switzerland, the UK, and the US). Enrolment began in March 2017 and was initially limited to patients between 12 years old and 60 years old who had been treated with either RO6885247 or nusinersen. The protocol was revised in June 2018 and February 2019, which lowered the eligible age to include infants as young as 6 months and patients previously treated with olesoxime or onasemnogene abeparvovec. As a result, the JEWELFISH population consisted of 174 patients aged 6 months to 60 years with SMA type I, SMA type II, or SMA type III. Patients were separated into cohorts based on which medication(s) they had previously received (RO6885247, nusinersen, olesoxime, or onasemnogene abeparvovec) and the risdiplam dose was determined based on age of body weight. The study treatment period is up to 104 weeks, after which patients can continue receiving risdiplam during the extension phase. A 52-week follow-up period will take place after treatment for all patients, regardless of study discontinuation, completion, or entry to the extension phase. The data cut-off date for the interim clinical study report was January 31, 2020.
Populations
Patients were eligible to participate in JEWELFISH if they met the following inclusion criteria:
male or female aged 6 months to 60 years, inclusive
confirmed diagnosis of 5q-autosomal recessive SMA
previously treated with any of the following: RO6885247 (during the MOONFISH study), nusinersen (at least 4 doses with the last dose received at least 90 days before screening), olesoxime (last dose received at least 90 days, but fewer than 18 months, before screening), or onasemnogene abeparvovec (last treatment received at least 12 months before screening)
able and willing to provide informed consent or by a legally authorized representative and comply with study protocol
adequate recovery from any acute illness at screening
negative blood pregnancy test, used a contraceptive, and/or agreed to refrain from donating eggs (for at least 28 days after the final dose) or sperm (for at least 4 months after the final dose)
patients younger than 2 years of age, agreement of the parent or patient’s caregiver that the patient receive adequate nutrition and hydration, receive medical care that met the local standard of care, and be able to complete all study procedures, and that the parent or patient’s caregiver was willing to consider nasogastric, nasojejunal, or gastrostomy tube placement as well as non-invasive ventilation at the investigator’s recommendation.
Patients were excluded from JEWELFISH if they met any of the following exclusion criteria:
current participation in another drug or device study, past participation in another drug or device study (other than those for olesoxime, onasemnogene abeparvovec, or nusinersen) within 90 days before screening or within 5 half-lives, whichever was longer
history of gene or cell therapy, other than onasemnogene abeparvovec
unstable gastrointestinal, renal, hepatic, endocrine, or cardiovascular system diseases at the discretion of the study investigator
inadequate venous or capillary blood access
for patients younger than 2 years, had undergone hospitalization or had incomplete recovery for a pulmonary event within 2 months of screening
major illness within 1 month before screening or febrile illness within 1 week of screening and up to first dose administration
lactating women
|||||||||||||||||||||||||||||||||||||||||||||||||||||||||||||||||||||||||||||||||||||||||||||||||||||||||||||||||||||||||||||| | |
|||||||||||||||||||||||||||||||||||||||||||||||||||||||||||||||||||||||||||||||||||||||||||||||||||||||||||||||||||||||||||||||| | ||||||||||||
|||||||||||||||||||||||||||||||||||||||||||||||||||||||||||||||||||||||||||||||||||||||||||||||||||||||||||||||||||||||||||||| |
||||||||||||||||||||||||||||||||||||||||||||||||||||||||||||||||||||||||||||||||||||||||||||||||||||||||||||||||||||||||||||||||
|||||||||||||||||||||||||||||||||||||||||||||||||||||||||||||||||||||||||||||||||||||||||||||||||||||||||||||||||||||||||||
||||||||||||||||||||||||||||||||||||||||||||||||||||||||||||||||||||||||||||||||||||||||||||||||||||||||||||||||||||||||||||||||
any clinically significant laboratory test abnormalities (e.g., electrocardiogram results, ALT, and creatinine levels)
history or evidence of any of the following: hypersensitivity to study drug or formulation; ophthalmological disease or other abnormalities at screening; history of malignancy if not considered cured; concomitant disease, condition, or treatment of the former that could interfere with the current study; suspicion or laboratory confirmation of drug or alcohol abuse; significant risk of suicidal behaviour (if older than 6 years)
||||||||||||||||||||||||||||||||||||||||||||||||||||||||||||||||||||||||||||||||||||||||||||||||||||||||||||||||||||
use of any OCT-2 and/or MATE substrates within 2 weeks before dosing, including mothers who are nursing the patients
|||||||||||||||||||||||||||||||||||||||||||||||||||||||||||||||||||||||||||||||||||||||||||||||||||||||||||||||||||||||||||||||||||||||||||||||||| |||||||||||||||||||||||||||||||||||||||||||||||||||||||||||||||||||||||||||||||||||||||||||||||||||||||||||||||||||||||||||||||||||||||||||||||||||| |||||||||||||||||||||||||||||||||||||||||||||||||||||||||||||||||||||||||||||||||||||||||||||||||||||||||||||||||||||||||||||||||||||||||||||||||| | ||||||||||||||||||||||||||||||||||||||||||||||||||||||||||||||||||||||||||||||||||||||||||||||||||||||||||||||||||||||||||||||||||||||||||||||||||| |
recent initiation (within 6 weeks before enrolment) of oral salbutamol or another oral beta2-adrenergic agonist for treatment of SMA, though patients receiving these treatments for more than 6 weeks and showing good tolerance were allowed
use of the following at any time: chloroquine, hydroxychloroquine, retigabine, vigabatrin, or thioridazine
||||||||||||||||||||||||||||||||||||||||||||||||||||||||||||||||||||||||||||||||||||||||||||||||||||||||||||||||||||||||
prior use of FMO1 or FMO3 inhibitor or inducer within 2 weeks or 5 half-lives before dosing, whichever is longer
Table 32 summarizes the baseline characteristics of patients in JEWELFISH. Patients were separated into 4 groups based on their previous treatment: RO6885247 during the MOONFISH study (n = 13), nusinersen (n = 76), olesoxime (n = 71), or onasemnogene abeparvovec (n = 14). Mean ages varied across groups based on previous treatment and patients were generally older in the RO6885247 group (32.2 years) compared to the olesoxime group (18.3 years), nusinersen group (16.1 years), and onasemnogene abeparvovec group (2.4 years). Males made up 54.6% of the ITT population, which was ||||||||||||||||||||||||||||||||||||. Of the ITT population, |||| were receiving BiPAP support for fewer than 16 hours per day and |||| had ventilation provided prophylactically. About 87.4% of patients were non-ambulant, 9.2% were ambulant, and 3.4% had data missing. SMA type II was the most common diagnosis in JEWELFISH at 62.1%, followed by 29.3% of patients who had SMA type III, and 8.6% of patients who had SMA type I.
Table 32: Summary of Baseline Characteristics in JEWELFISH — Intention-to-Treat Population
Characteristic | RO6885247 (n = 13) | Nusinersen (n = 76) | Olesoxime (n = 71) | Onasemnogene abeparvovec (n = 14) | All patients (N = 174) |
|---|---|---|---|---|---|
Demographics | |||||
Age at screening, years, mean (SD) | 32.2 (14.3) | 16.1 (13.5) | 18.3 (5.7) | 2.4 (1.2) | 17.1 (11.9) |
Age at onset of symptoms, months, n, mean (SD) | |||||| |||||| | |||||| |||||| | |||||| |||||| | |||||| || | |||||| |||||| |
Age at diagnosis, months, mean (SD) | |||||| |||||||||| | |||||| |||||| | |||||| |||||| | |||||| |||| | |||||| |||||| |
Time between onset of symptoms and first treatment (months), n, mean (SD) | |||||| |||||||||| | |||||| |||||||||| | |||||| |||||||| | |||||| |||||| | |||||| |||||||||| |
Male, n (%) | 9 (69.2) | 40 (52.6) | 35 (49.3) | 11 (78.6) | 95 (54.6) |
Race | |||||
White, n (%) | ||| | ||| | ||| | ||| | |||| |
Black, n (%) | ||| | ||| | ||| | ||| | ||| |
Asian, n (%) | ||| | ||| | ||| | ||| | ||| |
Multiple, n (%) | ||| | ||| | ||| | ||| | ||| |
Unknown, n (%) | ||| | ||| | ||| | ||| | ||| |
Disease history | |||||
BiPAP support < 16 hours/day, n (%) | ||| | ||| | ||| | ||| | ||| |
Ventilation provided prophylactically, n (%) | ||| | ||| | ||| | ||| | ||| |
No pulmonary care, n (%) | ||| | ||| | ||| | ||| | ||| |
Ambulatory status, n (%) | |||||
Ambulatory | 3 (23.1) | 13 (17.1) | 0 | 0 | 16 (9.2) |
Non-ambulatory | 10 (76.9) | 60 (78.9) | 71 (100) | 11 (78.6) | 152 (87.4) |
Missing | 0 | 3 (3.9) | 0 | 3 (21.4) | 6 (3.4) |
Genotype | |||||
SMN2 copies, n (%) | |||||
1 | 0 | 0 | 1 (1.4) | 1 (7.1) | 2 (1.1) |
2 | 0 | 9 (11.8) | 2 (2.8) | 3 (21.4) | 14 (8.0) |
3 | 6 (46.2) | 49 (64.5) | 45 (63.4) | 10 (71.4) | 110 (63.2) |
4 | 4 (30.8) | 7 (9.2) | 2 (2.8) | 0 | 13 (7.5) |
5 | 0 | 0 | 1 (1.4) | 0 | 1 (0.6) |
Unknown | 3 (23.1) | 11 (14.5) | 20 (28.2) | 0 | 34 (19.5) |
SMA type | |||||
I, n (%) | 0 | 9 (11.8) | 2 (2.8) | 4 (28.6) | 15 (8.6) |
II, n (%) | 5 (38.5) | 43 (56.6) | 50 (70.4) | 10 (71.4) | 108 (62.1) |
III, n (%) | 8 (61.5) | 24 (31.6) | 19 (26.8) | 0 | 51 (29.3) |
BiPAP = bilevel positive airway pressure; SD = standard deviation; SMA = spinal muscular atrophy; SMN2 = survival of motor neuron 2.
Source: Clinical Study Report of JEWELFISH.45
Interventions
|||||||||||||||||||||||||||||||||||||||||||||||||||||||||||||||||||||||||||||||||||||||||||||||||||||||||||||||||||||||||||||||||||||||||||||||||||||||||||||||||||||||||| |||||||||||||||||||||||||||||||||||||||||||||||||||||||||||||||||||||||||||||||||||||||||||||||||||||||||||||||||||||||||||||||||||||||||||||||||||||||||||||||||||||||||| | |||||||||||||||||||||||||||||||||||||||||||||||||||||||||||||||||||||||||||||||||||||||||||||||||||||||||||||||||||||||||||||||||||||||||||||||||||||||||||||||||||||||||| ||||||||||||||||||||||||||||||||||||||||||||||||||||||||||||||||||||||||||||||||||||||||||||||||||||||||||||||||||||||||||||||||||||||||||||
|||||||||||||||||||||||||||||||||||||||||||||||||||||||||||||||||||||||||||||||||||||||||||||||||||||||||||||||||||||||||||||||||||||||||||||||||||||||||||||||| |||||||||||||||||||||||||||||||||||||||||||||||||||||||||||||||||||||||||||||||||||||||||||||||||||||||||||||||||||||||||||||||||||||||||||||||||||||||||||||||||||||||||||| |||||||||||||||||||||||||||||||||||||||||||||||||||||||||||||||||||||||||||||||||||||||||||||||||||||||||||||||||||||||||||||||||||||||||||||||||||||||||||||||||||||||||| |||||||||||||||||||||||||||||||||||||||||||||||||||||||||||||||||||||||||||||||||||||||||||||||||||||||||||||||||||||||||||||||||||||||||||||||||||||||||||||| |||||||||| |||||||||||||||||||||||||||||||||||||||||||||||||||||||||||||||||||||||||||||||||||||||||||||||||||||||||||||||||||||||||||||||||||||||||||||||||||||||||||||||||||||||| ||||||||||||||||||||||||||||||||||||||||||||||||||||||||||||||||||||||||||||||||||||||||||||||||||||||||||
Outcomes
In JEWELFISH, safety outcomes were based on the safety population and summarized descriptively. They included AEs, SAEs, WDAEs, and deaths. PK, PD, and efficacy outcomes were not included in this interim report.
Statistical Analysis
|||||||||||||||||||||||||||||||||||||||||||||||||||||||||||||||||||||||||||||||||||||||||||||||||||||||||||||||||||||||||||||||||||||||||||||||||||||||||||||||||||||||| |||||||||||||||||||||||||||||||||||||||||||||||||||||||||||||||||||||||||||||||||||||||||||||||||||||||||||||||||||||||||||||||||||||||||||||||||||||||||||||||||||| |||||||||||||||||||||||||||||||||||||||||||||||||||||||||||||||||||||||||||||||||||||||||||||||||||||||||||||||||||||||||||||||||||||||||||||||||||||||||||||||| |||||||||||||||||||||||||||||||||||||||||||||||||||||||||||||||||||||||||||||||||||||||||||||||||||||||||||||||||||||||||||||||||||||||||||||||||||||||||||||||||||||||||||| |||||||||||||||||||||||||||||||||||||||||||||||||||||||||||||||||||||||||||||||||||||||||||||||||||||||||||||||||||||||||||||||||||||||||||||||||||||||||||||||||| |||||||||||||||||||||||||||||||||||||||||||||||||||||||||||||||||||||||||||||||||||||||||||||||||||||||||||||||||||||||||||||||||||||||||||||||||||||||||||||||||||||||||| |||||||||||||||||||||||||||||||||||||||||||||||||||||||||||||||||||||||||||||||||||||||||||||||||||||||||||||||||||||||||||||||||||||||||||||||||||||||||||||||||||||||| ||||||||||||||||||||||||||||||||||||||||||||||||||||||||||||||||||||||||||||||||||||||||||
Patient Disposition
Table 33 summarizes the patient disposition of JEWELFISH. Of the 182 individuals screened, 174 patients received treatment. The reasons for screening failures included patient withdrawal, history of treatment with excluded medications, and reasons due to medical history. Thirteen patients had previously received RO6885247 (during the MOONFISH study), 76 had received nusinersen (3 patients were previously treated with nusinersen and olesoxime, and were included in this group), 71 patients had received onasemnogene abeparvovec (1 patient was previously treated with onasemnogene abeparvovec and nusinersen, and was included in this group), and 14 patients had received olesoxime. Four patients withdrew from the study: 3 withdrawals were due to physician decision and 1 withdrawal was the patient’s decision. No patients withdrew due to AEs.
Table 33: Patient Disposition in JEWELFISH
Disposition | RO6885247 (n = 13) | Nusinersen (n = 76) | Olesoxime (n = 71) | Onasemnogene abeparvovec (n = 14) | All patients (N = 174) |
|---|---|---|---|---|---|
Screened | 182 | ||||
Enrolled, N (%) | 13 (100) | 76 (100) | 71 (100) | 14 (100) | 174 (100) |
Ongoing, n (%) | 12 (92.3) | 74 (97.4) | 70 (98.6) | 14 (100) | 170 (97.7) |
Reason for discontinuation, n (%) | |||||
Physician decision | 0 | 2 (2.6) | 1 (1.4) | 0 | 3 (1.7) |
Patient decision | 1 (7.7) | 0 | 0 | 0 | 1 (0.6) |
Entered OLE phase, n (%) | 8 (61.5) | 1 (1.3) | 0 | 0 | 9 (5.2) |
Entered safety follow-up, n (%) | 0 | 0 | 0 | 0 | 0 |
ITT population, n (%) | 13 (100) | 76 (100) | 71 (100) | 14 (100) | 174 (100) |
Safety-evaluable population, n (%) | 13 (100) | 76 (100) | 70 (98.6) | 14 (100) | 173 (99.4) |
ITT = intention-to-treat; OLE = open-label extension.
Note: Data are from the interim report with a cut-off date of January 31, 2020.
Source: Clinical Study Report of JEWELFISH.45
Exposure to Study Treatments
Exposure to risdiplam in JEWELFISH is summarized in Table 34. As of the data cut-off date, treatment exposure ranged from |||||| |||||||||||||||||||||||||||||||||||||||||||||||||||||||||||||||||||||||||||||||||||||||||||||||||||||||||||||||||||||||||||||||||||||||||||||||||||||||||||||||||| ||||||||||||||||||||||||||||||||||||||||||||||||||||||||||||||||||||||||||||||||||||||||||||||||||||
Table 34: Exposure to Risdiplam in JEWELFISH — Safety-Evaluable Population
Exposure | RO6885247 (n = 13) | Nusinersen (n = 76) | Olesoxime (n = 70) | Onasemnogene abeparvovec (n = 14) | All patients (N = 173) |
|---|---|---|---|---|---|
Treatment duration, months, mean (SD) | |||||||||| | |||||| | |||||| | |||||| | |||||| |
Treatment duration, months, median (range) | 23.69 (1.0 to 30.4) | 3.04 (0.0 to 32.8) | 3.12 (0.1 to 8.8) | 2.14 (0.1 to 3.0) | 3.02 (0.0 to 32.8) |
Number of dose adjustments, n (%) | |||||
0 | ||| | ||| | ||| | ||| | ||| |
1 | ||| | ||| | ||| | ||| | ||| |
2 | ||| | ||| | ||| | ||| | ||| |
≥ 3 | ||| | ||| | ||| | ||| | ||| |
SD = standard deviation.
Source: Clinical Study Report of JEWELFISH.45
Efficacy
Efficacy assessment is expected to be reported at a later date when mean exposure time is greater.
Harms
Safety outcomes for JEWELFISH are summarized in Table 35. Most patients (72.3%) experienced at least 1 AE. The most commonly reported AEs were upper respiratory tract infection (12.7%), headache (11.6%), diarrhea (7.5%), nasopharyngitis (6.9%), and nausea (6.9%). Fourteen patients (8.1%) reported having a SAE and there were no WDAEs or deaths.
Table 35: Summary of Safety Outcomes in JEWELFISH — Safety-Evaluable Population
Outcome | RO6885247 (n = 13) | Nusinersen (n = 76) | Olesoxime (n = 70) | Onasemnogene abeparvovec (n = 14) | All patients (N = 173) |
|---|---|---|---|---|---|
Patients with ≥ 1 AEs, n (%) | 11 (84.6) | 60 (78.9) | 44 (62.9) | 10 (71.4) | 125 (72.3) |
Most common AEs (frequency ≥ 2% of all patients), n (%) | |||||
Upper respiratory tract infection | 0 | 12 (15.8) | 9 (12.9) | 1 (7.1) | 22 (12.7) |
Nasopharyngitis | 1 (7.7) | 5 (6.6) | 5 (7.1) | 1 (7.1) | 12 (6.9) |
Viral infection | 0 | 7 (9.2) | 0 | 1 (7.1) | 8 (4.6) |
Influenza | 2 (15.4) | 3 (3.9) | 1 (1.4) | 1 (7.1) | 7 (4.0) |
Gastroenteritis | 0 | 4 (5.3) | 2 (2.9) | 0 | 6 (3.5) |
Pneumonia | 1 (7.7) | 3 (3.9) | 1 (1.4) | 1 (7.1) | 6 (3.5) |
Bronchitis | 0 | 3 (3.9) | 2 (2.9) | 0 | 5 (2.9) |
Sinusitis | 0 | 4 (5.3) | 1 (1.4) | 0 | 5 (2.9) |
Viral upper respiratory tract infection | 0 | 4 (5.3) | 0 | 0 | 4 (2.3) |
Diarrhea | 0 | 8 (10.5) | 4 (5.7) | 1 (7.1) | 13 (7.5) |
Nausea | 0 | 9 (11.8) | 3 (4.3) | 0 | 12 (6.9) |
Vomiting | 1 (7.7) | 3 (3.9) | 4 (5.7) | 0 | 8 (4.6) |
Abdominal pain, upper | 1 (7.7) | 3 (3.9) | 1 (1.4) | 1 (7.1) | 6 (3.5) |
Abdominal pain | 1 (7.7) | 3 (3.9) | 1 (1.4) | 0 | 5 (2.9) |
Aphthous ulcer | 1 (7.7) | 3 (3.9) | 0 | 0 | 4 (2.3) |
Oropharyngeal pain | 0 | 1 (1.3) | 5 (7.1) | 0 | 6 (3.5) |
Cough | 0 | 4 (5.3) | 1 (1.4) | 0 | 5 (2.9) |
Rhinorrhea | 1 (7.7) | 1 (1.3) | 2 (2.9) | 1 (7.1) | 5 (2.9) |
Pyrexia | 1 (7.7) | 8 (10.5) | 2 (2.9) | 3 (21.4) | 14 (8.1) |
Fatigue | 1 (7.7) | 5 (6.6) | 2 (2.9) | 0 | 8 (4.6) |
Pain | 0 | 2 (2.6) | 1 (1.4) | 0 | 3 (1.7) |
Headache | 0 | 13 (17.1) | 7 (10.0) | 0 | 20 (11.6) |
Rash | 1 (7.7) | 4 (5.3) | 2 (2.9) | 0 | 7 (4.0) |
Acne | 0 | 2 (2.6) | 2 (2.9) | 0 | 4 (2.3) |
Back pain | 2 (15.4) | 1 (1.3) | 2 (2.9) | 0 | 5 (2.9) |
Arthralgia | 2 (15.4) | 1 (1.3) | 1 (1.4) | 4 (2.3) | |
Pain in extremity | 2 (15.4) | 1 (1.3) | 1 (1.4) | 0 | 4 (2.3) |
Fall | 2 (15.4) | 2 (2.6) | 1 (1.4) | 0 | 5 (2.9) |
Patients with ≥ 1 SAEs, n (%) | 1 (7.7) | 9 (11.8) | 3 (4.3) | 1 (7.1) | 14 (8.1) |
Most common SAEs (frequency > 1 patient), n (%) | |||||
Lower respiratory tract infection | 0 | 1 (1.3) | 2 (2.9) | 0 | 3 (1.7) |
Upper respiratory tract infection | 0 | 3 (3.9) | 0 | 0 | 3 (1.7) |
Pneumonia | 0 | 1 (1.3) | 0 | 1 (7.1) | 2 (1.2) |
Respiratory failure | 0 | 2 (2.6) | 0 | 0 | 2 (1.2) |
WDAEs, n (%) | 0 | 0 | 0 | 0 | 0 |
Deaths, n (%) | 0 | 0 | 0 | 0 | 0 |
AE = adverse event; SAE = serious adverse event; WDAE = withdrawal due to adverse event.
Source: Clinical Study Report of JEWELFISH.45
Critical Appraisal
Internal Validity
JEWELFISH is a multi-centre, open-label, phase II clinical trial that provides results of the safety of risdiplam in pediatric and adult patients who have previously received treatment for SMA. Enrolment criteria initially included patients aged 12 years to 60 years who had been treated with RO6885247 or nusinersen. Protocol revisions lowered the eligible age to include infants as young as 6 months and patients previously treated with olesoxime or onasemnogene abeparvovec, resulting in the enrolment of 174 patients with SMA type I, SMA type II, or SMA type III. All patients received at least 1 previous treatment for SMA with the last dose administered 90 days or more before being screened for JEWELFISH. Without any control arms, it is unknown if or how the previous SMA medications would influence the outcomes of JEWELFISH and how these patients would compare to an untreated population or to patients treated with risdiplam alone. The original dose was changed partway through the treatment period both as a result of the SUNFISH Part 1 results and to account for the change in age eligibility. Therefore, some patients initially received risdiplam 3 mg for between 4 months and 9 months before being switched to 5 mg.
External Validity
JEWELFISH is ongoing and the results reflect the data available as of the cut-off date for the interim clinical study report (January 31, 2020). Some patients may have been unable to communicate (e.g., due to young age) and accurate reporting of patient harms was up to the caregiver. Consequently, it is possible that not all harms data were captured. The safety results do not necessarily reflect those of the final analysis and need to be considered on their own as representing a specific period of the trial. Efficacy results were not reported and, thus, are unknown in this patient population. Full results are still required to draw conclusions with a higher level of certainty.
Phase II Clinical Trial (Ongoing): RAINBOWFISH
RAINBOWFISH is a multi-centre, open-label, single-arm, phase II study of the efficacy, safety, PK, and PD of risdiplam in infants (from birth to 6 weeks of age) who have been genetically diagnosed with SMA, but are pre-symptomatic.46 The study will consist of screening, treatment for 2 years, open-label extension for at least 3 years, and a follow-up period. RAINBOWFISH began August 8, 2019, and was expected to enrol 25 patients. It is an ongoing study, and no additional information is available.
Discussion
Summary of Available Evidence
Two pivotal phase III studies met the pre-specified eligibility criteria for this review (FIREFISH Part 2 and SUNFISH Part 2). In addition, 3 supportive phase II studies were summarized in this review as additional relevant evidence (FIREFISH Part 1, SUNFISH Part 1, and JEWELFISH). One sponsor-submitted ITC was included in this review.
FIREFISH Part 2 (N = 41) is an ongoing, open-label, single-arm, phase III trial that investigated the efficacy and safety of risdiplam after 12 months of treatment in infants with SMA type I, 2 copies of the SMN2 gene, and no invasive ventilation. SUNFISH Part 2 (N = 180) is an ongoing, double-blind, placebo-controlled, phase III trial that investigated the efficacy and safety of risdiplam after 12 months of treatment in patients with SMA type II or non-ambulatory patients with SMA type III and who are between 2 years and 25 years of age (inclusive). FIREFISH Part 1 (N = 21) is an ongoing, open-label, single-arm, dose-finding, phase II trial that aimed to determine the appropriate therapeutic dose of risdiplam and reported on exploratory efficacy and safety findings at 12 months of treatment. SUNFISH Part 1 (N = 51) is an ongoing, 12-week, double-blind, dose-ranging, placebo-controlled trial that turns into a 24-month, open-label, single-arm trial. SUNFISH Part 1 aimed to assess the safety, tolerability, PK, and PD of risdiplam in patients with SMA type II or SMA type III aged 2 years to 25 years; the results of exploratory efficacy outcomes and safety were reported at 12 months of the study’s duration. JEWELFISH (N = 174) is an ongoing, phase II, open-label, exploratory study to assess the safety and tolerability of risdiplam in patients with SMA who received prior disease-modifying therapy. Only interim safety results are currently available from the JEWELFISH trial. One ongoing risdiplam study that was not available to be summarized in this report is RAINBOWFISH; it is an open-label, single-arm, phase II study of the efficacy, safety, PK, and PD of risdiplam in pre-symptomatic infants with a genetic diagnosis of SMA. RAINBOWFISH was expected to enrol 25 patients.
The sponsor-submitted ITC compared risdiplam to nusinersen in 2 distinct patient populations: infantile-onset SMA (SMA type I) and later-onset SMA (SMA type II or SMA type III). Comparison in the SMA type I population was done through an unanchored MAIC comparing a pooled FIREFISH Part 1 and Part 2 to the ENDEAR study. Comparison in the SMA type II or SMA type III population was done through an anchored MAIC, and a sensitivity analysis using a Bayesian NMA approach through a subset of the SUNFISH Part 2 and CHERISH studies.
Interpretation of Results
Efficacy
Patients With Infantile-Onset SMA or Who Are Diagnosed With SMA Type I
Both parts of the FIREFISH study addressed the infantile-onset SMA patient population (described as SMA type I). In FIREFISH Part 2, 41 infants received risdiplam at an age-determined dose. These infants had an average age of 5.2 (SD = 1.47) months and 2 SMN2 gene copies, and their onset of symptoms was reported at a mean age of 1.64 (SD = 0.70) months. Average disease duration in FIREFISH Part 2 was reported at 3.59 (SD = 1.35) months. At baseline, |||| of the infants were able to control their head upright, while |||| did not demonstrate any motor milestone achievement and 70.7% did not require any form of ventilatory support.
FIREFISH Part 2 achieved the primary outcome where 29.3% of infants (12 out of 41 infants) were able to sit without support after 12 months on treatment. This was contrasted with a natural history threshold of 5% (P < 0.0001). Of the reported secondary outcomes that are within the statistical hierarchy (tested with control of the type I error rate at 12 months of treatment), 56.1% of infants (23 out of 41 infants) had a CHOP INTEND score of 40 or higher (P < 0.0001 against a performance criterion of 17%), 90.2% (37 out of 41 infants) h-ad achieved an increase of at least 4 points in the CHOP INTEND score from baseline (P < 0.0001 against a performance criterion of 17%), and 78.0% (32 out of 41 infants) were considered motor milestone responders assessed through the HINE Section 2 (P < 0.0001 against a performance criterion of 12%). A total of 85.4% of patients were alive and did not require permanent ventilation at month 12 (35 out of 41 patients). This outcome was contrasted with a predefined threshold of 42% to give a statistically significant finding with a P value of less than 0.0001. These efficacy outcomes are supported by the exploratory efficacy results at month 12 of treatment in FIREFISH Part 1. Efficacy outcomes beyond 12 months are not yet available.
The lack of placebo or active control, the non-standard CI, statistical testing at twice the standard threshold, and the absence in randomization in the study design of FIREFISH may lead to overestimation of the effect of risdiplam. In addition, due to limitations in the study design, outcomes that may show variations in the natural clinical presentation pose difficulties in assessing the extent of the magnitude of benefit attributed solely to risdiplam.
While it is understandable that the clinical trials for risdiplam started at a time when disease-modifying therapies were not yet available for SMA, the current clinical landscape has 2 such therapies: nusinersen and onasemnogene abeparvovec. The lack of a head-to-head comparison strongly limits the generalizability of evidence that is based on hypothesis testing against thresholds from natural history studies of SMA when disease-modifying therapies were not available. To compensate for the lack of the head-to-head comparison, the sponsor conducted an unanchored MAIC to indirectly estimate the treatment effect of risdiplam versus nusinersen and onasemnogene abeparvovec. The comparison with onasemnogene abeparvovec was not possible due to the small sample size, while comparison with nusinersen through the pooled FIREFISH study weighted against the ENDEAR study suggested a favourable effect for risdiplam on the outcomes of ventilation-free survival (hazard ratio = 0.20; 95% CI, 0.06 to 0.42), and overall survival (hazard ratio = 0.26; 95% CI, 0.03 to 0.66). However, due to the strong and untested assumptions that are required for a valid unanchored MAIC result, the relatively small effective sample size, and the differences in study design and other unadjusted modifiers and prognostic factors, this result is associated with considerable statistical uncertainty and should be viewed with consideration of the many limitations outlined in the ITC section of this report.
The narrow eligibility criteria in FIREFISH have favoured the inclusion of clinically homogenous populations that are most likely to benefit from a disease-modifying treatment. Overall, infants in the FIREFISH study were young, had a recent diagnosis, did not require permanent ventilation, were highly likely to deteriorate quickly (in the absence of treatment) and, according to natural history studies, would have had a median survival of 13.6 months.9 However, these narrow eligibility criteria have also meant the exclusion of several groups of patients within the infantile period. These include the following.
Pre-symptomatic SMA infants who are captured through newborn screening
The sponsor is currently running another study, RAINBOWFISH, to explore the use of risdiplam in pre-symptomatic SMA infants. However, at the time of writing this review, no evidence exists on the efficacy of risdiplam in pre-symptomatic SMA patients.
Infants who may have received, or are receiving, another disease-modifying therapy
The sponsor is currently running another study, JEWELFISH, which aims to explore the use of risdiplam in any SMA patient who has received previous disease-modifying therapy (but not those patients who are currently receiving another disease-modifying therapy). However, at the time of writing this review, no evidence exists on the efficacy of risdiplam in infants with previous treatment with a disease-modifying therapy. This group of patients will increasingly become relevant as access to SMA disease-modifying therapies is increasing and not all infants treated will be deemed to have had a positive clinical outcome. This issue is further complicated by the fact that the mechanism of action of all of the available SMA disease-modifying therapies share the same end goal of increasing the concentration of available functioning SMN protein. No evidence exists of the efficacy and harms of concomitant treatment with other disease-modifying therapies.
Infants with a disease duration longer than 6 months
The rapid deteriorating nature of SMA, along with the irreversible loss of the alpha motor neurons, dictates that treatment with disease-modifying therapies that increase the levels of the SMN protein should be started as early as possible to save as many alpha motor neurons as possible, ideally before symptoms start.
Infants diagnosed as SMA type I with 3 or more copies of the SMN2 gene
The number of SMN2 gene copies is an established disease-modifying factor. The more copies of the SMN2 gene available, the less severe the illness. All infants enrolled in FIREFISH had 2 copies of the SMN2 gene. Generalizability of the results could be limited as up to 54% of patients diagnosed clinically as having type I SMA had 3 SMN2 gene copies. Therefore, it is unclear whether the results of FIREFISH can be extrapolated to those with 3 SMN2 gene copies.
Infants who require permanent ventilatory support
In FIREFISH, infants who required invasive ventilation, a tracheostomy, required awake non-invasive ventilation, or had awake hypoxemia (defined as arterial oxygen saturation less than 95%) with or without ventilator support were all excluded from the study. The requirement of extensive ventilatory support may be an indication of an advanced stage of the disease where irreversible damage has occurred. As such, it is not possible to generalize the results of FIREFISH into infants that require permanent ventilatory support.
A final consideration in this SMA population is the lack of availability of efficacy results beyond 12 months of treatment. This is relevant considering the lifelong nature of the disease and the treatment. FIREFISH is ongoing until 24 months of treatment and will continue as an open-label extension study for 5 years or until commercial risdiplam in the patient’s country is available. However, at the time of writing this report, no efficacy evidence exists beyond 12 months of treatment.
Patients With Later-Onset SMA or Who Are Diagnosed With SMA Type II or SMA Type III
In SUNFISH Part 2, 180 patients were randomized on a 2:1 ratio to risdiplam and placebo, respectively. The mean age of enrolled patients was 9.9 (SD = 5.8) years in the risdiplam group and 10.3 (SD = 6.1) years in the placebo group. Patients belonging to the age group of 18 years to 25 years formed the smallest age group (11.7% in risdiplam and 13.3% in placebo), followed by the age group of 12 years to 17 years (25.0% in risdiplam and 26.7% in placebo). Most patients had 3 SMN2 gene copies (89.2% in risdiplam and 83.3% in placebo), while more than two-thirds were diagnosed as having SMA type II (70.0% in risdiplam and 73.3% in placebo). At baseline, |||| were able to stand in the risdiplam arm and |||| in the placebo arm.
All the outcomes in SUNFISH Part 2 were reported at month 12 of the study. SUNFISH Part 2 achieved its primary end point where patients who received risdiplam had a mean difference versus placebo of 1.55 points (95% CI, 0.30 to 2.81) in the change of the MFM-32 score from baseline. The first secondary outcome tested within the statistical testing hierarchy after the primary outcomes was the MFM-32 responders (change of 3 points or more from baseline). This outcome showed that a total of 38.3% of patients in the risdiplam arm (44 out of 115 patients) were considered responders, compared to 23.7% in the placebo group (14 out of 59 patients), translating into a statically significant OR of 2.35 (95% CI, 1.01 to 5.44) for risdiplam versus placebo. Subsequently, the change in RULM score was tested, indicating a statistically significant mean difference versus placebo of 1.59 points (95% CI, 0.55 to 2.62). Subsequently, 2 co-outcomes were tested: change from baseline in the total score of HFMSE that failed to achieve statistical significance (mean difference = 0.58 points; 95% CI, –0.53 to 1.69) and change from baseline in best percentage predicted value FVC (mean difference = –2.05; 95% CI, –6.67 to 2.56). Patient- and clinician-reported outcomes, measured through the SMAIS and CGI-C tools, were next on the statistical testing hierarchy, but since the previous outcomes failed, these outcomes were no longer controlled for type I error, although the SMAIS and CGI-C results did not show a conclusive outcome in either direction.
The sponsor’s use of the overall scores of the MFM-32 required an understanding of what constituted an MID. Unfortunately, we were not able to find a published established estimate of the MID for MFM-32. However, the sponsor has indicated that a change of 3 points or more may translate into either the acquisition of a new function or the improvement in performance of several functions. This rationale was the basis of the responder definition that was used in the study. When applying the 3-point definition as a possible estimate of functional difference, the primary outcome failed to demonstrate such a difference, even at the upper limit of the 95% CI (MFM-32 change from baseline mean difference = 1.55 points [95% CI, 0.30 to 2.81]). Two other key motor function measurement tools used by the sponsor had published MIDs: RULM had an MID of 2.9 and HFMSE had an MID of 2. However, both of these MIDs were estimated using a distribution-based method. The MID may differ based on context and population or method of estimation. The distribution-based MID, however, was the only MID identified from the literature.47,48 Results of the mean difference versus placebo in both of these outcomes also does not achieve the published MID. Moreover, despite the deteriorating nature of SMA, a consistent observation across all outcomes, except for respiratory-related outcomes that saw deterioration in both the risdiplam and placebo arms, was that improvements were also reported in patients in the placebo group. This was most clear in the various categorical outcomes: MFM-32 responder (risdiplam: 38.3%; placebo: 23.7%), the RULM responders (risdiplam: ||||; placebo: ||||), the HFMSE responders (risdiplam: ||||; placebo: ||||), and the proportion of patients marked as “improved” on the CGI-C scale (risdiplam: 47.5%; placebo: 40.0%).
A pertinent point in the SUNFISH Part 2 design was the unequal number of patients randomized into the adult age group compared to the other 3 age groups. Specifically, of 180 randomized patients, only 22 were in the age group of 18 years to 25 years. This discrepancy in the number of patients in the age groups means that the age group of 18 years to 25 years did not contribute the same magnitude of effect to the assessed outcomes as the other age groups.
Subgroup analyses showed potentially inconsistent treatment effect across different subgroups, based on point estimates of the treatment effect, and wide CIs that frequently included the null. This inconsistency is more clearly observed in age subgroups. The age subgroup analysis was based on the age groups upon which randomization was stratified; this maintained randomization within the age subgroups. Patients in the youngest age group (2 years to 5 years) had the most favourable treatment outcome, while the magnitude of the beneficial effect of risdiplam seemed to decrease as we moved into older age groups. This trend was observed most clearly in the subgroup analysis of the primary outcome. However, the large CI associated with the subgroup estimates indicated high uncertainty and challenges into generalizability.
While the efficacy results from SUNFISH Part 2 were only available at 12 months, some exploratory efficacy results at 24 months were reported in the SUNFISH Part 1 study, which reflected the single-arm, open-label period of SUNFISH Part 1. The 24 months efficacy results show large variability and high uncertainty in the interpretation regarding the consistency of treatment effect from month 12 to month 24.
No head-to-head comparisons of risdiplam with other SMA disease-modifying therapies exist. As such, the sponsor conducted an anchored MAIC with a Bayesian NMA sensitivity analysis to provide an indirect comparison between risdiplam and nusinersen. The sponsor-submitted ITC included SUNFISH Part 2 and CHERISH for the MAIC analysis through the use of the SUNFISH Part 2 and CHERISH studies. Due to discrepancies in the inclusion and exclusion criteria, the sponsor-submitted ITC only used a subset of patients from the SUNFISH Part 2 study that would have been included in the CHERISH study, reducing the sample size of SUNFISH Part 2 by 62%. Subsequently, the weighting of the SUNFISH Part 2 sample produced an effective sample size in the risdiplam arm of 28.3. This small sample size translated into results with wide, and sometimes unrealistic, CIs in both the base-anchored base analysis and the NMA sensitivity analysis. This lack of statistical robustness, as well as the limitations associated with the persistent heterogeneity and the loss of the balanced distribution of characters in SUNFISH Part 2 after the subset selection, prevents any use of the presented outcome in a decision-making process.
Considering the totality of evidence pertaining to the later-onset SMA, generalizability of the results may be limited in the following patient groups.
Ambulatory SMA patients
These patients were excluded from the confirmatory SUNFISH Part 2 study but were included in the SUNFISH Part 1 study, where a total of 13.7% of patients enrolled in SUNFISH Part 1 were ambulatory. Ambulatory patients have more preserved motor function than non-ambulatory patients. However, at the same time, ambulation in a patient with a long disease duration may indicate a mild and potentially stable disease course. In either case, there is no evidence to assess the efficacy of risdiplam in improving or maintaining ambulation in SMA patients.
Adult SMA patients
While adult SMA patients were included in the SUNFISH Part 2 confirmatory trial, they represented the smallest age group in the study (12.2% of the study population, or 22 out of 180 patients) and had as such contributed the least of these age groups to the overall efficacy results. The generalizability of the overall results, in turn, is least in the adult age group. This is further illustrated in the potential inconsistency of the magnitude of effect across age groups in all outcomes. In these age group assessments, the adult age group would show the worst point estimates along with the widest CIs. The potential heterogeneity of effect in the adult population is also apparent in the exploratory nature of SUNFISH Part 1, where the analysis of patients 12 years to 25 years of age was consistently numerically less favourable when contrasted with patients 2 years to 11 years of age. Thus, the small representation of adult patients with SMA in the SUNFISH study, the high degree of uncertainty in the results of the subgroup analysis, and the pathophysiology of SMA indicate that the generalizability of the overall results of FIREFISH may be limited for adult patients with SMA.
Patients who may have received, or are receiving, another disease-modifying therapy
The findings are similar to the issue raised in the SMA type I population. However, the consideration of administering a new therapy after a previous 1 is likely to be more prevalent in pre-school and school-aged children as opposed to the infantile period. Until the results from JEWELFISH become available, there is no evidence to support the efficacy of risdiplam in patients with previous treatment with a disease-modifying therapy. No evidence exists of the efficacy and harms of concomitant treatment with other disease-modifying therapies.
Patients diagnosed as adult-onset or type IV SMA
These patients were not included in the trials. SMA type IV patients have the mildest disease course and the benefit of risdiplam in this disease population cannot be generalized from the results of SUNFISH.
Patients with invasive ventilation
These patients were excluded from the study. The requirement of extensive ventilatory support may be an indication of an advanced stage of the disease where irreversible damage have occurred. As such, it is not possible to generalize the results of SUNFISH to patients who require permanent ventilatory support.
Harms
Throughout all the sponsor-provided trials, the most common AEs were related to infections and/or respiratory problems — 2 common complications of SMA.
Similarly, SAEs were largely related to respiratory issues in all of the included trials. Death was reported in 4 patients in FIREFISH Part 1 and 3 patients in FIREFISH Part 2, with deaths largely due to respiratory complications.
Conclusions
By month 12 of treatment, patients in the FIREFISH Part 2 study were able to demonstrate the attainment of motor milestones, ventilation-free survival, and overall survival at levels that were statistically significant when compared to natural history thresholds. Patients in the SUNFISH Part 2 study did achieve the primary end point, at month 12 of treatment, with a statistically significant improvement in the MFM-32 score versus placebo, as well as in a secondary end point using the RULM score, though these differences may not have achieved a minimum important difference. Additionally, SUNFISH Part 2 failed to achieve statistical significance in the HFMSE and FVC outcomes, and no conclusive result can be determined for the outcomes of the SMA impact scale and the CGI-C “improved” rating. Respiratory- and infection-related AEs were most prevalent across the studies and were a related cause of death for 3 patients who died in FIREFISH Part 2.
Indirect evidence suggested that risdiplam could potentially be favoured over nusinersen in ventilation-free survival and overall survival. However, the high level of uncertainty associated with serious limitations imposed by the method used in deriving the indirect estimates coupled with the lack of assessment for residual biases preclude concluding that risdiplam is more efficacious than nusinersen for these outcomes
Evidence gaps exist in the lack of efficacy and safety outcomes in pre-symptomatic SMA patients, SMA patients with prior experience with nusinersen or onasemnogene abeparvovec, infants with a disease duration longer than 6 months, and SMA patients who require permanent ventilation. Additionally, despite adult patients with SMA having been included in the SUNFISH study, there are several limitations associated with generalizing the overall result of SUNFISH to the adult SMA population.
References
1.D'Amico A, Mercuri E, Tiziano FD, Bertini E. Spinal muscular atrophy. Orphanet J Rare Dis. 2011;6:71. PubMed
2.Tisdale S, Pellizzoni L. Disease mechanisms and therapeutic approaches in spinal muscular atrophy. J Neurosci. 2015;35(23):8691-8700. PubMed
3.Kolb SJ, Kissel JT. Spinal muscular atrophy: a timely review. Arch Neurol. 2011;68(8):979-984. PubMed
4.De Sanctis R, Coratti G, Pasternak A, et al. Developmental milestones in type I spinal muscular atrophy. Neuromuscul Disord. 2016;26(11):754-759. PubMed
5.Anderton RS, Mastaglia FL. Advances and challenges in developing a therapy for spinal muscular atrophy. Expert Rev Neurother. 2015;15(8):895-908. PubMed
6.Cartegni L, Hastings ML, Calarco JA, de Stanchina E, Krainer AR. Determinants of exon 7 splicing in the spinal muscular atrophy genes, SMN1 and SMN2. Am J Hum Genet. 2006;78(1):63-77. PubMed
7.Farrar MA, Park SB, Vucic S, et al. Emerging therapies and challenges in spinal muscular atrophy. Ann Neurol. 2017;81(3):355-368. PubMed
8.Kolb SJ, Kissel JT. Spinal muscular atrophy. Neurol Clin. 2015;33(4):831-846. PubMed
9.Belter L, Cook SF, Crawford TO, et al. An overview of the Cure SMA membership database: Highlights of key demographic and clinical characteristics of SMA members. J Neuromuscul Dis. 2018;5(2):167-176. PubMed
10.Arnold WD, Kassar D, Kissel JT. Spinal muscular atrophy: diagnosis and management in a new therapeutic era. Muscle Nerve. 2015;51(2):157-167. PubMed
11.Verhaart IEC, Robertson A, Wilson IJ, et al. Prevalence, incidence and carrier frequency of 5q-linked spinal muscular atrophy - a literature review. Orphanet J Rare Dis. 2017;12(1):124. PubMed
12.Zolgensma (onasemnogene abeparvovec), solution for intravenous injection, 2x10¹³ vector genomes/mL [product monograph]. Dorval (QC): Novartis Pharmaceuticals Canada Inc.; 2020 Dec 15: https://www.ask.novartispharma.ca/download.htm?res=zolgensma_scrip_e.pdf&resTitleId=1747. Accessed 2021 Apr 5.
13.Risdiplam, powder for oral solution, 0.75 mg/mL, reconstituted, oral or enteral [DRAFT product monograph]. Mississauga (ON): Hoffmann-La Roche Limited; 2020 Jul 27.
14.Drug Reimbursement Review sponsor submission: risdiplam, powder for oral solution, 0.75 mg/mL, reconstituted, oral or enteral [internal sponsor's package]. Mississauga (ON): Hoffmann-La Roche Limited; 2020 Nov 19.
15.Talbot K, Tizzano EF. The clinical landscape for SMA in a new therapeutic era. Gene Ther. 2017;24:529. PubMed
16.Wadman RI, Stam M, Gijzen M, et al. Association of motor milestones, SMN2 copy and outcome in spinal muscular atrophy types 0-4. J Neurol Neurosurg Psychiatry. 2017;88(4):365-367. PubMed
17.Gregoretti C, Ottonello G, Chiarini Testa MB, et al. Survival of patients with spinal muscular atrophy type 1. Pediatrics. 2013;131(5):e1509-1514. PubMed
18.Wijngaarde CA, Stam M, Otto LAM, et al. Population-based analysis of survival in spinal muscular atrophy. Neurology. 2020;94(15):e1634-e1644. PubMed
19.Zerres K, Rudnik-Schoneborn S. Natural history in proximal spinal muscular atrophy. Clinical analysis of 445 patients and suggestions for a modification of existing classifications. Arch Neurol. 1995;52(5):518-523. PubMed
20.Mercuri E, Darras BT, Chiriboga CA, et al. Nusinersen versus Sham Control in Later-Onset Spinal Muscular Atrophy. N Engl J Med. 2018;378(7):625-635. PubMed
21.Finkel RS, Mercuri E, Meyer OH, et al. Diagnosis and management of spinal muscular atrophy: Part 2: Pulmonary and acute care; medications, supplements and immunizations; other organ systems; and ethics. Neuromuscul Disord. 2018;28(3):197-207. PubMed
22.Dylan Trundell AS, Hannah Staunton, Asha Hareendran, Stephanie Le Scouiller, Louise Barrett, Owen Cooper, Ksenija Gorni, Tim Seabrook, Sangeeta Jethwa, Stefan Cano. Development of the SMA Independence Scale–Upper Limb Module (SMAIS–ULM): A novel scale for individuals with Type 2 and non-ambulant Type 3 SMA. J Neurol Sci. 2021.
23.Glascock J, Sampson J, Haidet-Phillips A, et al. Treatment Algorithm for Infants Diagnosed with Spinal Muscular Atrophy through Newborn Screening. J Neuromuscul Dis. 2018;5:145-158. PubMed
24.Genentech Inc. (Roche). Prescribing information: EVRYSDI™ (risdiplam) for oral solution. Silver Spring (MD): U.S. Food and Drug Administration; 2020: https://www.accessdata.fda.gov/drugsatfda_docs/label/2020/213535s000lbl.pdf. Accessed 2021 Apr 5.
25.Committee For Medicinal Products For Human Use. Summary of opinion (initial authorisation): Evrysdi - risdiplam. (European public assessment report). Amsterdam (Netherlands): European Medicines Agency; 2021 Feb 26: https://www.ema.europa.eu/en/medicines/human/summaries-opinion/evrysdi. Accessed 2021 Apr 5.
26.Spinraza (nusinersen injection): Solution for intrathecal injection 2.4 mg/mL nusinersen as nusinersen sodium [product monograph]. Mississauga (ON): Biogen Canada Inc.; 2020 April 20: https://www.biogen.ca/content/dam/corporate/en_CA/pdfs/products/SPINRAZA/SPINRAZAProduct_Monograph_EN.pdf. Accessed 2020 Oct 26.
27.McGowan J, Sampson M, Salzwedel DM, Cogo E, Foerster V, Lefebvre C. PRESS Peer Review of Electronic Search Strategies: 2015 guideline statement. J Clin Epidemiol. 2016;75:40-46. PubMed
28.Grey matters: a practical tool for searching health-related grey literature. Ottawa (ON): CADTH; 2019: https://www.cadth.ca/grey-matters. Accessed 2020 Dec 4.
29.Tech Report 1: Using the Bayley Scales of Infant and Toddler Development, Third Edition, to assess individuals with severe delays. Toronto (ON): Pearson Assessments; 2006: https://www.pearsonassessments.com/content/dam/school/global/clinical/us/assets/bayley-iii/bayley-iii-technical-report-1.pdf. Accessed 2020 Aug 30.
30.Albers CA, Grieve AJ. Test Review: Bayley, N. (2006). Bayley Scales of Infant and Toddler Development– Third Edition. San Antonio, TX: Harcourt Assessment. J Psychoeduc Assess. 2007;25(2):180-190.
31.Madaschi V, Mecca TP, Macedo EC, Paula CS. Bayley-III Scales of Infant and Toddler Development: Transcultural Adaptation and Psychometric Properties. Paidéia (Ribeirão Preto). 2016;26:189-197.
32.Glanzman AM, Mazzone E, Main M, et al. The Children's Hospital of Philadelphia Infant Test of Neuromuscular Disorders (CHOP INTEND): test development and reliability. Neuromuscul Disord. 2010;20(3):155-161. PubMed
33.Finkel RS, McDermott MP, Kaufmann P, et al. Observational study of spinal muscular atrophy type I and implications for clinical trials. Neurology. 2014;83(9):810-817. PubMed
34.Haataja L, Mercuri E, Regev R, et al. Optimality score for the neurologic examination of the infant at 12 and 18 months of age. J Pediatr. 1999;135(2 Pt 1):153-161. PubMed
35.Trundell D, Le Scouiller S, Le Goff L, Gorni K, Vuillerot C. Assessment of the validity and reliability of the 32-item Motor Function Measure in individuals with Type 2 or non-ambulant Type 3 spinal muscular atrophy. PLoS ONE [Electronic Resource]. 2020;15(9):e0238786. PubMed
36.de Lattre C, Payan C, Vuillerot C, et al. Motor function measure: validation of a short form for young children with neuromuscular diseases. Arch Phys Med Rehabil. 2013;94(11):2218-2226. PubMed
37.Trundell D, Le Scouiller S, Gorni K, Seabrook T, Vuillerot C, Group SMS. Validity and Reliability of the 32-Item Motor Function Measure in 2- to 5-Year-Olds with Neuromuscular Disorders and 2- to 25-Year-Olds with Spinal Muscular Atrophy. Neurol. 2020;9(2):575-584. PubMed
38.Mitsumoto H, Chiuzan C, Gilmore M, et al. Primary lateral sclerosis (PLS) functional rating scale: PLS-specific clinimetric scale. Muscle Nerve. 2020;61(2):163-172. PubMed
39.Mazzone ES, Mayhew A, Montes J, et al. Revised upper limb module for spinal muscular atrophy: Development of a new module. Muscle Nerve. 2017;55(6):869-874. PubMed
40.Stolte B, Bois JM, Bolz S, et al. Minimal clinically important differences in functional motor scores in adults with spinal muscular atrophy. Eur J Neurol. 2020;27(12):2586-2594. PubMed
41.O'Hagen JM, Glanzman AM, McDermott MP, et al. An expanded version of the Hammersmith Functional Motor Scale for SMA II and III patients. Neuromuscul Disord. 2007;17(9-10):693-697. PubMed
42.Kolb SJ, Coffey CS, Yankey JW, et al. Natural history of infantile-onset spinal muscular atrophy. Ann Neurol. 2017;82(6):883-891. PubMed
43.Clinical Study Report, Study BP39056 (FIREFISH), CCOD 14 Nov 2019 [internal sponsor's report]. Mississauga (ON): Hoffman-La Roche Ltd.
44.Clinical Study Report, Study BP39055 (SUNFISH), CCOD 09 Jan 2019 [internal sponsor's report]. Mississauga (ON): Hoffman-La Roche Ltd.
45.Clinical Study Report: Study BP39054 (JEWELFISH), CCOD 31 Jan 2020 [internal sponsor's report]. Mississauga (ON): Hoffman-La Roche Ltd.
46.Hoffmann-La Roche. NCT03779334: A study of risdiplam in infants with genetically diagnosed and presymptomatic spinal muscular atrophy (Rainbowfish). ClinicalTrials.gov. Bethesda (MD): U.S. National Library of Medicine; 2018; last updated 2021 Mar 15: https://clinicaltrials.gov/ct2/show/NCT03779334. Accessed 2021 Apr 5.
47.King MT. A point of minimal important difference (MID): a critique of terminology and methods. Expert Rev Pharmacoecon Outcomes Res. 2011;11(2):171-184. PubMed
48.Revicki D, Hays RD, Cella D, Sloan J. Recommended methods for determining responsiveness and minimally important differences for patient-reported outcomes. J Clin Epidemiol. 2008;61(2):102-109. PubMed
49.Manandhar SR, Dulal S, Manandhar DS, Saville N, Prost A. Acceptability and Reliability of the Bayley Scales of Infant Development III Cognitive and Motor Scales among Children in Makwanpur. Journal of Nepal Health Research Council. 2016;14(32):47-50. PubMed
50.Reeve BB, Wyrwich KW, Wu AW, et al. ISOQOL recommends minimum standards for patient-reported outcome measures used in patient-centered outcomes and comparative effectiveness research. Qual Life Res. 2013;22(8):1889-1905. PubMed
51.Glanzman AM, Mazzone ES, Young SD, et al. Evaluator Training and Reliability for SMA Global Nusinersen Trials1. J Neuromuscul Dis. 2018;5(2):159-166. PubMed
52.Glanzman AM, McDermott MP, Montes J, et al. Validation of the Children's Hospital of Philadelphia Infant Test of Neuromuscular Disorders (CHOP INTEND). Pediatr Phys Ther. 2011;23(4):322-326. PubMed
53.Kolb SJ, Coffey CS, Yankey JW, et al. Baseline results of the NeuroNEXT spinal muscular atrophy infant biomarker study. Ann Clin Transl Neurol. 2016;3(2):132-145. PubMed
54.Kichula E, Duong T, Glanzman A, et al. Children’s Hospital of Philadelphia Infant Test of Neuromuscular Disorders (CHOP INTEND) Feasibility for Individuals with Severe Spinal Muscular Atrophy II (S46.004). Neurology. 2018;90(15 Supplement):S46.004.
55.McClure NS, Sayah FA, Xie F, Luo N, Johnson JA. Instrument-Defined Estimates of the Minimally Important Difference for EQ-5D-5L Index Scores. Value Health. 2017;20(4):644-650. PubMed
56.Herdman M, Gudex C, Lloyd A, et al. Development and preliminary testing of the new five-level version of EQ-5D (EQ-5D-5L). Qual Life Res. 2011;20(10):1727-1736. PubMed
57.Luu KT, Norris DA, Gunawan R, Henry S, Geary R, Wang Y. Population pharmacokinetics of nusinersen in the cerebral spinal fluid and plasma of pediatric patients with spinal muscular atrophy following intrathecal administrations. J Clin Pharmacol. 2017;57(8):1031-1041. PubMed
58.McGraw S, Qian Y, Henne J, Jarecki J, Hobby K, Yeh WS. A qualitative study of perceptions of meaningful change in spinal muscular atrophy. BMC Neurol. 2017;17(1):68. PubMed
59.Glanzman AM, O'Hagen JM, McDermott MP, et al. Validation of the Expanded Hammersmith Functional Motor Scale in spinal muscular atrophy type II and III. J Child Neurol. 2011;26(12):1499-1507. PubMed
60.Mercuri E, Finkel R, Montes J, et al. Patterns of disease progression in type 2 and 3 SMA: Implications for clinical trials. Neuromuscul Disord. 2016;26(2):126-131. PubMed
61.Bishop KM, Montes J, Finkel RS. Motor milestone assessment of infants with spinal muscular atrophy using the hammersmith infant neurological Exam-Part 2: Experience from a nusinersen clinical study. Muscle Nerve. 2018;57(1):142-146. PubMed
62.Landgraf JM, Vogel I, Oostenbrink R, van Baar ME, Raat H. Parent-reported health outcomes in infants/toddlers: measurement properties and clinical validity of the ITQOL-SF47. Qual Life Res. 2013;22(3):635-646. PubMed
63.Raat H, Landgraf JM, Oostenbrink R, Moll HA, Essink-Bot ML. Reliability and validity of the Infant and Toddler Quality of Life Questionnaire (ITQOL) in a general population and respiratory disease sample. Qual Life Res. 2007;16(3):445-460. PubMed
64.Hobart J, Cano S. Improving the evaluation of therapeutic interventions in multiple sclerosis: the role of new psychometric methods. Health Technol Assess. 2009;13(12):iii, ix-x, 1-177.
65.Hoffmann-La Roche. NCT02908685: A study to investigate the safety, tolerability, pharmacokinetics, pharmacodynamics and efficacy of risdiplam (RO7034067) in Type 2 and 3 spinal muscular atrophy (SMA) participants (SUNFISH). ClinicalTrials.gov. Bethesda (MD): U.S. National Library of Medicine; 2016; last updated 2020 Jul 22: https://clinicaltrials.gov/ct2/show/NCT02908685. Accessed 2021 Apr 5.
Appendix 1: Literature Search Strategy
Clinical Literature Search
Overview
Interface: Ovid
Databases
MEDLINE All (1946-present)
Embase (1974-present)
Note: Subject headings and search fields have been customized for each database. Duplicates between databases were removed in Ovid.
Date of Search: December 17, 2020
Alerts: Bi-weekly search updates until project completion
Study types: No search filters were applied
Limits: No date or language limits were used
Conference abstracts: excluded
Syntax | Description |
|---|---|
/ | At the end of a phrase, searches the phrase as a subject heading |
* | Before a word, indicates that the marked subject heading is a primary topic; or, after a word, a truncation symbol (wildcard) to retrieve plurals or varying endings |
MeSH | Medical Subject Heading |
exp | Explode a subject heading |
.ti | Title |
.ab | Abstract |
.dq | Candidate term word (Embase) |
.ot | Original title |
adj# | Requires terms to be adjacent to each other within # number of words (in any order) |
.hw | Heading word; usually includes subject headings and controlled vocabulary |
.kf | Author keyword heading word (MEDLINE) |
.kw | Author keyword (Embase) |
.pt | Publication type |
.mp | Mapped term |
.rn | Registry number |
.yr | Publication year |
medall | Ovid database code: MEDLINE All, 1946 to present, updated daily |
oemezd | Ovid database code; Embase, 1974 to present, updated daily |
Multi-Database Strategy
Search strategy:
(Evrysdi* or risdiplam* or rg 7916 or rg7916 or ro 7034067 or ro7034067 or 76RS4S2ET1).ti,ab,kf,ot,hw,rn,nm.
1 use medall
*risdiplam/
(Evrysdi* or risdiplam* or rg 7916 or rg7916 or ro 7034067 or ro7034067).ti,ab,kw,dq.
3 or 4
5 use oemezd
6 not (conference review or conference abstract).pt.
2 or 7
remove duplicates from 8
Clinical Trials Registries
ClinicalTrials.gov
Produced by the U.S. National Library of Medicine. Targeted search used to capture registered clinical trials.
[Search -- Studies with results Evrysdi OR risdiplam]
WHO ICTRP
International Clinical Trials Registry Platform, produced by the World Health Organization. Targeted search used to capture registered clinical trials.
[Search terms -- Evrysdi OR risdiplam]
Health Canada’s Clinical Trials Database
Produced by Health Canada. Targeted search used to capture registered clinical trials.
[Search terms -- Evrysdi OR risdiplam]
EU Clinical Trials Register
European Union Clinical Trials Register, produced by the European Union. Targeted search used to capture registered clinical trials.
[Search terms -- Evrysdi OR risdiplam]
Grey Literature
Search dates: December 8 to 11, 2020
Keywords: Evrysdi, risdiplam, spinal muscular atrophy
Limits: None
Updated: Search updated prior to the completion of stakeholder feedback period
Relevant websites from the following sections of the CADTH grey literature checklist Grey Matters: A Practical Tool For Searching Health-Related Grey Literature were searched:
Health Technology Assessment Agencies
Health Economics
Clinical Practice Guidelines
Drug and Device Regulatory Approvals
Advisories and Warnings
Drug Class Reviews
Clinical Trials Registries
Databases (free)
Health Statistics
Internet Search
Appendix 2: Excluded Studies
Note that this appendix has not been copy-edited.
Reference | Reason for exclusion |
|---|---|
FIREFISH Part 1 | Study design |
SUNFISH Part 1 | Study design |
JEWELFISH | Study design |
Appendix 3: Description and Appraisal of Outcome Measures
Note that this appendix has not been copy-edited.
Aim
To describe the following outcome measures and review their measurement properties (validity, reliability, responsiveness to change, and MID).
Table 38: Outcome Measures Included in Each Study
Outcome measure | FIREFISH | SUNFISH | JEWELFISH |
|---|---|---|---|
Bayley Scales of Infant and Toddler Development, Third Edition | Primary | — | Exploratory |
Children’s Hospital of Philadelphia Infant Test of Neuromuscular Disorders | Secondary | — | — |
Clinical Global Impression of Change | Exploratory | Secondary | — |
EuroQol-5 Dimensions-5 Levels | — | Secondary | — |
Hammersmith Functional Motor Scale Expanded | — | Secondary | Exploratory |
Hammersmith Infant Neurological Examination Section | Secondary | — | Exploratory |
47-item Infant and Toddler Quality of Life Questionnaire | Exploratory | — | — |
Motor Function Measure–32 items | — | Primary | Exploratory |
Revised Upper Limb Module | — | Secondary | Exploratory |
SMA Independence Scale | — | Secondary | Exploratory |
SMA = spinal muscular atrophy.
Findings
Table 39: Summary of Outcome Measures and Their Measurement Properties
Outcome measure | Type | Conclusions about measurement properties | MID |
|---|---|---|---|
BSID-III | A standardized, norm-referenced assessment of developmental functioning across 5 domains using a combination of observational examinations and questionnaires | In a normative population, internal consistency and interrater reliability were determined to be acceptable. Test-retest reliability was low. Convergent validity was moderate. No literature was identified that assessed the BSID-III for validity, reliability, or responsiveness in patients with SMA. | No MID was identified in populations with SMA. |
CGI-C | A single-item, 7-point Likert scale | No literature was identified that assessed the CGI-C for validity, reliability, or responsiveness in patients with SMA. | No MID was identified in populations with SMA. |
CHOP INTEND | Motor function scale consisting of a set of 16 tasks to measure motor development in children with neuromuscular disorders. Each item was scored on a 5-point ordinal scale. corresponding to response levels. | Validity Face, construct, and convergent validity were adequate in patients with SMA. Reliability Intrarater and interrater reliabilities were adequate in patients with SMA. Responsiveness Responsiveness to change over time was adequate in patients with SMA. | No MID was identified in populations with SMA. |
EQ-5D-5L | Generic, preference-based measure of HRQoL consisting of 5 dimensions and 5 levels. | No literature was identified that assessed the EQ-5D-5L for validity, reliability, or responsiveness in patients with SMA. | An estimated MID between 0.037 and 0.069 for the general population. No MID was identified in populations with SMA. |
HFMSE | A set of 33 tasks to measure motor function in patients with SMA type II and type III with limited mobility, a 3-point ordinal scale for each item. | Validity Content and construct validity were adequate in patients with SMA. Reliability Test-retest and intrarater reliability were adequate in patients with SMA. Responsiveness No literature was identified that assessed responsiveness in patients with SMA. | An increase of > 2 points in total score is unlikely in untreated patients with SMA type II and type III. Patient and caregivers consider a 1-point increase meaningful. Standard error of measurement MID estimated to be a 4.3-point change for all patients with SMA. |
HINE Section 2 | A set of 8 motor milestones to assess development between the ages of 2 and 24 months, with a 3- to 5-point ordinal scale for each milestone. | Validity Construct validity was moderate when compared to CHOP INTEND scores in patients with SMA. Reliability Test-retest reliability was adequate in patients with SMA. Responsiveness No literature was identified that assessed responsiveness in patients with SMA. | A score of > 1 point for any given milestone is highly unlikely in untreated SMA type I patients. |
ITQOL-SF47 | A 47-item caregiver-completed, generic measure of QoL designed to assess infants from 2 months to 5 years of age. | Validity Validity was adequate in a sample of infants in the general population. No literature was identified that assessed the ITQOL-SF47 for validity, reliability, or responsiveness in patients with SMA. | No MID was identified in populations with SMA. |
MFM-32 | A 32-item instrument assessing a patient’s maximal motor function without assistance consisting of 3 domains and scored on a 4-point Likert scale. | Validity Convergent and known-groups validity were adequate in patients with SMA. Reliability Internal consistency and test-retest reliability were adequate in patients with SMA. Responsiveness No literature was identified that assessed responsiveness in patients with SMA. | No MID was identified in populations with SMA. |
RULM | A set of 19 tasks to measure motor function in non-ambulatory SMA patients, with a 3-point ordinal scale for each item. | Validity No literature was identified that assessed validity in patients with SMA. Reliability Internal consistency, interrater and intrarater reliability were adequate. Responsiveness No literature was identified that assessed responsiveness in patients with SMA. | Standard error of measurement MID estimated to be 2.9-point change for all patients with SMA. |
SMAIS | A 29-item questionnaire scored on a 3-point scale assessing the level of independence a patient requires to perform daily activities. | Validity Convergent and known-groups validity of the 22-item ULM were adequate when compared with MFM, HFMSE, and RULM, but not with EQ-5D. Content validity was adequate in patients with SMA. Reliability Test-retest reliability of the 22-item ULM was adequate for patients with stable SMA. Internal consistency was adequate for the both 29-item questionnaire and 22-item ULM in patients with SMA. Responsiveness Responsiveness was adequate when comparing the 22-item ULM and CGI-C in patients with SMA. | Estimated change of 2 to 3 points on the 22-item ULM is clinically meaningful in patients with SMA. |
BSID-III = Bayley Scales of Infant and Toddler Development, Third Edition; CHOP INTEND = Children’s Hospital of Philadelphia Infant Test of Neuromuscular Disorders; CGI-C = Clinician Global Impression–Change; EQ-5D-5L = 5-level EuroQol-5D; HFMSE = Hammersmith Functional Motor Scale Expanded; HINE Section 2 = Hammersmith Infant Neurological Examination–Section 2; HRQoL = health-related quality of life; ITQOL-SF47 = 47-item Infant and Toddler Quality of Life Questionnaire; MFM-32 = 32-item Motor Function Measure; MID = minimal important difference; QoL = quality of life; RULM = Revised Upper Limb Module; SMA = spinal muscular atrophy; SMAIS = SMA Independence Scale; ULM = Upper Limb Module.
Bayley Scales of Infant and Toddler Development, Third Edition
The BSID-III is a norm-referenced instrument designed to measure the developmental status of children aged 1 to 42 months, but it can also be used to estimate developmental level in older children with severe delays.29 The instrument assesses 5 scales: “Cognitive,” “Language,” “Motor,” Adaptive Behaviour,” and “Social-Emotional.” The administration and scoring procedures are completed by clinicians in a standard manner. The first 3 scales are assessed through direct observation of the child in test situations and the last 2 are evaluated using questionnaires which are completed by the main caregiver.31 Test administration takes approximately 50 min for children ≤ 12 months of age to 90 minutes for children > 12 months of age.30 For this review, the “Motor” scale is of particular interest and includes fine motor (66 items) and gross motor (72 items) subdomains.29,30 The gross motor skills items assess static positioning, dynamic movement including locomotion, quality of movement, balance, motor planning, and perceptual-motor integration. Only items within the basal and ceiling values are included in the calculation of the total raw score for each subtest. The BSID-III does not have an overall score but each domain has raw and scaled scores and each scale has composite scores and percentiles.31 With this information, the development level of the child can be placed into 1 of 7 levels: extremely low, borderline, low average, average, high average, superior, or very superior. The normative data used for the percentiles were collected from a representative sample of 1,700 children aged 16 days to 43 months and 15 days in 2004 in the US. The sample was representative of the October 2000 U.S. Bureau of the Census population survey data regarding education level of parents, race or ethnicity, and geographic region. It only included typically developing infants born between 36 and 42 weeks of gestation. Children with mental, physical, or behavioural difficulties were later added to the sample to make up approximately 10% of the total sample.
Internal consistency reliability was assessed using the split-half method corrected by the Spearman-Brown formula on the normative sample described above.30 The average reliability coefficients were calculated using Fisher’s z transformation. The subtest average reliability coefficient was estimated to be 0.86 for the fine motor subset and 0.91 for the gross motor subset, which indicate acceptable internal consistency reliability. Test-retest reliability was determined by re-administering the BSID-III to 197 children, who were tested twice between 2 and 15 days (mean retest interval = 6 days). The corrected correlation coefficients for the fine motor subset were estimated to be 0.67 in children aged 2 to 4 months which approaches the acceptable threshold for test-retest reliability and 0.83 for the gross motor subset in children aged 33 to 42 months, which is generally regarded as acceptable. Interrater reliability was assessed using the intraclass correlation coefficient (ICC) in a general population sample of 102 children aged 1 to 42 months in rural Nepal and determined to be 0.997 for the gross motor subset and 0.998 for the fine motor subset of the “Motor” scale.49 The interrater reliability was determined to be acceptable for both the gross and motor subsets of the “Motor” scale.
Convergent validity was assessed between the BSID-III “Motor” composite and the Peabody Developmental Motor Skills-Second Edition “Motor” quotients, which were moderately correlated (r = 0.49 to 0.57).30
In FIREFISH, the BSID-III gross motor subdomain was administered in a modified way; this was agreed to be acceptable after discussion between the sponsor and the licence holder of the scale.43 Modifications include not using infants’ age as the starting criteria for testing, changing the order in which items were administration, and not applying the discontinuation rule. Only raw (untransformed) scores were assessed. The 71 items of the gross motor subdomain were scored as 0 (unable to perform activity) or 1 (criteria for item achieved) and any missing or “cannot test” items were scored as 0.
No literature was identified that assessed the BSID-III for validity, reliability, or responsiveness in patients with SMA. No MID information was identified in patients with SMA.
Children’s Hospital of Philadelphia Infant Test of Neuromuscular Disorders
The CHOP INTEND was developed in infants with SMA type I to measure motor function in children with neuromuscular disorders presenting in infancy and possessing an infant’s repertoire of motor skills.32 The instrument consists of 16 items rated on a uniform scale from 0 to 4, corresponding to no response (0), minimal (1), partial (2), nearly full (3), and complete (4) response levels. The 16 items include: spontaneous movement (upper extremity), spontaneous movement (lower extremity), hand grip, head in midline with visual simulation, hip adductors, rolling (elicited from legs), rolling (elicited from arms), shoulder and elbow flexion and horizontal abduction, shoulder flexion and elbow flexion, knee extension, hip flexion and foot dorsiflexion, head control, elbow flexion, neck flexion, head/neck extension, and spinal incurvation. The maximum total score is 64; higher scores indicate more advanced motor development. The selection of items included in the CHOP INTEND was informed by an expert panel and the examination of the clinical utility and redundancy of items.32 The CHOP INTEND assessment is well tolerated by infants with neuromuscular disease who typically have limited tolerance to traditional motor assessments and can be administered to patients on invasive or non-invasive ventilation.33
Reliability of the CHOP INTEND was assessed in the study of the instrument development which was conducted in 26 infants with SMA type I.32 Intrarater reliability was assessed using the ICC over a 2-month period by the same evaluator in the test-retest of 9 infants with SMA type I and was determined to be acceptable (ICC = 0.96) according to the 0.7 threshold.32,50 In 2 global phase III clinical trials examining nusinersen in patients with SMA type I, examiners who were extensively trained on the administration and interpretation of the CHOP INTEND also demonstrated an acceptable intrarater reliability (in-person ICC = 0.895; video review ICC = 0.951).51 Interrater reliability of the CHOP INTEND was also assessed using the ICC in 10 infants with a variety of neuromuscular diseases (ICC = 0.98) and in typically developing infants (ICC = 0.93).32 One evaluator administered the CHOP INTEND on video and 4 evaluators scored the CHOP INTEND by videotape. Interrater reliability was demonstrated to be acceptable.
Face validity of the CHOP INTEND was supported by obtaining input from an expert panel in the selection of the final item set of the CHOP INTEND.32 Construct validity was established using Pearson’s correlation coefficient (r) in known-group comparisons in 27 patients with SMA type IB and 1C with a mean age of 4 years (range: 3.8 to 260 months).52 The CHOP INTEND score had moderate negative correlation with age (r = –0.51) and months since symptom onset (r = –0.49) but not with electrophysiological measures. Patients on non-invasive ventilation with BiPAP had lower scores than patients not requiring BiPAP (15.2 ± 10.2 versus 31.2 ± 4.2, P < 0.001). A different study established convergent validity in 23 infants with SMA type I and 14 healthy infants by comparing CHOP INTEND scores using Pearson’s correlation coefficient between groups and against the Test of Infant Motor Performance Screening Items (TIMPSI), an instrument previously validated in patients with SMA type I.53 The mean CHOP INTEND score was significantly lower in SMA infants compared to healthy infants (21.4 ± 9.6 versus 50.1 ± 10.2, P < 0.01). A strong correlation between the CHOP INTEND and TIMPSI scores was observed in both groups (SMA group: r = 0.855, n = 22; healthy group: r = 0.839, n = 9).
Responsiveness was assessed in 17 patients with SMA type I over a period of up to 36 months.33 The CHOP INTEND was sensitive to changes over time in patients with SMA type I as scores were shown to decease over time at a mean rate of 1.27 points per year. In an attempt to demonstrate its use in older patients, a different study compared a subset of CHOP INTEND items to the HFMSE in 13 patients with SMA type II aged 7 to 40 years with HFMSE scores ≤ 2 being treated with nusinersen.54 The distribution of the subset of CHOP INTEND scores was broader than the distribution of the HFMSE scores at baseline. Furthermore, 2 patients were retested after receiving their first doses of nusinersen and showed improved CHOP INTEND scores whereas their HFMSE scores remained at 0 indicating a floor effect for the latter. The investigators suggested the CHOP INTEND has better sensitivity to changes in gross motor function and muscle strength.
No MID information was found in the literature for the CHOP INTEND score in patients with SMA.
Clinician Global Impression of Change (CGIC)
The GIC is used to evaluate the change in a patient’s global health from baseline.35 It is a single-item, 7-point Likert scale with the following options: 1 = very much improved; 2 = much improved; 3 = minimally improved; 4 = no change; 5 = minimally worse; 6 = much worse; and 7 = very much worse. Different versions exist for clinicians (CGI-C) and patients or parents/caregivers (PGIC) exist.
No literature was identified that assessed validity, reliability, or responsiveness of the CGI-C in patients with SMA.
5-level EuroQol-5D (EQ-5D-5L) Questionnaire
The EQ-5D-5L was developed by the EuroQol Group as an improvement to the EQ-5D 3 level (EQ-5D-3L), to measure small and medium health changes and reduce ceiling effects.55,56 The instrument is comprised of 5 dimensions: mobility, self-care, usual activities, pain/discomfort, and anxiety/depression. Each dimension is rated on 5 levels: level 1 “no problems,” level 2 “slight problems,” level 3 “moderate problems,” level 4 “severe problems,” and level 5 “extreme problems” or “unable to perform.” A total of 3,125 unique health states are possible, with 55555 representing the worst health state and 11111 representing the best state. The corresponding scoring of EQ-5D-5L health states is based on a scoring algorithm that is derived from preference data obtained from interviews using choice-based techniques (e.g., time trade-off) and discrete choice experiment tasks. The lowest score varies depending on the scoring algorithm used. The anchors are 0 (dead) and 1 (full health), however negative values are also allowed to represent health states that a society considers worse than death. As an example, a Canadian scoring algorithm results in a score of –0.148 for health state 55555 (worst health state). Another component of the EQ-5D-5L is a visual analogue scale (EQ VAS), which asks respondents to rate their health on a visual scale from 0 (worst health imaginable) to 100 (best health imaginable).
An estimated MID for the general population was based off scoring algorithms for 6 countries (Canada, China, Spain, Japan, England, and Uruguay) to be between 0.037 and 0.069.55
No literature was identified that assessed the EQ-5D-5L for validity, reliability, or responsiveness in patients with SMA. No MID was identified in populations with SMA.
Hammersmith Functional Motor Scale Expanded
The Hammersmith Functional Motor Scale was designed to measure motor function in patients with SMA type II and type III with limited mobility.41 The HFMSE builds upon the HFMS by adding 13 items from the Gross Motor Function Measure (GMFM), an instrument designed for patients with cerebral palsy and previously validated in children with SMA. The HFMSE is intended for use in patients with SMA type II and type III and captures higher functioning skills. It consists of 33 activities that can be scored 1 of 3 ways: 0 for unable to perform, 1 for performs with modification/adaptation, and 2 for performs without modification. The item scores are summed to give a total score with a maximum of 66. The higher the total score, the greater the patient’s motor functioning.
Clinical evaluators deemed the items added from the GMFM to be clinically meaningful and focus groups and interviews established content validity of all of the HFMSE items.57,58 Focus groups with caregivers (n = 30) and patients (n = 25) of SMA type II and type III were able to relate each item to at least 1 relevant activity of daily living.57 A similar sample of patients and caregivers indicated in focus groups and interviews that the items on HFMSE were relevant to their life and that improvements in any of the items would translate to greater independence.58
Construct validity was assessed using both convergent validity and known-group comparisons in 2 studies in patients with SMA type II and type III and ages ranging from 2 to 45 years.41,59 Hypotheses regarding the strength of correlations with other measures were not stated. HFMSE score had strong (Spearman rank correlation coefficient ρ > 0.80) positive associations with the GMFM (both with and without the items that were added to the HFMSE), as well as a simple,10-point functional rating score ranging from “unable to sit” to “age-appropriate in motor skills” (ρ ranging from 0.88 to 0.98).41,59 Further convergent validity was established through positive correlations with FVC as a percentage of predicted normal value (ρ = 0.98), knee flexion and extension strength (Pearson correlation coefficient r = 0.74 for both), and elbow flexion strength (r = 0.77).59 Known-group comparisons showed statistically significant differences in median HFMSE score between those receiving BiPAP for less than and greater than 8 hours/day (23 versus 3, P < 0.0001), those who are able and unable to walk (52 versus 8, P < 0.0001), and those who have SMA type II and type III (49 versus 8, P < 0.0001). There were also statistically significant differences in median scores between patients with different SMN2 copy numbers (Kruskal-Wallis test: P = 0.0007).
In 1 trial where examiners were extensively trained on the administration and interpretation of the HFMSE (in 2 global phase III clinical trials that examined nusinersen in patients with SMA type I), the intrarater reliability was acceptable according to the 0.7 threshold (ICC[1, 1] = 0.0.959 and by video review, with ICC[1,1] ranging between 0.987 and 0.994).51
Reliability and change over time have also been studied. The HFMSE demonstrated adequate test-retest reliability when administered 2 months apart in patients with SMA type II and type III (ICC = 0.98).59 A natural history study measured HFMSE score over time in patients with SMA type II and type III (n = 268, age range of 2.5 to 55.5 years).60 Over 75% of the patients had a change in score from baseline to 12 months of –2 to +2 points. Only 7.84% experienced an increase of more than 2 points, and this was most likely to occur in children below 5 years of age. Focus groups and interviews with patients, parents, and clinicians representing SMA types I to III revealed that increases in the HFMSE scale as little as 1 point would represent meaningful change and that the scale increments may not be sensitive enough to capture small functional changes that are noticeable to patients.58
In a study of 51 adult patients with SMA type II and type III (n = 15 and 36, respectively), Stolte et al. calculated MIDs based on the SEM, 1/2 SD, and 1/3 SD using previously published test-retest reliability values.40 The SEM provided the smallest MID for all patients at 4.3 compared to 7.0 and 10.6 for 1/2 SD and 1/3 SD MIDs. A smaller MID range was calculated for patients with SMA type II (0.5 to 1.2) compared to those with SMA type III (4.3 to 10.7). The MID ranges were similar between ambulatory (n = 16) and non-ambulatory patients (n = 35) at 1.8 to 4.3 versus 1.5 to 3.8, respectively. A floor effect can be observed with HFMSE for patients with SMA type II resulting in a low MID score and may potentially limit its use in assessing patients who are weaker. The distribution-based approach to MID estimation that was used by Stolte et al. is generally less favoured than an anchor-based method.47,48 The MID may differ based on context and population or method of estimation.
Hammersmith Infant Neuromuscular Examination–Section 2: Motor Milestones
The HINE was based on a previous neurologic assessment and is meant for use in infants between 2 and 24 months of age.34 It contains 3 sections which assess neurologic signs (section 1), development of motor function (section 2), and state of behaviour (section 3). The items in sections 1 and 3 can be assigned scores on an ordinal scale based on descriptive ratings and the scores can be summed to give section scores. Section 2 is composed of 8 milestones: head control, sitting, voluntary grasp, ability to kick, rolling, crawling, standing, and walking. Each milestone has 3 to 5 possible descriptive ratings, ranging from not performing the task at all to fully demonstrating the milestone. The items can either be reported by the caregiver or observed by the examiner, though information regarding interrater reliability between caregivers and examiners was not found. Unlike the other sections of the HINE, the motor milestones are age-dependent and are not intended to produce a total score. Rating distributions are available for normal infants aged 12 months and 18 months for sections 1 and 2.
For most individual ratings for each motor milestone in section 2, a typical age of achievement in normal infants is provided34:
Head control:
Unable to maintain head upright, normal at < 3 months
Wobbles, normal at 4 months
All the time maintained upright, normal at 5 months
Sitting:
Cannot sit
With support, normal at 4 months
Props, normal at 6 months
Stable sit, normal at 7 months
Pivots, normal at 10 months
Voluntary grasp:
No grasp
Uses whole hand
Index finger and thumb but immature grasp
Pincer grasp
Ability to kick (in supine):
No kicking
Horizontally; legs do not lift
Upward (vertically), normal at 3 months
Touches leg, normal at 4 to 5 months
Touches toes, normal at 5 to 6 months
Rolling:
No rolling
Rolling to side, normal at 4 months
Prone to supine or supine to prone, normal at 6 months
Supine to prone and prone to supine, normal at 7 months
Crawling:
Does not lift head
On elbow, normal at 3 months
On outstretched hand, normal at 4 to 5 months
Crawling flat on abdomen, normal at 8 months
Crawling on hands and knees, normal at 10 months
Standing:
Does not support weight
Supports weight, normal at 4 to 5 months
Stands with support, normal at 8 months
Stands unaided, normal at 12 months
Walking:
Bouncing, normal at 6 months
Cruising (walks holding on), normal at 11 months
Walking, normal at 15 months
Natural history for the HINE Section 2 assessment was examined in infants with SMA type I with disease onset between 1 and 8 months of age.4 Over a period of about 4 years, retrospective data from patients were analyzed if the patients received at least 2 assessments occurring every 2 to 3 months until 12 months of age and every 6 months thereafter. Although the original HINE developers did not define a quantitative scoring system for section 2, scores for each milestone were obtained by assigning a value of 0 to the absence of the activity and adding 1 point for each incremental rating. All patients with SMA type IA (disease onset at birth, n = 7) had a score of 0 for every milestone at every assessment. The highest score on any item was 1 and, with the exception of 1 infant improving from 0 to 1 on ability to kick, none of the infants’ scores improved over time. Infants with SMA type IB (disease onset before 3 months of age, n = 24) had a score of 1 for at least 1 assessment for the following milestones: head control (n = 11), voluntary grasp (n = 17), and ability to kick (n = 13). Both infants with SMA type IC (disease onset between 3 and 6 months of age) maintained a score of 1 for head control, voluntary grasp, and ability to kick. The results imply that a score of more than 1 on any milestone is not expected in SMA type I patients.
Reliability and convergent validity of the HINE Section 2 in SMA type I were assessed in patients enrolled in the CS3A trial and who were administered nusinersen.61 Although not described, it is assumed that a total HINE Section 2 score was calculated by scoring each milestone on an ordinal scale (with 0 representing no ability) and summing the scores. Assessments within 14 days of each other demonstrated a test-retest reliability that was above 0.750 and, therefore, adequate (Pearson correlation coefficient r = 0.987, P < 0.0001, n = 19).61 Change in the HINE Section 2 score from baseline (1 to 7 months of age) to last assessment (5 to 39 months of age) was moderately correlated with change in the CHOP INTEND score (r = 0.691, P = 0.001) and ulnar CMAP amplitude (r = 0.511, P = 0.025). A priori hypotheses regarding the strength of correlations with CHOP INTEND and CMAP were not given. Incremental improvements in individual items were observed in 16 of the 19 infants and were spread out across all the milestones, suggesting responsiveness to intervention with nusinersen; however, no responsiveness statistics were calculated, nor was the relative responsiveness of the HINE versus the CHOP INTEND score or ulnar CMAP amplitude.
47-item Infant and Toddler Quality of Life Questionnaire (ITQOL-SF47)
Section
The ITQOL is a caregiver-reported, generic profile measure questionnaire used to assess health status and HRQoL for infants and children aged 2 months to 5 years62 It uses a 5-point Likert-style response from “all of the time” to “none of the time” to evaluate physical function, growth and development, bodily pain, temperament and moods, behaviour, and general health perceptions. The ITQOL also includes questions specific to the caregivers that consider emotional and time impact as well as family relationships. Higher scores indicate better HRQoL and raw scale scores are transformed to a scale from 0 to 100. The original questionnaire had been previously validated in samples of children from the general population (N = 410) and children with respiratory disease (N = 138).63 The ITQOL-SF47 is a shortened 47-item version that was used in SUNFISH.
The shortened version was developed based on a general sample of infants (N = 5,211) who had a median age of 12 months.62 It was decided that all scales would be retained from the original version and that, where appropriate, each scale or subscale would be reduced by a half while still upholding adequate scientific integrity as measured by a high alpha coefficient. The questionnaire consists of 6 infant/child scales and 2 parent scales. The infant/child portion includes physical abilities (6 items), growth and development (5 items), bodily pain (2 items), temperament and moods (6 items), behaviour (12 items), general health (5 items) and single-item questions for overall health and change in health. The parent portion includes emotional impact (4 items), time impact (4 items), and a single-item question about family cohesion. Items are scored such that a higher score represents better HRQoL and a mean score is calculated for each scale. Scale scores are transformed to scale from 0 to 100.
Once the shortened 47-item questionnaire was finalized, it was validated in infants from the general population (n = 309) in the Salland Dutch region who had a median (range) age of 24 (13, 35) months.62 Item convergent validity was acceptable if correlations were between 0.30 and 0.40 within the hypothesized scale while item discriminant validity was acceptable if correlations were 1 to 2 standard errors greater than correlations with other scales. The 2 were reported as “% scaling success” and 6 of the 8 scales ranged from 95% (temperament and mood) to 100% scaling success (physical abilities, growth and development, and bodily pain). Parental impact (emotional) and parental impact (time) were both 86% scaling success. Floor and ceiling effects were also investigated for the ITQOL-SF47. No floor effects were observed though there was a ceiling effect for nearly all scales ranging from 0% for behaviour to 82% for physical abilities scales. Internal consistency, using Cronbach’s alpha, was considered by the authors to be acceptable if found to be between 0.50 and 0.70; however, Cronbach’s alpha values ranged from 0.61 for parental impact (emotional) to 0.83 for bodily pain. Five of the 8 scales had an alpha greater than the generally accepted threshold of 0.70 (physical abilities, growth and development, bodily pain, temperament and moods, and behaviour). It may be worth noting that the ITQOL was designed to assess the health of infants whose age ranges from 2 months to 5 years though the ITQOL-SF47 was assessed in a population of children at least 13 months of age.
No literature was identified that assessed the ITQOL-SF47 for validity, reliability, or responsiveness in patients with SMA. No MID was identified in populations with SMA.
32-item Motor Function Measure
The MFM-32 is used to assess motor function of patients with neuromuscular disease. The 32 items are categorized in 3 domains: D1 (13 items) evaluates standing, transfers, and ambulation; D2 (12 items) measures proximal and axial function; and D3 (7 items) assesses distal function.35,36 A patient’s maximal ability without assistance is scored on a 4-point Likert scale: 0 = movement not initiated or starting position not maintained; 1 = exercise partially completed; 2 = exercise completed with compensations, slowness, or obvious clumsiness; and 3 = exercise completed with standard pattern. Subscores for can be calculated as a percentage of the maximum possible scores for each domain.36 The raw score (sum of the 32 items, ranging from 0 to 96) is divided by 96 (maximum score) and multiplied by 100 to produce a final score that can be interpreted as a “percentage of normal function.” A lower score indicates lower motor function.37
In 2 retrospective studies of patients with SMA type II and non-ambulant SMA type III, Trundell et al. assessed the validity and reliability of the MFM-32.35,37 One study37 consisted of 81 patients aged 2 to 25 years old while the second35 had 165 patients 6 to 27 years old who had been treated with olesoxime or placebo.
Test-retest reliability was measured by calculating the ICC and values ≥ 0.7 were considered acceptable.35 ICCs of 0.93 and 0.95 were calculated for patients who showed no change on the CGI-C and PGIC, respectively. Internal consistency reliability was measured by calculating Cronbach’s alpha at baseline and values ≥ 0.7 were considered acceptable. Cronbach’s alpha values of 0.89 to 0.95 were calculated in the 2 studies.35,37
Convergent validity was assessed using the Spearman rank order correlations with HFMSE and FVC scores. Scores were interpreted as follows: weak < 0.2; ≥ 0.2 modest < 0.4; ≥ 0.4 moderate < 0.6; ≥ 0.6 strong < 0.8, and ≥ 0.8 very strong.35 There was a stronger correlation observed between MFM-32 and HFMSE (Spearman’s ρ = 0.87) than between the MFM-32 and FVC (Spearman’s ρ = 0.61). Known-groups validity was assessed by comparing the means of known groups using analysis of covariance at baseline. Groups that were investigated mainly focused on the ability versus inability to stand or sit, as well as specific HFMSE scores. A P value < 0.05 was considered a significant difference. Comparisons between known groups using least squares mean followed an expected trend where higher MFM-32 scores were observed in patients with less severe disease and all analyses performed demonstrated statistically significant differences (P < 0.0001).
NatHis-SMA was a European, multi-centre, prospective study to assess the natural history of patients with SMA type II or 3 over the course of 24 months.38 Initially, 81 individuals between 2 years and 30 years of age were enrolled, consisting of patients with SMA type II who were non-sitters (n = 19) and those who were sitters (n = 34) as well as patients with SMA type III who were non-ambulant (n = 9) and those who were ambulant (n = 19) individuals. During the second year, 32 patients discontinued from the NatHis-SMA study to pursue treatment or participate in clinical trials. The investigators used 2 versions of the MFM, the 32-item scale for patients 6 years and older and the MFM-20 for those 2 to 5 years old. Using MFM total scores, the researchers were able to discriminate between the 4 groups: Type II non-sitters, sitters, type III non-ambulant, and ambulant. Though not statistically significant, mean (SD) MFM-32 scores (n = 40) declined from baseline values to 12 months for all patients; –1.35 (3.68) points (Wilcoxon test P = 0.073). At 24 months, a statistically significant decrease in mean (SD) MFM-32 scores (n = 27) was measured for all patients; –2.39 (4.35) points (P = 0.009). Only type II non-sitters (n = 11) displayed a significant decrease in mean score of –3.03 (3.77) points (P = 0.041) at 24 months; no significant decline was observed for the other groups at either 12 or 24 months.
Revised Upper Limb Module
The original ULM was designed to capture upper limb function in non-ambulatory SMA patients, especially in young children, and was previously validated in this population.39 Due to ceiling effects, it was revised and renamed the RULM. Some items in the RULM were incorporated from other upper limb scales, particularly the Performance of Upper Limb scale for Duchenne muscular dystrophy. During the revision process, the RULM was well tolerated with no refusals to participate noted, even in young children, with a test duration of 5 to 20 minutes. It consists of 19 items reflecting different functional domains that are graded on a 3-point scale. With the exception of 1 activity with a binary score, the possible scores are: 0 (unable), 1 (able, with modification), and 2 (able, no difficulty), giving a maximum total score of 38. The patient chooses 1 arm with which to perform the tasks.
Adequate interrater reliability was established using 3 video assessments of the RULM that were evaluated by 17 physiotherapists (ICC = 0.928).39 Rasch analysis was conducted on RULM assessments of 134 ambulatory and non-ambulatory SMA patients aged 2 to 52 years (median age of 9 years). Item and person locations revealed no floor or ceiling effects and only small gaps in measurement accuracy. The threshold map indicated that response categories for each item functioned as intended. The Person Separation Index (PSI), an indicator analogous to Cronbach’s alpha that assesses the ability of a set of items to separate the sample, demonstrated adequate internal consistency reliability (0.954).39,64 Indicators of fit demonstrated that the observed data overall did not differ from the expected responses as predicted by the Rasch model and that total RULM score is a suitable measurement of a single concept.39,64 Two pairs of items had correlated residuals, but their presence did not inflate the PSI. Scale performance did not differ between males and females, though it was not tested for groups expected to score differently.39 In another trial where examiners were extensively trained on the administration and interpretation of the RULM (in 2 global phase III clinical trials that examined nusinersen in patients with SMA type I), the intrarater and interrater reliability for the overall score were acceptable according to the 0.7 threshold (ICC[1, 1] = 0.948 and by video review, with ICC[1,1] ranging between 0.966 and 0.990, respectively).51 Associations with other measures of motor function and test-retest reliability were not found for the RULM.
In the same study evaluating the HFMSE, Stolte et al. calculated MIDs based on the SEM, 1/2 SD, and 1/3 SD for a group of 51 adult patients with Types 2 or 3 SMA (n = 15 or 36, respectively) using previously published test-retest reliability values.40 The SEM provided the smallest MID for all patients at 2.9 compared to 4.3 and 6.4 for 1/2 SD and 1/3 SD MIDs. A smaller MID range was calculated for patients with SMA type II (1.2 to 2.7) compared to those with SMA type III (2.7 to 5.9). Likewise, the calculated MID range was lower for ambulatory patients (n = 16) than for non-ambulatory patients (n = 35) (0.4 to 0.8 versus 2.0 to 4.4, respectively). It is worth noting that a ceiling effect can be observed with RULM for ambulant patients resulting in low MID scores which may limit its use in these populations. The distribution-based approach to MID estimation that was used by Stolte et al. is generally less favoured than an anchor-based method.47,48 The MID may differ based on context and population or method of estimation.
Spinal Muscular Atrophy Independence Scale
Roche developed the SMAIS during the SUNFISH study65 to supplement other patient- and observer-reported outcomes instruments which were considered inadequate at the time.14 Developing the SMAIS was a collaborative effort between Roche and the patient community for those with SMA type II and non-ambulatory SMA type III.
The SMAIS consists of 29 items and measures the level of independence a patient requires to perform daily activities.14 Roche It has 2 versions with identical items, one that is self-reported for patients over the age of 12 and another that is caregiver-reported for patients over 2 years old. Twenty-two of the 29 items cover activities that use the upper limbs such as personal hygiene, eating, drinking, and writing. The other 7 items focus on activities that rely on lower limb and proximal/axial movements such as mobility and completing chores. Each item is scored on a 3-point scale where 0 = unable to perform task at all without help; 1 = needs a lot to moderate amount of help; and 2 = needs little to no help. The total score for the 22-item upper limb portion ranges from 0 to 44 and is scored separately from the other 7 items which are considered stand-alone items. A higher overall score indicates greater independence.
An ICC of 0.91 was calculated for test-retest reliability between baseline and week 52 for patients with stable SMA (n = 74) as defined by the CGI-C.14 For internal consistency reliability, a Cronbach’s alpha of 0.90 was calculated for the 22-item upper limb patient self-reported total score (n = 66) and 0.91 for the observer-reported total score (n = 176). The SMAIS and other instruments commonly used in studies for SMA were compared where correlations < 0.30 reflected poor evidence, between 0.3 and 0.5 demonstrated moderate evidence, between 0.5 and 0.7 represented sufficient evidence, and scores > 0.7 showed very good evidence of convergent validity. Motor function measures like the MFM, HFMSE, and RULM had correlations of 0.77, 0.74, and 0.79, respectively, for patient self-report. Caregiver observer--report values were lower at 0.69, 0.60, and 0.74, respectively. The items from the EQ-5D were generally poorly correlated and/or negatively correlated with the SMAIS.
Content validity was assessed through semi-structured telephone interviews (N = 23) with individuals with SMA or caregivers, all of whom were in the US.22 Patients had a mean age of 25 years whereas patients who had caregivers responding as proxies had a mean age of 8.2 years. Overall, 70% of patients had SMA type II and 30% had type III. Psychometric properties of the SMAIS 21-item ULM were assessed using data from patients with SMA type II and non-ambulant type III.22 Test-retest reliability was assessed by SMAIS-ULM score ICCs between baseline and week 52 measures in stable patients. The investigators also examined convergent validity and hypothesized the relationships between the SMAIS-ULM and other instruments (MFM-32, HFMSE, RULM, and respiratory outcomes) as well as for known groups of individuals with differing levels of baseline motor function. Scale responsiveness was investigated by comparing SMAIS-ULM scores between groups (e.g., improved, stable, or worsened based on CGI-C scores) from baseline to week 52.
Internal consistency was estimated to be high with Cronbach’s alpha = 0.95 for the full 29 items and Cronbach’s alpha = 0.90 –0.91 (patient and caregiver–observer, respectively) for the SMAIS-ULM.22 Test-retest scores were also high (ICC = 0.91) among stable individuals comparing values at baseline to week 52. The SMAIS-ULM correlated well with other instruments for motor function such as the RULM (r = 0.74 and 0.79 for caregiver and patient reporting), MFM-32 (r = 0.69 and 0.77), and HFMSE (r = 0.60 and 0.74). Correlations were lower for respiratory function tests with r ranging from 0.28 to 0.64. Comparing the SMAIS-ULM with median-split (< or ≥ median) scores for the MFM-32, HFMSE, and RULM, all demonstrated significant (P < 0.0001) correlations which suggested evidence for construct validity using the known-groups approach. Furthermore, higher mean SMAIS-ULM scores correlated with better CGI-C scores and a statistically significant mean difference was calculated between groups who were improved versus worsened. Using a SEM distribution-based method, a meaningful within-patient change was estimated to be 2.53 points scored by caregivers and 2.72 points scored by patients. Though it varied by age subgroup, using the CGI-C for anchor-based analyses, it was estimated that a 1- to 5-point change on the SMAIS-ULM would be clinically meaningful. For all ages in the study (2 to 25 years), the mean change from baseline to week 52 was 1.4 points for caregiver-reporting and 2.8 points for patients self-reporting. Overall, a preliminary estimate of 2 to 3 points is expected to be meaningful for improvement. Note these assessments do not account for the SMAIS instrument as a whole (i.e., all 29 items) and represent only a selection of all SMA patients.
Pharmacoeconomic Review
Abbreviations
BSC
best supportive care
EFS
event-free survival
HINE Section 2
Hammersmith Infant Neurological Examination–Section 2
ICER
incremental cost-effectiveness ratio
MAIC
matching-adjusted indirect comparison
MFM-32
Motor Function Measure–32 items
OCCI
Ontario Case Costing Initiative
OS
overall survival
QALY
quality-adjusted life-year
SMA
spinal muscular atrophy
Executive Summary
The executive summary comprises 2 tables (Table 1 and Table 2) and a conclusion.
Item | Description |
|---|---|
Drug product | Risdiplam (Evrysdi), powder for oral solution |
Submitted price | Risdiplam, 60 mg/bottle (0.75 mg/mL), powder for oral solution: $193.97 per mg ($11,638.35 per bottle) |
Indication | Pre-NOC: For the treatment of spinal muscular atrophy Final: For the treatment of spinal muscular atrophy in patients 2 months and older |
Health Canada approval status | NOC |
Health Canada review pathway | Priority review |
NOC date | April 14, 2021 |
Reimbursement request | As per indication |
Sponsor | Hoffmann-La Roche Ltd |
Submission history | Previously reviewed: No |
NOC = Notice of Compliance.
Table 2: Summary of Economic Evaluation
Component | Description |
|---|---|
Type of economic evaluation | Cost-utility analysis Markov model |
Target population | Patients with SMA. Target population was divided into 2 subgroups evaluated separately:
|
Treatment | Risdiplam |
Comparators |
|
Perspective | Canadian publicly funded health care payer |
Outcome | QALYs |
Time horizon | Lifetime (25 years for the SMA type I subgroup and 80 years for the SMA type II or SMA type III subgroup) |
Key data source | SMA type I population: The FIREFISH study informed treatment efficacy with risdiplam. The ENDEAR trial informed an unanchored matching-adjusted indirect comparison for risdiplam with BSC. SMA type II or SMA type III population: The SUNFISH trial informed transitions between motor function health states for risdiplam and BSC. In both subgroups, the sponsor assumed equivalent treatment efficacy (motor function milestones, event-free survival, and overall survival) between risdiplam and nusinersen. |
Submitted results | SMA type I: ICER for risdiplam vs. BSC = $134,117 per QALY (incremental costs: $886,868; incremental QALYs: 6.62) SMA type II or SMA type III: ICER for risdiplam vs. BSC = $11,366,874 per QALY (incremental costs: $10,627,369; incremental QALYs: 0.93) Nusinersen was dominated by risdiplam in both subgroups. |
Key limitations |
|
CADTH reanalysis results |
|
BSC = best supportive care; ICER = incremental cost-effectiveness ratio; QALY = quality-adjusted life-year; SMA = spinal muscular atrophy; vs. = versus.
Conclusions
CADTH’s clinical review found limited comparative effectiveness evidence with regard to motor function milestone achievement, event-free survival (EFS), and overall survival (OS) for risdiplam in comparison with nusinersen and best supportive care (BSC). The limited availability of clinical evidence translates to limitations within the health economic evidence. The effect of this limitation is seen primarily within the comparison to BSC; the sponsor conservatively assumed risdiplam and nusinersen had equivalent treatment efficacy. There are no data available on the long-term efficacy of risdiplam, and results should be interpreted with caution.
CADTH conducted a reanalysis of the sponsor’s model, which excluded caregiver utilities in both subgroups. Compared with BSC, this resulted in an incremental cost-effectiveness ratio (ICER) of more than $1.2 million per quality-adjusted life-year (QALY) in spinal muscular atrophy (SMA) type I and an ICER of more than $37 million in SMA type II or SMA type III, indicating risdiplam would not be considered cost-effective at a conventional willingness-to-pay threshold. Price reductions of 99% would not be sufficient to reach a $50,000 per QALY threshold in either subgroup. Given the assumption of equivalent treatment efficacy, risdiplam continued to dominate nusinersen in reanalysis due to the drug acquisition costs associated with risdiplam being less than the publicly available price of nusinersen.
Several limitations beyond the lack of comparative efficacy data were identified that could not be addressed by CADTH: issues with the sponsor’s model structure not capturing all important factors of disease progression, as well as the implementation of mortality rates not reflecting the different likelihood of mortality based on the health state a person occupies. Due to these limitations and the uncertainty associated with the comparative clinical information, the cost-effectiveness of risdiplam remains highly uncertain.
Stakeholder Input Relevant to the Economic Review
This section is a summary of the feedback received from the patient and clinician groups that participated in the CADTH review process.
Cure SMA Canada, which supports individuals and families affected by SMA, and Muscular Dystrophy Canada, which offers a range of programs in support of those affected by neuromuscular disorders, provided patient group input. Cure SMA Canada gathered information via semi-structured telephone interviews, focus groups, and a survey from a total of 109 patients and caregivers, while Muscular Dystrophy Canada conducted semi-structured interviews and an online survey to collect patient input from a total of 92 individuals. Feedback from patient groups indicated a need for alternatives to nusinersen, given the burden of the intrathecal mode of administration, which includes painful spinal injections and frequent travel to hospitals for both treatment and to address adverse events like cerebral spinal fluid leaks. A daily oral treatment like risdiplam is seen as a favourable alternative with regard to administration, due to its reduction in the number of hospital visits and the pain experienced by patients from nusinersen. The key outcome for patients is a stop in the progression of disease. Patient group submissions also noted the enormous impact of SMA on activities of daily living, breathing, swallowing, and mobility, as well as pain, age-related fatigue, and a fear of falling.
Registered clinician input noted that SMA is currently treated using nusinersen and BSC, with a gene therapy, onasemnogene abeparvovec, which was not yet approved at the time. Clinicians noted that there was a need for novel therapies for patients with SMA who are contraindicated to nusinersen or onasemnogene abeparvovec, as well as a need for an oral therapy option. The oral formulation of risdiplam was thought to pose a large benefit over nusinersen, which is provided intrathecally. Clinical experts also noted a need for treatment options in patients with later-onset SMA, type II or type III, who are often not eligible for the current or soon to be available treatment options due to their age and felt risdiplam may be an option for such patients. The clinically meaningful responses to treatment were noted to be motor function milestone–based responses in children, as well as ventilation-free survival, whereas in adults, maintaining independence and the ability to speak were additionally noted as clinically important.
Several of these concerns were addressed in the sponsor’s model:
The model captured the impact of treatment on improvement of quality of life via the use of health states and utility values, based on motor function milestones.
The model captured disutilities due to the administration of nusinersen (spinal injections), as well as the additional costs of hospital visits for its administration.
Additional health care resource utilization related to symptom management was included within the analysis.
The sponsor submitted a model specific to the SMA type II or SMA type III subgroup of patients, in addition to the SMA type I subgroup of patients.
However, some of these concerns were not or could not be addressed by CADTH:
The model did not consider a comparison with onasemnogene abeparvovec. The cost-effectiveness of risdiplam in comparison remains unknown.
The model structure did not incorporate the impact of disease, as well as treatment, on nutritional support, or maintaining the ability to speak, or the impact of events such as falls.
Economic Review
The current review is for risdiplam (Evrysdi) for the treatment of SMA.
Economic Evaluation
Summary of Sponsor’s Economic Evaluation
Overview
The sponsor submitted a cost-utility analysis assessing risdiplam compared to nusinersen, and BSC, for the treatment of SMA. The target population in the sponsor’s base case also included informal caregivers in an attempt to fully capture the burden of disease on all those affected, while a scenario analysis was conducted excluding informal caregivers. The sponsor submitted 2 models to address this target population. One model was for patients with SMA type I, often referred to as infantile-onset SMA. The second model was for patients with SMA type II or SMA type III, where onset typically occurs after 18 months and further into childhood or adolescence. Two models were considered to better reflect the different natural history, age of onset, baseline motor function, and treatment efficacy between these 2 populations.1 The modelled population encompasses the majority of patients who fall under the anticipated Health Canada indication, though it does not consider patients with SMA type IV, who comprise less than 1% of cases.2
Risdiplam is available as a dry powder that must be reconstituted to an oral solution by a health care provider before being dispensed. The recommended dose is age- and body weight–dependent and is administered via oral syringe:
For patients between 2 months and 2 years of age, the recommended daily dose is 0.20 mg/kg.
For patients 2 years of age or older and weighing less than 20 kg, the recommended daily dose is 0.25 mg/kg.
For patients 2 years of age or older and weighing 20 kg or more, the recommended daily dose is 5 mg.2
As a result, the cost per administration and annual cost with risdiplam are weight dependent up until patients are 2 years of age and weigh at least 20 kg. At a cost of $193.9725 per mg, the cost per daily administration for such patients is $970, for a total annual cost of $354,000, while the average daily cost and annual cost for patients who are between 2 months and 2 years of age are $256 and $93,456, respectively.1 The BSC comparator included in the model was noted to be care provided in the absence of disease-modifying treatment and did not incur any treatment-related costs. Nusinersen was assumed to be administered as per the recommended dosage in its product monograph, with 4 loading doses in the first 63 days, followed by a maintenance dose every 4 months, with administration costs considered.2
The submitted models reported both QALYs and life-years over a lifetime time horizon of 25 years in the SMA type I population and 80 years in the SMA type II or SMA type III population. The base-case analyses were conducted from the perspective of the Canadian public health care payer, with discounting (1.5% per annum) applied to both costs and outcomes.
Model Structure
Both the model submitted for SMA type I and the model submitted for SMA type II or SMA type III were programmed in Microsoft Excel. The 6 health states included in the SMA type I model were “not sitting,” “sitting,” “standing,” “walking,” “permanent ventilation,” and death (Figure 1). The “not sitting,” “sitting,” “standing,” and “walking” health states were defined according to the Hammersmith Infant Neurological Examination–Section 2 (HINE Section 2) motor function milestones, a secondary end point in the FIREFISH trial, while “permanent ventilation” was defined as requiring at least 16 hours of non-invasive ventilation or intubation for more than 21 consecutive days. Patients could only move between adjacent motor function milestones (e.g., “not sitting” to “sitting”) on a monthly basis and could not skip a milestone, whether they were improving or regressing in motor function. Only patients in the “not sitting” health state were at risk of permanent ventilation, and all patients were at risk of mortality.
The SMA type II and SMA type III model also consisted of 6 health states that were also based on motor function milestone achievement. Unlike the SMA type I model, the health states were based on the primary end point from the SUNFISH trial, the Motor Function Measure–32 items (MFM-32). The health states included were “not sitting,” “supported sitting,” “unsupported sitting,” “standing,” “walking,” and death (Figure 2). Of note, the sponsor did not consider the MFM-32 to adequately capture the “walking” health state as it required a higher degree of coordination. The walking health state in the model was instead defined based on the Hammersmith Functional Motor Scale Expanded. The sponsor noted that they used the highest independent mobility categorization from the Hammersmith Functional Motor Scale Expanded, though they also noted that this also might not fully capture the “walking” health state. Patient transitions functioned similarly to those in the SMA type I model, where patients could either transition to a neighbouring motor function health state, either via improvement or regression, or remain in their current health state. They could not improve or regress to a health state with a motor function 2 steps above or below their own. There was no permanent ventilation health state in the SMA type II or SMA type III model, and all patients were at risk of mortality. Both the SMA type I and SMA type II or SMA type III models used a 1-month cycle length (i.e., each transition between health states was assumed to occur over the span of 1 month).
Model Inputs
Transition probabilities in the model were informed by different data and analyses for each of the submitted models. For SMA type I, the transition probabilities between motor function health states for risdiplam (i.e., the “not sitting” to “walking” health states) were derived by fitting a continuous time multi-state model informed by HINE-2 assessment data (i.e., motor milestone achievement) from the FIREFISH trial, a single-arm study that assessed the efficacy and safety of risdiplam in patients with infantile-onset SMA.3 In the absence of long-term data, transition probabilities were assumed to be constant for the entire time horizon of the model, as long as patients remained on risdiplam. Patients who discontinued risdiplam were considered to follow the same transition probabilities as patients receiving BSC. The FIREFISH study also informed the transitions to the death and “permanent ventilation” health states via the extrapolation of EFS and OS data, respectively, using parametric survival analysis. To avoid overlapping or crossing of these 2 curves, the sponsor chose to select a single survival distribution for both EFS and OS. The sponsor’s base case assumed that nusinersen and risdiplam were equally efficacious (i.e., identical transition probabilities for motor function milestones, EFS, and OS). The rate of treatment discontinuation with risdiplam was informed by a parametric survival analysis that extrapolated time-to-treatment discontinuation data, with the best-fitting curve (exponential) selected for use in the sponsor’s base case. In the absence of comparative data, the discontinuation rate was also assumed to be the same for patients on nusinersen, with the option to apply an alternative hazard ratio in scenario analyses.
A sponsor-conducted indirect treatment comparison, a matching-adjusted indirect comparison (MAIC), was used to inform the relative motor function milestone achievement, EFS, and OS, with BSC compared with risdiplam for the SMA type I subgroup. The sham control arm (i.e., no active comparator) of the ENDEAR nusinersen trial was used to inform motor function milestone achievement, EFS, and OS for BSC in the MAIC.4 These data were also available from the sponsor’s indirect treatment comparison for nusinersen, but were not used in the base case. The probability of regression from a motor function milestone health state while on BSC was conservatively assumed to be the same as risdiplam.
Data from part 2 of the SUNFISH trial were used to derive transition probabilities for both risdiplam and BSC for the SMA type II or SMA type III subgroup, with the BSC transitions informed by the placebo arm of the trial.5 The transitions between motor function health states were derived in the same manner as described for SMA type I, except the assessment of motor function milestone achievement as per the MFM-32 was used to inform the multi-state models instead of the HINE-2. Risdiplam use was included as a covariate in the multi-state model to derive treatment-specific transition probabilities between motor function health states. Nusinersen was assumed to have the same transition probabilities for motor function milestone achievement as risdiplam, based on the results of a sponsor-conducted indirect treatment comparison that indicated there was no statistically significant difference in treatment effect with risdiplam compared with nusinersen. As no deaths were recorded in the SUNFISH trial,5 the sponsor derived data from the literature to determine OS for all patients in the model,6 with no differences in survival between the 3 comparators assumed. Of note, the sponsor identified the proportion of the population with SMA type II or SMA type III in the model to apply appropriate mortality data relevant to each group. The aforementioned OS data from the literature was extrapolated using parametric survival analysis and applied to patients with SMA type II, while general population mortality based on Statistics Canada life tables was applied to the subset of the population with SMA type III, given they are generally assumed to have the same mortality risk as the general population.7 Treatment discontinuation was assumed to not occur for patients with SMA type II or SMA type III.
The only adverse event that was included in either submitted model was pneumonia, which was assumed to occur in 5.7% of patients on risdiplam based on the SUNFISH trial.5 In the absence of comparative data, the rate of occurrence with nusinersen and BSC was assumed to be 0%, the same as the placebo arm from the SUNFISH trial.
Health state utility values for patients in the SMA type I subgroup model were obtained from a sponsor-commissioned Canadian burden-of-illness survey, which was sent out to patients and caregivers with SMA (241 patients with SMA type I, 399 patients with SMA type II, and 283 patients with SMA type III; 285, 423, and 241 caregiver surveys, respectively), and included a EuroQol 5-Dimensions 5-Levels health utility questionnaire.5 Of note, in the absence of available data for the “permanent ventilation” and “not sitting” health states, the value identified in the survey for sitting supported was applied to both of these health states.
The EuroQol 5-Dimensions 5-Levels questionnaire was administered in the SUNFISH trial to patients older than the age of 12 and caregivers as proxies for patients younger than the age of 12.5 These values were used to inform health state utilities in the SMA type II or SMA type III subgroup. Health utility for SMA patients who could not sit were assumed to be the same as those sitting with support. The sponsor also applied caregiver utilities in their base case, which were identified from a discrete choice experiment in caregivers for patients with SMA type II or SMA type III, by health state.5 Several assumptions were made with regard to the applicability of these values to the model, which included that these values were applicable to the SMA type I population as well, that the value for “permanent ventilation” and “not sitting” was the same as for caregivers providing care to someone who could sit while supported, and that the value for “standing” was the same as for “walking.” Additionally, on average, there were 2 caregivers per patient according to the burden-of-illness survey.5 In the absence of data on the occurrence of disease-related events such as the requirement of respiratory support or development of severe scoliosis, no additional disease-related quality of life impacts were captured within the model.
Costs included in the model were treatment-related costs, adverse events costs (i.e., pneumonia), health state costs, and end-of-life costs. In the SMA type I model, the cost of risdiplam was based on patient weight and age at the time of the model cycle. For the SMA type II or SMA type III subgroup, patients were assumed to be more than 20 kg upon model entry and received the flat dosing of 5 mg of risdiplam daily. No wastage of risdiplam or nusinersen was assumed in both cases. The number of outpatient visits and hospitalizations and the frequency of use of concomitant medications by health state were identified from a Canadian burden-of-illness study commissioned by the sponsor.5 Costs for these sources of health care resource utilization were identified from the Alberta Health Hospital Care Case Costs, the Ontario Ministry of Health and Long-Term Care Schedule of Benefits, and the Ontario Drug Benefit e-formulary.8-10 Medical equipment costs by health state for each submitted model were also identified from the Canadian burden-of-illness study. End-of-life costs were obtained from Widger et al. for SMA type I and SMA type II, and Seow et al. for SMA type III.11,12
Summary of Sponsor’s Economic Evaluation Results
All analyses were run probabilistically (2,500 iterations for the base case and all scenarios). Deterministic and probabilistic results were similar. The probabilistic findings are presented below. Note that the submitted analyses are based on the publicly available price of nusinersen.
Base-Case Results
For the SMA type I subgroup, risdiplam was associated with incremental costs of $887,138 and QALYs of 6.62 in comparison with BSC, for an ICER of $134,117 per QALY. Nusinersen was dominated (i.e., it had higher costs and fewer QALYs) by risdiplam.
Table 3: Summary of the Sponsor’s Economic Evaluation Results — SMA Type I
Drug | Total costs ($) | Total QALYs | ICER ($/QALY) |
|---|---|---|---|
Best supportive care | 68,479 | 3.52 | Reference |
Risdiplam | 955,617 | 10.14 | 134,117 |
Nusinersen | 1,860,791 | 10.12 | Reference |
Risdiplam | 955,617 | 10.14 | Dominant |
ICER = incremental cost-effectiveness ratio; QALY = quality-adjusted life-year; SMA = spinal muscular atrophy.
Source: Adapted from the Sponsor’s Pharmacoeconomic Submission.1
In the SMA type II or SMA type III subgroup, risdiplam was similarly more costly (incremental costs: $10,627,369) and effective (incremental QALYs: 0.93) than BSC, for an ICER of $11,366,874 per QALY. Nusinersen was dominated by risdiplam.
Table 4: Summary of the Sponsor’s Economic Evaluation Results — SMA Type II or SMA Type III
Drug | Total costs ($) | Total QALYs | ICER ($/QALY) |
|---|---|---|---|
Best supportive care | 823,819 | 70.09 | Reference |
Risdiplam | 11,451,188 | 71.02 | 11,366,874 |
Nusinersen | 11,888,219 | 70.89 | Reference |
Risdiplam | 11,451,188 | 71.02 | Dominant |
ICER = incremental cost-effectiveness ratio; QALY = quality-adjusted life-year; SMA = spinal muscular atrophy.
Source: Adapted from the Sponsor’s Pharmacoeconomic Submission.1
In both subgroup analyses, for the comparison of risdiplam to nusinersen, results were driven by drug acquisition and administration costs, as well as the disutility due to intrathecal administration with nusinersen. In the comparison of risdiplam with BSC, the magnitude of the ICER is driven by the drug acquisition costs.
Sensitivity and Scenario Analysis Results
The sponsor conducted several sensitivity and scenario analyses. These analyses found that the cost-effectiveness results for risdiplam in comparison with BSC in both subgroups were most sensitive to changes in the assumption around caregiver utilities, health state utilities, and survival benefits for risdiplam versus BSC. Risdiplam dominated nusinersen in every scenario.
CADTH Appraisal of the Sponsor’s Economic Evaluation
CADTH identified several key limitations to the sponsor’s analysis that have notable implications on the economic analysis.
Uncertain comparative clinical efficacy of risdiplam with nusinersen and BSC for motor milestone achievement, EFS, and OS. Parameters within the sponsor’s SMA type I model that concern the relative clinical efficacy between risdiplam and BSC were informed by data from the FIREFISH trial. The CADTH clinical review identified important limitations within FIREFISH: the trial’s population was limited to symptomatic patients above 2 months of age and under 7 months of age who did not require ventilatory support and had only 2 copies of the survival of motor neuron 2 gene (SMN2). These patients are not necessarily reflective of the full indicated SMA type I population. The trial also did not include a valid control group. In the absence of direct comparative evidence, the sponsor used the results of an unanchored MAIC to estimate values for clinical efficacy parameters within the economic model of comparators. The CADTH clinical review concluded that the unanchored nature of the MAIC, and the potential influence of both measured and unmeasured prognostic factors, meant that the magnitude of benefit observed with risdiplam in comparison with BSC is highly uncertain. This uncertainty is passed on to clinical parameters and, in turn, on to the results of the model’s incremental cost-effectiveness estimates.
The sponsor’s model assumed that treatment with nusinersen resulted in patients experiencing the same motor function milestone achievement, EFS, and OS as those treated with risdiplam. Therefore, the limitations of the unanchored MAIC are not at risk of biasing the cost-effectiveness of risdiplam in comparison with nusinersen, though uncertainty still remains as to whether nusinersen and risdiplam are truly equally efficacious.
Motor function milestone achievement in the sponsor’s base case for the SMA type II or SMA type III subgroup was informed by data from the SUNFISH trial for risdiplam and BSC. The CADTH clinical review noted that there was no minimally important difference identified for the primary outcome in the SUNFISH trial, which was change from baseline mean difference in MFM-32. The sponsor has indicated that a change of 3 points or more may translate into either the acquisition of a new function or the improvement in performance of several functions, but patients on risdiplam failed to meet this difference in comparison with BSC. Despite the uncertainty that the benefit observed in the trial was clinically meaningful, risdiplam was still associated with greater QALYs than BSC, based on the sponsor’s submitted model. The CADTH clinical review also noted that the results of the SUNFISH trial may have limited generalizability to adult and ambulatory patients, given there were fewer patients aged 18 years to 25 years in the trial, and no ambulatory patients were included in the trial. As with the SMA type I subgroup, nusinersen was conservatively assumed to have the same motor function milestone, EFS, and OS as risdiplam, and no differences in EFS and OS were assumed for BSC in comparison with risdiplam for the SMA type II or SMA type III subgroup.
Overall, these issues led to notable uncertainty in the incremental QALYs estimated for risdiplam compared with BSC. As previously noted, the sponsor assumed the comparative efficacy of nusinersen to be similar to that of risdiplam in all regards, and the risk of bias in the results of this comparison are lower as a result. The lack of available data on certain patients also limits the generalizability of the cost-effectiveness estimated from the sponsor’s submitted models.
CADTH was unable to address this limitation in reanalyses.
Limited evidence on the durability of the treatment effect for risdiplam and nusinersen. The transition probabilities between motor function milestone health states in the model were assumed to be constant for the entire time horizon for all comparators in the model, including risdiplam and nusinersen. This assumption was applied to both the SMA type I model and the SMA type II or SMA type III model, despite only having efficacy data available for up to 12 months in the FIREFISH trial (SMA type I) and 24 months in the SUNFISH trial (SMA type II or SMA type III). Feedback from the clinical experts consulted by CADTH for this review indicated that there is limited evidence of the long-term durability of the treatment effect with either treatment, and that it is highly uncertain that survival motor neuron protein expression would remain constant throughout a patient’s lifetime and that it is theoretically possible for patients receiving risdiplam or nusinersen to experience a regression in motor function as a result of a lack of survival motor neuron protein expression. Additionally, there was no long-term comparative clinical effectiveness for EFS and OS. When considering the case of risdiplam versus BSC, approximately 8% of the QALY benefit observed in the sponsor’s base case for the SMA type I subgroup with risdiplam over BSC, and 3% in the SMA type II or SMA type III model, was from the period for which there was observed trial data. This results in a potential bias favouring the cost-effectiveness of risdiplam. The assumption of equivalent efficacy between risdiplam and nusinersen means that this issue is less of a concern for the comparison of risdiplam with nusinersen.
CADTH could not address this limitation within reanalyses.
The inclusion of caregiver utilities leads to an overestimate of the incremental benefit associated with risdiplam. The sponsor’s base cases for both SMA type I and SMA type II or SMA type III included health state utilities for 2 caregivers. CADTH acknowledges that caregiver burden is significant with SMA, and that patient improvements in motor function are likely to lead to gains in caregiver quality of life, though the CADTH requirements for CADTH Common Drug Review submissions note that the base case should be aligned with the Health Canada indication. The inclusion of the impact of treatment on caregiver quality of life would be appropriate for a scenario analysis but should not be included in the base-case analysis. The inclusion of caregiver health state utilities increases the incremental benefits observed with risdiplam in comparison with BSC in the sponsor’s base case, as the caregiver health state utilities contribute to 77% of the total QALYs and 66% of the incremental benefits observed. Their inclusion nearly triples the impact of treatment efficacy on patient quality of life observed in the model by carrying those effects over to the gains in quality of life to 2 caregivers. This biases results in favour of risdiplam in the sponsor’s base cases. This bias is not present in comparisons between risdiplam and nusinersen due to the assumption of equal treatment efficacy.
Caregiver health state utilities were excluded from the CADTH base case and were considered in a scenario analysis.
The submitted model does not capture all key changes in patient quality of life due to SMA and lacks face validity with regard to potential gains in motor function after regression in motor function and discontinuation. The submitted model structures were based primarily on patient achievement of motor function milestones. Such model structures may not adequately capture all disease events that affect patient quality of life, based on feedback from the clinical experts consulted by CADTH for this review. Their feedback indicated that quality of life for patients with SMA is not solely determined by their physical ability, and that other components, such as the requirement of nutritional support and bulbar function, or the loss of functional status, would also have a large impact. These events were not explicitly captured within the model.
Additionally, while patients in the model could experience regression in motor function, patients were just as likely to experience gains in motor functions as they were before the regression. This does not meet face validity, as such patients are likely experiencing a lack of treatment efficacy, according to the clinical experts consulted by CADTH for this review. A similar issue was observed with regard to treatment discontinuation. Patients who discontinued treatment could experience gains in motor function at the same rate as for patients on BSC. These discontinuing patients would no longer be receiving the drug necessary to achieve gains in motor function, though there is some uncertainty as to how long the drug effects might last following discontinuation. This post-discontinuation effect may also vary by SMA type, according to clinical expert feedback. SMA type I patients would not likely experience gains, though patients with SMA type II or SMA type III might have some natural gains, depending on their age. These limitations do not have as large an impact on the uncertainty in the comparison of risdiplam with nusinersen due to the assumption of equal efficacy, but this does lead to meaningful uncertainty for the estimate of the cost-effectiveness of risdiplam in comparison with BSC.
CADTH could not address this limitation within reanalyses.
Mortality risk assumed to be the same across health states in the model. The sponsor applied the same mortality rate for a given comparator to all health states within the model. This meant that patients requiring permanent ventilation had the same mortality risk as patients who were able to stand. Feedback from the clinical experts consulted by CADTH for this review noted that mortality is primarily related to respiratory function and swallowing, and indirectly related to ambulation. Patients requiring extensive respiratory support would have a higher risk of mortality than patients who are able to stand unassisted. The impact this has on model results is unknown. The impact on the comparison of risdiplam with nusinersen is minimal with regard to bias, though this does lead to meaningful uncertainty for the estimate of the cost-effectiveness of risdiplam in comparison with BSC.
CADTH could not address this limitation within reanalyses.
Submission of a single model for patients with SMA type II and SMA type III is likely inappropriate. The sponsor submitted a single model for the SMA type II and SMA type III subgroups. Feedback from clinical experts consulted by CADTH for this review indicated that this was unlikely to be appropriate, given the differences in natural history and typical disease progression between these 2 subgroups. While some SMA type III patients may have severe disease, for the most part, they are not as severe as SMA type II patients. SMA type II patients are more likely to have bulbar issues or require permanent ventilatory support, which was not included in the model for SMA type II or SMA type III. The sponsor’s estimates of the cost-effectiveness of risdiplam in the SMA type II or SMA type III population is highly uncertain.
CADTH could not address this limitation with reanalyses.
Serious adverse events were excluded from the model and their impact not appropriately captured. The sponsor only included grade 3 or higher treatment-related adverse events that occurred in more than 2% of the population in the SUNFISH trial. As the FIREFISH trial was non-comparative in nature, the rates from the SUNFISH trial were applied to both subgroups. The rates for nusinersen were assumed to be the same as those for BSC. As a result of these assumptions, only pneumonia was included as an adverse event in the model for patients on risdiplam. The FIREFISH study noted that common adverse events with risdiplam included upper respiratory tract infections, pyrexia, and constipation, in addition to pneumonia. Additionally, nusinersen is known to have adverse events associated with its use. The sponsor also assumed the impact of adverse events would already be captured in the utilities generated from their burden-of-illness study. This is likely inappropriate since it is probable that only patients who are well enough to participate in data collection will be represented, meaning that sicker patients experiencing more severe adverse events may be excluded from utility generation on the day of data collection. The exclusion of adverse events beyond pneumonia, as well as associated disutilities, is unlikely to have a large impact on the model results.
CADTH could not address this limitation within reanalyses.
An additional limitation was identified, but was not considered to be key to the analysis:
The sponsor used a probabilistic distribution for several cost inputs, including the drug acquisition and administration costs associated with nusinersen. These costs should remain fixed. These costs have been converted to fixed costs in the CADTH base case.
Additionally, the following key assumptions were made by the sponsor and have been appraised by CADTH (see Table 5).
Table 5: Key Assumptions of the Submitted Economic Evaluation (Not Noted as Limitations to the Submission)
Sponsor’s key assumption | CADTH comment |
|---|---|
Movement between health states was assumed to be sequential; patients could only move between adjacent health states and not skip any health states over the course of a single cycle. | Appropriate |
Patients with SMA type II or SMA type III were assumed to not discontinue treatment with nusinersen or risdiplam. | Uncertain. Clinical expert feedback indicated it is possible for patients to discontinue nusinersen or risdiplam, though it is unlikely given the impacts of discontinuation of treatment on patient prognosis. |
Patients who do not discontinue treatment prematurely continue treatment until their death. | Uncertain. According to clinical expert feedback, early discontinuation is not the only exit from treatment. Treatment duration will depend on ongoing individual goals, though given the alternative is likely regression in any gains in function achieved, patients are likely to continue indefinitely. It will also depend on the long-term duration of treatment effects. CADTH assessed the impact of alternative treatment discontinuation and duration assumptions in scenario analyses. |
Patients who discontinued risdiplam or nusinersen experienced the same transition probabilities as patients on BSC. | The probability of regression from a motor function milestone health state while on BSC was assumed to be the same as risdiplam. While this assumption biases results in favour of BSC, this also means that patients experienced the same probability of regression after discontinuing nusinersen or risdiplam, biasing results in their favour. CADTH was unable to determine which had a greater impact on model results. |
Adverse events with nusinersen were assumed to be the same as those with BSC. | Not appropriate. Patients on nusinersen are expected to experience more adverse events than patients on BSC. This was a conservative assumption, which was unlikely to bias results in favour of risdiplam. |
There is no difference in the occurrence of disease-related events like scoliosis or respiratory support between comparators in the model. | This is highly uncertain. Feedback from clinical experts consulted by CADTH indicated that the populations studied in the nusinersen and risdiplam trials are very different, and that there is no comparative evidence to support this assumption. The impact of this assumption on the cost-effectiveness of risdiplam could not be assessed. |
Health state utility for patients requiring permanent ventilation and not sitting assumed to be the same as patients sitting supported; walking the same as standing. | Appropriate |
Multi-state modelling could be used to estimate transition probabilities between motor function milestone health states for patients on risdiplam, as well as the treatment effect of risdiplam in comparison with BSC in the SMA type II or SMA type III model. | The sponsor estimated transition probabilities between motor function milestone health states with risdiplam by fitting a continuous time multi-state model to individual patient data from the FIREFISH and SUNFISH trials. This method allows for the estimation of transition rates between health states in the presence of covariates. The sponsor used this method to estimate the treatment effect of risdiplam vs. BSC for the SMA type II or SMA type III model. At CADTH’s request, the sponsor provided additional details about this method. The sponsor assumed that the model did not vary over time (i.e., time homogenous), placed constraints on the allowable transitions (e.g., only allowing movement between adjacent health states), and noted the inclusion of certain covariates. The method was accepted as appropriate for this review, though CADTH did note limitations with the time homogeneity assumption in the key limitations section, as there is limited evidence on the durability of treatment effect with risdiplam. |
BSC = best supportive care; SMA = spinal muscular atrophy; vs. = versus.
CADTH Reanalyses of the Economic Evaluation
Base-Case Results
Given the significant uncertainty associated with the comparative clinical effectiveness of risdiplam compared to BSC and nusinersen, a base case could not be determined. CADTH conducted reanalyses to obtain insight on the possible cost-effectiveness of risdiplam. CADTH undertook reanalyses that addressed some of the limitations with the model, as summarized in Table 6. These changes were applied to both the model for the SMA type I subgroup and the model for the SMA type II or SMA type III subgroup. CADTH could not address several limitations, including issues related to the long-term comparative efficacy of risdiplam, model structure, the exclusion of adverse events, and the generalizability of the results.
Table 6: CADTH Revisions to the Submitted Economic Evaluation
Stepped analysis | Sponsor’s value or assumption | CADTH value or assumption |
|---|---|---|
Correctionsa to sponsor’s base case | ||
1. Parameters that do not vary probabilistically | The sponsor applied probabilistic distributions to the following inputs:
| CADTH adjusted these parameters to be deterministic. |
Changes to derive the CADTH estimate | ||
1. Removal of caregiver disutilities | The sponsor included spillover utilities for 2 caregivers per patient. | CADTH excluded caregiver utilities. |
CADTH base case | — | 1 |
aCorrections are minor errors (e.g., transcription errors between report and model, misapplication of distributions or standard errors in probabilistic analyses, and so forth) that are not identified as limitations.
The sponsor’s corrected base case resulted in nearly identical results to the sponsor’s submitted base case. In the CADTH estimate for SMA type I excluding caregiver utilities, risdiplam was associated with estimated total costs of $965,780 and total QALYs of 1.08. The reduction in total QALYs when compared with the sponsor’s base case is solely due to the removal of caregiver utilities. The ICER compared with BSC was $1,203,108 per QALY. Based on this analysis, BSC is the optimal option up to a willingness-to-pay threshold of more than $1.2 million per QALY. Only 8% of the QALY benefit observed for risdiplam compared with BSC was from the period for which there was observed data. In comparison with nusinersen, risdiplam was dominant, resulting in greater QALYs, although nearly identical, and fewer costs.
A detailed breakdown of the disaggregate results is also available in Appendix 4, Table 13.
Table 7: Summary of the Stepped Analysis of the CADTH Reanalysis Results — SMA Type I
Stepped analysis | Drug | Total costs ($) | Total QALYs | ICER ($/QALYs) |
|---|---|---|---|---|
Sponsor’s base case | Best supportive care | 68,479 | 3.52 | Reference |
Risdiplam | 955,617 | 10.14 | 134,117 | |
Nusinersen | 1,860,791 | 10.12 | Reference | |
Risdiplam | 955,617 | 10.14 | Dominant | |
Sponsor’s corrected base case | Best supportive care | 68,293 | 3.53 | Reference |
Risdiplam | 961,580 | 10.19 | 134,229 | |
Nusinersen | 1,865,665 | 10.17 | Reference | |
Risdiplam | 961,580 | 10.19 | Dominant | |
CADTH estimate | Best supportive care | 69,311 | 0.34 | Reference |
Risdiplam | 965,780 | 1.08 | 1,203,108 | |
Nusinersen | 1,869,652 | 1.06 | Reference | |
Risdiplam | 965,780 | 1.08 | Dominant |
ICER = incremental cost-effectiveness ratio; QALY = quality-adjusted life-year; SMA = spinal muscular atrophy.
Note: All values in the table are as provided by the sponsor.
aReference product is least costly alternative.
For the SMA type II or SMA type III subgroup, the sponsor’s corrected base case resulted in nearly identical results to the sponsor’s submitted base case as well. In the CADTH estimate for SMA type II or SMA type III excluding caregiver utilities, risdiplam was associated with estimated total costs of $11,452,152 and total QALYs of 15.34, with the reduction in total QALYs when compared with the sponsor’s base case again due to the removal of caregiver utilities. The ICER compared with BSC was more than $37 million per QALY. Based on this analysis, BSC is the optimal option up to a willingness-to-pay threshold of more than $37 million per QALY. Only 3% of the QALY benefit observed for risdiplam compared with BSC was from the period for which there was observed data. In comparison with nusinersen, risdiplam was dominant, resulting in greater QALYs, although nearly identical, and fewer costs.
A detailed breakdown of the disaggregate results is also available in Appendix 4, Table 14.
Table 8: Summary of the Stepped Analysis of the CADTH Reanalysis Results — SMA Type II or SMA Type III
Stepped analysis | Drug | Total costs ($) | Total QALYs | ICER ($/QALYs) |
|---|---|---|---|---|
Sponsor’s base case | Best supportive care | 823,819 | 70.09 | Reference |
Risdiplam | 11,451,188 | 71.02 | 11,366,874 | |
Nusinersen | 11,888,219 | 70.89 | Reference | |
Risdiplam | 11,451,188 | 71.02 | Dominant | |
Sponsor’s corrected base case | Best supportive care | 825,656 | 70.11 | Reference |
Risdiplam | 11,454,583 | 71.04 | 11,343,198 | |
Nusinersen | 11,892,866 | 70.91 | Reference | |
Risdiplam | 11,454,583 | 71.04 | Dominant | |
CADTH estimate | Best supportive care | 823,674 | 15.05 | Reference |
Risdiplam | 11,452,152 | 15.34 | 37,378,163 | |
Nusinersen | 11,890,396 | 15.20 | Reference | |
Risdiplam | 11,452,152 | 15.34 | Dominant |
ICER = incremental cost-effectiveness ratio; QALY = quality-adjusted life-year; SMA = spinal muscular atrophy.
aReference product is least costly alternative.
Note: All values in the table are as provided by the sponsor.
Scenario Analysis Results
CADTH undertook price reduction analyses based on the sponsor’s base case and CADTH’s estimate analyses, assuming proportional price reductions for risdiplam (see Table 9 for SMA type I and Table 10 for SMA type II or SMA type III). Based on the CADTH reanalysis, a price reduction of more than 99% would be required for risdiplam to be considered the optimal therapy at a willingness-to-pay threshold of $50,000 per QALY in comparison with BSC for both subgroup analyses. Of note, in the SMA type II or SMA type III subgroup, the ICER with a 99% price reduction using the CADTH estimate was still above $300,000 per QALY gained. Given nusinersen was dominated by risdiplam in both the sponsor’s base case and the CADTH estimate, no price reductions were reported for this pairwise comparison.
Table 9: CADTH Price Reduction Analyses — SMA Type I (Deterministic)
Price reduction | ICERs for risdiplam vs. best supportive care ($/QALY) | |
|---|---|---|
Sponsor base case | CADTH reanalysis | |
No price reduction | $125,428 | $1,129,400 |
10% | $113,745 | $1,024,208 |
20% | $102,063 | $919,015 |
30% | $90,381 | $813,823 |
40% | $78,698 | $708,630 |
50% | $67,016 | $603,438 |
60% | $55,333 | $498,245 |
70% | $43,651 | $393,053 |
80% | $31,969 | $287,860 |
90% | $20,286 | $182,668 |
99% | $9,772 | $87,995 |
ICER = incremental cost-effectiveness ratio; QALY = quality-adjusted life-year; SMA = spinal muscular atrophy; vs. = versus.
Table 10: CADTH Price Reduction Analyses — SMA Type II or SMA Type III (Deterministic)
Price reduction | ICERs for risdiplam vs. best supportive care ($/QALY) | |
|---|---|---|
Sponsor base case | CADTH reanalysis | |
No price reduction | $11,398,690 | $37,229,796 |
10% | $10,257,443 | $33,502,316 |
20% | $9,116,196 | $29,774,835 |
30% | $7,974,949 | $26,047,355 |
40% | $6,833,702 | $22,319,874 |
50% | $5,692,455 | $18,592,394 |
60% | $4,551,208 | $14,864,913 |
70% | $3,409,961 | $11,137,432 |
80% | $2,269,714 | $7,409,952 |
90% | $1,127,467 | $3,682,471 |
99% | $100,344 | $327,739 |
ICER = incremental cost-effectiveness ratio; QALY = quality-adjusted life-year; SMA = spinal muscular atrophy; vs. = versus.
CADTH undertook a series of exploratory analyses to determine the impact of alternative assumptions on the cost-effectiveness of risdiplam. For SMA type I, the exploratory analyses conducted were as follows:
Removal of the disutility due to intrathecal injections with nusinersen.
Inclusion of caregiver utilities for 2 caregivers, as per the sponsor’s base case.
Differential discontinuation rates for nusinersen and risdiplam. Nusinersen was arbitrarily assumed to have a discontinuation rate 25% higher than that of risdiplam.
Treatment duration was applied for half the time horizon (12.5 years), instead of the entire time horizon.
An analysis using a 1-year time horizon, in alignment with the period for which there is available efficacy data from the FIREFISH trial part 2.
Analyses with the following price reductions for nusinersen:
10%
20%
30%
95%.
The results of these analyses are presented in Appendix 4 (Table 15). The results were generally robust to changes to the inputs and assumptions assessed in the scenario analyses. The only scenario that led to changes in the ICER of note were the scenarios altering the price of nusinersen. Only the scenario assessing a 95% price reduction for nusinersen resulted in nusinersen no longer being dominated. In this scenario, risdiplam was associated with an ICER of $34,064,823. The price reduction of 30% for nusinersen resulted in risdiplam continuing to dominate. In the scenario where the disutility due to intrathecal injections with nusinersen administration was removed, risdiplam was no longer associated with greater total QALYs than nusinersen, with a lower total cost for risdiplam.
For SMA type II or SMA type III, the exploratory analyses undertaken by CADTH were as follows:
Removal of the disutility due to intrathecal injections with nusinersen.
Inclusion of caregiver utilities for 2 caregivers.
Discontinuation rate of 1% per month for nusinersen and risdiplam applied. This rate was arbitrarily chosen to observe the impact of treatment discontinuation on model results.
Treatment effect duration was applied for half the time horizon (40 years) instead of the entire time horizon.
An analysis using a 2-year time horizon, in alignment with the period for which there is available efficacy data from the SUNFISH trial.
Analyses with the following price reductions for nusinersen:
10%
20%
30%
95%
The results of these analyses are presented in Appendix 4 (Table 16). Similar to the SMA type I subgroup, the results were generally robust to the changes described for each scenario. When a 2-year time horizon was considered (the period for which there is available evidence), the ICER for risdiplam compared with BSC rose to more than $100 million per QALY. Additionally, the scenarios testing price reductions for nusinersen resulted in notable results. With a 10%, 20%, or 30% price reduction, the ICER for risdiplam in comparison with nusinersen was more than $4.7 million per QALY, $12.7 million per QALY, and $20 million per QALY, respectively. In the scenario where the disutility due to intrathecal injections with nusinersen administration was removed, risdiplam was no longer associated with greater total QALYs than nusinersen, with lower total cost for risdiplam.
Issues for Consideration
Onasemnogene abeparvovec has recently been approved by Health Canada for the treatment of SMA. Onasemnogene abeparvovec is a 1-time gene therapy that does not require any subsequent treatment administrations. The cost-effectiveness of risdiplam in comparison with onasemnogene abeparvovec is unknown.
The use of risdiplam in combination or in sequence with nusinersen, either switching from or after failure, may be of interest to patients or their caregivers. Combined or sequential use of these agents is not supported by clinical evidence, and the cost-effectiveness of risdiplam in this context remains unknown.
The scenario analysis that excluded a disutility for intrathecal administration of nusinersen resulted in identical total QALYs between nusinersen and risdiplam in both subgroups. If it is assumed nusinersen and risdiplam have equivalent treatment efficacy and safety, patient preference for intrathecal administration may be an important consideration. The clinical experts consulted by CADTH for this review noted it was possible that some patients may prefer the infrequent administration associated with nusinersen.
The sponsor and CADTH estimate of the cost-effectiveness of risdiplam in comparison with nusinersen is based on the publicly available list price of nusinersen. The magnitude of price reduction with nusinersen relative to its list price has an impact on the cost-effectiveness of risdiplam in comparison.
Overall Conclusions
The CADTH clinical review found no high-quality comparative effectiveness evidence with regard to motor function milestones, EFS, and OS for risdiplam in comparison with nusinersen and BSC. This affects the comparison with BSC more than the comparison with nusinersen, as the sponsor assumed equivalent comparative effectiveness between risdiplam and nusinersen. This assumption was supported by clinical expert feedback indicating that risdiplam appeared to be at least noninferior to nusinersen. There is nevertheless no high-quality comparative evidence, nor is there any long-term efficacy data, to support assumptions about the duration of treatment effect of risdiplam. As a result, the long-term comparative efficacy of risdiplam remains uncertain.
In addition to a lack of both short-term and long-term comparative clinical evidence, CADTH identified several key limitations with the sponsor’s submission. These included limitations with the structural assumptions made by the sponsor, as well as the assumption of mortality being equal across all health states in the model. None of these limitations could be addressed in reanalysis. The results of the CADTH reanalysis should therefore be interpreted with caution given that substantial uncertainty remains. Additionally, the generalizability of the results to patients with SMA type I who are pre-symptomatic, younger than the age of 2 months, older than the age of 7 months, or have greater disease severity, and to patients with SMA type II or SMA type III who are older or ambulatory, is uncertain.
CADTH undertook reanalyses of the sponsor’s models that excluded caregiver utilities in both subgroups. Compared with BSC, this resulted in an ICER of more than $1.2 million per QALY in SMA type I and an ICER of more than $37 million in SMA type II or SMA type III, indicating risdiplam would not be considered cost-effective at a conventional willingness-to-pay threshold. A price reduction of 99% would not be sufficient to reach a $50,000 per QALY threshold in either subgroup. Risdiplam had similar effectiveness to nusinersen at a lower cost in both the SMA type I and SMA type II or SMA type III analyses. The incremental QALY benefit estimated for risdiplam is due entirely to the inclusion of disutility associated with intrathecal injections.
The cost-effectiveness of risdiplam in comparison with nusinersen is driven by the drug acquisition costs associated with nusinersen. The sponsor’s submission considered the list price of nusinersen and does not account for any additional reductions in the price paid by drug plans. The CADTH Canadian Drug Expert Committee recommendation for nusinersen was conditional on a substantial price reduction. In scenario analyses where price reductions for nusinersen were considered, substantially different results were observed for the SMA type II or SMA type III subgroup, where risdiplam was no longer dominant after a 10% price reduction to nusinersen. For the SMA type I subgroup, nusinersen was no longer dominated and resulted in substantial ICERs for risdiplam compared with nusinersen at price reductions above 54%.
Should risdiplam be considered equally effective to nusinersen, it is likely to result in fewer drug acquisition costs and may represent a cost-effective option in populations where nusinersen would be displaced, assuming the list price of nusinersen is what is currently paid by public drug plans. In subgroups not currently receiving any disease-modifying treatment, risdiplam is unlikely to be a cost-effective option, even with a substantial reduction in price.
References
1.Pharmacoeconomic evaluation [internal sponsor's report]. In: Drug Reimbursement Review sponsor submission: Risdiplam, powder for oral solution, 0.75 mg/mL reconstituted, oral or enteral. Mississauga (ON): Hoffmann-La Roche Limited; 2020 Nov 19.
2.Risdiplam, powder for oral solution, 0.75 mg/mL reconstituted, oral or enteral [draft product monograph]. Mississauga (ON): Hoffmann-La Roche Limited; 2020 Jul 27.
3.Baranello G, Darras BT, Day JW, et al. Risdiplam in Type 1 Spinal Muscular Atrophy. N Engl J Med. 2021;384(10):915-923. PubMed
4.Indirect treatment comparison (ITC) of treatments for spinal muscular atrophy (SMA) Types 1, 2 and 3 [internal sponsor's report]. In: Drug Reimbursement Review sponsor submission: Risdiplam, powder for oral solution, 0.75 mg/mL, reconstituted, oral or enteral. Mississauga (ON): Hoffman-La Roche Limited; 2020.
5.Drug Reimbursement Review sponsor submission: risdiplam, powder for oral solution, 0.75 mg/mL, reconstituted, oral or enteral [internal sponsor's package]. Mississauga (ON): Hoffmann-La Roche Limited; 2020 Nov 19.
6.Belter L, Cook SF, Crawford TO, et al. An overview of the Cure SMA membership database: Highlights of key demographic and clinical characteristics of SMA members. J Neuromuscul Dis. 2018;5(2):167-176. PubMed
7.Table: 13-10-0114-01. Life expectancy and other elements of the life table, Canada, all provinces except Prince Edward Island. Ottawa (ON): Statistics Canada; 2020: https://www150.statcan.gc.ca/t1/tbl1/en/tv.action?pid=1310011401. Accessed 2021 Apr 1.
8.Schedule of benefits for physician services under the Health Insurance Act: effective April 1, 2020. Toronto (ON): Ontario Ministry of Health; 2020: https://www.health.gov.on.ca/en/pro/programs/ohip/sob/physserv/sob_master20200306.pdf. Accessed 2021 Apr 1.
9.Ontario Ministry of Health, Ontario Ministry of Long-Term Care. Ontario drug benefit formulary/comparative drug index. 2020; https://www.formulary.health.gov.on.ca/formulary/. Accessed 2021 Apr 1.
10.Alberta Health Interactive Health Data Team. Hospital Inpatient Care Case Costs - CMG/Plex. 2015; https://open.alberta.ca/opendata/hospital-inpatient-care-case-costs-cmgplex. Accessed 2021 Apr 1.
11.Widger K, Seow H, Rapoport A, Chalifoux M, Tanuseputro P. Children's end-of-life health care use and cost. Pediatrics. 2017;139(4):e20162956. PubMed
12.Seow H, Salam-White L, Bainbridge D. Community-based specialist palliative care teams and health system costs at end of life: a retrospective matched cohort study. CMAJ Open. 2019;7(1):E73-E80. PubMed
13.Spinraza, nusinersen injection, solution for intrathecal injection 2.4 mg/mL nusinersen as nusinersen sodium [product monograph]. 2020 Apr 20; https://pdf.hres.ca/dpd_pm/00055799.PDF. Accessed 2021 Apr 5.
14.Hoffmann-La Roche Ltd. Clinical Study Report: Primary CSR Study BP39056 (FIREFISH): A two part seamless, open-label, multicenter study to investigate the safety, tolerability, pharmacokinetics, pharmacodynamics and efficacy of risdiplam in infants with type 1 spinal muscular atrophy. Report No. 1100385 [internal sponsor's report]. Mississauga (ON): Hoffman-La Roche Ltd; 2020.
15.Budget Impact Analysis [internal sponsor's report]. In: Drug Reimbursement Review sponsor submission: Risdiplam, powder for oral solution, 0.75 mg/mL reconstituted, oral or enteral. Mississauga (ON): Hoffman-La Roche Limited; 2020.
16.Exceptional Access Program (EAP). 2020; https://www.health.gov.on.ca/en/pro/programs/drugs/odbf/odbf_except_access.aspx.
17.Verhaart I, Robertson A, Wilson I. Prevalence, incidence and carrier frequency of 5q-linked spinal muscular atrophy - a literature review. Orphanet J Rare Dis. 2017;12(1):124. PubMed
18.SMA overview. Jackson (WY): SMA Foundation; 2019: http://www.smafoundation.org/wp-content/uploads/2012/03/SMA-Overview.pdf. Accessed 2021 Apr 5.
Appendix 1: Cost Comparison Table
Note that this appendix has not been copy-edited.
The comparators presented in the following table have been deemed to be appropriate based on feedback from clinical expert(s). Comparators may be recommended (appropriate) practice or actual practice. Existing Product Listing Agreements are not reflected in the table and as such, the table may not represent the actual costs to public drug plans.
Table 11: CADTH Cost Comparison Table for Spinal Muscular Atrophy
Treatment | Strength | Form | Price | Age and weight | Recommended dosagea | Daily cost | Annual cost |
|---|---|---|---|---|---|---|---|
Risdiplam (EVRYSDI) | 60 mg | Powder for oral solution | $11,638.3500b | 2 months to < 2 years of age | 0.20 mg/kg daily | $256.04c | $93,456 |
≥ 2 years and < 20 kg | 0.25 mg/kg daily | $918.94d | $335,415 | ||||
≥ 2 years and ≥ 20 kg | 5 mg daily | $969.86 | $354,000 | ||||
Antisense oligonucleotide (ASO) | |||||||
Nusinersen (Spinraza)-first year -subsequent years | 12 mg / 5 mL | Injection | $118,000.0000e | NA | 6 injections per year | $1,939.73 | $708,000 |
3 injections per year | $969.86 | $354,000 | |||||
Note: Prices do not include dispensing fees. Annual prices are based on 365 days per year.
aRecommended dosages are from the respective product monographs, unless otherwise indicated.13
bSponsor’s submitted price.1
cBased on a median patient weight of 6.60 kg from the FIREFISH trial.14
dBased on a mean patient weight of 18.95 kg calculated by the sponsor using SMA-specific growth curves.15
eOntario Exceptional Access Program (EAP) formulary (accessed December 2020).16
Appendix 2: Submission Quality
Note that this appendix has not been copy-edited.
Description | Comments |
|---|---|
Population is relevant, with no critical intervention missing, and no relevant outcome missing | Model does not consider patients with SMA type IV, nor does it include important outcomes, such as bulbar function. |
Model has been adequately programmed and has sufficient face validity | NA |
Model structure is adequate for decision problem | The applicability of the model structure to the decision problem is uncertain, as noted in the key limitations section. |
Data incorporation into the model has been done adequately (e.g., parameters for probabilistic analysis) | NA |
Parameter and structural uncertainty were adequately assessed; analyses were adequate to inform the decision problem | NA |
The submission was well organized and complete; the information was easy to locate (clear and transparent reporting; technical documentation available in enough details) | NA |
Appendix 3: Additional Information on the Submitted Economic Evaluation
Note that this appendix has not been copy-edited.
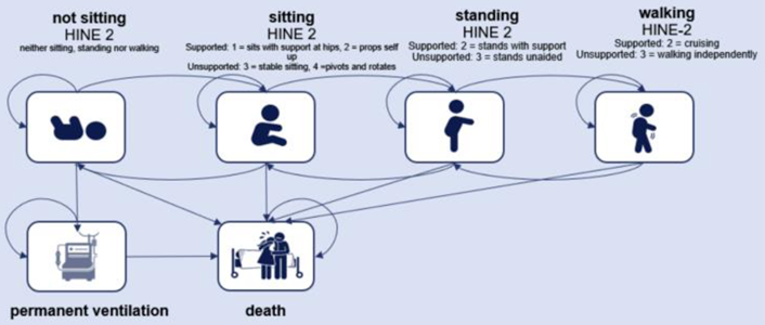
Figure 2: Model Structure — SMA Type II or SMA Type III
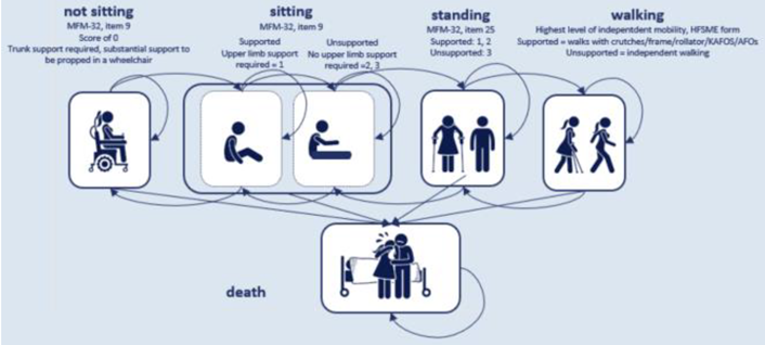
Source: Sponsor’s Pharmacoeconomic Submission.1
Appendix 4: Additional Details on the CADTH Reanalyses and Sensitivity Analyses of the Economic Evaluation
Note that this appendix has not been copy-edited.
Detailed Results of CADTH Base Case
Table 13: Disaggregated Summary of CADTH’s Economic Evaluation Results — SMA Type I
Treatment | Component | Value | Incremental (vs. reference) | Percentage of total incremental |
|---|---|---|---|---|
Discounted LYsb | ||||
Best supportive care | Total | 1.90 | NA | NA |
Risdiplam | Total | 5.09 | 3.19 | NA |
Nusinersen | Total | 5.09 | NA | NA |
Risdiplam | Total | 5.09 | 0 | NA |
Discounted QALYs | ||||
Best supportive care | Permanent ventilation | 0.17 | NA | NA |
Not sitting | 0.17 | NA | NA | |
Sitting | 0.02 | NA | NA | |
Standing | 0.00 | NA | NA | |
Walking | 0.00 | NA | NA | |
Adverse events | 0.00 | NA | NA | |
Disease- and treatment-related impacts | −0.02 | NA | NA | |
Total | 0.34 | NA | NA | |
Risdiplam | Permanent ventilation | 0.10 | −0.04 | −5% |
Not sitting | 0.21 | 0.06 | 7% | |
Sitting | 0.72 | 0.73 | 88% | |
Standing | 0.12 | 0.12 | 15% | |
Walking | 0.00 | 0.00 | 0% | |
Adverse events | 0.00 | 0.00 | 0% | |
Disease- and treatment-related impacts | −0.07 | −0.05 | −6% | |
Total | 1.08 | 0.83 | NA | |
Nusinersen | Permanent ventilation | 0.10 | NA | NA |
Not sitting | 0.21 | NA | NA | |
Sitting | 0.72 | NA | NA | |
Standing | 0.12 | NA | NA | |
Walking | 0.00 | NA | NA | |
Adverse events | 0.00 | NA | NA | |
Disease- and treatment-related impacts | −0.09 | NA | NA | |
Total | 1.06 | NA | NA | |
Risdiplam | Permanent ventilation | 0.10 | 0 | 0% |
Not sitting | 0.21 | 0 | 0% | |
Sitting | 0.72 | 0 | 0% | |
Standing | 0.12 | 0 | 0% | |
Walking | 0.00 | 0 | 0% | |
Adverse events | 0.00 | 0.2 | 100% | |
Disease- and treatment-related impacts | −0.07 | 0 | 0% | |
Total | 1.08 | 0.2 | NA | |
Discounted costs ($) | ||||
Best supportive care | Treatment costs | $0 | NA | NA |
Treatment administration | $0 | NA | NA | |
Adverse events | $0 | NA | NA | |
Emergency Department visits | $2,690 | NA | NA | |
Concomitant medications | $169 | NA | NA | |
Inpatient | $28,447 | NA | NA | |
Outpatient | $3,158 | NA | NA | |
Equipment, medical | $2,295 | NA | NA | |
End-of-life costs (palliative care, death) | $32,552 | NA | NA | |
TOTAL Patient, direct costs | $69,311 | NA | NA | |
Risdiplam | Treatment costs | $840,263 | $840,263 | 94% |
Treatment administration | $0 | $0 | 0% | |
Adverse events | $1,328 | $1,328 | 0% | |
Emergency Department visits | $7,943 | $5,253 | 1% | |
Concomitant medications | $470 | $301 | 0% | |
Inpatient | $68,711 | $40,263 | 4% | |
Outpatient | $9,795 | $6,637 | 1% | |
Equipment, medical | $6,368 | $4,074 | 0% | |
End-of-life costs (palliative care, death) | $30,901 | −$1,651 | 0% | |
Total | $965,780 | $896,469 | NA | |
Nusinersen | Treatment costs | $1,730,918 | NA | NA |
Treatment administration | $14,545 | NA | NA | |
Adverse events | $0 | NA | NA | |
Emergency Department visits | $7,943 | NA | NA | |
Concomitant medications | $470 | NA | NA | |
Inpatient | $68,711 | NA | NA | |
Outpatient | $9,795 | NA | NA | |
Equipment, medical | $6,368 | NA | NA | |
End-of-life costs (palliative care, death) | $30,901 | NA | NA | |
Total | $1,869,652 | NA | NA | |
Risdiplam | Treatment costs | $840,263 | −$898,359 | 99% |
Treatment administration | $0 | −$15,058 | 2% | |
Adverse events | $1,328 | $1,387 | 0% | |
Emergency Department visits | $7,943 | $0 | 0% | |
Concomitant medications | $470 | $0 | 0% | |
Inpatient | $68,711 | $0 | 0% | |
Outpatient | $9,795 | $0 | 0% | |
Equipment, medical | $6,368 | $0 | 0% | |
End-of-life costs (palliative care, death) | $30,901 | $0 | 0% | |
Total | $965,780 | −$912,030 | NA | |
ICER = incremental cost-effectiveness ratio; LY = life-year; QALY = quality-adjusted life-year; SMA = spinal muscular atrophy; vs. = versus.
aPercentage of total incremental (e.g., if total incremental LY is 5 and incremental LY in state XXX is 2, % of total is 2/5 = 40%).
Source: Sponsor’s Pharmacoeconomic Submission.1
Table 14: Disaggregated Summary of CADTH’s Economic Evaluation Results — SMA Type II or SMA Type III
Treatment | Component | Value | Incremental (vs. reference) | Percentage of total incremental |
|---|---|---|---|---|
Discounted LYsb | ||||
Best supportive care | Total | 30.06 | NA | NA |
Risdiplam | Total | 30.06 | 0 | NA |
Nusinersen | Total | 30.06 | NA | NA |
Risdiplam | Total | 30.06 | 0 | NA |
Discounted QALYs | ||||
Best supportive care | Not sitting | 1.86 | NA | NA |
Sitting – supported | 2.81 | NA | NA | |
Sitting - unsupported | 11.43 | NA | NA | |
Standing | 0.08 | NA | NA | |
Walking | 0.04 | NA | NA | |
Adverse events | 0.00 | NA | NA | |
Disease- and treatment-related impacts | −1.17 | NA | NA | |
Total | 15.05 | NA | NA | |
Risdiplam | Not sitting | 0.86 | −1.00 | −351% |
Sitting – supported | 2.03 | −0.78 | −273% | |
Sitting - unsupported | 12.10 | 0.68 | 238% | |
Standing | 1.10 | 1.02 | 357% | |
Walking | 0.41 | 0.37 | 129% | |
Adverse events | 0.00 | 0.00 | 0% | |
Disease- and treatment-related impacts | −1.17 | 0.00 | 0% | |
Total | 15.34 | 0.28 | NA | |
Nusinersen | Not sitting | 0.86 | NA | NA |
Sitting – supported | 2.03 | NA | NA | |
Sitting - unsupported | 12.10 | NA | NA | |
Standing | 1.10 | NA | NA | |
Walking | 0.41 | NA | NA | |
Adverse events | 0.00 | NA | NA | |
Disease- and treatment-related impacts | −1.30 | NA | NA | |
Total | 15.20 | NA | NA | |
Risdiplam | Not sitting | 0.86 | 0 | 0% |
Sitting – supported | 2.03 | 0 | 0% | |
Sitting - unsupported | 12.10 | 0 | 0% | |
Standing | 1.10 | 0 | 0% | |
Walking | 0.41 | 0 | 0% | |
Adverse events | 0.00 | 0.14 | 100% | |
Disease- and treatment-related impacts | −1.17 | 0 | 0% | |
Total | 15.34 | 0.14 | NA | |
Discounted costs | ||||
Best supportive care | Treatment costs | $0 | NA | NA |
Treatment administration | $0 | NA | NA | |
Adverse events | $0 | NA | NA | |
Emergency Department visits | $36,668 | NA | NA | |
Concomitant medications | $1,515 | NA | NA | |
Inpatient | $506,207 | NA | NA | |
Outpatient | $79,995 | NA | NA | |
Equipment, medical | $192,875 | NA | NA | |
End-of-life costs (palliative care, death) | $6,413 | NA | NA | |
Total | $823,674 | NA | NA | |
Risdiplam | Treatment costs | $10,641,432 | $10,641,432 | 100% |
Treatment administration | $0 | $0 | 0% | |
Adverse events | $15,945 | $15,945 | 0% | |
Emergency Department visits | $34,965 | −$1,703 | 0% | |
Concomitant medications | $1,485 | −$30 | 0% | |
Inpatient | $486,764 | −$19,443 | 0% | |
Outpatient | $81,349 | $1,353 | 0% | |
Equipment, medical | $183,798 | −$9,077 | 0% | |
End-of-life costs (palliative care, death) | $6,413 | $0 | 0% | |
Total | $11,452,152 | $10,628,479 | NA | |
Nusinersen | Treatment costs | $11,003,267 | NA | NA |
Treatment administration | $92,355 | NA | NA | |
Adverse events | $0 | NA | NA | |
Emergency Department visits | $34,965 | NA | NA | |
Concomitant medications | $1,485 | NA | NA | |
Inpatient | $486,764 | NA | NA | |
Outpatient | $81,349 | NA | NA | |
Equipment, medical | $183,798 | NA | NA | |
End-of-life costs (palliative care, death) | $6,413 | NA | NA | |
Total | $11,890,396 | NA | NA | |
Risdiplam | Treatment costs | $10,641,432 | −$361,834 | 83% |
Treatment administration | $0 | −$92,355 | 21% | |
Adverse events | $15,945 | $15,945 | −4% | |
Emergency Department visits | $34,965 | $0 | 0% | |
Concomitant medications | $1,485 | $0 | 0% | |
Inpatient | $486,764 | $0 | 0% | |
Outpatient | $81,349 | $0 | 0% | |
Equipment, medical | $183,798 | $0 | 0% | |
End-of-life costs (palliative care, death) | $6,413 | $0 | 0% | |
Total | $11,452,152 | −$438,244 | NA | |
ICER = incremental cost-effectiveness ratio; LY = life-year; QALY = quality-adjusted life-year; SMA = spinal muscular atrophy; vs. = versus.
aPercentage of total incremental (e.g., if total incremental LY is 5 and incremental LY in state XXX is 2, % of total is 2/5 = 40%).
Source: Sponsor’s Pharmacoeconomic Submission.1
Table 15: Summary of the CADTH Scenario Analyses Results — SMA Type I
Scenario | Drug | Total costs ($) | Total QALYs | ICER ($/QALY) |
|---|---|---|---|---|
CADTH reanalysis | Best supportive care | 69,311 | 0.34 | Reference |
Risdiplam | 965,780 | 1.08 | 1,203,108 | |
Nusinersen | 1,869,652 | 1.06 | Reference | |
Risdiplam | 965,780 | 1.08 | Dominant | |
1. Removal of disutility due to intrathecal injections with nusinersen | Best supportive care | 68,751 | 0.33 | Reference |
Risdiplam | 961,766 | 1.08 | 1,204,184 | |
Nusinersen | 1,864,702 | 1.08 | Reference | |
Risdiplam | 961,766 | 1.08 | Dominanta | |
2. Inclusion of 2 caregiver utilities | Best supportive care | 68,293 | 3.53 | Reference |
Risdiplam | 961,580 | 10.19 | 134,229 | |
Nusinersen | 1,865,665 | 10.17 | Reference | |
Risdiplam | 961,580 | 10.19 | Dominant | |
3. Differential discontinuation rate for nusinersen vs. risdiplam | Best supportive care | 69,849 | 0.34 | Reference |
Risdiplam | 970,237 | 1.09 | 1,207,007 | |
Nusinersen | 1,684,107 | 0.97 | Reference | |
Risdiplam | 970,237 | 1.09 | Dominant | |
4. 12.5-year treatment duration | Best supportive care | 69,002 | 0.34 | Reference |
Risdiplam | 939,906 | 1.07 | 1,182,103 | |
Nusinersen | 1,843,514 | 1.05 | Reference | |
Risdiplam | 939,906 | 1.07 | Dominant | |
5. 1-year time horizon | Best supportive care | 30,142 | 0.12 | Reference |
Risdiplam | 104,250 | 0.18 | 1,205,752 | |
Nusinersen | 708,581 | 0.18 | Reference | |
Risdiplam | 104,250 | 0.18 | Dominanta | |
6a. 10% price reduction with nusinersen | Best supportive care | 68,109 | 0.33 | Reference |
Risdiplam | 960,603 | 1.07 | 1,194,886 | |
Nusinersen | 1,691,178 | 1.05 | Reference | |
Risdiplam | 960,603 | 1.07 | Dominant | |
6b. 20% price reduction with nusinersen | Best supportive care | 68,903 | 0.33 | Reference |
Risdiplam | 966,965 | 1.08 | 1,202,381 | |
Nusinersen | 1,524,295 | 1.06 | Reference | |
Risdiplam | 966,965 | 1.08 | Dominant | |
6c. 30% price reduction with nusinersen | Best supportive care | 69,056 | 0.34 | Reference |
Risdiplam | 966,907 | 1.08 | 1,204,758 | |
Nusinersen | 1,350,678 | 1.06 | Reference | |
Risdiplam | 966,907 | 1.08 | Dominant | |
6d. 95% price reduction with nusinersen | Best supportive care | 69,026 | 0.34 | Reference |
Risdiplam | 966,211 | 1.08 | 1,129,400 | |
Nusinersen | 225,332 | 1.06 | Reference | |
Risdiplam | 966,211 | 1.08 | 34,064,823 |
ICER = incremental cost-effectiveness ratio; QALY = quality-adjusted life-years; SMA = spinal muscular atrophy; vs. = versus.
aIncremental QALY = 0, cost is lower.
Table 16: Summary of the CADTH Scenario Analyses Results — SMA Type II or SMA Type III
Scenario | Drug | Total costs ($) | Total QALYs | ICER ($/QALY) |
|---|---|---|---|---|
CADTH reanalysis | Best supportive care | 823,674 | 15.05 | Reference |
Risdiplam | 11,452,152 | 15.34 | 37,378,163 | |
Nusinersen | 11,890,396 | 15.20 | Reference | |
Risdiplam | 11,452,152 | 15.34 | Dominant | |
1. Removal of disutility due to intrathecal injections with nusinersen | Best supportive care | 824,052 | 15.05 | Reference |
Risdiplam | 11,451,620 | 15.34 | 36,595,113 | |
Nusinersen | 11,889,901 | 15.34 | Reference | |
Risdiplam | 11,451,620 | 15.34 | Dominant | |
2. Inclusion of 2 caregiver utilities | Best supportive care | 825,656 | 70.11 | Reference |
Risdiplam | 11,454,583 | 71.04 | 11,343,198 | |
Risdiplam | 11,454,583 | 71.04 | Dominant | |
Nusinersen | 11,892,866 | 70.91 | Reference | |
3. Discontinuation rates for nusinersen and risdiplam applied | Best supportive care | 825,112 | 15.05 | Reference |
Risdiplam | 3,287,139 | 15.11 | 36,176,639 | |
Nusinersen | 3,674,269 | 15.08 | Reference | |
Risdiplam | 3,287,139 | 15.11 | Dominant | |
4. 40-year treatment duration | Best supportive care | 823,155 | 15.04 | Reference |
Risdiplam | 9,601,461 | 15.28 | 36,155,728 | |
Nusinersen | 10,024,264 | 15.16 | Reference | |
Risdiplam | 9,601,461 | 15.28 | Dominant | |
5. 1-year time horizon | Best supportive care | 51,626 | 0.81 | Reference |
Risdiplam | 750,098 | 0.82 | 105,746,714 | |
Nusinersen | 1,112,078 | 0.80 | Reference | |
Risdiplam | 750,098 | 0.82 | Dominant | |
6a. 10% price reduction with nusinersen | Best supportive care | 824,899 | 15.04 | Reference |
Risdiplam | 11,453,255 | 15.33 | 36,873,616 | |
Nusinersen | 10,791,243 | 15.19 | Reference | |
Risdiplam | 11,453,255 | 15.33 | 4,783,742 | |
6b. 20% price reduction with nusinersen | Best supportive care | 823,702 | 15.04 | Reference |
Risdiplam | 11,450,349 | 15.33 | 37,155,417 | |
Nusinersen | 9,688,280 | 15.19 | Reference | |
Risdiplam | 11,450,349 | 15.33 | 12,792,943 | |
6c. 30% price reduction with nusinersen | Best supportive care | 822,326 | 15.04 | Reference |
Risdiplam | 11,448,703 | 15.33 | 37,503,903 | |
Nusinersen | 8,586,552 | 15.19 | Reference | |
Risdiplam | 11,448,703 | 15.33 | 20,764,079 | |
6d. 95% price reduction with nusinersen | Best supportive care | 824,157 | 15.03 | Reference |
Risdiplam | 11,452,012 | 15.32 | 36,801,427 | |
Nusinersen | 1,195,226 | 15.18 | Reference | |
Risdiplam | 11,452,012 | 15.32 | 72,680,407 |
ICER = incremental cost-effectiveness ratio; QALY = quality-adjusted life-years; SMA = spinal muscular atrophy; vs. = versus .
Appendix 5: Submitted Budget Impact Analysis and CADTH Appraisal
Note that this appendix has not been copy-edited.
Key Take-Aways of the Budget Impact Analysis |
|---|
|
Summary of Sponsor’s Budget Impact Analysis
The submitted budget impact analysis assessed the introduction of risdiplam for the treatment of eligible patients with SMA. The analysis was taken from the perspective of the Canadian public drug plans using an epidemiologic-based approach, with mark-up, dispensing fees, and drug acquisition costs considered. A 3-year time horizon was used, from 2022 to 2024, with 2021 as a base year. A summary of the sponsor’s derivation of the eligible population size is presented in Figure 3.
The main comparator for this analysis is nusinersen, though it is not available in all jurisdictions. Thus, a “no treatment” arm was also included for which there were no associated costs. The reference case scenario included nusinersen and no treatment. The new drug scenario included risdiplam, nusinersen, and no treatment. Key inputs to the budget impact analysis are documented in Table 17.
Figure 3: Sponsor’s Estimation of the Size of the Eligible Population
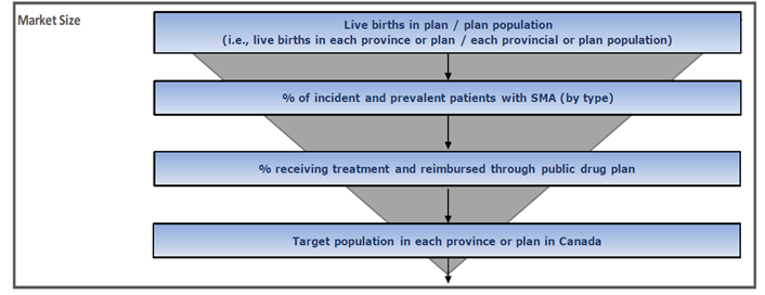
Source: Sponsor’s budget impact submission.15
Table 17: Summary of Key Budget Impact Model Parameters
Parameter | Sponsor’s estimate (reported as Year 1/Year 2/Year 3 if appropriate) |
|---|---|
Target population | |
Number of live births (2022) | 312,347 |
Incident SMA population | |
Incidence in live births | 0.01%17 |
Proportion type I patients | 58%18 |
Proportion type II or III patients | 42%18 |
Prevalent SMA population | |
Prevalence in general population | ||||||||||%5 |
Proportion type I patients | 12%18 |
Proportion type II or III patients | 88%18 |
SMA type I mortality rate | ||||%5 |
SMA type II or III mortality rate | 0% |
Market uptake for Ontario (3 years) | |
Uptake (reference scenario) | |
SMA type I | |
Incident population | |
Nusinersen | ||||||/||||||/|||||| |
No treatment | ||||||/||||||/|||||| |
Prevalent population | |
Nusinersen | ||||||/||||||/|||||| |
No treatment | ||||||/||||||/|||||| |
SMA type II or SMA type III | |
Incident population | |
Nusinersen | ||||||/||||||/|||||| |
No treatment | ||||||/||||||/|||||| |
Prevalent population | |
Nusinersen | ||||||/||||||/|||||| |
No treatment | ||||||/||||||/|||||| |
Uptake (new drug scenario) | |
SMA type I | |
Incident population | |
Risdiplam | ||||||/||||||/|||||| |
Nusinersen | ||||||/||||||/|||||| |
No treatment | ||||||/||||||/|||||| |
Prevalent population | |
Risdiplam | ||||||/||||||/|||||| |
Nusinersen | ||||||/||||||/|||||| |
No treatment | ||||||/||||||/|||||| |
SMA type II or SMA type III | |
Incident population | |
Risdiplam | ||||||/||||||/|||||| |
Nusinersen | ||||||/||||||/|||||| |
No treatment | ||||||/||||||/|||||| |
Prevalent population | |
Risdiplam | ||||||/||||||/|||||| |
Nusinersen | ||||||/||||||/|||||| |
No treatment | ||||||/||||||/|||||| |
Cost of treatment (per patient) | |
Cost of treatment annually (in Ontario) | |
Incident population | |
Risdiplam | $74,526 |
Nusinersen | $708,000 |
Prevalent population | |
Risdiplam (for SMA type I) | $157,333 |
Risdiplam (for SMA type II or SMA type III) | $354,000 |
Nusinersen | $354,000 |
SMA = spinal muscular atrophy.
Note: Market shares and annual costs vary by jurisdiction. Ontario is used here for illustrative purposes and may not be representative of all jurisdictions.
Summary of the Sponsor’s Budget Impact Analysis Results
The estimated budget impact of funding risdiplam for the treatment of SMA in eligible patients was $|||||||||||||||||| in year 1, $|||||||||||||||||| in year 2, $|||||||||||||||||| in year 3 for a 3-year total of $77,420,166.
CADTH Appraisal of the Sponsor’s Budget Impact Analysis
CADTH identified several key limitations to the sponsor’s analysis that have notable implications on the results of the budget impact analysis:
Proportion of SMA type I prevalent patients currently receiving treatment ||||||||||||||||||||||||||||: The sponsor assumed that among jurisdictions in which nusinersen is available, the proportion of SMA type I patients in the reference (current) scenario who are receiving nusinersen ranged from |||||| to |||||| across the 3-year time horizon. Clinical experts consulted by CADTH, however, felt that was an |||||||||||||||||||||| and that among SMA type I prevalent patients the proportion currently receiving nusinersen was likely closer to 95%.
To estimate the base case, CADTH |||||||||||||||| the proportion of SMA type I prevalent patients receiving nusinersen in the reference scenario. To maintain consistency, CADTH assumed that 95% of SMA type I prevalent patients in the new drug scenario also received treatment with either risdiplam or nusinersen, with the relative market share split between the 2 comparators being maintained from the sponsor’s original assumptions.
Differential retention rate in nusinersen versus risdiplam: The sponsor applied a retention rate of | to risdiplam and | to nusinersen to account for drug adherence and discontinuation, under the assumption that the in-hospital administration setting of nusinersen would change adherence. However, CADTH noted that risdiplam is available in 60 mg bottles with a maximum daily recommended dose of 5 mg and thus, if there is drug nonadherence it is likely that the costs of risdiplam would still be incurred by the drug plans. Furthermore, as noted in the pharmacoeconomic section of the report, there is uncertainty around the discontinuation of nusinersen and risdiplam and there is no evidence to suggest it would be different for risdiplam than nusinersen.
CADTH equated the retention rate of both comparators to 0.85 as part of the base case. Perfect retention was also explored in a scenario analysis.
Proportion of patients eligible for drug coverage based on assumptions that are not validated: The sponsor makes assumptions about the number of patients eligible for public drug coverage across the various jurisdictions that are not based on published sources. For most jurisdictions, the value used was ||||||, except in the cases of British Columbia, Ontario, and New Brunswick. As assumptions surrounding the population eligible for drug coverage directly affect the population size and thus, the drug acquisition costs, participating programs should ensure they can generate reasonable estimates in their own local jurisdictions.
CADTH increased the proportion of patients eligible for public drug coverage to |||||| in all jurisdictions as part of a scenario analysis.
CADTH Reanalyses of the BIA
Based on the limitations identified, CADTH’s base case included an increase to the number of SMA type I prevalent patients receiving treatment and a change in the estimated retention of risdiplam (Table 18).
Table 18: CADTH Revisions to the Submitted Budget Impact Analysis
Stepped analysis | Sponsor’s value or assumption | CADTH value or assumption |
|---|---|---|
Corrections to sponsor’s base case | ||
None | — | — |
Changes to derive the CADTH base case | ||
1. |||||||||||||||| proportion of SMA type I prevalent patients on treatment | Reference scenario: |||||| to |||||| depending on jurisdiction and year New scenario: |||||| to |||||| depending on jurisdiction and year | Reference scenario: 95% on nusinersen New scenario: 95% on either nusinersen or risdiplam (relative market shares maintained) |
2. Retention rate of risdiplam and nusinersen set to be equal | ||||| | 0.85 |
CADTH base case | — | Reanalysis 1 + 2 |
The results of the CADTH step-wise reanalysis are presented in summary format in Table 19 and a more detailed breakdown is presented in Table 20. Based on the CADTH base case, the budget impact of the reimbursement of risdiplam for the treatment of SMA is expected to be $30,183,701 in year 1, $29,146,849 in year 2, and $28,414,263 in year 3, with a 3-year budget impact of $87,744,812.
Scenario analyses were performed around the retention rates of both drugs and the proportion eligible for public drug coverage, with the first scenario analysis increasing the 3-year budget impact to $103,229,191 and the second scenario analysis increasing it to $106,912,889.
CADTH also performed scenario analyses to explore the budget impact within the subtypes of SMA. If risdiplam is used only in SMA type I patients the 3-year budget impact results in a savings of $39,022,801, and if it is only used in SMA type II and SMA type III the 3-year budget impact results in increased expenditures of $126,767,613.
Table 19: Summary of the CADTH Reanalyses of the BIA
Stepped analysis | 3-year total |
|---|---|
Submitted base case | $77,420,166 |
CADTH reanalysis 1 – increased proportion SMA type I on treatment | $61,075,466 |
CADTH reanalysis 2 – assumed equal retention | $103,110,967 |
CADTH base case | $87,744,812 |
BIA = budget impact analysis.
Table 20: Detailed Breakdown of the CADTH Reanalyses of the BIA
Stepped analysis | Scenario | Year 1 | Year 2 | Year 3 | 3-year total |
|---|---|---|---|---|---|
Submitted base case | Reference | $|||||||||||||||||| | $|||||||||||||||||| | $|||||||||||||||||| | $239,520,387 |
New drug | $|||||||||||||||||||| | $|||||||||||||||||||| | $|||||||||||||||||||| | $316,940,553 | |
Budget impact | $||||||||||||||||| | $||||||||||||||||| | $||||||||||||||||| | $77,420,166 | |
CADTH base case | Reference | $88,448,579 | $91,487,313 | $94,554,169 | $274,490,061 |
New drug | $118,632,280 | $120,634,161 | $122,968,432 | $362,234,873 | |
Budget impact | $30,183,701 | $29,146,849 | $28,414,263 | $87,744,812 | |
CADTH scenario analysis 1: 100% retention for both comparators | Reference | $104,057,152 | $107,632,133 | $111,240,199 | $322,929,484 |
New drug | $139,567,388 | $141,922,543 | $144,668,743 | $426,158,675 | |
Budget impact | $35,510,236 | $34,290,410 | $33,428,545 | $103,229,191 | |
CADTH scenario analysis 2: increased drug coverage assumptions to |||||| for British Columbia, Ontario, New Brunswick | Reference | $114,334,916 | $118,231,570 | $122,171,017 | $354,737,503 |
New drug | $151,275,952 | $153,748,252 | $156,626,187 | $461,650,392 | |
Budget impact | $36,941,036 | $35,516,682 | $34,455,170 | $106,912,889 | |
CADTH scenario analysis 3: risdiplam used in SMA type I patients only | Reference | $31,990,411 | $32,518,371 | $33,023,311 | $97,532,093 |
New drug | $20,696,488 | $19,416,793 | $18,396,011 | $58,509,292 | |
Budget impact | −$11,293,923 | −$13,101,578 | −$14,627,299 | −$39,022,801 | |
CADTH scenario analysis 4: risdiplam used in SMA type II or SMA type III patients only | Reference | $56,458,168 | $58,968,942 | $61,530,858 | $176,957,968 |
New drug | $97,935,792 | $101,217,369 | $104,572,421 | $303,725,581 | |
Budget impact | $41,477,624 | $42,248,427 | $43,041,562 | $126,767,613 | |
CADTH scenario analysis 5: 99% price reduction | Reference | $88,448,579 | $91,487,313 | $94,554,169 | $274,490,061 |
New drug | $50,845,888 | $45,209,507 | $41,809,914 | $137,865,309 | |
Budget impact | −$37,602,692 | −$46,277,806 | −$52,744,255 | −$136,624,753 |
BIA = budget impact analysis; NIHB = non-insured health benefit; SMA = spinal muscular atrophy.
ISSN: 2563-6596
Disclaimer: The information in this document is intended to help Canadian health care decision-makers, health care professionals, health systems leaders, and policy-makers make well-informed decisions and thereby improve the quality of health care services. While patients and others may access this document, the document is made available for informational purposes only and no representations or warranties are made with respect to its fitness for any particular purpose. The information in this document should not be used as a substitute for professional medical advice or as a substitute for the application of clinical judgment in respect of the care of a particular patient or other professional judgment in any decision-making process. The Canadian Agency for Drugs and Technologies in Health (CADTH) does not endorse any information, drugs, therapies, treatments, products, processes, or services.
While care has been taken to ensure that the information prepared by CADTH in this document is accurate, complete, and up-to-date as at the applicable date the material was first published by CADTH, CADTH does not make any guarantees to that effect. CADTH does not guarantee and is not responsible for the quality, currency, propriety, accuracy, or reasonableness of any statements, information, or conclusions contained in any third-party materials used in preparing this document. The views and opinions of third parties published in this document do not necessarily state or reflect those of CADTH.
CADTH is not responsible for any errors, omissions, injury, loss, or damage arising from or relating to the use (or misuse) of any information, statements, or conclusions contained in or implied by the contents of this document or any of the source materials.
This document may contain links to third-party websites. CADTH does not have control over the content of such sites. Use of third-party sites is governed by the third-party website owners’ own terms and conditions set out for such sites. CADTH does not make any guarantee with respect to any information contained on such third-party sites and CADTH is not responsible for any injury, loss, or damage suffered as a result of using such third-party sites. CADTH has no responsibility for the collection, use, and disclosure of personal information by third-party sites.
Subject to the aforementioned limitations, the views expressed herein are those of CADTH and do not necessarily represent the views of Canada’s federal, provincial, or territorial governments or any third party supplier of information.
This document is prepared and intended for use in the context of the Canadian health care system. The use of this document outside of Canada is done so at the user’s own risk.
This disclaimer and any questions or matters of any nature arising from or relating to the content or use (or misuse) of this document will be governed by and interpreted in accordance with the laws of the Province of Ontario and the laws of Canada applicable therein, and all proceedings shall be subject to the exclusive jurisdiction of the courts of the Province of Ontario, Canada.
The copyright and other intellectual property rights in this document are owned by CADTH and its licensors. These rights are protected by the Canadian Copyright Act and other national and international laws and agreements. Users are permitted to make copies of this document for non-commercial purposes only, provided it is not modified when reproduced and appropriate credit is given to CADTH and its licensors.
About CADTH: CADTH is an independent, not-for-profit organization responsible for providing Canada’s health care decision-makers with objective evidence to help make informed decisions about the optimal use of drugs, medical devices, diagnostics, and procedures in our health care system.
Funding: CADTH receives funding from Canada’s federal, provincial, and territorial governments, with the exception of Quebec.