CADTH Reimbursement Review
Upadacitinib (Rinvoq)
Sponsor: AbbVie Corporation
Therapeutic area: Psoriatic arthritis
This multi-part report includes:
Clinical Review
Pharmacoeconomic Review
Clinical Review
Abbreviations
ACE
Arthritis Consumer Experts
ACR
American College of Rheumatology
ACR20
20% improvement in the American College of Rheumatology criteria
ACR50
50% improvement in the American College of Rheumatology criteria
ACR70
70% improvement in the American College of Rheumatology criteria
AE
adverse event
BASDAI
Bath Ankylosing Spondylitis Disease Activity Index
bDMARD
biologic disease-modifying antirheumatic drug
BSA
body surface area
CAPA
Canadian Arthritis Patient Alliance
CAPP
Canadian Association of Psoriasis Patients
CI
confidence interval
CPK
creatine phosphokinase
CPN
Canadian Psoriasis Network
CrI
credible interval
CSA
Canadian Spondylitis Association
csDMARD
conventional synthetic disease-modifying antirheumatic drug
DMARD
disease-modifying antirheumatic drug
EQ-5D-5L
EuroQol 5-Dimensions 5-Levels
FACIT-F
Functional Assessment of Chronic Illness Therapy–Fatigue
FAS
full analysis set
HAQ-DI
Health Assessment Questionnaire–Disability Index
HRQoL
health-related quality of life
hs-CRP
high-sensitivity C-reactive protein
IL
interleukin
ITC
indirect treatment comparison
JAK
Janus kinase
LDI
Leeds Dactylitis Index
LEI
Leeds Enthesitis Index
LS
least squares
MACE
major adverse cardiovascular event
MCS
mental component summary
MDA
minimal disease activity
MID
minimal important difference
MMRM
mixed model for repeated measures
NMA
network meta-analysis
NRI
nonresponder imputation
NRS
numerical rating scale
NSAID
nonsteroidal anti-inflammatory drug
PASI
Psoriasis Area and Severity Index
PASI 50
50% reduction in Psoriasis Area Severity Index
PASI 75
75% reduction in Psoriasis Area Severity Index
PASI 90
90% reduction in Psoriasis Area Severity Index
PASI 100
100% reduction in Psoriasis Area Severity Index
PCS
physical component summary
PDE4
phosphodiesterase type 4
PPS
per-protocol set
PsA
psoriatic arthritis
PY
patient-year
RCT
randomized controlled trial
SAE
serious adverse event
SAPS
Self-Assessment of Psoriasis Symptoms
SC
subcutaneous
SD
standard deviation
SF-36
Short Form (36) Health Survey
SHS
Sharp/van der Heijde Score
sIGA
Self-Assessment of Psoriasis Symptoms
SJC
swollen joint count
SJC66
swollen joint count based on 66 joints
TEAE
treatment-emergent adverse event
TJC
tender joint count
TJC68
tender joint count based on 68 joints
TNF
tumour necrosis factor
tsDMARD
targeted synthetic disease-modifying antirheumatic drug
ULN
upper limit of normal
VAS
visual analogue scale
WDAE
withdrawal due to adverse event
WPAI
Work Productivity and Activity Impairment
Executive Summary
An overview of the submission details for the drug under review is provided in Table 1.
Item | Description |
|---|---|
Drug product | Upadacitinib (Rinvoq) 15-mg extended-release oral tablets |
Indication | For the treatment of adults with active psoriatic arthritis who have had an inadequate response or intolerance to methotrexate or other DMARDs; Rinvoq (upadacitinib) may be used as monotherapy or in combination with methotrexate |
Reimbursement request | As per indication |
Health Canada approval status | NOC |
Health Canada review pathway | Standard |
NOC date | June 3, 2021 |
Sponsor | AbbVie Corporation |
DMARD = disease-modifying antirheumatic drug; NOC = Notice of Compliance.
Introduction
Psoriatic arthritis (PsA) is an inflammatory musculoskeletal disease with a heterogenous presentation and disease course. While it is associated with psoriasis, PsA also presents with variable clinical features involving multiple domains, including peripheral arthritis, enthesitis, dactylitis, and axial disease.1,2 Patients with PsA also present with psoriatic skin lesions and are usually seronegative for rheumatoid factor (95%).2,3 Pain and stiffness of the affected joints are the most predominant presenting symptoms, with fatigue also occurring in many patients.1 The prevalence of PsA varies, depending on the case definition and geography, and is estimated to be 1 to 2 per 1,000 in the general population.1 A population-based Canadian study estimated that the age- and sex-standardized cumulative prevalence of PsA in Ontario ranged from 0.09% in 2008 to 0.15% in 2015. The same study estimated the age- and sex-standardized incidence in 2015 was 14 per 100,000.4 These figures may vary; for example, in another reference, the estimated annual incidence of PsA was reported to be 6 per 100,000 per year.1 Over time, PsA can lead to deformities and joint damage.2 This can lead to significant functional impairment, which in turn can affect work productivity and reduce health-related quality of life (HRQoL).2,3
Several drug classes are employed in the pharmacologic treatment of PsA, including nonsteroidal anti-inflammatory drugs (NSAIDs); conventional synthetic disease-modifying antirheumatic drugs (csDMARDs) such as methotrexate, sulfasalazine, and leflunomide; biologic disease-modifying antirheumatic drugs (bDMARDs) such as tumour necrosis factor (TNF) inhibitors; interleukin (IL)-23, IL-12/23, and IL-17 inhibitors; and targeted synthetic disease-modifying antirheumatic drugs (tsDMARDs) that inhibit phosphodiesterase type 4 (PDE4) such as apremilast or Janus kinases (JAKs) (tofacitinib).5 In the treatment of PsA, csDMARDs, typically methotrexate, are recommended as first-line therapy or after a short course of NSAIDs in patients with polyarthritis. Some guidelines also recommend first-line treatment with a TNF inhibitor, particularly in patients with severe PsA or psoriasis.6,7 In patients with an inadequate response to at least 1 csDMARD, a bDMARD may be started. In the case of biologic drug treatment failure, due to either lack of efficacy or adverse events (AEs), treatment guidelines recommend switching to an alternative biologic drug within a drug class, or to a drug with a different mode of action.5-7 Specific treatment recommendations are also available for other scenarios, such as for patients with unequivocal enthesitis or predominantly axial disease. Treatment choice is individualized based on numerous factors, including severity and manifestations of disease, contraindications, concomitant conditions (e.g., active inflammatory bowel disease), and patient preference (e.g., route of administration or dosing frequency).7
Upadacitinib is an oral JAK inhibitor that is selective for JAK1. By inhibiting JAKs, upadacitinib modulates intracellular signalling pathways of cytokines and growth factors involved in a broad range of cellular processes, such as inflammatory responses, hematopoiesis, and immune surveillance.8 It is approved for the treatment of adults with active PsA who have had an inadequate response or intolerance to methotrexate or other disease-modifying antirheumatic drugs (DMARDs). The recommended dosage of upadacitinib for treatment of PsA is 15 mg orally once a day, used as monotherapy or in combination with methotrexate.8
The objective of this CADTH Drug Reimbursement Review, as established before the granting of the Notice of Compliance, is to perform a systematic review of the beneficial and harmful effects of upadacitinib 15 mg oral extended-release tablets as monotherapy or in combination with non-bDMARDs for the treatment of active PsA in adult patients who have responded inadequately or who are intolerant to 1 or more DMARDs.
Stakeholder Perspectives
The information in this section is a summary of input provided by the patient groups who responded to CADTH’s call for patient input and from clinical expert(s) consulted by CADTH for the purpose of this review.
Patient Input
Four inputs were submitted for this review from 6 different patient groups: Arthritis Consumer Experts (ACE), the Canadian Spondylitis Association (CSA), the Canadian Association of Psoriasis Patients (CAPP) in partnership with the Canadian Psoriasis Network (CPN), and the Canadian Arthritis Patient Alliance (CAPA) in partnership with the Arthritis Society. Five of these patient organizations (the Arthritis Society, CSA, CAPP, CPN, and CAPA) collaboratively developed a survey that was shared with their respective memberships or patient communities. Overall, the survey drew 94 responses. The CSA also conducted a telephone interview with a patient on upadacitinib. Arthritis Consumer Experts gathered its own data from 5 patients who completed a patient input survey.
Respondents to the surveys emphasized pain, stiffness, lack of mobility, and fatigue, all of which affect activities associated with daily living and family life, and their ability to work and maintain certain hobbies. Other impacts included embarrassment and self-consciousness from symptoms caused by PsA. Respondents reported difficulties contributing and participating at school or work due to their symptoms. The impact of PsA extends to others within a person’s support circle, including caregivers such as spouses, partners, or children who may have to take on additional roles or tasks to support the person living with PsA.
The patient input noted that those living with psoriatic disease often try a succession of treatments throughout their lives. Patients’ responses to medication can vary significantly, and treatments that are initially effective can become less effective over time. As a result, patients need several treatment options to effectively manage their disease. Outcomes that were identified as important to patients with PsA include the route of drug administration (oral versus infusion versus self-injection), a reduction in pain and fatigue, treatments that are effective for psoriasis as well as PsA, increased mobility, ability to work and be productive at work, ability to carry out activities of daily living, ability to effectively carry out parenting tasks and other important social roles, reduced infection rates, affordability of the medication, and improved HRQoL. According to the input from the CSA, new treatment options and different classes of medications fill a void in the unmet needs of patients and prescribers; the oral formulation of upadacitinib provides another option for administration and may help lead to improved adherence and ultimately better outcomes.
Clinician Input
Input from Clinical Experts Consulted by CADTH
The clinical expert consulted by CADTH for this review identified an unmet need in the treatment of psoriatic disease as some patients may not respond to any treatment, and only a minority achieve minimal disease activity (MDA). In the treatment of PsA, numerous domains of disease activity that might not be accomplished by a single drug need to be addressed. In patients who do not respond or become refractory to treatment, a switch to treatment with a different mechanism of action will be necessary.
The clinical expert indicated that any patient with peripheral joint and skin disease that does not respond to csDMARDs would be eligible for upadacitinib, barring contraindications. Tumour necrosis factor inhibitors and IL-17 inhibitors will generally be prescribed before upadacitinib. However, the clinical expert noted that upadacitinib may become a first-line treatment for PsA as clinicians become more experienced with upadacitinib and long-term safety is confirmed. The caveat with this assumption is that longer-term observation in patients on upadacitinib will be needed to confirm the durability of benefit and safety. The clinical expert also identified the oral route of upadacitinib as an advantage, with the improved convenience over subcutaneous injections or IV infusions expected to enhance treatment adherence. It is also expected that a benefit from a JAK inhibitor will become apparent sooner than from TNF inhibitors, and a lack of response and/or side effects will result in the discontinuation of treatment.
According to the clinical expert, the swollen joint count (SJC) is the most likely measure used in clinical practice to assess response, with a reduction in joint count reflecting a meaningful response. Other clinically meaningful responses may be measured using achievement of MDA or patient-reported outcomes.
Clinician Group Input
No clinician group input was received for this reimbursement review.
Drug Program Input
Input was obtained from the jurisdictions participating in CADTH reimbursement reviews. The following were identified as key factors that could impact the implementation:
The place in therapy of upadacitinib relative to currently available treatments for PsA.
The significance of potential AEs associated with JAK inhibitors.
The expected dose of upadacitinib used and any potential for dose escalation.
The clinical expert consulted by CADTH provided responses that can be found in the Drug Program Input section.
Clinical Evidence
Pivotal Studies and Protocol-Selected Studies
Description of Studies
Two multi-centre, phase III, randomized, double-blind, placebo-controlled trials, SELECT-PsA1 and SELECT-PsA2, met the inclusion criteria for this review. Both SELECT studies enrolled adult patients with an established diagnosis of moderately to severely active PsA who had been previously treated with a DMARD. SELECT-PsA1 was conducted in patients who had an insufficient response or were intolerant to a non-bDMARD, whereas PsA2 included patients who had an insufficient response or were intolerant to a bDMARD. Both trials investigated 2 dosages of oral upadacitinib: 15 mg once daily and 30 mg once daily; however, to align with the Health Canada–recommended dosage, only results for upadacitinib 15 mg once daily are presented in this review.
Efficacy and safety of upadacitinib were compared with placebo in both studies; SELECT-PsA1 also included adalimumab as an active comparator. Both studies consisted of 2 periods, and at the end of week 24 in period 1, all patients on placebo were switched to upadacitinib. In SELECT-PsA1, period 1 was 56 weeks in duration and included a 24-week double-blind placebo and active comparator–controlled period followed by 32 weeks of blinded active comparator–controlled treatment. SELECT-PsA2 also consisted of period 1, which was 56 weeks in duration and included 24 weeks of a double-blinded placebo-controlled phase followed by a 32-week non-comparative treatment phase. Period 2 is an ongoing, open-label, long-term treatment extension of up to approximately 5 years for PsA1 and 3 years for PsA2.
In SELECT-PsA1 (N = 1,705), eligible participants were randomized at a 2:2:2:1:1 ratio to 1 of 5 treatment groups: upadacitinib 15 mg once daily, upadacitinib 30 mg once daily, adalimumab 40 mg subcutaneous every other week, and placebo followed by upadacitinib 15 mg once daily or placebo followed by upadacitinib 30 mg once daily. Randomization was stratified by extent of psoriasis (≥ 3% body surface area [BSA] or < 3% BSA), current use of at least 1 DMARD, presence of dactylitis, and presence of enthesitis. Patients enrolled in SELECT-PsA2 (N = 642) were randomized in a 2:2:1:1 ratio to 1 of 4 treatment groups similar to SELECT-PsA1, but without the adalimumab treatment group: upadacitinib 15 mg once daily, upadacitinib 30 mg once daily, and placebo followed by either upadacitinib 15 mg once daily or upadacitinib 30 mg once daily. Randomization was stratified by extent of psoriasis, current use of at least 1 DMARD, and number of prior failed bDMARDs (1 versus > 1). Patients were permitted to continue their stable background non-bDMARD therapy. Both studies had an appropriate randomization strategy, and treatment groups within each study were generally well balanced. Compared to patients in SELECT-PsA1, those in SELECT-PsA-2 had PsA for longer with more significant disease.
The primary end point for both SELECT-PsA1 and SELECT-PsA2 was the proportion of patients who achieved at least a 20% improvement in American College of Rheumatology response criteria (ACR20) at week 12. The primary and major secondary efficacy outcomes were assessed using a hierarchical testing procedure to control the overall type I error rate. The multiplicity-adjusted testing hierarchy included the primary end point plus 14 ranked key secondary end points in SELECT-PsA1, and 7 ranked key secondary end points in SELECT-PsA2. Several additional end points that were not part of the multiplicity-adjusted analyses but were identified in the CADTH systematic review protocol are also discussed in this report.
Efficacy Results
Efficacy results are summarized in Table 2. Results of the primary outcome, key secondary efficacy outcomes, outcomes identified in the review protocol (Table 5), and those considered important by patient groups are reported. Results of efficacy outcomes that were not included in the multiplicity-controlled analyses are described; however, they are considered inconclusive because of the potential for inflated type I error.
In the SELECT-PsA1 trial, upadacitinib 15 mg did not demonstrate superiority over adalimumab in ACR20 response at week 12. As such, statistically significant differences in the key secondary end points lower in the testing hierarchy were not tested because of the multiplicity control strategy.
Clinical Responses in Psoriatic Arthritis Symptoms
Clinical response in PsA symptoms or overall disease activity were measured using ACR20, MDA, and modified Psoriatic Arthritis Response Criteria (PsARC). In SELECT-PsA1, 70.6% and 36.2% of patients treated with upadacitinib 15 mg and placebo, respectively, achieved an ACR20 response, and the difference between the upadacitinib 15 mg group and placebo treatment group was 34.5% (95% confidence interval [CI], 28.2 to 40.7; P < 0.0001), which was clinically relevant and statistically significant in favour of upadacitinib 15 mg. In SELECT-PsA2, 56.9% and 24.1% of patients treated with upadacitinib 15 mg and placebo, respectively, achieved an ACR20 response; the difference between the upadacitinib 15 mg group and the placebo treatment group was 32.8% (95% CI, 24.0 to 41.6; P < 0.0001), which was clinically relevant and statistically significant in favour of upadacitinib 15 mg. Results of the pre-specified subgroup analyses by current use of non-bDMARD, number of prior non-bDMARD (SELECT-PsA1) and number of prior failed bDMARDs (SELECT-PsA2) were consistent with results from the overall population for the primary end point of an ACR20 at week 12; however, these analyses were not included in the hierarchical statistical analysis and should be interpreted with caution because of the potential for inflated type I error. The clinical expert consulted for this review noted that the differences in ACR20 responses compared with placebo were clinically meaningful.
In SELECT-PsA1, the proportion of patients achieving an ACR20 at week 12 with upadacitinib treatment compared to adalimumab was tested for noninferiority and superiority as key secondary end points. An ACR20 response was achieved by 70.6% of the upadacitinib 15 mg group and by 65.0% of patients in the adalimumab group. The difference between the upadacitinib 15 mg group and the adalimumab treatment group was 5.6% (95% CI, −0.6 to 11.8). The adalimumab effect preservation, calculated by (upadacitinib – placebo)/(adalimumab – placebo), was 119.4% (95% CI, 98.0 to 147.9); the lower bound of the 95% CI exceeded the pre-specified noninferiority ratio of at least 50% of the placebo-subtracted adalimumab effect, indicating that upadacitinib 15 mg daily was noninferior to adalimumab 40 mg every other week. In the subsequent testing of superiority, upadacitinib 15 mg was not found to be superior compared to adalimumab 40 mg, as it did not meet the statistical significance for superiority.
For clinical responses measured with the MDA criteria, patients treated with upadacitinib 15 mg had higher response rates compared to placebo at week 24 in both SELECT-PsA1 (36.6% for upadacitinib 15 mg and 12.3% for placebo) and SELECT-PsA2 (25.1% for upadacitinib 15 mg and 2.8% for placebo). The between-group differences were 24.3% (95% CI, 18.8 to 29.8; P = 0.0004) in the SELECT-PsA1 trial and 22.3% (95% CI, 16.0 to 28.6; P < 0.0001) in SELECT-PsA2. In both trials, the between-group differences were statistically significant in favour of upadacitinib 15 mg.
For modified PsARC response at week 24, a higher proportion of patients treated with upadacitinib achieved a response compared to patients randomized to adalimumab or placebo in both studies (SELECT-PsA1: 83.7% for upadacitinib 15 mg, 76.6% for adalimumab 40 mg, and 59.3% for placebo; SELECT-PsA2: 68.2% for upadacitinib 15 mg and 36.3% for placebo). In SELECT-PsA1, the response-rate difference between the upadacitinib and adalimumab groups was 7.0% (95% CI, 1.7 to 12.3), whereas the difference between upadacitinib and placebo was 24.3% (95% CI, 18.5 to 30.2). In SELECT-PsA2 the difference between upadacitinib and placebo was 31.9 (95% CI, 22.9 to 40.9). These analyses were not included in the hierarchical statistical analysis.
Measurement of Function and Disability
The improvement in physical function at week 12 as measured by the Health Assessment Questionnaire–Disability Index (HAQ-DI) was statistically significant. The change in scores from baseline in upadacitinib 15 mg and placebo were −0.42 and −0.14, respectively, in SELECT-PsA1, and −0.30 and −0.10, respectively, in SELECT-PsA2. The differences in change from baseline between upadacitinib 15 mg and placebo were −0.28 (95% CI, −0.35 to −0.22; P < 0.0001) in SELECT-PsA1 and −0.21 (95% CI, −0.30 to −0.12; P < 0.0001) in SELECT-PsA2. While in both studies, the between-group differences in the improvement of the HAQ-DI scores did not exceed the estimated minimal important difference (MID) of 0.35 found in the literature, the proportions of patients who achieved a clinically meaningful improvement in HAQ-DI at week 12 in the SELECT-PsA1 study were 33.4%, 47.2%, and 57.9% in the placebo, adalimumab 40 mg, and upadacitinib 15 mg treatment groups, respectively, while the proportions of patients who achieved a clinically meaningful improvement in HAQ-DI at week 12 in SELECT-PsA2 were 27.2% and 44.6% in the placebo and upadacitinib 15 mg treatment groups, respectively.
Work productivity was measured by the Work Productivity and Activity Impairment (WPAI) questionnaire in a portion of study participants in both studies. Numerically greater reductions in work or activity impairment due to disease were observed for the upadacitinib 15 mg group compared to placebo at week 24. Although it appears the suggested MID was achieved by SELECT-PsA1 patients in the upadacitinib group for improvement in presenteeism (≥ 20%) and activity impairment (≥ 20%), the between-group differences in change from baseline compared to placebo or adalimumab did not exceed this threshold. The least squares (LS) mean difference in the change in scores between upadacitinib and adalimumab was −2.5 (95% CI, −6.2 to 1.2), whereas the LS mean differences between upadacitinib and placebo were −13.4 (95% CI, −17.1 to −9.7) in SELECT-PsA1 and −12.2 (95% CI, −18.8 to −5.6) in SELECT-PsA2. With a smaller number of patients included in the analysis, and the lack of a confirmed MID for the WPAI instrument, it remains unclear whether the differences were clinically meaningful. This was identified as an important outcome by the patient groups, but as it was an exploratory variable in both SELECT-PsA1 and SELECT-PsA2 it was not included in the multiplicity-controlled analyses.
Measurement of PsA Symptoms
Symptoms of PsA such as fatigue and pain were reported in both studies. A statistically greater improvement in fatigue from baseline, measured using the Functional Assessment of Chronic Illness Therapy–Fatigue (FACIT-F), was seen at week 12 with upadacitinib 15 mg compared to placebo in both studies. The mean changes from baseline were 6.3 for upadacitinib 15 mg and 2.8 for placebo in SELECT-PsA1 (between-group difference of 3.5; 95% CI, 2.4 to 4.7; P = 0.0004) and 5.0 for upadacitinib 15 mg and 1.3 for placebo in SELECT-PsA2 (between-group difference of 3.7; 95% CI, 2.0 to 5.4; P < 0.0001). The between-group difference in the improvement in FACIT-F score at week 12 exceeded the estimated MID (3.1 points) in both studies. The impact of upadacitinib on pain is uncertain as this end point was not part of the hierarchical analysis, and no MID was identified for the patient’s assessment of pain numeric rating scale (NRS) in patients with PsA.
Health-Related Quality of Life
Health-related quality of life was measured by the Short Form (36) Health Survey (SF-36) and EuroQol 5-Dimensions 5-Levels questionnaire (EQ-5D-5L) in SELECT-PsA1 and PsA2. Only the physical component summary (PCS) of the SF-36 was part of the multiplicity-adjusted testing hierarchy in the SELECT studies, and the differences between the 2 groups were statistically significant. In SELECT-PsA1, the difference in mean change from baseline for upadacitinib 15 mg versus placebo was 4.67 (95% CI, 3.67 to 5.67; P = 0.0004) in favour of upadacitinib 15 mg; in SELECT-PsA2 the difference in mean change from baseline for upadacitinib 15 mg versus placebo was 3.52 (95% CI, 2.07 to 4.98; P < 0.0001) in favour of upadacitinib 15 mg. For the mental component summary (MCS), a numerically greater improvement from baseline was seen for upadacitinib compared to placebo in both trials; the difference in mean change from baseline between the 2 treatment groups was 1.70 (95% CI, 0.58 to 2.82) in SELECT-PsA1 and 2.98 (95% CI, 1.44 to 4.52) in SELECT-PsA2. The results from the EQ-5D-5L suggest that there were greater improvements in the utility index and the Visual Analogue Scale (VAS) scores from baseline to week 24 in the upadacitinib treatment group compared to patients randomized to placebo in both studies, as well as adalimumab in PsA1. For the utility index, the difference in mean change from baseline between upadacitinib and adalimumab was 0.03 (95% CI, 0.00 to 0.05), whereas the difference in mean change from baseline between upadacitinib and placebo was 0.09 (95% CI, 0.06 to 0.11) in SELECT-PsA1 and 0.10 (95% CI, 0.06 to 0.14) in SELECT-PsA2. For the VAS, the difference in mean change from baseline between upadacitinib and adalimumab was 2.8 (95% CI, 0.0 to 5.6), whereas the difference in mean change from baseline between upadacitinib and placebo was 10.9 (95% CI, 8.0 to 13.7) in SELECT-PsA1 and 6.8 (95% CI, 2.5 to 11.1) in SELECT-PsA2. For the comparison of upadacitinib to placebo in both studies, the mean between-group differences in the EQ-5D-5L utility index reached the MID threshold identified in the literature for the general Canadian population (summarized mean of 0.056; standard deviation [SD] = 0.011). These results suggest that treatment with upadacitinib 15 mg was associated with improved HRQoL. Although patient groups identified HRQoL as an important outcome, the EQ-5D-5L and the MCS of the SF-36 were not part of the hierarchical analysis plan and were not adjusted for multiple comparisons; therefore, the results should be interpreted with caution due to the risk of inflated type I error.
Measurement of Skin Disease
Extent and severity of skin disease was measured in both studies using the PASI, sIGA, and SAPS. Only patients with psoriasis involving a 3% or greater BSA baseline had a PASI assessment. In SELECT-PsA1, the proportion of patients achieving a PASI response of 75 in the upadacitinib 15 mg treatment group was 62.6% compared to 21.3% in the placebo group, and the difference between the upadacitinib 15 mg and placebo groups was 41.3% (95% CI, 32.8 to 49.8; P < 0.0001), which was statistically significant in favour of upadacitinib 15 mg. In PsA2, the proportion of patients achieving a 75% reduction in PASI score (PASI 75) in the upadacitinib treatment group was 52.3% compared to 16.0% in the placebo group, and the difference between the upadacitinib 15 mg group and placebo group was 36.3% (95% CI, 25.6 to 46.9; P < 0.001), which was statistically significant in favour of upadacitinib 15 mg. The clinical expert consulted for this review indicated that the between-group differences in PASI 75 were considered clinically relevant, although the true effect should be derived from separate studies that are specifically designed for patients with skin disease.
Only patients with an sIGA score of 2 or greater at baseline, and an improvement of at least 2 points from baseline at week 16 were included in the assessment. In both SELECT-PsA1 and SELECT-PsA2, a statistically significant difference was seen in the proportion of patients achieving a response (an sIGA of psoriasis score of 0 or 1) in favour of upadacitinib. At week 16, the proportions of responders were 41.9% for upadacitinib 15 mg and 10.9% for placebo (between-group difference of 31.1%; 95% CI, 24.7 to 37.5; P < 0.0001) in SELECT-PsA1, and 36.8% for upadacitinib 15 mg and 9.2% for placebo (between-group difference of 27.6%; 95% CI, 19.2 to 36.1; P < 0.0001) in SELECT-PsA2.
A greater reduction in SAPS score from baseline was reported for patients in the upadacitinib group compared to placebo at week 16. In PsA1, the difference in LS mean change from baseline between upadacitinib and placebo was −17.1 (95% CI, −19.6 to −14.6) for upadacitinib 15 mg versus placebo. Testing for superiority of upadacitinib compared to placebo was part of the multiplicity-adjusted analyses in PsA1; however, because it was ranked after the point at which the hierarchical analysis failed and was stopped, no appropriate statistical comparisons can be made. In SELECT-PsA2, the difference between groups in the LS mean change from baseline in SAPS scores was statistically significant, favouring upadacitinib compared to placebo (−22.9; 95% CI, −27.4 to −18.4; P < 0.0001).
Measurement of Other Musculoskeletal Disease
Impact of treatment on musculoskeletal disease was assessed by measuring the resolution of enthesitis with the Leeds Enthesitis Index (LEI), resolution of dactylitis with the Leeds Dactylitis Index (LDI), and change in axial disease using the Bath Ankylosing Spondylitis Disease Activity Index (BASDAI). For SELECT-PsA1 patients with enthesitis at baseline, resolution of enthesitis (LEI = 0) was achieved by a statistically significantly higher proportion of patients in the upadacitinib 15 mg treatment group (53.7%) compared to placebo (32.4%) at week 24 (between-group difference of 21.3%; 95% CI, 13.0 to 29.7; P = 0.0004). In SELECT-PsA2, a numerically higher proportion of patients in the upadacitinib 15 mg treatment group achieved resolution of enthesitis at week 24 compared to patients in the placebo group, with a difference of 27.6% (95% CI, 17.3 to 37.8); however, this end point was not part of the multiplicity-controlled analyses in PsA2. As there is a risk of inflated type I error, no appropriate statistical comparisons can be made. Resolution of dactylitis (LDI = 0) was achieved by a numerically higher proportion of patients in the upadacitinib group compared to the placebo group at week 24 in both trials. The differences between the 2 treatment groups were 36.8% (95% CI, 25.7 to 47.9) in SELECT-PsA1 and 30.1% (95% CI, 13.0 to 47.1) in SELECT-PsA2. In SELECT-PsA1, this end point was included in the hierarchical statistical analysis; however, it was ranked after the point at which the hierarchical analysis failed and was stopped. In SELECT-PsA2, this end point was not part of the multiplicity-controlled analyses. Results for this end point are therefore considered exploratory in both trials.
Change in axial disease was assessed in patients with the presence of psoriatic spondylitis at baseline. The improvement in BASDAI score from baseline to week 24 numerically favoured the upadacitinib 15 mg treatment group compared to the placebo group in both studies and compared to the adalimumab group in SELECT-PsA1. In SELECT-PsA1, the difference in the LS mean change in scores from baseline between upadacitinib and adalimumab was −0.57 (95% CI, −1.09 to −0.05), and between upadacitinib and placebo it was −1.42 (95% CI, −1.94 to −0.90). In PsA2, the difference between upadacitinib and placebo was −1.85 (95% CI, −2.55 to −1.15). However, this outcome assessment was not included in the hierarchical statistical analysis and should be considered inconclusive because of the potential for inflated type I error.
Radiographic Changes
Radiographic change was assessed only in SELECT-PsA1 using the Sharp/van der Heijde Score (SHS). At week 24, the differences in LS mean change from baseline in SHS was statistically significant, favouring the upadacitinib 15 mg treatment group over placebo (−0.29; 95% CI, −0.44 to −0.14; P = 0.0004). According to the clinical expert consulted for this review, these numerically small changes are unlikely to be clinically meaningful to patients over a period of only 24 weeks and it is difficult to extrapolate the significance of these changes over the lifetime of a patient with PsA. In particular, it is uncertain whether the radiographic changes seen in SELECT-PsA1 correlate with a direct and meaningful improvement in a patient’s physical function, quality of life, or permanent disability. However, the observations satisfy the regulatory requirement that upadacitinib can inhibit radiographic progression.
Harms Results
Safety data are summarized in Table 2. By week 24, the proportion of patients in SELECT-PsA1 who experienced a treatment-emergent adverse event (TEAE) was higher in the upadacitinib 15 mg and adalimumab treatment groups compared to the placebo group. In PsA2, the proportion of patients who experienced a TEAE was similar between the upadacitinib and placebo groups. Generally, the majority of AEs were mild or moderate in severity, and the most frequently reported AE in both studies was an upper respiratory tract infection. The frequency of serious adverse events (SAEs) and withdrawals due to adverse events (WDAEs) were low across all treatment groups and generally below 5%, with the exception of the upadacitinib 15 mg treatment group of SELECT-PsA2, which had the highest proportion of patients experiencing an SAE (5.7%) or WDAE (7.1%) across both studies. None of the specific SAEs were reported by more than 2 patients. Two treatment-emergent deaths were reported by week 24, both in the placebo group. One non–treatment-emergent death (i.e., occurring more than 30 days after the last dose) was reported in the upadacitinib 15 mg group.
Table 2: Summary of Key Results From Pivotal and Protocol-Selected Studies
Outcome | SELECT-PsA1 | SELECT-PsA2 | |||
|---|---|---|---|---|---|
PBO | ADA 40 mg every other week | UPA 15 mg daily | PBO | UPA 15 mg daily | |
Efficacy | |||||
ACR20 response rate at week 12 (NRI, FAS) | |||||
Total N | 423 | 429 | 429 | 212 | 211 |
Responder n (%) | 153 (36.2) | 279 (65.0) | 303 (70.6) | 51 (24.1) | 120 (56.9) |
Response rate (95% CI)a | 36.2 (31.6 to 40.7) | 65.0 (60.5 to 69.5) | 70.6 (66.3 to 74.9) | 24.1 (18.3 to 29.8) | 56.9 (50.2 to 63.6) |
Difference vs. control (95% CI)b | 34.5 (28.2 to 40.7) UPA vs. placebo 5.6 (−0.6 to 11.8) UPA vs. ADA | 32.8 (24.0 to 41.6) | |||
P valuec | < 0.0001 UPA vs. placebo 0.0004 (noninferiority, UPA vs. ADA)d 0.0815 (superiority, UPA vs. ADA) | < 0.0001 | |||
MDA at week 24 (NRI,e FAS) | |||||
Total N | 423 | 429 | 429 | 212 | 211 |
Responder n (%) | 52 (12.3) | 143 (33.3) | 157 (36.6) | 6 (2.8) | 53 (25.1) |
Response rate (95% CI)a | 12.3 (9.2 to 15.4) | 33.3 (28.9 to 37.8) | 36.6 (32.0 to 41.2) | 2.8 (0.6 to 5.1) | 25.1 (19.3 to 31.0) |
Difference vs. PBO (95% CI)b | 24.3 (18.8 to 29.8) | 22.3 (16.0 to 28.6) | |||
P valuec | 0.0004 | < 0.0001 | |||
HAQ-DI at week 12 (MMRM,f FAS) | |||||
Total N | 392 | 406 | 404 | 180 | 199 |
Baseline mean | 1.11 | 1.11 | 1.15 | 1.23 | 1.08 |
LS mean change from baseline (95% CI) | −0.14 (−0.18 to −0.09) | −0.34 (−0.38 to −0.29) | −0.42 (−0.47 to −0.37) | −0.10 (−0.16 to −0.03) | −0.30 (−0.37 to −0.24) |
LS mean difference vs. PBO (95% CI) | −0.28 (−0.35 to −0.22) | −0.21 (−0.30 to −0.12) | |||
P valueg | < 0.0001 | < 0.0001 | |||
FACIT-F at week 12 (MMRM,f FAS) | |||||
Total N | 394 | 410 | 404 | 184 | 201 |
Baseline mean | 30.3 | 29.8 | 29.0 | 26.4 | 27.9 |
LS mean change from baseline (95% CI) | 2.8 (1.9 to 3.7) | 5.7 (4.8 to 6.6) | 6.3 (5.4 to 7.2) | 1.3 (0.1 to 2.5) | 5.0 (3.8 to 6.1) |
LS mean difference vs. PBO (95% CI) | 3.5 (2.4 to 4.7) | 3.7 (2.0 to 5.4) | |||
P valueg | 0.0004 | < 0.0001 | |||
SF-36 PCS at week 12 (MMRM,f FAS) | |||||
Total N | 394 | 410 | 405 | 185 | 201 |
Baseline mean | 35.19 | 35.91 | 34.71 | 34.33 | 35.08 |
LS mean change from baseline (95% CI) | 3.19 (2.41 to 3.96) | 6.82 (6.07 to 7.58) | 7.86 (7.09 to 8.63) | 1.62 (0.58 to 2.67) | 5.15 (4.14 to 6.15) |
LS mean difference vs. PBO (95% CI) | 4.67 (3.67 to 5.67) | 3.52 (2.07 to 4.98) | |||
P valueg | 0.0004 | < 0.0001 | |||
PASI 75 at week 16 (NRI, FAS) | |||||
Total N | 211 | 211 | 214 | 131 | 130 |
Responder n (%) | 45 (21.3) | 112 (53.1) | 134 (62.6) | 21 (16.0) | 68 (52.3) |
Response rate (95% CI)a | 21.3 (15.8 to 26.9) | 53.1 (46.3 to 59.8) | 62.6 (56.1 to 69.1) | 16.0 (9.7 to 22.3) | 52.3 (43.7 to 60.9) |
Difference vs. PBO (95% CI)b | 41.3 (32.8 to 49.8) | 36.3 (25.6 to 46.9) | |||
P valuec | < 0.0001 | < 0.0001 | |||
sIGA at week 16 (NRI, FAS) | |||||
Total N | 313 | 330 | 322 | 163 | 171 |
Responder n (%) | 34 (10.9) | 127 (38.5) | 135 (41.9) | 15 (9.2) | 63 (36.8) |
Response rate (95% CI)a | 10.9 (7.4 to 14.3) | 38.5 (33.2 to 43.7) | 41.9 (36.5 to 47.3) | 9.2 (4.8 to 13.6) | 36.8 (29.6 to 44.1) |
Difference vs. PBO (95% CI)b | 31.1 (24.7 to 37.5) | 27.6 (19.2 to 36.1) | |||
P valuec | < 0.0001 | < 0.0001 | |||
SAPS at week 16 (MMRM,f FAS) | |||||
Total N | 388 | 407 | 396 | 182 | 191 |
Baseline mean | 44.0 | 43.0 | 44.0 | 52.6 | 49.5 |
LS mean change from baseline (95% CI) | −8.2 (−10.2 to −6.3) | −22.7 (−24.7 to −20.8) | −25.3 (−27.3 to −23.4) | −1.5 (−4.7 to 1.8) | −24.4 (−27.5 to −21.2) |
LS mean difference vs. PBO (95% CI) | −17.1 (−19.6 to −14.6) | −22.9 (−27.4 to −18.4) | |||
P valueg | NAh | < 0.0001 | |||
Enthesitis resolution (LEI = 0) at week 24 (NRI,e FAS) | |||||
Total N | 241 | 265 | 270 | 144 | 133 |
Responder n (%) | 78 (32.4) | 125 (47.2) | 145 (53.7) | 22 (15.3) | 57 (42.9) |
Response rate (95% CI)a | 32.4 (26.5 to 38.3) | 47.2 (41.2 to 53.2) | 53.7 (47.8 to 59.7) | 15.3 (9.4 to 21.2) | 42.9 (34.4 to 51.3) |
Difference vs. PBO (95% CI)b | 21.3 (13.0 to 29.7) | 27.6 (17.3 to 37.8) | |||
P valuec | 0.0004 | NAe | |||
SHS at week 24 (ANCOVA,i FAS) | |||||
Total N | 372 | 384 | 391 | NR | NR |
Baseline mean | 13.05 | 14.89 | 13.44 | NR | NR |
LS mean change from baseline (95% CI) | 0.25 (0.13 to 0.36) | 0.01 (−0.11 to 0.13) | −0.04 (−0.16 to 0.07) | NR | NR |
LS mean difference vs. PBO (95% CI) | −0.29 (−0.44 to −0.14) | NR | NR | ||
P valueg | 0.0004 | NR | NR | ||
Safety | |||||
Harms at end of double-blind period (up to week 24): Safety population | |||||
Patients with ≥ 1 AE, n (%) | 252 (59.6) | 278 (64.8) | 287 (66.9) | 139 (65.6) | 135 (64.0) |
Patients with ≥ 1 SAE, n (%) | 13 (3.1) | 16 (3.7) | 14 (3.3) | 4 (1.9) | 12 (5.7) |
Patients with ≥ 1 WDAE, n (%) | 13 (3.1) | 22 (5.1) | 13 (3.0) | 11 (5.2) | 15 (7.1) |
Deathj | 1 (0.2) | 0 | 0 | 1 (0.5) | 0 |
Notable harms, n (%): Safety population | |||||
Serious infection | 4 (0.9) | 3 (0.7) | 5 (1.2) | 1 (0.5) | 1 (0.5) |
Serious pneumonia | 2 (0.5) | 1 (0.2) | 1 (0.2) | 0 | 1 (0.5) |
Herpes zoster | 3 (0.7) | 0 | 4 (0.9) | 2 (0.9) | 3 (1.4) |
Anemia | 4 (0.9) | 1 (0.2) | 3 (0.7) | 2 (0.9) | 4 (1.9) |
Neutropenia | 1 (0.2) | 10 (2.3) | 4 (0.9) | 1 (0.5) | 2 (0.9) |
Malignancy (any) | 1 (0.2) | 3 (0.7) | 1 (0.2) | 0 | 3 (1.4) |
VTEk (fatal and non-fatal) | 1 (0.2) | 2 (0.5) | 0 | 0 | 1 (0.5) |
Arterial thrombosisl | 0 | 1 (0.2) | 0 | 0 | 0 |
GI perforation | 0 | 0 | 0 | 0 | 0 |
CPK elevation | 6 (1.4) | 24 (5.6) | 38 (8.9) | 4 (1.9) | 4 (1.9) |
Hepatic disorder | 16 (3.8) | 67 (15.6) | 39 (9.1) | 3 (1.4) | 4 (1.9) |
MACEm | 1 (0.2) | 2 (0.5) | 0 | 0 | 1 (0.5) |
ACR20 = American College of Rheumatology 20% improvement in rheumatoid arthritis; ADA = adalimumab; AE = adverse event; ANCOVA = analysis of covariance; BSA = body surface area; CI = confidence interval; CPK = creatine phosphokinase; DMARD = disease-modifying antirheumatic drug; FACIT-F = Functional Assessment of Chronic Illness Therapy–Fatigue; FAS = full analysis set; GI = gastrointestinal; HAQ-DI = Health Assessment Questionnaire–Disability Index; LEI = Leeds Enthesitis Index; LS = least squares; MACE = major adverse cardiovascular event; MDA = minimal disease activity; MMRM = mixed model for repeated measures; NR = not reported; NRI = nonresponder imputation; PASI = Psoriasis Area and Severity Index; PASI 75 = 75% reduction in Psoriasis Area Severity Index score; PBO = placebo; PCS = physical component summary; SAE = serious adverse event; SAPS = Self-Assessment of Psoriasis Symptoms; SF-36 = Short Form (36) Health Survey; SHS = Sharp/van der Heijde Score; sIGA = static Investigator Global Assessment; UPA = upadacitinib; vs. = versus ; VTE = venous thromboembolic event; WDAE = withdrawal due to adverse event.
Note: Analysis of PASI 75 was performed only in patients with psoriasis covering at least 3% of BSA at baseline; analysis of sIGA was performed for patients who achieved a score of 0 or 1 and an improvement of at least 2 points from baseline, and only in patients with baseline sIGA of at least 2%; analysis of resolution of enthesitis and resolution of dactylitis were performed only in patients with baseline LEI greater than 0 and LDI greater than 0, respectively.
a95% CIs for response rate were calculated based on normal approximation to the binominal distribution.
b95% CIs for response-rate difference were calculated based on normal approximation.
cThe P value was constructed using Cochran-Mantel-Haenszel test adjusted for the main stratification factor of current DMARD use (yes/no). In PsA1, the P value was statistically significant at the 0.025 level for ACR20 (for UPA vs. PBO; and for noninferiority of UPA vs. ADA), MDA, PASI 75, sIGA, and resolution of enthesitis; and at the 0.05 level for ACR20 and superiority of UPA vs. ADA. In PsA2, the P value was significant at the 0.0125 level for MDA, and at 0.025 for ACR20, sIGA, and PASI 75.
dThe noninferiority test of UPA vs. ADA was based on 3-arm noninferiority testing aiming for UPA, preserving at least 50% of the placebo-subtracted ADA effect. The percent of ADA effect preservation is the point estimate of 3-arm noninferiority analysis, which is calculated by (UPA − PBO)/(ADA − PBO) × 100. The confidence interval of the ratio is calculated using Fieller’s method.
eNonresponder imputation with additional rescue handling was used, with patients rescued at week 16 imputed as nonresponders.
fWithin-group LS mean and 95% CI, and between-group LS mean difference and 95% CI and P value are based on an MMRM analysis with an unstructured variance-covariance matrix, including treatment, visit, treatment-by-visit interaction, and the stratification factor of current DMARD use (yes/no) as fixed factors, and the continuous fixed covariate of baseline measurement. The MMRM analysis used observed longitudinal data up to week 12 (or week 16 for SAPS) before premature discontinuation of the study drug.
gIn PsA, the P value statistically was significant at the 0.0125 level for FACIT-F and SF-36 PCS; and the 0.025 level for HAQ-DI and SHS. In PsA2, the P value was significant at the 0.0125 level for FACIT-F, SF-36 PCS, SAPS; and at the 0.025 level for HAQ-DI.
hIn SELECT-PsA1, because the change from baseline in SAPS at week 16 was ranked below the point at which the hierarchical analysis failed (i.e., after testing had stopped due to failure to show superiority of UPA 15 mg vs. ADA), the P value is not presented in this table.
iResults for SHS were based on an ANCOVA with linear extrapolation for missing data and rescue handling. Within-group LS mean and 95% CI, and between-group LS mean difference and 95% CI and P value are based on an ANCOVA model including treatment and the stratification factor of current DMARD use (yes/no) as fixed factors and the baseline value as a covariate.
jTreatment-emergent deaths were captured for deaths occurring up to 30 days after last dose (or ≤ 70 days for patients in the adalimumab group). In SELECT-PsA1, from week 24 to the data cut-off, 1 additional death in the upadacitinib 15 mg treatment group was reported, occurring more than 30 days after the last dose of the study drug (participant had withdrawn consent).
kIncludes fatal and non-fatal deep-vein thrombosis and pulmonary embolism. None of the patients experience a fatal VTE.
lIncludes non-cardiac, non-neurologic, and non-fatal events.
mDefined as cardiovascular death, non-fatal myocardial infarction, and non-fatal stroke.
Source: SELECT-PsA1 Clinical Study Report9 and SELECT-PsA2 Clinical Study Report.10
Critical Appraisal
A few major limitations and sources of bias are described in this section. Further details for each point, as well as a complete list of limitations and sources of bias, are available in the Critical Appraisal subsection of the Clinical Evidence – Results section.
Key end points comparing upadacitinib to adalimumab were measured at week 12. According to the clinical expert consulted for this review, this may not have provided enough time for adalimumab to show maximal benefit. The benefit of JAK inhibitors is thought to be seen generally sooner than that of TNF inhibitors. As such, end points measured at week 12 may be biased in favour of upadacitinib. While results of both upadacitinib and adalimumab were consistent until 24 weeks, it is uncertain whether upadacitinib 15 mg is noninferior to adalimumab due to the lack of statistical testing at week 24. Also, the noninferiority and superiority comparison between upadacitinib and adalimumab was conducted only for the ACR20 efficacy outcome, making it unclear whether upadacitinib would be noninferior to adalimumab for other outcome measures.
Not all end points measured in this trial may be clinically meaningful to patients, despite showing statistically significant differences in the trials. For example, subjective measures such as fatigue or the small changes seen in SHS may not reflect clinically meaningful improvement, particularly when measured over such a short length of time relative to the long disease course. The clinical expert consulted for this review noted that it is difficult to extrapolate the significance of these changes over the lifetime of a patient with PsA. Also, several outcomes that were identified in the CADTH review protocol and reported in the studies fell outside the statistical testing hierarchy and should therefore be interpreted with consideration of type I error. Given the large number of comparisons in the study, a statistically significant finding may be attributable to inflated type I error. Furthermore, the results of the pre-specified subgroup analyses performed for the primary end point should be interpreted with caution due to the small sample sizes and lack of control for type I error, and also because the trial was not powered to test specific hypotheses in subgroups. As with the end points, which were not part of the statistical testing hierarchy, the results of these subgroup analyses should be interpreted with caution.
SELECT-PsA1 required patients to have the presence of either at least 1 erosion on an X-ray or high-sensitivity C-reactive protein (hs-CRP) levels greater than the upper limit of normal (ULN) for inclusion in the study, and this may affect the generalizability of the study’s results. According to the clinical expert consulted for this review, a substantial proportion of patients seen in clinical practice generally do not have evident erosion or inflammatory markers elevated to this degree and yet still require treatment with bDMARDs.
Although long-term data were reported for up to week 56 in both studies, placebo-controlled data for upadacitinib exist only up to week 24.
Upadacitinib was compared to active treatment (adalimumab) only in patients with no prior exposure to bDMARD treatment. It is unknown if the same relative benefit can be expected from patients who have failed prior treatment with bDMARDs.
Indirect Comparisons
Description of Studies
Other than the inclusion of upadacitinib in SELECT-PsA1 and SELECT-PsA2, there are no studies in which upadacitinib is compared directly to other bDMARDs or tsDMARDs. Therefore, the sponsor conducted an indirect comparison that comprised a network meta-analysis (NMA) that compared the efficacy of upadacitinib to that of TNF inhibitors (adalimumab, certolizumab pegol, etanercept, golimumab, and infliximab), IL-17 inhibitors (secukinumab and ixekizumab), an IL-12/23 inhibitor (ustekinumab), an IL-23 inhibitor (guselkumab), cytotoxic T lymphocyte–associated antigen-4 immunoglobulin (abatacept), a JAK inhibitor (tofacitinib), and a PDE4 inhibitor (apremilast). Results from the indirect treatment comparison (ITC) are summarized in this section only for relevant comparators identified in the CADTH systematic review. Efficacy was compared at 12 and 24 weeks, and the ITC reported results for bDMARD-naive and bDMARD-experienced patients separately.
Efficacy Results
Overall, in biologic-naive patients, the NMA suggests that upadacitinib 15 mg is more efficacious for an ACR20 at week 12 compared to some comparators, specifically an IL-17 inhibitor (secukinumab 15 mg), IL-12/23 inhibitor (ustekinumab 45 mg), and IL-23 inhibitor (guselkumab), but this advantage was only seen for the IL-12/23 inhibitor at 24 weeks. Upadacitinib was also shown to be more efficacious than etanercept at both weeks 12 and 24 for a PASI response; however, this was not seen with other TNF inhibitors. The IL-17 inhibitors (secukinumab 300 mg and ixekizumab) and IL-23 inhibitor (guselkumab) appear to be more efficacious than upadacitinib for PASI responses at week 12, although only the IL-23 inhibitor was favoured over upadacitinib at week 24. For PsARC, upadacitinib was more efficacious than tofacitinib but only at week 12; this was not seen at week 24. For HAQ-DI measured in PsARC responders at week 12, etanercept was more efficacious than upadacitinib; this benefit was not seen with other TNF inhibitors. At week 24, adalimumab appeared to be more efficacious than upadacitinib. The number of comparators included in some analyses (i.e., HAQ-DI at 24 weeks) was limited. Because no difference was seen between upadacitinib and the relevant comparators in other analyses, no consistent benefit of upadacitinib over bDMARDs or tsDMARDs was demonstrated across all measured end points (weeks 12 and 24).
In biologic-experienced patients, upadacitinib 15 mg was favoured only when compared to tofacitinib (a JAK inhibitor) in PASI response at week 12; this comparison was not performed at week 24. No difference in treatment effect was demonstrated in all other comparisons between upadacitinib and the included IL inhibitors. Not all IL inhibitors were included in every analyses, and the IL-23 inhibitor was absent from many comparisons. Furthermore, TNF inhibitors were not included in any of the NMA analyses as there were insufficient eligible data in the bDMARD-experienced patient population, and therefore no conclusions can be drawn on the comparative efficacy of upadacitinib in these patients. Also, because JAK inhibitors were not included in any of the week 24 analyses, the long-term comparative efficacy of upadacitinib compared to tofacitinib is unknown.
Harms Results
The sponsor’s submitted ITC did not report safety outcomes.
Critical Appraisal
Several limitations increase the uncertainty of the results of the ITC discussed in this review. The included studies were highly heterogeneous in terms of inclusion criteria and patient characteristics. Significant differences were noted in potential effect modifiers, such as duration of disease, use of prior DMARDs, and disease severity. Although these factors are heightened due to the variation in inclusion and exclusion criteria across included studies, no sensitivity analysis or subgroup analysis was conducted to assess the impact of these potential effect modifiers on the comparison of upadacitinib and other biologics. The ITC also did not include any analyses of other clinically meaningful outcomes, such as PsA symptoms (e.g., pain and fatigue), HRQoL, or safety.
Overall, there is uncertainty due to the inherent heterogeneity across trials in the networks. The robustness of the comparative efficacy was further compromised by the lack of precision in the findings, and results from the sponsor-submitted ITC must therefore be interpreted with caution.
Other Relevant Evidence
Description of Studies
Each of the SELECT studies included 2 study periods. At the time of this review, data up to the end of period 1 (week 56) was available. Period 1 for SELECT-PsA1 included 24 weeks of randomized, double-blind, placebo- and active comparator–controlled treatment followed by an additional 32 weeks of blinded active comparator–controlled treatment. Period 1 for SELECT-PsA2 included 24 weeks of randomized, double-blind, placebo-controlled treatment followed by an additional 32 weeks of upadacitinib treatment. In both studies, all patients assigned to placebo were switched to pre-assigned upadacitinib 15 mg or 30 mg daily in a 1:1 ratio at week 24.11 Data reported at week 56 used the as-observed dataset, and no adjustments for multiple testing were employed.
Efficacy Results
In both studies, results from the end of period 1 (week 56 data) suggest that the improvements in clinical and patient-reported outcomes observed at week 24 in patients who received upadacitinib 15 mg once daily starting at day 1 were maintained throughout the 56-week blinded treatment period. Patients who switched from placebo to upadacitinib 15 mg once daily at week 24 also showed improvements in clinical and patient-reported outcomes at week 56; the trajectory for achievement of response or improvement in end points after starting upadacitinib was similar to those observed in patients who started upadacitinib on day 1 of both studies. Numerically greater improvement with upadacitinib compared to adalimumab was also demonstrated for several end points in SELECT-PsA1. For example, the difference in the ACR20 response rate between the upadacitinib 15 mg treatment group (including those switched to upadacitinib 15 mg from placebo), and adalimumab was 6.3% (95% CI, 0.3 to 12.2), and the difference in the proportion of patients achieving MDA was 7.6% (95% CI, 0.4 to 14.8).
Harms Results
The safety profile of oral upadacitinib 15 mg once daily over 56 weeks was consistent with that observed during the 24-week double-blind period in both SELECT-PsA1 and PsA2, with no unexpected safety signals reported. Harms for the analysis at week 56 were presented as exposure-adjusted event rates and were also pooled such that data reported for the upadacitinib exposure combined the upadacitinib 15 mg and placebo-switched-to-upadacitinib 15 mg groups. In SELECT-PsA1, 1 or more AEs were reported at an exposure-adjusted incidence of 265.9 events per 100 patient-years (PYs) in the adalimumab group and 281.1 events per 100 PY in the upadacitinib group. In SELECT-PsA2, 1 or more AEs were reported at a rate of 260.6 events per 100 PY (pooled upadacitinib group). With longer exposure to treatment, a greater proportion of patients treated with upadacitinib compared to adalimumab experienced infectious AEs, including the following, which are presented as events per 100 PY: urinary tract infections (3.6 for adalimumab and 6.7 for upadacitinib in SELECT-PsA1, and 9.8 for upadacitinib in SELECT-PsA2), bronchitis (2.9 for adalimumab and 5.7 for upadacitinib in SELECT-PsA1, and 8.8 for upadacitinib in SELECT-PsA2), hypertension (2.7 for adalimumab and 5.6 for upadacitinib in SELECT-PsA1, and 5.7 for upadacitinib in SELECT-PsA2), and influenza (0.8 for adalimumab and 3.2 for upadacitinib in SELECT-PsA1, and 5.2 for upadacitinib in SELECT-PsA2). Herpes zoster was also reported in a higher proportion of patients treated with upadacitinib across both studies (3.9 per 100 PY and 3.8 per 100 PY in SELECT-PsA1 and SELECT-PsA2, respectively), compared to those treated with adalimumab (0.5 per 100 PY). Other notable AEs that showed an imbalance in groups include elevated creatine phosphokinase (CPK) levels and hepatic disorder, which were reported at a higher incidence by both upadacitinib and adalimumab treatment groups in SELECT-PsA1 compared to SELECT-PsA2. Elevated CPK levels were reported at an incidence rate of 7.3 per 100 PY for adalimumab, 11.9 for upadacitinib in SELECT-PsA1, and 5.2 for upadacitinib in SELECT-PsA2. Hepatic disorder was reported in a higher proportion of patients treated with adalimumab (24.9 per 100 PY for adalimumab and 19.1 per 100 PY for upadacitinib in SELECT-PsA1, and 4.8 per 100 PY for upadacitinib in SELECT-PsA2), although this may be confounded overall by the higher usage of concomitant methotrexate treatment in SELECT-PsA1 patients. Withdrawal of treatment due to AEs was reported at an incidence of 7.4 per 100 PY for adalimumab, and 4.6 per 100 PY and 10.0 per 100 PY for upadacitinib in SELECT-PsA1 and SELECT-PsA2, respectively. In total, 5 deaths occurred in the relevant treatment groups by the end of period 1, inclusive of those counted under week 24 data. These include both treatment-emergent deaths (occurring within 30 days of last dose for upadacitinib or 70 days for adalimumab) and non–treatment-emergent deaths. One treatment-emergent death occurred in the adalimumab group, and 2 non-treatment-emergent deaths occurred in the upadacitinib 15 mg treatment group. The remaining 2 deaths occurred in the placebo groups.
Critical Appraisal
Interpretation of the long-term efficacy and safety outcomes at week 56 is limited by the lack of a placebo control in both SELECT-PsA1 and SELECT-PsA2, as well as the lack of a comparator in SELECT-PsA2. Also, because background therapies were allowed to be modified, it is difficult to disentangle the drug effect from the changes in the background therapies on the reported outcomes. Furthermore, given that all patients were aware that they were receiving an active treatment (upadacitinib or adalimumab), results for patient-reported outcomes may be subject to bias. Because no adjustment was made for multiplicity to evaluate long-term data, and given the large number of analyses performed, there is a risk of inflated type I error. As such, the week 56 data should be interpreted with caution.
Conclusions
Psoriatic arthritis is a complex disease due to the numerous domains of disease activity that need to be addressed with treatment. Based on the double-blind portion of both phase III randomized controlled trials (RCTs) (SELECT-PsA1 and SELECT-PsA2), treatment with oral upadacitinib 15 mg once daily is associated with statistically significant and clinically meaningful improvement compared to placebo in the clinical response of PsA symptoms, as measured by the primary efficacy outcome of an ACR20 response at week 12. In bDMARD-naive patients (SELECT-PsA1), upadacitinib 15 mg orally once daily was no worse than (i.e., noninferior to) adalimumab 40 mg administered subcutaneously every other week in achievement of an ACR20 at week 12. The efficacy of upadacitinib compared to adalimumab in bDMARD-experienced patients is unknown.
Additionally, an overall consistent effect of upadacitinib 15 mg compared to placebo was demonstrated for numerous clinically relevant manifestations of PsA, including function and disability, PsA symptoms (pain and fatigue), HRQoL or patient-reported health outcomes, skin disease or psoriasis, musculoskeletal symptoms (enthesitis, dactylitis, and spinal symptoms), and other measures of clinical response or disease control such as MDA. Improvement in these measures of treatment response with upadacitinib 15 mg compared to placebo was demonstrated across both studies in patients with inadequate response or intolerance to non-bDMARDs (SELECT-PsA1) and bDMARDs (SELECT-PsA2). Efficacy of upadacitinib in radiographic changes was only studied in bDMARD-naive patients, and the clinical meaningfulness of the small improvement seen versus placebo over this short duration is uncertain. Furthermore, an estimated MID for many of the measures used to assess continuous end points was not identified for patients with PsA, making the clinical significance of the numerical improvements seen in some end points, notably the patient’s assessment of pain NRS, uncertain.
Findings from the end of period 1 of SELECT-PsA1 and SELECT-PsA2 suggest that the improvements in outcomes observed at week 24 in the upadacitinib 15 mg treatment group were maintained throughout the 56-week extension.
By week 24, the proportion of patients who experienced a TEAE with upadacitinib in SELECT-PsA1 was comparable to the proportion treated with adalimumab but higher relative to the placebo group. In SELECT-PsA2, the proportion of patients who experienced a TEAE was similar between the upadacitinib and placebo groups. Upper respiratory tract infection was most commonly reported in both studies. The safety profile of upadacitinib 15 mg once daily over 56 weeks was consistent with that observed during the 24-week double-blind period, with no unexpected safety signals reported. However, long-term data from the ongoing extension phase of both SELECT-PsA1 (up to 5 years) and SELECT-PsA2 (up to 3 years) will help better characterize the efficacy and safety of upadacitinib in the treatment of this chronic condition.
No direct comparative evidence for upadacitinib 15 mg versus bDMARDs or tsDMARDs other than adalimumab was identified. A sponsor-submitted ITC comparing upadacitinib 15 mg to bDMARDs or tsDMARDs suggested that in both bDMARD-naive and DMARD-experienced patients, upadacitinib does not show either a consistent or distinct difference in efficacy as measured by ACR20, PASI, PsARC, or HAQ-DI when compared to bDMARDs or tsDMARDs. The value of the ITC results is uncertain due to the inherent heterogeneity across trials in the networks. Moreover, no information was obtained regarding safety compared to other bDMARDs or tsDMARDs. In addition, no conclusion could be drawn on the HRQoL outcomes.
Introduction
Disease Background
Psoriatic arthritis is an inflammatory musculoskeletal disease with a heterogenous presentation and disease course. While it is associated with psoriasis, PsA also presents with variable clinical features involving multiple domains, including peripheral arthritis, enthesitis, dactylitis, and axial disease.1,2 Diagnosis of PsA can be a challenge, as there is no gold-standard diagnostic test; diagnoses are typically based on clinical findings and imaging features that evaluate specific patterns of joint inflammation or involvement of the different domains. Patients with PsA also present with psoriatic skin lesions and most (95%) are usually seronegative for rheumatoid factor.2,3 Pain and stiffness of the affected joints are the most predominant presenting symptoms, with fatigue also occurring in many patients.1
The prevalence of PsA varies, depending on the case definition and geography, and is estimated to be 1 to 2 per 1,000 in the general population.1 A population-based Canadian study estimated that the age- and sex-standardized cumulative prevalence of PsA in Ontario ranged from 0.09% in 2008 to 0.15% in 2015. The same study estimated the age- and sex-standardized incidence in 2015 to be 14 per 100,000.4 These figures may vary. For example, another study found the estimated annual incidence of PsA was 6 per 100,000 per year.1
About 30% of patients with psoriasis develop PsA; skin disease usually precedes manifestations of PsA by several years (10 years on average), although both can occur simultaneously in some individuals or PsA may occur before the onset of psoriasis.2 A Canadian prospective cohort study estimated the annual incidence of PsA was 2.7 cases per 100 psoriasis patients.12 Over time, PsA can lead to deformities and joint damage.2 This can lead to significant functional impairment, which in turn can affect work productivity and reduce HRQoL.2,3
Standards of Therapy
Treatment goals for patients with PsA include achieving the lowest possible level of disease activity in all domains of disease; optimizing functional status, improving quality of life and well‐being; preventing structural damage to the greatest extent possible; and avoiding or minimizing complications, both from untreated active disease and from therapy. Because this disease affects more than just the joints of the patient, treatment is individualized based on various factors, including disease activity, structural damage, comorbid conditions, and previous therapies.6 Accordingly, treatment effects need to be evaluated in different domains involving the musculoskeletal system (e.g., in dactylitis, enthesitis, and axial disease) as well as extra-articular manifestations (e.g., nails, skin, eyes, and the gastrointestinal tract). Several drug classes are employed in the pharmacologic treatment of PsA, including NSAIDs, csDMARDs (methotrexate, sulfasalazine, and leflunomide), bDMARDs (TNF inhibitors, IL-23 inhibitors, IL-12/23 inhibitors, and IL-17 inhibitors), and tsDMARDs (apremilast or tofacitinib).5
In the treatment of PsA, NSAIDs are generally used for symptomatic treatment. Despite the lack of evidence from RCTs, guidelines often recommend using csDMARDs, typically methotrexate, as the primary treatment in first-line therapy or after a short course of NSAIDs in patients with polyarthritis.5,6 These recommendations were based on data from primarily observational studies, the low costs and universal access associated with csDMARDs, and the lack of evidence that a short time delay in the introduction of more effective therapies would affect long-term function and quality of life.6 Some guidelines also recommend first-line treatment with a TNF inhibitor, particularly in patients with severe PsA or psoriasis.6,7 In patients with an inadequate response to at least 1 csDMARD, the European League Against Rheumatism recommends starting a bDMARD. The latest recommendations do not distinguish among TNF inhibitors, IL-17 inhibitors, and IL-12/23 inhibitors, and the choice is individualized based on numerous factors, including cost. However, an IL-17 or IL-12/23 inhibitor may be preferred in patients with relevant skin involvement.5
In the case of biologic drug treatment failure due to either lack of efficacy or AEs, switching to an alternative biologic drug within a class or with a different mode of action was recommended in treatment guidelines.5-7 Tofacitinib (a pan-JAK inhibitor) may be considered in patients who have an inadequate response or intolerance to at least 1 csDMARD and at least 1 bDMARD, or when a bDMARD is not appropriate.5 It is given in combination with methotrexate or another csDMARD.13 Thereafter, European League Against Rheumatism recommendations suggest considering apremilast (a PDE4 inhibitor) in patients with mild disease and an inadequate response to at least 1 csDMARD, and for whom neither a bDMARD nor a JAK inhibitor is appropriate. Abatacept, a cytotoxic T lymphocyte–associated antigen-4 immunoglobulin co-stimulation modulator, is another potential option in the treatment of PsA; however, its use is generally limited due to its relatively low efficacy, and it is also not funded by public drug plans.5 Specific treatment recommendations are also available for other scenarios; for example, in patients with unequivocal enthesitis or predominantly axial disease, for whom bDMARDs are generally considered after insufficient response to NSAIDs.5 In addition to the severity and manifestations of disease, treatment choice may vary depending on contraindications, concomitant conditions (e.g., active inflammatory bowel disease), and patient preference (e.g., route of administration or dosing frequency).7
Although there is no specific Canadian treatment guideline for the management of PsA, the Canadian Rheumatology Association/Spondyloarthritis Research Consortium of Canada Treatment Recommendations for the Management of Spondyloarthritis from 2014 include the following recommendations: (1) methotrexate, sulfasalazine, and leflunomide may be considered in patients with peripheral arthritis, however these treatments have only minimal to moderate evidence of efficacy (on peripheral joints and no efficacy on the spine); (2) combination therapy with DMARDs should be considered in peripheral arthritis, particularly in patients with moderate to high disease activity, poor prognostic features, and in patients with recent-onset disease, and combination therapy should also be considered in patients with inadequate response to monotherapy; (3) TNF inhibitors should be offered to those with persistent inflammation despite a trial of NSAID and 1 csDMARD in patients with predominantly peripheral arthritis; and (4) TNF inhibitors should be offered to patients with refractory enthesitis or dactylitis accompanied by persistent inflammation. The recommendations on the use of csDMARDs and TNF inhibitors in peripheral arthritis were based on PsA data.14
Currently, a single JAK inhibitor is available in Canada. Tofacitinib, a pan-JAK inhibitor, is indicated for the treatment of adult patients with active PsA when the response to previous DMARD therapy has been inadequate.13 However, it has not undergone review by CADTH and is not publicly funded in Canada. Some safety signals have been identified for tofacitinib. Most recently, preliminary results for a post-marketing safety trial comparing tofacitinib to TNF inhibitors identified an increased risk of major adverse cardiovascular events (MACEs). The trial enrolled patients with rheumatoid arthritis who were 50 years of age or older and had at least 1 additional cardiovascular risk factor. Results suggest that risks are associated with dosages of both 5 mg twice daily and 10 mg twice daily.15
The input received from the clinical expert consulted by CADTH for this review is consistent with the guidelines. According to the clinical expert, treatment of PsA is directed at fundamental disease mechanisms, and is complex because decisions are based on managing the diverse domains of psoriatic disease (i.e., arthritis, spondylitis, enthesitis, dactylitis, and skin and nail dysfunction). Treatment decisions are further influenced by the number of swollen peripheral joints (oligoarthritis versus polyarthritis), by the magnitude of skin disease, and by the presence of associated conditions, such as inflammatory bowel disease and uveitis. For treatment goals in PsA, the clinical expert noted that a treat-to-target strategy is advocated. The recommended target for arthritis is MDA, a high-level end point of almost no disease activity. Targets involving peripheral joint activity may also be acceptable. Control of musculoskeletal disease is expected to prevent joint damage and deformity. In turn, control of articular disease would be expected to improve quality of life, restore functional capacity, and enhance work attendance and productivity. The clinical expert indicated that the current treatment plan in Canada for patients with PsA begins with a DMARD. Trials of at least 2 csDMARDs as monotherapy (methotrexate, leflunomide, or sulfasalazine) lasting 3 to 4 months. In patients with inadequate responses to csDMARDs, treatment is escalated to a TNF inhibitor. Patients with inadequate response to TNF inhibitors would be treated with an IL-17 inhibitor or IL-12/23 inhibitor next, and the oral JAK inhibitor tofacitinib is currently considered as last-line therapy. Oral apremilast, a PDE4 inhibitor, is considered in a minority of patients, typically those with less joint and skin disease; however, it is not reimbursed by public drug plans. The clinical expert noted that patients with spinal disease are treated first with NSAIDs, followed by biologics when NSAIDs fail. Oral and IV steroids are not indicated in patients with spondylitis and used only with caution and at low doses for patients with peripheral arthritis. Intra-articular steroid injections can be used in patients with oligoarthritis and dactylitis.
Drug
Upadacitinib is an oral JAK inhibitor that has greater inhibitory potency on JAK1 proteins relative to JAK2, JAK3, and TYK2. By inhibiting JAKs, upadacitinib modulates the intracellular signalling pathways of cytokines or growth factors involved in a broad range of cellular processes, such as inflammatory responses, hematopoiesis, and immune surveillance. Specifically, upadacitinib prevents the phosphorylation and activation of signal transducers and activators of transcription by JAKs, blocking intracellular activity, including gene expression. Upadacitinib is available as 15 mg extended-release tablets.8
The recommended dosage of upadacitinib for treatment of PsA is 15 mg orally once a day. Upadacitinib may be used as monotherapy or in combination with methotrexate.8
Upadacitinib is approved by Health Canada for the treatment of adults with active PsA who have had an inadequate response or are intolerant to methotrexate or other DMARDs. The requested reimbursement criteria align overall with the Health Canada indication. AbbVie Inc., the sponsor, is requesting reimbursement for the treatment of active PsA in adult patients who have responded inadequately or who are intolerant to 1 or more DMARDs. The approved indication states that upadacitinib may be used as monotherapy or in combination with methotrexate. The European Commission has also granted marketing authorization for upadacitinib for the same indication.16
Upadacitinib has been previously reviewed by CADTH for the treatment of adults with moderately to severely active rheumatoid arthritis who have had an inadequate response or are intolerant to methotrexate.17
In addition to upadacitinib, various treatments for PsA are currently approved in Canada (Table 3).
Table 3: Key Characteristics of Select Agents Used in the Treatment of Psoriatic Arthritis
Agents | Characteristics | ||||
|---|---|---|---|---|---|
Mechanisms of action | Indicationa | Route of administration | Recommended dosage | Serious side effects and safety issues | |
Upadacitinib | JAK inhibitor; greater inhibitory potency at JAK1 relative to JAK2, JAK3, and TYK2 | Treatment of adults with active psoriatic arthritis who have had an inadequate response or are intolerant to methotrexate or other DMARDs; may be used as monotherapy or in combination with methotrexate | PO | 15 mg once daily | Serious infections (TB, invasive fungal infections, opportunistic infections), malignancies, thrombosis, liver enzyme elevation |
Tofacitinib | JAK inhibitor; pan-JAK inhibitor | Reducing the signs and symptoms of PsA in adult patients with active PsA when the response to previous DMARD therapy has been inadequate; can be used in combination with MTX or another conventional synthetic DMARD | PO | 5 mg twice a day | Serious infections (TB, invasive fungal infections, opportunistic infections), malignancies, thrombosis, liver enzyme elevation |
Ixekizumab | Humanized IgG4 monoclonal antibody that selectively binds and neutralizes the pro-inflammatory cytokine IL-17A | Treatment of adult patients with active PsA who have responded inadequately or are intolerant to 1 or more DMARDs; can be used alone or in combination with a conventional DMARD, e.g., MTX | SC | For PsA or PsA with coexistent mild PP: 160 mg at week 0, followed by 80 mg every 4 weeks For PsA with coexistent moderate to severe PP: 160 mg at week 0, followed by 80 mg at weeks 2, 4, 6, 8, 10, and 12, then 80 mg every 4 weeks | Infections (TB and serious infection in particular), hypersensitivity reactions and inflammatory bowel disease (exacerbations or new onset) |
Secukinumab | Fully human IgG1k monoclonal antibody that selectively binds and neutralizes the pro-inflammatory cytokine IL-17A | Treatment of adult patients with active PsA when the response to previous DMARD therapy has been inadequate; can be used alone or in combination with MTX | SC | 150 mg at weeks 0, 1, 2, 3, and 4 followed by monthly maintenance dosing For PsA patients with coexistent moderate to severe PP: 300 mg at weeks 0, 1, 2, 3, and 4 followed by monthly maintenance dosing Patients with PsA who are anti–TNF-alpha inadequate responders or who continue to have active PsA: 300 mg dose should be considered | Infections (TB and serious infection in particular), hypersensitivity reactions and inflammatory bowel disease (exacerbations or new onset) |
Ustekinumab | Fully human IgG1k monoclonal antibody that inhibits the bioactivity of IL-12 and IL-23 | Treatment of adult patients with active PsA; can be used alone or in combination with MTX | SC | 45 mg at weeks 0 and 4, then every 12 weeks thereafter Alternately, 90 mg may be used in patients with a body weight > 100 kg | Infections and reactivation of latent infections (TB and serious infections), hypersensitivity reactions, malignancies, RPLS |
Adalimumab | TNF inhibitor; recombinant human IgG1 monoclonal antibody | Reducing the signs and symptoms of active arthritis and inhibiting the progression of structural damage and improving the physical function in adult PsA patients; can be used in combination with MTX in patients who do not respond adequately to methotrexate alone | SC | 40 mg every other week | Serious infections (bacterial, mycobacterial, invasive fungal, viral, parasitic, or other opportunistic infections), malignancies, hypersensitivity reactions (allergic reactions and injection site reactions), neurologic events (e.g., demyelinating disease), congestive heart failure |
Certolizumab pegol | TNF inhibitor; recombinant, humanized antibody Fabʹ fragment | Reducing signs and symptoms and inhibiting the progression of structural damage as assessed by X-rays in adult patients with moderately to severely active PsA who have failed 1 or more DMARDs; can be used alone or in combination with MTX | SC | Loading dose of 400 mg initially (week 0) and at weeks 2 and 4 followed by a maintenance dose of 200 mg every 2 weeks or 400 mg every 4 weeks | Serious infections (bacterial, mycobacterial, invasive fungal, viral, parasitic, or other opportunistic infections), malignancies, hypersensitivity reactions (allergic reactions and injection site reactions), neurologic events (e.g., demyelinating disease), congestive heart failure |
Etanercept | TNF inhibitor; recombinant human TNF receptor: fusion protein | Reducing signs and symptoms, inhibiting the progression of structural damage of active arthritis, and improving physical function in adult patients with PsA; can be used in combination with MTX in adult patients who do not respond adequately to MTX alone | SV | 50 mg once a week Can be given as a single 50 mg injection, or 2 × 25 mg injections given on the same day once weekly or 3 or 4 days apart | Serious infections (bacterial, mycobacterial, invasive fungal, viral, parasitic, or other opportunistic infections), malignancies, hypersensitivity reactions (allergic reactions and injection site reactions), neurologic events (e.g., demyelinating disease), congestive heart failure |
Golimumab | TNF inhibitor; recombinant human IgG1k monoclonal antibody | Reducing signs and symptoms, inhibiting the progression of structural damage, and improving physical function in adult patients with moderately to severely active PsA; can be used in combination with MTX in patients who do not respond adequately to MTX alone | SC | 50 mg once a month on the same date each month | Serious infections (bacterial, mycobacterial, invasive fungal, viral, parasitic, or other opportunistic infections), malignancies, hypersensitivity reactions (allergic reactions and injection site reactions), neurologic events (e.g., demyelinating disease), congestive heart failure |
Infliximab | TNF inhibitor; recombinant chimeric IgG1k monoclonal antibody | Reduction of signs and symptoms, induction of major clinical response, and inhibition of the progression of structural damage of active arthritis, and improvement in physical function in patients with PsA; can be used with or without MTX | IV | 5 mg/kg given as an IV infusion followed with additional similar doses at 2 and 6 weeks after the first infusion then every 8 weeks thereafter | Serious infections (bacterial, mycobacterial, invasive fungal, viral, parasitic, or other opportunistic infections), malignancies, hypersensitivity reactions (allergic reactions and injection site reactions), neurologic events (e.g., demyelinating disease), congestive heart failure |
DMARD = disease-modifying antirheumatic drug; IgG1 = immunoglobin G1; IgG1k = immunoglobin G1k; IgG4 = immunoglobin G4; IL = interleukin; JAK = Janus kinase; MTX = methotrexate; PP = plaque psoriasis; PsA = psoriatic arthritis; PO = oral; RPLS = reversible posterior leukoencephalopathy syndrome; SC = subcutaneous injection; TB = tuberculosis; TNF = tumour necrosis factor.
Note: Only biologic DMARDs and targeted synthetic DMARDs identified as relevant comparators in the CADTH systematic review are included in this table. Comparators are agents used in the treatment of PsA that are publicly funded. Although tofacitinib is currently not reimbursed by public drug programs in Canada, it was deemed to be a relevant comparator to upadacitinib by the clinical expert consulted for this review.
aHealth Canada–approved indication for condition under review, according to product monographs.
Sources: Health Canada product monographs8,13,18-25 and sponsor’s submission.26
Stakeholder Perspectives
Summary of Patient Group Input
This section was prepared by CADTH staff based on the input provided by patient groups.
About the Patient Group(s) and Information Gathered
Four inputs were submitted for this review from 6 different patient groups: ACE, the CSA, the CAPP in partnership with the CPN, and the CAPA in partnership with the Arthritis Society.
Canada’s largest and longest-running national arthritis patient organization, ACE is headquartered in Vancouver, British Columbia, and has 50,000 members from coast to coast. It provides free, science-based information and education programs to people with arthritis and those who care for and support them.
The CSA is a national not-for-profit organization federally registered in Canada. Its mission is to be the leading voice for the spondyloarthritis community in Canada, raise awareness, and provide support, education and advocacy for patients, caregivers, and health professionals.
The CAPP is a national not-for-profit organization formed to better serve the needs of psoriasis patients across the country. Its mission is to be a resource and advocate for psoriatic patients and their families to improve patient care and quality of life.
The CPN is a national, not-for-profit organization dedicated to improving the quality of life of people in Canada who live with psoriasis and PsA. The CPN does this by providing current information on research and treatment options and by working with others to build awareness and advocacy about the complexities of these conditions.
The CAPA is a grassroots, patient-driven and managed, independent, national education and advocacy organization with members and supporters across Canada. It creates links between Canadians with arthritis, helps them become more effective advocates, and seeks to improve the quality of life of all people living with the disease.
The Arthritis Society is dedicated to a vision of living in a world in which people are free from the devastating effects of arthritis. The Arthritis Society is Canada’s principal health charity, providing education, programs, and support to the more than 6 million Canadians living with arthritis.
Five patient organizations collaborated by collectively developing survey questions using SurveyMonkey for the submitted inputs. The survey was launched by the Arthritis Society and the raw data were shared with all collaborating organizations. Each organization shared the surveys with its respective memberships or patient communities via newsletters, social media channels, and websites. The CSA conducted a telephone interview with 1 patient on upadacitinib (Rinvoq). Notes from this interview were shared with the CAPP, CPN, CAPA, and Arthritis Society.
The survey was translated into French to reach a broader national audience. The surveys were available from December 15, 2020, to January 18, 2021. Overall, there were 85 responses to the English survey and 9 responses to the French survey. Of those who provided their demographic information, 10 respondents were from British Columbia (10.8%), 6 from Alberta (6.5%), 3 from Saskatchewan (3.2%), 17 from Manitoba (19.3%), 30 from Ontario (32.3%), 13 from Quebec (14.0%), 3 from New Brunswick (3.2%), 5 from Nova Scotia (5.4%), and 4 from Newfoundland and Labrador (4.3%). Only 1 response was from someone outside Canada. In addition to PsA, 90.7% of 54 respondents (n = 49) across the 2 surveys indicated they live with psoriasis, 16.7% (n = 9) live with another inflammatory condition, 35.2% (n = 19) also live with another type of arthritis, and 33.3% (n = 18) live with at least 1 other condition, including fibromyalgia, borderline personality disorder, eczema, Raynaud’s syndrome, scoliosis, hypothyroidism, allergies, asthma, high blood pressure, or bladder conditions. Fifty-four respondents provided information about their age across the English and French surveys. These respondents ranged in age from 26 to 80 years old.
In addition, ACE gathered data from 5 patients who completed a patient input survey through SurveyMonkey from December 18, 2020, to January 26, 2021.
Disease Experience
Psoriatic arthritis is an inflammatory disease that causes swelling and pain in multiple joints and can sometimes result in permanent and debilitating joint damage. It is also a systemic disease affecting other parts of the body, including the eyes and heart, and can vary in severity from mild to very severe. There is currently no cure for PsA. Respondents to the survey emphasized pain, stiffness, lack of mobility, and fatigue, which affect their daily living activities, their family lives, and their ability to work and maintain certain hobbies. People can live in constant pain without remission.
When asked about the most significant impacts of PsA on their daily quality of life, respondents from the collaborative input expressed that PsA interfered with social connections (78%), self-esteem (69%), family life (66%), mental health (66%), work (60%), friendships (50%), intimacy (44%), and parenting (15%). Other impacts included embarrassment and self-consciousness from symptoms caused by PsA. Respondents reported difficulty contributing and participating at school or work due to the fatigue, pain, and other symptoms of PsA. The following quotes from respondents illustrate how living with PsA, and its symptoms, affects their lives:
EXTREMELY painful joints. To the point that walking, climbing stairs (to the 2nd floor where the master bedroom was located), etc. was a challenge. Pain killers and NSAIDs were a minimal daily requirement just to get out of bed and make it through the day... Sometimes not being able to go to work because of the pain. When I was first diagnosed with PsA, my son had just been born. I was not even able to do what many fathers do, and take for granted, and that was hold my son up over my head with my arms, smiling up to him as he would be laughing down to me... That was almost 30 years ago. My son passed in March of 2019 and to this day, I still regret not being able to do that simple thing, that “[rite] of passage”... Holding my infant so up in the air. PsA took that from me...
People living with the disease are also at risk of comorbidities, such as depression and mental health issues, diabetes, and cardiovascular disease. For some people, flares can be incapacitating. Due to their unpredictability, flares must be dealt with reactively. According to the joint input from CAPA and the Arthritis Society, the unpredictable nature of PsA may often make it feel like a person is not in control of their disease and can affect their ability to carry out day-to-day activities and life roles, such as contributing to the workplace. The following respondent quote indicates how chronic fatigue influences daily activities:
Chronic fatigue — daily. Worse in the winter than summer months. Energy levels decline dramatically starting 4pm. I am unable to do much socializing after 6pm due to lack of energy. Dinners out are a rare occurrence. Enthesitis — in my wrists, elbows,—. My hands are now weak (I'm 50) that carrying grocery bags is uncomfortable. I take a rolling cart whenever I have to carry more than 5l lbs. Flares — occur when there is hot weather or I have over-exerted myself exercising. This causes the enthesitis to become painful and I experience extreme body aches and fatigue. Like the flu. This lasts 1 to 3 days. Gluten and dairy flares me — so I avoid them in my diet. I normally have to pack food when travelling as it's difficult to find gf [gluten-free] options.
The impact of PsA extends to others within a person’s support circle, including caregivers such as spouses/partners and children. The CAPA and the Arthritis Society note that these people often take on additional chores or tasks such as cooking, cleaning, and shopping to support the person living with PsA, and family roles change as spouses and partners take on more tasks, such as supporting their partners in getting to and from medical appointments. The following are respondent quotes indicating how PsA affects their caregivers: “I'm sick of the Pain and Fatigue!! I feel like a Burden to my Husband!” and “I had struggled with severe pain for 30 plus years, was very hard to do everyday tasks, my son thank god for him was always there to help me as opening a simple bottle of water was at times very hard to even open.”
Patients who submitted input to ACE’s patient survey spoke to the following disease experiences, and certain aspects of the disease that are more important to control than others:
“Was diagnosed with PsA in 2015, but started to show symptoms in mid-eighties.” They experience pain in many joints and require 45 minutes warm-up exercises every morning before their day starts. They also experience big toes problems and have “psoriasis in scalp and on face” that requires lotions.
“Maintaining treatment schedule. Missing treatments, particularly my weekly methotrexate shot catches up with me…aches, stiffness, inflammation.”
Experiences With Currently Available Treatments
Patients living with psoriatic disease often try a succession of treatments throughout their lives. Due to the inflammatory nature of the diseases, treatments that are initially effective can become less effective over time. It is important to note that many people who live with PsA also live with psoriasis. As some drugs are indicated for both diseases, it is not uncommon for people with psoriasis to have some experience taking a treatment indicated for PsA and vice versa. For patients who take treatments for psoriasis, these same treatments can but do not always adequately manage their PsA.
Effective treatments mean that people with PsA do not need to live with the permanent damage, high medical costs (e.g., surgery, mobility aids, and accessible housing), and disability. Early intervention is critical to allow people with PsA the opportunity to fully participate in all aspects of life. Although numerous medication options exist, patients’ responses to medication can vary significantly. As a result, patients need a number of medication options to effectively manage their disease throughout their lives. There are also no specific tests that identify which medication will be effective for a person living with PsA. This means that a person with the disease will need to take 1 or more medications on a trial-and-error basis to find an effective medication. It is also an anxious and stressful experience if medications are not effective and cost thousands of dollars out of pocket. Oftentimes, people with PsA need to make difficult financial choices to pay for their medications.
Of individuals who had taken the treatment and responded to the question from the collaborative input, biologics had the highest proportion of patients, with 50% (18 of 36) indicating the treatment was “very effective” and 22% (n = 8) “mildly effective.” Non-bDMARDs were mildly effective for 36% (16 of 44 respondents) and very effective for 11% (n = 5). For 36% (n = 16) of respondents, DMARDs were either very or mildly ineffective. Nonsteroidal anti-inflammatory drugs were mildly effective for 36% (19 of 53 of respondents) but ineffective for 38% (n = 20), and for 19% (n = 10) there was no difference in symptoms. Forty percent (6 of 15) of those taking leflunomide reported it to be very ineffective, with no respondents reporting it was very effective. Apremilast was very ineffective for 55% of patients (6 of 11 respondents) and mildly effective for 27% (3 of 11 respondents). Tofacitinib was very ineffective for 71% (5 of 7 respondents), with no respondents reporting it to be very or mildly effective.
Many patients have experience with DMARDs. Fifty-four respondents had experience with non-bDMARDs, including combinations containing methotrexate: apremilast (18.5%; n = 10), methotrexate (74.1%, n = 40), azathioprine (0.02%, n = 1), cyclosporine (13.0%, n = 7), hydroxychloroquine (13.0%, n = 7), leflunomide (14.8%, n = 8), sulfasalazine (22.2%, n = 12), and Salazopyrin (0.04%, n = 2). Several respondents had experience with methotrexate and noted a variety of side effects, including nausea, raised liver enzyme levels, headaches, and a sore mouth. Patient experiences with methotrexate include “worsening my brain fog” and “feeling ‘worse’ on it in other ways” are reflected in the following statement:
I've only tried methotrexate and am currently on it. It manages my PsA quite well but I'm still susceptible to joint injuries and cuts and abrasions can still lead to new psoriatic lesions. The side effects I get are poor sleep, nausea, poor balance, mental fog, runny stool, flatulence, and some GI discomfort. The needs not being met by methotrexate are that it doesn't completely put my arthritis into remission and it doesn't completely eliminate my psoriatic lesions. Wishful thinking, I know.
The side effects of sulfasalazine were noted by several respondents. One reported, “I had fever, chills, a horrible hot tingling rash and fatigue, ended up going off all medications including my anti-inflammatory. So I spent 2 weeks [with] no medications and my pain increased more and more each day till I was able to resume my anti-inflammatory…. My PsA remains uncontrolled.” Another noted that “sulphasalazine almost cost me my marriage due to mood swings.”
Cyclosporine was also noted to affect other organs: “When I took cyclosporine my kidney function became a problem. I have not been able to achieve comfort with any treatment.” Some respondents noted that apremilast (Otezla) helped their psoriasis but did not improve their PsA, and came with challenging side effects, including increased heart rate, nausea, diarrhea, depression, and moodiness.
Several respondents also had experience with different biologics, but the benefits do not last forever: “The biologics do a good job until they fail. Then the search is on for the next one that will work” and “on my 5th biologic since 2007.”
According to the input from CSA, new treatment options and different classes of medications fill unmet needs of patients and prescriber. The Rinvoq oral formulation is an exciting option for patients. It provides another option for administration and may help lead to improved adherence and ultimately better outcomes.
The input from CAPA and the Arthritis Society stated that patients may also pursue medical cannabis and/or non-pharmacological approaches to manage PsA symptoms, such as physiotherapy, occupational therapy, massage therapy, counselling, or acupuncture. These approaches can often help address the symptoms of the disease, such as pain and fatigue. However, the patient groups noted that there are significant unmet patient needs in terms of accessing non-pharmacological treatments, often because they are not reimbursed through provincial health care systems, the treatment options are simply not offered, or there are lengthy waits.
Patients identified a number of issues in accessing treatment options. Expense, travel, and time required for treatment were all cited as being prohibitive. Some patients also identified a lack of access to specialists and general practitioners, and/or restrictions associated with the coronavirus disease 2019 pandemic.
One patient who filled out ACE’s patient survey spoke to experiences taking infliximab (Remicade) as an infusion every 7 weeks combined with a weekly dose of methotrexate. They experienced nausea for a couple of days after taking methotrexate and higher levels of fatigue. When asked if there are any needs that are not met by current therapy, this patient stated: “Not for me to say – but many friends and relatives have asked about my treatments and their inability to access them or their acceptance of arthritis/pain as part of getting old.” While this patient had no hardships in accessing current therapies, they added: “But I have private coverage for Remicade, which is roughly $3K every 7 weeks – roughly $21-25,000.”
Improved Outcomes
Through their joint input, the CAPA and the Arthritis Society identified several outcomes that are important to patients with PsA and that should be considered when evaluating new therapies. These include the route of drug administration (oral versus infusion versus self-injections), reduction in pain and fatigue, effectiveness for psoriasis symptoms as well as PsA symptoms, increased mobility, ability to work and be productive at work, ability to carry out activities of daily living, ability to effectively carry out parenting tasks and other important social roles, reduced infection rates, affordability of the medication, and increased quality of life.
People living with PsA shared the following experiences:
“I would hope [a new treatment] would not have side effects and I wish it would work on my psoriasis as well as my arthritis. I would hope to gain more confidence in my appearance (psoriasis plaques lessened) so that I would desire to be more social. Being more social would get me out of the house and more active which would help with the everyday aches and pains of arthritis. It's all linked...you cannot separate the arthritis and the psoriasis. They work together against the body and mind unfortunately.”
“The drug needs to be 8-%+ to be effective. No side effects would be the goal, I have had enough to them. Better quality of life so that the morning you wish you were alive rather than dead. I do mean that literally.”
Experience With Drug Under Review
Of those surveyed in the joint patient survey, 6 respondents indicated that they have experience taking upadacitinib for PsA. Four of these respondents were from Manitoba and 2 were from Quebec. Five indicated that they live with psoriasis. Five of the 6 respondents who have experience with upadacitinib indicated that they have used DMARDs. No patients from ACE’s survey had experience with upadacitinib. When asked about their positive and negative experiences with upadacitinib, 1 of these respondents noted: “[The] only negative [side effect] as mention[ed] before is a feeling of being cold all the time. I have had 80-90% relief of pain.” Another reported that “It has helped a lot with my pain and joint swelling, I really haven’t noticed any side effects. It’s definitely better than the injections I take, I hope that taking this now will prevent worsening problems on my joints as I age. It makes day to day easier and less painful.” A third reported, “Getting up every morning with pain is a challenge! In contrast, with upadacitinib, pain lasts less when you wake up. The look of others, when I had psoriasis on hands was a challenge, now I have beautiful nails and beautiful hands. Maintain[ing] clean[lines] is much easier. Besides, shortness of breath is the only side effect I have observed.”
When asked about the impact of upadacitinib (Rinvoq) on caregivers and their family and their day-to-day activities, these respondents answered with: “Yes. I am able to move more freely and exercise more often,” “I have more energy to do activities with my partner. I had support from my partner, he does the shopping. The support of the research centre team was very important to me, [to address] my anxieties and my fears about the disease,” and “Greater self-esteem and easier to get around.”
The CSA conducted 1 interview with a female patient who has lived with PsA for 30 years, has had severe psoriasis her entire life, and who also had experience with upadacitinib through a clinical trial. Her PsA caused pain and reduced her mobility to the point that she had to retire from her job. Her past medication history included methotrexate, “every topical under the sun,” and 2 biologics that she injected but that were not effective for her. Her experience with upadacitinib was positive: within 2 weeks of beginning treatment, she was able to walk around her home without walking aids and her pain was significantly better. Her skin was almost entirely clear, with the exception of a couple of small spots. She noted no side effects, despite previously being very prone to them and unable to tolerate other medications. She has been able to return to work part-time. She commented that for her, this drug is life-altering, has given her freedom, and she can’t believe how much she can move around and not be in pain all the time.
Additional Information
According to the joint input from CAPP and CPN, PsA is a disease that often “falls through the cracks.” Some patients are seen by a dermatologist while others are seen by rheumatologists. Joint pain is not always discussed with a dermatologist and plaques on the skin are not always discussed with rheumatologists. These challenges often lead to delays in diagnosis and consequently severe and irreversible damage to the joints. Roughly 30% of people with psoriasis will develop PsA. Most (80%) of the time, psoriasis comes first, but it remains difficult to predict whether a person living with psoriasis will later develop PsA, despite research advances that have identified a number of biomarkers associated with PsA and led to predictive screening tools.
The patient input from the CSA states that effective treatments give Canadians the opportunity to regain self-confidence and re-integrate into society and personal relationships. The input from this group noted that, for those yet to find relief, it can be a life of darkness, isolation, and desperation, leaving people spiralling into further depression and anxiousness and robbing them of life. The input emphasized it is important for CADTH take into consideration that many patients over the course of their journey have tried several, and in some cases all, the options currently available.
Clinician Input
Input from Clinical Experts Consulted by CADTH
All CADTH review teams include at least 1 clinical specialist with expertise in the diagnosis and management of the condition for which the drug is indicated. Clinical experts are a critical part of the review team and are involved in all phases of the review process (e.g., providing guidance on the development of the review protocol; assisting in the critical appraisal of clinical evidence; interpreting the clinical relevance of the results; and providing guidance on the potential place in therapy). The following input was provided by 1 clinical specialist with expertise in the diagnosis and management of PsA.
Unmet Needs
There are unmet needs in the treatment of psoriatic disease because some patients may not respond to any treatment, and only a minority achieve MDA. The treatment of PsA involves numerous domains of disease activity, not all of which are likely to be addressed by a single agent. Further durability of any therapy is limited and switching to treatment with a different mechanism of action will be necessary when a patient becomes refractory to current treatment.
Place in Therapy
Most rheumatologists will generally use TNF inhibitors and IL-17 inhibitors before upadacitinib. However, as experience is accrued with upadacitinib, and when safety has been confirmed (i.e., when data show a lack of association with AEs of special interest, such as bowel perforations, venous thromboembolic events, MACEs, and malignancy), it is anticipated that upadacitinib could become a first-line treatment for PsA. The caveat with this assumption is that longer-term observation of patients on upadacitinib will be needed to confirm the durability of efficacy and safety.
In general, oral agents are considered more convenient than therapies administered intravenously or subcutaneously and are expected to demonstrate enhanced adherence to treatment. Upadacitinib would have the advantage of oral administration, which adds further support to its appeal.
Patient Population
Any patient with peripheral joint and skin disease who has not responded to conventional synthetic DMARDs would be eligible for upadacitinib. Studies in spondylitis will address its use in this domain. Currently, some rheumatologists may not prescribe upadacitinib to patients with a recent history of thromboembolic disease, and patients with active infection would also not be treated with this drug. Additional data may reveal other contraindications to therapy.
Assessing Response to Treatment
In clinical practice, the SJC is the most likely measure of response, with a reduction in joint count reflecting a meaningful response. Some rheumatologists may use the achievement of MDA as a meaningful response. Other clinically meaningful responses to treatment may involve patient-reported outcomes such as a health assessment questionnaire, patient’s global assessment, and patient’s assessment of pain; however, these outcomes are subjective and prone to bias. Outcome measures of RCTs are seldom used in clinical practice.
It is expected that benefit from a JAK inhibitor will be readily apparent by week 12, and most rheumatologists will decide whether to continue with therapy at that point.
Discontinuing Treatment
Lack of response and/or side effects will result in a decision to discontinue treatment. Blood tests will be monitored every 1 to 3 months.
Prescribing Conditions
Upadacitinib should be prescribed by specialists who treat PsA. Diagnosis, prescribing of treatment, and continued patient monitoring should be performed by specialists such as rheumatologists who treat PsA.
Clinician Group Input
No registered clinician group input was received for this reimbursement review.
Drug Program Input
The drug programs provide input on each drug being reviewed through CADTH’s reimbursement review processes by identifying issues that may affect their ability to implement a recommendation. The implementation questions and corresponding responses from the clinical experts consulted by CADTH are summarized in Table 4.
Table 4: Summary of Drug Plan Input and Clinical Expert Response
Drug program implementation questions | Clinical expert response |
|---|---|
Would upadacitinib be initiated in patients who have failed previous treatment with a biologic? There may be a desire to switch from biologic therapies to upadacitinib due to the oral route of administration. Would patients who have been successfully treated with a biologic be switched to upadacitinib? | The clinical expert consulted by CADTH for this review indicated that in clinical practice upadacitinib would be initiated in patients who have failed previous treatment with a biologic. However, patients who are successfully treated with biologic therapy should not be switched to upadacitinib. |
Tofacitinib (Xeljanz) is currently not reimbursed for PsA; however, would patients who fail tofacitinib treatment or who were previously treated with tofacitinib be switched to upadacitinib? How are these patients expected to respond? | The clinical expert indicated that patients who are successfully treated with tofacitinib should not switch treatment to upadacitinib. However, patients who fail tofacitinib treatment or who were previously treated with tofacitinib can be treated with upadacitinib; this opinion is based on evidence for patients with rheumatoid arthritis who switched treatment from tofacitinib to baricitinib.27 However, no such evidence is available for patients with PsA, and it is unknown how patients with PsA would respond if they switched from treatment tofacitinib to upadacitinib. |
How would upadacitinib fit into the current treatment paradigm? Would the place in therapy of upadacitinib be the same as that of the biologic DMARDs? | The clinical expert indicated that the place in therapy of upadacitinib would be the same as that of the biologic DMARDs. Due to the ease of use of upadacitinib, upadacitinib might be used as first-line treatment after failing previous treatment with DMARDs. |
Should upadacitinib be prescribed in consultation with a rheumatologist and/or specialist? | The clinical expert indicated that upadacitinib should be prescribed by rheumatologists or non-rheumatologist clinical physicians who have experience treating patients with PsA. |
According to the product monograph, Rinvoq (upadacitinib) has been associated with increases in lipid parameters. The effect of lipid parameter elevations on cardiovascular morbidity and mortality has not been determined. What is the significance of this side effect, particularly in patients being treated for PsA? | The clinical expert does not expect that upadacitinib would have an impact on cardiovascular morbidity and mortality; patients should be treated for their lipid abnormalities according to their risk and the standard of care; however, the full effect of upadacitinib on cardiovascular morbidity and mortality still need to be assessed. |
Should a potential dose escalation beyond 15 mg per day be expected in the indication under review? | Due to safety concerns of serious infection and zoster which increased with the upadacitinib 30 mg dose in comparison with the upadacitinib 15 mg dose, the clinical expert indicated that clinicians would be cautious about dose escalation. The clinical expert also stated that it is not expected that dose escalation beyond 15 mg of upadacitinib once daily would happen in the clinical practice. |
DMARD = disease-modifying antirheumatic drug; PsA = psoriatic arthritis.
Clinical Evidence Selection
The clinical evidence included in the review of upadacitinib is presented in 3 sections. The first section, the systematic review, includes pivotal studies provided in the sponsor’s submission to CADTH and Health Canada, as well as those studies selected according to an a priori protocol. The second section includes indirect evidence from the sponsor and indirect evidence selected from the literature that met the selection criteria specified in the review. The third section includes sponsor-submitted long-term extension studies and additional relevant studies that were considered to address important gaps in the evidence included in the systematic review.
Systematic Review (Pivotal and Protocol-Selected Studies)
Objectives
To perform a systematic review of the beneficial and harmful effects of upadacitinib 15 mg oral extended-release tablets as monotherapy or in combination with non-bDMARDs for the treatment of active PsA in adult patients who have responded inadequately or who are intolerant to 1 or more DMARDs.
Methods
Studies selected for inclusion in the systematic review include pivotal studies provided in the sponsor’s submission to CADTH and Health Canada, as well as those meeting the selection criteria presented in Table 5. Outcomes included in the CADTH review protocol reflect outcomes considered important by patients, clinicians, and drug plans.
The systematic review protocol was established before the granting of a Notice of Compliance from Health Canada.
Table 5: Inclusion Criteria for the Systematic Review
Criteria | Description |
|---|---|
Patient population | Adult patients with active PsA, who have responded inadequately to, or are intolerant to, 1 or more DMARDs. Subgroups of interest:
|
Intervention | Upadacitinib 15 mg orally once daily As monotherapy or in combination with non-biologic DMARDs |
Comparators | bDMARDs
tsDMARDs
|
Outcomes | Efficacy outcomes
Harms outcomes
|
Study design | Published and unpublished phase III and IV RCTs |
ACR = American College of Rheumatology; ACR20 = American College of Rheumatology 20% improvement in rheumatoid arthritis; ACR50 = American College of Rheumatology 50% improvement in rheumatoid arthritis; ACR70 = American College of Rheumatology 70% improvement in rheumatoid arthritis; AE = adverse events; bDMARD = biologic disease-modifying antirheumatic drug; CPK = creatine phosphokinase; csDMARD = conventional synthetic disease-modifying antirheumatic drug; DAS28 = Disease Activity Score 28; DMARD = disease-modifying antirheumatic drug; HAQ-DI = Health Assessment Questionnaire–Disability Index; IL = interleukin; JAK = Janus kinase; MACE = major adverse cardiovascular events; MDA = minimal disease activity; PASI 75 = 75% reduction in Psoriasis Area Severity Index score; PASI 90 = 90% reduction in Psoriasis Area Severity Index score; PE = pulmonary embolism; PsA = psoriatic arthritis; PsAQoL = Psoriatic Arthritis Quality of Life; PsARC = Psoriatic Arthritis Response Criteria; RCT = randomized controlled trial; SAE = serious adverse events; SF-36 = Short Form (36) Health Survey; TB = tuberculosis; TNF = tumour necrosis factor; VTE = venous thromboembolism; WDAE = withdrawal due to adverse events.
aTofacitinib is currently not reimbursed by public drug programs in Canada; however, it was deemed to be a relevant comparator to upadacitinib by the clinical expert(s) consulted for this review.
The literature search for clinical studies was performed by an information specialist using a peer-reviewed search strategy according to the Peer Review of Electronic Search Strategies checklist (https://www.cadth.ca/resources/finding-evidence/press).28
Published literature was identified by searching the following bibliographic databases: MEDLINE All (1946‒) via Ovid and Embase (1974‒) via Ovid. The search strategy comprised both controlled vocabulary, such as the National Library of Medicine’s MeSH (Medical Subject Headings), and keywords. The main search concept was upadacitinib (Rinvoq). Clinical trials registries searched included the US National Institutes of Health’s clinicaltrials.gov, WHO’s International Clinical Trials Registry Platform (ICTRP) search portal, Health Canada’s Clinical Trials Database, and the European Union Clinical Trials Register.
No filters were applied to limit the retrieval by study type. Retrieval was not limited by publication date or by language. Conference abstracts were excluded from the search results. Appendix 1 provides detailed search strategies.
The initial search was completed on February 1, 2021. Regular alerts updated the search until the meeting of the CADTH Canadian Drug Expert Committee on June 16, 2021.
Grey literature (literature that is not commercially published) was identified by searching relevant websites from the Grey Matters: A Practical Tool For Searching Health-Related Grey Literature checklist.29 Included in this search were the websites of regulatory agencies (FDA and European Medicines Agency). Google was used to search for additional internet-based materials. See Appendix 1 for more information on the grey literature search strategy. These searches were supplemented by reviewing bibliographies of key papers and through contacts with appropriate experts. In addition, the manufacturer of the drug was contacted for information regarding unpublished studies.
Two CADTH clinical reviewers independently selected studies for inclusion in the review based on titles and abstracts, according to the predetermined protocol. Full-text articles of all citations considered potentially relevant by at least 1 reviewer were acquired. Reviewers independently made the final selection of studies to be included in the review, and differences were resolved through discussion.
A focused literature search for NMAs dealing with PsA was run in MEDLINE All (1946–) on February 1, 2021.
Findings From the Literature
A total of 2 studies were identified from the literature for inclusion in the systematic review (Figure 1). The included studies are summarized in Table 6. A list of excluded studies is presented in Appendix 2.
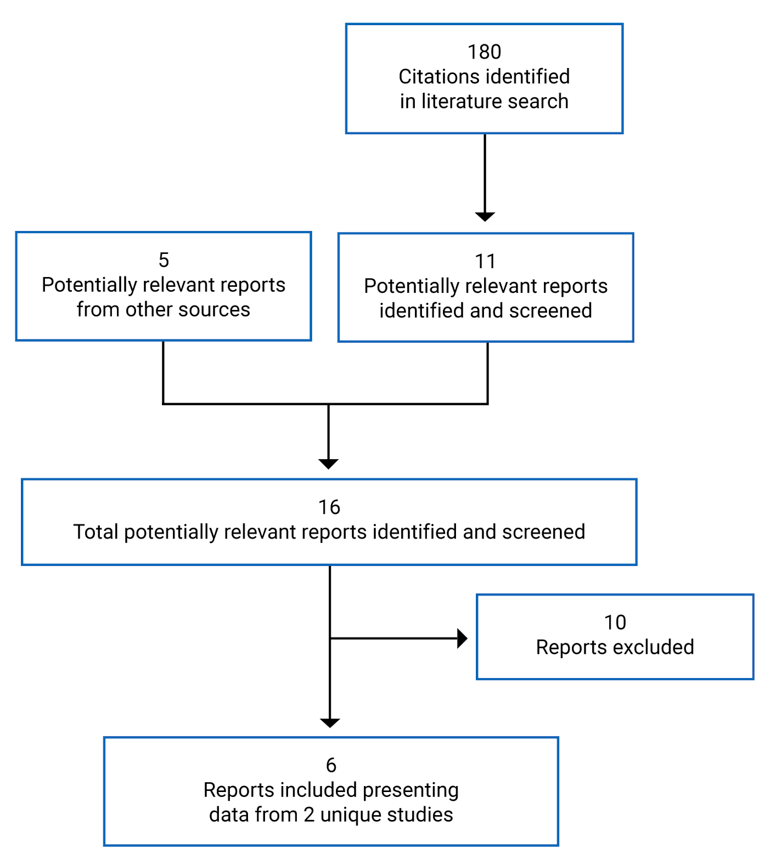
Table 6: Details of Included Studies
Detail | SELECT-PsA1 | SELECT-PsA2 |
|---|---|---|
Designs and populations | ||
Study design | Phase III, double-blind, multi-centre, active and placebo-controlled RCT | Phase III, double-blind, multi-centre, placebo-controlled RCT |
Locations | 281 sites in 44 countries across Canada, US, South America, Europe, Asia, and Australasia 6 Canadian sites (39 Canadian patients) participated in this trial | 123 sites in 16 countries across and including Canada, US, South America, Europe, Japan, and New Zealand 5 Canadian sites (17 Canadian patients) participated in this trial |
Patient randomization dates | April 27, 2017, to June 28, 2019 | May 1, 2017, to April 24, 2019 |
Randomized (N) | 1,705 | 642 |
Inclusion criteria |
|
|
Exclusion criteria | • Prior exposure to biologic immunomodulators • Prior exposure JAK inhibitor • Current treatment with > 2 non-biologic DMARDs or use of DMARDs other than MTX, SSZ, LEF, apremilast, HCQ, bucillamine, or iguratimod, or use of MTX in combination with LEF • History of fibromyalgia, any arthritis with onset before age 17 years, or current diagnosis of inflammatory joint disease other than PsAd • Extra-articular manifestations of PsA (e.g., psoriasis, uveitis, IBD) not clinically stable for ≥ 30 days • Current or past history of infectione • History of cardiovascular conditions (NYHA class III or IV CHF; recent CVA, myocardial infarction or coronary stent; uncontrolled hypertension) • History of GI perforation or diverticulitis • History of malignancyf • History of demyelinating disease (e.g., MS) • Use of concomitant psoriasis treatmentg | • Prior exposure JAK inhibitor • Current treatment with > 2 non-biologic DMARDs or use of DMARDs other than MTX, SSZ, LEF, apremilast, HCQ, bucillamine or iguratimod, or use of MTX in combination with LEF • History of fibromyalgia, any arthritis with onset before age 17 years, or current diagnosis of inflammatory joint disease other than PsAd • Extra-articular manifestations of PsA (e.g., psoriasis, uveitis, IBD) not clinically stable for ≥ 30 days • Current or past history of infectione • History of cardiovascular conditions (NYHA class III or IV CHF; recent CVA, myocardial infarction or coronary stent; uncontrolled hypertension) • History of GI perforation or diverticulitis • History of malignancyf • Use of concomitant psoriasis treatmentg |
Drugs | ||
Intervention |
|
|
Comparator(s) |
|
|
Duration | ||
Phase | ||
Screening | 35 days | 35 days |
Blinded period | 56 weeks (double-blind for 24 weeks) | 56 weeks (double-blinded for 24 weeks) |
Long-term extension | Up to 5 years | Up to 3 years |
Follow-up | At 30 days (call or visit) and 70 days (call) | At 30 days (call or visit) |
Outcomes | ||
Primary end point | Proportion of patients achieving ACR20 at week 12 | Proportion of patients achieving ACR20 at week 12 |
Secondary and exploratory end points | Key secondary end points
| Key secondary end points • Week 2 o ACR20
|
Additional end points |
|
|
Additional end points |
|
|
Notes | ||
Publications | McInnes et al. (2021)30 | |
ACR = American College of Rheumatology; ACR20 = American College of Rheumatology 20% improvement in rheumatoid arthritis; ACR50 = American College of Rheumatology 50% improvement in rheumatoid arthritis; ACR70 = American College of Rheumatology 70% improvement in rheumatoid arthritis; ASDAS = Ankylosing Spondylitis Disease Activity Score; BASDAI = Bath Ankylosing Spondylitis Disease Activity Index; bDMARD = biologic disease-modifying antirheumatic drug; BSA = body surface area; CASPAR = Classification Criteria for Psoriatic Arthritis; CHF = congestive heart failure; CRP = C-reactive protein; CVA = cerebrovascular accident; DAPSA = Disease Activity Index for Psoriatic Arthritis; DAS28 = Disease Activity Score 28; DMARD = disease-modifying antirheumatic drug; EQ-5D-5L = EuroQol 5-Dimensions 5-Levels questionnaire; ESR = erythrocyte sedimentation rate; FACIT-F = Functional Assessment of Chronic Illness Therapy–Fatigue; GI = gastrointestinal; HAQ-DI = Health Assessment Questionnaire–Disability Index; HCQ = hydroxychloroquine; HRU = Health Resource Utilization; hs-CRP = high-sensitivity C-reactive protein; IBD = inflammatory bowel disease; JAK = Janus kinase; LDI = Leeds Dactylitis Index; LEF = leflunomide; LEI = Leeds Enthesitis Index; MDA = minimal disease activity; MS = multiple sclerosis; MTX = methotrexate; NRS = Numerical Rating Scale; NYHA = New York Heart Association; PASDAS = Psoriasis Disease Activity Score; PASI 75 = 75% reduction in Psoriasis Area Severity Index score; PASI 90 = 90% reduction in Psoriasis Area Severity Index score; PASI 100 = 100% reduction in Psoriasis Area Severity Index score PCS = physical component summary; PO = orally; PsA = psoriatic arthritis; PsARC = Psoriatic Arthritis Response Criteria; RCT = randomized controlled trial; SAPS = Self-Assessment of Psoriasis Symptoms; SC = subcutaneously; SF-36 = Short Form (36) Health Survey; SHS = Sharp/van der Heijde Score; sIGA = static Investigator Global Assessment; SPARCC = Spondyloarthritis Research Consortium of Canada; SSZ = sulfasalazine; ULN = upper limit of normal; WPAI = Work Productivity and Activity Impairment.
Note: Four additional reports were included from the sponsor’s submission package (SELECT-PsA1: Clinical Study Report for week 249 and week 5633; SELECT-PsA2: Clinical Study Report for week 2410 and week 5611).
aInadequate response defined as lack of efficacy after a minimum of 12 weeks of therapy, with prior non-bDMARD given at the maximally tolerated dosage, or up to the following dosages: MTX (≤ 25 mg weekly), SSZ (≤ 3,000 mg daily), LEF (≤ 20 mg daily), apremilast (≤ 60 mg daily), HCQ (≤ 400 mg daily), bucillamine (≤ 300 mg daily), and iguratimod (≤ 50 mg daily). Inadequate response to MTX is defined as between 15 mg per week and ≤ 25 mg per week; or at least 10 mg per week in patients who are intolerant of MTX at dosages greater than or equal to 12.5 mg per week after complete titration. For patients in China, Korea, Malaysia, Singapore, Hong Kong (China), Taiwan, and Japan, inadequate response to MTX is defined as at least 7.5 mg per week.
bMaximum dosages defined as: MTX (≤ 25 mg per week), SSZ (≤ 3,000 mg daily), leflunomide (LEF) (≤ 20 mg daily), apremilast (≤ 60 mg daily), HCQ (≤ 400 mg daily), bucillamine (≤ 300 mg daily), and iguratimod (≤ 50 mg daily). In the SELECT-PsA1 trial, no more than approximately 15% of patients with concomitant use of HCQ, sulfasalazine, bucillamine, or iguratimod were enrolled. The use of MTX in combination with LEF was not allowed.
cIn SELECT-PsA2, no more than approximately 40% of patients with less than 3% BSA extent of psoriasis, and no more than approximately 30% of patients with prior failure of more than 1 bDMARD were enrolled.
dInflammatory joint disease included, but was not limited to, rheumatoid arthritis, gout, overlap connective tissue diseases, scleroderma, polymyositis, dermatomyositis, and systemic lupus erythematosus. Prior history of reactive arthritis or axial spondyloarthritis, including ankylosing spondylitis and non-radiographic axial spondyloarthritis, was permitted if documentation of change in diagnosis to PsA or additional diagnosis of PsA was made.
eIncludes recurrent or disseminated (even a single episode) of herpes zoster, disseminated (even a single episode) of herpes simplex, active tuberculosis, or active infection(s) requiring parenteral anti-infectives within 30 days or oral anti-infectives within 14 days before baseline visit.
fExcept for successfully treated non-melanoma skin cancer or localized carcinoma in situ of the cervix.
gIncludes oral retinoids within 4 weeks of baseline visit; topical treatments within 2 weeks of baseline visit (except low-potency topical corticosteroids on palms, soles, face, inframammary area, and groin only).
Source: SELECT-PsA1 Clinical Study Report,9 SELECT-PsA2 Clinical Study Report,10 SELECT-PsA2 Week 56 Clinical Study Report,11 and sponsor’s response to additional information request.34,35
Description of Studies
Two phase III, multi-centre, double-blind RCTs met the inclusion criteria for this systematic review.9,10 The study designs of SELECT-PsA1 and SELECT-PsA2 are shown in Figure 2 and Figure 3. Both SELECT-PsA1 and PsA2 were funded by AbbVie, Inc.
Both SELECT studies enrolled adults with moderate to severely active PsA who had been previously treated with a DMARD; however, patients enrolled in PsA1 were bDMARD-naive. A screening period running 35 days before randomization was used to assess patients’ eligibility, during which their medical history, treatment history, and current medical condition were assessed, and relevant laboratory tests including tuberculosis skin tests and radiographic examinations were performed. Both studies consisted of 2 periods, and at the end of period 1, all patients on placebo were switched to upadacitinib. In SELECT-PsA1, period 1 lasted for 56 weeks and included a 24-week double-blind placebo and active comparator–controlled period followed by 32 weeks of blinded active comparator–controlled treatment. In SELECT-PsA2, period 1 was also 56 weeks in duration and included 24 weeks of a double-blinded placebo-controlled phase, followed by 32 weeks of a non-comparative treatment phase. Period 2 is an ongoing open-label long-term extension for up to approximately 5 years in PsA1 and 3 years in PsA2.
The primary objective of period 1 in SELECT-PsA1 was to compare the efficacy of upadacitinib versus placebo and versus adalimumab for the treatment of signs and symptoms of moderately to severely active PsA in patients who have an inadequate response or are intolerant to at least 1 non-bDMARD. Prevention of structural progression and safety were secondary objectives. The objective for period 1 in SELECT-PsA2 was to compare the efficacy and safety of upadacitinib versus placebo for the treatment of signs and symptoms of moderately to severely active PsA in patients who had an inadequate response or are intolerant to at least 1 bDMARD. The objective of period 2 in both SELECT studies was to evaluate the long-term safety, tolerability, and efficacy of upadacitinib in patients who completed period 1. In both studies, period 1 was designed to test the superiority of upadacitinib versus placebo in achieving the primary end point (ACR20 at week 12) and other efficacy parameters at week 12 to 24. In addition, period 1 in PsA1 was designed to test the noninferiority of upadacitinib versus adalimumab (ACR20 at week 12). Results from both studies were presented using interim analyses, with a data cut-off of December 13, 2019, for PsA1 and October 9, 2019, for PsA2. At data cut-off, all patients had completed week 24 of period 1 or had discontinued from the study. Both studies are ongoing.
In SELECT-PsA1 (N = 1,705), eligible participants were randomized after the screening phase in a 2:2:2:1:1 ratio to 1 of 5 treatment groups: upadacitinib 15 mg orally once daily, upadacitinib 30 mg orally once daily, adalimumab 40 mg subcutaneous every other week, and placebo followed by either upadacitinib 15 mg daily or upadacitinib 30 mg daily (Figure 2). Randomization was performed through a centralized interactive voice response system and stratified by extent of psoriasis (≥ 3% BSA or < 3% BSA), current use of at least 1 DMARD, presence of dactylitis, and presence of enthesitis. The exception was for patients from China or Japan, where randomization was stratified only by the extent of psoriasis.
In SELECT-PsA2 (N = 642), eligible participants were randomized after the screening phase in a 2:2:1:1 ratio to 1 of 4 treatment groups: upadacitinib 15 mg orally once daily, upadacitinib 30 mg orally once daily, and placebo followed by either upadacitinib 15 mg daily or upadacitinib 30 mg daily (Figure 3). Randomization was performed through a centralized interactive voice response system and stratified by extent of psoriasis (≥ 3% or < 3% BSA), current use of at least 1 DMARD, and number of prior failed (i.e., inadequate response to) bDMARDs (1 versus > 1). The exception was for patients from China or Japan, where randomization was stratified only by the extent of psoriasis.
In both SELECT-PsA1 and SELECT-PsA2, at week 24, patients randomized to placebo at the start of the study were switched to pre-assigned upadacitinib 15 mg or 30 mg daily in a 1:1 ratio, regardless of response. Patients, study-site personnel, the investigator, and the sponsor study team were blinded to study drug assignment, until all patients completed the week 24 visit. Thereafter, an unblinded analysis was conducted by the sponsor but the individual investigators, study sites, and patients remained blinded. When the last patient completed the last visit of period 1 (week 56), the study drug assignments were unblinded and treatment was continued in an open-label manner until the end of period 2.
Starting at week 36 in both studies, patients who did not show an improvement of at least 20% from baseline in either or both TJC and SJC at 2 consecutive visits were discontinued from study treatment but had the option of continuing to participate in the study for continued follow-up.
The primary end point for both SELECT-PsA1 and SELECT-PsA2 was the proportion of patients who achieve an ACR20 at week 12. The Health Canada–approved indication is for upadacitinib 15 mg once daily. Data from the SELECT studies for the 30 mg dose are not presented in this review.
Figure 2: Study Design for SELECT-PsA1
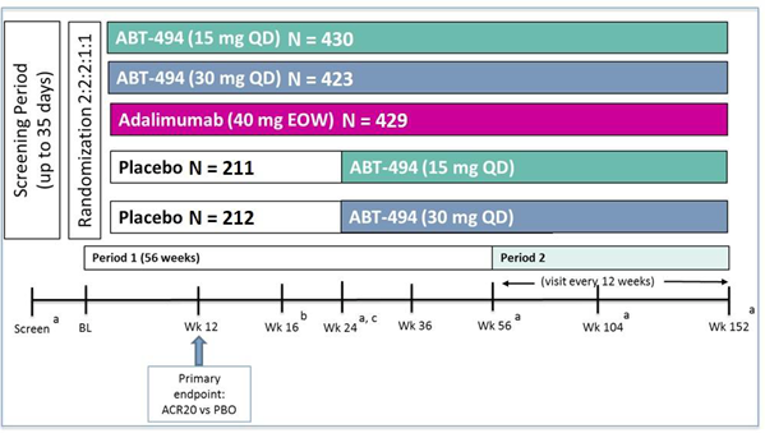
ABT-494 = upadacitinib; ACR20 = American College of Rheumatology 20% improvement in rheumatoid arthritis; BL = baseline; e.o.w. = every other week; PBO = placebo; QD = once daily; vs = versus; Wk = week.
Note: Sample sizes represent the actual number of patients randomized to each treatment sequence.
a All patients received X-rays of hands and feet at screening, week 24, week 56, week 104, week 152, and at premature discontinuation.
b At week 16, rescue therapy was offered to patients classified as nonresponders (defined as not achieving an improvement of at least 20% in either or both tender joint count and swollen joint count at both week 12 and week 16).
c At week 24, all placebo patients were switched to upadacitinib 15 mg once daily or 30 mg once daily (1:1 ratio) regardless of response.
Source: SELECT-PsA1 Clinical Study Report.9
Figure 3: Study Design for SELECT-PsA2
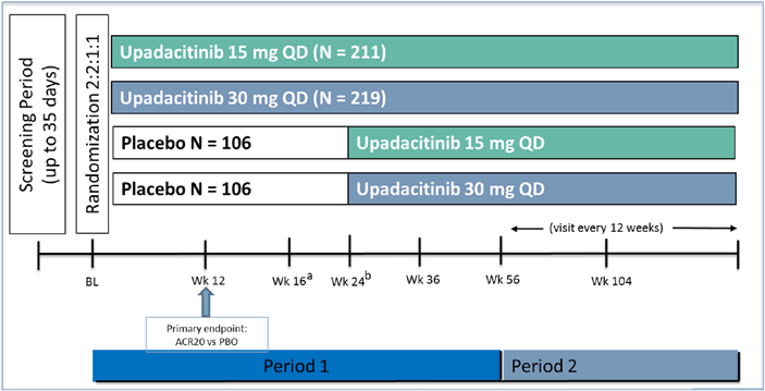
ACR20 = American College of Rheumatology 20% improvement in rheumatoid arthritis; BL = baseline; PBO = placebo; QD = once daily; vs = versus; Wk = week.
a At week 16, rescue therapy was offered to patients classified as nonresponders (defined as not achieving an improvement of at least 20% in either or both tender joint count and swollen joint count at both week 12 and week 16).
b At week 24, all placebo patients switched to upadacitinib 15 mg once daily or 30 mg once daily (1:1 ratio) regardless of response.
Source: SELECT-PsA2 Clinical Study Report.10
Populations
Inclusion and Exclusion Criteria
To be eligible for both SELECT-PsA1 and SELECT-PsA2, patients were required to be at least 18 years of age and have an established diagnosis of PsA with at least 3 tender joints and 3 swollen joints. The patients were required to have active or a documented history of plaque psoriasis. Patients enrolled in SELECT-PsA1 were also required to exhibit either 1 or more examples of erosion on X-ray, or hs-CRP levels greater than the ULN. Patients in PsA1 were bDMARD-naive but had been previously treated with at least 1 non-bDMARD. Patients in PsA2 were all bDMARD-experienced.
Patients were excluded if they had prior exposure to a JAK inhibitor, were on concomitant treatment for psoriasis, or were receiving more than 2 concurrent non-bDMARDs at baseline. Patients on concomitant non-biologic treatment must have been on a stable dose for at least 4 weeks. The use of methotrexate in combination with leflunomide was also not permitted. Patients with extra-articular manifestation of PsA who were not clinically stable for 30 days or longer were excluded. In SELECT-PsA1, patients were also excluded if they had prior exposure to biologic immunomodulators or a history of demyelinating disease.
Baseline Characteristics
Across both studies, in the treatment groups of interest to this review, the mean age ranged from 50 to 54 years, and the majority of patients were White. The mean duration of PsA diagnosis was shorter in the SELECT-PsA1 trial and ranged from 5.9 to 6.2 years in SELECT-PsA1 and from 9.6 to 11.0 years in SELECT-PsA2. The mean TJCs were 20 in SELECT-PsA1 and 25 in SELECT-PsA2. The mean SJC was between 11 and 12 in both SELECT-PsA1 and SELECT-PsA2. The proportion of patients with psoriasis affecting 3% or more of their BSA was lower in SELECT-PsA1 (50%) than in SELECT-PsA2 (61%). Enthesitis at baseline was reported in 77% of patients in SELECT-PsA1 and 82% of patients in SELECT-PsA2, while dactylitis at baseline was reported in 30% to 32% of patients in SELECT-PsA1 and ranged from 26% to 30% of patients in SELECT-PsA2. Patients in SELECT-PsA1 had a lower mean LDI baseline score, ranging from 88 to 99, compared to patents in SELECT-PsA2, who had a baseline score of between 96 and 124. In SELECT-PsA1, more than 99% of patients had received a prior non-bDMARD compared to 74% to 81% of patients in SELECT-PsA2, and most patients had received methotrexate. In SELECT-PsA1, most patients (91%) were enrolled due to inadequate response to prior non-bDMARDs (including patients who had lack of efficacy as well as those who had both a lack of efficacy and intolerance), whereas 7% were enrolled due to an intolerance or contraindication to non-bDMARDs.35 As per protocol, 100% of patients in SELECT-PsA2 had received a prior bDMARD; most (62%) had failed 1 prior biologic treatment, whereas 8% were enrolled due to an intolerance to a bDMARD. At baseline, more patients in SELECT-PsA1 were concurrently using a non-bDMARD (81% to 82%) compared to patients enrolled in SELECT-PsA2 (46 to 47%).
The baseline demographic and disease characteristics were generally similar across the treatment groups within SELECT-PsA1 and SELECT-PsA2. There were some minor imbalances between the treatment groups in PsA2; for example, the placebo group had a slightly higher mean LDI (124.19 versus 96.27 for the upadacitinib 15 mg group) and sIGA score of 0 (8.0% versus 4.3% for upadacitinib 15 mg), and a larger share of patients who had received no prior non-bDMARD (25.9% versus 19.4% for upadacitinib 15 mg). A slightly higher proportion of patients in the upadacitinib 15 mg group had a baseline sIGA score of 2 compared to patients in the placebo group (27.8% versus 38.9% upadacitinib 15 mg group).
Table 7: Summary of Baseline Characteristics — Full Analysis Set
Characteristic | SELECT-PsA1 | SELECT-PsA2 | |||
|---|---|---|---|---|---|
PBO (n = 423) | ADA 40 mg (n = 429) | UPA 15 mg (n = 429) | PBO (n = 212) | UPA 15 mg (n = 211) | |
Age (years), mean (SD) | 50.4 (12.21) | 51.4 (12.04) | 51.6 (12.19) | 54.1 (11.53) | 53.0 (12.02) |
Male, n (%) | 212 (50.1) | 207 (48.3) | 191 (44.5) | 92 (43.4) | 98 (46.4) |
Race | |||||
White | 377 (89.1) | 375 (87.4) | 386 (90.0) | 186 (87.7) | 183 (86.7) |
Black or African American | 3 (0.7) | 2 (0.5) | 1 (0.2) | 7 (3.3) | 5 (2.4) |
American Indian/Alaska Native | 2 (0.5) | 2 (0.5) | 0 | 0 | 3 (1.4) |
Native Hawaiian or other Pacific Islander | 1 (0.2) | 2 (0.5) | 0 | 1 (0.5) | 1 (0.5) |
Asian | 37 (8.7) | 41 (9.6) | 37 (8.6) | 17 (8.0) | 19 (9.0) |
Multiple | 3 (0.7) | 7 (1.6) | 5 (1.2) | 1 (0.5) | 0 |
Weight (kg), mean (SD) | 87.4 (21.36) | 87.8 (21.90) | 84.8 (18.89) | 90.0 (23.02) | 89.3 (23.56) |
BMI (kg/m2), mean (SD) | 30.4 (6.79) | 30.7 (7.24) | 30.1 (6.40) | 31.8 (7.47) | 31.5 (7.37) |
Duration of PsA diagnosis (years), mean (SD) | 6.2 (7.01) | 5.9 (7.06) | 6.2 (7.41) | 11.0 (10.33) | 9.6 (8.36) |
Joint counts, mean (SD) | |||||
Tender join count 68 | 20.0 (14.34) | 20.1 (13.82) | 20.4 (14.72) | 25.3 (17.62) | 24.9 (17.27) |
Swollen joint count 66 | 11.0 (8.16) | 11.6 (8.75) | 11.6 (9.31) | 12.0 (8.85) | 11.3 (8.19) |
Presence of ≥ 1 erosion, n (%) | |||||
Yes | 161 (38.1) | 183 (42.7) | 165 (38.5) | NR | NR |
No | 227 (53.7) | 218 (50.8) | 241 (56.2) | NR | NR |
Missing | 35 (8.3) | 28 (6.5) | 23 (5.4) | NR | NR |
hs-CRP > ULN,a n (%) | 324 (76.6) | 308 (71.8) | 324 (75.5) | 121 (57.1) | 126 (59.7) |
hs-CRP (mg/L), mean (SD) | 11.48 (15.80) | 10.91 (15.46) | 11.00 (14.91) | 10.40 (18.46) | 11.16 (18.55) |
BSA psoriasis | |||||
< 3% | 212 (50.1) | 218 (50.8) | 215 (50.1) | 81 (38.2) | 81 (38.4) |
≥ 3% | 211 (49.9) | 211 (49.2) | 214 (49.9) | 131 (61.8) | 130 (61.6) |
PASDAS, n | 421 | 428 | 425 | 209 | 207 |
Mean (SD) | 6.18 (1.06) | 6.15 (1.03) | 6.31 (1.05) | 6.38 (1.22) | 6.26 (1.07) |
DAS28 (CRP) | 421 | 428 | 425 | 209 | 208 |
Mean (SD) | 4.90 (1.01) | 4.88 (1.06) | 4.94 (1.05) | 5.15 (1.03) | 5.14 (0.99) |
Patient's assessment of pain NRS, n | 421 | 428 | 425 | 209 | 208 |
Mean (SD) | 6.1 (2.14) | 6.0 (2.08) | 6.2 (2.07) | 6.6 (2.12) | 6.4 (2.13) |
HAQ-DI, n | 421 | 428 | 425 | 209 | 208 |
Mean (SD) | 1.12 (0.64) | 1.12 (0.63) | 1.15 (0.65) | 1.23 (0.69) | 1.10 (0.61) |
PASI (for baseline BSA psoriasis ≥ 3%), n | 211 | 211 | 214 | 131 | 130 |
Mean (SD) | 11.21 (11.43) | 9.42 (8.54) | 9.78 (9.95) | 11.68 (11.43) | 10.13 (9.20) |
SHS, n | 388 | 401 | 406 | NR | NR |
Mean (SD) | 13.32 (31.21) | 14.97 (38.87) | 13.14 (42.45) | NR | NR |
BASDAI (patients with psoriatic spondylitis), n | 130 | 125 | 138 | 74 | 75 |
Mean (SD) | 5.81 (1.86) | 5.69 (2.19) | 5.94 (2.03) | 6.54 (1.88) | 5.90 (2.14) |
Presence of dactylitis (LDI > 0), n (%) | 126 (29.8) | 127 (29.6) | 136 (31.7) | 64 (30.2) | 55 (26.1) |
LDI (for baseline LDI > 0), n | 126 | 127 | 136 | 64 | 55 |
Mean (SD) | 87.65 (114.76) | 99.00 (163.11) | 88.99 (106.50) | 124.19 (178.76) | 96.27 (97.87) |
Presence of enthesitis (total count > 0), n (%)b | 322 (76.1) | 330 (76.9) | 333 (77.6) | 173 (81.6) | 173 (82.0) |
LEI (for baseline LEI > 0), n | 241 | 265 | 270 | 144 | 133 |
Mean (SD) | 2.7 (1.52) | 2.5 (1.42) | 2.6 (1.55) | 3.3 (1.70) | 3.0 (1.64) |
sIGA of psoriasis score, n (%) | |||||
0 | 24 (5.7) | 34 (7.9) | 34 (7.9) | 17 (8.0) | 9 (4.3) |
1 | 86 (20.3) | 65 (15.2) | 73 (17.0) | 32 (15.1) | 31 (14.7) |
2 | 167 (39.5) | 181 (42.2) | 170 (39.6) | 59 (27.8) | 82 (38.9) |
3 | 119 (28.1) | 132 (30.8) | 133 (31.0) | 88 (41.5) | 78 (37.0) |
4 | 27 (6.4) | 17 (4.0) | 19 (4.4) | 16 (7.5) | 11 (5.2) |
Any prior non-bDMARD use, n (%) | 423 (100) | 427 (99.5) | 428 (99.8) | 157 (74.1) | 170 (80.6) |
Number of prior non-bDMARDs, n (%) | 26 (6.1) | 27 (6.3) | 31 (7.2) | NR | NR |
0 | 0 | 2 (0.5) | 1 (0.2) | 55 (25.9) | 41 (19.4) |
1 | 274 (64.8) | 286 (66.7) | 274 (63.9) | 103 (48.6) | 109 (51.7) |
2 | 105 (24.8) | 112 (26.1) | 112 (26.1) | 40 (18.9) | 45 (21.3) |
≥ 3 | 44 (10.4) | 29 (6.8) | 42 (9.8) | 14 (6.6) | 16 (7.6) |
Intolerant to prior non-bDMARD | 26 (6.1) | 27 (6.3) | 31 (7.2) | NR | NR |
Any prior bDMARD use, n (%) | NR | NR | NR | 212 (100) | 211 (100) |
Number of prior bDMARDs, n (%) | |||||
0 | NR | NR | NR | 0 | 0 |
1 | NR | NR | NR | 133 (62.7) | 118 (55.9) |
2 | NR | NR | NR | 39 (18.4) | 44 (20.9) |
≥ 3 | NR | NR | NR | 40 (18.9) | 49 (23.2) |
Number of prior anti-TNFs, n (%) | |||||
0 | NR | NR | NR | 45 (21.2) | 50 (23.7) |
1 | NR | NR | NR | 106 (50.0) | 92 (43.6) |
2 | NR | NR | NR | 42 (19.8) | 41 (19.4) |
≥ 3 | NR | NR | NR | 19 (9.0) | 28 (13.3) |
Number of prior bDMARDs other than anti-TNF, n (%) | |||||
0 | NR | NR | NR | 124 (58.5) | 109 (51.7) |
1 | NR | NR | NR | 79 (37.3) | 92 (43.6) |
2 | NR | NR | NR | 7 (3.3) | 7 (3.3) |
≥ 3 | NR | NR | NR | 2 (0.9) | 3 (1.4) |
Number of prior failed bDMARDs, n (%) | |||||
0 | NR | NR | NR | 18 (8.5) | 16 (7.6) |
1 | NR | NR | NR | 135 (63.7) | 126 (59.7) |
2 | NR | NR | NR | 35 (16.5) | 35 (16.6) |
≥ 3 | NR | NR | NR | 24 (11.3) | 34 (16.1) |
Use of ≥ 1 non-bDMARD at baseline, n (%) | 347 (82.0) | 347 (80.9) | 353 (82.3) | 100 (47.2) | 98 (46.4) |
Use of non-bDMARD at baseline, n (%) | |||||
MTX alone | 267 (63.1) | 270 (62.9) | 279 (65.0) | 75 (35.4) | 74 (35.1) |
MTX + other non-bDMARD | 26 (6.1) | 16 (3.7) | 20 (4.7) | 7 (3.3) | 6 (2.8) |
Non-bDMARD other than MTX | 54 (12.8) | 61 (14.2) | 54 (12.6) | 18 (8.5) | 18 (8.5) |
None | 76 (18.0) | 82 (19.1) | 76 (17.7) | 112 (52.8) | 113 (53.6) |
Use of NSAID at baseline, n (%) | 275 (65.0) | 279 (65.0) | 263 (61.3) | 125 (59.0) | 124 (58.8) |
Use of corticosteroid at baseline, n (%) | 70 (16.5) | 72 (16.8) | 73 (17.0) | 24 (11.3) | 22 (10.4) |
ADA = adalimumab; BASDAI = Bath Ankylosing Spondylitis Disease Activity Index; bDMARD = biologic disease-modifying antirheumatic drug; BMI = body mass index; BSA = body surface area; CRP = C-reactive protein; DAS28 = Disease Activity Score 28; DMARD = disease-modifying antirheumatic drug; HAQ-DI = Health Assessment Questionnaire–Disability Index; hs-CRP = high-sensitivity C-reactive protein; LDI = Leeds Dactylitis Index; LEI = Leeds Enthesitis Index; MTX = methotrexate; NR = not reported; NRS = Numerical Rating Scale; NSAID = nonsteroidal anti-inflammatory drug; PASDAS = Psoriatic Arthritis Disease Activity Score; PASI = Psoriasis Area Severity Index; PBO = placebo; PsA = psoriatic arthritis; SD = standard deviation; SHS = Sharp/van der Heijde Score; sIGA = static Investigator Global Assessment; TNF = tumour necrosis factor; ULN = upper limit of normal; UPA = upadacitinib.
aFor hs-CRP, the ULN = 2.87 mg/L.
bThe total enthesitis count is calculated by taking the sum of the tenderness scores from all 18 sites derived from the Spondyloarthritis Research Consortium of Canada Enthesitis Index and LEI.
Source: SELECT-PsA1 Clinical Study Report,9 SELECT-PsA2 Clinical Study Report,10 and sponsor’s response to additional information request.34
Interventions
While both included studies randomized patients to 15 mg oral upadacitinib or placebo once daily, the SELECT-PsA1 study also included an active comparator arm (adalimumab 40 mg subcutaneous every other week). Both studies also randomized patients to a 30 mg upadacitinib arm; however, further description of the 30 mg upadacitinib group is not included in this systematic review as it is higher than the dose approved by Health Canada. All patients in the SELECT-PsA1 study received matching placebo injections or tablets. In this double-dummy design, patients received both the oral study drug (upadacitinib or matching placebo) once daily and the subcutaneous study drug (adalimumab or matching placebo) every other week. Adalimumab injections were administered by medical staff or, after training, self-administered or administered by a designee, including a friend or family member. In both SELECT-PsA1 and SELECT-PsA2, all patients randomized to placebo were switched to upadacitinib 15 mg or 30 mg once daily (1:1 ratio) at week 24. No background non-bDMARD therapy was required for participation in either trial, but patients were permitted to continue their stable background non-bDMARD. Patients taking methotrexate were to also take oral folic acid supplements.
In both trials, starting at week 16, rescue therapy was offered to nonresponders, defined as patients who did not achieve an improvement of at least 20% in both TJC and SJC at both week 12 and week 16. Rescue therapy included addition or dose modification of non-bDMARDs, NSAIDs, acetaminophen, low-potency opioids, or oral corticosteroids. Alternatively, 1 intra-articular, trigger point or tender point, intra-bursa, or intra-tendon-sheath corticosteroid injection was permitted to the corresponding affected location. After week 36, patients were permitted to start or change background PsA medications (i.e., NSAIDs, acetaminophen, low-potency opiates), and non-bDMARDs (concomitant use of up to 2 non-bDMARDs except the combination of methotrexate and leflunomide). Any treatment for psoriasis, except non-bDMARDs, was also permitted to start after week 16; initiation or change in dose of non-bDMARD was permitted at week 36.
Prohibited therapies in both studies included treatment with any bDMARD therapy for PsA or non-bDMARD other than methotrexate, leflunomide, sulfasalazine, hydroxychloroquine, or apremilast. The combination of methotrexate with leflunomide was not permitted, nor was the concomitant use of more than 2 non-bDMARDs.
Outcomes
Details of outcome measures are provided in Appendix 4. Only the efficacy outcomes identified in the review protocol included in the multiplicity-controlled analyses (primary and major secondary efficacy outcomes) and those indicated as important outcomes by patient groups are presented in Table 5. In both SELECT-PsA1 and PsA2, the following assessments were performed by an independent and blinded assessor if possible: PASI, BSA, sIGA, TJC and SJC assessments, dactylitis, and enthesitis. In total, 20 end points in 7 categories are discussed in this review and summarized in Table 8.
Table 8: Summary of Outcomes in SELECT-PsA1 and SELECT-PsA2
End point | SELECT-PsA1 | SELECT-PsA2 |
|---|---|---|
Clinical response in psoriatic arthritis symptoms | ||
Proportion of patients achieving ACR20 at week 12 | Primary | Primary |
ACR20 response rate at week 12 (noninferiority of UPA vs. ADA) | Key secondary | Not measured |
ACR20 response rate at week 12 (superiority of UPA vs. ADA) | Key secondary | Not measured |
Proportion of patients achieving MDA at week 24 | Key secondary | Key secondary |
Modified PsARC response rate | Exploratory | Exploratory |
Measure of function and disability | ||
Change from baseline in HAQ-DI at week 12 | Key secondary | Key secondary |
Change from baseline in HAQ-DI at week 12 (superiority of UPA vs. ADA) | Key secondary | Not measured |
Change from baseline in WPAI questionnaire | Exploratory | Exploratory |
Measure of PsA symptoms | ||
Change from baseline in patient’s assessment of pain NRS at week 12 | Exploratory | Exploratory |
Change from baseline in patient’s assessment of pain NRS at week 12 (superiority of UPA vs. ADA) | Key secondary | Not measured |
Change from baseline in FACIT-F at week 12 | Key secondary | Key secondary |
Health-related quality of life | ||
Change from baseline in SF-36 PCS at week 12 | Key secondary | Key secondary |
Change from baseline in EQ-5D-5L and Visual Analogue Scale score | Exploratory | Exploratory |
Measure of skin disease | ||
PASI 75 at week 16 (for patients with ≥ 3% BSA psoriasis at baseline) | Key secondary | Key secondary |
Proportion of patents achieving a sIGA of psoriasis of 0 or 1 and at least a 2-point improvement from baseline (sIGA 0/1) at week 16 | Key secondary | Key secondary |
Change from baseline in SAPS at week 16 | Key secondary | Key secondary |
Measure of other musculoskeletal disease | ||
Proportion of patients with resolution of enthesitis (LEI = 0) at week 24 | Key secondary | Exploratory |
Proportion of patients with resolution of dactylitis (LDI = 0) at week 24 | Key secondary | Exploratory |
Change from baseline in BASDAI | Exploratory | Exploratory |
Radiographic changes | ||
Change from baseline in modified psoriatic arthritis SHS at week 24 | Key secondary | Not measured |
ACR20 = American College of Rheumatology 20% improvement in rheumatoid arthritis; ADA = adalimumab; BASDAI = Bath Ankylosing Spondylitis Disease Activity Index; EQ-5D-5L = EuroQol 5-Dimensions 5-Levels questionnaire; FACIT-F = Functional Assessment of Chronic Illness Therapy–Fatigue; HAQ-DI = Health Assessment Questionnaire–Disability Index; LDI = Leeds Dactylitis Instrument; LEI = Leeds Enthesitis Index; MDA = Minimal Disease Activity; NRS = Numerical Rating Scale; PASI 75 = 75% reduction in Psoriasis Area Severity Index score; PCS = physical component summary; PsARC = Psoriatic Arthritis Response Criteria; SAPS = Self-Assessment of Psoriasis Symptoms; SF-36 = Short Form (36) Health Survey; SHS = Sharp/van der Heijde Score; sIGA = static Investigator Global Assessment; UPA = upadacitinib; WPAI = Work Productivity and Activity Impairment.
Note: Efficacy was tested for upadacitinib vs. placebo unless otherwise specified. Key secondary end points refer to those included in the hierarchical testing of multiplicity-controlled analyses. End points included in this table are not listed in the order in which they were included in the statistical testing hierarchy (see the Statistical Analysis section).
Source: SELECT-PsA1 Clinical Study Report9 and SELECT-PsA2 Clinical Study Report.10
American College of Rheumatology Measures
The American College of Rheumatology (ACR) criteria for assessing joint status provide a composite measure of 20%, 50%, or 70% improvement from baseline in both SJCs and TJCs and at least 3 of 5 additional core set disease criteria including: patient global assessment of disease activity, physician global assessment of disease activity, patient’s assessment of pain, patient assessment of physical function (e.g., HAQ-DI score), and acute-phase reactant (e.g., hs-CRP). The ACR20 is generally accepted as an indicator reflecting important difference in response to treatment, while the American College of Rheumatology 50% improvement in rheumatoid arthritis (ACR50) and American College of Rheumatology 70% improvement in rheumatoid arthritis (ACR70) more likely reflect truly important change in the long term management of arthropathy. As an example, if a study reported a 50% ACR20, this means that half of the study patients achieved a minimal 20% improvement in TJCs and SJCs and a 20% improvement in at least 3 of the other 5 criteria. This a general measure of clinical response of peripheral joint disease and does not include assessment of enthesitis, dactylitis, the spine, or the skin. The proportion of patients achieving an ACR20 at week 12 was the primary outcome in both SELECT-PsA1 and SELECT-PsA2 and tested in the multiplicity-controlled analyses. Responses of 50% and 70% at week 12 were secondary end points in SELECT-PsA1 and SELECT-PsA2, but they were not included in the multiplicity-controlled analyses.
In both studies, the sponsor noted that a “joint evaluator” assessed whether a particular joint was “tender or painful.” Total TJC was based on 68 joints (TJC68), and the total SJC was based on 66 joints (SJC66). Aspects related to the patient evaluation (e.g., pain and global assessment) was completed by the patient, while a physician’s global assessment was completed by the physician. Global assessments took into consideration both arthritis and psoriasis activity. The patient and physician’s global assessment of disease activity on the NRS as well as patient’s assessment of pain NRS were measured on a scale of 0 to 10, with higher scores indicating greater disease activity. No specific measures beyond the established allocation concealment described earlier were taken to maintain blinding in the ACR-related outcomes assessments.
Minimal Disease Activity
Minimal disease activity is a composite outcome measure that was developed as a target of treatment for patients with PsA that encompasses different aspects of disease domains. In SELECT-PsA1 and SELECT-PsA2, a patient was classified as a responder, or as achieving MDA when 5 out of the following 7 outcome measures were fulfilled: a TJC68 of no more than 1, SJC66 of no more than 1, PASI less than or equal to 1, BSA psoriasis of 3% or less, patient’s assessment of pain of no more than 1.5 (0 to 10 NRS), patient’s global assessment of disease activity of 2 or less (0 to 10 NRS), HAQ-DI score of up to 0.5, and LEI of no more than 1. Patients who did not meet at least 3 of the 7 criteria were considered nonresponders. The proportion of patients achieving MDA at week 24 was a major secondary end point in both studies and was therefore included in the multiplicity-controlled analyses.
Psoriatic Arthritis Response Criteria
The PsARC is a composite responder index that measures signs and symptoms of PsA assessed by TJC and/or SJC, physician’s global assessment (0 to 5 Likert scale), and patient’s global assessment (0 to 5 Likert scale). A patient was classified as a responder if 2 of 4 measures was achieved, 1 of which is TJC68 or SJC66, and no worsening of any of the measures. In the SELECT studies, the specific components were at least a 30% reduction in TJC68, at least a 30% reduction in SJC66, improvement in patient’s global assessment of disease activity, or improvement in physician’s global assessment of disease activity. In both studies, the PsARC response was modified by using the physician’s global assessment and the patient’s global assessment on a NRS instead of a 5-point Likert scale in the original criteria. The PsARC has been shown to be a responsive and discriminate outcome instrument in RCTs of PsA. The PsARC does not account for psoriasis severity and is only a general assessment of clinical status. The MID for PsARC is unknown. This was an additional outcome in SELECT-PsA1 and SELECT-PsA2 and was not included in the multiplicity-controlled analyses.
Health Assessment Questionnaire–Disability Index
The HAQ-DI was developed to assess physical disability and pain in rheumatoid arthritis and has been used extensively in arthritis RCTs, including PsA trials. Through a self-assessed questionnaire of 8 functional areas (dressing and grooming, arising, eating, walking, hygiene, reach, grip, and errands/chores), patients’ difficulty in performing these activities over the past week is scored from 0 (without any difficulty) to 3 (unable to do). The maximum score for all questions in each category is considered as the score for the respective category, and the overall HAQ-DI is calculated as the mean score from all the categories, with higher scores reflecting greater disability. Mease et al.36 estimated that the MID for the HAQ-DI in PsA patients using anchor-based methods is 0.35, while the MID was estimated to be 0.131 in PsA patients using an anchor-based approach (equal bidirectional magnitudes for improvement and worsening) by Kwok and Pope.37 Discrepancies in the MID estimates may partly be explained by differences in the HAQ-DI score of the patients studied at baseline.38 In Mease et al.,36 patients had a mean HAQ-DI score at baseline of 1.16, corresponding to moderate functional impairment. In contrast, patients in the study by Kwok and Pope had less functional impairment at baseline, with a mean HAQ-DI score of 0.732.37 In the SELECT studies, the HAQ-DI score ranged from 1.10 to 1.23. The MID of 0.35 estimated by Mease et al.36 was used for this review. The SELECT studies also considered the MID to be 0.35. As change from baseline in the HAQ-DI score at week 12 was a key secondary end point in SELECT-PsA1 and SELECT-PsA2, it was included in the multiplicity-controlled analyses. In SELECT-PsA1, this end point was also hierarchically tested for superiority of upadacitinib versus adalimumab.
Work Productivity and Activity Impairment
Work productivity was measured by the WPAI questionnaire for PsA, version 2.0. This is a patient-administered instrument used to measure overall health and specific impacts on productivity at work and outside of work. The WPAI consists of 6 questions to determine employment status, missed work due to PsA, impaired work due to PsA, and daily activity impairment due to PsA. Four main impairment scores are derived: percentage of absenteeism, percentage of presenteeism (reduced productivity while at work), overall percentage of work impairment that combines absenteeism and presenteeism, and percentage of impairment in activities performed outside of work. Higher scores indicate greater impairment, and a lower WPAI score indicates an improvement. It has been suggested that improvements of 20% in presenteeism, 15% in work productivity loss, and 20% in activity impairment represent clinically meaningful improvements in patients with active PsA.39 Absenteeism, presenteeism, and work impairment were measured only in patients who were employed. Change from baseline in the WPAI questionnaire up to week 24 was an additional outcome in both SELECT-PsA1 and SELECT-PsA2 and therefore was not included in the multiplicity-controlled analyses.
Patient’s Assessment of Pain Numerical Rating Scale
The patient’s assessment of pain NRS is 1 of the 5 ACR core set criteria. Pain severity was scored on a 0 to 10 scale, with a score of 0 indicating “no pain” and 10 indicating “worst possible pain.” No reported MID was identified for patients with PsA. In SELECT-PsA1, superiority of upadacitinib versus adalimumab in the change from baseline in the patient’s assessment of pain NRS at week 12 was a key secondary multiplicity-adjusted end point. In PsA2, change from baseline in the patient’s assessment of pain NRS was measured as an individual component of ACR response at week 12, and was not included in the multiplicity-controlled analysis.
FACIT-F
The FACIT-F questionnaire is a 13-item tool that measures an individual's level of fatigue during usual daily activities over the past week. The instrument measures physical fatigue (e.g., “I feel tired”), functional fatigue (e.g., trouble finishing things), emotional fatigue (e.g., frustration), and social consequences of fatigue (e.g., limits social activity). Level of fatigue is measured on a 4-point scale, with 4 indicating “not at all fatigued” and 0 indicating “very much fatigued.” The overall score ranges from 0 to 52, with higher scores indicating less fatigue. An MID for the FACIT-F total score has been estimated as 3.1 points. As change from baseline in the FACIT-F at week 12 was a key secondary end point in SELECT-PsA1 and SELECT-PsA2, it was included in the multiplicity-controlled analyses.
Short Form (36) Health Survey
Version 2 of the SF-36 is a 36-item, generic health status instrument that has been used extensively in clinical trials in many disease areas.9,10 It consists of 8 health sub-domains: physical functioning, role physical, bodily pain, general health, vitality, social functioning, role emotional, and mental health. The sub-domains are aggregated to create 2 component summaries: the PCS and the MCS. The PCS constitutes the domains of physical functioning, role physical, bodily pain, and general health and vitality, and has a normative mean value of 50. The scores for each domain range from 0 to 100, with higher scores indicating better health status or HRQoL. The MID for either the PCS or MCS of the SF-36 for the change from baseline is typically between 2.5 and 5 points.40-42 Leung and colleagues reported MIDs of change scores of 3.74 and 1.77 in PsA patients treated with TNF inhibitors for PCS and MCS, respectively.43 Although the SF-36 was conducted, only the change from baseline in PCS at week 12 was a key secondary end point in SELECT-PsA1 and SELECT-PsA2; it was therefore included in the multiplicity-controlled analyses.
EuroQol 5-Dimensions 5-Levels Questionnaire
The EQ-5D-5L is a generic instrument for HRQoL evaluation. It has been validated in a diverse patient population; however, no studies specifically validating EQ-5D-5L in patients with PsA were identified. It may be applied to a wide range of health conditions and treatments. The 5-level version consists of a 5-dimensional descriptive system and the EuroQol VAS. The descriptive system comprises the following 5 dimensions of health status: mobility, self-care, usual activities, pain/discomfort and anxiety/depression, each with 5 levels. A level 1 response represents “no problems” and level 5 “extreme problems” or “unable to perform.” Results from the EQ-5D-5L descriptive system can be converted into a single index score. A score of 0 represents the health state of “dead” and 1.0 reflects “perfect health.” Negative scores are also possible for those health states that society (not the individual patient) considers to be “worse than dead.” The EuroQol VAS records the respondent’s self-rated health on a vertical line on which the end points are labelled 0 (“the worst health you can imagine”) and 100 (“the best health you can imagine”). The EQ-5D-5L index and VAS scores can be summarized and analyzed as continuous data. In the SELECT-PsA1 and SELECT-PsA2 studies, the UK scoring algorithm was used, with the patient’s preference for the current health state estimated through the index score from published algorithms. The range is between –0.285 and 1, with higher scores indicating better health.9,10 The MID estimates for the index score in a Canadian population have a summarized mean of 0.056 (SD = 0.011).44 The change from baseline in the EQ-5D-5L index value and VAS up to week 24 was an additional outcome in both PsA1 and PsA2 and therefore was not included in the multiplicity-controlled analyses.
Psoriasis Area Severity Index
A widely used instrument in psoriasis trials, the PASI assesses and grades the severity of psoriatic lesions and the patient’s response to treatment. Severity of psoriasis is measured at 4 anatomic sites (head, upper extremities, trunk, and lower extremities) and each is assessed for erythema, induration, and desquamation using a 5-point scale. Scores for each site range from 0 (no symptoms) to 4 (very marketed symptoms). The extent of lesions in a given anatomic site is also ranked from 0 (no involvement) to 6 (90% to 100% involvement). The PASI produces a numeric score ranging from 0 to 72, with the highest score representing complete erythroderma of the most severe degree possible. In general, a PASI score of 3 or less represents mild disease, scores above 3 and up to 15 represent moderate disease, and scores above 15 are considered indicative of severe disease.
A PASI 75 response is the current benchmark for most clinical trials in psoriasis and the criterion for efficacy of new psoriasis treatments approved by the FDA.45 The proportion of patients achieving a PASI 75 response at week 16 (restricted to patients with baseline psoriatic lesions involving ≥ 3% BSA) was a key secondary end point in both SELECT-PsA1 and SELECT-PsA2; it was therefore included in the multiplicity-controlled analyses. At week 24, a 75% reduction in Psoriasis Area Severity Index score (PASI 75), 90% reduction in Psoriasis Area Severity Index score (PASI 90), or 100% reduction in Psoriasis Area Severity Index score (PASI 100) from baseline was an additional outcome and was not included in the multiplicity-controlled analyses.
Static Investigator Global Assessment
The sIGA evaluates the severity of psoriasis. It is a 5-point score ranging from 0 (clear) to 4 (severe), based on the investigator’s assessment of the average elevation, erythema, and scaling of all psoriatic lesions. As a static assessment, the patient’s disease state at the time of assessment is not compared to any of the previous measures. A lower score indicates less-severe psoriasis (i.e., less body coverage).
In both SELECT studies, the proportion of patients achieving an sIGA score of 0 or 1 and an improvement of at least 2 points from baseline at week 16 was a key multiplicity-adjusted secondary end point, and was calculated in patients with baseline sIGA scores of 2 or higher.
Self-Assessment of Psoriasis Symptoms
The SAPS questionnaire contains 11 symptom-focused items. Patients self-assess symptoms of psoriasis including pain, itching, redness, scaling, flaking, bleeding, burning, stinging, tenderness, pain due to skin cracking, and joint pain. Each item is scored from 0 (least severe) to 10 (most severe), with the sum of scores forming a total score that ranges from 0 to 110. No reported MID was identified for patients with PsA. As change from baseline in the SAPS questionnaire at week 16 was a key secondary end point in SELECT-PsA1 and SELECT-PsA2, it was included in the multiplicity-controlled analyses.
Leeds Enthesitis Index
The LEI was developed specifically for PsA diagnoses. It measures enthesitis at 6 sites: lateral epicondyle, left and right; medial femoral condyle, left and right; and Achilles tendon insertion, left and right. Tenderness on examination at each site was assigned a score of 0 (absent) or 1 (present); the results from each site were then added to produce an overall score ranging from 0 to 6. Resolution of enthesitis sites was defined as an LEI of 0. An MID was not identified from the literature. The proportion of patients achieving resolution of enthesitis at week 24 (measured in patients with baseline LEI > 0) was a key secondary outcome in SELECT-PsA1 and was therefore included in the multiplicity-controlled analyses. However, in SELECT-PsA2, this end point was considered additional and was not included in the multiplicity-controlled analyses.
Leeds Dactylitis Index
Presence of dactylitis in all 20 digits was assessed using the LDI. Tenderness and circumference of digits were measured with a dactylometer, with presence of a dactylitic digit defined as at least 1 affected and tender digit with a circumference increase of at least 10% over the reference digit. The reference circumference is either the unaffected contralateral digit or derived from a reference table. A digit score is calculated for each of the 20 digits (hands and feet), with a score of 0 representing an unaffected digit. The sum of scores over all 20 digits forms the LDI. Resolution of dactylitis was defined as an LDI of 0. An MID was not identified from the literature. The proportion of patients achieving resolution of dactylitis at week 24 (measured in patients with a baseline LDI > 0) was a key secondary outcome in SELECT-PsA1 and was therefore included in the multiplicity-controlled analyses. However, in SELECT-PsA2, this end point was considered additional and was not included in the multiplicity-controlled analyses.
Bath Ankylosing Spondylitis Disease Activity Index
The BASDAI contains 6 questions pertaining to the 5 major symptoms (domains) of axial disease activity: fatigue, spinal pain, joint pain and/or swelling, areas of localized tenderness, and morning stiffness. A continuous NRS of 0 to 10 is used to measure these disease activities, with 0 indicating no problem and 10 indicating the worst problem. A BASDAI score from 0 to 10 is then calculated. Scores of 4 or greater suggest suboptimal control of disease. The MID for the BASDAI has been determined as a change of −1.96 on the 10-point BASDAI scale.46 The change in BASDAI from baseline up to week 24 (in patients who had psoriatic spondylitis at baseline) was assessed as an additional efficacy outcome in both SELECT trials. This outcome was not included in the multiplicity-controlled analyses.
Sharp/van der Heijde Score
The Sharp method as modified by van der Heijde for PsA was used to assess and score radiographic outcomes. The SHS allows for the assessment of 2 different aspects of joint damage in PsA: articular erosions and joint space narrowing in the hands and feet. A total SHS score is obtained by adding together scores for erosions and joint space narrowing in both hands and feet.
Erosions were assessed in 20 locations in each hand (graded from 0 to 5), and 6 joints in each foot (graded from 0 to 10). Joint space narrowing was assessed in 20 joints in each hand and in 6 joints in each foot (graded 0 to 4). A score of 0 denoted no erosion or narrowing. The range of scores is 0 to 320 for erosions, and 0 to 208 for joint space narrowing. The total score ranges from 0 to 528. A higher score indicates greater radiographic damage. Radiographic images were assessed and scored centrally by 2 independent reviewers who were blinded to patient details and treatment allocation, with the SHS calculated using the score of the 2 closest reads. An MID for SHS is unknown in patients with PsA. Only SELECT-PsA1 assessed change from baseline in SHS at week 24. As this was a key secondary efficacy outcome in PsA1, it was included in the multiplicity-controlled analyses.
Safety
Adverse events, SAEs, severe adverse events (≥ grade 3), AEs of special interest, and WDAEs were recorded in in SELECT-PsA1 and SELECT-PsA2. Two sets of safety analyses were planned, the first by week 24, and a long-term safety analysis.
Unless otherwise noted, all AEs presented were treatment-emergent. The definition of TEAEs and treatment-emergent deaths were those with an onset on or after the first dose of the study drug but no more than 30 days after the last dose of upadacitinib or placebo (oral and subcutaneous) and no more than 70 days after the last dose of adalimumab. Reported AEs did not necessarily have a causal relationship with treatment. Several AEs of special interest were specified in the protocol: serious infections, opportunistic infections, malignancy, hepatic disorders, gastrointestinal perforations, anemia, neutropenia, lymphopenia, herpes zoster, creatine phosphokinase elevation, renal dysfunction, tuberculosis, MACEs, and thrombotic and embolic events.
Statistical Analysis
An unblinded analysis was conducted by an independent data monitoring committee after all patients completed week 24. A final analysis is planned after all patients have completed the last visit of the study (period 2). In SELECT-PsA1, an interim utility analysis of unblinded efficacy data was also performed by the committee after 600 patients completed week 12.
Power analysis in SELECT-PsA1 indicated that 1,640 patients randomized 2:2:2:1:1 to upadacitinib 15 mg, upadacitinib 30 mg, adalimumab 40 mg, and placebo would provide at least 90% power to detect a 20% difference in ACR20 response rates at week 12 versus placebo, assuming a 30% placebo response rate, a 10% dropout, and a 2-sided significance level of 0.025. This sample size also provided at least 85% power to test the noninferiority of upadacitinib versus adalimumab, assuming 50% ACR20 response rates for adalimumab and upadacitinib, and 30% ACR20 response rates for placebo. At least 90% power was also to be provided for the majority of key secondary end points. In SELECT-PsA2, a sample size of 630 was thought to provide at least 90% power to detect a 20% difference in ACR20 response rates, with an assumption of a 20% response rate in the placebo group, at a 2-sided alpha of 0.025, and accounting for a 10% dropout rate. This sample size also provided at least 90% power for the majority of key secondary end points. It was not clear what the basis was for the assumed ACR20 responses in either intervention or placebo groups. No rationale was provided regarding the assumption for the sample size.
Treatment comparisons of categorical efficacy outcomes (e.g., ACR20, ACR50, and ACR70) were reported as point estimates and 95% CIs using normal approximations for response rates of each randomized treatment group. In both trials, treatment comparisons were made between each upadacitinib dose and the combined placebo group using the Cochran-Mantel-Haenszel test, adjusting for the main stratification factor of current DMARD use (yes/no); P values were also constructed using the Cochran-Mantel-Haenszel test. The primary analyses for all continuous efficacy outcomes (e.g., HAQ-DI scores) at the specified time points included in the multiplicity-adjustment plan were based on the mixed model for repeated measures (MMRM). The model included treatment, visit, treatment-by-visit interaction, and the stratification factor of current DMARD use (yes/no) as fixed factors, and the continuous baseline measurements as covariates. The LS mean and 95% CI for each randomized treatment group, the LS mean treatment difference (with associated 95% CI), and the P value between each upadacitinib dose group and the combined placebo group were provided. In SELECT-PsA1, superiority of upadacitinib versus adalimumab in change from baseline in patient’s assessment of pain NRS and change from baseline in HAQ-DI at week 12, were also tested using the same MMRM model. In SELECT-PsA1, change from baseline in SHS at week 24 was also assessed using the analysis of covariance model with treatment and the stratification factor of current DMARD use (yes/no) as the fixed factors and the corresponding baseline values as the covariates.
For SELECT-PsA1 and SELECT-PsA2, all efficacy analyses were conducted in the full analysis set (FAS) population. For the primary end point measuring the proportion of patients with ACR20 at week 12 and other binary end points, nonresponder imputation (NRI) was used for missing values. For the NRI approach, patients who were missing binary response data at a time point of interest were considered as nonresponders for that visit, and patients who had discontinued the study drug before the time point of interest were defined as nonresponders for all subsequent visits. For MDA at week 24 in both trials, resolution of enthesitis at week 24, and resolution of dactylitis at week 24 in SELECT-PsA1, in addition to the NRI data handling, patients who met the rescue criteria (i.e., those not achieving an improvement of at least 20% in either or both TJC and SJC at both week 12 and week 16) were also treated as nonresponders. In both studies, continuous data were analyzed through an MMRM approach that included observed data at all visits. Data collected after premature discontinuation of the study drug were excluded. The parameter estimations for the mixed model assumed that data were missing at random and used the method of restrictive maximum likelihood. Missing data in the radiographic outcome of SHS in SELECT-PsA1 were based on linear extrapolation, with the missing X-ray at the time point of interest after rescue or premature discontinuation imputed by assuming a linear relationship across visits. As-observed handling of missing data was used for supplementary analysis of binary and continuous end points. In such analyses, all observed data regardless of premature discontinuation of the study drug or use of rescue medication were included, and values for missing evaluations were excluded from the analysis for the particular visit. An additional tipping-point analysis was performed for ACR20 and HAQ-DI using multiple imputations to explore various missing data assumptions, including missing not at random.
In SELECT-PsA1, noninferiority of upadacitinib versus adalimumab was assessed for ACR20 at week 12. This was performed using the Koch 3-arm test statistic to demonstrate that upadacitinib preserves at least 50% of the placebo-subtracted adalimumab effect. That is, noninferiority was claimed if the multiplicity-adjusted lower confidence limit for the ratio of placebo-subtracted upadacitinib ACR20 rate compared to the placebo-subtracted adalimumab ACR20 rate was at least 50%. No clear justification for the noninferiority margin was provided in the Clinical Study Report. The noninferiority margin was changed in Protocol Amendment 2; the previous noninferiority margin of 15% was derived from prior data (e.g., a meta-analysis of placebo-subtracted effect of anti-TNF biologics in ACR20 among patients who had inadequate response to csDMARDs). In SELECT-PsA1, superiority of upadacitinib versus adalimumab was also planned and hierarchically tested for ACR20 at week 12, as well as change from baseline in patient’s assessment of pain NRS and HAQ-DI at week 12.
In SELECT-PsA1, the overall type I error rate of the primary and 14 ranked key secondary end points was strongly controlled using a 2-part, sequential, graphical multiple-testing procedure. The testing used the end-point sequence of the primary end point followed by the ranked key secondary end points in the order outlined in the Outcomes section and began with testing the primary end point using alpha/2 (where alpha = 0.0499) for each dose. For the interim futility analysis, an alpha of 0.0001 was spent, and the final analysis at week 24 database lock was performed at the 0.0499 level. Continued testing followed a pre-specified alpha transfer path that included downstream transfer along the end-point sequence within each dose as well as cross-dose transfer between the low (15 mg) and high (30 mg) upadacitinib doses. A superiority-testing sequence at level alpha was subsequently performed if all previous end points were significant. The ranked key secondary end points compared upadacitinib versus placebo, unless specified (e.g., superiority testing versus adalimumab). Adjusted P values were provided for the primary and ranked key secondary end points based on the testing procedure.
In SELECT-PsA2, the overall type I error rate of the primary and 7 ranked key secondary end points was also strongly controlled using a graphical multiple-testing procedure. The testing used the end-point sequence of primary end point followed by the ranked key secondary end points in the order outlined in the Outcomes section, and began with testing the primary end point using an alpha of 0.025 for each dose. Continued testing followed a pre-specified alpha transfer path that included downstream transfer along the end-point sequence within each dose as well as cross-dose transfer between the low (15 mg) and high (30 mg) upadacitinib doses. Sequential noninferiority or superiority testing was not performed in SELECT-PsA2. Adjusted P values were provided for the primary and ranked key secondary end points based on the testing procedure.
In both studies, subgroup analysis was planned for the primary efficacy outcome for age, sex, body mass index, race, geographic region, duration of PsA diagnosis, baseline hs-CRP, and current use of non-bDMARDs. SELECT-PsA1 also included a subgroup factor for number of prior non-bDMARDs (≤ 1, > 1) whereas SELECT-PsA2 included a subgroup factor for the number of prior failed bDMARDs ( = 1, > 1). Subgroup analyses were not adjusted for multiple testing. The CADTH systematic review protocol included subgroups by PsA disease severity at baseline, previous exposure to bDMARDs (treatment-naive versus -experienced), and concomitant treatment with a non-bDMARD. Inclusion criteria for SELECT-PsA1 and SELECT-PsA2 allowed examination of treatment effects separately for biologic-naive (SELECT-PsA1) and biologic-experienced (SELECT-PsA2). Neither study provided subgroup data based on disease severity at baseline.
Analysis Populations
The analysis populations were defined in the same way in both studies.
The FAS consisted of all randomized patients who received at least 1 dose of study medication. The FAS was used for all efficacy and baseline analyses.
The per-protocol set (PPS) consisted of patients in the FAS who did not have any major protocol deviations that could have had an impact on the primary efficacy end point up to week 12 in period 1 of the study. The PPS was used in the additional analysis of the primary efficacy end point to evaluate the impact of major protocol deviations.
The safety analysis set consisted of all patients who received at least 1 dose of study drug. Patients were analyzed “as treated,” regardless of the treatment group to which they were randomized. Specifically, patients were analyzed according to the treatment received during the majority of their drug exposure time during the analysis period.
Results
Patient Disposition
Patient disposition is summarized in Table 9. In SELECT-PsA1, a total of 1,282 patients were randomized to upadacitinib 15 mg, adalimumab 40 mg, or placebo at baseline. In SELECT-PsA2, a total of 423 patients were randomized to upadacitinib 15 mg or placebo at baseline.
Overall, the number of premature discontinuations at week 24 was higher in the placebo groups (10.4% and 20.3% in SELECT-PsA1 and SELECT-PsA2, respectively) than in the upadacitinib 15 mg group (7.2% and 12.3% in SELECT-PsA1 and SELECT-PsA2, respectively), and adalimumab 40 mg every other week (8.4%). Adverse events and patient decisions to withdraw were reported most frequently as the primary reason to discontinue treatment, although lack of efficacy was the most frequent reason in the SELECT-PsA2 placebo group.
Table 9: Patient Disposition up to Week 24
Disposition | SELECT-PsA1 | SELECT-PsA2 | |||
|---|---|---|---|---|---|
PBO | ADA 40 mg | UPA 15 mg | PBO | UPA 15 mg | |
Screened, Na | 2,480 | 751 | |||
Randomized, N | 423 | 429 | 430 | 212 | 211 |
Completed week 12 on study drug, N (%) | 399 (94.3) | 410 (95.6) | 412 (95.8) | 183 (86.3) | 202 (95.7) |
Discontinued study drug by week 12, N (%) | 24 (5.7) | 19 (4.4) | 18 (4.2) | 29 (13.7) | 9 (4.3) |
Primary reason for discontinuation, N (%) | |||||
Adverse event | 9 (2.1) | 8 (1.9) | 5 (1.2) | 6 (2.8) | 4 (1.9) |
Withdrawal by patient | 9 (2.1) | 7 (1.6) | 7 (1.6) | 12 (5.7) | 0 |
Lost to follow-up | 2 (0.5) | 1 (0.2) | 4 (0.9) | 4 (1.9) | 3 (1.4) |
Lack of efficacy | 1 (0.2) | 2 (0.5) | 0 | 7 (3.3) | 0 |
Other | 3 (0.7) | 1 (0.2) | 2 (0.5) | 0 | 2 (0.9) |
Completed week 24 on study drug, N (%) | 377 (89.1) | 388 (90.4) | 395 (91.9) | 169 (79.7) | 185 (87.7) |
Temporary drug interruption | 2 (0.5) | 4 (0.9) | 2 (0.5) | NA | NA |
Discontinued study drug by week 24, N (%) | 44 (10.4) | 36 (8.4) | 31 (7.2) | 43 (20.3) | 26 (12.3) |
Primary reason for discontinuation, N (%) | |||||
Adverse event | 11 (2.6) | 18 (4.2) | 10 (2.3) | 9 (4.2) | 15 (7.1) |
Withdrawal by patient | 19 (4.5) | 10 (2.3) | 10 (2.3) | 13 (6.1) | 0 |
Lost to follow-up | 3 (0.7) | 3 (0.7) | 5 (1.2) | 5 (2.4) | 4 (1.9) |
Lack of efficacy | 7 (1.7) | 3 (0.7) | 1 (0.2) | 14 (6.6) | 5 (2.4) |
Other | 4 (0.9) | 2 (0.5) | 5 (1.2) | 2 (0.9) | 2 (0.9) |
Study discontinuation by week 24 | 39 (9.2) | 24 (5.6) | 21 (4.9) | 38 (17.9) | 19 (9.0) |
FAS, N | 423 | 429 | 429 | 212 | 211 |
PP, N | 413 | 424 | 402 | 203 | 192 |
Safety, N | 423 | 429 | 429 | 212 | 211 |
ADA = adalimumab; FAS = full analysis set; NA = not applicable; PBO = placebo; PP = per protocol; UPA = upadacitinib.
aIn SELECT-PsA1, of 2,480 patients screened, 774 patients were ineligible for enrolment; in SELECT-PsA2, of 751 patients screened, 109 patients were ineligible for enrolment. The upadacitinib 30 mg oral once daily treatment group is not shown (n = 423 in SELECT-PsA1; n = 219 in SELECT-PsA2).
Source: SELECT-PsA1 Clinical Study Report,9 SELECT-PsA2 Clinical Study Report,10 and sponsor’s response to additional information request.34
Exposure to Study Treatments
In SELECT-PsA1, the mean duration of exposure during the double-blind treatment period (up to week 24) was similar in all groups: 161.7 days (SD = 28.57) for upadacitinib, 161.4 days (SD = 28.24) for adalimumab, and 158.5 days (SD = 32.22) for placebo. Treatment compliance was high (mean > 98%) across all treatment groups. In SELECT-PsA2, the mean duration of exposure during the double-blind treatment period (week 24) was longer in the upadacitinib 15 mg daily group (159.1; SD = 29.10) compared to the placebo group (146.7; SD = 48.24). Treatment compliance was also high (mean > 98%) in both treatment groups. Overall, a higher proportion of patients in the SELECT-PsA1 trial received concomitant treatment with a non-bDMARD compared to patients enrolled in SELECT-PsA2.
Table 10: Treatment Exposure and Concomitant Therapies up to Week 24
Exposure | SELECT-PsA1 | SELECT-PsA2 | |||
|---|---|---|---|---|---|
PBO (n = 423) | ADA 40 mg (n = 429) | UPA 15 mg (n = 429) | PBO (n = 212) | UPA 15 mg (n = 211) | |
Extent of exposure to study drug, SAS | |||||
Mean days (SD) | 158.5 (32.22) | 161.4 (28.24) | 161.7 (28.57) | 146.7 (48.24) | 159.1 (29.10) |
Treatment compliance, FAS | |||||
Mean % (SD) | 98.8 (6.16) | 98.3 (5.36) | 99.4 (13.57)a | 116.7 (234.29) | 98.7 (7.97) |
Concomitant treatment, FAS | |||||
Any non-biologic DMARDs, n (%) | 354 (83.7) | 348 (81.1) | 355 (82.8) | 113 (53.3) | 101 (47.9) |
Methotrexate, n (%) | 296 (70.0) | 286 (66.7) | 299 (69.7) | 92 (43.4) | 82 (38.9) |
Any systemic corticosteroid, n (%) | 94 (22.2) | 82 (19.1) | 84 (19.6) | 42 (19.8) | 33 (15.6) |
Any NSAID, n (%) | 290 (68.6) | 286 (66.7) | 277 (64.6) | 130 (61.3) | 127 (60.2) |
ADA = adalimumab; DMARD = disease-modifying antirheumatic drug; FAS = full analysis set; NSAID = nonsteroidal anti-inflammatory drug; PBO = placebo; SAS = safety analysis set; SD = standard deviation; UPA = upadacitinib.
aThis analysis excludes 2 outliers that resulted in an artificially inflated compliance rate. The original analysis included 2 outlier patients who had discontinued the study drug but did not return any tablets, resulting in a compliance of 3,500% and 1,750% and a mean compliance exceeding 100% (103.3%; SD = 80.83%).
Source: SELECT-PsA1 Clinical Study Report9 and SELECT-PsA2 Clinical Study Report.10
Efficacy
Numerous end points were measured at various time points across both SELECT studies. In this review, a total of 20 end points were presented from PsA1, and 15 end points were presented from PsA2. Only the efficacy outcomes identified in the review protocol (Table 5) and those indicated as important by patient groups are reported below. Data tables are only presented for end points that were included in the multiplicity-controlled analyses (primary and major secondary efficacy outcomes); data tables for end points that were not part of the statistical testing hierarchy are presented in Appendix 3, as indicated in the respective sections. In the data tables, P values are presented only for end points that were part of the multiplicity-adjusted testing hierarchy; P values are not reported for end points that fell below failure of the hierarchical analysis. A detailed discussion and critical appraisal of the outcome measures is provided in Appendix 4.
In the multiplicity-controlled analyses of SELECT-PsA1, statistically significant differences for the comparisons between upadacitinib 15 mg once daily and placebo were observed for the primary end point of ACR20 at week 12 and most key secondary end points. Upadacitinib 15 mg once daily did not demonstrate statistically significant superiority over adalimumab in ACR20 at week 12. As such, statistically significant differences in the key secondary end points lower in the testing hierarchy were not tested because of the multiplicity control strategy. The affected end points were the proportion of patients achieving resolution of dactylitis at week 24 (versus placebo), change from baseline in patient’s assessment of pain NRS at week 12 (versus adalimumab), change from baseline in HAQ-DI at week 12 (versus adalimumab), and change from baseline in SAPS at week 16 (versus placebo).
In the multiplicity-controlled analyses of SELECT-PsA2, statistically significant differences for the comparisons between upadacitinib 15 mg and placebo were observed for the primary end point of ACR20 at week 12 and all major secondary end points.
Clinical Responses in Psoriatic Arthritis Symptoms
ACR Responses of 20%, 50%, and 70%
The proportion of patients achieving ACR20 at week 12 was the primary end point in both SELECT-PsA1 and SELECT-PsA2. In SELECT-PsA1, a statistically significantly greater proportion of bDMARD-naive patients in the upadacitinib treatment group achieved ACR20 at week 12 compared with placebo (70.6% for upadacitinib 15 mg versus 36.2% for placebo; P < 0.0001). In SELECT-PsA2, a statistically significantly greater proportion of bDMARD-experienced patients in the upadacitinib treatment group achieved an ACR20 at week 12 compared with placebo (56.9% for upadacitinib 15 mg daily versus 24.1% for placebo; P < 0.0001) (Table 11).
Supplemental analyses using as-observed handling of missing data on the FAS and NRI on the PPS were consistent with the primary analysis. Subgroup analysis by current use of non-bDMARDs, number of prior non-bDMARDs for SELECT-PsA1, and number of failed bDMARDs for SELECT-PsA2 were also consistent with the primary analysis. However, these analyses were not included in the hierarchical statistical analysis approach and should be considered inconclusive because of the potential for inflated type I error.
In SELECT-PsA1, the proportion of patients achieving an ACR20 at week 12 with upadacitinib treatment compared to adalimumab was tested for noninferiority and superiority as key secondary end points. A greater proportion of patients in the upadacitinib treatment group achieved an ACR20 response at week 12 compared with adalimumab (70.6% for upadacitinib 15 mg once daily versus 65.0% for adalimumab 40 mg every other week; between-group difference of 5.6%; 95% CI, −0.6 to 11.8). In the noninferiority analysis, upadacitinib 15 mg daily was noninferior to adalimumab 40 mg every other week. The percentages of adalimumab effect preservation, as calculated by (upadacitinib − placebo)/(adalimumab − placebo), was 119.4% (95% CI, 98.0 to 147.9); the lower bound of the 95% CI exceeded the pre-specified noninferiority ratio of at least 50% of the placebo-subtracted adalimumab effect. The analysis of the PPS showed consistent results for both response-rate difference and adalimumab effect preservation. In the subsequent testing of superiority, upadacitinib 15 mg once daily was not found to be superior to adalimumab 40 mg every other week as it did not meet statistical significance for superiority.
In both SELECT-PsA1 and PsA2, additional exploratory end points showed that, numerically, a greater proportion of patients treated with upadacitinib achieved an ACR50 or ACR70 at week 12 compared to patients who were treated with placebo. In PsA1, the response rates were numerically similar between upadacitinib and adalimumab treatment groups. Furthermore, ACR responses of 20%, 50%, and 70% at week 24 were maintained, with a numerically higher proportion of patients treated with upadacitinib 15 mg achieving a response compared to patients who received placebo (PsA1 and PsA2) or adalimumab (PsA1). As these end points were not part of the multiplicity-controlled analyses, no statistical comparisons can be made.
According to the clinical expert consulted for this review, the between-group differences in ACR20 in the FAS population in SELECT-PsA1 and PsA2 are considered clinically important.
Table 11: Clinical Response (ACR20, ACR50, and ACR70) at Week 12 or Week 24
Treatment group | Total N | Responders, n (%) | Response rate % (95% CI)a | Response-rate difference vs. control | |
|---|---|---|---|---|---|
Point estimate (95% CI)b | P valuec | ||||
Primary end point | |||||
ACR20 response rate at week 12 (NRI, FAS) | |||||
SELECT-PsA1 | |||||
Placebo | 423 | 153 (36.2) | 36.2 (31.6 to 40.7) | 34.5 (28.2 to 40.7) UPA vs. placebo | < 0.0001 |
ADA 40 mg e.o.w. | 429 | 279 (65.0) | 65.0 (60.5 to 69.5) | ||
UPA 15 mg q.d. | 429 | 303 (70.6) | 70.6 (66.3 to 74.9) | ||
SELECT-PsA2 | |||||
Placebo | 212 | 51 (24.1) | 24.1 (18.3 to 29.8) | 32.8 (24.0 to 41.6) | < 0.0001 |
UPA 15 mg q.d. | 211 | 120 (56.9) | 56.9 (50.2 to 63.6) | ||
Key secondary end points | |||||
ACR20 response rate at week 12 – noninferiority of UPA vs. ADA; superiority of UPA vs. ADA | |||||
SELECT-PsA1 (NRI, FAS) | |||||
Placebo | 423 | 153 (36.2) | 36.2 (31.6 to 40.7) | 5.6 (−0.6 to 11.8) noninferiority, UPA vs. ADAd | 0.0004 |
ADA 40 mg e.o.w. | 429 | 279 (65.0) | 65.0 (60.5 to 69.5) | ||
UPA 15 mg q.d. | 429 | 303 (70.6) | 70.6 (66.3 to 74.9) | ||
SELECT-PsA1 (NRI, PPS) | |||||
Placebo | 413 | 150 (36.3) | 36.3 (31.7 to 41.0) | 4.8 (−1.5 to 11.2) noninferiority, UPA vs. ADAd | NAe |
ADA 40 mg e.o.w. | 424 | 279 (65.8) | 65.8 (61.3 to 70.3) | ||
UPA 15 mg q.d. | 402 | 284 (70.6) | 70.6 (66.2 to 75.1) | ||
SELECT-PsA1 (NRI, FAS) | |||||
Placebo | 423 | 153 (36.2) | 36.2 (31.6 to 40.7) | 5.6 (−0.6 to 11.8) superiority, UPA vs. ADA | 0.0815 |
ADA 40 mg e.o.w. | 429 | 279 (65.0) | 65.0 (60.5 to 69.5) | ||
UPA 15 mg q.d. | 429 | 303 (70.6) | 70.6 (66.3 to 74.9) | ||
ACR50 response rate at week 12 (NRI, FAS) | |||||
SELECT-PsA1 | |||||
Placebo | 423 | 56 (13.2) | 13.2 (10.0 to 16.5) | 24.3 (18.7 to 29.9) UPA vs. placebo | NAe |
ADA 40 mg e.o.w. | 429 | 161 (37.5) | 37.5 (32.9 to 42.1) | 0.0 (−6.5 to 6.5) UPA vs. ADA | |
UPA 15 mg q.d. | 429 | 161 (37.5) | 37.5 (32.9 to 42.1) | Reference | |
SELECT-PsA2 | |||||
Placebo | 212 | 10 (4.7) | 4.7 (1.9 to 7.6) | 27.0 (20.1 to 33.9) | NAe |
UPA 15 mg q.d | 211 | 67 (31.8) | 31.8 (25.5 to 38.0) | ||
ACR70 response rate at week 12 (NRI, FAS) | |||||
SELECT-PsA1 | |||||
Placebo | 423 | 10 (2.4) | 2.4 (0.9 to 3.8) | 13.3 (9.5 to 17.0) UPA vs. placebo | NAe |
ADA 40 mg e.o.w. | 429 | 59 (13.8) | 13.8 (10.5 to 17.0) | 1.9 (−2.9 to 6.6) UPA vs. ADA | |
UPA 15 mg q.d. | 429 | 67 (15.6) | 15.6 (12.2 to 19.1) | Reference | |
SELECT-PsA2 | |||||
Placebo | 212 | 1 (0.5) | 0.5 (0.0 to 1.4) | 8.1 (4.2 to 11.9) | NAe |
UPA 15 mg q.d. | 211 | 18 (8.5) | 8.5 (4.8 to 12.3) | ||
ACR20 response rate at week 24 (NRI, FAS) | |||||
SELECT-PsA1 | |||||
Placebo | 423 | 191 (45.2) | 45.2 (40.4 to 49.9) | 28.3 (22.0 to 34.6) UPA vs. placebo | NAe |
ADA 40 mg e.o.w. | 429 | 288 (67.1) | 67.1 (62.7 to 71.6) | 6.3 (0.2 to 12.4) UPA vs. ADA | |
UPA 15 mg q.d. | 429 | 315 (73.4) | 73.4 (69.2 to 77.6) | Reference | |
SELECT-PsA2 | |||||
Placebo | 212 | 43 (20.3) | 20.3 (14.9 to 25.7) | 39.0 (30.4 to 47.5) | NAe |
UPA 15 mg q.d. | 211 | 125 (59.2) | 59.2 (52.6 to 65.9) | ||
ACR50 response rate at week 24 (NRI, FAS) | |||||
SELECT-PsA1 | |||||
Placebo | 423 | 80 (18.9) | 18.9 (15.2 to 22.6) | 33.5 (27.5 to 39.6) UPA vs. placebo | NAe |
ADA 40 mg e.o.w. | 429 | 190 (44.3) | 44.3 (39.6 to 49.0) | 8.2 (1.5 to 14.8) UPA vs. ADA | |
UPA 15 mg q.d. | 429 | 225 (52.4) | 52.4 (47.7 to 57.2) | Reference | |
SELECT-PsA2 | |||||
Placebo | 212 | 20 (9.4) | 9.4 (5.5 to 13.4) | 29.0 (21.3 to 36.6) | NAe |
UPA 15 mg q.d. | 211 | 81 (38.4) | 38.4 (31.8, 45.0) | ||
ACR70 response rate at week 24 (NRI, FAS) | |||||
SELECT-PsA1 | |||||
Placebo | 423 | 22 (5.2) | 5.2 (3.1 to 7.3) | 23.5 (18.7 to 28.2) UPA vs. placebo | NAe |
ADA 40 mg e.o.w. | 429 | 97 (22.6) | 22.6 (18.7 to 26.6) | 6.1 (0.2 to 11.9) UPA vs. ADA | |
UPA 15 mg q.d. | 429 | 123 (28.7) | 28.7 (24.4 to 33.0) | Reference | |
SELECT-PsA2 | |||||
Placebo | 212 | 2 (0.9) | 0.9 (0.0 to 2.2) | 18.5 (13.0 to 24.0) | NAe |
UPA 15 mg q.d. | 211 | 41 (19.4) | 19.4 (14.1 to 24.8) | ||
Subgroup analyses: ACR20 response rate at week 12 (NRI, FAS) | |||||
SELECT-PsA1, Current use of non-biologic DMARD | |||||
Yes | |||||
Placebo | 347 | 130 (37.5) | 37.5 (32.4 to 42.6) | 34.8 (27.9 to 41.7) UPA vs. placebo | NAe |
ADA 40 mg e.o.w. | 347 | 223 (64.3) | 64.3 (59.2 to 69.3) | ||
UPA 15 mg q.d. | 353 | 255 (72.2) | 72.2 (67.6 to 76.9) | ||
No | |||||
Placebo | 76 | 23 (30.3) | 30.3 (19.9 to 40.6) | 32.9 (17.9 to 47.9) UPA vs. placebo | NAe |
ADA 40 mg e.o.w. | 82 | 56 (68.3) | 68.3 (58.2 to 78.4) | ||
UPA 15 mg q.d. | 76 | 48 (63.2) | 63.2 (52.3 to 74.0) | ||
SELECT-PsA2, current use of non-biologic DMARD | |||||
Yes | |||||
Placebo | 100 | 27 (27.0) | 27.0 (18.3 to 35.7) | 31.2 (18.1 to 44.2) | NAe |
UPA 15 mg q.d. | 98 | 57 (58.2) | 58.2 (48.4 to 67.9) | ||
No | |||||
Placebo | 112 | 24 (21.4) | 21.4 (13.8 to 29.0) | 34.3 (22.4 to 46.2) | NAe |
UPA 15 mg q.d. | 113 | 63 (55.8) | 55.8 (46.6 to 64.9) | ||
SELECT-PsA1, number of prior non-biologic DMARDs | |||||
≤ 1 | |||||
Placebo | 274 | 99 (36.1) | 36.1 (30.4 to 41.8) | 34.8 (27.0 to 42.6) UPA vs. placebo | NAe |
ADA 40 mg e.o.w. | 288 | 184 (63.9) | 63.9 (58.3 to 69.4) | ||
UPA 15 mg q.d. | 275 | 195 (70.9) | 70.9 (65.5 to 76.3) | ||
> 1 | |||||
Placebo | 149 | 54 (36.2) | 36.2 (28.5 to 44.0) | 33.9 (23.3 to 44.5) UPA vs. placebo | NAe |
ADA 40 mg e.o.w. | 141 | 95 (67.4) | 67.4 (59.6 to 75.1) | ||
UPA 15 mg q.d. | 154 | 108 (70.1) | 70.1 (62.9 to 77.4) | ||
SELECT-PsA2, number of prior failed biologic DMARDs | |||||
1 | |||||
Placebo | 135 | 32 (23.7) | 23.7 (16.5 to 30.9) | 37.4 (26.3 to 48.5) | NAe |
UPA 15 mg q.d. | 126 | 77 (61.1) | 61.1 (52.6 to 69.6) | ||
> 1 | |||||
Placebo | 59 | 12 (20.3) | 20.3 (10.1 to 30.6) | 24.6 (9.0 to 40.2) | NAe |
UPA 15 mg q.d. | 69 | 31 (44.9) | 44.9 (33.2 to 56.7) | ||
ACR20 = American College of Rheumatology 20% improvement in rheumatoid arthritis; ACR50 = American College of Rheumatology 50% improvement in rheumatoid arthritis; ACR70 = American College of Rheumatology 70% improvement in rheumatoid arthritis; ADA = adalimumab; CI = confidence interval; DMARD = disease-modifying antirheumatic drug; e.o.w. = every other week; FAS = full analysis set; NA = not applicable; NRI = nonresponder imputation; PPS = per-protocol set; q.d. = every day; UPA = upadacitinib; vs. = versus .
a95% CIs for response rate were calculated based on normal approximation to the binominal distribution.
b95% CIs for response rate difference were calculated based on normal approximation.
cThe P value was constructed using a Cochran-Mantel-Haenszel test adjusted for the main stratification factor of current DMARD use (yes/no). In PsA1, the P value was statistically significant at the 0.025 level for ACR20 (UPA vs. placebo; and noninferiority of UPA vs. ADA) and the P value was significant at the 0.05 level for ACR20, superiority of UPA vs. ADA. In PsA2, the P value was significant at 0.025 for ACR20 (UPA vs. placebo).
dFAS effect preservation ratio = 119.381 (95% CI, 97.987 to 147.942); 3-arm noninferiority z statistic = 7.301. PPS effect preservation ratio = 116.433 (95% CI, 95.409 to 144.051); 3-arm noninferiority z statistic = 6.975. Noninferiority test of UPA vs. ADA was based on 3-arm noninferiority testing aiming for UPA preserving at least 50% of the placebo-subtracted ADA effect. The percent of ADA effect preservation is the point estimate of 3-arm noninferiority analysis, which is calculated by (UPA − PBO)/(ADA − PBO) × 100. The confidence interval of the ratio is calculated using Fieller’s method.
eThe P value is not presented, as the end point was not part of the multiplicity-adjusted testing hierarchy and therefore was not controlled for type I error rate.
Source: SELECT-PsA1 Clinical Study Report9 and SELECT-PsA2 Clinical Study Report.10
Minimal Disease Activity
In both SELECT-PsA1 and SELECT-PsA2, a responder or MDA achievement was met when 5 out of 7 outcome measures (involving TJC68, SJC66, PASI, or BSA psoriasis, patient’s assessment of pain, patient’s global assessment of disease activity, HAQ-DI, and LEI) were fulfilled. In SELECT-PsA1, a statistically significantly higher proportion of patients in the upadacitinib treatment group achieved MDA at week 24 compared with placebo: 36.6% for upadacitinib 15 mg and 12.3% for placebo (between-group difference of 24.3%; 95% CI, 18.8 to 29.8; P = 0.0004). Similarly, in SELECT-PsA2 at week 24, a statistically significantly higher proportion of patients in the upadacitinib treatment groups achieved an MDA compared with placebo: 25.1% for upadacitinib 15 mg and 2.8% for placebo (between-group difference of 22.3%; 95% CI, 16.0 to 28.6; P < 0.0001) (Table 12).
Table 12: Proportion of Patients Achieving Minimal Disease Activity at Week 24
Treatment group | Total N | Responders, n (%) | Response rate (95% CI)a | Response-rate difference vs. control | |
|---|---|---|---|---|---|
Point estimate (95% CI)b | P valuec | ||||
Minimal disease activity at week 24 (NRI,d FAS) | |||||
SELECT-PsA1 | |||||
Placebo | 423 | 52 (12.3) | 12.3 (9.2 to 15.4) | 24.3 (18.8 to 29.8) UPA vs. placebo | 0.0004 |
ADA 40 mg e.o.w. | 429 | 143 (33.3) | 33.3 (28.9 to 37.8) | ||
UPA 15 mg q.d. | 429 | 157 (36.6) | 36.6 (32.0 to 41.2) | ||
SELECT-PsA2 | |||||
Placebo | 212 | 6 (2.8) | 2.8 (0.6 to 5.1) | 22.3 (16.0 to 28.6) | < 0.0001 |
UPA 15 mg q.d. | 211 | 53 (25.1) | 25.1 (19.3 to 31.0) | ||
ADA = adalimumab; CI = confidence interval; e.o.w = every other week; FAS = full analysis set; NRI = nonresponder Imputation; q.d. = every day; UPA = upadacitinib; vs. = versus
a95% CI for response rates are calculated based on normal approximation to the binomial distribution.
b95% CI for response-rate difference are calculated based on normal approximation.
cThe P value was constructed using a Cochran-Mantel-Haenszel test adjusting for the main stratification factor of current disease-modifying antirheumatic drug use (yes/no). The P value was statistically significant at the 0.025 level for SELECT-PsA1 and the 0.0125 level for SELECT-PsA2.
dNonresponder imputation with additional rescue handling was used, with patients rescued at week 16 imputed as nonresponders.
Source: SELECT-PsA1 Clinical Study Report9 and SELECT-PsA2 Clinical Study Report.10
Modified Psoriatic Arthritis Response Criteria
In SELECT-PsA1, a higher proportion of patients treated with upadacitinib achieved a modified PsARC response at week 24 compared to patients randomized to adalimumab or placebo: 83.7% for upadacitinib 15 mg, 76.6% for adalimumab 40 mg, and 59.3% for placebo (Appendix 3,Table 48). Similarly, in SELECT-PsA2, a higher proportion of patients treated with upadacitinib 15 mg achieved a modified PsARC response at week 24 compared with placebo: 68.2% for upadacitinib 15 mg and 36.3% for placebo. This end point was not part of the multiplicity-controlled statistical analyses.
Measure of Function and Disability
Health Assessment Questionnaire–Disability Index
In SELECT-PsA1, a statistically significantly greater reduction from baseline in the HAQ-DI score was achieved in biologic-naive patients in the upadacitinib treatment groups compared with the placebo group at week 12 (Table 13). The differences in change from baseline between upadacitinib 15 mg and placebo was −0.28 (95% CI, −0.35 to −0.22; P < 0.0001). Similarly, in SELECT-PsA2, a statistically significantly greater reduction from baseline in the HAQ-DI score was achieved in bDMARD-experienced patients in the upadacitinib treatment groups compared with placebo at week 12. The differences in change from baseline between upadacitinib 15 mg and placebo was −0.21 (95% CI, −0.30 to −0.12; P < 0.0001). While in both studies, the between-group differences comparing upadacitinib and placebo in the improvement of the HAQ-DI score did not exceed the MID for the HAQ-DI (estimated in the literature at 0.35), the proportions of patients in the SELECT-PsA1 study who achieved a clinically meaningful improvement in HAQ-DI at week 12 were 33.4%, 47.2%, and 57.9% in the placebo, adalimumab 40 mg, and upadacitinib 15 mg treatment groups, respectively. In SELECT-PsA2, the proportions of patients who achieved a clinically meaningful improvement in HAQ-DI at week 12 were 27.2% and 44.6% in the placebo and upadacitinib 15 mg treatment groups, respectively. The clinical expert consulted for this review indicated that the between-group differences in the change from baseline in HAQ-DI were clinically relevant.
Table 13: Change From Baseline in Health Assessment Questionnaire–Disability Index at Week 12
Treatment group | Total N | Baseline, mean | Visit, mean | Change from baseline | ||
|---|---|---|---|---|---|---|
Within group | Between-group comparison | |||||
LS mean (95% CI) | LS mean difference (95% CI) | P valuea | ||||
HAQ-DI at week 12 (MMRM,b FAS) | ||||||
SELECT-PsA1 | ||||||
Placebo | 392 | 1.11 | 0.98 | −0.14 (−0.18 to −0.09) | −0.28 (−0.35 to −0.22) UPA vs. placebo | < 0.0001 |
ADA 40 mg e.o.w. | 406 | 1.11 | 0.78 | −0.34 (−0.38 to −0.29) | −0.08 (−0.15 to −0.01) superiority, UPA vs. ADA | NAc |
UPA 15 mg q.d. | 404 | 1.15 | 0.72 | −0.42 (−0.47 to −0.37) | Reference | — |
SELECT-PsA2 | ||||||
Placebo | 180 | 1.23 | 1.12 | −0.10 (−0.16 to −0.03) | −0.21 (−0.30 to −0.12) | < 0.0001 |
UPA 15 mg q.d. | 199 | 1.08 | 0.79 | −0.30 (−0.37 to −0.24) | ||
ADA = adalimumab; CI = confidence interval; e.o.w. = every other week; FAS = full analysis set; HAQ-DI = Health Assessment Questionnaire–Disability Index; LS = least squares; MMRM = mixed model for repeated measures; NA = not applicable; q.d. = every day; UPA = upadacitinib; vs. = versus .
aStatistically significant at the 0.025 level.
bWithin-group LS mean and 95% CI, and between-group LS mean difference and 95% CI and P value are based on an MMRM analysis with unstructured variance-covariance matrix, including treatment, visit, treatment-by-visit interaction, and the stratification factor of current disease-modifying antirheumatic drug use (yes/no) as fixed factors, and the continuous fixed covariate of baseline measurement. The MMRM analysis used observed longitudinal data up to week 12 before premature discontinuation of the study drug.
cIn SELECT-PsA1, testing for superiority in the change from baseline in HAQ-DI at week 12 was ranked below the point at which the hierarchical analysis failed (i.e., after testing had stopped due to failure to show superiority of UPA 15 mg vs. ADA); the P value is therefore not presented in this table.
Source: SELECT-PsA1 Clinical Study Report9 and SELECT-PsA2 Clinical Study Report.10
Work Productivity
In SELECT-PsA1 and PsA2, numerically greater reductions in work or activity impairment due to disease as measured by the WPAI questionnaire were observed for the upadacitinib group compared with placebo or adalimumab (in SELECT-PsA1) at week 24 (Appendix 3, Table 49). The between-group differences in change from baseline with upadacitinib compared to placebo or adalimumab did not exceed the estimated MID threshold of an improvement of at least 20% for presenteeism and at least 20% for activity impairment. Not all randomized patients participated in this evaluation; absenteeism, presenteeism, and work impairment were measured only in patients who were employed. For these 3 scores, the number of patients evaluated in each treatment group ranged from 42% to 48% in SELECT-PsA1 and 31% to 44% in SELECT-PsA2. More patients were included in the assessment of activity impairment (87% to 90% of patients in each SELECT-PsA1 treatment group; 79% to 87% of patients in each SELECT-PsA2 treatment group). Also, without a confirmed MID for the WPAI instrument, it remains unclear whether differences were clinically meaningful. This was an exploratory variable in both studies and was not included in the multiplicity-controlled statistical analyses.
Measurement of Psoriatic Arthritis Symptoms
Pain
In SELECT-PsA1 and SELECT-PsA2, the mean change in patient’s assessment of pain NRS scores decreased (improved) from baseline to week 12 for all treatment arms (Table 14), and the LS mean reduction in score was the same for upadacitinib and adalimumab in SELECT-PsA1. Specifically, the between-group comparison favoured upadacitinib numerically compared to placebo in both studies, with an LS mean difference of −1.3 (95% CI, −1.6 to −1.0) in SELECT-PsA1 and −1.4 (95% CI, −1.9 to −1.0) in SELECT-PsA2. However, neither treatment was favoured when upadacitinib was compared to adalimumab in SELECT-PsA1 (LS mean difference of 0.0; 95% CI, −0.3 to 0.3). In both trials, the comparison between upadacitinib and placebo was not included in the hierarchical statistical analysis. In SELECT-PsA1, the end point exploring comparisons of upadacitinib and adalimumab was ranked after the point at which the hierarchical analysis failed and was stopped, and no statistical comparisons can be made. An MID was not identified for patients with PsA.
Table 14: Change From Baseline in Patient’s Assessment of Pain at Week 12
Treatment group | Total N | Baseline, mean | Visit, mean | Change from baseline | ||
|---|---|---|---|---|---|---|
Within group | Between-group comparison | |||||
LS mean (95% CI) | LS mean difference (95% CI) | P value | ||||
Pain NRS at week 12 (MMRM, FAS) | ||||||
SELECT-PsA1a | ||||||
Placebo | 392 | 6.1 | 5.1 | −0.9 (−1.2 to −0.7) | −1.3 (−1.6 to −1.0) UPA vs. placebo | NAb |
ADA 40 mg e.o.w. | 406 | 5.9 | 3.6 | −2.3 (−2.5 to −2.1) | 0.0 (−0.3 to 0.3) superiority, UPA vs. ADA | NAc |
UPA 15 mg q.d. | 404 | 6.2 | 3.8 | −2.3 (−2.5 to −2.0) | Reference | — |
SELECT-PsA2d | ||||||
Placebo | 180 | 6.6 | 6.0 | −0.5 (−0.8 to −0.2) | −1.4 (−1.9 to −1.0) | NAd |
UPA 15 mg q.d. | 199 | 6.3 | 4.4 | −1.9 (−2.2 to −1.6) | ||
ADA = adalimumab; CI = confidence interval; e.o.w = every other week; FAS = full analysis set; LS = least squares; MMRM = mixed model for repeated measures; NA = not applicable; NRS = numerical rating scale; q.d. = every day; UPA = upadacitinib; vs. = versus .
aWithin-group LS mean and 95% CI, and between-group LS mean difference and 95% CI and P value are based on an MMRM analysis with unstructured variance-covariance matrix, including treatment, visit, treatment-by-visit interaction, and the stratification factor of current disease-modifying antirheumatic drug use (yes/no) as fixed factors and the continuous fixed covariate of baseline measurement. The MMRM analysis used observed longitudinal data up to week 12 before premature discontinuation of the study drug.
bIn SELECT-PsA1 and SELECT-PsA2, patient’s assessment of pain NRS (comparing UPA vs. placebo) was collected as a component of American College of Rheumatology response and was not included in the hierarchical statistical analysis; the P value is therefore not presented.
cIn SELECT-PsA1, change from baseline in patient’s assessment of pain at week 12 (comparing UPA vs. ADA) was ranked below the points at which the hierarchical analysis failed (i.e., after testing had stopped due to failure to show the superiority of UPA 15 mg vs. ADA); the P value is not presented in this table.
dWithin-group LS mean and 95% CI, and between-group LS mean, 95% CI and P value were based on an MMRM analysis with unstructured variance-covariance matrix, including treatment, visit, treatment-by-visit interaction, and prior biologic disease-modifying antirheumatic drug use as fixed factors and the baseline value as covariate.
Source: SELECT-PsA1 Clinical Study Report9 and SELECT-PsA2 Clinical Study Report.10
Fatigue
In SELECT-PsA1, a statistically significantly greater improvement from baseline in the FACIT-F score was seen in biologic-naive patients in the upadacitinib treatment groups compared with placebo at week 12 (Table 15). The differences in change from baseline between upadacitinib 15 mg and placebo was 3.5 (95% CI, 2.4 to 4.7; P = 0.0004). Similarly, in SELECT-PsA2, a statistically significantly greater improvement from baseline in the FACIT-F score was seen in bDMARD-experienced patients in the upadacitinib treatment groups compared with placebo at week 12. The differences in change from baseline between upadacitinib 15 mg and placebo was 3.7 (95% CI, 2.0 to 5.4; P < 0.0001). The between-group differences in the improvement in FACIT-F score at week 12 exceeded the estimated MID (3.1 points) in both studies.
Table 15: Change From Baseline in Functional Assessment of Chronic Illness Therapy — Fatigue at Week 12
Treatment group | Total N | Baseline, mean | Visit, mean | Change from baseline | ||
|---|---|---|---|---|---|---|
Within group | Between-group comparison | |||||
LS mean (95% CI) | LS mean difference (95% CI) | P valuea | ||||
FACIT-F at week 12 (MMRM,b FAS) | ||||||
SELECT-PsA1 | ||||||
Placebo | 394 | 30.3 | 32.8 | 2.8 (1.9 to 3.7) | 3.5 (2.4 to 4.7) UPA vs. placebo | 0.0004 |
ADA 40 mg e.o.w. | 410 | 29.8 | 35.3 | 5.7 (4.8 to 6.6) | ||
UPA 15 mg q.d. | 404 | 29.0 | 35.5 | 6.3 (5.4 to 7.2) | ||
SELECT-PsA2 | ||||||
Placebo | 184 | 26.4 | 28.1 | 1.3 (0.1 to 2.5) | 3.7 (2.0 to 5.4) | < 0.0001 |
UPA 15 mg q.d. | 201 | 27.9 | 32.8 | 5.0 (3.8 to 6.1) | ||
ADA = adalimumab; CI = confidence interval; e.o.w = every other week; FACIT-F = Functional Assessment of Chronic Illness Therapy–Fatigue; FAS = full analysis set; LS = least squares; MMRM = mixed model for repeated measures; q.d. = every day; UPA = upadacitinib; vs. = versus .
aStatistically significant at the 0.0125 level.
bWithin-group LS mean and 95% CI, and between-group LS mean difference and 95% CI and P value are based on an MMRM analysis with unstructured variance-covariance matrix, including treatment, visit, treatment-by-visit interaction, and the stratification factor of current disease-modifying antirheumatic drug use (yes/no) as fixed factors and the continuous fixed covariate of baseline measurement. The MMRM analysis used observed longitudinal data up to week 12 before premature discontinuation of study drug.
Source: SELECT-PsA1 Clinical Study Report9 and SELECT-PsA2 Clinical Study Report.10
Health-Related Quality of Life
Short Form (36) Health Survey
In SELECT-PsA1 at week 12, patients in the upadacitinib group reported higher PCS scores compared with placebo on the SF-36 (Table 16). The LS mean difference for the change in scores from baseline was 4.67 for upadacitinib 15 mg versus placebo (95% CI, 3.67 to 5.67; P = 0.0004). Similarly, in SELECT-PsA2 at week 12, patients in the upadacitinib treatment reported higher PCS scores compared with placebo on the SF-36. The LS mean difference was 3.52 for upadacitinib 15 mg versus placebo (95% CI, 2.07 to 4.98; P < 0.0001). In both studies, the difference versus placebo was more modest for the MCS than for the PCS, with an LS mean difference for upadacitinib 15 mg versus placebo of 1.70 (95% CI, 0.58 to 2.82) in SELECT-PsA1 and 2.98 (95% CI, 1.44 to 4.5) in SELECT-PsA2. The between-group differences achieved the estimated MID (typically between 2.5 and 5 points) for the PCS component in both studies, but the MCS component was only met in PsA2. As reported by Leung et al.,43 when using the MID of 3.74 (for PCS) and 1.77 (for MCS) in patients treated with TNF inhibitors, the between-group differences in patients enrolled in SELECT-PsA2 met the threshold only for the MCS component. Only the PCS component of SF-36 was part of the multiplicity-controlled statistical analyses.
Table 16: Change From Baseline in Short Form (36) Health Survey at Week 12
Treatment group | Total N | Baseline, mean | Visit, mean | Change from baseline | ||
|---|---|---|---|---|---|---|
Within-group | Between-group comparison | |||||
LS mean (95% CI) | LS mean difference (95% CI) | P valuea | ||||
Physical component summary at week 12 (MMRM,b FAS) | ||||||
SELECT-PsA1 | ||||||
Placebo | 394 | 35.19 | 38.44 | 3.19 (2.41 to 3.96) | 4.67 (3.67 to 5.67) UPA vs. placebo | 0.0004 |
ADA 40 mg e.o.w. | 410 | 35.91 | 42.54 | 6.82 (6.07 to 7.58) | ||
UPA 15 mg q.d. | 405 | 34.71 | 42.81 | 7.86 (7.09 to 8.63) | ||
SELECT-PsA2 | ||||||
Placebo | 185 | 34.33 | 36.07 | 1.62 (0.58 to 2.67) | 3.52 (2.07 to 4.98) | < 0.0001 |
UPA 15 mg q.d. | 201 | 35.08 | 40.11 | 5.15 (4.14 to 6.15) | ||
Mental component summary at week 12 (MMRM,b FAS) | ||||||
SELECT-PsA1 | ||||||
Placebo | 394 | 45.65 | 47.51 | 2.21 (1.35 to 3.06) | 1.70 (0.58 to 2.82) UPA vs. placebo | NAc |
ADA 40 mg e.o.w. | 410 | 45.13 | 48.67 | 3.59 (2.76 to 4.42) | ||
UPA 15 mg q.d. | 405 | 44.75 | 48.72 | 3.91 (3.06 to 4.75) | ||
SELECT-PsA2 | ||||||
Placebo | 185 | 43.70 | 43.97 | −0.13 (−1.25 to 0.98) | 2.98 (1.44 to 4.52) | NAc |
UPA 15 mg q.d. | 201 | 44.75 | 47.68 | 2.84 (1.78 to 3.91) | ||
ADA = adalimumab; CI = confidence interval; e.o.w. = every other week; FAS = full analysis set; LS = least squares; MMRM = mixed model for repeated measures; NA = not applicable; q.d. = every day; SF-36 = Short Form (36) Health Survey; UPA = upadacitinib; vs. = versus .
aStatistically significant at the 0.0125 level.
bWithin-group LS mean and 95% CI, and between-group LS mean difference and 95% CI and P value are based on an MMRM analysis with unstructured variance-covariance matrix, including treatment, visit, treatment-by-visit interaction, and the stratification factor of current disease-modifying antirheumatic drug use (yes/no) as fixed factors and the continuous fixed covariate of baseline measurement. The MMRM analysis used observed longitudinal data up to week 12 before premature discontinuation of the study drug.
cThe P value is not presented as the mental component summary was not included in the ranked (multiplicity-adjusted) secondary end points and was therefore not controlled for type I error rate.
Source: SELECT-PsA1 Clinical Study Report9 and SELECT-PsA2 Clinical Study Report.10
EuroQol 5-Dimensions 5-Levels Questionnaire
In SELECT-PsA1, there were greater improvements in the EQ-5D-5L utility index and VAS scores from baseline to week 24 in the upadacitinib treatment group compared to patients randomized to adalimumab treatment or placebo. The LS mean differences in the utility index were 0.09 (95% CI, 0.06 to 0.11) for upadacitinib 15 mg versus placebo and 0.03 (95% CI, 0.00 to 0.05) for upadacitinib 15 mg versus adalimumab 40 mg. The LS mean differences in the VAS score were 10.9 (95% CI, 8.0 to 13.7) for upadacitinib 15 mg versus placebo and 2.8 (95% CI, 0.0 to 5.6) for upadacitinib 15 mg versus adalimumab 40 mg (Appendix 3, Table 50).
In SELECT-PsA2, there were greater improvements in the EQ-5D-5L utility index and VAS scores from baseline to week 24 in the upadacitinib treatment group compared to the placebo group. The LS mean differences in the utility index was 0.10 (95% CI, 0.06 to 0.14) for upadacitinib 15 mg versus placebo. The LS mean differences in the VAS score was 6.8 (95% CI, 2.5 to 11.1) for upadacitinib 15 mg versus placebo (Appendix 3, Table 50).
For the comparison of upadacitinib to placebo in both SELECT-PSA1 and SELECT-PsA2, the LS mean between-group differences in the EQ-5D-5L utility index reached the MID threshold identified in the literature for the general Canadian population (summarized mean of 0.056; SD = 0.011). This end point was not included in the multiplicity-controlled testing hierarchy.
Measurement of Skin Disease
Psoriasis Area and Severity Index
Patients considered to be PASI 75 responders were those with a 75% improvement from baseline scores. Only patients with a BSA involvement of at least 3% at baseline had a PASI assessment.
In SELECT-PsA1, the proportion of patients achieving a PASI 75 response in the upadacitinib treatment group compared to the placebo group at week 16 was statistically significantly higher: 62.6% for upadacitinib 15 mg and 21.3% for placebo (41.3% difference; 95% CI, 32.8 to 49.8; P < 0.0001). In SELECT-PsA2, the proportion of patients achieving a PASI 75 response in the upadacitinib treatment group compared to placebo at week 16 was also statistically significantly higher: 52.3% for upadacitinib 15 mg and 16.0% for placebo (36.3% difference; 95% CI, 25.6 to 46.9; P < 0.001) (Table 17).
In both SELECT-PsA1 and SELECT-PsA2, additional exploratory end points showed that, numerically, a greater proportion of patients treated with upadacitinib achieved a PASI 75, PASI 90, or PASI 100 score at week 24 compared to patients who were treated with placebo. In SELECT-PsA1, the response rates were numerically similar between upadacitinib and adalimumab treatment groups, although a slightly higher proportion of patients in the adalimumab group achieved PASI 90 or PASI 100 at week 24 (Appendix 3, Table 51).
The clinical expert consulted for this review indicated that the between-group differences in PASI 75 were clinically relevant.
Table 17: Proportion of Patients Achieving PASI 75 at Week 16
Treatment group | Total N | Responders, n (%) | Response rate (95% CI)a | Response-rate difference vs. control | |
|---|---|---|---|---|---|
Point estimate (95% CI)b | P valuec | ||||
PASI 75 at week 16 (NRI, FAS) | |||||
SELECT-PsA1 | |||||
Placebo | 211 | 45 (21.3) | 21.3 (15.8 to 26.9) | 41.3 (32.8 to 49.8) UPA vs. placebo | < 0.0001 |
ADA 40 mg e.o.w. | 211 | 112 (53.1) | 53.1 (46.3 to 59.8) | ||
UPA 15 mg q.d. | 214 | 134 (62.6) | 62.6 (56.1 to 69.1) | ||
SELECT-PsA2 | |||||
Placebo | 131 | 21 (16.0) | 16.0 (9.7 to 22.3) | 36.3 (25.6 to 46.9) | < 0.0001 |
UPA 15 mg q.d. | 130 | 68 (52.3) | 52.3 (43.7 to 60.9) | ||
ADA = adalimumab; CI = confidence interval; e.o.w. = every other week; FAS = full analysis set; NRI = nonresponder imputation; PASI 75 = 75% reduction in Psoriasis Area Severity Index score; q.d. = every day; UPA = upadacitinib; vs. = versus .
Note: Analysis of PASI 75 was performed only in patients with BSA psoriasis of at least 3% at baseline.
a95% CI for response rates are calculated based on normal approximation to the binomial distribution.
b95% CI for response-rate difference are calculated based on normal approximation.
cP value was constructed using a Cochran-Mantel-Haenszel test adjusting for the main stratification factor of current disease-modifying antirheumatic drug use (yes/no). The P value was statistically significant at the 0.025 level.
Source: SELECT-PsA1 Clinical Study Report9 and SELECT-PsA2 Clinical Study Report.10
Static Investigator Global Assessment of Psoriasis
Only patients with an sIGA score of at least 2 at baseline, and an improvement of at least 2 points from baseline at week 16 were assessed (Table 18).
In SELECT-PsA1, the proportion of patients achieving a response (an sIGA of psoriasis score of 0 or 1 and an improvement of at least 2 points from baseline) in the upadacitinib treatment group compared to placebo was statistically significantly higher at week 16: 41.9% for upadacitinib 15 mg and 10.9% for placebo (between-group difference 31.1%; 95% CI 24.7 to 37.5; P < 0.0001). In SELECT-PsA2, the proportion of patients achieving response in the upadacitinib treatment group compared to placebo was also statistically significantly higher at week 16: 36.8% for upadacitinib 15 mg and 9.2% for placebo (between-group difference 27.6%; 95% CI, 19.2 to 36.1; P < 0.0001).
Table 18: Proportion of Patients Achieving an sIGA of Psoriasis Score of 0 or 1 at Week 16
Treatment group | Total N | Responders, n (%) | Response rate (95% CI)a | Response-rate difference vs. control | |
|---|---|---|---|---|---|
Point estimate (95% CI)b | P valuec | ||||
sIGA at week 16 (NRI, FAS) | |||||
SELECT-PsA1 | |||||
Placebo | 313 | 34 (10.9) | 10.9 (7.4 to 14.3) | 31.1 (24.7 to 37.5) UPA vs. placebo | < 0.0001 |
ADA 40 mg e.o.w. | 330 | 127 (38.5) | 38.5 (33.2 to 43.7) | ||
UPA 15 mg q.d. | 322 | 135 (41.9) | 41.9 (36.5 to 47.3) | ||
SELECT-PsA2 | |||||
Placebo | 163 | 15 (9.2) | 9.2 (4.8 to 13.6) | 27.6 (19.2 to 36.1) | < 0.0001 |
UPA 15 mg q.d. | 171 | 63 (36.8) | 36.8 (29.6 to 44.1) | ||
ADA = adalimumab; CI = confidence interval; e.o.w. = every other week; FAS = full analysis set; NRI = nonresponder imputation; q.d. = every day; sIGA = static Investigator Global Assessment; UPA = upadacitinib; vs. = versus .
Note: Analysis was performed for patients who achieved score of 0 or 1 and an improvement of at least 2 points from baseline, and only in patients with baseline sIGA of at least 2%.
a95% CI for response rates are calculated based on normal approximation to the binomial distribution.
b95% CI for response rate difference are calculated based on normal approximation.
cThe P value was constructed using a Cochran-Mantel-Haenszel test adjusting for the main stratification factor of current disease-modifying antirheumatic drug use (yes/no). The P value was statistically significant at the 0.025 level.
Source: SELECT-PsA1 Clinical Study Report9 and SELECT-PsA2 Clinical Study Report.10
Self-Assessment of Psoriasis Symptoms
In SELECT-PsA1 at week 16, patients in the upadacitinib group reported greater reductions in SAPS score compared with placebo (Table 19). The LS mean difference was −17.1 (95% CI, −19.6 to −14.6) for upadacitinib 15 mg versus placebo. Testing for superiority of upadacitinib compared to placebo was part of the multiplicity-adjusted analyses in SELECT-PsA1; however, it was ranked after the point at which the hierarchical analysis failed and was stopped, and no statistical comparisons can be made. In SELECT-PsA2 at week 16, patients in the upadacitinib treatment reported greater reductions in SAPS scores compared to placebo. The LS mean difference was −22.9 for upadacitinib 15 mg versus placebo (95% CI, −27.4 to −18.4; P < 0.0001).
Table 19: Change From Baseline in Self-Assessment of Psoriasis Symptoms at Week 16
Treatment group | Total N | Baseline, mean | Visit, mean | Change from baseline | ||
|---|---|---|---|---|---|---|
Within group | Between-group comparison | |||||
LS mean (95% CI) | LS mean difference (95% CI) | P valuea | ||||
SAPS at week 16 (MMRM,b FAS) | ||||||
SELECT-PsA1 | ||||||
Placebo | 388 | 44.0 | 34.6 | −8.2 (−10.2 to −6.3) | −17.1 (−19.6 to −14.6) UPA vs. placebo | NAc |
ADA 40 mg e.o.w. | 407 | 43.0 | 19.8 | −22.7 (−24.7 to −20.8) | ||
UPA 15 mg q.d. | 396 | 44.0 | 17.5 | −25.3 (−27.3 to −23.4) | ||
SELECT-PsA2 | ||||||
Placebo | 182 | 52.6 | 49.5 | −1.5 (−4.7 to 1.8) | −22.9 (−27.4 to −18.4) | < 0.0001 |
UPA 15 mg q.d. | 191 | 49.5 | 25.3 | −24.4 (−27.5 to −21.2) | ||
ADA = adalimumab; CI = confidence interval; e.o.w = every other week; FAS = full analysis set; LS = least squares; MMRM = mixed model for repeated measures; NA = not applicable; q.d. = every day; SAPS = Self-Assessment of Psoriasis Symptoms; UPA = upadacitinib; vs. = versus .
aStatistically significant at the 0.05 level in SELECT-PSA1 and at the 0.0125 level in SELECT-PsA2.
bWithin-group LS mean and 95% CI, and between-group LS mean difference and 95% CI and P value are based on an MMRM analysis with unstructured variance-covariance matrix, including treatment, visit, treatment-by-visit interaction, and the stratification factor of current disease-modifying antirheumatic drug use (yes/no) as fixed factors and the continuous fixed covariate of baseline measurement. The MMRM analysis used observed longitudinal data up to week 16 prior premature discontinuation of the study drug.
cIn SELECT-PsA1, change from baseline in SAPS at week 16 was ranked below the point at which the hierarchical analysis failed (i.e., after testing had stopped due to failure of showing superiority of UPA 15 mg vs. ADA); the P value is therefore not presented in this table.
Source: SELECT-PsA1 Clinical Study Report9 and SELECT-PsA2 Clinical Study Report.10
Measurement of Other Musculoskeletal Disease
Enthesitis
The resolution of enthesitis, defined as an LEI score of 0, was included in the hierarchical statistical analysis only in SELECT-PsA1, and was measured in patients who had a baseline LEI greater than 0 (Table 20). Using multiplicity-controlled analyses, the proportion of patients in SELECT-PsA1 achieving resolution of enthesitis was statistically significantly higher at week 24 in the upadacitinib treatment group compared to placebo: 53.7% for upadacitinib 15 mg and 32.4% for placebo (between-group difference 21.3%; 95% CI, 13.0 to 29.7; P = 0.0004). In SELECT-PsA2, a numerically higher proportion of patients in the upadacitinib treatment group achieved resolution of enthesitis at week 24 compared to patients in the placebo group: 42.9% for the upadacitinib 15 mg group, 15.3% for placebo (between-group difference 27.6%; 95% CI, 17.3 to 37.8). This end point was not part of the multiplicity-controlled statistical analyses in PsA2.
Table 20: Proportion of Patients Achieving Enthesitis Resolution at Week 24
Treatment group | Total N | Responders, n (%) | Response rate (95% CI)a | Response-rate difference vs. control | |
|---|---|---|---|---|---|
Point estimate (95% CI)b | P valuec | ||||
LEI = 0 at week 24 (NRI,d FAS) | |||||
SELECT-PsA1 | |||||
Placebo | 241 | 78 (32.4) | 32.4 (26.5 to 38.3) | 21.3 (13.0 to 29.7) UPA vs. placebo | 0.0004 |
ADA 40 mg e.o.w. | 265 | 125 (47.2) | 47.2 (41.2 to 53.2) | ||
UPA 15 mg q.d. | 270 | 145 (53.7) | 53.7 (47.8 to 59.7) | ||
SELECT-PsA2 | |||||
Placebo | 144 | 22 (15.3) | 15.3 (9.4 to 21.2) | 27.6 (17.3 to 37.8) | NAe |
UPA 15 mg q.d. | 133 | 57 (42.9) | 42.9 (34.4 to 51.3) | ||
ADA = adalimumab; CI = confidence interval; e.o.w. = every other week; FAS = full analysis set; LEI = Leeds Enthesitis Index; NA = not applicable; NRI = nonresponder imputation; q.d. = every day; UPA = upadacitinib; vs. = versus .
Note: Resolution was defined as an LEI score of 0; analysis was performed for patients who had a baseline LEI greater than 0.
a95% CI for response rates are calculated based on normal approximation to the binomial distribution.
b95% CI for response rate difference are calculated based on normal approximation.
cThe P value was constructed using a Cochran-Mantel-Haenszel test adjusting for the main stratification factor of current disease-modifying antirheumatic drug use (yes/no). The P value was statistically significant at the 0.025 level.
dNonresponder imputation with additional rescue handling was used, with patients rescued at week 16 imputed as nonresponders.
eIn SELECT-PsA2, resolution of LEI was not included in the ranked (multiplicity-adjusted) secondary end points and therefore was not controlled for type I error rate. The P value is not presented.
Source: SELECT-PsA1 Clinical Study Report9 and SELECT-PsA2 Clinical Study Report.10
Dactylitis
The resolution of dactylitis, defined as an LDI of 0, was included in the hierarchical statistical analysis in SELECT-PsA1 only, and was measured in patients who had a baseline LDI of greater than 0 (Table 21). In SELECT-PsA1, the proportion of patients achieving resolution of dactylitis, defined as an LDI of 0, was numerically higher at week 24 in the upadacitinib treatment group compared to placebo: 76.5% for upadacitinib 15 mg and 39.7% for placebo (between-group difference 36.8%; 95% CI, 25.7 to 47.9). This end point was included in the hierarchical statistical analysis in SELECT-PsA1; however, because it was ranked after the point at which the hierarchical analysis failed and was stopped, no statistical comparisons can be made. In SELECT-PsA2, a numerically higher proportion of patients in the upadacitinib treatment group achieved resolution of dactylitis at week 24 compared to patients in the placebo group: 58.2% for upadacitinib 15 mg and 28.1% placebo (between-group difference 30.1%; 95% CI; 13.0 to 47.1). This end point was not part of the multiplicity-controlled statistical analyses in PsA2.
Table 21: Proportion of Patients Achieving Dactylitis Resolution at Week 24
Treatment group | Total N | Responders, n (%) | Response rate (95% CI)a | Response-rate difference vs. control | |
|---|---|---|---|---|---|
Point estimate (95% CI)b | P valuec | ||||
LDI = 0 at week 24 (NRI,d FAS) | |||||
SELECT-PsA1 | |||||
Placebo | 126 | 50 (39.7) | 39.7 (31.1 to 48.2) | 36.8 (25.7 to 47.9) UPA vs. placebo | NAe |
ADA 40 mg e.o.w. | 127 | 94 (74.0) | 74.0 (66.4 to 81.6) | ||
UPA 15 mg q.d. | 136 | 104 (76.5) | 76.5 (69.3 to 83.6) | ||
SELECT-PsA2 | |||||
Placebo | 64 | 18 (28.1) | 28.1 (17.1 to 39.1) | 30.1 (13.0 to 47.1) | NAf |
UPA 15 mg q.d. | 55 | 32 (58.2) | 58.2 (45.1 to 71.2) | ||
ADA = adalimumab; CI = confidence interval; e.o.w. = every other week; FAS = full analysis set; LDI = Leeds Dactylitis Index; NA = not applicable; NRI = nonresponder imputation; q.d. = every day; UPA = upadacitinib; vs. = versus .
Note: Resolution was defined as an LDI of 0; analysis was performed for patients who had a baseline LDI greater than 0.
a95% CI for response rates are calculated based on normal approximation to the binomial distribution.
b95% CI for response-rate difference are calculated based on normal approximation.
cThe P value was constructed using a Cochran-Mantel-Haenszel test adjusting for the main stratification factor of current disease-modifying antirheumatic drug use (yes/no).
dNonresponder imputation with additional rescue handling was used, with patients rescued at week 16 imputed as nonresponders.
eIn SELECT-PsA1, resolution of dactylitis at week 24 was ranked below the point at which the hierarchical analysis failed (i.e., after testing had stopped due to failure of showing superiority of UPA 15 mg vs. ADA); the P value is therefore not presented in this table.
fIn SELECT-PsA2, resolution of LDI was not included in the ranked (multiplicity-adjusted) secondary end points and was not controlled for type I error rate; the P value is therefore not presented.
Source: SELECT-PsA1 Clinical Study Report9 and SELECT-PsA2 Clinical Study Report.10
Axial Arthritis
In SELECT-PsA1 and SELECT-PsA2, change in axial disease was assessed in patients with psoriatic spondylitis at baseline. The number of patients included in this assessment was approximately 30% of those randomized into each treatment group in SELECT-PsA1, and approximately 35% in patients randomized to each treatment in SELECT-PsA2 (Appendix 3, Table 52). In SELECT-PsA1, greater improvement in BASDAI score from baseline to week 24 was observed in the upadacitinib treatment group compared to adalimumab or placebo. The LS mean difference between upadacitinib and placebo in the change in scores was −1.42 (95% CI, −1.94 to −0.90), whereas the LS mean difference between upadacitinib and adalimumab was −0.57 (95% CI, −1.09 to −0.05). In PsA2, greater improvement in the BASDAI score from baseline to week 24 was observed in the upadacitinib 15 mg group compared to the placebo group. The LS mean difference between upadacitinib and placebo in PsA2 was −1.85 (95% CI, −2.55 to −1.15). The difference between treatment groups in the change in scores from baseline did not achieve the MID identified in the literature (a change of −1.96). However, the change in scores from baseline within each active treatment group (upadacitinib and adalimumab) achieved the estimated MID. This end point was not part of the multiplicity-controlled statistical analyses.
Radiographic Changes
Sharp/van der Heijde Score
Radiographic change, as measured by SHS, was only assessed in SELECT-PsA1 (Table 22). At week 24, the difference in mean change from baseline in SHS was statistically significant for the upadacitinib treatment group compared to placebo (−0.29; 95% CI, −0.44 to −0.14; P = 0.0004). An MID for SHS in patients with PsA is unknown; however, the clinical expert consulted for this review noted that the small changes seen are unlikely to be significantly clinically meaningful to patients, and that it is difficult to observe meaningful radiographic changes within 24 weeks in the study population.
Table 22: Change From Baseline in Psoriatic Arthritis Sharp/van der Heijde Score at Week 24
Treatment group | Total N | Baseline, mean | Visit, mean | Change from baseline | ||
|---|---|---|---|---|---|---|
Within group | Between-group comparison | |||||
LS mean (95% CI) | LS mean difference (95% CI) | P valuea | ||||
SHS at week 24 (ANCOVA,b FAS) | ||||||
SELECT-PsA1 | ||||||
Placebo | 372 | 13.05 | 13.31 | 0.25 (0.13 to 0.36) | −0.29 (−0.44 to −0.14) UPA vs. placebo | 0.0004 |
ADA 40 mg | 384 | 14.89 | 14.92 | 0.01 (−0.11 to 0.13) | ||
UPA 15 mg | 391 | 13.44 | 13.42 | −0.04 (−0.16 to 0.07) | ||
SELECT-PsA2 | ||||||
Placebo | NR | NR | NR | NR | NR | NR |
UPA 15 mg | NR | NR | NR | NR | ||
ADA = adalimumab; ANCOVA = analysis of covariance; CI = confidence interval; FAS = full analysis set; LS = least squares; NR = not reported; SHS = Sharp/van der Heijde Score; UPA = upadacitinib; vs. = versus .
aStatistically significant at the 0.025 level.
bResults for SHS were based on an ANCOVA with linear extrapolation for missing data and rescue handling. Within-group LS mean and 95% CI, and between-group LS mean difference and 95% CI and P value are based on an ANCOVA model including treatment and the stratification factor of current disease-modifying antirheumatic drug use (yes/no) as fixed factors and baseline value as covariate.
Source: SELECT-PsA1 Clinical Study Report9 and SELECT-PsA2 Clinical Study Report.10
Harms
Only those harms identified in the review protocol are reported below. Table 23 provides detailed harms data.
Adverse Events
In SELECT-PsA1, the percentage of patients with TEAEs overall was numerically higher in the upadacitinib and adalimumab treatment groups compared to placebo. One or more AE was reported in 66.9% of patients treated with upadacitinib 15 mg once daily, 64.8% treated with adalimumab 40 mg every other week, and 59.6% of patients in the placebo group during the double-blind treatment period. In SELECT-PsA2, a similar proportion of patients experienced 1 or more AEs (64.0% of patients in the upadacitinib 15 mg once daily group and 65.6% in the placebo group) during the double-blind treatment period. Generally, the majority of AEs were mild or moderate in severity. The most frequently reported AE in both studies was upper respiratory tract infection. Across the 2 studies, a higher proportion of patients in PsA1 experienced upper respiratory tract infection, as well as elevated blood CPK, alanine aminotransferase, and aspartate aminotransferase levels; a higher proportion of patients in SELECT-PsA2 experienced psoriatic arthropathy, which referred to the worsening of the underlying PsA disease.
Serious Adverse Events
In SELECT-PsA1, the proportion of patients who experienced 1 or more SAEs was similar across all treatment groups (3.3% of upadacitinib 15 mg, 3.7% of adalimumab 40 mg, 3.1% in placebo). No more than 1 patient in any treatment group reported SAEs, with the exception of pneumonia (2 patients in the placebo group) and sepsis (2 patients in the upadacitinib 15 mg group).
In SELECT-PsA2, a greater proportion of patients in the upadacitinib 15 mg (5.7%) experienced an SAE compared to patients in the placebo group (1.9%). No more than 1 patient in any treatment group reported SAEs, with the exception of psoriatic arthropathy, and nephrolithiasis (each of which were reported in 2 patients in the upadacitinib 15 mg group). Psoriatic arthropathy referred to worsening of the underlying PsA disease. Details of the reported SAEs are presented in Table 23.
Withdrawals Due to Adverse Events
In SELECT-PsA1, the percentages of patients with AEs leading to discontinuation of study drug were numerically highest in the adalimumab group and similar between the upadacitinib and placebo groups. Up to week 24, 3.0% of patients treated with upadacitinib 15 mg, 5.1% of patients treated with adalimumab 40 mg, and 3.1% of patients in the placebo group discontinued study treatment due to an AE (Table 23). Most AEs leading to study drug discontinuation were mild to moderate in severity. Four patients in the placebo group, 6 patients in the adalimumab group, and 4 patients in the upadacitinib group experienced SAEs that led to study drug discontinuation. Of these, the SAEs that lead to treatment discontinuation and were thought to be reasonably related to the study drug were sepsis (2 patients) and pyrexia (1 patient) in the upadacitinib 15 mg group, and hepatic encephalopathy (1 patient) and portal vein thrombosis (1 patient) in the adalimumab 40 mg group.
In SELECT-PsA2, the percentage of patients who discontinued study treatment due to an AE was numerically higher in the upadacitinib group. Up to week 24, 7.1% of patients treated with upadacitinib 15 mg and 5.2% of patients in the placebo group discontinued study treatment due to an AE (Table 23). Most AEs leading to study drug discontinuation were mild to moderate in severity. Two patients in the placebo group and 6 patients in the upadacitinib 15 mg group experienced an SAE that led to study drug discontinuation. Of these, the SAEs that lead to treatment discontinuation and were reasonably assumed to be related to the study drug were rapidly progressive osteoarthritis, psoriatic arthropathy, blood loss anemia, acute respiratory failure, pulmonary embolism, cardiorespiratory arrest (1 patient each) in the upadacitinib 15 mg group.
Mortality
During the double-blind period (up to week 24), SELECT-PsA1 and SELECT-PsA2 each recorded a single treatment-emergent death. In both studies, the death occurred in a patient in the placebo group.
Notable Harms
Percentages of patients who experienced a notable harm identified for this review can be found in Table 23. Overall, the proportions of patients experiencing notable harms during the double-blind period were low, and no explicit imbalances between the 2 studies were seen, with the exception of a numerically higher proportion of patients who reported CPK elevation and hepatic disorder in SELECT-PsA1. In SELECT-PsA1, 8.9% of patients treated with upadacitinib 15 mg, 5.6% of patients treated with adalimumab 40 mg, and 1.4% of patients in the placebo group experienced elevated CPK levels. Comparatively, in SELECT-PsA2, 1.9% of patients in each treatment group (upadacitinib 15 mg and placebo) experienced elevated CPK levels. Hepatic disorder was reported in 9.1%, 15.6%, and 3.8% of SELECT-PsA1 patients treated with upadacitinib 15 mg, adalimumab 40 mg, and placebo, respectively. In SELECT-PsA2, 1.9% of patients treated with upadacitinib 15 mg and 1.4% of patients in the placebo group were reported as having hepatic disorder as an AE.
Table 23: Summary of Harms Up to Week 24 — Safety Population
Adverse events | SELECT-PsA1 | SELECT-PsA2 | |||
|---|---|---|---|---|---|
PBO n = 423 | ADA 40 mg n = 429 | UPA 15 mg n = 429 | PBO n = 212 | UPA 15 mg n = 211 | |
Patients with ≥ 1 adverse event | |||||
n (%) | 252 (59.6) | 278 (64.8) | 287 (66.9) | 139 (65.6) | 135 (64.0) |
Most common events,a n (%) | |||||
Upper respiratory tract infection | 34 (8.0) | 30 (7.0) | 44 (10.3) | 10 (4.7) | 13 (6.2) |
Increase blood CPK | 6 (1.4) | 24 (5.6) | 38 (8.9) | 4 (1.9) | 4 (1.9) |
Nasopharyngitis | 21 (5.0) | 29 (6.8) | 21 (4.9) | 17 (8.0) | 10 (4.7) |
Increased ALT | 12 (2.8) | 32 (7.5) | 19 (4.4) | 1 (0.5) | 2 (0.9) |
Urinary tract infection | 10 (2.4) | 14 (3.3) | 18 (4.2) | 12 (5.7) | 9 (4.3) |
Diarrhea | 10 (2.4) | 9 (2.1) | 18 (4.2) | 12 (5.7) | 5 (2.4) |
Increased AST | 8 (1.9) | 22 (5.1) | 14 (3.3) | 1 (0.5) | 0 |
Psoriatic arthropathyb | 13 (3.1) | 5 (1.2) | 6 (1.4) | 11 (5.2) | 10 (4.7) |
Patients with ≥ 1 serious adverse event | |||||
n (%) | 13 (3.1) | 16 (3.7) | 14 (3.3) | 4 (1.9) | 12 (5.7) |
Most common events,c n (%) | |||||
Sepsis | 0 | 0 | 2 (0.5) | NR | NR |
Pneumonia | 2 (0.5) | 1 (0.2) | 1 (0.2) | 0 | 1 (0.5) |
Nephrolithiasis | NR | NR | NR | 0 | 2 (0.9) |
Psoriatic arthropathyb | NR | NR | NR | 0 | 2 (0.9) |
Patients who stopped treatment due to adverse events | |||||
n (%) | 13 (3.1) | 22 (5.1) | 13 (3.0) | 11 (5.2) | 15 (7.1) |
Most common events,c n (%) | |||||
Sepsis | 0 | 0 | 2 (0.5) | NR | NR |
Psoriatic arthropathyb | 0 | 0 | 1 (0.2) | 2 (0.9) | 4 (1.9) |
Increased ALT | 0 | 2 (0.5) | 0 | 0 | 0 |
Increased AST | 0 | 2 (0.5) | 0 | 0 | 0 |
Alopecia | 0 | 2 (0.5) | 0 | NR | NR |
Muscle spasms | 2 (0.5) | 0 | 0 | NR | NR |
Decreased white blood cell count | 0d | 0d | 0d | 0 | 2 (0.9) |
Psoriasis | 0 | 1 (0.2) | 0 | 2 (0.9) | 0 |
Treatment-emergent deaths | |||||
n (%)e | 1 (0.2) | 0 | 0 | 1 (0.5) | 0 |
Cardiac arrest (undetermined/unknown cause of death) | 1 (0.2) | — | — | — | — |
Rib fracture, traumatic hemothorax | — | — | — | 1 (0.5) | — |
Notable harms, n (%) | |||||
Serious infection | 4 (0.9) | 3 (0.7) | 5 (1.2) | 1 (0.5) | 1 (0.5) |
Serious pneumonia | 2 (0.5) | 1 (0.2) | 1 (0.2) | 0 | 1 (0.5) |
Herpes zoster | 3 (0.7) | 0 | 4 (0.9) | 2 (0.9) | 3 (1.4) |
Active tuberculosis | 0 | 0 | 0 | 0 | 0 |
Anemia | 4 (0.9) | 1 (0.2) | 3 (0.7) | 2 (0.9) | 4 (1.9) |
Neutropenia | 1 (0.2) | 10 (2.3) | 4 (0.9) | 1 (0.5) | 2 (0.9) |
Lymphopenia | 5 (1.2) | 1 (0.2) | 6 (1.4) | 0 | 2 (0.9) |
Malignancy (any) | 1 (0.2) | 3 (0.7) | 1 (0.2) | 0 | 3 (1.4) |
VTEf (fatal and non-fatal) | 1 (0.2) | 2 (0.5) | 0 | 0 | 1 (0.5) |
Arterial thrombosisg | 0 | 1 (0.2) | 0 | 0 | 0 |
Gastrointestinal perforation | 0 | 0 | 0 | 0 | 0 |
CPK elevation | 6 (1.4) | 24 (5.6) | 38 (8.9) | 4 (1.9) | 4 (1.9) |
Hepatic disorder | 16 (3.8) | 67 (15.6) | 39 (9.1) | 3 (1.4) | 4 (1.9) |
MACEh | 1 (0.2) | 2 (0.5) | 0 | 0 | 1 (0.5) |
Hyperlipidemia | 3 (0.7) | 1 (0.2) | 1 (0.2) | 1 (0.5) | 5 (2.4) |
ADA = adalimumab; ALT = alanine aminotransferase; AST = aspartate aminotransferase; CPK = creatine phosphokinase; MACE = major adverse cardiovascular event; NR = not reported; PBO = placebo; UPA = upadacitinib, VTE = venous thromboembolic event.
aFrequency of 5% or greater in any treatment group.
bThe term psoriatic arthropathy refers to worsening of the underlying PsA disease.
cFrequency of at least 2 patients in any treatment group.
dClassified as leukopenia.
eTreatment-emergent deaths were captured for deaths occurring no more than 30 days after last dose (or no more than 70 days for patients in the adalimumab group). In SELECT-PsA1, from week 24 to the data cut-off, 1 additional death in the upadacitinib 15 mg treatment group was reported, occurring more than 30 days after the last dose of the study drug (participant had withdrawn consent).
fIncludes fatal and non-fatal deep-vein thrombosis and pulmonary embolism. None of the patients experience a fatal VTE.
gIncludes non-cardiac, non-neurologic, non-fatal events.
hDefined as cardiovascular death, non-fatal myocardial infarction, and non-fatal stroke.
Source: SELECT-PsA1 Clinical Study Report9 and SELECT-PsA2 Clinical Study Report.10
Critical Appraisal
Internal Validity
SELECT-PsA1 and SELECT-PsA2 were randomized trials with a double-blind period up to week 24. Appropriate methods of randomization, blinding, and allocation concealment were reported. Patients were stratified at randomization according to extent of psoriasis (≥ 3% BSA or < 3% BSA), current use of at least 1 DMARD, presence of dactylitis, and presence of enthesitis in SELECT-PsA1, and according to extent of psoriasis, current use of at least 1 DMARD, and number of prior failed bDMARDs (1 versus > 1) in SELECT-PsA2. Patients from China and Japan were stratified only by extent of psoriasis. All clinical laboratory tests (including clinical chemistry, hematology, and urinalysis) were analyzed by a central laboratory. Radiographs taken at screening were read by the investigator to determine if the patient fulfills the classification criteria for PsA; imaging of hands and feet taken during the study were reviewed and assessed centrally by qualified reader. In general, patients’ baseline demographic and disease characteristics were similar between treatment groups within each study. Only minor differences were seen between the upadacitinib and placebo group in SELECT-PsA2, which are unlikely to have a significant impact on the study results. For example, the placebo group enrolled patients with a slightly higher mean LDI, those with an sIGA score of 0, and those who had received no prior non-bDMARD. In both studies, the sponsor was unblinded at week 24 to conduct an analysis, but the investigators and patients remained blinded to their allocated treatment until the end of period 1 (week 56). In SELECT-PsA2, no more than approximately 30% of patients with prior failure of more than 1 bDMARD were enrolled. As a result, most patients had failed on only 1 previous treatment. Overall, the results were consistent with those seen in SELECT-PsA1, in which patients had not been exposed to a previous bDMARD.
Multiplicity-controlled analyses using a hierarchical test procedure for ranked primary and key secondary efficacy outcomes was used in both studies to control the overall type I error rate at 5%. Testing was performed sequentially, with alpha transferred down a specific path. Statistical testing for the hypotheses was performed only if the previous null hypothesis in the hierarchy could be rejected. A limitation with this approach is that only certain outcomes were selected and therefore it did not take into consideration all outcomes measured in the study, including HRQoL as measured by the EQ-5D-5L, patient symptom improvement (i.e., pain), or work productivity. These outcomes were identified as exploratory or additional outcomes in SELECT-PsA1 and SELECT-PsA2, even though HRQoL and work productivity were identified by patient groups as important outcomes. In addition, no rationales were provided for the choice of outcomes that were included in the hierarchy. Several outcomes that were identified in the CADTH review protocol and reported in the studies fell outside the statistical testing hierarchy and any interpretation should therefore consider the possibility of type I error. Given the large number of comparisons in the study, a statistically significant finding may be attributable to an inflated type I error.
Key end points comparing upadacitinib to adalimumab were measured at week 12. According to the clinical expert consulted for this review, this may not have provided adequate time for adalimumab to show maximal benefit. The benefits of JAK inhibitors are thought to be seen generally sooner than those of TNF inhibitors, and end points measured at week 12 may have favoured upadacitinib. While the results for both upadacitinib and adalimumab were consistent until 24 weeks, it is uncertain whether upadacitinib 15 mg is noninferior to adalimumab due to the lack of statistical testing at week 24. Also, the noninferiority and superiority comparison between upadacitinib and adalimumab was conducted only for the ACR20 efficacy outcome, making it unclear whether upadacitinib would be noninferior or superior to adalimumab for other outcome measures.
Despite showing statistically significant differences in the trials, some end points may not be clinically meaningful to patients. For example, subjective measures such as fatigue, or the small changes seen in SHS, may not translate to a true overall improvement in daily life, particularly when measured over such a short length of time relative to the long disease course of PsA. The clinical expert consulted for this review noted that it is difficult to extrapolate the significance of these changes over the lifetime of a patient with PsA. In particular, it is uncertain whether the radiographic changes seen in SELECT-PsA1 correlate with a direct and meaningful improvement in a patient’s physical function, quality of life, or permanent disability.
Rescue therapy was permitted starting at week 16. It is difficult to differentiate the effects of the drugs from changes in background therapy on the outcomes observed after week 16, making interpretation of results challenging. This may also confound the results of patient-reported outcomes, such as HRQoL, symptoms, and disability measures, as well as AEs in the long term. To adjust for patients who received rescue therapy, the end points of MDA, resolution of enthesitis, and resolution of dactylitis, all measured at week 24, considered patients who required rescue therapy to be nonresponders, which was appropriate for a more conservative assessment.
Several pre-specified subgroup analyses were performed for the primary end point. The CADTH systematic review protocol included subgroups by PsA disease severity at baseline, previous exposure to bDMARDs (treatment-naive versus -experienced), and concomitant treatment with a non-bDMARD. In both studies, the results of the subgroup analysis exploring concomitant treatment with a non-bDMARD was consistent with the primary analysis, regardless of whether patients received concurrent non-bDMARDs. Inclusion criteria for PsA1 and PsA2 allowed examination of treatment effects separately for biologic-naive (SELECT-PsA1) and biologic-experienced (SELECT-PsA2) patients. Neither study provided subgroup data based on disease severity at baseline. The results of the pre-specified subgroup analyses performed for the primary end point should be interpreted with caution due to the small sample sizes and lack of control for type I error, and also because the trial was not powered to test specific hypotheses in subgroups. As with the end points that were not part of the statistical testing hierarchy, the results of these subgroup analyses should be interpreted with caution. Although small differences in ACR20 were evident within some pre-specified subgroups, the results should be interpreted with caution due to the small sample sizes and lack of control for type I error, and also because the trial was not powered to test specific hypotheses in subgroups. As with the end points that were not part of the statistical testing hierarchy, the results of these subgroup analyses should be interpreted with caution.
A noninferiority analysis of upadacitinib compared to adalimumab was part of the key secondary end points in SELECT-PsA1. Initially, the noninferiority margin was set at 15% based on prior data but it was changed in Protocol Amendment 2. A rationale for the change and justification for the new analysis, which aimed to demonstrate preservation of at least 50% of the placebo-subtracted adalimumab effect by upadacitinib, were not provided. However, the clinical expert consulted for the review described this as a reasonable measure that reflected the noninferiority of upadacitinib versus the active control group. Similar numbers of patients were included in the PPS as the FAS, and consistent results were seen between the 2 analysis sets.
Missing data (i.e., randomized patients not included in the analysis) are a concern in the analyses of patient-reported outcomes and continuous end points, such as HAQ-DI, SF-36, patient’s assessment of pain NRS, FACIT-F, and EQ-5D-5L. Particularly in SELECT-PsA2, the placebo group was missing up to approximately 15% of patients at week 12, and approximately 20% at week 24 (EQ-5D). In the upadacitinib 15 mg group of SELECT-PsA2, generally less than 5% of data were missing at week 12, with 13% missing at week 24 for EQ-5D-5L. In SELECT-PsA1, generally less than 10% were missing up to week 24. Although a large proportion of missing data can make results more uncertain (particularly in the placebo group of PsA2 for EQ-5D-5L), the main secondary end points of this trial were likely less subject to this bias due to their evaluation at week 12, at which point there were fewer missing patients. Sensitivity analyses were conducted using different forms of imputation, including as-observed data handling and an analysis of covariance model for continuous efficacy outcomes, and tipping-point analysis of HAQ-DI at week 12 using multiple imputation. The results of these sensitivity analyses were consistent with the results from the primary analysis. The missing-imputation method for binary outcomes employed a nonresponder imputation; supplemental as-observed data-handing analysis showed consistent results, which suggests that missing data had a small impact on the results.
Some end points were only analyzed in a subset of randomized patients. For example, PASI was assessed only in patients in whom psoriasis affected at least 3% of their BSA at baseline, sIGA was assessed in patients with a score of at least 2 at baseline, and enthesitis and dactylitis were assessed in patients with an LEI or LDI greater than 0 at baseline. As such, there is a risk that randomization is broken in these subset of patients. However, with the exception of sIGA scores, most of these baseline characteristics were part of the randomization stratification in SELECT-PsA1, and the number of patients analyzed in each treatment group was generally balanced. In PsA2, only the baseline measure of BSA affected by psoriasis was included in the randomization stratification, but there was no major imbalance in the number of patients included in each treatment group for sIGA, and resolution of enthesitis and dactylitis were not included in the testing hierarchy.
Currently available outcome measures in PsA have been adopted in large part from other conditions, such as rheumatoid arthritis and psoriasis. Validity and reliability data specific to PsA are sparse, and some instruments, such as EQ-5D-5L, WPAI, sIGA, and SAPS, lack a known MID exclusively for patients with PsA.
External Validity
The included studies were multi-centre trials enrolling patients from different countries; however, only 2.3%, or 39 patients, in SELECT-PsA1, and 2.6%, or 17 patients, in SELECT-PsA2, were recruited from Canada.35 According to the clinical expert involved in the review, the patients’ baseline characteristics were consistent with what can be seen in Canadian clinical practice and in other PsA trials. The clinical expert indicated that the study results are likely generalizable to the Canadian patient population.
In SELECT-PsA2, as enrolment of patients with prior failure of multiple bDMARDs was limited to approximately 30%, a limited number of patients had failed several bDMARDs. This may limit the generalizability of the PsA2 study results in patients who had failed multiple bDMARD treatments.
Because adalimumab was an active comparator only in the SELECT-PsA1 study, the effects of upadacitinib were compared to those of adalimumab only in the bDMARD-naive patient population. Results from PsA1 cannot be generalized to the bDMARD-experienced patient population, and it is unknown whether patients previously exposed to bDMARDs would derive the same benefit from adalimumab. However, the responses to subsequent bDMARDs in patients who failed previous biologic treatment are generally suboptimal, and it would be reasonable to expect a similar direction of response (benefit) with upadacitinib, relative to adalimumab.
SELECT-PsA1 required patients to have the presence of either 1 or more examples of erosion on X-ray or an hs-CRP level greater than the ULN for inclusion into the study, which may affect the generalizability of this study’s results. According to the clinical expert consulted for this review, a substantial proportion of patients seen in clinical practice generally do not have evident erosions or inflammatory markers elevated to this degree and yet still require treatment with bDMARDs. Consistent with this, the main reason for screening failure (422 of 774 screened patients) was patient failure to meet the MDA criteria of at least 1 erosion on X-ray as determined by a central imaging review or an hs-CRP level exceeding a laboratory-defined ULN. At enrolment, most patients met the inclusion criteria for having elevated an hs-CRP level greater than ULN (approximately 75%) and approximately 40% of patients had at least 1 erosion. Despite this inclusion criteria being only part of 1 of the trials, the mean hs-CRP levels at baseline were similar between patients enrolled in SELECT-PsA-1 and SELECT-PsA-2.
The efficacy results as observed in the 2 trials were generally consistent. Overall, the magnitude of differences was comparable even though the characteristics of the population enrolled in SELECT-PsA2 were reflective of patients with long-standing disease that is more difficult to control. For example, the mean duration of PsA diagnosis in the treatment groups ranged from 5.9 to 6.2 years in SELECT-PsA1 and from 9.6 to 11.0 years in SELECT-PsA2. The mean TJC was higher in patients enrolled in PsA2, as was the baseline LDI score. Patients in PsA1 were bDMARD-naive but had been previously treated with at least 1 non-bDMARD whereas all patients in PsA2 were bDMARD-experienced. Most patients in SELECT-PsA2 (62%) had failed 1 prior biologic treatment; approximately 20% of patients had failed 2 biologics, and another 20% had failed 3 or more prior bDMARDs. During the study, a greater proportion of patients in SELECT-PsA1 (81% to 84%) received concomitant non-bDMARD compared to patients in SELECT-PsA2 (48% to 53%). The impact of these patient characteristics when generalizing results from the 2 trials to the Canadian patient population is uncertain.
Patients were permitted to continue stable background non-biologic treatment. Approximately 80% of patients in SELECT-PsA1 and 50% of patients in SELECT-PsA2 were treated with concomitant non-bDMARDs. Of these patients, most received concomitant methotrexate (approximately 70% and 40% of patients in SELECT-PsA1 and SELECT-PsA2, respectively). The number of patients who received other non-bDMARDs (varying in category and mechanism of action) were small for individual agents. Efficacy and safety data supporting the full effect of upadacitinib in combination with other non-bDMARDs (i.e., other than methotrexate) is limited, and cannot be generalized from the SELECT trials.
Several outcomes measured in the trials have limitations, including not being validated, or lacking a clearly defined MID in a change in score in the population of patients with PsA (see Appendix 4). However, for the purposes of this review, the clinical expert consulted for the review deemed the end points measured in both SELECT studies to be relevant to patients being treated for PsA.
The dosages of upadacitinib (15 mg orally once daily) and adalimumab (40 mg subcutaneous every 2 weeks) are consistent with Canadian practice, and a direct comparison between them can help inform the expected efficacy of upadacitinib in the Canadian practice setting. However, there is a lack of direct head-to-head comparisons of upadacitinib versus other active comparators, particularly non-TNF inhibitors, including JAK inhibitors such as tofacitinib, as well TNF inhibitors other than adalimumab. A critical appraisal of a sponsor-submitted ITC is included in this review to address some of these gaps.
Although long-term data were reported for up to week 56 for both studies, the only placebo-controlled data for upadacitinib are those up to week 24. Also, interpretation of results after week 24 is limited by the lack of a placebo group and the allowance for rescue treatment within the groups. However, continuation of active control beyond week 24 would have provided additional insight on the effect of upadacitinib compared to adalimumab in SELECT-PsA1. Also, both studies’ long-term extensions of up to 5 years in SELECT-PsA1 and 3 years in SELECT-PsA2 are ongoing and can be expected to provide further trends on efficacy and safety over time.
Indirect Evidence
Objectives and Methods for the Summary of Indirect Evidence
Upadacitinib is a tsDMARDs indicated for the treatment of active PsA in adult patients who have responded inadequately or who are intolerant to methotrexate or other DMARDs. Due to the lack of direct evidence comparing the efficacy and safety of upadacitinib with that of other bDMARDs and tsDMARDs for the treatment of moderately to severely active PsA, a review of indirect evidence was undertaken. CADTH conducted a literature search to identify potentially relevant ITCs in patients with moderately to severely active PsA, in addition to reviewing the sponsor’s submission to CADTH. A focused literature search for NMAs dealing with PsA was run in MEDLINE All (1946–) on February 1, 2021. Titles, abstracts, and full-text articles were screened for inclusion by 1 reviewer based on the population, intervention, comparator, and outcome criteria outlined in Table 5.
The sponsor submitted an ITC that assessed the efficacy of upadacitinib compared to bDMARDs and tsDMARDs in adult patients with active PsA.47 No ITCs were identified in the literature search. This section summarizes and critically appraises the unpublished ITC submitted by the sponsor.
Description of Indirect Treatment Comparison
No systematic literature review or source of study selection was reported. The population, intervention, comparators, outcomes, and design of studies included in the sponsor’s ITC are provided in Table 24.
Table 24: Study Selection Criteria and Methods for the Sponsor-Submitted ITC
Criteria | Inclusion | Exclusion |
|---|---|---|
Population | Adult patients with moderately to severely active PsA
| • Pediatric patients only or not report results for adult subgroup in an age-mixed patient population • Only csDMARD-naive patients • Only methotrexate-naive patients • Moderate-to-severe psoriasis that reported subgroup results for patients with concomitant PsA • Patients with primary failure to prior biologics |
Interventions and comparators |
| NR |
Outcomes | Efficacy
Week 12 and week 24 data stratified by biologic-naive and biologic-experienced populations were used whenever available | |
Study design and factors | RCTs Exclusion: single-arm trials or observational studies | |
Language | English abstracts of foreign publications were considered | |
Search period | NR | |
ACR = American College of Rheumatology; AE = adverse events; bDMARD = biologic DMARD; csDMARD = conventional synthetic DMARD; CLTA4-Ig = cytotoxic T lymphocyte–associated protein 4 immunoglobin; DMARD = disease-modifying antirheumatic drug; HAQ-DI = Health Assessment Questionnaire–Disability Index; IL = interleukin; JAK = Janus kinase; NR = not reported; PASI 50 = 50% reduction in Psoriasis Area Severity Index score; PASI 75 = 75% reduction in Psoriasis Area Severity Index score; PASI 90 = 90% reduction in Psoriasis Area Severity Index score; PsA = psoriatic arthritis; PsARC = Psoriatic Arthritis Response Criteria; RCT = randomized controlled trial.
Source: Sponsor-submitted indirect treatment comparison.47
Methods of the Sponsor-Submitted Indirect Treatment Comparison
Objectives
The sponsor conducted an ITC that indirectly compared the efficacy of upadacitinib, bDMARDs, and tsDMARDs for the treatment of moderately to severely active PsA. The ITC reported overall results among biologic-naive and biologic-experienced patients separately.
Study Selection Methods
Eligibility Criteria
Any RCTs, irrespective of blinding status and enrolled adults (18 years and over) of biologic-naive or biologic-experienced with moderately or severely active PsA were eligible for inclusion (Table 24).
Study Selection and Data Extraction
Several electronic databases were searched via the Ovid platform on August 9, 2019. A first update of the search was conducted on May 21, 2020, and a second update was conducted on September 3, 2020, to identify relevant papers published post-August 2019.
Identified studies were independently assessed by 2 reviewers for inclusion at each stage of study selection. First, the title and abstracts of the references identified from the electronic bibliographic databases were screened by 2 independent reviewers. Any disputes between the inclusion and exclusion decisions were resolved by a third independent reviewer. The full texts of included titles and abstracts, where available, were then further assessed by independent reviewers. For both phases, the reviewers determined the eligibility according to pre-specified inclusion and exclusion criteria for the review based on Table 24.
Relevant information was extracted into the data extraction template by a reviewer. A second reviewer checked the data extraction, and any inconsistencies were resolved through discussion or by a third reviewer. Results from a clinical trial, if reported in multiple publications, were extracted as a single study.
Interventions and Comparators
Both bDMARDs and tsDMARDs were included in the ITC, with trials including at least 1 arm for upadacitinib or a treatment currently licensed by the FDA and/or the European Medicines Agency for biologic-naive and/or biologic-experienced patients with moderately to severely active PsA or anticipated to be licensed by the FDA and/or the EMA for moderately to severely active PsA by the time of upadacitinib approval.
Outcomes
The primary efficacy outcomes for the ITC were percentage of patients who achieved PsARC, 50% reduction in Psoriasis Area Severity Index score (PASI 50), PASI 75, PASI 90, ACR20, ACR50, ACR70, and change in HAQ-DI from baseline at week 12 and 24. The comparisons were stratified by patients with prior biologics use (biologic-experienced) and without prior biologics use (biologic-naive) to account for its potential modification of the treatment effects. The ITC included no safety outcomes.
Quality Assessment of Included Studies
Quality assessment of included RCTs was conducted using the 7-criteria checklist provided in section 2.5 of the National Institute for Health and Care Excellence single technology appraisal user guide.48
ITC Analysis Methods
The submitted ITC used Bayesian fixed- or random-effect NMAs. The methods used for conducting the ITC were reportedly consistent with the approach described in National Institute for Health and Care Excellence Decision Support Unit Technical Support Documents 2 and 3.49,50 Outcomes were assumed to follow given distributions and associated link functions were used:
PsARC follows a binomial distribution. Logistic models were used to model PsARC.
PASI 50, PASI 75, and PASI 90 follow multinomial distributions. Probit models were used to jointly model all 3 responses.
HAQ-DI change conditional on PsARC response was assumed to follow a normal distribution. Linear models were used to model HAQ-DI change among PsARC responders and PsARC nonresponders, respectively.
ACR20, ARC50, and ARC70 follow multinomial distributions. Probit models were used to jointly model ACR20, ARC50, and ARC70.
The following models were implemented for each outcome in each network:
Biologic-experienced NMAs for PsARC, PASI, HAQ-DI change conditional on PsARC, and ACR responses at week 12 and 24. Fixed-effects models were implemented because of the sparsity of the networks.
Biologic-naive NMAs for PsARC, PASI, and ACR at week 12 and 24. Random-effects models with placebo-response adjustment were implemented because of the rich networks and the large variations in the placebo response rates.
Biologic-naive NMAs for HAQ-DI change conditional on PsARC response at week 12 and 24. Fixed-effects models were implemented, because of the sparsity of the network.
Analyses were conducted using a Markov chain Monte Carlo method using JAGS and R software packages. Models used a typical “burn-in” method and estimates were based on additional iterations using 3 chains. Three Markov chains were run with different initial values. Each chain contains 5,000 adaptive iterations, 50,000 burn-in iterations, and 500,000 sampling iterations. The results are presented as odds ratios and 95% credible intervals (CrI) to compare PsARC, PASI 50, PASI 75, PASI 90, ACR20, ARC50, and ARC70 between each pair of treatments. Mean differences were used to compare HAQ-DI change between each pair of treatments among PsARC responders or nonresponders, respectively. The posterior distributions for the pairwise comparisons were summarized using posterior medians and their associated 95% CrIs. No sensitivity or subgroup analyses were reported to assess the heterogeneity and/or adjusted for potential effect modifiers across the comparisons. Model fit was assessed using the deviance information criterion. Model selection was not formally reported but was based on network sparsity. It was unclear how inconsistency was assessed was formally assessed.
Results of the Sponsor-Submitted ITC
Summary of Included Studies
A total of 34 RCTs (Table 25; as well as Table 58 and Table 59 of Appendix 3) were included in at least 1 of the pre-specified analyses.47 Both phase II and III trials were included. All were placebo-controlled, except 5 trials that included adalimumab as an active comparator arm. A total of 13,433 patients from all trials were included, with an average arm size of 152, and ranging from 30 to 429. The average age of the patients was 48.8 years, ranging from 43.5 to 54.1 years. The proportion of patients who were female was 50.8%, while 93.5% were White. At baseline the average duration of PsA was 7.3 years, ranging from 3.4 to 11.7 years. Prior DMARD use was 69.7%, ranging from 1% to 100% based on inclusion criteria. Importantly, different criteria for the inclusion of biologic-experienced patients were applied across trials, with 3 trials including only biologic-experienced patients. Important differences were noted in selection of concomitant therapy, background therapy, and rescue therapy. A summary of the study characteristics and patient’s baseline characteristics for each of the included studies is presented in Table 25, as well as Table 58 and Table 59 of Appendix 3.
Table 25: Summary of Studies Included and Baseline Characteristics
Characteristics | Value |
|---|---|
Number of studies, n | 34 |
Total number of patients, N | 13,433 |
Patients per study arm, range | 30 to 429 |
Age, range | 43.5 to 54.1 |
Female (%), range | 29 to 61 |
White (%), range | 80.9 to 100 |
Duration of PsA (years), range | 3.4 to 11.7 |
Prior DMARDs (%), range | 1 to 100 |
Source: Sponsor-submitted indirect treatment comparison.47
Results
Biologic-Naive Patients
A total of 31 trials were included in the biologic-naive NMAs at week 12 (Table 58 and Table 59, Appendix 3). The majority of studies used the data from weeks 12 through 16 for the biologic-naive population. The ACR response at 12 weeks was reported from all 31 trials (Figure 4). Other outcomes had slightly reduced networks, with 16 trials for PsARC, 28 for PASI, and only 9 trials for HAQ-DI change from baseline conditional on PsARC response. A total of 25 trials were included in the analysis at week 24. The ACR responses at 24 weeks were reported from all 25 trials (Figure 5). Other outcomes had slightly reduced networks, with 14 trials for PsARC, 22 trials for PASI, and only 2 trials for HAQ-DI change from baseline conditional on PsARC response.
Figure 4: Network of Trials for NMA of Biologic-Naive Patients for ACR 50 at Week 12
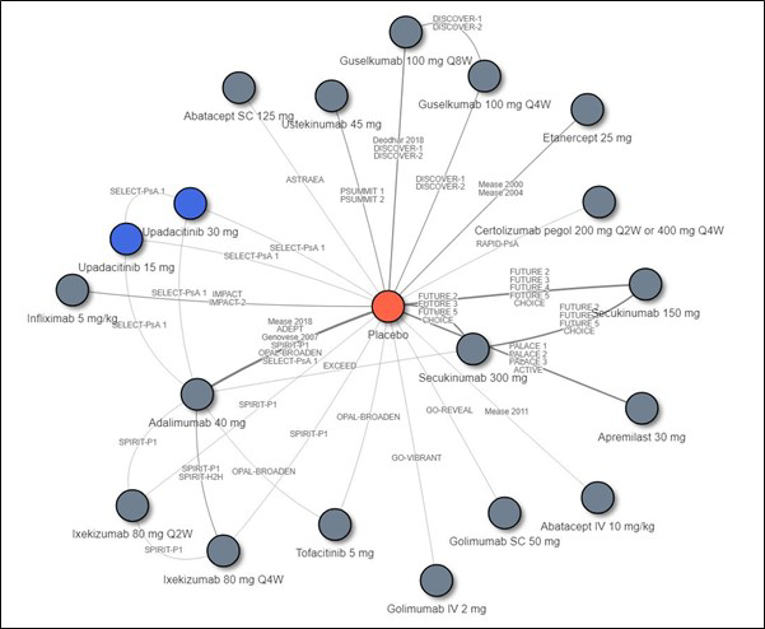
ABA = abatacept; ACR = American College of Rheumatology; ADA = adalimumab; APR = apremilast; bDMARD = biologic disease-modifying antirheumatic drug; BID = twice a day; BIW = twice a week; CZP = certolizumab; ETN = etanercept; GOL = golimumab; GUS = guselkumab; INF = infliximab; IXE = ixekizumab; mg = milligram; NMA = network meta-analysis; PBO = placebo; Q2W = every 2 weeks; Q4W = every 4 weeks; Q8W = every 8 weeks; Q12W. = every 12 weeks; QD = every day; SC = subcutaneous; SEC = secukinumab; TOF = tofacitinib; tsDMARD = targeted synthetic disease-modifying antirheumatic drug; UPA = upadacitinib; UST = ustekinumab.
Source: Sponsor-submitted indirect treatment comparison.47
Figure 5: Network of Trials for NMA of Biologic-Naive Patients for ACR 50 at Week 24
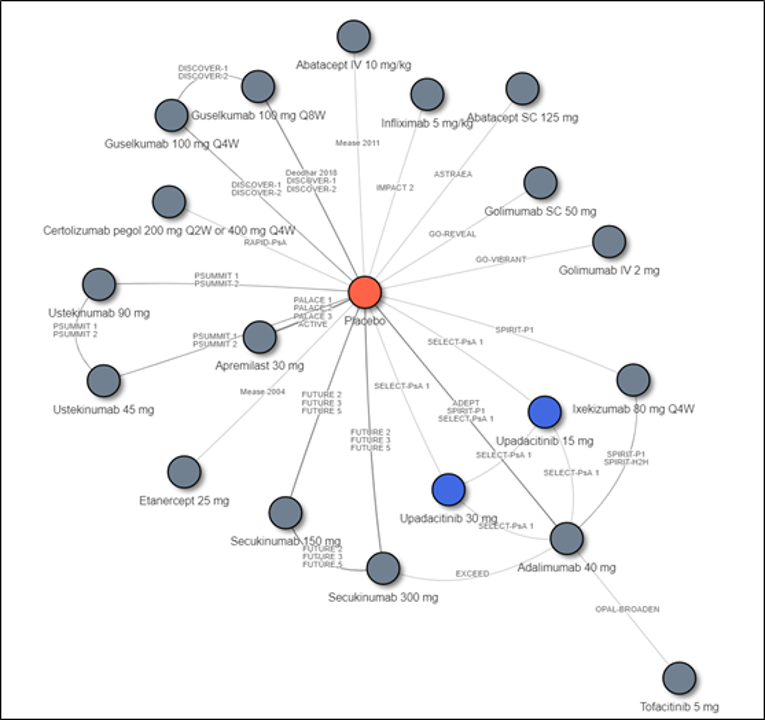
ABA = abatacept; ACR = American College of Rheumatology; ADA = adalimumab; APR = apremilast; bDMARD = biologic disease-modifying antirheumatic drug; BID = twice a day; BIW = twice a week; CZP = certolizumab; ETN = etanercept; GOL = golimumab; GUS = guselkumab; INF = infliximab; IV = IV infusion; IXE = Ixekizumab; mg = milligram; NMA = network meta-analysis; PBO = placebo; Q2W = every 2 weeks; Q4W = every 4 weeks; Q8W = every 8 weeks; Q12W = every 12 weeks; QD = every day; SC = subcutaneous injection; SEC = secukinumab; TOF = tofacitinib; tsDMARD = targeted synthetic disease-modifying antirheumatic drug; UPA = upadacitinib; UST = ustekinumab.
Source: Sponsor-submitted indirect treatment comparison.47
Summary of Results at 12 Weeks
Table 26 and Table 28 present the results among biologic-naive patients.
At week 12, all treatments had a higher response rate than did placebo for all ACR measures. Upadacitinib 15 mg showed a higher ACR response rate than did abatacept SC, apremilast, ustekinumab 45 mg, guselkumab, and secukinumab 150 mg. No difference was found when upadacitinib 15 mg was compared to abatacept IV, tofacitinib, certolizumab, golimumab, adalimumab, secukinumab, ixekizumab, etanercept, and infliximab (Table 26).
Other Outcomes: The results for the other outcomes of interest suggest that upadacitinib 15 mg at 12 weeks was superior to placebo for all outcomes measured, including PsARC, PASI, and HAQ-DI change from baseline.
For the PASI outcome measures, upadacitinib 15 mg at 12 weeks was favoured when compared to abatacept, apremilast, and etanercept; no difference was reported when upadacitinib 15 mg was compared to golimumab, certolizumab, ustekinumab, tofacitinib, adalimumab, secukinumab subcutaneous 150 mg, and infliximab. Guselkumab, ixekizumab, and secukinumab subcutaneous 300 mg were favoured when compared to upadacitinib 15 mg (Table 27).
For the PsARC outcome measures, upadacitinib 15 mg at 12 weeks was favoured when compared to tofacitinib and apremilast. No difference was reported when upadacitinib 15 mg was compared to ixekizumab, ustekinumab, adalimumab, secukinumab, certolizumab, etanercept, golimumab, and infliximab (Table 28).
Among PsARC responders, upadacitinib 15 mg had a larger reduction in HAQ-DI when compared with apremilast (between-group difference [95% CrI, ||||||||||||||||||||||) and etanercept was favoured when compared to upadacitinib 15 mg in HAQ-DI (between-group difference [95% CrI, ||||||||||||||||||). No difference was reported when upadacitinib 15 mg was compared to ustekinumab 45 mg, adalimumab, golimumab subcutaneous, and infliximab. Among PsARC nonresponders, no difference was reported when upadacitinib 15 mg was compared to apremilast, etanercept, ustekinumab 45 mg, adalimumab, golimumab subcutaneous, and infliximab.
Summary of Results at 24 Weeks
At week 24, all treatments had a higher response rate than did placebo for all ACR measures. For ACR 50, upadacitinib 15 mg was favoured when compared to abatacept subcutaneous, apremilast, and ustekinumab 45 mg. No difference was found when compared to abatacept IV, guselkumab, tofacitinib, certolizumab, golimumab, adalimumab, secukinumab, ixekizumab, etanercept, and infliximab (Table 26).
Other Outcomes: The results for the other outcomes of interest suggested that upadacitinib 15 mg at 24 weeks was favoured when compared to placebo for all PsARC, PASI, and HAQ-DI change from baseline.
For the PASI outcome measures, upadacitinib 15 mg at 24 weeks was favoured when compared to abatacept, apremilast, and etanercept, and no difference was reported when upadacitinib 15 mg was compared to golimumab, certolizumab, ustekinumab, tofacitinib, adalimumab, secukinumab, infliximab, ixekizumab, and secukinumab. Guselkumab was favoured when compared to upadacitinib 15 mg (Table 27).
For the PsARC outcome measures, upadacitinib 15 mg at 24 weeks was favoured when compared to apremilast, and no difference was reported when upadacitinib 15 mg was compared to tofacitinib, ixekizumab, ustekinumab, adalimumab, secukinumab, certolizumab, etanercept, golimumab, and infliximab (Table 28).
For HAQ-DI at 24 weeks, upadacitinib 15 mg was compared only with adalimumab and ustekinumab. Among PsARC responders, upadacitinib 15 mg had a larger reduction in HAQ-DI compared with adalimumab (between-group difference: ||||||||||||||||||||||||||||||||), and no difference was reported when upadacitinib 15 mg was compared to ustekinumab 45 mg (between-group difference: ||||||||||||||||||||||||||||||||||). Among PsARC nonresponders, no difference was reported when upadacitinib 15 mg was compared to adalimumab and ustekinumab 45 mg.
Table 26: Summary of ITC Results for ACR20, ACR50, and ACR70 for Biologic-Naive Patients at 12 and 24 Weeks for Upadacitinib 15 mg Versus Comparators
Comparator | Random-effects with placebo-response adjustment, odds ratio (95% CI) | |||||
|---|---|---|---|---|---|---|
12 weeks | 24 weeks | |||||
ACR20 | ACR50 | ACR70 | ACR20 | ACR50 | ACR70 | |
Placebo |
|
|
|
|
|
|
Abatacept SC |
|
|
|
|
|
|
Apremilast |
|
|
|
|
|
|
Ustekinumab SC 45 mg at weeks 0 and 4, then q.12.w. |
|
|
|
|
|
|
Abatacept IV |
|
|
|
|
|
|
Guselkumab SC 100 mg at weeks 0, and 4, then q.8.w |
|
|
|
|
|
|
Guselkumab SC 100 mg q.4.w. |
|
|
|
|
|
|
Secukinumab SC 150 mg |
|
|
|
|
|
|
Tofacitinib |
|
|
|
|
|
|
Certolizumab |
|
|
|
|
|
|
Golimumab SC |
|
|
|
|
|
|
Adalimumab |
|
|
|
|
|
|
Secukinumab SC 300 mg |
|
|
|
|
|
|
Ixekizumab SC 160 mg at week 0, then 80 mg q.2.w |
|
|
|
|
|
|
Etanercept |
|
|
|
|
|
|
Golimumab IV |
|
|
|
|
|
|
Infliximab IV |
|
|
|
|
|
|
ACR20 = American College of Rheumatology 20% improvement in rheumatoid arthritis; ACR50 = American College of Rheumatology 50% improvement in rheumatoid arthritis; ACR70 = American College of Rheumatology 70% improvement in rheumatoid arthritis; CrI = credible interval; q.2.w = every 2 weeks; q.4.w. = every 4 weeks; q.8.w. = every 8 weeks; q.12.w. = every 12 weeks; SC = subcutaneous.
Source: Sponsor-submitted indirect treatment comparison.47
Table 27: Summary of ITC Results for PASI 50, PASI 75, and PASI 90 Among Biologic-Naive Patients at 12 and 24 Weeks for Upadacitinib 15 mg Versus Comparators
Comparator | Random-effects with placebo-response adjustment, odds ratio (95% CrI) | |||||
|---|---|---|---|---|---|---|
12 weeks | 24 weeks | |||||
PASI 50 | PASI 75 | PASI 90 | PASI 50 | PASI 75 | PASI 90 | |
Placebo |
|
|
|
|
|
|
Abatacept IV |
|
|
|
|
|
|
Abatacept SC |
|
|
|
|
|
|
Apremilast |
|
|
|
|
|
|
Etanercept |
|
|
|
|
|
|
Golimumab SC |
|
|
|
|
|
|
Certolizumab |
|
|
|
|
|
|
Ustekinumab SC 45 mg |
|
|
|
|
|
|
Tofacitinib |
|
|
|
|
|
|
Adalimumab |
|
|
|
|
|
|
Secukinumab SC 150 mg |
|
|
|
|
|
|
Golimumab IV |
|
|
|
|
|
|
Infliximab IV |
|
|
|
|
|
|
Secukinumab SC 300 mg |
|
|
|
|
|
|
Ixekizumab SC 160 mg at week 0, then 80 mg q.4.w. |
|
|
|
|
|
|
Ixekizumab SC 160 mg at week 0, then 80 mg q.2.w. |
|
|
|
|
|
|
Guselkumab SC 100 mg at weeks 0, and 4, then q.8.w. |
|
|
|
|
|
|
Guselkumab SC 100 mg q.4.w. |
|
|
|
|
|
|
CrI = credible interval; PASI 50 = 50% reduction in Psoriasis Area Severity Index score; PASI 75 = 75% reduction in Psoriasis Area Severity Index score; PASI 90 = 90% reduction in Psoriasis Area Severity Index score; q.2.w = every 2 weeks; q.4.w. = every 4 weeks SC = subcutaneous.
aUpadacitinib was more efficacious than the comparator.
bUpadacitinib was less efficacious than the comparator.
Source: Sponsor-submitted indirect treatment comparison.47
Table 28: Summary of ITC Results for PsARC Among Biologic-Naive Patients at 12 and 24 Weeks for Upadacitinib 15 mg Versus Comparators
Comparator | Random-effects with placebo-response adjustment, odds ratio (95% CrI) | |
|---|---|---|
12 weeks | 24 weeks | |
Placebo |
|
|
Tofacitinib |
|
|
Apremilast |
|
|
Ixekizumab SC 160 mg at week 0, then 80 mg q.4.w. |
|
|
Ustekinumab SC 45 mg |
|
|
Ustekinumab SC 90 mg |
|
|
Ixekizumab SC 160 mg at week 0, then 80 mg q.2.w |
|
|
Adalimumab |
|
|
Secukinumab SC 300 mg |
|
|
Certolizumab |
|
|
Secukinumab SC 150 mg |
|
|
Etanercept SC 25 mg b.i.w. |
|
|
Golimumab SC |
|
|
Infliximab IV |
|
|
b.i.w. = twice weekly; PsARC = Psoriatic Arthritis Response Criteria; q.2.w. = every 2 weeks; q.4.w. = every 4 weeks; SC = subcutaneous.
aUpadacitinib was more efficacious than comparator.
Source: Sponsor-submitted indirect treatment comparison.47
Biologic-Experienced Patients
A total of 15 trials were included in the biologic-experienced NMAs at week 12 (Figure 6 and Figure 7). The majority used data from weeks 12 through 16 data for the biologic-naive population, with ACR responses reported from all 15 trials (Figure 6). Other outcomes had reduced networks with 4 trials for PsARC, 6 for PASI and only 2 for HAQ-DI change from baseline conditional on PsARC response. A total of 10 trials were included in the analysis at week 24. The ACR responses were reported from all 10 trials (Figure 7). Other outcomes had reduced networks, with 3 trials for PsARC, 5 trials for PASI, and only 2 trials for HAQ-DI change from baseline conditional on PsARC response.
Figure 6: Network of Trials for NMA of Biologic-Experienced Patients for ACR50 At Week 12
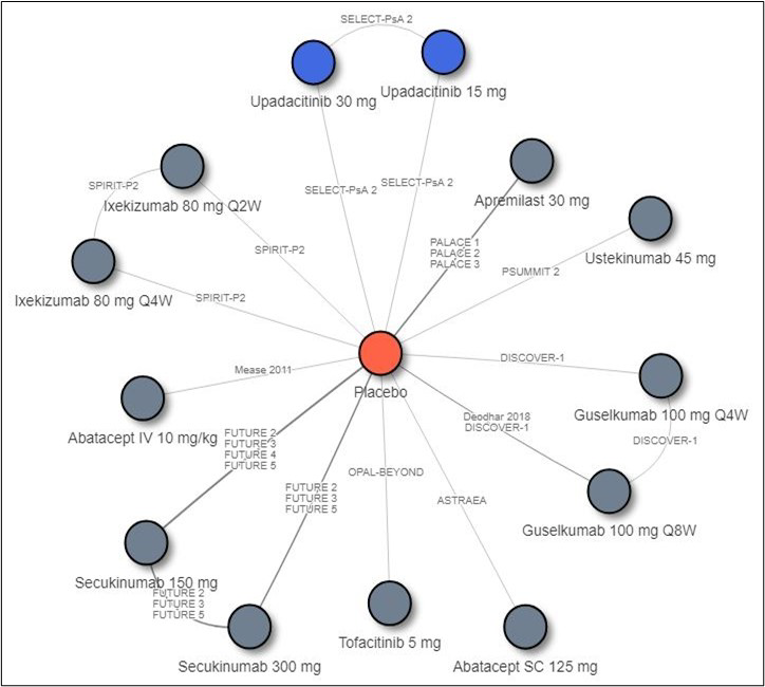
ABA = abatacept; ACR = American College of Rheumatology; ADA = adalimumab; APR = apremilast; bDMARD = biologic disease-modifying antirheumatic drug; BID = twice a day; BIW = twice a week; CZP = certolizumab; ETN = etanercept; GOL = golimumab; GUS = guselkumab; INF = infliximab; IV = IV infusion; IXE = ixekizumab; NMA = network meta-analysis; PBO = placebo; Q2W = every 2 weeks; Q4W = every 4 weeks; Q8W = every 8 weeks; Q12W = every 12 weeks; QD = every day; SC = subcutaneous injection; SEC = secukinumab; TOF = tofacitinib; tsDMARD = targeted synthetic disease-modifying antirheumatic drug; UPA = upadacitinib; UST = ustekinumab.
Source: Sponsor-submitted indirect treatment comparison.47
Figure 7: Network of Trials for NMA of Biologic-Experienced Patients for ACR50 at Week 24
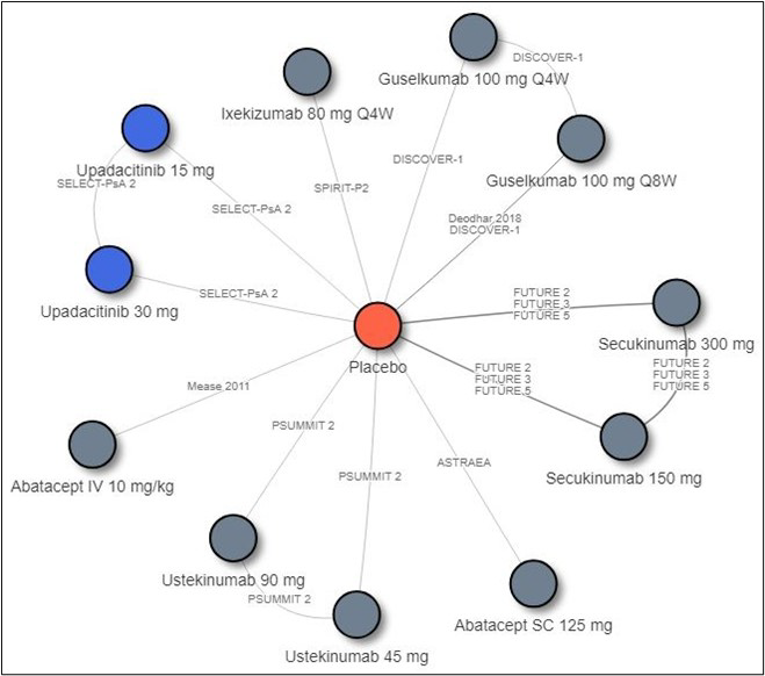
ABA = abatacept; ACR = American College of Rheumatology; ADA = adalimumab; APR = apremilast; bDMARD = biologic disease-modifying antirheumatic drug; BID = twice a day; BIW = twice a week; CZP = certolizumab; ETN = etanercept; GOL = golimumab; GUS = guselkumab; INF = infliximab; IV = IV infusion; IXE = Ixekizumab; mg = milligram; NMA = network meta-analysis; PBO = placebo; Q2W = every 2 weeks; Q4W = every 4 weeks; Q8W = every 8 weeks; Q12W = every 12 weeks; QD = every day; SC = subcutaneous injection; SEC = secukinumab; TOF = tofacitinib; tsDMARD = targeted synthetic disease-modifying antirheumatic drug; UPA = upadacitinib; UST = ustekinumab.
Source: Sponsor-submitted indirect treatment comparison.47
Summary of Results at 12 Weeks
Table 29, Table 30, and Table 35 present the results among biologic-experienced patients.
At week 12, all treatments had a higher response rate than placebo for all ACR measures. Upadacitinib 15 mg showed a higher ACR response rate than did abatacept SC. No difference was found when compared to abatacept IV, secukinumab, tofacitinib, ustekinumab, apremilast, ixekizumab, and guselkumab (Table 29).
Other Outcomes: The results for the other outcomes of interest suggested that upadacitinib 15 mg at 12 weeks was superior to placebo for all outcomes measured including PsARC, PASI, and HAQ-DI change from baseline.
For the PASI outcome measures, upadacitinib 15 mg at 12 weeks was favoured when compared to abatacept and tofacitinib; and no difference was reported when upadacitinib 15 mg was compared to secukinumab, ixekizumab, and ustekinumab (Table 30).
For the PsARC outcome measures at 12 weeks, no difference was reported when upadacitinib 15 mg was compared to ixekizumab, ustekinumab, and tofacitinib (Table 31).
For HAQ-DI at 12 weeks, upadacitinib 15 mg was compared only with ustekinumab 45 mg. Among PsARC responders and PsARC nonresponders, no difference was reported when upadacitinib 15 mg was compared to ustekinumab 45 mg.
Summary of Results at 24 Weeks
Among biologic-experienced patients at week 24, all treatments had a higher response rate than did placebo for all ACR measures. Upadacitinib 15 mg showed a higher ACR response rate than abatacept. No difference was found when upadacitinib 15 mg was compared to abatacept IV, secukinumab, ustekinumab, ixekizumab, and guselkumab (Table 29).
Other Outcomes: The results for the other outcomes of interest suggest that upadacitinib 15 mg at 24 weeks was superior to placebo for all outcomes measured including PsARC, and PASI.
For the PASI outcome measures, upadacitinib 15 mg at 24 weeks was favoured when compared to abatacept. No difference was reported when upadacitinib 15 mg was compared to secukinumab, ixekizumab, and ustekinumab (Table 30).
For the PsARC outcome measures at 24 weeks, no difference was reported when upadacitinib 15 mg was compared to ixekizumab and ustekinumab (Table 31).
For HAQ-DI at 24 weeks, upadacitinib 15 mg was only compared with ustekinumab 45 mg. Among PsARC responders and PsARC nonresponders, no difference was reported when upadacitinib 15 mg was compared to ustekinumab 45 mg.
Table 29: Summary of ITC Results for ACR20, ACR50, and ACR70 Among Biologic-Experienced Patients at 12 and 24 Weeks for Upadacitinib Oral 15 mg Versus Comparators
Comparator | Fixed-effects model odds ratio (95% CrI) | |||||
|---|---|---|---|---|---|---|
12 weeks | 24 weeks | |||||
ACR20 | ACR50 | ACR70 | ACR20 | ACR50 | ACR70 | |
Placebo |
|
|
|
|
|
|
Abatacept SC |
|
|
|
|
|
|
Abatacept IV |
|
|
|
|
|
|
Secukinumab SC 150 mg |
|
|
|
|
|
|
Tofacitinib |
|
|
|
|
|
|
Secukinumab SC 300 mg |
|
|
|
|
|
|
Ustekinumab |
|
|
|
|
|
|
Apremilast |
|
|
|
|
|
|
Ixekizumab SC 160 mg at week 0, then 80 mg q.2.w. |
|
|
|
|
|
|
Ixekizumab SC 160 mg at week 0, then 80 mg q.4.w |
|
|
|
|
|
|
Guselkumab SC |
|
|
|
|
|
|
ACR20 = American College of Rheumatology 20% improvement in rheumatoid arthritis; ACR50 = American College of Rheumatology 50% improvement in rheumatoid arthritis; ACR70 = American College of Rheumatology 70% improvement in rheumatoid arthritis; CrI = credible interval; ITC = indirect treatment comparison; q.2.w. = every 2 weeks; q.4.w. = every 4 weeks; SC = subcutaneous.
aUpadacitinib was more efficacious than the comparator.
Source: Sponsor-submitted indirect treatment comparison.47
Table 30: Summary of ITC Results for PASI 50, PASI 75, and PASI 90 Among Biologic-Experienced Patients at 12 and 24 Weeks for Upadacitinib 15 mg Versus Comparators
Comparator | Fixed-effects model odds ratio (95% CrI) | |||||
|---|---|---|---|---|---|---|
12 weeks | 24 weeks | |||||
PASI 50 | PASI 75 | PASI 90 | PASI 50 | PASI 75 | PASI 90 | |
Placebo |
|
|
|
|
|
|
Abatacept SC |
|
|
|
|
|
|
Tofacitinib |
|
|
|
|
|
|
Secukinumab SC 150 mg |
|
|
|
|
|
|
Ixekizumab SC 160 mg at week 0, then 80 mg q.4.w. |
|
|
|
|
|
|
Ixekizumab SC 160 mg then 80 mg q.2.w. |
|
|
|
|
|
|
Secukinumab SC 300 mg |
|
|
|
|
|
|
Ustekinumab SC |
|
|
|
|
|
|
CrI = credible interval; ITC = indirect treatment comparison; PASI 50 = 50% reduction in Psoriasis Area Severity Index score; PASI 75 = 75% reduction in Psoriasis Area Severity Index score; PASI 90 = 90% reduction in Psoriasis Area Severity Index score; q.2.w. = every 2 weeks; q.4.w. = every 4 weeks; SC = subcutaneous.
aUpadacitinib was more efficacious than comparator.
bUpadacitinib was less efficacious than comparator.
Source: Sponsor-submitted indirect treatment comparision.47
Table 31: Summary of Indirect Treatment Comparison of Results for PsARC Among Biologic-Experienced Patients at 12 and 24 Weeks for Upadacitinib 15 mg Versus Comparators
Comparator | Fixed-effects model odds ratio (95% CrI) | |
|---|---|---|
12 weeks | 24 weeks | |
Placebo |
|
|
Ustekinumab SC 90 mg |
|
|
Ustekinumab SC 45 mg |
|
|
Ixekizumab SC 160 mg at week 0, then 80 mg q.4.w. |
|
|
Ixekizumab SC 160 mg at week 0, then 80 mg q.2.w. |
|
|
Tofacitinib |
|
|
CrI = credible interval; PsARC = Psoriatic Arthritis Response Criteria; q.2.w. = every 2 weeks; q.4.w. = every 4 weeks; SC = subcutaneous.
aUpadacitinib was more efficacious than the comparator.
Source: Sponsor-submitted indirect treatment comparison.47
Critical Appraisal of the Sponsor-Submitted Indirect Treatment Comparison
The sponsor-submitted ITC included all clinically relevant efficacy outcomes for PsA. Due to limitations of the submitted ITC, the results should be interpreted with caution. The major concerns with the submitted ITCs are related to the analysis’ failure to fully account for effect modifiers. Specifically, although significant heterogeneity was noted across different trials, particularly regarding the clinical characteristics of the patient population (i.e., status of disease, type of prior therapies, and use of concomitant treatments), no sensitivity analysis or subgroup analysis was attempted to assess the impact of these potential effect modifiers on the comparison of upadacitinib and other biologics. Additionally, the submitted ITC did not include any safety outcome of interest.
Clinical heterogeneity across the trials was evident in terms of inclusion criteria and patient baseline characteristics. Significant differences were noted in potential effect modifiers, such as duration of disease, including years of active disease, use of prior DMARDs, and disease severity, including the status of disease (e.g., active, refractory, or intolerant to prior DMARDs). These factors are heightened due to the variation in inclusion and exclusion criteria across the included studies. Although the inclusion of a larger number of studies allows for a larger sample, which allows for more informative analysis, there is a greater chance that results may be swayed by differences in characteristics across studies. The study needs further analyses, such as a subgroup analysis or meta-regression, to assess the potential impact of these effect modifiers on the estimates of efficacy outcomes.
Importantly, the analysis did not include other clinically meaningful outcomes such as PsA symptoms (e.g., pain and fatigue) or HRQoL. Although some of these might be represented in the outcome scores analyzed, they have been highlighted as important outcomes to report separately by both clinicians and patients. Last, no assessment of safety or tolerability was conducted. An overall assessment of the efficacy and safety profile between upadacitinib versus other bDMARDs available in current practice is missing. At a minimum, a better understanding of potential differences in discontinuation due to AEs may have highlighted potential differences between treatments. Given the importance of treatment adherence that occurs with this class of biologic medications, information on comparative safety would help weigh against comparative efficacy in decision-making. This understanding can provide important context for any observed results and strong overlaps with the efficacy outcomes. Current concerns with potential safety signals with the drug class make this an important assessment.
Summary
Overall, in biologic-naive patients, the NMA suggests that upadacitinib 15 mg is more efficacious for ACR response at week 12 compared to some comparators, specifically an IL-17 inhibitor (secukinumab 15 mg), IL-12/23 inhibitor (ustekinumab 45 mg), and IL-23 inhibitor (guselkumab), but this advantage was only seen for the IL-12/23 inhibitor at 24 weeks. Upadacitinib was also more efficacious than etanercept at both weeks 12 and 24 for PASI response; however, this was not seen with other TNF inhibitors. The IL-17 inhibitors (secukinumab 300 mg and ixekizumab) and IL-23 inhibitor (guselkumab) appear to be more efficacious than upadacitinib for PASI at week 12, although only the IL-23 inhibitor was favoured over upadacitinib at week 24. For PsARC, upadacitinib was more efficacious than tofacitinib but only at week 12; this was not seen at week 24. For HAQ-DI measured in PsARC responders at week 12, etanercept was more efficacious than upadacitinib; this benefit was not seen with other TNF inhibitors. At week 24, adalimumab was more efficacious than upadacitinib. The number of comparators included in some analyses (i.e., HAQ-DI at 24 weeks) was limited. For other analyses, no difference was seen between upadacitinib and the relevant comparators, and no consistent benefit of upadacitinib over bDMARDs or tsDMARDs was demonstrated across the measured end points of weeks 12 and 24.
In biologic-experienced patients, upadacitinib 15 mg was favoured only when compared to tofacitinib (a JAK inhibitor) in PASI response at week 12; this comparison was not performed at week 24. No difference in treatment effect was demonstrated in any other comparisons between upadacitinib and the included IL inhibitors. Not all IL inhibitors were included in every analyses, and the IL-23 inhibitor in particular was absent from many comparisons. Furthermore, TNF inhibitors were not included in any of the NMA analyses as insufficient eligible data were available for the bDMARD-experienced patient population, and no conclusions can be drawn on the comparative efficacy of upadacitinib in these patients. Also, because JAK inhibitors were not included in any of the week 24 analyses, the long-term comparative efficacy of upadacitinib compared to tofacitinib is unknown.
Taken together, and based on the sponsor-submitted ITC, upadacitinib does not show a consistent or distinct difference in efficacy as measured by ACR response, PASI, PsARC, or HAQ-DI when compared to bDMARDs or tsDMARDs in either bDMARD-naive or experienced patients. Although the NMA suggests upadacitinib is more efficacious over certain comparators in some end points, a consistent effect across all comparators or with specific classes of DMARDs (e.g., TNF inhibitors) was not observed. In particular, upadacitinib was not consistently favoured over comparators that are clinically relevant to this review, namely TNF inhibitors, IL inhibitors, and JAK inhibitors across both time points. Furthermore, not all comparators were included in every analysis, and some results were specific to a particular dosing regimen. A comparison with the tsDMARD most relevant to this review (tofacitinib) was largely absent, particularly in the bDMARD-experienced population. It is therefore difficult to draw a universal conclusion regarding the relative efficacy of upadacitinib versus bDMARDs, tsDMARDs, or specific classes of DMARDs. Compared to the biologic-naive population, the relative efficacy of upadacitinib to active comparators in the biologic-experienced population is less certain due to the fact that fewer agents were included in the analyses. Most importantly, conclusions regarding the long-term efficacy of upadacitinib compared to the active comparators relevant to this review cannot be drawn as the NMA used study results collected over an inappropriately short period given the chronic nature of PsA. There is also uncertainty due to the inherent heterogeneity across trials in the networks. The robustness of the comparative efficacy was further compromised by the lack of precision in the findings, and results from the sponsor-submitted ITC must be interpreted with caution. Moreover, no information was obtained regarding safety compared to other biologic or tsDMARDs. In addition, no conclusion could be drawn on the HRQoL outcomes.
Other Relevant Evidence
This section includes submitted long-term extension studies and additional relevant studies included in the sponsor’s submission to CADTH that were considered to address important gaps in the evidence included in the systematic review.
Long-Term Extension Studies
Both SELECT-PsA1 and SELECT-PsA2 included 2 study periods. The study duration in SELECT-PsA1 included a 35-day screening period; a 56-week blinded period that included 24 weeks of randomized, double-blind, placebo-controlled, and active comparator–controlled treatment followed by an additional 32 weeks of active comparator–controlled treatment (period 1); and a long-term extension period of up to a total treatment duration of approximately 5 years (period 2).33 The study duration in SELECT-PsA2 included a 35-day screening period; a 56-week blinded period that included 24 weeks of randomized, double-blind, parallel-group, placebo-controlled treatment followed by an additional 32 weeks of blinded upadacitinib treatment (period 1); and a long-term extension period (period 2) of up to a total treatment duration of approximately 3 years.11 The 56-week data for both studies are summarized in the following section.
Methods
At week 24 in both SELECT-PsA1 and PsA2, patients who were randomized to placebo at the start of the study were switched to pre-assigned oral upadacitinib 15 mg or 30 mg once daily in a 1:1 ratio, regardless of response. Patients, study-site personnel, the investigator, and the sponsor study team were blinded to study drug assignment, until all patients completed the week 24 visit. Thereafter, an unblinded analysis was conducted by the sponsor but the study sites and patients remained blinded. When the last patient completed the last visit of period 1 (week 56), the drug assignments were unblinded and treatment was continued in an open-label manner until period 2 had completed.11,33
Populations and Patient Disposition
Because the data from week 24 to week 56 were collected during an extension of the initial 24 weeks of SELECT-PsA1 and SELECT-PsA2, the populations at baseline were the same as those reported earlier in this report. A summary of patient disposition through to week 56 is presented in Table 32. SELECT-PsA1 reported that 362 patients (84.2%) completed the study drug dosing in the upadacitinib arm, 353 patients (82.3%) completed the drug dosing in the adalimumab arm, and 172 patients (81.5%) completed in the placebo-to-upadacitinib arm for period 1.33 In SELECT-PsA2, 65 patients (61.3%), and 159 patients (75.4%) completed the drug dosing in the placebo-to-upadacitinib arm and the upadacitinib arm, respectively.11
Table 32: Patient Disposition up to Week 56
Disposition | SELECT-PsA1 | SELECT-PsA2 | |||
|---|---|---|---|---|---|
PBO followed by UPA 15 mga | ADA 40 mg | UPA 15 mg | PBO followed by UPA 15 mga | UPA 15 mg | |
Randomized, N (%) | 211 | 429 | 430 | 106 | 211 |
Completed period 1 (week 56) on study drug, N (%) | 172 (81.5) | 353 (82.3) | 362 (84.2) | 65 (61.3) | 159 (75.4) |
Discontinued study drug during period 1, N (%) | 39 (18.5) | 76 (17.7) | 68 (15.8) | 41 (38.7) | 52 (24.6) |
Primary reason for discontinuation, N (%) | |||||
Adverse event | 9 (4.3) | 23 (5.4) | 21 (4.9) | 10 (9.4) | 18 (8.5) |
Withdrawal by subject | 12 (5.7) | 20 (4.7) | 24 (5.6) | 10b (9.4) | 3 (1.4) |
Lost to follow-up | 3 (1.4) | 4 (0.9) | 7 (1.6) | 3 (2.8) | 6 (2.8) |
Lack of efficacy | 12 (5.7) | 24 (5.6) | 11 (2.6) | 17 (16.0) | 20 (9.5) |
Met discontinuation criteria (from week 36)c | 4 (1.9) | 12 (2.8) | 4 (0.9) | 1 (0.9) | 7 (3.3) |
Other | 3 (1.4) | 5 (1.2) | 5 (1.2) | 1 (0.9) | 5 (2.4) |
ADA = adalimumab; PBO = placebo; UPA = upadacitinib.
Note: UPA 30 mg oral once-daily (n = 423 in SELECT-PsA1; n = 219 in SELECT-PsA2) and PBO to UPA 30 mg oral once-daily treatment groups are not shown.
aPBO/UPA = PBO day 1 through week 24 and UPA thereafter. At week 24, patients randomized to placebo (N = 423 for SELECT-PsA1 and N = 212 for SELECT-PsA2) were switched to UPA. Patients who were randomized to placebo were pre-assigned to either UPA 15 mg or 30 mg, orally once daily, in a 1:1 ratio. During weeks 24 to 56, the following number of patients were switched to upadacitinib:
• SELECT-PsA1: n = 211 (PBO to UPA 15 mg), n = 212 (PBO to UPA 30 mg)
• SELECT-PsA2: n = 106 (PBO to UPA 15 mg), n = 106 (PBO to UPA 30 mg)
bOne participant met the criteria for discontinuation due to lack of efficacy but was reported as a withdrawal by subject.
cDiscontinuation criteria is failure to show at least 20% improvement in either or both tender joint count or swollen joint count compared to baseline at 2 consecutive visits.
Source: SELECT-PsA1 Week 56 Clinical Study Report33 and SELECT-PsA2 Week 56 Clinical Study Report.11
Interventions
Patients who initially received placebo in SELECT-PsA1 and SELECT-PsA2 trials were switched to upadacitinib 15 mg or upadacitinib 30 mg at week 24. The long-term efficacy outcomes presented here include patients who received either upadacitinib, placebo followed by upadacitinib, or adalimumab (SELECT-PsA1 trial only) for all of period 1 (56 weeks).
All patients participating in SELECT-PsA1 who met eligibility criteria were randomized to receive upadacitinib 15 mg or 30 mg once daily (N = 430 and N = 423, respectively), adalimumab 40 mg every other week (N = 429), or placebo (N = 423) during the first 24 weeks, after which patients receiving placebo were switched to upadacitinib 15 mg (N = 211) or 30 mg (N = 212).33 All patients participating who met eligibility criteria for SELECT-PsA2 were randomized to receive upadacitinib 15 mg (N = 210) or 30 mg (N = 210), or placebo during the first 24 weeks, after which patients receiving placebo were switched to upadacitinib 15 mg (N = 105) or 30 mg (N = 105).11 Further description of the 30 mg upadacitinib group was not included in this review as the dose is higher than the dose approved by Health Canada.
After the last patient completed the week 24 study visit, the sponsor conducted an unblinded analysis for the purpose of initial regulatory submission. A second unblinded analysis was conducted for regulatory purposes after all patients completed period 1.11,33
Outcomes
The efficacy outcomes presented here correspond to the data available for the outcomes reported in the report above (week 24 data).
Statistical Analysis
Descriptive statistics and 95% CIs were provided for each randomized treatment group in the long term efficacy analysis. In SELECT-PsA1, treatment comparisons between each upadacitinib dose versus adalimumab were made for efficacy end points for the originally randomized upadacitinib groups and adalimumab group. No adjustment was made for multiple comparisons to evaluate long-term efficacy.
For non-radiographic binary end points, as-observed data analysis and as-observed data with imputation, missing measurements were imputed as nonresponders. As-observed data without imputation are presented in this section. Frequencies (point estimates) and 95% CIs using normal approximation were provided for the response rate for each randomized treatment group. Comparisons were made between each originally randomized upadacitinib dose group and the adalimumab group using the Cochran-Mantel-Haenszel test adjusting for the main stratification factor of current DMARD use (yes/no).
For non-radiographic continuous end points, comparisons were made between each originally randomized upadacitinib dose group and the adalimumab group using the MMRM model based on as-observed data, with fixed effects of treatment, visit, treatment-by-visit interaction, and the stratification factor of current DMARD use (yes/no) and the continuous fixed covariate of baseline measurement. The LS mean and 95% CI for each randomized treatment group were provided.
For radiographic end points, analysis was based on linear extrapolation imputation and as-observed data.11,33
Long-term safety analyses that accounted for protocol-defined treatment switching for both SELECT-PsA1 and SELECT-PsA2 included reporting of AE rates adjusted by cumulative exposure. The TEAE rate per 100 PYs of exposure was presented by actual treatment received at the time of AE.11,33
Exposure to Study Treatments
Through the data cut-off, the mean durations of study drug exposure in SELECT-PsA1 were similar among the upadacitinib 15 mg and adalimumab group. The mean durations of exposure to adalimumab were 537.6 days (SD = 221.71), and 496.7 days (SD = 216.32) in the upadacitinib 15 mg group. For patients who switched from placebo to upadacitinib 15 mg or 30 mg at week 24, their exposure to upadacitinib is included in this data.33 The mean duration of exposure in SELECT-PsA2 to upadacitinib 15 mg was 528.3 days (SD = 273.17). Data for exposure in SELECT-PsA1 represents period 1 and period 2 combined exposure and is presented by treatment received.11
Efficacy
Only the efficacy outcomes identified in the review protocol and those indicated as important by patient groups are reported below. Data tables are only presented for end points that were included in the multiplicity-controlled analyses (primary and major secondary efficacy outcomes). These coincide with the end points for week 24 data. Data tables for end points that were not part of the statistical testing hierarchy are presented in Appendix 3. The results of as-observed analysis with imputation are consistent with the as-observed results.
ACR20, ARC50, and ARC70
The percentages of patients who achieved an ACR20, ARC50, or ARC70 at week 56 are summarized in Table 33. SELECT-PsA1 reported 85.9% (95% CI, 71.7 to 79.8), 68.2% (95% CI, 63.4 to 73.0) and 45.8% (95% CI, 40.8 to 50.9) of patients met criteria for ACR20, ARC50, and ARC70, respectively, at week 56 in the upadacitinib 15 mg group, and 81.2% (95% CI, 77.1 to 85.2), 60.1% (95% CI, 55.0 to 65.2) and 36.5% (95% CI, 31.5 to 41.5) in the adalimumab group. Among patients who started on placebo and switched to upadacitinib at week 24, the trajectory for achievement of ACR20, ARC50, or ARC70 after upadacitinib initiation was similar to that observed after upadacitinib initiation in patients who started upadacitinib on day 1, with respective response rates at week 56 of 87.6% (95% CI, 82.7 to 92.4), 64.4% (95% CI, 57.4 to 71.5), and 34.8% (95% CI, 27.8 to 41.8) in the placebo-to-upadacitinib 15 mg group. Compared with the adalimumab group, the proportion of patients who achieved an ACR20, ARC50, or ARC70 was greater in the upadacitinib 15 mg group at most visits beyond week 24 and through week 56, with response-rate differences of 6.3% (95% CI, 0.3 to 12.2) for ACR20, 8.1% (95% CI, 1.1 to 15.1) for ACR50, and 9.3% (95% CI, 2.2 to 16.4) for ACR70.33
Among patients randomized to initiate upadacitinib treatment on day 1 in SELECT-PsA2, the percentage of patients who achieved ACR20, ARC50, or ARC70 at week 24 continued to increase or was maintained throughout week 56 for the 15 mg dose. The percentages of patients who achieved ACR20, ARC50, or ARC70 at week 56 were 79.6% (95% CI, 73.4 to 85.8), 52.8% (95% CI, 45.1 to 60.4), and 31.1% (95% CI, 24.0 to 38.2), respectively, in the 15 mg dose group. For patients who started on placebo and switched to upadacitinib at week 24, the trajectory for achievement of ACR20, ARC50, or ARC70 after starting upadacitinib was similar to that observed after upadacitinib initiation in patients who started upadacitinib on day 1, with response rates at week 56 of 78.3% (95% CI, 68.5 to 88.0), 47.8% (95% CI, 36.0 to 59.6), and 24.6% (95% CI, 14.5 to 34.8), respectively, in the 15 mg dose group.11
Table 33: Clinical Response (ACR20, ARC50, and ARC70) at Week 56
Treatment group | Total N | Responders, n (%) | Response rate (95% CI)a | Response-rate difference vs. control | |
|---|---|---|---|---|---|
Point estimate (95% CI)b | P valuec | ||||
ACR20 response rate at week 56 | |||||
SELECT-PsA1 | |||||
PBO to UPA 15 mg q.d. | 177 | 155 (87.6) | 87.6 (82.7 to 92.4) | 6.3 (0.3 to 12.2) UPA vs. ADA | 0.0391 |
ADA 40 mg e.o.w. | 356 | 289 (81.2) | 81.2 (77.1 to 85.2) | ||
UPA 15 mg q.d. | 369 | 317 (85.9) | 85.9 (71.7 to 79.8) | ||
SELECT-PsA2 | |||||
PBO to UPA 15 mg q.d. | 69 | 54 (78.3) | 78.3 (68.5 to 88.0) | NR | NR |
UPA 15 mg q.d. | 162 | 129 (79.6) | 79.6 (73.4 to 85.8) | ||
ACR50 response at week 56 | |||||
SELECT-PsA1 | |||||
PBO to UPA 15 mg q.d. | 177 | 114 (64.4) | 64.4 (57.4 to 71.5) | 8.1 (1.1 to 15.1) UPA vs. ADA | 0.0236 |
ADA 40 mg e.o.w | 356 | 214 (60.1) | 60.1 (55.0 to 65.2) | ||
UPA 15 mg q.d. | 368 | 251 (68.2) | 68.2 (63.4 to 73.0) | ||
SELECT-PsA2 | |||||
PBO to UPA 15 mg q.d. | 69 | 33 (47.8) | 47.8 (36.0 to 59.6) | NR | NR |
UPA 15 mg q.d. | 163 | 86 (52.8) | 52.8 (45.1 to 60.4) | ||
ACR70 response at week 56 | |||||
SELECT-PsA1 | |||||
PBO to UPA 15 mg q.d. | 178 | 62 (34.8) | 34.8 (27.8 to 41.8) | 9.3 (2.2 to 16.4) UPA vs. ADA | 0.0105 |
ADA 40 mg e.o.w. | 359 | 131 (36.5) | 36.5 (31.5 to 41.5) | ||
UPA 15 mg q.d. | 371 | 170 (45.8) | 45.8 (40.8 to 50.9) | ||
SELECT-PsA2 | |||||
PBO to UPA 15 mg q.d. | 69 | 17 (24.6) | 24.6 (14.5 to 34.8) | NR | NR |
UPA 15 mg q.d. | 164 | 51 (31.1) | 31.1 (24.0 to 38.2) | ||
ADA = adalimumab; CI = confidence interval; e.o.w = every other week; PBO = placebo; NR = not reported; q.d. = daily; UPA = upadacitinib; vs. = versus .
Note: Patients randomized to PBO to UPA 15 mg q.d. or PBO to UPA 30 mg q.d. switched to UPA 15 mg q.d. or UPA 30 mg q.d. at week 24 and their data up to week 24 are under PBO exposure.
a95% CIs for response rates are calculated based on normal approximation to the binomial distribution.
b95% CIs for response rates difference are calculated based on normal approximation.
cThe P value was constructed using a Cochran-Mantel-Haenszel test adjusting for the main stratification factor of current disease-modifying antirheumatic drug use (yes/no). However, no adjustment was made for multiple comparisons.
Source: SELECT-PsA1 Week 56 Clinical Study Report33 and SELECT-PsA2 Week 56 Clinical Study Report.11
HAQ-DI, Patient’s Assessment of Pain, FACIT-F, SF-36, SAPS, and PsA SHS
The change from baseline to week 56 for both SELECT-PsA1 and SELECT-PsA2 was reported for the HAQ-DI, patient’s assessment of pain scale, FACIT-F, SF-36, SAPS, and PsA SHS.
Among patients in both studies who were randomized to initiate upadacitinib 15 mg or adalimumab on day 1, the results for the ACR components (HAQ-DI and patient’s assessment of pain) at week 24 showed a reduction in disability or improvement in health status through to week 56 (Table 34 and Table 35). Improvement in patient-reported outcomes at week 24, as measured by mean changes from baseline in SF-36 PCS and MCS and FACIT-F were also improved over time or maintained through week 56. In SELECT-PsA1, a greater improvement in SF-36 PCS and FACIT-F was observed in the upadacitinib 15 mg group compared with the adalimumab group (Table 36 and Table 37). Additionally, the mean decreases from baseline in SAPS for those randomized to receive upadacitinib 15 mg or adalimumab continued to decrease or were maintained through week 56. In SELECT-PsA1, greater improvements in SAPS were observed in the upadacitinib 15 mg group compared with the adalimumab group at all visits beyond week 24 through week 56 (nominal P < 0.05) (Table 38). Among patients who started on placebo and switched to upadacitinib at week 24, the trajectory for improvements achieved after upadacitinib initiation was similar to that observed after upadacitinib initiation in patients who started upadacitinib on day 1, leading to comparable results at week 56.11,33
For SHS in SELECT-PsA1, results from as-observed analyses were consistent with the linear extrapolation analyses. At week 56, patients in the upadacitinib 15 mg group had a smaller mean increase in SHS from baseline compared with those initially randomized to placebo.33 In SELECT-PsA2, SHS was not measured in patients (Table 39).
Table 34: Change From Baseline in HAQ-DI at Week 56
Treatment group | Total N | Baseline, mean | Visit, mean | Change from baseline | ||
|---|---|---|---|---|---|---|
Within group | Between-group comparison | |||||
LS mean (95% CI)b | LS mean difference (95% CI) | P valuea | ||||
HAQ-DI at week 56 (as observed; FAS) | ||||||
SELECT-PsA1 | ||||||
PBO to UPA 15 mg q.d. | 178 | 1.08 | 0.68 | −0.40 (−0.48 to −0.32) | −0.11 (−0.18 to −0.03) UPA vs. ADA | 0.0065 |
ADA 40 mg e.o.w. | 361 | 1.09 | 0.65 | −0.43 (−0.49 to −0.38) | ||
UPA 15 mg q.d. | 370 | 1.12 | 0.56 | −0.54 (−0.59 to −0.48) | ||
SELECT-PsA2 | ||||||
PBO to UPA 15 mg q.d. | 69 | 1.21 | 0.81 | −0.40 (−0.52 to −0.29) | NR | NR |
UPA 15 mg q.d. | 164 | 1.07 | 0.69 | −0.35 (−0.43 to −0.27) | ||
ADA = adalimumab; CI = confidence interval; e.o.w. = every other week; FAS = full analysis set; HAQ-DI = Health Assessment Questionnaire–Disability Index; LS = least squares; NR = not reported; PBO = placebo; q.d. = daily; UPA = upadacitinib; vs. = versus .
Note: Patients randomized to placebo to upadacitinib 15 mg q.d. or placebo to upadacitinib 30 mg q.d. switched to the respective upadacitinib dosage at week 24 and their data up to week 24 are under placebo exposure.
aStatistically significant at the 0.05 level.
bWithin-group LS mean and 95% CI, and between-group LS mean difference and 95% CI and nominal P value are based on a mixed model for repeated measures analysis with unstructured variance-covariance matrix, including treatment, visit, treatment-by-visit interaction, and the stratification factor current of disease-modifying antirheumatic drug use (yes/no) as fixed factors and the continuous fixed covariate of baseline measurement.
Source: SELECT-PsA1 Week 56 Clinical Study Report33 and SELECT-PsA2 Week 56 Clinical Study Report.11
Table 35: Change From Baseline in Patient’s Assessment of Pain at Week 56
Treatment group | Total N | Baseline, mean | Visit, mean | Change from baseline | ||
|---|---|---|---|---|---|---|
Within group | Between-group comparison | |||||
LS mean (95% CI) | LS mean difference (95% CI) | P valuea | ||||
Pain NRS at week 56 (as observed; FAS) | ||||||
SELECT-PsA1b | ||||||
PBO to UPA 15 mg q.d. | 178 | 6.0 | 2.8 | −3.1 (−3.5 to −2.8) | −0.4 (−0.8 to −0.1) UPA vs. ADA | 0.0106 |
ADA 40 mg e.o.w. | 362 | 5.9 | 2.9 | −2.9 (−3.1 to −2.7) | ||
UPA 15 mg q.d. | 370 | 6.1 | 2.6 | −3.3 (−3.6 to −3.1) | ||
SELECT-PsA2c | ||||||
PBO to UPA 15 mg q.d. | 69 | 6.7 | 4.0 | −2.4 (−3.0 to −1.9) | NR | NR |
UPA 15 mg q.d. | 164 | 6.3 | 3.5 | −2.6 (−2.9 to −2.2) | ||
ADA = adalimumab; CI = confidence interval; e.o.w. = every other week; FAS = full analysis set; LS = least squares; NRS = numerical rating scale; NR = not reported; PBO = placebo; q.d. = daily; UPA = upadacitinib; vs. = versus .
Note: Patients randomized to PBO to UPA 15 mg q.d. or PBO to UPA 30 mg q.d. switched to UPA 15 mg q.d. or UPA 30 mg q.d. at week 24 and their data up to week 24 are under PBO exposure.
aP values are presented where available; however, analyses were not adjusted for multiple comparisons.
bWithin-group LS mean and 95% CI, and between-group LS mean difference and 95% CI and nominal P values are based on a mixed model for repeated measures analysis with unstructured variance-covariance matrix, including treatment, visit, treatment-by-visit interaction, and the stratification factor of current disease-modifying antirheumatic drug use (yes/no) as fixed factors and the continuous fixed covariate of baseline measurement.
c95% CIs were calculated based on mixed model for repeated measures analysis with an unstructured variance-covariance matrix.
Source: SELECT-PsA1 Week 56 Clinical Study Report33 and SELECT-PsA2 Week 56 Clinical Study Report.11
Table 36: Change From Baseline in FACIT-F at Week 56
Treatment group | Total N | Baseline, mean | Visit, mean | Change from baseline | ||
|---|---|---|---|---|---|---|
Within group | Between-group comparison | |||||
LS mean (95% CI) | LS mean difference (95% CI)b | P valuea | ||||
FACIT-F at week 56 (as observed; FAS) | ||||||
SELECT-PsA1 | ||||||
PBO to UPA 15 mg q.d. | 178 | 31.5 | 38.0 | 7.2 (5.9 to 8.6) | 1.35 (−0.0 to 2.6) UPA vs. ADA | 0.0510 |
ADA 40 mg e.o.w. | 364 | 30.5 | 38.2 | 7.6 (6.7 to 8.6) | ||
UPA 15 mg q.d. | 370 | 29.3 | 38.7 | 8.9 (8.0 to 9.9) | ||
SELECT-PsA2 | ||||||
PBO to UPA 15 mg q.d. | 67 | 54.1 | 63.7 | 7.7 (2.6 to 12.7) | NA | NA |
UPA 15 mg q.d. | 163 | 54.4 | 66.2 | 10.6 (7.4 to 13.9) | ||
ADA = adalimumab; CI = confidence interval; e.o.w. = every other week; FACIT-F = Functional Assessment of Chronic Illness Therapy–Fatigue; FAS = full analysis set; LS = least squares; NA = not applicable; PBO = placebo; q.d. = every day; UPA = upadacitinib; vs. = versus .
aP values are presented where available; however, analyses were not adjusted for multiple comparisons.
bWithin-group LS mean and 95% CI, and between-group LS mean difference and 95% CI and nominal P values are based on a mixed model for repeated measurement analysis with unstructured variance-covariance matrix, including treatment, visit, treatment-by-visit interaction, and the stratification factor of current disease-modifying antirheumatic drug use (yes/no) as fixed factors and the continuous fixed covariate of baseline measurement.
Source: SELECT-PsA1 Week 56 Clinical Study Report33 and SELECT-PsA2 Week 56 Clinical Study Report.11
Table 37: Change From Baseline in SF-36 at Week 56
Treatment group | Total N | Baseline, mean | Visit, mean | Change from baseline | ||
|---|---|---|---|---|---|---|
Within-group | Between-group comparison | |||||
LS mean (95% CI) | LS mean difference (95% CI) | P valuea | ||||
PCS at week 56 (MMRM,b FAS) | ||||||
SELECT-PsA1 | ||||||
PBO to UPA 15 mg q.d. | 178 | 35.78 | 44.82 | 9.27 (8.03 to 10.50) | 1.93 (0.75 to 3.11) UPA vs. ADA | 0.0014 |
ADA 40 mg e.o.w. | 364 | 36.02 | 45.04 | 8.91 (8.04 to 9.78) | ||
UPA 15 mg q.d. | 371 | 34.96 | 46.34 | 10.84 (9.96 to 11.72) | ||
SELECT-PsA2 | ||||||
PBO to UPA 15 mg q.d. | 68 | 35.32 | 42.52 | 6.74 (4.88 to 8.60) | NA | NA |
UPA 15 mg q.d. | 163 | 35.07 | 42.91 | 7.21 (5.99 to 8.44) | ||
MCS at week 56 (MMRM,b FAS) | ||||||
SELECT-PsA1 | ||||||
PBO to UPA 15 mg q.d. | 178 | 45.60 | 49.25 | 3.63 (2.34 to 4.93) | 0.86 (−0.38 to 2.10) UPA vs. ADA | 0.1758 |
ADA 40 mg e.o.w | 364 | 45.72 | 50.09 | 4.29 (3.37 to 5.21) | ||
UPA 15 mg q.d. | 371 | 45.18 | 50.57 | 5.15 (4.23 to 6.07) | ||
SELECT-PsA2 | ||||||
PBO to UPA 15 mg q.d. | 68 | 42.26 | 47.47 | 3.63 (1.67 to 5.60) | NR | NR |
UPA 15 mg q.d. | 163 | 45.05 | 48.56 | 3.33 (2.04 to 4.62) | ||
ADA = adalimumab; CI = confidence interval; FAS = full analysis set; LS = least squares; MCS = mental component summary; MMRM = mixed model for repeated measures; PCS = physical component summary; NA = not applicable; NR = not reported; PBO = placebo; q.d. = daily; SF-36 = Short Form (36) Health Survey; UPA = upadacitinib; vs. = versus .
Note: Patients randomized to PBO to UPA 15 mg q.d. or PBO to UPA 30 mg q.d. switched to UPA 15 mg q.d. or UPA 30 mg q.d. at week 24 and their data up to week 24 are under PBO exposure.
aP values are presented where available; however, analyses were not adjusted for multiple comparisons.
bWithin-group LS mean and 95% CI, and between-group LS mean difference and 95% CI and nominal P values are based on an MMRM analysis with unstructured variance-covariance matrix, including treatment, visit, treatment-by-visit interaction, and the stratification factor of current disease-modifying antirheumatic drug use (yes/no) as fixed factors and the continuous fixed covariate of baseline measurement. The MMRM analysis used observed longitudinal data up to week 12 before premature discontinuation of the study drug.
Source: SELECT-PsA1 Week 56 Clinical Study Report33 and SELECT-PsA2 Week 56 Clinical Study Report.11
Table 38: Change From Baseline in SAPS at Week 56
Treatment group | Total N | Baseline, mean | Visit, mean | Change from baseline | ||
|---|---|---|---|---|---|---|
Within group | Between-group comparison | |||||
LS mean (95% CI) | LS mean difference (95% CI) | P valuea | ||||
SAPS at week 56 (MMRM,b FAS) | ||||||
SELECT-PsA1 | ||||||
PBO to UPA 15 mg q.d. | 178 | 44.2 | 15.1 | −28.1 (−30.5 to −25.6) | −3.8 (−6.1 to −1.5) UPA vs. ADA | 0.0014 |
ADA 40 mg e.o.w. | 364 | 42.5 | 16.3 | −25.8 (−27.6 to −24.1) | ||
UPA 15 mg q.d. | 370 | 44.3 | 13.2 | −29.6 (−31.4 to −27.9) | ||
SELECT-PsA2 | ||||||
PBO to UPA 15 mg q.d. | 67 | 55.6 | 24.8 | −26.6 (−30.9 to −22.3) | NR | NR |
UPA 15 mg q.d. | 163 | 48.0 | 19.9 | −27.7 (−30.5 to −24.9) | ||
ADA = adalimumab; CI = confidence interval; e.o.w = every other week; FAS = full analysis set; LS = least squares; MMRM = mixed model for repeated measures; NR = not reported; PBO = placebo; q.d. = daily; SAPS = Self-Assessment of Psoriasis Symptoms; UPA = upadacitinib; vs. = versus .
aP values are presented where available; however, analyses were not adjusted for multiple comparisons.
bWithin-group LS mean and 95% CI, and between-group LS mean difference and 95% CI and nominal P values are based on an MMRM analysis with unstructured variance-covariance matrix, including treatment, visit, treatment-by-visit interaction, and the stratification factor of current disease-modifying antirheumatic drug use (yes/no) as fixed factors and the continuous fixed covariate of baseline measurement. The MMRM analysis used observed longitudinal data up to week 16 before premature discontinuation of the study drug.
Source: SELECT-PsA1 Week 56 Clinical Study Report33 and SELECT-PsA2 Week 56 Clinical Study Report.11
Table 39: Change From Baseline in Psoriatic Arthritis SHS at Week 56
Treatment group | Total N | Baseline, mean | Visit, mean | Change from baseline | ||
|---|---|---|---|---|---|---|
Within group | Between-group comparison | |||||
LS mean (95% CI)a | LS mean difference (95% CI) | P value | ||||
SHS at week 56 (as observed; FAS) | ||||||
SELECT-PsA1 | ||||||
PBO to UPA 15 mg q.d. | 170 | 13.87 | 14.19 | 0.33 (0.15 to 0.51) | NR | NR |
ADA 40 mg e.o.w. | 337 | 14.35 | 14.29 | −0.06 (−0.19 to 0.08) | NR | NR |
UPA 15 mg q.d. | 353 | 12.00 | 11.96 | −0.03 (−0.11 to 0.16) | NR | NR |
SELECT-PsA2 | ||||||
PBO to UPA 15 mg q.d. | NR | NR | NR | NR | NR | NR |
UPA 15 mg q.d. | NR | NR | NR | NR | NR | NR |
ADA = adalimumab; CI = confidence interval; e.o.w. = every other week; FAS = full analysis set; LS = least squares; NR = not reported; PBO = placebo; q.d. = daily; SHS = Sharp/van der Heijde Score; UPA = upadacitinib.
aWithin-group LS mean and 95% CI were based on an analysis of covariance model including treatment and the stratification factor of current disease-modifying antirheumatic drug use (yes/no) as fixed factors and baseline value as covariate.
Source: SELECT-PsA1 Week 56 Clinical Study Report33 and SELECT-PsA2 Week 56 Clinical Study Report.11
Dactylitis, Enthesitis, MDA, PASI, and sIGA
Of the patients in both SELECT-PsA1 and SELECT-PsA2 who had dactylitis and enthesitis at baseline and were randomized to initiate upadacitinib or adalimumab on day 1, the proportion who achieved resolution of dactylitis and enthesitis continued to increase through week 56. The proportion of patients in SELECT-PsA1 who achieved resolution of dactylitis and enthesitis at week 56 were similar in the upadacitinib 15 mg group compared with the adalimumab group (Table 40 and Table 41).
Among patients in SELECT-PsA1 and SELECT-PsA2 randomized to upadacitinib 15 mg or adalimumab on day 1, the proportion of patients who achieved MDA at week 24 continued to increase or was maintained through week 56. In SELECT-PsA1, for all visits beyond week 24 and through week 56, a greater proportion of patients in the upadacitinib 15 mg group achieved MDA compared to the adalimumab group, producing a response-rate difference of 7.6% (95% CI, 0.4 to 14.8) (Table 42). Among those patients in SELECT-PsA1 and SELECT-PsA2 who had psoriasis on at least 3% of their BSA at baseline and were randomized to initiate upadacitinib 15 mg or adalimumab on day 1, the proportion of patients achieving PASI 75 at week 24 continued to increase or was maintained through week 56. In SELECT-PsA1, improvements in PASI 75 were similar among the upadacitinib 15 mg, and adalimumab groups at week 56 (Table 43).
Patients who started on placebo and switched to upadacitinib at week 24 had a similar trajectory for the resolution of dactylitis, resolution of enthesitis, achievement of MDA, and achievement of PASI 75 response after upadacitinib initiation to that of patients who started upadacitinib on day 1, leading to comparable results at week 56.
A similar trend was observed for the proportion of patients achieving sIGA score of 0 or 1 with an improvement of at least 2 points from baseline (Table 44).11,33
Table 40: Proportion of Patients Achieving Dactylitis Resolution at Week 56
Treatment group | Total N | Responders, n (%) | Response rate (95% CI)a | Response-rate difference vs. control | |
|---|---|---|---|---|---|
Point estimate (95% CI)b | P valuec | ||||
LDI = 0 at week 56 (as observed, FAS) | |||||
SELECT-PsA1 | |||||
PBO to UPA 15 mg q.d. | 56 | 50 (89.3) | 89.3 (81.2 to 97.4) | 0.7 (−5.9 to 7.2) UPA vs. ADA | 0.8225 |
ADA 40 mg e.o.w | 110 | 102 (92.7) | 92.7 (87.9 to 97.6) | ||
UPA 15 mg q.d. | 121 | 113 (93.4) | 93.4 (89.0 to 97.8) | ||
SELECT-PsA2e | |||||
PBO to UPA 15 mg q.d. | 20 | 20 (100) | 100 (100.0 to 100.0) | NR | NR |
UPA 15 mg q.d. | 44 | 35 (79.5) | 79.5 (67.6 to 91.5) | ||
ADA = adalimumab; CI = confidence interval; e.o.w. = every other week; FAS = full analysis set; LDI = Leeds Dactylitis Index; NR = not reported; PBO = placebo; q.d. = daily; UPA = upadacitinib; vs. = versus .
a95% CI for response rates are calculated based on normal approximation to the binomial distribution.
b95% CI for response rate difference are calculated based on normal approximation.
cThe P value was constructed using a Cochran-Mantel-Haenszel test adjusting for the main stratification factor of current disease-modifying antirheumatic drug use (yes/no). However, no adjustment was made for multiple comparisons.
Source: SELECT-PsA1 Week 56 Clinical Study Report33 and SELECT-PsA2 Week 56 Clinical Study Report.11
Table 41: Proportion of Patients Achieving Enthesitis Resolution at Week 56
Treatment group | Total N | Responders, n (%) | Response rate (95% CI)a | Response-rate difference | |
|---|---|---|---|---|---|
Point estimate (95% CI)b | P valuec | ||||
LEI = 0 at week 56 (as observed, FAS) | |||||
SELECT-PsA1 | |||||
PBO to UPA 15 mg q.d. | 102 | 70 (68.6) | 68.6 (59.6 to 77.6) | 4.1 (−4.1 to 12.3) UPA vs. ADA | 0.3111 |
ADA 40 mg e.o.w. | 218 | 155 (71.1) | 71.1 (65.1 to 77.1) | ||
UPA 15 mg q.d. | 234 | 176 (75.2) | 75.2 (69.7 to 80.7) | ||
SELECT-PsA2 | |||||
PBO to UPA 15 mg q.d. | 46 | 31 (67.4) | 67.4 (53.8 to 80.9) | NR | NR |
UPA 15 mg q.d. | 101 | 62 (61.4) | 61.4 (51.9 to 70.9) | ||
ADA = adalimumab; CI = confidence interval; e.o.w. = every other week; FAS = full analysis set; LEI = Leeds Enthesitis Index; NR = not reported; PBO = placebo; q.d. = daily; UPA = upadacitinib; vs. = versus .
a95% CI for response rates are calculated based on normal approximation to the binomial distribution.
b95% CI for response-rate difference are calculated based on normal approximation.
cThe P value was constructed using a Cochran-Mantel-Haenszel test adjusting for the main stratification factor of current disease-modifying antirheumatic drug use (yes/no). However, no adjustment was made for multiple comparisons.
Source: SELECT-PsA1 Week 56 Clinical Study Report33 and SELECT-PsA2 Week 56 Clinical Study Report.11
Table 42: Proportion of Patients Achieving Minimal Disease Activity at Week 56
Treatment group | Total N | Responders, n (%) | Response rate (95% CI)a | Response-rate difference | |
|---|---|---|---|---|---|
Point estimate (95% CI)b | P valuec | ||||
Minimal disease activity at week 56 (as observed; FAS) | |||||
SELECT-PsA1 | |||||
PBO to UPA 15 mg q.d. | 178 | 79 (44.4) | 44.4 (37.1 to 51.7) | 7.6 (0.4 to 14.8) UPA vs. ADA | 0.0414 |
ADA 40 mg e.o.w. | 362 | 171 (47.2) | 47.2 (42.1 to 52.4) | ||
UPA 15 mg q.d. | 374 | 205 (54.8) | 54.8 (49.8 to 59.9) | ||
SELECT-PsA2 | |||||
PBO to UPA 15 mg q.d. | 70 | 19 (27.1) | 27.1 (16.7 to 37.6) | NR | NR |
UPA 15 mg q.d. | 166 | 64 (38.6) | 38.6 (31.2 to 46.0) | ||
ADA = adalimumab; CI = confidence interval; e.o.w. = every other week; FAS = full analysis set; NR = not reported; PBO = placebo; q.d. = daily; UPA = upadacitinib; vs. = versus .
a95% CI for response rates is calculated based on normal approximation to the binomial distribution.
b95% CI for response-rate difference are calculated based on normal approximation.
cP value was constructed using Cochran-Mantel-Haenszel test adjusting for the main stratification factor of current disease-modifying antirheumatic drug use (yes/no). However, no adjustment was made for multiple comparisons.
Source: SELECT-PsA1 Week 56 Clinical Study Report33 and SELECT-PsA2 Week 56 Clinical Study Report.11
Table 43: Proportion of Patients Achieving PASI 75 at Week 56
Treatment group | Total N | Responders, n (%) | Response rate (95% CI)a | Response-rate difference | |
|---|---|---|---|---|---|
Point estimate (95% CI)b | P valuec | ||||
PASI 75 at week 56 (as observed, FAS) | |||||
SELECT-PsA1 | |||||
PBO to UPA 15 mg q.d. | 88 | 61 (69.3) | 69.3 (59.7 to 79.0) | 4.0 (−4.9 to 12.9) UPA vs. ADA | 0.3806 |
ADA 40 mg e.o.w. | 178 | 129 (72.5) | 72.5 (65.9 to 79.0) | ||
UPA 15 mg q.d. | 187 | 143 (76.5) | 76.5 (70.4 to 82.6) | ||
SELECT-PsA2 | |||||
PBO to UPA 15 mg q.d. | 44 | 29 (65.9) | 65.9 (51.9 to 79.9) | NR | NR |
UPA 15 mg q.d. | 104 | 70 (67.3) | 67.3 (58.3 to 76.3) | ||
ADA = adalimumab; CI = confidence interval; e.o.w. = every other week; FAS = full analysis set; PASI 75 = 75% reduction in Psoriasis Area Severity Index score; NR = not reported; PBO = placebo; q.d. = daily; UPA = upadacitinib; vs. = versus .
Note: Patients randomized to PBO to UPA 15 mg q.d. or PBO to UPA 30 mg q.d. switched to UPA 15 mg q.d. or UPA 30 mg q.d. at week 24 and their data up to week 24 are under PBO exposure. Analysis of PASI 75 was performed only in patients with psoriasis on at least 3% of their BSA at baseline.
a95% CI for response rates is calculated based on normal approximation to the binomial distribution.
b95% CI for response-rate difference are calculated based on normal approximation.
cThe P value was constructed using a Cochran-Mantel-Haenszel test adjusting for the main stratification factor of current disease-modifying antirheumatic drug use (yes/no). However, no adjustment was made for multiple comparisons.
Source: SELECT-PsA1 Week 56 Clinical Study Report33 and SELECT-PsA2 Week 56 Clinical Study Report.11
Table 44: Proportion of Patients Achieving an sIGA of Psoriasis Score of 0 or 1 at Week 56
Treatment group | Total N | Responders, n (%) | Response rate (95% CI)a | Response-rate difference | |
|---|---|---|---|---|---|
Point estimate (95% CI)b | P valuec | ||||
sIGA at week 56 (as observed; FAS) | |||||
SELECT-PsA1 | |||||
PBO to UPA 15 mg q.d. | 137 | 52 (38.0) | 38.0 (29.8 to 46.1) | 5.0 (−3.1 to 13.2) UPA vs. ADA | 0.2429 |
ADA 40 mg e.o.w | 283 | 156 (55.1) | 55.1 (49.3 to 60.9) | ||
UPA 15 mg q.d. | 281 | 169 (60.1) | 60.1 (54.4 to 65.9) | ||
SELECT-PsA2 | |||||
PBO to UPA 15 mg q.d. | 56 | 24 (42.9) | 42.9 (29.9 to 55.8) | NR | NR |
UPA 15 mg q.d. | 131 | 58 (44.3) | 44.3 (35.8 to 52.8) | ||
ADA = adalimumab; CI = confidence interval; e.o.w. = every other week; FAS = full analysis set; NR = not reported; PBO = placebo; q.d. = daily; sIGA = static Investigator Global Assessment; UPA = upadacitinib; vs. = versus .
Note: Analysis was performed for patients who achieved a score of 0 or 1 and an improvement of at least 2 points from baseline, and only in patients with a baseline sIGA at least 2%.
a95% CI for response rates are calculated based on normal approximation to the binomial distribution.
b95% CI for response-rate difference are calculated based on normal approximation.
cThe P value was constructed using a Cochran-Mantel-Haenszel test adjusting for the main stratification factor of current disease-modifying antirheumatic drug use (yes/no). However, no adjustment was made for multiple comparisons.
Source: SELECT-PsA1 Week 56 Clinical Study Report33 and SELECT-PsA2 Week 56 Clinical Study Report.11
Additional End Points
Data tables for the following additional end points from week 56 can be found in Appendix 3: Proportion of Patients Achieving Modified PsARC Response (Table 53), change from baseline in WPAI (Table 54), change from baseline in EQ-5D-5L (Table 55), change from baseline in BASDAI at week 56 (Table 56), and proportion of patients achieving PASI 90 or PASI 100 at week 56 (Table 57).These were not part of the original multiplicity-controlled testing hierarchy in the week 24 analyses.
Harms
The pooled harms data up to week 56 from SELECT-PsA1 and SELECT-PsA2 studies are summarized in Table 45. Safety data through the data cut-offs that include period 1 and period 2 are presented as exposure-adjusted event rates. Of those patients in SELECT-PsA1 receiving adalimumab, 265.9 events per 100 PY were reported for at least 1 AE, 9.3 events per 100 PY were reported for at least 1 SAE and 7.4 events per 100 PY were reported for patients who stopped treatment due to AEs, and death was reported as 0.2 per 100 PY. Of those patients in SELECT-PsA1 receiving upadacitinib (15 mg), 281.1 events per 100 PY were reported for at least 1 AE, 9.1 events per 100 PY were reported for at least 1 SAE and 4.6 events per 100 PY were reported for patients who stopped treatment due to AEs.33 Patients in SELECT-PsA2 receiving upadacitinib reported 260.6 events per 100 patient PY for at least 1 AE, 14.3 events per 100 PY were reported for at least 1 SAE and 10.0 events per 100 PY were reported for patients who stopped treatment due to AEs.11 In SELECT-PsA1, individual notable harms were higher in patients receiving upadacitinib (15 mg) for all individual harms except for neutropenia (4.2 events per 100 PY for adalimumab versus 2.4 events per 100 PY for upadacitinib) and hepatic disorder (24.9 events per 100 PY for adalimumab versus 19.1 events per 100 PY for upadacitinib).33
Table 45: Summary of Harms up to Week 56 — Safety Population
Adverse events | SELECT-PsA1 | SELECT-PsA2 | |
|---|---|---|---|
ADA 40 mg N = 429 PY = 631.4 | UPA 15 mga N = 617 PY = 839.1 | UPA 15 mga N = 290 PY = 419.4 | |
Patients with at least 1 adverse event | |||
E (E/100 PY) | 1,679 (265.9) | 2,359 (281.1) | 1,093 (260.6) |
Most common events,b E (E/100 PY) | |||
Upper respiratory tract infection | 73 (11.6) | 124 (14.8) | 46 (11.0) |
Increased blood CPK | 46 (7.3) | 100 (11.9) | 22 (5.2) |
Nasopharyngitis | 67 (10.6) | 72 (8.6) | 49 (11.7) |
Increased ALT | 58 (9.2) | 68 (8.1) | 5 (1.2) |
Urinary tract infection | 23 (3.6) | 56 (6.7) | 41 (9.8) |
Bronchitis | 18 (2.9) | 48 (5.7) | 37 (8.8) |
Hypertension | 17 (2.7) | 47 (5.6) | 24 (5.7) |
Increased AST | 38 (6.0) | 46 (5.5) | 1 (0.2) |
Headache | 29 (4.6) | 43 (5.1) | 6 (1.4) |
Psoriatic arthropathyc | 32 (5.1) | 25 (3.0) | 28 (6.7) |
Influenza | 5 (0.8) | 27 (3.2) | 22 (5.2) |
Sinusitis | 15 (2.4) | 21 (2.5) | 23 (5.5) |
Patients with ≥ 1 serious adverse event | |||
E (E/100 PY) | 59 (9.3) | 76 (9.1) | 60 (14.3) |
Most common events,d E (E/100 PY) | |||
Pneumonia | 1 (0.2) | 6 (0.7) | 3 (0.7) |
Herpes zoster | 0 | 2 (0.2) | 0 |
Pulmonary embolism | 0 | 2 (0.2) | 1 (0.2) |
Corona virus infection | 1 (0.2) | 2 (0.2) | NR |
Angioedema | 0 | 2 (0.2) | NR |
Depression | 0 | 2 (0.2) | NR |
Diverticulitis | 0 | 2 (0.2) | 0 |
Sepsis | 0 | 2 (0.2) | 0 |
Uterine prolapse | 0 | 2 (0.2) | NR |
Osteoarthritis | 4 (0.6) | 1 (0.1) | 1 (0.2) |
Cellulitis | 3 (0.5) | 1 (0.1) | 2 (0.5) |
Cholelithiasis | 0 | 1 (0.1) | 2 (0.5) |
Cerebrovascular accident | 2 (0.3) | 0 | NR |
Psoriatic arthropathyc | 0 | 0 | 4 (1.0) |
Acute kidney injury | 0 | 0 | 2 (0.5) |
Dizziness | NR | NR | 2 (0.5) |
Nephrolithiasis | 1 (0.2) | 0 | 2 (0.5) |
Patients who stopped treatment due to adverse events | |||
E (E/100 PY) | 47 (7.4) | 39 (4.6) | 42 (10.0) |
Most common events,d E (E/100 PY) | |||
Blood CPK increased | 0 | 2 (0.2) | 0 |
Herpes zoster | 0 | 2 (0.2) | 0 |
Sepsis | 0 | 2 (0.2) | NR |
Psoriatic arthropathyc | 3 (0.5) | 1 (0.1) | 5 (1.2) |
Increased ALT | 3 (0.5) | 0 | 0 |
Alopecia | 2 (0.3) | 0 | NR |
Increased AST | 3 (0.5) | 0 | 0 |
Psoriasis | 3 (0.5) | 0 | 2 (0.5) |
Decreased white blood cell count | 0e | 0e | 2 (0.5) |
Prostate cancer | NR | NR | 2 (0.5) |
Deaths | |||
n/PY (n/100 PY)f | 1/631.5 (0.2) | 0 | 0 |
Multiple injuries; road traffic accident | 1/631.5 (0.2) | — | — |
Notable harms, E (E/100 PY) | |||
Serious infection | 8 (1.3) | 24 (2.9) | 11 (2.6) |
Serious pneumonia | 1 (0.2) | 6 (0.7) | 3 (0.7) |
Herpes zoster | 3 (0.5) | 33 (3.9) | 16 (3.8) |
Active TB | 0 | 0 | 0 |
Anemia | 10 (1.6) | 25 (3.0) | 9 (2.1) |
Neutropenia | 27 (4.3) | 20 (2.4) | 4 (1.0) |
Lymphopenia | 1 (0.2) | 27 (3.2) | 3 (0.7) |
Malignancy (any) | 6 (1.0) | 11 (1.3) | 10 (2.4) |
VTEg (fatal and non-fatal) | 2 (0.3) | 3 (0.4) | 1 (0.2) |
Arterial thrombosish | 1 (0.2) | 0 | 0 |
Gastrointestinal perforation | 0 | 2 (0.2) | 0 |
CPK elevation | 46 (7.3) | 100 (11.9) | 22 (5.2) |
Hepatic disorder | 157 (24.9) | 160 (19.1) | 20 (4.8) |
MACEi | 3 (0.5) | 3 (0.4) | 1 (0.2) |
Hyperlipidemia | 1 (0.2) | 5 (0.6) | 12 (2.9) |
ADA = adalimumab; AE = adverse event; ALT = alanine aminotransferase; AST = aspartate aminotransferase; CPK = creatine phosphokinase; E = events; MACE = major adverse cardiovascular event; NR = not reported; PY = patient-year; UPA = upadacitinib; VTE = venous thromboembolic event.
Note: The event rate (E) counts the number of events, and the incidence rate (n/100) counts the number of patients.
aIncludes upadacitinib exposure in UPA 15 mg and placebo switched to UPA 15 mg dose groups.
bFrequency of at least 5 E/100 PY in any treatment group.
cThe term psoriatic arthropathy refers to worsening of the underlying PsA disease.
dFrequency of at least 2 events in any treatment group.
eClassified as leukopenia.
fTreatment-emergent deaths were captured for deaths occurring no more than 30 days after last dose (or ≤ 70 days for patients in the adalimumab group). Deaths are presented as number of patients that had died (incidence rate) rather than the event rate. Four additional deaths had been reported up to week 56. In SELECT-PsA1, a total of 2 non-treatment-emergent deaths in the upadacitinib 15 mg treatment group were reported, occurring more than 30 days after the last dose of the study drug; 1 had already been captured under week 24. Both non–treatment-emergent deaths were thought to have a reasonable possibility of being related to the study drug. In PsA1 and PsA2, just 1 death occurred in the placebo group of each study; both have been captured under week 24 data.
gIncludes fatal and non-fatal deep-vein thrombosis and pulmonary embolism. None of the patients experience a fatal VTE.
hIncludes non-cardiac, non-neurologic, and non-fatal events.
iDefined as cardiovascular death, non-fatal myocardial infarction, and non-fatal stroke.
Source: SELECT-PsA1 Week 56 Clinical Study Report33 and SELECT-PsA2 Week 56 Clinical Study Report.11
Critical Appraisal
The long-term data from week 24 to week 56 of both SELECT-PsA1 and SELECT-PsA2 provide an overview of the efficacy and safety of upadacitinib over a 56-week period. Overall, efficacy was maintained during this period, and there were no major safety signals to report; however, the data are subject to certain limitations. Both studies were initially double-blinded, but sponsors were unblinded after the last patient completed the week 24 study visit. An unblinded analysis was conducted for the purpose of initial regulatory submission. After week 24, patients in both studies were made aware that they were on some form of active treatment (either upadacitinib or adalimumab for PsA1 and upadacitinib for PsA2) as all patients in the placebo groups were switched to upadacitinib. Although the site investigators and patients remained blinded until the end of period 1, awareness that placebos were no longer being given may have affected patient performance and evaluation.
As mentioned in the critical appraisal of week 24 data, imbalance in missing data (i.e., randomized patients not included in the analysis) continues to be a potential concern in the analyses of patient-reported outcomes, particularly as more patients discontinued study treatment between week 24 and 56. Particularly in SELECT-PsA2, approximately 40% of patients had discontinued from the placebo-to-upadacitinib 15 mg group by week 56. The larger proportion of missing data in the placebo group makes results more uncertain.
Conclusions about the long-term efficacy and safety outcomes are also limited by a lack of control in both SELECT-PsA1 and SELECT-PsA2, as well as a lack of a comparator in SELECT-PsA2. This is particularly problematic for the interpretation of patient-reported outcomes. In addition, for both SELECT studies, harm data reported for the upadacitinib exposure in upadacitinib 15 mg and placebo groups that switched to upadacitinib 15 mg were combined. Type I error rate adjustments were not planned for any of the outcomes reported in the efficacy analyses, which can limit the interpretation of statistically significant findings.
In addition, although SELECT-PsA1 was designed as a 5-year trial, long-term efficacy or safety outcomes (from week 56 to week 260) were not reported by the sponsor. Similarly, while SELECT-PsA2 was designed as a 3-year trial, long-term efficacy or safety outcomes (from week 56 to week 156) were not reported.
The generalizability of the long-term safety and efficacy results is similar to what was described earlier in this report. The patients included in these studies represent a subset of the patients seen in Canadian clinical practice.
Discussion
Summary of Available Evidence
Two multi-centre, phase III, placebo-controlled RCTs — SELECT-PsA1 (N = 1,705) and SELECT-PsA2 (N = 642) — met the inclusion criteria for this systematic review. SELECT-PsA1 also included an active control group of patients receiving adalimumab. Both SELECT studies enrolled adults with an established diagnosis of moderate to severely active PsA who had been previously treated with a DMARD. SELECT-PsA1 studied patients who had an insufficient response or were intolerant to a non-bDMARD, whereas PsA2 included patients who had an insufficient response or were intolerance to a bDMARD. The trials investigated the efficacy and safety of 2 dosages of oral upadacitinib: 15 mg once daily and 30 mg once daily; however, to align with the Health Canada–approved dose of upadacitinib 15 mg once daily, data for the 30 mg dose were not presented in this review. Both studies consist of 2 periods. Period 1 was 56 weeks in duration and included a 24-week double-blind period. At week 24, all patients on placebo were switched to upadacitinib. Stable background non-bDMARD therapy was permitted to continue during the study, and rescue therapy was permitted starting at week 16. The primary end point for both SELECT-PsA1 and PsA2 was the proportion of patients who achieved an ACR20 at week 12. Both studies had an appropriate randomization strategy; treatment groups within each study were generally well balanced. Compared to SELECT-PsA1, patients enrolled in PsA2 had experienced PsA for longer, with disease that was more difficult to control (based on baseline characteristics and treatment history). Overall, study discontinuation at week 24 was low and similar across the treatment groups, except for the placebo group in SELECT-PsA2, in which approximately 20% of patients had discontinued treatment.
The primary and major secondary efficacy outcomes were assessed using a hierarchical testing procedure to control the overall type I error rate. Several additional end points that were not part of the multiplicity-adjusted analyses but were identified in the CADTH systematic review protocol are also discussed in this report. Results from both studies were presented from interim analyses, with data cut-offs of December 13, 2019, for PsA1 and October 9, 2019, for PsA2. At each data cut-off point, all patients had completed week 24 or had discontinued from the study. Additional data collected after all patients had completed week 56 (period 1) are also discussed. By week 56, discontinuation rates from the study continued to be similar across all treatment groups in PsA1. Discontinuation rates in PsA2 were generally higher than in PsA1, and the placebo-to-upadacitinib 15 mg group had the highest proportion of patients discontinuing study treatment (38.7%).
Interpretation of Results
Efficacy
The SELECT-PsA1 and SELECT-PsA2 trials demonstrated a largely consistent treatment effect of oral upadacitinib 15 mg once daily compared to placebo in both bDMARD-naive and -experienced patients in the following specific outcomes identified in the CADTH systematic review: clinical response in PsA symptoms, measure of function and disability, measure of PsA symptoms, HRQoL, measure of skin disease, and musculoskeletal disease. Both studies showed statistically significant improvement with upadacitinib 15 mg over placebo as the primary end point of ACR20 at week 12 in patients with PsA. This primary outcome is a clinically relevant end point in the treatment of PsA and is a composite measure that includes end points identified as an outcome of importance to patients. In SELECT-PsA1, results of the pre-specified subgroup analyses were consistent with results from the overall population for the primary end point. However, ACR20 is a general measure of clinical response of peripheral joint disease and does not include assessment of enthesitis, dactylitis, or effects on the spine or skin. The effect of upadacitinib on domains outside of this composite end point were explored using other scales and instruments as part of secondary outcomes. The clinician expert consulted on this review noted that, overall, results are generalizable to the relevant Canadian patient population.
Numerous end points were measured at various time points across the SELECT studies. In this review, a total of 20 end points were presented from SELECT-PsA1, and 15 end points were presented from SELECT-PsA2. Not all end points presented were part of the multiplicity-adjusted statistical testing hierarchy in each trial. End points that were not adjusted for multiple comparisons are at risk of type I error and should be interpreted with caution. This review made no definitive conclusions for end points that fell outside of the statistical testing hierarchy. In SELECT-PsA1, a statistically significant benefit of upadacitinib over placebo was evident for 9 end points: ACR20 at week 12, MDA at week 24, HAQ-DI at week 12, FACIT-F at week 12, SF-36 PCS at week 12, PASI 75 at week 16, sIGA at week 16, enthesitis resolution at week 24, and SHS at week 24. Noninferiority was also demonstrated for upadacitinib compared to adalimumab for ACR20 at week 12, although upadacitinib was not superior to adalimumab for ACR20 at week 12. In SELECT-PsA2, a statistically significant benefit of upadacitinib over placebo was evident for 8 end points: ACR20 at week 12, MDA at week 24, HAQ-DI at week 12, FACIT-F at week 12, SF-36 at week 12, PASI 75 at week 16, sIGA at week 16, and SAPS at week 16. Across both studies, upadacitinib demonstrated a largely consistent treatment effect in 7 common end points: ACR20 at week 12, MDA at week 24, HAQ-DI at week 12, FACIT-F at week 12, SF-36 PCS at week 12, PASI 75 at week 16, and sIGA at week 16.
Other key secondary end points that were included in the multiplicity-adjusted testing hierarchy in only 1 of the studies can be used to characterize the efficacy of upadacitinib in their respective populations (biologic-naive versus biologic-experienced). Statistically significant improvement with upadacitinib compared to placebo was demonstrated in radiographic changes (measured by SHS) and resolution of enthesitis in SELECT-PsA1, as well as SAPS in SELECT-PsA2. However, according to the clinical expert consulted for this review, the small changes seen in some end points (e.g., SHS) may not reflect clinically meaningful improvement, particularly when measured over such a short length of time relative to the long course of the disease.
In SELECT-PsA1, the statistical testing failed to show superiority of upadacitinib 15 mg versus adalimumab in ACR20 at week 12. Statistical testing for end points ranked below this point in the hierarchy therefore should not have been performed. This affected the interpretation of the results of 4 end points: resolution of dactylitis (versus placebo), patient’s assessment of pain NRS (versus adalimumab), HAQ-DI (versus adalimumab), and SAPS (versus placebo) in SELECT-PsA1, and it is uncertain whether the between-group difference reported is clinically meaningful.
Several end points presented in this report but not part of the multiplicity-adjusted statistical testing hierarchy should be interpreted with caution. Six end points common to both studies comparing upadacitinib to placebo were not part of the multiplicity-adjusted statistical testing hierarchies, and no definitive conclusions can be drawn for either patient population (bDMARD-naive or bDMARD-experienced): modified PsARC at week 24, WPAI at week 24, patient’s assessment of pain NRS at week 12, EQ-5D-5L at week 24, dactylitis resolution at week 24, and BASDAI at week 24. In these analyses, results were numerically favourable for the upadacitinib 15 mg treatment group compared to placebo. Additional exploratory end points were also included in this report to provide further details, including ACR50 and ARC70 or PASI 90 and PASI 100. Generally, results were numerically similar or in favour of upadacitinib, although the magnitude was less than results seen when compared to placebo.
The input from patients identified the importance of treatments that are effective for psoriasis as well as PsA symptoms; data from the SELECT-PsA1 and SELECT-PsA2 trials have shown benefit with upadacitinib compared to placebo in several parameters, including skin disease and other measures of PsA (as measured by ACR20, PASI 75, and sIGA) in both bDMARD-naive and bDMARD-experienced patients. Reduction in PsA symptoms, such as fatigue and pain, as well as improvements in quality of life, work productivity, mobility, and ability to carry out activities of daily living were also identified as important end points by patient groups. Upadacitinib 15 mg once daily showed consistent benefit over placebo in both bDMARD-naive and -experienced patients for improved quality of life as measured by SF-36, function according to HAQ-DI, and fatigue as assessed by FACIT-F in both SELECT studies. The end points of quality of life as measured by EQ-5D-5L, work productivity according to WPAI, and patient’s assessment of pain NRS were supplemental. These end points numerically favoured treatment with upadacitinib when compared to placebo. An estimated MID for the relevant patient population was not available for all continuous end points, and for end points with an identified estimated MID, the change in scores from baseline did not always achieve the threshold for within- and between-group differences.
With regards to comparisons with adalimumab, PsA1 demonstrated noninferiority of upadacitinib 15 mg in the clinical response of PsA symptoms (ACR20 at week 12). The hierarchical testing prevented a statistical comparison between the 2 active treatment groups after upadacitinib failed to show superiority over adalimumab in ACR20. Conclusions about the comparative efficacy between upadacitinib 15 mg and adalimumab therefore cannot be drawn aside from ACR20 at week 12.
The patient groups also mentioned preference for oral administration of medications. At this time, other publicly funded treatments for the same indication are administered by IV infusion or subcutaneous injection. The other oral products currently approved for PsA, tofacitinib and apremilast, are not funded by public jurisdictions.
Several sources of uncertainty in SELECT-PsA1 and PsA2 were identified. A key limitation was the timeline of assessment, as 12 weeks may not be an adequate length of time to fully appreciate the benefit of adalimumab. The clinical expert consulted for this review indicated that a noninferiority test at 16 or 24 weeks would have been more appropriate; however, no such statistical test was conducted. Also, because currently available outcome measures in PsA, such as rheumatoid arthritis and psoriasis, have largely been adopted from other conditions, validity and reliability data specific to PsA are sparse, and some instruments (e.g., EQ-5D, WPAI, sIGA, and SAPS) lack a known MID exclusively for patients with PsA. A comparison between upadacitinib and adalimumab was made only in the bDMARD-naive population (SELECT-PsA1), and it is not known whether patients previously exposed to bDMARDs would derive the same efficacy relative to adalimumab. Furthermore, there is a lack of direct head-to-head comparisons of upadacitinib versus other active controls, particularly versus non-TNF inhibitors or tofacitinib. It is therefore difficult to determine whether the analysis of the full benefit of upadacitinib versus other treatments used the same indication. Despite these uncertainties, the results that indicate an improved response and the conclusion of a consistent treatment effect of upadacitinib 15 mg over placebo in patients with PsA appear reasonable.
The approved indication states that upadacitinib may be used as monotherapy or in combination with methotrexate. This is reflective of the pivotal trials, in which approximately 80% of patients in SELECT-PsA1 and 50% of patients in PsA2 received concomitant non-bDMARDs, and most received concomitant methotrexate. The number of patients who received other non-bDMARDs (varying in category and mechanism of action) were small for individual drugs. The magnitude of benefit of upadacitinib as monotherapy, particularly in bDMARD-naive patients, or in combination with other non-bDMARDs (i.e., other than methotrexate) is therefore limited, and cannot be generalized from the SELECT trials. The approved indication includes patients who have responded inadequately or are intolerant to methotrexate or other DMARDs. The indication refers to DMARDs in general, which can include csDMARDs, tsDMARDs, or bDMARDs. In both trials, a significant proportion of patients received prior methotrexate (approximately 90% in PsA1 and 70% in PSA2), which is a csDMARD and reflective of current practice. SELECT-PsA2 provides additional information on the benefit of upadacitinib in patients who failed on previous bDMARDs. However, as the share of enrolled patients with prior failure on more than 1 bDMARD was limited to approximately 30%, there was a limited number of patients who had failed several bDMARDs. This may limit the generalizability of the PsA2 study results in patients who had failed multiple bDMARD treatments. Overall, data from the SELECT-PsA1 and PsA2 trials support the sponsor’s funding request.
Results from the end of period 1 (week 56 data) suggest that the improvements in clinical and patient-reported outcomes observed at week 24 were maintained throughout the 56-week treatment period. Patients who were switched from placebo to upadacitinib at week 24 also showed improvements in clinical and patient-reported outcomes at week 56; the trajectory for achievement of response or improvement in end points after switching to upadacitinib was similar to those observed in patients who started upadacitinib on day 1. Numerically similar or greater achievement of results was seen in patients treated with upadacitinib from day 1 compared with achievement results with adalimumab. The conclusions of the long-term efficacy and safety outcomes at week 56 are limited by the lack of a placebo control in both SELECT-PsA1 and SELECT-PsA2, as well as the lack of a comparator in SELECT-PsA2. In addition, rescue therapy, including change in background treatment, was permitted after week 16. Furthermore, given that all patients were aware they were receiving an active treatment (upadacitinib or adalimumab) after week 24, this may affect performance and evaluation of patient-reported outcomes. No adjustment was made for multiplicity to evaluate long-term data. Given the large number of analyses performed, there is a risk of inflated type I error with the week 56 data, and these results should be interpreted with caution.
The sponsor provided an ITC comparing the efficacy of upadacitinib with bDMARDs and tsDMARDs at 12 and 24 weeks, and results were reported separately for bDMARD-naive and bDMARD-experienced patients. Efficacy outcomes were limited to the PsARC response rate, PASI 50, PASI 70, and PASI 90 response rate, change in HAQ-DI, and ACR20, ARC50, and ACR70 response rates. Based on the sponsor-submitted ITC, upadacitinib did not show a consistent or distinct difference in efficacy in either bDMARD-naive or -experienced patients, as measured by ACR response, PASI, PsARC, or HAQ-DI when compared to bDMARDs or tsDMARDs. Although the NMA suggests upadacitinib is more efficacious over certain comparators in some end points, a consistent effect across all comparators or with specific classes of DMARDs (e.g., TNF inhibitors) was not observed. In particular, upadacitinib was not consistently favoured over comparators that are clinically relevant to this review, namely TNF inhibitors, IL inhibitors, and JAK inhibitors, across both time points. Furthermore, not all comparators were included in every analysis, and some results were specific to a particular dosing regimen. A comparison with the tsDMARD most relevant to this review (i.e., tofacitinib) was largely absent, particularly in the bDMARD-experienced population. It is therefore difficult to draw a universal conclusion regarding the relative efficacy of upadacitinib versus bDMARDs, tsDMARDs, or specific classes of DMARDs. Compared to the biologic-naive population, the relative efficacy of upadacitinib to active comparators in the biologic-experienced population is less certain due to the fact that fewer agents were included in the analyses. Most importantly, conclusions regarding the long-term efficacy of upadacitinib compared to the active comparators relevant to this review cannot be drawn as the NMA used study results collected over an inappropriately short period time for a chronic disease such as PsA. There is also uncertainty due to the inherent heterogeneity across trials in the networks. Because the robustness of the comparative efficacy was further compromised by the lack of precision in the findings, results from the sponsor-submitted ITC must be interpreted with caution. Moreover, no information was obtained regarding the comparative safety to other biologic or tsDMARDs. Finally, no conclusion could be drawn with respect to the HRQoL outcomes.
Harms
Overall, AEs reported in SELECT-PsA1 and PsA2 were consistent with the known AE profile of each drug included in the studies. During the double-blind period up to week 24, the frequencies of SAEs and WDAEs were low across all treatment groups and generally below 5%, with the exception of the upadacitinib 15 mg treatment group in SELECT-PsA2, which had the highest proportion of patients experiencing an SAE (5.7%) or WDAE (7.1%) across both studies. None of the specific SAEs were reported by more than 2 patients.
The proportion of patients in SELECT-PsA1 who experienced a TEAE with upadacitinib treatment (66.9%) was comparable to patients treated with adalimumab (64.8%), but higher than those who received placebo (59.6%). In SELECT-PsA2, the proportion of patients who experienced a TEAE was similar between the upadacitinib (64.0%) and placebo (65.6%) groups. The majority of AEs were mild or moderate in severity. In both studies, the most common infections reported as an AE were upper respiratory tract infections and nasopharyngitis. In SELECT-PsA1, the most common non-infectious AEs, particularly in the active treatment groups, were increases in blood CPK levels and elevated alanine aminotransferase. Across the 2 studies, a higher proportion of patients in PsA1 experienced upper respiratory tract infections, as well as elevated blood CPK counts and alanine aminotransferase and aspartate aminotransferase levels, and a higher proportion of patients in PsA2 experienced psoriatic arthropathy, which refers to the worsening of the underlying PsA disease. The patient group input identified a reduction in infection rates as an important consideration for treatment selection. Although patients treated with upadacitinib 15 mg still experienced various infections as AEs, the reported incidences were similar to those in the adalimumab and placebo groups.
Overall, the proportions of patients experiencing notable harms such as serious infections and malignancy during the double-blind period were low. No explicit imbalances between the 2 studies were seen, with the exception of a numerically higher proportion of elevated CPK levels and hepatic disorder reported in SELECT-PsA1. Both notable AEs were reported in a higher proportion of patients treated with upadacitinib and adalimumab compared to placebo; hepatic disorder was reported most frequently in the adalimumab group, in which an elevated CPK level was reported most often in the upadacitinib 15 mg group. Hepatic disorder may be confounded by the greater use of concomitant methotrexate treatment in PsA1 patients. During the double-blind period, 2 treatment-emergent deaths occurred in the relevant treatment groups (i.e., excluding upadacitinib 30 mg treatment). Both were reported in the placebo groups. One non-treatment-emergent death (i.e., occurring beyond 30 days after the last dose) was reported in the upadacitinib 15 mg treatment group of SELECT-PsA1.
The safety profile of oral upadacitinib 15 mg once daily for PsA over 56 weeks was consistent with that observed during the 24-week double-blind period in both SELECT-PsA1 and PsA2, with no unexpected safety signals reported. Similar types and patterns of AEs were observed, although, with longer exposure to treatment, some infections occurred more often in patients treated with upadacitinib compared to adalimumab. Of the notable AEs, herpes zoster was reported in a higher proportion of patients treated with upadacitinib across both studies compared to those treated with adalimumab. Across the 2 studies, an imbalance in elevated CPK levels and hepatic disorders were reported, and continued to occur more often, in SELECT-PsA1. Deaths in the active treatment groups were low; 5 deaths were reported in total (1 treated with adalimumab, 2 treated with upadacitinib, and 2 in the placebo group).
Although a MACE has been identified as an important AE of interest, particularly with recent findings of increased risk with tofacitinib, the incidence of such AEs was low in the SELECT-PsA1 and PsA2 studies, and they occurred at a rate similar to that of the adalimumab treatment group. Consistent results were seen between week 24 and 56, although, given the chronic nature of this disease, further data are required to confirm these results. Thus, it is unknown whether the recent identification of MACEs is a class effect of JAK inhibitors across different disease states at this time, and longer-term follow-up data are required to better characterize the overall safety profile of upadacitinib in patients with PsA.
A main limitation of the ITC submitted by the sponsor was the lack of comparisons regarding safety. As a result, conclusions regarding the relative safety of upadacitinib to comparators included in the sponsor’s ITC cannot be made.
Conclusions
Psoriatic arthritis is a complex disease due to the numerous domains of disease activity that need to be addressed with treatment. Based on the double-blind portion of both phase III randomized controlled trials (RCTs) (SELECT-PsA1 and SELECT-PsA2), treatment with oral upadacitinib 15 mg once daily is associated with statistically significant and clinically meaningful improvement compared to placebo in the clinical response of PsA symptoms, as measured by the primary efficacy outcome of an ACR20 response at week 12. In bDMARD-naive patients (SELECT-PsA1), upadacitinib 15 mg orally once daily was no worse than (i.e., noninferior to) adalimumab 40 mg administered subcutaneously every other week in achievement of an ACR20 at week 12. The efficacy of upadacitinib compared to adalimumab in bDMARD-experienced patients is unknown.
Additionally, an overall consistent effect of upadacitinib 15 mg compared to placebo was demonstrated for numerous clinically relevant manifestations of PsA, including function and disability, PsA symptoms (pain and fatigue), HRQoL or patient-reported health outcomes, skin disease or psoriasis, musculoskeletal symptoms (enthesitis, dactylitis, and spinal symptoms), and other measures of clinical response or disease control such as MDA. Improvement in these measures of treatment response with upadacitinib 15 mg compared to placebo was demonstrated across both studies in patients with inadequate response or intolerance to non-bDMARDs (SELECT-PsA1) and bDMARDs (SELECT-PsA2). Efficacy of upadacitinib in radiographic changes was only studied in bDMARD-naive patients, and the clinical meaningfulness of the small improvement seen versus placebo over this short duration is uncertain. Furthermore, an estimated MID for many of the measures used to assess continuous end points was not identified for patients with PsA, making the clinical significance of the numerical improvements seen in some end points, notably the patient’s assessment of pain NRS, uncertain.
Findings from the end of period 1 of SELECT-PsA1 and SELECT-PsA2 suggest that the improvements in outcomes observed at week 24 in the upadacitinib 15 mg treatment group were maintained throughout the 56-week extension.
By week 24, the proportion of patients who experienced a TEAE with upadacitinib in SELECT-PsA1 was comparable to the proportion treated with adalimumab but higher relative to the placebo group. In SELECT-PsA2, the proportion of patients who experienced a TEAE was similar between the upadacitinib and placebo groups. Upper respiratory tract infection was most commonly reported in both studies. The safety profile of upadacitinib 15 mg once daily over 56 weeks was consistent with that observed during the 24-week double-blind period, with no unexpected safety signals reported. However, long-term data from the ongoing extension phase of both SELECT-PsA1 (up to 5 years) and SELECT-PsA2 (up to 3 years) will help better characterize the efficacy and safety of upadacitinib in the treatment of this chronic condition.
No direct comparative evidence for upadacitinib 15 mg versus bDMARDs or tsDMARDs other than adalimumab was identified. A sponsor-submitted ITC comparing upadacitinib 15 mg to bDMARDs or tsDMARDs suggested that in both bDMARD-naive and DMARD-experienced patients, upadacitinib does not show either a consistent or distinct difference in efficacy as measured by ACR20, PASI, PsARC, or HAQ-DI when compared to bDMARDs or tsDMARDs. The value of the ITC results is uncertain due to the inherent heterogeneity across trials in the networks. Moreover, no information was obtained regarding safety compared to other bDMARDs or tsDMARDs. In addition, no conclusion could be drawn on the HRQoL outcomes.
References
1.Gladman D, Ritchlin C. Clinical manifestations and diagnosis of psoriatic arthritis. In: Post, TW, ed. UpToDate. Waltham (MA): UpToDate; 2020: www.uptodate.com. Accessed 2021 May 13.
2.Ritchlin CT, Colbert RA, Gladman DD. Psoriatic Arthritis. N Engl J Med. 2017;376(10):957-970. PubMed
3.Van den Bosch F, Coates L. Clinical management of psoriatic arthritis. Lancet. 2018;391(10136):2285-2294. PubMed
4.Eder L, Widdifield J, Rosen CF, et al. Trends in the Prevalence and Incidence of Psoriasis and Psoriatic Arthritis in Ontario, Canada: A Population-Based Study. Arthritis Care Res (Hoboken). 2019;71(8):1084-1091. PubMed
5.Gossec L, Baraliakos X, Kerschbaumer A, et al. EULAR recommendations for the management of psoriatic arthritis with pharmacological therapies: 2019 update. Ann Rheum Dis. 2020;79(6):700-712. PubMed
6.Coates LC, Kavanaugh A, Mease PJ, et al. Group for Research and Assessment of Psoriasis and Psoriatic Arthritis 2015 Treatment Recommendations for Psoriatic Arthritis. Arthritis Rheumatol. 2016;68(5):1060-1071. PubMed
7.Singh JA, Guyatt G, Ogdie A, et al. Special Article: 2018 American College of Rheumatology/National Psoriasis Foundation Guideline for the Treatment of Psoriatic Arthritis. Arthritis Rheumatol. 2019;71(1):5-32. PubMed
8.Rinvoq (upadacitinib): 15 mg extended-release oral tablet [product monograph]. St-Laurent (QC): AbbVie Corporation; 2021 June 2.
9.Clinical Study Report: SELECT-PsA 1. A phase 3, randomized, double-blind, study comparing upadacitinib (abt-494) to placebo and to adalimumab in subjects with active psoriatic arthritis who have a history of inadequate response to at least one non-biologic disease modifying anti-rheumatic drug [internal sponsor's report]. North Chicago (IL): AbbVie; 2020 Apr 14.
10.Clinical Study Report: SELECT-PsA 2. A phase 3, randomized, double-blind study comparing upadacitinib (abt-494) to placebo in subjects with active psoriatic arthritis who have a history of inadequate response to at least one biologic disease-modifying anti-rheumatic drug (bdmard) [internal sponsor's report]. North Chicago (IL): AbbVie; 2020 June 16.
11.Week 56 Clinical Study Report: SELECT-PsA 2. A phase 3, randomized, double-blind study comparing upadacitinib (abt-494) to placebo in subjects with active psoriatic arthritis who have a history of inadequate response to at least one biologic disease-modifying anti-rheumatic drug (bdmard) [internal sponsor's report]. North Chicago (IL): AbbVie; 2020 October 19.
12.Eder L, Haddad A, Rosen CF, et al. The Incidence and Risk Factors for Psoriatic Arthritis in Patients With Psoriasis: A Prospective Cohort Study. Arthritis Rheumatol. 2016;68(4):915-923. PubMed
13.PrXELJANZ®tofacitinib, tablets, oral [product monograph]. Kirkland (QC): Pfizer Canada ULC; 2019 Oct 24.
14.Rohekar S, Chan J, Tse SML, et al. 2014 Update of the Canadian Rheumatology Association/Spondyloarthritis Research Consortium of Canada Treatment Recommendations for the Management of Spondyloarthritis. Part II: Specific Management Recommendations. The Journal of Rheumatology. 2015;42(4):665-681. PubMed
15.Initial safety trial results find increased risk of serious heart-related problems and cancer with arthritis and ulcerative colitis medicine Xeljanz, Xeljanz XR (tofacitinib) [press release] Rockville (MD): U.S. Food and Drug Administration; 2021 Feb 4: https://www.fda.gov/media/145590/download. Accessed 2021 Mar 15.
16.Product information: Upadacitinib (European public assessment report) Brussels (BE): European Commission: https://ec.europa.eu/health/documents/community-register/html/h1404.htm. Accessed 2021 Apr 7.
17.Upadacitinib for Rheumatoid Arthritis (Reimbursement Review) Ottawa (ON): CADTH; 2020 Mar 31: https://cadth.ca/upadacitinib. Accessed 2021 Apr 7.
18.PrTALTZ® ixekizumab Solution for Injection 80 mg / 1.0 mL [product monograph]. Toronto (ON): Eli Lilly Canada Inc.; 2021 Mar 29.
19.PrCOSENTYX®secukinumab. Solution for injection, Powder for solution for injection 150 mg/mL [product monograph]. Dorval (QC): Novartis Pharmaceuticals Canada Inc.; 2021 Jan 20.
20.PrSTELARA® (ustekinumab injection). Solution for subcutaneous injection 45 mg/0.5 mL, 90 mg/1.0 mL; and PrSTELARA® I.V. (ustekinumab for injection) Solution for intravenous infusion 130 mg/26 mL (5 mg/mL) [product monographs]. Toronto (ON): Janssen Inc.; 2020 Oct 14.
21.PrHUMIRA® adalimumab 40 mg in 0.8 mL sterile solution (50 mg/mL) subcutaneous injection, 10 mg in 0.1 mL sterile solution (100 mg/mL) subcutaneous injection, 20 mg in 0.2 mL sterile solution (100 mg/mL) subcutaneous injection, 40 mg in 0.4 mL sterile solution (100 mg/mL) subcutaneous injection, 80 mg in 0.8 mL sterile solution (100 mg/mL) subcutaneous injection [product monograph]. St-Laurent (QC): AbbVie Corporation; 2019 June 25.
22.PrEnbrel (etanercept). Solution in a prefilled syringe, 50 mg/mL and lyophilized powder in a vial for reconstitution, 25 mg/vial [product monograph]. . Mississauga (ON): Amgen Canada Inc.; 2018 Oct 29.
23.PrCIMZIA (certolizumab pegol injection). Solution for injection 200 mg/mL [product monograph]. Oakville (ON): UCB Canada Inc.; 2019 Nov 13.
24.PrINFLECTRA (infliximab for injection). Powder for solution, sterile, lyophilized, 100 mg/vial, intravenous infusion [product monograph]. Kirkland (QC): Pfizer Canada ULC; 2020 Mar 11.
25.PrSIMPONI (golimumab injection). Solution for subcutaneous injection 50 mg/0.5 mL, 100 mg/1.0 mL [product monograph]; and PrSIMPONI (I.V. golimumab for injection). Solution for intravenous infusion 50 mg/4.0 mL [product monograph]. Toronto (ON): Janssen Inc.; 2019 Jun 20.
26.Drug Reimbursement Review sponsor submission: Rinvoq (upadacitinib), 15 mg extended release tablets, oral [internal sponsor's package]. Pointe-Claire (QC): Abbvie Corporation; 2021 Jan.
27.Retuerto-Guerrero M, Trujillo E, Valero C, et al. Efficacy and safety of switching jakinibs in rheumatoid arthritis. Ann Rheum Dis. 2020;79(Suppl 1, FRI0132):648-649.
28.McGowan J, Sampson M, Salzwedel DM, Cogo E, Foerster V, Lefebvre C. PRESS Peer Review of Electronic Search Strategies: 2015 guideline statement. J Clin Epidemiol. 2016;75:40-46. PubMed
29.Grey matters: a practical tool for searching health-related grey literature. Ottawa (ON): CADTH; 2019: https://www.cadth.ca/grey-matters. Accessed 2021 Feb 1.
30.McInnes IB, Anderson JK, Magrey M, et al. Trial of Upadacitinib and Adalimumab for Psoriatic Arthritis. N Engl J Med. 2021;384(13):1227-1239. PubMed
31.Mease PJ, Lertratanakul A, Anderson JK, et al. Upadacitinib for psoriatic arthritis refractory to biologics: SELECT-PsA 2. Ann Rheum Dis. 2020. PubMed
32.Mease PJ, Lertratanakul A, Papp KA, et al. Upadacitinib in Patients with Psoriatic Arthritis and Inadequate Response to Biologics: 56-Week Data from the Randomized Controlled Phase 3 SELECT-PsA 2 Study. Rheumatology and Therapy. 2021. PubMed
33.Week 56 Clinical Study Report: SELECT-PsA 1. A phase 3, randomized, double-blind, study comparing upadacitinib (abt-494) to placebo and to adalimumab in subjects with active psoriatic arthritis who have a history of inadequate response to at least one non-biologic disease modifying anti-rheumatic drug [internal sponsor's report]. North Chicago (IL): AbbVie; 2020 Nov 19.
34.AbbVie Corporation response to the DRR request for additional information regarding the Rinvoq for psoriatic arthritis review [internal additional sponsor's information]. Pointe-Claire (QC): AbbVie Corporation; 2021 Mar 18.
35.AbbVie Corporation response to the DRR request for additional information regarding the Rinvoq for psoriatic arthritis review [internal additional sponsor's information]. Pointe-Claire (QC): Abbie Corporation; 2021 March 24.
36.Mease P, Woolley J, Bitman B, et al. Minimally important difference of health assessment questionnaire in psoriatic arthritis: Relating thresholds of improvement in functional ability to patient-rated importance and satisfaction. The Journal of Rheumatology. 2011;38(11):2461-2465. PubMed
37.Kwok T, Pope JE. Minimally important difference for patient-reported outcomes in psoriatic arthritis: Health Assessment Questionnaire and pain, fatigue, and global visual analog scales. J Rheumatol. 2010;37(5):1024-1028. PubMed
38.Mease P, Strand V, Gladman D. Functional impairment measurement in psoriatic arthritis: Importance and challenges. Semin Arthritis Rheum. 2018;48(3):436-448. PubMed
39.Tillett W, Lin CY, Zbrozek A, Sprabery AT, Birt J. A Threshold of Meaning for Work Disability Improvement in Psoriatic Arthritis Measured by the Work Productivity and Activity Impairment Questionnaire. Rheumatology & Therapy. 2019;6(3):379-391. PubMed
40.Hays RD, Morales LS. The RAND-36 measure of health-related quality of life. Ann Med. 2001;33(5):350-357. PubMed
41.Samsa GP, Edelman D, Rothman M, Williams G, Lipscomb J, Matchar D. Determining Clinically Important Differences in Health Status Measures: A General Approach With Illustration to the Health Utilities Index Mark II. Pharmacoeconomics. 1999;15:141-155. PubMed
42.Strand V, Khanna D, Singh J, et al. Improved health-related quality of life and physical function in patients with refractory chronic gout following treatment with pegloticase: Evidence from phase III randomized controlled trials. The Journal of Rheumatology. 2012;39(7):1450-1457. PubMed
43.Leung YY, Zhu T, Tam L-S, Kun E, Li E. Minimal Important Difference and Responsiveness to Change of the SF-36 in Patients with Psoriatic Arthritis Receiving Tumor Necrosis Factor-alpha Blockers. The Journal of rheumatology. 2011;38:2077-2079. PubMed
44.McClure NS, Sayah FA, Xie F, Luo N, Johnson JA. Instrument-Defined Estimates of the Minimally Important Difference for EQ-5D-5L Index Scores. Value Health. 2017;20(4):644-650. PubMed
45.Carlin CS, Feldman SR, Krueger JG, Menter A, Krueger GG. A 50% reduction in the Psoriasis Area and Severity Index (PASI 50) is a clinically significant endpoint in the assessment of psoriasis. J Am Acad Dermatol. 2004;50(6):859-866. PubMed
46.Reilly MC, Gooch KL, Wong RL, Kupper H, van der Heijde D. Validity, reliability and responsiveness of the Work Productivity and Activity Impairment Questionnaire in ankylosing spondylitis. Rheumatology (Oxford). 2010;49(4):812-819. PubMed
47.Network meta-analysis (NMA) of treatments for moderately to severely active psoriatic arthritis (Global Expanded NMAs) [internal sponsor's report]. In: Drug Reimbursement Review sponsor submission: Rinvoq (upadacitinib), 15 mg extended release tablets, oral Pointe-Claire (QC): Abbvie Corporation; 2020 Sep.
48.Single technology appraisal: User guide for company evidence submission template. London (UK): National Institute for Health and Care Excellence (NICE) 2015: https://www.nice.org.uk/process/pmg24/resources/single-technology-appraisal-user-guide-for-company-evidence-submission-template-pdf-72286715419333. Accessed 2021 May 14.
49.Dias S, Sutton AJ, Welton NJ, Ades AE. Evidence synthesis for decision making 3: heterogeneity--subgroups, meta-regression, bias, and bias-adjustment. Med Decis Making. 2013;33(5):618-640. PubMed
50.Dias S, Welton NJ, Sutton AJ, Ades AE. NICE Decision Support Unit Technical Support Documents. NICE DSU Technical Support Document 2: A Generalised Linear Modelling Framework for Pairwise and Network Meta-Analysis of Randomised Controlled Trials. London: National Institute for Health and Care Excellence (NICE); 2014.
51.Gladman DD, Farewell V, Buskila D, et al. Reliability of measurements of active and damaged joints in psoriatic arthritis. J Rheumatol. 1990;17(1):62-64. PubMed
52.Gladman D, Cook R, Schentag C, et al. The clinical assessment of patients with psoriatic arthritis (PsA): Results of a validation study of the Spondyloarthritis Research Consortium of Canada. J Rheumatol. 2004;31(6):1126-1131. PubMed
53.Fransen J, Antoni C, Mease PJ, et al. Performance of response criteria for assessing peripheral arthritis in patients with psoriatic arthritis: analysis of data from randomised controlled trials of two tumour necrosis factor inhibitors. Ann Rheum Dis. 2006;65(10):1373-1378. PubMed
54.Leung YY, Orbai AM, de Wit M, et al. Comparing the patient reported physical function outcome measures in a real-life international cohort of patients with psoriatic arthritis. Arthritis Care Res (Hoboken). 2020;21:21. PubMed
55.Højgaard P, Klokker L, Orbai AM, et al. A systematic review of measurement properties of patient reported outcome measures in psoriatic arthritis: A GRAPPA-OMERACT initiative. Semin Arthritis Rheum. 2018;47(5):654-665. PubMed
56.Cella D, Wilson H, Shalhoub H, et al. Content validity and psychometric evaluation of Functional Assessment of Chronic Illness Therapy-Fatigue in patients with psoriatic arthritis. Journal of Patientreported Outcomes. 2019;3(1):30. PubMed
57.Tillett W, Jadon D, Shaddick G, et al. Feasibility, reliability, and sensitivity to change of four radiographic scoring methods in patients with psoriatic arthritis. Arthritis Care Res (Hoboken). 2014;66(2):311-317. PubMed
58.Coates LC, Strand V, Wilson H, et al. Measurement properties of the minimal disease activity criteria for psoriatic arthritis. RMD Open. 2019;5(2):e001002. PubMed
59.Healy PJ, Helliwell PS. Measuring clinical enthesitis in psoriatic arthritis: Assessment of existing measures and development of an instrument specific to psoriatic arthritis. Arthritis Care Res (Hoboken). 2008;59(5):686-691. PubMed
60.Fink C, Alt C, Uhlmann L, Klose C, Enk A, Haenssle HA. Intra- and interobserver variability of image-based PASI assessments in 120 patients suffering from plaque-type psoriasis. J Eur Acad Dermatol Venereol. 2018;32(8):1314-1319. PubMed
61.Fink C, Alt C, Uhlmann L, Klose C, Enk A, Haenssle HA. Precision and reproducibility of automated computer-guided Psoriasis Area and Severity Index measurements in comparison with trained physicians. Br J Dermatol. 2019;180(2):390-396. PubMed
62.van Gestel AM, Haagsma CJ, van Riel PL. Validation of rheumatoid arthritis improvement criteria that include simplified joint counts. Arthritis Rheum. 1998;41(10):1845-1850. PubMed
63.Gladman D, Mease P, Healy P, et al. Outcome measures in psoriatic arthritis. The Journal of rheumatology. 2007;34:1159-1166. PubMed
64.Fries JF, Spitz P, Kraines RG, Holman HR. Measurement of patient outcome in arthritis. Arthritis Rheum. 1980;23(2):137-145. PubMed
65.Bruce B, Fries J. The Health Assessment Questionnaire (HAQ). Clin Exp Rheumatol. 2005;23:S14-18. PubMed
66.Anderson J, Caplan L, Yazdany J, et al. Rheumatoid arthritis disease activity measures: American College of Rheumatology recommendations for use in clinical practice. Arthritis Care Res (Hoboken). 2012;64(5):640-647. PubMed
67.Bruce B, Fries JF. The Stanford Health Assessment Questionnaire: dimensions and practical applications. Health Qual Life Outcomes. 2003;1:20. PubMed
68.Bruce B, Fries JF. The Stanford Health Assessment Questionnaire: a review of its history, issues, progress, and documentation. J Rheumatol. 2003;30(1):167-178. PubMed
69.Blackmore MG, Gladman DD, Husted J, Long JA, Farewell VT. Measuring health status in psoriatic arthritis: the Health Assessment Questionnaire and its modification. J Rheumatol. 1995;22(5):886-893. PubMed
70.Husted JA, Gladman DD, Long JA, Farewell VT. A modified version of the Health Assessment Questionnaire (HAQ) for psoriatic arthritis. Clin Exp Rheumatol. 1995;13(4):439-443. PubMed
71.Ware JE, Jr., Sherbourne CD. The MOS 36-item short-form health survey (SF-36). I. Conceptual framework and item selection. Med Care. 1992;30(6):473-483. PubMed
72.Mease PJ, Menter MA. Quality-of-life issues in psoriasis and psoriatic arthritis: outcome measures and therapies from a dermatological perspective. J Am Acad Dermatol. 2006;54(4):685-704. PubMed
73.Leung YY, Ho K, Zhu T, Tam L-S, Kun E, Li E. Testing scaling assumptions, reliability and validity of medical outcomes study short-form 36 health survey in psoriatic arthritis. Rheumatology (Oxford). 2010;49:1495-1501. PubMed
74.Husted J, Gladman D, Cook R, Farewell V. Responsiveness of health status instruments to changes in articular status and perceived health in patients with psoriatic arthritis. The Journal of rheumatology. 1998;25 11:2146-2155. PubMed
75.Leung YY, Holland R, Mathew AJ, et al. Clinical trial discrimination of physical function instruments for psoriatic arthritis: A systematic review. Semin Arthritis Rheum. 2020;50(5):1158-1181. PubMed
76.Cella D, Yount S, Sorensen M, Chartash E, Sengupta N, Grober J. Validation of the Functional Assessment of Chronic Illness Therapy Fatigue Scale relative to other instrumentation in patients with rheumatoid arthritis. J Rheumatol. 2005;32(5):811-819. PubMed
77.Wong PCH, Leung Y-Y, Li EK, Tam L-S. Measuring disease activity in psoriatic arthritis. Int J Rheumatol. 2012;2012:839425-839425. PubMed
78.Salaffi F, Carotti M, Di Donato E, et al. Preliminary validation of the Simplified Psoriatic Arthritis Radiographic Score (SPARS). Skeletal Radiol. 2019;48(7):1033-1041. PubMed
79.Coates LC, Fransen J, Helliwell PS. Defining minimal disease activity in psoriatic arthritis: a proposed objective target for treatment. Ann Rheum Dis. 2010;69(1):48-53. PubMed
80.Coates LC, Helliwell PS. Validation of minimal disease activity criteria for psoriatic arthritis using interventional trial data. Arthritis Care Res (Hoboken). 2010;62(7):965-969. PubMed
81.Coates LC, Cook R, Lee K-A, Chandran V, Gladman DD. Frequency, predictors, and prognosis of sustained minimal disease activity in an observational psoriatic arthritis cohort. Arthritis Care Res (Hoboken). 2010;62(7):970-976. PubMed
82.Queiro R, Cañete JD, Montilla C, et al. Minimal disease activity and impact of disease in psoriatic arthritis: a Spanish cross-sectional multicenter study. Arthritis Res Ther. 2017;19(1):72. PubMed
83.Gossec L, de Wit M, Kiltz U, et al. A patient-derived and patient-reported outcome measure for assessing psoriatic arthritis: elaboration and preliminary validation of the Psoriatic Arthritis Impact of Disease (PsAID) questionnaire, a 13-country EULAR initiative. Ann Rheum Dis. 2014;73(6):1012-1019. PubMed
84.Rahman P, Zummer M, Bessette L, et al. Real-world validation of the minimal disease activity index in psoriatic arthritis: an analysis from a prospective, observational, biological treatment registry. BMJ Open. 2017;7(8):e016619. PubMed
85.Lubrano E, Spadaro A. Pharmacoeconomic burden in the treatment of psoriatic arthritis: from systematic reviews to real clinical practice studies. BMC Musculoskelet Disord. 2014;15:25. PubMed
86.Herdman M, Gudex C, Lloyd A, et al. Development and preliminary testing of the new five-level version of EQ-5D (EQ-5D-5L). Quality of life research: an international journal of quality of life aspects of treatment, care and rehabilitation. 2011;20(10):1727-1736. PubMed
87.Garrett S, Jenkinson T, Kennedy LG, Whitelock H, Gaisford P, Calin A. A new approach to defining disease status in ankylosing spondylitis: the Bath Ankylosing Spondylitis Disease Activity Index. J Rheumatol. 1994;21(12):2286-2291. PubMed
88.Calin A, Nakache JP, Gueguen A, Zeidler H, Mielants H, Dougados M. Defining disease activity in ankylosing spondylitis: is a combination of variables (Bath Ankylosing Spondylitis Disease Activity Index) an appropriate instrument? Rheumatology (Oxford). 1999;38(9):878-882. PubMed
89.Braun J, Davis J, Dougados M, et al. First update of the international ASAS consensus statement for the use of anti-TNF agents in patients with ankylosing spondylitis. Ann Rheum Dis. 2006;65(3):316-320. PubMed
90.Haywood KL, Garratt AM, Dawes PT. Patient-assessed health in ankylosing spondylitis: a structured review. Rheumatology. 2005;44(5):577-586. PubMed
91.Maravic M, Fermanian J. Psychometric properties of the bath ankylosing spondylitis disease activity index (BASDAI): comparison of the different versions available in English. Clin Exp Rheumatol. 2006;24(1):79-82. PubMed
92.Feldman SR, Krueger GG. Psoriasis assessment tools in clinical trials. Ann Rheum Dis. 2005;64 Suppl 2(Suppl 2):ii65-68; discussion ii69-73.
93.Choi J, Koo JY. Quality of life issues in psoriasis. J Am Acad Dermatol. 2003;49(2 Suppl):S57-61. PubMed
94.Feldman SR, Menter A, Koo JY. Improved health-related quality of life following a randomized controlled trial of alefacept treatment in patients with chronic plaque psoriasis. Br J Dermatol. 2004;150(2):317-326. PubMed
95.Ashcroft DM, Wan Po AL, Williams HC, Griffiths CE. Clinical measures of disease severity and outcome in psoriasis: a critical appraisal of their quality. Br J Dermatol. 1999;141(2):185-191. PubMed
96.Gourraud PA, Le Gall C, Puzenat E, Aubin F, Ortonne JP, Paul CF. Why statistics matter: limited inter-rater agreement prevents using the psoriasis area and severity index as a unique determinant of therapeutic decision in psoriasis. J Invest Dermatol. 2012;132(9):2171-2175. PubMed
97.Jacobson CC, Kimball AB. Rethinking the Psoriasis Area and Severity Index: the impact of area should be increased. Br J Dermatol. 2004;151(2):381-387. PubMed
98.Bozek A, Reich A. The reliability of three psoriasis assessment tools: Psoriasis area and severity index, body surface area and physician global assessment. Advances in Clinical & Experimental Medicine. 2017;26(5):851-856. PubMed
99.Clegg DO, Reda DJ, Weisman MH, et al. Comparison of sulfasalazine and placebo in the treatment of ankylosing spondylitis. A Department of Veterans Affairs Cooperative Study. Arthritis Rheum. 1996;39(12):2004-2012. PubMed
100.Mease PJ, Antoni CE, Gladman DD, Taylor WJ. Psoriatic arthritis assessment tools in clinical trials. Ann Rheum Dis. 2005;64 Suppl 2(Suppl 2):ii49-ii54.
Appendix 1: Literature Search Strategy
Clinical Literature Search
Overview
Interface: Ovid
Databases:
MEDLINE All (1946-present)
Embase (1974-present)
Note: Subject headings and search fields have been customized for each database. Duplicates between databases were removed in Ovid.
Date of search: February 1, 2021
Alerts: Weekly search updates until project completion
Study types: None applied.
Limits:
Publication date limit: none used
Humans
Language limit: none used
Conference abstracts: excluded
Syntax | Description |
|---|---|
/ | At the end of a phrase, searches the phrase as a subject heading |
MeSH | Medical Subject Heading |
.fs | Floating subheading |
exp | Explode a subject heading |
* | Before a word, indicates that the marked subject heading is a primary topic; or, after a word, a truncation symbol (wildcard) to retrieve plurals or varying endings |
# | Truncation symbol for 1 character |
? | Truncation symbol for 1 or no characters only |
adj# | Requires terms to be adjacent to each other within # number of words (in any order) |
.ti | Title |
.ot | Original title |
.ab | Abstract |
.hw | Heading word; usually includes subject headings and controlled vocabulary |
.kf | Author keyword heading word (MEDLINE) |
.kw | Author keyword (Embase); |
.dq | Candidate term word (Embase) |
.pt | Publication type |
.mp | Mapped term |
.rn | Registry number |
.nm | Name of substance word (MEDLINE) |
.yr | Publication year |
.jw | Journal title word (MEDLINE) |
.jx | Journal title word (Embase) |
freq = # | Requires terms to occur # number of times in the specified fields |
medall | Ovid database code: MEDLINE All, 1946 to present, updated daily |
oemezd | Ovid database code; Embase, 1974 to present, updated daily |
cctr | Ovid database code; Cochrane Central Register of Controlled Trials |
Multi-Database Strategy
Database(s): Embase1974 to 2021 January 29, Ovid MEDLINE(R) ALL 1946 to January 29, 2021
Search strategy:
(rinvoq* or upadacitinib* or NEW4DV02U5 or 4RA0KN46E0 or 7KCW9IQM02 or 328W323FLH or ABT-494 or BT494).ti,ab,hw,kf,rn,nm,ot.
1 use medall
*upadacitinib/
(rinvoq* or upadacitinib or ABT-494 or ABT494).ti,ab,kw,dq.
3 or 4
conference abstract.pt.
conference review.pt.
6 or 7
5 not 8
9 use oemezd
2 or 10
remove duplicates from 11
Clinical Trials Registries
ClinicalTrials.gov
Produced by the US National Library of Medicine. Targeted search used to capture registered clinical trials.
[Search – upadacitinib/Rinvoq]
WHO ICTRP
International Clinical Trials Registry Platform, produced by the WHO. Targeted search used to capture registered clinical trials.
[Search terms -- upadacitinib/Rinvoq]
Health Canada’s Clinical Trials Database
Produced by Health Canada. Targeted search used to capture registered clinical trials.
[Search terms -- upadacitinib/Rinvoq]
EU Clinical Trials Register
European Union Clinical Trials Register, produced by the European Union. Targeted search used to capture registered clinical trials.
[Search terms -- upadacitinib/Rinvoq]
Grey Literature
Search dates: January 22, 2021
Keywords: [upadacitinib/Rinvoq; psoriatic arthritis]
Limits:
Updated: Publication years: None used
Regulatory sections of search updated 3 weeks before the CDEC meeting
Relevant websites from the following sections of the CADTH grey literature checklist Grey Matters: A Practical Tool For Searching Health-Related Grey Literature (https://www.cadth.ca/grey-matters) were searched:
Health Technology Assessment Agencies
Health Economics
Clinical Practice Guidelines
Drug and Device Regulatory Approvals
Advisories and Warnings
Drug Class Reviews
Clinical Trials Registries
Databases (free)
Health Statistics
Internet Search
Appendix 2: Excluded Studies
Note that this appendix has not been copy-edited.
Reference | Reason for exclusion |
|---|---|
VARMA, A., et al. Shared development of targeted therapies among autoimmune and inflammatory diseases: a systematic repurposing analysis. Current Dermatology Reports 2020 9(2):107-113. NAVARINI, L., et al. Experimental and Investigational Pharmacotherapy for Psoriatic Arthritis: Drugs of the Future. Journal of Experimental Pharmacology 2020 12(487-502). CHEN, M., et al. A novel treatment for psoriatic arthritis: Janus kinase inhibitors. Chinese Medical Journal 2020 133(8):959-967. CASO, F., et al. Targeted synthetic pharmacotherapy for psoriatic arthritis: state of the art. Expert Opinion on Pharmacotherapy 2020 21(7):785-796. VEALE, D. J., et al. The rationale for Janus kinase inhibitors for the treatment of spondyloarthritis. Rheumatology 2019 58(2):197-205. SILVAGNI, E., et al. Biologic and synthetic target DMARDs in psoriatic arthritis. Pharmacological Research 2019 149 (104473). ANONYMOUS. Drugs for psoriatic arthritis. Medical Letter on Drugs and Therapeutics 2019 61(1588):203-210. TORGUTALP, M., et al. Emerging treatment options for spondyloarthritis. Best Practice and Research in Clinical Rheumatology 2018 32(3):472-484. BAKER, K. F., et al. Novel therapies for immune-mediated inflammatory diseases: What can we learn from their use in rheumatoid arthritis, spondyloarthritis, systemic lupus erythematosus, psoriasis, Crohn disease and ulcerative colitis? Annals of the Rheumatic Diseases 2018 77(2):175-187. | Review article |
PETITDEMANGE, A., et al. Shared development of targeted therapies among autoimmune and inflammatory diseases: a systematic repurposing analysis. Therapeutic Advances in Musculoskeletal Disease 2020;12 (1759720X20969261). | Systematic review (repurposing analysis) |
Appendix 3: Detailed Outcome Data
Note that this appendix has not been copy-edited.
Efficacy outcomes for end points that are discussed in the report but not included in the multiplicity-adjusted testing hierarchy are presented in this section. As none of the end points were controlled for type 1 error, P values are not presented in the data tables.
Table 48: Proportion of Patients Achieving Modified PsARC Response at Week 24
Treatment group | Total N | Responder n (%) | Response rate (95% CI)a | Response-rate difference vs. control | |
|---|---|---|---|---|---|
Point estimate (95% CI)b | P valuec | ||||
PsARC at week 24 (NRI, FAS) | |||||
SELECT-PsA1 | |||||
Placebo | 423 | 251 (59.3) | 59.3 (54.7 to 64.0) | 24.3 (18.5 to 30.2) UPA vs. placebo | NAd |
ADA 40 mg e.o.w. | 429 | 329 (76.7) | 76.7 (72.7 to 80.7) | 7.0 (1.7 to 12.3) UPA vs. ADA | |
UPA 15 mg q.d. | 429 | 359 (83.7) | 83.7 (80.2 to 87.2) | Reference | |
SELECT-PsA2 | |||||
Placebo | 212 | 77 (36.3) | 36.3 (29.8 to 42.8) | 31.9 (22.9 to 40.9) | NAd |
UPA 15 mg q.d. | 211 | 144 (68.2) | 68.2 (62.0 to 74.5) | ||
ADA = adalimumab; CI = confidence interval; e.o.w. = every other week; FAS = full analysis set; NA = not applicable; NRI = Nonresponder Imputation; PsARC = Psoriatic Arthritis Response Criteria; q.d. = every day; UPA = upadacitinib; vs. = versus .
a95% CI for response rates is calculated based on normal approximation to the binomial distribution.
b95% CI for response-rate difference are calculated based on normal approximation.
cP value was constructed using Cochran-Mantel-Haenszel test adjusting for the main stratification factor of current DMARD use (yes/no).
dP value is not presented as the end point was not part of the multiplicity-adjusted testing hierarchy and therefore not controlled for type 1 error rate.
Source: SELECT-PsA1 Clinical Study Report9 and SELECT-PsA2 Clinical Study Report.10
Table 49: Change From Baseline in WPAI at Week 24
Treatment group | Total N | Baseline mean | Visit mean | Change from baseline | ||
|---|---|---|---|---|---|---|
Within group | Between-group comparison | |||||
LS mean (95% CI) | LS mean difference (95% CI) | P value | ||||
Overall work impairment at week 24 (MMRM,a FAS) | ||||||
SELECT-PsA1 | ||||||
Placebo | 192 | 49.56 | 37.50 | −8.25 (−11.76 to −4.75) | −14.98 (−19.56 to −10.40) UPA vs. placebo | NAb |
ADA 40 mg e.o.w. | 190 | 42.59 | 23.06 | −20.33 (−23.80 to −16.87) | −2.90 (−7.50 to 1.70) UPA vs. ADA | |
UPA 15 mg q.d. | 206 | 47.03 | 22.40 | −23.23 (−26.63 to −19.83) | Reference | |
SELECT-PsA2 | ||||||
Placebo | 68 | 46.91 | 46.03 | 0.26 (−5.51 to 6.03) | −10.88 (−18.46 to −3.29) | NAb |
UPA 15 mg q.d. | 93 | 45.00 | 33.58 | −10.62 (−15.55 to −5.69) | ||
Activity impairment at week 24 (MMRM,a FAS) | ||||||
SELECT-PsA1 | ||||||
Placebo | 368 | 48.8 | 36.8 | −11.2 (−13.6 to −8.8) | −13.1 (−16.3 to −10.0) UPA vs. placebo | NAb |
ADA 40 mg e.o.w. | 387 | 48.5 | 27.5 | −20.4 (−22.7 to −18.0) | −3.9 (−7.1 to −0.8) UPA vs. ADA | |
UPA 15 mg q.d. | 387 | 51.5 | 25.1 | −24.3 (−26.6 to −22.0) | Reference | |
SELECT-PsA2 | ||||||
Placebo | 167 | 54.0 | 49.9 | −2.3 (−5.9 to 1.3) | −16.2 (−21.2 to −11.3) | NAb |
UPA 15 mg q.d. | 183 | 50.4 | 31.9 | −18.5 (−21.9 to −15.1) | ||
Absenteeism at week 24 (MMRM,a FAS) | ||||||
SELECT-PsA1 | ||||||
Placebo | 192 | 14.40 | 11.83 | −0.16 (−2.95 to 2.63) | −5.06 (−8.73 to −1.39) UPA vs. placebo | NAb |
ADA 40 mg e.o.w. | 190 | 11.15 | 5.93 | −5.46 (−8.23 to −2.69) | 0.24 (−3.44 to 3.92) UPA vs. ADA | |
UPA 15 mg q.d. | 206 | 10.37 | 6.30 | −5.22 (−7.92 to −2.52) | Reference | |
SELECT-PsA2 | ||||||
Placebo | 68 | 13.14 | 11.25 | −0.73 (−5.42 to 3.95) | 2.09 (−4.07 to 8.25) | NAb |
UPA 15 mg q.d. | 93 | 13.40 | 13.52 | 1.36 (−2.64 to 5.36) | ||
Presenteeism at week 24 (MMRM,a FAS) | ||||||
SELECT-PsA1 | ||||||
Placebo | 181 | 42.5 | 31.1 | −8.9 (−11.8 to −6.1) | −13.4 (−17.1 to −9.7) UPA vs. placebo | NAb |
ADA 40 mg e.o.w. | 180 | 36.6 | 18.2 | −19.9 (−22.7 to −17.1) | −2.5 (−6.2 to 1.2) UPA vs. ADA | |
UPA 15 mg q.d. | 197 | 42.1 | 17.7 | −22.4 (−25.1 to −19.6) | Reference | |
SELECT-PsA2 | ||||||
Placebo | 66 | 40.6 | 38.9 | −1.1 (−6.0 to 3.9) | −12.2 (−18.8 to −5.6) | NAb |
UPA 15 mg q.d. | 85 | 37.6 | 24.9 | −13.2 (−17.6 to −8.9) | ||
ADA = adalimumab; CI = confidence interval; e.o.w. = every other week; FAS = full analysis set; LS = least square; MMRM = mixed model for repeated measures; NA = not applicable; q.d. = every day; UPA = upadacitinib; WPAI = Work Productivity and Activity Impairment; vs. = versus .
aWithin-group LS mean and 95% CI, and between-group LS mean difference and 95% CI and P value are based on an MMRM analysis with unstructured variance-covariance matrix, including treatment, visit, treatment-by-visit interaction, and the stratification factor of current DMARD use (yes/no) as fixed factors and the continuous fixed covariate of baseline measurement.
bP value is not presented as the end point was not part of the multiplicity-adjusted testing hierarchy and therefore not controlled for type 1 error rate.
Source: SELECT-PsA1 Clinical Study Report9 and SELECT-PsA2 Clinical Study Report.10
Table 50: Change From Baseline in EQ-5D-5L at Week 24
Treatment group | Total N | Baseline mean | Visit mean | Change from baseline | ||
|---|---|---|---|---|---|---|
Within group | Between-group comparison | |||||
LS mean (95% CI) | LS mean difference (95% CI) | P value | ||||
EQ-5D-5L utility index at week 24 (MMRM,a FAS) | ||||||
SELECT-PsA1 | ||||||
Placebo | 369 | 0.62 | 0.71 | 0.10 (0.08 to 0.12) | 0.09 (0.06 to 0.11) UPA vs. placebo | NAb |
ADA 40 mg e.o.w. | 387 | 0.62 | 0.77 | 0.16 (0.14 to 0.18) | 0.03 (0.00 to 0.05) UPA vs. ADA | |
UPA 15 mg q.d. | 387 | 0.60 | 0.79 | 0.18 (0.17 to 0.20) | Reference | |
SELECT-PsA2 | ||||||
Placebo | 167 | 0.59 | 0.64 | 0.03 (0.01 to 0.06) | 0.10 (0.06 to 0.14) | NAb |
UPA 15 mg q.d. | 183 | 0.62 | 0.75 | 0.13 (0.10 to 0.16) | ||
EQ-5D-5L VAS score at week 24 (MMRM,a FAS) | ||||||
SELECT-PsA1 | ||||||
Placebo | 369 | 54.7 | 60.6 | 6.3 (4.1 to 8.4) | 10.9 (8.0 to 13.7) UPA vs. placebo | NAb |
ADA 40 mg e.o.w. | 387 | 54.1 | 68.5 | 14.3 (12.2 to 16.4) | 2.8 (0.0 to 5.6) UPA vs. ADA | |
UPA 15 mg q.d. | 387 | 53.4 | 71.1 | 17.1 (15.0 to 19.2) | Reference | |
SELECT-PsA2 | ||||||
Placebo | 167 | 55.0 | 58.0 | 2.3 (−0.8 to 5.4) | 6.8 (2.5 to 11.1) | NAb |
UPA 15 mg q.d. | 183 | 55.2 | 64.3 | 9.0 (6.1 to 12.0) | ||
ADA = adalimumab; CI = confidence interval; e.o.w. = every other week; EQ-5D-5L = EuroQol 5-Dimensions 5-Levels; FAS = full analysis set; LS = least square; MMRM = mixed model for repeated measures; NA = not applicable; q.d. = every day; UPA = upadacitinib; VAS = visual analogue scale; vs. = versus .
aWithin-group LS mean and 95% CI, and between-group LS mean difference and 95% CI and P value are based on MMRM analysis with unstructured variance-covariance matrix, including treatment, visit, treatment-by-visit interaction, and the stratification factor current DMARD use (yes/no) as fixed factors and the continuous fixed covariate of baseline measurement.
bP value is not presented as the end point was not part of the multiplicity-adjusted testing hierarchy and therefore not controlled for type 1 error rate.
Source: SELECT-PsA1 Clinical Study Report9 and SELECT-PsA2 Clinical Study Report.10
Table 51: Proportion of Patients Achieving PASI 75, PASI 90, or PASI 100 at Week 24
Treatment group | Total N | Responder n (%) | Response rate (95% CI)a | Response-rate difference vs. control | |
|---|---|---|---|---|---|
Point estimate (95% CI)b | P valuec | ||||
PASI 75 at week 24 (NRI, FAS) | |||||
SELECT-PsA1 | |||||
Placebo | 211 | 56 (26.5) | 26.5 (20.6 to 32.5) | 37.5 (28.7 to 46.2) UPA vs. placebo | NAd |
ADA 40 mg e.o.w. | 211 | 124 (58.8) | 58.8 (52.1 to 65.4) | 5.3 (−4.0 to 14.5) UPA vs. ADA | |
UPA 15 mg q.d. | 214 | 137 (64.0) | 64.0 (57.6 to 70.4) | Reference | |
SELECT-PsA2 | |||||
Placebo | 131 | 25 (19.1) | 19.1 (12.4 to 25.8) | 34.8 (23.9 to 45.7) | NAd |
UPA 15 mg q.d. | 130 | 70 (53.8) | 53.8 (45.3 to 62.4) | ||
PASI 90 at week 24 (NRI, FAS) | |||||
SELECT-PsA1 | |||||
Placebo | 211 | 35 (16.6) | 16.6 (11.6 to 21.6) | 25.0 (16.7 to 33.3) UPA vs. placebo | NAd |
ADA 40 mg e.o.w. | 211 | 95 (45.0) | 45.0 (38.3 to 51.7) | −3.4 (−12.9 to 6.0) UPA vs. ADA | |
UPA 15 mg q.d. | 214 | 89 (41.6) | 41.6 (35.0 to 48.2) | Reference | |
SELECT-PsA2 | |||||
Placebo | 131 | 19 (6.9) | 6.9 (2.5 to 11.2) | 29.3 (20.0 to 38.6) | NAd |
UPA 15 mg q.d. | 130 | 47 (36.2) | 36.2 (27.9 to 44.4) | ||
PASI 100 at week 24 (NRI, FAS) | |||||
SELECT-PsA1 | |||||
Placebo | 211 | 21 (10.0) | 10.0 (5.9 to 14.0) | 16.7 (9.5 to 23.9) UPA vs. placebo | NAd |
ADA 40 mg e.o.w. | 211 | 58 (27.5) | 27.5 (21.5 to 33.5) | −0.9 (−9.3 to 7.6) UPA vs. ADA | |
UPA 15 mg q.d. | 214 | 57 (26.6) | 26.6 (20.7 to 32.6) | Reference | |
SELECT-PsA2 | |||||
Placebo | 131 | 6 (4.6) | 4.6 (1.0 to 8.2) | 17.7 (9.7 to 25.7) | NAd |
UPA 15 mg q.d. | 130 | 29 (22.3) | 22.3 (15.2 to 29.5) | ||
ADA = adalimumab; CI = confidence interval; e.o.w. = every other week; FAS = full analysis set; NA = not applicable; NRI = nonresponder imputation; PASI 75 = 75% reduction in Psoriasis Area Severity Index score; PASI 90 = 90% reduction in Psoriasis Area Severity Index score; PASI 100 = 100% reduction in Psoriasis Area Severity Index score; q.d. = every day; UPA = upadacitinib; vs. = versus .
a95% CI for response rates are calculated based on normal approximation to the binomial distribution.
b95% CI for response-rate difference are calculated based on normal approximation.
cP value was constructed using Cochran-Mantel-Haenszel test adjusting for the main stratification factor of current DMARD use (yes/no).
dP value is not presented as the end point was not part of the multiplicity-adjusted testing hierarchy and therefore not controlled for type 1 error rate.
Note: Analysis of PASI 75/90/100 was performed only in patients with ≥ 3% BSA psoriasis at baseline.
Source: SELECT-PsA1 Clinical Study Report9 and SELECT-PsA2 Clinical Study Report.10
Table 52: Change From Baseline in BASDAI at Week 24
Treatment group | Total N | Baseline mean | Visit mean | Change from baseline | ||
|---|---|---|---|---|---|---|
Within group | Between-group comparison | |||||
LS mean (95% CI) | LS mean difference (95% CI) | P value | ||||
BASDAI at week 24 (MMRM,a FAS) | ||||||
SELECT-PsA1 | ||||||
Placebo | 115 | 5.89 | 4.13 | −1.70 (−2.11 to −1.29) | −1.42 (−1.94 to −0.90) UPA vs. placebo | NAb |
ADA 40 mg e.o.w. | 114 | 5.73 | 3.18 | −2.55 (−2.96 to −2.13) | −0.57 (−1.09 to −0.05) UPA vs. ADA | |
UPA 15 mg q.d. | 125 | 6.04 | 2.75 | −3.12 (−3.51 to −2.72) | Reference | |
SELECT-PsA2 | ||||||
Placebo | 59 | 6.48 | 6.08 | −0.21 (−0.71 to 0.29) | −1.85 (−2.55 to −1.15) | NAb |
UPA 15 mg q.d. | 61 | 5.70 | 3.70 | −2.06 (−2.54 to −1.57) | ||
ADA = adalimumab; BASDAI = Bath Ankylosing Spondylitis Disease Activity Index; CI = confidence interval; e.o.w. = every other week; FAS = full analysis set; LS = least square; MMRM = mixed model for repeated measures; q.d. = every day; UPA = upadacitinib; vs. = versus .
aWithin-group LS mean and 95% CI, and between-group LS mean difference and 95% CI and P value are based on MMRM analysis with unstructured variance-covariance matrix, including treatment, visit, treatment-by-visit interaction, and the stratification factor current DMARD use (yes/no) as fixed factors and the continuous fixed covariate of baseline measurement.
bP value is not presented as the end point was not part of the multiplicity-adjusted testing hierarchy and therefore not controlled for type 1 error rate.
Note: Analysis was performed only for patients with presence of psoriatic spondylitis at baseline, assessed by the investigator.
Source: SELECT-PsA1 Clinical Study Report9 and SELECT-PsA2 Clinical Study Report.10
Table 53: Proportion of Patients Achieving Modified PsARC Response at Week 56
Treatment group | Total N | Responder n (%) | Response rate (95% CI)a | Response-rate difference vs. control | |
|---|---|---|---|---|---|
Point estimate (95% CI)b | P valuec | ||||
PsARC at week 56 (AO, FAS) | |||||
SELECT-PsA1 | |||||
PBO to UPA 15 mg q.d. | 177 | 164 (92.7) | (88.8 to 96.5) | 3.4 (−1.0 to 7.7) UPA vs. ADA | 0.1256 |
ADA 40 mg e.o.w. | 357 | 315 (88.2) | (84.9 to 91.6) | ||
UPA 15 mg q.d. | 369 | 338 (91.6) | (88.8 to 94.4) | ||
SELECT-PsA2 | |||||
PBO to UPA 15 mg q.d. | 69 | 57 (82.6) | (73.7 to 91.6) | NA | NA |
UPA 15 mg q.d. | 164 | 137 (83.5) | (77.9 to 89.2) | ||
ADA = adalimumab; AO = as observed; CI = confidence interval; e.o.w. = every other week; FAS = full analysis set; PsARC = Psoriatic Arthritis Response Criteria; PBO = placebo; NR = not reported; q.d. = daily; UPA = upadacitinib; vs. = versus .
a95% CI for response rates are calculated based on normal approximation to the binomial distribution.
b95% CI for response-rate difference are calculated based on normal approximation.
cP value is constructed using Cochran-Mantel-Haenszel test adjusting for the main stratification factor of current DMARD use (yes/no). However, no adjustment was made for multiple comparisons.
Source: SELECT-PsA1 Week 56 Clinical Study Report33 and SELECT-PsA2 Week 56 Clinical Study Report.11
Table 54: Change From Baseline in WPAI at Week 56
Treatment group | Total N | Baseline mean | Visit mean | Change from baseline | ||
|---|---|---|---|---|---|---|
Within group | Between-group comparison | |||||
LS mean (95% CI) | LS mean difference (95% CI)a | P valuea | ||||
Overall work impairment at week 56 (MMRM,b FAS) | ||||||
SELECT-PsA1 | ||||||
PBO to UPA 15 mg q.d. | 88 | 49.95 | 23.56 | −21.92 (−27.11 to −16.73) | −3.71 (−8.67 to 1.25) UPA vs. ADA | 0.1427 |
ADA 40 mg e.o.w. | 180 | 41.18 | 22.14 | −20.81 (−24.48 to −17.13) | ||
UPA 15 mg q.d. | 187 | 47.48 | 20.94 | −24.51 (−28.14 to −20.88) | ||
SELECT-PsA2 | ||||||
PBO to UPA 15 mg q.d. | 26 | 43.53 | 38.00 | −3.58 (−13.75 to 6.60) | NR | NR |
UPA 15 mg q.d. | 86 | 46.64 | 29.25 | −15.64 (−21.43 to −9.85) | ||
Activity impairment at week 56 (MMRM,b FAS) | ||||||
SELECT-PsA1 | ||||||
PBO to UPA 15 mg q.d. | 178 | 48.5 | 21.3 | −26.7 (−29.9 to −23.4) | −5.1 (−8.2 to −1.9) UPA vs. ADA | 0.0015 |
ADA 40 mg e.o.w. | 363 | 47.9 | 24.0 | −23.2 (−25.5 to −20.9) | ||
UPA 15 mg q.d. | 368 | 50.6 | 20.4 | −28.2 (−30.5 to −25.9) | ||
SELECT-PsA2 | ||||||
PBO to UPA 15 mg q.d. | 67 | 53.6 | 34.0 | −18.0 (−23.5 to −12.4) | NR | NR |
UPA 15 mg q.d. | 183 | 50.4 | 29.1 | −21.1 (−24.7 to −17.5) | ||
Absenteeism at week 56 (MMRM,b FAS) | ||||||
SELECT-PsA1 | ||||||
PBO to UPA 15 mg q.d. | 88 | 15.59 | 8.66 | −2.84 (−6.94 to 1.25) | 1.98 (−1.95 to 5.90) UPA vs. ADA | 0.3236 |
ADA 40 mg e.o.w. | 180 | 10.13 | 6.18 | −4.92 (−7.82 to −2.03) | ||
UPA 15 mg q.d. | 187 | 10.46 | 8.23 | −2.95 (−5.80 to −0.09) | ||
SELECT-PsA2 | ||||||
PBO to UPA 15 mg q.d. | 26 | 8.81 | 9.00 | 0.25 (−8.61 to 9.11) | NR | NR |
UPA 15 mg q.d. | 86 | 14.65 | 10.97 | −0.94 (−5.88 to 4.01) | ||
Presenteeism at week 56 (MMRM,b FAS) | ||||||
SELECT-PsA1 | ||||||
PBO to UPA 15 mg q.d. | 84 | 43.2 | 18.1 | −22.0 (−26.1 to −18.0) | −4.7 (−8.6 to −0.8) UPA vs. ADA | 0.0190 |
ADA 40 mg e.o.w. | 172 | 36.0 | 17.3 | −20.8 (−23.7 to −17.9) | ||
UPA 15 mg q.d. | 179 | 42.7 | 14.9 | −25.5 (−28.4 to −22.7) | ||
SELECT-PsA2 | ||||||
PBO to UPA 15 mg q.d. | 26 | 39.6 | 30.8 | −7.1 (−14.9 to 0.7) | NR | NR |
UPA 15 mg q.d. | 81 | 39.8 | 21.4 | −17.7 (−22.3 to −13.1) | ||
ADA = adalimumab; CI = confidence interval; e.o.w. = every other week; FAS = full analysis set; LS = least square; MMRM = mixed model for repeated measures; PBO = placebo; NR = not reported; q.d. = daily; UPA = upadacitinib; WPAI = Work Productivity and Activity Impairment; vs. = versus .
aP values are presented where available; however, analyses were not adjusted for multiple comparisons.
aWithin-group LS mean and 95% CI are based on mixed model for repeated measures (MMRM) analysis with unstructured variance-covariance matrix, including treatment, visit, treatment-by-visit interaction, and the stratification factor current DMARD use (yes/no) as fixed factors and the continuous fixed covariate of baseline measurement.
Source: SELECT-PsA1 Week 56 Clinical Study Report33 and SELECT-PsA2 Week 56 Clinical Study Report.11
Table 55: Change From Baseline in EQ-5D-5L at Week 56
Treatment group | Total N | Baseline mean | Visit mean | Change from baseline | ||
|---|---|---|---|---|---|---|
Within group | Between-group comparison | |||||
LS mean (95% CI) | LS mean difference (95% CI) | P valuea | ||||
EQ-5D-5L utility index at week 56 (MMRM,b FAS) | ||||||
SELECT-PsA1 | ||||||
PBO to UPA 15 mg q.d. | 178 | 0.63 | 0.80 | 0.18 (0.16 to 0.21) | 0.02 (−0.00 to 0.04) UPA vs. ADA | 0.1091 |
ADA 40 mg e.o.w. | 362 | 0.62 | 0.80 | 0.18 (0.16 to 0.20) | ||
UPA 15 mg q.d. | 369 | 0.60 | 0.81 | 0.20 (0.18 to 0.22) | ||
SELECT-PsA2 | ||||||
PBO to UPA 15 mg q.d. | 67 | 0.58 | 0.77 | 0.16 (0.12 to 0.20) | NR | NR |
UPA 15 mg q.d. | 163 | 0.62 | 0.78 | 0.15 (0.12 to 0.17) | ||
EQ-5D-5L VAS score at week 56 (MMRM,b FAS) | ||||||
SELECT-PsA1 | ||||||
PBO to UPA 15 mg q.d. | 178 | 56.7 | 73.6 | 19.1 (16.2 to 21.9) | 3.5 (0.8 to 6.3) UPA vs. ADA | 0.0105 |
ADA 40 mg e.o.w. | 362 | 54.6 | 72.2 | 17.5 (15.5 to 19.5) | ||
UPA 15 mg q.d. | 369 | 53.8 | 75.6 | 21.0 (19.0 to 23.1) | ||
SELECT-PsA2 | ||||||
PBO to UPA 15 mg q.d. | 67 | 54.1 | 63.7 | 7.7 (2.6 to 12.7) | NR | NR |
UPA 15 mg q.d. | 163 | 54.4 | 66.2 | 10.6 (7.4 to 13.9) | ||
ADA = adalimumab; CI = confidence interval; e.o.w. = every other week; EQ-5D-5L = EuroQol 5-Dimensions 5-Levels; FAS = full analysis set; LS = least square; MMRM = mixed model for repeated measures; PBO = placebo; NR = not reported; q.d. = daily; UPA = upadacitinib; VAS = visual analogue scale; vs. = versus .
aP values are presented where available; however, analyses were not adjusted for multiple comparisons. Within-group LS mean and 95% CI, and between-group LS mean difference and 95% CI and nominal P value are based on MMRM analysis with unstructured variance-covariance matrix, including treatment, visit, treatment-by-visit interaction, and the stratification factor current DMARD use (yes/no) as fixed factors and the continuous fixed covariate of baseline measurement.
Source: SELECT-PsA1 Week 56 Clinical Study Report33 and SELECT-PsA2 Week 56 Clinical Study Report.11
Table 56: Change From Baseline in BASDAI at Week 56
Treatment group | Total N | Baseline M=mean | Visit mean | Change from baseline | ||
|---|---|---|---|---|---|---|
Within group | Between-group comparison | |||||
LS mean (95% CI) | LS mean difference (95% CI) | P valuea | ||||
BASDAI at week 56 (MMRM,b FAS) | ||||||
SELECT-PsA1 | ||||||
PBO to UPA 15 mg q.d. | 63 | 5.82 | 2.69 | −3.06 (−3.57 to −2.55) | −0.44 (−0.95 to 0.07) UPA vs. ADA | 0.0937 |
ADA 40 mg e.o.w. | 107 | 5.65 | 2.81 | −2.84 (−3.23 to −2.44) | ||
UPA 15 mg q.d. | 116 | 5.91 | 2.41 | −3.27 (−3.66 to −2.89) | ||
SELECT-PsA2 | ||||||
PBO to UPA 15 mg q.d. | 24 | 3.18 | 2.02 | −1.13 (−1.49 to −0.77) | NR | NR |
UPA 15 mg q.d. | 52 | 3.24 | 1.71 | −1.32 (−1.56 to −1.07) | ||
ADA = adalimumab; BASDAI = Bath Ankylosing Spondylitis Disease Activity Index; CI = confidence interval; e.o.w. = every other week; FAS = full analysis set; LS = least square; MMRM = mixed model for repeated measures; NR = not reported; q.d. = daily; PBO = placebo; UPA = upadacitinib
aP values are presented where available; however, analyses were not adjusted for multiple comparisons.
bWithin-group LS mean and 95% CI, and between-group LS mean difference and 95% CI and nominal P value are based on MMRM analysis with unstructured variance-covariance matrix, including treatment, visit, treatment-by-visit interaction, and the stratification factor current DMARD use (yes/no) as fixed factors and the continuous fixed covariate of baseline measurement.
Note: Analysis was performed only for patients with presence of psoriatic spondylitis at baseline, assessed by the investigator.
Source: SELECT-PsA1 Week 56 Clinical Study Report33 and SELECT-PsA2 Week 56 Clinical Study Report.11
Table 57: Proportion of Patients Achieving PASI 90/100 at Week 56
Treatment group | Total N | Responder n (%) | Response rate (95% CI)a | Response-rate difference vs. control | |
|---|---|---|---|---|---|
Point estimate (95% CI)b | P valuec | ||||
PASI 90 at week 56 (AO, FAS) | |||||
SELECT-PsA1 | |||||
PBO to UPA 15 mg q.d. | 88 | 44 (50.0) | 50.0 (39.6 to 60.4) | 2.1 (−8.0 to 12.3) UPA vs. ADA | 0.6993 |
ADA 40 mg e.o.w. | 178 | 99 (55.6) | 55.6 (48.3 to 62.9) | ||
UPA 15 mg q.d. | 187 | 108 (57.8) | 57.8 (50.7 to 64.8) | ||
SELECT-PsA2 | |||||
PBO to UPA 15 mg q.d. | 44 | 21 (47.7) | 47.7 (33.0 to 62.5) | NR | NR |
UPA 15 mg q.d. | 104 | 54 (51.9) | 51.9 (42.3 to 61.5) | ||
PASI 100 at week 56 (AO, FAS) | |||||
SELECT-PsA1 | |||||
PBO to UPA 15 mg q.d. | 88 | 23 (26.1) | 26.1 (17.0 to 35.3) | 2.5 (−7.5 to 12.5) UPA vs. ADA | 0.6597 |
ADA 40 mg e.o.w. | 178 | 66 (37.1) | 37.1 (30.0 to 44.2) | ||
UPA 15 mg q.d. | 187 | 74 (39.6) | 39.6 (32.6 to 46.6) | ||
SELECT-PsA2 | |||||
PBO to UPA 15 mg q.d. | 44 | 9 (20.5) | 20.5 (8.5 to 32.4) | NR | NR |
UPA 15 mg q.d. | 104 | 36 (34.6) | 34.6 (25.5 to 43.8) | ||
ADA = adalimumab; AO = as observed; CI = confidence interval; e.o.w. = every other week; FAS = full analysis set; PASI = Psoriasis Area Severity Index; NR = not reported; PBO = placebo; q.d. = daily; UPA = upadacitinib; vs. = versus .
a95% CI for response rates are calculated based on normal approximation to the binomial distribution.
b95% CI for response-rate difference are calculated based on normal approximation.
cNominal P value is constructed using Cochran-Mantel-Haenszel test adjusting for the main stratification factor of current DMARD use (yes/no). However, no adjustment was made for multiple comparisons. Note: Patients randomized to Placebo to UPA 15 mg q.d. or Placebo to UPA 30 mg q.d. switched to UPA 15 mg q.d. or UPA 30 mg q.d. at week 24 and their data up to week 24 are under placebo exposure. Analysis of PASI 75 was performed only in patients with ≥ 3% BSA psoriasis at baseline.
Source: SELECT-PsA1 Week 56 Clinical Study Report33 and SELECT-PsA2 Week 56 Clinical Study Report.11
Table 58: Summary of Study Characteristics of All Studies Included in the Network Meta-Analysis
Trial name (reference) | Treatment name | Number of screened/ randomized patients | Study design | Trial Duration | Primary outcomes | Rescue therapy/details of crossover/treatment details post PBO controlled phase | Previous treatment(s) | Concomitant DMARD treatment during trial |
|---|---|---|---|---|---|---|---|---|
ACTIVE | APR 30 mg b.i.d. PBO | NR/219 | Phase III, RCT, DB, PC | 104 weeks/16 weeks | ACR20 at week 16 | Patients who did not improve by ≥ 10% in SJC and TJC at week 16 were eligible for early escape at the investigator’s discretion | csDMARDs/MTX | NSAIDs and corticosteroids |
ADEPT | PBO ADA 40 mg | 345/315 | Phase III RCT DB PC | 24 Week /12 and 24 Weeks | ACR20 at week 12 Change in modified total Sharp score of structural damage on radiographs of the hands and feet at week 24 | All patients who completed the 24-week protocol were eligible for long-term treatment in an open-label extension study | DMARDs ≥ 1 NSAIDs IR or intolerance MTX (≥ 3 months with dosage stable for ≥ 4 weeks) | MTX |
ASTRAEA | ABAT 125 mg PBO | 489/424 | Phase III, RCT PC | 104 Weeks/24 Weeks | Proportion of patients achieving an ACR20 response at week 24 | Patients who had not achieved ≥ 20% improvement in swollen and tender joint counts from baseline to week 16 were switched to open-label ABAT weekly (early escape) for 28 weeks (total study time for these patients, 44 weeks); at week 24, all remaining patients transitioned to the open-label period and received subcutaneous ABAT weekly for 28 weeks (total study time, 52 weeks); at the end of the open-label period, patients had the option of entering a 1-year, long-term extension | ≥ 1 non-biologic DMARDs, both TNFi-naive and TNFi-exposed patients were also enrolled | csDMARDs MTX |
CHOICE | SEC 300 mg SEC 150 mg PBO | NR/258 | Phase IV RCT PC, DB | 52 weeks/16 weeks | Proportion of patients achieving an ACR20 response at week 16 | After week 16, all patients randomized to PBO, and nonresponders from the SEC 150 mg group received SEC 300 mg up to week 52 | NR (patients were biologic-naive) | NR |
Deodhar 2018 | GUS 100 mg Q8W PBO | 251/149 | Phase II, RCT PC DB | 24 weeks/24 weeks | Proportion of patients achieving an ACR20 response at week 24 | All patients with less than 5% improvement in swollen and tender joint counts at week 16 were eligible for early escape to open-label ustekinumab at weeks 16, 20, 32, and 44, with dosing according to the approved local country prescribing information | csDMARDs NSAIDs Anti-TNF | MTX (43%) |
DISCOVER-1 | GUS 100 mg q.4.w. GUS 100 mg Q8W PBO | 624/382 | Phase III, RCT PC DB | 24/24 weeks | Proportion of patients achieving an ACR20 response at week 24 | At week 16, patients with < 5% improvement in tender plus swollen joints could initiate or increase the dose of permitted medications while continuing study treatment | csDMARDs Apremilast NSAIDs Anti-TNFi | csDMARDs |
DISCOVER-2 | GUS 100 mg q.4.w. GUS 100 mg q.8.w. PBO | 1153/739 | Phase III, RCT PC DB | 24/24 weeks | Proportion of patients achieving an ACR20 response at week 24 | At week 16, patients with < 5% improvement in tender plus swollen joints could initiate or increase the dose of permitted medications while continuing study treatment | csDMARDs Apremilast NSAIDs | csDMARDs |
EXCEED | SEC 300 mg ADA SC 40 mg q.2.w. | 1067/853 | Phase IIIb RCT DB AC | 52 weeks/52 weeks | Proportion of patients achieving an ACR20 response at week 52 | No crossover design | csDMARDs/MTX NSAIDs | Corticosteroids |
FUTURE 2 (NCT01752634) | SEC 300 mg SEC 150 mg SEC 75 mg PBO | 469/397 | Phase III, RCT PC DB | 104/24 weeks | Proportion of patients achieving an ACR20 response at week 24 | Patients originally randomized to PBO were randomized to SEC 300 or 150 mg every 4 weeks from week 16 (nonresponders) or 24 (responders) | ≥ 1 DMARDs ≤ 3 TNFi | MTX |
FUTURE 3 | SEC 300 mg SEC 150 mg PBO | 533/414 | Phase III, RCT DB PC | 52 weeks/24 weeks | Proportion of patients achieving an ACR20 response at week 24 | At week 16, patients were classified either as responders (≥ 20% improvement from baseline in both tender joint count and swollen joint count or nonresponders. PBO patients were re-randomized to receive secukinumab 300 or 150 mg SC. every 4 weeks | ≤ 3 TNFi ≥ 1 DMARDs NSAIDs | MTX (47.5%) |
FUTURE 4 | SEC 150 mg SC with loading dose SEC 150 mg SC without loading dose PBO | 408/341 | Phase III RCT DB PC | 104/16 weeks | Proportion of patients achieving an ACR20 response at week 16 | All PBO patients were reassigned to SEC 150 mg no-load at either week 16 (nonresponders) or week 24 (responders). Patients could have their dose escalated from 150 to 300 mg based on their physician’s decision starting at week 36 | csDMARDs NSAIDs IR or intolerance ≤ 3 TNFi | MTX (56.6%) |
FUTURE 5 | SEC 300 mg, 150 mg PBO | NR/996 | Phase III RCT DB PC | 52 weeks/16 weeks | Proportion of patients achieving an ACR20 response at week 16 | At week 16, patients in the placebo arm with < 20% improvement from baseline in tender and swollen joint counts were switched in a double-blind manner to receive SC SEC 300 mg or 150 mg, pre-assigned at original randomization | < 3 TNFi csDMARDs MTX | MTX (50.1%) |
Genovese 2007 | ADA 40 mg SC q.2.w. PBO | NR/100 | Phase III, DB RCT PC | 24 weeks/12 weeks | Proportion of patients achieving an ACR20 response at week 12 | After 12 weeks open-label ADA therapy for 12 weeks | ≥ 1 csDMARD IR | MTX (66%) |
GO-REVEAL Kavanaugh 2009 | GOL SC 50 mg, 100 mg PBO | 555/405 | Phase III, RCT, DB, PC | 24 weeks/week 14 | Proportion of patients achieving an ACR20 response at week 12 | After 16 weeks patients with < 10% improvement in both swollen and tender joint counts entered early escape with dose escalations | csDMARDs IR ± NSAIDs | MTX (49%) |
GO-VIBRANT | GOL IV 2mg/kg PBO | 817/480 | Phase III, DB RCT PC | 24 weeks/week 14 | Proportion of patients achieving an ACR20 response at week 14 | At week 16, patients in both treatment groups with < 5% improvement in swollen and tender joint counts entered early escape with dose escalations | csDMARDs IR ± NSAIDs | MTX |
IMPACT Antoni 2005 | INF 5 mg/kg at 0, 2, 6, 14 weeks PBO | NR/104 | Phase III, RCT DB, PC | 50 weeks (PBO up to 16 weeks)/16 weeks) | Proportion of patients achieving an ACR20 response at week 16 | After week 16, patients initially assigned to receive PBO crossed over to receive INF 5 mg/kg every 8 weeks through week 50, while patients initially randomized to INF continued to receive active treatment at the same dose through week 50 | NSAIDs csDMARDs | Patients were allowed to receive concomitant therapy with 1 of the following DMARDs:
|
IMPACT-2 Antoni 2005 | INF 5 mg/kg at 0, 2, 6, 14, 22 weeks PBO | NR/200 | Phase III, RCT DB, PC | 52 weeks (crossover at 24 weeks)/14 weeks) | Proportion of patients achieving an ACR20 response at week 14 | After 16 weeks patients originally randomized to placebo with < 10% improvement in both swollen and tender joint counts entered early escape and received infliximab at weeks 16, 18 and 22. To maintain the blinding, patients randomized to infliximab who had < 10% improvement received additional placebo infusions at weeks 16 and 18 | csDMARDs NSAIDs | MTX |
Mease 2000 | ETN 25 mg SC q.2.w. PBO | 71/60 | RCT DB PC | 12 Weeks/12 Weeks | Proportion of patients meeting PsARC at 12 weeks Proportion of patients achieving PASI75 response at 12 weeks | NR | ≥ 1 DMARDs NSAIDs | MTX (47%) |
Mease 2004 | ETN 25 mg q.2.w. PBO | 303/205 | RCT DB PC | 48 weeks (24 weeks PBO controlled)/12 weeks) | Proportion of patients achieving an ACR20 response | After the 24 weeks blinded phase was complete all patients were eligible to receive ETN in the 48 weeks extension | NSAIDs ≥ 1 DMARDs | MTX |
Mease 2011 | ABAT 3 mg/kg, 10 mg/kg PBO | NR/170 | Phase II, RCT, DB, PC | 6 months/ day 169 | Proportion of patients achieving an ACR20 response on day 169 | Patients across all treatment arms who completed the 6-month double-blind period were given the weight-tiered dose of 10 mg/kg, administered monthly starting on day 169, for the duration of the 18-month open-label period | ≥ 1 DMARD IR TNFi-IR | MTX (60%) |
Mease 2018 | ABT-122 120 mg QW ABT-122 240 mg QW ADA 40 mg e.o.w. PBO | NR/240 | Phase II, RCT PC DB | 12 weeks/12 weeks | Proportion of patients achieving an ACR20 response at week 12 | NR | MTX | NR |
OPAL BEYOND | TOFA 5mg, 10 mg b.i.d. PBO | 546/395 | Phase III, RCT PC, DB | 6 months (3 months placebo-controlled)/3 months) | Proportion of patients achieving an ACR20 response at end of 3 months Change in HAQ-DI scores 0-3 months | After 3 months patients in the placebo arms were advanced to TOFA 5 mg or 10 mg b.i.d. (determined by group at randomization) | ≥ 1 TNFi IR due to lack of efficacy or adverse event | csDMARDs (100%) |
OPAL Broaden (NCT01877668) | PBO TOFA 5 mg b.i.d. TOFA 10 mg b.i.d. ADA 40 mg q.2.w. | 611/422 | Phase III, RCT PC DB | 12 months/12 months | ACR20 response rates at Month 3 Mean change from baseline in HAQ-DI at Month 3 | Patients originally randomized to PBO switched to TOFA 5 mg b.i.d. or TOFA 10 mg b.i.d. at month 3 | ≥ 1 csDMARDs | csDMARDs |
PALACE 1 (NCT01172938) | PBO APR 20 mg b.i.d. APR 30 mg b.i.d. | 615/504 | Phase III, RCT PC DB | 5 years/16 weeks | Percentage of participants with ACR20 response at week 16 | After week 16 patients without ≥ 20% reduction in swollen and tender joint counts were required to be re-randomized equally to either APR dose if initially randomized to PBO or remained on their initial APR dose. At week 24, all remaining PBO patients were re-randomized to APR 20 mg b.i.d. or 30 mg b.i.d. | ≥ 1 DMARDs ≥ 1 Biologics failure | csDMARDs |
PALACE 2 (NCT01212757) | PBO APR 20 mg b.i.d. APR 30 mg b.i.d. | NR/484 | Phase III, RCT PC DB | 52 weeks (24 weeks PBO controlled)/16 weeks) | Percentage of participants with ACR20 response at week 16 | At week 16, pts with < 20% reduction in swollen and tender joint counts qualified for protocol-defined early escape; those on PBO were re-randomized to APR and those on APR remained on the initial dose. At week 24, all remaining PBO patients were re-randomized to APR through week 52 | ≥ 1 DMARDs ≥ 1 Biologics failure | csDMARDs |
PALACE 3 | APR 30 mg BD oral APR 20 mg BD oral PBO | 612/505 | Phase III, RCT PC | 52 weeks (24 weeks PBO controlled)/16 weeks) | Proportion of patients achieving an ACR20 response at week 16 | At week 16, pts with < 20% reduction in swollen and tender joint counts qualified for protocol-defined early escape; those on PBO were re-randomized to APR and those on APR remained on the initial dose; at week 24, all remaining PBO patients were re-randomized to APR through week 52 | ≥ 1 DMARD (both conventional and biologic)- IR (TNFi-IR ≤ 10%) | csDMARDs |
PSUMMIT 1 (NCT01009086) | PBO UST 45 mg UST 90 mg | NR/615 | Phase III, RCT PC | 108 weeks (24 weeks PBO controlled)/24 weeks) | Percentage of participants with ACR20 response at week 24 | At week 16, patients with < 5% improvement in both tender and swollen joint counts entered blinded early escape (PBO to 45 mg, 45 mg to 90 mg, and 90 mg to 90 mg); all remaining PBO patients crossed over to UST 45 mg at week 24 | NSAIDs ≥ 1 DMARDs | MTX |
PSUMMIT-2 Ritchlin (2014) | UST 45 mg, 90 mg PBO | 597/312 | Phase III, RCT, DB, PC | 52 weeks (16 weeks placebo-controlled)/24 weeks) | Proportion of patients achieving an ACR20 response at week 24 | At week 16, patients with < 5% improvement in tender and swollen joints entered blinded early escape; patients receiving placebo switched to UST 45 mg, those receiving UST 45 mg increased to 90mg and patients receiving UST 90mg continued with blinded 90 mg dosing; placebo patients who did not EE crossed over to receive UST 45 mg at week 24, week 28 and week 40 | csDMARD IR +/− bDMARDs IR | csDMARDs (50%) |
Rapid PSA Mease (2014) | CZP 200 mg q.2.w. or 400 mg q.4.w. PBO | NR/409 | Phase III, DB RCT PC | 216 weeks (24 weeks PBO controlled)/12 weeks) | Proportion of patients achieving an ACR20 response at week 12 Modified Total Sharp Score change from baseline at week 24 | Placebo patients who failed to achieve a 10% improvement from baseline in both swollen and tender joints at weeks 14 and 16 underwent mandatory escape to active treatment in a blinded manner. These patients were re-randomized to active treatment at week 16 in a 1:1 ratio (CZP 200 mg q.2.w.: CZP 400 mg q.4.w.) receiving loading doses at weeks 16, 18 and 20. All CZP patients continued to receive the initially assigned dose | Prior TNFi limited to ≤ 40% of patients (≤ 2 bDMARDs and ≤ 1 TNFi) ≥ 1 DMARD IR | csDMARDs (MTX) |
SELECT-PsA 1 | UPA 30 mg q.d. UPA 15 mg q.d. ADA 40 mg q.2.w. PBO | NR/1705 | Phase III, DB, RCT PC | 56 weeks (24 weeks PBO and ADA controlled)/12 weeks) | Proportion of patients achieving an ACR20 response at week 12 | At week 16, subjects classified as nonresponders (defined as not achieving at least 20% improvement in either or both tender joint count (TJC) and swollen joint count (SJC) at both week 12 and week 16) will add or modify background therapy for PsA | ≥ 1 csDMARD IR, intolerance, or contraindication | Up to 2 csDMARDs |
SELECT-PsA 2 | UPA 30 mg q.d. UPA 15 mg q.d. PBO | NR/642 | Phase III, DB, RCT PC | 56 weeks (24 weeks PBO and ADA controlled)/12 weeks) | Proportion of patients achieving an ACR20 response at week 12 | At week 16, subjects classified as nonresponders (defined as not achieving at least 20% improvement in either or both tender joint count (TJC) and swollen joint count (SJC) at both week 12 and week 16) will add or modify background therapy for PsA | ≥ 1 bDMARD IR or intolerance | Up to 2 csDMARDs |
SPIRIT H2H | IXE 160 mg then 80 mg q.2.w. and q.4.w. ADA 80 mg then 40 mg q.2.w. | NR/566 | Phase IV, RCT, OL | 52 week/24 weeks | Proportion of patients achieving a simultaneous ACR50 response and PASI 100 at week 24 | NR | csDMARDs | csDMARDs (68%) |
SPIRIT- P1 Mease 2017 | ADA 40 mg q.2.w. IXE 80mg q.2.w. following 160mg initial dose IXE 80mg q.4.w. following 160mg initial dose PBO | NR/417 | Phase III, DB RCT | 156 weeks/24 weeks | Proportion of patients achieving an ACR20 response at week 24 | Patients who were identified as Inadequate responders at week 16 were required to modify their concomitant medication by adjusting the dose of existing medication(s) and/or introduction of new medication(s). Modifications made at week 16 must have remained in place and unchanged throughout the remainder of the double-blind period of the study | NSAIDs ± DMARD IR | csDMARDs (64%) MTX (54.2%) |
SPIRIT P2 Nash 2017 | IXE 80 mg q.2.w. following 160 mg initial dose IXE 80mg q.4.w. following 160mg initial dose PBO | NR/363 | Phase III, DB RCT PC | 24 weeks/24 weeks | Proportion of patients achieving an ACR20 response at week 24 | Patients with an inadequate response at week 16 were required to add or modify concomitant drugs. Inadequate responders continued taking their originally assigned dose of IXI or, if receiving placebo, were re-randomized to IXI every 2 weeks or every 4 weeks in a 1:1 ratio | 1 to 2 TNFi IR or intolerance + ≥ 1 csDMARDs | csDMARDs (50%) |
ABA = abatacept; ADA = adalimumab; APR = apremilast; bDMARD = biologic disease-modifying antirheumatic drug; b.i.d. = twice a day; BIW = twice a week; csDMARD = conventional synthetic disease-modifying antirheumatic drug; CZP = certolizumab; ETN = etanercept; GOL = golimumab; GUS = guselkumab; INF = infliximab; IV = IV infusion; IXE = Ixekizumab; mg = milligram; NMA = network meta-analysis; PASI = Psoriasis Area and Severity Index; PsA = psoriatic arthritis; PsARC = Psoriatic Arthritis Response Criteria; PBO = placebo; q.2.w. = every 2 weeks; q.4.w. = every 4 weeks; q.8.w. = every 8 weeks; q.12.w. = every 12 weeks; q.d. = every day; SC = subcutaneous injection; SEC = secukinumab; TOF = tofacitinib; tsDMARD = targeted synthetic disease-modifying antirheumatic drug; UPA = upadacitinib; UST = ustekinumab.
Source: Sponsor-submitted indirect treatment comparison.47
Table 59: Patient Demographics and Baseline Characteristics of Studies
Trial name (reference) | Treatment name | ITT | Age mean (SD) | Female (%) | White (%) | Duration of PsA years, mean (SD) | Duration of psoriasis years, mean (SD) | Prior therapies | |||
|---|---|---|---|---|---|---|---|---|---|---|---|
DMARDs, n (%) | MTX, n (%) | Biologics, n (%) | Biologic failure, n (%) | ||||||||
ACTIVE | PBO | 109 | 48 (13.8) | 65 (59.6) | 105 (96.3) | 3.6 (5.5) | NR | 78 (71.6) | 66 (60.6) | 0 | 0 |
APR 30 mg b.i.d. | 110 | 50.7 (12.2) | 58 (52.7) | 109 (99.1) | 4 (4.5) | NR | 74 (67.3) | 61 (55.5) | 0 | 0 | |
ADEPT | PBO | 162 | 49.2 (11.1) | (45.1) | (93.8) | 9.2 (8.7) | 17.1 (12.6) | 1.5 (1.2) | (50) | NR | NR |
ADA 40 mg | 151 | 48.6 (12.5) | (43.7) | (97.4) | 9.8 (8.3) | 17.2 (12.0) | 1.5 (1.2) | (51) | NR | NR | |
ASTRAEA (NCT01860976) | ABAT 125 mg | 213 | 51.0 (10.7) | 121 (56.8) | 195 (91.5) | 8.3 (8.1) | NR | NR | NR | 129 (60.6) | NR |
PBO | 211 | 49.8 (11.3) | 112 (53.1) | 198 (93.8) | 8.8 (8.3) | NR | NR | NR | 130 (61.6) | NR | |
Deodhar 2018 NCT02319759 | GUS 100 mg | 100 | 47.4 (12.8) | 48 (48) | 100 (100) | 7 (7.2) | NR | 90 (90) | NR | 9 (9) | NR |
PBO | 49 | 44.2 (12.4) | 25 (51) | 49 (100) | 6.9 (7.2) | NR | 41 (84) | NR | 4 (8) | NR | |
DISCOVER-1 | GUS 100 mg q.4.w. | 128 | 47.4 (11.6) | 62 (48) | 121 (95) | 6.6 (6.3) | NR | NR | NR | 38 (30) | 17 (13) |
GUS 100 mg q.8.w. | 127 | 48.9 (11.5) | 59 (46) | 116 (91) | 6.4 (5.9) | NR | NR | NR | 41 (32) | 15 (12) | |
PBO | 126 | 49.0 (11.1) | 65 (52) | 112 (89) | 7.2 (7.6) | NR | NR | NR | 39 (31) | 12 (10) | |
DISCOVER-2 | GUS 100 mg q.4.w. | 245 | 45.9 (11.5) | 103 (42) | 242 (99) | 5.5 (5.9) | NR | NR | NR | NR | NR |
GUS 100 mg q.8.w. | 248 | 44.9 (11.9) | 119 (48) | 240 (97) | 5.1 (5.5) | NR | NR | NR | NR | NR | |
PBO | 246 | 46.3 (11.7) | 129 (52) | 242 (98) | 5.8 (5.6) | NR | NR | NR | NR | NR | |
FUTURE 2 (NCT01752634) | SEC 300 mg | 100 | 46.9 (12.6) | 49 (49.0) | 96 (96.0) | 7.4 (7.5) | NR | NR | NR | Prior TNFi: 0: 67 (67.0) 1: 16 (16.0) 2 or 3: 17 (17.0) | NR |
SEC 150 mg | 100 | 46.5 (11.7) | 45 (45.0) | 90 (90.0) | 6.5 (8.2) | NR | NR | NR | Prior TNFi: 0: 63 (63.0) 1: 26 (26.0) 2 or 3: 11 (11.0) | NR | |
SEC 75 mg PBO | 99 | 48.6 (11.4) | 52 (52.5) | 90 (90.9) | NR | NR | NR | NR | Prior TNFi: 0: 65 (65.7) 1: 21 (21.2) 2 or 3: 13 (13.1) | NR | |
PBO | 98 | 49.9 (12.5) | 59 (60.2) | 94 (95.9) | 7.3 (7.8) | NR | NR | NR | Prior TNFi: 0: 63 (64.3) 1: 16 (16.3) 2 or 3: 19 (19.4) | NR | |
FUTURE 3 | SEC 300 mg | 139 | 49.3 (12.9) | 72 (51.8) | 130 (93.5) | 8.3 (9.2) | NR | NR | 70 (50.4) | 44 (31.7) | NR |
SEC 150 mg | 138 | 50.1 (11.7) | 39 (55.8) | 129 (93.5) | 7.7 (8.5) | NR | NR | 59 (42.8) | 44 (31.8) | NR | |
PBO | 137 | 50.1 (12.6) | 41 (56.9) | 133 (97.1) | 6.6 (6.9) | NR | NR | 68 (49.6) | 44 (32.1) | NR | |
FUTURE 4 | SEC 150 mg load | 114 | 48.3 (12.2) | 67 (58.8) | NR | 5.6 (7.3) | NR | NR | 57 (50.0) | 27 (23.9) | NR |
SEC 150 mg non-load | 113 | 50.4 (11.8) | 62 (54.9) | NR | 5.7 (7.7) | NR | NR | 53 (46.9) | 27 (23.7) | NR | |
PBO | 114 | 48.5 (12.2) | 69 (60.5) | NR | 6.9 (7.6) | NR | NR | 60 (52.6) | 27 (23.9) | NR | |
FUTURE 5 | SEC 300 mg with loading dose | 222 | 48.9 (12.8) | 114 (51.4) | 184 (82.9) | 6.7 (8.3) | NR | NR | 112 (50.5) | 68 (30.7) | NR |
SEC 150 mg with loading dose | 220 | 48.4 (12.9) | 109 (49.5) | 178 (80.9) | 6.7 (7.1) | NR | NR | 108 (49.1) | 65 (29.5) | NR | |
SEC 150 mg without loading dose | 222 | 48.8 (11.8) | 102 (45.9) | 180 (81.1) | 6.2 (6.1) | NR | NR | 120 (54.1) | 64 (28.8) | NR | |
PBO | 332 | 49.0 (12.1) | 171 (51.5) | 274 (82.5) | 6.6 (7.6) | NR | NR | 159 (47.9) | 98 (29.5) | NR | |
Genovese 2007 | ADA 40 mg q.2.w. | 51 | 50.4 (11.0) | 22 (43.1) | 50 (98.0) | 7.5 (7.0) | 18.0 (13.2) | 51 (100) | 41 (80.4) | NA | NA |
PBO | 49 | 47.7 (11.3) | 24 (49) | 46 (93.9) | 7.2 (7.0) | 13.8 (10.7) | 49 (100) | 39 (79.6) | NA | NA | |
GO-REVEAL | GOL SC 50 mg q.4.w. | 146 | 45.7 (10.7) | 57 (39) | 141 (97) | 7.2 (6.8) | NR | NR | 71 (49) | NA | NA |
GOL SC 100 mg q.4.w. | 146 | 48.2 (10.9) | 60 (41) | 142 (97) | 7.7 (7.8) | NR | NR | 69 (47) | NA | NA | |
PBO | 113 | 47.0 (10.6) | 44 (39) | 110 (97) | 7.6 (7.9) | NR | NR | 54 (48) | NA | NA | |
GO-VIBRANT | GOL IV 2 mg/kg | 241 | 45.7 (11.3) | 113 (46.9) | NR | 6.2 (6.0) | NR | NR | NR | NR | NR |
PBO | 239 | 46.7 (12.5) | 118 (49.4) | NR | 5.3 (5.9) | NR | NR | NR | NR | NR | |
IMPACT | INF 5 mg/kg at 0, 2, 6 and 14 weeks | 52 | 45.7 (11.1) | 22 (42.3) | NR | 11.7 (9.8) | 16.9 (10.9) | 52 (100) | 24 (46.2) | NA | NA |
PBO | 52 | 45.2 (9.7) | 22 (42.3) | NR | 11.0 (6.6) | 19.4 (11.6) | 52 (100) | 34 (65.4) | NA | NA | |
IMPACT-2 | INF 5 mg/kg at 0, 2, 6, 14 and 22 weeks | 100 | 47.1 (12.8) | 49 (49) | NR | 8.4 (7.2) | 16.2 (11) | 100 (100) | NR (47) | NA | NA |
PBO | 100 | 46.5 (11.3) | 29 (29) | NR | 7.5 (7.8) | 16.8 (12) | 100 (100) | NR (45) | NA | NA | |
Mease 2000 | PBO | 30 | 43.5 (24.0–63.0) | 12 (40) | 25 (83) | 9.5 | 17.5 | 2.0 | NR | NR | NR |
ETN 25 mg q.2.w. | 30 | 46.0 (30.0–70.0) | 14 (47) | 27 (90) | 9.0 | 19.0 | 1.5 | NR | NR | NR | |
Mease 2004 | ETN 25 mg q.2.w. | 101 | 47.6 | 43 (43) | 91 (90) | 9.0 | 18.3 | NR | NR | NR | NR |
PBO | 104 | 47.3 | 57 (55) | 95 (91) | 9.2 | 19.7 | NR | NR | NR | NR | |
Mease 2011 | ABA 30/10 mg/kg | 43 | 51.5 (9.8) | 23 (54) | 43 (100) | 7.8 (7.7) | NR | 43 (100) | NR (72) | NR | NR |
ABA 10 mg/kg | 40 | 50.8 10.5) | 27 (35) | NR (95) | 10.6 (9.4) | NR | 40 (100) | 34 (85) | NR | NR | |
ABA 3 mg/kg | 45 | 50.3 (9.9) | 23 (51) | NR (98) | 7.2 (7.4) | NR | 45 (100) | NR (82) | NR | NR | |
PBO | 42 | 52.6 12.0) | 19 (45) | NR (98) | 7.4 (8.0) | NR | 42 (100) | 29 (69) | NR | NR | |
OPAL BEYOND | TOFA 5 mg b.i.d. | 131 | 49.5 (12.3) | 64 (49) | 121 (92) | 9.6 (7.6) | NR | 131 (100) | 98 (75) | 131 (100) | 131 (100) |
TOFA 10 mg b.i.d. | 132 | 51.3 (10.9) | 74 (56) | 124 (94) | 9.1 (6.8) | NR | 132 (100) | 91 (69) | 132 (100) | 132 (100) | |
PBO | 131 | 49.0 (12.6) | 80 (61) | 118 (90) | 9.4 (8.1) | NR | 131 (100) | 101 (77) | 131 (100) | 131 (100) | |
OPAL Broaden (NCT01877668) | PBO | 105 | 47.7 (12.3) | 56 (53) | 104 (99) | 6.4 (6.4) | NR | 3 (3) | NR | NR | NR |
TOFA 5 mg b.i.d. | 107 | 49.4 (12.6) | 57 (53.3) | 105 (98.1) | 7.3 (8.2) | NR | 3 (3) | NR | NR | NR | |
TOFA 10 mg b.i.d. | 104 | 46.9 (12.4) | 62 (59.6) | 97 (93.3) | 5.4 (5.8) | NR | 4 (4) | NR | NR | NR | |
ADA 40 mg q.2.w. | 106 | 47.4 (11.3) | 50 (47.2) | 103 (97.2) | 5.3 (5.3) | NR | 1 (1) | NR | NR | NR | |
PALACE 1 (NCT01172938) | PBO | 168 | 51.1 (12.1) | 80 (47.6) | 153 (91.1) | 7.3 (7.1) | 15.7 (13.0) | 120 (71.4) | NR | 41 (24.4) | 19 (11.3) |
APR 20 mg b.i.d. | 168 | 48.7 (11.0) | 83 (49.4) | 150 (89.3) | 7.2 (6.8) | 15.5 (11.9) | 129 (76.8) | NR | 37 (22.0) | 14 (8.3) | |
APR 30 mg b.i.d. | 168 | 51.4 (11.7) | 92 (54.8) | 152 (90.5) | 8.1 (8.1) | 16.5 (12.3) | 124 (73.8) | NR | 41 (24.4) | 14 (8.3) | |
PALACE 2 (NCT01212757) | PBO | 159 | 51.2 (10.9) | 85 (53.5) | NR | 7.76 (8.254) | 17.8 (13.9) | 135 (84.9) | 94 (59.1) | 23 (14.5) | 8 (5.0) |
APR 20 mg b.i.d. | 163 | 50.9 (11.8) | 95 (58.3) | NR | 7.83 (8.621) | 17.9 (14.1) | 135 (82.8) | 94 (57.7) | 28 (17.2) | 10 (6.1) | |
APR 30 mg b.i.d. | 162 | 50.5 (11.2) | 95 (58.6) | NR | 6.82 (7.592) | 18.7 (14.5) | 134 (82.7) | 91 (56.2) | 23 (14.2) | 7 (4.3) | |
PALACE 3 | PBO | 169 | 49.5 (11.6) | 91 (54) | 158 (94) | 6.8 (6.5) | 17.8 (13.3) | 121 (72) | 91 (54) | 48 (28) | 12 (7) |
APR 20 mg BD | 169 | 49.6 (12.1) | 90 (53) | 161 (95) | 7.7 (7.7) | 18.3 (14.4) | 118 (70) | 88 (52) | 50 (30) | 14 (8) | |
APR 30 mg BD | 167 | 49.9 (11.4) | 88 (53) | 163 (98) | 7.5 (7.6) | 17.1 (12.1) | 124 (74) | 83 (50) | 43 (26) | 14 (8) | |
PSUMMIT 1 | PBO | 206 | 47.4 (12.29) | 98 (47.6) | NR | 3.6 (95% CI, 1·0–9·7) | 13·1 | NR | 96 (46·6) | NR | NR |
UST 45 mg | 205 | 47.1 (12.64) | 99 (48.3%) | NR | 3.4 | 12·0 | NR | 99 (48·3) | NR | NR | |
UST 90 mg | 204 | 46.8 (11.75) | 88 (43.1%) | NR | 4·9 | 14·1 | NR | 101 (49·5) | NR | NR | |
PSUMMIT-2 | UST 45 mg q.12.w. | 103 | 49.0 [Range: 40.0-56.0] | 55 (53.4) | NR | 5.3 (95% CI 2.3-12.2) | 13.3 [5.0-24.4] | NR | 54 (52.4) | NR | NR |
UST 90 mg q.12.w. | 105 | 48.0 [Range: 41.0-57.0] | 56 (53.3) | NR | 4.5 [1.7-10.3] | 11.3 [4.5-21.4] | NR | 52 (49.5) | NR | NR | |
PBO | 104 | 48.0 [Range: 38.5-56.0] | 53 (51.0) | NR | 5.5 [2.3-12.2] | 11.4 [6.0-22.0] | NR | 49 (47.1) | NR | NR | |
RAPID PSA | PBO | 136 | 47.3 (11.1) | NR (58.1) | NR (97.1) | 7.9 (7.7) | NR | 136 (100) | NR (61.8) | NR (19.1) | NR |
CZP 200 mg q.2.w. | 138 | 48.2 (12.3) | NR (53.6) | NR (97.8) | 9.6 (8.5) | NR | 138 (100) | NR (63.8) | NR (22.5) | NR | |
CZP 400 mg q.4.w. | 135 | 47.1 (10.8) | NR (54.1) | NR (98.5) | 8.1 (8.3) | NR | 135 (100) | NR (65.2) | NR (17) | NR | |
SELECT-PsA1 | UPA 30 mg q.d. | 423 | 49.9 (12.41) | 236 (55.8) | 377 (89.1) | 5.9 (6.37) | NR | 422 (99.8) | NR | 0 (0) | 0 (0) |
UPA 15 mg q.d. | 429 | 51.6 (12.19) | 238 (55.5) | 386 (90.0) | 6.2 (7.41) | NR | 428 (99.8) | NR | 0 (0) | 0 (0) | |
ADA 40 mg e.o.w. | 429 | 51.4 (12.04) | 222 (51.7) | 375 (87.4) | 5.9 (7.06) | NR | 427 (99.5) | NR | 0 (0) | 0 (0) | |
PBO | 423 | 50.4 (12.21) | 211 (49.9) | 377 (89.1) | 6.2 (7.01) | NR | 423 (100) | NR | 0 (0) | 0 (0) | |
SELECT-PsA2 | UPA 30 mg q.d. | 218 | 53.0 (11.94) | 115 (52.8) | 196 (89.9) | 9.7 (8.71) | NR | 176 (80.7) | NR | 218 (100) | 201 (92.2) |
UPA 15 mg q.d. | 211 | 53.0 (12.02) | 113 (53.6) | 183 (86.7) | 9.6 (8.36) | NR | 170 (80.6) | NR | 211 (100) | 195 (92.4) | |
PBO | 212 | 54.1 (11.53) | 120 (56.6) | 186 (87.7) | 11.0 (10.33) | NR | 157 (74.1) | NR | 212 (100) | 194 (91.5) | |
SPIRIT H2H | IXE | 283 | 47.5 (12) | 121 (43) | NR | 6.6 (7.4) | NR | 193 (68) | NR | 0 | NR |
ADA | 283 | 48.3 (12.3) | 133 (47) | NR | 5.9 (6.4) | NR | 199 (70) | NR | 0 | NR | |
SPIRIT- P1 | ADA 40mg q.2.w. | 101 | 48.6 (12.4) | 50 (49.5) | 95 (94.1) | 6.9 (7.5) | 15.7 (12.7) | 20 (19.8) | 57 (56.4) | NA | NA |
IXE 160mg + 80mg q.2.w. | 103 | 49.8 (12.6) | 55 (53.4) | 96 (93.2) | 7.2 (8.0) | 17.0 (14.0) | 23 (22.3) | 53 (51.5) | NA | NA | |
IXE 160mg + 80mg q.4.w. | 107 | 49.1 (10.1) | 62 (57.9) | 102 (95.3) | 6.2 (6.4) | 16.5 (13.8) | 22 (20.6) | 57 (53.3) | NA | NA | |
PBO | 106 | 50.6 (12.3) | 58 (54.7) | 99 (93.4) | 6.3 (6.9) | 16.0 (13.8) | 24 (22.6) | 59 (55.7) | NA | NA | |
SPIRIT- P2 | PBO | 118 | 51.5 (10.4) | 62 (53) | 108 (92) | 9.2 (7.3) | 15.3 (12.6) | 52 (44) | 40 (34) | 118 (100) | 109 (93) |
IXE 160 mg + 80 mg q.4.w. | 122 | 52.6 (13.6) | 59 (48) | 111 (91) | 11.0 (9.6) | 15.7 (12.3) | 60 (49) | 48 (39) | 122 (100) | 112 (92) | |
IXE 160 mg + 80 mg q.2.w. | 123 | 51.7 (11.9) | 73 (59) | 113 (93) | 9.9 (7.4) | 16.5 (13.0) | 73 (59) | 61 (50) | 123 (100) | 111 (90) | |
ABA = abatacept; ADA = adalimumab; APR = apremilast; bDMARD = biologic disease-modifying antirheumatic drug; b.i.d. = twice a day; BIW = twice a week; csDMARD = conventional synthetic disease-modifying antirheumatic drug; CZP = certolizumab; ETN = etanercept; GOL = golimumab; GUS = guselkumab; INF = infliximab; IV = IV infusion; IXE = Ixekizumab; mg = milligram; PASI = Psoriasis Area and Severity Index; PsA = psoriatic arthritis; PsARC = Psoriatic Arthritis Response Criteria; PBO = placebo; q.2.w. = every 2 weeks; q.4.w. = every 4 weeks; q.8.w. = every 8 weeks; q.12.w. = every 12 weeks; q.d. = every day; SC = subcutaneous injection; SEC = secukinumab; TOF = tofacitinib; tsDMARD = targeted synthetic disease-modifying antirheumatic drug; UPA = upadacitinib; UST = ustekinumab.
Source: Sponsor-submitted indirect treatment comparison.47
Appendix 4: Description and Appraisal of Outcome Measures
Note that this appendix has not been copy-edited.
Aim
To describe the following outcome measures and review their measurement properties (validity, reliability, responsiveness to change, and MID):
American College of Rheumatology (ACR) 20/50/70
Health Assessment Questionnaire – Disability Index (HAQ-DI)
Short Form-36 (SF-36) Health Survey, including SF-36 Physical Component Summary (PCS)
Functional Assessment of Chronic Illness Therapy – Fatigue (FACIT-F)
Patient's Assessment of Pain Numerical Rating Scale (NRS)
Self-Assessment of Psoriasis Symptoms (SAPS)
static Investigator Global Assessment (sIGA) of Psoriasis
modified PsA Sharp/van der Heijde Score (SHS)
minimal disease activity (MDA)
Leeds Enthesitis Index (LEI)
Leeds Dactylitis Instrument (LDI)
European Quality of Life 5 Dimensions- 5 Levels (EQ-5D-5L)
Work Productivity and Activity Impairment (WPAI)
Bath Ankylosing Spondylitis Disease Activity Index (BASDAI)
Psoriasis Area Severity Index (PASI) 75/90/100
Psoriatic Arthritic Response Criteria (PsARC)
Findings
Table 60: Summary of Outcome Measures and Their Measurement Properties
Outcome measure | Type | Conclusions about measurement properties | Minimal important difference |
|---|---|---|---|
ACR20/50/70 | ACR20, ACR50, and ACR70 responses represent at least a 20%, 50%, and 70% improvement, respectively, in tender and swollen joint counts and in 3 of the 5 additional criteria:
| Reliability and validity: The ACR has been shown to have good inter- and intra-observer reliability in PsA51,52 and was shown to be a valid outcome measure in RCTs53 | ACR20 is generally accepted as the MID indicating a response to treatment |
HAQ-DI | The HAQ Disability Index (HAQ-DI) is the disability assessment component of the HAQ, a self-reported assessment of functional status Overall HAQ-DI score ranges from zero (no disability) to 3 (completely disabled) | Validity: Internal consistency measured by Cronbach alpha for HAQ-DI was 0.9254 | 0.13 estimated by Kwok and Pope37 0.35 estimated by Mease et al.36 |
SF-36 Health Survey Version 2 | The SF-36 consists of 8 sub-domains; the SF-36 provides 2 component summaries, PCS and MCS; the 8 sub-domains are each measured on a scale of zero to 100, with an increase in score indicating improvement in health status | Reliability and validity: Strong evidence for unidimensionality, internal consistency (Cronbach alpha = 0.91 to 0.92) and good structural validity55 | 3.74 and 1.77 for the PCS and MCS subsections, respectively43 |
FACIT– F | The FACIT – Fatigue scale was originally developed for use in patients with cancer; it is 1 of a series of symptom subscales in the FACIT measurement system and has since been validated for use in patients with PsA | Validity: Construct validity through correlation with SF-36 domains generally exceeded 0.60 (all were > 0.50; P < 0.0001). SF-36 Vitality domain (r > 0.80)56 Reliability: FACIT-Fatigue demonstrated good internal consistency (Cronbach coefficient alpha ≥ 0.90) and test-retest reliability (intraclass correlation coefficient ≥ 0.95)55,56 | A total score of 3.1 points56 |
Patient’s assessment of pain NRS | The subject will assess his/her pain using the Patient’s Assessment Pain NRS. The range is 0 to 10 with no activity being indicated by 0 and severe activity by 109 | Measurement properties not assessed in PsA patients | Not found in PsA patients |
SAPS | The SAPS contain 11 symptom-focused items. Each item is scored from 0 to 10, with 0 being least severe and 10 being most severe. The total score is generated by summing the 11 items. The total score ranges from 0 to 1109 | Measurement properties not assessed in PsA patients | Not found in PsA patients |
sIGA of Psoriasis | The sIGA is a 5-point score ranging from 0 to 4, based on the investigator's assessment of the average elevation, erythema, and scaling of all psoriatic lesions | Measurement properties not assessed in PsA patients | Not found in PsA patients |
SHS | The proposed method for PsA evaluates erosions, joint-space narrowing, subluxation, ankylosis, gross osteolysis, and pencil-in-cup lesions; erosions are assessed in 20 joints of the hands and wrists and 12 joints of the feet9 | Validity: Strong convergent validity through correlation with SPARS (r = 0.926, P < 0.0001) Reliability: The intra-rater reliability was 0.95 (95% CI 0.83, 0.99)57 Responsiveness: The SHS has the ability to detect change at 1.2%. SHS has the ability to detect change at a level of 0.7957 | Not found in PsA patients |
MDA | A composite outcome measure developed as a target of treatment for patients with PsA that encompasses the different aspects of disease domains | Validity: The κ coefficient between MDA and patients’ rating of whether they were in a minimal disease state was 0.3058 | Not found in PsA patients |
LEI | An enthesitis index designed for use in PsA RCTs assessing lateral humeral epicondyles (elbows), medial femoral epicondyles (knees), and Achilles tendons (heels) bilaterally and scored as 0 (no pain) and 1 (painful)59 | Validity: The correlation results from Healy et al. suggest that the associations are very robust for the LEI59 Responsiveness: The LEI index showed a large effect size at 6 months and significant response to change59 | Not found in PsA patients |
LDI | LDI evaluates for a ≥ 10% difference in the circumference of the digit compared to the opposite digit | Measurement properties not assessed in PsA patients | Not found in PsA patients |
EQ-5D-5L | Generic preference-based HRQoL instrument, consisting of a VAS and a composite index score of 5 dimensions: mobility, self-care, usual activities, pain/discomfort, and anxiety/depression | Measurement properties not assessed in PsA patients | Not found in PsA patients Index score: summarized mean in Canadian population 0.056 (SD = 0.011) |
WPAI-SHP | Measuring the impact of disease on productivity consisting of 6 questions to determine employment status, hours missed from work due to PsA | Measurement properties not assessed in PsA patients | ROC analyses suggested that a ≥ 20% improvement in presenteeism, a 15% improvement in work productivity loss, and a 20% improvement in activity impairment represented clinically meaningful improvements in both populations39 |
BASDAI | Self-administered disease-specific questionnaire, a composite index containing 6 questions related to 5 major symptoms of ankylosing Spondylitis, scores ranging from 0 to 10 | Measurement properties not assessed in PsA patients | A change of −1.96 on the 10-point BASDAI scale46 |
PASI 75/90/100 | Numeric score ranging from 0 to 72, based on assessments of 4 body areas and severity of induration, erythema, and scaling | Reliability: An inter-rater variability with an ICC of 0.895 was observed; intra-rater variability showed a mean ICC of 0.87760; the ACPMs thus outperformed the 3 physicians for intra-rater reliability (mean ICC 0.86)61 | A 75% reduction in the PASI score (PASI 75) |
PsARC | Measuring signs and symptoms of PsA assessed by tender and/or swollen joint count, physician global assessment (0-5 Likert scale), and patient global assessment (0–5 Likert scale) | Measurement properties not assessed in PsA patients | Not found in PsA patients |
ACMPs = automated, computer- guided PASI measurements; ACR = American College of Rheumatology; BASDI = Bath Ankylosing Spondylitis Disease Activity Index; EQ-5D-5L = European Quality of Life 5 Dimensions- 5 Levels; FACIT-F = Functional Assessment of Chronic Illness Therapy – Fatigue; HAQ-DI = Health Assessment Questionnaire – Disability Index; ICC = intraclass correlation coefficient; LDI = Leeds Dactylitis Instrument; LEI = Leeds Enthesitis Index; MDA = Minimum Disease Activity; MID = minimal important difference; NRS = Numerical Rating Scale; PASI = Psoriasis Area Severity Index; PsA = Psoriatic Arthritis; PsARC = Psoriatic Arthritic Response Criteria; ROC = receiver operating characteristic; SAPS = Self-Assessment of Psoriasis Symptoms; SF-36 = Short Form-36; sIGA = static Investigator Global Assessment; SHS = Sharp/van der Heijde Score; VAS = visual analogue scale; WPAI = Work Productivity and Activity Impairment.
American College of Rheumatology Response
The ACR criteria for assessing joint status was originally developed for rheumatoid arthritis patients, and provides a composite measure of ≥ 20%, ≥ 50%, or ≥ 70% improvement in both swollen and tender joint counts and at least 3 of 5 additional disease criteria including: patient’s global assessment of disease activity using a 10-cm VAS, physician’s global assessment of disease activity on VAS, Health Assessment Questionnaire – Disability Index (HAQ-DI), patient’s assessment of pain intensity, and an acute-phase reactant value (levels of CRP or erythrocyte sedimentation rate [ESR]).62 The ACR joint count assesses 68 joints for tenderness and 66 joints for swelling. Assessment of the proximal interphalangeal (PIP) and distal interphalangeal (DIP) joints of the hands and feet (i.e., 78 joints for tenderness and 76 for swelling) is not typically included for PsA because of difficulty distinguishing PIP and DIP joint inflammation in the toes.63 The ACR has been shown to have good inter- and intra-observer reliability in PsA,51,52 and was shown to be a valid outcome measure in RCTs.53
MID
The ACR20 is generally accepted as the MID indicating a response to treatment, while the ACR 50 and 70 more likely reflect truly important change for the long-term management of arthropathy. The ACR is a general measure of clinical response of peripheral joint disease and does not include assessment of enthesitis, dactylitis, the spine, or the skin. Consequently, it represents only part of the clinical features of PsA; therefore, the use of additional assessment instruments to assess other clinical features is necessary.
Health Assessment Questionnaire–Disability Index
The Health Assessment Questionnaire (HAQ) was originally developed in 1978 at Stanford University.64 It was 1 of the first self-reported functional status (disability) measures and has become the dominant instrument in many disease areas, including arthritis.65 The full HAQ collects data on 5 generic patient-centred health dimensions: 1) to avoid disability, 2) to be free of pain and discomfort, 3) to avoid adverse treatment effects, 4) to keep dollar costs of treatment low, and 5) to postpone death.66
The HAQ Disability Index (HAQ-DI) is the disability assessment component of the HAQ. It assesses a patient’s level of functional ability. There are 20 questions in 8 categories to assess a patient’s physical functional status: dressing, arising, eating, walking, hygiene, reach, grip, and common activities.67,68 For each of these categories, patients report the amount of difficulty they have in performing specific activities, and their responses are made on a scale from zero (no difficulty) to 3 (unable to do). The 8 category scores are averaged into an overall HAQ-DI score on a scale from zero (no disability) to 3 (completely disabled). The HAQ-DI was developed to assess physical disability and pain in rheumatoid arthritis64 and has been used extensively in RCTs in arthritis, including for PsA.
Leung et al. analyzed data available from a longitudinal study in 14 countries of consecutive adults with definite PsA of at least 2 years in duration. A total of 414 patients (52% male) were analyzed. They reported an internal consistency measured by Cronbach alpha of 0.92 for HAQ-DI. Ceiling effects were noted in a third of patients. The HAQ-DI, Physical component summary score of SF-12 (PCS12) and functional capacity of Psoriatic Arthritic Impact of Disease Instrument (PsAID-FC) were assessed for construct validity. The 3 patient-reported outcome measures correlated strongly with each other (ρ > 0.7); and moderately to strongly with patient global assessments for arthritis (ρ = 0.61 to 0.78), pain (ρ = 0.61 to 0.77); moderately with tender joint count (ρ = 0.39 to 0.51) and DAPSA (ρ = 0.55 to 0.72); weakly with swollen joint count (ρ = 0.19 to 0.32); and very weakly with patient global assessment for skin (ρ = 0.24 to 0.36).54 All 3 PROMs for physical function were more sensitive for worsening than improvement. Moderate effect sizes were seen in all 3 PROMs in measurement of worsening. The SRM for worsening for HAQ-DI, PCS12 and PsAID-FC were 0.37, −0.45 and 0.38 respectively. Although the effect sizes estimations (Cohen’s d, and SRM) were similar across the physical function PROMs, the relative effectiveness (SRM2 ratio) was higher for PsAID-FC than the other 2 generic PROMs for physical function for worsening.54
Mean summary scores were similar for the Health Assessment Questionnaire – Spondyloarthropathies (HAQ-S) and the original HAQ-DI (0.53 and 0.50, respectively). Moreover, while both versions yielded higher scores in patients with versus without spinal involvement, there were no statistical differences between the 2 versions within these patient groups. When tested in outpatients with PsA, mean summary scores were almost identical for the HAQ-SK (an expanded version of the original HAQ) and the original HAQ-DI (0.56 and 0.55, respectively).38
MID
Mease et al.36 have estimated that the MID for the HAQ-DI in PsA patients using anchor-based methods is 0.35 (unlike 0.22 for rheumatoid arthritis), while the MID has been estimated to be 0.131 in PsA patients using an anchor-based approach (equal bidirectional magnitudes for improvement and worsening) by Kwok and Pope.37 Discrepancies in the MID estimates may partly be explained by differences in the HAQ-DI score of the patients studied at baseline.38 In the study by Mease et al.,36 patients had a mean HAQ-DI score at baseline of 1.16, corresponding to moderate functional impairment. In contrast, patients in the study by Kwok and Pope had less functional impairment at baseline, with a mean HAQ-DI score of 0.732.37 Blackmore and colleagues have shown the HAQ-DI adequately captures clinically important changes in functional status and pain in patients with PsA.69 However, the HAQ-DI focuses on physical disability and may not adequately capture disability in patients with predominantly skin disease.69 Modified versions of the HAQ to include spinal domains (HAQ-S) or skin disease assessment (HAQ-SK) have not proven to be significantly better in assessment of health status in PsA than the original HAQ-DI.69,70 Leung et al. reported the MID for improvement/ worsening for HAQ-DI were −0.16 (SD: 0.87) for improvement, and 0.30 (SD: 0.81) for worsening.54
Short Form-36 (SF-36) Health Survey, Including Physical Component Summary
The SF-36 is a 36-item, general health status instrument that has been used extensively in clinical trials in many disease areas.71 The SF-36 consists of 8 health domains – physical functioning, role physical, bodily pain, general health, vitality, social functioning, role emotional, and mental health.72 For each of the 8 categories, a subscale score can be calculated. The SF-36 also provides 2 component summaries, the physical component summaries (PCS) and the mental component summary (MCS), derived from aggregating the 8 domains according to a scoring algorithm. The PCS and MCS scores range from zero to 100 with higher scores indicating better health status. The summary scales are scored using norm-based methods, with regression weights and constants derived from the general US population. Both the PCS and MCS scales are transformed to have a mean of 50 and a standard deviation (SD) of 10 in the general US population. Therefore, all scores above/below 50 are considered above/below average for the general US population. Husted and colleagues and Leung and colleagues reported that the SF-36 is reliable and valid for assessment of patients with PsA, and could be used to distinguish PsA patients from patients without PsA.73 The SF-36 is at least equally responsive as the HAQ instrument to short-term changes in perceived health status and inflammatory disease activity in patients with PsA.74
Based on evidence from English and Chinese studies using Rasch analysis and principal component analysis, the SF-36 PF was the best candidate with strong evidence for unidimensionality, internal consistency (Cronbach alpha = 0.91 to 0.92) and good structural validity. Evidence for construct validity was moderate and limited for internal and external relationships, respectively.55
The SF-36 has been included in 26 out of 31 (83.9%) RCTs in PsA. The median (IQR) ES were 0.77 (0.60, 0.93) and 0.23 (0.09, 0.36) for intervention and control groups, respectively.75
MID
The MID for either the PCS or MCS of the SF-36 is typically between 2.5 and 5 points.40-42 Leung and colleagues reported MIDs of 3.74 and 1.77 for the PCS and MCS subsections, respectively, in PsA patients treated with anti-TNFAlpha drugs using an anchor-based approach. The MCS was observed in a phase III trial to be weaker in differentiating drug and placebo effects. However, the trial was limited by its small sample size (n = 17).43
Functional Assessment of Chronic Illness Therapy–Fatigue
The FACIT–F scale was originally developed for use in patients with cancer. It is 1 of a series of symptom subscales in the FACIT measurement system and has since been validated for use in patients with rheumatoid and PsA.76
The FACIT-Fatigue scale is a patient self-reported measure consisting of 13 statements. Patients are asked to indicate to what extent the statement applies to them over the course of the previous 7 days. Each statement has 5 possible levels of response, scored on a scale of 0 to 4 (0 representing “not at all” and 4 representing “very much”), resulting in scores ranging from 0 to 52. Lower scores indicate higher levels of fatigue. A suggested MID for the FACIT-F in patients with rheumatoid arthritis is between 3 and 4 points. This MID was found in a sample of 271 patients (77% female, 81% White, median age of 56 years [range 28 to 84]), a median tender joint count of 26 (range 9 to 68) and a median swollen joint count of 15 (range 2 to 43).76 The FACIT-F was validated in a Toronto PsA cohort study and was found to be well-correlated with the modified Fatigue Severity Scale, showing high internal consistency, test-retest reliability, as well as criterion, and construct validity.77
Cella et al. completed a qualitative study with 12 patients; 2 (17%) had mild, 8 (67%) had moderate, and 2 (17%) had severe PsA disease activity; 7 (58%) attributed fatigue to PsA, and 7 (58%) rated fatigue as important or extremely important. Most patients considered the FACIT-F items relevant to their PsA experience and understood the item content and response options well. In the psychometric analysis of RCT data, a second-order confirmatory factor model fit the data well (Bentler’s Comparative Fit Index ≥ 0.92). FACIT-F demonstrated good internal consistency (Cronbach coefficient Alpha ≥ 0.90) and test-retest reliability (intraclass correlation coefficient = 0.95).55,56 Apart from the Health Transition Item (which has a recall period of 1 year), correlations between FACIT-F and SF-36 domains generally exceeded 0.60 (all were > 0.50; P < 0.0001). There was a strong correlation with SF-36 Vitality (ρ > 0.80).56
MID
A robust relationship between disease activity (based on Patient’s Global Assessment of Psoriasis and Arthritis) and FACIT-F was observed with a minimum clinically important difference for the FACIT-F total score estimated as 3.1 points. Analysis of FACIT-F data from 2 PsA RCTs showed good content validity and reliability, and a strong correlation with other disease measures.56
Patient's Assessment of Pain Numerical Rating Scale
The patient’s assessment of pain NRS is an outcome where the subject will assess his/her pain using a scale. The range is 0 to 10 with no activity being indicated by 0 and severe activity by 10.Higher scores are associated with worse outcomes.9 This type of scale can be administered verbally and can also be administered via paper to be completed physically. This scale can help guide the diagnostic process and track the progression of the pain.
MID
There were no studies found to date that assessed the validity and reliability of the patient’s assessment of pain NRS in PsA patients. No reported MID was found for PsA patients.
Self-Assessment of Psoriasis Symptoms
The SAPS contain 11 symptom-focused items. Each item is scored from 0 to 10, with 0 being least severe and 10 being most severe. Higher scores are associated with worse outcomes. The total score is generated by summing the 11 items. The total score ranges from 0 to 110.9 The SAPS is a self-administered questionnaire.
There were no studies found to date that assessed the validity and reliability of the SAPS in PsA patients.
MID
No reported MID was found for PsA patients.
Static Investigator Global Assessment of Psoriasis
The sIGA is a 5-point score ranging from 0 to 4, based on the investigator's assessment of the average elevation, erythema, and scaling of all psoriatic lesions. The assessment is considered “static” which refers to the patient’s disease state at the time of the assessments, without comparison to any of the patient's previous disease states, whether at Baseline or at a previous visit. A lower score indicates less-severe psoriasis (0 = clear, 1 = almost clear, 2 = mild, 3 = moderate and 4 = severe). A binary clinical end point based on sIGA is considered in this study. It is the proportion of patients achieving a sIGA score of 0 or 1 and at least a 2-point improvement from baseline. This end point is calculated among the patients with baseline sIGA score ≥ 2.9
There were no studies found to date that assessed the validity and reliability of sIGA in PsA patients.
MID
No reported MID was found for PsA patients.
Modified PsA Sharp/van der Heijde Score
The modified PsA Sharp/van der Heijde Score is based on the Sharp–van der Heijde method. The original scoring system evaluates erosions and joint-space narrowing of joints of hands and feet in RA. The proposed method for PsA evaluates erosions, JSN, subluxation, ankylosis, gross osteolysis, and pencil-in-cup lesions. Erosions are assessed in 20 joints of hands and wrists: 10 DIPs/ interphalangeal joints of the thumbs (IPs), 10 metacarpophalangeal joints (MCPs), 2 first metacarpal bones, 2 radial and ulnar bones, 2 multangular units (trapezium and trapezoid combined) and in 12 joints of the feet (10 metatarsophalangeal joints [MTPs] and 2 IPs of the big toes). JSN, subluxation, ankylosis, gross osteolysis and pencil in cup are assessed in the hands in 10 DIPs/IPs, 10 MCPs, second, third, fourth, and fifth carpometacarpal joints, 2 multangular units, 2 capitate-navicular-lunate joints, 2 radiocarpal joints, 10 MTPs, and 2 IPs of the big toes. The maximum score for erosions is 5 in the joints of the hands and 10 in the joints of the feet. Scores for erosions are as follows: 0 = no erosions; 1 = discrete erosions; 2 = large erosions not passing the midline; 3 = large erosions passing the midline. A combination of the above scores lead to a maximum of 5 for a whole joint in the hands, and 5 at each site of the joint (for the entire joint a maximum of 10) in the feet. The JSN scoring is: 0 = normal; 1 = asymmetric or minimal narrowing up to a maximum of 25%; 2 = definite narrowing with loss of up to 50% of the normal space; 3 = definite narrowing with loss of 50% to 99% of the normal space or subluxation; 4 = absence of a joint space, presumptive evidence of ankylosis, or complete luxation. Gross osteolysis and pencil in cup are scored separately. If present, these lesions are scored with the maximum score for both erosions and JSN. The maximum possible score for erosions is 200 for the hands and 120 for the feet; the maximum possible score for JSN is 160 for the hands and 48 for the feet. Finally, the maximum possible score is 528.78
The SHS method showed strong convergent validity, when correlated with Simplified Psoriatic Arthritis Radiographic Score (SPARS) (r = 0.926, P < 0.0001).78
Hand and feet radiographs from 50 patients with PsA were scored at 2 time points by 2 assessors for the modified Sharp/van der Heijde score (SHS). The radiographs of 10 patients were scored by both assessors to evaluate reliability using intraclass correlation coefficients. Sensitivity to change was estimated using a standardized response mean and smallest detectable change. The intra-rater reliability was high for the SHS at 0.95 (95% CI, 0.83, 0.99). The SHS has the ability to detect change at 1.2%. The sensitivity to change of the methods using the standardized response mean demonstrated the SHS as having the greatest ability to detect change at a level of 0.79. The feasibility of the SHS was estimated based on the mean time taken to score each film. The SHS method took 14.4 minutes to score.57
MID
No reported MID was found for PsA patients.
Minimum Disease Activity
Minimum disease activity is a composite outcome measure that was developed as a target of treatment for patients with PsA that encompasses the different aspects of disease domains.79 Patients were considered as achieving MDA if they fulfilled the following 5 of 7 outcome measures: ≤ 1 tender joint count, ≤ 1 swollen joint count, PASI ≤ 1 or BSA ≤ 3%, patient pain VAS of no more than 15, patient global VAS of no more than 20, HAQ-DI up to 0.5, tender entheseal points or 1 or less.80 These criteria for MDA were validated in patients with active PsA using interventional trial data.43 In an observational PsA cohort study, it was found that patients who achieved sustained MDA (sustained MDA was defined as achieving MDA on consecutive visits for a minimum duration of 12 months) had a reduction in joint damage progression, where 69% of patients who achieved sustained MDA showed no progression of joint damage, compared with 51% in the control group, in addition the mean change in damaged joint counts was 0.931 in the sustained MDA group and 2.245 in the controls (P < 0.001).81
Queiro et al. reported the relationship between MDA and presence of radiographic erosions in the hands and feet in a cross-sectional study. Patients in MDA were less likely to have evidence of hand erosions compared with those who were not (P < 0.05); however, there were no significant differences among patients when evaluating presence of erosions in the feet.58,82
The relationship between MDA status and physical and psychological function measured by the PsA Impact of Disease Questionnaire (PsAID) was evaluated by Queiro and colleagues in an observational, cross-sectional study. The PsAID measures the physical and psychological impact of disease on patients’ lives.83 Results indicated that patients in MDA reported significantly lower impacts of disease than patients who were not in MDA across all domains and total PsAID scores (P < 0.001).25 Eighty-eight (66.7%) MDA patients reported a PsAID score < 4 compared with 34 (37.4%) non-MDA patients (P < 0.0001).82
Two studies reported the relationship between changes over time in PROs and MDA. In both, patients in MDA reported significantly more improvements across all PROs assessing HRQoL and fatigue: SF-36, Dermatology Life Quality Index (DLQI), FACIT-F, and PsA quality of life.
Coates and Helliwell reported moderate agreement (kappa = 0.73 to 0.75) with 3 alternative definitions of treatment responses: PASDAS, CPDAI-4 and CPDAI-3. Agreement was also strong for MDA joints (kappa = 0.86) but weak for MDA-phys (kappa = 0.48). The relationship between MDA and disease activity reported by the patient (measured as a patient-reported overall indicator of disease activity) was also evaluated. The κ coefficient between MDA and patients’ rating of whether they were in a minimal disease state was 0.30.58
Rahman et al reported a moderate κ agreement between achievement of MDA and 3 additional disease activity measures, including DAS using 28 joints (DAS28, < 2.6), DAS28 deep remission (DAS28 < 1.98) and DAPSA remission (≤ 4).84 Lubrano et al reported moderate agreement between MDA and a single item of the MDA, PtGA (kappa = 0.72 to 0.73).34 As part of the same LOS, Lubrano et al then evaluated the sensitivity and specificity in differentiating patients rated by their physician as being in MDA (< 10 mm on a 100 mm VAS) versus a higher disease state (≥ 10); sensitivity was 0.90 (0.74 to 0.98) and specificity 0.69 (0.57 to 0.79).85
MID
No MID for MDA was identified in PsA.
Leeds Enthesitis Index
Enthesitis, the inflammation at the bone insertion of a tendon or ligament is common in PsA. The LEI is an enthesitis index designed for use in PsA and has been adopted for use in randomized controlled studies involving patients with PsA.59 Enthesitis was assessed by examining 6 sites, i.e., the lateral humeral epicondyles (elbows), medial femoral epicondyles (knees), and Achilles tendons (heels) bilaterally and scored as 0 (no pain) and 1 (painful).59
The reliability of the LEI index was assessed during the International Spondyloarthropathy Inter-Observer Reliability Exercise study. The intraclass correlation coefficients (ICC) for the LEI was 0.81.
Spearman’s correlation was used to determine the relationship between the entheseal indices and disease activity as measured by the swollen and tender joint counts, patient and physician global VAS, CRP level, HAQ, and DAS28. The LEI index showed a large effect size at 6 months and significant response to change. The correlation results from Healy et al. suggest that the associations are very robust for the LEI.59
MID
No MID for LEI was identified.
Leeds Dactylitis Instrument
Dactylitis, the swelling of an entire digit related to articular and periarticular inflammation is a characteristic of inflammatory spondyloarthropathies, including PsA. Presence of dactylitis was assessed using the LDI basic which evaluates for a ≥ 10% difference in the circumference of the digit compared to the opposite digit.64
MID
No MID for LDI was identified.
European Quality of Life 5 Dimensions- 5 Levels
The EQ-5D-5L is a generic preference-based HRQoL instrument that has been applied to a wide range of health conditions and treatments including multiple myeloma. The EQ-5D-5L was developed by the EuroQol Group as an improvement to the EQ-5D-3L, to measure small and medium health changes and reduce ceiling effects. The instrument comprises 5 dimensions: mobility, self-care, usual activities, pain/discomfort, and anxiety/depression. Each dimension is rated on 5 levels: level 1 “no problems”, level 2 “slight problems”, level 3 “moderate problems”, level 4 “severe problems”, and level 5 “extreme problems” or “unable to perform”. A total of 3,125 unique health states are possible, with 55555 representing the worst health state and 11111 representing the best state. The corresponding scoring of EQ-5D-5L health states is based on a scoring algorithm that is derived from preference data obtained from interviews using choice-based techniques (e.g., time trade-off) and discrete choice experiment tasks. The lowest score varies depending on the scoring algorithm used. The anchors are 0 (dead) and 1 (full health), however negative values are also allowed to represent health states that a society considers worse than death. As an example, a Canadian scoring algorithm results in a score of −0.148 for health state 55555 (worst health state) . Another component of the EQ-5D-5L is a VAS that asks respondents to rate their health on a visual scale from 0 (worst health imaginable) to 100 (best health imaginable).86
The EQ-5D-5L has been extensively validated across countries around the world and in various conditions. However, the psychometric properties of the EQ-5D-5L have not been assessed in patients with multiple myeloma specifically, therefore its validity, reliability, and responsiveness to change have not been evaluated in the patient population of interest.
MID
EQ-5D-5L has been validated in a diverse patient population. However, no studies specifically validating EQ-5D-5L in patients with PsA were identified.
To estimate the MID values of the EQ-5D-5L for each country-specific scoring algorithm, a simulation-based approach based on instrument-defined single-level transitions has been used. The simulation-based instrument-defined generally accepted MID estimate (mean ± SD) for Canada is 0.056 ± 0.011.44
Work Productivity and Activity Impairment Specific Health Problem
Work Productivity and Activity Impairment–Specific Health Problem (WPAI-SHP) is a self-administered instrument used to measure the impact of disease on productivity.46 WPAI-SHP consists of 6 questions to determine employment status, hours missed from work due to PsA, hours missed from work for other reasons, hours actually worked, the degree to which PsA affected work productivity while at work, and the degree to which PsA affected activities outside of work. Four scores are derived: percentage of absenteeism, percentage of presenteeism (reduced productivity while at work), an overall work impairment score that combines absenteeism and presenteeism, and percentage of impairment in activities performed outside of work. Higher scores indicate greater impairment and poorer productivity.46
MID
Tillett et al.’s analysis included 417 biologic-naive and 363 TNFi-experienced patients. ACR20, MDA, and HAQ-DI were valid anchors. Significant differences in WPAI:SHP domain scores were observed between patients achieving ACR20, MDA, or HAQ-DI compared to patients not achieving these clinical thresholds (all P < 0.001). ROC analyses suggested that a ≥ 20% improvement in presenteeism, a 15% improvement in work productivity loss, and a 20% improvement in activity impairment represented clinically meaningful improvements in both populations. The distribution-based method supported the results.39
Bath Ankylosing Spondylitis Disease Activity Index
The most common and widely used validated measure of inflammatory activity of Ankylosing Spondylitis (AS) is the BASDAI.87 This instrument for disease activity is a self-administered patient questionnaire. The BASDAI is a composite index that records patients’ responses to major symptoms of AS. It includes 6 questions addressing 5 major symptoms: fatigue, axial (spinal) and peripheral joint pain, localized tenderness and morning stiffness (both degree of stiffness and length of time for which stiffness persists).87,88 Patients’ responses for each question are recorded on a 10 cm VAS. The final BASDAI score has a range from zero to 10. The higher the score, the greater the degree of disease activity. A reduction in the BASDAI score is considered improvement. The definition of treatment response includes a change in the BASDAI value defined as 2 units (on a zero to 10 scale) of the BASDAI.89 The recall period for BASDAI is “past week”.
In previous research, the BASDAI has been shown to have good test-retest reliability, validity and responsiveness in patients with AS.88,90,91 Content and face validity were assessed through an appraisal of item content, while external construct validity required comparison of instrument scores with those for other measures of health, clinical, socio-demographic and health service use variables.90 In addition, the BASDAI was found to be quick and simple to complete, and appeared to be sensitive to change in disease activity.87 No studies were found that validated BASDAI in PsA patients.
MID
The MID for the BASDAI has been determined as a change of −1.96 on the 10-point BASDAI scale.46
Psoriasis Area Severity Index 75, PASI 90, and PASI 100
The PASI is a widely used instrument in psoriasis trials that assesses and grades the severity of psoriatic lesions and the patient’s response to treatment. It produces a numeric score ranging from zero to 72. In general, a PASI score of 5 to 10 is considered moderate disease and a score over 10 is considered severe. PASI 75 is a dichotomous (yes/no) scale indicating whether a patient achieved ≥ 75% improvement from baseline PASI score. In calculating the PASI, severity is determined by dividing the body into 4 regions: head (h), upper extremities (u), trunk (t) and lower extremities (l) that account for 10%, 20%, 30%, and 40% of the total BSA, respectively.92 Each of these areas is assessed separately for erythema, induration, and scaling which is rated on a scale of 0 (none) to 4 (very severe). Extent of psoriatic involvement is graded as follows: 0 = no involvement; 1 = 1%–9%; 2 = 10%–29%; 3 = 30%–49%; 4 = 50%–69%; 5 = 70%–89%; and 6 = 90%–100%. The following formula is used to calculate the PASI score:
PASI = 0.1 (Eh + lh + Sh) Ah + 0.2 (Eu + lu + Su) Au + 0.3 (Et + lt + St) At + 0.4 (El + ll + Sl) Al.92
Where E = erythema, I = induration, S = scaling, A = area, h = head score, t = trunk score, u = upper extremities, and l = lower extremities score.
A number of limitations of the PASI have been identified:
The PASI has been criticized as not correlating the clinical extent of the disease with quality of life and the psychological stress caused by psoriasis. The patient’s measure of quality of life is often worse than the physician’s-rated clinical severity.93
There are significant inter-rater reliability issues regarding the measurement of BSA.94,95
It often fails to predict severity as seen from the patient’s perspective.94,95
Improvements in PASI score are not linearly related to severity or improvements in psoriasis.60,61 The extent of psoriatic involvement is measured using a scale of 1 to 6 and the areas corresponding to each score are nonlinear.
Some severe disease (clinically) may be scored low. For example, scores as low as 3 (on palms and soles) may represent psoriasis that disables a patient from work and other life activities.
Most patients fall into a narrow band of scores thereby decreasing the usefulness of the full range of scores (i.e., scores above 40 are rare).95 Validity of this scale may be overrated, in part because of the skew toward lower scores.96
There is little research on the reliability of the assessments for erythema, desquamation and induration, together with overall PASI scores.95
Criterion validity is restricted by the lack of a ‘gold standard’ measure of psoriatic severity.97
The PASI lacks sensitivity as erythema, desquamation, and induration are scored with equal weight within each of the 4 body regions. Thus, a reduction in scaling with a concomitant increase in skin erythema could be recorded with the same PASI score.
Improvement of the histological phenotype of psoriasis can be underestimated by the percent improvement in PASI (e.g., reduction of T cells, loss of K16 expression and reduction in epidermal thickness).45
Little work has been done to determine the clinical relevance of derived PASI scores.95
Bozek et al.98 compared and assessed the reliability of 3 commonly used assessment instruments for psoriasis severity: the PASI, BSA, and physician global assessment (PGA). Ten trained dermatologists evaluated 9 adult patients with plaque-type psoriasis using the PASI, BSA and PGA. All the patients were assessed twice by each physician. Significant correlations were observed among the 3 scales in both assessments. In all 3 scales the ICCs were > 0.75, indicating high intra-rater reliability. The coefficient of variation for PASI was 36.9, indicating moderate inter-rater variability.98
Fink et al. validated the methodology of ‘image-based’ versus commonly used ‘live’ PASI measurements in a pilot study, followed by validating in an observational cohort study.60 They investigated the precision and reproducibility of automated, computer- guided PASI measurements (ACPMs) in comparison with 3 trained physicians. PASI scores of 120 patients affected by plaque psoriasis of various severities were prospectively evaluated by 3 formally trained physicians by means of total body images. Each observer independently performed 2 rounds of image-based PASI calculations in all patients at 2 different time points.60
Overall, 720 image-based PASI scores were calculated with a mean PASI of 8.8 (range 0.7 to 34.8). An inter-rater variability with an ICC of 0.895 and mean absolute difference of 3.3 PASI points were observed. Intra-rater variability showed a mean ICC of 0.877 and a MAD of 2.2 points.60
The level of agreement between ACPMs and physicians’ PASI measurements was calculated by the intraclass correlation coefficient (ICC). The reproducibility of ACPMs in comparison with physicians’ PASI measurements was investigated by performing 2 successive ‘repeat PASI calculations’ in the same patients.61
The agreement between ACPMs and physicians’ PASI calculations in 120 fully evaluable patients was high (ICC 0.86, 95% confidence interval 0.80 to 0.90, mean absolute difference 2.5 PASI points). Repeat ACPMs to measure the reproducibility showed an excellent ICC of 0.99 (95% confidence interval 0.98 to 0.99) with a mean absolute difference of 0.5 PASI points. The ACPMs thus outperformed the 3 physicians for intra-rater reliability (mean ICC 0.86).61
MID
A PASI 75 is the current benchmark for most clinical trials in psoriasis and the criterion for efficacy of new psoriasis treatments approved by the FDA.45
Psoriatic Arthritic Response Criteria
Psoriatic Arthritis Response Criteria (PsARC) measures signs and symptoms of PsA assessed by tender and/or swollen joint count, physician global assessment (0-to-5 Likert scale), and patient global assessment (0 to 5 Likert scale). To be a PsARC responder, a patient must have at least a 30% reduction in tender or swollen joint count, as well as a 1-point reduction on the 5-point patient and/or physician global assessment scales, and no worsening on any score. PsARC has been shown to be a responsive and discriminate outcome instrument in PsA RCTs.53,99 However, the PsARC tends to have a higher percentage response than the ACR20, which may be explained by the requirement that tender or swollen joint change is required, not both, and possibly due to the absence of the HAQ score and measurement of ESR or CRP.100 As with the ACR, the PsARC does not account for psoriasis severity and is only a general assessment of clinical status.
No studies specifically validating PsARC in patients with PsA were identified.
MID
No MID for PsARC was identified.
Pharmacoeconomic Review
Abbreviations
ACR
American College of Rheumatology
ACR20
American College of Rheumatology 20% improvement in rheumatoid arthritis
AE
adverse event
bDMARD
biologic disease-modifying antirheumatic drug
BSC
best supportive care
csDMARD
conventional synthetic disease-modifying antirheumatic drug
DMARD
disease-modifying antirheumatic drug
EQ-5D-3L
EuroQol 5-Dimensions 3-Levels
EQ-5D-5L
EuroQol 5-Dimensions 5-Levels
HAQ-DI
Health Assessment Questionnaire–Disability Index
ICER
incremental cost-effectiveness ratio
NICE
National Institute for Health and Care Excellence
NMA
network meta-analysis
PASI
Psoriasis Area and Severity Index
pCPA
pan-Canadian Pharmaceutical Alliance
PsA
psoriatic arthritis
PsARC
Psoriatic Arthritis Response Criteria
QALY
quality-adjusted life-year
tsDMARD
targeted synthetic disease-modifying antirheumatic drug
Executive Summary
The executive summary comprises 2 tables (Table 1 and Table 2) and a conclusion.
Item | Description |
|---|---|
Drug product | Upadacitinib (Rinvoq), 15 mg extended-release tablet in bottles of 30 tablets |
Submitted price | Upadacitinib: $48.68 per tablet |
Indication | For the treatment of adults with active psoriatic arthritis who have had an inadequate response or intolerance to methotrexate or other DMARDs; upadacitinib may be used as monotherapy or in combination with methotrexate |
Health Canada approval status | NOC |
Health Canada review pathway | Standard review |
NOC date | June 3, 2021 |
Reimbursement request | As per indication |
Sponsor | AbbVie Corporation |
Submission history | Previously reviewed: Yes Indication: Rheumatoid arthritis Recommendation date: February 4, 2020 Recommendation: Recommended with clinical criteria (initiation, discontinuation, prescribing) and pricing condition that upadacitinib should not exceed the drug plan cost of the least costly bDMARD or targeted synthetic DMARD reimbursed for the treatment of moderate to severe rheumatoid arthritis1 |
bDMARD = biologic disease-modifying antirheumatic drug; DMARD = disease-modifying antirheumatic drug; NOC = Notice of Compliance.
Table 2: Summary of Economic Evaluation
Component | Description |
|---|---|
Type of economic evaluation | Cost-utility analysis Markov model |
Target population | Adults (age 18 years or older) with active PsA who have had an inadequate response to previous DMARDs or for whom DMARDs are not tolerated or contraindicated |
Treatment | A drug sequence initiated with upadacitinib as monotherapy or in combination with a non-biologic DMARD (not stratified) |
Comparators | Drug sequences initiating with:
|
Perspective | Canadian publicly funded health care payer |
Outcome | QALYs |
Time horizon | Lifetime (48.5 years) |
Key data source | Unpublished sponsor-commissioned NMAs to inform efficacy (i.e., ACR 20, ACR50, ACR70, PsARC, HAQ-DI score, and PASI 50, PASI 75, and PASI 90) SELECT-PsA 1 and SELECT-PsA 2 to inform health-state utilities (i.e., EQ-5D) and patient baseline characteristics |
Submitted results | Biologic-naive population:
Biologic-experienced population:
|
Key limitations |
|
CADTH reanalysis results |
|
ACR20 = American College of Rheumatology 20% improvement in rheumatoid arthritis; ACR50 = American College of Rheumatology 50% improvement in rheumatoid arthritis; ACR70 = American College of Rheumatology 70% improvement in rheumatoid arthritis; DMARD = disease-modifying antirheumatic drug; HAQ-DI = Health Assessment Questionnaire–Disability Index; ICER = incremental cost-effectiveness ratio; IL = interleukin; NMA = network meta-analysis; PASI 50 = 50% reduction in Psoriasis Area and Severity Index score; PASI 75 = 75% reduction in Psoriasis Area and Severity Index score; PASI 90 = 90% reduction in Psoriasis Area and Severity Index score; PDE4 = phosphodiesterase type 4; PsA = psoriatic arthritis; PsARC = Psoriatic Arthritis Response Criteria; QALY = quality-adjusted life-year; TNF = tumour necrosis factor; tsDMARD = targeted synthetic disease-modifying antirheumatic drug.
Note: The costs of etanercept and infliximab were assumed to reflect the biosimilar costs.
Conclusions
The CADTH clinical review noted that, based on the SELECT-PsA1 and SELECT-PsA2 studies, upadacitinib is more effective than placebo, and upadacitinib demonstrated noninferiority compared with adalimumab for American College of Rheumatology 20% improvement in rheumatoid arthritis (ACR20) at 12 weeks. To incorporate other relevant analyses, the sponsor commissioned network meta-analyses (NMAs) for upadacitinib compared with other treatments in patients who were biologic-naive and biologic-experienced. Multiple limitations were associated with the sponsor-submitted NMAs, including a lack of transparency, heterogeneity between the included studies, and use of a fixed-effects model. Based on the totality of evidence, CADTH noted that upadacitinib is more effective than placebo but does not show any difference in efficacy in terms of Psoriatic Arthritis Response Criteria (PsARC), Psoriasis Area and Severity Index (PASI), Health Assessment Questionnaire–Disability Index (HAQ-DI) change and American College of Rheumatology (ACR) response when compared to biologic disease-modifying antirheumatic drugs (bDMARDs) and targeted synthetic disease-modifying antirheumatic drugs (tsDMARDs).
The sponsor’s economic submission relied on the results of the submitted NMA, and the use of the PsARC, which is not commonly used in clinical practice. CADTH also identified limitations with the modelling approach that could not be fully addressed within reanalyses. In the confines of the submitted model and clinical data, CADTH reanalyses suggested that upadacitinib is not a cost-effective treatment at the submitted price as it is more costly and less effective than other available treatments in both the biologic-naive and biologic-experienced populations.
Based on CADTH reanalyses, a price reduction of between 5% and 27% is required for upadacitinib to move onto the cost-effectiveness frontier, with the caveat that CADTH could not address all limitations, particularly as they pertain to the clinical data and specific regimens received. These price reductions are generally similar to the differences between upadacitinib and the reference products, based solely on publicly available drug prices.
Stakeholder Input Relevant to the Economic Review
This section is a summary of the feedback received from the patient groups and drug plans that participated in the CADTH review process.
Input was received by 6 patient groups: Arthritis Consumer Experts, the Canadian Spondylitis Association, the Canadian Association of Psoriasis Patients partnering with the Canadian Psoriasis Network, and the Canadian Arthritis Patient Alliance partnering with the Arthritis Society.
Patient input was from a collaboration of 5 patient groups and collected using online surveys. A total of 85 and 9 responses to English and French surveys were received, respectively, with the majority of responses (n = 93) from Canadian patients. Further input was received from Arthritis Consumer Experts based on an independent online survey of 5 additional patients. Patients reported receiving bDMARDs with varying levels of effectiveness according to treatment, and patients noted that these treatments worked well until they experienced failure and had to find subsequent treatments that are effective. However, multiple patients (n = 54) had experience using non-bDMARDs, with methotrexate and sulfasalazine being the top 2 mostly frequently used treatments (74.1% and 22.2% respectively). Multiple adverse events (AEs) associated with non-bDMARDs were reported, including nausea, elevated liver enzymes, headaches, sore mouth, mental fog, and fatigue. Patients highlighted several areas of unmet need such as new treatments using different mechanisms of action, improved route of administration (oral versus infusion or subcutaneous), reduction in pain and fatigue, effectiveness for psoriatic arthritis (PsA) symptoms, ability to work and carry out daily activities, reduced infection rates, affordability of medication, and improved quality of life.
Six respondents reported an overall positive experience using upadacitinib for the treatment of PsA, with the treatment resulting in improved pain relief and joint swelling, increased ability to perform daily and work activities, and improved self-esteem and self-image. Only a small number of patients stated there were any noticeable AEs (e.g., coldness or shortness of breath).
Drug plans noted that no other oral treatment options are available for patients with PsA.
Several of these concerns were addressed in the sponsor’s model:
the sponsor’s model incorporated AEs and quality of life
the sponsor’s economic submission considered biologic-naive and biologic-experienced patients separately.
CADTH was unable to address 1 concern raised in stakeholder input: The sponsor’s model economic submission did not present effectiveness information based on the number of prior biologic treatments patients had received in the biologic-experienced population.
Economic Review
The current review is for upadacitinib (Rinvoq) for adults with active PsA who have had an inadequate response to previous disease-modifying antirheumatic drugs (DMARDs) or for whom DMARDs are not tolerated or contraindicated.2
Economic Evaluation
Summary of Sponsor’s Economic Evaluation
Overview
The sponsor submitted a cost-utility analysis of upadacitinib compared with bDMARDs only.2 The model population comprised patients who were biologic-naive (i.e., had an inadequate response to conventional synthetic DMARDs [csDMARDs]) and biologic-experienced (i.e., had an inadequate response to a bDMARD) from the SELECT-PsA1 and SELECT-PsA2 trials. This aligns with the proposed Health Canada indication.3,4 As per the Health Canada indication, upadacitinib may be used as either monotherapy or in combination with methotrexate or other non-bDMARDs. However, upadacitinib was not modelled separately as monotherapy and combination therapy in the sponsor’s base case. The sponsor modelled upadacitinib and the relevant comparators as part of a treatment sequence according to treatment class for both the biologic-naive and biologic-experienced populations using clinical expert opinion, with the most-used therapy by treatment class informing model inputs (i.e., clinical efficacy outcomes and costs). An overview of the treatment sequences for upadacitinib and bDMARD comparators in both the biologic-naive and biologic-experienced population is provided in Table 12.
The recommended dose of upadacitinib is 15 mg daily as monotherapy or combination therapy.5 At the sponsor’s submitted price of $48.68 per 15 mg tablet, the total annual drug acquisition costs of upadacitinib were $17,768. The sponsor assumed 58% of patients would receive concomitant methotrexate6 as part of treatment (7.5 mg weekly).7 The combined total annual drug acquisition costs of upadacitinib and methotrexate were $17,867.
Comparators were selected on the basis of the current standard of care in Canada (i.e., bDMARDs), which varied by population:
adalimumab, apremilast, certolizumab pegol, etanercept, subcutaneous golimumab, infliximab, ixekizumab, secukinumab, and ustekinumab for the biologic-naive population
ixekizumab, secukinumab, ustekinumab for the biologic-experienced population.
As aligned with upadacitinib, the treatment comparators were modelled according to the most commonly used treatment sequences (see Table 12). The annual maintenance drug costs varied according to the initial treatment received and ranged from $9,973 (i.e., secukinumab 150 mg) to $20,138 (i.e., ixekizumab); an overview of drug costs is presented in Table 10. The sponsor assumed vial sharing would occur for patients receiving infliximab. The sponsor also included a similar assumption, in which 58% of patients receiving a bDMARD would also receive methotrexate.
The clinical outcomes of interest were quality-adjusted life-years (QALYs). The economic analysis was undertaken over a lifetime time horizon (i.e., 48.5 years) using 4-week cycles from the perspective of a public health care payer. Discounting at 1.5% per annum was applied to both costs and clinical outcomes.
Model Structure
A Markov cohort model was developed in Microsoft Excel, with 10 health states for the biologic-naive population and 8 health states for the biologic-experienced population.2 Health states were stratified by trial period (i.e., induction phase of 12 weeks), continuous treatment period (i.e., maintenance phase), line of treatment failure, and transition to best supportive care (BSC) or death, as shown in Figure 1. Patient response in the trial period was assessed after 12 weeks of treatment using PsARC; patients could either transition to the continuous treatment health state or discontinue and initiate subsequent treatment. Patients in the continuous treatment health state were assumed to remain on treatment until discontinuation due to AEs or loss of response. If patients failed to achieve a PsARC response on the last active treatment line (i.e., 2 subsequent treatments in biologic-naive patients and 1 subsequent treatment in biologic-experienced patients) they would receive BSC, which involved a treatment basket of csDMARDs and supportive medications. The sponsor assumed that treatment effect had no impact on patient mortality and the risk of death was based on the all-cause mortality rates of the Canadian population,8 adjusted for excess mortality due to having PsA.9
Model Inputs
The baseline patient characteristics in the model were aligned with those of the SELECT-PsA1 and SELECT-PsA2 clinical trial patient populations, which included patient age, sex, mean weight, level of psoriasis severity, and PASI and HAQ-DI scores by psoriasis severity.3,4
The sponsor submitted separate NMAs informed by the SELECT trials and relevant comparator trials for biologic-naive and biologic-experienced patients at 12-week and 24-week assessment periods. The 12-week results were applied in the base-case analysis to inform the transition probabilities of all treatments according to PsARC response and nonresponse after the evaluation period (i.e., initial 3 months). Response was defined as an improvement in at least 2 of 4 components without worsening of any criteria: joint tenderness and swelling using 68 and 66 joint counts, respectively; patient input on global health; and physician assessment of global health.10,11 Summary-level trial characteristics of PsARC were unavailable for secukinumab 300 mg, and the corresponding response probability and statistical variation (i.e., 95% credible interval) were obtained from the National Institute for Health and Care Excellence (NICE) technology assessment of secukinumab for treating active PsA after inadequate response to DMARDs.6 Additional NMAs were conducted to estimate changes in HAQ-DI scores and 50%, 75%, and 90% reductions in PASI, measured as improvement from baseline, which informed improvements in the arthritic and psoriasis components of PsA, respectively, and were weighted according to PsARC response status.12 To account for missing HAQ-DI scores and estimate the difference in HAQ-DI scores for patients with and without PsARC responses, the sponsor conducted a regression analysis on the SELECT-PsA trials using a generalized linear mixed-effects model. A Pearson correlation coefficient was derived between a 75% reduction in PASI score and PsARC response, with the ratio of PsARC responders and nonresponders assumed to be equal for 50% and 90% reductions in PASI scores. Upon loss of response and initiation of subsequent treatment or BSC, patients were assumed to revert to their baseline HAQ-DI and PASI scores. Upon transitioning to BSC, it was also assumed that PASI scores would remain constant, but HAQ-DI scores would progressively worsen until reaching a maximum of 3.12 The sponsor applied a constant annual hazard rate of discontinuation using a meta-analysis of registry data, assuming that discontinuation would be uniform across all treatments and lines of therapy.13
Health-state utility values were collected as part of the SELECT trials, with EuroQol 5-Dimensions 5-Levels (EQ-5D-5L) utilities mapped to those of the EuroQol 5-Dimensions 3-Levels questionnaire (EQ-5D-3L) using the algorithm from van Hout et al. (2012).14 The sponsor conducted separate regression analyses (using a generalized linear mixed-effects model) for the biologic-naive and biologic-experienced populations to include the independent variables of HAQ-DI and PASI scores. Due to the infrequent and transient nature of AEs, the sponsor did not include utility decrements due to AEs.
Costs included those for drug acquisition, treatment administration, monitoring, arthritis and psoriasis-related disease management, and AEs.2 The drug price for upadacitinib was obtained from the sponsor and all other treatments were sourced from the IQVIA DeltaPA database.15 Methotrexate (7.5 mg weekly) was assumed to be received concomitantly by 58% of patients during treatment with bDMARDs. Administration costs were included based on IV administration costs in Ontario from Tam et al. (2013)16 and pharmacist time,17 with subcutaneous treatments assumed to incur costs for nursing wages.18 An additional outpatient IV infusion cost was applied for patients receiving infliximab according to the recommended dosing schedule. No administration costs were assumed for patients receiving oral therapies. Monitoring resource utilization was informed using a survey of 4 Canadian clinical experts, and costs were obtained from the Ontario Physician Schedule of Benefits and Schedule for Laboratory Services.19,20 The sponsor applied arthritis-related total health care costs using a linear regression analysis according to HAQ-DI scores from Bansback et al. (2006) and inputs were informed using Goeree et al. (2018).21 Psoriasis-related costs were linked according to PASI response (i.e., with or without a 75% reduction in PASI score) obtained from Levy et al. (2012).22 The sponsor included unadjusted serious AEs requiring hospitalization (i.e., melanoma, non-melanoma skin cancer, lymphoma, other malignancies, and severe infections). Costs for AEs were obtained from a Canadian costing study and inflated to 2020 Canadian dollars.23
Summary of Sponsor’s Economic Evaluation Results
All analyses were run probabilistically (5,000 iterations for the base-case and scenario analyses). The deterministic and probabilistic results were similar. The probabilistic findings follow.
Base-Case Results
The sponsor presented base-case results for both the biologic-naive and biologic-experienced populations.
In the base case for the biologic-naive population, the upadacitinib sequence was associated with an expected cost of $180,882 and 12.241 QALYs over a lifetime time horizon. Based on sequential analyses, when compared with the apremilast sequence, the upadacitinib sequence had an incremental cost of $16,483 and was associated with 0.443 incremental QALYs, resulting in an incremental cost-effectiveness ratio (ICER) of $37,233 per QALY gained (Table 3). The upadacitinib sequence had an 83% probability of being considered cost-effective at a willingness-to-pay threshold of $50,000 per QALY gained.
Table 3: Summary of Sponsor’s Economic Evaluation Results — Biologic-Naive Population
Drug | Total costs ($) | Total QALYs | ICER ($ per QALY) |
|---|---|---|---|
Apremilast sequence | 452,004 | 11.798 | Reference |
Upadacitinib sequence | 468,487 | 12.241 | 37,233 |
ICER = incremental cost-effectiveness ratio; QALY = quality-adjusted life-year.
Note: Only treatments that are on the efficiency frontier are reported in the main body. The submitted analysis is based on publicly available prices of the comparator treatments. Full results are reported in Appendix 3.
Source: Sponsor’s pharmacoeconomic submission.2
In the base case for the biologic-experienced population, the upadacitinib sequence was associated with an expected cost of $122,391 and 10.686 QALYs over a lifetime time horizon. Based on sequential analyses, the efficiency frontier was only represented by the upadacitinib sequence as all other treatment sequences were dominated (i.e., they were less costly and more effective). The upadacitinib sequence had a greater than 99% probability of being considered cost-effective at a willingness-to-pay threshold of $50,000 per QALY gained.
The majority of the benefit (i.e., QALYs) in both the biologic-naive and biologic-experienced populations were accrued in the BSC health state for upadacitinib and all comparators. The major cost drivers were drug acquisition and disease management.
Sensitivity and Scenario Analysis Results
The sponsor undertook scenario analyses for both the biologic-naive and biologic-experienced populations that included: varying the discount rate between 0% and 3%, adopting a societal perspective, no mortality adjustment, using a 24-week response assessment, no AE costs, applying treatment-specific discontinuation, altering the proportion of patients receiving secukinumab 300 mg, wastage, adjusting HAQ-DI deterioration, immediate utility gains and alternate utility sources, and altering the time horizon. Based on pairwise comparisons with the apremilast sequence in biologic-naive patients, the upadacitinib sequence remained more costly and effective in the majority of scenarios, with minimal changes in the resulting ICERs, except when truncating the time horizon (i.e., 1 year, 5 years, and 10 years) which resulted in reduced cost-effectiveness for upadacitinib. In the biologic-experienced population, the upadacitinib sequence remained the dominant treatment strategy in all pairwise scenarios (i.e., comparator sequences remained dominated), except when compared to apremilast when the time horizon was truncated.
CADTH Appraisal of the Sponsor’s Economic Evaluation
CADTH identified several key limitations to the sponsor’s analysis that have notable implications for the economic analysis:
Treatments modelled were not reflective of current Canadian clinical practice. Apremilast received a conditional positive recommendation from CADTH for the treatment of PsA and was therefore included as part of the sponsor’s base-case analyses.24 However, because negotiations were concluded without an agreement with the pan-Canadian Pharmaceutical Alliance (pCPA), apremilast is not currently listed for reimbursement on the public drug programs.25 Currently, apremilast is undergoing further negotiations with the pCPA to facilitate reimbursement, but it is unclear if the sponsor will be able to successfully negotiate mutually agreed-upon terms and receive a letter of agreement allowing apremilast to be listed by the public drug programs.26 CADTH also noted the limited list of comparators in the biologic-experienced population, which does not reflect the treatments used in clinical practice. The sponsor noted this was due to a lack of trial data for other available treatments in this line of therapy.
CADTH also noted that, based on the proposed Health Canada indication for upadacitinib, patients are only required to have an inadequate response or intolerance to 1 or more DMARDs.5 However, based on feedback from clinical experts consulted by CADTH, patients typically require failure on at least 2 csDMARDs before receiving a bDMARD therapy, and they were the only included comparators in the submitted economic model. This was also noted in the sponsor submission for the drug program reimbursement criteria of the included bDMARDs; patients are required to have failed at least 2 or more csDMARDs.2 CADTH considered BSC to be an appropriate comparator in patients that have only failed 1 prior csDMARD as this aligns with clinical practice and current reimbursement criteria.
Last, as per the proposed Health Canada indication, upadacitinib can be used as monotherapy or combined with a non-biologic DMARD. However, the sponsor did not model these therapies independently in the economic model.2,5 Instead, it was assumed that 58% of patients on a bDMARD would concomitantly receive methotrexate, even though only the associated drug costs were included and the potential differential efficacy was not considered. It is therefore unclear if there is an expected difference in efficacy (i.e., HAQ-DI, PASI, PsARC) or in safety outcomes for upadacitinib when used as monotherapy compared to combination therapy.
CADTH removed apremilast as a comparator in the biologic-naive population. Due to a lack of data, CADTH was unable to explore the cost-effectiveness independently for upadacitinib monotherapy and combination therapy.
The comparative effectiveness of upadacitinib is uncertain. Clinical efficacy inputs used to inform the economic model were derived from a sponsor-submitted NMA.27 The sponsor’s economic model incorporated data from both the fixed- and random-effects models. The sponsor noted a wide range of placebo response rates between trials for multiple clinical end points (PsARC, PASI, and ACR) and adjusted these rates in the random-effects models. However, the sponsor applied data from fixed-effect models for all clinical outcomes in the biologic-experienced population and for HAQ-DI conditional on PsARC response in the biologic-naive population. The CADTH clinical review team noted multiple limitations were associated with the sponsor-submitted NMA, including a lack of transparency in how included studies were selected (or which studies were excluded) and a lack of additional analyses to address the heterogeneity in inclusion criteria and patient characteristics. Furthermore, it is unclear to what extent using the fixed-effects model biased the cost-effectiveness results, specifically in the biologic-experienced population, for which the placebo response was not adjusted for any clinical outcome. As such, the results of the sponsor-submitted NMA must be viewed with caution. The CADTH clinical review also noted that, based on the SELECT-PsA1 and SELECT-PsA2 studies, upadacitinib is more effective than placebo, and upadacitinib demonstrated noninferiority compared with adalimumab. Based on the totality of evidence, CADTH noted that upadacitinib is more effective than placebo but does not show any difference in efficacy in terms of PsARC, PASI, HAQ-DI change, and ACR when compared to biologic DMARDs and tsDMARDs.
CADTH was unable to address the uncertainty associated with the point estimates derived from the sponsor-submitted NMA.
The outcome modelled is not clinically relevant. The sponsor used PsARC to determine responses within the submitted model. The PsARC was neither a primary nor a key secondary end point captured in the SELECT-PsA1 and SELECT-PsA2 trials. As such, these analyses were not included in the hierarchical statistical analyses and results should be considered inconclusive due to the potential for inflated type I error as described in the CADTH Clinical Review Report. The clinical expert consulted by CADTH also noted PsARC response criteria are not widely used in practice, and alternate response criteria (ACR20 or minimum disease activity, which is a composite outcome) may be considered, but noted that many provinces require PsARC as part of their reimbursement criteria. Given that ACR20 response criteria were used as the primary end point in both trials and were included in the multiplicity-controlled analyses, the sponsor should have explored the cost-effectiveness of upadacitinib using this end point.
CADTH was unable to assess the cost-effectiveness of upadacitinib using ACR20 or minimum disease activity as response criteria. However, as noted in the previous limitation, upadacitinib did not show any difference in efficacy in terms of PsARC and ACR20 when compared to biologic DMARDs and tsDMARDs in the NMAs.
Subsequent treatment assumptions are uncertain. The sponsor used treatment sequences to capture the long-term pathway of PsA as patients frequently lose response to treatment and are initiated on subsequent bDMARDs. However, the use of treatment sequences was associated with a high degree of uncertainty as both costs and efficacy may be over- or underestimated, depending on the initial treatment received. Specifically, the sponsor typically applied subsequent treatments to the comparator treatments, which were associated with lower clinical outcomes (i.e., PsARC, HAQ-DI, and PASI) and higher treatment costs. The sponsor also included ustekinumab as a treatment option after failure of 2 biologics in the biologic-naive and biologic-experienced populations; however, negotiations were not pursued by the sponsor with the pCPA28 and ustekinumab is currently only reimbursed by the Saskatchewan Drug Plan.29 The inclusion of ustekinumab as a subsequent treatment therefore does not likely represent the treatment landscape among the majority of drug programs.
The clinical expert consulted by CADTH also noted that there are no current restrictions on the number of subsequent bDMARDs patients can receive. As such, the assumed number of active treatments in the sequence may underestimate the number of treatments patients would receive in clinical practice.
Further, the sponsor implicitly assumed there would be no attenuation of treatment efficacy (i.e., PsARC, HAQ-DI, or PASI) for patients receiving subsequent treatment. However, the clinical expert indicated that efficacy would be reduced with subsequent failures. Patients receiving subsequent treatment with more efficacious treatments would receive an additional benefit that would not likely be realized in clinical practice. CADTH observed that, based on the modelled sequences, upadacitinib accrued more benefit in later lines compared with any other comparator treatment.
Based on the uncertainty associated with treatment sequences, the CADTH base case restricted sequencing to initial treatment and, upon loss of response, assumed patients proceed directly to BSC.
Quality-of-life estimates are associated with uncertainty. The sponsor used a mapping algorithm to derive EQ-5D-3L scores from EQ-5D-5L utility scores from the SELECT-PsA1 and SELECT-PsA2 trials using the van Hout et al. (2012)14 mapping algorithm. A report from the NICE Decision Support Unit highlighted limitations associated with the van Hout et al. algorithm used by the sponsor as the NICE models were slightly better predictors of responses to the EQ-5D-3L system.30 Although a recent position statement by NICE recommended the van Hout et al. mapping algorithm for use in the reference case, alternative algorithms were not explored by the sponsor and the impact on cost-effectiveness results is unknown.31 As the EQ-5D-5L is the latest version of the EQ-5D instrument, which was developed to better represent the level of disease severity for each dimension,32 the reasoning behind adding further uncertainty to utility assessments by mapping EQ-5D-3L utilities was unclear.
Due to a lack of data, CADTH was unable to explore the impact of using EQ-5D-5L utility estimates.
Uncertain long-term treatment efficacy. The sponsor projected trial results over the model time horizon (i.e., 48.5 years) with the implicit assumption that treatment-effect waning would not occur for the model outcomes (HAQ-DI and PASI). The sponsor assumed no attenuation of efficacy while on treatment and implicitly assumed treatment effect by line of treatment remained uniform.
CADTH could not address this limitation given the configuration of the submitted model.
The cost of adalimumab changed. Between the time at which the sponsor submitted upadacitinib and the review being completed, the price of adalimumab changed. Biosimilar adalimumab became available at 60% of the price of branded adalimumab. As such, the cost of adalimumab moving forward is overestimated.
CADTH conducted reanalyses using the revised price of adalimumab.
Administration costs were not applicable. The sponsor included administration costs for subcutaneous treatments. However, the clinical expert consulted by CADTH noted that patients would not require a nurse to aid in the administration and monitoring of patients as assumed by the sponsor and the costs of such assistance would likely not be incurred by the public payer. Subcutaneous treatments would be self-administered by the patient, and no administration costs are expected for these treatments.
As part of CADTH base-case reanalyses, subcutaneous administration costs were removed.
Additionally, the following key assumptions were made by the sponsor and have been appraised by CADTH (Table 4).
Vial sharing for infusion therapies is not appropriate. The sponsor assumed vial sharing as part of the base-case analysis for infliximab. However, vial sharing is subject to a high degree of uncertainty as it was uncertain if it is commonly used in clinical practice. CADTH therefore considers drug wastage to be a more appropriate approach to calculating drug costs for IV treatments such as infliximab; this aligns with the recent CADTH review of ixekizumab for PsA.33
CADTH included drug wastage for infliximab as part of base-case reanalyses.
Treatment assessment time points may bias results in favour of upadacitinib. The sponsor assessed PsARC response after 12 weeks, which aligned with the SELECT-PsA1 and SELECT-PsA 2 trials. However, the clinical expert consulted by CADTH noted that other bDMARDs (specifically adalimumab as included in the trials) typically achieve a maximal response at the week 24 assessment due to a longer onset of response compared to upadacitinib. Therefore, limiting the treatment assessment to after only 12 weeks likely biased results in favour of upadacitinib, and likely underestimated the cost-effectiveness of upadacitinib relative to adalimumab. However, due to the variability in assessment periods between trials and lack of available data for comparators, multiple assumptions were used in the economic model to inform missing data for the week 24 assessment.
As part of scenario analyses, CADTH used the week 24 assessment to inform treatment response.
Table 4: Key Assumptions of the Submitted Economic Evaluation
Sponsor’s key assumption | CADTH comment |
|---|---|
48-year time horizon represents “lifetime” | Acceptable |
Treatment discontinuation was equal between treatments | Acceptable |
58% of patients on a bDMARD receive concomitant methotrexate | Acceptable |
Best supportive care comprised a csDMARD and supportive medication (i.e., NSAID) | Reasonable based on clinical expert feedback |
61% of patients receiving secukinumab received the 300 mg dose | Reasonable based on clinical expert feedback |
bDMARD = biologic disease-modifying antirheumatic drug; csDMARD = conventional synthetic disease-modifying antirheumatic drug, NSAID = nonsteroidal anti-inflammatory drug.
CADTH Reanalyses of the Economic Evaluation
Base-Case Results
Given that the biologic-naive and biologic-experienced populations have different parameter inputs and comparators, CADTH provided reanalyses according to these distinct subgroups. The CADTH base case was derived by making changes in model parameter values and assumptions in consultation with clinical experts. CADTH reanalyses of the economic model addressed several limitations, which included removing apremilast as a comparator, including wastage for infliximab, and restricting subsequent treatment to BSC following failure of initial treatment. The reanalyses for the biologic-naive populations are summarized in Table 5 and for biologic-experienced populations in Table 6.
Table 5: CADTH Revisions to the Submitted Economic Evaluation in the Biologic-Naive Population
Stepped analysis | Sponsor’s value or assumption | CADTH value or assumption |
|---|---|---|
Corrections to sponsor’s base case | ||
1. None | ||
Changes to derive the CADTH base case | ||
1. Apremilast as a comparator | Included | Excluded |
2. Infliximab wastage | Excluded | Included |
3. Subsequent treatment | Included 2 additional treatments before BSC | Patients receive BSC upon failure of initial treatment |
CADTH base case | — | Reanalyses 1 to 3 |
BSC = best supportive care.
Table 6: CADTH Revisions to the Submitted Economic Evaluation in the Biologic-Experienced Population
Stepped analysis | Sponsor’s value or assumption | CADTH value or assumption |
|---|---|---|
Corrections to sponsor’s base case | ||
1. None | ||
Changes to derive the CADTH base case | ||
1. Infliximab wastage | Excluded | Included |
2. Subsequent treatment | Included 1 additional treatment before BSC | Patients receive BSC upon failure of initial treatment |
CADTH base case | — | Reanalyses 1 to 2 |
BSC = best supportive care.
CADTH’s base-case results for the biologic-naive and biologic-experienced population are presented in Table 7 and Table 8, respectively. In the bioIogic-naive subgroup, upadacitinib was dominated by (i.e., was more costly and less effective than) etanercept; upadacitinib was associated with 0.37 fewer QALYs and an incremental cost of $19,234. Only infliximab, with an ICER of $185,071 per QALY, was on the cost-effectiveness frontier. In the biologic-experienced subgroup, upadacitinib and all other comparators were dominated by (i.e., were more costly and less effective than) secukinumab; upadacitinib was associated with 0.15 fewer QALYs and an incremental cost of $3,415.
Table 7: Summary of CADTH Reanalysis Results — Biologic-Naive Population
Drug | Total costs ($) | Total QALYs | Sequential ICER ($ per QALY) |
|---|---|---|---|
CADTH base case | |||
Etanercept | 409,227 | 9.483 | Reference |
Infliximab | 430,065 | 9.595 | 185,071 |
Dominated strategies | |||
Secukinumab | 424,228 | 9.026 | Dominated by etanercept |
Upadacitinib | 428,460 | 9.110 | Dominated by etanercept |
Certolizumab pegol | 429,976 | 9.025 | Dominated by etanercept |
Ixekizumab | 434,282 | 8.800 | Dominated by etanercept and infliximab |
Ustekinumab | 435,276 | 8.808 | Dominated by etanercept and infliximab |
Adalimumab | 437,092 | 8.896 | Dominated by etanercept and infliximab |
Golimumab | 440,333 | 9.249 | Dominated by etanercept and infliximab |
ICER = incremental cost-effectiveness ratio; QALY = quality-adjusted life-year.
Note: Etanercept and infliximab costs were assumed to be 100% of biosimilar costs.
Table 8: Summary of CADTH Reanalysis Results — Biologic-Experienced Population
Drug | Total costs ($) | Total QALYs | Sequential ICER ($ per QALY) |
|---|---|---|---|
CADTH base case | |||
Secukinumab | 427,117 | 8.940 | Reference |
Ustekinumab | 430,512 | 8.546 | Dominated by secukinumab |
Upadacitinib | 430,532 | 8.790 | Dominated by secukinumab |
Ixekizumab | 437,037 | 8.804 | Dominated by secukinumab |
ICER = incremental cost-effectiveness ratio; QALY = quality-adjusted life-year.
Scenario Analysis Results
CADTH undertook 2 key scenario analyses, 1 using a reduced price of adalimumab and 1 exploring price reductions for upadacitinib. Both of these analyses were undertaken based on the CADTH base case, although the analysis for adalimumab applied only to the biologic-naive population. Using the revised price of adalimumab, etanercept is no longer the least costly alternative (adalimumab). As noted in Table 19, there are 2 treatments on the cost-effectiveness frontier (etanercept and infliximab); upadacitinib remains dominated by etanercept.
A price reduction of approximately 27% is required for upadacitinib to not be dominated by etanercept in the biologic-naive population, which closely resembles the difference between the publicly available prices of these drugs. A price reduction of 5% is required for upadacitinib to not be dominated by secukinumab in the biologic-experienced population, which is comparable to the differences in publicly available prices of these drugs based on the sponsors dosing assumptions.
Table 9: CADTH Price Reduction Analyses
Price reduction | ICER | |
|---|---|---|
Sponsor base case | CADTH reanalysis | |
Upadacitinib: biologic-naive population | ||
No price reduction | $37,233 (upadacitinib vs. apremilast) | Upadacitinib is dominated by etanercept |
10% | $7,386 (upadacitinib vs. apremilast) | Upadacitinib is dominated by etanercept |
20% | Upadacitinib is dominant | Upadacitinib is dominated by etanercept |
30% | Upadacitinib is dominant | $7,386 (etanercept vs. upadacitinib) |
40% | Upadacitinib is dominant | $27,065 (etanercept vs. upadacitinib) |
50% | Upadacitinib is dominant | $46,743 (etanercept vs. upadacitinib) |
Upadacitinib vs. comparators: biologic-experienced population | ||
No price reduction | Upadacitinib is dominant | Upadacitinib is dominated by secukinumab |
10% | Upadacitinib is dominant | $23,479 (secukinumab vs. upadacitinib) |
20% | Upadacitinib is dominant | $69,690 (secukinumab vs. upadacitinib) |
30% | Upadacitinib is dominant | $115,902 (secukinumab vs. upadacitinib) |
ICER = incremental cost-effectiveness ratio; vs. = versus.
Issues for Consideration
Availability of 30 mg upadacitinib dosing. The SELECT-PsA1 and SELECT-PsA2 trials included a 30 mg dose for upadacitinib, which is not currently available in Canada and was not explored in the sponsor’s submission. It is therefore uncertain what the cost-effectiveness of upadacitinib would be if the 30 mg dose were to become available.
Overall Conclusions
The CADTH clinical review noted that, based on the SELECT-PsA1 and SELECT-PsA2 trials, upadacitinib is more effective than placebo, and upadacitinib demonstrated noninferiority compared with adalimumab. To incorporate other relevant analysis, the sponsor commissioned NMAs comparing upadacitinib with other treatments in patients who were biologic-naive and biologic-experienced. Multiple limitations were associated with the sponsor-submitted NMAs, including a lack of transparency, heterogeneity between the included studies, and use of a fixed-effects model. Based on the totality of evidence, CADTH noted that upadacitinib is more effective than placebo but does not show any difference in efficacy in terms of PsARC, PASI, HAQ-DI change, or ACR response when compared to biologic DMARDs and tsDMARDs.
CADTH identified several key limitations with the sponsor’s economic submission. First, the comparators included by the sponsor were not reflective of Canadian practice and were not stratified to assess monotherapy or combination therapy individually. Second, the clinical effectiveness of upadacitinib is uncertain, particularly over the long-term; the sponsor-commissioned NMAs assessed only short-term trial data, and the NMAs’ identified limitations mean the results must be viewed with caution. Third, feedback from the clinical expert consulted by CADTH noted that the outcome modelled (PsARC) is no longer commonly used in practice, and another outcome, such as ACR20 or minimum disease activity, may be more relevant. Fourth, the sponsor’s inclusion of different sequences of subsequent treatments for all comparators was of limited relevance given the amount of cycling between treatments that occurs, and the sequencing used in the sponsor’s analysis appeared to bias the results in favour of upadacitinib. Finally, biosimilars for adalimumab have recently been listed by public drugs plans at a lower cost than branded adalimumab.
CADTH undertook reanalyses that removed apremilast, included wastage for infliximab, and removed subsequent treatments (other than BSC) for patients after the initial treatment in that line of therapy. These reanalyses indicated that upadacitinib is not a cost-effective treatment at the submitted price as it is dominated by (i.e., more costly and less effective than) other available treatments in both the biologic-naive and biologic-experienced populations. When the new price of adalimumab is included, upadacitinib remains dominated. A price reduction of between 5% and 27% is required for upadacitinib to move onto the cost-effectiveness frontier based on CADTH reanalyses, with the caveat that CADTH could not address all limitations, particularly as they pertain to the clinical data and specific regimens received. These price reductions are generally similar to the differences between upadacitinib and the reference products, based solely on publicly available drug prices.
References
1.CADTH Canadian Drug Expert Committee Recommendation: Upadacitinib for Rheumatoid Arhthritis. Ottawa (ON): CADTH; 2020: https://cadth.ca/sites/default/files/cdr/complete/SR0614%20Rinvoq%20-%20CDEC%20Final%20Recommendation%20February%206%2C%202020_for%20posting.pdf. Accessed 2021 Feb 16.
2.Pharmacoeconomic evaluation [internal sponsor's report]. In:Drug Reimbursement Review sponsor submission: Rinvoq (upadacitinib), 15 mg extended release tablets, oral. Pointe-Claire (QC): Abbvie; 2021 Jan.
3.Clinical Study Report: SELECT-PsA 1. A phase 3, randomized, double-blind, study comparing upadacitinib (abt-494) to placebo and to adalimumab in subjects with active psoriatic arthritis who have a history of inadequate response to at least one non-biologic disease modifying anti-rheumatic drug [internal sponsor's report]. North Chicago (IL): AbbVie; 2020 Apr 14.
4.Clinical Study Report: SELECT-PsA 2. A phase 3, randomized, double-blind study comparing upadacitinib (abt-494) to placebo in subjects with active psoriatic arthritis who have a history of inadequate response to at least one biologic disease-modifying anti-rheumatic drug (bdmard) [internal sponsor's report]. North Chicago (IL): AbbVie; 2020 June 16.
5.Rinvoq (upadacitinib): 15 mg extended-release oral tablet [product monograph]. Pointe-Claire (QC): Abbvie Corporation; 2020 Dec 21.
6.National Institute for Health and Care Excellence. Certolizumab pegol and secukinumab for treating active psoriatic arthritis after inadequate response to DMARDs London (UK): NICE; 2017: https://www.nice.org.uk/guidance/ta445/resources/certolizumab-pegol-and-secukinumab-for-treating-active-psoriatic-arthritis-after-inadequate-response-to-dmards-pdf-82604786303941. Accessed 2021 Feb 19.
7.Methotrexate: 2.5 mg and 10 mg tablet; 20 mg/2mL and 50 mg/2mL vial [product monograph]. Kirkland (QC): Pfizer Canada Inc: https://pdf.hres.ca/dpd_pm/00013052.PDF. Accessed 2021 Feb 19.
8.Statistics Canada. Table 13-10-0114-01 Life expectancy and other elements of the life table, Canada, all provinces except Prince Edward Island. Ottawa (ON): Statistics Canada; 2021: https://www150.statcan.gc.ca/t1/tbl1/en/tv.action?pid=1310011401. Accessed 2021 Feb 19.
9.Ali Y, Tom BD, Schentag CT, Farewell VT, Gladman DD. Improved survival in psoriatic arthritis with calendar time. Arthritis Rheum. 2007;56(8):2708-2714. PubMed
10.Mease PJ, Coates LC. Considerations for the definition of remission criteria in psoriatic arthritis. Semin Arthritis Rheum. 2018;47(6):786-796. PubMed
11.National Institute for Health and Care Excellence. Spondyloarthritis in over 16s: diagnosis and management London((UK): NICE; 2017: https://www.nice.org.uk/guidance/ng65/resources/spondyloarthritis-in-over-16s-diagnosis-and-management-pdf-1837575441349. Accessed 2021 Feb 19.
12.Rodgers M, Epstein D, Bojke L, et al. Etanercept, infliximab and adalimumab for the treatment of psoriatic arthritis: a systematic review and economic evaluation. Health Technol Assess. 2011;15(10):i-xxi, 1-329. PubMed
13.National Institute for Health and Care Excellence. Etanercept, infliximab and adalimumab for the treatment of psoriatic arthritis. London (UK): NICE; 2010: https://www.nice.org.uk/guidance/ta199. Accessed 2021 Feb 19.
14.van Hout B, Janssen MF, Feng YS, et al. Interim scoring for the EQ-5D-5L: mapping the EQ-5D-5L to EQ-5D-3L value sets. Value Health. 2012;15(5):708-715. PubMed
15.DeltaPA. [Ottawa (ON)]: IQVIA; 2021: https://www.iqvia.com/. Accessed 2021 Feb 19.
16.Tam VC, Ko YJ, Mittmann N, et al. Cost-effectiveness of systemic therapies for metastatic pancreatic cancer. Curr Oncol. 2013;20(2):e90-e106. PubMed
17.Millar DR CP, Hill M, Pulfer A, PCN74 a service evaluation to compare secondary care resource use between xelox and folfox-6 regimens in the treatment of metastatic colorectal cancer (MCRC) from a UK national health service (NHS) perspective. Value Health. 2008;11(6):A483.
18.Rituxan Hycela [prescribing information]: 1,400 mg rituximab and 23,400 Units hyaluronidase human per 11.7 mL vial; 1,600 mg rituximab and 26,800 Units hyaluronidase human per 13.4 mL vial. San Francisco (CA): Genetech Inc; 2017: https://www.accessdata.fda.gov/drugsatfda_docs/label/2017/761064s000lbl.pdf. Accessed 2021 Feb 19.
19.Schedule of benefits for physician services under the Health Insurance Act: effective April 1, 2020. Toronto (ON): Ontario Ministry of Health; 2020: https://www.health.gov.on.ca/en/pro/programs/ohip/sob/physserv/sob_master20200306.pdf. Accessed 2021 Feb 19.
20.Schedule of benefits for laboratory services: effective July 1, 2020. Toronto (ON): Ontario Ministry of Health; 2020: https://www.health.gov.on.ca/en/pro/programs/ohip/sob/lab/lab_mn2020.pdf. Accessed 2021 Feb 19.
21.Goeree R, Chiva-Razavi S, Gunda P, et al. Cost-effectiveness analysis of secukinumab for the treatment of active psoriatic arthritis: a Canadian perspective. J Med Econ. 2018;21(2):163-173. PubMed
22.Levy AR, Davie AM, Brazier NC, et al. Economic burden of moderate to severe plaque psoriasis in Canada. Int J Dermatol. 2012;51(12):1432-1440. PubMed
23.PeriPharm Inc. Cost estimates for the economic model for RINVOQ (upadacitinib) in the management of psoriatic arthritis, in Quebec setting. Montreal (QC)2020.
24.CADTH Canadian Drug Expert Committee Final Recommendation: Apremilast (Otezla). Ottawa (ON): CADTH; 2015: https://cadth.ca/sites/default/files/cdr/complete/SR0437_complete_Otezla_PsA-Dec-21-15_e.pdf. Accessed 2021 Mar 10.
25.pan-Canadian Pharmaceutical Alliance. Otezla (Apremilast) - pCPA File Number: 20909. Toronto (ON): pCPA; 2017: https://www.pcpacanada.ca/negotiation/20909. Accessed 2021 Mar 10.
26.pan-Canadian Pharmaceutical Alliance. Otezla (Apremilast) - pCPA File Number: 21210. Toronto (ON): pCPA; 2021: https://www.pcpacanada.ca/negotiation/21210. Accessed 2021 Mar 10.
27.Network meta-analysis (NMA) of treatments for moderately to severely active psoriatic arthritis (Global Expanded NMAs) [internal sponsor's report]. In: Drug Reimbursement Review sponsor submission: Rinvoq (upadacitinib), 15 mg extended release tablets, oral Pointe-Claire (QC): Abbvie Corporation; 2020 Sep.
28.pan-Canadian Pharmaceutical Alliance. Stelara (Ustekinumab) - pCPA File Number: 20903. Toronto (ON): pCPA; 2014: https://www.pcpacanada.ca/negotiation/20903. Accessed 2021 Mar 18.
29.Saskatchewan Drug Plan: Appendix A Exception Drug Status Program. Regina (SK): Saskatchwean Drug Plan; 2021: https://formulary.drugplan.ehealthsask.ca/PDFs/APPENDIXA.pdf. Accessed 2021 Mar 18.
30.Methods for mapping between the EQ-5D-5L and the 3L for technology appraisal. Sheffield (UK): Decision Support Unit, ScHARR, University of Sheffield; 2017: http://nicedsu.org.uk/wp-content/uploads/2017/05/Mapping-5L-to-3L-DSU-report.pdf. Accessed 2020 May 19.
31.Position statement on use of the EQ-5D-5L value set for England (updated October 2019). 2019; https://www.nice.org.uk/about/what-we-do/our-programmes/nice-guidance/technology-appraisal-guidance/eq-5d-5l. Accessed 2020 May 19.
32.Janssen MF, Pickard AS, Golicki D, et al. Measurement properties of the EQ-5D-5L compared to the EQ-5D-3L across eight patient groups: a multi-country study. Quality of life research: an international journal of quality of life aspects of treatment, care and rehabilitation. 2013;22(7):1717-1727. PubMed
33.CADTH Common Drug Review Pharmacoeconomic Review Report: Ixekizumab (Taltz). Ottawa (ON): CADTH; 2018: https://cadth.ca/sites/default/files/cdr/pharmacoeconomic/SR0558_TaltzPsA_PE_Report.pdf. Accessed 2020 Mar 05.
34.Saskatchewan Drug Plan: search formulary. 2021; https://formulary.drugplan.ehealthsask.ca/SearchFormulary. Accessed Jan 27, 2021.
35.Taltz (ixekizumab): 80 mg/1.0 mL solution for injection [product monograph]. Toronto (ON): Eli Lilly Canada Inc; 2020 Oct 14: http://pi.lilly.com/ca/taltz-ca-pm.pdf. Accessed 2021 Jan 27.
36.List of medications. Quebec (QC): Régie de l'assurance maladie du Québec (RAMQ); 2020: https://www.ramq.gouv.qc.ca/en/about-us/list-medications. Accessed 2021 Jan 27.
37.Alberta Health Care Insurance Plan: medical price list as of 31 March 2020. Edmonton (AB): Government of Alberta; 2020: https://open.alberta.ca/dataset/30add047-29c2-4fc7-83b5-a8ab78605cdd/resource/48d0dd0b-bb33-478d-a85c-85a86d4555ad/download/health-somb-medical-price-list-2020-03.pdf. Accessed 2021 Jan 27.
38.Budget Impact Analysis [internal sponsor's report]. In: Drug Reimbursement Review sponsor submission: Rinvoq (upadacitinib), 15 mg extended release tablets, oral, Pointe-Claire (QC), Abbvie Corporation. 2020 Dec 21.
39.Statistics Canada. Table 17-10-0005-01 Population estimates on July 1st, by age and sex. Ottawa (ON): Statistics Canada; 2021: https://www150.statcan.gc.ca/t1/tbl1/en/tv.action?pid=1710000501. Accessed 2021 Feb 19.
Appendix 1: Cost Comparison Table
Note that this appendix has not been copy-edited.
The comparators presented in Table 10 have been deemed to be appropriate based on feedback from clinical expert(s). Comparators may be recommended (appropriate) practice or actual practice. Existing product listing agreements are not reflected in the table and as such, the table may not represent the actual costs to public drug plans.
Table 10: CADTH Cost Comparison Table for Psoriatic Arthritis
Treatment | Strength/ concentration | Form | Price ($) | Recommended dosage | Daily cost ($) | Annual cost ($) |
|---|---|---|---|---|---|---|
Upadacitinib (Rinvoq) | 15 mg | Tablet | 48.6800a | 15 mg daily | 48.68 | 17,768 |
TNF inhibitors | ||||||
Adalimumab (Humira) | 40 mg/0.8 mL | Pre-filled syringe or pen | 785.4500 | 40 mg every 2 weeks | 56.10 | 20,478 |
SEB Adalimumab (biosimilars) | 20 mg/0.4 mL 40 mg/0.8 mL | Pre-filled syringe or pen | 235.6350 471.2700 | 40 mg every 2 weeks | 33.66 | 12,287 |
Certolizumab pegol (Cimzia) | 200 mg/mL | Single-use pre-filled syringe | 664.5100b | 400 mg SC injection at weeks 0, 2 and 4, then 200 mg every 2 weeks or 400 mg every 4 weeks | First year: 52.80 Subsequent: 47.47 | First year: 19,271 Subsequent: 17,325 |
Etanercept (Enbrel) | 25 mg/vial | Vial | 202.9300 | 50 mg weekly (one 50 mg injection or two 25 mg injections on the same day or 3 or 4 days apart) | 57.98 | 21,163 |
50 mg/mL | Pre-filled syringe or auto-injector | 405.9850 | 58.00 | 21,169 | ||
SEB Etanercept (Erelzi) | 25 mg/0.5 mL 50 mg/mL | Pre-filled syringe or auto-injector | 120.5000 241.0000 | 34.43 | 12,566 | |
SEB Etanercept (Brenzys) | 50 mg/mL | Pre-filled syringe or auto-injector | 241.0000 | 50 mg weekly | 34.43 | 12,566 |
Golimumab SC (Simponi) | 50 mg/0.5 mL 100 mg/mL | Pre-filled syringe or Auto-injector | 1,555.5000b | 50 mg monthly | 51.14 | 18,666 |
Infliximab (Remicade) | 100 mg/vial | Vial | 977.0000b | 5 mg/kg initial dose followed with additional similar doses at 2 and 6 weeks after the first infusion, then every 8 weeks thereafter | First year: 107.07 Subsequent: 87.23 | First year: 39,080 Subsequent: 31,840 |
SEB Infliximab (Inflectra) | 100 mg/vial | Vial | 525.0000 | First year: 57.53 Subsequent: 46.88 | First year: 21,000 Subsequent: 17,109 | |
SEB Infliximab (Renflexis/ Avsola) | 100 mg/vial | Vial | 493.0000 | First year: 54.03 Subsequent: 44.02 | First year: 19,720 Subsequent: 16,067 | |
IL-17A inhibitors | ||||||
Secukinumab (Cosentyx) | 150 mg/mL | Pre-filled syringe, pen, or vial | 831.1100 | 150 mg SC at weeks 0,1,2,3, and 4 followed by monthly thereafter 300 mg with coexistent moderate to severe plaque psoriasis | First year: 36.43 to 72.86 Subsequent: 27.32 to 54.64 | First year: 13,298 to 26,596 Subsequent: 9,973 to 19,946 |
Ixekizumab (Taltz) | 80 mg/mL | Pre-filled syringe or pen | 1,621.7900 | 160 mg SC at week 0, followed by 80 mg every 4 weeksc 160 mg SC at week 0, followed by 80 mg weeks 2,4,6,8,10, and 12, then 80 mg every 4 weeksd | First year: 62.21 to 75.54 Subsequent: 57.92 | First year: 22,705 to 27,570 Subsequent: 20,138 |
IL-12/23 inhibitor | ||||||
Ustekinumab (Stelera) | 45 mg/0.5 mL 90 mg/mL | Pre-filled syringe or vial | 4,593.1400 4,593.1400 | Patients < 100 kg: 45 mg at weeks 0 and 4, then every 12 weeks thereafter Patients > 100 kg: 90 mg at weeks 0 and 4, then every 12 weeks thereafter | First year: 62.92 Subsequent: 54.68 | First year: 22,966 Subsequent: 19,958 |
Phosphodiesterase type 4 inhibitors | ||||||
Apremilast (Otezla) | 10 mg 20 mg 30 mg | Tablet | 18.9041e | 30 mg twice daily, following titration | 37.81 | 13,800 |
Conventional synthetic disease-modifying antirheumatic drugs | ||||||
Methotrexate (generics) | 2.5 mg 10 mg | Tablet | 0.6325 2.6505f | 7.5 to 25 mg per week until response achieved. Dose adjusted to optimal clinical response; 30 mg/week not ordinarily be exceeded | 0.27 to 1.08 | 99 to 396 |
20 mg/2 mL 50 mg/2 mL | Injection | 12.5000 8.9200 | 10 to 25 mg per week until response achieved. Dose adjusted to optimal clinical response; 25 mg/week not ordinarily be exceeded | 0.64 to 0.89 | 233 to 326 | |
Leflunomide (generics) | 10 mg 20 mg | Tablet | 2.6433 2.6433 | Loading: 100 mg daily for 3 days Maintenance: 20 mg daily | 2.64 to 2.73 | First year: 997 Subsequent: 965 |
Sulfasalazine (generics) | 500 mg | Tablet | 0.1804 | Titration: Week 1: 500 mg/day Week 2: 1,000 mg/day Week 3: 1,500 mg/day Maintenance: 2000 mg/day | First year: 0.70 Subsequent: 0.72 | First year: 256 Subsequent: 263 |
500 mg | EC tab | 0.2816 | First year: 1.09 Subsequent: 1.13 | First year: 399 Subsequent: 411 | ||
EC = enteric coated; SC = subcutaneous; SEB = subsequent entry biologic.
Note: All prices are from the Ontario Drug Benefit Formulary (accessed January 2021), unless otherwise indicated, and do not include dispensing fees. First year is assumed to be 52 weeks long (364 days), while subsequent years are 365 days. Products without a distinct initiation phase are reported as cost per 365-day year. All weight-based doses assume an average patient weight of 86.4 kg as per the SELECT-PsA 1 trial and wastage of excess medication in vials.3
aSponsor-submitted price.2
bSaskatchewan Formulary (accessed January 2021).34
cDosing regimen for adult PsA patients or PsA patients with coexistent mild plaque psoriasis.35
dDosing regimen for adult PsA patients with coexistent moderate to severe plaque psoriasis.35
eRégie de l’assurance maladie du Quebec formulary (accessed January 2021).36
fAlberta Formulary (accessed January 2021).37
Appendix 2: Submission Quality
Note that this appendix has not been copy-edited.
Description | Yes/No | Comments |
|---|---|---|
Population is relevant, with no critical intervention missing, and no relevant outcome missing | No | See CADTH appraisal section |
Model has been adequately programmed and has sufficient face validity | Yes | No comment |
Model structure is adequate for decision problem | Yes | No comment |
Data incorporation into the model has been done adequately (e.g., parameters for probabilistic analysis) | No | The model had limited flexibility and much of the background data were hard-coded |
Parameter and structural uncertainty were adequately assessed; analyses were adequate to inform the decision problem | No | See CADTH appraisal section |
The submission was well organized and complete; the information was easy to locate (clear and transparent reporting; technical documentation available in enough details) | Yes | No comment |
Appendix 3: Additional Information on the Submitted Economic Evaluation
Note that this appendix has not been copy-edited.
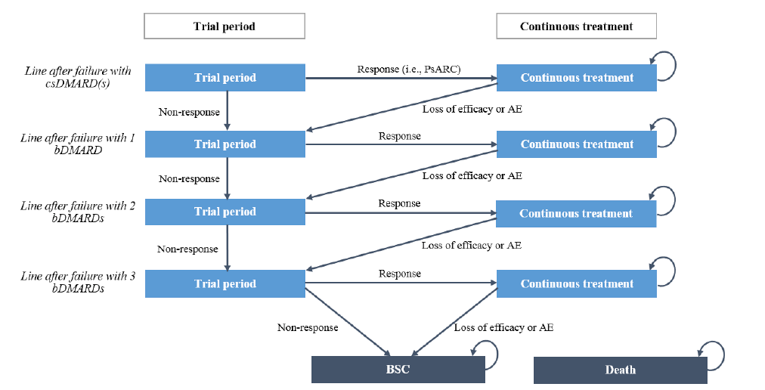
AE = adverse event; bDMARD = biologic disease-modifying antirheumatic drug; csDMARD = conventional synthetic disease-modifying antirheumatic drug; PsARC = Psoriatic Arthritis Response Criteria.
Source: Sponsor’s pharmacoeconomic submission.2
Table 12: Sponsor-Included Treatment Sequencing
Initial drug | After failure of 1 biologic | After failure of 2 biologics | After failure of 3 biologics |
|---|---|---|---|
Biologic-naive population (failure of 1 csDMARD) | |||
Upadacitinib 15 mg | Anti-TNF (etanercept) | IL-17 (secukinumab 150 or 300 mg) | BSC |
Adalimumab | IL-17 (secukinumab 150 or 300 mg) | IL-12/23 (ustekinumab) | BSC |
Apremilast | Anti-TNF (etanercept) | IL-17 (secukinumab 150 or 300 mg) | BSC |
Certolizumab pegol | IL-17 (secukinumab 150 or 300 mg) | IL-12/23 (ustekinumab) | BSC |
Etanercept | IL-17 (secukinumab 150 or 300 mg) | IL-12/23 (ustekinumab) | BSC |
Golimumab SC | IL-17 (secukinumab 150 or 300 mg) | IL-12/23 (ustekinumab) | BSC |
Infliximab | IL-17 (secukinumab 150 or 300 mg) | IL-12/23 (ustekinumab) | BSC |
Ixekizumab q.4.w. | Anti-TNF (etanercept) | IL-12/23 (ustekinumab) | BSC |
Secukinumab 150 or 300 mg | Anti-TNF (etanercept) | IL-12/23 (ustekinumab) | BSC |
Ustekinumab | IL-17 (secukinumab 150 or 300 mg) | Anti-TNF (etanercept) | BSC |
Biologic-experienced population (failure of 1 bDMARD) | |||
Upadacitinib 15 mg | NA | Anti-TNF (etanercept) | BSC |
Ixekizumab | NA | IL-12/23 (ustekinumab) | BSC |
Secukinumab 150 or 300 mg | NA | IL-12/23 (ustekinumab) | BSC |
Ustekinumab | NA | IL-17 (secukinumab 150 or 300 mg) | BSC |
bDMARD = biologic disease-modifying antirheumatic drug; BSC = best supportive care; csDMARD = conventional synthetic disease-modifying antirheumatic drug; IL = interleukin; NA = not applicable; q.4.w. = every 4 weeks; SC = subcutaneous; TNF = tumour necrosis factor.
Source: Adapted from the sponsor’s pharmacoeconomic submission.2
Detailed Results of the Sponsor’s Base Case
Table 13: Disaggregated Costs for Sponsor’s Base-Case Analyses
Drug | Drug costs ($) | Administration costs ($) | Monitoring costs ($) | AE costs ($) | Disease management costs ($) | Total costs ($) |
|---|---|---|---|---|---|---|
Biologic-naive population (failure of 1 csDMARD) | ||||||
Apremilast | 154,398 | 29 | 5,520 | 2,383 | 289,675 | 452,004 |
Etanercept | 172,353 | 44 | 5,680 | 2,440 | 286,122 | 466,638 |
Secukinumab | 173,456 | 44 | 5,655 | 2,387 | 285,178 | 466,720 |
Upadacitinib | 180,882 | 28 | 6,109 | 3,367 | 278,101 | 468,487 |
Infliximab | 182,966 | 6,480 | 5,694 | 1,923 | 280,011 | 477,074 |
Ixekizumab | 180,626 | 45 | 5,432 | 2,110 | 289,076 | 477,289 |
Ustekinumab | 185,638 | 45 | 5,842 | 2,256 | 284,099 | 477,880 |
Certolizumab pegol | 188,012 | 44 | 5,451 | 2,413 | 292,241 | 488,161 |
Adalimumab | 194,245 | 45 | 5,350 | 2,033 | 293,951 | 495,623 |
Golimumab | 201,351 | 44 | 5,680 | 1,962 | 288,701 | 497,738 |
Biologic-experienced population (failure of 1 bDMARD) | ||||||
Upadacitinib | 122,391 | 15 | 4,313 | 2,573 | 315,140 | 444,432 |
Secukinumab | 129,308 | 31 | 3,674 | 1,099 | 325,136 | 459,248 |
Ustekinumab | 130,589 | 31 | 3,677 | 1,047 | 324,978 | 460,322 |
Ixekizumab | 137,044 | 31 | 3,438 | 808 | 328,218 | 467,540 |
bDMARD = biologic disease-modifying antirheumatic drug; csDMARD = conventional synthetic disease-modifying antirheumatic drug; AE = adverse event.
Table 14: Disaggregated QALYs for Sponsor’s Base-Case Analyses
Drug | After failure of 1 csDMARD | After failure of 1 bDMARD | After failure of 2 bDMARDs | BSC | Total QALYs |
|---|---|---|---|---|---|
Biologic-naive population (failure of 1 csDMARD) | |||||
Apremilast | 2.050 | 2.978 | 2.128 | 4.641 | 11.798 |
Etanercept | 3.310 | 2.338 | 1.578 | 4.662 | 11.889 |
Secukinumab | 2.709 | 2.912 | 1.582 | 4.676 | 11.878 |
Upadacitinib | 2.819 | 2.903 | 2.064 | 4.455 | 12.241 |
Infliximab | 3.440 | 2.333 | 1.575 | 4.647 | 11.994 |
Ixekizumab | 2.353 | 2.957 | 1.611 | 4.789 | 11.710 |
Ustekinumab | 2.370 | 2.415 | 2.624 | 4.580 | 11.990 |
Certolizumab pegol | 2.718 | 2.377 | 1.609 | 4.782 | 11.486 |
Adalimumab | 2.529 | 2.395 | 1.622 | 4.834 | 11.380 |
Golimumab | 3.079 | 2.338 | 1.578 | 4.661 | 11.655 |
Biologic-experienced population (failure of 1 bDMARD) | |||||
Upadacitinib | N/a | 2.449 | 2.920 | 5.317 | 10.686 |
Secukinumab | N/a | 2.638 | 1.813 | 5.617 | 10.068 |
Ustekinumab | N/a | 2.013 | 2.441 | 5.617 | 10.071 |
Ixekizumab | N/a | 2.385 | 1.838 | 5.728 | 9.951 |
bDMARD = biologic disease-modifying antirheumatic drug; csDMARD = conventional synthetic disease-modifying antirheumatic drug; BSC = best supportive care; QALY = quality-adjusted life-years.
Table 15: Detailed Results of Sponsor’s Base-Case Analyses
Drug | Total costs ($) | Total QALYs | ICER vs. etanercept ($ per QALY) | Sequential ICER ($ per QALY) |
|---|---|---|---|---|
Biologic-naive population (failure of 1 csDMARD) | ||||
Apremilast | 452,004 | 11.798 | Reference | Reference |
Etanercept | 466,638 | 11.889 | 161,527 | Extendedly dominated through apremilast and upadacitinib |
Secukinumab | 466,720 | 11.878 | 183,265 | Dominated by etanercept |
Upadacitinib | 468,487 | 12.241 | 37,233 | 37,233 |
Infliximab | 477,074 | 11.994 | 127,711 | Dominated by upadacitinib |
Ixekizumab | 477,289 | 11.710 | Dominated by apremilast | Dominated by upadacitinib |
Ustekinumab | 477,880 | 11.990 | 135,122 | Dominated by upadacitinib |
Certolizumab pegol | 488,161 | 11.486 | Dominated by apremilast | Dominated by upadacitinib |
Adalimumab | 495,623 | 11.380 | Dominated by apremilast | Dominated by upadacitinib |
Golimumab | 497,738 | 11.655 | Dominated by apremilast | Dominated by upadacitinib |
Biologic-experienced population (failure of 1 bDMARD) | ||||
Upadacitinib | 444,432 | 10.686 | Reference | Reference |
Secukinumab | 459,248 | 10.068 | Dominated by upadacitinib | Dominated by upadacitinib |
Ustekinumab | 460,322 | 10.071 | Dominated by upadacitinib | Dominated by upadacitinib |
Ixekizumab | 467,540 | 9.951 | Dominated by upadacitinib | Dominated by upadacitinib |
bDMARD = biologic disease-modifying antirheumatic drug; csDMARD = conventional synthetic disease-modifying antirheumatic drug; ICER = incremental cost-effectiveness ratio; QALY = quality-adjusted life-year.
Appendix 4: Additional Details on the CADTH Reanalyses
Note that this appendix has not been copy-edited.
Detailed Results of CADTH Reanalyses
Table 16: Results of CADTH Reanalysis 1
Drug | Total costs ($) | Total QALYs | ICER vs. reference ($ per QALY) | Sequential ICER ($ per QALY) |
|---|---|---|---|---|
Biologic-naive population (failure of 1 csDMARD) | ||||
Etanercept | 466,638 | 11.889 | Reference | Reference |
Secukinumab | 466,720 | 11.878 | Dominated by etanercept | Dominated by etanercept |
Upadacitinib | 468,487 | 12.241 | 5,249 | 5,249 |
Ixekizumab | 477,074 | 11.994 | 98,725 | Dominated by upadacitinib |
Ustekinumab | 477,289 | 11.710 | Dominated by etanercept | Dominated by upadacitinib |
Infliximab | 477,880 | 11.990 | 111,412 | Dominated by upadacitinib |
Certolizumab pegol | 488,161 | 11.486 | Dominated by etanercept | Dominated by upadacitinib |
Adalimumab | 495,623 | 11.380 | Dominated by etanercept | Dominated by upadacitinib |
Golimumab | 497,738 | 11.655 | Dominated by etanercept | Dominated by upadacitinib |
bDMARD = biologic disease-modifying antirheumatic drug; csDMARD = conventional synthetic disease-modifying antirheumatic drug; ICER = incremental cost-effectiveness ratio; QALY = quality-adjusted life-year.
Note: Biologic-experienced analysis not provided as apremilast was not included for this population.
Table 17: Results of CADTH Reanalysis 2
Drug | Total costs ($) | Total QALYs | ICER vs. reference ($ per QALY) | Sequential ICER ($ per QALY) |
|---|---|---|---|---|
Biologic-naive population (failure of 1 csDMARD) | ||||
Apremilast | 452,004 | 11.798 | Reference | Reference |
Etanercept | 466,638 | 11.889 | 161,527 | Extendedly dominated through apremilast and upadacitinib |
Secukinumab | 466,720 | 11.878 | 183,265 | Dominated by etanercept |
Upadacitinib | 468,487 | 12.241 | 37,233 | 37,233 |
Ixekizumab | 477,289 | 11.710 | Dominated by apremilast | Dominated by etanercept, upadacitinib |
Ustekinumab | 477,880 | 11.990 | 135,122 | Dominated by upadacitinib |
Infliximab | 487,385 | 11.994 | 180,240 | Dominated by upadacitinib |
Certolizumab pegol | 488,161 | 11.486 | Dominated by apremilast | Dominated by etanercept, upadacitinib |
Adalimumab | 495,623 | 11.380 | Dominated by apremilast | Dominated by etanercept, upadacitinib |
Golimumab | 497,738 | 11.655 | Dominated by apremilast | Dominated by etanercept, upadacitinib |
Biologic-experienced population (failure of 1 bDMARD) | ||||
Upadacitinib | 444,432 | 10.686 | Reference | Reference |
Secukinumab | 459,248 | 10.068 | Dominated by upadacitinib | Dominated by upadacitinib |
Ustekinumab | 460,322 | 10.071 | Dominated by upadacitinib | Dominated by upadacitinib |
Ixekizumab | 469,540 | 9.951 | Dominated by upadacitinib | Dominated by upadacitinib |
bDMARD = biologic disease-modifying antirheumatic drug; csDMARD = conventional synthetic disease-modifying antirheumatic drug; ICER = incremental cost-effectiveness ratio; QALY = quality-adjusted life-year.
Table 18: Results of CADTH Reanalysis 3
Drug | Total costs ($) | Total QALYs | ICER vs. reference ($ per QALY) | Sequential ICER ($ per QALY) |
|---|---|---|---|---|
Biologic-naive population (failure of 1 csDMARD) | ||||
Etanercept | 409,227 | 9.483 | Reference | Reference |
Apremilast | 411,234 | 8.560 | Dominated by etanercept | Dominated by etanercept |
Infliximab | 419,754 | 9.595 | 93,490 | 93,490 |
Secukinumab | 424,228 | 9.026 | Dominated by etanercept | Dominated by etanercept, infliximab |
Upadacitinib | 428,460 | 9.110 | Dominated by etanercept | Dominated by etanercept, infliximab |
Certolizumab pegol | 429,976 | 9.025 | Dominated by etanercept | Dominated by etanercept, infliximab |
Ixekizumab | 434,282 | 8.800 | Dominated by etanercept | Dominated by etanercept, infliximab |
Ustekinumab | 435,276 | 8.808 | Dominated by etanercept | Dominated by etanercept, infliximab |
Adalimumab | 437,092 | 8.896 | Dominated by etanercept | Dominated by etanercept, infliximab |
Golimumab | 440,333 | 9.249 | Dominated by etanercept | Dominated by etanercept, infliximab |
Biologic-experienced population (failure of 1 bDMARD) | ||||
Secukinumab | 427,117 | 8.940 | Reference | Reference |
Ustekinumab | 430,512 | 8.546 | Dominated by secukinumab | Dominated by secukinumab |
Upadacitinib | 430,532 | 8.790 | Dominated by secukinumab | Dominated by secukinumab |
Ixekizumab | 437,037 | 8.804 | Dominated by secukinumab | Dominated by secukinumab |
bDMARD = biologic disease-modifying antirheumatic drug; csDMARD = conventional synthetic disease-modifying antirheumatic drug; ICER = incremental cost-effectiveness ratio; QALY = quality-adjusted life-year; vs. = versus.
Scenario Analyses
Table 19: Scenario 1 — Revised Price of Adalimumab
Drug | Total costs | Total QALYs | ICER vs. adalimumab ($ per QALY) | Sequential ICER ($ per QALY) |
|---|---|---|---|---|
Biologic-naive population (failure of 1 csDMARD) | ||||
Adalimumab | 406,139 | 8.896 | Reference | Reference |
Etanercept | 409,227 | 9.483 | 5,263 | 5,263 |
Secukinumab | 424,228 | 9.026 | 139,039 | Dominated by etanercept |
Upadacitinib | 428,460 | 9.110 | 104,207 | Dominated by etanercept |
Certolizumab pegol | 429,976 | 9.025 | 184,633 | Dominated by etanercept |
Infliximab | 430,065 | 9.595 | 34,219 | 185,071 |
Ixekizumab | 434,282 | 8.800 | Dominated by adalimumab | Dominated by etanercept |
Ustekinumab | 435,276 | 8.808 | Dominated by adalimumab | Dominated by etanercept |
Golimumab | 440,333 | 9.249 | 96,730 | Dominated by etanercept |
csDMARD = conventional synthetic disease-modifying antirheumatic drug; ICER = incremental cost-effectiveness ratio; QALY = quality-adjusted life-years; vs. = versus.
Note: biologic-experienced analysis not provided as adalimumab was not included for this population.
Table 20: Scenario 2 — PsARC Outcome at 24 weeks
Drug | Total costs | Total QALYs | ICER vs. adalimumab ($ per QALY) | Sequential ICER ($ per QALY) |
|---|---|---|---|---|
Biologic-naive population (failure of 1 csDMARD) | ||||
Etanercept | 408,643 | 9.490 | Reference | Reference |
Secukinumab | 426,208 | 9.007 | Dominated by etanercept | Dominated by etanercept |
Upadacitinib | 430,462 | 9.430 | Dominated by etanercept | Dominated by etanercept |
Certolizumab pegol | 430,491 | 9.222 | Dominated by etanercept | Dominated by etanercept |
Infliximab | 431,474 | 9.317 | Dominated by etanercept | Dominated by etanercept |
Ustekinumab | 434,066 | 8.836 | Dominated by etanercept | Dominated by etanercept |
Golimumab | 434,488 | 9.299 | Dominated by etanercept | Dominated by etanercept |
Ixekizumab | 438,473 | 9.001 | Dominated by etanercept | Dominated by etanercept |
Adalimumab | 439,160 | 9.049 | Dominated by etanercept | Dominated by etanercept |
Biologic-experienced population (failure of 1 bDMARD)a | ||||
Upadacitinib | 429,259 | 8.828 | Reference | Reference |
Ustekinumab | 436,855 | 8.853 | Dominated by upadacitinib | Dominated by upadacitinib |
Ixekizumab | 443,608 | 9.140 | Dominated by upadacitinib | Dominated by upadacitinib |
bDMARD = biologic disease-modifying antirheumatic drug; csDMARD = conventional synthetic disease-modifying antirheumatic drug; ICER = incremental cost-effectiveness ratio; QALY = quality-adjusted life-year.
aThe results are uncertain as running this analysis removes secukinumab (the treatment that domination upadacitinib) from consideration due to an apparent lack of data.
Appendix 5: Submitted Budget Impact Analysis and CADTH Appraisal
Note that this appendix has not been copy-edited.
Table 21: CADTH Summary Findings from the Sponsor’s Budget Impact Analysis
Key Take-Aways of the BIA |
|---|
|
Summary of Sponsor’s Budget Impact Analysis
The sponsor submitted a claims-based budget impact assessment to estimate the number of PsA patients expected to be eligible for upadacitinib based upon historical drug purchasing behaviour.38 The claims-based approach derived the number of active spondylarthritis beneficiaries using the IQVIA GPM database over a 3-year time horizon based upon the number of claims filed for etanercept, infliximab, certolizumab pegol, secukinumab, adalimumab, golimumab, ustekinumab, and ixekizumab over January 2017 to September 2020. The sponsor estimated that 55% of spondylarthritis patients would be diagnosed with PsA. Key inputs to the BIA are documented in Table 23.
Data for the model were obtained from various sources including: SELECT-PsA1 and SELECT-PsA2 trials,3,4 Sponsor’s internal research, AbbVie Care Patient Support Program, and Statistics Canada.39 The sponsor included drug costs as well as markups, dispensing fees, and co-payments. An annual growth of 8.7% was applied based on the IQVIA GPM data (2019 to 2020) for patients using bDMARDs. The sponsor stated a conservative approach was adopted where the model only considers maintenance dosing which biases results against upadacitinib which does not require an induction period. The sponsor assumed market share uptake for upadacitinib would come proportionally from currently reimbursed therapies.
Table 22: Summary of Key Model Parameters
Parameter | Sponsor’s estimate (reported as year 1 / year 2 / year 3 if appropriate) |
|---|---|
Target population | |
Population plan size (2020) | 39,387/40,043/40,699 |
Proportion of SpA patients diagnosed with PsA | 55% |
Proportion of PsA patients covered by public drug programs | 52.7% |
Number of patients eligible for drug under review | 9,099/9,884/10,737 |
Market uptake (3 years) | |
Uptake (reference scenario) | |
Etanercept (Enbrel) | 10.8%/10.4%/10.0% |
Etanercept (Erelzi) | 3.0%/3.1%/3.2% |
Etanercept (Brenzys) | 3.7%/3.8%/3.9% |
Infliximab (Remicade) | 8.1%/7.9%/7.6% |
Infliximab (Inflectra) | 2.6%/2.7%/2.7% |
Infliximab (Renflexis) | 1.4%/1.4%/1.5% |
Infliximab (Avsola) | 0.0%/0.0%/0.0% |
Certolizumab Pegol (Cimzia) | 3.4%/3.4%/3.4% |
Secukinumab (Cosentyx) | 10.6%/10.8%/11.0% |
Adalimumab (Humira) | 31.2%/31.1%/31.0% |
Golimumab (Simponi) | 23.2%/23.4%/23.6% |
Ustekinumab (Stelara) | 0.2%/0.2%/0.2% |
Ixekizumab (Taltz) | 1.8%/1.9%/1.9% |
Uptake (new drug scenario) | |
Upadacitinib (Rinvoq) | 1.6%/4.0%/5.8% |
Etanercept (Enbrel) | 10.6%/10.0%/9.4% |
Etanercept (Erelzi) | 3.0%/3.0%/3.0% |
Etanercept (Brenzys) | 3.6%/3.7%/3.7% |
Infliximab (Remicade) | 8.0%/7.5%/7.1% |
Infliximab (Inflectra) | 2.6%/2.5%/2.5% |
Infliximab (Renflexis) | 1.4%/1.4%/1.4% |
Infliximab (Avsola) | 0.0%/0.0%/0.0% |
Certolizumab Pegol (Cimzia) | 3.3%/3.2%/3.2% |
Secukinumab (Cosentyx) | 10.4%/10.4%/10.4% |
Adalimumab (Humira) | 30.7%/29.8%/29.2% |
Golimumab (Simponi) | 22.9%/22.5%/22.3% |
Ustekinumab (Stelara) | 0.1%/0.1%/0.1% |
Ixekizumab (Taltz) | 1.8%/1.8%/1.8% |
Annual cost of maintenance treatment (per patient) | |
Upadacitinib | $17,768 |
Etanercept (Enbrel) | $21,169 |
Etanercept (Erelzi) | $12,566 |
Etanercept (Brenzys) | $12,566 |
Infliximab (Remicade) | $32,184a |
Infliximab (Inflectra) | $17,109a |
Infliximab (Renflexis) | $16,067a |
Infliximab (Avsola) | $16,067a |
Certolizumab Pegol (Cimzia) | $17,325 |
Secukinumab (Cosentyx) | $16,057b |
Adalimumab (Humira) | $20,478 |
Golimumab (Simponi) | $18,622 |
Ustekinumab (Stelara) | $19,958 |
Ixekizumab (Taltz) | $21,141 |
PsA = psoriatic arthritis; SpA = spondylarthritis.
aCalculated based on a mean patient weight of 87 kg as per the SELECT-PsA1 and SELECT-PsA2 trials.3,4
bCalculated based on a weighted average with 61% and 39% of patients receiving the 300 mg and 150 mg doses, respectively.
Source: Adapted from sponsor’s pharmacoeconomic submission.38
Summary of the Sponsor’s Budget Impact Analysis Results
Results of the sponsor’s base case revealed that the incremental cost savings associated with the reimbursement of upadacitinib in adult patients with PsA are expected to be $327,010 in Year 1, $860,130 in Year 2, and $1,312,200 in Year 3. The total 3-year budget impact for reimbursing upadacitinib was estimated to be a cost saving of $2,499,340.
CADTH Appraisal of the Sponsor’s Budget Impact Analysis
CADTH identified several key limitations to the sponsor’s analysis that have notable implications on the results of the business impact analysis:
Population growth for PsA is uncertain: The sponsor included an annual increase in the number of patients likely to use a bDMARD according to claims data from 2019 to 2020. However, claims were for patients with spondylarthritis, and it was unclear if there would be an expected difference in bDMARD usage between PsA or ankylosing spondylitis patients. Further, as noted by the sponsor, the annual increase in claims were higher for the time period before 2019, indicating the sponsor may be potentially underestimating bDMARD uptake.
CADTH undertook a scenario analyses which explored no population growth.
Uncertain generalizability and assumptions regarding market share capture for upadacitinib: The sponsor aligned the budget impact analysis population according to the Health Canada proposed indication, however, results stratified by biologic-naive and biologic-experienced populations were not explored. Given the distinction of these subgroups which are associated with differences in relevant comparators, it is unclear if the sponsor assumptions used in the BIA would be reasonable to apply to both populations (e.g., equal market share uptake from all comparators).
Further it is unclear if uptake of upadacitinib would remain similar between the biologic-naive and biologic-experienced patients, as the latter which is associated with fewer treatment options. If the majority of market share uptake is from adalimumab and etanercept (as noted by the clinical expert consulted by CADTH), the sponsors assumption of equal uptake from all comparators may not accurately represent the anticipated budget impact, particularly in the biologic-naive population.
Lastly, it would be inappropriate for upadacitinib to obtain market share from name brand treatments with available biosimilars (i.e., Remicade, Enbrel, Humira) for newly initiated patients as the public drug programs are likely to only provide funding for the biosimilar treatment. Therefore, the budget impact of upadacitinib is likely underestimated when market share uptake from Remicade and Enbrel is included, however due to structural limitations of the model, CADTH is unable to distinguish the incident and prevalent populations and limit uptake to the biosimilar or determine the accuracy of assumptions regarding treatment displacement.
Due to structural limitations, CADTH is unable to explore the impact of upadacitinib according to biologic subgroups or incident and prevalent patients. CADTH explored the impact of upadacitinib uptake from etanercept (generic) and adalimumab as part of scenario analyses.
Cost of adalimumab: Between the time at which the sponsor submitted upadacitinib and the review being completed, the price of adalimumab changed. Biosimilar adalimumab became available at 60% of the price of branded adalimumab (Humira). As such, the cost of adalimumab moving forward is overestimated.
CADTH conducted reanalyses using the revised price of adalimumab.
Additional limitations were identified, but were not considered to be key limitations:
Inclusion of patient co-payment: The sponsor included patient co-payments as part of the base-case analysis, however there is uncertainty if patients will have previously reached the co-payment upper limits through other medications (e.g., concomitant treatment such as methotrexate). As such the inclusion of patient co-payments likely underestimates the introduction of upadacitinib, however given that the maximum co-payments are likely limited, there is unlikely to be a substantial impact on the budget impact.
As part of the CADTH base case, patient co-payments were removed and explored in scenario analyses only.
CADTH Reanalyses of the Budget Impact Analysis
CADTH revised the sponsor base case by excluding patient co-payments (Table 23) and the final analysis was conducted with and without pharmacy markups and dispensing fees (Table 24); a more detailed breakdown is presented in Table 25.
Table 23: CADTH Revisions to the Submitted Budget Impact Analysis
Stepped analysis | Sponsor’s value or assumption | CADTH value or assumption |
|---|---|---|
Corrections to sponsor’s base case | ||
1. Patient co-payment | Included | Excluded |
The CADTH reanalysis results were aligned with the sponsor findings (Table 24). However, due to the structural limitations noted above related to patient subgroups and market share uptake, these findings are associated with a high degree of uncertainty, and it cannot be definitively confirmed that upadacitinib would remain cost-saving when introduced.
Table 24: Summary of the CADTH Reanalyses of the Budget Impact Analysis
Stepped analysis | Three-year total | |
|---|---|---|
Drug costs only | Dispensing fees and markups included | |
Submitted base case | −$2,302,801 | −$2,499,340 |
Corrected base case | −$2,216,243 | −$2,437,623 |
Table 25: Detailed Breakdown of the CADTH Reanalyses of the Budget Impact Analysis
Stepped analysis | Scenario | Year 0 (current situation) | Year 1 | Year 2 | Year 3 | Three-year totala |
|---|---|---|---|---|---|---|
Submitted base case | Reference | $166,519,845 | $179,721,177 | $194,526,999 | $210,573,950 | $584,822,126 |
New drug | $166,519,845 | $179,394,167 | $193,666,869 | $209,261,750 | $582,322,786 | |
Budget impact | $0 | –$327,010 | −$860,130 | −$1,312,200 | –$2,499,340 | |
Corrected base case | Reference | $177,544,097 | $191,671,444 | $207,502,947 | $224,663,778 | $623,838,169 |
New drug | $177,544,097 | $191,352,056 | $206,663,710 | $223,384,779 | $621,400,546 | |
Budget impact | $0 | –$319,388 | −$839,237 | −$1,278,999 | −$2,437,623 | |
Scenario 1: Exclude markup and dispensing fees | Reference | $166,629,604 | $179,875,405 | $194,715,220 | $210,800,160 | $585,390,785 |
New drug | $166,629,604 | $179,584,241 | $193,951,601 | $209,638,700 | $583,174,541 | |
Budget impact | $0 | –$291,164 | −$763,619 | −$1,161,461 | −$2,216,243 | |
Scenario 2: No market growth | Reference | $177,544,097 | $176,450,138 | $175,854,479 | $175,277,752 | $527,582,369 |
New drug | $177,544,097 | $176,156,115 | $175,143,249 | $174,279,918 | $525,579,282 | |
Budget impact | $0 | –$294,023 | −$711,230 | −$997,834 | −$2,003,087 | |
Scenario 3: Biosimilar price of adalimumab | Reference | $154,548,024 | $166,794,999 | $180,596,085 | $195,557,326 | $542,948,410 |
New drug | $154,548,024 | $166,873,635 | $180,833,123 | $195,966,501 | $543,673,259 | |
Budget impact | $0 | $78,636 | $237,037 | $409,176 | $724,849 | |
Scenario 4: All infliximab use is biosimilara (not branded) | Reference | $166,471,366 | $180,293,224 | $195,593,313 | $212,200,178 | $588,086,715 |
New drug | $166,471,366 | $180,155,888 | $195,230,461 | $211,644,068 | $587,030,418 | |
Budget impact | $0 | −$137,336 | −$362,852 | −$556,110 | −$1,056,298 | |
Scenario 5: All etanercept use is biosimilar (not branded) | Reference | $169,099,632 | $183,233,234 | $198,650,979 | $215,378,613 | $597,262,827 |
New drug | $169,099,632 | $183,048,858 | $198,165,821 | $214,638,154 | $595,852,833 | |
Budget impact | $0 | −$184,376 | −$485,158 | −$740,459 | −$1,409,994 | |
Scenario 6: Combined scenarios 3, 4 and 5 | Reference | $135,030,828 | $146,978,569 | $159,834,483 | $173,808,561 | $480,621,613 |
New drug | $135,030,828 | $147,374,268 | $160,901,984 | $175,479,165 | $483,755,417 | |
Budget impact | $0 | $395,698 | $1,067,501 | $1,670,604 | $3,133,804 |
Note: Including markup and dispensing fees.
aMidpoint of the biosimilar price of Inflectra and Renflexis.
ISSN: 2563-6596
Disclaimer: The information in this document is intended to help Canadian health care decision-makers, health care professionals, health systems leaders, and policy-makers make well-informed decisions and thereby improve the quality of health care services. While patients and others may access this document, the document is made available for informational purposes only and no representations or warranties are made with respect to its fitness for any particular purpose. The information in this document should not be used as a substitute for professional medical advice or as a substitute for the application of clinical judgment in respect of the care of a particular patient or other professional judgment in any decision-making process. The Canadian Agency for Drugs and Technologies in Health (CADTH) does not endorse any information, drugs, therapies, treatments, products, processes, or services.
While care has been taken to ensure that the information prepared by CADTH in this document is accurate, complete, and up-to-date as at the applicable date the material was first published by CADTH, CADTH does not make any guarantees to that effect. CADTH does not guarantee and is not responsible for the quality, currency, propriety, accuracy, or reasonableness of any statements, information, or conclusions contained in any third-party materials used in preparing this document. The views and opinions of third parties published in this document do not necessarily state or reflect those of CADTH.
CADTH is not responsible for any errors, omissions, injury, loss, or damage arising from or relating to the use (or misuse) of any information, statements, or conclusions contained in or implied by the contents of this document or any of the source materials.
This document may contain links to third-party websites. CADTH does not have control over the content of such sites. Use of third-party sites is governed by the third-party website owners’ own terms and conditions set out for such sites. CADTH does not make any guarantee with respect to any information contained on such third-party sites and CADTH is not responsible for any injury, loss, or damage suffered as a result of using such third-party sites. CADTH has no responsibility for the collection, use, and disclosure of personal information by third-party sites.
Subject to the aforementioned limitations, the views expressed herein are those of CADTH and do not necessarily represent the views of Canada’s federal, provincial, or territorial governments or any third party supplier of information.
This document is prepared and intended for use in the context of the Canadian health care system. The use of this document outside of Canada is done so at the user’s own risk.
This disclaimer and any questions or matters of any nature arising from or relating to the content or use (or misuse) of this document will be governed by and interpreted in accordance with the laws of the Province of Ontario and the laws of Canada applicable therein, and all proceedings shall be subject to the exclusive jurisdiction of the courts of the Province of Ontario, Canada.
The copyright and other intellectual property rights in this document are owned by CADTH and its licensors. These rights are protected by the Canadian Copyright Act and other national and international laws and agreements. Users are permitted to make copies of this document for non-commercial purposes only, provided it is not modified when reproduced and appropriate credit is given to CADTH and its licensors.
About CADTH: CADTH is an independent, not-for-profit organization responsible for providing Canada’s health care decision-makers with objective evidence to help make informed decisions about the optimal use of drugs, medical devices, diagnostics, and procedures in our health care system.
Funding: CADTH receives funding from Canada’s federal, provincial, and territorial governments, with the exception of Quebec.