CADTH Health Technology Review
Pharmacogenomic Testing in Depression: A 2021 Update
Rapid Review
Authors: Nazia Darvesh, Jennifer Horton, Mê-Linh Lê
Abbreviations
AD
antidepressant
AE
adverse event
AMSTAR 2
A MeaSurement Tool to Assess systematic Reviews 2
BDI
Beck Depression Inventory
CGI/CGI-I/CGI-S
Clinical Global Impression rating scales
CGI-E
Clinical Global Impression – Efficacy
GAD-7
Generalized Anxiety Disorder – 7-items scale
HAM-D
Hamilton Depression Rating Scale
HTA
health technology assessment
LOS
length of stay
MA
meta-analysis
MDD
major depressive disorder
NRS
non-randomized study
PGx
pharmacogenomic (also referred to as pharmacogenetic)
PHQ-9
Patient Health Questionnaire
PRISMA
Preferred Reporting Items for Systematic Reviews and Meta-Analyses
PTSD
posttraumatic stress disorder
QIDS
Quick Inventory of Depressive Symptomatology
RCT
randomized controlled trial
SIGH
Structured Interview Guide for the Hamilton rating scale
SR
systematic review
Key Messages
An update to a 2020 CADTH Rapid Review was conducted to capture new literature published since 2019 examining the effectiveness of drug treatment informed by genetic testing compared to usual care for adults with depression.
Eleven studies were identified: 1 systematic review, 1 health technology assessment, 4 randomized controlled trials reported in 5 publications, 1 non-randomized study, 1 cohort study with historical control, and 2 uncontrolled before-and-after studies.
Similar to the conclusions of the 2020 CADTH report, the effectiveness of gene testing for treating depression was unclear. In patients with depression, some studies showed that there were improvements in the clinical effectiveness outcomes in those who received gene testing and other studies showed that there was no difference in outcomes between those who received gene testing and those who did not. No studies showed that gene testing resulted in worse outcomes compared to those who did not receive gene testing.
In the current report, the were several limitations across studies such as poor design, inclusion of subjectively measured outcomes, small sample sizes, and a focus on hospital settings ― all of which may not be generalizable to other populations.
Context and Policy Issues
Depression, a major cause of functional disability, affects 5% of adults worldwide and is seen in more women than men.1,2 Depression can refer to a heterogeneous group of disease processes such as a syndrome with varied symptoms and signs (e.g., major depression, minor depression); a mood state characterized by feelings of despair, sadness, anxiety, emptiness, hopelessness, or no feelings; or a mental disorder presenting as a clinical condition (e.g., bipolar disorder, major depressive disorder [MDD], substance/medication-induced depressive disorder, schizophrenia, depressive disorder).1,2 Factors that may contribute to the development of depression include brain chemistry, stress, and genetics.3 Treatments for depression include psychotherapy, psychoeducation, pharmacotherapy (e.g., antidepressants [ADs]), or brain stimulation ― all of which can be used alone or in combination with each other.3 Many patients are prescribed medication for depression; however, this may result in patients experiencing adverse drug reactions before the correct treatment regimen for a particular patient is determined.4
Pharmacogenomic (PGx) testing (also referred to as pharmacogenetics) describes how the genome responds to drug treatment; PGx testing can offer patients with depression a way to individualize AD treatment based on their genome and how their physiology may react to different drugs.5 Testing can help select a more suitable medication type and dose for patients.4 However, PGx testing is not common and there are several challenges to its use including inconclusive results from trials, limited results from cost-effectiveness studies, ethical issues, availability of tests, lack of guidelines, lack of education for clinicians and patients, and delays between testing and treatment.5 In January 2020, CADTH published a rapid review6 on the clinical effectiveness, cost-effectiveness, and guidelines for PGx testing in depression. With growing interest in this topic, it is unclear whether any new evidence has been published since this report was produced.
The current report is an update to the 2020 CADTH report,6 with the goal of summarizing the findings from any new studies that were published since the 2020 CADTH report. The 2020 CADTH report found 1 health technology assessment (HTA), 2 systematic reviews (SRs) with meta-analyses (MAs), 1 randomized controlled trial (RCT), and 3 economic evaluations that compared PGx testing to standard care in adults with depression.6 The 2020 CADTH report found that there were mixed results for the clinical effectiveness of PGx testing.6 The objective of the current report is to summarize the evidence regarding the clinical effectiveness and safety of PGx testing guided care in adults with depression compared to standard care.
Research Question
What is the clinical effectiveness of pharmacogenomic testing for treating all severities of diagnosed depression?
Methods
Literature Search Methods
A limited literature search was conducted by an information specialist on key resources including MEDLINE, PsycInfo, the Cochrane Database of Systematic Reviews, the International HTA Database, the websites of Canadian and major international health technology agencies, as well as a focused internet search. The search strategy consisted of both controlled vocabulary, such as the National Library of Medicine’s MeSH (Medical Subject Headings), and keywords. The main search concepts were pharmacogenomic testing and depression, as well as specific pharmacogenomic tests. No filters were applied to limit the retrieval by study type. Comments, newspaper articles, editorials, and letters were excluded. Where possible, retrieval was limited to the human population. The search was also limited to English-language documents published between January 1, 2019 and November 2, 2021.
Selection Criteria and Methods
One reviewer screened citations and selected studies. In the first level of screening, titles and abstracts were reviewed and potentially relevant articles were retrieved and assessed for inclusion. The final selection of full-text articles was based on the inclusion criteria presented in Table 1.
Exclusion Criteria
Articles were excluded if they did not meet the selection criteria outlined in Table 1, they were duplicate publications, or they were published before 2019. SRs in which all relevant studies were captured in other more recent or more comprehensive SRs were excluded. Primary studies retrieved by the search were excluded if they were captured in 1 or more included SRs. Studies captured in the 2020 CADTH report6 were also excluded.
Criteria | Description |
|---|---|
Population | Adults (aged 18 to 60 years) with diagnosed depression of all severities (e.g., major depressive disorder, refractory depression) |
Intervention | Guided care (e.g., guiding the drug selection or dose) with pharmacogenomic testing, either before or after treatment is initiated |
Comparator | Treatment as usual (e.g., no testing) |
Outcomes | Clinical effectiveness (e.g., response rate, remission rate, optimized dosing regimen, number of changes in treatment choice) and harms (e.g., adverse events, morbidity, mortality) |
Study designs | Health technology assessments, systematic reviews, randomized controlled trials, and non-randomized studies |
Note: Studies that included people with an unspecified age range or where the mean age was 18 to 60 years or where the majority of the population were aged 18 to 60 years were included.
Critical Appraisal of Individual Studies
The included publications were critically appraised by 1 reviewer using the following tools as a guide: A MeaSurement Tool to Assess systematic Reviews 2 (AMSTAR 2)7 for the SR and the HTA, and the Downs and Black checklist8 for RCTs and the non-randomized studies (NRSs). Summary scores were not calculated for the included studies; rather, the strengths and limitations of each included publication were described narratively.
Summary of Evidence
Quantity of Research Available
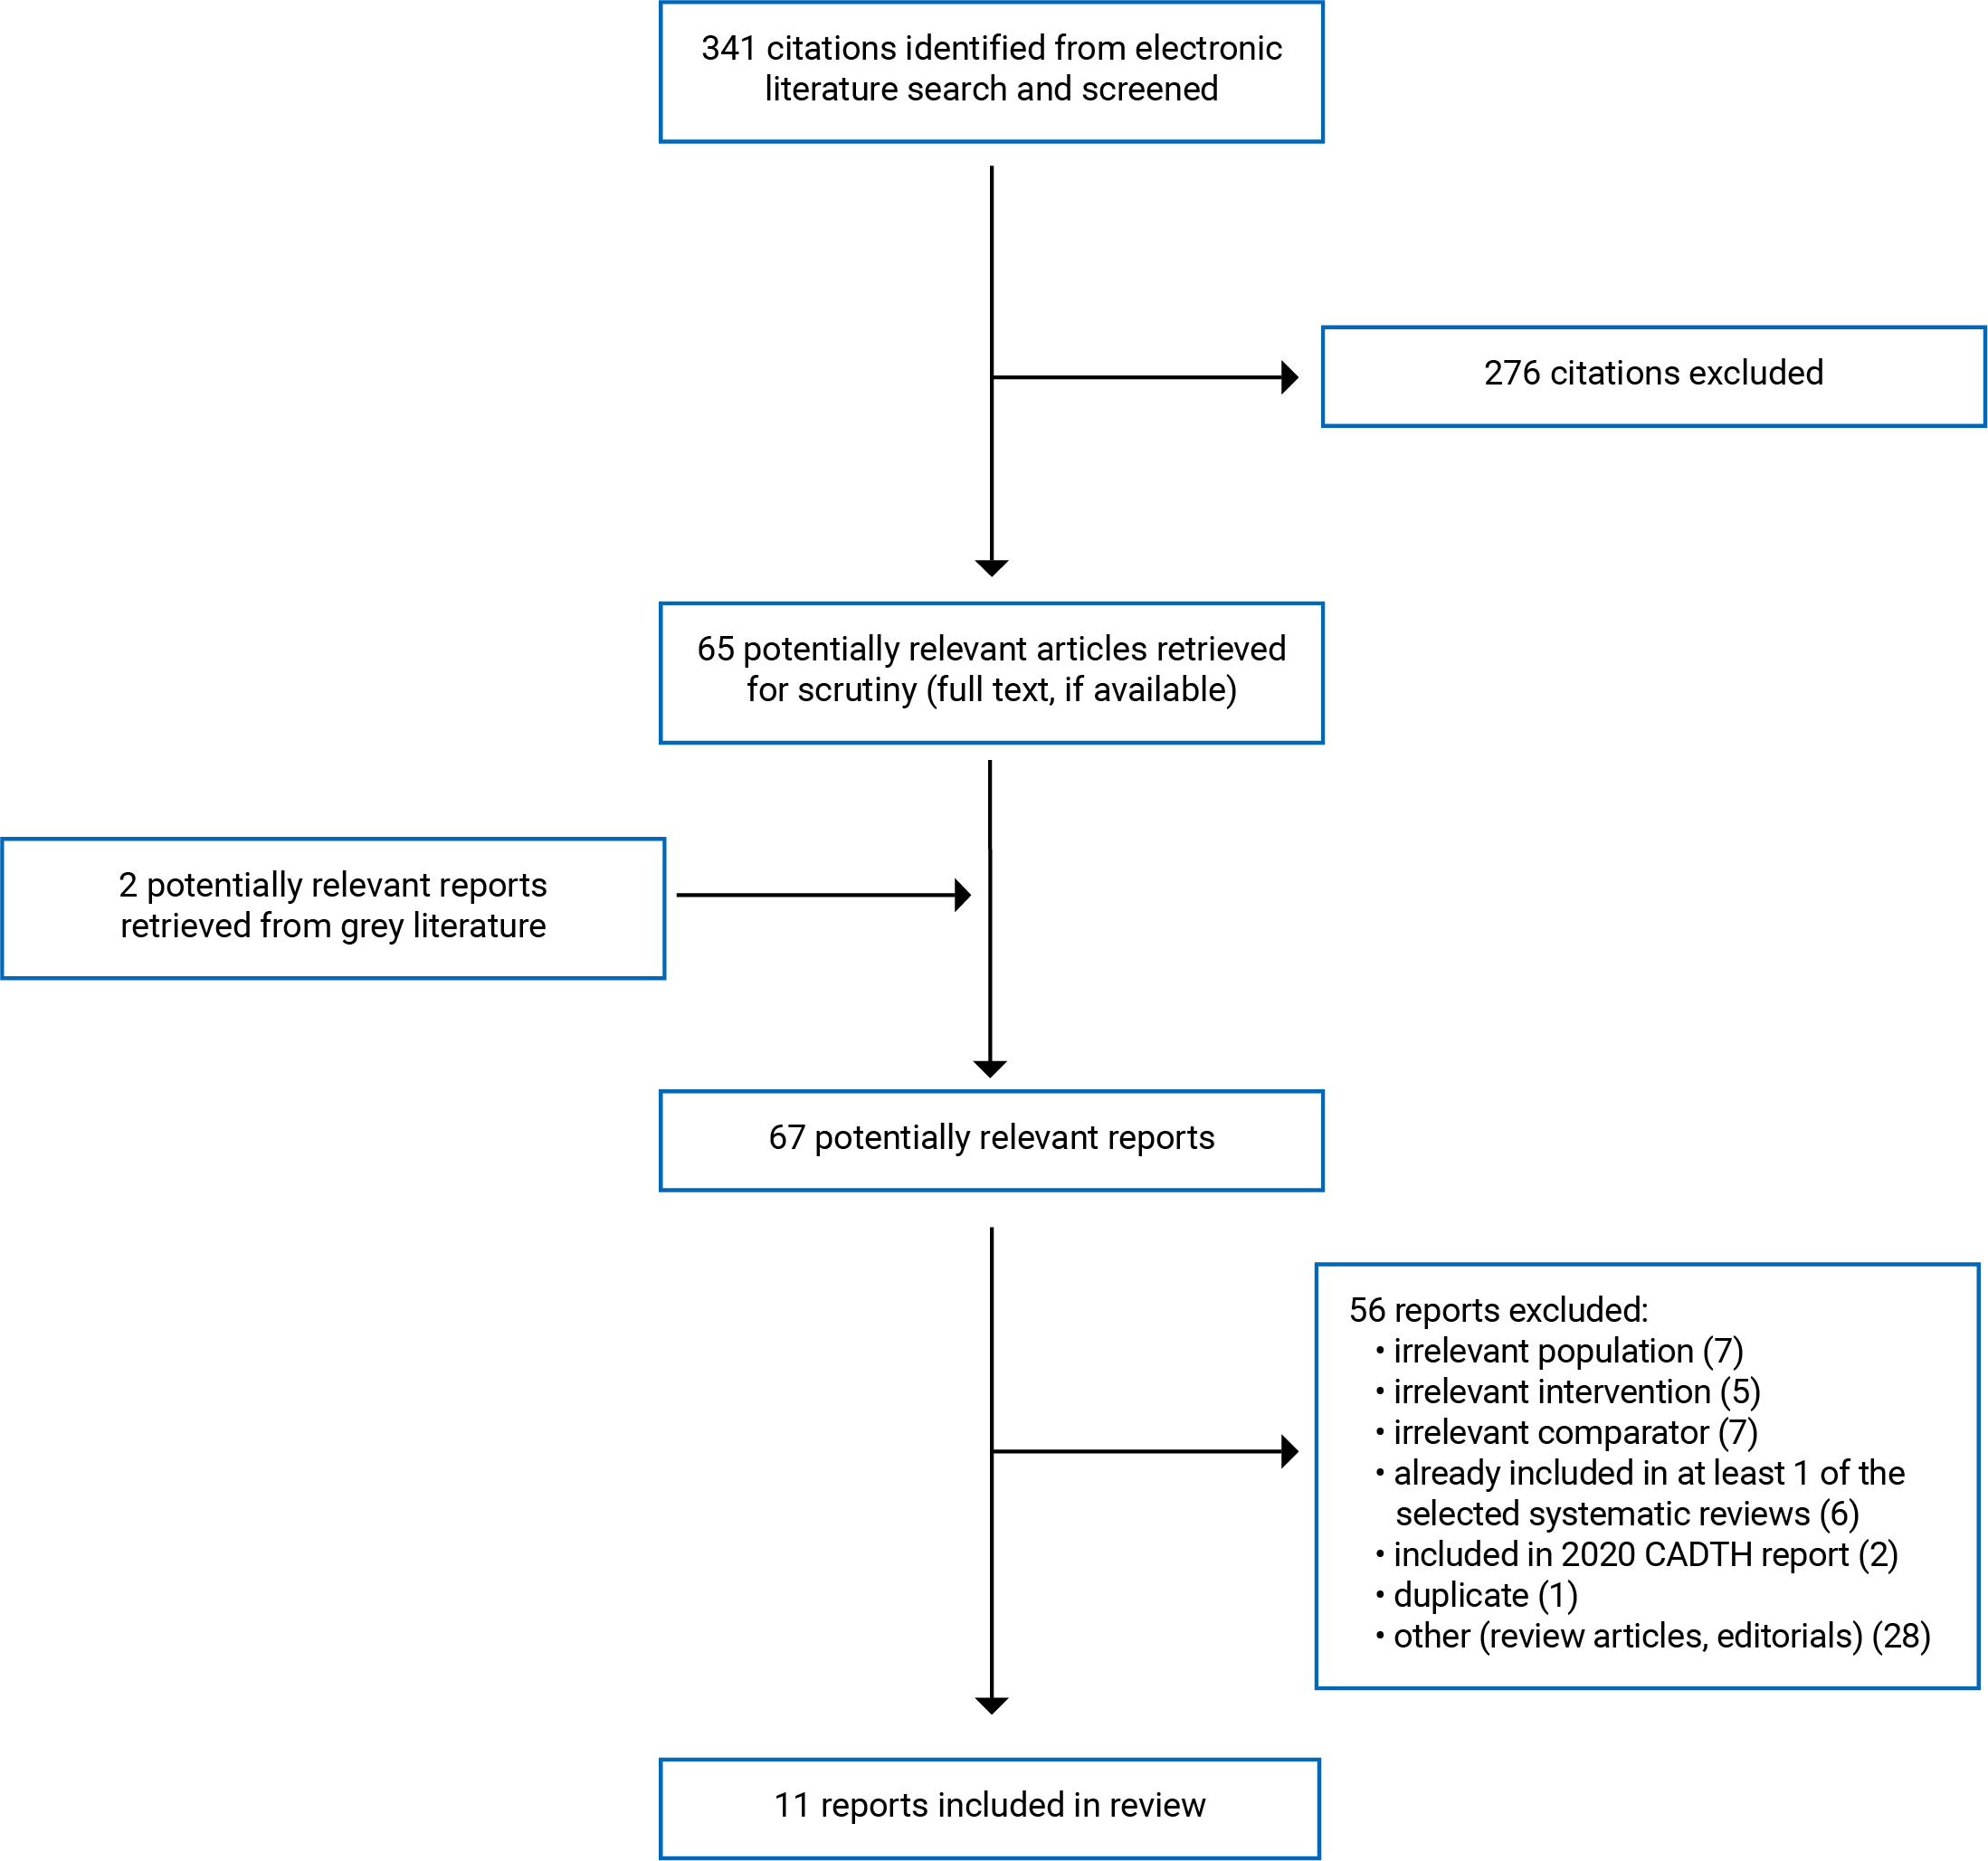
A total of 341 citations were identified in the literature search. Following screening of titles and abstracts, 276 citations were excluded and 65 potentially relevant reports from the electronic search were retrieved for full-text review. Two potentially relevant publications were retrieved from the grey literature search for full-text review. Of the potentially relevant articles, 55 publications were excluded for various reasons and 11 publications met the inclusion criteria and were included in this report. These comprised 1 SR,9 1 HTA,10 4 RCTs,11-15 1 NRS,16 1 cohort study with historical control,17 and 2 uncontrolled before-and-after studies.18,19 Of the RCTs, 2 publications by Ruaño et al. reported results from the same trial:13,14 1 study described the main results13 and the other summarized findings based on subgroup analyses.14 The publication by Huilei et al.16 described an intervention study; however, since randomization was not mentioned, it is assumed that the study was non-randomized for the purpose of this report. Appendix 1 presents the PRISMA20 flow chart of the study selection.
Additional references of potential interest are provided in Appendix 6.
Summary of Study Characteristics
Study Design
One SR9 published in 2021 was found and included literature published up to June 30, 2020. The studies included in this review were 6 other SRs (4 with MAs) published from 2017 to 2020 and 3 RCTs published from 2018 to 2019 that were not already included in the 6 SRs. Across the 6 SRs, population sizes ranged from 1,556 to 13,377 patients. Across the 3 RCTs, population sizes ranged from 100 to 1,541 patients.9
One HTA10 published in 2021 was found and included literature published up to January 24, 2020. This HTA was conducted to examine clinical effectiveness, cost-effectiveness, incremental cost per quality-adjusted life-year, and a 5-year budget impact of PGx testing compared to unguided care. The HTA included 10 primary studies with 4 post-hoc analyses published from 2012 to 2020.The mean age in the included studies ranged from 41 to 52 years for all studies (except 1 that limited age range to 51 years). The authors of the HTA10 reported that the majority of populations across included studies were female. For the current report, only the clinical effectiveness findings of this HTA10 were considered relevant. The overlap in primary studies between the SR9 and HTA10 in the current report is presented in Appendix 5, Table 9; there was an overlap of 3 RCTs between the 2 publications. Three RCTs overlapped between the HTA and SR; however, there was no duplication in how findings are presented in this report, as the SR reported results by individual study and the HTA reported results by specific PGx test.
Across the 4 RCTs and 4 NRSs in the current report, publication dates ranged from 2019 to 2021. Of the RCTs, 2 studies reported being single-blinded, 1 study was double-blinded, and 1 did not report blinding; 2 studies were single-centre and 2 studies were multi-centre. For the NRSs, none reported blinding and all were at single centres; 2 studies were prospective, with 1 using a historical control, and 2 were uncontrolled before-and-after studies measuring outcomes within the same study population before-and-after PGx testing was conducted.
Country of Origin
The authors of the included SR were from Qatar9 and those who authored the HTA10 were from Canada. Of the remaining 8 studies (where 1 was reported in 2 publications), 4 were conducted in the US,11,13,14,18,19 1 in Canada,12 1 in Russia,15 1 in China,16 and 1 in Germany17 (the primary author’s affiliations were both Switzerland and Germany).
Patient Population
The included SR9 found studies that focused on adults who were reported to have depression, uncontrolled depression, MDD, generalized anxiety disorder, or psychiatric conditions. The included HTA10 searched for studies with adults who had a primary diagnosis of major depression. In the HTA,10 all but 1 study had a mean age ranging from 41 to 52 years and studies comprised mostly female participants.
Populations in the included primary studies were adults who had a variety of conditions such as MDD, bipolar disorder, posttraumatic stress disorder (PTSD), and generalized anxiety disorder.11-19 One study15 included patients who had comorbid affective disorder and alcohol addiction. The studies included in the current report varied in their descriptions of whether patients had already tried previous AD therapy that had been unsuccessful. Five studies reported in 6 publications took place in single hospital/health care centre setting,13-18 1 study was in a veteran centre,11 1 study was in an urban community pharmacy,12 and 1 study took place in an outpatient centre.19 Total study population sizes ranged from 15 to 1,459 participants. For the studies that provided age data, ages ranged from 18 to 85 years and the mean age in specific study populations ranged from 36.6 to 52.5 years. Studies did not clarify whether gender or sex was recorded or whether nonbinary identification was reported, so the results are summarized as reported by the authors of the included studies. One study included a male-only population.15 Male and female participants each represented approximately half of study populations in 4 articles;13,14,17,19 female participants were a greater proportion in 2 studies (ranging from 72% to 75.93%)12,18 and male participants were the greater proportion in the other 2 studies.11,16
Interventions and Comparators
PGx-guided treatment was compared to unguided care (i.e., standard care or treatment as usual) in all included studies. Some studies referred to testing as “pharmacogenomic” and others referred to it as “pharmacogenetic.” For the purpose of this report, the term “pharmacogenomic” is used. In 2 studies,11,15 unguided care involved placebo, whereby clinicians were given a sham report to use information as directed, or were given a report indicating that the patient’s genotype was normal. In the uncontrolled before-and-after studies, outcomes were compared before and after PGx testing at the same site;18,19 in the cohort study, patients who had undergone PGx testing were compared to a historical control of patients who were admitted 1 year earlier and did not receive testing.17
Outcomes
Outcomes included effectiveness, safety, and medication, with follow-up ranging from 1 day to 24 weeks across studies.9-19 Effectiveness was reported and referred to in several ways such as length of stay (LOS) in hospital, response to treatment,9-17,19 or remission from depression.9-11 Response and remission outcomes that were measured based on depression, anxiety, functioning, or illness severity symptoms were measured using self-reported questionnaires (3 sections: Sheehan Disability Scale;21 5 items: Penn Alcohol Craving Scale;22 7 items: General Anxiety Disorder-7 items;23 9 items: Patient Health Questionnaire [PHQ-9]24; 14 items: Hospital Anxiety and Depression Scale,25 16-item questionnaires: Quick Inventory of Depressive Symptomatology [QIDS-SR/QIDS-C16]26; 17 items: Treatment Satisfaction with Medicines Questionnaire;27 21 items: Hamilton Depression Rating Scales and Structured Interview Guide for the Hamilton rating scale [HAM-D/HAMD-17/HAM-D6/SIGH-D17]28; 21 items: Beck Depression Inventory [BDI/BDI-II]29), or clinician-measured questionnaires using the Clinical Global Impression [CGI] scales30 (7-point scales: CGI-I [improvement], CGI-S [severity]; 16-cell matrix: CGI-E [Efficacy index]), or the Global Assessment of Functioning scale31 (0-to-100 scale).
Safety or harms were measured by side effects9-11,15,16,18 or adverse events (AEs).9,10 Side effects were measured in some studies15,18 using self-reported 21-item questionnaires (Antidepressant Side-Effect Checklist; 32 UKU Side-Effect Rating Scale33). AEs such as emergency room visits and rehospitalization were reported in the included SR9 and 1 RCT that was reported in 2 articles.13,14 The included HTA10 found that no studies reported on suicide.
Medication-related outcomes were reported as medication switches,12,17,18 adding or removing medication,12,19 dose adjustments, whether there was adherence to medication,12 whether there was a delay in the patient receiving therapy,17 the number of medications the patient was taking,13,14,19 compatibility with the medication,18 and how prescribers used PGx testing to influence their recommendations.11,12
Additional details regarding the characteristics of included publications are provided in Appendix 2, Table 2 and Table 3.
Summary of Critical Appraisal
Systematic Review
The SR by Aboelbaha et al.9 had several strengths and some limitations. Strengths included clearly identifying the research question and eligibility criteria, following a protocol registered beforehand, using a comprehensive search strategy, conducting study selection and data extraction in duplicate, appraising the quality of studies, and providing details of included studies such as which were industry-funded. The SR9 only included primary studies not already included in the SRs that were part of their evidence synthesis and results for SRs and RCTs were reported separately to allow for summaries to be made by study design. In addition, since there was no funding for the SR, the authors had no financial conflicts of interest. Limitations of this review included not providing an explanation for excluding observational studies or a list of excluded studies. The authors conducted quality assessment using the Crowe Critical Appraisal Tool34 for both SRs and RCTs, which may not have been appropriate enough to capture unique aspects of each study design. This assessment by the authors suggested that overall, included studies were poor- to moderate-quality because of issues in study design, inappropriate blinding, small sample sizes, and poor accounting for confounders.
Health Technology Assessment
The HTA by Ontario Health10 had several strengths and limitations. Strengths included clearly identifying the research question and eligibility criteria, following a protocol registered beforehand, using a comprehensive search strategy, appraising the quality of studies, and providing details of included studies such as which were industry-funded. In addition, authors discussed heterogeneity and the quality of the body of evidence when interpreting results (e.g., from the MAs they conducted with random effects models). Limitations of this HTA10 included having study screening and extraction performed by a single reviewer, not providing an explanation for excluding certain study designs and publications, not providing a list of all of the excluded studies (a smaller sample of 7 studies was provided out of the 104 studies that were excluded), and lacking additional details about any potential conflicts of interest or funding source. The authors’ quality assessment using the Cochrane Risk of Bias Tool, Risk of Bias Assessment Tool for Nonrandomized studies (RoBANS), and Grading of Recommendations Assessment, Development and Evaluation (GRADE) Working Group criteria suggested that, overall, included studies were of low or very low quality.
Randomized Controlled Trials
Among the 6 RCTs, there were several strengths and limitations, and these varied across studies. The 2 articles by Ruaño et al.13,14 about the CYP-GUIDES trial reported details about the trials differently. As strengths, both studies described the objectives, main outcomes, patient characteristics, intervention, confounders, and main findings clearly. Both also reported randomization into study groups, random variability for main outcomes, and P values with exact values. One publication13 did not mention the blinding of participants or study personnel and the other14 indicated that both patients and physicians were blinded. Blinding would be a strength of the trial, as it would have potentially reduced biases in how physicians treated patients and how outcomes were measured and reported on. A strength of the trial mentioned in 1 of the publications13 is that all patients received their allocated intervention and there was no loss to follow-up. The main outcome, LOS, may also have been valid and reliable, as it could be objectively measured, and the readmission rate outcome may not have been valid because only the electronic medical record at the study site was consulted to see if patients were readmitted; if patients had been readmitted at another site, this would not be captured in the results. Further, patients were recruited from the same site, which may have increased internal validity since potential confounders may have been balanced, but may have reduced external validity, as findings may not be generalizable to other populations. In 1 publication,13 the trial was described to have a randomization process that resulted in adequate sample sizes for the study groups; however, a statistical analysis plan was not described in detail and it was unclear how any covariates may have biased the results. Although 1 of the publications14 conducted statistical analyses appropriately to account for confounders not adjusted for in the previous publication for the same trial,13 it is unclear if the sub-analyses in the more recent publication had sufficient power. Limitations in both Ruaño publications13,14 include no data describing AEs and unknown compliance by physicians to use the PGx guidance.
In the remaining 3 RCTs,11,12,15 strengths were clear descriptions of objectives, patient characteristics, interventions, and main findings; randomization to study group; sufficient reporting of P values; appropriate statistical analyses with consideration for confounders; blinding; patients being recruited from similar sites suggesting high internal validity; and sufficient power to detect main effects. Specifically in 1 study,12 there was sufficient power to detect effects after 6 months. However, there was not enough power to include all important variables in the analysis or to compare treatment recommendations across groups. Although these 3 RCTs had high internal validity, there may have been low external validity, as results may not be generalizable to other populations. In all 3 studies, reliability of the outcomes was unclear, as they may have been biased by patient or clinician judgment. Two studies12,15 reported main outcomes sufficiently, but 1 only described tolerability in sufficient detail11 and main findings for other outcomes were not clearly described with exact values. In this study,11 misclassification was likely low, as physicians were provided with a sham report of PGx test results. In the Zastrozhin et al. study,15 physicians were blinded to the study assignment; however, there was no explicit mention of patients being blinded. Further, side effects were measured in the Zastrozhin et al. study.15 However, in the other 2 RCTs,11,12 it is unclear if AEs were measured. The Papastergiou et al. study12 had similar loss to follow-up in both study groups (15%); however, the McCarthy et al. study11 had a large amount of loss to follow-up that was higher in the comparator group. In the Zastrozhin et al. study,15 loss to follow-up was not adequately described and the study may have been too short to detect outcome changes. In the McCarthy et al. study,11 the authors listed several conflicts of interest and it is unclear how these affected study results.
Non-randomized Study
The study by Huilei et al.16 had strength and limitations. Strengths included clearly identifying the objective, main outcomes, patient characteristics, intervention, confounders, and main findings; measuring side effects throughout the study; providing exact P values; having patients and outcome assessors blind to the study assignment; conducting appropriate statistical tests; recruiting participants from the same site; and considering confounding in the study groups. Because patients and outcomes assessors were blinded, this may have reduced bias in how patients reported outcomes and how clinicians may have provided care or measured outcomes. Recruiting patients from the same site may have increased the internal validity, as potential confounders introduced from a more variable sample may have been controlled better. However, this may also have reduced the external validity, as results may not be applicable to other populations.
Cohort Study With Historical Control
The cohort study with historical control17 had some strengths and several limitations. Strengths included clearly describing the objectives, main outcomes, patient characteristics, interventions, and main findings, and providing exact P values for the main outcomes. Patients were recruited from the same site, which may have increased internal validity as potential confounders introduced from a more variable sample may have been controlled better. The study also provided random variability for main outcomes to indicate the distribution of the data, considered confounders to compare the study populations before and after the intervention, and reported on AEs. In addition, the study also measured outcomes such as medication changes and hospitalization stay, which may have been less influenced by bias as these would have been objectively recorded, and it indicated that the authors had no conflicts of interest.
Regarding limitations, because patients were not randomized to groups, several variables and confounders may not have been controlled and that could have biased the results. In addition, the blinding of patients or clinicians was not mentioned and was assumed not to have occurred, meaning that the knowledge of receiving the intervention may have influenced how outcomes were reported and measured. The population size of the PGx group was 49 in the intervention group and 94 in the control group, which reduced the power of the study to detect effects of the intervention. The study also did not describe how statistical analyses accounted for small sample sizes and it included outcomes measures with unclear validity and reliability, as they involved the patient or physician’s subjective judgment about depression symptoms and side effects. Further, the results may not have had external validity because the study took place at a single site and may not be applicable to other populations. The funding sources were not reported and it is unclear if there were missing patients or data, or controlling for confounders. Therefore, selection bias may have occurred to include patients in the study with longer disease history, which may have biased the results.
Uncontrolled Before-and-After Studies
The 2 uncontrolled before-after studies18,19 had some strengths and several limitations. Strengths of both studies included clearly describing the objectives, main outcomes, patient characteristics, interventions, and main findings, and providing exact P values for the main outcomes. Both studies recruited patients from the same site, which may have increased internal validity, as potential confounders introduced from a more variable sample may have been controlled better. The Collins et al. study18 also provided random variability for main outcomes to indicate the distribution of the data, considered confounders to compare the study populations before and after the intervention, and reported on AEs. The Kierce et al. study19 also indicated that the authors had no conflicts of interest.
Regarding limitations, both studies were uncontrolled before-and-after designs, meaning that patients were not randomized to groups and several variables and confounders may not have been controlled for and could have biased the results. In addition, the blinding of patients or clinicians was not mentioned and assumed not to have occurred in these studies, meaning that the knowledge of receiving the intervention may have influenced how outcomes were reported and measured. The sample sizes of both studies were also small (ranging from 15 to 80 patients enrolled in intervention groups), which reduced the power of the studies to detect the effects of the intervention. The 2 studies also did not describe how statistical analyses accounted for small sample sizes and included outcomes measures that may not have been valid or reliable because they involved the patient’s or physician’s subjective judgment about depression symptoms and side effects. Further, the results from these studies may not have had external validity because they took place at single sites and may not be applicable to other populations. The funding source from 1 study19 was not reported and for the other study18 there may have been conflicts of interest relating to the funding of the study. In the Collins et al. study,18 loss to follow-up was greater than 30%, which may have biased the results if the reasons for dropout were related to the intervention. It is also unclear if the intervention was applied in the intervention group and if the patients were recruited over the same period of time. In the Kierce et al. study,19 it is unclear if AEs were recorded beyond the main outcome or if there were missing patients or data. Additionally, follow-up time varied and it was unclear if this was adjusted for; the short time period of the study overall may have also prevented key outcomes that occurred later from being included in the results. Finally, although the Kierce et al. study19 measured demographic characteristics, the results may have been biased by potential placebo effects and other factors such as depressive episodes and psychosocial circumstances.
Additional details regarding the strengths and limitations of included publications are provided in Appendix 3, Table 4 and Table 5.
Summary of Findings
Appendix 4 presents the main study findings by outcome in Table 6, Table 7, and Table 8. Although there was an overlap of 3 RCTs between the included HTA10 and included SR,9 there was no duplication in how their findings were reported, as the SR reported results by study and the HTA reported results by specific PGx test. The SR included 6 SRs and 3 RCTs; 3 of the SRs were already described in the 2020 CADTH report6 and are not reported in the current report. The HTA10 included 8 RCTs covered in 12 publications and 2 NRSs. The results from 5 of the RCT publications and both NRSs were already included in the 2020 CADTH report and are not included in the current report.
Clinical Effectiveness of Pharmacogenomic Testing ― Effectiveness
Length of Stay in Hospital
Two studies looked at LOS in a hospital and had mixed results.13,14,17 In the cohort study with historical control,17 there was a difference in LOS between the intervention and comparator groups and there was an association between those who underwent genotyping and a shorter LOS. The statistically significant difference remained when results were conducted within a treatment-naive subgroup and within a subgroup of patients who had previously taken ADs. For the RCT reported in 2 publications,13,14 both publications showed no difference between the intervention and comparator groups with respect to LOS in the hospital.
Response to Treatment
Several studies reported on response to treatment using different terminology such as response, response rate, or using specific definitions based on questionnaire scores. For the current report, results are presented using the wording of the original authors and definitions are provided where available.
In the Aboelbaha et al. SR,9 response was considered in multiple ways such as proportion of response, improved symptoms, or a change in depression scores. One RCT included in this SR9 showed significant differences in response rates and depression scores (measured using HAMD-17) after 8 weeks and mixed results in another RCT. Three SRs showed improvements in response for the intervention group (PGx testing) compared to the control group.
In the included HTA,10 authors reported that response to depression treatment was defined as 50% or greater improvement in depression score from baseline in 8 studies and 4 post-hoc analyses, and that studies measured this using various tools such as the HAM-D17/SIGH-D17, QIDS-C16, HAM-D6, PHQ-9, or CGI-S, all of which measure depressive symptoms. In this HTA,10 low to very low-quality evidence showed that NeuroIDgenetix and GeneSight resulted in improvements in the response to treatment compared to treatment as usual, for Neuropharmagen the results were mixed, and there was no evidence for CNSDose. Depression results were mixed across different PGx tests compared to treatment as usual, with little to no improvement in the intervention group for GeneSight and Genecept tests, inconsistent results for Neuropharmagen, and no evidence for CNSDose or NeuroIDgenetix.10 The authors conducted an MA of 2 RCTs (1 of which was previously summarized in the 2020 CADTH report) and reported findings in 2 places in the report, with different values. The results reported in the text indicate that there was a 34% improvement in response (measured by HAMD-D17) in those who received a GeneSight PGx test compared to those who received usual care and that this was considered low-quality evidence. The results from the MA figure showed a relative risk of 1.50 (95% confidence interval, 1.14 to 1.96). It is unclear which of these are the results for the response outcomes in this study.10
The 1 included NRS16 that used the CGI-EI found that the intervention group had significantly better clinical outcomes than the comparator group. The intervention group showed better effectiveness than the comparator group at the 4-, 8-, and 12-week follow-ups but not the 2-week follow-up.16
In 1 cohort study with historical control,17 the calculated improvement rates for functioning (using the Global Assessment of Functioning) and depression (using BDI-II) were greater in the intervention group even though absolute numbers were not different between the groups.
In 1 RCT,12 depression outcomes measured by the PHQ-9 showed improvements compared to the standard care group and in 1 uncontrolled before-and-after study,19 the PHQ-9 showed no difference in baseline and follow-up scores following guided care using PGx testing.
In 1 RCT,11 within-group differences measured using CGI showed improvements over time; however, there was no difference in depressive symptoms between the intervention and the standard care groups. When these results were reexamined, results showed that when bipolar disorder patients were removed from the analysis, the intervention group had improved CGI outcomes compared to the standard care group, which was driven by PTSD patients. There were no differences in MDD patient improvement within study groups over time in either study group. When separating the study population into risk categories, moderate-risk patients in the intervention group improved better than the standard care group, while there was no difference between groups for high-risk patients. In this same RCT,11 similar results were seen when depression was reported with QIDS-SR scores, which showed study population improvements over time but no difference between the intervention and standard care group. In another RCT that measured CGI,15 scores were better in the guided group compared to the unguided group at day 9 and day 16 follow-ups.
In the Papastergiou et al. RCT,12 functional disability and impairment (measured with the Sheehan Disability Scale) and anxiety (using GAD-7 questionnaire scores) assessments showed more improvements in the intervention group compared to the standard care group. However, treatment satisfaction (using the Treatment Satisfaction with Medicines Questionnaire) did not change differently across groups during the study.
In the Zastrozhin et al. RCT,15 alcohol craving (reported using the Penn Alcohol Craving Scale), depression (measured using BDI), anxiety and depression (using Hospital Anxiety and Depression Scale), and depression scores (using HAMD) were all significantly lower in the intervention group compared to the unguided group. In this same RCT, HAMD scores for depression showed reductions within study groups at multiple follow-ups and between study groups at each follow-up.15
Remission From Depression
Remission outcomes were reported in 3 studies.9-11 In the included HTA,10 authors reported that remission from depression was defined as 5 or lower on PHQ-9, 5 or lower on QIDS-C16, 7 or lower on HAMD-D17, or 4 or lower on HAM-D6 at follow-up. Low- to very low-quality evidence showed that the NeuroIDgenetix, GeneSight, and CNSDose PGx tests resulted in improvements in remission compared to treatment with no PGx testing, while the Neuropharmagen results were mixed across studies.10 The authors conducted an MA of 2 RCTs (1 of which was previously summarized in the 2020 CADTH report) that showed an improvement in remission (measured by HAMD-D17) in those who received a GeneSight PGx test compared to those who receive usual care and this was considered low-quality evidence.10
In the SR by Aboelbaha et al.,9 evidence showed higher remission in the guided group compared to the standard care group in 1 RCT and 2 MAs but no significant differences in 1 primary study and no improvement in 1 MA.
In 1 RCT,11 remission was defined as ending the study with a score of 1 or 2 on the CGI and, although remission was higher in the intervention group compared to the standard care group, this was not statistically significant.
Clinical Effectiveness of Pharmacogenomic Testing ― Safety and Harms
Side Effects
The included HTA10 showed inconclusive results for side effect outcomes in the included studies. The Aboelbaha et al.study9 found minimal evidence on safety outcomes and inconsistency in results: 1 RCT showed no differences in the mean number of side effects between study groups and another RCT showed that side effects measured using FIBSER scale (for the frequency, intensity, and burden of side effects) were significantly different between groups, showing greater improvements in the PGx group. Further, 1 SR included in the Aboelbaha et al.study9 showed that the intervention group had a lower risk of medication tolerability issues.
The 1 included NRS16 used the CGI-EI index and found that the intervention group had significantly fewer side effects than the comparator group at the 4-, 8-, and 12-week follow-ups but not the 2-week follow-up.
One RCT11 showed that side effects were prevalent in the total study population but did not change over the course of study and there were no significant differences between those who were tested and those receiving standard care. When conducting subgroup analyses, this RCT11 showed that, in the moderate-risk subgroup, side effect burden improved in the intervention group compared to standard care and the high-risk group showed higher side effect burden compared to the standard care group, which was explained by patient dropout. In another RCT,15 side effects measured using the UKU Side-Effect Rating Scale showed increases within study groups at multiple follow-ups and between study groups at each follow-up.
In 1 uncontrolled before-and-after study,18 side effects measured using the Antidepressant Side-Effect Checklist showed improvements after PGx testing and adjusted analyses showed that improvements were not correlated with medication change.
Adverse Events
In the Aboelbaha et al. study,9 1 included SR showed the intervention group had lower rehospitalizations after 2 months, as well as fewer emergency room visits after 2 months. However, this was not statistically significant. The HTA10 reported that there was no evidence found for suicide.
For the RCT reported in 2 publications,13,14 both publications showed no difference between the intervention and comparator groups with respect to the readmission rate 30 days after discharge.
Clinical Effectiveness of Pharmacogenomic Testing ― Medication
Of the included primary studies, the 2 uncontrolled before-and-after studies,18,19 the cohort study with historical control,17 and 3 of the RCTs11-14 reported medication-related outcomes. The included HTA10 found no studies examining medication adherence. In the cohort study with historical control,17 the number of medication switches was not different between the intervention and control groups and the subgroup analyses in treatment-naive patients showed more changes in the control group compared to the intervention group. In addition, the intervention group was given medication at a significantly delayed time point compared to the control group.17 In the Collins et al. study,18 the majority of patents had medication changes and were compatible with their treatment; the adjusted analysis showed that the medication change was not correlated to the CGI-I score. In the Papastergiou et al. study, there were more medication switches in the intervention group compared to the control group.12
In terms of how treatment was implemented, the Kierce et al. uncontrolled before-and-after study19 showed that, of the 15 patients who underwent PGx testing, 6 were given medication that had gene-drug interactions. In the 1 RCT conducted by Ruaño et al.,13,14 most patients in the overall study population were given at least 2 psychotropic drug treatments: less than 100 patients were given no treatment and less than 200 patients were given 1 medication.19 The McCarthy et al. study11 showed that the majority of clinicians did not change dosing based on the PGx test results but did use the test to reduce side effects. In the Papastergiou et al. study,12 more dose adjustments and more new medication additions occurred in the PGx test group, while continuation of the medication regimen occurred more in the control group compared to the PGx test group.
Limitations
There are several limitations to the body of evidence found. Studies varied in comparability of populations across the evidence and findings may have had low external validity. Some studies were focused on patients with a specific primary diagnosis of MDD and other studies were inclusive of various forms of depression. Some study population sizes were small (e.g., 15 participants), which may have made it difficult to draw conclusions. The majority of studies were conducted at single hospital sites in different countries. These findings may not be representative of the types of patients with depression in a more generalizable population (i.e., non-hospital contexts) or to people with depression specifically in Canada. The 1 study that was conducted in Canada12 took place at 3 urban pharmacies in Ontario that may not be generalizable to other health care settings (e.g., primary care) or geographic settings (e.g., rural communities in Canada).
Regarding outcomes, several ways of measuring the effectiveness or response to the intervention were measured, with the majority of studies using questionnaires that relied on patients’ self-reporting or clinicians’ judgment; this may not have been reliable because the questionnaires are based on subjective responses. Different questionnaires were used across studies to measure symptoms and some studies used multiple questionnaires for the same trial, which showed conflicting findings. There were also few studies that reported on other outcomes such as side effects, AEs, or medication-related outcomes; these outcomes may be important in determining the effectiveness of PGx testing. Further, follow-up time for these outcomes ranged widely from 1 day to 24 weeks and differences between study groups were seen at some time points but not others. In the included HTA,10 no results were found for quality of life, recovery, relapse, or recurrence of depressive symptoms long term; and, of the studies found, most did not have outcomes reported after 12 weeks. In some studies, subgroup analyses were performed based on the specific PGx test, patient risk categories, or whether patients were treatment-naive or not. This variability may make it difficult to compare studies to each other as the study findings are based on different outcomes using different measures, different follow-up times, different sample sizes, and different subgroups of patients.
Conclusions and Implications for Decision- or Policy-Making
A CADTH rapid review was conducted to update a 2020 CADTH report6 and provide new evidence on the clinical effectiveness of guided care with PGx testing compared to standard care for adults with depression. Although trials are currently underway and new protocols have been published since the 2020 CADTH report’s6 literature search (see Appendix 6), the results of these studies have not been published yet. Of the literature that was found for the current report, 11 new studies were identified that included 1 SR,9 1 HTA,10 4 RCTs reported in 5 publications,11-15 1 NRS,16 1 cohort study with historical control,17 and 2 uncontrolled before-and-after studies.18,19 One additional abstract for an RCT35 was found in the literature search and is listed in Appendix 6. Most studies were conducted in the US and 1 RCT was conducted in Canada.12 The populations in these studies included people aged 18 to 85 years, with various forms of depression such as MDD, BD, generalized anxiety disorder, and PTSD in study samples that ranged from 15 to 1,459 participants. Outcomes reported were LOS, response to treatment, remission from depression, side effects, AEs, and medication-related outcomes. All outcomes showed mixed results across the body of evidence.
Because PGx testing is a growing field, the current CADTH report adds to the body of evidence to ascertain what has been published since the previous report. Compared to the 2020 CADTH report,6 the current report only focused on updating the clinical effectiveness literature (the 2020 CADTH report included cost-effectiveness studies and guidelines). The previous report6 found 1 HTA, 2 SRs with MAs, and 1 RCT that showed inconclusive evidence on the clinical effectiveness of PGx testing. Specifically, the HTA included in the 2020 CADTH report found mixed results of low to very low quality for all outcomes, 1 SR with MA that showed minimal evidence of low quality, another SR with an MA that showed remission for depression for patients with moderate to severe depression who had intolerability to previous medication, and 1 RCT that showed no effect of PGx-guided care on safety or depressive symptoms.6 This current report found a greater number of publications; however, it also showed inconclusive evidence. In particular, LOS in hospital, response to treatment, remission from depression, side effects, and adverse event outcomes showed mixed results across study designs, with some studies reporting improvements in those patients who received PGx-guided treatment and some studies showed no difference between the PGx testing and usual care. No included studies found worse outcomes for those undergoing PGx treatment compared to standard care. There were several limitations in the included studies such as poor study design, small sample sizes, variability in measuring outcomes, subjective reporting of outcomes, and low generalizability. For the primary studies specifically, half were randomized and half were not, which may have explained why the conclusions for various outcomes differed across studies. Further, 4 of the publications included some form of blinding, with 2 trials blinding someone other than the patient.
Because of the high variability in the findings, future studies may consider the following: consensus on which tools best measure the clinical effectiveness of guided care with PGx testing, with a balance of reporting subjective and objective outcomes; the appropriate length of follow-up to allow medication changes to take place and long-term effects to be captured; all important variables that may affect results (e.g., patient risk type, patient’s medication history) and performing statistical analyses to determine whether potential effects are due to medication changes or other variables; other outcomes that are not adequately captured in current literature (e.g., long-term effects, suicide); and study conduct in settings that are more generalizable.
Further research could also help shed light on how this new tool can be implemented in a way that provides clear guidelines for clinicians, helps determine the best way to manage care by setting and provider type (e.g., physicians in primary care, pharmacist in pharmacies), helps assess ethical issues regarding how patients’ biological samples and data are used, helps understand what barriers exist to accessing PGx-guided care, and helps establish best care practices during the delays between testing and medication implementation.4,5
Guided care with PGx testing is not commonly used as part of treatment for people with depression5 and further research in this area could help provide more conclusive results on its clinical effectiveness.
References
1.Krishnan R. Unipolar depression: genetics. In: Post TW, ed. UpToDate. Waltham (MA): UpToDate; 2021: http://www.uptodate.com. Accessed 2021 Nov 11.
2.World Health Organization. Depression. 2021; https://www.who.int/news-room/fact-sheets/detail/depression. Accessed 2021 Nov 11.
3.CAMH. Depression. https://www.camh.ca/en/health-info/mental-illness-and-addiction-index/depression. Accessed 2021 Nov 11.
4.Bousman CA, Bengesser SA, Aitchison KJ, et al. Review and consensus on pharmacogenomic testing in psychiatry. Pharmacopsychiatry. 2021;54(1):5-17. PubMed
5.Tantisira K, Weiss ST. Overview of pharmacogenomics. In: Post TW, ed. UpToDate. Waltham (MA): UpToDate; 2021: http://www.uptodate.com. Accessed 2021 Nov 11.
6.Li KX, Loshak H. Pharmacogenomic testing in depression: a review of clinical effectiveness, cost-effectiveness, and guidelines. (CADTH Rapid response report: summary with critical appraisal). Ottawa (ON): CADTH; 2020: https://cadth.ca/pharmacogenomic-testing-depression-review-clinical-effectiveness-cost-effectiveness-and-guidelines. Accessed 2021 Nov 10.
7.Shea BJ, Reeves BC, Wells G, et al. AMSTAR 2: a critical appraisal tool for systematic reviews that include randomised or non-randomised studies of healthcare interventions, or both. BMJ. 2017;358:j4008. PubMed
8.Downs SH, Black N. The feasibility of creating a checklist for the assessment of the methodological quality both of randomised and non-randomised studies of health care interventions. J Epidemiol Community Health. 1998;52(6):377-384. PubMed
9.Aboelbaha S, Zolezzi M, Elewa H. Effect of pharmacogenetic-based decision support tools in improving depression outcomes: a systematic review. Neuropsychiatr. 2021;17:2397-2419. PubMed
10.Ontario Health. Multi-gene pharmacogenomic testing that includes decision-support tools to guide medication selection for major depression: a health technology assessment. Ont Technol Assess Ser. 2021;21(13):1-214. https://www.hqontario.ca/Portals/0/Documents/evidence/reports/hta-multi-gene-pharmacogenomic-testing-that-includes-decision-support-tools-to-guide-medication-selection-for-major-depression.pdf. Accessed 2021 Nov 10.
11.McCarthy MJ, Chen Y, Demodena A, et al. A prospective study to determine the clinical utility of pharmacogenetic testing of veterans with treatment-resistant depression. J Psychopharmacol. 2021;35(8):992-1002. PubMed
12.Papastergiou J, Quilty LC, Li W, et al. Pharmacogenomics guided versus standard antidepressant treatment in a community pharmacy setting: A randomized controlled trial. Clin Transl Sci. 2021;14(4):1359-1368. PubMed
13.Ruano G, Robinson S, Holford T, et al. Results of the CYP-GUIDES randomized controlled trial: Total cohort and primary endpoints. Contemp Clin Trials. 2020;89:105910. PubMed
14.Ruano G, Tortora J, Robinson S, et al. Subanalysis of the CYP-GUIDES Trial: CYP2D6 functional stratification and operational timeline selection. Psychiatry Res. 2021;297:113571. PubMed
15.Zastrozhin M, Skryabin V, Sorokin A, et al. Using a pharmacogenetic clinical decision support system to improve psychopharmacotherapy dosing in patients with affective disorders. Drug Metabol Personal Ther. 2020;35(4):01.
16.Huilei X, Siyu C, Jianghua X, Jidong R, Yi R. Clinical utility of pharmacogenetic testing in the treatment of bipolar disorder of Chinese patients. Pharmacogenomics. 2020;21(11):761-770. PubMed
17.Battig VAD, Roll SC, Hahn M. Pharmacogenetic testing in depressed patients and interdisciplinary exchange between a pharmacist and psychiatrists results in reduced hospitalization times. Pharmacopsychiatry. 2020;53(4):185-192. PubMed
18.Collins AR, Kung S, Ho JT, et al. Pharmacogenetic testing in psychiatric inpatients with polypharmacy is associated with decreased medication side effects but not via medication changes. J Psychiatr Res. 2020;126:105-111. PubMed
19.Kierce ED, Vanderhoef DM, Connors LM. Use of PHQ-9 and pharmacogenetic testing in clinical practice. J Am Assoc Nurse Pract. 2019;31(9):497-501. PubMed
20.Liberati A, Altman DG, Tetzlaff J, et al. The PRISMA statement for reporting systematic reviews and meta-analyses of studies that evaluate health care interventions: explanation and elaboration. J Clin Epidemiol. 2009;62(10):e1-e34. PubMed
21.Sheehan KH, Sheehan DV. Assessing treatment effects in clinical trials with the discan metric of the Sheehan Disability Scale. Int Clin Psychopharmacol. 2008;23(2):70-83. PubMed
22.Flannery BA, Volpicelli JR, Pettinati HM. Psychometric properties of the Penn Alcohol Craving Scale. Alcohol Clin Exp Res. 1999;23(8):1289-1295. PubMed
23.Spitzer RL, Kroenke K, Williams JBW, Löwe B. A brief measure for assessing generalized anxiety disorder: The GAD-7. Arch Intern Med. 2006;166(10):1092-1097. PubMed
24.Kroenke K, Spitzer RL, Williams JB. The PHQ-9: validity of a brief depression severity measure. J Gen Intern Med. 2001;16(9):606-613. PubMed
25.Zigmond AS, Snaith RP. The hospital anxiety and depression scale. Acta Psychiatr Scand. 1983;67(6):361-370. PubMed
26.Rush AJ, Trivedi MH, Ibrahim HM, et al. The 16-Item Quick Inventory of Depressive Symptomatology (QIDS), clinician rating (QIDS-C), and self-report (QIDS-SR): a psychometric evaluation in patients with chronic major depression. Biol Psychiatry. 2003;54(5):573-583. PubMed
27.Ruiz MA, Pardo A, Rejas J, Soto J, Villasante F, Aranguren JL. Development and validation of the “Treatment Satisfaction with Medicines Questionnaire” (SATMED-Q). Value Health. 2008;11(5):913-926. PubMed
28.Hamilton M. The assessment of anxiety states by rating. Br J Med Psychol. 1959;32(1):50-55. PubMed
29.Hautzinger M, Keller F, Kuhner C, Beck AT, Steer RA, Brown GK. Beck Depressions-Inventar: BDI-II. Revision; Manual. Frankfurt (DE): Pearson; 2009.
30.Guy W. ECDEU assessment manual for psychopharmacology. Rockville (MD): National Institute of Mental Health, Psychopharmacology Research Branch, Division of Extramural Research Programs; 1976: https://archive.org/details/ecdeuassessmentm1933guyw/page/218/mode/2up. Accessed 2021 Nov 11.
31.Jones SH, Thornicroft G, Coffey M, Dunn G. A brief mental health outcome scale-reliability and validity of the Global Assessment of Functioning (GAF). Br J Psychiatry. 1995;166(5):654-659. PubMed
32.Uher R, Farmer A, Henigsberg N, et al. Adverse reactions to antidepressants. Br J Psychiatry. 2009;195(3):202-210. PubMed
33.Lingjaerde O, Ahlfors UG, Bech P, Dencker SJ, Elgen K. The UKU side effect rating scale. A new comprehensive rating scale for psychotropic drugs and a cross-sectional study of side effects in neuroleptic-treated patients. Acta Psychiatr Scand Suppl. 1987;334:1-100. PubMed
34.Conchra Research & Technology. Crowe Critical Appraisal Tool (v1.4). 2015; https://conchra.com.au/2015/12/08/crowe-critical-appraisal-tool-v1-4/. Accessed 2021 Nov 11.
35.Parikh SV, Khazanov GK, Thase ME, et al. Safety of using a combinatorial pharmacogenomic test for patients with major depressive disorder in the GUIDED trial. CNS Spectr. 2021;26(2):169-170. PubMed
Appendix 1: Selection of Included Studies
Appendix 2: Characteristics of Included Publications
Note that this appendix has not been copy-edited.
Table 2: Characteristics of Included Systematic Review and Health Technology Assessment
Study citation, country, funding source | Study designs, no. of primary studies included | Population characteristics | Intervention and comparator(s) | Clinical outcomes, length of follow-up |
|---|---|---|---|---|
Systematic review | ||||
Aboelbaha et al. (2021)9 Qatar Funding source: No funding received | Literature published up to June 30, 2020 6 SRs
3 RCTs
| Adults with depression, GAD, uncontrolled depression, psychiatric conditions, MDD or MDD with treatment failure Across SRs: 1,556 to 13,377 patients Across RCTs: 100 to 1,541 patients | Intervention: PGx-guided treatment PGx tests covered:
Comparator: TAU | Outcomes: remission, response (symptom improvement, depression scores), safety, rehospitalizations, emergency room visits, treatment tolerability, side effects, cost-effectiveness, quality of life, prevention of suicide, clinician and patient satisfaction, impact on therapeutic decisions Follow-up: 4 to 24 weeks |
Health technology assessment | ||||
Ontario Health (2021)10 Canada Funding source: NR | SRs, MAs, NRS, and RCTs searched up to Jan. 24, 2020 8 RCTs (12 articles)
2 NRSs
| Adults ≥ 18 years with a primary diagnosis of major depression needing drug therapy including those with inadequate response to medication or medication-naïve people; Mean age: 41 to 52 years for all studies (except 1 which limited age range to 51 years) “Most participants were female in all studies (p. 24)” | Intervention: multi-gene pharmacogenomic test with a clinical decision-support tool to guide treatment selection PGx tests covered:
Comparator: TAU | Outcomes: change in depression (depression score, response, remission, relapse, recurrence, recovery), medical adherence, AEs, suicide, quality of life, impact on therapeutic decisions Follow-up: 2 to 12 weeks |
AE = adverse event; BD = bipolar depression; GAD = generalized anxiety disorder; MA = meta-analysis; MDD = major depressive disorder; NR = not reported; NRS = non-randomized study; PGx = pharmacogenomic; RCT = randomized controlled trial; SR = systematic review; TAU = treatment as usual.
aAssessed in a 2020 CADTH report.6
Table 3: Characteristics of Included Primary Clinical Studies
Study citation, country, funding source | Study design | Population characteristics | Intervention and comparator(s) | Clinical outcomes, length of follow-up |
|---|---|---|---|---|
Randomized controlled trials | ||||
McCarthy et al. (2021)11 US Funding source: grant from NIH, corporate sponsorship, and research support from Pathway Genomics | RCT, single-blinded (patient), multi-centre Setting: veteran centres | Veterans (N = 182) with TRD diagnosed with PTSD, MDD, BD Intervention group: mean age 52.5 (SEM 1.5), range 24 to 82 Comparator group: mean age 50.3 (SEM 1.6), range 23 to 81 Intervention group male: 79% Comparator group male: 74% | Intervention (n = 75): PGx-guided treatment (clinician given PGx test report to inform decision-making for patient care) Comparator (n = 74): TAU (clinician given sham report to inform decision-making for patient care; use as directed) | Outcomes: improvement, remission, depressive symptoms, tolerability (side effects) Follow-up: 4, 8 weeks |
Papastergiou et al. (2021)12 Canada Funding source: Green Shield Canada | RCT, single-blinded (patient), multi-centre Setting: urban community pharmacies | Inclusion criteria: adults prescribed ≥ AD and diagnosed with GAD and/or MDD who were on newly initiated or had recently changed AD therapy; had suboptimal response, adverse drug reactions, or dissatisfaction with AD therapy; and their SATMEDQ results showed dissatisfaction Exclusion criteria: people who had had a liver transplant, people with BD, dementia, or schizophrenia; people who were nonadherent to prescribed medication because of failure or refusal Mean age: 42.69 (SD 14.90), range 18 to 77 years Female: 74.65% | Intervention (n = 105): PGx-guided treatment using the Pillcheck test (pharmacist given PGx test report and made recommendations to prescriber to inform AD therapy) Comparator (n = 108): TAU | Outcomes: depression, anxiety, functional disability and impairment, treatment satisfaction Follow-up: 1, 3, 6 months |
Ruano et al. (2020)13 US Funding source: Agency for Healthcare Research and Quality | RCT (2:1), single-centre Trial name: CYP-GUIDES Setting: hospital | Inclusion criteria: adults with MDD Exclusion criteria: pregnant or nursing; people with chronic kidney disease, Alzheimer disease, dementia, subarachnoid hemorrhage, or hemorrhagic stroke; people in hospital in previous 30 days Intervention group: female 51.3%, male 48.7% Comparator group: female 50.3%, male 49.7% Intervention group: female > 60 years old 8.7%, male > 60 years old 8.6% Comparator group female > 60 years old 8.8%, male > 60 years old 8.9% | Intervention (n = 982): genetically-guided therapy (CYP2D6 genotype and functionality determined and used for prescribing recommendations to physician) Comparator (n = 477): standard care (CYP2D6 genotype and functionality determined and not used for prescribing recommendations to physician) | Outcomes: LOS, RAR Follow-up: RAR 30 days after discharge |
Ruano et al. (2021)14 US Funding source: Agency for Healthcare Research and Quality | RCT (2:1), single-centre, patients and physicians blinded Trial name: CYP-GUIDES (subgroup analysis) Setting: hospital | Inclusion criteria: adults with MDD Exclusion criteria: pregnant or nursing; people with chronic kidney disease, Alzheimer disease, dementia, subarachnoid hemorrhage, or hemorrhagic stroke; people in hospital in previous 30 days; people who had surgery or ischemic stroke within 6 weeks; people enrolled in another clinical trial Intervention group: female 52.5%, male 47.5% Comparator group: female 51.6%, male 48.4% Intervention group: female > 60 years old 6.9%, male > 60 years old 8.4% Comparator group female > 60 years old 9.1%, male > 60 years old 8.2% | Intervention (n = 549): genetically-guided therapy (CYP2D6 functional status used for prescribing psychotropics) Comparator (n = 277): TAU | Outcomes: LOS, RAR Follow-up: RAR 30 days after discharge |
Zastrozhin et al. (2020)15 Russia Funding source: grant from the President of the Russian Federation, the Russian Science Foundation | RCT, single-centre, double-blinded (including physician) Setting: health care centre | Inclusion criteria: Patients with MDD single episodes or cyclothymic disorder with comorbid alcohol dependence in remission; mirtazapine, fluvoxamine, or carbamazepine treatment ≥ 16 days Exclusion criteria: severe somatic disorders except alcohol hepatitis and toxic encephalopathy; other mental disorders; creatinine concentration ≥ 1.5 mg/dL, creatinine clearance values < 50 mL/min, body weight < 60 kg or > 100 kg, reactions to fluvoxamine, age ≥ 75 years; other psychotropic medications Intervention group: mean age 36.7 (SD 9.5) Comparator group: mean age 38.2 (SD 8.6) Male: 100% | Intervention (n = 48): mirtazapine, fluvoxamine, or carbamazepine treatment informed by PGx testing Comparator (n = 70): physicians given report that patients had normal genotype (regardless of actual genotype) | Outcomes: safety, efficacy Follow-up: 1, 9, 16 days |
Non-randomized study | ||||
Huilei et al. (2020)16 China Funding source: NR | Prospective, single-centre Setting: hospital | Inclusion criteria: patients 16 to 65 years old with BD, baseline HAM-D score ≥ 20 points, BRMS score ≥ 6 points; only 2 previously failed treatments or first-time unmedicated patient Exclusion criteria: chronic disease or serious illness needing medication that could interfere with study, > 2 past treatment failures Intervention group: 32 females, 68 males Comparator group: 30 females, 70 males Intervention group: ages 16 to < 25 = 10 people, ages 25 to 50 = 48 people, ages 50 to 65 = 42 people Comparator group: ages 16 to < 25 = 18 people, ages 25 to 50 = 50 people, ages 50 to 65 = 32 people | Intervention (n = 100): genetic test results used to guide treatment Comparator (n = 100): standard practice/ traditional methods | Outcomes: efficacy, side effects Follow-up: 2, 4, 8, 12 weeks |
Cohort study with historical control | ||||
Bättig et al. (2020)17 Switzerland, Germany Funding source: NR | Cohort study with historical control, single-centre Setting: hospital | Inclusion (intervention): people with MDD (recurrent severe without psychotic features or single episode, severe without psychotic features) prescribed ≥ 1 AD (not for sleep); AD taken for first time or previous therapy replaced, stayed ≥ 14 days Exclusion (intervention): part of modular psychotherapeutic treatments requiring hospitalization; discharge against recommendation or for an emergency (non-psychiatric) treatment at another hospital; BD, current episode depressed, severe, without psychotic features; schizophrenia/ schizotypal/ delusional/other non-mood psychotic disorders Exclusion (comparator): admitted multiple times during control investigation period, or in both periods of investigation Intervention group: mean age 41.27 (SD 14.15) Comparator group: mean age 44.12 (SD 16.65) Intervention: female 46.9%, male 53.1% Comparator: female 53.2%, male 46.8% | Intervention (n = 49): patients provided PGx test before AD therapy Comparator (n = 94): patients admitted 1 year before who did not receive PGx testing | Outcomes: medication changes, hospitalization, depression Follow-up: outcomes measured up to 6 months |
Uncontrolled before-and-after studies | ||||
Collins et al. (2020)18 US Funding source: grant from the National Center for Advancing Translational Sciences, Mayo Clinic Center for Individualized Medicine | Uncontrolled before-after study, single-centre Setting: hospital | Inclusion criteria: adults with polypharmacy with unipolar bipolar depressive disorders, depressive, substance use and/or psychotic disorders, and psychiatric but also comorbid neurocognitive or medical illnesses Exclusion criteria: PGx testing in previous 5 years N = 80 enrolled, 92.5% diagnosed MDD, BD, PDD or mood disorder Mean age: 48.4 (SD NR) Female: 72% | Intervention: after PGx testing using OneOme RightMed Comparator: before PGx testing | Outcomes: side effects, medication changes, medication compatibility, ECT part of therapy Follow-up: 30 days |
Kierce et al. (2019)19 US Funding source: NR | Uncontrolled before-after study, single-centre Setting: outpatient psychiatric practice | Inclusion criteria: 19 to 85 years with primary depression, selected by provider Exclusion criteria: patients with BD I or II, psychotic or related disorder diagnosis, or < 19 years N = 15 completed testing (8 female, 7 male) Mean age: 44 (SD NR), range 19 to 76 | Intervention: completed PGx testing Comparator: before PGx testing | Outcomes: depressive symptoms, medication regimen Follow-up: within 6 weeks |
AD = antidepressant; ADR = adverse drug reaction; AE = adverse event; BD = bipolar disorder; GAD = generalized anxiety disorder; ECT = electroconvulsive therapy; HAM-D = Hamilton Depression Rating Scale; LOS = length of stay; MDD = major depressive disorder; NIH = National Institutes of Health; PGx = pharmacogenomic; PTSD = posttraumatic stress disorder; RAR = readmission rate; RCT = randomized controlled trial; SATMEDQ = Treatment Satisfaction with Medicines Questionnaire; SD = standard deviation; SEM = standard error of the mean; TAU = treatment as usual; TRD = treatment-resistant depression; NR = not reported.
Appendix 3: Critical Appraisal of Included Publications
Note that this appendix has not been copy-edited.
Table 4: Strengths and Limitations of Systematic Review and Meta-Analysis, and Health Technology Assessment, Using AMSTAR 27
Strengths | Limitations |
|---|---|
Aboelbaha et al. (2021)9 | |
The research questions and inclusion criteria for the review included relevant populations, interventions, comparators, and outcomes. The protocol was established beforehand and was followed to conduct the review. For the search strategy, at least 2 databases were searched, key words were provided, reference lists were screened, study registries were consulted, grey literature was searched, and the search was conducted within 24 months of completion of the review. Study selection and data extraction were conducted in duplicate with conflicts resolved between reviewers through discussion or consensus. Adequate detail was provided for included studies. A satisfactory technique for assessing risk of bias was used. The references for studies where authors of included studies had financial relationships with manufacturing organizations or were industry-funded, were provided. The discussion of the results included consideration of the risk of bias of individual studies. Heterogeneity of the included studies was discussed. There was no funding for the review and the review authors had no financial conflicts of interest. | An explanation for excluding observational studies was not provided. It is unclear whether context experts were consulted for additional studies. A list of all excluded studies with justification was not provided. |
Ontario Health (2021)10 | |
The research questions and inclusion criteria for the review included relevant populations, interventions, comparators, and outcomes. The protocol was established beforehand and was followed to conduct the review. For the search strategy, at least 2 databases were searched, key words and search terms were provided, reference lists were screened, study registries and experts were consulted, grey literature was searched, and the search was conducted within 24 months of completion of the review. Adequate detail was provided for included studies. A satisfactory technique for assessing risk of bias was used. The impact of risk of bias on MA findings was discussed. Studies where authors had financial relationships or funding from manufacturers were indicated. The authors addressed the heterogeneity of studies and used random effects models for MA. The authors discussed the risk of bias of studies, the quality of the body of evidence, and publication bias. | Explanations for study design selection and publication restrictions were not provided. Study selection and data extraction were conducted by a single reviewer. A list of all excluded studies with justification was not provided, however a sample was included in the appendices. It is unclear whether there were any potential conflicts of interest, or what the funding source of the review was. |
MA = meta-analysis.
Table 5: Strengths and Limitations of Clinical Studies Using the Downs and Black Checklist8
Strengths | Limitations |
|---|---|
Randomized controlled trials | |
McCarthy et al. (2021)11 | |
The objective, main outcomes, patient characteristics, intervention, and confounders were clearly described. The main findings for tolerability were clearly described. Exact probability values were reported for the primary outcome. The patients were blinded to the intervention they received. The statistical tests used to assess the main outcomes were appropriate. Since all patients were swabbed for PGx testing and clinicians for both groups were given reports (PGx test results for the intervention group and sham report in the comparator group), misclassification was likely low. Participants were recruited from similar populations (veteran centres) over the same period of time and analyses were adjusted for site. Patients were randomly assigned to intervention or comparator group. Confounding was considered in order to compare the intervention and comparator groups – analyses were adjusted for some covariates and demographic factors, and were compared between the 2 groups. The study had sufficient power to detect a moderate effect. | The main findings for CGI, remission, and depression were not clearly described with exact values. It is unclear what the quantity of adverse events were in each study group. Patients were lost to follow-up throughout the study and when results were stratified by risk category, loss to follow-up was higher in the comparator group than the intervention group suggesting potential selection bias. It is unclear whether the patients recruited, patients prepared to participate, or the staff, places, and facilities where patients were treated were representative as they were veterans receiving care in specific veteran centres in the US. It is unclear whether there was bias in recruitment as patients were referred by their clinician and were provided with free testing if they chose to participate. Those measuring the main outcomes of the intervention were not blinded. It is unclear whether the outcomes measured were valid or reliable as they relied on patient/clinician judgment. Since clinicians were not blind to study assignment, this may have biased results. Phenoconversion was a variable that may have affected the results and was not measured or accounted for. It is unclear how the authors’ conflicts of interest and study funding source may have affected the study. |
Papastergiou et al. (2021)12 | |
The objective, main outcomes, patient characteristics, intervention, confounders, and main findings were clearly described. Loss to follow-up was described in detail and the quantity was similar in both study groups (15%). Exact probability values were reported for study outcomes. The patients were blinded to the intervention they received. The statistical tests used to assess the main outcomes were appropriate and justification was provided. Confounding was considered to compare the intervention and comparator groups – analyses were adjusted for some covariates and demographic factors, and were compared between the 2 groups. Intent-to-treat and sensitivity analyses were conducted. Participants were recruited from similar populations (urban pharmacies) and analyses were adjusted for site. The patients were all recruited over the same period of time. Patients were randomly assigned to intervention or comparator group. The study had sufficient power to detect effects after 6 months. | It is unclear what the quantity of adverse events were in each study group. Since the study setting was in urban pharmacies in Ontario, Canada, findings may not be generalizable to pharmacies in other settings; the patients, staff, places, facilities, and 6-month follow-up of care may not be representative to care that majority of patients receive. There may have been potential bias due to prescribers and assessors not being blinded, and thus patients potentially knowing their assignment. For inclusion in the study, pharmacists decided which patients may not have been satisfied with their current medications and may be interested in participating. After receiving test results, pharmacists made recommendations to prescribers, who may or may not have implemented recommendations. This may have introduced bias due to noncompliance, misclassification bias, performance bias, or made outcome measurements not reliable. There was not enough power to include sex as a predictor in analyses, and not all possible covariates or effect modifiers were measured and accounted for. Patient medication history was not collected and could not be assessed as a potential moderator of the effect of PGx testing. The study did not have sufficient power to compare treatment recommendations across groups and how blinding may have affected results. |
Ruaño et al. (2020)13 | |
The objective, main outcomes, patient characteristics, intervention, confounders, and main findings were clearly described. The random variability in data for the main outcomes is provided and distribution of the data was accounted for. There was no loss to follow-up. Where probability values were provided, they were reported sufficiently. All patients received their allocated intervention and were measured at follow-up. The LOS outcome maybe have been valid and reliable as it can be objectively measured. Participants were recruited from the same site. Patients were randomly assigned to intervention or comparator group. The randomization process resulted in adequate sample sizes for the study groups. | Adverse events were not described in detail. It is unclear whether the patients recruited, patients prepared to participate, or the staff, places, and facilities where patients were treated were representative of the population from which they were recruited as they are all from a single site. Blinding of patients or study personnel was not mentioned. The plan for statistical analyses was not clearly described in detail. It is unclear if the intervention was applied in the intervention group (i.e., whether the physician used the PGx results). The guidance for patients on standard and low doses was similar and may have influenced the results if physicians ignored the PGx results when using low treatment dose. It is unclear whether patients were recruited over the same time period. Blinding of patients or study personnel was not described. Although covariates were measured, it is unclear if they were adjusted for and how they impacted the results. Unknown variables, comorbidities, or inadequate community placement may have affected the results. The RAR outcome may not have been valid and since it was measured by looking in the EMR for readmission to the study site only, and patients who were readmitted at other sites would have been counted as not have RAR data. |
Ruaño et al. (2021)14 | |
The objective, main outcomes, patient characteristics, intervention, confounders, and main findings were clearly described. The random variability in data for the main outcomes is provided and distribution of the data was accounted for. Probability values were provided with exact values. Patients and physicians were blinded to study assignment. The statistical tests used to assess the main outcomes were appropriate and described data distribution. The subanalysis accounted for confounders that were not previously adjusted for. The LOS outcome maybe have been valid and reliable as it can be objectively measured. Participants were recruited from the same site and over the same period of time. Patients were randomly assigned to intervention or comparator group. | Adverse events were not described in detail. It is unclear whether the patients recruited, patients prepared to participate, or the staff, places, and facilities where patients were treated were representative of the population from which they were recruited as they are all from a single site. It is unclear if the intervention was applied in the intervention group (i.e., whether the physician used the PGx results). The RAR outcome may not have been valid and since it was measured by looking in the EMR for readmission to the study site only, and patients who were readmitted at other sites would have been counted as not have RAR data. It is unclear if the subanalysis had sufficient power. |
Zastrozhin et al. (2020)15 | |
The objective, main outcomes, patient characteristics, intervention, confounders, and main findings were clearly described. The random variability in data for the main outcomes is provided. Side effects were measured throughout the study. Where probability values were provided, they were reported sufficiently. The physicians were blinded to study assignment. The statistical tests used to assess the main outcomes were appropriate. Analysis type was informed by the normality of the data. Covariates across the 2 groups were described. Participants were recruited from the same site and over the same period of time. Patients were randomly assigned to intervention or comparator group. The study had sufficient power to detect effects. | Details about loss to follow-up, if any, or missing data were not described. It is unclear whether the patients recruited, patients prepared to participate, or the staff, places, and facilities where patients were treated were representative of the population from which they were recruited as they are all males from a single site in Moscow, Russia. It is unclear if patients were blinded. It is unclear whether there was any noncompliance or misclassification bias. It is unclear whether the main outcomes measured by psychometric scales were valid or reliable as they relied on patient/clinician judgment. Since the study took place over a short time period, there may not have been enough time to capture outcome changes which may have occurred after the study. |
Non-randomized study | |
Huilei et al. (2020)16 | |
The objective, main outcomes, patient characteristics, intervention, confounders, and main findings were clearly described. Side effects were measured throughout the study. Exact probability values were reported for study outcomes. Patients and outcome assessors were blind to study treatment. The statistical tests used to assess the main outcomes were appropriate. Participants were recruited from the same site. Confounding was considered in order to compare the intervention and comparator groups, and demographic factors were similar between the 2 groups. | Random variability in the data for the main outcome were not clearly described. It is unclear whether patients recruited into the study had been lost to follow-up over the course of the study or had missing data. It is unclear whether the patients recruited, patients prepared to participate, or the staff, places, and facilities where patients were treated were representative as they were patients from 1 hospital in Nanchong, China. It is unclear whether the main outcomes measured by CGI-EI were valid or reliable as they relied on clinician judgment. It is unclear whether patients were recruited over the same time period. It is unclear how patients were allocated into study groups; randomization or allocation methods were not described. The study’s sample size was not large enough to draw conclusions from the results. The funding source was not reported. |
Cohort study with historical control | |
Bättig et al. (2020)17 | |
The objective, main outcomes, patient characteristics, intervention, confounders, and main findings were clearly described. The random variability in data for the main outcomes is provided. Medication changes because of adverse drug reactions were measured. Exact probability values were reported for study outcomes. Outcomes such as AD switches and LOS maybe have been more valid and reliable as they can be objectively measured. Participants were recruited from the same site. Authors indicated that they had no conflicts of interest. | It is unclear whether there were missing patients or missing data at any point in the study. It is unclear whether the patients recruited, patients prepared to participate, or the staff, places, and facilities where patients were treated were representative as they were patients from 1 hospital in Eltville, Germany. Blinding of patients or study personnel was not described. Results may be explained by placebo effects. There is the potential of selection bias since patients with a longer disease history may have been the ones offered genotyping. It is unclear whether the outcomes measured by BDI-II or GAF were valid or reliable as they relied on patient/clinician judgment. Patients were not randomized to study assignment. Confounding was considered to compare the intervention and comparator groups however it is unclear whether adjustments were made for variables that were different between the 2 groups. The study’s sample size was not large enough and may have biased the results. It is unclear if the statistical tests used to assess the main outcomes were appropriate and if they accounted for small sample size. The funding source was not reported. |
Uncontrolled before-and-after studies | |
Collins et al. (2020)18 | |
The objective, main outcomes, patient characteristics, intervention, confounders, and main findings were clearly described. Random variability was reported for main outcomes. Adverse events were measured. Exact probability values were reported for study outcomes. Participants were recruited from the same site. Confounders were considered in analyses. | Loss to follow-up reasons were described and analyzed, however they were many patients lost to follow-up (> 30%). It is unclear whether the patients recruited, patients prepared to participate, or the staff, places, and facilities where patients were treated were representative as they were patients from inpatient units in 1 centre in the US. Blinding of patients or study personnel was not described. There may have been a placebo effect due to knowing that PGx testing or medication changes had occurred. It is unclear if the intervention was applied in the intervention group (i.e., whether the clinical team used the PGx results). It is unclear whether the outcomes measured by ASEC were valid or reliable as they relied on patient/clinician judgment. It is unclear whether all patients were recruited over the same time period. Patients were not randomized to study assignment. The study’s sample size was not large enough and may have biased the results. It is unclear if the statistical tests used to assess the main outcomes were appropriate and if they accounted for small sample size. The short study duration (30-day follow-up) may not have been enough time to see results. It is unclear how the authors’ conflicts of interest and study funding source may have affected the study. |
Kierce et al. (2019)19 | |
The objective, main outcomes, patient characteristics, intervention, and main findings were clearly described. The exact probability value for the main outcome was reported. Participants were recruited from the same site. Authors indicated that they had no conflicts of interest. | Random variability was not reported for main outcomes. It is unclear if adverse events were recorded beyond the main outcome. It is unclear whether there were missing patients or missing data at any point in the study. It is unclear whether the patients recruited, patients prepared to participate, or the staff, places, and facilities where patients were treated were representative as they were patients from 1 outpatient psychiatric practice in Nashville, US. Blinding of patients or study personnel was not described. Patient follow-up time varied and it is unclear how this was adjusted for. Since the study took place over a short time period, there may not have been enough time to capture outcome changes which may have occurred after the study. Although some demographic variables were measured, the results may have been biased by the study’s small sample size, psychosocial circumstances, duration of depressive episodes, or potential placebo effects. It is unclear whether the outcomes measured by PHQ-9 were valid or reliable as they relied on patient/clinician judgment. Patients were not randomized to study assignment, and it is unclear if there was any bias due to physician recommendation that their patient receive testing. It is unclear if the statistical tests used to assess the main outcomes were appropriate and if they accounted for small sample size. The funding source was not reported. |
AD = antidepressant; ASEC = Antidepressant Side-Effect Checklist; BDI-II = Beck Depression Inventory-Second Edition; CGI = Clinical Global Impression; CGI-EI = Clinical Global Impression - Efficacy Index; EMR = electronic medical record; GAF = Global Assessment of Functioning; LOS = length of stay; PHQ-9 = Patient Health Questionnaire-9; RAR = readmission rate.
Appendix 4: Main Study Findings
Table 6: Summary of Findings by Outcome ― Effectiveness
Study citation and study design | Detailed findings |
|---|---|
Length of stay in hospital | |
Bättig et al. (2020)17 Cohort study with historical control |
|
Ruaño et al. (2020)13 RCT |
|
Ruaño et al. (2021)14 (subanalysis of Ruaño et al., 202013) RCT |
“Functional stratification and Group X Function interaction was examined controlling for age and ethnicity. Covariate analysis for demographics revealed a significant effect of age and race on LOS. Older patients stayed longer (p < 0.0001). Latino patients had a significantly shorter stay (p < 0.0001). Adjusted for age, gender, and ethnicity, the Group X Function interaction (2-way ANOVA) of log10(LOS) for 601 patients was statistically significant (P = 0.0456) (p. 5).”14 |
Response to treatment | |
Aboelbaha et al. (2021)9 SR | SR/MA results Fabbri et al. (2018)
Rosenblat et al. (2018)
Brown et al. (2020)
RCT results Han et al. (2018)
Greden et al. (2019)
Thase et al. (2019)
|
Ontario Health (2021)10 HTA | “Overall, we found inconsistent outcome reporting and inconsistent findings across the six multi-gene pharmacogenomic tests with decision-support tools identified (p. 51).”10 Depression
Response
|
Huilei et al. (2020)16 NRS | Total E-Index from all follow-ups combined (398 data points) was significantly different in the PGx test compared to the standard care group (400 data points) (χ2 = 13.137; P = 0.000).
Treatment efficacy (PGx vs. standard care)
|
Bättig et al. (2020)17 Cohort study with historical control | Depression and functioning
|
Kierce et al. (2019)19 Uncontrolled before-and-after study | Depression (PHQ-9)
“Compared with baseline PHQ-9 scores, follow-up scores ranged from a 5-point reduction to a 2-point increase in depressive symptoms. […] The differences in baseline and follow-up PHQ-9 scores were not statistically significant at P =.21 (p. 499).”19 |
McCarthy et al. (2021)11 RCT | Clinical impression of mental illness (CGI)
Depression (QIDS-SR)
|
Papastergiou et al. (2021)12 RCT | Depression (PHQ-9)
Anxiety (GAD-7)
Functional impairment (SDS)
Treatment satisfaction (SATMEDQ)
“Only age demonstrated significant effects across all outcomes, such that younger age was associated with better outcomes (p. 1363-1364).”12 |
Zastrozhin et al. (2020)15 RCT | Anxiety/depression (HAM-D scores presented as median [IQR1:IQR3]) Between-group differences
Within-group differences
|
Remission from depression | |
Aboelbaha et al. (2021)9 SR | SR/MA results Fabbri et al. (2018)
Rosenblat et al. (2018)
Brown et al. (2020)
RCT results Han et al. (2018)
Greden et al. (2019)
Thase et al. (2019)
|
Ontario Health (2021)10 HTA |
|
McCarthy et al. (2021)11 RCT | No significant differences in remission between groups at 8-week follow-up.
|
Δ = change; AD = antidepressant; ANOVA = Analysis of variance; BD = bipolar disorder; BDI/BDI-II = Beck Depression Inventory; CGI/CGI-S = Clinical Global Impression; CI = confidence interval; GAD-7 = General Anxiety Disorder-7; GAF = Global Assessment of Functioning; GRADE = Grading of Recommendations Assessment, Development and Evaluation; HADS = Hospital Anxiety and Depression Scale; HAM-D/HAMD/HAM-D16/HAM-D17 = Hamilton Depression Rating Scale; HTA = health technology assessment; IQR1/IQR3 = interquartile range; LOS = length of stay; MDD = major depressive disorder; NNT = number needed to treat; NRS = non-randomized study; OR = odds ratio; PACS = Penn Alcohol Craving Scale; PGx/PGX = pharmacogenomic; PHQ-9 = Patient Health Questionnaire; PTSD = posttraumatic stress disorder; QIDS-SR/QIDS-C16 = Quick Inventory of Depressive Symptomatology; RAR = readmission rate; RCT = randomized controlled trial; RR = relative risk; SATMEDQ = Treatment Satisfaction with Medicines Questionnaire; SD = standard deviation; SDS = Sheehan Disability Scale; SE = standard error; SIGH-D17 = Structured Interview Guide for the Hamilton Depression Rating Scale; SR = systematic review; TAU = treatment as usual; vs. = versus.
Table 7: Summary of Findings by Outcome ― Safety
Study citation and study design | Detailed findings |
|---|---|
Side effects | |
Aboelbaha et al. (2021)9 SR | Overall minimal evidence on safety outcomes and inconsistency in results. SR/MA results Fabbri et al. (2018)
RCT results Han et al. (2018)
Greden et al. (2019)
|
Ontario Health (2021)10 HTA | “ [..] the impact of testing on adverse side effects from medication selection was inconsistent and uncertain, with little to no difference observed for some tests (i.e., GeneSight, Genecept, and an unspecified test), while the remaining tests reported some improvement (p. 52).”10 |
Huilei et al. (2020)16 NRS | PGx group had fewer side effects than control group.
|
Collins et al. (2020)18 Uncontrolled before-after study |
|
McCarthy et al. (2021)11 RCT | Side effects were common in PGx and usual care groups, not significant changes during trial. No significant difference in side effect burden. “The PGX patients in the moderate-risk subgroup again had a significant improvement in side effect burden compared to TAU (for group × risk interaction P = 0.00001, remains significant after the Bonferroni correction of α = 0.0125 for four comparisons of side effect × risk category). In contrast, high-risk patients had the opposite pattern: PGX subjects in the high-risk group had the highest side effect burden of any group (i.e., more than high-risk TAU subjects and both moderate-risk groups) and did not improve over time to the same extent as TAU. The explanation of these discrepant findings is differential rates of dropout from the study (p. 997).”11 |
Zastrozhin et al. (2020)15 RCT | Side effects (UKU scores presented as median [IQR1:IQR3]) Between-group differences
Within-group differences
|
Adverse events | |
Aboelbaha et al. (2021)9 SR | SR/MA results Fabbri et al. (2018)
|
Ontario Health (2021)10 HTA | No results found for suicide. |
Ruaño et al. (2020)13 RCT | Readmission rate within 30 days after discharge
|
Ruaño et al. (2021)14 (subanalysis of Ruaño et al., 202013) RCT | Readmission rate within 30 days after discharge
|
AD = antidepressant; AE = adverse event; ASEC = Antidepressant Side-Effect Checklist; BD = bipolar disorder; BDI/BDI-II = Beck Depression Inventory; CGI/CGI-S = Clinical Global Impression; CI = confidence interval; ECT = electroconvulsive therapy; FIBSER = Frequency, Intensity, Burden of Side Effects Rating; GAD-7 = General Anxiety Disorder-7; GAF = Global Assessment of Functioning; GDI = gene-drug interaction; h = hours; HADS = Hospital Anxiety and Depression Scale; HAM-D/HAMD/HAM-D16/HAM-D17 = Hamilton Depression Rating Scale; HTA = health technology assessment; LOS = length of stay; NNT = number needed to treat; NRS = non-randomized study; PACS = Penn Alcohol Craving Scale; PGx/PGX = pharmacogenomic; PHQ-9 = Patient Health Questionnaire; PTSD = posttraumatic stress disorder; QIDS-SR/QIDS-C16 = Quick Inventory of Depressive Symptomatology; RAR = readmission rate; RCT = randomized controlled trial; RR = relative risk; SATMEDQ = Treatment Satisfaction with Medicines Questionnaire; SD = standard deviation; SDS = Sheehan Disability Scale; SE = standard error; SIGH-D17 = Structured Interview Guide for the Hamilton Depression Rating Scale; SR = systematic review; TAU = treatment as usual; UKU = UKU Side-Effect Rating Scale; vs. = versus.
Table 8: Summary of Findings by Outcome ― Medication
Study citation and study design | Detailed findings |
|---|---|
Ontario Health (2021)10 HTA | No results found for treatment adherence. |
Bättig et al. (2020)17 Cohort study with historical control | AD switches
AD therapy delay
|
Collins et al. (2020)18 Uncontrolled before-after study | “Of the 52 patients who completed the study, 36 (69.2%) had their medications changed by the 30 days follow-up, and 43 (82.7%) were “compatible” with their follow-up medications. Of the 14 patients considered “high risk” of DGI on admission, 6 were lost to follow-up. The 8 who completed remained incompatible with their medications at follow-up. Five of the 8 underwent a medication change. In this high risk group, oneway analysis of change in ASEC score by whether medications were changed showed a non-significant result (P = 0.29) (p. 108).”18 |
Kierce et al. (2019)19 Uncontrolled before-after study | 6/15 participants prescribed single drug with significant drug–gene interactions. No participants prescribed > 1 drug with significant drug–gene interactions. “After provider review, medications with significant drug–gene interactions were eliminated from the medication regimen for three of the six participants. Providers deemed it to be in the best interest of the remaining three participants to continue medications with significant drug–gene interactions. One interaction was noted to be “reduced efficacy,” though the patient responded well to the medication and preferred not to change antidepressants despite test results. The other 2 patients had red bin medications with dose adjustment recommendations that did not necessitate discontinuing medication. Provider use of pharmacogenetic test data resulted in a 20% decrease in prescribed red bin medications (p. 499).”19 |
McCarthy et al. (2021)11 RCT | Prescribers asked how PGx test was used
Dosing decisions
|
Papastergiou et al. (2021)12 RCT | Accepted recommendations
“Recommendations were made for the majority of participants (n = 204); although the number of recommendations per participant ranged from one to five, most received one (n = 124) or two (n = 60) (p. 1364-1365).”12 “Pharmacist recommendations did not differ across study groups: there was no difference in the number of participants who received pharmacist recommendations (χ2 = 0.37, P = 0.54) or the number of pharmacist recommendations made (χ2 = 1.57, P = 0.81) across study groups (p. 1365).”12 “Pharmacist recommendations were also more commonly accepted when medication costs were covered by third parties or provincial drug coverage (χ2=9.54, P = 0.02 (p. 1365).”12 “Prescriber acceptance of pharmacist recommendations did not differ across the pharmacy sites (χ2 = 0.29, P = 0.59) or by prescriber (χ2 = 1.53, P = 0.68) (p. 1365).”12 |
Ruaño et al. (2020)13 RCT |
|
Ruaño et al. (2021)14 (subanalysis of Ruaño et al., 202013) RCT | Drug prescribing overlapped between the PGx and standard care groups (number of recipients exceeded number of patients because a patient could count as recipient > 1 time if they were prescribed > 1 drug) “A greater number of drug administrations, 21.8 per patient, were given to subfunctional patients in Group S (over 1922 administrations) than to any of the other 3 subgroups. The other drug administrations were 14.8 per patient in Group S–functional (over 1766 administrations), 16.5 in Group G–functional (over 3540 administrations), and 16.2 in Group G–subfunctional (over 2911 administrations). Patients in these other 3 subgroups were given an average of 16.0 drug administrations per patient (over 8217 total administrations). […] for the subfunctional patients in Group G the mean number of administrations of CYP2D6 major substrate drugs per patient (7.9 administrations) was significantly lower than for the subfunctional patients in Group S (11.3) at the P = 0.05 level, but not significantly different from the functional patients in either Group G (9.3 administrations) or Group S (8.2) (p. 6).”14 |
AD = antidepressant; ASEC = Antidepressant Side-Effect Checklist; CGI/CGI-S = Clinical Global Impression; DGI = drug-genotype interaction; ECT = electroconvulsive therapy; HTA = health technology assessment; PGx/PGX = pharmacogenomic; RCT = randomized controlled trial.
Appendix 5: Overlap Between Included Systematic Reviews
Note that this appendix has not been copy-edited.
Table 9: Overlap in Relevant Primary Studies Between the Included Systematic Review and the Health Technology Assessment
Primary study citation | Aboelbaha et al. (2021)9 | Ontario Health (2021)10 |
|---|---|---|
Dunlop BW, et al. BMC Psychiatry. 2019;19(1):420. | No | Yes |
Forester BP, et al. Am J Geriatr Psychiatry. 2020;28(9):933-945. | No | Yes |
Greden JF, et al. Psychiatr Res. 2019;111:59-67. | Yes | Yes |
Han C, et al. Clin Psychopharmacol Neurosci. 2018;16(4):469-480. | Yes | Yes |
Menchon JM, et al. J Neural Transm (Vienna). 2019;126(1):95-99. | No | Yes |
Perlis RH, et al. Depress Anxiety. 2020;37(9):834-841. | No | Yes |
Thase ME, et al. J Clin Psychiatry. 2019;80(6):19m12910. | Yes | Yes |
Appendix 6: References of Potential Interest
Note that this appendix has not been copy-edited.
Previous CADTH Reports
Li KX, Loshak H. Pharmacogenomic testing in depression: a review of clinical effectiveness, cost-effectiveness, and guidelines. (CADTH Rapid response report: summary with critical appraisal). Ottawa (ON): CADTH; 2020: https://cadth.ca/pharmacogenomic-testing-depression-review-clinical-effectiveness-cost-effectiveness-and-guidelines. Accessed 2021 Nov 10.
Review Articles
Bousman CA, Bengesser SA, Aitchison KJ, et al. Review and consensus on pharmacogenomic testing in psychiatry. Pharmacopsychiatry. 2021;54(1):5-17. PubMed
Eap CB, Grunder G, Baumann P, et al. Tools for optimising pharmacotherapy in psychiatry (therapeutic drug monitoring, molecular brain imaging and pharmacogenetic tests): focus on antidepressants. World J Biol Psychiatry. 2021;22(8):561-628. PubMed
Zanardi R, Manfredi E, Montrasio C, Colombo C, Serretti A, Fabbri C. Pharmacogenetic-guided treatment of depression: real-world clinical applications, challenges, and perspectives. Clin Pharmacol Ther. 2021;110(3):573-581. PubMed
Zanardi R, Prestifilippo D, Fabbri C, Colombo C, Maron E, Serretti A. Precision psychiatry in clinical practice. Int J Psychiatry Clin Pract. 2021;25(1):19-27. PubMed
Arandjelovic K, Eyre HA, Lenze E, Singh AB, Berk M, Bousman C. The role of depression pharmacogenetic decision support tools in shared decision making. J Neural Transm. 2019;126(1):87-94. PubMed
Vilches S, Tuson M, Vieta E, Alvarez E, Espadaler J. Effectiveness of a pharmacogenetic tool at improving treatment efficacy in major depressive disorder: a meta-analysis of three clinical studies. Pharmaceutics. 2019;11(9):02.
Ongoing Clinical Trials
Massachusetts General Hospital. NCT03749629: Comparative Effectiveness of Pharmacogenomics for Treatment of Depression (CEPIO-D). ClinicalTrials.gov. Bethesda (MD): U.S. National Library of Medicine; 2021: https://clinicaltrials.gov/ct2/show/NCT03749629. Accessed 2021 Nov 11.
Weill Medical College of Cornell University. NCT03952494: Individualizing antidepressant treatment using pharmacogenomics and EHR-driven clinical decision support (MyGenes). ClinicalTrials.gov. Bethesda (MD): U.S. National Library of Medicine; 2021: https://clinicaltrials.gov/ct2/show/NCT03952494. Accessed 2021 Nov 11.
Assurex Health Inc. NCT02466477: Pharmacogenomic decision support with GeneSight Psychotropic to guide the treatment of major depressive disorder. ClinicalTrials.gov. Bethesda (MD): U.S. National Library of Medicine; 2020: https://clinicaltrials.gov/ct2/show/NCT02466477. Accessed 2021 Nov 11.
Seattle Institute for Biomedical and Clinical Research. NCT03468309: Medication optimization using pharmacogenetic testing and the G-DIG to reduce polypharmacy in a mental health population (MedOPT). ClinicalTrials.gov. Bethesda (MD): U.S. National Library of Medicine; 2019: https://clinicaltrials.gov/ct2/show/NCT03468309. Accessed 2021 Nov 11.
Protocols
Ginsburg GS, Cavallari LH, Chakraborty H, et al. Establishing the value of genomics in medicine: the IGNITE Pragmatic Trials Network. Genet Med. 2021;23(7):1185-1191. PubMed
Oslin DW, Chapman S, Duvall SL, et al. Study design and implementation of the PRecision Medicine In MEntal health Care (PRIME Care) Trial. Contemp Clin Trials. 2021;101:106247. PubMed
Tsermpini EE, Skokou M, Ferentinos P, et al. Clinical implementation of preemptive pharmacogenomics in psychiatry: Tauhe “PREPARE” study. Psuhiatrike. 2020;31(4):341-351. PubMed
Manzor Mitrzyk B, Kadri R, Farris KB, et al. Using pharmacogenomic testing in primary care: protocol for a pilot randomized controlled study. JMIR Res Protoc. 2019;8(8):e13848. PubMed
Primary Study With Mixed Age Population
Brown L, Li J, Katel N, et al. Pharmacogenetic testing in an academic psychiatric clinic: a retrospective chart review. J Pers Med. 2021;11(9):08.
Relevant Abstract
Parikh SV, Khazanov GK, Thase ME, et al. Safety of using a combinatorial pharmacogenomic test for patients with major depressive disorder in the GUIDED trial. CNS Spectr. 2021;26(2):169-170. PubMed
ISSN: 2563-6596
Disclaimer: The information in this document is intended to help Canadian health care decision-makers, health care professionals, health systems leaders, and policy-makers make well-informed decisions and thereby improve the quality of health care services. While patients and others may access this document, the document is made available for informational purposes only and no representations or warranties are made with respect to its fitness for any particular purpose. The information in this document should not be used as a substitute for professional medical advice or as a substitute for the application of clinical judgment in respect of the care of a particular patient or other professional judgment in any decision-making process. The Canadian Agency for Drugs and Technologies in Health (CADTH) does not endorse any information, drugs, therapies, treatments, products, processes, or services.
While care has been taken to ensure that the information prepared by CADTH in this document is accurate, complete, and up to date as at the applicable date the material was first published by CADTH, CADTH does not make any guarantees to that effect. CADTH does not guarantee and is not responsible for the quality, currency, propriety, accuracy, or reasonableness of any statements, information, or conclusions contained in any third-party materials used in preparing this document. The views and opinions of third parties published in this document do not necessarily state or reflect those of CADTH.
CADTH is not responsible for any errors, omissions, injury, loss, or damage arising from or relating to the use (or misuse) of any information, statements, or conclusions contained in or implied by the contents of this document or any of the source materials.
This document may contain links to third-party websites. CADTH does not have control over the content of such sites. Use of third-party sites is governed by the third-party website owners’ own terms and conditions set out for such sites. CADTH does not make any guarantee with respect to any information contained on such third-party sites and CADTH is not responsible for any injury, loss, or damage suffered as a result of using such third-party sites. CADTH has no responsibility for the collection, use, and disclosure of personal information by third-party sites.
Subject to the aforementioned limitations, the views expressed herein are those of CADTH and do not necessarily represent the views of Canada’s federal, provincial, or territorial governments or any third-party supplier of information.
This document is prepared and intended for use in the context of the Canadian health care system. The use of this document outside of Canada is done so at the user’s own risk.
This disclaimer and any questions or matters of any nature arising from or relating to the content or use (or misuse) of this document will be governed by and interpreted in accordance with the laws of the Province of Ontario and the laws of Canada applicable therein, and all proceedings shall be subject to the exclusive jurisdiction of the courts of the Province of Ontario, Canada.
The copyright and other intellectual property rights in this document are owned by CADTH and its licensors. These rights are protected by the Canadian Copyright Act and other national and international laws and agreements. Users are permitted to make copies of this document for non-commercial purposes only, provided it is not modified when reproduced and appropriate credit is given to CADTH and its licensors.
About CADTH: CADTH is an independent, not-for-profit organization responsible for providing Canada’s health care decision-makers with objective evidence to help make informed decisions about the optimal use of drugs, medical devices, diagnostics, and procedures in our health care system.
Funding: CADTH receives funding from Canada’s federal, provincial, and territorial governments, with the exception of Quebec.
Questions or requests for information about this report can be directed to Requests@CADTH.ca