CADTH Health Technology Review
Bone Growth Stimulators for Treatment of Adults with Bone Disease or Injury
Rapid Review
Authors: Khai Tran, Jennifer Horton
Abbreviations
AE
adverse event
CCS
capacitive coupling stimulation
CI
confidence interval
CMF
combined magnetic field
DCS
direct current stimulation
HR
hazard ratio
HRQoL
health-related quality of life
ICER
incremental cost-effectiveness ratio
ICS
inductive coupling stimulation
LIPUS
low intensity pulsed ultrasound
OR
odds ratio
PEMF
pulsed electromagnetic field
QALY
quality-adjusted life-year
RCT
randomized controlled trial
RoB
risk of bias
RR
risk ratio
SF-36
short form-36
SR
systematic review
VAS
visual analogue scale
WTP
willingness to pay
Key Messages
Electrical stimulation and low intensity pulsed ultrasound technologies for bone healing may have some beneficial effects on radiographic assessment outcomes (e.g., spinal fusion rate, radiographic nonunion rates, number of days to radiographic healing) and clinical assessment outcomes (e.g., mouth opening, wrist and shoulder mobility, exteroceptive sensation, and wound healing), but may not improve outcomes that are important to patients (e.g., functional recovery). Pain may be reduced by electrical bone growth stimulation devices, but not by low intensity pulsed ultrasound.
No adverse events (AEs) related to the low intensity pulsed ultrasound device were reported. It is unknown if there are AEs related to electrical stimulation devices (no evidence found).
Low intensity pulsed ultrasound for treatment of fresh tibial fractures was not cost-effective compared with placebo from either a payer perspective or societal perspective within the Canadian context.
It is unknown if electrical bone growth stimulator devices are cost-effective (no evidence found).
Context and Policy Issues
Bone fracture is common and often results in pain, loss of function, and decreased productivity, causing considerable burden to the individuals and society.1 Among Canadians 40 years and older, more than 1.8 million fractures at skeletal sites were identified over a surveillance period of 15 years (2000/2001 to 2015/2016).1 The most common fracture occurred at the forearm, followed by fractures of the hip, spine, humerus, and pelvis.1 Various approaches and modalities including bone growth stimulators have been developed and tested over the past few decades for the induction and stimulation of bone growth and repair with the idea of speeding or enhancing healing.2,3 A cross-sectional survey of 450 Canadian orthopedic trauma surgeons in 2008 found that nearly half of respondents were using bone growth stimulators for the management of tibial fractures, with low intensity pulsed ultrasound (LIPUS) and electrical stimulation were equally popular.4
Bone growth stimulators such as LIPUS2 and electrical bone growth stimulation3 might promote bone growth at the site of fracture or osteotomy. LIPUS treatment for bone repair delivers non-invasive soundwaves, which induce and stimulate molecular and cellular responses in fracture healing.2 There are 3 types of electrical stimulation therapies, namely direct current stimulation (DCS), capacitive coupling stimulation (CCS), and inductive coupling stimulation (ICS), also known as pulsed electromagnetic field (PEMF) therapy.3 DCS requires a surgically implantable device that delivers direct current electrical stimulation to the appropriate locations.3 In contrast to DCS, CCS and ICS are non-invasive, with the device apparatus is completely external.3 The detailed mechanisms by which electrical stimulation promotes bone healing are poorly understood, although pre-clinical studies have suggested that electrical stimulation might influence the behaviours and functions of bone-forming stem cells.5
For decades, electrical stimulation and LIPUS has been studied and used in clinical practice to stimulate bone healing.2,3 However, the clinical results obtained are inconsistent.2,3,6 The potential effective role of these technologies depend on the medical history, site and type of fracture, fresh fracture or delayed unions, type of device, and treatment modality.2,3 There were limited number of trials focusing on outcomes important to patients that renders clinical decision-making challenging.2,3
The aim of this report is to summarize the evidence regarding the clinical effectiveness and cost-effectiveness of bone growth stimulators for the treatment of bone disease or injury.
Research Questions
What is the clinical effectiveness of bone growth stimulators for the treatment of bone disease or injury?
What is the cost-effectiveness of bone growth stimulators for the treatment of bone disease or injury?
Methods
Literature Search Methods
A limited literature search was conducted by an information specialist on key resources including MEDLINE, the Cochrane Database of Systematic Reviews, the international HTA database, the websites of Canadian and major international health technology agencies, as well as a focused internet search. The search strategy comprised both controlled vocabulary, such as the National Library of Medicine’s MeSH (Medical Subject Headings), and keywords. The main search concept was bone growth stimulators. No filters were applied to limit the retrieval by study type. Where possible, retrieval was limited to the human population. The search was also limited to English language documents published between January 1, 2016 and August 30, 2021.
Selection Criteria and Methods
One reviewer screened citations and selected studies. In the first level of screening, titles and abstracts were reviewed and potentially relevant articles were retrieved and assessed for inclusion. The final selection of full-text articles was based on the inclusion criteria presented in Table 1.
Criteria | Description |
|---|---|
Population | Adults with bone disease or injury (e.g., fracture, nonunion, delayed union, and osteotomy) |
Intervention | Electric or ultrasound bone growth stimulator devices (alone or in combination with other interventions) |
Comparator | Usual care; sham therapy (i.e., placebo); no treatment with bone growth stimulators |
Outcomes | Q1: Clinical effectiveness (e.g., pain, radiographic nonunion, functionality, quality of life, safety [e.g., AEs]) Q2: Cost-effectiveness (e.g., cost per QALY) |
Study designs | HTAs, SRs, RCTs, non-randomized studies, and economic evaluations |
AE =adverse event; HTA = health technology assessment; QALY = quality-adjusted life-year; RCT = randomized controlled trial; SR = systematic review.
Exclusion Criteria
Articles were excluded if they did not meet the selection criteria outlined in Table 1, they were duplicate publications, or were published before 2016. Systematic reviews (SRs) in which all relevant studies were captured in other more recent or more comprehensive SRs were excluded. Primary studies retrieved by the search were excluded if they were captured in 1 or more included SRs.
Critical Appraisal of Individual Studies
The included publications were critically appraised by 1 reviewer using the following tools as a guide: A MeaSurement Tool to Assess systematic Reviews 2 (AMSTAR 2)7 for systematic reviews, the Downs and Black checklist8 for randomized and non-randomized studies, the Drummond checklist9 for economic evaluations. Summary scores were not calculated for the included studies; rather, the strengths and limitations of each included publication were described narratively.
Summary of Evidence
Quantity of Research Available
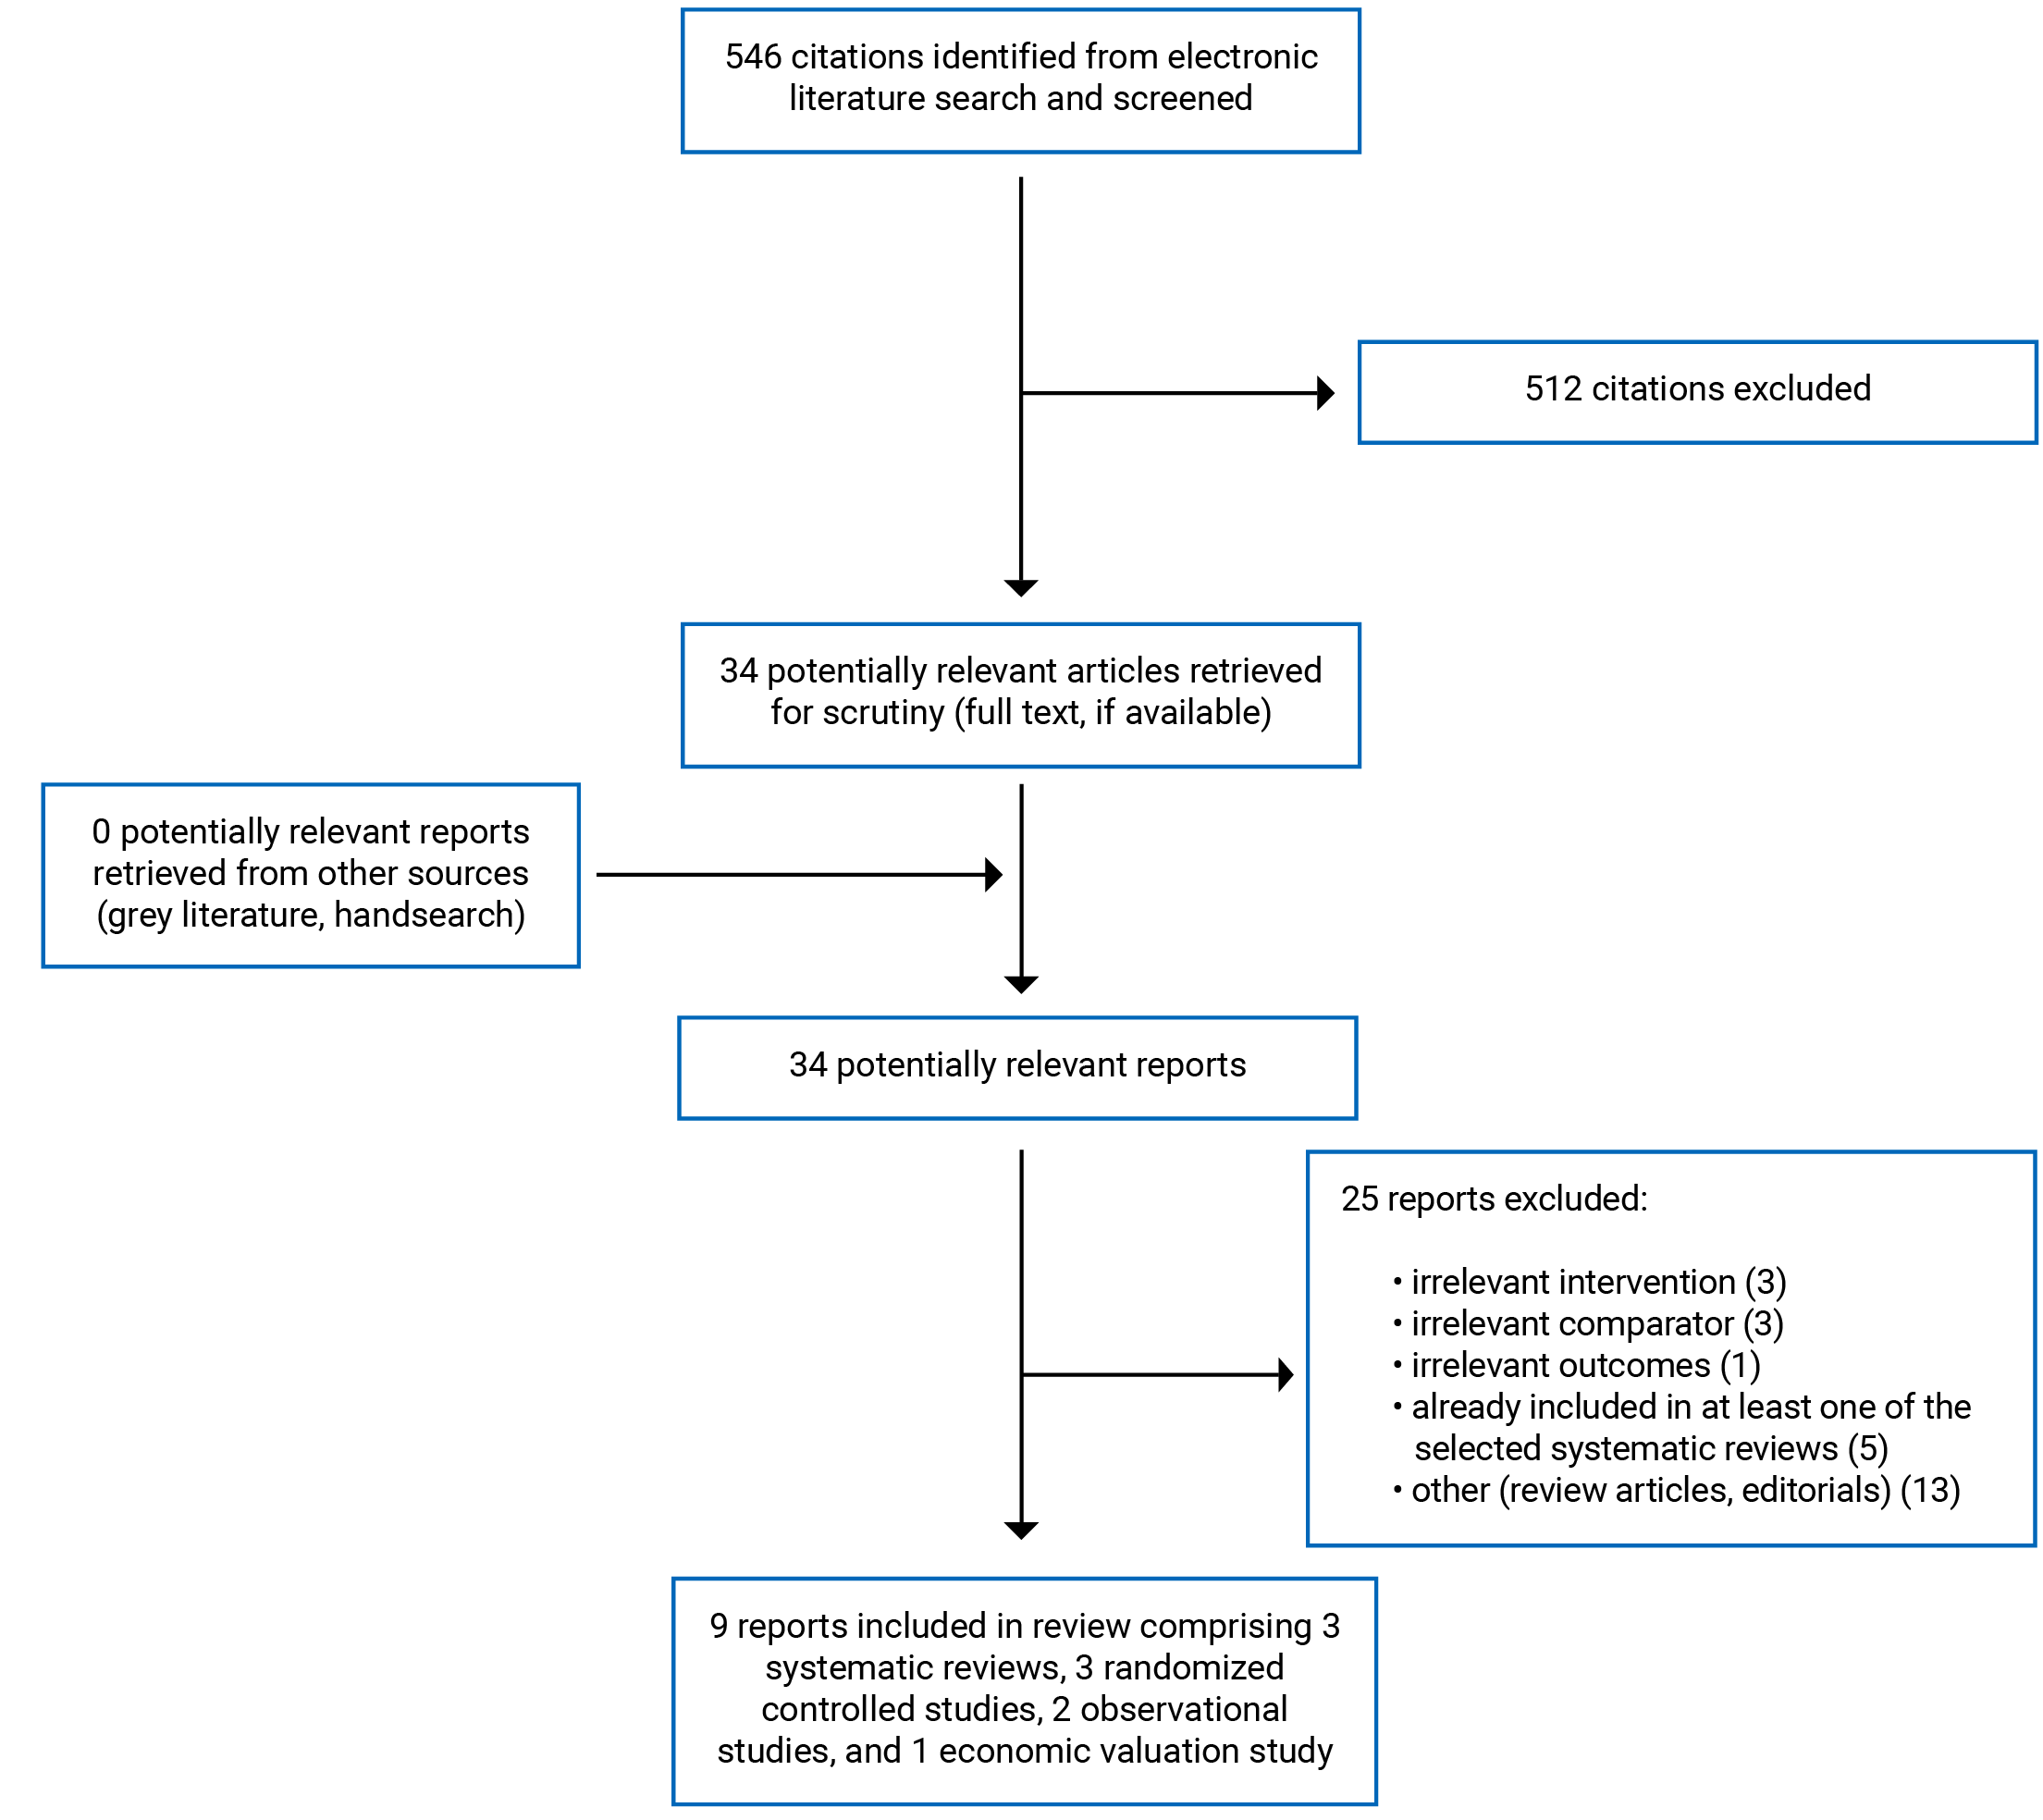
A total of 546 citations were identified in the literature search. Following screening of titles and abstracts, 512 citations were excluded and 34 potentially relevant reports from the electronic search were retrieved for full-text review. No potentially relevant publications were retrieved from the grey literature search for full-text review. Of these potentially relevant articles, 25 publications were excluded for various reasons, and 9 publications met the inclusion criteria and were included in this report. These comprised 3 SRs, 3 RCTs, 2 non-randomized studies, and 1 economic evaluation study.
Appendix 1 presents the PRISMA10 flow chart of the study selection. Additional reference of potential interest are provided in Appendix 6.
Summary of Study Characteristics
The detailed characteristics of the included SRs11-13 (Table 2), primary clinical studies14-18 (Table 3), and economic evaluation study19 (Table 4) are provided in Appendix 2.
Study Design
The SR by Cottrill et al. (2020)11 identified 16 studies, 13 of which (N = 2,144) had comparator groups and were included in the meta-analyses. The included studies were RCTs and non-randomized studies (retrospective and prospective cohort studies), which were published between 1990 and 2019. The SR by Schandelmaier et al. (2017)12 identified 26 RCTs, 23 of which (N = 1,594) were included in meta-analyses. The RCTs were published between 1997 and 2016. Two SRs11,13 had 3 overlapping RCTs. As 1 SR13 that was published in at an earlier date (i.e., 2016) included a total of 15 RCTs, 20% of its included studies overlapped with those in the SR11 published in 2020). Overlap of included studies between the 2 SRs is presented in Table 14 of Appendix 5.
The SR by Aleem et al. (2016)13 included 15 RCTs (N = 1,247), all of which were sham-controlled trials. The RCTs were published between 1984 and 2014.
The 5 included primary studies comprised 3 RCTs,14-16 1 retrospective cohort study,17 and 1 prospective cohort study.18 The studies were published between 2019 and 2020.
The economic evaluation study by Tarride et al. (2017)19 was a cost-utility analysis conducted using clinical data from the TRUST trial20 and cost data were from publicly available sources. Indirect costs were estimated based on the value of wage loss. Health-related quality of life (HRQoL) from the TRUST trial20 was used to derive quality-adjusted life-year (QALY). Costs were adjusted to Canadian dollars based on values from 2015. The analyses were conducted from a payer (direct costs) and societal (direct and indirect costs) perspectives over a 1-year time horizon.
Country of Origin
The SRs were conducted by authors from US11 and Canada.12,13
The primary clinical studies were conducted by authors from India,14 Iran,15 Spain,16 US,17 and Poland.18
The economic evaluation study was conducted by authors from Canada.19
Patient Population
Patients in the studies included in the SR by Cottrill et al. (2020)11 were adults with difficult-to-fuse spines; posterior or posterolateral lumbar fusion, cervical or lumbar/lumbosacral fusion; undergoing 1- or 2-level lumbar fusion with or without instrumentation; with autograft or allograft. Mean age and gender were not reported. Sample sizes ranged from 20 to 245 patients.
Patients in the RCTs included in the SR by Schandelmaier et al. (2017)12 were adults diagnosed with a variety of fractures (e.g., fresh fractures, non-operatively managed fresh fractures, and stress fractures), non-unions, and osteotomies. Twenty-five RCTs had adult patients with a mean age between 19 and 68 years. One RCT had patients with an age range between 15 and 35 years. The percent of male patients ranged between 15% and 100%. Sample sizes ranged between 8 and 501 patients.
Patients in the RCTs included in the SR by Aleem et al. (2016)13 were adults with acute fracture (tibia, scaphoid, femoral neck, and femoral diaphysis), posterolateral lumbar fusion (lumbar spine), un-instrumented fusion (lumbar spine), interbody fusion (lumbar spine), nonunion (tibia, femur), delayed union (tibia, long-bone), and osteotomy (tibia). Mean age was 45 years. The mean percent of male was 58.3% in the experimental arms and 56.3% in the placebo arms. Sample sizes ranged from 16 to 201 patients.
Patients in the included primary studies were adults with mandibular fracture,14,15 rib fracture,16 undergoing thoracolumbar fusion,17 and with distal radius fracture on cast immobilization surgery.18 Mean age ranged from 27 years to 64 years. The percent of male ranged from 13.5% to 75%. One study14 did not provide detailed characteristics of the included patients. The patient demographics of the other 4 studies15-18 appeared to be balanced between groups.
Patients in the economic evaluation study19 were adults from the TRUST trial20 (N = 501) with an open or closed tibial fracture. The mean age was 38 years with 69% male.
Interventions and Comparators
The SR by Cottrill et al. (2020)11 included studies comparing 3 types of electrical stimulation therapies used in spinal fusion (DCS, CCS, and ICS/PEMF) with inactive stimulator or no device as control.
The SR by Schandelmaier et al. (2017)12 included RCTs comparing LIPUS for bone healing with inactive device or no ultrasound as control. Twenty-four RCTs applied LIPUS for 20 minutes every day, either for a fixed period or until radiographic healing. One RCT applied LIPUS for 15 minutes a day, and another RCT for 5 minutes every second day.
The SR by Aleem et al. (2016)13 included randomized sham-controlled trials comparing electrical stimulators (i.e., DCS, CCS, and PEMF) for bone healing with placebo (inactive stimulator) as control.
The included primary studies compared LIPUS with placebo16 or no LIPUS14 as control, and PEMF with no PEMF15,18 as control. One study17 compared PEMF with combined magnetic field (CMF) stimulation and with no stimulation. Both PEMF and CMF are 2 commercially available types of ICS.
The authors of the included economic evaluation study19 conducted a cost-utility analysis comparing LIPUS with placebo for treatment of fresh tibial fractures.
Outcomes
The included outcomes considered in the included SRs11-13 and primary clinical studies14-18 were broadly categorized as radiographic assessment outcomes, clinical assessment outcomes, pain reduction, functional outcomes, and adverse events (AEs) related to device.
The radiographic assessment outcomes included fusion rate,11,17 nonunion rate,13 bone density,15 time to radiographic healing,12 radiographic or ultrasound assessment of fractures,14 and bone callus consolidation.16
The clinical assessment outcomes included maximum amount of mouth opening,15 number of sensory changes,15 malocclusion numbers,15 circumference of the limb, forearm and shoulder,18 wrist mobility,18 global wrist strength,18 touch sensation,18 upper limb disability evaluation,18 range of motion shoulder flexion,18 shoulder extension,18 shoulder abduction,18 elbow flexion,18 number of subsequent operations,12 wound healing assessment,14 and teeth mobility.14
Pain was measured using 10-point visual analogue score (VAS)15,16 or 100 mm VAS.12-14,18
The functional outcomes included the Short Form-36 (SF-36) scores,13 time to return to work,12 time to return to leisure activities,12 time to return to at least 80% of pre-injury level of function,12 time to return to full weight bearing,12 time to return to household activities,12 return to physical activity,16 and work activity (e.g., number of patients who were working and those who were not due to retirement or unemployment, and number of day sick leave).16
AEs related to the LIPUS procedure were reported in the SR by Schandelmaier et al. (2017)12 and 1 included RCT.16
The primary outcome in the economic evaluation study19 was an incremental cost-effectiveness ratio (ICER), which was calculated as the incremental cost per change QALY gained calculated from both a payer and societal perspectives.
Summary of Critical Appraisal
The detailed quality assessments of the SRs11-13 (Table 5), the primary clinical studies14-18 (Table 6), and the economic evaluation study19 (Table 7) are provided in Appendix 3.
All 3 included SRs11-13 were explicit in their objectives and inclusion criteria for the review, selection of the study designs for inclusion, and included a comprehensive literature search strategy. Providing details of the literature search strategy increases the reproducibility of the review. Study selection was performed in duplicate in all 3 SRs.11-13 Two SRs12,13 reported that data extraction was performed in duplicate, while 1 SR11 did not. None of the SRs11-13 reported whether a protocol had been published before the conduct of the review that may introduce bias in modifying the methods after the review had been conducted. Two SRs12,13 reported the sources of funding of the studies included in their review, while 1 SR11 did not. None of the included SRs provided a list of excluded studies. No justification of for the excluded studies could bias the results of the review. The characteristics of the included studies in all 3 SRs11-13 were described in adequate detail. Two SRs12,13 used the Cochrane risk-of-bias instrument to assess the quality of the included RCTs, while 1 SR11 used the Joanna Briggs Institute critical appraisal checklists to assess the quality of the included clinical studies. Meta-analysis was used to combine the results in all 3 SRs.11-13 Two SRs12,13 conducted subgroup analysis to assess the potential impact of risk of bias on the results and account for risk of bias (RoB) in individual studies when interpreting or discussing the results, while 1 SR11 did not. In the SR by Cottrill et al. (2020),11 the results were pooled from different types of study designs (e.g., prospective and retrospective studies), which had different limitations in terms of RoB. The authors in this SR11 used the critical appraisal checklist to evaluate the quality of the studies for inclusion, but the methodological quality and RoB of the included studies were not reported, and discussed with the findings. In both SRs11,13 that used electrical stimulators, the results were pooled from different electrical stimulation technologies which might have different patient compliance; for instance, the DCS was an implanted device, whereas the CCS and ICS are wearable devices. However, compliance was not reported or considered in the included studies. Statistical heterogeneity was observed and discussed in all SRs.11-13 Publication bias was investigated using funnel plots in 2 SRs.12,13 Conflicts of interest were declared in all 3 SRs,11-13 but the source of funding was only reported in 1 SR,12 and it is possible that the source of funding may bias the reporting of the results of a SR. Overall, 1 SR11 was of moderate methodological quality, and 2 SRs12,13 were of high methodological quality.
With respect to reporting, all primary clinical studies including 3 RCTs14-16 and 2 non-randomized controlled studies17,18 (1 retrospective17 and 1 prospective18) clearly described the objective of the study, the intervention of interest, the main outcomes, and the main findings of the study. Three studies (2 RCTs15,16 and 1 retrospective cohort study17) clearly described the patient characteristics at baseline, while 2 studies (1 RCT14 and 1 prospective cohort study18) did not. Without a clear description of patient baseline characteristics, it is unknown if potential confounders may exist that could potentially affect the interpretation of the results. Of the 5 clinical studies, only 1 study16 reported adverse events (AEs) related to the device. Actual P values (i.e., P values) were reported in all studies. Regarding external validity, it was unclear if the participants were representative of the entire population from which they were recruited in all included studies. However, the treatment settings in all studies appeared to be representative of the treatment received by most of the patients. For internal validity, 1 RCT14 was single-blinded to patients only, 1 RCT15 was open-label, and 1 RCT16 was double-blinded. The single-blinded and open-label RCTs as well as the 2 non-randomized controlled studies17,18 were therefore subjected to risk of selection, performance, and detection biases. Appropriate statistical tests were used to assess the main outcomes, and reliable and validated outcome measures were used in all studies. In 4 studies,14,15,17,18 it was unclear if patients in the intervention and control groups were recruited from the same population, or over the same period, which may have led to selection bias. All 3 RCTs14-16 did not report allocation concealment, which may subject to risk of selection bias. The 2 non-randomized controlled studies17,18 did not adjust for potential confounders in the analyses. Four14,15,17,18 of 5 included studies did not report whether sample size calculations were performed, and it is unclear whether the non-significant differences in certain outcomes were because the studies were underpowered for those outcomes. One RCT16 reported a sample size calculation, but reported the results from of an interim analysis with half of the planned sample size. However, the authors stated that the power reached 82% after enrolling half of the planned sample size.16 Eligible patients in this trial16 were those with stable rib fractures (i.e., simple and displaced rib fracture without flail chest), and therefore the findings may not be applicable to patients with severe thoracic trauma or the presence of complications.
A major limitation of the RCT by Gopalan et al. (2020)14 was that it was unclear if the findings can be generalizable to populations not included in the trial, such as patients older than 40 years, patients with bony pathologic features, fractures involving the angle, ramus, or condyle, and fractures that did not require open reduction and internal fixation, normal healthy patients (ASA Class I), nonsmokers, nondrinkers, and patients with systemic condition or disease. There was a risk of selection bias in the 2 non-randomized studies17,18 due to the nature of the study design. Both of the studies17,18 did not adjust for potentially confounding variables in their analyses, the differences between groups may have been affected by residual confounders. Overall, 1 RCT16 was of moderate methodological quality, while the other 4 studies (2 RCTs14,15 and 2 non-randomized controlled studies17,18) were of low methodological quality.
The included economic evaluation study19 clearly stated the objective, the economic importance of the research question, the rational for choosing the alternative comparators (i.e., LIPUS versus placebo), and the type of economic evaluation (i.e., cost-utility analysis) that was conducted. The study used both a payer (direct costs) and societal (direct and indirect costs) perspectives in its analyses. For data collection, the study clearly stated the source of effectiveness estimates with details of the design and findings (i.e., the TRUST trial20), the primary outcome measures for the economic evaluation (i.e., ICER expressed as the incremental cost per QALY gained), the methods for the estimation of quantities and unit costs, productivity changes, and the currency and price data. However, no model was used in the economic evaluation. For the analysis and interpretation of results, the study clearly stated the time horizon of costs and benefits, statistical tests and confidence intervals, justification for the choice of variables for sensitivity analysis, and the ranges over which the variables were varied. Discount rate was not applicable as the time horizon was 1 year. The study reported incremental analysis and presented major outcomes in a disaggregated as well as aggregated form. The conclusion in the study was based on the data reported and were accompanied by the appropriate caveats. Overall, the study was of moderate methodological quality with respect to the study design, data collection, and analysis and interpretation of results.
Summary of Findings
Appendix 4 presents the main study findings of the SRs,11-13 the primary clinical studies,14-18 and the economic evaluation study.19 The findings of the SRs11-13 and primary clinical studies14-18 are presented by outcomes, which are radiographic assessment outcomes (Table 8), clinical assessment outcomes (Table 9), pain reduction (Table 10), functional outcomes (Table 11), and adverse events related to device (Table 12). The findings and authors’ conclusions of the economic evaluation study are presented in Table 13.
Clinical Effectiveness of Bone Growth Stimulators for the Treatment of Bone disease or Injury
Radiographic assessment outcomes of electrical stimulation versus control
Meta-analysis results of the SR by Cottrill et al. (2020)11 showed that patients treated with electrical stimulators (DDS, CCS, and ICS) had statistically significantly higher spinal fusion rates compared with controls, and that for patients receiving some form of electrical stimulation the odds of a successful fusion at last follow-up was around 126% higher compared with controls. Subgroup analyses based on type of stimulators revealed that DCS and ICS improved fusion rates, while CCS was not effective. However, only 1 study of CCS was identified. Subgroup analyses based on clinical populations found that electrical stimulation therapies were effective in the following populations: patients with difficult-to-fuse spines, smokers, non-smokers, patients undergoing index surgical procedures, and those undergoing interbody fusion, single-level fusion, multilevel (≥ 2), cervical fusion, lumbar and lumbosacral fusion, fusion with allograft, fusion with instrumentation, and fusion without instrumentation. In contrast, the electrical stimulation therapies showed no significant differences in fusion rates compared with controls in patients undergoing revision surgery, posterior/posterolateral fusion, and fusion with autograft alone.
The retrospective cohort study by Cheaney et al. (2020)17 found that, in patients underwent thoracolumbar fusion procedures, PEMF demonstrated a statistically significantly lower rate of fusion compared to CMF (68.8% versus 87.5%) and no stimulation (68.8% versus 100.0%), while CMF had comparable fusion results to the no stimulation group (87.5% versus 100.0) after at least 1 year of radiographic follow-up.
Meta-analysis results of the SR by Aleem et al. (2016)13 showed that radiographic stimulators (DCS, CCS, PEMF) for healing of bone fracture or osteotomy statistically significantly reduced radiographic nonunion rates by 35% compared with placebo. Subgroup analyses by indication revealed that radiographic stimulators statistically significantly reduced nonunion rates with spine, but not with fresh fracture, nonunion or delayed union, or osteotomy. However, when spine studies were removed, meta-analysis result of fresh fracture, nonunion or delayed union, and osteotomy showed a statistically significant pooled treatment effect in favour of the electrical stimulation compared with placebo.
The RCT by Mohajerani et al. (2019)15 on mandibular fracture healing found no significant difference in the mean bone density values between the PEMF and control groups after 2 weeks and 4 weeks post-surgery.
Radiographic assessment outcomes of LIPUS versus control
In the SR by Schandelmaier et al. (2017),12 meta-analysis of 2 RCTs that used time to event analysis methods showed no significant effect of LIPUS compared to control for time to radiographic healing. Meta-analysis results of 15 RCTs reporting number of days to radiographic healing showed that LIPUS accelerated radiographic healing by 27% compared with controls. Subgroup analyses revealed that the effect of LIPUS on days to radiographic healing remained significant in all clinical subgroups including operatively managed fresh fractures, non-operatively managed fresh fractures, osteotomy, and nonunion, as well as high compliance, or moderate compliance. One included RCT in the SR12 involved patients with delayed union of tibia fracture reported no significant difference in the proportion of patients with healed fractures at 16 weeks in between the LIPUS group and the control group (65% versus 46%).
The RCT by Gopalan et al. (2020)14 found no significant difference between LIPUS and control groups in mandibular fracture healing assessed radiographically at 4 weeks, 8 weeks, and 12 weeks post-surgery. However, the mean ultrasound assessment score for wound healing was statistically significantly higher in the LIPUS group compared with the control group at all times of follow-up.
The RCT by Santana-Rodriguez et al. (2019)16 found that bone callus consolidation was statistically significantly higher in the LIPUS group at 1 month and 3 months for the thoracic surgeon and for the radiologist compared with the placebo group. However, at 6 months of follow-up, there was no significant differences between groups for the thoracic surgeon or for the radiologist.
Clinical assessment outcomes of electrical stimulation versus control
The RCT by Mohajerani et al. (2019)15 on mandibular fracture healing found that the maximum mouth opening was statistically significantly larger in the PEMF group compared with the control group (46.7 ± 3.02 mm versus 34 ± 5.4 mm). However, both groups showed no significant differences for the number of sensory changes or the number of malocclusion.
The prospective cohort study by Krzyzanska et al. (2020)18 on distal radius fracture healing found no significant differences between PEMF and control groups after 3 weeks and 6 weeks follow-up about the circumference of the forearm and shoulder, suggesting that PEMF had no effect on edema. However, PEMF statistically significantly improved wrist mobility such as range of wrist dorsal flexion and range of palmar flexion, and increased global grip strength compared with control. Likewise, PEMF also significantly increased other ranges of motion at 3 and 6 weeks: shoulder flexion, shoulder extension, shoulder abduction, and elbow flexion. Patients in the PEMF group had statistically significantly greater improvement in exteroceptive sensation measured with Dellon’s discriminator at 3 weeks and 6 weeks or with the microfilaments at 6 weeks compared with control. Upper limb disability evaluation using the DASH questionnaire score showed a statistically significant decrease in limb disability in the PEMF group compared with the control group after 3 weeks and 6 weeks of therapy.
Clinical assessment outcomes of LIPUS versus control
Meta-analysis results of the SR by Schandelmaier et al. (2017)12 showed no statistically significant differences between LIPUS and control groups in the number of subsequent operations.
The RCT by Gopalan et al. (2020)14 found that, compared to control, LIPUS statistically significantly improved mandibular wound healing assessed using the modified Landry’s Wound Healing Index after 5 days and 9 days post-treatment, but the difference was not statistically significant after 15 days, or 21 days . There was no significant difference in teeth mobility between groups.
Pain reduction of electrical stimulation versus control
Meta-analysis results of the SR by Aleem et al. (2016)13 showed that radiographic stimulation for healing of bone fracture or osteotomy statistically significantly improved pain compared with placebo.
The RCT by Mohajerani et al. (2019)15 on mandibular fracture healing showed that the mean pain scores on 10-point VAS were numerically lower in the PEMF group compared with the control group after 1 day, 7 days and 14 days post-surgery, but statistical comparisons were not reported.
The prospective cohort study by Krzyzanska et al. (2020)18 on distal radius fracture healing found that pain assessed using 100-mm VAS was statistically significantly lower in the PEMF group compared with the control group at 3 weeks and 6 weeks of follow-up.
Pain reduction of LIPUS versus control
Meta-analysis results of the SR by Schandelmaier et al. (2017)12 showed no significant effect of LIPUS on pain reduction assessed using 100-mm VAS compared with the control at the end of follow-up. One RCT (i.e., the TRUST trial20) included in the SR12 showed no significant difference between LIPUS and placebo groups in pain intensity at different time points and number of painful days assessed using SF-36 bodily pain scores.
The RCT by Gopalan et al. (2020)14 found that the pain scores on VAS in mandibular fracture healing was statistically significantly lower in the LIPUS group compared with the control group after 5 days, 9 days, 15 days, and 21 days follow-up.
The RCT by Santana-Rodriguez et al. (2019)16 on rib fracture healing found that the mean pain scores on 10-point VAS were statistically significantly lower in the LIPUS group compared with the placebo group at all evaluated time points: 1 month, 3 months, and 6 months. For pain medication, no significant differences between groups in the number of patients who were taking medication at 1 month and at 6 months. However, a statistically significantly lower number of patients taking pain medication was observed at 3 months in the LIPUS group compared with the placebo group.
Functional outcomes of electrical stimulation versus control
Meta-analysis results of the SR by Aleem et al. (2016)13 found that the difference of SF-36 scores used to assess functional outcomes between electrical stimulation and placebo groups were not statistically significant.
Functional outcomes of LIPUS versus control
Meta-analysis results of the SR by Schandelmaier et al. (2017)12 on healing of bone fracture or osteotomy found that, compared with controls, LIPUS did not improve functional recovery including time to return to work, time to return to leisure activities, time to return to at least 80% of pre-injury level of function, time to return to full weight bearing, and time to return to household activities.
The RCT by Santana-Rodriguez et al. (2019)16 on rib fracture healing found no significant differences between LIPUS and placebo groups in the number of patients who were returning to physical activity at baseline, at 1 month, and at 6 months. However, there were statistically significant differences at 3 months (53.7% versus 46.3%). No significant differences between groups were observed in the number of patients who were working and those who were not working due to retirement or unemployment at baseline, at 3 months, and at 6 months. Also, no significant differences between groups were observed in the number of days of sick leave at baseline and at 6 months.
Adverse events related to LIPUS
In the SR by Schandelmaier et al. (2017),12 7 RCTs reported no AEs related to the device and 2 RCTs reported mild transient skin irritations in 6 patients. Pooled analysis based on all 9 trials also showed no significant in AEs between groups.
The RCT by Santana-Rodriguez et al. (2019)16 reported that no patients experienced any type of complications related to LIPUS procedure.
Cost-Effectiveness of Bone Growth Stimulators for the Treatment of Bone disease or Injury
The economic evaluation study by Tarride et al. (2017)19 conducted a cost-utility analysis comparing LIPUS with placebo for the treatment of fresh tibial fractures, from both a payer (direct costs) and societal (direct and indirect costs) perspective over a 1-year time horizon. Patients’ 1-year use of health care resources, including secondary procedures, therapy (i.e., physiotherapy and occupational therapy), medications, and number of weeks taken for patients to return to work were not significantly different between LIPUS and placebo groups. With the cost of the device of CA$3,995, the mean difference of 1-year total costs per patient from the payer perspective was $3,647 more with LIPUS compared to placebo; this difference in cost was statistically significant. As there was no significant difference in wage loss between groups, the mean difference of 1-year total costs per patient from the societal perspective was $3,425 more with LIPUS compared to the placebo; this difference in cost was statistically significant.
QALY was calculated from HRQoL data collected from the TRUST trial.20 No significant difference in QALY was observed between groups. The ICER for LIPUS compared with placebo for the treatment of patients with fresh tibial fractures was estimated to be $155,443 per QALY gained for a payer perspective, and $146,006 per QALY gained for a societal perspective. Results from bootstrap analyses (i.e., plot of incremental costs against incremental QALYs) indicated that LIPUS cost more and yielded less QALYs (i.e., located at right upper quadrant of the plot). LIPUS was therefore more expensive and less effective than placebo (i.e., LIPUS was dominated by placebo). Probabilistic sensitivity analyses revealed that the probabilities that LIPUS being cost-effective for treating operatively managed tibial fractures were 1% and 23% at willingness-to-pay (WTP) thresholds of $50,000 and $100,000, respectively from a payer perspective. Using the same WTP thresholds, the probabilities were 5% and 31%, respectively, from a societal perspective. One-way sensitivity analyses revealed that increasing duration of therapy (i.e., physiotherapy, occupational therapy) did not affect the results. In addition, the results from the analysis showed that the unit cost of LIPUS needed to change from $3,995 (base case) to $1,743 and $2,916 to yield ICERs of $50,000 per QALY gained and $100,000 per QALY gained, respectively, from a societal perspective.
Limitations
One of the limitations of the included SRs11-13 was that most included trials reported surrogate end points and lack of patient-important outcomes that are critical for decision-making. There was substantial heterogeneity among included studies in the SRs11-13 in terms of patient characteristics, definition and methods of assessment of outcomes, anatomic location of the fracture, technologies used, intensity of treatment, time of application, duration of the treatment and compliance with the treatment; thus, preventing a definitive conclusion as to which patients will benefit most from the technologies, and which technology is most effective.
The definition of fusion and the method of assessment of fusion varied among studies included in the SR by Cottrill et al. (2020).11 In the SR by Schandelmaier et al. (2017),12 most trials enrolled patients with tibia fractures or osteotomies; therefore, it was unclear if the results are applicable to populations under-represented in the eligible trials such as those with stress fractures, and nonunion. Although the mean differences in pain were statistically significant as reported in the SR by Aleem et al. (2016)13 and some included primary studies,14,16,18 it may not represent a difference important to patients due to the lack of calculation of minimally important differences.
A general limitation of the included primary clinical studies was they all had small sample sizes, ranging from 32 to 60. With the aforementioned limitations, the interpretation of the findings and the generalizability of the evidence to the real world within the Canadian context should be made with caution.
One limitation of the economic evaluation study was that the cost and HRQoL data were not available for all patients. Multiple imputation techniques were used to address missing data. The analyses were conducted over a 1-year time horizon, which was relatively short and may not have accounted for all of the costs and outcomes. Another limitation of this study was that the unit cost of LIPUS device may vary across Canada relative to the cost used in the base-case analysis. However, the authors did perform sensitivity analyses to the determine the prices of LIPUS device required to be cost-effective at the common WTP thresholds. Since the study only focused on the cost-effectiveness of LIPUS for treatment of fresh tibial fractures compared with placebo, it was unclear whether the findings could be applicable to other types of fractures or bone diseases. No economic evaluation studies of electrical stimulation technologies were identified.
Conclusions and Implications for Decision- or Policy-Making
This report identified 3 SRs,11-13 5 primary clinical studies,14-18 including 3 RCTs,14-16 1 retrospective cohort study,17 and 1 prospective cohort study,18 and 1 economic evaluation study.19
Radiographic assessment evidence from 2 SRs11,13 and 1 retrospective cohort study17 showed that electrical stimulation (DCS, CCS, PEMF) significantly increased fusion rates of the spine and reduced nonunion rates for bone healing compared with controls (e.g., no treatment or sham devices). Among electrical stimulation technologies for spine fusion, DCS, and ICS appeared to be effective, while CCS was not. However, no direct comparisons among electrical stimulation technologies were identified. Electrical stimulation therapies appeared to be effective in certain populations including patients with difficult-to-fuse spines, smokers, non-smokers, patients undergoing index surgical procedures, and those undergoing interbody fusion, single-level fusion, multilevel, cervical fusion, lumbar and lumbosacral fusion, fusion with allograft alone, fusion with instrumentation, and fusion without instrumentation.11 The electrical stimulation therapies did not appear to be effective in patients undergoing revision surgery, posterior or posterolateral fusion, and fusion with autograft alone.11 Evidence from clinical assessment showed that PEMF therapy on mandibular fracture healing significantly increased amount of mouth opening, but had no effect for the number of sensory changes or the number of malocclusion.15 Addition of PEMF treatment during cast immobilization of distal radius fracture had no effect on edema, but improved exteroceptive sensation and range of motion of the wrist and shoulder.18 Evidence from 1 SR13 and 2 included primary studies15,18 showed that electrical stimulation technologies statistically significantly reduced pain compared with controls. However, it was unclear if the differences in pain was clinically meaningful to the patients. Despite the beneficial effects of electrical stimulators on pain and several surrogate outcomes, the technologies did not appear to provide any effect on functional outcomes as assessed using SF-36 scores in the SR by Aleem et al. (2016).13 None of the studies reported AEs related to electrical stimulation devices.
Radiographic assessment findings of LIPUS versus controls from 1 SR12 and 2 RCTs14,16 were inconsistent, suggesting that LIPUS might have limited effect on radiographic bone healing. Clinical assessment from a SR12 and an RCT14 showed that LIPUS had no effect on the number of subsequent operations after treatment for bone healing or teeth mobility for mandibular fracture healing. The evidence on the effect of pain reduction by LIPUS was mixed, as 1 SR12 showed no significant difference in pain between LIPUS and control groups, while 2 included RCTs14,16 showed that pain scores were statistically significantly lower in the LIPUS group compared with the control group for mandibular fracture healing14 and rib fracture healing.16 Evidence from a high-quality SR12 and low to moderate quality RCTs14,16 suggested that LIPUS had little or no beneficial effect on pain reduction. Evidence from 1 SR12 and 1 included RCT16 showed that LIPUS did not improve functional recovery outcomes that were important to patients including time to return to work, time to return to physical activities, time to return to at least 80% of pre-injury level of function, time to return to full weight bearing, and time to return to household activities. No AEs related to the LIPUS device were observed.12,16
Moderate quality evidence from a cost-utility analysis of LIPUS for treatment of fresh tibial fractures revealed that LIPUS was not found to be cost-effective compared with placebo for either a payer perspective or societal perspective, as there was no differences between groups in patients’ use of health care resources, productivity losses, or HRQoL.19 No economic evaluation studies of electrical stimulation were identified.
Overall, both electrical stimulation and LIPUS technologies showed some beneficial effects on surrogate outcomes (e.g., spinal fusion rate, radiographic nonunion rates, number of days to radiographic healing, amount of mouth opening, wrist and shoulder mobility, exteroceptive sensation, and wound healing) but did not improve patient-important outcomes, such as functional recovery. LIPUS was not cost-effective for adjunctive treatment of fresh tibial fractures. As the SRs and the economic evaluation study were conducted in Canada and/or the US, the findings may be applicable to the Canadian context; however, the limitations of the included evidence should be considered when interpreting the findings of this report. Generalizability to the real-world population may be limited. Future studies are needed to evaluate the cost-effectiveness of LIPUS and different electrical stimulation technologies for treatment of different types of bone fractures or osteotomies.
References
1.Public Health Agency of Canada. Osteoporosis and related fractures in Canada: Report from the Canadian Chronic Disease Surveillance System 2020. Ottawa (ON): Government of Canada; 2021: https://www.canada.ca/en/public-health/services/publications/diseases-conditions/osteoporosis-related-fractures-2020.html. Accessed 2021 Sep 28.
2.Padilla F, Puts R, Vico L, Guignandon A, Raum K. Stimulation of Bone Repair with Ultrasound. Adv Exp Med Biol. 2016;880:385-427. PubMed
3.Khalifeh JM, Zohny Z, MacEwan M, et al. Electrical Stimulation and Bone Healing: A Review of Current Technology and Clinical Applications. IEEE rev. 2018;11:217-232.
4.Busse JW, Morton E, Lacchetti C, Guyatt GH, Bhandari M. Current management of tibial shaft fractures: a survey of 450 Canadian orthopedic trauma surgeons. Acta Orthop. 2008;79(5):689-694. PubMed
5.Leppik L, Oliveira KMC, Bhavsar MB, Barker JH. Electrical stimulation in bone tissue engineering treatments. Eur. 2020;46(2):231-244. PubMed
6.Bhavsar MB, Han Z, DeCoster T, Leppik L, Costa Oliveira KM, Barker JH. Electrical stimulation-based bone fracture treatment, if it works so well why do not more surgeons use it? Eur. 2020;46(2):245-264. PubMed
7.Shea BJ, Reeves BC, Wells G, et al. AMSTAR 2: a critical appraisal tool for systematic reviews that include randomised or non-randomised studies of healthcare interventions, or both. BMJ. 2017;358:j4008. PubMed
8.Downs SH, Black N. The feasibility of creating a checklist for the assessment of the methodological quality both of randomised and non-randomised studies of health care interventions. J Epidemiol Community Health. 1998;52(6):377-384. PubMed
9.Higgins JPT, Green S, editors. Figure 15.5.a: Drummond checklist (Drummond 1996). Cochrane handbook for systematic reviews of interventions. London (GB): The Cochrane Collaboration; 2011: http://handbook-5-1.cochrane.org/chapter_15/figure_15_5_a_drummond_checklist_drummond_1996.htm. Accessed 2021 Sep 28.
10.Liberati A, Altman DG, Tetzlaff J, et al. The PRISMA statement for reporting systematic reviews and meta-analyses of studies that evaluate health care interventions: explanation and elaboration. J Clin Epidemiol. 2009;62(10):e1-e34. PubMed
11.Cottrill E, Pennington Z, Ahmed AK, et al. The effect of electrical stimulation therapies on spinal fusion: a cross-disciplinary systematic review and meta-analysis of the preclinical and clinical data. J Neurosurg Spine. 2020;32:106-126. PubMed
12.Schandelmaier S, Kaushal A, Lytvyn L, et al. Low intensity pulsed ultrasound for bone healing: systematic review of randomized controlled trials. BMJ. 2017;356:j656. PubMed
13.Aleem IS, Aleem I, Evaniew N, et al. Efficacy of Electrical Stimulators for Bone Healing: A Meta-Analysis of Randomized Sham-Controlled Trials. Sci. 2016;6:31724. PubMed
14.Gopalan A, Panneerselvam E, Doss GT, Ponvel K, Raja Vb K. Evaluation of Efficacy of Low Intensity Pulsed Ultrasound in Facilitating Mandibular Fracture Healing-A Blinded Randomized Controlled Clinical Trial. J Oral Maxillofac Surg. 2020;78(6):997.e991-997.e997. PubMed
15.Mohajerani H, Tabeie F, Vossoughi F, Jafari E, Assadi M. Effect of pulsed electromagnetic field on mandibular fracture healing: A randomized control trial, (RCT). J Stomatol Oral Maxillofac Surg. 2019;120(5):390-396. PubMed
16.Santana-Rodriguez N, Clavo B, Llontop P, et al. Pulsed Ultrasounds Reduce Pain and Disability, Increasing Rib Fracture Healing, in a Randomized Controlled Trial. Pain Med. 2019;20(10):1980-1988. PubMed
17.Cheaney B, 2nd, El Hashemi M, Obayashi J, Than KD. Combined magnetic field results in higher fusion rates than pulsed electromagnetic field bone stimulation after thoracolumbar fusion surgery. J Clin Neurosci. 2020;74:115-119. PubMed
18.Krzyzanska L, Straburzynska-Lupa A, Raglewska P, Romanowski L. Beneficial Effects of Pulsed Electromagnetic Field during Cast Immobilization in Patients with Distal Radius Fracture. Biomed Res Int. 2020;2020:6849352. PubMed
19.Tarride JE, Hopkins RB, Blackhouse G, et al. Low-intensity pulsed ultrasound for treatment of tibial fractures: an economic evaluation of the TRUST study. Bone Joint J. 2017;99-B(11):1526-1532. PubMed
20.Busse JW, Bhandari M, Einhorn TA, et al. Re-evaluation of low intensity pulsed ultrasound in treatment of tibial fractures (TRUST): randomized clinical trial. BMJ. 2016;355:i5351. PubMed
Appendix 1: Selection of Included Studies
Appendix 2: Characteristics of Included Publications
Note that this appendix has not been copy-edited
Table 2: Characteristics of Included Systematic Reviews
Study citation, country, funding source | Objectives, study designs and numbers of primary studies included | Population characteristics | Intervention and comparator(s) | Clinical outcomes, length of follow-up |
|---|---|---|---|---|
Cottrill et al. (2020)11 US Funding: NR | Objective: To estimate of the overall effect of electrical stimulation therapies, namely, DCS, CCS, and ICS, also known as PEMF therapy, on spinal fusion. Total: 16 studies; 13 studies (N = 2,144) included in the meta-analysis. 6 studies with DCS, 1 with CCS, 6 with ICS. Sample sizes: 20 to 245 Quality assessment tool: Joanna Briggs Institute at The University of Adelaide. | DCS (2 RCTs and 4 cohort studies; N = 988): Patients with difficult-to-fuse spines; posterior or posterolateral lumbar fusion; with or without instrumentation; with autograft and/or allograft. CCS (1 RCT; N = 179): Adult patients undergoing 1- or 2-level lumbar fusion with or without instrumentation; with autograft and/or allograft. ICS (4 RCTs, 2 cohort studies; N = 977): Adult patients with difficult-to-fuse spines; cervical or lumbar/lumbosacral fusion; with instrumentation; with autograft and/or allograft. Age: NR % Male: NR | DCS (N = 534) vs. control (no DCS; N = 454) CCS (N = 85) vs. control (inactive stimulator; N = 94) ICS (N = 574) vs. control (no ICS; N = 403) | Outcome: Fusion rate (defined as the proportion of patients experiencing a successful radiological fusion at the last follow-up visit) Follow-up: 1 year to 2 years |
Schandelmaier et al. (2017)12 Canada Funding: Did not receive any specific grant or funding | Objective: To determine the efficacy of LIPUS for bone healing from fracture or osteotomy. Total: 26 RCTs; 23 RCTs (N = 1,594) included in meta-analyses Sample sizes: 8 to 501 Quality assessment tool: Modified Cochrane RoB instrument. GRADE approach was used to summarize to quality of evidence. | 25 RCTs had adult patients with mean age between 19 to 68 years. One RCT had patients with age range between 15 to 35 years. % Male: 15 to 100 Type of fracture/surgery: Fresh fractures (7 RCTs); non-operatively managed fresh fractures (6 RCTs); stress fractures (2 RCTs); non-unions (3 RCTs); and osteotomies (8 RCTs). | LIPUS (N = 796) vs. inactive device (placebo) or no device (N = 798) 24 RCTs applied LIPUS for 20 minutes every day, either for a fixed period or until radiographic healing. One RCT applied LIPUS for 15 minutes a day, and another RCT for 5 minutes every second day. | Outcomes:
Follow-up: 5 weeks to 5 years |
Aleem et al. (2016)13 Canada Funding: NR | Objective: To determine the effect of electrical stimulation on bone healing using meta-analysis of randomized sham-controlled trials. Total: 15 RCTs; 1 with DCS (N = 95); 2 with CCS (N = 200); and 12 with PEMF (N = 952). Sample sizes: 16 to 201 Quality assessment tool: Cochrane RoB instrument. GRADE approach was used to summarize to quality of evidence. | Adult patients with acute fracture (tibia, scaphoid, femoral neck, femoral diaphysis); posterolateral lumbar fusion (lumbar spine); un-instrumented fusion (lumbar spine); interbody fusion (lumbar spine); nonunion (tibia, femur); delayed union (tibia, long-bone); osteotomy (tibia). Mean age: 45 years. % Male: 58.3% in the experimental arm and 56.3% in the placebo arm. | DCS (N = 53) vs. placebo (N = 42) CCS (N = 95) vs. placebo (N = 105) PEMF (N = 477) vs. placebo (N = 475) | Outcomes:
Follow-up: 8.2 (SD 3.4) months for radiographic outcomes, and 8.6 (SD 3.7) months for pain and functional outcomes. Pain was reported using VAS, DPQ, or categorical pain scale. Pain scores expressed in different units were transformed to the 0 to 100 mm VAS. Functional outcome was reported using components of the SF-36 health survey. |
CCS = capacitive coupling stimulation; DCS = direct current stimulation; DPQ = Dallas Pain Questionnaire; ICS = inductive coupling stimulation; LIPUS = low intensity pulsed ultrasound; NR = not reported; PEMF = pulsed electromagnetic field; RCT = randomized controlled trial; SF-36 = Short Form 36; VAS = visual analogue scale.
Table 3: Characteristics of Included Primary Clinical Studies
Study citation, country, funding source | Study design | Population characteristics | Intervention and comparator(s) | Clinical outcomes, length of follow-up |
|---|---|---|---|---|
Randomized controlled trials | ||||
Gopalan et al. (2020)14 India Funding: NR | RCT, single-blinded (patient), single institution, parallel 1:1 ratio. Sample size calculation provided: No | Adult patients (N = 40) with mandibular fractures involving the anterior mandible. Mean age: 28 (SD 7.3) years in the study group, and 26.8 (SD 8.7) years in the control group. % Male: NR Mean operative time: 49.7 (14.7) minutes in the study group, and 56.7 (SD 15.1) minutes in the control group. | LIPUS (N = 20) vs. control (no LIPUS; N = 20) After fixation, the study group received LIPUS (1.5 MHz, 30 mW/cm2) on post-operative days 4, 8, 14, and 20 for 20 minutes daily. | Outcomes:
Follow-up: 5 days to 21 days for pain and wound healing assessment, and 4 weeks to 12 weeks for radiographic and ultrasound assessment. Pain was assessed using VAS. Wound healing was clinically assessed using the modified Landry’s index (from very poor to excellent) The fractures were analyzed using conventional radiography and ultrasonography and assessed using the Moed scoring index (1 for absence of callus, 2 for presence of mild callus, 3 for considerable callus, and 4 for significant callus with complete fusion of fracture ends). |
Mohajerani et al. (2019)15 Iran Funding: Postgraduate grant | RCT, open-label, parallel 1:1 ratio Sample size calculation provided: No | Adult patients (N = 32) diagnosed with a mandibular fracture. Mean age: 37 years % Male: 75 | PEMF (N = 16) vs. control (no PEMF; N = 16) Patients in PEMF group received immediate post-surgery PEMF therapy for 6 hours, then received 3 hours of exposure for the next 6 days, and 1.5 hours for days 8 to 13. | Outcomes:
Follow-up: 4 weeks Pain was assessed using VAS (0 to 10; 0 for no pain, 1 to 3 for slight pain, 4 to 7 for moderate pain, and 8 to 10 for severe pain). |
Santana-Rodriguez et al. (2019)16 Spain Funding: Sociedad Española de Neumología y Cirugía Torácica | RCT, double-blind, parallel 1:1 ratio Sample size calculation provided: Yes | Adult patients (N = 51) diagnosed with a rib fracture. Median age: 64 years in the study group; 59 in the control group. % Male: 66 Median pain at baseline: 9 in the study group; 9.5 in the control group. | LIPUS (N = 25) vs. placebo (N = 26) The LIPUS group received 1 MHz, 0.5 W/cm2, and 10% pulse (50 mW/cm2) for 1 minute/cm2. LIPUS was applied for 20 consecutive workdays and started within the first 24 hours after recruitment. The placebo group had LIPUS transductor without emission. | Outcomes:
Follow-up: 1, 3, 6 months |
Non-randomized studies | ||||
Cheaney et al. (2020)17 US Funding: No funding received | Retrospective cohort study (N = 60) Sample size calculation provided: No Adjustment for confounders conducted: No | Adult patients (N = 60) underwent thoracolumbar fusion surgeries by a single surgeon. Mean age: 57 years % Male: 37 | PEMF (N = 16) vs. CMF (N = 24) vs. NS (N = 20) There are 2 commercially available types of ICS: PEMF and CMF. Patients in the PEMF group were instructed to wear the device for a minimum of 2 hours daily. Patients in the CMF group were instructed to use the device once daily for 30 minutes. | Outcomes: Radiographic assessment of solid fusion, stable nonunion, and pseudarthrosis. Follow-up: 1 year of radiographic follow-up. |
Krzyzanska et al. (2020)18 Poland Funding: NR | Prospective cohort study (N = 52) Sample size calculation provided: No Adjustment for confounders conducted: No | Adult patients (N = 52) with distal radius fracture on cast immobilization. Mean age: 60.8 years % Male: 13.5 | PEMF (N = 27) vs. control (no PEMF; N = 25) Patients in PEMF group received the treatment once a day in the first week, and then 3 times a week. Patients received total 22 treatments over 6 weeks. | Outcomes:
Follow-up: 3 and 6 weeks |
CMF = combined magnetic field; DASH = disability of the arm, shoulder, and hand; ICS = inductive coupling stimulator; LIPUS = low intensity pulsed ultrasound; NR = not reported; NS = no stimulation; PEMF = pulsed electromagnetic field; RCT = randomized controlled trial; SD = standard deviation.
Table 4: Characteristics of Included Economic Evaluation
Study citation country, funding source | Type of analysis, time horizon, perspective | Population characteristics | Intervention and comparator(s) | Approach | Source of clinical, cost, and utility data used in analysis | Main assumptions |
|---|---|---|---|---|---|---|
Tarride et al. (2017)19 Canada Funding: The Canadian Institute for Health Research | Cost-utility analysis Time horizon: 1 year Perspective: Payer (direct costs) and societal (direct and indirect costs) perspectives | Patients from the TRUST trial with an open or closed tibial fracture. Mean age: 38 years % Male: 69 % Smokers: 33 % Employed at time of fracture: 74% | LIPUS (N = 250) vs. placebo (N = 251) | ICER was estimated as ratio of the difference in cost and difference in effect (QALY). Probabilistic sensitivity analysis using 2 commonly cited WTP thresholds ($50,000/QALY gained; $100,000/QALY gained). Costs were adjusted to 2015 Canadian dollars. | Clinical data were from the TRUST trial. Cost data were from publicly available sources. Indirect costs were estimated based on the value of wage loss. HRQoL was used to derived QALY. | Hourly rate for physiotherapy and occupational therapy was assumed to be $95. Mean Canadian wage rate of $25.89 was assumed for hourly workers with a mean work-week of 35 hours. |
HRQoL = health-related quality of life; ICER = incremental cost-effectiveness ratio; LIPUS = low intensity pulsed ultrasound; QALY = quality-adjusted life-year.
Appendix 3: Critical Appraisal of Included Publications
Note that this appendix has not been copy-edited
Table 5: Critical Appraisal of Systematic Reviews Using AMSTAR 27
Item | Cottrill et al. (2020)11 | Schandelmaier et al. (2017)12 | Aleem et al. (2016)13 |
|---|---|---|---|
1. Did the research questions and inclusion criteria for the review include the components of PICO? | Yes | Yes | Yes |
2. Did the report of the review contain an explicit statement that the review methods were established before the conduct of the review and did the report justify any significant deviations from the protocol? | No | No | No |
3. Did the review authors explain their selection of the study designs for inclusion in the review? | Yes | Yes | Yes |
4. Did the review authors use a comprehensive literature search strategy? | Yes | Yes | Yes |
5. Did the review authors perform study selection in duplicate? | Yes | Yes | Yes |
6. Did the review authors perform data extraction in duplicate? | NR | Yes | Yes |
7. Did the review authors provide a list of excluded studies and justify the exclusions? | No | No | No |
8. Did the review authors describe the included studies in adequate detail? | Yes | Yes | Yes |
9. Did the review authors use a satisfactory technique for assessing the RoB in individual studies that were included in the review? | Yes – JBI critical appraisal checklist | Yes – Cochrane RoB instrument | Yes – Cochrane RoB instrument |
10. Did the review authors report on the sources of funding for the studies included in the review? | No | Yes | Yes |
11. If meta-analysis was performed did the review authors use appropriate methods for statistical combination of results? | Yes | Yes | Yes |
12. If meta-analysis was performed, did the review authors assess the potential impact of RoB in individual studies on the results of the meta-analysis or other evidence synthesis? | No | Yes | Yes |
13. Did the review authors account for RoB in individual studies when interpreting/ discussing the results of the review? | No | Yes | Yes |
14. Did the review authors provide a satisfactory explanation for, and discussion of, any heterogeneity observed in the results of the review? | Yes | Yes | Yes |
15. If they performed quantitative synthesis did the review authors carry out an adequate investigation of publication bias (small study bias) and discuss its likely impact on the results of the review? | No | Yes | Yes |
16. Did the review authors report any potential sources of conflict of interest, including any funding they received for conducting the review? | Yes (but source of funding NR) | Yes | Yes (but source of funding NR) |
AMSTAR 2 = A MeaSurement Tool to Assess systematic Reviews 2; JBI = the Joanna Briggs Institute; NR = not reported; PICO = Population, Intervention, Comparator, Outcomes; RCT = randomized controlled trial; RoB = risk of bias.
Table 6: Critical Appraisal of Clinical Studies Using the Downs and Black checklist8
Item | Gopalan et al. (2020)14 | Mohajerani et al. (2019)15 | Santana-Rodriguez et al. (2019)16 | Cheaney et al. (2020)17 | Krzyzanska et al. (2020)18 |
|---|---|---|---|---|---|
Reporting | |||||
1. Is the hypothesis/aim/objective of the study clearly described? | Yes | Yes | Yes | Yes | Yes |
2. Are the main outcomes to be measured clearly described in the Introduction or Methods section? | Yes | Yes | Yes | Yes | Yes |
3. Are the characteristics of the patients included in the study clearly described? | No | Yes | Yes | Yes | No |
4. Are the interventions of interest clearly described? | Yes | Yes | Yes | Yes | Yes |
5. Are the distributions of principal confounders in each group of subjects to be compared clearly described? | Unclear – Patient characteristics were not clearly described | NA – RCT | NA – RCT | No | No |
6. Are the main findings of the study clearly described? | Yes | Yes | Yes | Yes | Yes |
7. Does the study provide estimates of the random variability in the data for the main outcomes? | No – SD or CI was not provided | Yes – SD was provided | Yes – SD was provided | Yes – SD was provided | Yes – SD was provided |
8. Have all important AEs that may be a consequence of the intervention being reported? | No | No | Yes – reported any adverse event related to the device | No | No |
9. Have the characteristics of patients lost to follow-up been described? | NA – no lost to follow-up | NA – no lost to follow-up | No – 3 out of 26 patients in the study group lost to follow-up | NA – retrospective study | NA – prospective cohort study |
10. Have actual P values been reported (e.g., 0.035 rather than < 0.05) for the main outcomes except where the P value is less than 0.001? | Yes | Yes | Yes | Yes | Yes |
External validity | |||||
11. Were the subjects asked to participate in the study representative of the entire population from which they were recruited? | Unclear | Unclear | Unclear | Unclear | Unclear |
12. Were the subjects who were prepared to participate representative of the entire population from which they were recruited? | Unclear | Unclear | Unclear | Unclear | Unclear |
13. Were the staff, places, and facilities where the patients were treated, representative of the treatment the majority of the patients receive? | Yes | Yes | Yes | Yes | Yes |
Internal validity – bias | |||||
14. Was an attempt made to blind study subjects to the intervention they have received? | Yes – Patient-blinded) | No | Yes – double blind | NA – retrospective study | NA – prospective cohort study |
15. Was an attempt made to blind those measuring the main outcomes of the intervention? | No | No | Yes – double blind | NA – retrospective study | NA – prospective cohort study |
16. If any of the results of the study were based on “data dredging”, was this made clear? | NA | NA | NA | NA | NA |
17. In trials and cohort studies, so the analyses adjust for different lengths of follow-up of patients, or in case-control studies, is the time period between the intervention and outcome the same for cases and controls? | NA | NA | NA | NA | NA |
18. Were the statistical tests used to assess the main outcomes appropriate? | Yes | Yes | Yes | Yes | Yes |
19. Was compliance with the intervention/s reliable? | NR | NR | NR | NR | NR |
20. Were the main outcome measures used accurate (valid and reliable)? | Yes | Yes | Yes | Yes | Yes |
Internal validity – confounding (selection bias) | |||||
21. Were the patients in different intervention groups (trials and cohort studies) or were the cases and controls (case-control studies) recruited from the same population? | Unclear | Unclear | Yes | Unclear | Unclear |
22. Were study subjects in different intervention groups (trial and cohort studies) or were the cases and controls (case-controls studies) recruited over the same period of time? | Unclear | Unclear | Yes | Unclear | Unclear |
23. Were study subjects randomized to intervention groups? | Yes | Yes | Yes | NA – retrospective study | NA – prospective cohort study |
24. Was the randomized intervention assignment concealed from both patients and health care staff until recruitment was complete and irrevocable? | NR | NR | NR | NA | NA |
25. Was the adequate adjustment for confounding in the analyses from which the main findings were drawn? | Unclear, although RCT | NA | NA | No | No |
26. Were losses of patients to follow-up taken into account? | NA | NA | No | NA | NA |
27. Did the study have sufficient power to detect a clinically important effect where the P value for a difference being due to chance is less than 5%? | NR | NR | Yes | NR | NR |
AEs = adverse event; CI = confidence interval; NA = not applicable; NR = not reported; SD = standard deviation.
Table 7: Critical Appraisal of Economic Evaluations Using the Drummond Checklist9
Item | Tarride et al. (2017)19 |
|---|---|
Study design | |
1. The research question is stated. | Yes – Assess the cost-effectiveness of LIPUS on tibial fractures |
2. The economic importance of the research question is stated. | Yes – It was unclear if LIPUS is cost-effective compared to placebo |
3. The viewpoint(s) of the analysis are clearly stated and justified. | Yes – From a payer (direct costs) and societal (direct and indirect costs) perspective |
4. The rationale for choosing alternative programs or interventions compared is stated. | Yes – Based on clinical data from the TRUST trial comparing LIPUS and placebo |
5. The alternatives being compared are clearly described. | Yes |
6. The form of economic evaluation used is stated. | Yes – Cost-utility analysis |
7. The choice of form of economic evaluation is justified in relation to the questions addressed. | Yes – To express ICER as the incremental cost per QALY gained |
Data collection | |
8. The source(s) of effectiveness estimates used are stated. | Yes – From the TRUST trial |
9. Details of the design and results of effectiveness study are given (if based on a single study). | Yes |
10. Details of the methods of synthesis or meta-analysis of estimates are given (if based on a synthesis of a number of effectiveness studies). | NA |
11. The primary outcome measure(s) for the economic evaluation are clearly stated. | Yes – ICER expressed as the incremental cost per QALY gained |
12. Methods to value benefits are stated. | Yes |
13. Details of the subjects from whom valuations were obtained were given. | Yes – Described and referred to the TRUST trial |
14. Productivity changes (if included) are reported separately. | Yes |
15. The relevance of productivity changes to the study question is discussed. | Yes |
16. Quantities of resource use are reported separately from their unit costs. | Yes |
17. Methods for the estimation of quantities and unit costs are described. | Yes |
18. Currency and price data are recorded. | Yes |
19. Details of currency of price adjustments for inflation or currency conversion are given. | Yes – Costs were adjusted to 2015 Canadian dollars |
20. Details of any model used are given. | No model used |
21. The choice of model used and the key parameters on which it is based are justified. | No model used |
Analysis and interpretation of results | |
22. Time horizon of costs and benefits is stated. | Yes – 1 year |
23. The discount rate(s) is stated. | NA |
24. The choice of discount rate(s) is justified. | NA |
25. An explanation is given if costs and benefits are not discounted. | NA |
26. Details of statistical tests and confidence intervals are given for stochastic data. | Yes |
27. The approach to sensitivity analysis is given. | Yes – probabilistic sensitivity analysis |
28. The choice of variables for sensitivity analysis is justified. | Yes |
29. The ranges over which the variables are varied are justified. | Yes |
30. Relevant alternatives are compared. | Yes |
31. Incremental analysis is reported. | Yes |
32. Major outcomes are presented in a disaggregated as well as aggregated form. | Yes |
33. The answer to the study question is given. | Yes |
34. Conclusions follow from the data reported. | Yes |
35. Conclusions are accompanied by the appropriate caveats. | Yes |
ICER = incremental cost-effectiveness ratio; LIPUS = low-intensity pulse ultrasound; NA = not applicable; NR = not reported; QALY = quality-adjusted life-year.
Appendix 4: Main Study Findings
Note that this appendix has not been copy-edited
Table 8: Summary of Findings by Outcomes — Radiographic Assessment Outcomes
Study citation, study design, and patient model | Study findings |
|---|---|
Electrical stimulation vs. Control | |
Fusion rate | |
Cottrill et al. (2020)11 SR (13 studies included in the meta-analyses) Spinal fusion | DCS vs. control (6 studies; N = 988)
CCS vs. control (1 study; N = 179)
ICS vs. control (6 studies; N = 977)
All vs. control (13 studies; N = 2,144)
|
Cottrill et al. (2020)11 SR Spinal fusion Subgroup analysis: Difficult-to-fuse spines | DCS vs. control (3 studies; N = 273)
ICS vs. control (2 studies; N = 554)
All vs. control (5 studies; N = 827)
|
Cottrill et al. (2020)11 SR Spinal fusion Subgroup analysis: Smokers | DCS vs. control (3 studies; N = 218)
ICS vs. control (3 studies; N = 94)
All vs. control (6 studies; N = 312)
|
Cottrill et al. (2020)11 SR Spinal fusion Subgroup analysis: Nonsmokers | DCS vs. control (3 studies; N = 114)
ICS vs. control (3 studies; N = 128)
All vs. control (6 studies; N = 242)
|
Cottrill et al. (2020)11 SR Spinal fusion Subgroup analysis: Index surgery (no prior back surgery) | DCS vs. control (2 studies; N = 262)
CCS vs. control (1 study; N = 179)
ICS vs. control (3 studies; N = 370)
All vs. control (6 studies; N = 811)
|
Cottrill et al. (2020)11 SR Spinal fusion Subgroup analysis: Revision surgery (prior back surgery) | DCS vs. control (2 studies; N = 57)
ICS vs. control (1 study; N = 9)
All vs. control (3 studies; N = 66)
|
Cottrill et al. (2020)11 SR Spinal fusion Subgroup analysis: Posterior or posterolateral fusion | DCS vs. control (5 studies; N = 763)
ICS vs. control (2 studies; N = 245)
All vs. control (7 studies; N = 1,008)
|
Cottrill et al. (2020)11 SR Spinal fusion Subgroup analysis: Interbody fusion | DCS vs. control (1 study; N = 225)
ICS vs. control (4 studies; N = 705)
All vs. control (5 studies; N = 930)
|
Cottrill et al. (2020)11 SR Spinal fusion Subgroup analysis: Single-level fusion | DCS vs. control (3 studies; N = 234)
ICS vs. control (2 studies; N = 116)
All vs. control (5 studies; N = 350)
|
Cottrill et al. (2020)11 SR Spinal fusion Subgroup analysis: Multilevel (≥ 2) fusion | DCS vs. control (3 studies; N = 137)
ICS vs. control (2 studies; N = 62)
All vs. control (5 studies; N = 199)
|
Cottrill et al. (2020)11 SR Spinal fusion Subgroup analysis: Cervical fusion | ICS vs. control (2 studies; N = 554)
|
Cottrill et al. (2020)11 SR Spinal fusion Subgroup analysis: Lumbar and lumbosacral fusion | DCS vs. control (6 studies; N = 988)
CCS vs. control (1 study; N = 179)
ICS vs. control (4 studies; N = 423)
All vs. control (11 studies; N = 1,590)
|
Cottrill et al. (2020)11 SR Spinal fusion Subgroup analysis: Autograft | DCS vs. control (4 studies; N = 679)
ICS vs. control (3 studies; N = 119)
All vs. control (7 studies; N = 798)
|
Cottrill et al. (2020)11 SR Spinal fusion Subgroup analysis: Allograft | ICS vs. control (3 studies; N = 312)
|
Cottrill et al. (2020)11 SR Spinal fusion Subgroup analysis: With instrumentation | DCS vs. control (4 studies; N = 350)
ICS vs. control (5 studies; N = 586)
All vs. control (9 studies; N = 936)
|
Cottrill et al. (2020)11 SR Subgroup analysis: Without instrumentation | DCS vs. control (3 studies; N = 638)
ICS vs. control (3 studies; N = 281)
All vs. control (6 studies; N = 919)
|
Cheaney et al. (2020)17 Retrospective cohort study Thoracolumbar fusion surgery | PEMF (N = 16) vs. CMF (N = 24) vs. control (N = 20)
|
Nonunion rates | |
Aleem et al. (2016)13 SR of 15 RCTs Healing of bone fracture or osteotomy | Electrical stimulators (DCS, CCS, PEMF; N = 625) vs. placebo (N = 622)
Subgroup analysis by indication:
|
Bone density | |
Mohajerani et al. (2019)15 RCT Mandibular fracture healing | PEMF (N = 16) vs. control (N = 16)
|
LIPUS vs. control | |
Time to radiographic healing | |
Schandelmaier et al. (2017)12 SR of RCTs Healing of bone fracture or osteotomy | Time to event analysis (2 RCTs; N = 532)
Number of days to radiographic healing (15 RCTs; N = 929)
Analysis by RoB:
Analysis by clinical subgroups:
Analysis by compliance:
Proportion of healed tibia fractures at 16 weeks (1 RCT)
|
Radiographic or ultrasound assessment of fractures | |
Gopalan et al. (2020)14 RCT Mandibular fracture healing | LIPUS (N = 20) vs. control (N = 20) Radiographic assessment (mean rank):
Ultrasound assessment (mean rank):
|
Bone callus consolidation | |
Santana-Rodriguez et al. (2019)16 RCT Rib fracture healing | LIPUS (N = 24) vs. placebo (N = 23)
|
CCS = capacitive coupling stimulation; CI = confidence interval; CMF = combined magnetic field; DCS = direct current stimulation; HR = hazard ratio; ICS = inductive coupling stimulation, also known as PEMF; LIPUS = low intensity pulsed ultrasound; PEMF = pulse electromagnetic field; OR = odds ratio; RCT = randomized controlled trial; RR = risk ratio; SR = systematic review.
Table 9: Summary of Findings by Outcomes – Clinical Assessment Outcomes
Study citation, study design, and patient model | Study findings |
|---|---|
Electrical stimulation vs. Control | |
Mouth opening | |
Mohajerani et al. (2019)15 RCT Mandibular fracture healing | PEMF (N = 16) vs. control (N = 16) • Maximum amount of mouth opening 46.7 ± 3.02 mm vs. 34 ± 5.4 mm; P = 0.0001 |
Sensory changes | |
Mohajerani et al. (2019)15 RCT Mandibular fracture healing | PEMF (N = 16) vs. control (N = 16) • Number of sensory changes at 3 months and 6 months post-surgery No significant difference between groups (P > 0.05) |
Malocclusion | |
Mohajerani et al. (2019)15 RCT Mandibular fracture healing | PEMF (N = 16) vs. control (N = 16) • Malocclusion numbers between groups No significant difference between groups (P > 0.05) |
Limb circumference | |
Krzyzanska et al. (2020)18 Prospective cohort study Distal radius fracture healing | PEMF (N = 27) vs. control (N = 25) • Circumference of forearm (cm) Before treatment: 25.8 ± 2.46 vs. 25.9 ± 1.89; P = 0.9198 After 3 weeks: 24.7 ± 2.39 vs. 24.2 ± 1.94; P = 0.5097 After 6 weeks: 23.9 ± 2.31 vs. 22.9 ± 1.95; P = 0.1285 • Circumference of shoulder (cm) Before treatment: 28.1 ± 2.54 vs. 28.9 ± 3.51; P = 0.4582 After 3 weeks: 26.9 ± 2.52 vs. 27.6 ± 3.34; P = 0.5097 After 6 weeks: 26.4 ± 2.36 vs. 26.8 ± 3.41; P = 0.7486 |
Wrist mobility and global grip strength | |
Krzyzanska et al. (2020)18 Prospective cohort study Distal radius fracture healing | PEMF (N = 27) vs. control (N = 25) • Wrist mobility Range of wrist dorsal flexion (o): 26 ± 10.60 vs. 15 ± 6.85; P = 0.0001 Range of palmar flexion (o): 29.5 ± 9.17 vs. 19.8 ± 5.79; P = 0.0003 • Global grip strength Strength (kg): 4.5 ± 3.14 vs. 2.2 ± 1.52; P = 0.0012 |
Exteroceptive sensation | |
Krzyzanska et al. (2020)18 Prospective cohort study Distal radius fracture healing | PEMF (N = 27) vs. control (N = 25) • Touch sensation measured by monofilaments (g) After 3 weeks: 1.7 ± 0.55 vs. 1.9 ± 0.49; P = 0.1585 After 6 weeks: 1.0 ± 0.19 vs. 1.6 ± 0.51; P = 0.0013 • Touch sensation measured by Dellon’s discriminator (mm) After 3 weeks: 1.7 ± 0.66 vs. 2.3 ± 0.75; P = 0.0098 After 6 weeks: 1.2 ± 0.42 vs. 1.8 ± 0.52; P = 0.0018 |
Upper limb disability | |
Krzyzanska et al. (2020)18 Prospective cohort study Distal radius fracture healing | PEMF (N = 27) vs. control (N = 25) • Upper limb disability evaluation (DASH questionnaire score) After 3 weeks: 45.9 ± 15.39 vs. 66.7 ± 19.39; P = 0.0003 After 6 weeks: 29.1 ± 13.97 vs. 60.1 ± 20.29; P < 0.0001 |
Range of motion | |
Krzyzanska et al. (2020)18 Prospective cohort study Distal radius fracture healing | PEMF (N = 27) vs. control (N = 25) • Range of motion shoulder flexion (o) Before treatment: 151.8 ± 18.96 vs. 146.4 ± 17.32; P = 0.1331 After 3 weeks: 162.1 ± 12.78 vs. 156.6 ± 13.87; P = 0.0280 After 6 weeks: 167.5 ± 6.42 vs. 162.0 ± 9.43; P = 0.0034 • Shoulder extension Before treatment: 39.6 ± 5.23 vs. 37.8 ± 6.03; P = 0.1935 After 3 weeks: 47.7 ± 3.11 vs. 42.6 ± 5.19; P = 0.0004 After 6 weeks: 49.7 ± 0.81 vs. 45.8 ± 4.29; P = 0.0004 • Shoulder abduction Before treatment: 144.9 ± 18.21 vs. 142.3 ± 14.12; P = 0.0727 After 3 weeks: 164.5 ± 8.19 vs. 153.6 ± 12.7; P = 0.0015 After 6 weeks: 168.4 ± 3.72 vs. 159.5 ± 10.01; P = 0.0002 • Elbow flexion (o) Before treatment: 116.1 ± 14.10 vs. 111.2 ± 8.55; P = 0.2198 After 3 weeks: 129.8 ± 14.10 vs. 122.8 ± 7.43; P = 0.0115 After 6 weeks: 141.6 ± 7.19 vs. 132.1 ± 8.24; P = 0.0001 |
LIPUS vs. control | |
Subsequent operations | |
Schandelmaier et al. (2017)12 SR of RCTs Healing of bone fracture or osteotomy | • Number of subsequent operations RR (95% CI) = 0.80 (0.55 to 1.16); I2 = 0%; 7 RCTs (N = 693) RD (95% CI) = −7% (−3% to 2%); I2 = 0%; 10 RCTs (N = 740) |
Wound healing | |
Gopalan et al. (2020)14 RCT Mandibular fracture healing | LIPUS (N = 18) vs. control (N = 17) • Wound healing assessment using the modified Landry’s Wound Healing Index (mean rank) Day 5 post-surgery: 22.08 vs. 13.08; P = 0.004 Day 9 post-surgery: 21.03 vs. 14.74; P = 0.019 Day 15 post-surgery: 20.86 vs. 14.97; P = 0.055 Day 21 post-surgery: 19.92 vs. 15.97; P = 0.182 |
Teeth mobility | |
Gopalan et al. (2020)14 RCT Mandibular fracture healing | No significant difference between groups (P > 0.05) |
DASH = disabilities of the arm, shoulder, and hand; PEMF = pulse electromagnetic field; RD = risk difference; RR = risk ratio.
Table 10: Summary of Findings by Outcomes — Pain Reduction
Study citation, study design, and patient model | Study findings |
|---|---|
Electrical stimulation vs. Control | |
Pain score | |
Aleem et al. (2016)13 SR of RCTs Healing of bone fracture or osteotomy | Pain score on 100-mm VAS (4 RCTs; N = 195) – Moderate quality based on GRADE • MD (95% CI) = −7.67 mm (−13.93 to −1.43); P = 0.02; I2 = 0% |
Mohajerani et al. (2019)15 RCT Mandibular fracture healing | PEMF (N = 16) vs. control (N = 16) • Mean pain score on 10-point VAS Immediate after treatment: 6.7 ± 1.4 vs. 7.5 ± 0.75; no statistical comparison Day 1 post-surgery: 2.8 ± 1.2 vs. 5.6 ± 1.01; no statistical comparison Week 1 post-surgery: 1.75 ± 1.06 vs. 3.85 ± 0.9; no statistical comparison Week 2 post-surgery: 0.81 ± 0.83 vs. 2.4 ± 0.9; no statistical comparison |
Krzyzanska et al. (2020)18 Prospective cohort study Distal radius fracture healing | PEMF (N = 27) vs. control (N = 25) • Mean pain score on 0 to 100 mm VAS Before treatment: 6.2 ± 2.0 vs. 7.1 ± 1.88; P = 0.096 After 3 weeks: 2.1 ± 1.41 vs. 3.5 ± 1.71; P = 0.005 After 6 weeks: 0.2 ± 0.42 vs. 2.7 ± 2.15; P < 0.0001 |
LIPUS vs. control | |
Pain score | |
Schandelmaier et al. (2017)12 SR of RCTs Healing of bone fracture or osteotomy | • Pain score on 100-mm VAS (4 RCTs; N = 654) MD (95% CI) = −6.92 mm (−15.39 to 1.55); P = 0.11; I2 = 91% Analysis by RoB:
• Pain intensity and assessed at different time points and number of painful days using SF-36 bodily pain scores: The TRUST trial showed no significant difference LIPUS and placebo groups. |
Gopalan et al. (2020)14 RCT Mandibular fracture healing | LIPUS (N = 20) vs. control (N = 20) • Pain assessment using VAS (mean rank) Before surgery: 19.53 vs. 21.48; P = 0.311 Day 5 post-surgery: 12.40 vs. 28.60; P < 0.001 Day 9 post-surgery: 12.50 vs. 28.50; P < 0.001 Day 15 post-surgery: 12.13 vs. 28.88; P < 0.001 Day 21 post-surgery: 12.58 vs. 28.43; P < 0.001 |
Santana-Rodriguez et al. (2019)16 RCT Rib fracture healing | LIPUS (N = 24) vs. placebo (N = 23) • Mean pain score on 10-point VAS Baseline: 9 ± 1.1 vs. 8.5 ± 1.2; P = 0.083 1 month: 1.3 ± 1.9 vs. 3 ± 2.7; P = 0.004 3 months: 0.3 ± 0.7 vs. 1.6 ± 1.9; P = 0.005 6 months: 0.2 ± 0 vs. 0.7 ± 1.2; P = 0.025 |
Pain medication | |
Santana-Rodriguez et al. (2019)16 RCT Rib fracture healing | LIPUS (N = 24) vs. placebo (N = 23) • Pain medication (number of patients taking pain medication) Baseline: No significant (P > 0.05) 1 month: 37.5% vs. 65.2%; P = 0.057 3 months: 4.2% vs. 30.4%; P = 0.017 6 months: No significant (P > 0.05) |
CI = confidence interval; GRADE = The Grading of Recommendations Assessment, Development and Evaluation; LIPUS = low intensity pulsed ultrasound; MD = mean difference; RCT = randomized controlled trial; SF-36 = Short Form-36; VAS = visual analogue scale.
Table 11: Summary of Findings by Outcomes – Functional Recovery
Study citation, study design, and patient model | Study findings |
|---|---|
Electrical stimulation vs. Control | |
Aleem et al. (2016)13 SR of RCTs Healing of bone fracture or osteotomy | • SF-36 scores (2 RCTs; N = 316 patients) – Low quality based on GRADE MD (95% CI) = −0.88 (−6.63 to 4.87); P = 0.76 |
LIPUS vs. control | |
Schandelmaier et al. (2017)12 SR of RCTs Healing of bone fracture or osteotomy | • Time to return to work HR (95% CI) = 1.11 (0.82 to 1.50) • Time to return to leisure activities HR (95% CI) = 1.06 (0.77 to 1.46) • Time to return to ≥ 80% of pre-injury level of function HR (95% CI) = 1.00 (0.80 to 1.25) • Time to return to full weight bearing HR (95% CI) = 0.87 (0.70 to 1.08) • Time to return to household activities % Difference (95% CI) = −1.9% (−11.6% to 8.9%) |
Santana-Rodriguez et al. (2019)16 RCT Rib fracture healing | LIPUS (N = 24) vs. placebo (N = 23) • Return to physical activity: At baseline (P = 0.081) At 1 month (P = 0.168) At 3 months (53.7% vs. 46.3%; P = 0.036) At 6 months (P = 0.465) • Work activity (number of patients who were working and those who were not due to retirement or unemployment) At baseline (P = 0.247) At 3 months (P = 0.586) At 6 months (P = 0.421) • Work activity (number of day sick leave) At baseline (P = 1) At 6 months (P = 0.351) |
CI = confidence interval; GRADE = The Grading of Recommendations Assessment, Development and Evaluation; HR = hazard ratio; LIPUS = low intensity pulsed ultrasound; MD = mean difference; RCT = randomized controlled trial.
Table 12: Summary of Findings by Outcomes — Adverse Events Related to Device
Study citation, study design, and patient model | Study findings |
|---|---|
LIPUS vs. control | |
Schandelmaier et al. (2017)12 SR of RCTs Healing of bone fracture or osteotomy | • 7 RCTs reported no adverse effects related to the device • 2 RCTs reported mild transient skin irritations in 6 patients RR (95% CI) = 2.65 (0.32 to 22.21); 2 RCTs (N = 129) RD (95% CI) = 0% (−1% to 1%); I2 = 0%; 9 RCTs (N = 839) |
Santana-Rodriguez et al. (2019)16 RCT Rib fracture healing | LIPUS (N = 24) vs. placebo (N = 23) • No patients experienced any type of complications related to LIPUS procedure |
CI = confidence interval; LIPUS = low intensity pulsed ultrasound; RCT = randomized controlled trial; RD = risk difference; RR = risk ratio.
Table 13: Summary of Findings of Included Economic Evaluation
Main study findings | Authors’ conclusion |
|---|---|
Tarride et al. (2017)19 | |
Cost-utility analysis of LIPUS compared with placebo in patients with fresh tibial fractures Clinical outcome
Costs – In 2015 Canadian dollars
Mean (95% CI): $5,656 (5,387 to 5,923) vs. $2,009 ($1,680 to 2,338) MD (95% CI) = $3,647 (3,224 to 4,070); P < 0.001
Mean (95% CI): $8,245 (7,047 to 9,443) vs. $8,466 ($7,225 to 9,708) MD (95% CI) = -$221 (−1,943 to 1,500); P = 0.801
Mean (95% CI) = $13,901 (12,616 to 15,186) vs. $10,475 ($9,128 to 11,823) MD (95% CI) = $3,425 (1,568 to 5,283); P < 0.001 | “Our analysis provides further clarity in regard to the cost-effectiveness of adjunctive LIPUS in patients with fresh tibial fractures. We found no differences in patients’ use of health-care resources, productivity losses, or HRQoL between LIPUS and placebo. LIPUS was not found to be cost-effective compared with placebo for the treatment of patients with fresh tibial fractures amenable to intramedullary nail fixation at commonly accepted cost-effectiveness thresholds.”19 (p. 1531) |
QALYs Mean number of QALYs (95% CI): 0.686 (0.666 to 0.705) vs. 0.662 (0.639 to 0.685) MD (95% CI) = 0.023 (−0.035 to 0.069); P = 0.47 ICER
Probabilistic sensitivity analyses
One-way sensitivity analyses
• Unit cost of LIPUS needs to change from $3,995 (base case) to $1,743 and $2,916 to yield ICERs of $50,000/QALY gained and $100,000/QALY gained, respectively, from a societal perspective. | |
CI = confidence interval; HRQoL = health-related quality of life; ICER = incremental cost-effectiveness ratio; LIPUS = low intensity pulsed ultrasound; MD = mean difference; QALY = quality-adjusted life-year; WTP = willingness to pay.
Appendix 5: Overlap Between Included Systematic Reviews
Note that this appendix has not been copy-edited
Table 14: Overlap in Relevant Primary Studies Between Included Systematic Reviews
Primary study citation | Cottrill et al. (2020)11 | Aleem et al. (2016)13 |
|---|---|---|
Nerubay J and Katznelson A. Int Orthop. 1984; 7:239–242. | X | |
Kane WJ. Spine 1988; 13:363–365. | X | |
Meril AJ. Spine 1994; 19:2393–2398. | X | |
Rogozinski A and Rogozinski C. Spine 1996; 21:2479–2483. | X | |
Tejano NA, et al. Spine 1996; 21:1904–1908. | X | |
Kucharzyk DW. Spine 1999; 24:465–469, 1999. | X | |
Jenis LG, et al. J Spinal Disord. 2000; 13:290–296. | X | |
Welch WC, et al. Adv Ther. 2004; 21:389–400. | X | |
Andersen T, et al. Spine 2009; 34:2248–2253. | X | X |
Goodwin CB, et al. Spine 1999; 24:1349–1357. | X | X |
Mooney V. Spine 1990; 15:708–712. | X | |
Marks RA. Adv Ther. 2000; 17:57–67. | X | |
Jenis LG, et al. J Spinal Disord. 2000; 13:290–296. | X | |
Bose B. Adv Ther. 2001; 18:12–20. | X | |
Linovitz RJ, et al. Spine 2002; 27:1383–1389. | X | X |
Foley KT, et al. Spine J. 2008; 8:436–442. | X | |
Coric D, et al. Bone Joint Res. 2018; 7:124–130. | X | |
Faldini C, et al. Curr Orthop Pract 2010; 21:282–287. | X | |
Andersen T, et al. Spine 2009; 34:2241–2247. | X | |
Adie S, et al. J Bone Joint Surg American 2011; 93:1569–1576. | X | |
Barker AT, et al. Lancet 1984; 1:994–996. | X | |
Hannemann PF, et al. J Bone Joint Surg British 2012; 94:1403–1408. | X | |
Hannemann PF, et al. Bone & Joint J. 2014; 96-B:1070–1076. | X | |
Mammi GI, et al. Clin Orthop Relat 1993;246–253. | X | |
Martinez-Rondanelli A, et al. Colombia Medica 2014; 45:67–71. | X | |
Mooney V. Spine 1990; 15:708–712. | X | |
Scott G and King JB. J Bone Joint Surg American 1994; 76:820–826. | X | |
Sharrard WJA. J Bone Joint Surg British 1990; 72:347–355. | X | |
Shi HF, et al. BMC Musculoskelet Disord 2013; 14:35. | X | |
Simonis RB et al. Injury 2003; 34:357–362. | X |
Appendix 6: References of Potential Interest
Additional Reference
Poolman RW, Agoritsas T, Siemieniuk RA, et al. Low intensity pulsed ultrasound (LIPUS) for bone healing: a clinical practice guideline. BMJ. 2017;356:j576. PubMed
ISSN: 2563-6596
Disclaimer: The information in this document is intended to help Canadian health care decision-makers, health care professionals, health systems leaders, and policy-makers make well-informed decisions and thereby improve the quality of health care services. While patients and others may access this document, the document is made available for informational purposes only and no representations or warranties are made with respect to its fitness for any particular purpose. The information in this document should not be used as a substitute for professional medical advice or as a substitute for the application of clinical judgment in respect of the care of a particular patient or other professional judgment in any decision-making process. The Canadian Agency for Drugs and Technologies in Health (CADTH) does not endorse any information, drugs, therapies, treatments, products, processes, or services.
While care has been taken to ensure that the information prepared by CADTH in this document is accurate, complete, and up-to-date as at the applicable date the material was first published by CADTH, CADTH does not make any guarantees to that effect. CADTH does not guarantee and is not responsible for the quality, currency, propriety, accuracy, or reasonableness of any statements, information, or conclusions contained in any third-party materials used in preparing this document. The views and opinions of third parties published in this document do not necessarily state or reflect those of CADTH.
CADTH is not responsible for any errors, omissions, injury, loss, or damage arising from or relating to the use (or misuse) of any information, statements, or conclusions contained in or implied by the contents of this document or any of the source materials.
This document may contain links to third-party websites. CADTH does not have control over the content of such sites. Use of third-party sites is governed by the third-party website owners’ own terms and conditions set out for such sites. CADTH does not make any guarantee with respect to any information contained on such third-party sites and CADTH is not responsible for any injury, loss, or damage suffered as a result of using such third-party sites. CADTH has no responsibility for the collection, use, and disclosure of personal information by third-party sites.
Subject to the aforementioned limitations, the views expressed herein are those of CADTH and do not necessarily represent the views of Canada’s federal, provincial, or territorial governments or any third-party supplier of information.
This document is prepared and intended for use in the context of the Canadian health care system. The use of this document outside of Canada is done so at the user’s own risk.
This disclaimer and any questions or matters of any nature arising from or relating to the content or use (or misuse) of this document will be governed by and interpreted in accordance with the laws of the Province of Ontario and the laws of Canada applicable therein, and all proceedings shall be subject to the exclusive jurisdiction of the courts of the Province of Ontario, Canada.
The copyright and other intellectual property rights in this document are owned by CADTH and its licensors. These rights are protected by the Canadian Copyright Act and other national and international laws and agreements. Users are permitted to make copies of this document for non-commercial purposes only, provided it is not modified when reproduced and appropriate credit is given to CADTH and its licensors.
About CADTH: CADTH is an independent, not-for-profit organization responsible for providing Canada’s health care decision-makers with objective evidence to help make informed decisions about the optimal use of drugs, medical devices, diagnostics, and procedures in our health care system.
Funding: CADTH receives funding from Canada’s federal, provincial, and territorial governments, with the exception of Quebec.
Questions or requests for information about this report can be directed to Requests@CADTH.ca