CADTH Health Technology Review
Heart Function Clinics for Patients With Heart Failure
September 2021
Rapid Review
Authors: Khai Tran, Robyn Butcher
Abbreviations
CI
confidence interval
CMS
Centers for Medicare & Medicaid Services
DKK
Danish krone
HF
heart failure
ICER
incremental cost-effectiveness ratio
OR
odds ratio
PDC
proportion of days covered
QALY
quality-adjusted life-year
RCT
randomized controlled trial
SR
systematic review
WTP
willingness-to-pay
Key Messages
Low- to moderate-quality clinical evidence suggested that heart failure clinics were associated with significant reductions in all-cause mortality, reductions in heart failure‒related hospitalization, better guideline-directed medical therapy management, and higher adherence to heart failure medications compared to usual care. The findings for all-cause hospitalization were mixed.
One low-quality economic study in Denmark found that heart failure clinics were associated with higher costs but no significant difference in mortality rates compared with the usual care. Another moderate cost-effectiveness analysis study in Canada revealed that heart failure clinic interventions were cost-effective compared to standard care, with an incremental cost-effectiveness ratio below the willingness-to-pay threshold.
Context and Policy Issues
A 2018 report from the Canadian Chronic Disease Surveillance System estimated about 669,600 (3.6%) Canadian adults aged 40 years and older were living with heart failure (HF).1 The direct health care cost for HF in Canada was estimated to be CA$2.8 billion per year by a 2016 Heart and Stroke Foundation report.2 Despite recent developments in evidence-based care for HF, the overall hospital readmission and all-cause mortality rates among people living with HF remain relatively high.1
Many strategies have been developed for the transition care for patients with HF after being discharged from the hospital, with an intent to improve outcomes and to reduce mortality and rehospitalization.3 Models of care that appear to be more effective among treatment strategies in reducing mortality and rehospitalization include nurse-led titration of drugs, programs promoting self-care, outpatient cardiologist care, and multidisciplinary clinics.3 A multidisciplinary team of health care professionals includes, at a minimum, a cardiologist and a nurse specialist, with other specialists including a dietician, pharmacist, psychologist, physiotherapist, and/or social worker.3 Recent evidence has shown that many multidisciplinary disease management programs including HF clinics were associated with reductions in mortality and readmission rates.3 However, the clinical benefit of the multidisciplinary HF clinics remains uncertain and whether the benefit is balanced against the cost for implementing this intervention is unknown.
The aim of this report is to summarize the evidence regarding the clinical effectiveness and cost-effectiveness of multidisciplinary HF clinics in adults with HF.
The terms “heart function clinic” and “heart failure clinic” are synonymous and, as all the included studies for this report used “heart failure clinic,” the latter term is used throughout this report.
Research Questions
What is the clinical effectiveness of HF clinics for adults with HF?
What is the cost-effectiveness of HF clinics for adults with HF?
Methods
Literature Search Methods
A limited literature search was conducted by an information specialist on key resources including MEDLINE, the Cochrane Database of Systematic Reviews, the international HTA database, the websites of Canadian and major international health technology agencies, as well as a focused internet search. The search strategy comprised both controlled vocabulary, such as the National Library of Medicine’s MeSH (Medical Subject Headings), and keywords. The main search concepts were heart failure or heart function clinics. For research question 1, no filters were applied to limit the retrieval by study type. For research question 2, CADTH-developed search filters were applied to limit retrieval to economic studies. Where possible, retrieval was limited to the human population. The search for research question 1 was limited to English-language documents published between January 1, 2016 and August 3, 2021. The search for research question 2 was limited to English-language documents published between January 1, 2010 and August 3, 2021.
Selection Criteria and Methods
One reviewer screened citations and selected studies. In the first level of screening, titles and abstracts were reviewed and potentially relevant articles were retrieved and assessed for inclusion. The final selection of full-text articles was based on the inclusion criteria presented in Table 1.
Criteria | Description |
|---|---|
Population | Adults with any stage of heart failure |
Intervention | Q1 and Q2: Heart failure management through multidisciplinary heart function clinics (also known as heart failure clinics) involving a team of health care professionals |
Comparator | Q1 and Q2: Usual/standard heart failure management provided by a single practitioner in the community; waitlist Q1: No treatment |
Outcomes | Q1: Clinical effectiveness (e.g., morbidity, mortality [e.g., sudden cardiac death], change in left ventricular ejection fraction or stage of heart failure, need for hospital or emergency room admission, kidney function) and safety (e.g., rate of adverse events) Q2: Cost-effectiveness (e.g., cost per quality-adjusted life-year gained) |
Study Designs | HTAs, SRs, RCTs, non-randomized studies, and economic evaluations |
HTA = health technology assessment; Q = question; RCT = randomized controlled trial; SR = systematic review.
Exclusion Criteria
Articles were excluded if they did not meet the selection criteria outlined in Table 1 or were published before 2016 for clinical studies or before 2010 for economic studies. As the intervention is the multidisciplinary HF clinics involving a team of health care professionals, studies on nurse-led clinics ― which involved nurses and no other health care professionals ― were excluded. Economic studies that did not consider both benefits and costs were excluded.
Critical Appraisal of Individual Studies
The included publications were critically appraised by 1 reviewer using the following tools as a guide: A MeaSurement Tool to Assess systematic Reviews 2 (AMSTAR 2)4 for systematic reviews, the Downs and Black checklist5 for non-randomized studies, and the Drummond checklist6 for economic evaluations. Summary scores were not calculated for the included studies; rather, the strengths and limitations of each included publication were described narratively.
Summary of Evidence
Quantity of Research Available
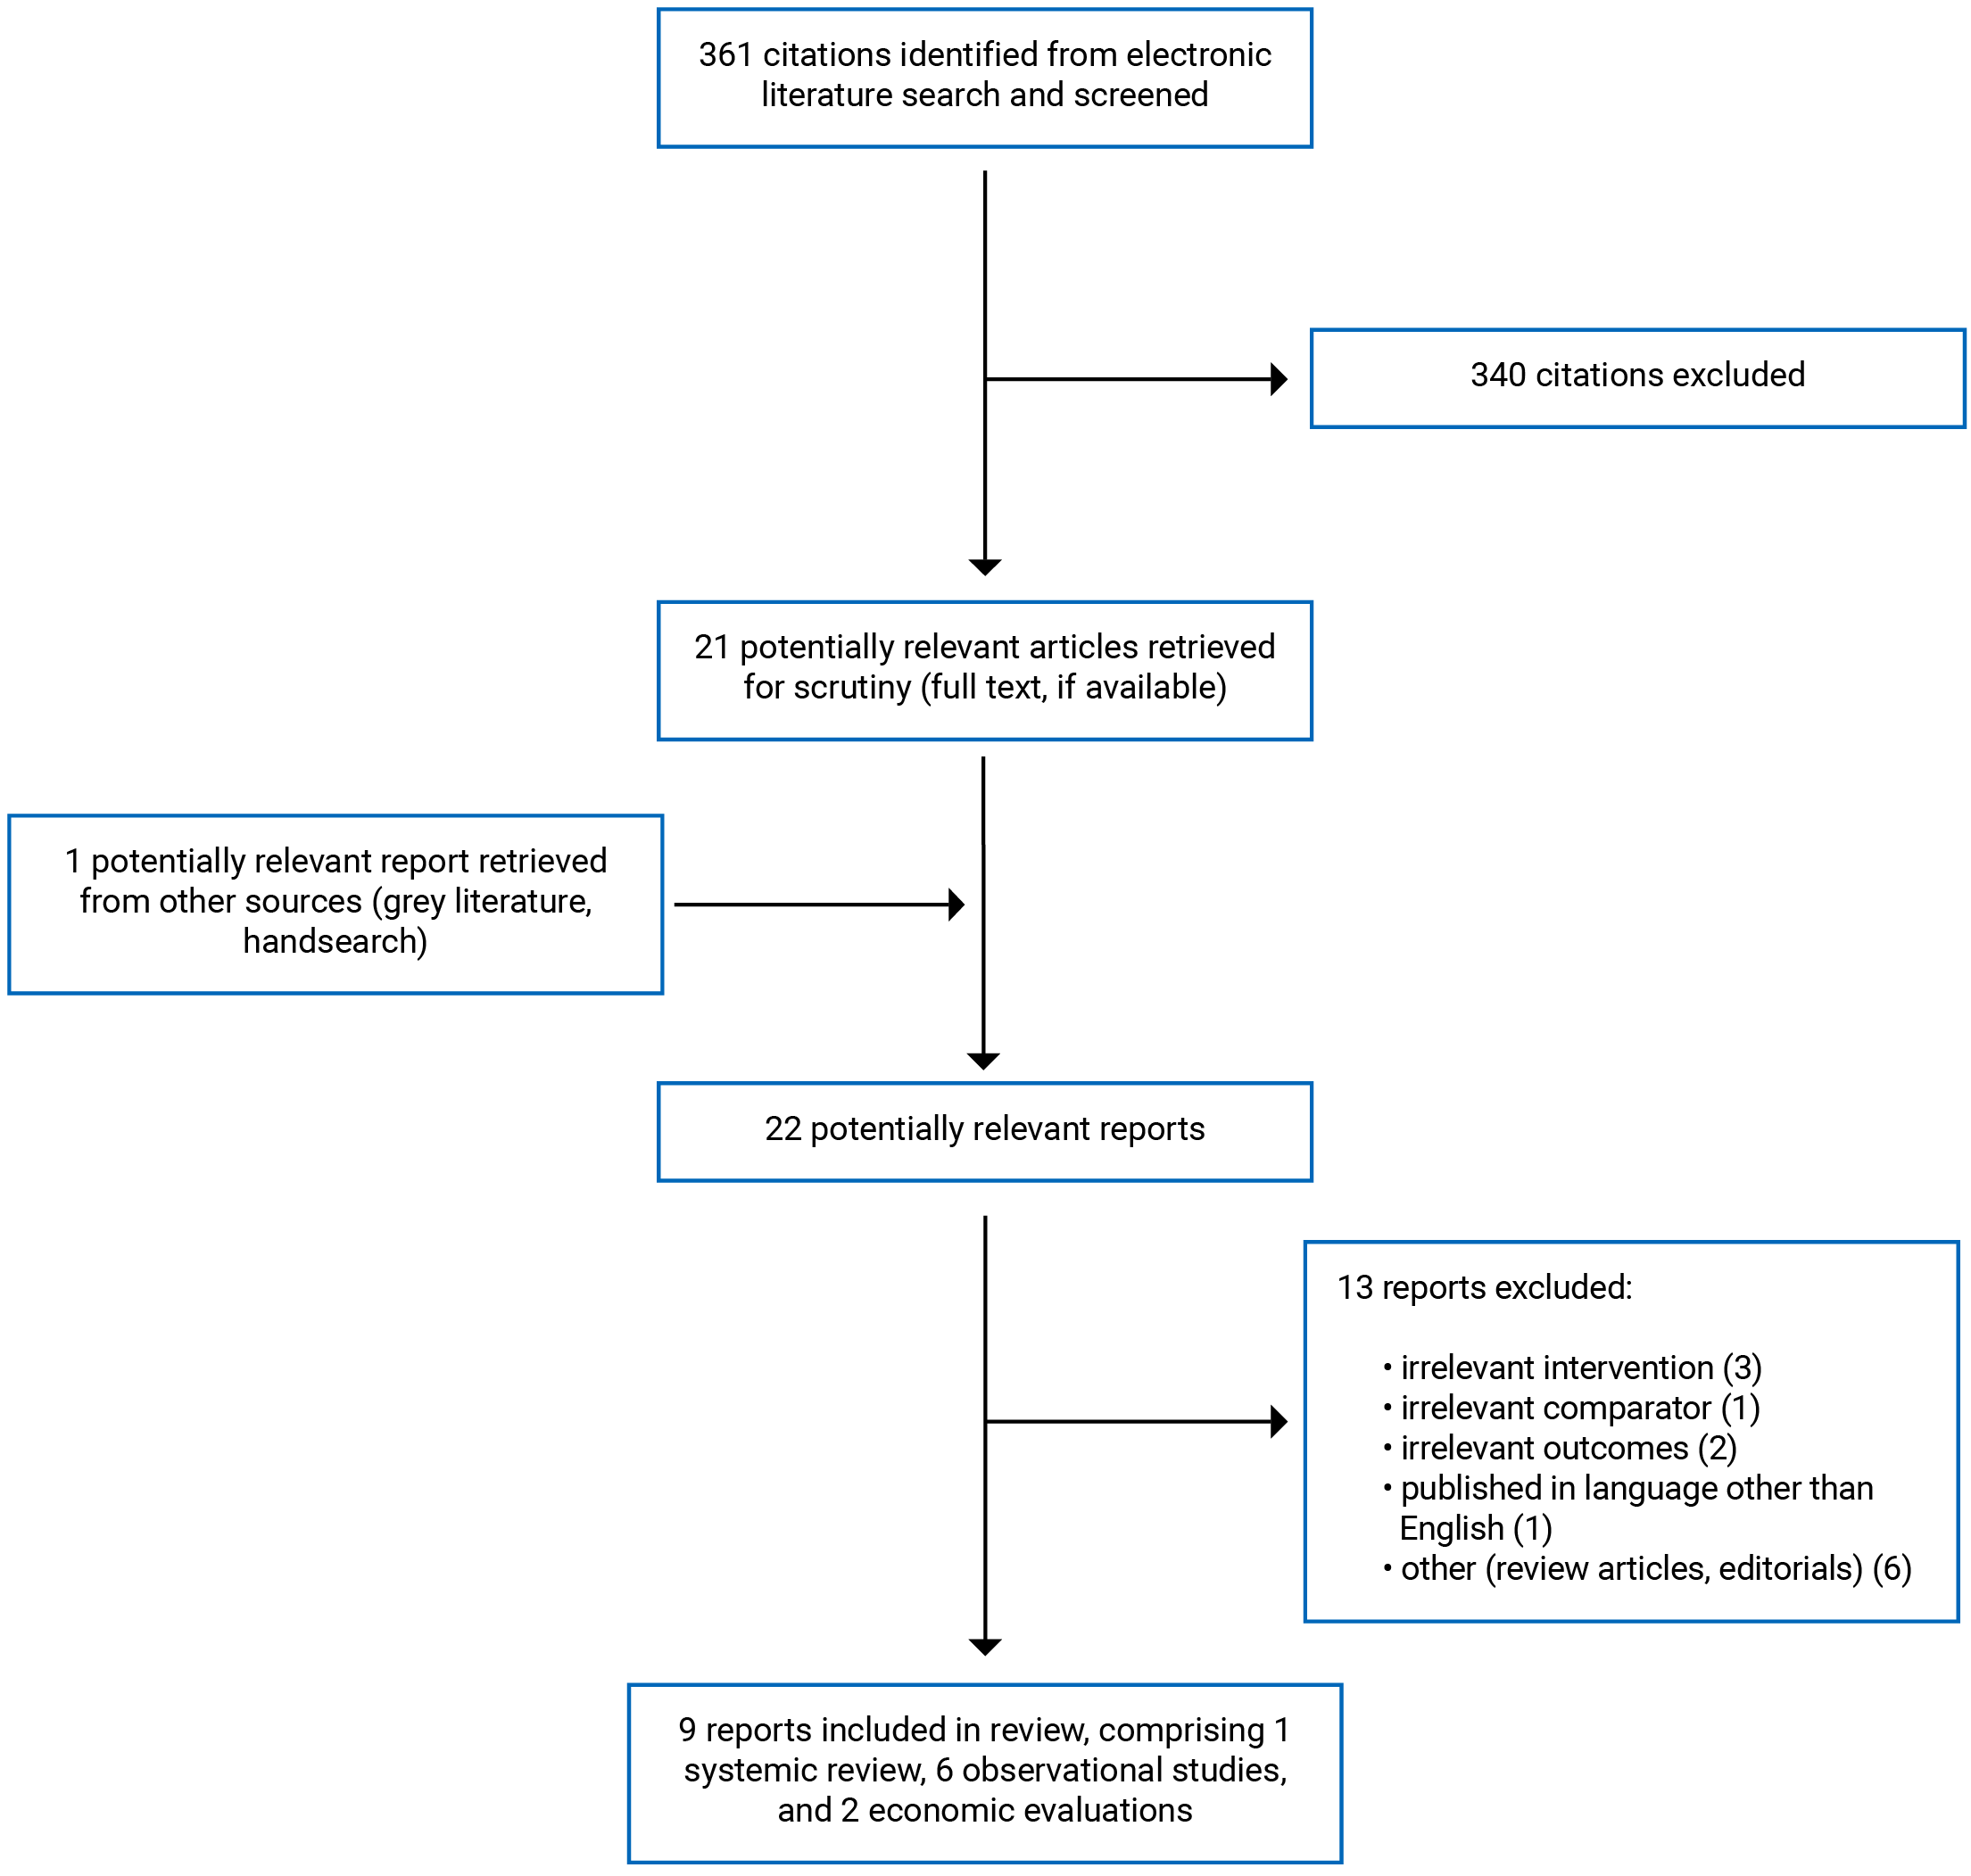
A total of 361 citations were identified in the literature search. Following screening of titles and abstracts, 340 citations were excluded and 21 potentially relevant reports from the electronic search were retrieved for full-text review. One potentially relevant publication was retrieved from the grey literature search for full-text review. Of these potentially relevant articles, 13 publications were excluded for various reasons and 9 publications met the inclusion criteria and were included in this report. These comprised 1 systematic review (SR), 6 non-randomized studies, and 2 economic evaluations. Appendix 1 presents the PRISMA7 flow chart of the study selection. Additional references of potential interest are provided in Appendix 5.
Summary of Study Characteristics
The detailed characteristics of the included SR8 (Table 2), primary clinical studies9-14 (Table 3), and economic evaluation studies15,16 (Table 4) are provided in Appendix 2.
The included SR8 had broader inclusion criteria than the present review. Specifically, the SR8 included studies on nurse-led HF clinics, which involved nurses and no other health care professionals. Only the characteristics and results of the subset of relevant studies were described in this report.
Study Design
The SR8 included 10 relevant randomized controlled trials (RCTs) comparing the clinical effectiveness of HF clinics with usual care. The SR was published in 2017.8 The 10 relevant RCTs included in the SR were published between 2002 and 2014.
The 6 included primary clinical studies comprised 1 prospective cohort study12 and 5 retrospective cohort studies.9-11,13,14 The studies were published between 2017 and 2020.
The cost-effectiveness analysis of an HF clinic in Denmark was a master thesis published in 2014 by Ravn (2014).15 Both clinical and cost data were obtained from a registry of data from the periods before and after the establishment of the HF clinic study. The time horizon was 1 year. The perspective taken for the analysis was not reported. Costs included in the analysis were costs directly connected to the HF clinic and costs of health care services. As for day-to-day running costs, wages for nurses and no other cost items were considered. All costs were converted into 2014 Danish krone (DKK) currency. The clinical outcome used in the analysis was all-cause mortality. Another outcome of interest was days before hospital readmission, but this outcome measure was not available at the time of the analysis.
The cost-effectiveness analysis by Wijeysundera et al. (2010)16 published in 2010 was conducted using life expectancy as the clinical outcome, which was estimated from a published population-based study for standard care and from a published SR and meta-analysis for an HF clinic. Costs considered in the analysis for the HF clinic included costs of health practitioner visits and staffing, costs of laboratory and imaging tests, medication costs, and costs of operating and overhead. Costs associated with standard care were health-related costs and medication costs. Medication costs were assumed to be similar between the 2 treatment strategies. Costs were adjusted to 2008 Canadian dollars. All health outcomes and costs were discounted at 5%. The time horizon for the analysis was 12 years. The perspective taken was that of the Ontario Ministry of Health and Long-Term Care.
Country of Origin
The SR8 was conducted by authors from Canada and the US.
The primary clinical studies were conducted by authors from India,9 Israel,10,12 and the US.11,13,14
The economic evaluation studies were conducted by author(s) from Denmark15 and Canada.16
Patient Population
Patients in the RCTs included in the SR8 were adults with a diagnosis of HF who had been discharged from hospitals and were to be followed up with HF clinics or usual care. The mean age of patients among the RCTs ranged from 56 years to 76 years, with 55% to 84% of the patients being male. The mean ejection fraction (i.e., a measurement of the percentage of blood leaving the heart every time it contracts) of patients among the RCTs ranged from 27% to 38%.
Patients in all included primary clinical studies9-14 were adults with a discharge diagnosis of HF. The mean age ranged from 66 years to 75 years, with the percentage of males ranging from 51% to 98%. The mean ejection fraction ranged from 26.4% to 40% or lesser. In each study, there was an imbalance in certain baseline characteristics, such as age, gender, socioeconomic status, comorbidities, or baseline therapy.
Patients in both economic evaluation studies15,16 were adults discharged from an index hospitalization for HF. The study by Ravn (2014) in Denmark used patient data from a registry study of 2 periods of 365 days before (N = 62; 53% male; mean age = 78.8 years) and after (N = 52; 63% male; mean age = 76.4 years) the implementation of an HF clinic. The study by Wijeysundera et al. (2010)16 used patient data from 2 cohorts: A standard care cohort consisted of all patients in the fiscal year 2005 in Ontario discharged from hospitals with a diagnosis of HF (N = 16,443; 49% male; mean age = 76.8 years) and a hypothetical HF clinic cohort modelled using the same patients in the standard care cohort.
Interventions and Comparators
The SR8 included 16 RCTs ― 6 of which had randomized patients to either a nurse-led HF clinic or usual care and 10 of which had randomized patients to either a multidisciplinary non-nurse-led HF clinic or usual care. Nurse-led HF clinics, which involved nurses and no other health care professionals, were not in scope with the current review and therefore this review reports on the findings of the 10 RCTs that were in scope. The multidisciplinary non–nurse-led HF clinics across studies were quite heterogeneous regarding the components and modalities of the intervention. Staff involved in a multidisciplinary HF clinic included cardiologists, HF nurses, dieticians, physiotherapists, pharmacists, and/or social workers. Usual care was provided by either a cardiologist or a primary care physician.
Three retrospective cohort studies9-11 and 1 prospective cohort study12 compared multidisciplinary HF clinics with usual care. One retrospective cohort study13 compared data from a multidisciplinary HF clinic with the Centers for Medicare & Medicaid Services (CMS) data for the national average and surrounding area hospitals, while the other retrospective cohort study14 compared data of patients attending a multidisciplinary HF clinic with historical controls who did not attend the HF clinic.
One economic evaluation study15 compared a period with a multidisciplinary HF clinic established with a period before its establishment. The other economic evaluation study16 compared a hypothetical multidisciplinary HF clinic with standard care.
In this report, all comparators were termed as usual care or standard care.
Outcomes
The primary outcome in the SR8 was a composite end point of HF-related hospitalization and all-cause mortality. Secondary outcomes included HF-related hospitalization, all-cause hospitalization, and all-cause mortality. Follow-up periods were either less than 3 months or 3 months and greater.
The clinical outcomes considered in the primary clinical studies included hospitalization,9-11,13 mortality,9,12,13 guideline-directed medical therapy,9,10,12 improvement in ejection fraction,9 primary care and emergency department visits,10 and medication adherence.14 The follow-up periods among the included studies ranged from 3 months to 2 years.
The primary outcome in 1 economic evaluation study15 was an incremental cost-effectiveness ratio (ICER), which was calculated as the incremental cost per change in mortality rate based on registry data drawn before and after the establishment of an HF clinic. The other economic evaluation study16 also had an ICER as the primary outcome and defined it as the incremental cost per life-year gained.
Summary of Critical Appraisal
The detailed quality assessments of the SR8 (Table 5), primary clinical studies9-14 (Table 6), and economic evaluation studies15,16 (Table 7) are provided in Appendix 3.
The SR8 was explicit in its objective and inclusion criteria for the review and selection of the study designs for inclusion, and included a comprehensive literature search strategy. Data extraction was performed in duplicate, but it was unclear if study selection was performed in duplicate. The SR did not report whether a protocol had been published before the conducting of the review. The SR also did not report the sources of funding of the studies included in their review and did not provide a list of excluded studies. The characteristics of the included studies were described in adequate detail. The Jadad 5-point scale was used to assess the quality of the included RCTs. Meta-analysis was performed to combine the results, but subgroup analysis was not conducted to assess the potential impact of risk of bias on the results. Quality assessments revealed 6 high-quality RCTs (a score of 3 or higher) and 4 moderate-quality RCTs (a score from 1 to 2), as assessed by the authors. Statistical heterogeneity was observed and discussed. Publication bias was investigated using funnel plots. Conflicts of interest were declared. Overall, the SR was of moderate methodological quality.
All primary clinical studies9-14 clearly described the objective of the study, the main outcomes, and the main findings of the study. Of the 6 studies, 1 study13 provided the characteristics of patients in the HF clinic group but not those in the control group and 2 studies9,12 did not describe the components of the HF clinics. None of the included studies investigated the adverse events of the intervention. Actual P values were reported in all studies. Regarding external validity, it was unclear if the participants were representative of the entire population from which they were recruited in all included studies. However, the treatment settings in all studies appeared to be representative of the treatment received by most of the patients. For internal validity, all studies were of observational design (i.e., 5 retrospective cohort studies and 1 prospective cohort study) and were therefore subject to risk of selection, performance, and detection biases. Patients in the intervention and control groups of all included studies were not recruited from the same population, or over the same period, which may have led to selection bias. Despite differences in baseline patient characteristics between groups in all included studies, only 2 studies10,14 adjusted for potential confounders in the analysis, while the other 4 studies did not.9,11-13 None of studies provided sample size calculations and therefore it was unclear if the studies had sufficient power to detect a statistically significant effect where the P value for a difference being due to chance is less than 5%. Overall, the methodological quality of the included studies was low.
Both economic evaluation studies15,16 clearly stated the objectives, the economic importance of the research questions, the rationale for choosing the alternative comparators, and the type of economic evaluation that was conducted. One study15 did not state the perspective of the analysis, while the other study16 used the Ontario Ministry of Health and Long-Term Care perspective in its analysis. For data collection, both studies clearly stated the sources of effectiveness estimates, with details of the design and findings of those studies, the primary outcome measures for the economic evaluation, the methods for the estimation of quantities and unit costs, and the currency and price data. Both studies15,16 did not have a model in their economic evaluations. For the analysis and interpretation of results, 1 study16 clearly stated the time horizon of costs and benefits, the discount rate, statistical tests and confidence intervals, justification for the choice of variables for sensitivity analysis, and the ranges over which the variables were varied. The other study15 did not apply any discount rate, as its time horizon was 1 year. Both studies15,16 reported incremental analysis and presented major outcomes in a disaggregated, as well as aggregated, form. The conclusions in both studies15,16 were based on the data reported and were accompanied by the appropriate caveats. Overall, 1 study15 was of low quality and 1 study16 was of moderate quality with respect to the study design, data collection, and analysis and interpretation of results.
Summary of Findings
Appendix 4 presents the main study findings of the SR,8 the primary clinical studies,9-14 and the economic evaluation studies.15,16 The findings of the SR and primary clinical studies are presented by outcomes, which are the composite end points of HF-related hospitalization and all-cause mortality (Table 8), hospitalization (Table 9), mortality (Table 10), guideline-directed medical therapy (Table 11), improvement in ejection fraction (Table 12), medical visits (Table 13), and medication adherence (Table 14). The findings and authors’ conclusions of the economic evaluation studies are presented in Table 15.
Clinical Effectiveness of HF Clinics for Patients With HF
Composite End Point of HF-Related Hospitalization and All-Cause Mortality
Meta-analysis results of the SR8 showed that patients followed up in the multidisciplinary non–nurse-led HF clinics had a significantly lower incidence of the primary composite end point of HF-related hospitalization and all-cause mortality compared with usual care. The odds ratio (OR) (95% confidence interval [CI]) of 10 RCTs was 0.52 (0.34 to 0.80; P = 0.003). However, there was substantial heterogeneity among studies (I2 = 77%).
Hospitalization
Meta-analysis results of the SR8 showed that patients followed up in the multidisciplinary non–nurse-led HF clinics had a statistically significantly lower incidence of HF-related hospitalization (7 RCTs [OR = 0.58; 95% CI, 0.38 to 0.89]; P = 0.01; I2 = 68%). However, no statistically significant difference in all-cause hospitalization between groups was observed (5 RCTs [OR = 1.06; 95% CI, 0.84 to 1.34]; P = 0.61; I2 = 15%).
One retrospective cohort study9 found a statistically significant difference in the number of events of rehospitalization in favour of HF clinics compared to usual care (65 versus 189, with 200 patients in each group; P = 0.0001). Two other retrospective cohort studies11,13 also found that 30-day hospital readmission rates (defined as patients readmitted to the hospital within the following 30 days of discharge for any cause) were statistically significantly lower in patients seen in the HF clinic compared with usual care (5.4% versus 16.4%; P < 0.05)11 or compared with the CMS data (13.3% versus 22%; P < 0.001).13 In contrast, 1 retrospective cohort study10 found that patients in the HF clinic group had statistically significantly higher 30-day hospital readmission rates compared to the control group (55.5% versus 33.7%, P = 0.006 during 2013; 50.6% versus 32.4%, P = 0.04 during 2014). The authors of this study suggested that patients in this specialized HF clinic might have better care and follow-up, leading to earlier referral to hospitalization.
Mortality
Meta-analysis results of the SR8 showed that patients in the multidisciplinary, non-nurse-led HF clinics had a statistically significantly lower all-cause mortality compared to usual care (10 RCTs; [OR = 0.64, 95% CI, 0.47 to 0.88]; P = 0.006; I2 = 27%).
Two retrospective cohort studies9,13 found that patients followed up at the HF clinics had statistically significantly lower mortality rates compared to usual care (2% versus 8%; P = 0.05)9 or compared with the CMS data (1.2% versus 11.6%; P < 0.001).13 One prospective cohort study12 found that the cumulative incidence of mortality of patients followed up at the HF clinic was statistically significantly lower compared with patients receiving usual care (P = 0.0006, log rank test score).
Guideline-Directed Medical Therapy
A retrospective cohort study9 found that a statistically significantly higher proportion of patients in the HF clinic group received guideline-directed medical therapy (81% versus 55%; P = 0.001) and that a statistically significantly higher number of patients in the HF clinic achieved target doses of HF medications (e.g., beta-blockers: 59% versus 34%, P = 0.0001; renin-angiotensin inhibitors: 65% versus 20%, P = 0.0001), when compared to those in the usual care group. Moreover, patients in the HF clinic group attained target doses faster when compared to usual care.
One retrospective cohort study10 found that a statistically significantly higher proportion of patients treated in the HF clinic received medications recommended by guidelines for the treatment of HF (e.g., renin-angiotensin inhibitors: 92.7% versus 80.1%, P = 0.007; beta-blockers: 95.1% versus 76.7%, P < 0.0002; spironolactone: 34.7% versus 70.7%, P < 0.0001; furosemide: 80.5% versus 61.5%, P = 0.001; statin: 92.7% versus 77.5%, P = 0.002; anticoagulant: 76.5% versus 52.7%, P = 0.01) compared to usual care.
A prospective cohort study12 also found that, compared with usual care, statistically significantly more patients treated at the HF clinic achieved the recommended dose of beta-blockers (85% versus 65%, P < 0.001), renin-angiotensin inhibitors (82% versus 65%, P = 0.0006), and mineralocorticoid receptor antagonists (45% versus 31%, P < 0.001) at the end of follow-up.
Improvement in Ejection Fraction
In 1 retrospective cohort study,9 statistically significantly more patients in the HF clinic group had an improvement in ejection fraction at the twelfth month compared to the first month of follow-up (28.12% during the first month, 38.59% by the end of the 12th month, P = 0.001), while there was no statistically significant improvement in ejection fraction in patients in the usual care group (33.87% during the first month, 34.03% by the end of the twelfth month, P = 0.38).
Medical Visits
One retrospective cohort study10 found that patients in the HF clinic group had a statistically significantly greater number of primary care physician visits (31.2 ± 15.6 versus 20.8 ± 13.7; P = 0.0001) and emergency department visits (0.5 ± 1.2 versus 0.2 ± 0.5; P = 0.03) compared to usual care. The authors of this study suggested that patients in this specialized HF clinic might have better care and follow-up, leading to earlier referral to medical attention.
Medication Adherence
A retrospective cohort study14 assessed medication adherence using 2 measures. The first measure was the 90-day proportion of days covered (PDC-90), defined as the ratio of total days’ supply of medication dispensed divided by total days prescribed. The second measure was the proportion of patients who were adherent at 90 days after discharge. Patients were adherent if their PDC-90 was 0.80 or higher. The study found that, compared with usual care, the HF clinic was associated with a statistically significantly higher and improved mean PDC-90 for beta-blockers (0.92 ± 0.17 versus 0.85 ± 0.26; P = 0.04), angiotensin-converting enzyme inhibitors (0.93 ± 0.16 versus 0.82 ± 0.28; P = 0.005), and aldosterone antagonists (0.94 ± 0.14 versus 0.69 ± 0.32; P = 0.001). No statistically significant differences between groups were seen for angiotensin II receptor blockers (0.87 ± 0.25 versus 0.98 ± 0.05; P = 0.11) or digoxin (0.92 ± 0.20 versus 0.84 ± 0.25; P = 0.26). In the HF clinic group, compared to usual care, a statistically significantly higher proportion of patients were adherent at 90 days post-discharge to angiotensin-converting enzyme inhibitors (87% versus 68%; P = 0.004), but no statistically significant differences were found in the proportions of patient adherence to beta-blockers (83% versus 74%; P = 0.2), angiotensin II receptor blockers (77% versus 100%; P = 0.05), or digoxin (83% versus 73%; P = 0.27).
Cost-Effectiveness of HF Clinics for Patients With HF
The study by Ravn (2014)15 assessed the cost-effectiveness of an HF clinic in a hospital in Denmark compared with follow-up with a general practitioner during the period before the establishment of the HF clinic. The clinical outcome used in the analysis was all-cause mortality obtained from a registry study. There was no statistically significant difference between the periods before and after the establishment of the HF clinic (0.361 versus 0.369; difference = 0.037; P = 0.59). The difference in total costs between the 2 periods was DKK18,289.95. The ICER was estimated to be 494,323, meaning that it would cost an extra DKK494,323 for preventing an extra death with the HF clinic compared to usual care. One-way sensitivity analyses found none of the variables could shift the ICER except for the mortality rate.
The study by Wijeysundera et al. (2010)16 performed a cost-effectiveness analysis from the perspective of the Ontario Ministry of Health and Long-Term Care that compared HF clinics in Ontario to standard care, with a 12-year time horizon. The difference in life expectancy between HF clinics and standard care was 0.71 year or 8.5 months. The difference in total costs between HF clinics and standard care was CA$12,895. The ICER was estimated to be CA$18,259, meaning it would cost an extra CA$18,259 for each additional life-year gained with an HF clinic compared to standard care. The authors stated that the results were robust across the range of plausible values in 1-way sensitivity analyses. Specifically, the results did not vary if medication and diagnostic test costs increased by 50%. Within the 95% CI of the mortality benefit associated with HF clinics expressed as a risk ratio (0.56 to 0.91), the HF clinic strategy remained cost-effective at a willingness-to-pay (WTP) threshold of CA$50,000. Probabilistic sensitivity analyses revealed that, of 10,000 simulations, 99.4% were cost-effective at a WTP threshold of $50,000.
Limitations
The included SR8 had several limitations. The SR included 16 RCTs, of which 6 RCTs randomized patients to a nurse-led HF clinic that was not a multidisciplinary clinic and whose findings were not presented in this report. Several subgroup analyses such as follow-up duration (less than 3 months versus 3 months or longer), outpatient conditions (stable versus recent emergency department visit or hospitalization), mean ejection fraction (30% or less versus more than 30%), and year of publication (2008 or earlier versus after 2008) were not presented in this report because the analyses included RCTs from both nurse-led and non–nurse-led multidisciplinary HF clinics. In addition, there was substantial clinical heterogeneity among the included RCTs due to differences in the enrolled populations, with variations in comorbidities and baseline therapy, sample sizes, follow-up duration, components and modality of the HF clinics, and the provision of the usual care (i.e., delivered by a single cardiologist or a primary care physician).
A significant limitation of the included primary clinical studies9-14 was the risk of selection bias because of the nature of the retrospective or cohort study design. In 1 prospective cohort study,12 the data analysis was retrospective even though the data were captured prospectively. Patients with missing data in the electronic records might have been missed. The study groups were not randomized and therefore the more severe cases or sicker patients who had been hospitalized had recently deteriorated or had been frequent visitors at the primary care clinic and were more likely to be referred to the HF clinic to improve care. Alternatively, patients who had decided to attend an HF clinic might have been sicker than those who had declined to do so. Indeed, there were significant differences between groups in certain patient characteristics such as severity of the disease and baseline use of HF medication; nevertheless, 49,11-13 of the 6 included observational studies did not adjust for potentially confounding variables in their analyses. None of the included studies performed sample size calculations and, therefore, the non-significant differences in certain outcomes between groups may be due to the lack of power. One retrospective cohort study14 estimated medication adherence based on prescriptions filled, which might not accurately reflect medications taken. None of the included clinical primary studies were conducted in Canada. With the aforementioned limitations, the interpretation and generalizability of the findings of the included studies in the Canadian context should be made with caution.
One major limitation of both economic evaluation studies15,16 was the lack of incorporating the quality-of-life aspect into the clinical outcome using utility weights (e.g., quality-adjusted life-year [QALY] gained). In the study by Ravn (2014),15 the pre-specified second outcome measure (i.e., days before readmission) was not available at the time of the writing up of the thesis and was therefore not included in the cost-effectiveness analysis. This study15 did not perform probabilistic sensitivity analyses and did not discuss the ICER with respect to the WTP threshold. One of the limitations of the study by Wijeysundera et al. (2010)16 was that the efficacy values of the HF clinics were derived from the results of an SR, which included only RCTs whose populations were highly selected. Another limitation of this study16 was that the costs of the HF clinic intervention were based on a single clinic in Ontario, which may not be representative of other HF clinics. Both studies15,16 were conducted many years ago and therefore the data used in the analyses might not reflect today’s costs and benefits. Between the 2 included economic evaluation studies,15,16 the study by Wijeysundera et al. (2010)16 was conducted in Canada and had better methodological quality; therefore, its findings may be more applicable to the Canadian context.
Conclusions and Implications for Decision- or Policy-Making
This report identified 1 SR,8 6 observational studies9-14 (1 prospective12 and 5 retrospective studies9-11,13,14), and 2 economic evaluation studies,15,16 assessing the clinical effectiveness and cost-effectiveness of multidisciplinary HF clinics compared with usual care.
Evidence from the SR8 of RCTs and from 3 observational studies (1 prospective12 and 2 retrospective studies9,13) showed that, in adult patients with a discharge diagnosis of HF, follow-up care in HF clinics was associated with a significant reduction in all-cause mortality compared with usual care. Evidence on hospitalization was mixed. The SR8 found that HF clinics were associated with a significant reduction in HF-related hospitalization but not in all-cause hospitalization. The 30-day hospital readmission rates in the HF clinic group were found to be significantly lower in 3 retrospective cohort studies9,11,13 but significantly higher in 1 retrospective cohort study10 as compared with usual care. Evidence from 1 prospective12 and 2 retrospective studies9,10 showed that patients followed up in HF clinics had better guideline-directed medical therapy management (i.e., significantly more patients received medications recommended by guidelines for the treatment of HF, significantly higher numbers of patients achieved target doses, and significantly more patients attained target doses faster), leading to a better improvement in ejection fraction9 compared to usual care. One retrospective cohort study10 found that primary care visits and emergency department visits were significantly higher in the HF clinic group than in the control group. The authors of this study10 suggested that patients in this specialized HF clinic might have better care and follow-up, leading to earlier referral to medical attention and hospitalization. As found in 1 retrospective cohort study,14 adherence to HF medications estimated (based on prescriptions filled) was significantly higher in patients in the HF clinic group compared to those in the usual care group.
Low-quality evidence from a cost-effectiveness analysis of an HF clinic in Denmark15 showed that the HF clinic was associated with a higher cost but no significant difference in mortality rates compared with the usual care. Moderate-quality evidence from a cost-effectiveness analysis of HF clinics in Ontario16 revealed that the HF clinic intervention was associated with a higher cost and a higher life expectancy compared to usual care, resulting in an ICER below a WTP threshold of $50,000; meaning that an HF clinic intervention may be cost-effective at that WTP threshold.
Overall, in adult patients with a discharge diagnosis of HF, follow-up in HF clinics was associated with a significant reduction in all-cause mortality, HF-related hospitalization, better guideline-directed medical therapy management, and higher adherence to HF medications. The findings for all-cause hospitalization were mixed. The multidisciplinary HF clinic appeared to be a cost-effective intervention, within the perspective of the Ontario Ministry of Health and Long-Term Care, at a WTP threshold of $50,000. The findings may be applicable to the Canadian context given that the limitations of the evidence should be taken into consideration. It is imperative to conduct an economic analysis with the incorporation of other outcome measurements, such QALYs gained in a cost-utility analysis, to better determine whether an HF clinic is cost-effective at extending life with quality.
References
1.Public Health Agency of Canada. Report from the Canadian Chronic Disease Surveillance System: heart disease in Canada, 2018. 2018; https://www.canada.ca/en/public-health/services/publications/diseases-conditions/report-heart-disease-Canada-2018.html. Accessed 2021 Aug 9.
2.The burden of heart failure. (2016 report on the health of Canadians). Ottawa (ON): Heart and Stroke Foundation; 2016: https://www.heartandstroke.ca/-/media/pdf-files/canada/2017-heart-month/heartandstroke-reportonhealth-2016.ashx?la=en#:~:text=%E2%80%9CThe%20biggest%20driver%20of%20costs,billion%20per%20year%20in%20Canada. Accessed 2021 Aug 9.
3.Horwitz L, Krumholz H. Systems-based strategies to reduce hospitalizations in patients with heart failure. In: Post TW, ed. Waltham (MA): UpToDate; 2021: http://www.uptodate.com. Accessed 2021 Aug 9.
4.Shea BJ, Reeves BC, Wells G, et al. AMSTAR 2: a critical appraisal tool for systematic reviews that include randomised or non-randomised studies of healthcare interventions, or both. BMJ. 2017;358:j4008. PubMed
5.Downs SH, Black N. The feasibility of creating a checklist for the assessment of the methodological quality both of randomised and non-randomised studies of health care interventions. J Epidemiol Community Health. 1998;52(6):377-384. PubMed
6.Higgins JPT, Green S, editors. Figure 15.5.a: Drummond checklist (Drummond 1996). Cochrane handbook for systematic reviews of interventions. London (GB): The Cochrane Collaboration; 2011: http://handbook-5-1.cochrane.org/chapter_15/figure_15_5_a_drummond_checklist_drummond_1996.htm. Accessed 2021 Aug 9.
7.Liberati A, Altman DG, Tetzlaff J, et al. The PRISMA statement for reporting systematic reviews and meta-analyses of studies that evaluate health care interventions: explanation and elaboration. J Clin Epidemiol. 2009;62(10):e1-e34. PubMed
8.Gandhi S, Mosleh W, Sharma UC, Demers C, Farkouh ME, Schwalm JD. Multidisciplinary heart failure clinics are associated with lower heart failure hospitalization and mortality: systematic review and meta-analysis. Can J Cardiol. 2017;33(10):1237-1244. PubMed
9.Joseph J, P SS, James J, Abraham S, Abdullakutty J. Guideline-directed medical therapy in heart failure patients: impact of focused care provided by a heart failure clinic in comparison to general cardiology out-patient department. Egypt Heart J. 2020;72(1):53. PubMed
10.Shani M, Ozan E, Duani Y, et al. Survival benefit in patients with heart failure treated in specialized heart failure center within the community. Isr Med Assoc J. 2020;22(1):8-12. PubMed
11.Taklalsingh N, Wengrofsky P, Levitt H. The heart failure clinic: improving 30-day all-cause hospital readmissions. J Healthc Qual. 2020;42(4):215-223. PubMed
12.Murninkas D, Itzhaki Ben Zadok O, Iakobishvili Z, et al. Comparison of 18-month outcomes of ambulatory patients with reduced (<=40%) left ventricular ejection fraction treated in a community-based, dedicated heart failure clinic versus treated elsewhere. Am J Cardiol. 2019;123(7):1101-1108. PubMed
13.Koser KD, Ball LS, Homa JK, Mehta V. An outpatient heart failure clinic reduces 30-day readmission and mortality rates for discharged patients: process and preliminary outcomes. J Nurs Res. 2018;26(6):393-398. PubMed
14.Lu L, Jackevicius CA, de Leon NK, Warner AL, Chang DS, Mody FV. Impact of a multidisciplinary heart failure postdischarge management clinic on medication adherence. Clin Ther. 2017;39(6):1200-1209. PubMed
15.Ravn J. Cost effectiveness analysis of a heart failure clinic [thesis]. Aalborg (DK): Aalborg University; 2014: https://projekter.aau.dk/projekter/files/198408300/14gr1011bed_mmelse2014.pdf. Accessed 2021 Aug 9.
16.Wijeysundera HC, Machado M, Wang X, et al. Cost-effectiveness of specialized multidisciplinary heart failure clinics in Ontario, Canada. Value Health. 2010;13(8):915-921. PubMed
Appendix 1: Selection of Included Studies
Appendix 2: Characteristics of Included Publications
Note that this appendix has not been copy-edited.
Table 2: Characteristics of Included Systematic Review
Study citation, country, funding source | Objectives, study designs and numbers of primary studies included | Population characteristics | Intervention and comparator(s) | Clinical outcomes, length of follow-up |
|---|---|---|---|---|
Gandhi et al. (2017)8 Canada, US Funding: NR | Objective: To assess the benefit on clinical outcomes of multidisciplinary HF clinics compared with usual care. Total: 16 RCTs in total; 10 RCTs relevant to the present review (N = 2,562) Quality assessment tool: Jadad scale (6 RCTs with high quality [score ≥ 3]; 4 RCTs with moderate quality [score 1 to 2]) | Patients with HF Mean age: 56 years to 76 years Male: 55% to 84% EF: range from 27% to 38% Comorbidities and baseline therapy were not balanced between groups. | Intervention: HF clinics (non-nurse-led [10 RCTs]) (N = 1,276) Comparator: Usual care (N = 1,286) Definitions of the intervention and comparator were provided for each included study. The intervention was multidisciplinary non-nurse-led HF clinics. Usual care was provided by either a cardiologist or a primary care physician. | Outcomes:
Follow-up:
|
EF = ejection fraction; HF = heart failure; NR = not reported; RCT = randomized controlled trial.
Table 3: Characteristics of Included Primary Clinical Studies
Study citation, country, funding source | Study design | Population characteristics | Intervention and comparator(s) | Clinical outcomes, length of follow-up |
|---|---|---|---|---|
Joseph et al. (2020)9 India Funding: No specific grant | Retrospective cohort study Sample size calculation provided: No Adjustment for confounders conducted: No | Adult patients with a discharge diagnosis of HF Age: 30 to 90 years Male: 80% in HF clinic and 73% in control EF: ≤ 35% No significant difference between groups for risk factors and comorbidities | Intervention: HF clinic (N = 200) Comparator: Cardiology outpatient department (N = 200) Definition of the intervention was not provided. | Outcomes:
Follow-up: 1st month, 6th month, and 12th month after the 1st hospital visit. |
Shani et al. (2020)10 Israel Funding: NR | Retrospective cohort study Sample size calculation provided: No Adjustment for confounders conducted: Yes (Multivariate Cox regression analysis) | Adult patients with a discharge diagnosis of HF Mean age: 75 years Male: 51% Low socioeconomic status: 78% in HF clinic vs. 43.3% in control; P < 0.001 EF: ≤ 40% No significant difference between groups for other characteristics | Intervention: HF clinic opened during 2013–2014 (N = 82) Comparator: Usual care during 2012, 2013, and 2014 (N = 348) Definitions of the intervention and comparator were not provided. | Outcomes:
Follow-up: Between 2013 and 2014 |
Taklalsingh et al. (2020)11 US Funding: NR | Retrospective cohort study Sample size calculation provided: No Adjustment for confounders conducted: No | Adult patients with a discharge diagnosis of HF Mean age: 65.8 years Male: 58.7% EF: 49.3% patients had EF ≤ 30% Certain characteristics were not balanced between groups (e.g., mean time to 30-day readmission, blood pressure, NYHA symptom Class 3 and 4, beta-blocker use, EF, aldosterone antagonist, and ejection fraction) | Intervention: HF clinic (N = 79) Comparator: Usual standard follow-up (N = 58) HF clinic consisted of nurse practitioners, physician assistants, residents, fellows, and 2 board-certified cardiologists. Usual standard follow-up was with an outpatient cardiologist or primary care physician. | Outcomes:
Follow-up: 9 months |
Murninkas et al. (2019)12 Israel Funding: NR | Prospective cohort study Sample size calculation provided: No Adjustment for confounders conducted: No | Adult patients with a discharge diagnosis of HF Mean age: 73 years Male: 27% in HF clinic vs. 19% in control; P = 0.034 NYHA Class 3 or 4: 33% in HF clinic vs. 56% in control; P < 0.001 Mean EF: 35% No significant difference between groups for other characteristics | Intervention: HF clinic (N = 304) Comparator: Usual care (N = 248) Definition of the intervention was not provided Usual care was provided by a general cardiology clinic or family physician | Outcomes:
Follow-up: 18 months |
Koser et al. (2018)13 US Funding: NR | Retrospective cohort study Sample size calculation provided: No Adjustment for confounders conducted: No | Adult patients with a discharge diagnosis of HF Mean age: 72.3 years Male: 55.2% Patients with EF ≤ 40%: 54.5% Mean EF: 26.4% | Intervention: HF clinic (N = 415) Comparator: The CMS data for the national average and surrounding area hospitals (N = NR) HF clinic consisted of 2 registered nurses as clinical care coordinators, and 2 providers (one physician and 1 nurse practitioner). Definition of the comparator was not provided. | Outcomes:
Follow-up: 2 years |
Lu et al. (2017)14 US Funding: NR | Retrospective cohort study Sample size calculation provided: No Adjustment for confounders conducted: Yes | Adult patients with a discharge diagnosis of HF Mean age: 70.5 years Male: 98% Mean EF: 38.5% Most baseline characteristics between groups were not significantly different, except fewer patients in the control group had comorbid chronic kidney disease, and more patients in the control group had unknown HF etiology | Intervention: HF clinic (N = 114) Comparator: Historical controls, who did not attend the HF clinic (N = 133) HF clinic consisted of a physician assistant, a clinical pharmacist, a nurse-case manager, and a cardiologist. | Outcomes:
Follow-up: 3 months |
CMS = Centers for Medicare & Medicaid Services; EF = ejection fraction; HF = heart failure; NR = not reported; NYHA = New York Heart Association.
Table 4: Characteristics of Included Economic Evaluations
Study citation country, funding source | Type of analysis, time horizon, perspective | Population characteristics | Intervention and comparator(s) | Approach | Source of clinical, cost, and utility data used in analysis | Main assumptions |
|---|---|---|---|---|---|---|
Ravn (2014)15 Denmark Funding: NR (Master Thesis) | Cost-effectiveness analysis Time horizon: 1 year Perspective: Not stated | Patients with a discharge diagnosis of HF from a hospital in Denmark No significant differences between groups in age, sex, and number of days hospitalized for the index admission | Intervention: Period after the HF clinic established (N = 83). HF clinic consisted of cardiologists, nurses, dieticians, physiotherapists, and psychologists. Comparator: Period before the HF clinic established (N = 118). Patients were followed up by general practitioners at the outpatient clinic. | ICER was calculated as the incremental cost per change in mortality rate based on the registry data drawn before and after the establishment of the HF clinic. Clinical outcome: All-cause mortality Costs: Costs directly connected to the HF clinic, and costs associated with the consumption of health care services (i.e., visiting the general practitioner, hospitalizations, and out-patient clinic visits). Overhead costs were not included. All costs were converted into 2014 Denmark krone currency using an inflation rate of 2.5%. | From the registry data No utility data, as quality of life was not measured. | No assumptions provided |
Wijeysundera et al. (2010)16 Canada Funding: Canadian Institute of Health Research | Cost-effectiveness analysis Time horizon: 12 years Perspective: Ontario Ministry of Health and Long-Term Care | Patients discharged after an index hospitalization for HF. HF clinic cohort (a hypothetical cohort based on the standard care cohort) Standard care cohort (all patients in the fiscal year 2005 discharged from hospitals with diagnosis of HF in Ontario; N = 16,443) | Intervention: HF clinics consisted of at least 1 physician and a nurse Comparator: Standard care provided by a single practitioner | ICER was calculated as the incremental cost per life-year gained. Clinical outcome: Life expectancy measured in years HF clinic costs: Costs associated with health practitioner visits and clinical staffing, laboratory and imaging tests, and operational and overhead Standard care costs: All-cause physician visits, hospitalizations, ED visits, and same day surgeries. Costs were adjusted to 2008 Canadian dollars. | The mortality rated from the EFFECT study were used to estimate the life expectancy of HF with standard care. The life expectancy of patients treated in HF clinics was obtained from a systematic review and meta-analysis. HF clinic costs were identified from a HF clinic at the UHN in Toronto, Ontario. The standard care costs were from administrative databases at the ICES. Medication costs were from OBD. No utility data, as quality of life was not measured. | Assumed medication costs to be similar between treatment strategies. All health outcomes and costs were discounted at 5% per year. |
ED = emergency department; EFFECT = Enhanced Feedback for Effective Cardiac Treatment; HF = heart failure; ICER = incremental cost-effectiveness ratio; ICES = Institute for Clinical Evaluation Sciences; OBD = Ontario Drug Database; UHN = University Health Network.
Appendix 3: Critical Appraisal of Included Publications
Note that this appendix has not been copy-edited.
Table 5: Strengths and Limitations of Systematic Reviews Using AMSTAR 24
Item | Gandhi et al. (2017)8 |
|---|---|
1. Did the research questions and inclusion criteria for the review include the components of PICO? | Yes |
2. Did the report of the review contain an explicit statement that the review methods were established prior to the conduct of the review and did the report justify any significant deviations from the protocol? | No |
3. Did the review authors explain their selection of the study designs for inclusion in the review? | Yes – RCTs |
4. Did the review authors use a comprehensive literature search strategy? | Yes – PubMed, Embase, and Cochrane databases |
5. Did the review authors perform study selection in duplicate? | NR |
6. Did the review authors perform data extraction in duplicate? | Yes |
7. Did the review authors provide a list of excluded studies and justify the exclusions? | No |
8. Did the review authors describe the included studies in adequate detail? | Yes |
9. Did the review authors use a satisfactory technique for assessing the risk of bias (RoB) in individual studies that were included in the review? | Yes – Jadad scale |
10. Did the review authors report on the sources of funding for the studies included in the review? | No |
11. If meta-analysis was performed did the review authors use appropriate methods for statistical combination of results? | Yes – RevMan 5.1 software |
12. If meta-analysis was performed, did the review authors assess the potential impact of RoB in individual studies on the results of the meta-analysis or other evidence synthesis? | No |
13. Did the review authors account for RoB in individual studies when interpreting/ discussing the results of the review? | No |
14. Did the review authors provide a satisfactory explanation for, and discussion of, any heterogeneity observed in the results of the review? | Yes |
15. If they performed quantitative synthesis did the review authors carry out an adequate investigation of publication bias (small study bias) and discuss its likely impact on the results of the review? | Yes – using funnel plots |
16. Did the review authors report any potential sources of conflict of interest, including any funding they received for conducting the review? | Reported conflict of interest, but not source of funding |
AMSTAR 2 = A MeaSurement Tool to Assess systematic Reviews 2; NR = not reported; PICO = Population, Intervention, Comparator, Outcomes; RCT = randomized controlled trial; RoB = risk of bias.
Table 6: Strengths and Limitations of Clinical Studies Using the Downs and Black Checklist5
Item | Joseph et al. (2020)9 | Shani et al. (2020)10 | Taklalsingh et al. (2020)11 | Murninkas et al. (2019)12 | Koser et al. (2018)13 | Lu et al. (2017)14 |
|---|---|---|---|---|---|---|
Reporting | ||||||
1. Is the hypothesis/aim/objective of the study clearly described? | Yes | Yes | Yes | Yes | Yes | Yes |
2. Are the main outcomes to be measured clearly described in the Introduction or Methods section? | Yes | Yes | Yes | Yes | Yes | Yes |
3. Are the characteristics of the patients included in the study clearly described? | Yes | Yes | Yes | Yes | No – Only characteristics of patients from the HF clinic were provided. | Yes |
4. Are the interventions of interest clearly described? | No – Definition for the HF clinic was not provided | Yes | Yes | No – Definition for the HF clinic was not provided | Yes | Yes |
5. Are the distributions of principal confounders in each group of subjects to be compared clearly described? | No | Yes | No | Yes | No | Yes |
6. Are the main findings of the study clearly described? | Yes | Yes | Yes | Yes | Yes | Yes |
7. Does the study provide estimates of the random variability in the data for the main outcomes? | No – SD or CI was not provided | Yes – 95% CI was provided | No – SD or CI was not provided | Yes – 95% CI was provided | Yes – SD was provided | Yes – SD was provided |
8. Have all important adverse events that may be a consequence of the intervention being reported? | No – AEs were not investigated | No – AEs were not investigated | No – AEs were not investigated | No – AEs were not investigated | No – AEs were not investigated | No – AEs were not investigated |
9. Have the characteristics of patients lost to follow-up been described? | NA – Retrospective study | NA – Retrospective study | NA – Retrospective study | NR | NA – Retrospective study | NA – Retrospective study |
10. Have actual probability values been reported (e.g., 0.035 rather than < 0.05) for the main outcomes except where the probability value is less than 0.001? | Yes | Yes | Yes | Yes | Yes | Yes |
External validity | ||||||
11. Were the subjects asked to participate in the study representative of the entire population from which they were recruited? | Unclear | Unclear | Unclear | Unclear | Unclear | Unclear |
12. Were the subjects who were prepared to participate representative of the entire population from which they were recruited? | Unclear | Unclear | Unclear | Unclear | Unclear | Unclear |
13. Were the staff, places, and facilities where the patients were treated, representative of the treatment the majority of the patients receive? | Yes | Yes | Yes | Yes | Yes | Yes |
Internal validity – bias | ||||||
14. Was an attempt made to blind study subjects to the intervention they have received? | NA – Retrospective cohort study | NA – Retrospective cohort study | NA – Retrospective cohort study | NA – Prospective cohort study | NA – Retrospective cohort study | NA – Retrospective cohort study |
15. Was an attempt made to blind those measuring the main outcomes of the intervention? | NR | NR | NR | NR | NR | NR |
16. If any of the results of the study were based on “data dredging,” was this made clear? | NA | NA | NA | NA | NA | NA |
17. In trials and cohort studies, so the analyses adjust for different lengths of follow-up of patients, or in case-control studies, is the time period between the intervention and outcome the same for cases and controls? | NA | NA | NA | NA | NA | NA |
18. Were the statistical tests used to assess the main outcomes appropriate? | Yes | Yes | Yes | Yes | Yes | Yes |
19. Was compliance with the intervention/s reliable? | NA | NA | NA | NA | NA | NA |
20. Were the main outcome measures used accurate (valid and reliable)? | Yes | Yes | Yes | Yes | Yes | Yes |
Internal validity – confounding (selection bias) | ||||||
21. Were the patients in different intervention groups (trials and cohort studies) or were the cases and controls (case-control studies) recruited from the same population? | No | No | No | No | No | No |
22. Were study subjects in different intervention groups (trial and cohort studies) or were the cases and controls (case-controls studies) recruited over the same period of time? | No | No | No | No | No | No |
23. Were study subjects randomized to intervention groups? | No – Retrospective cohort study | No – Retrospective cohort study | No – Retrospective cohort study | No – Prospective cohort study | No – Retrospective cohort study | No – Retrospective cohort study |
24. Was the randomized intervention assignment concealed from both patients and health care staff until recruitment was complete and irrevocable? | NA | NA | NA | NA | NA | NA |
25. Was the adequate adjustment for confounding in the analyses from which the main findings were drawn? | No – Confounders were not adjusted | Yes – Multivariate analysis | No – Confounders were not adjusted | No – Confounders were not adjusted | No – Confounders were not identified and adjusted | Yes – Multivariate analysis |
26. Were losses of patients to follow-up taken into account? | NA | NA | NA | NR | NA | NA |
27. Did the study have sufficient power to detect a clinically important effect where the probability value for a difference being due to chance is less than 5%? | NR | NR | NR | NR | NR | NR |
AEs = adverse event; CI = confidence interval; HF = heart failure; NA = not applicable; NR = not reported; SD = standard deviation.
Table 7: Strengths and Limitations of Economic Evaluations Using the Drummond Checklist6
Item | Ravn (2014)15 | Wijeysundera et al. (2010)16 |
|---|---|---|
Study design | ||
1. The research question is stated. | Yes – Evaluate the cost-effectiveness of the HF clinic at a hospital in Denmark | Yes – Assess the cost-effectiveness of specialized multidisciplinary HF clinics in Ontario |
2. The economic importance of the research question is stated. | Yes – A cost-effectiveness analysis was conducted to enable the hospital to optimize the resources. | Yes – It was unclear if the benefit of HF clinics is balanced against the costs of the intervention itself. |
3. The viewpoint(s) of the analysis are clearly stated and justified. | NR – From which perspective was not stated or justified. | Yes – From the Ontario Ministry of Health and Long-Term Care perspective |
4. The rationale for choosing alternative programmes or interventions compared is stated. | Yes – The HF clinic was more structured compared to usual follow-up by a general practitioner. | Yes – HF clinics may improve utilization and compliance with medications that prolong survival. |
5. The alternatives being compared are clearly described. | Yes | Yes |
6. The form of economic evaluation used is stated. | Yes – Cost-effectiveness analysis | Yes – Cost-effectiveness analysis |
7. The choice of form of economic evaluation is justified in relation to the questions addressed. | Yes – To express ICER as the incremental cost per change in mortality rate. | Yes – To express ICER as the incremental cost per life-year gained. |
Data collection | ||
8. The source(s) of effectiveness estimates used are stated. | Yes – Based on registry data from before and after the establishment of the HF clinic | Yes – Life expectancy of HF patients with standard care was obtained from a chart review study, while that of patients treated in HF clinics was estimated from a systematic review and meta-analysis. |
9. Details of the design and results of effectiveness study are given (if based on a single study). | Yes – From a registry study | Yes |
10. Details of the methods of synthesis or meta-analysis of estimates are given (if based on a synthesis of a number of effectiveness studies). | NA | Yes |
11. The primary outcome measure(s) for the economic evaluation are clearly stated. | Yes – ICER expressed as mean cost per mean effect | Yes – ICER expressed as the incremental cost per life-year gained. |
12. Methods to value benefits are stated. | No | Yes |
13. Details of the subjects from whom valuations were obtained were given. | No – Not provided | Yes – Described and referred to the studies |
14. Productivity changes (if included) are reported separately. | NR | NR |
15. The relevance of productivity changes to the study question is discussed. | NR | NR |
16. Quantities of resource use are reported separately from their unit costs. | Yes | Yes |
17. Methods for the estimation of quantities and unit costs are described. | Yes | Yes |
18. Currency and price data are recorded. | Yes | Yes |
19. Details of currency of price adjustments for inflation or currency conversion are given. | Yes – 2013 −2014 Denmark currency | Yes – Costs were adjusted to 2008 Canadian dollars |
20. Details of any model used are given. | No model used | No model used |
21. The choice of model used and the key parameters on which it is based are justified. | No model used | No model used |
Analysis and interpretation of results | ||
22. Time horizon of costs and benefits is stated. | Yes – 1-year | Yes – 12-year |
23. The discount rate(s) is stated. | NA | Yes – 5% per year for both costs and benefits |
24. The choice of discount rate(s) is justified. | NA | Yes – Based on CADTH guideline |
25. An explanation is given if costs and benefits are not discounted. | NA | NA |
26. Details of statistical tests and confidence intervals are given for stochastic data. | No – Not given | Yes |
27. The approach to sensitivity analysis is given. | Yes – 1-way sensitivity analysis | Yes – 1-way and probabilistic sensitivity analysis |
28. The choice of variables for sensitivity analysis is justified. | No – No justification given | Yes |
29. The ranges over which the variables are varied are justified. | No – No justification given | Yes |
30. Relevant alternatives are compared. | Yes | Yes |
31. Incremental analysis is reported. | Yes | Yes |
32. Major outcomes are presented in a disaggregated as well as aggregated form. | Yes | Yes |
33. The answer to the study question is given. | Yes | Yes |
34. Conclusions follow from the data reported. | Yes | Yes |
35. Conclusions are accompanied by the appropriate caveats. | Yes | Yes |
HF = heart failure; ICER = incremental cost-effectiveness ratio; NA = not applicable; NR = not reported.
Appendix 4: Main Study Findings
Note that this appendix has not been copy-edited.
Table 8: Summary of Findings by Outcomes ― Composite End Point of HF-Related Hospitalization and All-Cause Mortality
Study citation and study design | Study findings |
|---|---|
HF clinic vs. usual care | |
Ganghi et al. (2017)8 SR (10 RCTs) | OR (95% CI) = 0.52 (0.34 to 0.80); P = 0.003; I2 = 77% |
CI = confidence interval; HF = heart failure; OR = odds ratio; RCT = randomized controlled trial; SR = systematic review; vs. = versus.
Table 9: Summary of Findings by Outcomes ― Hospitalization
Study citation and study design | Study findings |
|---|---|
HF clinic vs. usual care | |
HF-related hospitalization | |
Ganghi et al. (2017)8 SR (7 RCTs) | OR (95% CI) = 0.58 (0.38 to 0.89); P = 0.01; I2 = 68% |
All-cause hospitalization | |
Ganghi et al. (2017)8 SR (5 RCTs) | OR (95% CI) = 1.06 (0.84 to 1.34); P = 0.61; I2 = 15% |
Joseph et al. (2020)9 Retrospective cohort study | Events: 65 vs. 189, with 200 patients in each group; P = 0.0001 |
Shani et al. (2020)10 Retrospective cohort study | Proportion of patients hospitalized:
Number of hospitalizations:
|
Taklalsingh et al. (2020)11 Retrospective cohort study | 30-day hospital readmission: 5.4% vs. 16.4% Event-free survival: Patients in the HF clinic group had a better event-free survival during the 9 months of follow-up compared to usual care (log rank P < 0.05). |
Koser et al. (2018)13 Retrospective cohort study | 30-day hospital readmission: 13.3% in the HF clinic group vs. 22% of the national average (P < 0.001) |
CI = confidence interval; HF = heart failure; OR = odds ratio; RCT = randomized controlled trial; SR = systematic review; vs. = versus.
Table 10: Summary of Findings by Outcomes ― Mortality
Study citation and study design | Study findings |
|---|---|
HF clinic vs. usual care | |
All-cause mortality | |
Ganghi et al. (2017)8 SR (10 RCTs) | OR (95% CI) = 0.64 (0.47 to 0.88); I2 = 27%; P = 0.006 |
Joseph et al. (2020)9 Retrospective cohort study | Mortality rates: 2% vs. 8%; P = 0.05 |
Murninkas et al. (2019)12 Prospective cohort study | Overall survival: Better in patients treated in the HF clinic group (log rank P = 0.0006) |
Koser et al. (2018)13 Retrospective cohort study | 30-day all-cause mortality rates: 1.2% in the HF clinic group vs. 11.6% of the national average (P < 0.001) |
CI = confidence interval; HF = heart failure; OR = odds ratio; RCT = randomized controlled trial; SR = systematic review; vs. = versus.
Table 11: Summary of Findings by Outcomes ― Guideline-directed Medical Therapy
Study citation and study design | Study findings |
|---|---|
HF clinic vs. usual care | |
Joseph et al. (2020)9 Retrospective cohort study |
|
Shani et al. (2020)10 Retrospective cohort study |
|
Murninkas et al. (2019)12 Prospective cohort study |
|
ACEI: angiotensin-converting enzyme inhibitor; ARB = angiotensin receptor blockers; ARNI = angiotensin receptor neprilysin inhibitor; BB = beta-blockers; HF = heart failure; MRA = mineralocorticoid receptor antagonist; vs. = versus.
Table 12: Summary of Findings by Outcomes ― Improvement in Ejection Fraction
Study citation and study design | Study findings |
|---|---|
1st month vs. 12th month | |
Joseph et al. (2020)9 Retrospective cohort study |
|
HF = heart failure; vs. = versus.
Table 13: Summary of Findings by Outcomes ― Medical Visits
Study citation and study design | Study findings |
|---|---|
HF clinic vs. usual care | |
Shani et al. (2020)10 Retrospective cohort study | Primary care visits:
Emergency department visits:
|
HF = heart failure; vs. = versus.
Table 14: Summary of Findings by Outcomes ― Medication Adherence
Study citation and study design | Study findings |
|---|---|
HF clinic vs. usual care | |
Lu et al. (2017)14 Retrospective cohort study | 90-day proportion of days covereda (i.e., ratio of total days’ supply of medication dispensed divided by total days prescribed):
Proportion of patients who were adherent at 90 days after discharge:a
|
AA = aldosterone antagonist; ACEI: angiotensin-converting enzyme inhibitor; BB = beta-blockers; ARB = angiotensin receptor blockers; HF = heart failure; vs. = versus.
aMultivariate-adjusted analysis, adjusted for age, comorbidities (dementia, depression), HF etiology, admission functional class, precipitating factors (diet noncompliance and medication noncompliance), and new-onset HF.
Table 15: Summary of Findings of Included Economic Evaluations
Main study findings | Authors’ conclusions |
|---|---|
Ravn (2014)15 | |
Cost-effectiveness analysis of a HF clinic in Denmark compared with a period before the establishment of the HF clinic Clinical outcome – All-cause mortality rates obtained from a registry study.
Costs – All costs are in 2014 DKK Cost of consumption of health care:
Cost of planning and day-to-day running:
Total cost:
Incremental cost: 18,289.95 ICER: 494,323 (i.e., It would cost an extra DKK 494,323 to prevent an extra death with the HF clinic compared to usual care) One-way sensitivity analyses – The variable that changed the ICER the most was change in mortality rate. | “It is not cost-effective to have the heart failure clinic at Hobro hospital. There is no statistical differences in deaths prevented, but an increase in costs.”15 (p. 9) |
Wijeysundera et al. (2010)16 | |
Cost-effectiveness analysis of HF clinics in Ontario compared with standard care Clinical outcome – Life expectancy measured in years (discounted by 5%)
Costs – In 2008 Canadian dollars (discounted by 5%)
ICER: $18,259 (i.e., It would cost an extra $18,259 for each additional life-year gained with a HF clinic compared to standard care) One-way sensitivity analyses – The results were robust across the range of plausible values. The results did not vary if medication and diagnostic test costs increased by 50%. Within the 95% confidence interval of the mortality benefit expressed as RR (0.56 to 0.91) associated with HF clinics compared to standard care, the HF clinic strategy remained cost-effective at a WTP threshold of $50,000. Probabilistic sensitivity analyses – Of 10,000 simulations, 99.4% were cost-effective at a WTP threshold of $50,000. | “In conclusion, in our cohort model examining the cost-effectiveness of multidisciplinary HF clinics for posthospitalized patients, we found that these clinics are a cost-effective intervention with substantial mortality benefits. Our results reinforce guideline recommendations that these complex patients be treated at such clinics.”16 (p. 921) |
DKK = Danish krone; HF = heart failure; ICER = incremental cost-effectiveness ratio; RR = relative risk; WTP = willingness-to-pay.
Appendix 5: References of Potential Interest
Economic Study on Costs, Only
Wijeysundera HC, Austin PC, Wang X, et al. The effect of multidisciplinary heart failure clinic characteristics on 1-year postdischarge health care costs: a population-based study. Med Care. 2014;52(3):272-279. PubMed
ISSN: 2563-6596
Disclaimer: The information in this document is intended to help Canadian health care decision-makers, health care professionals, health systems leaders, and policy-makers make well-informed decisions and thereby improve the quality of health care services. While patients and others may access this document, the document is made available for informational purposes only and no representations or warranties are made with respect to its fitness for any particular purpose. The information in this document should not be used as a substitute for professional medical advice or as a substitute for the application of clinical judgment in respect of the care of a particular patient or other professional judgment in any decision-making process. The Canadian Agency for Drugs and Technologies in Health (CADTH) does not endorse any information, drugs, therapies, treatments, products, processes, or services.
While care has been taken to ensure that the information prepared by CADTH in this document is accurate, complete, and up-to-date as at the applicable date the material was first published by CADTH, CADTH does not make any guarantees to that effect. CADTH does not guarantee and is not responsible for the quality, currency, propriety, accuracy, or reasonableness of any statements, information, or conclusions contained in any third-party materials used in preparing this document. The views and opinions of third parties published in this document do not necessarily state or reflect those of CADTH.
CADTH is not responsible for any errors, omissions, injury, loss, or damage arising from or relating to the use (or misuse) of any information, statements, or conclusions contained in or implied by the contents of this document or any of the source materials.
This document may contain links to third-party websites. CADTH does not have control over the content of such sites. Use of third-party sites is governed by the third-party website owners’ own terms and conditions set out for such sites. CADTH does not make any guarantee with respect to any information contained on such third-party sites and CADTH is not responsible for any injury, loss, or damage suffered as a result of using such third-party sites. CADTH has no responsibility for the collection, use, and disclosure of personal information by third-party sites.
Subject to the aforementioned limitations, the views expressed herein are those of CADTH and do not necessarily represent the views of Canada’s federal, provincial, or territorial governments or any third party supplier of information.
This document is prepared and intended for use in the context of the Canadian health care system. The use of this document outside of Canada is done so at the user’s own risk.
This disclaimer and any questions or matters of any nature arising from or relating to the content or use (or misuse) of this document will be governed by and interpreted in accordance with the laws of the Province of Ontario and the laws of Canada applicable therein, and all proceedings shall be subject to the exclusive jurisdiction of the courts of the Province of Ontario, Canada.
The copyright and other intellectual property rights in this document are owned by CADTH and its licensors. These rights are protected by the Canadian Copyright Act and other national and international laws and agreements. Users are permitted to make copies of this document for non-commercial purposes only, provided it is not modified when reproduced and appropriate credit is given to CADTH and its licensors.
About CADTH: CADTH is an independent, not-for-profit organization responsible for providing Canada’s health care decision-makers with objective evidence to help make informed decisions about the optimal use of drugs, medical devices, diagnostics, and procedures in our health care system.
Funding: CADTH receives funding from Canada’s federal, provincial, and territorial governments, with the exception of Quebec.
Questions or requests for information about this report can be directed to Requests@CADTH.ca