CADTH Reimbursement Review
Zanubrutinib (Brukinsa)
Sponsor: BeiGene Canada ULC
Therapeutic area: Waldenström macroglobulinemia
This multi-part report includes:
Clinical Review
Pharmacoeconomic Review
Clinical Review
Abbreviations
AE
adverse event
BIA
budget impact analysis
BTK
Bruton tyrosine kinase
BR
bendamustine-rituximab
CI
confidence interval
CORD
Canadian Organization for Rare Disorders
CR
complete response
CNS
central nervous system
CXCR4
chemokine receptor 4
DRC
dexamethasone-rituximab-cyclophosphamide
CyBorD
cyclophosphamide-bortezomib-dexamethasone
ECOG
Eastern Cooperative Oncology Group
EORTC QLQ-C30
European Organisation for Research and Treatment of Cancer Quality of Life Questionnaire Core 30
EQ-5D
EuroQol 5-Dimensions
EQ-5D-5L
EuroQol 5-Dimensions 5-Levels
EQ VAS
EuroQol Visual Analogue Scale
ESS
effective sample size
HR
hazard ratio
HRQoL
health-related quality of life
ICTRP
International Clinical Trials Registry Platform
IgM
immunoglobulin M
IPSSWM
International Prognostic Scoring System for Waldenström Macroglobulinemia
IRC
Independent Review Committee
IPD
individual patient data
ITC
indirect treatment comparison
ITT
intention to treat
IWWM
International Workshop on Waldenström’s Macroglobulinemia
KM
Kaplan-Meier
LC
Lymphoma Canada
LS
least squares
MAIC
matching-adjusted indirect comparison
MCL
mantle cell lymphoma
MGUS
monoclonal gammopathy of undetermined significance
MID
minimally important difference
MRR
major response rate
MYD88
myeloid differentiation factor 88
NICE DSU
National Institute for Health and Care Excellence Decision Support Unit
NMA
network meta-analysis
OS
overall survival
PD
progressive disease
pERC
CADTH pan-Canadian Oncology Drug Review Expert Review Committee
PH
proportional hazards
PR
partial response
PFS
progression-free survival
QoL
quality of life
R/R
relapsed/refractory
SAE
serious adverse event
SAP
statistical analysis plan
SD
standard deviation
SLR
systematic literature review
TEAE
treatment-emergent adverse event
VGPR
very good partial response
WM
Waldenström macroglobulinemia
WMFC
Waldenström Macroglobulinemia Foundation of Canada
Executive Summary
An overview of the submission details for the drug under review is provided in Table 1.
Item | Description |
|---|---|
Drug product | Zanubrutinib (Brukinsa), 80 mg oral capsules |
Indication | Treatment of adult patients with Waldenström macroglobulinemia (lymphoplasmacytic lymphoma) |
Reimbursement request | As per indication |
Health Canada approval status | NOC |
Health Canada review pathway | Priority review |
NOC date | March,1, 2021 |
Sponsor | BeiGene Canada GmbH |
NOC = Notice of Compliance.
Introduction
Waldenström macroglobulinemia (WM) is a rare, low-grade lymphoplasmacytic lymphoma characterized by the presence of clonal cells that secrete immunoglobulin M (IgM) in the bone marrow and other organs. Although described as indolent, WM can become a serious condition; features and symptoms include cytopenias, hyperviscosity, peripheral neuropathy, hemolytic anemia, hepatomegaly, splenomegaly, organomegaly, fatigue, weight loss, and recurrent fever and night sweats.1 More than 90% of patients with WM have an activating mutation in myeloid differentiation factor 88 (MYD88L265P), and approximately 30% have mutations in the chemokine receptor 4 (CXCR4) gene.2 In Canada, the incidence of WM is 1 in 200,000 people per year.3 Currently, the diagnosis of WM is based on clinicopathological criteria, including bone marrow involvement by lymphoplasmacytic lymphoma cells, a serum IgM monoclonal paraprotein, and the presence of MYD88L265P mutation.4 Once the diagnosis is established, the relationship between the patient’s symptoms and WM is confirmed, because therapy is generally reserved for symptomatic patients. Bone marrow involvement and serum levels of IgM, albumin, and beta2 microglobulin may be used to estimate the time until treatment initiation.4
Most patients presenting with symptomatic disease require treatment. The most important goals of therapy are to relieve lymphoma and paraprotein-related symptoms and delay disease progression by achieving prolonged remission. In patients who present with life-threatening complications related to hyperviscosity or cryoglobulinemia, plasmapheresis is used as a temporary measure until definitive treatment is initiated. The standard approach for first-line treatment in Canada is chemoimmunotherapy, most commonly bendamustine-rituximab (BR), followed by maintenance rituximab. Other regimens, including dexamethasone-rituximab-cyclophosphamide (DRC), bortezomib-rituximab, rituximab monotherapy, and chlorambucil monotherapy, are used for patients unable to tolerate BR. There is no standard of care for the treatment of relapsed/refractory (R/R) WM. Bortezomib-based chemotherapy is the most commonly used regimen (e.g., cyclophosphamide-bortezomib-dexamethasone [CyBorD]). Bruton tyrosine kinase (BTK) inhibitors (e.g., ibrutinib, acalabrutinib, zanubrutinib) are available only through compassionate access programs, and are currently most used in the R/R setting after failure of chemoimmunotherapy. However, none of these treatments is curative, and all patients are expected to relapse and require additional treatment.
Zanubrutinib (Brukinsa, 80 mg oral capsules) is a second-generation BTK inhibitor indicated for the treatment of adult patients with WM. It received a Notice of Compliance from Health Canada on March 1, 2021.3
The objective of this review was to evaluate the efficacy and safety of zanubrutinib 80 mg oral capsules for the treatment of adult patients with WM.
Stakeholder Perspectives
The information in this section is a summary of input provided by the patient groups who responded to CADTH’s call for patient input and from clinical experts consulted by CADTH for the purpose of this review.
Patient Input
Four patient groups provided input for the review of zanubrutinib in WM: the CanCertainty Coalition, Lymphoma Canada (LC) in collaboration with the Canadian Organization for Rare Disorders (CORD), and the WM Foundation of Canada (WMFC). The CanCertainty Coalition data were sourced through literature, Canadian prescription drug insurance coverage, population demographics, and previously conducted surveys. The CanCertainty data collection and submission were completed using CanCertainty resources and personnel and contract personnel exclusively. LC, CORD, and WMFC conducted anonymous online surveys of patients with WM between February 28, 2021 and May 10, 2021 registered through their respective databases and through social media outlets.
Symptoms of WM that most affected patients’ health-related quality of life (HRQoL) at diagnosis included fatigue (66%), night sweats (28%), neuropathy (24%), weight loss or loss of appetite (20%), and easy bruising or bleeding (20%). A total of 81% of respondents experienced at least 1 psychological and social impact of a WM diagnosis, including stress or anxiety (66%), difficulty sleeping (30%), impact on daily activities (28%), memory loss or concentration problems (19%), and depression (19%). In terms of treatment, 17% of patient respondents were receiving first-line treatment, 41% were in remission following a previous line of treatment, and 6% had relapsed following previous treatment and were waiting to begin another treatment. The most common treatments patients had received included chemotherapy monotherapy (55%), monoclonal antibodies (63%), and BTK inhibitors (36%). The most common side effects experienced by patients during treatment for WM included fatigue (72%), neutropenia (47%), nausea (39%), anemia (37%), peripheral neuropathy (37%), thrombocytopenia (30%), rash or itch (26%), back or joint pain (23%), mouth sores (22%), diarrhea (20%), headache (19%), and hair loss (17%). Patients noted that fatigue was particularly difficult to handle. Having a choice of treatment and enough treatment options were considered particularly important to patients. In terms of treatment outcomes, patients rated longer survival (75%), longer remission (76%), better HRQoL (70%), and fewer side effects (57%) as the most important.
Clinician Input
Input From Clinical Experts Consulted by CADTH
The clinical experts consulted by CADTH indicated that zanubrutinib would be used in the R/R setting after failure of standard chemoimmunotherapy because they expect it to be more efficacious (leading to more prolonged remission) and less toxic than a repeated round of chemoimmunotherapy. The clinical experts indicated that they would generally not consider zanubrutinib in the first-line treatment setting. All patients should be offered chemoimmunotherapy first, unless they are truly unfit for anything other than rituximab therapy or even oral chlorambucil. These patients have a defined treatment interval and can enjoy a prolonged remission after chemoimmunotherapy (with or without rituximab); as such, reserving zanubrutinib for later lines does not result in reduced survival. Zanubrutinib should be offered only to patients who have failed at least 1 line of therapy. The clinical experts consulted by CADTH also indicated that patients with asymptomatic disease should not be treated with zanubrutinib unless there is concern about impending hyperviscosity syndrome. Patients who are at very high risk for bleeding complications (e.g., those who cannot tolerate antiplatelet or anticoagulation equivalent) would be least suitable for treatment with zanubrutinib.
One clinical expert commented that WM is truly an orphan disease. Compared to other indolent lymphomas (e.g., follicular lymphoma), it affects a rare group of patients with unique clinical manifestations that do not respond as well to chemoimmunotherapy. There are few effective treatment options available at relapse and few or no new therapies available through clinical trials. Consequently, access to BTK inhibitors is imperative for this group of patients.
Clinician Group Input
Joint input was received from 2 registered clinicians on behalf of the Ontario Health (Cancer Care Ontario) Hematology Cancer Drug Advisory Committee for the review of zanubrutinib for the treatment of WM.
The clinicians stated that most patients demonstrate a good response to first-line BR and remain free of relapse for a few years. Contrary to the clinical experts consulted by CADTH, the clinician group advised that zanubrutinib may be used in the first-line setting or after relapse, given that there is currently no evidence to suggest the specific sequencing of treatment with zanubrutinib. However, patients with relapsed disease have a significant unmet need for additional treatment options, including BTK inhibitors. The clinicians indicated that the patients best suited to this treatment are those with symptomatic R/R WM.
Drug Program Input
The drug plans noted that in the ASPEN trial, zanubrutinib was compared to ibrutinib, which is not publicly funded in any jurisdiction in Canada. Ibrutinib, for the treatment of patients with WM who have received at least 1 prior therapy, was previously reviewed by CADTH and not recommended for reimbursement, Ibrutinib may be available for some patients (at no charge) through the sponsor’s patient support program. Relevant comparators for WM in Canadian jurisdictions include rituximab-based chemotherapy (BR, bortezomib-dexamethasone-rituximab, and DRC) for treatment-naive patients and those with R/R WM. Re-treatment with rituximab is funded for patients with a relapse-free interval (6 months to 12 months, depending on the jurisdiction) following the last dose of rituximab. In terms of prescribing considerations, the drug plans noted that zanubrutinib has the potential for drug-drug interactions, possibly increasing pharmacy resource use. However, in terms of care provision, the capsule strength of 80 mg (in bottles of 120 capsules) facilitates dispensing and dose adjustment without wastage. The drug plans had questions about patient eligibility criteria for treatment with zanubrutinib that were answered by the clinical experts consulted by CADTH.
Clinical Evidence
Pivotal Studies and Protocol Selected Studies
Description of Studies
The ASPEN trial is an ongoing, phase III, randomized, open-label, multi-centre study designed to compare the efficacy and safety of zanubrutinib and ibrutinib in patients with WM who required therapy. Between January 2017 and July 2018, 164 R/R and 37 unfit, treatment-naive patients with WM were recruited into cohort 1 (patients with MYD88 mutation) and randomized 1:1 to receive either ibrutinib (420 mg) or zanubrutinib (160 mg) in 28-day cycles. Cohort 2 was a non-randomized, no-comparator arm that included 28 patients with wild-type or unknown MYD88 mutation status, including 23 R/R and 5 unfit, treatment-naive patients, all of whom received zanubrutinib (160 mg). The primary efficacy end point was the proportion of patients in each arm of cohort 1 who achieved either complete response (CR) or very good partial response (VGPR), as determined by an Independent Review Committee (IRC) using an adaptation of the response criteria updated at the Sixth International Workshop on Waldenström’s Macroglobulinemia (IWWM).5,6 Other end points included duration of response (DoR), progression-free survival (PFS), improvement in cancer-related symptoms, overall survival (OS), HRQoL, and medical resource utilization.
The most common indications (> 20%) for therapy initiation in cohort 1 were fatigue (57.2%), anemia (43.8%), B symptoms (systemic symptoms of fever, night sweats, and weight loss [30.3%]), hyperviscosity (26.9%), and peripheral neuropathy (22.4%). The median age of all patients was 70.0 years. The majority of patients were male (66.7%) and White (91.0%). In cohort 2, the median age was 72 years; 50% of patients were male and 96.4% were White. The most common indications for therapy initiation were fatigue (60.7%), B symptoms (35.7%), anemia (32.1%), hyperviscosity (21.4%), and peripheral neuropathy (10.7%).
A summary of the key results from the ASPEN trial is available in Table 2.
Efficacy Results
Cohort 1 – MYD88 L265P
The median follow-up time was 19.4 months in cohort 1. Nine patients in the ibrutinib arm and 6 patients in the zanubrutinib arm started non-protocol anticancer therapy. The median times to initiation of non-protocol anticancer therapy were 6.44 months in the ibrutinib treatment arm and 6.83 months in the zanubrutinib treatment arm. The median PFS had not been reached in either treatment arm. The event-free rates at 12 months for patients in the ibrutinib and zanubrutinib treatment arms were 87.2% (95% confidence interval [CI], 78.6% to 92.5%) versus 89.7% (95% CI, 81.7% to 94.3%), respectively, and 83.8% (95% CI, 74.5% to 89.9%) versus 85.0% (95% CI, 75.2% to 91.2%) at 18 months. In cohort 1, the median OS was not reached in either treatment arm. At the data cut-off date (August 31, 2019), 8 deaths occurred in the ibrutinib arm, and 6 deaths occurred in the zanubrutinib arm. The event-free rates for patients in the ibrutinib versus zanubrutinib treatment arms were 93.9% (95% CI, 86.8%, 97.2%) versus 97.0% (95% CI, 90.9% to 99.0%) at 12 months.
In cohort 1, the IRC-assessed CR or VGPR rates in the ibrutinib and zanubrutinib arm were 19.2% (95% CI, 12.0% to 28.3%) and 28.4% (95% CI, 19.9% to 38.2%), respectively. In R/R patients, the IRC-assessed CR or VGPR rates were 19.8% (95% CI, 11.7% to 30.1%) in the ibrutinib arm and 28.9% (95% CI, 19.5% to 39.9%) in the zanubrutinib arm (P = 0.11). In unfit, treatment-naive patients, the IRC-assessed CR or VGPR rates were 16.7% (95% CI, 3.6% to 41.4%) in the ibrutinib arm and 26.3% (95% CI, 9.1% to 51.2%) in the zanubrutinib arm. On average, in cohort 1, HRQoL (an exploratory end point) increased numerically during the trial observation period in both treatment arms. The least squares (LS) means for the European Organisation for Research and Treatment of Cancer Quality of Life Questionnaire Core 30 (EORTC QLQ-C30) global health status/quality of life (QoL) were 69.0 (standard error = 2.3) in the ibrutinib arm and 68.3 (standard error = 2.2) in the zanubrutinib arm, a difference of –0.69 (95% CI, –4.95 to 3.57). The mean changes in EuroQol 5-Dimensions (EQ-5D) scores from baseline were 9.0 (standard deviation [SD] = 17.90) in the ibrutinib arm and 13.7 (SD = 14.66) in the zanubrutinib arm at cycle 13, day 1.
Cohort 2 – MYD88WT
The median follow-up time was 17.8 months in cohort 2. Three patients (1 unfit, treatment-native patient and 2 R/R patients) started non-protocol anticancer therapy with a median time to initiation of 3.61 months. In cohort 2, no patients achieved CR. The IRC-assessed CR or VGPR rate was 26.9% (95% CI, 11.6% to 47.8%).
Harms Results
In cohort 1, 97 ibrutinib-treated patients (99.0%) and 98 zanubrutinib-treated patients (97.0%) had at least 1 adverse event (AE); AEs of grade 3 or greater were reported in 62 patients (63.3%) and 59 patients (58.4%) in the ibrutinib and zanubrutinib treatment arms, respectively. Serious AEs (SAEs) were reported in 40 patients (40.8%) and 40 patients (39.6%) in the ibrutinib and zanubrutinib treatment arms, respectively. The most common SAE in the ibrutinib treatment arm was pneumonia (9 patients [9.2%]), followed by pyrexia and sepsis (3 patients [3.1%] each). The most common SAEs in the zanubrutinib treatment arm were febrile neutropenia, influenza, and neutropenia (3 patients [3.0%] each). Nine patients (9.2%) in the ibrutinib arm and 4 patients (4.0%) in the zanubrutinib treatment arm had AEs leading to study treatment discontinuation. A total of 7 patients (7.1%) in the ibrutinib treatment arm and 6 patients (5.9%) in the zanubrutinib treatment arm had died by the time of the data cut-off date; 5 patients (5.1%) in the ibrutinib arm and 1 patient (1.0%) in the zanubrutinib arm died within 30 days of the last dose of study drug.
Notable AEs included neutropenia, hemorrhage (minor and major bleeding), cardiovascular events, and second primary malignancy. In cohort 1, neutropenia was reported in 12 patients (12.2%) in the ibrutinib and 25 patients (24.8%) in the zanubrutinib arm. However, the higher incidence of neutropenia among zanubrutinib-treated patients did not translate to an increased occurrence of infections in the zanubrutinib arm. Fifty-eight patients (59.2%) in the ibrutinib arm and 49 patients (48.5%) in the zanubrutinib arm had hemorrhage (including minor bleeds involving mucous membranes and skin). Major hemorrhage was observed in 9 patients (9.2%) in the ibrutinib arm and 6 patients (5.9%) in the zanubrutinib arm. Atrial fibrillation or flutter was reported in 14 patients (14.3%) in the ibrutinib arm and 2 patients (2.0%) in the zanubrutinib treatment arm. Second primary malignancy was reported in 11 patients (11.2%) in the ibrutinib arm and 12 patients (11.9%) in the zanubrutinib arm.
Table 2: Summary of Key Results From the ASPEN Trial
Outcome | Cohort 1 (MYD88L265P) | Cohort 2 (MYD88WT) | |
|---|---|---|---|
Ibrutinib | Zanubrutinib | Zanubrutinib | |
Efficacy (ITT) analysis set, N | 99 | 102 | 26 |
PFS | |||
Median (months) | Not reached | Not reached | 27.5 (13.7 to 27.5) |
Event-free rate at, % (95% CI) | |||
12 months | 87.2 (78.6 to 92.5) | 89.7 (81.7 to 94.3) | 72.4 (50.6 to 85.8) |
18 months | 83.8 (74.5 to 89.9) | 85.0 (75.2 to 91.2) | 68.1 (46.2 to 82.6) |
CR or VGPR, | |||
n (%) | 19 (19.2) | 29 (28.4) | 7 (26.9) |
OS | |||
Median (95% CI), months | Not reached | Not reached | 16.5 (15.7 to 18.7) |
Harms, n (%) | |||
At least 1 AE or TEAE | 97 (99.0) | 98 (97.0) | 24 (85.7) |
Grade 3 or higher | 62 (63.3) | 59 (58.4) | 18 (64.3) |
SAE | 40 (40.8) | 40 (39.6) | 11 (39.3) |
Leading to death | 4 (4.1) | 1 (1.0) | 0 |
Notable harms, n (%) | |||
Safety analysis set, N | 98 | 101 | 28a |
Neutropenia | 12 (12.2) | 25 (24.8) | 4 (14.3) |
Hemorrhage | 58 (59.2) | 49 (48.5) | 11 (39.3) |
Atrial fibrillation | 14 (14.3) | 2 (2.0) | 1 (3.6) |
Second primary malignancy | 11 (11.2) | 12 (11.9) | 4 (14.3) |
AE = adverse event, CR = complete response; ITT = intention to treat; PFS = progression-free survival; SAE = serious adverse event; OS = overall survival; TEAE = treatment-emergent adverse event; VGPR = very good partial response.
aTwenty-eight patients were enrolled in cohort 2; 2 patients had unknown MYD88 status. The efficacy analyses excluded these 2 patients. The safety analyses included them.
Source: Clinical Study Report for Brukinsa.7
Critical Appraisal
The ASPEN trial was an open-label study. Therefore, important sources of bias from lack of blinding of patients and investigators to study treatments exist; patients’ knowledge of their treatment may have affected some safety end points; and different supportive care may have been offered to patients in the 2 treatment arms. The primary end point and key secondary end points were appropriate and adequately described. Data were immature for time-to-event outcomes, and median PFS and OS were not reached in either treatment arm. Given that the ASPEN trial is ongoing, future analyses may be more informative with respect to time-to-event outcomes. In addition to PFS and OS, time to next treatment was identified in the systematic review protocol as an important efficacy outcome; however, this was an exploratory outcome that limits the interpretation of results. Some other important outcomes, including OS and HRQoL, were also exploratory in the trial. Of note, the only outcome defined in the statistical testing hierarchy, CR or VGPR rate in the R/R patient population of cohort 1, did not reach statistical significance.
Ibrutinib is not the most relevant comparator for zanubrutinib in Canadian clinical practice. The most relevant comparators for WM in Canadian jurisdictions include rituximab-based chemotherapy for treatment-naive patients and those with relapsed disease. Therefore, relevance to the current clinical setting is limited, and the question of the comparative efficacy and safety of zanubrutinib to current standard of care in Canada cannot be answered. The inclusion criteria for the ASPEN study were generally reasonable, based on the intended patient population. However, the exclusion of patients with central nervous system (CNS) involvement in the ASPEN trial — while justified when the trial was designed, due to a lack of disease management guidelines — was not considered appropriate because these patients (i.e., patients with Bing Neel disease) may benefit from early BTK inhibitor treatment. The trial considered patients to be treatment-naive if they were unsuitable for chemoimmunotherapy due to age or the presence of comorbidities. This definition does not align with the standard definition of treatment-naive in oncology practice, which refers to patients who have not received prior anticancer therapy. Therefore, the trial evidence regarding the efficacy and safety of zanubrutinib compared to ibrutinib in truly treatment-naive patients is insufficient to guide treatment decisions in this patient population in clinical practice.
Indirect Comparisons
Description of Studies
The sponsor-submitted indirect treatment comparison (ITC), which was used to inform the pharmacoeconomic model, was appraised and summarized. A matching-adjusted indirect comparison (MAIC) was conducted based on a systematic literature review that compared the individual patient-level data (IPD) of the zanubrutinib arm of the ASPEN trial to match the populations of relevant trial reports for chemotherapy regimens in adult patients with treatment-naive or relapsed-refractory WM. The analysis was informed by a systematic literature review that identified 33 trials, mainly retrospective, that were subsequently excluded from the ITC. In total, 3 trials were included in the MAIC; 1 which included R/R WM patients, 1 that included treatment-naïve WM patients, and 1 that included a mixed R/R, and treatment-naive WM population. The interventions included zanubrutinib, BR, and DRC; however, DRC was used in the treatment-naive population, and BR was used in the R/R population. Three sets of pairwise MAICs were conducted. Two pairwise comparisons matched the overall zanubrutinib population (N = 102) to the BR (N = 71) and DRC (N = 72) populations separately. A subgroup analysis was conducted matching zanubrutinib patients with R/R disease to the BR population. No MAIC was conducted specifically to compare the unfit, treatment-naive subpopulation in ASPEN, given the small sample size of the unfit, treatment-naive patient population in the zanubrutinib arm of the ASPEN trial (n = 19). Several of the preidentified variables, including Eastern Cooperative Oncology Group Performance Status (ECOG PS), beta2 microglobulin concentration, and MYD88/CXCR4 mutation status, were not accounted for during weighting due to the limitations of available data. In the MAIC comparing zanubrutinib to BR, the variables included in the weighting process included age, prior lines of therapy, IgM concentration, International Prognostic Scoring System for Waldenström Macroglobulinemia (IPSSWM) score, and presence of extramedullary disease. In the MAIC comparing zanubrutinib to DRC, the variables included in the weighting were age, platelet count, hemoglobin count, and presence of extramedullary disease.
Efficacy Results
After weighting, the results of the MAIC comparing zanubrutinib to BR suggest that zanubrutinib is favoured over BR, including in the R/R subgroup for PFS and OS; however, the results lacked precision, showing wide 95% CIs. Zanubrutinib was associated with significantly longer PFS (hazard ratio [HR] = 0.37; 95% CI, 0.15 to 0.91) after weighting compared to BR. Compared to DRC, zanubrutinib was associated with significantly longer PFS (HR = 0.35; 95% CI, 0.14 to 0.86) after weighting. The HR for OS comparing zanubrutinib to BR indicated a statistically significantly longer OS in the overall population after weighting (HR = 0.29; 95% CI, 0.10 to 0.85]). ||||||||||||||||||||||||||||||||||||||||||||||||||||||||||||||||||||||||||||||||||||||||||||||||||||||||||||||||||||||||||||||||||||||||||||||||||||| |||||||||||||||||||||||||||||||||||||||||||||||||||||||||||||||||||||||||||||||||||||||||||||||||||||||||||||||||||||||||||||||||||||||||||||||||||||||||||||||||||||||| ||||||||||||||||||||||||||||||||||||||||||||||||||||||||||||||||||||||||||||||||||||||||||||.
Harms Results
No indirect evidence was available for the safety or impact on HRQoL of zanubrutinib compared to relevant chemotherapy regimens.
Critical Appraisal
The ITC was informed by an appropriately conducted systematic review of the literature highlighting the relevant population and outcomes of interest for this review. Screening was conducted based on standard methods, with studies selected independently in duplicate, according to pre-specific criteria. No formal quality assessment of the included studies was conducted, which is an important limitation. The sponsor-submitted MAIC assumes that all effect modifiers and prognostic factors are accounted for in the model. A comprehensive list of prognostic factors and treatment-effect modifiers identified through appropriate channels was included in the report and — based on discussions with the clinical experts consulted by CADTH — these factors and modifiers were considered relevant; however, some of the factors, including ECOG PS, B2 microglobulin, and MYD88/CXCR4 mutation status, were not accounted for in the calculation of weight. This may result in bias because not all prognostic factors and effect modifiers that were originally identified were accounted for in the weights. Additionally, there were discrepancies between the cut-offs of identified variables and those available for weighting, potentially biasing the results further. In terms of external validity, the studies selected for indirect comparison included treatment with DRC in the treatment-naive population and with BR in the R/R population. In discussion with the clinical experts consulted by CADTH, the comparison to DRC in the treatment-naive, first-line population was considered irrelevant because it does not reflect clinical practice in Canada. No studies were identified in the systematic literature review (SLR) reporting results for BR in the treatment-naive population, which is the standard of care in Canada; thus, these were not included in the analysis for treatment-naive patients. Moreover, no studies were included in the treatment-naive population for patients for whom chemoimmunotherapy was considered unsuitable.
Conclusions
Based on clinical evidence from the ASPEN trial, the relative efficacy of zanubrutinib for the treatment of unfit, treatment-naive patients with R/R WM did not surpass that of the comparator, ibrutinib, another BTK inhibitor for the outcome of CR or VGPR in patients with R/R WM. The safety profiles of zanubrutinib and ibrutinib were similar in terms of occurrence of overall AEs and SAEs. Notable differences in toxicity between the 2 treatments included a higher incidence of atrial fibrillation in the ibrutinib arm and a higher incidence of neutropenia in the zanubrutinib arm. Ibrutinib is not publicly funded in Canada; it is currently only available for patients with WM through compassionate access programs. Given the lack of head-to-head studies evaluating zanubrutinib versus the most relevant comparators in Canada — and the important methodological limitations of the sponsor-submitted ITC — no conclusions could be drawn regarding the efficacy and safety of zanubrutinib compared with currently used chemoimmunotherapy regimens in patients with WM who are treatment-naive or R/R.
Based on input from clinicians consulted by CADTH, zanubrutinib is not expected to replace current standard of care first-line chemoimmunotherapy treatment regimens. The clinical experts indicated that all patients with WM will likely relapse after front-line chemoimmunotherapy. The results of re-treatment with chemoimmunotherapy for R/R disease are less optimal when compared to other indolent lymphomas; therefore, there is an unmet need for additional treatment options that prolong remission in patients with R/R WM. Given that patients become immunosuppressed with initial therapy, additional treatment options that minimize toxicity are desirable during relapse. The clinicians indicated that, based on clinical experience with BTK inhibitors, zanubrutinib may be more tolerable than the chemoimmunotherapy treatments currently used to treat patients with R/R WM.
Introduction
Disease Background
WM is a rare, low-grade, lymphoplasmacytic lymphoma characterized by the presence of IgM-secreting clonal cells in the bone marrow and other organs. Many patients who fulfill the criteria for a diagnosis are asymptomatic. Almost all patients diagnosed with WM have a preceding phase of IgM monoclonal gammopathy of undetermined significance (MGUS), but the clonal MGUS B-cells already contain the molecular signature of a malignant clone.8 Phenotypically, the lymphoplasmacytic cells of WM typically arise from CD25+, CD22low, activated B lymphocytes, and express pan B-cell markers, CD19 and CD20.8 Although described as indolent, WM can become a serious, life-threatening disease, causing significant morbidity in the elderly. Morbidity and mortality in WM are associated with excess serum IgM rather than tumour infiltration, contrary to other lymphomas. The clinical manifestations of WM related to the overproduction of IgM include cytopenias, hyperviscosity, peripheral neuropathy, hemolytic anemia, hepatomegaly, splenomegaly, and organomegaly. Accompanying symptoms include fatigue, weight loss, recurrent fever, and night sweats.1 Approximately 1 in 4 patients with WM have a family history of lymphoproliferative disorders, with first-degree relatives having a 20-fold higher risk of developing WM compared to the general population.2,9 More than 90% of patients with WM have an activating mutation in the MYD88 gene (MYD88L265P). Mutations in the CXCR4 gene are also common; these are observed in approximately 30% of cases.2 Both of these mutations have prognostic significance and may be associated with clinical outcomes and response to targeted therapies.1
The overall age-adjusted incidence of WM is 3.8 per million persons per year, with incidence increasing with age. The incidence of WM is twice as high in men as it is in women (5.4 million versus 2.7 per million, respectively). In Canada, the incidence of WM is 1 in 200,000 people per year.3 The 5- and 10- year PFS for IgM MGUS to WM is 90% and 81%, respectively.8 Median OS has been improving; from 1991 to 2000 and 2001 to 2010, median OS in patients diagnosed with WM in the US improved to 8 years from 6 years, respectively.10 Because patients with WM have an indolent disease course and are often of an advanced age, some patients ultimately succumb to other diseases of the elderly not related to WM; up to 40% of patients over 75 years of age with WM do not die of WM.11 However, compared to the general population, patients with WM have a greater overall risk of second malignancies, including large cell lymphoma, myelodysplasia, and brain cancer.8,12
Currently, the diagnosis of WM is based on clinicopathological criteria, including bone marrow involvement by lymphoplasmacytic lymphoma cells, a serum IgM monoclonal paraprotein, and the presence of MYD88L265P mutation.4 Once the diagnosis is established, it is important to investigate the relationship between the patient’s symptoms and WM, because therapy should be reserved for symptomatic patients. Bone marrow involvement and serum levels of IgM, albumin, and beta2 microglobulin may be used to estimate the time until treatment initiation.4
Standards of Therapy
The treatment of a patient with WM should be highly personalized and consider their clinical presentation, comorbidities, and genomic profile, as well as the toxicity of the treatment regimens used to tailor treatment approaches.4 A number of treatment options for first and subsequent lines of therapy are identified in international guidelines; however, real-world treatment practices vary significantly, in part due to treatment availability. Common treatment options for patients with WM across all lines of therapy include alkylating drugs (bendamustine, cyclophosphamide), proteasome inhibitors (bortezomib, carfilzomib, ixazomib), anti-CD20 monoclonal antibodies (rituximab, ofatumumab), and BTK inhibitors (ibrutinib, zanubrutinib).4
Based on input from clinical experts consulted by CADTH for the purpose of this review, in Canada, therapeutic approaches for WM are based on watchful waiting or active surveillance for the approximately 25% of patients who are asymptomatic. Most patients presenting with symptomatic disease require treatment. In patients who present with life-threatening complications related to hyperviscosity or cryoglobulinemia, plasmapheresis is used as a temporary measure until definitive treatment is initiated. The standard approach for first-line treatment in Canada is chemoimmunotherapy, given that the vast majority of patients are good candidates for this treatment. The most commonly used chemoimmunotherapy regimen is BR, which is followed by maintenance rituximab. This regimen is associated with remissions that last longer than 5 years. For those unable to tolerate BR, other regimens have been used (DRC, bortezomib-rituximab, rituximab monotherapy, and chlorambucil monotherapy).
There is no standard of care for the treatment of R/R WM. Bortezomib-based chemotherapy is the most commonly used therapy (e.g., rituximab-CyBorD). Few patients are eligible for high-dose chemotherapy and autologous stem cell transplant, and even fewer are eligible for allogeneic hematopoietic stem cell transplant. If a patient has not had BR and has had a long remission (i.e., time to next treatment of more than 6 years to 7 years), then BR can be considered as second-line treatment. Currently, there is no publicly funded BTK inhibitor for this indication in Canada. Ibrutinib was reviewed by CADTH in September 2016 and was not recommended for reimbursement. In Canada, BTK inhibitors (e.g., ibrutinib, acalabrutinib, zanubrutinib) are available only through compassionate access programs, and are currently the most frequently used drugs in the R/R setting after failure of chemoimmunotherapy. BTK inhibitors are currently available through these programs, but access is temporary. BTK inhibitors are included in some provincial practice guidelines, such as Alberta’s, along with other non-funded options, including lenalidomide and everolimus.
None of the current treatments available for WM in any line of therapy can modify the underlying disease mechanism, and none is considered curative. All patients are expected to relapse and require additional treatment. The 2 most important goals of therapy are to relieve lymphoma- and paraprotein-related symptoms and to delay disease progression by achieving prolonged remission. Although WM is an indolent disease, it is associated with many potential symptoms (e.g., fatigue, aches, hyperviscosity) when it is active. The complications of paraproteinemia cause significant morbidity and can be life- and limb-threatening in some cases; severe hyperviscosity is an oncologic emergency. Because the patient population is generally older and “less fit,” treatments should be efficacious while minimizing toxicity. Improvement in HRQoL is always desired. With current therapies, patient QoL is good while patients are in remission, so most patients are willing to accept short-term symptoms (i.e., from chemotherapy) to achieve durable remission. In addition to delaying disease progression and controlling symptoms with minimal toxicity, the ideal treatment would minimize the hypogammaglobulinemia that is common with recurrent infections in patients with WM. More effective therapies that induce long-lasting remission would likely result in prolongation of OS; however, studies of WM rarely use OS as a primary end point.
Drug
Zanubrutinib (Brukinsa) is a small molecule inhibitor of BTK that, like other BTK inhibitors, forms an irreversible covalent bond at Cys481 within the adenosine triphosphate binding pocket of the BTK protein, preventing the proliferation and survival of malignant and normal B-cells. Zanubrutinib is a second-generation BTK inhibitor, designed to be more selective; it has more favourable pharmacokinetic and pharmacodynamic properties than the approved first-in-class BTK inhibitor, ibrutinib. Zanubrutinib has been shown to be more selective than ibrutinib for the inhibition of BTK in kinase inhibition and cell-based assays. Based on in vitro and in vivo studies, it was hypothesized that zanubrutinib would provide a deeper clinical response than ibrutinib as measured by response rate in patients with WM.
Zanubrutinib is indicated for the treatment of adult patients with WM. In the US, Brukinsa was granted an accelerated approval by the US FDA on November 14, 2019 for the treatment of adult patients with mantle cell lymphoma (MCL) who have received at least 1 prior therapy.13 In Canada, zanubrutinib was issued a Notice of Compliance by Health Canada on March 1, 2021.3 The indication is for the treatment of adult patients with WM.14 The sponsor has requested reimbursement criteria that align with the approved Health Canada indication.
Brukinsa is supplied in 80 mg oral capsules (size 0 hard gelatin capsules with a white to off-white opaque body and cap, marked in black ink with “ZANU 80”). The recommended total daily oral dose of zanubrutinib is 320 mg, which may be taken as either 320 mg (four 80 mg capsules) once daily or 160 mg (two 80 mg capsules) twice daily (12 hours apart). Per the Health Canada product monograph for zanubrutinib, treatment should continue until disease progression or unacceptable toxicity. Dose interruptions and reductions are recommended for non-hematological toxicities of grade 3 or higher, grade 3 febrile neutropenia, grade 3 thrombocytopenia with significant bleeding, and grade 4 neutropenia lasting more than 10 consecutive days. Discontinuation is recommended for grade 4 thrombocytopenia lasting more than 10 days.14
Stakeholder Perspectives
Patient Group Input
This section was prepared by CADTH staff based on the input provided by patient groups.
About the Patient Groups and Information Gathered
Four patient groups provided input for the review of zanubrutinib in WM: The CanCertainty Coalition and LC in collaboration with CORD and the WMFC. The CanCertainty Coalition is the united voice of more than 30 Canadian patient groups, cancer health charities, and caregiver organizations from across the country, joining together with oncologists and cancer care professionals to significantly improve the affordability and accessibility of cancer treatment. LC is a national Canadian registered charity that empowers the lymphoma community through education, support, advocacy, and research, collaborating with patients, caregivers, health care professionals, and other organizations and stakeholders to promote early detection, learn about the causes of lymphoma, find new and better treatments for lymphoma patients, help patients access those treatments, and work together to find a cure. CORD and WMFC are Canadian patient organizations with similar missions focused on their communities.
The data collected by the CanCertainty Coalition to inform this submission were sourced from literature, Canadian prescription drug insurance coverage, population demographics, and previously conducted surveys. The CanCertainty data collection and submission were completed using CanCertainty resources and personnel and contract personnel exclusively.
LC, CORD, and WMFC conducted an anonymous online survey of patients with WM between February 28, 2021 and May 10, 2021. The organizations reached patients through their respective databases and social media outlets (including Twitter, Instagram, and Facebook) and sent the survey to physicians to share with patients. The survey contained a combination of multiple choice, rating, and open‐ended questions. A total of 281 patients responded, of whom 109 had experience with a BTK inhibitor (87 with ibrutinib, 22 with zanubrutinib); 172 did not have this experience. Among all respondents, 47% lived in Canada, 56% were female, and 74% were 60 years of age or older.
Disease Experience
WM is considered a rare disease, which can make it a challenge to diagnose. Although 60% of patients in the survey received their diagnosis within 3 months of initial symptom presentation, 21% had to wait 6 months to 12 months, and 19% waited more than 1 year to receive a confirmed diagnosis. Symptoms of WM that most affected patients’ QoL at diagnosis included fatigue (66%), night sweats (28%), neuropathy (24%), weight loss or loss of appetite (20%), and easy bruising or bleeding (20%). A total of 81% of respondents experienced at least 1 psychological or social impact of a WM diagnosis, including stress and anxiety (66%), difficulty sleeping (30%), impact on daily activities (28%), memory loss or concentration problems (19%), and depression (19%). Similar symptom profiles and psychological or social impacts were observed between diagnosis and patients’ current status, which indicates that WM has consistent detrimental impacts on patients. Patients were asked to rate on a scale of 1 to 5 how WM had negatively affected various aspects of their lives (where 1 = no impact and 5 = significant negative impact). Patients indicated work, school, volunteering (3.62), and travel (3.04) as having been the most negatively affected.
Experience with Treatment
In the survey conducted by LC, CORD, and WMFC, 13% of patient respondents were still in the watch-and-wait phase following diagnosis and did not require treatment, and 40% of patients were currently receiving treatment. Of patients receiving treatment, 17% were receiving first-line treatment, 41% were in remission following a previous line of treatment, and 6% had relapsed following previous treatment and were waiting to begin re-treatment. The most common treatments included chemotherapy monotherapy (55%), monoclonal antibodies (63%), and BTK inhibitors (36%). In the later lines of therapy, BTK inhibitors were the top treatment choice.
The most common side effects of treatment for WM experienced by the surveyed patients included fatigue (72%), neutropenia (47%), nausea (39%), anemia (37%), peripheral neuropathy (37%), thrombocytopenia (30%), rash or itch (26%), back or joint pain (23%), mouth sores (22%), diarrhea (20%), headache (19%), and hair loss (17%). It was noted that many to all of these side effects were difficult to handle, particularly treatment-related fatigue. One patient said, “Anemia and fatigue continue to be the most challenging; recurring infection or susceptibility to infection is also a constant worry.”
Although not common, 20 patients confirmed side effects including infections or fever (30%), infusion-related reactions (20%), neutropenia (15%), cardiac complications (10%), and pneumonitis (10%), among others, as being the most difficult to tolerate because these resulted in hospitalization for management. It was noted that none of these side effects or hospitalizations was the result of BTK inhibitors. The side effects that patients experienced for longer than 2 years, or that appeared more than 2 years after treatment, included fatigue (36%), peripheral neuropathy (27%), and “chemo-brain” (21%). There were no long-term side effects reported by respondents related to BTK inhibitors.
When asked about the impact of various aspects of treatment (not including BTK inhibitors) on daily living, patients noted significant negative impacts due to treatment-related fatigue (30%), treatment side effects (27%), and infusion-related reactions or inability to tolerate treatment (19%). Patients said that previous treatments and side effects had further negatively affected their work, school, or volunteering activities (25%), daily activities (22%), and travel (27%). In contrast, patients indicated that BTK inhibitors did not negatively affect their mental health, work, school, or volunteer activities, relationships with family, friends, or intimate partners, ability to continue with daily activities, or personal image. In fact, BTK inhibitors actually had a positive impact in each of these categories.
The majority of patients in the LC survey were able to access treatment locally (78%); some of those who could not attributed this inability to living in a community without a cancer centre (9%) or to their treatment not being available at their local cancer centre (4%). As a result of not being able to access treatment locally, patients worried about their prognosis or survival (16%), required long and exhaustive trips to access treatment (13%), and experienced impacts to their daily activities (13%). Access to treatments such as oral BTK inhibitors (which do not involve travelling to a hospital or centre for administration) can limit the negative impacts related to treatment. CanCertainty noted that reimbursement of oral cancer drugs differs across Canadian provinces and territories: British Columbia, Alberta, Saskatchewan, Manitoba, Quebec, Northwest Territories, Yukon, and Nunavut reimburse oral cancer drugs for all in need, while Ontario and the Atlantic provinces do not. As a result, patients who do not have adequate insurance may have to pay out-of-pocket for medication and/or apply to funding assistance programs, which can take time and delay access to treatment. Financial impacts were also noted to be important to patients with WM. They cited the cost of medications (67%), parking (26%), and travel (21%). One patient said:
“During the treatment, I spent several hours 2 days a week getting therapy and then a couple of days to recover significantly which affected my available time for other things. When the protocol changed allowing my treatment to be given as an injection instead of IV, it cut down on the time which helped.”
As previously mentioned, 109 patients had experience with a BTK inhibitor, of whom 22 had experience with zanubrutinib accessed through a clinical trial (50%), private insurance (27%), or compassionate access program (3%). The most common side effects included easy bruising or bleeding (55%), diarrhea (18%), neutropenia (18%), rash or itch (8%), muscle or joint pain (18%), and muscle spasms (18%), with the most difficult to tolerate being diarrhea, bruising, and rash or itch. The majority of patients said zanubrutinib did not affect their work, school, travel, mental health, personal image, intimate or family relationships, or friendships, but did tend to positively affect their ability to continue with daily activities. When asked to describe their experience with zanubrutinib, 95% of patients said they had a good to excellent experience with the therapy; the remaining patients reported having a satisfactory experience, and said they would take this treatment option again if available and recommended by their doctor and would also recommend it to other patients. In comparison to patients who received other treatments, those who received zanubrutinib noted fewer side effects (64%), had a better and faster response rate (41%), and said it did not affect their QoL to the same extent as past treatments (36%).
One patient commented: “I am grateful for the opportunity to participate in a clinical trial for a drug that is less toxic than ibrutinib and that gives me such a deep response.” Another said, “It amazes me that people choose infusion therapy over the ease of zanubrutinib.” A third said, ““I like that it is an oral drug and that it has not produced any noticeable side effects.”
There were 6 patients in the LC survey who had been treated with both zanubrutinib and ibrutinib. According to the results, patients treated with both of these BTK inhibitors preferred their experience with zanubrutinib, citing less impactful side effects. Moreover, based on the summary results of the ibrutinib and zanubrutinib trials shared with the respondents, 45% of patients said they would use zanubrutinib over other BTK inhibitors, while 12% would use zanubrutinib after treatment with another BTK inhibitor has failed; 43% of patients were unsure. Reasons for choosing zanubrutinib over other BTK inhibitors included fewer side effects (63%) and a slightly better response rate (34%). A total of 62% of patients indicated they would also choose zanubrutinib if it was recommended by their doctor.
Improved Outcomes
Patients responding to the survey considered having a choice of treatment and enough treatment options to be important. To access new treatments for their WM, 67% of patients reported that they would be interested in participating in a clinical trial. In terms of treatment outcomes, patients rated longer survival (75%), longer remission (76%), better QoL (70%), and fewer side effects (57%) as the most important.
Patients stated that they would be likely to accept known, non–life-threatening risks or side effects for a new treatment. Very few patients would be willing to tolerate severe or long-term side effects. On a scale of 1 to 5, patients rated headache or cognitive changes (56%), changes in vision (58%), shortness of breath (46%), abdominal discomfort (nausea, vomiting, diarrhea, or constipation) (42%), and fatigue (42%) as the most important symptoms for new WM treatments to control.
Patient expectations for new treatment options included a “targeted oral treatment that will not cause secondary cancers or more discomfort than the disease itself” and would “provide [an] increase in quality of life and longevity with minimal side effects.”
Clinician Input
Input From Clinical Experts Consulted by CADTH
All CADTH review teams include at least 1 clinical specialist with expertise regarding the diagnosis and management of the condition for which the drug is indicated. Clinical experts are a critical part of the review team and are involved in all phases of the review process (e.g., providing guidance on the development of the review protocol; assisting in the critical appraisal of clinical evidence; interpreting the clinical relevance of the results; and providing guidance on the potential place in therapy). The following input was provided by 3 clinical specialists with expertise in the diagnosis and management of WM.
Unmet Needs
The clinical experts consulted by CADTH noted that patients with WM become resistant to current available treatment options and that all patients will eventually relapse after chemoimmunotherapy. After failing chemoimmunotherapy, results from re-treatment with chemoimmunotherapy are disappointing — particularly for patients who are refractory or early progressors — because re-treatment subjects patients to the toxicities of treatment without the hope of prolonged benefit. Moreover, remissions tend to be shorter with each subsequent round of chemoimmunotherapy. Many patients progress quickly after second-line treatment, and re-treatment with chemoimmunotherapy is generally of limited use. Given that patients often become immunosuppressed with initial therapy treatments, treatment options that minimize toxicity during relapse are very important. The only clear unmet need currently is for R/R patients. One clinical expert explained that before the availability of BTK inhibitors, patients would be offered complete palliation after failure of 2 lines of therapy because the toxicities of therapy outweighed the potential benefit. BTK inhibitors have consistently shown benefit in the relapsed setting for other lymphoproliferative disorders, namely MCL and chronic lymphocytic leukemia, particularly when used earlier in the course of disease. The clinical experts consulted by CADTH indicated that the same impact on efficacy has been demonstrated for WM, and that as such, BTK inhibitors have become a preferred treatment option (available through compassionate access programs) for relapsed WM because these drugs are generally well tolerated in the older, less fit and unfit population. In the experience of the clinical experts, these therapies have been life-changing and life-sustaining for patients with WM who have no other effective alternatives.
Place in Therapy
The clinical experts consulted by CADTH indicated that zanubrutinib would be used in the R/R setting after failure of standard chemoimmunotherapy. In the opinion of the clinical experts, zanubrutinib is expected to be more efficacious (i.e., associated with prolonged remission) and less toxic than a repeated round of chemotherapy. The clinical experts noted that this is particularly true for patients who fail chemotherapy early (i.e., while on rituximab maintenance or < 3 years after standard chemotherapy without maintenance rituximab). The clinical experts indicated that, based on the available evidence, they would generally not consider zanubrutinib in the first-line treatment setting because it does not provide sufficient benefit relative to standard chemoimmunotherapy to justify the added cost and low-level toxicity and inconvenience of indefinite first-line therapy.
All patients should be offered chemoimmunotherapy as first-line treatment unless they are considered truly unfit for anything other than rituximab therapy or even oral chlorambucil. These patients have a defined treatment interval and can enjoy a prolonged remission after chemoimmunotherapy (with or without rituximab); reserving zanubrutinib in later lines does not appear to result in reduced survival (based on experience with other BTK inhibitors in different disease settings). Therefore, there is no downside to postponing treatment with zanubrutinib to the relapsed setting. Patients should fail at least 1 line of therapy before being offered zanubrutinib, and the clinical experts noted that intolerance to treatment would be an insufficient reason for patients to not receive standard first-line treatment. For example, if a patient is unable to tolerate BR, other chemoimmunotherapy-based regimens should be attempted in its place (e.g., DRC or CyBorD). Even frail, elderly patients can trial dose-reduced BR or DRC. In the opinion of the clinical experts, zanubrutinib does offer an oral therapy with low toxicity that elderly patients may value, but that there are insufficient data to support its use in the treatment-naive population. The pivotal trial of zanubrutinib included only a small number of treatment-naive patients and did not define this population robustly. One of the clinical experts was of the view that zanubrutinib could be used in patients who had previously been treated with ibrutinib, but were intolerant, and that it should not be reserved for patients with contraindications to other therapies. The clinical experts consulted by CADTH indicated that if zanubrutinib was approved and funded, they would expect more patients to receive it as a second- or later-line therapy. One of the clinical experts stated that they would favour first-line chemoimmunotherapy and BTK inhibitors in second and later lines unless BTK inhibitors for indefinite use (i.e., continued until progression) were priced very reasonably.
Patient Population
Zanubrutinib may be offered to patients with R/R WM, particularly those with MYD88 mutations, who require treatment after chemoimmunotherapy and to those who obtained a poor response to chemoimmunotherapy or had chemoimmunotherapy more than once. There is no standard of care for these patients, and repeated rounds of chemotherapy carry toxicity while offering a low likelihood of prolonged benefit. The clinical experts noted that there are no specific disease characteristics that make patients more or less suitable for treatment with zanubrutinib. The drug is expected to be more effective in earlier lines of treatment; as such, it would be considered routinely in second-line therapy or beyond. Treatment is indicated in the R/R setting for patients with symptomatic disease only (i.e., a period of observation at relapse can and should be done because a return of paraproteinemia by itself is not an indication for treatment). When patients develop symptomatic disease, then second-line treatment should be offered.
In terms of how patients best suited for treatment with zanubrutinib can be identified, the clinical experts noted that WM is not challenging to diagnose, but determining whether a patient’s symptoms or findings are caused by WM requires expertise. For example, patients are often sent for reassessment or re-treatment, and may be determined to have alternative diagnoses, such as a second malignancy or progressive anemia from iron deficiency. Diagnosis of WM is both a clinical and pathological 1. Molecular techniques to confirm MYD88 mutational status can help distinguish WM from other lymphoproliferative disorders, particularly marginal zone lymphoma. While MYD88 testing is not performed routinely, it can be done if there is diagnostic uncertainty between marginal zone lymphoma and lymphoplasmacytic lymphoma. One of the clinical experts stated that MYD88 mutation should be confirmed before embarking on BTK inhibitor treatment; however, testing may not be available in all provinces. Although MYD88 mutation may be found in other hematologic B-cell malignancies, certain clinical features — such as the presence of paraproteinemia (which is essential) and the absence of other classic lymphoma features (e.g., lymphadenopathy) — can help to confirm the diagnosis of WM.
The clinical experts consulted by CADTH also indicated that patients with asymptomatic disease should not be treated with zanubrutinib unless there is concern about impending hyperviscosity syndrome. Patients who are at very high risk for bleeding complications (e.g., those who require antiplatelet or anticoagulation equivalent) would also be least suitable for treatment with zanubrutinib. Patients who have previously progressed on a BTK inhibitor should not be eligible for zanubrutinib, whereas patients who are intolerant of ibrutinib could be considered. One of the clinical experts noted that the ASPEN trial excluded patients with CNS involvement, but Bing Neel syndrome is, in fact, a situation where BTK inhibitors, including zanubrutinib, may be particularly valuable due to CNS penetration; thus, CNS involvement should not be used as a reason not to offer zanubrutinib. Ibrutinib is a well-established therapy for Bing Neel syndrome.
Assessing Response to Treatment
Regarding how and when patients eligible to receive zanubrutinib should be assessed to determine if they are benefiting from the treatment, the clinical experts consulted by CADTH indicated that there are currently no data on non-responders or how to identify them for zanubrutinib or any of the BTK inhibitors. Response to treatment is measured by assessing disease status after the initiation of therapy, and response is assessed as either CR, partial response (PR), stable disease, or progressive disease (PD), as in clinical trials. If a patient has stable disease or PD, the current treatment is discontinued, and another treatment is initiated. A PR would be acceptable and is generally the norm for patients with WM on any currently available treatment. Patients are then monitored until progression; time to next treatment would be the next time point. However, response rates are not sufficient; a more substantial measure, such as PFS, is required as a minimum for clinicians to adopt a new treatment in practice. Time to next treatment is also important because if the first-line treatment delays the initiation of a second treatment, this is particularly useful information. In indolent lymphoma (in which patients can receive multiple therapies and live for many years, similarly to patients with myeloma), it is difficult to assess OS; as such, OS is less often considered for WM or studies of other indolent lymphomas.
The clinical experts considered that a clinically meaningful response to treatment would include: hematological response (e.g., resolution of cytopenias, splenomegaly), reduction in or elimination of paraprotein, resolution of lymphoma-related symptoms (e.g., neuropathy with WM), and prolonged DoR — the longer the better, given that therapies are limited for this disease in regard to the magnitude of response (ideally a CR, but a PR would be the expected result, and many patients can enjoy prolonged PFS even with a PR).
Response to treatment is generally assessed every 3 months to 6 months, or more frequently when a therapy is newly initiated (i.e., every cycle). This would also apply to patients on zanubrutinib, in whom disease status is often assessed after the initial 3 months to 6 months and every 3 months thereafter.
Discontinuing Treatment
The parameters described by the clinical experts that could be used to identify patients who are no longer responding to or benefiting from the treatment include: clinically symptomatic disease progression, new lymphadenopathy or splenomegaly, progressive anemia from marrow infiltration, or progressive IgM increase (not just minimal change in monoclonal protein); and severe toxicity (particularly grade 3 or higher) that cannot be managed through dose reduction.
Prescribing Conditions
The clinical experts consulted by CADTH considered any setting, including community or academic, to be appropriate for providing treatment with zanubrutinib, provided the prescribing clinicians understand how to prescribe and monitor the therapy. However, zanubrutinib would generally be expected to be provided in an outpatient clinic by a hematologist or oncologist.
Additional Considerations
One of the clinical experts commented that WM is truly an orphan disease, affecting a rare group of patients with unique clinical manifestations who do not respond as well to chemoimmunotherapy as patients with other indolent lymphomas (e.g., follicular lymphoma). There are few treatment options at relapse, and those available are generally ineffective. As well, there are few or no new therapies available through clinical trials. Consequently, access to BTK inhibitors is imperative for this group of patients.
Clinician Group Input
This section was prepared by CADTH staff based on the input provided by patient groups.
Clinician input was received from 2 registered clinicians on behalf of the Ontario Health (Cancer Care Ontario) Hematology Cancer Drug Advisory Committee for the review of zanubrutinib for the treatment of WM. The Ontario Health-Cancer Care Ontario Drug Advisory Committees provide evidence-based clinical and health system guidance on drug-related issues, including those related to the provincial drug reimbursement programs and the Systemic Treatment Program.
Current Treatments
Treatments for first-line therapy for WM include BR and ibrutinib-rituximab (accessible through private pay). Treatments for patients who have relapsed include re-treatment with BR or treatment with ibrutinib-rituximab, other rituximab chemotherapy combinations, or palliative chlorambucil.
Unmet Needs
The clinicians stated that current treatments are not curative, and patients often become refractory. Additionally, some patients are unable to tolerate ibrutinib due to its toxicity profile. The goals of treatment for patients with WM are to delay the progression of disease, prolong survival, prevent end-organ effects related to hyperviscosity, and improve overall HRQoL. Most patients demonstrate a good response to first-line BR and remain free of relapse for a few years. It is patients with relapsed disease who have a significant unmet need for a drug like zanubrutinib.
Place in Therapy
The clinicians advised that zanubrutinib may be used in the first-line setting or after relapse. There is currently no evidence to suggest the specific sequencing of treatment with zanubrutinib, given that the ASPEN study enrolled newly diagnosed patients as well as patients who had been previously treated. There is also no evidence to suggest whether zanubrutinib should be prescribed to patients who fail or are intolerant to ibrutinib.
Patient Population
The patients best suited to this treatment are those with symptomatic R/R WM. These patients are identified as per the routine clinical diagnosis for WM. The clinicians explained that the patients least suited for zanubrutinib are those with prior BTK inhibitor exposure, given that they were excluded from the ASPEN study. It is not possible for the clinicians to identify the patients most likely to exhibit a response to zanubrutinib because the ASPEN study did not identify specific subgroups of patients likely to benefit the most.
Assessing Response to Treatment
Outcomes that can indicate whether a patient is responding to treatment include response rates based on blood count, IgM level, and routine imaging, as per clinical practice. The prevention of end-organ effects and, at minimum, a PR to treatment would be considered clinically meaningful responses to zanubrutinib. Response to treatment should be assessed approximately every 1 month to 3 months, as per clinical practice.
Discontinuing Treatment
Progression of disease, lack of clinically meaningful responses, and the occurrence of treatment-related toxicities are good indicators to help decide if treatment with zanubrutinib should be discontinued.
Prescribing Conditions
The clinicians explained that zanubrutinib would be prescribed in community settings because it is an oral drug that can be taken at home.
Drug Program Input
The drug programs provide input on each drug being reviewed through CADTH’s reimbursement review processes by identifying issues that may affect their ability to implement a recommendation. The drug plans noted that in the ASPEN trial, zanubrutinib was compared to ibrutinib, which is not publicly funded in any jurisdiction in Canada. Ibrutinib, for the treatment of patients with WM who have received at least 1 prior therapy, was previously reviewed by CADTH and not recommended for reimbursement. Ibrutinib may be available for some patients (at no charge) through the sponsor’s patient support program. Relevant comparators for WM in Canadian jurisdictions include rituximab-based chemotherapy (BR, bortezomib-dexamethasone-rituximab, and DRC) for treatment-naive patients and those with R/R WM. Re-treatment with rituximab is funded for patients with a relapse-free interval (6 months to 12 months, depending on jurisdiction) following the last dose of rituximab. In terms of prescribing considerations, the drug plans noted that zanubrutinib has the potential for drug-drug interactions, possibly increasing pharmacy resource use. However, in terms of care provision, the capsule strength of 80 mg (in bottles of 120) facilitates dispensing and dose adjustment without wastage. Some system and economic issues were noted by the drug plans. The submitted budge impact analysis (BIA) includes ibrutinib, which is not publicly funded in Canada for WM, potentially affecting the BIA results. However, a revised BIA was submitted by the sponsor that no longer included any market share or costs for ibrutinib. The drug plans also noted that a confidential negotiated price exists for biosimilar rituximab (pan-Canadian Pharmaceutical Alliance) and subcutaneous rituximab; and bendamustine and bortezomib are available in a generic format.
The implementation questions and corresponding responses from the clinical experts consulted by CADTH are summarized in Table 3.
Table 3: Summary of Drug Plan Input and Clinical Expert Response
Drug program implementation questions | Clinical expert responses |
|---|---|
Jurisdictional implementation issues | |
Relevant comparators | |
How does zanubrutinib compare to rituximab-based chemotherapy regimens for treatment-naive patients as well as those with R/R disease? | Rituximab-based regimens are commonly used in first-line settings, whereas zanubrutinib would be considered only in second- or later-line treatment of patients with R/R WM. There are no clinical trial data comparing rituximab-based regimens with zanubrutinib for R/R WM. |
Policy considerations for reimbursing the drug | |
Considerations for initiation of therapy | |
In the ASPEN trial, participants with no prior therapy had to have been considered unsuitable candidates for treatment with standard chemoimmunotherapy due to comorbidities and risk factors. Should zanubrutinib for treatment-naive patients with WM be limited to those with a contraindication to, or who are unsuitable for, chemoimmunotherapy? If so, what determines or defines “unsuitability” for standard chemoimmunotherapy? | There are no criteria used in clinical practice to define “unsuitability” for standard chemoimmunotherapy; the decision is made by the treating physician. However, the clinical experts indicated that very elderly or frail patients who may not be able to tolerate standard treatment and may be considered unsuitable for first-line standard chemoimmunotherapy would likely also be unsuitable for most other regimens. For the majority of patients, there are multiple first-line treatment options. Age alone is generally not a factor to regard patients as unfit for chemoimmunotherapy. However, the clinical experts noted that there are some elderly and frail patients for whom first-line chemoimmunotherapy (e.g., BR) may be too toxic. In these patients, dose-reduced DRC is another treatment option, but BTK inhibitors that have lower toxicity and an easier route of administration compared to chemotherapy regimens would present good alternatives. Other patients who may be considered unfit for chemoimmunotherapy are those with impaired mobility and cognition and those with multiple comorbidities, particularly those at high risk of developing neutropenia (the main concern with BR); in these patients, the risk of harm outweighs potential benefit from treatment. The ASPEN trial did not include enough patients from all patient groups to guide clinicians. The trial’s definition of treatment-naive does not align with how treatment-naive is usually defined in oncology (i.e., having no prior treatment for the disease). Because the trial did not include newly diagnosed patients who had never received prior anticancer treatment (not only those deemed unsuitable for chemoimmunotherapy for various reasons), the evidence for the efficacy of zanubrutinib in the treatment-naive patient population (as defined in oncology practice) is insufficient. |
Patients with prior BTK inhibitor exposure were excluded from ASPEN. Should patients who have progressed on prior BTK inhibitors be eligible for zanubrutinib? | There is no evidence from clinical trials to suggest that patients who progress on prior BTK inhibitors would benefit from treatment with a different BTK inhibitor. The clinical experts indicated that if a patient did not respond to ibrutinib, they should be ineligible for another covalent BTK inhibitor. Treatment with another BTK inhibitor should only be considered in cases of intolerance. |
Patients with evidence of disease transformation and patients with active CNS lymphoma were excluded from ASPEN. Should these patients be eligible for treatment with zanubrutinib? | CNS lymphoma should not be an exclusion factor. While BTK inhibitors are not used in disease transformation, patients with active CNS lymphoma from WM (Bing Neel syndrome) would, in fact, benefit from early treatment with zanubrutinib. This is similar to how ibrutinib is used in these patients. |
Considerations for prescribing the therapy | |
Per the product monograph, zanubrutinib is dosed at 320 mg PO daily or 160 mg PO b.i.d. until disease progression or unacceptable toxicity. Is there a preferred dosing schedule that should be used for zanubrutinib? | The clinical experts commented that a once-per-day regimen is preferable. |
Special implementation issues | |
Generalizability | |
Should patients receiving alternate treatment, who have not progressed, be switched to zanubrutinib if they otherwise meet the criteria? If so, what is the appropriate time frame for switching? | If current treatment is effective and well tolerated, no switching is required. |
Under what clinical circumstances would zanubrutinib be used over currently available treatments (e.g., BR, rituximab chemotherapy, privately funded ibrutinib)? | Zanubrutinib would be considered primarily in the R/R setting. |
Zanubrutinib may change place in therapy for currently available treatment options. If first-line zanubrutinib is recommended for treatment-naive patients who are unsuitable for chemoimmunotherapy, would bendamustine-rituximab and/or rituximab chemotherapy be available in second-line therapy and subsequent lines of therapy? | If rituximab-based chemotherapy is considered unsuitable as first-line treatment, it would not be suitable in second and later lines of therapy. |
b.i.d. = twice daily; BTK = Bruton tyrosine kinase; BR = bendamustine-rituximab; CNS = central nervous system; DRC = dexamethasone-rituximab, cyclophosphamide; PO = orally; R/R = relapsed/refractory; WM = Waldenström macroglobulinemia.
Clinical Evidence
The clinical evidence included in the review of zanubrutinib is presented in 2 sections. The first section, the Systematic Review, includes pivotal studies provided in the sponsor’s submission to CADTH and Health Canada, as well as those studies that were selected according to an a priori protocol. The second section includes indirect evidence from the sponsor and indirect evidence selected from the literature that met the selection criteria specified in the review.
Systematic Review (Pivotal and Protocol Selected Studies)
Objectives
To perform a systematic review of the beneficial and harmful effects of zanubrutinib 80 mg oral capsules for the treatment of adult patients with WM.
Methods
Studies selected for inclusion in the systematic review included pivotal studies provided in the sponsor’s submission to CADTH and Health Canada, as well as those meeting the selection criteria presented in Table 4. Outcomes included in the CADTH review protocol reflect outcomes considered to be important to patients, clinicians, and drug plans.
Table 4: Inclusion Criteria for the Systematic Review
Criteria | Description |
|---|---|
Population | Adult patients (≥ 18 years of age) with WM Subgroups of interest:
|
Intervention | Zanubrutinib, 80 mg oral capsules |
Comparator | Bendamustine-rituximab Rituximab-cyclophosphamide-dexamethasone Rituximab-cyclophosphamide-prednisone Cyclophosphamide-bortezomib-dexamethasone Chlorambucil-rituximab Bortezomib-rituximab Bortezomib-dexamethasone Ibrutiniba |
Outcomes | Efficacy outcomes:
Patient-reported outcomes:
Health care resource utilization:
Harms outcomes:
|
Outcomes (continued) | Notable harms:
|
Study designs | Published and unpublished phase III and IV RCTs |
AE = adverse event; CR = complete response; DoR = duration of response; HRQoL = health-related quality of life; IgM = immunoglobulin M; OS = overall survival; PFS = progression-free survival; PR = partial response; RCT = randomized controlled trial; SAE = serious adverse event; TEAE = treatment-emergent adverse event; VGPR = very good partial response; WDAE = withdrawal due to adverse event; WM = Waldenström macroglobulinemia.
aIn Canada, ibrutinib for treatment of patients with WM is available only under sponsor’s special access program.
The literature search was performed by an information specialist using a peer-reviewed search strategy according to the PRESS Peer Review of Electronic Search Strategies checklist.15
Published literature was identified by searching the following bibliographic databases: MEDLINE All (1946‒) through Ovid and Embase (1974‒) through Ovid. All Ovid searches were run simultaneously as a multi-file search. Duplicates were removed using Ovid deduplication for multi-file searches, followed by manual deduplication in Endnote. The search strategy comprised both controlled vocabulary, such as the National Library of Medicine’s MeSH (Medical Subject Headings), and keywords. The main search concept was Brukinsa (zanubrutinib). Clinical trials registries were searched: the US National Institutes of Health’s clinicaltrials.gov, WHO’s International Clinical Trials Registry Platform (ICTRP) search portal, Health Canada’s Clinical Trials Database, and the European Union Clinical Trials Register.
No filters were applied to limit the retrieval by study type. Retrieval was not limited by publication date or by language. Conference abstracts were excluded from the search results. See Appendix 1 for the detailed search strategies.
The initial search was completed on June 21, 2021. Regular alerts updated the search until the meeting of the pERC on October 13, 2021.
Grey literature (literature that is not commercially published) was identified by searching relevant websites from the CADTH Grey Matters: A Practical Tool for Searching Health-Related Grey Literature checklist. Included in this search were the websites of regulatory agencies (US FDA and European Medicines Agency). Google was used to search for additional internet-based materials. See Appendix 1 for more information on the grey literature search strategy.
Two CADTH clinical reviewers independently selected studies for inclusion in the review based on titles and abstracts, according to the predetermined protocol. Full-text articles of all citations considered potentially relevant by at least 1 reviewer were acquired. Reviewers independently made the final selection of studies to be included in the review, and differences were resolved through discussion.
A focused literature search for network meta-analyses (NMA) dealing with WM or Brukinsa (zanubrutinib) was run in MEDLINE All (1946–) on June 18, 2021. No limits were applied. Articles were screened by 1 researcher for ITCs that met the patient, intervention, comparator, and outcome criteria listed in Table 4.
Findings From the Literature
A total of 107 studies were identified; 103 were excluded, while 4 potentially relevant citations were retrieved for full-text screening.16-19 Three potentially relevant reports from other sources were also identified that included regulatory approvals (i.e., Health Canada and FDA). Two studies met the inclusion criteria.16,18 The details of the included study (the ASPEN trial) are summarized in Table 5. Excluded studies are listed in Appendix 2. Information relevant to this report was derived from the submission to CADTH, Health Canada, and the FDA (Figure 1).3,7,13
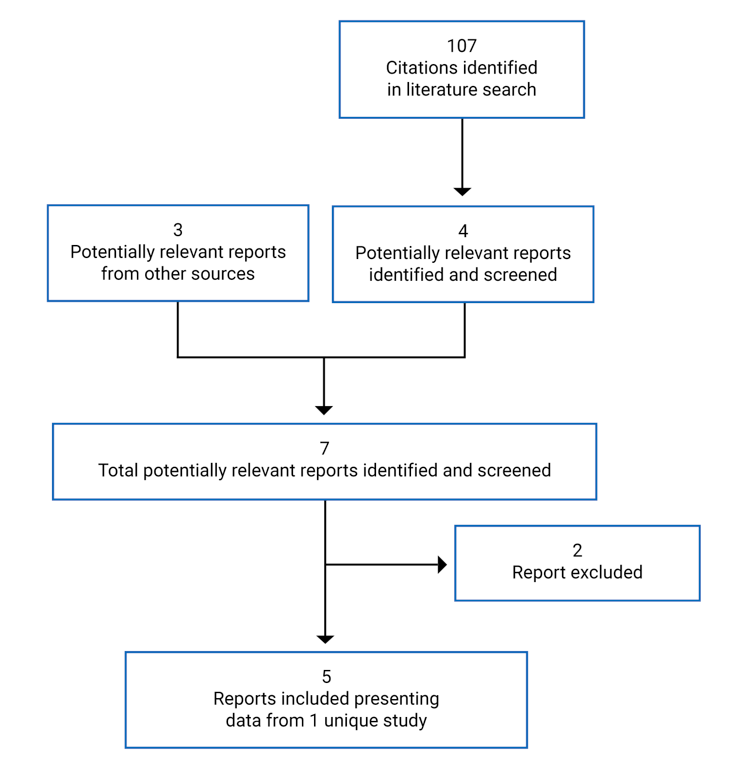
Table 5: Details of the ASPEN Study
Criteria | Design and population |
|---|---|
Study design | Phase III, randomized, open-label, multi-centre trial |
Locations | 60 centres in 12 countries (Australia, Czech Republic, France, Germany, Greece, Italy, Netherlands, Poland, Spain, Sweden, UK, US) |
Study duration | 25 January 2017 – ongoing |
Data cut-off date | 31 August 2019 |
Randomized (N) | Cohort 1 (MYD88L265P): N = 201 (1:1) Cohort 2 (MYD88WT or undetermined MYD88 mutation status): N = 28 (non-randomized; all patients received zanubrutinib) |
Inclusion criteria |
|
Exclusion criteria | • Prior exposure to a BTK inhibitor • Evidence of disease transformation at the time of study entry • Corticosteroids given with antineoplastic intent within 7 days; or chemotherapy, targeted therapy, or radiation therapy within 4 weeks; or antibody-based therapy within 4 weeks of the start of study drug • Major surgery within 4 weeks of study treatment • Ongoing toxicity of ≥ grade 2 from prior anticancer therapy (except for alopecia, absolute neutrophil count, and platelets) • Currently active, clinically significant cardiovascular disease (e.g., uncontrolled arrhythmia, congestive heart failure) or treatment with warfarin or another vitamin K antagonist, or history of myocardial infarction within 6 months of screening • History of other active malignancies within 2 years of study entry, with the exception of adequately treated in situ carcinoma of the cervix, localized basal or squamous cell carcinoma of skin, or previous malignancy confined and treated locally with curative intent |
Drugs | |
Intervention | Zanubrutinib 160 mg (80 mg × 2 capsules) orally twice a day |
Comparator | Ibrutinib 420 mg (140 mg × 3 capsules) orally once a day |
Duration | |
Phase | |
Open-label phase | Daily treatment until disease progression, unacceptable toxicity, or death, or withdrawal of consent or loss to follow-up (median duration of treatment was 19 months in both arms) |
Follow-up phase | Ongoing |
Outcomes | |
Primary end point | CR or VGPR as assessed by IRC based on the IWWM-6 criteria (in cohort 1) |
Secondary and exploratory end points | Secondary end points:
Exploratory end points:
Safety:
|
Notes | |
Publications | Tam C, et al. (2020)18 Dimopoulos M, et al. (2020)16 Clinical Study Report for Brukinsa7 Regulatory review reports from Health Canada and the FDA3,13 |
AE = adverse event; BTK = Bruton tyrosine kinase; CR = complete response; DoR = duration of response; ECOG PS = Eastern Cooperative Oncology Group Performance Status; HRQoL = health-related quality of life; IRC = Independent Review Committee; IWWM-6 = Sixth International Workshop on Waldenström’s Macroglobulinemia; IWWM-7 = Seventh International Workshop on Waldenström’s Macroglobulinemia; MRR = major response rate; OS = overall survival; PFS = progression-free survival; PR = partial response; R/R = relapsed/refractory; SAE = serious adverse event; VGPR = very good partial response; WM = Waldenström macroglobulinemia.
aUnsuitability for treatment with a standard chemoimmunotherapy regimen must have been a physician-determined status based on comorbidities and risk factors. Physicians needed to provide and document organ system(s) and specific reason(s) for the patient being considered unsuitable.
Source: Clinical Study Report for Brukinsa.7
Description of the ASPEN Trial
The ASPEN trial is an ongoing, phase III, randomized, open-label, multi-centre study designed to compare the efficacy and safety of zanubrutinib to ibrutinib in patients with WM who require therapy according to the consensus panel criteria from the 7th International Workshop on Waldenström Macroglobulinemia.7,20 The study consisted of an initial screening phase, a treatment phase, and a follow-up phase. The study is being conducted at 60 centres in 12 countries (Australia, Czech Republic, France, Germany, Greece, Italy, Netherlands, Poland, Spain, Sweden, UK, and US). Ibrutinib was chosen as the comparator because it was approved by the European Medicines Agency for the treatment of WM in adults who have received prior treatment for their disease and in previously untreated patients for whom treatment with chemoimmunotherapy is not suitable. The FDA approved zanubrutinib for the treatment of adult patients with WM in August 2021.
Randomization and treatment allocation: Based on MYD88 gene sequencing, patients were enrolled into either cohort 1 (MYD88L265P) or cohort 2 (MYD88WT). Patients with either missing or inconclusive MYD88 gene-sequencing results were assigned to cohort 2 by default. Using an interactive response technology system, cohort 1 patients were randomized 1:1 to receive either zanubrutinib (arm A) or ibrutinib (arm B). Stratification factors included CXCR4 mutational status (CXCR4WHIM versus CXCR4WT versus missing) and the number of prior therapies for WM (0 versus 1 to 3 versus > 3). A computer-generated randomization list, including stratification factor values and treatment arm assignments, was produced, reviewed, and approved by an independent statistician. Cohort 2 patients were assigned to receive zanubrutinib (arm C, non-randomized) by the interactive response technology system (Figure 2).7
Blinding: This was an open-label study. The IRC was blinded to study treatment, but the independent Data Monitoring Committee was not.
Study phases: The screening phase consisted of screening evaluations that were performed within 35 days before randomization, with the exception of a fresh bone biopsy, which could be performed up to 42 days before randomization as long as no intervening therapy had been administered. A fresh bone marrow aspirate was required for flow cytometry and the MYD88 and CXCR4 mutational analyses at screening. After treatment assignment, the first dose of ibrutinib or zanubrutinib was administered at cycle 1, day 1. A treatment cycle consisted of 28 days; treatment continued until progression or unacceptable toxicity. In all study arms, patients were to return approximately 30 days after the last dose of the study drug for safety follow-up visit(s) for the collection of information about AEs and SAEs that may have occurred after the patient discontinued the study. Information on new anticancer therapies given after the last dose of the study drug continued to be collected after discontinuation of study drug.
Protocol Amendments
The protocol was amended 5 times before the data cut-off date. In the original statistical analysis plan (SAP), the hierarchical testing procedure of the primary end point (VGPR or CR rate) included a noninferiority test. The noninferiority test was removed from the planned analyses in the final SAP before unblinded analyses being performed (by the sponsor), but the test was performed as a post hoc analysis. In addition, the noninferiority margin for the key secondary end point of major response rate (MRR) was changed to 12% from 8%. Other major changes to the conduct of the study included: a background update, with new zanubrutinib results and data on the role of MYD88 mutation in responsiveness of WM to BTK inhibitors; a change of the primary objective to the proportion of patients who achieved VGPR or CR, based on the clarification of the primary study hypothesis that stemmed from the updated zanubrutinib data; the addition of MRR and VGPR or CR (by investigator assessment) as secondary end points; the addition of antitumour activity and safety of zanubrutinib in MYD88WT patients with WM as exploratory end points; the addition of QoL and medical resource utilization as exploratory end points; and the identification of patients with MYD88L265P WM as the primary population for randomization and study analyses (cohort 1).
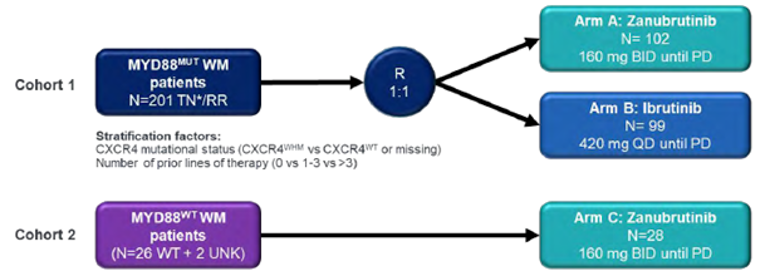
BID = twice daily; CXCR4 = chemokine receptor 4; MYD88MUT = mutated MYD88 gene; MYD88WT = wild-type MYD88 gene; PD = progressive disease; QD = once daily; R = randomization; RR = relapsed/refractory; TN = treatment-naive; UNK = unknown; WHIM = warts, hypogammaglobulinemia, immunodeficiency, and myelokathexis syndrome; WT = wild type.
Note: TN indicates unsuitability for chemoimmunotherapy (up to 20% of overall population).
Source: Clinical Study Report for Brukinsa.7
Populations
Inclusion and Exclusion Criteria
In the ASPEN trial, eligible patients had R/R WM after at least 1 prior line of therapy or were treatment-naive and considered by their treating physician to be unsuitable for standard chemoimmunotherapy regimens, based on comorbidities and risk factors (hereafter referred to as unfit, treatment-naive). Study investigators were required to document the organ system(s) and specific reason(s) for which they considered the patient unsuitable for standard chemoimmunotherapy. Patients with no prior therapy (i.e., unfit, treatment-naive) comprised no more than 20% of the patients in cohort 1. Relapsed patients were defined as whose who previously achieved a CR or VGPR or PR, but showed PD after a period of greater than or equal to 6 months. Refractory patients were defined as those who experienced prior treatment failure or disease progression within 6 months of therapy initiation. Patients were required to have measurable disease and adequate end-organ function. Patients with prior BTK inhibitor exposure, disease transformation, clinically significant cardiovascular disease, or active CNS lymphoma were not eligible to participate in the trial. The inclusion and exclusion criteria used in the trial are shown in Table 5.
Baseline Characteristics
Demographic Characteristics and Medical History
Between January 2017 and July 2018, 164 R/R and 37 unfit, treatment-naive patients with WM were recruited into cohort 1 (MYD88L265P). Two R/R patients were randomized, but never dosed (1 patient in the ibrutinib arm had a CNS lymphoma identified before dosing, and 1 patient in the zanubrutinib arm had acute kidney injury). The most common indications (> 20%) for therapy initiation were fatigue (57.2%), anemia (43.8%), B symptoms (30.3%), hyperviscosity (26.9%), and peripheral neuropathy (22.4%). The median age of all patients was 70.0 years. The majority of patients were male (66.7%), White (91.0%), and randomized at sites in Europe (59.7%) and Australia or New Zealand (30.8%) (Table 6). Overall, 8% of patients in the ibrutinib arm and 11% of patients in the zanubrutinib arm had a CXCR4WHIM mutation. Approximately 85% were in the intermediate- or high-risk prognostic category, and 77% had CT evidence of extramedullary disease.21 Cohort 2 (MYD88WT) included 28 patients (23 R/R, 5 unfit, treatment-naive) (Table 7). The most common indications for therapy initiation were fatigue (60.7%), B symptoms (35.7%), anemia (32.1%), hyperviscosity (21.4%), and peripheral neuropathy (10.7%). The median age was 72 years; 50% of patients were male and 96.4% were White.
In cohort 1, 37 unfit, treatment-naive patients were considered unsuitable for chemoimmunotherapy (Table 8): 27 patients (73.0%) were deemed unsuitable due to age (range = 64 years to 89 years); 8 patients (21.6%) were deemed unsuitable due to cardiac conditions (e.g., hypertension, ischemic heart disease, dilated cardiomyopathy, CABG); 4 patients (10.8%) were deemed unsuitable due to renal conditions (e.g., inadequate renal function for standard chemotherapy, chronic kidney disease); and 2 patients (5.4%) were deemed unsuitable due to infection (e.g., recurrent bacterial infections and sinusitis). Other miscellaneous reasons for unsuitability included lack of central venous access, allergic reaction to rituximab, and high IgM levels that, in the treating physician’s judgment, were a contraindication to chemoimmunotherapy.
In cohort 1, prior and/or concomitant medical conditions were reported in 197 patients (98.0%) overall (98 patients [99.0%] in the ibrutinib treatment arm and 99 patients [97.1%] in the zanubrutinib treatment arm). All 37 unfit, treatment-naive patients (100%) and 160 R/R patients (97.6%) had prior and/or concomitant medical conditions. The most common prior and/or concomitant medical conditions reported in greater than or equal to 10% of patients overall included hypertension (40.8%), anemia (20.9%), fatigue (15.9%), benign prostatic hyperplasia (13.4%), gastroesophageal reflux disease (11.9%), and insomnia (10.9%). In cohort 2, prior and/or concomitant medical conditions were reported in 27 patients (96.4%) overall, and included hypertension (35.7%), anemia (17.9%), and benign prostatic hyperplasia, cholecystectomy, chronic obstructive pulmonary disease, or hypercholesterolemia (14.3% each).
Prior Anticancer Therapies
For the 164 patients in cohort 1 and the 23 patients in cohort 2 with R/R disease, the median number of prior anticancer therapies was 1. In cohort 1, the most common prior anticancer therapies were rituximab (rituximab or ofatumumab; 149 patients [90.9%]); alkylating drugs (139 patients [84.8%]), and corticosteroids (110 patients [67.1%]); the use of these was generally comparable between the ibrutinib and zanubrutinib treatment arms, except for the following for R/R patients: prior alkylators (88.0% for zanubrutinib versus 81.5% for ibrutinib), steroid use (72.3% for zanubrutinib versus 61.7% for ibrutinib), and vinca alkaloids (27.7% for zanubrutinib versus 22.2% for ibrutinib). In addition, there were 3 patients with a prior history of stem cell transplant in the zanubrutinib treatment arm versus only 1 such patient in the ibrutinib arm. Rituximab monotherapy was used as part of prior treatments in 18% of cohort 1 overall (22 patients [22%] in the ibrutinib arm and 14 patients [14%] in the zanubrutinib arm). In cohort 2, the most common prior anticancer therapies were alkylating drugs and rituximab (22 patients [95.7%]) followed by corticosteroids (17 patients [73.9%]). Only 1 patient in cohort 2 had received rituximab monotherapy before study enrolment (Table 9).
Table 6: Demographic and Baseline Characteristics (Cohort 1: MYD88L265P) (ITT Analysis Set)
Characteristic | Unfit, treatment-naive | Relapsed/refractory | Overall | ||||||
|---|---|---|---|---|---|---|---|---|---|
Ibrutinib (N = 18) | Zanubrutinib (N = 19) | Total (N = 37) | Ibrutinib (N = 81) | Zanubrutinib (N = 83) | Total (N = 164) | Ibrutinib (N = 99) | Zanubrutinib (N = 102) | Total (N = 201) | |
Age (years) | |||||||||
Mean (SD) | 71.4 (11.70) | 70.4 (9.55) | 70.9 (10.51) | 69.6 (7.79) | 68.9 (10.45) | 69.2 (9.21) | 69.9 (8.59) | 69.2 (10.26) | 69.5 (9.46) |
Median (min, max) | 72.0 (38, 89) | 74.0 (50, 81) | 73.0 (38, 89) | 69.0 (52, 90) | 69.0 (45, 87) | 69.0 (45, 90) | 70.0 (38, 90) | 70.0 (45, 87) | 70.0 (38, 90) |
Age group, n (%) | |||||||||
≤ 65 years | 3 (16.7) | 5 (26.3) | 8 (21.6) | 26 (32.1) | 36 (43.4) | 62 (37.8) | 29 (29.3) | 41 (40.2) | 70 (34.8) |
> 65 years | 15 (83.3) | 14 (73.7) | 29 (78.4) | 55 (67.9) | 47 (56.6) | 102 (62.2) | 70 (70.7) | 61 (59.8) | 131 (65.2) |
≤ 75 years | 12 (66.7) | 12 (63.2) | 24 (64.9) | 65 (80.2) | 56 (67.5) | 121 (73.8) | 77 (77.8) | 68 (66.7) | 145 (72.1) |
> 75 years | 6 (33.3) | 7 (36.8) | 13 (35.1) | 16 (19.8) | 27 (32.5) | 43 (26.2) | 22 (22.2) | 34 (33.3) | 56 (27.9) |
Sex, n (%) | |||||||||
Male | 12 (66.7) | 11 (57.9) | 23 (62.2) | 53 (65.4) | 58 (69.9) | 111 (67.7) | 65 (65.7) | 69 (67.6) | 134 (66.7) |
Female | 6 (33.3) | 8 (42.1) | 14 (37.8) | 28 (34.6) | 25 (30.1) | 53 (32.3) | 34 (34.3) | 33 (32.4) | 67 (33.3) |
Race, n (%) | |||||||||
Asian | 0 (0.0) | 2 (10.5) | 2 (5.4) | 0 (0.0) | 2 (2.4) | 2 (1.2) | 0 (0.0) | 4 (3.9) | 4 (2.0) |
White | 17 (94.4) | 16 (84.2) | 33 (89.2) | 78 (96.3) | 72 (86.7) | 150 (91.5) | 95 (96.0) | 88 (86.3) | 183 (91.0) |
Not reported/ unknown | 1 (5.6) | 1 (5.3) | 2 (5.4) | 3 (3.7) | 9 (10.8) | 12 (7.3) | 4 (4.0) | 10 (9.8) | 14 (7.0) |
ECOG PS, n (%) | |||||||||
0 | 6 (33.3) | 7 (36.8) | 13 (35.1) | 36 (44.4) | 39 (47.0) | 75 (45.7) | 42 (42.4) | 46 (45.1) | 88 (43.8) |
1 | 10 (55.6) | 11 (57.9) | 21 (56.8) | 40 (49.4) | 39 (47.0) | 79 (48.2) | 50 (50.5) | 50 (49.0) | 100 (49.8) |
2 | 2 (11.1) | 1 (5.3) | 3 (8.1) | 5 (6.2) | 5 (6.0) | 10 (6.1) | 7 (7.1) | 6 (5.9) | 13 (6.5) |
WM signs and symptoms: indications for initiation of therapy, n (%)a | |||||||||
Fatigue | 10 (55.6) | 14 (73.7) | 24 (64.9) | 47 (58.0) | 44 (53.0) | 91 (55.5) | 57 (57.6) | 58 (56.9) | 115 (57.2) |
Hemoglobin ≤ 10 g/dL | 10 (55.6) | 12 (63.2) | 22 (59.5) | 30 (37.0) | 36 (43.4) | 66 (40.2) | 40 (40.4) | 48 (47.1) | 88 (43.8) |
B symptoms | 4 (22.2) | 6 (31.6) | 10 (27.0) | 22 (27.2) | 29 (34.9) | 51 (31.1) | 26 (26.3) | 35 (34.3) | 61 (30.3) |
Hyperviscosity | 8 (44.4) | 7 (36.8) | 15 (40.5) | 19 (23.5) | 20 (24.1) | 39 (23.8) | 27 (27.3) | 27 (26.5) | 54 (26.9) |
Peripheral neuropathy due to WM | 4 (22.2) | 6 (31.6) | 10 (27.0) | 17 (21.0) | 18 (21.7) | 35 (21.3) | 21 (21.2) | 24 (23.5) | 45 (22.4) |
ECOG PS = Eastern Cooperative Oncology Group Performance Status; ITT = intention to treat; max = maximum; min = minimum; SD = standard deviation; WM = Waldenström macroglobulinemia.
Notes: Cohort 1 includes patients with activating mutation in MYD88. Baseline value is the last non-missing result before the first dose of study treatment.
aOnly the most common signs and symptoms (observed in > 20%) are reported in the table.
Source: Clinical Study Report for Brukinsa.7
Table 7: Demographic and Baseline Characteristics (Cohort 2: MYD88WT) (SAS)
Characteristic | Unfit, treatment-naïve (N = 5) | Relapsed/refractory (N = 23) | Overall (N = 28) |
|---|---|---|---|
Zanubrutinib (N = 28) | |||
Age (years) | |||
Mean (SD) | 80.4 (6.31) | 67.9 (13.77) | 70.1 (13.57) |
Median (min, max) | 81.0 (71, 87) | 71.0 (39, 87) | 72.0 (39, 87) |
Age group, n (%) | |||
≤ 65 years | 0 (0.0) | 9 (39.1) | 9 (32.1) |
> 65 years | 5 (100.0) | 14 (60.9) | 19 (67.9) |
≤ 75 years | 1 (20.0) | 15 (65.2) | 16 (57.1) |
> 75 years | 4 (80.0) | 8 (34.8) | 12 (42.9) |
Sex, n (%) | |||
Male | 3 (60.0) | 11 (47.8) | 14 (50.0) |
Female | 2 (40.0) | 12 (52.2) | 14 (50.0) |
Race, n (%) | |||
White | 4 (80.0) | 23 (100.0) | 27 (96.4) |
Not reported/unknown | 1 (20.0) | 0 (0.0) | 1 (3.6) |
ECOG PS, n (%) | |||
0 | 3 (60.0) | 6 (26.1) | 9 (32.1) |
1 | 1 (20.0) | 14 (60.9) | 15 (53.6) |
2 | 1 (20.0) | 3 (13.0) | 4 (14.3) |
WM signs and symptoms: indications for initiation of therapy, n (%)a | |||
Fatigue | 2 (40.0) | 15 (65.2) | 17 (60.7) |
Hemoglobin ≤ 10 g/dL | 1 (20.0) | 8 (34.8) | 9 (32.1) |
B symptoms | 1 (20.0) | 9 (39.1) | 10 (35.7) |
Hyperviscosity | 2 (40.0) | 4 (17.4) | 6 (21.4) |
Peripheral neuropathy due to WM | 1 (20.0) | 2 (8.7) | 3 (10.7) |
ECOG PS = Eastern Cooperative Oncology Group Performance Status; max = maximum; min = minimum; SAS = safety analysis set; SD = standard deviation; WM = Waldenström macroglobulinemia.
Note: Baseline value is the last non-missing result before the first dose of study treatment.
aOnly the most common signs and symptoms (observed in > 10%) are reported in the table.
Source: Clinical Study Report for Brukinsa.7
Table 8: Reasons for Treatment-Naive Patients’ Unsuitability for Standard Chemoimmunotherapy
Characteristic | Cohort 1 (ITT analysis set) | Cohort 2 (safety analysis set) | ||
|---|---|---|---|---|
Ibrutinib (N = 18) n (%) | Zanubrutinib (N = 19) n (%) | Total (N = 37) n (%) | Zanubrutinib (N = 5) n (%) | |
Reasons | ||||
Age | 13 (72.2) | 14 (73.7) | 27 (73.0) | 5 (100.0) |
Cardiac | 3 (16.7) | 5 (26.3) | 8 (21.6) | 0 (0.0) |
Renal | 2 (11.1) | 2 (10.5) | 4 (10.8) | 1 (20.0) |
Pulmonary | 0 (0.0) | 0 (0.0) | 0 (0.0) | 1 (20.0) |
Infection | 1 (5.6) | 1 (5.3) | 2 (5.4) | 0 (0.0) |
Other | 5 (27.8) | 2 (10.5) | 7 (18.9) | 0 (0.0) |
ITT = intention to treat.
Table 9: Prior Anticancer Drug Therapies in Relapsed/Refractory Patients, Cohort 1 (MYD88L265P, ITT Analysis Set) and Cohort 2 (MYD88WT, Safety Analysis Set)
Prior therapies details | Relapsed/refractory | |||
|---|---|---|---|---|
Cohort 1 | Cohort 2 | |||
Ibrutinib (N = 81) | Zanubrutinib (N = 83) | Total (N = 164) | Zanubrutinib (N = 23) | |
Patients with any prior anticancer therapy, n (%) | 81 (100.0) | 83 (100.0) | 164 (100.0) | 23 (100.0) |
Number of prior therapies | ||||
Median (min, max) | 1.0 (1, 6) | 1.0 (1, 8) | 1.0 (1, 8) | 1.0 (1, 5) |
Number of prior therapies, n (%) | ||||
1 | 46 (56.8) | 47 (56.6) | 93 (56.7) | 14 (60.9) |
2 | 15 (18.5) | 15 (18.1) | 30 (18.3) | 4 (17.4) |
3 | 13 (16.0) | 14 (16.9) | 27 (16.5) | 2 (8.7) |
4 | 2 (2.5) | 4 (4.8) | 6 (3.7) | 1 (4.3) |
5 | 3 (3.7) | 0 (0.0) | 3 (1.8) | 2 (8.7) |
≥ 6 | 2 (2.5) | 3 (3.6) | 5 (3.0) | 0 (0.0) |
Best response for last therapy, n (%) | ||||
CR | 3 (3.7) | 8 (9.6) | 11 (6.7) | 1 (4.3) |
VGPR | 5 (6.2) | 4 (4.8) | 9 (5.5) | 3 (13.0) |
PR | 37 (45.7) | 30 (36.1) | 67 (40.9) | 7 (30.4) |
MRa | 5 (6.2) | 6 (7.2) | 11 (6.7) | 1 (4.3) |
Stable disease | 11 (13.6) | 16 (19.3) | 27 (16.5) | 5 (21.7) |
PD | 6 (7.4) | 4 (4.8) | 10 (6.1) | 2 (8.7) |
Unknown | 12 (14.8) | 14 (16.9) | 26 (15.9) | 4 (17.4) |
Time from the end of the last therapy to first dose (months) | ||||
N | 77 | 76 | 153 | 21 |
Mean (SD) | 40.92 (35.332) | 28.41 (30.431) | 34.71 (33.473) | 25.36 (33.167) |
Median (min, max) | 30.55 (1.1, 167.9) | 14.24 (0.9, 130.9) | 25.72 (0.9, 167.9) | 11.96 (0.9, 132.7) |
Prior therapy, n (%) | ||||
Rituximab (rituximab, ofatumumab) | 74 (91.4) | 75 (90.4) | 149 (90.9) | 22 (95.7) |
Alkylating drugs (cyclophosphamide, chlorambucil, bendamustine, ifosfamide, lomustine, melphalan, cisplatin) | 66 (81.5) | 73 (88.0) | 139 (84.8) | 22 (95.7) |
Corticosteroids (dexamethasone, prednisone, prednisolone, hydrocortisone, methylprednisone, methylprednisolone) | 50 (61.7) | 60 (72.3) | 110 (67.1) | 17 (73.9) |
Vinca alkaloid (vinblastine, vinorelbine, vincristine) | 18 (22.2) | 23 (27.7) | 41 (25.0) | 4 (17.4) |
Nucleoside analogue (fludarabine, gemcitabine, cladribine, cytarabine, methotrexate) | 18 (22.2) | 21 (25.3) | 39 (23.8) | 3 (13.0) |
Proteasome inhibitor (bortezomib, ixazomib) | 10 (12.3) | 10 (12.0) | 20 (12.2) | 5 (21.7) |
Anthracyclines (doxorubicin, epirubicin) | 9 (11.1) | 9 (10.8) | 18 (11.0) | 2 (8.7) |
Kinase inhibitors (idelalisib, everolimus) | 3 (3.7) | 2 (2.4) | 5 (3.0) | 0 (0.0) |
Stem cell transplant | 1 (1.2) | 3 (3.6) | 4 (2.4) | 1 (4.3) |
Others (interferon, bleomycin, belimumab) | 0 (0.0) | 3 (3.6) | 3 (1.8) | 0 (0.0) |
Topoisomerase inhibitors (etoposide) | 1 (1.2) | 2 (2.4) | 3 (1.8) | 1 (4.3) |
Immunomodulators (lenalidomide, thalidomide) | 1 (1.2) | 1 (1.2) | 2 (1.2) | 0 (0.0) |
Rituximab (rituximab, ofatumumab) in combinations | 0 (0.0) | 1 (1.2) | 1 (0.6) | 0 (0.0) |
CR = complete response; IgM = immunoglobulin M; ITT = intention to treat; max = maximum; min = minimum; MR = minor response; PD = progressive disease; PR = partial response; SD = standard deviation; VGPR = very good partial response.
Notes: Cohort 1 includes patients with activating mutations in MYD88. Cohort 2 includes patients with wild-type and unknown MYD88. Percentages are based on N.
Medication terms were coded using the WHO Drug Dictionary (September 2018 version). The categories are not mutually exclusive.
aDefined as ≥ 25% reduction in IgM level.
Source: Clinical Study Report for Brukinsa.7
Interventions
Zanubrutinib or ibrutinib was dispensed by the study centre personnel to patients at scheduled study visits to ensure adequate drug supply for administration at home throughout the treatment phase. Patients randomized or assigned to zanubrutinib (arms A and C) were instructed to take 160 mg (80 mg × 2 capsules) orally with a glass of water twice daily at approximately the same time each day. The time difference between 2 consecutive doses should have been at least 8 hours. Patients randomized to ibrutinib (arm B) were instructed to take 420 mg (140 mg × 3 capsules or in other applicable dose forms) orally with a glass of water once daily at approximately the same time each day. Patients were not required to fast before or after administration of either zanubrutinib or ibrutinib. Zanubrutinib or ibrutinib was to be taken as prescribed from cycle 1, day 1 until disease progression, unacceptable toxicity, death, withdrawal of consent, loss to follow-up, or termination of the study by the sponsor. Compliance with study drug administration was measured by reviewing patient diaries and tablet counts at each study visit.
Outcomes
The primary efficacy end point was the proportion of patients in each arm of cohort 1 achieving either CR or VGPR, as determined by the IRC using an adaptation of the response criteria updated at the Sixth IWWM.5,6
The main secondary efficacy end points for cohort 1 were as follows:
MRR as assessed by the IRC, defined as the proportion of patients achieving CR, VGPR, or PR
DoR as assessed by the IRC, defined as the time from first determination of response (CR, VGPR, or PR) (per modified IWWM criteria) until first documentation of progression (per modified IWWM criteria) or death, whichever comes first
PFS as assessed by the IRC, defined as the time from randomization to the first documentation of progression (per modified IWWM criteria) or death, whichever occurs first
Resolution of treatment-precipitating symptoms, defined as the absence of the symptoms that triggered the initiation of study treatment (per the IWWM treatment guidelines) at any point during study treatment
The main exploratory end points included:
Time to next treatment, defined as the time from the date of randomization until the start date of a new anticancer therapy other than study medications in patients with MYD88L265P WM (cohort 1)
OS, defined as the time from the date of randomization until the date of death from any cause in patients with MYD88L265P WM (cohort 1)
MRR according to CXCR4 mutation status (CXCR4WHIM versus CXCR4WT) in patients with MYD88L265P WM (cohort 1)
Change in QoL as assessed using the EORTC QLQ-C30 and EQ-5D in patients with MYD88L265P WM (cohort 1) (further detail, including information on the validity and reliability of these instruments, is presented in Appendix 3)
Medical resource utilization as assessed by the number of hospitalizations, lengths of hospital stays, and supportive care in patients with MYD88L265P WM (cohort 1)
Anticancer activity of zanubrutinib (i.e., CR or VGPR rate, MRR, overall response rate, PFS, DoR, and OS as assessed by the IRC and by the investigator) in patients with MYD88WT WM (cohort 2)
Assessments
Bone marrow aspiration and biopsy information was collected at baseline and week 48, and as clinically indicated thereafter, including for confirmation of CR. Bone marrow samples taken at baseline were assayed for MYD88 and CXCR4 mutations before randomization. Quantitative serum immunoglobulins, M-paraprotein, and beta2-microglobulin levels were measured at baseline, the start of each cycle until cycle 12, and every 3 cycles thereafter. MRI or contrast-enhanced CT scans were performed at baseline. Patients with extramedullary disease underwent follow-up scans every 3 cycles until cycle 12 and every 6 cycles thereafter until disease progression. HRQoL assessments were collected at baseline, every 3 cycles until cycle 12, and every 6 cycles thereafter (Table 9). All patients were followed for AEs for 30 additional days after the last dose of the study drug. All treatment-related AEs and SAEs were followed until resolution or stabilization.
Safety Outcomes
The incidence, timing, and severity of AEs were assessed using Version 4.3 of the National Cancer Institute Common Terminology Criteria for Adverse Events. A treatment-emergent adverse event (TEAE) was defined as an AE with an onset time or increase in severity level on or after the first dose of study drug and within 30 days after the last dose of study drug or before the initiation of a new anticancer therapy, whichever occurred first. Unless otherwise stated, all AE summaries are of TEAEs. A treatment-related AE was an AE that was assessed by the investigator as related to the study drug or for which an assessment of the causal relationship was missing. AEs of special interest included hemorrhage (including minor bleeding, such as contusion and petechiae), major hemorrhage (defined as serious or ≥ grade 3 bleeding at any site or CNS bleeding of any grade), atrial fibrillation or flutter, hypertension, second primary malignancies, tumour lysis syndrome, infections (opportunistic), neutropenia, thrombocytopenia, and anemia.
Statistical Analysis
Sample Size Calculations
The sample size calculation was based on the comparison of the primary end point of CR or VGPR rate in the R/R analysis set in cohort 1. Assuming that RRA equals 0.35 and RRB equals 0.15, where RRA and RRB denote the CR or VGPR rate in arm A and arm B, respectively, 75 patients per arm (150 in total) provided a power of 0.814 in testing RRA versus RRB in the R/R analysis set in cohort 1 using a normal approximation to binomial test with a 2-sided significance of 0.05. Assuming that MRRA equals 0.90 and MRRB equals 0.80, the power of demonstrating noninferiority of zanubrutinib in the R/R analysis set in cohort 1 was 96.8% when a noninferiority margin of 12% was used. In addition to the 150 R/R patients, approximately 20% (n = 38) of unfit, treatment-naive patients with MYD88L265P were enrolled in cohort 1. Assuming MYD88L265P mutation was present in 90% of the enrolled patients, a total of approximately 210 patients were enrolled in cohorts 1 and 2 combined.
Analysis Sets
The intention-to-treat (ITT) analysis set included all randomized patients assigned to a treatment in cohort 1 (MYD88L265P).
The R/R analysis set (a subset of the ITT analysis set) included all randomized patients with at least 1 prior line of therapy. This was the primary analysis set used for efficacy analyses.
The efficacy analysis set in cohort 2 included all patients who received any dose of zanubrutinib and were centrally confirmed to have MYD88WT.
The safety analysis set included all patients who received any dose of zanubrutinib or ibrutinib. This was the analysis set used for all safety analyses.
Analyses of Outcomes
In the original SAP, the hierarchical testing procedure of the primary end point (VGPR or CR rate) included a noninferiority test with a noninferiority margin of –4.5% to be conducted before the superiority test. The margin of –4.5% was determined before the unblinded analysis (of the sponsor) being performed, using the 95% to 95% fixed margin approach on the estimated treatment effect of ibrutinib based on 2 ibrutinib monotherapy studies.22,23 After discussions with the FDA before the unblinded analysis, the noninferiority test was removed from the planned analyses, and was instead performed as a post hoc analysis, as specified in the final SAP.
The primary efficacy analysis was planned to be performed approximately 12 months after the last R/R patient was randomized. Comparison between ibrutinib and zanubrutinib for the primary efficacy end point (cohort 1) was based on a hierarchical fixed-sequence procedure to adjust for multiplicity. The analysis of the superiority of zanubrutinib compared to ibrutinib in patients with R/R WM was performed first. If the comparison was statistically significant, further testing was performed using the ITT population (including 38 treatment-naive patients in addition to the R/R patients with MYD88L265P). The superiority of the primary end point of CR or VGPR rate was tested using the Cochran-Mantel-Haenszel test stratified by the CXCR4 status (CXCRWHIM versus CXCRWT/missing), prior line of therapy (1 to 3 versus > 3 for R/R patients and 0 versus > 3 in the ITT analysis set), and age group (≤ 65 years versus > 65 years) at a 1-sided significance level of 0.025. If the 2-sided P value was less than 0.05 and the estimated risk difference was positive, it would be concluded that the VGPR or CR rate for zanubrutinib was significantly greater than the VGPR or CR rate for ibrutinib, and the primary objective of superiority would be met.
The key secondary end point of MRR by IRC was to be tested only if any of the superiority tests for the primary end point were statistically significant. If the primary end point of VGPR or CR rate was superior in the R/R analysis set only, the key secondary end point of MRR was tested for noninferiority in the R/R analysis set at a 1-sided significance level of 0.025. If the primary end point of VGPR or CR rate was superior in both the R/R and ITT analysis sets, MRR would be tested for noninferiority in the R/R and ITT analysis sets, respectively, at a 1-sided significance level of 0.025. The study-wide type I error would be controlled at a 1-sided 0.05 level. For the other secondary end points assessed, including PFS, the statistical tests performed were descriptive without multiplicity adjustment. The MRR by IRC test for noninferiority of zanubrutinib compared to ibrutinib was conducted with a noninferiority margin of 12% (H0: MRRA-MRRB ≤ –12%, and Ha: MRRA-MRRB > –12%, where MRRA is the MRR in the zanubrutinib arm and MRRB is the MRR in the ibrutinib arm). The 95% CI for the Cochran-Mantel-Haenszel common risk difference was to be constructed with normal approximation and standard error based on Sato (1989) with strata similar to those described earlier for the primary end point of VGPR or CR. If the lower bound of the CI was greater than the noninferiority margin, the null hypothesis would be rejected, concluding that the MRR in zanubrutinib is noninferior to the MRR in ibrutinib. In addition, as a sensitivity analysis, the Cochran-Mantel-Haenszel common risk difference was to be estimated using the null variance estimator (Klingenberg [2013]).
Time to next treatment was summarized descriptively using the Kaplan–Meier (KM) method. Time to next treatment for patients without subsequent anticancer therapy was censored at the date of the patient’s last available information. PFS was analyzed at the time of the primary analysis of VGPR or CR rate, which was approximately 4 years after the first patient was randomized. The KM method was used; PFS was right-censored for patients who met 1 of the following criteria: no baseline disease assessment; started a new anticancer therapy before disease progression/death; experienced disease progression or death immediately after or more than 6 months since the last disease assessment (more than 12 months if a patient was on a response assessment schedule of every 24 weeks); alive without documentation of disease progression. Two-sided 95% CIs for median PFS were estimated using the Brookmeyer and Crowley method. OS was analyzed using methods similar to those described for PFS. Patients who remained alive as of the data cut-off date or who discontinued the study due to reasons other than death were right-censored at the date on which the patient was last known to be alive. The analysis of DoR conducted similarly to that of PFS. DoR was not compared between the 2 treatment arms. The difference in the resolution of any and all treatment-precipitating symptoms between zanubrutinib and ibrutinib was tested using a Chi-square test. The number and percentage of patients with the resolution of each and all symptoms were summarized.
The EORTC QLQ-C30 and EQ-5D were summarized for each assessment point. For the EORTC QLQ-C30, the percentage of patients with clinically meaningful changes from baseline in “global health status/QoL” and functional domains was summarized as “improved,” “stable,” or “worsened,” according to the scale’s scoring manual. The minimally important difference (MID) used to determine these categories was not reported. In addition to descriptive analysis, the QLQ-C30 global health status/QoL scale scores were compared between treatment groups in cohort 1 using a linear mixed effects model for repeated measures. LS means and standard errors for the difference between treatment arms were reported. The EuroQol 5-Dimensions 5-Levels (EQ-5D-5L) comprised a descriptive system and the EuroQol Visual Analogue Scale (EQ VAS) with 5 dimensions (mobility, self-care, usual activities, pain/discomfort, and anxiety/depression). The EQ VAS was summarized descriptively. Descriptive statistics were also performed, including the number and percentage of patients reporting each level of problem on each dimension of the EQ-5D.
Medical resource utilization, including the number of hospitalizations, planned and unplanned hospital visits, lengths of hospital stays, and supportive care (e.g., transfusions, growth factor support, IV antibiotics) were summarized at each cycle for each treatment arm in cohort 1.
All analyses were performed on data collected through a cut-off date of August 31, 2019.
Subgroup Analyses
The proportion of patients in cohort 1 who achieved a VGPR or CR were assessed in the following subgroups: sex (male versus female), age (≤ 65 years versus > 65 years; > 75 years versus ≤ 75 years), geographic region (Australia or New Zealand versus Europe versus North America), number of prior lines of therapy (0 versus 1 to 3 versus ≥ 3 and R/R versus treatment-naive), baseline ECOG PS (0 versus ≥ 1), baseline CXCR4 mutation status by Sanger method (warts, hypogammaglobulinemia, infections, and myelokathexis versus wild type or missing), baseline IgM level (≤ 40 g/L versus > 40 g/L), baseline beta2-microglobulin level (≤ 3 mg/L versus 3 mg/L), baseline hemoglobin concentration (≤ 110 g/L versus > 110 g/L), baseline platelet count (≤ 100 × 109/L versus > 100 × 109/L), baseline presence of extramedullary disease (yes versus no), and IPSSWM score (low versus intermediate versus high).
Handling of Dropouts or Missing Data
Missing data were not imputed unless otherwise specified. Missing dates or partially missing dates were not imputed as data level for prior or concomitant medications or procedures, new anticancer therapies, AEs, and deaths.
Results
Patient Disposition
In cohort 1 (MYD88L265P), 201 patients were randomized: 99 in the ibrutinib arm and 102 in the zanubrutinib arm. A total of 37 patients (18.4%) were unfit, treatment-naive (18 in the ibrutinib treatment arm and 19 in the zanubrutinib treatment arm), and 164 patients (81.6%) were R/R (81 in the ibrutinib treatment arm and 83 in the zanubrutinib treatment arm). Two R/R patients were randomized but not treated: 1 in the zanubrutinib treatment arm due to an AE (unrelated to screening procedures) and 1 in the ibrutinib treatment arm due to PD (Bing Neel syndrome). As of the data cut-off date, 158 patients (78.6%) were continuing study treatment (77 patients [77.8%] in the ibrutinib treatment arm and 81 patients [79.4%] in the zanubrutinib treatment arm).
The most common reasons for discontinuation of study treatment were AEs (9 ibrutinib-treated patients [9.1%] versus 4 zanubrutinib-treated patients [3.9%]) and PD (5 ibrutinib-treated patients [5.1%] versus 7 zanubrutinib-treated patients [6.9%]). At the time of the primary analysis, 92% of the patients in the R/R analysis set had at least 15 months of follow-up. Overall, the median follow-up times on study for patients treated with ibrutinib and zanubrutinib were 19.38 months and 19.47 months, respectively (Table 10).
Of the 28 patients enrolled in cohort 2 (MYD88WT) and treated with zanubrutinib (5 unfit, treatment-naive and 23 R/R), 17 patients (60.7%) remained on treatment as of the data cut-off date. The most common reasons for discontinuation of study treatment were PD (6 patients [21.4%]) and AEs (2 patients [7.1%]). The median follow-up time on study was 17.8 months in this group (Table 11).
Table 10: Patient Disposition (Cohort 1: MYD88L265P) (Intention-to-Treat Analysis Set)
Category | Unfit, treatment-naive | Relapsed/refractory | Overall | ||||||
|---|---|---|---|---|---|---|---|---|---|
Ibrutinib n (%) | Zanubrutinib n (%) | Total n (%) | Ibrutinib n (%) | Zanubrutinib n (%) | Total n (%) | Ibrutinib n (%) | Zanubrutinib n (%) | Total n (%) | |
Number of patients randomized | 18 (100.0) | 19 (100.0) | 37 (100.0) | 81 (100.0) | 83 (100.0) | 164 (100.0) | 99 (100.0) | 102 (100.0) | 201 (100.0) |
Patients randomized, but not treated | 0 (0.0) | 0 (0.0) | 0 (0.0) | 1 (1.2) | 1 (1.2) | 2 (1.2) | 1 (1.0) | 1 (1.0) | 2 (1.0) |
Adverse event | 0 (0.0) | 0 (0.0) | 0 (0.0) | 0 (0.0) | 1 (1.2) | 1 (0.6) | 0 (0.0) | 1 (1.0) | 1 (0.5) |
Progressive disease | 0 (0.0) | 0 (0.0) | 0 (0.0) | 1 (1.2) | 0 (0.0) | 1 (0.6) | 1 (1.0) | 0 (0.0) | 1 (0.5) |
Number of patients treated | 18 (100.0) | 19 (100.0) | 37 (100.0) | 80 (98.8) | 82 (98.8) | 162 (98.8) | 98 (99.0) | 101 (99.0) | 199 (99.0) |
Patients remaining on treatment | 14 (77.8) | 14 (73.7) | 28 (75.7) | 63 (77.8) | 67 (80.7) | 130 (79.3) | 77 (77.8) | 81 (79.4) | 158 (78.6) |
Patients discontinued from treatment | 4 (22.2) | 5 (26.3) | 9 (24.3) | 17 (21.0) | 15 (18.1) | 32 (19.5) | 21 (21.2) | 20 (19.6) | 41 (20.4) |
Adverse event | 3 (16.7) | 0 (0.0) | 3 (8.1) | 6 (7.4) | 4 (4.8) | 10 (6.1) | 9 (9.1) | 4 (3.9) | 13 (6.5) |
Progressive disease | 0 (0.0) | 3 (15.8) | 3 (8.1) | 5 (6.2) | 4 (4.8) | 9 (5.5) | 5 (5.1) | 7 (6.9) | 12 (6.0) |
Investigator’s discretion | 0 (0.0) | 0 (0.0) | 0 (0.0) | 4 (4.9) | 2 (2.4) | 6 (3.7) | 4 (4.0) | 2 (2.0) | 6 (3.0) |
Withdrawal by patient | 0 (0.0) | 2 (10.5) | 2 (5.4) | 0 (0.0) | 3 (3.6) | 3 (1.8) | 0 (0.0) | 5 (4.9) | 5 (2.5) |
Other | 1 (5.6) | 0 (0.0) | 1 (2.7) | 2 (2.5) | 2 (2.4) | 4 (2.4) | 3 (3.0) | 2 (2.0) | 5 (2.5) |
Median study follow-up (min, max), months | 22.21 (1.6, 31.1) | 21.45 (4.8, 31.2) | 21.95 (1.6, 31.2) | 18.79 (0.5, 30.0) | 18.73 (0.4, 28.7) | 18.78 (0.4, 30.0) | 19.38 (0.5, 31.1) | 19.47 (0.4, 31.2) | 19.45 (0.4, 31.2) |
max = maximum; min = minimum.
Notes: Percentages are based on the number of patients randomized. Study follow-up time is defined as the time from the randomization (enrolment) date to the death date or end-of-study date (whichever occurred first) for patients who discontinued from the study, or the database cut-off date for ongoing patients.
Source: Clinical Study Report for Brukinsa.7
Table 11: Patient Disposition (Cohort 2: MYD88WT) (Safety Analysis Set)
Category | Unfit, treatment-naive n (%) | Relapsed/refractory n (%) | Overall n (%) |
|---|---|---|---|
Zanubrutinib (N = 28) | |||
Number of patients enrolled | 5 (100.0) | 23 (100.0) | 28 (100.0) |
Number of patients treated | 5 (100.0) | 23 (100.0) | 28 (100.0) |
Patients remaining on treatment | 3 (60.0) | 14 (60.9) | 17 (60.7) |
Patients discontinued from treatment | 2 (40.0) | 9 (39.1) | 11 (39.3) |
Progressive disease | 1 (20.0) | 5 (21.7) | 6 (21.4) |
Adverse event | 0 (0.0) | 2 (8.7) | 2 (7.1) |
Investigator’s discretion | 1 (20.0) | 1 (4.3) | 2 (7.1) |
Withdrawal by patient | 0 (0.0) | 1 (4.3) | 1 (3.6) |
Median study follow-up (min, max), months | 19.29 (13.7, 21.7) | 17.15 (2.3, 27.8) | 17.87 (2.3, 27.8) |
max = maximum; min = minimum.
Notes: Percentages are based on the number of patients enrolled. Study follow-up time is defined as the time from the randomization (enrolment) date to the death date or end-of- study date (whichever occurred first) for patients discontinued from the study, or the database cut-off date for ongoing patients.
Source: Clinical Study Report for Brukinsa.7
Exposure to Study Treatments
In cohort 1, the overall median treatment durations were 18.5 months and 18.7 months for the ibrutinib and zanubrutinib treatment arms, respectively; the median relative dose intensities were 98.1% and 97.6%, respectively. For R/R patients, the median treatment durations were 17.99 months and 18.00 months in the ibrutinib and zanubrutinib treatment arms, respectively, with median relative dose intensities of 98.14% and 97.73%, respectively. The median treatment durations for treatment-naive patients were 20.73 months and 21.45 months in the ibrutinib and zanubrutinib treatment arms, respectively, with median relative dose intensities of 98.76% and 97.58%.
Concomitant Medications
In cohort 1, almost all patients received greater than or equal to 1 concomitant medication(s) (98% in the ibrutinib arm and 96% in zanubrutinib arm). The most common concomitant medications in both arms were antibacterial drugs for systemic use (74 patients [75.5%] in the ibrutinib treatment arm and 69 patients [68.3%] in the zanubrutinib treatment arm) and analgesics (44 patients [44.9%] in the ibrutinib treatment arm and 46 patients [45.5%] in the zanubrutinib treatment arm). This was followed by drugs for acid-related disorders (37 patients [37.8%] in the ibrutinib arm and 35 patients [34.7%] in the zanubrutinib arm) and antithrombotic drugs (32 patients [32.7%] in the ibrutinib arm and 37 patients [36.6%] in the zanubrutinib arm). Antidiarrheals and intestinal anti-inflammatory or anti-infective drugs were used by 19 patients (19.4%) in the ibrutinib arm and by 3 patients (3.0%) in the zanubrutinib arm, consistent with the increased frequency of diarrhea in the former group. Antianemic preparations were used by 14 patients (14.3%) and 32 patients (31.7%) in the ibrutinib and zanubrutinib treatment arms, respectively, consistent with lower hemoglobin levels at baseline in the zanubrutinib-treated patients.
Protocol Violations
Overall, 7 patients (3.5%) had major protocol violations: study assessment or procedures (n = 5), hepatitis B or C testing not assessed (n = 5), or disallowed medication (n = 1).
Efficacy
The median follow-up time of patients was 19.4 months in cohort 1 and 17.8 months in cohort 2.
Time to Next Treatment
Cohort 1: MYD88L265P
In cohort 1, 9 patients in the ibrutinib arm and 6 patients in the zanubrutinib arm started non-protocol anticancer therapy. The median time to initiation of non-protocol anticancer therapy were 6.44 months in the ibrutinib treatment arm and 6.83 months in the zanubrutinib treatment arm (Table 12).
Cohort 2: MYD88WT
In cohort 2, 3 patients (1 unfit, treatment-native and 2 R/R) started non-protocol anticancer therapy with a median time to initiation of 3.61 months.
Table 12: Time to Initiation of Non-Protocol Anticancer Therapy for Waldenström Macroglobulinemia (Cohort 1: MYD88L265P) (ITT Analysis Set)
Study details | Unfit, treatment-naive | Relapsed/refractory | Overall | |||
|---|---|---|---|---|---|---|
Ibrutinib (N = 18) | Zanubrutinib (N = 19) | Ibrutinib (N = 81) | Zanubrutinib (N = 83) | Ibrutinib (N = 99) | Zanubrutinib (N = 102) | |
Time to initiation of non-protocol anticancer therapy for WM (months) | ||||||
na | 2 | 1 | 7 | 5 | 9 | 6 |
Mean (SD) | 6.65 (8.06) | 1.84 (NE) | 6.69 (4.69) | 9.32 (8.21) | 6.68 (4.96) | 8.07 (7.95) |
Median (min, max) | 6.65 (1.0, 12.4) | 1.84 (1.8, 1.8) | 6.44 (0.4, 13.1) | 11.07 (0.0, 20.5) | 6.44 (0.4, 13.1) | 6.83 (0.0, 20.5) |
ITT = intention to treat; max = maximum; min = minimum; NE = not estimable; SD = standard deviation; WM = Waldenström macroglobulinemia.
aNumber of patients who started non-protocol anticancer therapy for WM.
Source: Clinical Study Report for Brukinsa.7
PFS
Cohort 1: MYD88L265P
In cohort 1, the median IRC-assessed PFS was not reached in either treatment arm. The event-free rates at 12 months for patients in the ibrutinib and zanubrutinib treatment arms were 87.2% (95% CI, 78.6% to 92.5%) versus 89.7% (95% CI, 81.7% to 94.3%), respectively, and were 83.8% (95% CI, 74.5% to 89.9%) versus 85.0% (95% CI, 75.2% to 91.2%) at 18 months. For patients with R/R disease in the ibrutinib and zanubrutinib treatment arms, the event-free rates at 12 months were 85.9% (95% CI, 75.9% to 91.9%) versus 92.4% (95% CI, 83.8% to 96.5%), respectively, and 81.7% (95% CI, 71.1% to 88.8%) versus 85.9% (95% CI, 73.7% to 92.7%) at 18 months (Table 13 and Figure 3).
The median PFS assessed by the investigator was not reached in either treatment arm. The event-free rates at 12 months for patients in the ibrutinib and zanubrutinib treatment arms were 90.4% (95% CI, 82.4% to 94.9%) versus 93.9% (95% CI, 87.0% to 97.2%) respectively, and 87.1% (95% CI, 78.4% to 92.5%) versus 88.9% (95% CI, 79.3% to 94.2%) at 18 months.
Cohort 2: MYD88WT
In cohort 2, the event-free rate was 72.4% (95% CI, 50.6% to 85.8%) at 12 months and 68.1% (95% CI, 46.2% to 82.6%) at 24 months (Table 14 and Figure 4). In patients overall in cohort 2, the event-free rate as assessed by the investigator was 69.0% (95% CI, 47.5% to 83.2%) at 12 months and 64.7% (95% CI, 43.0 to 79.9%) at 18 months.
Table 13: IRC-Assessed PFS (Cohort 1: MYD88L265P) (ITT Analysis Set)
Response category | Unfit, treatment-naive | Relapsed/refractory | Overall | |||
|---|---|---|---|---|---|---|
Ibrutinib (N = 18) | Zanubrutinib (N = 19) | Ibrutinib (N = 81) | Zanubrutinib (N = 83) | Ibrutinib (N = 99) | Zanubrutinib (N = 102) | |
Events, n (%) | 1 (5.6) | 5 (26.3) | 15 (18.5) | 10 (12.0) | 16 (16.2) | 15 (14.7) |
Progressive disease | 1 (5.6) | 4 (21.1) | 9 (11.1) | 9 (10.8) | 10 (10.1) | 13 (12.7) |
Death | 0 (0.0) | 1 (5.3) | 6 (7.4) | 1 (1.2) | 6 (6.1) | 2 (2.0) |
Censored, n (%) | 17 (94.4) | 14 (73.7) | 66 (81.5) | 73 (88.0) | 83 (83.8) | 87 (85.3) |
No documented progressive disease or death | 15 (83.3) | 13 (68.4) | 65 (80.2) | 68 (81.9) | 80 (80.8) | 81 (79.4) |
No documented progressive disease or death: withdrew consent or lost to follow-up | 1 (5.6) | 1 (5.3) | 1 (1.2) | 2 (2.4) | 2 (2.0) | 3 (2.9) |
No documented progressive disease/ or death: non-protocol anticancer therapy | 0 (0.0) | 0 (0.0) | 0 (0.0) | 2 (2.4) | 0 (0.0) | 2 (2.0) |
No baseline or post-baseline assessment | 1 (5.6) | 0 (0.0) | 0 (0.0) | 1 (1.2) | 1 (1.0) | 1 (1.0) |
Follow-up (months)a | ||||||
Median (95% CI) | 19.4 (16.6 to 22.1) | 22.2 (19.4 to 24.9) | 17.0 (16.6 to 19.3) | 16.7 (16.6 to 19.3) | 18.5 (16.7 to 19.3) | 18.0 (16.7 to 19.4) |
PFS (months)b | ||||||
Median (95% CI) | NE (NE to NE) | NE (19.1 to NE) | NE (NE to NE) | NE (NE to NE) | NE (NE to NE) | NE (NE to NE) |
Event-free rate at, % (95% CI)c | ||||||
6 months | 93.8 (63.2 to 99.1) | 89.5 (64.1 to 97.3) | 91.1 (82.3 to 95.7) | 96.3 (88.9 to 98.8) | 91.6 (83.9 to 95.7) | 95.0 (88.4 to 97.9) |
9 months | 93.8 (63.2 to 99.1) | 83.9 (57.9 to 94.5) | 88.6 (79.2 to 93.9) | 95.0 (87.2 to 98.1) | 89.5 (81.3 to 94.2) | 92.9 (85.7 to 96.5) |
12 months | 93.8 (63.2 to 99.1) | 78.3 (51.9 to 91.3) | 85.9 (75.9 to 91.9) | 92.4 (83.8 to 96.5) | 87.2 (78.6 to 92.5) | 89.7 (81.7 to 94.3) |
18 months | 93.8 (63.2 to 99.1) | 78.3 (51.9 to 91.3) | 81.7 (71.1 to 88.8) | 85.9 (73.7 to 92.7) | 83.8 (74.5 to 89.9) | 85.0 (75.2 to 91.2) |
24 months | 93.8 (63.2 to 99.1) | 71.8 (44.6 to 87.3) | 78.8 (66.5 to 87.0) | 80.2 (61.8 to 90.3) | 81.5 (71.1 to 88.5) | 79.4 (66.2 to 88.0) |
CI = confidence interval; IRC = Independent Review Committee; ITT = intention to treat; NE = not estimable; PFS = progression-free survival.
Note: Percentages are based on N.
aMedian follow-up time is estimated using the reverse Kaplan–Meier method.
bMedians and other quartiles are estimated using the Kaplan–Meier method, with 95% CIs estimated using the method of Brookmeyer and Crowley.
cEvent-free rates are estimated using the Kaplan–Meier method, with 95% CIs estimated using the Greenwood formula.
Source: Clinical Study Report for Brukinsa.7
Table 14: IRC-Assessed PFS (Cohort 2: MYD88WT) (Efficacy Analysis Set)
Response category | Unfit, treatment-naive (N = 5) | Relapsed/refractory (N = 21) | Overall (N = 26) |
|---|---|---|---|
Zanubrutinib (N = 26) | |||
Events, n (%) | 2 (40.0) | 7 (33.3) | 9 (34.6) |
Progressive disease | 1 (20.0) | 6 (28.6) | 7 (26.9) |
Death | 1 (20.0) | 1 (4.8) | 2 (7.7) |
Censored, n (%) | 3 (60.0) | 14 (66.7) | 17 (65.4) |
No documented progressive disease or death | 3 (60.0) | 14 (66.7) | 17 (65.4) |
Follow-up (months)a | |||
Median (95% CI) | 19.1 (16.8 to 19.7) | 16.1 (13.8 to 19.7) | 17.5 (13.9 to 19.4) |
PFS (months)b | |||
Median (95% CI) | NE (10.0 to NE) | 27.5 (11.1 to 27.5) | 27.5 (13.7 to 27.5) |
Event-free rate at, % (95% CI)c | |||
6 months | 100.0 (NE to NE) | 85.7 (62.0 to 95.2) | 88.5 (68.4 to 96.1) |
9 months | 100.0 (NE to NE) | 75.6 (50.9 to 89.1) | 80.4 (59.1 to 91.4) |
12 months | 80.0 (20.4 to 96.9) | 70.6 (45.8 to 85.6) | 72.4 (50.6 to 85.8) |
18 months | 60.0 (12.6 to 88.2) | 70.6 (45.8 to 85.6) | 68.1 (46.2 to 82.6) |
24 months | NE (NE to NE) | 70.6 (45.8 to 85.6) | 68.1 (46.2 to 82.6) |
CI = confidence interval; IRC = Independent Review Committee; NE = not estimable; PFS = progression-free survival.
Note: Percentages are based on N.
aMedian follow-up time is estimated using the reverse Kaplan–Meier method.
bMedians and other quartiles are estimated using the Kaplan–Meier method, with 95% CIs estimated using the Brookmeyer and Crowley method.
cEvent-free rates are estimated using the Kaplan–Meier method, with 95% CIs estimated using the Greenwood formula.
Source: Clinical Study Report for Brukinsa.7
Figure 3: Kaplan–Meier Plot of IRC-Assessed PFS (Cohort 1: MYD88L265P) (ITT Analysis Set)
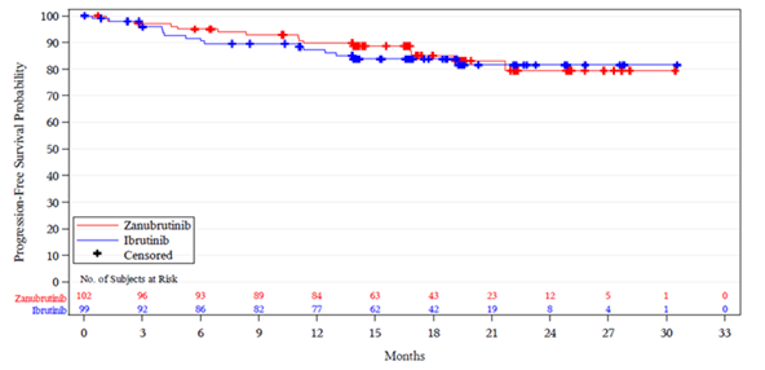
IRC = Independent Review Committee; ITT = intention to treat; no. = number.
Source: Clinical Study Report for Brukinsa.7
Figure 4: Kaplan–Meier Plot of IRC-Assessed PFS (Cohort 2: MYD88WT) (Efficacy Analysis Set)
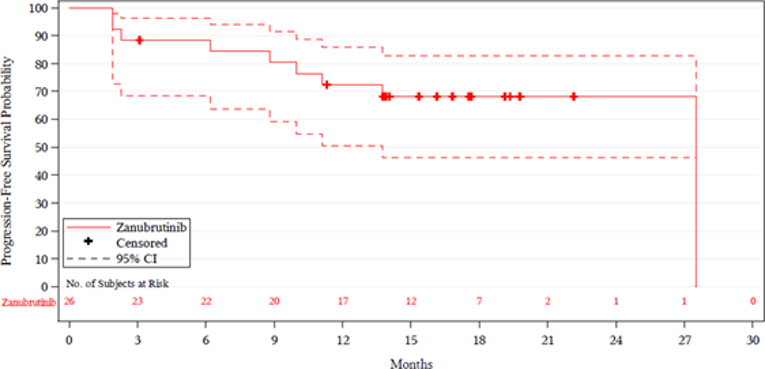
CI = confidence interval; IRC = Independent Review Committee; no. = number.
Source: Clinical Study Report for Brukinsa.7
Overall Survival
Cohort 1: MYD88L265P
In cohort 1, the median OS was not reached in either treatment arm (Table 15 and Figure 5). By the data cut-off date, 8 deaths had occurred in the ibrutinib arm, and 6 deaths had occurred in the zanubrutinib arm. The event-free rates for patients in the ibrutinib versus zanubrutinib treatment arms were 93.9% (95% CI, 86.8% to 97.2%) versus 97.0% (95% CI, 90.9% to 99.0%) at 12 months, and 92.8% (95% CI, 85.5% to 96.5%) versus 97.0% (95% CI, 90.9% to 99.0%) at 18 months.
Cohort 2: MYD88WT
In cohort 2, the median OS was not reached (Table 16 and Figure 6). The event-free rates were 96.2% (95% CI, 75.7% to 99.4%) at 12 months and 87.8% (95% CI, 66.7% to 95.9%) at 18 months.
Table 15: Overall Survival (Cohort 1: MYD88L265P) (Intention-to-Treat Analysis Set)
Response category | Unfit, treatment-naive | Relapsed/refractory | Overall | |||
|---|---|---|---|---|---|---|
Ibrutinib (N = 18) | Zanubrutinib (N = 19) | Ibrutinib (N = 81) | Zanubrutinib (N = 83) | Ibrutinib (N = 99) | Zanubrutinib (N = 102) | |
Events, n (%) | 0 (0.0) | 3 (15.8) | 8 (9.9) | 3 (3.6) | 8 (8.1) | 6 (5.9) |
Death | 0 (0.0) | 3 (15.8) | 8 (9.9) | 3 (3.6) | 8 (8.1) | 6 (5.9) |
Follow-up (months)a | ||||||
Median (95% CI) | 21.1 (19.3 to 22.9) | 22.4 (19.4 to 23.8) | 19.7 (17.9 to 20.4) | 18.7 (17.1 to 20.3) | 19.7 (18.7 to 20.9) | 19.5 (18.1 to 20.8) |
Min, max | 1.6, 31.1 | 4.8, 31.2 | 0.5, 30.0 | 0.4, 28.7 | 0.5, 31.1 | 0.4, 31.2 |
OS (months)b | ||||||
Median (95% CI) | NE (NE to NE) | NE (NE to NE) | NE (NE to NE) | NE (NE to NE) | NE (NE to NE) | NE (NE to NE) |
Event-free rate at, % (95% CI)c | ||||||
12 months | 100.0 (NE to NE) | 89.5 (64.1 to 97.3) | 92.5 (84.1 to 96.6) | 98.8 (91.6 to 99.8) | 93.9 (86.8 to 97.2) | 97.0 (90.9 to 99.0) |
18 months | 100.0 (NE to NE) | 89.5 (64.1 to 97.3) | 91.3 (82.6 to 95.7) | 98.8 (91.6 to 99.8) | 92.8 (85.5 to 96.5) | 97.0 (90.9 to 99.0) |
24 months | 100.0 (NE to NE) | 81.3 (51.3 to 93.8) | 88.8 (78.2 to 94.4) | 91.6 (73.5 to 97.5) | 91.0 (82.5 to 95.5) | 89.5 (76.4 to 95.5) |
CI = confidence interval; min = minimum; max = maximum; NE = not estimable; OS = overall survival.
Note: Percentages are based on N.
aMedian follow-up time is estimated by the reverse Kaplan–Meier method.
bMedians and other quartiles are estimated by Kaplan–Meier method with 95% CIs estimated using the method of Brookmeyer and Crowley.
cEvent-free rates are estimated by Kaplan–Meier method with 95% CIs estimated using the Greenwood’s formula.
Source: Clinical Study Report for Brukinsa.7
Table 16: Overall Survival (Cohort 2: MYD88WT) (Efficacy Analysis Set)
Response category | Unfit, treatment-naive (N = 5) | Relapsed/refractory (N = 21) | Overall (N = 26) |
|---|---|---|---|
Zanubrutinib (N = 26) | |||
Events, n (%) | 1 (20.0) | 2 (9.5) | 3 (11.5) |
Death | 1 (20.0) | 2 (9.5) | 3 (11.5) |
Follow-up (months)a | |||
Median (95% CI) | 19.6 (15.3 to 21.7) | 16.4 (15.3 to 18.5) | 16.5 (15.7 to 18.7) |
OS (months)b | |||
Median (95% CI) | NE (13.7 to NE) | NE (NE to NE) | NE (NE to NE) |
Event-free rate at, % (95% CI)c | |||
12 months | 100.0 (NE to NE) | 95.2 (70.7 to 99.3) | 96.2 (75.7 to 99.4) |
18 months | 80.0 (20.4 to 96.9) | 89.9 (65.3 to 97.4) | 87.8 (66.7 to 95.9) |
24 months | NE (NE to NE) | 89.9 (65.3 to 97.4) | 87.8 (66.7 to 95.9) |
CI = confidence interval; NE = not estimable; OS = overall survival.
Note: Percentages are based on N.
aMedian follow-up time is estimated using the reverse Kaplan–Meier method.
bMedians and other quartiles are estimated using the Kaplan–Meier method, with 95% CIs estimated using the Brookmeyer and Crowley method.
cEvent-free rates are estimated using the Kaplan–Meier method, with 95% CIs estimated using the Greenwood formula.
Source: Clinical Study Report for Brukinsa.7
Figure 5: Kaplan–Meier Plot of Overall Survival (Cohort 1: MYD88L265P) (ITT Analysis Set)
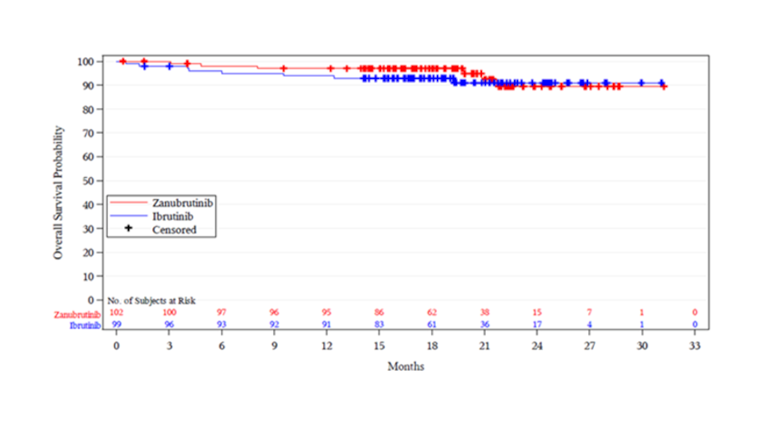
ITT = intention to treat; no. = number.
Source: Clinical Study Report for Brukinsa.7
Figure 6: Kaplan–Meier Plot of Overall Survival (Cohort 2: MYD88WT) (Efficacy Analysis Set)
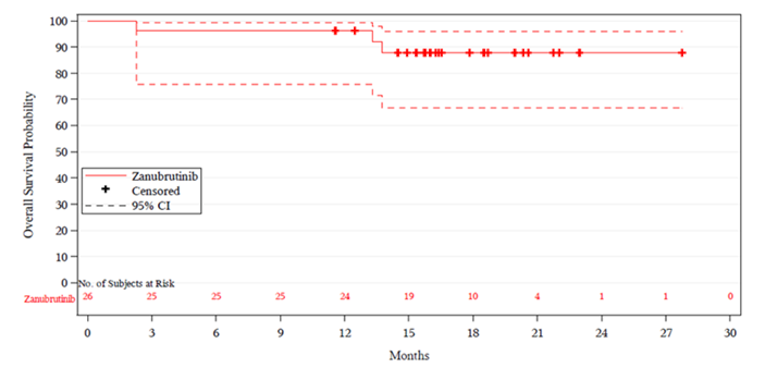
CI = confidence interval; no. = number.
Source: Clinical Study Report for Brukinsa.7
Overall Response
Cohort 1: MYD88L265P
No patients achieved a CR. In cohort 1, the IRC-assessed VGPR or CR rates in the ibrutinib and zanubrutinib arms were 19.2% (95% CI, 12.0% to 28.3%) and 28.4% (95% CI, 19.9% to 38.2%), respectively. In R/R patients, the IRC-assessed VGPR or CR rate was 19.8% (95% CI, 11.7% to 30.1%) in the ibrutinib arm and 28.9% (95% CI, 19.5% to 39.9%) in the zanubrutinib arm (P = 0.11). In unfit, treatment-naive patients, the IRC-assessed VGPR or CR rate was 16.7% (95% CI to 3.6%, 41.4%) in the ibrutinib arm and 26.3% (95% CI, 9.1% to 51.2%) in the zanubrutinib arm (Table 17).
A post hoc analysis showed that noninferiority was demonstrated under the noninferiority margin of –4.5%, which was determined before the unblinded analysis being performed. The lower bound of the 95% CI for the VGPR or CR rate difference assessed by the IRC was –2.5% in the R/R analysis set in cohort 1. If the study end point was not changed from noninferiority of VGPR or CR to superiority of VGPR or CR, noninferiority of VGPR or CR in zanubrutinib-treated patients compared to ibrutinib would have been met.
Cohort 2: MYD88WT
In cohort 2, no patients achieved a CR. The IRC-assessed VGPR or CR rate was 26.9% (95% CI, 11.6% to 47.8%) (Table 18).
Table 17: Analysis of Disease Response by IRC (Cohort 1: MYD88L265P) (ITT Analysis Set)
Response category | Unfit, treatment-naive | Relapsed/refractory | Overall | |||
|---|---|---|---|---|---|---|
Ibrutinib (N = 18) | Zanubrutinib (N = 19) | Ibrutinib (N = 81) | Zanubrutinib (N = 83) | Ibrutinib (N = 99) | Zanubrutinib (N = 102) | |
Best overall response, n (%) | ||||||
CR | 0 (0.0) | 0 (0.0) | 0 (0.0) | 0 (0.0) | 0 (0.0) | 0 (0.0) |
VGPR | 3 (16.7) | 5 (26.3) | 16 (19.8) | 24 (28.9) | 19 (19.2) | 29 (28.4) |
PR | 9 (50.0) | 9 (47.4) | 49 (60.5) | 41 (49.4) | 58 (58.6) | 50 (49.0) |
MR | 4 (22.2) | 4 (21.1) | 11 (13.6) | 13 (15.7) | 15 (15.2) | 17 (16.7) |
Stable disease | 1 (5.6) | 0 (0.0) | 2 (2.5) | 3 (3.6) | 3 (3.0) | 3 (2.9) |
PD | 0 (0.0) | 1 (5.3) | 2 (2.5) | 1 (1.2) | 2 (2.0) | 2 (2.0) |
NAa | 0 (0.0) | 0 (0.0) | 0 (0.0) | 0 (0.0) | 0 (0.0) | 0 (0.0) |
NEb | 1 (5.6) | 0 (0.0) | 1 (1.2) | 0 (0.0) | 2 (2.0) | 0 (0.0) |
Discontinued before first assessmentc | 0 (0.0) | 0 (0.0) | 0 (0.0) | 1 (1.2) | 0 (0.0) | 1 (1.0) |
VGPR or CR rate, n (%) | 3 (16.7) | 5 (26.3) | 16 (19.8) | 24 (28.9) | 19 (19.2) | 29 (28.4) |
95% CId | (3.6 to 41.4) | (9.1 to 51.2) | (11.7 to 30.1) | (19.5 to 39.9) | (12.0 to 28.3) | (19.9 to 38.2) |
Risk difference, %e | NE | 10.7 | 10.2 | |||
95% CI | (–2.5 to 23.9) | (–1.5 to 22.0) | ||||
P value f | 0.1160 | 0.0921g | ||||
MRR (PR or better), n (%) | 12 (66.7) | 14 (73.7) | 65 (80.2) | 65 (78.3) | 77 (77.8) | 79 (77.5) |
95% CId | (41.0 to 86.7) | (48.8 to 90.9) | (69.9 to 88.3) | (67.9 to 86.6) | (68.3 to 85.5) | (68.1 to 85.1) |
Risk difference, %e | NE | –3.5 | –0.5 | |||
95% CI | (–16.0 to 9.0) | (–12.2 to 11.1) | ||||
ORR (MR or better), n (%) | 16 (88.9) | 18 (94.7) | 76 (93.8) | 78 (94.0) | 92 (92.9) | 96 (94.1) |
95% CId | (65.3 to 98.6) | (74.0 to 99.9) | (86.2 to 98.0) | (86.5 to 98.0) | (86.0 to 97.1) | (87.6 to 97.8) |
CR = complete response; CI = confidence interval; IRC = Independent Review Committee; IRT = interactive response technology; ITT = intention to treat; MR = minor response; MRR = major response rate; NA = not applicable; NE = not evaluable; ORR = overall response rate; PD = progressive disease; PR = partial response; VGPR = very good partial response.
aIncludes patients whose only overall tumour response available is PD unconfirmed.
bIncludes NE, unknown, and disease flare.
cIncludes patients who discontinued study before the first response assessment.
d95% CI is calculated using the Clopper-Pearson method.
eMantel-Haenszel common risk difference with the 95% CI calculated using a normal approximation and Sato’s standard error stratified by the stratification factors per IRT (strata CXCR4WT and unknown are combined) and age group (≤ 65 and > 65 years). Ibrutinib is the reference group.
fBased on Cochran-Mantel-Haenszel test stratified by the stratification factors per IRT (strata CXCR4WT and unknown are combined) and age group (≤ 65 and 65 years). The P value is 2-sided.
gSignificance testing for this end point was conducted after the failed primary end point (i.e., VGPR or CR in the relapsed/refractory patients). Thus, this P value cannot be interpreted for inference.
Source: Clinical Study Report for Brukinsa.7
Table 18: Analysis of Disease Response by IRC (Cohort 2: MYD88WT) (Efficacy Analysis Set)
Response category | Unfit, treatment-naive (N = 5) | Relapsed/refractory (N = 21) | Overall (N = 26) |
|---|---|---|---|
Zanubrutinib (N = 26) | |||
Best overall response, n (%) | |||
CR | 0 (0.0) | 0 (0.0) | 0 (0.0) |
VGPR | 1 (20.0) | 6 (28.6) | 7 (26.9) |
PR | 1 (20.0) | 5 (23.8) | 6 (23.1) |
MR | 2 (40.0) | 6 (28.6) | 8 (30.8) |
Stable disease | 1 (20.0) | 3 (14.3) | 4 (15.4) |
PD | 0 (0.0) | 1 (4.8) | 1 (3.8) |
NAa | 0 (0.0) | 0 (0.0) | 0 (0.0) |
NEb | 0 (0.0) | 0 (0.0) | 0 (0.0) |
Discontinued before first assessmentc | 0 (0.0) | 0 (0.0) | 0 (0.0) |
VGPR or CR rate, n (%) | 1 (20.0) | 6 (28.6) | 7 (26.9) |
95% CId | (0.5 to 71.6) | (11.3 to 52.2) | (11.6 to 47.8) |
MRR (PR or better), n (%) | 2 (40.0) | 11 (52.4) | 13 (50.0) |
95% CId | (5.3 to 85.3) | (29.8 to 74.3) | (29.9 to 70.1) |
ORR (MR or better), n (%) | 4 (80.0) | 17 (81.0) | 21 (80.8) |
95% CId | (28.4 to 99.5) | (58.1 to 94.6) | (60.6 to 93.4) |
CI = confidence interval; CR = complete response; IRC = Independent Review Committee; MR = minor response; MRR = major response rate; NA = not applicable; NE = not evaluable; ORR = overall response rate; PD = progressive disease; PR = partial response; VGPR = very good partial response.
Note: Cohort 2 includes patients with wild-type and unknown MYD88. Percentages are based on N.
aIncludes patients whose only overall tumour response available is PD unconfirmed.
bIncludes NE, unknown, and disease flare.
cIncludes patients who discontinued study before the first response assessment.
d95% CI is calculated using the Clopper-Pearson method.
Source: Clinical Study Report for Brukinsa.7
Duration of Response
Cohort 1: MYD88L265P
In cohort 1, the median durations of CR or VGPR and MRR had not been reached overall or for R/R patients in either treatment arm who achieved a response to study treatment. Four events occurred in patients with VGPR or CR in the ibrutinib arm, and 1 event occurred in patients with VGPR or CR in the zanubrutinib arm. Among patients who achieved a major response, 9 events occurred in the ibrutinib arm, and 6 events occurred in the zanubrutinib arm. The event-free rates at 12 months and 18 months for patients in the ibrutinib arm who achieved a major response were 87.9% (95% CI, 77.0% to 93.8%) and 87.9% (95% CI, 77.0% to 93.8%), respectively. For those in the zanubrutinib arm, the event-free rates at 12 months and 18 months were 94.4% (95% CI, 85.8% to 97.9%) and 85.2% (71.7% to 92.6%), respectively (Table 19).
Cohort 2: MYD88WT
In cohort 2, in patients who achieved a response to study treatment, the median duration of major response had not been reached. The event-free rates at 12 months and 18 months for patients who achieved a major response were 62.3% (95% CI, 27.7% to 84.0%) and 62.3% (95% CI, 27.7% to 84.0%), respectively (Table 20).
Table 19: Duration of Response (Cohort 1: MYD88L265P) (Intention-to-Treat Analysis Set)
Response category | Unfit, treatment-naive | Relapsed/refractory | Overall | |||
|---|---|---|---|---|---|---|
Ibrutinib (N = 18) | Zanubrutinib (N = 19) | Ibrutinib (N = 81) | Zanubrutinib (N = 83) | Ibrutinib (N = 99) | Zanubrutinib (N = 102) | |
Number of responders (CR or VGPR) | 3 | 5 | 16 | 24 | 19 | 29 |
Events, n (%) | 0 (0.0) | 0 (0.0) | 4 (25.0) | 1 (4.2) | 4 (21.1) | 1 (3.4) |
Progressive disease | 0 (0.0) | 0 (0.0) | 3 (18.8) | 1 (4.2) | 3 (15.8) | 1 (3.4) |
Death | 0 (0.0) | 0 (0.0) | 1 (6.3) | 0 (0.0) | 1 (5.3) | 0 (0.0) |
Censored, n (%) | 3 (100.0) | 5 (100.0) | 12 (75.0) | 23 (95.8) | 15 (78.9) | 28 (96.6) |
No documented progressive disease or death | 3 (100.0) | 5 (100.0) | 12 (75.0) | 22 (91.7) | 15 (78.9) | 27 (93.1) |
No documented progressive disease or death: non-protocol anticancer therapy | 0 (0.0) | 0 (0.0) | 0 (0.0) | 1 (4.2) | 0 (0.0) | 1 (3.4) |
Follow-up time (months)a | ||||||
Median (95% CI) | 0.0 (0.0 to 2.7) | 15.5 (0.0 to 21.8) | 12.0 (2.8 to 13.7) | 13.3 (9.2 to 16.6) | 7.7 (2.8 to 12.9) | 13.6 (9.7 to 16.6) |
Duration of CR or VGPR (months)b | ||||||
Median (95% CI) | NE (NE to NE) | NE (NE to NE) | NE (8.0 to NE) | NE (13.8 to NE) | NE (8.0 to NE) | NE (NE to NE) |
Event-free rate at, % (95% CI)c | ||||||
12 months | NE (NE to NE) | 100.0 (NE to NE) | 63.9 (28.7 to 85.2) | 100.0 (NE to NE) | 64.2 (28.8 to 85.4) | 100.0 (NE to NE) |
18 months | NE (NE to NE) | 100.0 (NE to NE) | 63.9 (28.7 to 85.2) | 90.0 (47.3 to 98.5) | 64.2 (28.8 to 85.4) | 92.9 (59.1 to 99.0) |
24 months | NE (NE to NE) | NE (NE to NE) | NE (NE to NE) | NE (NE to NE) | NE (NE to NE) | NE (NE to NE) |
Number of responders (PR or better) | 12 | 14 | 65 | 65 | 77 | 79 |
Events, n (%) | 0 (0.0) | 2 (14.3) | 9 (13.8) | 6 (9.2) | 9 (11.7) | 8 (10.1) |
Progressive disease | 0 (0.0) | 2 (14.3) | 6 (9.2) | 5 (7.7) | 6 (7.8) | 7 (8.9) |
Death | 0 (0.0) | 0 (0.0) | 3 (4.6) | 1 (1.5) | 3 (3.9) | 1 (1.3) |
Censored, n (%) | 12 (100.0) | 12 (85.7) | 56 (86.2) | 59 (90.8) | 68 (88.3) | 71 (89.9) |
No documented progressive disease or death | 12 (100.0) | 11 (78.6) | 56 (86.2) | 58 (89.2) | 68 (88.3) | 69 (87.3) |
No documented progressive disease or death: non-protocol anticancer therapy | 0 (0.0) | 0 (0.0) | 0 (0.0) | 1 (1.5) | 0 (0.0) | 1 (1.3) |
No documented progressive disease or death: withdrew consent or lost to follow-up | 0 (0.0) | 1 (7.1) | 0 (0.0) | 0 (0.0) | 0 (0.0) | 1 (1.3) |
Follow-up time (months)a | ||||||
Median (95% CI) | 16.5 (6.5 to 21.2) | 16.8 (2.7 to 23.0) | 13.8 (12.0 to 15.7) | 14.4 (13.1 to 16.6) | 13.9 (12.3 to 15.7) | 14.8 (13.8 to 16.8) |
Duration of major response (months)b | ||||||
Median (95% CI) | NE (NE to NE) | NE (16.3 to NE) | NE (NE to NE) | NE (NE to NE) | NE (NE to NE) | NE (NE to NE) |
Event-free rate at, % (95% CI)c | ||||||
12 months | 100.0 (NE to NE) | 90.9 (50.8 to 98.7) | 85.6 (73.1 to 92.6) | 95.1 (85.5 to 98.4) | 87.9 (77.0 to 93.8) | 94.4 (85.8 to 97.9) |
18 months | 100.0 (NE to NE) | 79.5 (39.3 to 94.5) | 85.6 (73.1 to 92.6) | 87.0 (72.5 to 94.1) | 87.9 (77.0 to 93.8) | 85.2 (71.7 to 92.6) |
24 months | 100.0 (NE to NE) | 79.5 (39.3 to 94.5) | 77.1 (52.8 to 89.9) | 87.0 (72.5 to 94.1) | 81.6 (62.4 to 91.6) | 85.2 (71.7 to 92.6) |
CI = confidence interval; CR = complete response; NE = not estimable; PR = partial response; VGPR = very good partial response.
Notes: Cohort 1 includes patients with activating mutations in MYD88. Percentages are based on number of responders.
aEstimated using the reverse Kaplan–Meier method.
bEstimated using the Kaplan–Meier method, with 95% CIs estimated using the Brookmeyer and Crowley method.
cEstimated using the Kaplan–Meier method, with 95% CIs estimated using the Greenwood formula.
Source: Clinical Study Report for Brukinsa.7
Table 20: Duration of Response (Cohort 2: MYD88WT) (Efficacy Analysis Set)
Response category | Unfit, treatment-naive (N = 5) | Relapsed/refractory (N = 21) | Overall (N = 26) |
|---|---|---|---|
Zanubrutinib (N = 26) | |||
Number of responders (CR or VGPR) | 1 | 6 | 7 |
Events, n (%) | 1 (100.0) | 0 (0.0) | 1 (14.3) |
Death | 1 (100.0) | 0 (0.0) | 1 (14.3) |
Censored, n (%) | 0 (0.0) | 6 (100.0) | 6 (85.7) |
No documented progressive disease or death | 0 (0.0) | 6 (100.0) | 6 (85.7) |
Follow-up time (months)a | |||
Median (95% CI) | NE (NE to NE) | 7.2 (0.0 to 19.3) | 8.5 (0.0 to 19.3) |
Duration of CR or VGPR (months)b | |||
Median (95% CI) | 8.1 (NE to NE) | NE (NE to NE) | NE (8.1 to NE) |
Event-free rate at, % (95% CI)c | |||
12 months | 0.0 (NE to NE) | 100.0 (NE to NE) | 75.0 (12.8 to 96.1) |
18 months | 0.0 (NE to NE) | 100.0 (NE to NE) | 75.0 (12.8 to 96.1) |
24 months | 0.0 (NE to NE) | NE (NE to NE) | NE (NE to NE) |
Number of responders (PR or better) | 2 | 11 | 13 |
Events, n (%) | 2 (100.0) | 2 (18.2) | 4 (30.8) |
Progressive disease | 1 (50.0) | 2 (18.2) | 3 (23.1) |
Death | 1 (50.0) | 0 (0.0) | 1 (7.7) |
Censored, n (%) | 0 (0.0) | 9 (81.8) | 9 (69.2) |
No documented progressive disease or death | 0 (0.0) | 9 (81.8) | 9 (69.2) |
Follow-up time (months)a | |||
Median (95% CI) | NE (NE to NE) | 12.0 (0.0 to 17.0) | 12.0 (8.5 to 17.0) |
Duration of major response (months)b | |||
Median (95% CI) | 8.6 (6.3 to 10.9) | NE (1.4 to NE) | NE (6.3 to NE) |
Event-free rate at, % (95% CI)c | |||
12 months | 0.0 (NE to NE) | 77.8 (36.5 to 93.9) | 62.3 (27.7 to 84.0) |
18 months | 0.0 (NE to NE) | 77.8 (36.5 to 93.9) | 62.3 (27.7 to 84.0) |
24 months | 0.0 (NE to NE) | NE (NE to NE) | NE (NE to NE) |
CI = confidence interval; CR = complete response; NE = not estimable; PR = partial response; VGPR = very good partial response.
Note: Percentages are based on number of responders.
aEstimated using the reverse Kaplan–Meier method.
bEstimated using the Kaplan–Meier method, with 95% CIs estimated using the Brookmeyer and Crowley method.
cEstimated using the Kaplan–Meier method, with 95% CIs estimated using the Greenwood formula.
Source: Clinical Study Report for Brukinsa.7
Health-Related Quality of Life
In cohort 1, HRQoL measures on average increased numerically during the trial observation period in both treatment arms (Figure 7 and Figure 8). The LS mean for the EORTC QLQ-C30 global health status/QoL was 69.0 (standard error = 2.3) in the ibrutinib arm and 68.3 (standard error = 2.2) in the zanubrutinib arm (difference = –0.69; 95% CI, –4.95 to 3.57). The mean change in EQ-5D score from baseline was 9.0 (SD = 17.90) in the ibrutinib arm and 13.7 (SD = 14.66) in the zanubrutinib arm (at cycle 13, day 1).
Figure 7: EORTC QLQ-C30 Global Health Status: Change From Baseline Over Time (Cohort 1: MYD88L265P) (ITT Analysis Set)
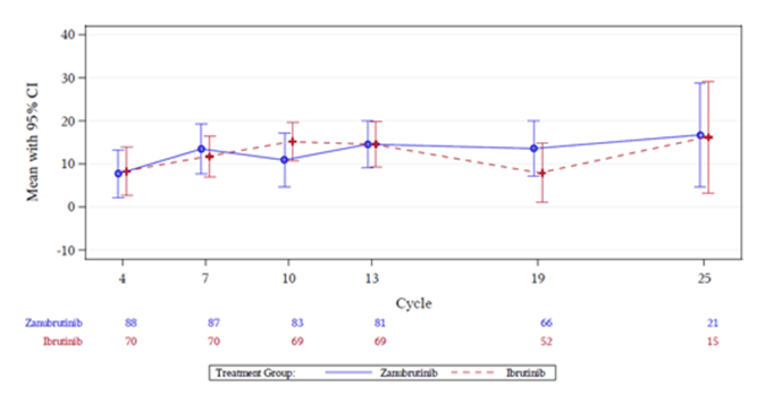
CI = confidence interval; EORTC QLQ-C30 = European Organisation for Research and Treatment of Cancer Quality of Life Questionnaire Core 30; ITT = intention to treat.
Note: A high score for global health status represents a high quality of life.
Source: Clinical Study Report for Brukinsa.7
Figure 8: EQ-5D Score — Change From Baseline Over Time (Cohort 1: MYD88L265P) (ITT Analysis Set)
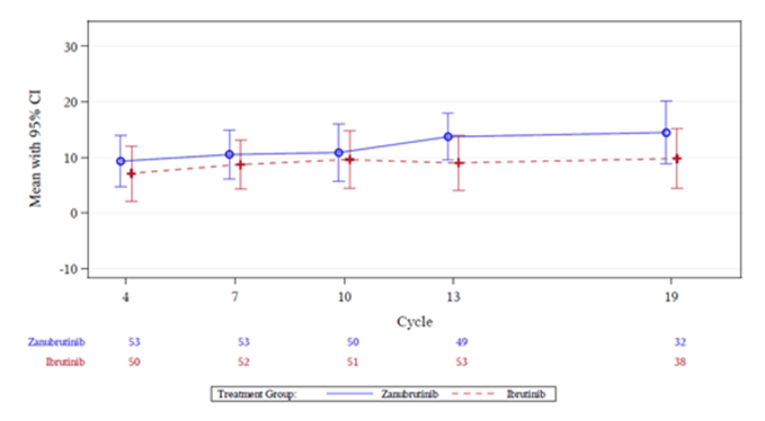
CI = confidence interval; EQ-5D = EuroQol 5-Dimensions; ITT = intention to treat.
Source: Clinical Study Report for Brukinsa.7
Cancer-Related Symptoms
Cohort 1: MYD88L265P
In cohort 1, the proportions of patients with resolution of all treatment-precipitating symptoms in the ibrutinib and zanubrutinib treatment arms were 68.0% and 68.8%, respectively. Most patients had resolution of any treatment-precipitating symptoms (92.8% and 94.8%, respectively). The proportions of patients in the zanubrutinib versus ibrutinib treatment arm with WM-related symptoms at baseline who achieved a resolution were 79.3% versus 86.0% for fatigue, 95.8% versus 87.5% for hemoglobin of less than or equal to 10 g/dL, 97.1% versus 96.2% for B symptoms, 96.3% versus 96.3% for hyperviscosity, 58.3% versus 47.6% for peripheral neuropathy, 83.3% versus 44.4% for amyloidosis, and 75.0% versus 58.3% for and platelet count of less than 100 × 109/L. In R/R patients, 64.6% and 70.5% of patients in the ibrutinib and zanubrutinib treatment arms, respectively, had resolution of all treatment-precipitating symptoms.
Cohort 2: MYD88WT
In cohort 2, 68.0% of patients overall had resolution of all treatment-precipitating symptoms. Most patients had resolution of any treatment-precipitating symptoms (92.0%). Overall, resolution of fatigue, hyperviscosity, and peripheral neuropathy due to WM were obtained in 86.7%, 83.3%, and 33.3% of patients, respectively.
Health Care Resource Utilization
In cohort 1, 23.9% of patients had emergency room and hospital admissions. Planned admissions for 17.9% of patients overall were for reasons that are expected and commonly encountered in elderly patients with WM. A total of 220 hospital visits were reported with a mean duration of 6.4 days (5.8 days and 6.9 days for the ibrutinib-treated and zanubrutinib-treated patients, respectively) (Table 21). Seventeen patients in the ibrutinib arm and 19 patients in the zanubrutinib arm had 35 and 43 planned admissions, respectively. (Two events of granulocyte colony-stimulating factor self-administration for zanubrutinib were not considered admissions.) Of these planned admissions, 20 (57%) for patients in the ibrutinib arm and 31 (72%) for patients in the zanubrutinib arm resulted in discharge on the day of admission. The remaining planned admissions were generally short and/or in line with the reason for admission, such as for knee replacement surgery and rehab. Forty-three admissions (55%) were for (or, on 1 occasion, involved) red blood cell transfusions, platelet transfusions, growth factor administration, and/or IV immunoglobulin infusion. Six admissions (8%) can be considered disease-related (such as for plasmapheresis or bone marrow and trephine), and 30 admissions (38%) (1 involving a platelet transfusion) were for other reasons that can be considered expected and typical for elderly patients in general, such as bladder neoplasm or total hip arthroplasty.
Table 21: Summary of Medical Resource Utilization (Cohort 1: MYD88L265P) (ITT Analysis Set)
Type of visita | Unfit, treatment-naive | Relapsed/refractory | Overall | ||||||
|---|---|---|---|---|---|---|---|---|---|
Ibrutinib (N = 18) | Zanubrutinib (N = 19) | Total (N = 37) | Ibrutinib (N = 81) | Zanubrutinib (N = 83) | Total (N = 164) | Ibrutinib (N = 99) | Zanubrutinib (N = 102) | Total (N = 201) | |
Emergency room and hospital admission, n (%) | 7 (38.9) | 6 (31.6) | 13 (35.1) | 17 (21.0) | 18 (21.7) | 35 (21.3) | 24 (24.2) | 24 (23.5) | 48 (23.9) |
Planned hospital admission, n (%) | 4 (22.2) | 6 (31.6) | 10 (27.0) | 13 (16.0) | 13 (15.7) | 26 (15.9) | 17 (17.2) | 19 (18.6) | 36 (17.9) |
Unplanned hospital visit (without emergency room), n (%) | 4 (22.2) | 4 (21.1) | 8 (21.6) | 9 (11.1) | 14 (16.9) | 23 (14.0) | 13 (13.1) | 18 (17.6) | 31 (15.4) |
Emergency room only, n (%) | 0 (0.0) | 2 (10.5) | 2 (5.4) | 8 (9.9) | 3 (3.6) | 11 (6.7) | 8 (8.1) | 5 (4.9) | 13 (6.5) |
Emergency room and short-stay observation visit, n (%) | 0 (0.0) | 2 (10.5) | 2 (5.4) | 3 (3.7) | 2 (2.4) | 5 (3.0) | 3 (3.0) | 4 (3.9) | 7 (3.5) |
Patients with at least 1 hospital visit, n (%) | 9 (50.0) | 12 (63.2) | 21 (56.8) | 34 (42.0) | 37 (44.6) | 71 (43.3) | 43 (43.4) | 49 (48.0) | 92 (45.8) |
Total number of hospital visits, n | 23 | 28 | 51 | 81 | 88 | 169 | 104 | 116 | 220 |
Duration of hospital stay (days), mean (SD) | 7.0 (7.91) | 8.4 (10.24) | 7.8 (9.20) | 5.5 (9.23) | 6.4 (9.43) | 6.0 (9.32) | 5.8 (8.94) | 6.9 (9.62) | 6.4 (9.30) |
ITT = intention to treat.
aType of visits are not mutually exclusive. Multiple visits within the same type are counted once per patient.
Note: The summary includes hospitalizations that started after randomization.
Source: Clinical Study Report for Brukinsa.7
Subgroups
Results of subgroup analyses were consistent with the primary analysis for VGPR or CR. The proportions of patients in cohort 1 who achieved a VGPR or CR were similar in each treatment arm for the subgroups of interest identified in the systematic review protocol (Table 22).
Table 22: VGPR or CR Rate by Subgroup (Cohort 1: MYD88L265P) (ITT Analysis Set)
Subgroup | Response/patients | ||
|---|---|---|---|
Ibrutinib | Zanubrutinib | Risk difference (95% CI),a % | |
Baseline CXCR4 mutation status by central lab | |||
WHIM | 1/8 | 1/11 | –3.4 (–31.9 to 25.1) |
WT or unknown | 18/91 | 28/91 | 11.0 (–1.5 to 23.5) |
Baseline IgM | |||
< 40 g/L | 14/60 | 19/66 | 5.5 (–9.8 to 20.7) |
≥ 40 g/L | 5/38 | 10/36 | 14.6 (–3.5 to 32.8) |
Baseline hemoglobin | |||
≤ 110 g/L | 9/53 | 22/67 | 15.9 (0.7 to 31.0) |
> 100 g/L | 10/46 | 7/35 | –1.7 (–19.6 to 16.1) |
Prior line(s) of therapy | |||
0 | 3/18 | 5/19 | 9.6 (–16.6 to 35.9) |
1 to 3 | 13/74 | 22/76 | 11.4 (–2.0 to 24.8) |
> 3 | 3/7 | 2/7 | –14.3 (–63.9 to 35.4) |
CR = complete response; IgM = immunoglobulin M; ITT = intention to treat; VGPR = very good partial response; WHIM = warts, hypogammaglobulinemia, infections, and myelokathexis; WT = wild type.
aUnstratified rate difference and 95% CI.
Source: Clinical Study Report for Brukinsa.7
Harms
In cohort 1, nearly all patients (97 [99.0%] of ibrutinib-treated patients and 98 [97.0%] of zanubrutinib-treated patients) had at least 1 AE or TEAE; AEs greater than or equal to grade 3 were reported in 62 patients (63.3%) and 59 patients (58.4%) in the ibrutinib and zanubrutinib treatment arms, respectively (Table 22). Among all zanubrutinib-treated patients (cohort 1 and cohort 2), 122 (94.6%) had at least 1 AE, including 77 patients (59.7%) who had AEs greater than or equal to grade 3 (Table 24).
Serious Adverse Events
In cohort 1, SAEs were reported in 40 patients (40.8%) the ibrutinib treatment arm and in 40 patients (39.6%) in the zanubrutinib treatment arms (Table 22). The most common SAE in the ibrutinib treatment arm was pneumonia (9 patients [9.2%]), followed by pyrexia and sepsis (each reported by 3 patients [3.1%]). The most common SAEs in the zanubrutinib treatment arm were febrile neutropenia, influenza, and neutropenia (each reported by 3 patients [3.0%]). Among all zanubrutinib-treated patients, pneumonia was more common in cohort 2 compared with cohort 1 (10.7% versus 1.0%). Of note, cohort 2 had an older patient population and a smaller sample size than cohort 1 (Table 23).
Withdrawals Due to Adverse Events
In cohort 1, 9 patients (9.2%) in the ibrutinib arm and 4 patients (4.0%) in the zanubrutinib treatment arm had AEs leading to study treatment discontinuation. Five patients (5.1%) in the ibrutinib treatment arm had AEs leading to study treatment discontinuation that were assessed as related to ibrutinib (1 each of drug-induced liver injury, hepatitis, interstitial lung disease, pneumonia, and pneumonitis); and 2 patients (2.0%) in the zanubrutinib treatment arm had AEs leading to study treatment discontinuation that were assessed as related to zanubrutinib (1 each of neutropenia and cardiomegaly). In cohort 2, 2 patients (7.1%) had AEs leading to study treatment discontinuation that were assessed as related to zanubrutinib treatment (1 each of subdural hemorrhage and diarrhea).
Deaths
In cohort 1, a total of 7 patients (7.1%) in the ibrutinib treatment arm and 6 patients (5.9%) in the zanubrutinib treatment arm died (as recorded in the death electronic case report form) at the time of the data cut-off date. Five patients (5.1%) in the ibrutinib arm and 1 patient (1.0%) in the zanubrutinib arm died within 30 days of the last dose of study drug. PD was the most common cause of death in the zanubrutinib treatment arm, reported in 3 patients (3.0%). Deaths due to AEs occurred in 4 ibrutinib-treated patients (4.1%) and 1 zanubrutinib-treated patient (1.0%); all 5 deaths due to AEs occurred within 30 days of the last dose date. The 4 deaths due to AEs in the ibrutinib arm were attributed to bacterial sepsis, acute cardiac failure, sepsis, and, in 1 case, unknown cause; none of these were judged to be related to ibrutinib treatment. The 1 death due to an AE in the zanubrutinib arm was assessed as related to zanubrutinib treatment. The death occurred in an |||||||||||||||||| patient with R/R WM and was from cardiomegaly approximately 3 months after initiating zanubrutinib. The patient was reported to have had a history of hypertension, aortic stenosis, chronic inflammatory demyelinating polyneuropathy, and multiple plasmapheresis.
Table 23: Overview of Adverse Events (Cohort 1: MYD88L265P) (Safety Analysis Set)
Adverse events | Unfit, treatment-naive | Relapsed/refractory | Overall | |||
|---|---|---|---|---|---|---|
Ibrutinib (N = 18) n (%) | Zanubrutinib (N = 19) n (%) | Ibrutinib (N = 80) n (%) | Zanubrutinib (N = 82) n (%) | Ibrutinib (N = 98) n (%) | Zanubrutinib (N = 101) n (%) | |
Patients with at least 1 AE or TEAE | 18 (100.0) | 19 (100.0) | 79 (98.8) | 79 (96.3) | 97 (99.0) | 98 (97.0) |
Grade 3 or highera | 12 (66.7) | 14 (73.7) | 50 (62.5) | 45 (54.9) | 62 (63.3) | 59 (58.4) |
Serious | 9 (50.0) | 10 (52.6) | 31 (38.8) | 30 (36.6) | 40 (40.8) | 40 (39.6) |
Leading to death | 0 (0.0) | 0 (0.0) | 4 (5.0) | 1 (1.2) | 4 (4.1) | 1 (1.0) |
Leading to treatment discontinuation | 3 (16.7) | 0 (0.0) | 6 (7.5) | 4 (4.9) | 9 (9.2) | 4 (4.0) |
Leading to dose reduction | 4 (22.2)c | 2 (10.5) | 19 (23.8)b | 12 (14.6) | 23 (23.5)b | 14 (13.9) |
Leading to dose hold | 11 (61.1) | 11 (57.9) | 44 (55.0) | 36 (43.9) | 55 (56.1) | 47 (46.5) |
Patients with at least 1 treatment-related AEb | 15 (83.3) | 15 (78.9) | 69 (86.3) | 65 (79.3) | 84 (85.7) | 80 (79.2) |
AE = adverse event; TEAE = treatment-emergent adverse event.
aAE grades are evaluated based on the National Cancer Institute Common Terminology Criteria for Adverse Events (Version 4.03).
bTreatment-related AEs are defined as related or with missing relationship.
cIncludes 2 patients who had a temporary dose reduction of ibrutinib due to AE by investigator decision (1 treatment-naive) or by patient’s own decision (1 relapsed/refractory).
Source: Clinical Study Report for Brukinsa.7
Table 24: Overview of Adverse Events (All Zanubrutinib Patients) (Safety Analysis Set)
Adverse events | Cohort 1 (MYD88L265P) (N = 101) n (%) | Cohort 2 (MYD88WT) (N = 28) n (%) | Total (N = 129) n (%) |
|---|---|---|---|
Patients with at least 1 AE or TEAE | 98 (97.0) | 24 (85.7) | 122 (94.6) |
Grade 3 or highera | 59 (58.4) | 18 (64.3) | 77 (59.7) |
Serious | 40 (39.6) | 11 (39.3) | 51 (39.5) |
Leading to death | 1 (1.0) | 0 (0.0) | 1 (0.8) |
Leading to treatment discontinuation | 4 (4.0) | 2 (7.1) | 6 (4.7) |
Leading to dose reduction | 14 (13.9) | 2 (7.1) | 16 (12.4) |
Leading to dose hold | 47 (46.5) | 14 (50.0) | 61 (47.3) |
Patients with at least 1 treatment-related AEb | 80 (79.2) | 22 (78.6) | 102 (79.1) |
AE = adverse event, TEAE = treatment-emergent adverse event.
aAE grades are evaluated based on the National Cancer Institute Common Terminology Criteria for Adverse Events (Version 4.03).
bTreatment-related AEs are defined as related or with missing relationship.
Source: Clinical Study Report for Brukinsa.7
In cohort 1, the most common AEs in the ibrutinib arm were diarrhea (31 patients [31.6%]), upper respiratory tract infection (28 patients [28.6%]), and contusion and muscle spasms (23 patients [23.5%] each). In the zanubrutinib arm, the most common AEs were neutropenia (25 patients [24.8%]), upper respiratory tract infection (24 patients [23.8%]), and diarrhea (21 patients [20.8%]). The following AEs were greater (> 10% difference) in the ibrutinib treatment arm versus the zanubrutinib treatment arm: muscle spasms (23.5% versus 9.9%), atrial fibrillation (14.3% versus 2.0%), diarrhea (31.6% versus 20.8%), contusion (23.5% versus 12.9%), peripheral edema (19.4% versus 8.9%), pneumonia (12.2% versus 2.0%). Neutropenia was observed in a higher proportion of patients in the zanubrutinib arm versus the ibrutinib treatment arm (24.8% versus 12.2%). Among all zanubrutinib-treated patients, the incidences of AEs were generally comparable between cohort 1 and cohort 2. Exceptions (> 10% difference) in cohort 1 included neutropenia (24.8% versus 14.3%, respectively), nausea (14.9% versus 3.6%), and dyspnea (13.9% versus 3.6%); exceptions (> 10% difference) in cohort 2 included pneumonia (2.0% versus 14.3%), respiratory tract infection (5.9% versus 17.9%), and decreased appetite (4.0% versus 14.3%) (Table 25).
Table 25: Adverse Events by System Organ Class and Preferred Term Reported in Greater Than 10% of Patients in Either Overall Arm (Cohort 1: MYD88L265P) (Safety Analysis Set)
System organ class preferred terma | Unfit, treatment-naive | Relapsed/refractory | Overall | |||
|---|---|---|---|---|---|---|
Ibrutinib (N = 18) n (%) | Zanubrutinib (N = 19) n (%) | Ibrutinib (N = 80) n (%) | Zanubrutinib (N = 82) n (%) | Ibrutinib (N = 98) n (%) | Zanubrutinib (N = 101) n (%) | |
Patients with at least 1 AE | 18 (100.0) | 19 (100.0) | 79 (98.8) | 79 (96.3) | 97 (99.0) | 98 (97.0) |
Blood and lymphatic system disorders | ||||||
Neutropenia | 1 (5.6) | 5 (26.3) | 11 (13.8) | 20 (24.4) | 12 (12.2) | 25 (24.8) |
Anemia | 0 (0.0) | 6 (31.6) | 10 (12.5) | 6 (7.3) | 10 (10.2) | 12 (11.9) |
Thrombocytopenia | 0 (0.0) | 2 (10.5) | 10 (12.5) | 8 (9.8) | 10 (10.2) | 10 (9.9) |
Infections and infestations | ||||||
Upper respiratory tract infection | 4 (22.2) | 3 (15.8) | 24 (30.0) | 21 (25.6) | 28 (28.6) | 24 (23.8) |
Nasopharyngitis | 0 (0.0) | 2 (10.5) | 7 (8.8) | 9 (11.0) | 7 (7.1) | 11 (10.9) |
Urinary tract infection | 2 (11.1) | 1 (5.3) | 8 (10.0) | 9 (11.0) | 10 (10.2) | 10 (9.9) |
Pneumonia | 2 (11.1) | 0 (0.0) | 10 (12.5) | 2 (2.4) | 12 (12.2) | 2 (2.0) |
Gastrointestinal disorders | ||||||
Diarrhea | 5 (27.8) | 5 (26.3) | 26 (32.5) | 16 (19.5) | 31 (31.6) | 21 (20.8) |
Constipation | 1 (5.6) | 4 (21.1) | 6 (7.5) | 12 (14.6) | 7 (7.1) | 16 (15.8) |
Nausea | 4 (22.2) | 6 (31.6) | 9 (11.3) | 9 (11.0) | 13 (13.3) | 15 (14.9) |
Vomiting | 4 (22.2) | 1 (5.3) | 9 (11.3) | 8 (9.8) | 13 (13.3) | 9 (8.9) |
General disorders and administration-site conditions | ||||||
Fatigue | 2 (11.1) | 4 (21.1) | 13 (16.3) | 15 (18.3) | 15 (15.3) | 19 (18.8) |
Pyrexia | 0 (0.0) | 3 (15.8) | 12 (15.0) | 10 (12.2) | 12 (12.2) | 13 (12.9) |
Edema peripheral | 3 (16.7) | 1 (5.3) | 16 (20.0) | 8 (9.8) | 19 (19.4) | 9 (8.9) |
Nervous system disorders | ||||||
Headache | 2 (11.1) | 3 (15.8) | 9 (11.3) | 12 (14.6) | 11 (11.2) | 15 (14.9) |
Dizziness | 2 (11.1) | 4 (21.1) | 7 (8.8) | 9 (11.0) | 9 (9.2) | 13 (12.9) |
Musculoskeletal and connective tissue disorders | ||||||
Back pain | 2 (11.1) | 3 (15.8) | 4 (5.0) | 11 (13.4) | 6 (6.1) | 14 (13.9) |
Arthralgia | 3 (16.7) | 2 (10.5) | 13 (16.3) | 11 (13.4) | 16 (16.3) | 13 (12.9) |
Pain in extremity | 2 (11.1) | 1 (5.3) | 5 (6.3) | 10 (12.2) | 7 (7.1) | 11 (10.9) |
Muscle spasms | 6 (33.3) | 3 (15.8) | 17 (21.3) | 7 (8.5) | 23 (23.5) | 10 (9.9) |
Respiratory, thoracic, and mediastinal disorders | ||||||
Dyspnea | 1 (5.6) | 2 (10.5) | 5 (6.3) | 12 (14.6) | 6 (6.1) | 14 (13.9) |
Cough | 2 (11.1) | 3 (15.8) | 15 (18.8) | 10 (12.2) | 17 (17.3) | 13 (12.9) |
Epistaxis | 4 (22.2) | 4 (21.1) | 15 (18.8) | 9 (11.0) | 19 (19.4) | 13 (12.9) |
Skin and subcutaneous tissue disorders | ||||||
Rash | 4 (22.2) | 3 (15.8) | 12 (15.0) | 10 (12.2) | 16 (16.3) | 13 (12.9) |
Injury, poisoning, and procedural complications | ||||||
Contusion | 4 (22.2) | 3 (15.8) | 19 (23.8) | 10 (12.2) | 23 (23.5) | 13 (12.9) |
Vascular disorders | ||||||
Hypertension | 3 (16.7) | 3 (15.8) | 13 (16.3) | 8 (9.8) | 16 (16.3) | 11 (10.9) |
Renal and urinary disorders | ||||||
Hematuria | 3 (16.7) | 3 (15.8) | 7 (8.8) | 4 (4.9) | 10 (10.2) | 7 (6.9) |
Cardiac disorders | ||||||
Atrial fibrillation | 3 (16.7) | 0 (0.0) | 11 (13.8) | 2 (2.4) | 14 (14.3) | 2 (2.0) |
AE = adverse event.
Note: Patients with multiple events for a given preferred term and system organ class are counted only once for each preferred term and system organ class, respectively. Medical Dictionary for Regulatory Activities (MedDRA) Version 22.0
aSorted by most common incidence in the Overall Zanubrutinib column.
Source: Clinical Study Report for Brukinsa.7
Notable Harms
Neutropenia: In cohort 1, neutropenia was reported in 12 patients (12.2%) in the ibrutinib arm and 25 patients (24.8%) in the zanubrutinib arm. In cohort 2, neutropenia was observed in 4 patients (14.3%). Neutropenia was observed in 29 out of 129 patients (22.5%) among all zanubrutinib-treated patients in both cohorts. Neutropenia greater than or equal to grade 3 was reported in 8 patients (8.2%) in the ibrutinib arm and 16 patients (15.8%) in the zanubrutinib treatment arms. Among all zanubrutinib-treated patients in both cohorts, neutropenia greater than or equal to grade 3 was reported in 19 out of 129 patients (14.7%).
Hemorrhage (including minor and major bleeding): In cohort 1, 58 patients (59.2%) in the ibrutinib arm and 49 patients (48.5%) in the zanubrutinib arm had hemorrhage (including minor bleeds involving mucous membranes and skin). The predominant events reported in the ibrutinib treatment arm versus the zanubrutinib treatment arm were mild or moderate mucocutaneous bleeding (i.e., contusion [23.5% versus 12.9%], epistaxis [19.4% versus 12.9%], hematuria [10.2% versus 6.9%], hematoma [7.1% versus 5.0%], petechiae [3.1% versus 6.9%], and purpura [6.1% versus 3.0%]). No patients in the ibrutinib treatment arm and 1 patient (1.0%) in the zanubrutinib treatment arm discontinued study treatment due to a hemorrhagic event. Forty-nine of the 58 ibrutinib-treated patients (84%) and 36 of the 49 zanubrutinib-treated patients (73%) had hemorrhage events that were considered related to treatment by the investigator.
Major hemorrhage, defined as serious (or ≥ grade 3) bleeding at any site or CNS bleeding of any grade, was observed in 9 patients (9.2%) in the ibrutinib arm and 6 patients (5.9%) in the zanubrutinib arm. The only major hemorrhages reported in more than 1 patient were hematuria and retinal hemorrhage (each occurring in 2 ibrutinib-treated patients). Eight ibrutinib-treated patients (8.2%) and 6 zanubrutinib-treated patients (5.9%) had major hemorrhage (grade ≥ 3). Six ibrutinib-treated patients (6.1%) and 5 zanubrutinib-treated patients (5.0%) had serious events of major hemorrhage. None of the major hemorrhage events were fatal. One patient in the zanubrutinib treatment arm discontinued study treatment for subdural hemorrhage. No patients in either treatment arm had a dose reduction for a major hemorrhagic event. Three patients (2 in the zanubrutinib arm [1.2%] and 1 in the ibrutinib arm [1.0%]) required transfusions for the management of major hemorrhage. The major hemorrhage events were considered related to treatment by the investigator in 6 out of 9 ibrutinib-treated patients and in 2 out of 6 zanubrutinib-treated patients. The median time to the first event of major hemorrhage was 258.0 days (range = 3 days to 539 days) for the ibrutinib arm and 289 days (range = 171 days to 537 days) for the zanubrutinib arm.
Cardiovascular events: Atrial fibrillation or flutter was reported in 14 patients (14.3%) in the ibrutinib arm and 2 patients (2.0%) in the zanubrutinib treatment arm. Atrial fibrillation greater than or equal to grade 3 was reported in 3 ibrutinib-treated patients (3.1%) and in 0 zanubrutinib-treated patients. None of the atrial fibrillation or flutter events led to death. Four patients (4.1%) in the ibrutinib arm had atrial fibrillation or flutter greater than or equal to grade 3; 0 patients in the zanubrutinib arm had this. No patient discontinued treatment due to atrial fibrillation or flutter. In the ibrutinib arm, 2 patients (2.0%) had dose reduction due to atrial fibrillation or flutter.
Second primary malignancy: In cohort 1, a second primary malignancy was reported in 11 patients (11.2%) in the ibrutinib arm: basal cell carcinoma (n = 2), squamous cell carcinoma (n = 4), Bowen’s disease (n = 1), skin cancer (n = 2), bladder transitional cell carcinoma (n = 2), and chronic myeloid leukemia (n = 1). In the zanubrutinib arm, 12 patients (11.9%) were observed to have a second primary malignancy, including basal cell carcinoma (n = 4), squamous cell carcinoma (n = 2), Bowen’s disease (n = 1), chronic myelomonocytic leukemia (n = 1), metastatic colorectal cancer (n = 1), endometrial adenocarcinoma (n = 1), malignant lung neoplasm (n = 1), malignant melanoma (n = 1), stage I malignant melanoma (n = 1), plasma cell myeloma (n = 1), and skin cancer (n = 1).
Critical Appraisal
Internal Validity
The objective of the ASPEN trial was to assess the efficacy of zanubrutinib compared to ibrutinib in R/R and treatment-naive patients with WM. If the study end point had not been changed from noninferiority of VGPR or CR to superiority of VGPR or CR, noninferiority of VGPR or CR in zanubrutinib-treated patients compared to ibrutinib-treated patients would have been met. Although this supports the primary efficacy analysis, the post hoc nature of this analysis is an inherent limitation. Thus, it can be considered as exploratory only.
Given that WM is a rare disease, the sample size was acceptable. Statistical power calculations were reported, and the target sample size (210 in cohorts 1 and 2 combined) was achieved. However, the number of treatment-naive patients was limited (37 in cohort 1). Randomization was stratified, and stratification was based on relevant prognostic factors, which included CXCR4WHIM mutational status and prior lines of therapy; these were identified as subgroups of interest by the clinical experts consulted. Cohort 2 (MYD88WT) was a non-randomized exploratory single arm; as such, the relative efficacy of zanubrutinib compared to ibrutinib in this population (which represents approximately 10% of the population of patients with WM) cannot be determined. The study was generally well balanced with respect to patient demographics and disease characteristics.
Because the ASPEN trial was an open-label study, access to aggregated data summaries with actual study treatment assignment of the randomized arms while the study was ongoing may have introduced unwanted bias due to the possibility of inconsistent queries among patients with different treatments, or over-interpretation of immature, accruing data. A Data Integrity Protection Plan was put in place to describe the steps taken before database lock for the primary analysis of efficacy to minimize these potential biases for the randomized portion of the study.7 The primary end point was assessed by an IRC, which reduces bias related to outcome assessment. Additionally, there are other important sources of bias that may result from lack of blinding of patients and investigators to study treatments. Patients’ knowledge of their assigned treatment may have affected some safety end points, and different supportive care may have been offered to patients in the 2 treatment arms.
The primary end point and key secondary end points were appropriate and adequately described. Data were immature for time-to-event outcomes, and median PFS and OS were not reached in either treatment arm. Given that the ASPEN trial is ongoing, future analyses may be more informative with respect to time-to-event outcomes. In addition to PFS and OS, time to next treatment and HRQoL were also identified in the systematic review protocol as important efficacy outcomes. However, these were studied as exploratory outcomes in the ASPEN trial, which limits the interpretation of results. Furthermore, the instruments used to assess HRQoL (QLQ-C30 and EQ-5D) have not been validated in the WM patient population, and no information regarding their reliability, responsiveness, or MID could be identified in this population (Appendix 3). It is unclear what threshold was used to determine clinically meaningful change in HRQoL in the ASPEN trial. Overall, the exploratory nature of important end points is a major limitation of the presented evidence.
External Validity
The clinical experts, clinician groups, and drug plans noted that ibrutinib is not an appropriate comparator for zanubrutinib in Canadian clinical practice. Relevant comparators for WM in Canadian jurisdictions include rituximab-based chemotherapy for treatment-naive patients and those with relapsed disease. Re-treatment with rituximab is funded for patients with a relapse-free interval (6 months to 12 months, depending on jurisdiction) following the last dose of rituximab. Therefore, relevance to the current clinical setting is limited, and the question of the comparative efficacy and safety of zanubrutinib versus current standard of care in Canada cannot be answered (see the Indirect Evidence section).
The ASPEN trial defined treatment-naive patients as those unsuitable for standard chemoimmunotherapy, based on the judgment of the study investigators; no explicit criteria were used to define this patient population. This definition of treatment-naive does not align with the standard definition of treatment-naive in oncology research and practice. A treatment-naive patient is generally defined as a patient with no prior anticancer therapy. It is not based on the suitability of a patient to receive treatment. The reasons cited for considering patients unsuitable for standard chemoimmunotherapy (e.g., age, hypertension, ischemic heart disease) were not considered by the clinical experts consulted by CADTH to be key factors that guide treatment decision in this population, particularly age. The clinical experts consulted by CADTH deemed the methods and criteria use in the ASPEN trial to determine suitability for standard chemoimmunotherapy to be insufficient for deciding which patients are truly ineligible for chemoimmunotherapy. Therefore, the trial evidence regarding the efficacy and safety of zanubrutinib compared to ibrutinib in unfit, treatment-naive patients is insufficient to guide treatment decisions in truly treatment-naive patients in clinical practice.
The inclusion criteria used in the ASPEN trial were generally reasonable, based on the intended patient population. However, the clinical experts consulted by CADTH noted the exclusion of patients with CNS involvement in the ASPEN trial. According to the clinical experts, patients with CNS involvement, namely Bing Neel syndrome, may in fact benefit from zanubrutinib early in the course of their disease. Indeed, ibrutinib is a well-established therapy for Bing Neel syndrome. The exclusion of patients with Bing Neel syndrome was justified during the planning phase of the trial because no comprehensive guidelines existed at the time for the diagnostic and therapeutic approach or response assessment of Bing Neel syndrome. (Guidelines were published in 2017, around the time the first patient in the trial was dosed.) Given that Bing Neel syndrome was considered a separate disease entity within WM, with a unique clinical course and management challenges, patients with CNS involvement were excluded to ensure the enrolment of a fairly homogenous patient population. Other criteria to define trial populations — including R/R — and definitions of outcomes (e.g., CR, PR) were comparable to the standard definitions used in clinical practice.
Indirect Evidence
Objectives and Methods for the Summary of Indirect Evidence
The objective of this section is to provide an appraisal and summary of indirect evidence from the sponsor-submitted ITC comparing zanubrutinib to chemotherapy regimens. There is no standard of care for the treatment of R/R WM. BTK inhibitors — such as ibrutinib, the comparator in the ASPEN trial — are most frequently used in Canadian clinical practice through compassionate access for the treatment of WM. As such, the sponsor submitted an ITC to provide an assessment of the relative efficacy of zanubrutinib compared to chemotherapeutic regimens currently funded by Canadian public plans.24
The literature search identified 1 ITC; however, it did not meet the eligibility criteria. The sponsor-submitted ITC, which was used to inform the pharmacoeconomic model, was appraised and summarized.24
Description of Indirect Comparison(s)
The sponsor submitted a MAIC based on an SLR that compared the IPD of the zanubrutinib arm of the ASPEN trial to the populations of relevant trial reports for chemotherapy-based regimens in adult patients with treatment-naive or R/R WM.24
Methods of the Sponsor-Submitted ITC
Objectives
The objective of the sponsor-submitted report was to conduct a systematic review of the literature and perform an ITC to provide an assessment of the relative efficacy of zanubrutinib compared to chemotherapeutic regimens currently funded by Canadian public plans.24
Study Selection Methods
A systematic literature search was conducted in September 2020 using Embase, MEDLINE and MEDLINE In-Process (through ProQuest), and the Cochrane Library (using wiley.com and including the Cochrane Database of Systematic Reviews, the Database of Abstracts of Reviews of Effectiveness, and the Cochrane Central Register of Controlled Trials). The study selection criteria for the review are summarized in Table 26. Briefly, eligible patients were informed by the ASPEN trial, and included treatment-naive (i.e., first-line) patients with WM for whom chemoimmunotherapy is unsuitable, or patients with R/R WM who had received at least 1 prior therapy (i.e., second-line patients). Relevant comparators were identified through a systematic search of clinical practice guidelines, a prior CADTH review, and consultation with clinical experts.24
Relevant outcomes for the ITC were narrower than for the systematic review, which included a broad range of efficacy and safety outcomes. PFS and OS were the primary outcomes of interest for the ITC.24
No date restriction was applied to the search.24
Table 26: Study Selection Criteria and Methods for the Sponsor-Submitted Systematic Literature Review
Criteria | Sponsor-submitted ITC |
|---|---|
Population | Adults with R/R WM who have had at least 1 prior therapy (second-line) Adults with WM whose disease is untreated and for whom chemoimmunotherapy is unsuitable (first-line) |
Intervention | Zanubrutinib |
Comparator | Second-line BR, Clad-R, DRC, FCR, FR, CHOP ± R, ibrutinib For people who are not eligible for chemo-immunotherapy: chlorambucil ± R, R monotherapy, BSC |
Outcome | ORR, CR, VGPR, PR, MRR, duration of response (CR, VGPR, or PR), OS, PFS, safety (e.g., including AEs, discontinuation), HRQoL |
Study design | Prospectively planned, interventional studies. Must report baseline characteristics |
Publication characteristics | English language |
Exclusion criteria |
|
Databases searched | Embase MEDLINE MEDLINE In-Process The Cochrane Library |
Selection process | Articles were screened independently by 2 reviewers using the predefined study selection criteria. Discrepancies between reviewers were resolved by a third reviewer. |
Data extraction process | Conducted by a single reviewer using a standardized data extraction form. Quality check was conducted by a second reviewer. |
Quality assessment | NR |
AE = adverse event; BR = bendamustine-rituximab; BSC = best supportive care; CHOP = cyclophosphamide, doxorubicin, vincristine, and prednisone; Clad-R = cladribine and rituximab; CR = complete response; DRC = dexamethasone-rituximab-cyclophosphamide; FCR = fludarabine-cyclophosphamide-rituximab; FR = fludarabine-rituximab; HRQoL = health-related quality of life; MA = meta-analysis; MRR = major response rate; NR = not reported; ORR = overall response rate; OS = overall survival; PFS = progression-free survival; PR = partial response; R = rituximab; R/R = relapsed/refractory; SLR = systematic literature review; VGPR = very good partial response; WM = Waldenström macroglobulinemia.
Source: Sponsor-submitted matching-adjusted indirect comparison.24
Primary screening of study titles and abstracts was performed by 2 independent reviewers, who applied the basic study selection criteria (population, intervention, and study design). Full-text articles were obtained for potentially relevant studies identified by primary screening, and secondary screening was performed by 2 independent reviewers against the same eligibility criteria. Uncertainty regarding the inclusion of studies during primary or secondary screening was checked and judged by a third reviewer.24
Data extraction was performed by a single reviewer using a predefined data extraction template, and data were quality checked by a separate reviewer against the source publication. For baseline patient characteristics and AE incidence, summary mean estimates were extracted from comparator trial publications whenever available. Individual patient-level event and censoring times for survival were derived through a 2-step process for OS and PFS KM curves. First, the numerical values of the curves (i.e., time on the x-axis and proportion of patients alive on the y-axis) were obtained through graphical digitization using WebPlotDigitizer . Second, the number of events and censoring at each time point were manually calibrated to create a “simulated” trial population that would reproduce the KM curves presented in trial publications, based on the reported number of patients at risk and/or the marker for censoring on the KM curves.24
No formal approach was taken to assess the risk of bias in the included studies.24
ITC Analysis Methods
A feasibility assessment was conducted to determine whether an NMA was possible by determining the appropriate approach based on clinical input and availability of data, including: anchored comparisons (i.e., common comparator arms); evaluable PFS and OS KM curves; baseline patient characteristics; study design features (prospective, sample size); and geographic location. Study design features considered the size of the trial (larger, better), whether an anchored comparison was possible, and whether outcomes were collected prospectively. Geographic location considered whether treatment patterns or populations would be expected to be similar to the Canadian setting. The final study selection for the ITC was conducted through an informal assessment by Canadian and clinical experts and the sponsor personnel.24
A summary of the analysis methods for the MAIC is shown in Table 26. A MAIC approach was used for this comparison because an NMA based on aggregate-level data was determined to be infeasible due to a lack of network connectivity. First, the patients from the ASPEN trial who did not qualify for comparable studies were excluded based on the selection criteria from the comparator study. Second, the IPD for zanubrutinib obtained from the ASPEN trial were reweighted such that the weighted mean baseline characteristics were similar to those reported in the comparator publications. Finally, the effect estimates for outcomes of interest were weighted using the generated weights. In the process of adjustment, each patient was assigned a weight representing the inverse of the odds of being in the ASPEN trial’s zanubrutinib arm versus being in a specific comparator trial. Baseline characteristics of patients before and after weighting were provided (Table 31 and Table 32).
Based on input from the clinical experts consulted by the sponsor — and from the ASPEN trial and other published literature — the following were considered to be potential prognostic factors or effect modifiers: age (≤ 75 years versus > 75 years; ≤ 65 years, and 66 to 75 years versus > 75 years); number of prior therapies (0 lines to 3 lines versus > 3 lines; 1 line to 3 lines versus 3 lines); ECOG PS (0 to 1 versus > 1); MYD88/CXCR4 mutation status; IgM concentration (≤ 40 g/L versus > 40 g/L); beta2-microglobulin concentration (≤ 3 versus > 3 mg/L); platelet count (≤ 100 versus > 100 × 109/L); hemoglobin concentration (≤ 110 g/L versus > 110 g/L); presence of extramedullary disease; and WM IPSS. Not all variables were included in each comparison, and the reason for variable exclusion was not provided; however, it was presumed to be due to lack of available data.
For the unanchored MAIC, inferences on the comparisons were performed using the “sandwich” package in R.24
Two MAIC analyses using zanubrutinib IPD from the ASPEN trial were conducted during this analysis: 1 comparing zanubrutinib to the single-arm trial (Tedeschi et al. [2015]) for BR and another comparing zanubrutinib to the single-arm trial for DRC (Dimopoulos et al. [2007] and Kastritis et al. [2015]). (The Dimopoulos and Kastritis publications describe the same study) The primary outcome measures were investigator-assessed PFS and OS. OS and PFS with zanubrutinib compared to other relevant therapies were assessed by estimating HRs using Cox proportional hazard (PH) models. The PH assumption was assessed through visual inspection of the log-cumulative hazard plots for PFS and OS.24 No further information on the approach used to estimate the parameters of the model, or the choice of outcomes for the MAIC, was provided.
Table 27: Summary of MAIC Analysis Methods
Details | Sponsor-submitted MAIC |
|---|---|
ITC methods | Unanchored MAIC |
Covariates used for weighting |
|
Outcomes | OS, PFS (investigator-assessed) |
Follow-up time points | 19 months to 8 years |
Populations | Zanubrutinib population:
Comparator populations:
|
Sensitivity analyses | None |
Subgroup analysis | None |
BR = bendamustine-rituximab; DRC = dexamethasone-rituximab-cyclophosphamide; IgM = Immunoglobulin M; IPSSWM = International Prognostic Scoring System for Waldenström Macroglobulinemia; ITC = indirect treatment comparison; ITT = intention to treat; MAIC = matching-adjusted indirect comparison; OS = overall survival; PFS = progression-free survival; R/R = relapsed/refractory.
Source: Sponsor-submitted MAIC.24
Results of ITC
Summary of Included Studies
In total, 1,351 records were identified from database searches. After the removal of duplicates, 1,118 abstracts were screened for eligibility, resulting in 1,021 exclusions. A total of 97 publications were assessed for eligibility for the SLR based on full texts, with 33 publications included.24 No quality assessment of the included studies was conducted.
Of the 33 studies included in the systematic review, 7 consisted of ibrutinib monotherapy and did not inform comparisons for the ITC, and 2 publications were for zanubrutinib compared to ibrutinib (i.e., the ASPEN trial; however, the ibrutinib arm was not included in the ITC). Of the 24 remaining trials, 2 were included in the MAIC: Tedeschi et al. (2015), which evaluated BR, and Dimopoulos at al. (2007) and Kastritis et al. (2015), which concern the same trial evaluating DRC.24 A detailed summary of the 24 eligible studies is provided in Table 28.
Of the 4 studies identified for BR, Tedeschi et al. (2015) was considered by the sponsor to be the most suitable for inclusion in the MAIC because24:
It reported evaluable PFS KM and OS KM for incorporation into the cost-effectiveness analysis.
The results in this study are representative of other studies of BR, which have consistently shown it to be at least as effective as other chemoimmunotherapeutic regimens.
It reported baseline patient characteristics, which supported further comparability assessment and potential matching adjustments.
It had the largest sample size.
Of the 5 articles identified for DRC, 2 articles (Dimopoulos et al. [2007] and Kastritis et al. [2015]) describing the same study were considered by the sponsor for inclusion in the MAIC because24:
The study was the only prospective study.
It reported an evaluable OS KM, over the long-term, for incorporation into the cost-effectiveness analysis.
It reported baseline patient characteristics, which supported further comparability assessment and potential matching adjustments.
It had the largest sample size.
Of the 6 studies identified for fludarabine-cyclophosphamide-rituximab or fludarabine-rituximab, no study was considered by the sponsor for inclusion in the ITC because of the relatively small sample sizes and a lack of reporting of OS KM curves or PFS KM curves. For cladribine-rituximab and best supportive care, no study was identified in the SLR. One study of rituximab plus cyclophosphamide, doxorubicin, vincristine, and prednisone (R-CHOP) was identified; however, it was a small cohort of R/R patients with WM (n = 10/13). Therefore, these comparators, although listed in the final scope, were not included in the ITC or the cost-effectiveness analysis.24
For comparators for adults with WM whose disease is untreated and for whom chemoimmunotherapy is unsuitable, several studies were identified. However, these trials were not considered for the ITC because of the small sample size of treatment-naive patients (unsuitable for chemoimmunotherapy) in the zanubrutinib arm in the ASPEN trial (n = 19), which made it infeasible to match to the comparator populations.24 Thus, patients with treatment-naive disease were not analyzed in a separate MAIC. Instead, they were included in the overall ASPEN trial population in both MAIC scenarios.
Table 28: Findings of the Clinical Systematic Literature Review
Population | Comparator | Identified studies by comparatora | Key considerations for potential inclusion in ITC | ||||
|---|---|---|---|---|---|---|---|
Study population treated with the comparator of interest (N) | Country and study setting | Study design | Available and evaluable PFS and OS KM | Baseline characteristics reported (population) | |||
Adults with WM who have had at least 1 prior therapy | BR | Treon (2011) | R/R (30) | US, single centre | Retrospective | PFS (E) | Yes |
Paludo (2018) Paludo (2016)a Paludo (2016)b | TN (17) and R/R (43) | US, single centre | Retrospective | PFS (NE) | Yes (overall) | ||
Castillo (2018) | Treatment line NR (57) | Likely US, single centre | Retrospective | PFS (E); OS (E) | Yes | ||
Tedeschi (2015) | R/R WM (71) | Italy, multi-centre | Retrospective | PFS (E); OS (E) | Yes | ||
Adults with WM who have had at least 1 prior therapy (continued) | DRC | Paludo (2017) | TN (50) and R/R (50) | US, multi-centre | Retrospective | PFS (NE) | Yes (by TN, R/R, overall) |
Paludo (2018) Paludo (2016)a Paludo (2016)b | TN (50) and R/R (50) | US, single centre | Retrospective | PFS (NE) | Yes (overall) | ||
Castillo (2018) | Treatment line NR (38) | Likely US, single centre | Retrospective | PFS (E); OS (E) | Yes | ||
Dimopoulos (2007) | TN (72) | Greece, multi-centre | Prospective phase II, single arm | PFS (NE); OS (E) | Yes | ||
Kastritis (2015)b | |||||||
Adults with WM who have had at least 1 prior therapy (continued) | FCR or FR | Treon (2009) | TN (27) and R/R (16) | US, Canada, UK, France, Sweden, multi-centre | Prospective, single arm | PFS (E) | Yes (overall) |
Tedeschi (2012) | TN (28) and R/R (15) | Italy, multi-centre | Prospective, single arm | OS (E) | Yes (overall) | ||
Tam (2005) | TN and R/R (3 overall)c | Australia, single centre | Retrospective | OS (E) | Yes (overall) | ||
Ngan (2003) | TN (5)d | UK, single centre | Retrospective | None | No | ||
Tedeschi (2013) | R/R (40) | Italy, multi-centre | Retrospective | PFS (E) | Yes | ||
Souchet (2016) | TN (25) and R/R (57) | France, multi-centre | Retrospective | PFS (E) | Yes (by TN, R/R, overall) | ||
Adults with WM who have had at least 1 prior therapy (continued) | R-CHOP | Treon (2005) | TN (3) and R/R (10) | US, single centre | Retrospective | None | Yes (overall) |
Clad-R | None | NA | NA | NA | NA | NA | |
Adults with WM whose disease is untreated, for whom chemo-immunotherapy is unsuitable | Chlorambucil | Ngan (2003) | TN (23)d | UK, single centre | Retrospective | None | No |
Kyle (2000) | Treatment line NR (46) | Likely US, single centre | Prospective, single arme | OS (NE) | Yes | ||
Rituximab monotherapy | Gertz (2004) | TN (34) and RR (35) | US, multi-centre | Prospective, single arm | PFS (E); OS (E) | Yes | |
Gertz (2009) | |||||||
Dimopoulos (2002) | TN (17) | Greece, single centre | Prospective | None | Yes | ||
Dimopoulos (2002) | TN (15) and R/R (12) | Greece, single centre | Prospective phase II, single arm | None | Yes | ||
Byrd (1999) | R/R (7) | Likely US, multi-centre | Retrospective | None | Yes | ||
Treon (2001) | TN and RR (30) | US, multi-centre | Retrospective | None | Yes | ||
BSC | None | NA | NA | NA | NA | NA | |
BR = bendamustine-rituximab; BSC = best supportive care; Clad-R = cladribine and rituximab; DRC = dexamethasone-rituximab-cyclophosphamide; E = evaluable; FCR = fludarabine-cyclophosphamide-rituximab; FR = fludarabine-cyclophosphamide; KM = Kaplan–Meier; MAIC = matching-adjusted indirect comparison; NA = not applicable; NE = not evaluable; NR = not reported; OS = overall survival; PFS = progression-free survival; R/R = relapsed or refractory; R-CHOP = rituximab + cyclophosphamide, doxorubicin, vincristine and prednisone; TN = treatment-naive.
aGiven the relatively limited clinical evidence identified from the clinical systematic literature review, the list studies are stratified by comparator, but not by population.
bKastritis (2015) was the same study as Dimopoulos (2007), but with a longer follow-up.
cIn Tam (2005), 16 patients were evaluated in total, of whom 3 patients were treated with FCR or FR.
dIn Ngan (2003), 40 patients were evaluated in total, of whom 5 patients received fludarabine-based therapy; 23 patients received chlorambucil.
eIn Kyle (2000), patients were randomized to continuous and intermittent chlorambucil therapy arms. For the purposes of the indirect treatment comparison and the assessment of feasibility of a network meta-analysis, this study was considered to be no different from a single-arm trial.
Source: Sponsor-submitted MAIC.24
Study and baseline characteristics of the 3 included studies are summarized in Table 28. Study phase, countries included, dosing regimen and administration, and follow-up times varied across the studies. Both R/R and treatment-naive patients were evaluated in the included studies; where the ASPEN trial included both R/R and treatment-naive patients, Tedeschi et al. (2015) included only R/R patients with WM, and Dimopoulos et al. (2007) and Kastritis et al. (2015) included only treatment-naive patients. Included interventions were all different, with differences in administration method and dosing schedule. The ASPEN trial enrolled more patients than the other 2 studies (n = 102 [zanubrutinib arm only] versus n = 71 versus n = 72). Follow-up times were similar between the ASPEN and the Tedeschi et al. (2015) study, at 19.47 months and 19 months, respectively; however, the Dimopoulos et al. (2007) and Kastritis et al. (2015) study had follow-ups of 23.4 months and 8 years, respectively.24 Many important baseline characteristics for the Tedeschi et al. (2015) and Dimopoulos et al. (2007) and Kastritis et al. (2015) studies were not reported. As such, there are numerous sources of possible clinical heterogeneity between the studies.
Table 29: Summary of Studies Included in the ITC – Study and Baseline Characteristics
Study details | ASPEN trial | Tedeschi et al. (2015) | Dimopoulos et al. (2007) and Kastritis et al. (2015) |
|---|---|---|---|
IPD available | Yes | No | No |
Study characteristics | |||
Study design | Multi-centre, phase III | Multi-centre (phase not applicable) | Multi-centre, phase II |
Country | Europe (59.7%); Australia or New Zealand (30.8%) | Italy | Greece |
Intervention | Zanubrutinib, 160 mg twice daily until disease progression (ibrutinib is included in ASPEN, but not included in ITC) | BR (six 28-day courses of bendamustine | DRC (six 21-day courses of dexamethasone |
Patient population | Mixed TN (unsuitable for chemoimmunotherapy) and R/R WM | R/R WM | TN (suitable for chemoimmunotherapy) WM |
Sample size, N | R/R: 83, TN: 19 | 71 | 72 |
Median follow-up | 19.47 months | 19 months | Dimopoulos et al. (2007): 23.4 months Kastritis et al. (2015): 8 years |
Outcomes of interest | |||
PFS KM | IPD available | Reported | Reported |
OS KM | IPD available | NR | Reported |
AE incidence | IPD available | NR | Reported |
Baseline characteristics | |||
Age, years | |||
Mean (SD) | 69.5 (9.46) | NR | NR |
Median (range) | 70 (38 to 90) | 72 (49 to 88) | 69 (33 to 89) |
> 65, n (%) | 61 (59.8%) | NR | 63% |
Female proportion, n (%) | 134 (66.7%) | 25 (35.2%) | 45 (62.5%) |
IgM, g/L | |||
Mean (SD) | 34.72 (19.62) | NR | NR |
Median (range) | 32.85 (2.4 to 108.0) | 38.15 (2.4 to 96.2) | NR |
Platelet count, 109/L | |||
Mean (SD) | 238.63 (108.21) | NR | NR |
Median (range) | 236.00 (34.0 to 564.0) | NR | NR |
≤ 100, n (%) | 12 (11.8) | NR | 3 (4.2%) |
Hemoglobin, g/L | |||
Mean (SD) | 104.39 (19.24) | NR | NR |
Median (range) | 102.50 (53.0 to 152.0) | NR | NR |
< 100, n (%) | 78 (47.1%) | NR | 41 (56.9%) |
Prior lines of treatment | |||
Median | 1 (0 to 3) | 2 (1 to 5) | NA |
0, n (%) | 19 (18.6) | NR | NA |
1 to 3, n (%) | 76 (74.5) | NR | NA |
> 3, n (%) | 7 (6.9) | NR | NA |
Prior treatment regimen, n (%) | |||
Nucleoside analogue-containing therapies | 39 (23.8%) | 21 (29.6%) | NA |
Bortezomib-containing therapies | 20 (12.2%) | 7 (9.9%) | NA |
Cyclophosphamide-containing therapies | 139 (84.8%) | 64 (90.1%) | NA |
Rituximab alone or in combination therapy | 150 (91.5%) | 55 (77.5%) | NA |
Extramedullary disease, n (%) | |||
Adenopathy and/or splenomegaly | 63 (61.8%) | 30 (42.3%) | NA |
Lymphadenopathy | 61 (59.8%) | NR | 28 (38.9%) |
Splenomegaly | 16 (15.7%) | NR | 23 (31.9%) |
IPSSWM score, n (%) | |||
Low risk | 17 (16.7%) | 12 (21.4%a) | NR |
Intermediate risk | 38 (37.3%) | 17 (30.4%a) | NR |
High risk | 47 (46.1%) | 27 (48.2%a) | NR |
AE = adverse event; BR = bendamustine-rituximab; DRC = dexamethasone-rituximab-cyclophosphamide; IgM = Immunoglobulin M; IPD = individual patient-level data; IPSSWM = International Prognostic Scoring System for Waldenström Macroglobulinemia; ITC = indirect treatment comparison; KM = Kaplan–Meier; MAIC = matching-adjusted indirect comparison; NA = not applicable; NR = not reported; OS = overall survival; PFS = progression-free survival; R/R = relapsed/refractory; SD = standard deviation; TN = treatment-naive; WM = Waldenström macroglobulinemia.
aBased on 56 patients.
Source: Sponsor-submitted MAIC.24
Results
Three sets of pairwise MAICs were conducted and are summarized in Table 30. Two pairwise comparisons weighted the overall zanubrutinib population (N = 102) to be similar to the BR (N = 71) and DRC (N = 72) populations separately. A subgroup analysis was conducted weighting zanubrutinib patients with R/R disease to the BR population, considering that the population in Tedeschi et al. (2015) consisted of R/R patients only. Given the small sample size of unfit, treatment-naive patients in the zanubrutinib arm of the ASPEN trial (n = 19), no MAIC was conducted specifically comparing the unfit, treatment-naive subpopulation in ASPEN.24
Table 30: Pairwise MAICs Conducted
Pairwise comparison | Zanubrutinib population | Comparator population |
|---|---|---|
1 | 102 R/R and TN patients in the zanubrutinib arm (ASPEN ITT analysis set) | 71 R/R patients receiving BR |
2 | 83 patients in the R/R set of zanubrutinib arm (ASPEN ITT analysis set) | 71 R/R patients receiving BR |
3 | 102 R/R and TN patients in the zanubrutinib arm (ASPEN ITT analysis set) | 72 TN patients receiving DRC |
BR = bendamustine-rituximab; DRC = dexamethasone-rituximab-cyclophosphamide; ITT = intention to treat; MAIC = matching-adjusted indirect comparison; R/R = relapsed/refractory; TN = treatment-naive.
Source: Sponsor-submitted MAIC.24
Results were based on the ITT population of the ASPEN trial. Baseline characteristics before and after weighting for the MAICs are summarized in Table 31 and Table 32 for the comparison to BR and the comparison to DRC, respectively.24 In both MAIC analyses, several of the preidentified variables, including ECOG PS, beta2-microglobulin concentration, and MYD88/CXCR4 mutation status, were not accounted for during weighting due to the limitations of available data. In the MAIC comparing zanubrutinib to BR, the variables included in the weighting process included age, prior lines of therapy, IgM concentration, IPSSWM score, and presence of extramedullary disease. In the MAIC comparing zanubrutinib to DRC, the variables included in the weighting were age, platelet count, hemoglobin count, and presence of extramedullary disease. The number of patients in the zanubrutinib trial who did not qualify for comparable studies (i.e., were removed or unavailable for weighting) was not provided; therefore, it is unclear how much of the loss in precision in the MAIC results is due to the exclusion of patients versus due to the weighting as captured by the effective sample size (ESS).
Table 31: Baseline Characteristics Before and After Weighting for the ASPEN Zanubrutinib Arm Versus BR Population
Baseline characteristics, n (%) | Total population | Relapsed/refractory subgroup | ||||
|---|---|---|---|---|---|---|
Zanubrutinib, unweighted n = 102 | BR, n = 71 | Zanubrutinib, weighted ESS = 50 | Zanubrutinib, unweighted n = 83 | BR n = 71 | Zanubrutinib, weighted ESS = 46 | |
Age ≤ 72 years | 45.1 | 50.0 | 50.0 | 61.4 | 50.0 | 50.0 |
0 to 2 prior lines of therapy | 79.4 | 50.0 | 50.0 | 74.7 | 50.0 | 50.0 |
IgM ≤ 38.15 g/L | 64.7 | 50.0 | 50.0 | 65.1 | 50.0 | 50.0 |
IPSSWM score, intermediate risk | 37.3 | 30.4 | 30.4 | 36.1 | 30.4 | 30.4 |
IPSSWM score, high risk | 46.1 | 48.2 | 48.2 | 44.6 | 48.2 | 48.2 |
Presence of extramedullary disease: splenomegaly or adenopathy (by investigator) | 61.8 | 42.3 | 42.3 | 63.9 | 42.3 | 42.3 |
BR = bendamustine-rituximab; ESS = effective sample size; IgM = Immunoglobulin M; IPSSWM = International Prognostic Scoring System for Waldenström Macroglobulinemia; MAIC = matching-adjusted indirect comparison.
Source: Sponsor-submitted MAIC.24
Table 32: Baseline Characteristics Before and After Weighting for ASPEN Zanubrutinib Arm Versus DRC Population
Baseline characteristics, n (%) | Zanubrutinib, unweighted n = 102 | DRC, n = 72 | Zanubrutinib, weighted ESS = 53 |
|---|---|---|---|
Age ≤ 65 years | 40.2 | 37.5 | 37.5 |
Age 65 years to ≤ 69 years | 6.9 | 12.5 | 12.5 |
Age > 69 years | 52.9 | 50.0 | 50.0 |
Platelet count < 100 × 109/L | 11.8 | 4.2 | 4.2 |
Hemoglobin < 100 g/L | 47.1 | 56.9 | 56.9 |
Presence of extramedullary disease: lymphadenopathy | 59.8 | 38.9 | 38.9 |
Presence of extramedullary disease: splenomegaly | 15.7 | 31.9 | 31.9 |
DRC = dexamethasone-rituximab-cyclophosphamide; ESS = effective sample size; MAIC = matching-adjusted indirect comparison.
Source: Sponsor-submitted MAIC.24
Progression-Free Survival
KM curves for PFS before and after weighting are summarized in Figure 9. Zanubrutinib was associated with significantly longer PFS (HR = 0.37; 95% CI, 0.15 to 0.91) after weighting compared to BR (Figure 9a). |||||||||||||||||||||||||||||||||||||||||||||||||||||| |||||||||||||||||||||||||||||||||||||||||||||||||||||||||||||||||||||||||||||||||||||||||||||||||||||||||||||||||||||||||||||||||||||||||||||||||||||||||||||||||||||||||| ||||||||||||||||||||||||||||||||||||||||||.24
|||||||||||||||||||||||||||||||||||||||||||||||||||||||||||||||||||||||||||||||||||||||||||||||||||||||||||||||||||||||||||||||||||||||||||||||||||| ||||||||||||||||||||||||||||.24
Overall Survival
KM curves for OS before and after weighting are summarized in Figure 10. The HRs for OS comparing zanubrutinib to BR indicated statistically significantly longer OS in the overall population (HR = 0.29; 95% CI, 0.10 to 0.85) (Figure 10a). |||||||||||||||||||||||||||||||||||||||||||||||||||||||||||||||||||||||||||||||||||||||||||||||||||||||||||||||||||||||||||||||||||||||||||||||||||||||||||||||||||||||||| ||||||||||||||||||||||||||||||||||||||||||||||||||||||||||||||||||||||||||||||||||||||||||||.24
|||||||||||||||||||||||||||||||||||||||||||||||||||||||||||||||||||||||||||||||||||||||||||||||||||||||||||||||||||||||||||||||||||||||||||||||||||| | ||||||||||||||||||||||||||||||.24
PHs Assumption
Plots assessing the PH for PFS and OS are shown in Figure 11 and were assessed through visual inspection. The authors concluded that despite the crossing of plot curves, there was no evidence that the PH assumption was violated for the comparisons of zanubrutinib to BR or DRC for PFS or OS.24
Figure 9: Unweighted and Weighted Kaplan–Meier Curves for PFS With Zanubrutinib
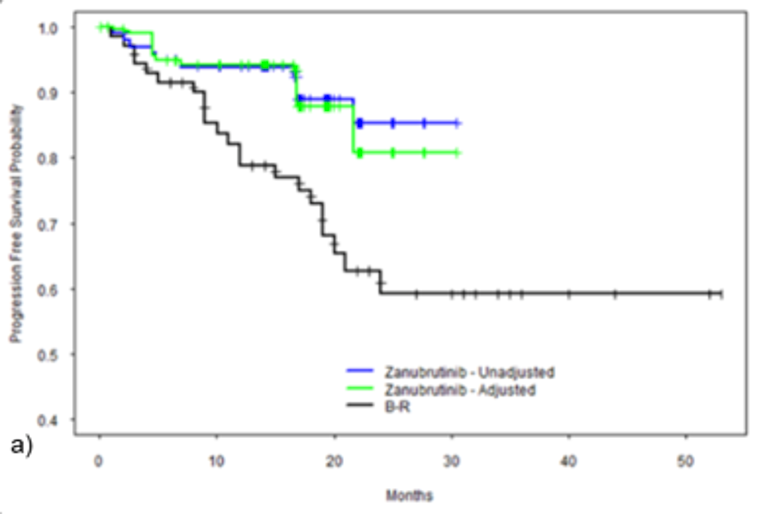
B-R = bendamustine-rituximab; KM = Kaplan–Meier; MAIC = matching-adjusted indirect comparison; PFS = progression-free survival.
Note: Figure shows the KM curves of PFS and zanubrutinib (before and after matching and adjustment) versus BR. |||||||||||||||||||||||||||||||||||||||||||||||||||||||||||||||||||||||||||||||||||||||||||||| |||||||| ||||||||||||||||||||||||||||||||||||||||||||||||||||||||||||||||||||||||||||||||||||||||||||||
Source: Sponsor-submitted MAIC.24
Figure 10: Unweighted and Weighted Kaplan–Meier Curves for Overall Survival With Zanubrutinib
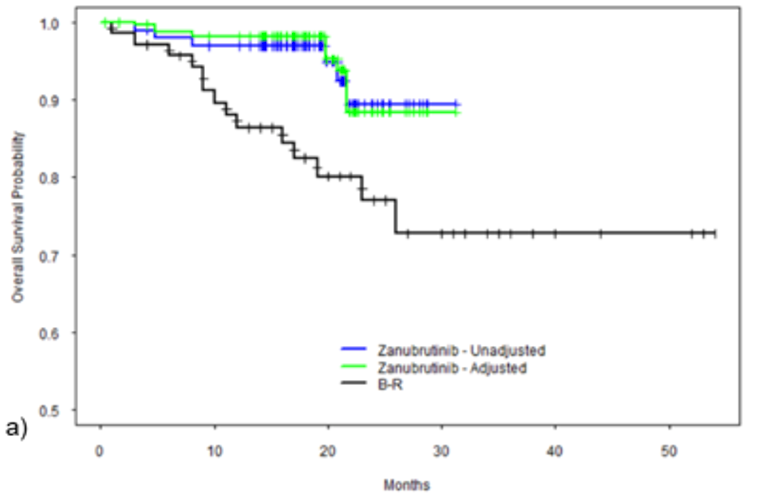
B-R = bendamustine-rituximab; KM = Kaplan–Meier; MAIC = matching-adjusted indirect comparison; OS = overall survival.
Note: Figure shows the KM curves of OS and zanubrutinib (before and after matching and adjustment) versus bendamustine-rituximab. |||||||||||||||||||||||||||||||||||||||||||||||||||||||||||||||||||||||||||||||||||||||||||||||||||||||||| ||||||||||||||||||||||||||||||||||||||||||||||||||||||||||||||||||||||||||||||||||||||||||||||
Source: Sponsor-submitted MAIC.24
Figure 11: Log-Cumulative Hazards Versus Log Time for PFS and Overall Survival
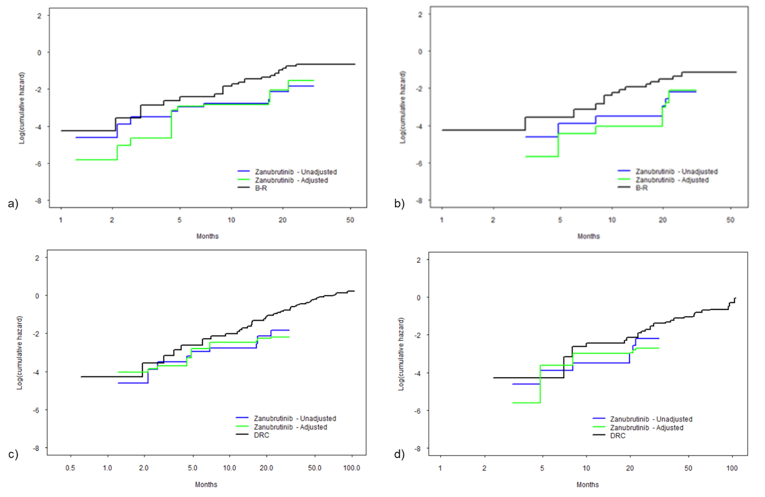
B-R = bendamustine-rituximab; DRC = dexamethasone-rituximab-cyclophosphamide; MAIC = matching-adjusted indirect comparison; PFS = progression-free survival; OS = overall survival.
Note: In the figure, a) shows log-cumulative hazards versus log time for PFS, zanubrutinib (before and after matching and adjusting to bendamustine-rituximab) versus BR; b) shows log-cumulative hazards versus log time for OS, zanubrutinib (before and after matching and adjusting to BR) versus bendamustine-rituximab; c) shows log-cumulative hazards versus log time for PFS, zanubrutinib (before and after matching and adjusting to DRC) versus DRC; and d) shows log-cumulative hazards versus log time for OS, zanubrutinib (before and after matching and adjusting to DRC) versus DRC.
Source: Sponsor-submitted MAIC.24
Critical Appraisal of ITC
Internal Validity
Results of the MAIC comparing zanubrutinib to BR after weighting suggest that zanubrutinib is favoured over BR, including in the R/R subgroup for PFS and OS; however, the results lacked precision, showing wide 95% CIs. Compared to DRC (in the treatment-naive population), zanubrutinib was favoured for PFS; however, there was no statistically significant difference in OS. For both outcomes, the results lacked precision, with wide CIs. The sponsor considered that, given that greater than 80% of the ASPEN population was R/R — and that the analyses comparing zanubrutinib to DRC in Dimopoulos et al. (2007) and Kastritis et al. (2015) were in treatment-naive patients — there may be bias in the results of the MAIC in favour of DRC; survival outcomes are generally more favourable in patients receiving first-line treatment versus R/R patients, due to the lack of prior treatment and overall disease status, which are known effect modifiers in WM. Therefore, the comparative results for patients with treatment-naive WM are highly uncertain. Additionally, no indirect evidence was available to assess the comparative safety of zanubrutinib or its impact on HRQoL versus relevant chemoimmunotherapy regimens.
The ITC was informed by an appropriately conducted systematic review of the literature, highlighting the relevant population, and by outcomes of interest for this review. Screening was conducted based on standard methods, with studies selected independently in duplicate according to pre-specific criteria. No formal quality assessment of the included studies was conducted — an important limitation, given the many prospective and retrospective studies included in the SLR. An informal approach was taken by the sponsor to further select studies for the ITC, including an assessment of clinical input and data availability (anchored comparisons, evaluable PFS and OS outcomes, baseline characteristics, study design and trial size, data collection method [randomized controlled trial or observational study], and geographic location) by Canadian clinical experts and sponsor personnel. Considerations for the inclusion of certain trials based on interventions were provided; however, given that reasons for exclusion were not provided, it is uncertain whether the exclusion of these trials was justifiable.
The choice to conduct a MAIC was justified by the lack of a common comparator across the included trials, given that no connected networks could be formed based on the identified trials. Moreover, all studies were considered single arm; therefore, an unanchored MAIC was conducted based on National Institute for Health and Care Excellence (NICE) Decision Support Unit (DSU) guidance. The key limitation of the sponsor-submitted MAIC, which is a limitation inherent to all unanchored MAICs, is that it assumes that all effect modifiers and prognostic factors are accounted for in the model. This assumption is largely considered impossible to meet, according to the NICE DSU Technical Guidance report on the methods for population-adjusted indirect comparisons.25 A comprehensive list of prognostic factors and treatment-effect modifiers identified through appropriate channels was included in the report; based on discussions with the clinical experts consulted by CADTH, these were considered relevant. However, some of these factors — including ECOG PS, beta2 microglobulin, and MYD88/CXCR4 mutation status — were not accounted for in the calculation of weight (see Table 26). This may have resulted in bias because not all prognostic factors and effect modifiers that were originally identified were accounted for in the weights. Additionally, there were discrepancies between the cut-offs of identified variables and those available for weighting (zanubrutinib versus BR: age ≤ 72 years; 0 to 2 prior lines of therapy; IgM concentration threshold; zanubrutinib versus DRC: age 65 years to ≤ 69 years, age > 69 years), potentially further biasing the results. The distribution of weights generated by the weighting process and extreme high and low weights was also not reported.
Given that there were 2 comparator trials, separate MAICs were conducted for comparisons to BR and DRC. When conducting a MAIC, the inclusion criteria for the index study should be the same as or broader than those of the comparator study. It is unclear if this requirement was met for either analysis. Compared to the original sample sizes of the zanubrutinib arm of the ASPEN trial for comparisons to BR and DRC, the corresponding ESS was reduced by 44.58% to 50.98%; however, it is uncertain how much of this reduction is due to the exclusion of patients or to loss of precision due to the weighting process. Thus, there was either considerable heterogeneity between studies among the variables included in the weighting process, or the inclusion and exclusion criteria differed greatly between the studies. No consideration was given to the potential bias introduced as a result of any exclusion, which is an important limitation in the relative treatment-effect estimates. In the absence of such evidence, the NICE DSU considers the amount of bias in an unanchored MAIC likely to be substantial.25
The sponsor-submitted report included a description of the characteristics of the included studies. Definitions of response and progression for each of the selected trials was reported; however, these outcomes were not evaluated as part of the MAIC. The incidence of AEs was reported as an outcome of interest in the MAIC (Table 29); however, these were not assessed. Comparisons of the definitions of the outcomes evaluated in the MAIC, OS, and PFS were not included. Minimal information about the specific differences in baseline characteristics between the studies was provided, and many baseline characteristics important to the comparison of populations in the Tedeschi et al. (2015) and Dimopoulos et al. (2007) and Kastritis et al. (2015) studies were not reported. However, when reported, baseline characteristics were generally similar. Overall, the potential for heterogeneity between studies based on different baseline and patient characteristics is unclear. The sponsor did not specify which study design and baseline patient characteristics were considered sources of heterogeneity; however, it was noted that a key limitation is that the MAIC relies on data from uncontrolled studies with small sample sizes. Other sources of heterogeneity across studies included the variation in study phases, the countries included in each study, the dosing regimens of treatments (oral versus IV, twice daily versus 28-day and 21-day cycles), and the reporting of study outcomes. Importantly, the study for BR (Tedeschi et al. [2015]) was retrospective; as such, it could have lower accuracy in identifying outcomes compared to a prospective evaluation. These differences in study design cannot be adjusted for. Such differences are considered a limitation of the MAIC, and may affect the interpretability and generalizability of the results. As such, the conclusions based on the results of the MAIC should consider the limitations and how these affected the results.
External Validity
The results of the 2 MAICs may not be generalizable to the WM patient population in Canada due to many factors related to the populations in the comparator trials and the comparators chosen. As previously mentioned, compared to the original sample sizes of the zanubrutinib arm of the ASPEN trial for comparisons to BR and DRC, the ESS was reduced by 44.58% to 50.98%, potentially due to the exclusion of ASPEN patients. If the exclusion criteria used in the comparator trials were not reflective of the WM patient population in Canada, then the results will not be generalizable to the desired population. Because the inclusion and exclusion criteria of these studies were not provided, this cannot be evaluated.
Individual MAICs were conducted for the separate studies. The ASPEN trial enrolled both treatment-naive and R/R patients, whereas Tedeschi et al. (2015) and Dimopoulos et al. (2007) and Kastritis et al. (2015) enrolled solely R/R or treatment-naive patients, respectively. Except for the R/R subgroup analysis from the ASPEN trial, this heterogeneity in patient population is not accounted for, further limiting the comparability of these studies. The exact definition of “treatment-naive” in Dimopoulos et al. (2007) and Kastritis et al. (2015) was not provided; however, it was stated that treatment-naive patients were considered suitable for chemoimmunotherapy (Table 29). For comparison, in the ASPEN trial, treatment-naive patients were considered unsuitable for standard chemoimmunotherapy. Moreover, the majority of the patients in the ASPEN trial (> 80%) were R/R. Therefore, comparisons of the use of zanubrutinib in the treatment-naive population were based on a small sample of treatment-naive patients from the ASPEN trial, limiting the interpretability and generalizability across treatment-naive patients with WM.
The studies selected for indirect comparison included treatment with DRC in the treatment-naive population and treatment with BR in the R/R population. In discussion with the clinical experts consulted by CADTH, the comparison to DRC in the treatment-naive, first-line population is irrelevant because it does not reflect clinical practice in Canada. No studies were identified in the SLR reporting results for BR in the treatment-naive population, which is the standard of care in Canada; thus, these treatments were not included in the analysis for treatment-naive patients. Moreover, no studies were included for the population of treatment-naive patients for whom chemoimmunotherapy was considered unsuitable (Table 28). Together, the comparisons used in the MAIC are not entirely relevant to clinical practice. Overall, there were multiple limitations of the sponsor-submitted MAIC, such as the exclusion and inclusion criteria of the comparator studies and the choice of comparators, leading to uncertainty about the overall generalizability of the results to the Canadian population of patients with WM.
Discussion
Summary of Available Evidence
The evidence base for this review consists of 1 randomized controlled trial and 1 ITC submitted by the sponsor. The ASPEN trial was the largest phase III trial for WM conducted to date that included an active comparator. It compared the efficacy and safety of ibrutinib, a first-generation BTK inhibitor, with zanubrutinib, a novel, highly selective BTK inhibitor for use in patients with WM. Cohort 1 included patients with MYD88 mutation (164 R/R and 37 treatment-naive patients); patients were randomized to receive either ibrutinib (420 mg) or zanubrutinib (160 mg) in 28-day cycles. Cohort 2 included 28 patients with no or unknown MYD88 mutation, including 23 R/R and 5 unfit, treatment-naive patients, all of whom received zanubrutinib (160 mg); this arm was not part of the randomized comparison. The primary efficacy end point was the proportion of patients in each arm of cohort 1 who achieved either CR or VGPR. Secondary end points included PFS and DoR; exploratory end points included OS and HRQoL. The median ages of patients were 70 years in cohort 1 and 72 years in cohort 2. The median follow-up times were 19.4 months in cohort 1 and 17.8 months in cohort 2.
The sponsor submitted a MAIC that compared the efficacy of zanubrutinib to chemotherapy regimens in terms of PFS and OS for the treatment of WM. The analysis was informed by an SLR that identified 33 trials; most were retrospective and subsequently excluded from the ITC. In total, 3 trials were included in the MAIC that included mixed, R/R, and treatment-naive patients with WM, respectively. The interventions included zanubrutinib, BR, and DRC. However, DRC was used in the treatment-naive population and BR in the R/R population, which does not reflect Canadian clinical practice. The median follow-up in the 3 trials ranged from 19 months to 23.4 months and 8 years. For the MAIC, IPD for the zanubrutinib arm of the ASPEN trial was weighted such that the mean baseline characteristics of the ASPEN patients (n = 102) matched the mean characteristics of patients in the BR and DRC studies. Pairwise indirect comparisons were then conducted using the weighted zanubrutinib patients versus BR and versus DRC. The results of the MAIC suggest that zanubrutinib is associated with improved OS and PFS compared to both BR and DRC. However, the wide CIs indicate significant imprecision in these estimates. The limitations surrounding the inclusion and exclusion criteria of the comparator studies and the choice of comparators result in uncertainty about the generalizability of the results to the Canadian population of patients with WM. The sponsor-submitted MAIC did not assess safety or HRQoL outcomes for zanubrutinib.
Interpretation of Results
Efficacy
The ASPEN trial failed to meet its primary end point and did not demonstrate superiority of zanubrutinib compared to ibrutinib for the outcome of CR or VGPR in patients with R/R WM (MYD88L265P). The predictive value of CR or VGPR for PFS and the distinction between VGPR (≥ 90% IgM reduction) and PR (≥ 50% IgM but < 90% IgM) with respect to PFS is recognized by the addition of VGPR as a new category of response in the IWWM recommendations.5 Some previous studies suggest that among patients with WM who are treated with chemoimmunotherapy, those who achieve a VGPR have PFS outcomes similar to those who achieve a CR.26 Although median PFS was not reached in either treatment arm of the ASPEN trial after a median follow-up of 19 months, the data may have been immature at the time of the data cut-off date, and longer follow-up may be needed to assess this outcome. Similarly, median DoR and OS were not reached in either treatment arm after 18 months’ follow-up. Therefore, these secondary efficacy end points can only be considered descriptive and exploratory. Overall, the main limitation of the evidence is the use of a comparator treatment that is not part of publicly funded standard of care in Canada. Ibrutinib and other BTK inhibitors are used for the treatment of WM in Canada, but are only available through compassionate access, which is temporary. This limits the interpretation of the results and the assessment of zanubrutinib’s suitability for and integration into the Canadian clinical practice setting.
In their report, Health Canada reviewers consider the efficacy of zanubrutinib to be clinically meaningful, given the incidence of the disease (1:200,000), clinical activity in unfit, treatment-naive, and R/R patients with WM with MYD88L265P, a supportive post hoc noninferiority analysis of CR and VGPR in R/R patients with WM with MYD88L265P, and clinical activity in a rare, therapeutically unmet treatment-naive or R/R MYD88WT WM patient population.3 Given the comparable primary efficacy end point (i.e., the lack of demonstrated superiority or noninferiority of zanubrutinib to ibrutinib), in addition to comparable results in terms of other measures of disease control — such as the resolution of treatment-precipitating symptoms and improvement in HRQoL measures observed in both treatment arms — current evidence does not suggest a need for change in clinical practice where chemoimmunotherapy constitutes standard of care for the first-line treatment of WM. Although the data for VGPR (of 26% and 20% in unfit, treatment-naive MYD88L265P and MYD88WT patients, respectively) show that response is obtained independently of MYD88 status, and also that zanubrutinib may potentially be a treatment option for those with contraindications to chemoimmunotherapy, this was based on a limited sample size of 19 unfit, treatment-naive patients with MYD88L265P and only 5 patients with MYD88WT, with no comparative data. Therefore, current data, including the ITC, do not support zanubrutinib use in first-line settings. Moreover, as the clinical experts consulted by CADTH noted, the unfit, treatment-naive population in the ASPEN trial is not an accurate representation of treatment-naive patients in clinical practice who would be considered for first-line therapy, given that few patients would truly be ineligible for any type of chemotherapy regimen.
The sponsor-submitted ITC does not provide robust evidence regarding the comparative efficacy of zanubrutinib compared to current standard of care treatments in Canada. Although the results of the MAIC suggest that zanubrutinib is associated with improved OS and PFS compared to BR, and with improved PFS compared to DRC, the considerable lack of precision in these estimates and the limitations surrounding the inclusion and exclusion criteria of the comparator studies mean that any conclusions with respect to the treatments’ comparative efficacy would be highly uncertain.
In their input to CADTH, both the patient and clinician groups emphasized that having a choice in treatment options was of great importance to them. The patient group indicated that their symptoms have a considerable negative impact on their QoL and physical and mental functioning. Patients reported that they would like to have access to treatments that result in better QoL and longer remission while causing fewer side effects and offering an easier form of administration. Given that almost all patients with WM relapse and need further treatment, zanubrutinib may present an additional treatment option after failure of first-line chemoimmunotherapy or in the few patients who are not suitable candidates for chemotherapy. Currently, BTK inhibitor treatment for R/R WM in Canada (most commonly ibrutinib) is only possible through compassionate access programs.
Harms
The safety profiles of zanubrutinib and ibrutinib were similar in terms of the occurrence of overall AEs and SAEs; nearly all patients had at least 1 AE, and approximately 40% of patients in each treatment arm had an SAE. The most common AEs (reported in > 20% of patients) among zanubrutinib patients were neutropenia, upper respiratory infection, and diarrhea. The most common AEs among ibrutinib patients were diarrhea, upper respiratory infection, contusion, and muscle spasms. There were notable differences between the 2 treatment arms with respect to some AEs. Neutropenia was reported in 12.2% of patients in the ibrutinib arm and by 24.8% of patients in the zanubrutinib arm. The frequency of infections, including viral, bacterial, and fungal infections, is consistent with the known safety profiles of BTK inhibitors and similar between the 2 treatment arms. Although neutropenia was greater than or equal to 10% higher among zanubrutinib-treated patients compared to ibrutinib-treated patients, this did not translate to an increased occurrence of infections in the zanubrutinib arm. Another AE with a notable difference in frequency between the 2 treatment arms was atrial fibrillation or flutter, which was reported in 14.3% of ibrutinib-treated patients and 2.0% of zanubrutinib-treated patients. Atrial fibrillation occurred within 6 months of treatment onset in 7 patients in the ibrutinib arm and in 1 patient in the zanubrutinib arm. No patient discontinued treatment due to atrial fibrillation. The clinical experts consulted by CADTH noted that the higher proportion of patients with atrial fibrillation in the zanubrutinib arm, while notable, is not out of the expected range for cardiovascular toxicities from treatment in this patient population. Fewer occurrences of hemorrhage (including minor and major bleeding) were noted in the zanubrutinib treatment arm (48.5% versus 59.2% in the ibrutinib arm). The higher frequency of bleeding events may be related to the combined effect of tyrosine kinase expressed in hepatocellular carcinoma and BTK inhibition in the platelets of ibrutinib-treated patients.18 In terms of second primary malignancy, similar frequencies were observed in both arms, which is also consistent with the known safety profile of BTK inhibitors.3 However, uncertainties remain about the temporal association with cancer development (e.g., 30% of patients had prior skin neoplasms).
Overall, the AEs associated with zanubrutinib were generally consistent with the known safety profile of BTK inhibitors, and did not differ based on genotype (MYD88L265P versus MYD88WT). Most AEs could be actively managed in the pivotal trial by dose modification, dose discontinuation, and/or standard medical practice. When considering clinical practice, given that maintenance of response requires continuous treatment, managing treatment toxicities may be more challenging than in the clinical trial setting.
Conclusions
Based on clinical evidence from the ASPEN trial, the relative efficacy of zanubrutinib for the treatment of unfit, treatment-naive and R/R patients with WM did not surpass that of the comparator, ibrutinib, another BTK inhibitor for the outcome of CR and VGPR in patients with R/R WM. The safety profiles of zanubrutinib and ibrutinib were similar in terms of the occurrence of overall AEs and SAEs. Notable differences in toxicity between the 2 treatments included a higher incidence of atrial fibrillation in the ibrutinib arm and a higher incidence of neutropenia in the zanubrutinib arm. Ibrutinib is not publicly funded in Canada. Currently, it is only available for patients with WM through compassionate access programs. Given the lack of head-to-to-head studies evaluating zanubrutinib versus the most relevant comparators in Canada, and the important methodological limitations of the sponsor-submitted ITC, no conclusions could be drawn regarding the efficacy and safety of zanubrutinib compared with currently used chemoimmunotherapy regimens in patients with WM who are treatment-naive or R/R.
Based on input from the clinicians consulted by CADTH, zanubrutinib is not expected to replace current standard of care, first-line chemoimmunotherapy treatment regimens. The clinical experts indicated that all patients with WM will likely relapse after first-line chemoimmunotherapy. The results of re-treatment with chemoimmunotherapy for R/R WM are less optimal than those for other indolent lymphomas; therefore, there is an unmet need for additional treatment options that prolong remission in patients with R/R WM. Given that patients become immunosuppressed with initial therapy, additional treatment options that minimize toxicity during relapse are desirable. The clinicians indicated that, based on their clinical experience with BTK inhibitors, zanubrutinib may be more tolerable than the chemoimmunotherapy treatments currently used to treat patients with R/R WM.
References
1.Dimopoulos MA, Kastritis E, Ghobrial IM. Waldenstrom's macroglobulinemia: a clinical perspective in the era of novel therapeutics. Ann Oncol. 2016;27(2):233-240. PubMed
2.Treon SP, Hunter ZR, Aggarwal A, et al. Characterization of familial Waldenstrom's macroglobulinemia. Ann Oncol. 2006;17(3):488-494. PubMed
3.Health Canada reviewer's report: Brukinsa (zanubrutinib) [internal sponsor's report]. Ottawa (ON): Therapeutics Products Directorate, Health Canada; 2021.
4.Castillo JJ, Treon SP. Management of Waldenstrom macroglobulinemia in 2020. Hematology Am Soc Hematol Educ Program. 2020;2020(1):372-379. PubMed
5.Owen RG, Kyle RA, Stone MJ, et al. Response assessment in Waldenstrom macroglobulinaemia: update from the VIth International Workshop. Br J Haematol. 2013;160(2):171-176. PubMed
6.NCCN Guidelines. Waldenström’s Macroglobulinemia / Lymphoplasmacytic Lymphoma version 1.2021. Plymouth Meeting (PA): National Cancer Care Network (NCCN); 2015: www.nccn.org. Accessed 2021 Jun 08.
7.Clinical Study Report: BGB-3111-302. A phase 3, randomized, open-label, multicenter study comparing the efficacy and safety of the Bruton’s tyrosine kinase (BTK) inhibitors BGB-3111 and ibrutinib in subjects with Waldenström’s macroglobulinemia (WM) [internal sponsor's report]. San Mateo (CA): BeiGene, Ltd.; 2020 Jun 30.
8.Gertz MA. Waldenstrom macroglobulinemia: 2017 update on diagnosis, risk stratification, and management. Am J Hematol. 2017;92(2):209-217. PubMed
9.Kristinsson SY, Bjorkholm M, Goldin LR, McMaster ML, Turesson I, Landgren O. Risk of lymphoproliferative disorders among first-degree relatives of lymphoplasmacytic lymphoma/Waldenstrom macroglobulinemia patients: a population-based study in Sweden. Blood. 2008;112(8):3052-3056. PubMed
10.Castillo JJ, Olszewski AJ, Kanan S, Meid K, Hunter ZR, Treon SP. Overall survival and competing risks of death in patients with Waldenstrom macroglobulinaemia: an analysis of the Surveillance, Epidemiology and End Results database. Br J Haematol. 2015;169(1):81-89. PubMed
11.Kastritis E, Kyrtsonis MC, Morel P, et al. Competing risk survival analysis in patients with symptomatic Waldenstrom macroglobulinemia: the impact of disease unrelated mortality and of rituximab-based primary therapy. Haematologica. 2015;100(11):e446-449. PubMed
12.Varettoni M, Tedeschi A, Arcaini L, et al. Risk of second cancers in Waldenstrom macroglobulinemia. Ann Oncol. 2012;23(2):411-415. PubMed
13.Center for Drug Evaluation Research. Multidiscipline review(s). Brukinsa (zanubrutinib) oral capsule. Company: BeiGene USA, Inc. Application No.:213217. Approval date: 11/14/2019 (FDA approval package). Silver Spring (MD): U.S. Food and Drug Administration (FDA); 2019: https://www.accessdata.fda.gov/drugsatfda_docs/nda/2019/213217Orig1s000MultidisciplineR.pdf. Accessed 2021 Sep 22.
14.Brukinsa (zanubrutinib): 80 mg oral capsules [product monograph]. Basel (CH): BeiGene Switzerland GmbH; 2021 Feb 26.
15.McGowan J, Sampson M, Salzwedel DM, Cogo E, Foerster V, Lefebvre C. PRESS Peer Review of Electronic Search Strategies: 2015 guideline statement. J Clin Epidemiol. 2016;75:40-46. PubMed
16.Dimopoulos M, Sanz RG, Lee HP, et al. Zanubrutinib for the treatment of MYD88 wild-type Waldenstrom macroglobulinemia: a substudy of the phase 3 ASPEN trial. Blood Advances. 2020;4(23):6009-6018. PubMed
17.Lim KJC, Tam CS. Zanubrutinib for the treatment of Waldenstrom Macroglobulinemia. Expert Rev Hematol. 2020;13(12):1303-1310. PubMed
18.Tam CS, Opat S, D'Sa S, et al. A randomized phase 3 trial of zanubrutinib vs ibrutinib in symptomatic Waldenstrom macroglobulinemia: the ASPEN study. Blood. 2020;136(18):2038-2050. PubMed
19.Trotman J, Opat S, Gottlieb D, et al. Zanubrutinib for the treatment of patients with Waldenstrom macroglobulinemia: 3 years of follow-up. Blood. 2020;136(18):2027-2037. PubMed
20.Dimopoulos MA, Kastritis E, Owen RG, et al. Treatment recommendations for patients with Waldenstrom macroglobulinemia (WM) and related disorders: IWWM-7 consensus. Blood. 2014;124(9):1404-1411. PubMed
21.Morel P, Duhamel A, Gobbi P, et al. International prognostic scoring system for Waldenstrom macroglobulinemia. Blood. 2009;113(18):4163-4170. PubMed
22.Dimopoulos MA, Trotman J, Tedeschi A, et al. Ibrutinib for patients with rituximab-refractory Waldenstrom's macroglobulinaemia (iNNOVATE): an open-label substudy of an international, multicentre, phase 3 trial. Lancet Oncol. 2017;18(2):241-250. PubMed
23.Treon SP, Tripsas CK, Meid K, et al. Ibrutinib in previously treated Waldenstrom's macroglobulinemia. N Engl J Med. 2015;372(15):1430-1440. PubMed
24.Brukinsa (zanubrutinib) for the treatment of Waldenström’s macroglobulinemia. Indirect treatment comparison results and technical report [internal sponsor's report]. In: Drug Reimbursement Review sponsor submission: Brukinsa (zanubrutinib), 80 mg oral capsules. Mississauga (ON): BeiGene (Canada) ULC; 2021 May 17.
25.Phillippo DM, Ades AE, Dias S, Palmer S, Abrams KR, Welton NJ. Methods for Population-Adjusted Indirect Comparisons in Health Technology Appraisal. Med Decis Making. 2018;38(2):200-211. PubMed
26.Treon SP, Yang G, Hanzis C, et al. Attainment of complete/very good partial response following rituximab-based therapy is an important determinant to progression-free survival, and is impacted by polymorphisms in FCGR3A in Waldenstrom macroglobulinaemia. Br J Haematol. 2011;154(2):223-228. PubMed
27.Aaronson NK, Ahmedzai S, Bergman B, et al. The European Organization for Research and Treatment of Cancer QLQ-C30: a quality-of-life instrument for use in international clinical trials in oncology. J Natl Cancer Inst. 1993;85(5):365-376. PubMed
28.Georgakopoulos A, Kontodimopoulos N, Chatziioannou S, Niakas D. EORTC QLQ-C30 and FACT-Lym for the assessment of health-related quality of life of newly diagnosed lymphoma patients undergoing chemotherapy. Eur J Oncol Nurs. 2013;17(6):849-855. PubMed
29.Bjordal K, de Graeff A, Fayers PM, et al. A 12 country field study of the EORTC QLQ-C30 (version 3.0) and the head and neck cancer specific module (EORTC QLQ-H&N35) in head and neck patients. EORTC Quality of Life Group. Eur J Cancer. 2000;36(14):1796-1807. PubMed
30.EQ-5D-5L user guide, 2019. Rotterdam (NL): EuroQol Research Foundation; 2019: https://euroqol.org/wp-content/uploads/2021/01/EQ-5D-5LUserguide-08-0421.pdf. Accessed 2021 Sep 22.
31.Pickard AS, Neary MP, Cella D. Estimation of minimally important differences in EQ-5D utility and VAS scores in cancer. Health Qual Life Outcomes. 2007;5:70-70. PubMed
32.McClure NS, Sayah FA, Xie F, Luo N, Johnson JA. Instrument-Defined Estimates of the Minimally Important Difference for EQ-5D-5L Index Scores. Value Health. 2017;20(4):644-650. PubMed
33.Fayers PM, Aaronson NK, Bjordal K, et al. The EORTC QLQ-C30 scoring manual (3rd Edition). Brussels (BE): European Organisation for Research and Treatment of Cancer; 2001: https://www.eortc.org/app/uploads/sites/2/2018/02/SCmanual.pdf?bcs-agent-scanner=2c148f07-1edf-8445-a6a1-949c6d31e5f8. Accessed 2021 Sep 22.
34.Osoba D, Aaronson N, Zee B, Sprangers M, te Velde A. Modification of the EORTC QLQ-C30 (version 2.0) based on content validity and reliability testing in large samples of patients with cancer. The Study Group on Quality of Life of the EORTC and the Symptom Control and Quality of Life Committees of the NCI of Canada Clinical Trials Group. Qual Life Res. 1997;6(2):103-108. PubMed
35.Reeve BB, Wyrwich KW, Wu AW, et al. ISOQOL recommends minimum standards for patient-reported outcome measures used in patient-centered outcomes and comparative effectiveness research. Qual Life Res. 2013;22(8):1889-1905. PubMed
36.Osoba D, Rodrigues G, Myles J, Zee B, Pater J. Interpreting the significance of changes in health-related quality-of-life scores. J Clin Oncol. 1998;16(1):139-144. PubMed
37.Xie F, Pullenayegum E, Gaebel K, et al. A Time Trade-off-derived Value Set of the EQ-5D-5L for Canada. Med Care. 2016;54(1):98-105. PubMed
Appendix 1: Literature Search Strategy
Note that this appendix has not been copy-edited.
Clinical Literature Search
Overview
Interface: Ovid
Databases:
MEDLINE All (1946-present)
Embase (1974-present)
Note: Subject headings and search fields have been customized for each database. Duplicates between databases were removed in Ovid.
Date of search: June 21, 2021
Alerts: Bi-weekly search updates until project completion
Search filters applied: No filters were applied
Limits:
Publication date limit: none
Language limit: none
Conference abstracts: excluded
Syntax | Description |
|---|---|
/ | At the end of a phrase, searches the phrase as a subject heading |
MeSH | Medical Subject Heading |
* | Before a word, indicates that the marked subject heading is a primary topic; or, after a word, a truncation symbol (wildcard) to retrieve plurals or varying endings |
.ti | Title |
.ot | Original title |
.ab | Abstract |
.hw | Heading word; usually includes subject headings and controlled vocabulary |
.kf | Author keyword heading word (MEDLINE) |
.kw | Author keyword (Embase) |
.dq | Candidate term word (Embase) |
.pt | Publication type |
.rn | Registry number |
.nm | Name of substance word (MEDLINE) |
medall | Ovid database code: MEDLINE All, 1946 to present, updated daily |
oemezd | Ovid database code; Embase, 1974 to present, updated daily |
Multi-Database Strategy
(Brukinsa* or zanubrutinib* or BGB 3111* or BGB3111* or AG9MHG098Z*).ti,ab,kf,ot,hw,rn,nm.
1 use medall
*zanubrutinib/
(Brukinsa* or zanubrutinib* or BGB 3111* or BGB3111*).ti,ab,kw,dq.
or/3-4
5 use oemezd
6 not conference abstract.pt.
2 or 7
remove duplicates from 8
Clinical Trials Registries
ClinicalTrials.gov
Produced by the US National Library of Medicine. Targeted search used to capture registered clinical trials.
[Search -- Studies with results | Brukinsa OR zanubrutinib OR BGB 3111 OR BGB3111]
WHO ICTRP
ICTRP, produced by the World Health Organization. Targeted search used to capture registered clinical trials.
[Search terms -- Brukinsa OR zanubrutinib OR BGB 3111 OR BGB3111]
Health Canada’s Clinical Trials Database
Produced by Health Canada. Targeted search used to capture registered clinical trials.
[Search terms -- Brukinsa OR zanubrutinib OR BGB 3111 OR BGB3111]
EU Clinical Trials Register
European Union Clinical Trials Register, produced by the European Union. Targeted search used to capture registered clinical trials.
[Search terms -- Brukinsa OR zanubrutinib OR BGB 3111 OR BGB3111]
Grey Literature
Search dates: June 08, 2021 – June 15, 2021
Keywords: [Brukinsa OR zanubrutinib OR Waldenström macroglobulinemia OR lymphoplasmacytic lymphoma]
Limits: Publication years: no limits
Updated: Search updated prior to the CADTH pan-Canadian Oncology Drug Review Expert Committee (pERC) meeting
Relevant websites from the following sections of the CADTH grey literature checklist Grey Matters: A Practical Tool for Searching Health-Related Grey Literature were searched:
Health Technology Assessment Agencies
Health Economics
Clinical Practice Guidelines
Drug and Device Regulatory Approvals
Advisories and Warnings
Drug Class Reviews
Clinical Trials Registries
Databases (free)
Internet Search.
Appendix 2: Excluded Studies
Note that this appendix has not been copy-edited.
Reference | Reason for Exclusion |
|---|---|
Lim et al. 202017 | Review |
Trotman et al., 202019 | Phase II study |
Appendix 3: Description and Appraisal of Outcome Measures
Note that this appendix has not been copy-edited.
Aim
To describe the following outcome measures and review their measurement properties (validity, reliability, responsiveness to change, and MID):
EORTC QLQ-C30
EQ-5D-5L
Findings
Table 35: Summary of Outcome Measures and Their Measurement Properties
Outcome measure | Type | Conclusions about measurement properties | MID |
|---|---|---|---|
EORTC QLQ-C30 | 30-item, patient-reported, cancer-specific, quality of life questionnaire using 4- and 7- point Likert scales.27 | Reliability of the EORTC QLQ-C30 in HL and DLBCL patients undergoing chemotherapy measured by Cronbach alpha was 0.79 for GHS/QoL, 0.51-0.85 for functional scales, and 0.82 to 0.86 for symptom scales/items.28 No evidence of validity, reliability, or responsiveness in patients with WM. | No MID identified in patients with WM. Patients with cancer29:
|
EQ-5D-5L | Generic, preference-based measure of HRQoL.30 | No evidence of validity, reliability, or responsiveness in patients with WM. | No MID identified in patients with WM. All cancers (including lymphoma) in the US: 0.07-0.09 (by ECOG PS), and 0.06-0.07 (by FACT-G).31 Canadian population: 0.037 for the health state index score.32 Patients with advanced cancer: 7 to 12 for the VAS.31 |
DLBCL = diffuse large B-cell lymphoma; ECOG PS = Eastern Cooperative Oncology Group Performance Status; EORTC QLQ-C30 = European Organization for Research and Treatment of Cancer Quality of Life Questionnaire Core 30; EQ-5D = EuroQol 5-Dimensions; GHS = global health status; HL = Hodgkin lymphoma; HRQoL = health-related quality of life; MID = minimal important difference; QoL = quality of life; VAS = Visual Analogue Scale; WM = Waldenström macroglobulinemia.
EORTC QLQ-C30
Description and Scoring
The European Organization for Research and Treatment of Cancer Quality of Life Questionnaire Core 30 (EORTC QLQ-C30) is one of the most used patient-reported outcome measures in oncology clinical trials. It is a multidimensional, cancer-specific, measure of HRQoL.27
The EORTC QLQ-C30 is composed of both multi-item scales and single-item measures. These include 5 functional scales (physical, role, cognitive, emotional, and social), 3 symptom scales (fatigue, pain, and nausea and vomiting), a global health status/QoL scale, and 6 single items assessing additional symptoms commonly reported by cancer patients (dyspnea, loss of appetite, insomnia, constipation and diarrhea) and perceived financial impact of the disease.27
The EORTC QLQ-C30 uses a 1-week recall period to assess function and symptoms. All the scales and single-item measures range in score from 0 to 100. Most questions have 4 response options (“not at all,” “a little,” “quite a bit,” “very much”), with scores on these items ranging from one to 4. For the 2 items that form the global QoL scale, the response format is a 7-point Likert-type scale with anchors at 1 = “very poor” and 7 = “excellent.” Raw scores for each scale are computed as the average of the items that contribute to a particular scale. Scale sum scores are transformed so that a high score on the functional scales represents a high/healthy level of functioning, a high score on the symptom scales represents a high level of symptomatology, and a high score on the global health status/QoL represents a high QoL.33
According to the EORTC QLQ-C30 scoring algorithm, if there are missing items for a scale (i.e., the participant did not provide a response), the score for the scale can still be computed if there are responses for at least half of the items. It is assumed that the missing items have values equal to the average of those items for what the respondent completed.33
The third edition of the EORTC QLQ-C30 was used in to evaluate HRQoL in the ASPEN trial.
Assessment of Validity and Reliability
In its initial development, the EORTC QLQ-C30 underwent an evaluation of its psychometric properties and demonstrated reliability and validity in cancer patients in multicultural clinical research settings.27 A revision of the EORTC QLQ-C30 was undertaken to improve low internal consistency estimates and content validity for the role functioning scale and emphasis on physical functioning in the global QoL scale.34 The original and new versions were in a total of 1,181 patients with cancer in Canada and the Netherlands. Internal consistency improved in role functioning scale in the new version (Cronbach alpha ranging from 0.78 to 0.88), and substitution of the new item for the previous did not alter internal consistency (Cronbach alpha ranging from 0.81 to -0.92).34
The EORTC QLQ-C30 (Version 3.0) is the version currently in use, which differed from the previous Version 2.0 in that the number of response options for the first 5 items of the questionnaire that comprise the Physical Function scale were increased from 2 response options (yes/no in Version 2.0) to 4 (not at all, a little, quite a bit, very much). Internal consistency reliability, construct validity, criterion validity, and responsiveness of the EORTC QLQ-C30 Version 3.0 was assessed in 622 head and neck cancer patients from 12 countries which demonstrated that version 3.0 was more reliable than previous versions.29 Internal consistency of the multi-item scales was assessed using Cronbach alpha, with a value of 0.70 being considered adequate.35 The internal consistency of the new Physical Function scale of the EORTC QLQ-C30 Version 3.0 was 0.84, compared with 0.66 in Version 1.0. The EORTC QLQ-C30 Version 3.0 was able to discriminate between head and neck cancer patients who were disease-free, who were newly diagnosed, and those with recurrent disease. As well, differences were noted between stages and according to Karnofsky performance status (KPS), as the new scale had a stronger association with KPS. Further, there was a high correlation observed between scores on the EORTC QLQ-C30 Version 3.0 and symptom/toxicity scores. Responsiveness to change was assessed using the standardized response mean (SRM), with an SRM of 0.20 being considered small, 0.50 being considered medium, and 0.80 being considered large. The changes in the scores of QLQ-C30 demonstrated a small to medium SRM in response to treatment over time with scores mostly deteriorating between 5 and 10 points.29
In a study by Georgakopoulos et al., 2013, the validity of the EORTC QLQ-C30 was assessed in 80 newly diagnosed patients with Hodgkins lymphoma and diffuse large B-cell lymphoma (DLBCL) undergoing chemotherapy (Adriamycin, Bleomycin, Vinblastine, Darcabazine for Hodgkin lymphoma, and R-CHOP for DLBCL).28 Data were collected from the Clinical Research section of the Biomedical Research Foundation of the Academy of Athens in patients who had completed their chemotherapy (4-8 ABVD cycles or 6-8 R-CHOP cycles). The QLQ-C30 and other questionnaires were administered for self-completion, and the researcher was present for any clarifications. A difference of more than 10 units was considered significant for the 0-100 scales. Reliability as measured by Cronbach alpha for the EORTC QLQ-C30 was 0.79 for global health status/QoL, ranged from 0.51 to 0.85 for functional scales, and 0.82 to 0.86 for symptom scales/items indicating acceptable internal consistency for most dimensions. However, in the 2 functional scales of the QLQ-C30 instrument (emotional and cognitive functioning) the threshold of 0.70 was not met (0.63 and 0.51), demonstrating a more questionable internal consistency reliability for these domains. No statistically significant differences between patients with HL and those with DLBCL were recorded, with exception in the symptom scale of the QLQ-C30 “appetite loss,” where a statistically significant higher score for patients with HL was observed. The study determined that the Greek version of the EORTC QLQ-C30 appeared to be reliable and valid tools to assess HRQoL in lymphoma patients and should be used in compliment with the FACT-Lym questionnaire.28
Evidence of validity, and reliability of the EORTC QLQ-C30 was not identified in the literature for patients with WM.
Minimally Important Difference
One study from 1998 conducted in patients with breast cancer and small-cell lung cancer estimated a clinically relevant change in score on any scale of the EORTC QLQ-C30 to be 10 points. The estimate was based on a study that used an anchor-based approach to estimate the MID in which patients who reported “a little” change (for better or worse) on the subjective significance questionnaire had corresponding changes on a function or symptom scale of the EORTC QLQ-C30 of approximately 5 to 10 points. Participants who reported a “moderate” change had corresponding changes in the EORTC QLQ-C30 of about 10 to 20 points, and those who reported being “very much” changed had corresponding changes of more than 20 points.36
No MID in WM specifically has been identified.
EQ-5D-5L
Description and Scoring
The EuroQol 5-Dimensions (EQ-5D) questionnaire is a generic, utility-based measure of HRQoL. The EQ-5D-5L is a 2-part questionnaire consisting of the EQ-5D descriptive system and the EQ VAS with a recall period of one day. The descriptive system consists of 5 dimensions including mobility, self-care, usual activities, pain/discomfort and anxiety/depression. Each dimension has 5 levels: no problems, slight problems, moderate problems, severe problems, and extreme problems. Each decision corresponds to a 1-digit number that expresses the level selected for that dimension which are combined into a 5-digit number that describes the patient’s health state, for a total of 3,125 possible health states. Health states can be summarized using the 5-digit code or represented by a single summary index value which reflects how good or bad a health state is according to the preferences of the general population of a country/region. The summary index is derived by applying weights to each level in each dimension. The index is calculated by deducting the appropriate weights from 1, the value for full health (i.e., state 11111). Scores less than 0 represent health states that are valued by society as being worse than dead, while scores of 0 and 1.00 are assigned to the health states ‘dead’ and ‘perfect health,’ respectively.30
Valuation of the EQ-5D summary value sets for Canada was undertaken in 2012 based on composite time trade-off and traditional time trade-off techniques. Scores of −0.148 and 0.949 were reported as the worst and best EQ-5D-5L states, respectively.37
The EQ VAS records the patient’s self-rated health on a vertical Visual Analogue Scale, where the end points are labelled ‘The best health you can imagine’ and ‘The worst health you can imagine.’ The VAS can be used as a quantitative measure of health outcome that reflect the patient’s own judgment at that specific time point.30
Assessment of Validity, and Reliability
Evidence of validity and reliability of the EQ-5D-5L for patients with WM was not identified in the literature.
Minimally Important Difference
Pickard et al. conducted a retrospective analysis of 534 patients with 11 types of cancer (including lymphoma) to estimate the MID using distribution-based (SEM, 1/2 SD, and 1/3 SD) and anchor-based (ECOG) methods.31 Using both anchor-based and distribution-based methods, estimates of the MID for the EQ-5D-5L ranged from 0.07 to 0.09 grouped by ECOG PS for all cancers, and 0.06 to 0.07 when based on FACT-G quintiles. MIDs for the EQ-5D VAS ranged from 8 to 12 based on the ECOG performance status, and from 7 to 10 based on FACT QoL questionnaire quintiles.
McClure et al. (2017) obtained the MID for the EQ-5D-5L by calculating the average absolute difference between the index score of the baseline health state and the index score of all single-level transitions from the baseline state. Single-level transitions across all 3,125 health states were averaged to arrive at MIDs for various countries, by applying country-specific scoring algorithms. For Canada, transitions between levels 3 and 4 were excluded from the average to form a constant distribution of MID values across the range of baseline scores. This analysis resulted in a Canadian-specific MID of 0.037.32
No information on the MID of the EQ-5D-5L in patients with WM was found.
Pharmacoeconomic Review
Abbreviations
AE
adverse event
BIA
budget impact analysis
Bor-DR
bortezomib-dexamethasone-rituximab
BR
bendamustine-rituximab
DRC
dexamethasone-rituximab-cyclophosphamide
ICER
incremental cost-effectiveness ratio
ITC
indirect treatment comparison
HR
hazard ratio
ITT
intention to treat
MAIC
matching-adjusted indirect comparison
OS
overall survival
PFS
progression-free survival
QALY
quality-adjusted life-year
RDI
relative dose intensity
R/R
relapsed/refractory
TN
treatment-naive
TTD
time to treatment discontinuation
WM
Waldenström macroglobulinemia
Executive Summary
The executive summary comprises 2 tables (Table 1 and Table 2) and a conclusion.
Item | Description |
|---|---|
Drug product | Zanubrutinib (Brukinsa), 80 mg, oral capsules |
Submitted price | $67.9833 per capsule |
Indication | Treatment of adult patients with Waldenström macroglobulinemia |
Health Canada approval status | NOC |
Health Canada review pathway | Priority review |
NOC date | March 1, 2021 |
Reimbursement request | As per indication |
Sponsor | BeiGene (Canada) ULC |
Submission history | Previously reviewed: No |
NOC = Notice of Compliance.
Table 2: Summary of Economic Evaluation
Component | Description |
|---|---|
Type of economic evaluation | Cost-utility analysis Partitioned survival model |
Target populations | R/R and TN patients with WM |
Treatment | Zanubrutinib |
Comparators | In R/R patients: BR In TN patients: DRC |
Perspective | Canadian publicly funded health care payer |
Outcomes | QALYs, LYs |
Time horizon | Lifetime (30 years) |
Key data source |
|
Submitted results |
|
Key limitations |
|
CADTH reanalysis results |
|
Bor-DR = bortezomib-dexamethasone-rituximab; BR = bendamustine-rituximab; DRC = dexamethasone-rituximab-cyclophosphamide; ICER = incremental cost-effectiveness ratio; inc. = including; LY = life-year; MAIC = matching-adjusted indirect comparison; OS = overall survival; PFS = progression-free survival; QALY = quality-adjusted life-year; R/R = relapsed/refractory; TN = treatment-naive; WM = Waldenström macroglobulinemia.
Conclusions
The CADTH clinical review noted that. due to the lack of head-to-to-head studies comparing zanubrutinib to a relevant drug regimen in Canada and the important methodological limitations of the indirect treatment comparison (ITC), no conclusions could be drawn regarding the efficacy of zanubrutinib compared with standard chemotherapy regimens in patients with relapsed/refractory (R/R) or treatment-naive (TN) Waldenström macroglobulinemia (WM).
Due to unknown clinical effects, CADTH was unable to derive a base case. As a result, the cost-effectiveness of zanubrutinib versus relevant Canadian clinical comparators is unknown. The matching-adjusted indirect comparisons (MAICs) conducted by the sponsor were limited by the clinical heterogeneity between the included studies, imprecise results for progression-free survival (PFS) and overall survival (OS), and the inherent methodological deficiencies associated with MAICs. Furthermore, the studies included in the ITCs do not reflect the standard of care for patients with WM in Canada. Thus, no conclusions can be drawn from the MAICs, and there is no evidence to support an incremental benefit of zanubrutinib over treatments used in current Canadian practice. Therefore, it should not be inferred that zanubrutinib is equivalent to other comparators; rather, it is emphasized that there is no evidence available to inform the comparative clinical effectiveness of zanubrutinib.
To explore the potential disparity in drug costs, CADTH attempted to calculate treatments costs in R/R and TN populations using the most relevant comparators, as determined by clinical experts. In the R/R population, zanubrutinib was associated with a per-patient lifetime drug cost of $514,116, while the cost of the comparator regimen, bortezomib-dexamethasone-rituximab (Bor-DR), was $32,463 if taken for the maximum number of treatment cycles. In the TN population, zanubrutinib was associated with lifetime drug costs of up to $805,190 per patient, while the cost of the comparator regimen, bendamustine-rituximab (BR), was $37,135 if taken for the maximum number of treatment cycles. Therefore, although there is a high degree of clinical uncertainty regarding whether zanubrutinib provides incremental clinical benefit over currently funded treatments, there is a known substantial cost difference. In the absence of clinical information to justify this increase in treatment cost, price reductions would be required to ensure treatment costs are similar to currently funded options that could be displaced. To ensure cost parity with BR in the TN setting, a price reduction in excess of 95% would be required. To ensure cost parity with Bor-DR in the R/R setting, a price reduction in excess of 93% would be required. In both instances, these price reductions may not necessarily ensure cost-effectiveness, given that they assume equivalence of effect — an assumption for which there is no evidence.
Stakeholder Input Relevant to the Economic Review
This section is a summary of the feedback received from the patient groups, registered clinicians, and drug plans that participated in the CADTH review process.
Four patient groups provided input for the review of zanubrutinib in WM. CADTH received input from The CanCertainty Coalition, which comprises more than 30 patient groups, cancer health charities, and caregiver organizations across Canada. The CanCertainty Coalition collected data for this submission using literature, Canadian prescription drug insurance coverage, population demographics, and previously conducted surveys. CADTH also received input from Lymphoma Canada in collaboration with Canadian Organization for Rare Disorders and Waldenström Macroglobulinemia Foundation of Canada. These groups conducted an online survey of 281 patients with WM, of whom 47% lived in Canada and 8% had experience with zanubrutinib. About 40% of the patients surveyed by Lymphoma Canada, Canadian Organization for Rare Disorders, and Waldenström Macroglobulinemia Foundation of Canada were currently receiving treatment, which most commonly consisted of chemotherapy monotherapy, monoclonal antibodies, and Bruton tyrosine kinase inhibitors, the latter being most common in later lines of therapy. The most common side effect of treatment was fatigue, with neutropenia, nausea, anemia, peripheral neuropathy, and thrombocytopenia also being common. Patients experienced with zanubrutinib reported bruising or bleeding as the most common side effects, but felt that overall, zanubrutinib had fewer side effects than other therapies. Patients noted that the oral formulation led to ease of administration.
CADTH received clinical group input from the Ontario Health (Cancer Care Ontario) Hematology Cancer Drug Advisory Committee. The clinicians indicated that first-line therapy for WM includes BR and ibrutinib-rituximab (accessible through private pay). Chlorambucil is prescribed for palliative care. Treatments for patients who have relapsed include either re-treatment with BR, ibrutinib-rituximab, other rituximab-chemotherapy combinations, or palliative chlorambucil. Clinicians stated that zanubrutinib may be used in first-line or relapsed WM, but that the greatest unmet need is among patients with relapsed disease.
Feedback from the drug plans suggested that zanubrutinib has the possibility for drug-drug interactions, potentially increasing pharmacy resource use. The drug plans also noted that a confidential negotiated price exists for biosimilar rituximab, and that bendamustine and bortezomib are available in a generic format.
The sponsor’s model addressed concerns associated with adverse events (AEs), such as anemia, neutropenia, and thrombocytopenia.
In addition, CADTH addressed concerns from the drug plans by using the price for generic bendamustine and bortezomib in the reanalysis and cost comparison table (Table 8).
CADTH was unable to address the following concerns raised in the stakeholder input:
Bruising, bleeding, and fatigue were not included as AEs in the sponsor’s pharmacoeconomic analysis.
The sponsor used the comparator dexamethasone-rituximab-cyclophosphamide (DRC) in TN patients rather than BR, which had been noted as the preferred first-line therapy by the clinical group. Therefore, the cost-effectiveness of zanubrutinib versus BR in a first-line setting is unknown.
CADTH based the cost comparison (Table 8) and reanalyses on publicly available prices, which may not reflect the confidential price for biosimilar rituximab.
Economic Review
The current review is for zanubrutinib (Brukinsa) for the treatment of adult patients with WM.
Economic Evaluation
Summary of Sponsor’s Economic Evaluation
Overview
The sponsor submitted a cost-utility analysis assessing zanubrutinib compared to commonly used chemotherapy and chemoimmunotherapy regimens for WM. Two separate, distinct populations were modelled: a TN population in whom DRC was the comparator, and an R/R population in which BR was the comparator. These 2 modelled populations encompass the Health Canada indication, which broadly states that zanubrutinib is indicated for adults with WM.1 The modelled population aligned with the indication and reimbursement request.
Zanubrutinib is available as an 80 mg oral capsule. The recommended total daily dose of zanubrutinib is 320 mg. Zanubrutinib may be taken as either 320 mg (four 80 mg capsules) once daily or 160 mg (two 80 mg capsules) twice daily.1 Treatment with zanubrutinib should continue until disease progression or unacceptable toxicity. The price per 80 mg capsule is $67.9833, with a cost per package of $8,158.00 for 120 capsules. The cost per 28-day cycle used by the sponsor was $7,434.
The comparator in the R/R population was BR, which consisted of rituximab (375 mg/m2) on day 1 plus bendamustine (90 mg/m2) on days 1 and 2, infused intravenously every 4 weeks. This was assumed to continue for 6 cycles or until disease progression, with a 28-day cost of $8,113. The comparator in the TN population was DRC, which consisted of 20 mg IV dexamethasone and rituximab 375 mg/m2 IV on day 1, and cyclophosphamide 100 mg/m2 orally twice daily on days 1 through 5, repeated every 3 weeks. This was assumed to continue for 6 cycles or until disease progression, and had a 28-day cost of $3,960. No vial sharing was assumed in the sponsor’s base case.
The submitted model reported both quality-adjusted life-years (QALYs) and life-years over a lifetime horizon (30 years). The base-case analysis was conducted from the perspective of the Canadian public health care system, with discounting (1.5% per annum) applied to both costs and outcomes.
Model Structure
The sponsor submitted a standard partitioned survival model with 3 mutually exclusive health states: pre-progression, post-progression, and death. All patients entered the model in the pre-progression health state and remained there until disease progression or death. Transition probabilities between health states were defined by parametric OS and PFS curves. The proportion of patients in the pre-progression health state was defined as the area under the PFS curve. The proportion of patients in the post-progression state was defined as the area under the OS curve, but above the PFS curve, with the death state making up the remainder of the patient population (above the OS curve). Patients were at risk of death in both the pre- and post-progression health states. OS and PFS data for zanubrutinib were derived from the phase III ASPEN trial for zanubrutinib versus ibrutinib.2 The sponsor conducted 2 MAICs to derive hazard ratios (HRs) for PFS and OS for each of the comparators, BR and DRC. Time to treatment discontinuation (TTD) was also included to calculate zanubrutinib drug costs. The cycle length was 28 days, with a half-cycle correction applied.
Model Inputs
The population in the model was derived from the intention-to-treat (ITT) population of the phase III ASPEN trial, which compared zanubrutinib (n = 101) to ibrutinib (n = 99) in patients with WM. Patients eligible for this trial had R/R WM (n = 83 in the zanubrutinib arm) after greater than or equal to 1 prior line of therapy or TN WM (n = 19 in the zanubrutinib arm) and were unsuitable for standard immunochemotherapy due to the presence of documented comorbidities or risk factors. The mean baseline age was 69.5 years, and 67% of participants were male. Patients were followed for a median of 18 months for PFS and OS.
The ITT population of ASPEN was used to inform the clinical effectiveness of zanubrutinib. PFS, OS, and TTD information from the study was extrapolated beyond the trial period using parametric modelling. The modelling approach was chosen based on internal validity according to Akaike information criteria and Bayesian information criteria fit statistics, clinical plausibility of OS, and alignment of TTD and PFS.
The sponsor chose the regimens BR and DRC as their comparators in the base case based on clinical practice guidelines, available evidence, and funding status in Canada. The sponsor conducted a MAIC to determine the comparative clinical effectiveness of zanubrutinib versus BR and DRC. One single-arm trial was used for the comparison, with BR in R/R patients3; another single-arm trial was used for the comparison of DRC in TN patients.4,5 Compared with BR, zanubrutinib was associated with improved PFS (HR = 0.32; 95% CI, 0.15 to 0.69 and HR = 0.37; 95% CI, 0.15 to 0.9 before and after matching and adjustment, respectively) and improved OS (HR = 0.31; 95% CI, 0.12 to 0.80 and HR = 0.29; 95% CI, 0.10 to 0.85 before and after matching, respectively). Compared with DRC, zanubrutinib was associated with improved PFS (HR = 0.39; 95% CI, 0.18 to 0.82 and HR = 0.35; 95% CI, 0.14 to 0.86 before and after matching and adjustment, respectively) and |||||||||||||||||||||||||||||||||||||||||||||||||||||||||||||||||||||||||||||||||||||||||||||||||||||||||||| |||||||||||||||||||||||||||||||||||||||||||||||||||||||||||||||||||||||||||||||||||||||||||||||||||||||||||||||||||||||||||||||||||||||||||||||||||||||||||||||||||||||||| The primary analyses comparing zanubrutinib with BR and DRC were conducted using the baseline patient characteristics of the ASPEN ITT population after matching adjustment.
For the base-case modelling of zanubrutinib versus BR, the sponsor chose an independent exponential model and an independent Weibull model for OS for the zanubrutinib and BR arms, respectively. A dependent exponential model was chosen for PFS, and an independent exponential model was chosen for TTD. In the base case for zanubrutinib versus DRC, the sponsor chose a dependent gamma model for both zanubrutinib and DRC, a dependent exponential model for PFS, and an independent exponential model for TTD.
The dose of zanubrutinib used in the sponsor’s model was assumed to be 320 mg per day, which reflects the product monograph.1 The sponsor included a relative dose intensity (RDI) of 97.6%, leading to a 28-day cost for zanubrutinib of $7,434. The dosages used in the model for the comparators BR and DRC were according to the single-arm trials that informed the MAIC and were described earlier.3,4
The sponsor calculated a utility of 0.791 for patients in the pre-progression state based on the EuroQol 5-Dimensions 5-Levels data captured in ASPEN.2 The sponsor assumed that utility would be reduced by 12.8% in the progressed state, based on values reported in a prior economic evaluation for chronic lymphocytic leukemia, resulting in a utility value of 0.690.6 AEs greater than or equal to grade 3 that occurred in greater than or equal to 5% of patients in any treatment arm were included in the model. Specifically, these consisted of anemia, hypertension, neutropenia, pneumonia, and thrombocytopenia. Disutilities, derived from published literature, were applied for the durations of the AEs as follows: for anemia, 0.1917; for hypertension, 0.1538; for neutropenia, 0.1859; for pneumonia, 0.1959; and for thrombocytopenia, a disutility of 0.108 was applied.7
Acquisition costs for comparators were derived from the Ontario and Nova Scotia drug formularies and a previous CADTH review.10-12 An administration cost of $130.47 was applied to all IV therapies based on a Quebec study.13 AEs were associated with a 1-time cost applied during the first model cycle, the unit costs of which were derived from the Ontario Case Costing Initiative and ranged from $306 to $457 for anemia, hypertension, neutropenia, pneumonia, and thrombocytopenia.14 The sponsor assumed the use of subsequent treatment for 86% of all patients, regardless of treatment received, based on the National Institute for Health and Care Excellence review of ibrutinib.9 For those on zanubrutinib, it was assumed that 60.4% and 39.6% of patients would receive BR and DRC, respectively. For patients receiving BR in the model, 10% were assumed to receive ibrutinib and 90% were assumed to receive DRC. For patients receiving DRC initially, 10% and 90% were assumed to receive ibrutinib and BR, respectively.15 The sponsor also included routine care costs for patients with WM comprising blood work, immunoglobulin monitoring, hematologist fees, and other monitoring, the frequencies of which were derived from the National Institute for Health and Care Excellence review of ibrutinib.9 Finally, a 1-time terminal care cost of $61,013 was applied upon death, based on sex-specific terminal care costs reported in the literature.16
Summary of Sponsor’s Economic Evaluation Results
All analyses were run probabilistically (5,000 iterations for the base-case and scenario analyses). The deterministic and probabilistic results differed considerably for the TN and R/R populations. The deterministic incremental cost-effectiveness ratio (ICER) was lower in both cases. The probabilistic findings are presented in the following section.
Base-Case Results
In the R/R WM population, zanubrutinib was associated with incremental costs of $576,295 and QALYs of 4.40 in comparison with BR, for an ICER of $130,853 per QALY. In the TN WM population, zanubrutinib was associated with incremental costs of $740,508 and QALYs of 2.69 in comparison with DRC, for an ICER of $275,579 (Table 3). Further details on the sponsor’s submitted results are available in Appendix 3.
Table 3: Summary of the Sponsor’s Economic Evaluation Results
Drug | Total costs ($) | Incremental costs ($) | Total QALYs | Incremental QALYs | ICER ($/QALY) |
|---|---|---|---|---|---|
Relapsed/refractory population | |||||
BR | 169,534 | Reference | 7.25 | Reference | Reference |
Zanubrutinib | 745,829 | 576,295 | 12.91 | 4.40 | 130,853 |
TN population | |||||
DRC | 164,954 | Reference | 8.89 | Reference | Reference |
Zanubrutinib | 905,462 | 740,508 | 12.07 | 2.69 | 275,579 |
BR = bendamustine-rituximab; DRC = dexamethasone-rituximab-cyclophosphamide; ICER = incremental cost-effectiveness ratio; QALY = quality-adjusted life-year; TN = treatment naive.
Note: The submitted analyses are based on the publicly available prices of comparators and may not reflect confidential, negotiated prices.
Source: Sponsor’s pharmacoeconomic submission.17
Sensitivity and Scenario Analysis Results
The sponsor conducted a scenario analysis comparing zanubrutinib with ibrutinib based on the ASPEN trial. This analysis, which found zanubrutinib to dominate ibrutinib, was considered a scenario analysis because ibrutinib is not routinely funded in Canada for WM, having received a negative recommendation from the CADTH pan-Canadian Oncology Drug Review in 2016.18 Sensitivity analyses were conducted around the time horizon, discounting rate, and subsequent treatment assumptions.
CADTH Appraisal of the Sponsor’s Economic Evaluation
CADTH identified several key limitations to the sponsor’s analysis that have notable implications on the economic analysis.
There is no evidence to support an incremental benefit of zanubrutinib over current Canadian clinical practice: The sponsor conducted a systematic literature review to identify relevant studies for an ITC that would assess the relative efficacy of zanubrutinib compared to chemotherapeutic regimens currently funded by Canadian public plans. The studies for comparison3-5 were chosen on the basis of their sample sizes and the availability of OS, PFS, and baseline characteristic data; however, they do not necessarily reflect Canadian clinical practice. Clinical experts consulted by CADTH noted that BR is considered the standard of care in first-line therapy (i.e., in TN patients) on the basis of treatment practices for other indolent lymphomas. This is reflected in the sponsor’s budget impact analysis (BIA), in which a market share of 81% for BR for patients in first-line therapy is assumed.19 However, in the pharmacoeconomic analysis, the sponsor chose DRC as its comparator in the TN population, based on the data available in the publications.20 CADTH contends that the comparison between zanubrutinib and DRC in the TN population is less relevant to clinical practice, and that the more appropriate comparator in the TN population would be BR. Clinical experts also noted that, while there is no accepted standard of care in the R/R setting, bortezomib-based regimens are preferred in Canada; therefore, the comparison of zanubrutinib to BR in the R/R setting may not necessarily reflect clinical practice, either. In addition, the CADTH clinical review concluded that, given the lack of head-to-to-head studies and important methodological limitations of the sponsor-submitted ITC, no conclusions could be drawn regarding the efficacy and safety of zanubrutinib compared with currently used chemoimmunotherapy regimens in patients with WM who are TN or R/R.
Due to a paucity of clinical evidence and a high degree of uncertainty involving the appropriate comparators for WM, CADTH was unable to derive a base case. With no evidence to support an incremental benefit of zanubrutinib, there are no reliable data to inform an economic model used to predict QALYs. Because zanubrutinib is given until unacceptable toxicity or progression — whereas other comparators are given for a defined number of treatment cycles — CADTH conducted an analysis of treatment costs to explore the potential additional drug costs associated with zanubrutinib.
Overestimation of the survival of patients with WM, particularly those receiving zanubrutinib: The sponsor modelled the clinical effectiveness of zanubrutinib on the ASPEN trial, which had a median follow-up of 18 months for PFS in the zanubrutinib arm.21 Using an exponential regression for OS and PFS, the sponsor extrapolated the Kaplan–Meier data from ASPEN trial to the rest of the patient’s lifetime. The use of an exponential regression has the property that the rate of death or progression remains the same throughout the extrapolation. However, this is not clinically plausible, given that patients will naturally have an increased risk of death as they age. This assumption by the sponsor led to another clinically implausible consequence: that patients with WM would eventually have better survival outcomes than those of the general population. This led the sponsor to adjust OS such that the mortality rate of patients with WM would equal, rather than surpass, that of the general population after around 10 years. Because PFS is also bounded by OS, the implicit assumption in the sponsor’s base case is that a proportion of patients being treated with zanubrutinib will reach a point in time after which they are not expected to progress and will not have increased mortality as a result of their cancer. These assumptions were deemed implausible by clinical experts consulted by CADTH, who stated that there was no evidence that patients would reach a point after which they are no longer expected to progress.
Furthermore, the sponsor vastly overestimated the survival of patients with WM as a result of its regression analysis. For the comparison of zanubrutinib and BR in the sponsor’s base case, it was assumed that after 10 years, 70% of patients on zanubrutinib would still be alive; that after 15 years, 54% would be alive; and that after 25 years, 14% would still be alive, with an average age of 95 years. This regression assumption does not meet face validity. The life expectancy of the average Canadian is 82 years,22 but the sponsor has assumed that 54% of patients will still be alive at age 85, suggesting a longer life expectancy for patients with WM than for the general population. Moreover, the sponsor’s own pharmacoeconomic report stated that the median survival of patients with WM was 5 years.17 According to clinical experts, the sponsor’s survival assumptions overestimate the expected survival of patients being treated with zanubrutinib. They suggested that the average life expectancy of a patient with WM would be between 8 years and 10 years, and preferred the gamma regression for OS, in which 22% of patients are alive after 10 years and 7% are alive after 15 years in the R/R setting.
Although CADTH did not use the sponsor’s model to predict QALY gains due to insufficient comparative efficacy, CADTH used the sponsor’s model to predict lifetime zanubrutinib drug costs. To do so, CADTH used a gamma regression for OS, PFS, and TTD to estimate zanubrutinib costs in the R/R setting.
Bendamustine is available in a generic form with a reduced price: The sponsor used a price of $1,250.00 per 100 mg for bendamustine, based on the branded price. However, bendamustine is available in a generic form23 with a price of $1,062.50 per 100 mg, based on the IQVIA Delta PA wholesale price (accessed July 2021).24 The generic price is more reflective of the price paid by the public drug plans and more appropriate for use in the economic model.
As part of the analysis of treatment costs, CADTH used the price for generic bendamustine.
Assumptions of subsequent treatment use are associated with uncertainty: As part of the base case, the sponsor considered what subsequent treatment patients with WM might receive after progressing on each of zanubrutinib, BR, and DRC. Ibrutinib, which is not funded in any jurisdiction in Canada, was included as a potential subsequent therapy, with the assumption that 10% of patients relapsing on BR or DRC would receive it. Most patients failing zanubrutinib or BR were assumed to be treated with DRC. However, the comparison between zanubrutinib and BR was done in a population of R/R patients who had already failed a certain number of therapies, as indicated in the ASPEN trial; it is unclear which, if any, therapies would be used in an R/R population that had also failed zanubrutinib. Lastly, clinical experts consulted by CADTH were of the opinion that bortezomib-based regimens would be used frequently in an R/R population, but these was not included by the sponsor as a comparator. Due to this uncertainty, CADTH chose not to consider subsequent treatment in the pharmacoeconomic model.
As part of its analysis of treatment costs, CADTH did not consider costs associated with subsequent treatment, using the sponsor-provided option to do so.
RDI of zanubrutinib underestimated: The sponsor assumed an RDI of 97.6%. However, because zanubrutinib is an oral therapy, CADTH does not expect there to be any issues with the RDI.
As part of its analysis of treatment costs, CADTH assumed an RDI of 100%.
Additionally, the key assumptions shown in Table 4 were made by the sponsor and appraised by CADTH.
Table 4: Key Assumptions of the Submitted Economic Evaluation (Not Noted as Limitations to the Submission)
Sponsor’s key assumption | CADTH comment |
|---|---|
The relative safety between zanubrutinib and BR was assumed to be the same as that between zanubrutinib and DRC. | Uncertain. The incidence of AEs was derived from the ASPEN trial for zanubrutinib and from the single-arm studies included in the MAIC for BR and DRC. The MAIC did not assess safety outcomes. CADTH did not include the cost of AEs in the analysis of treatment costs due to this uncertainty. |
Total management costs for AEs were applied as a 1-time cost during the first model cycle, estimated as the sum of the product of the AE incidence and associated unit costs. | Uncertain. This approach does not allow for the discounting of AE costs because all are applied in the first cycle. |
The sponsor assumed that utility would be reduced by 12.8% in the progressed state based on values reported in a prior economic evaluation in chronic lymphocytic leukemia. | Uncertain. It would have been preferable if utility measurements had been available from the ASPEN trial for the post-progression state. |
AE = adverse event; BR = bendamustine-rituximab; DRC = dexamethasone-cyclophosphamide-rituximab; MAIC = matching-adjusted indirect comparison.
CADTH Reanalyses of the Economic Evaluation
CADTH Reanalysis Results
CADTH was unable to determine a base case for the cost-effectiveness of zanubrutinib in patients with WM due to a paucity of clinical evidence, specifically a lack of reliable evidence for comparators that are relevant in a Canadian context. However, given that current treatment regimens are used for a defined number of treatment cycles, while zanubrutinib is used until progression or toxicity, treatment with zanubrutinib will result in increased drug costs if given for longer than 6 cycles of BR (i.e., 24 weeks). CADTH sought to quantify these increased drug costs by estimating treatment costs in the R/R and TN populations for zanubrutinib and relevant comparators.
In the R/R population, the sponsor’s model was used to estimate the lifetime costs of zanubrutinib while incorporating the CADTH revisions summarized in Table 5. The main comparator in the R/R population was Bor-DR, based on clinical expert feedback and a published clinical trial.25 In the TN population, the sponsor’s original model was used to estimate lifetime costs of zanubrutinib without any revisions by CADTH, given that the model was not flexible enough to allow for clinically plausible survival assumptions deemed appropriate by clinical experts. The comparator in the TN population was BR, based on clinical expert feedback. The costs for Bor-DR and BR were derived from the CADTH cost comparison table (Table 8) and based on a maximum of 5 cycles for Bor-DR and 6 cycles for BR. This assumes that 100% of patients receive the full number of treatment cycles of each comparator. CADTH acknowledges that this is likely an overestimation, because some patients will discontinue before completing therapy. Administration costs for Bor-DR and BR were also considered in the cost comparison to account for the oral route of administration of zanubrutinib, which would not incur such costs. Discounting of costs at 1.5% per annum was applied to zanubrutinib because these were estimated using the sponsor’s model. Discounting was not performed for the calculation of Bor-DR and BR costs because the maximum 6 cycles are assumed to be given within the first year of treatment initiation.
Table 5: CADTH Revisions to the Submitted Economic Evaluation (Used to Estimate Lifetime Costs of Zanubrutinib in the R/R Population)
Stepped analysis | Sponsor’s value or assumption | CADTH value or assumption |
|---|---|---|
Corrections to sponsor’s base case | ||
1. Considered generic price of bendamustine | $1,250.00 per 100 mg | $1,062.50 per 100 mg |
Changes to derive the CADTH reanalysis | ||
1. Survival extrapolations for zanubrutinib in an R/R population | OS: Exponential | OS: Gamma |
PFS: Exponential | PFS: Gamma | |
TTD: Exponential | TTD: Gamma | |
2. Subsequent treatment costs | Included for consideration | Did not include |
3. Relative dose intensity | 97.6% | 100% |
CADTH reanalysis (corrected) | — | Reanalysis 1 + 2 + 3 |
OS = overall survival; PFS = progression-free survival; R/R = relapsed or refractory; TTD = time to treatment discontinuation.
In the R/R population, CADTH used the sponsor’s model with CADTH revisions to estimate the lifetime drug acquisition costs of zanubrutinib. These costs were compared to those of Bor-DR, the most relevant comparator in the R/R setting, according to clinical experts. A maximum of 5 cycles of Bor-DR therapy was assumed,25 with an administration cost of $130.47 applied 4 times per cycle.13 The results of this cost comparison are shown in Table 6. Zanubrutinib was associated with a lifetime cost of $514,116, while Bor-DR was associated with a lifetime cost of $32,463. A price reduction of at least 93% would be required to ensure cost parity with Bor-DR in the R/R setting.
In the TN population, CADTH used the sponsor’s original model to estimate the lifetime drug acquisition costs of zanubrutinib. CADTH acknowledges that this likely overestimates the total costs, given that the sponsor’s original model overestimated the life expectancy of patients with WM. This estimate may be considered the upper bound of the lifetime zanubrutinib costs, while the lower bound can be assumed to be the value obtained from the sicker R/R population ($514,116). Zanubrutinib costs in the TN setting were compared to BR, the most relevant comparator, according to clinical experts. A maximum of 6 cycles were assumed, with an administration cost of $130.47 applied 3 times per cycle, according to the sponsor’s original assumptions.17 The results of this cost comparison are shown in Table 7. Zanubrutinib was associated with lifetime costs of $805,190, while BR was associated with lifetime costs of $37,135. A price reduction of at least 95% would be required to ensure cost parity with BR in the TN setting.
The purpose of these analyses is to explore the potential cost burden associated with a treatment option given until progression or toxicity versus a treatment given for a fixed number of treatment cycles. Because there is no reliable information to inform relative clinical efficacy, a full economic evaluation would provide limited insight into incremental health outcomes, such as progression, and their associated costs. Although treatment costs are only a partial component of the economic analysis, there is limited evidence to provide conclusions regarding any other component of the analysis.
Table 6: Summary of Treatment Costs (Relapsed/Refractory Population)
Treatment | Cost category | Total costs ($) | Source |
|---|---|---|---|
Zanubrutinib | Drug acquisition | 514,116 | Sponsor’s PE model (with CADTH revisions) |
Drug administration | 0 | Assumption | |
Total costs | 514,116 | Addition | |
BRa | Drug acquisition | 34,787 | |
Drug administration | 2,348 | Calculation13 | |
Total costs | 37,135 | Addition | |
DRC | Drug acquisition | Not the most relevant comparator in this setting, according to clinical experts | |
Drug administration | |||
Total costs | |||
Bor-DR | Drug acquisition | 29,853 | |
Drug administration | 2,609 | Calculation13 | |
Total costs | 32,463 | Addition | |
Bor-DR = bortezomib-dexamethasone-and rituximab; BR = bendamustine-rituximab; DRC = dexamethasone-rituximab-cyclophosphamide; PE = pharmacoeconomic.
aAlthough Bor-DR was suggested as the most relevant comparator in the R/R setting, clinical experts noted that some patients may receive BR. A price reduction of at least 92% would be required to ensure cost parity with BR in the R/R setting.
Table 7: Summary of Treatment Costs (TN Population)
Treatment | Cost category | Total costs ($) | Source |
|---|---|---|---|
Zanubrutinib | Drug acquisition | 805,190 | Sponsor’s PE model17 |
Drug administration | 0 | Assumption | |
Total costs | 805,190 | Addition | |
BR | Drug acquisition | 34,787 | |
Drug administration | 2,348 | Calculation13 | |
Total costs | 37,135 | Addition | |
DRC | Drug acquisition | Not the most relevant comparator in this setting, according to clinical experts | |
Drug administration | |||
Total costs | |||
Bor-DR | Drug acquisition | Not the most relevant comparator in this setting, according to clinical experts | |
Drug administration | |||
Total costs | |||
Bor-DR = bortezomib-dexamethasone-rituximab; BR = bendamustine-rituximab; DRC = dexamethasone-rituximab-cyclophosphamide; PE = pharmacoeconomic; TN = treatment naive.
Overall Conclusions
The CADTH clinical review noted that, due to the lack of head-to-to-head studies for zanubrutinib versus a relevant comparator in Canada, and the important methodological limitations of the ITC, no conclusions could be drawn regarding the efficacy of zanubrutinib compared with standard chemotherapy regimens in patients with R/R or TN WM.
Due to unknown clinical effects, CADTH was unable to derive a base case. As a result, the cost-effectiveness of zanubrutinib versus relevant Canadian clinical comparators is unknown. The MAICs conducted by the sponsor were limited by the clinical heterogeneity between the included studies, imprecise results for PFS and OS, and the inherent methodological deficiencies associated with MAICs. Furthermore, the studies included in the ITCs do not reflect the standard of care for patients with WM in Canada. Thus, no conclusions can be drawn from the MAICs, and there is no evidence to support an incremental benefit of zanubrutinib over treatments used in current Canadian practice. Therefore, it should not be inferred that zanubrutinib is equivalent to other comparators; rather, it is emphasized that there is no evidence available to inform the comparative clinical effectiveness of zanubrutinib.
To explore the potential disparity in drug costs, CADTH attempted to calculate treatments costs in R/R and TN populations using the most relevant comparators, as determined by clinical experts. In the R/R population, zanubrutinib was associated with a per-patient lifetime drug cost of $514,116, while the cost of the comparator regimen, Bor-DR, was $32,463, if taken for the maximum number of treatment cycles. In the TN population, zanubrutinib was associated with a lifetime drug cost of up to $805,190 per patient, while the cost of the comparator regimen, BR, was $37,135 if taken for the maximum number of treatment cycles. Therefore, although there is a high degree of clinical uncertainty regarding whether zanubrutinib provides incremental clinical benefit over currently funded treatments, there is a known substantial cost difference. In the absence of clinical information to justify this increase in treatment cost, price reductions would be required to ensure treatment costs are similar to currently funded options that could be displaced. To ensure cost parity with BR in the TN setting, a price reduction in excess of 95% would be required. To ensure cost parity with Bor-DR in the R/R setting, a price reduction in excess of 93% would be required. In both instances, these price reductions may not necessarily ensure cost-effectiveness because they assume equivalence of effect — an assumption for which there is no evidence.
References
1.Brukinsa (zanubrutinib): 80 mg oral capsules [product monograph]. Basel (CH): BeiGene Switzerland GmbH; 2021 Feb 26.
2.Clinical Study Report: BGB-3111-302. A phase 3, randomized, open-label, multicenter study comparing the efficacy and safety of the Bruton’s tyrosine kinase (BTK) inhibitors BGB-3111 and ibrutinib in subjects with Waldenström’s macroglobulinemia (WM) [internal sponsor's report]. San Mateo (CA): BeiGene, Ltd.; 2020 Jun 30.
3.Tedeschi A, Picardi P, Ferrero S, Benevolo G, Margiotta Casaluci G, Varettoni M. Bendamustine and rituximab combination is safe and effective as salvage regimen in Waldenstom macroglobulinemia. Leuk Lymphoma. 2015;56(9):2637-2642. PubMed
4.Dimopoulos M, Anagnostopoulos A, Kyrtsonis M, Zervas K, Tsatalas C, Kokkinis G. Primary treatment of Waldenstom macroglobulinemia with dexamethasone, rituximab, and cyclophosphamide. J Clin Oncol. 2007;25(22):3344-3349. PubMed
5.Kastritis E, Gavriatopoulou M, Kyrtsonis M, Roussou M, Hadjiharissi E, Symeonidis A. Dexamethasone, rituximab, and cyclophosphamide as primary treatment of Waldenstom macroglobulinemia: final analysis of a phase 2 study. Blood. 2015;126(11):1392-1394. PubMed
6.Beusterien K, Davies J, Leach M, Meiklejohn D, Grinspan J, O'Toole A. Population preference values for treatment outcomes in chronic lymphocytic leukaemia: a cross-sectional utility study. Health Qual Life Outcomes. 2010;8:50. PubMed
7.Beauchemin C, Letarte N, Mathurin K, Yelle L, Lachaine J. A global economic model to assess the cost-effectiveness of new treatments for advanced breast cancer in Canada. J Med Econ. 2016;19:619-629. PubMed
8.Swinburn P, Lloyd A, Nathan P, Choueiri T, Cella D, Neary M. Elicitation of health state utilities in metastatic renal cell carcinoma. Curr Med Res Opin. 2010;26(5):1091-1096. PubMed
9.Tappenden P, Carroll C, Stevens J, Simpson E, Thokala P, Wong R. Ibrutinib for treating Waldenstrom's macroglobulinaemia: an evidence review group perspective of a NICE single technology appraisal. Pharmacoeconomics. 2019;37(1):7-18. PubMed
10.Nova Scotia Formulary. Halifax (NS): Nova Scotia Department of Health; 2021: https://novascotia.ca/dhw/pharmacare/documents/formulary.pdf. Accessed 2021 Sep 21.
11.Ontario Ministry of Health, Ontario Ministry of Long-Term Care. Ontario drug benefit formulary/comparative drug index. 2021; https://www.formulary.health.gov.on.ca/formulary/. Accessed 2021 Jul 5.
12.pan-Canadian Oncology Drug Review pharmacoeconomic report: venetoclax (Venclexta) rituximab for chronic lymphocytic leukemia. Ottawa (ON): CADTH; 2019 May 31: https://cadth.ca/sites/default/files/pcodr/Reviews2019/10162VenetoclaxRituximabCLL_fnEGR_NOREDACT-ABBREV_31May2019_final.pdf. Accessed 2021 Sep 21.
13.Shinder G, Paradis P, Posman M, Mishagina N, Guay M, Linardos D. Patient and work flow and costs associated with staff time and facility usage at a comprehensive cancer centre in Quebec, Canada - a time and motion study. BMC Health Serv Res. 2012;12:370. PubMed
14.Ontario Case Costing Initiative (OCCI). Toronto (ON): Ontario Health and Long-Term Care; 2017: https://data.ontario.ca/dataset/ontario-case-costing-initiative-occi. Accessed 2021 Sep 21.
15.Bomsztyk J, D’Sa S, McCarthy H, et al. The Rory Morrison Registry: First UK Waldenstrom's Macroglobulinaemia registry report. Dendrite Clinical Systems Ltd: Oxfordshire (UK); 2018: https://e-dendrite.com/Publishing/Reports/Macroglobulinaemia/WM2018.pdf. Accessed 2021 Sep 21.
16.de Oliveira C, Pataky R, Bremner K, Rangrej J, Chan K, Cheung W. Phase-specific and lifetime costs of cancer care in Ontario, Canada. BMC Cancer. 2016;16(1):809. PubMed
17.Pharmacoeconomic evaluation [internal sponsor's report]. In: Drug Reimbursement Review sponsor submission: Brukinsa (zanubrutinib), 80 mg oral capsules. Mississauga (ON): BeiGene (Canada) ULC; 2021 Jun 08.
18.CADTH pCODR Expert Review Committee (pERC) final recommendation: ibrutinib (Imbruvica). Ottawa (ON): CADTH; 2016 Nov 03: https://cadth.ca/sites/default/files/pcodr/pcodr_ibrutinib_imbruvica_wm_fn_rec.pdf. Accessed 2021 Sep 21.
19.Budget Impact Analysis [internal sponsor's report]. In: Drug Reimbursement Review sponsor submission: Brukinsa (zanubrutinib), 80 mg oral capsules. Mississauga (ON): BeiGene (Canada) ULC; 2021 Jun 08.
20.Brukinsa (zanubrutinib) for the treatment of Waldenström’s macroglobulinemia. Indirect treatment comparison results and technical report [internal sponsor's report]. In: Drug Reimbursement Review sponsor submission: Brukinsa (zanubrutinib), 80 mg oral capsules. Mississauga (ON): BeiGene (Canada) ULC; 2021 May 17.
21.Tam C, Opat S, D'Sa S, et al. A randomized phase 3 trial of zanubrutinib vs ibrutinib in symptomatic Waldenstom macroglobulinemia: the ASPEN study. Blood. 2020;136(18):2038-2050. PubMed
22.Table: 13-10-0114-01. Life expectancy and other elements of the life table, Canada, all provinces except Prince Edward Island. Ottawa (ON): Statistics Canada; 2020: https://www150.statcan.gc.ca/t1/tbl1/en/tv.action?pid=1310011401. Accessed 2021 Sep 21.
23.Nat-bendamustine (bendamustine hydrochloride): 25 mg/ vial and 100 mg/ vial lyophilized powder for intravenous infusion or for injection [product monograph]. Mississauga (ON): Natco Pharma (Canada) Inc.; 2020 Mar 04: https://pdf.hres.ca/dpd_pm/00060095.PDF. Accessed 2021 Jul 23.
24.DeltaPA. Ottawa (ON): IQVIA; 2021: https://www.iqvia.com/. Accessed 2021 Sep 21.
25.Dimopoulos M, Garcia-Sanz R, Gavriatopoulou M, et al. Primary therapy of Waldenstrom macroglobulinemia (WM) with weekly bortezomib, low-dose dexamethasone, and rituximab (BDR): long-term results of a phase 2 study of the European Myeloma Network (EMN). Blood. 2013;122(19):3276-3282. PubMed
26.Exceptional Access Program (EAP). Toronto (ON): Ontario Ministry of Health; Ontario Ministry of Long-Term Care; 2021: https://www.health.gov.on.ca/en/pro/programs/drugs/odbf/odbf_except_access.aspx. Accessed 2021 Jul 05.
27.Bortezomib (bortezomib mannitol boronic ester): 3.5 mg /vial sterile lyophilized powder for intravenous or subcutaneous injection[product monograph]. Mississauga (ON): Dr. Reddy’s Laboratories Canada Inc.; 2020 May 19: https://pdf.hres.ca/dpd_pm/00055976.PDF. Accessed 2021 Jul 23.
28.Dexamethasone sodium phosphate: 4 mg/mL and 10 mg/mL for intravenous infusion or for injection [product monograph]. Boucherville (QC): Sandoz Canada Inc.; 2020 Jun 26: https://www.sandoz.ca/sites/www.sandoz.ca/files/Dexamethasone%20Sodium%20Phosphate%20Injection%20Product%20Monograph.pdf. Accessed 2021 Jul 06.
29.Imbruvica (ibrutinib): 140 mg oral capsules [product monograph]. Toronto (ON): Janssen Inc.; 2018 Jul 24: https://pdf.hres.ca/dpd_pm/00046525.PDF. Accessed 2021 Jul 06.
30.Procytox (cyclophosphamide): 25 mg and 50 mg oral tablets, or 200 mg, 500 mg, 1000 mg, and 2000 mg powder for injection [product monograph]. Mississauga (ON): Baxter Corporation; 2012 Sep 07 https://www.baxter.ca/sites/g/files/ebysai1431/files/2018-11/PROCYTOX_PM_SEP072012_EN.pdf. Accessed 2021 Jul 06.
31.Truxima (rituximab): 10 mg/mL intravenous infusion [product monograph]. Toronto (ON): Teva Canada Limited; 2020 May 22: https://pdf.hres.ca/dpd_pm/00057805.PDF. Accessed 2021 Jul 23.
32.Table: 17-10-0005-01. Population estimates on July 1st, by age and sex. Ottawa (ON): Statistics Canada; 2020: https://www150.statcan.gc.ca/t1/tbl1/en/tv.action?pid=1710000501. Accessed 2021 Sep 21.
33.Institut national d’excellence en santé et en services sociaux. Imbruvica - Macroglobulinemie de Waldenstrom. Extract from opinion to Minister. Montreal (QC): INESSS; 2017: https://www.inesss.qc.ca/fileadmin/doc/INESSS/Inscription_medicaments/Avis_au_ministre/Fevrier_2017/Imbruvica_MW_2017_02.pdf. Accessed 2021 Sep 22.
34.pan-Canadian Oncology Drug Review clinical report: ibrutinib (Imbruvica) for Waldenstrom's Macroglobulinemia. Ottawa (ON): CADTH; 2016: https://cadth.ca/sites/default/files/pcodr/pcodr_ibrutinib_imbruvica_wm_fn_cgr.pdf. Accessed 2021 Sep 21.
35.Dimopoulos M, Kastritis E. How I treat Waldenstrom macroglobulinemia. Blood. 2019;134:2022-2035. PubMed
36.Abeykoon J, et al. Outcomes with rituximab plus bendamustine (R-Benda), dexamethasone, rituximab, cyclophosphamide (DRC), and bortezomib, dexamethasone, and rituximab (BDR) as primary therapy in patients with Waldenstrom macroglobulinemia (WM). J Clin Oncol. 2019;37(15):suppl.
37.Canadian Institute for Health Information. Prescribed drug spending in Canada 2019: a focus on public drug programs. Ottawa (ON): CIHI; 2019: https://secure.cihi.ca/free_products/PDEX-report-2019-en-web.pdf. Accessed 2021 Sep 21.
Appendix 1: Cost Comparison Table
Note that this appendix has not been copy-edited.
The comparators presented in the following table have been deemed to be appropriate based on feedback from clinical experts and drug plans. Comparators may be recommended (appropriate) practice or actual practice. Existing Product Listing Agreements are not reflected in the table and as such, the table may not represent the actual costs to public drug plans.
Table 8: CADTH Cost Comparison Table for Waldenström Macroglobulinemia
Treatment | Strength / concentration | Form (Vial size if single-use) | Price | Recommended dosage | Daily cost | 28-day cost | Annual costa |
|---|---|---|---|---|---|---|---|
Zanubrutinib (Brukinsa) | 80 mg | Capsule | $67.9833 | 320 mg daily | $271.93 | $7,614 | $99,324 Subsequent years: $99,324 |
BR3 | |||||||
Bendamustine (generic) | 5 mg/mL | Powder for IV infusion 25 mg 100 mg | $265.6300b $1,062.5000 | 90 mg/m2 daily twice every 4 weeks | $132.81 | $3,719 | NA |
Rituximab (biosimilar) | 10 mg/mL | IV infusion 10 mL 50 mL | $297.0000 $1,485.0000 | 375 mg/m2 every 4 weeks | $74.25 | $2,079 | NA |
BR regimen | $207.06 | $5,798 | $34,787 Subsequent years: $0 | ||||
DRC4 | |||||||
Cyclophosphamide | 25 mg 50 mg | Tablet | $0.3545 $0.4773 | 200 mg/m2 daily 5 times every 3 weeks | $0.91 | $25 | NA |
Dexamethasone | 4 mg/mL | IV infusion | $1.6900 | 20 mg every 3 weeks | $0.40 | $11.27 | NA |
Rituximab (biosimilar) | 10 mg/mL | IV infusion 10 mL 50 mL | $297.0000 $1,485.0000 | 375 mg/m2 every 3 weeks | $99.00 | $2,772 | NA |
DRC regimen | $100.31 | $2,809 | $16,852 Subsequent years: $0 | ||||
Bor-DR25 | |||||||
Bortezomib (generic) | 1 mg/mL | Powder for IV infusion 3.5 mg | $654.3100b | 1st cycle: 1.3 mg/m2 4 times per 21-day cycle Cycles 2 to 5: 1.6 mg/m2 4 times per 35-day cycle | $81.28 | $2,276 | NA |
Dexamethasone | 4 mg/mL | IV infusion | $1.6900 | Cycles 2 and 5: 40 mg 4 times | $0.84 | $24 | NA |
Rituximab (biosimilar) | 10 mg/mL | IV infusion 10 mL 50 mL | $297.0000 $1,485.0000 | Cycles 2 and 5: 375 mg/m2 4 times | $103.30 | $2,893 | NA |
Bor-DR regimen | $185.42 | $5,192 | $29,853 Subsequent years: $0 | ||||
Ibrutinib monotherapy21 | |||||||
Ibrutinibc | 140 mg | Capsule | $99.8350b | 420 mg daily | $299.51 | $8,386 | $109,394 Subsequent years: $109,394 |
Bor-DR = bortezomib, dexamethasone, and rituximab; BR = bendamustine and rituximab; DRC = dexamethasone, rituximab, and cyclophosphamide; IV = IV; m = metre; mg = milligram; mL = millilitre; NA = not applicable.
Note: All prices are from the Ontario Drug Benefit Formulary (accessed July 2021), unless otherwise indicated, and do not include dispensing fees.11,26 Product sizes were sourced from their respective product monographs.23,27-31 A body surface area of 1.86 m2 was used according to that observed in the ASPEN trial.2
aAnnual costs are based on 365.25 days per year. For the comparators BR and DRC a maximum of 6 treatment cycles was assumed and that assumption is reflected in the cost of $0 in subsequent years of treatment. For Bor-DR a maximum of 5 treatment cycles was assumed.25
bIQVIA Delta PA wholesale price (accessed July 2021).24
cIbrutinib is not publicly funded in any jurisdiction in Canada but may be available out-of-pocket or through compassionate use.
Appendix 2: Submission Quality
Note that this appendix has not been copy-edited.
Description | Yes/No | Comments |
|---|---|---|
Population is relevant, with no critical intervention missing, and no relevant outcome missing | No | The model was based on the ITT population of ASPEN and includes adult patients with WM previously treated with at least one prior line of therapy, or who are TN and unsuitable for chemoimmunotherapy. Clinical experts noted that TN patients would be eligible for zanubrutinib regardless of their suitability for chemoimmunotherapy, based on the Health Canada indication. Bortezomib was excluded as a relevant comparator. Clinical experts noted that in the R/R setting, bortezomib-containing regimens are preferred (e.g., CyBorD or bortezomib + rituximab). |
Model has been adequately programmed and has sufficient face validity | No | The sponsor’s base case estimation of the survival of patients with WM lacks face validity as it contradicts clinical plausibility, clinical experts, and the sponsor’s own pharmacoeconomic report. |
Model structure is adequate for decision problem | No | The survival data are too immature for the extrapolations required, leading to significant uncertainty in the long term effects of zanubrutinib. |
Data incorporation into the model has been done adequately (e.g., parameters for probabilistic analysis) | No | The deterministic ICER for the TN population is considerably lower than the probabilistic ICER. Probabilistic and deterministic results for the R/R population also differ. Probabilistic results consistently overestimate life-years gained from zanubrutinib and this is likely due to either a modelling error or an incorrect artifact from the model’s assumptions. |
Parameter and structural uncertainty were adequately assessed; analyses were adequate to inform the decision problem | No | Due to a lack of comparative clinical evidence and uncertainty surrounding the other clinical assumptions, the cost-effectiveness of zanubrutinib vs. BR or DRC cannot be determined. The study question has not been answered. |
The submission was well organized and complete; the information was easy to locate (clear and transparent reporting; technical documentation available in enough details) | No | Multiple hidden sheets, aspects of the technical report unclear (e.g., calculation of AE incidence), cost calculations unnecessarily complicated and difficult to validate, with costs per model cycle not reported in the report or model. |
AE = adverse event; CyBorD = cyclophosphamide, bortezomib, and dexamethasone; ITT = intention to treat; R/R = relapsed/refractory; TN = treatment naive; WM = Waldenström macroglobulinemia.
Appendix 3: Additional Information on the Submitted Economic Evaluation
Note that this appendix has not been copy-edited.
Detailed Results of the Sponsor’s Base Case
Table 10 and Table 11 present the cost-effectiveness results for zanubrutinib in an R/R and TN population, respectively. The comparator for the R/R population is BR and for the TN population it is DRC. The cost-effectiveness of zanubrutinib versus BR in a first-line setting is unknown.
Table 10: Sponsor’s Cost-Effectiveness Results of Zanubrutinib Versus BR (R/R Population)
Category | Zanubrutinib (matched/adjusted for BR) | BR | Incremental |
|---|---|---|---|
Life years | |||
Progression-free survival | 9.476 | 4.565 | 4.910 |
Post-progression survival | 3.438 | 2.683 | 0.755 |
Total | 12.914 | 7.249 | 5.665 |
QALY | |||
Progression-free survival | 7.495 | 3.611 | 3.884 |
Post-progression survival | 2.371 | 1.851 | 0.520 |
Adverse events | −0.003 | −0.003 | 0.000 |
Total | 9.864 | 5.460 | 4.404 |
Costs ($) | |||
Drug acquisition | 645,454 | 53,687 | 591,768 |
Drug administration | 0 | 2,594 | −2,594 |
Adverse events | 140 | 166 | −26 |
Disease management | 9,758 | 5,889 | 3,869 |
Subsequent treatment | 41,935 | 52,614 | −10,679 |
Terminal care | 48,542 | 54,584 | −6,042 |
Total | 745,829 | 169,534 | 576,295 |
ICER ($/QALY) | 130,853 | ||
BR = bendamustine and rituximab; ICER = incremental cost-effectiveness ratio; QALY = quality-adjusted life-year; R/R = relapsed/refractory.
Table 11: Sponsor’s Cost-Effectiveness Results of Zanubrutinib Versus DRC (TN Population)
Category | Zanubrutinib (matched/adjusted for DRC) | DRC | Incremental |
|---|---|---|---|
Life-years | |||
Progression-free survival | 10.172 | 5.299 | 4.873 |
Post-progression survival | 1.896 | 3.587 | −1.691 |
Total | 12.068 | 8.886 | 3.182 |
QALY | |||
Progression-free survival | 8.046 | 4.191 | 3.855 |
Post-progression survival | 1.308 | 2.474 | −1.167 |
Adverse events | −0.002 | −0.001 | −0.001 |
Total | 9.352 | 6.665 | 2.687 |
Costs ($) | |||
Drug acquisition | 805,190 | 20,130 | 785,060 |
Drug administration | 0 | 1,773 | −1,773 |
Adverse events | 104 | 40 | 64 |
Disease management | 9,197 | 7,036 | 2,161 |
Subsequent treatment | 41,496 | 83,058 | −41,562 |
Terminal care | 49,476 | 52,918 | −3,442 |
Total | 905,462 | 164,954 | 740,508 |
ICER ($/QALY) | 275,579 | ||
DRC = dexamethasone, rituximab, and cyclophosphamide; ICER = incremental cost-effectiveness ratio TN = treatment-naive; QALY = quality-adjusted life-year. .
Appendix 4: Additional Details on the CADTH Reanalyses Used to Estimate Zanubrutinib Costs in the Relapsed/Refractory Setting
Note that this appendix has not been copy-edited.
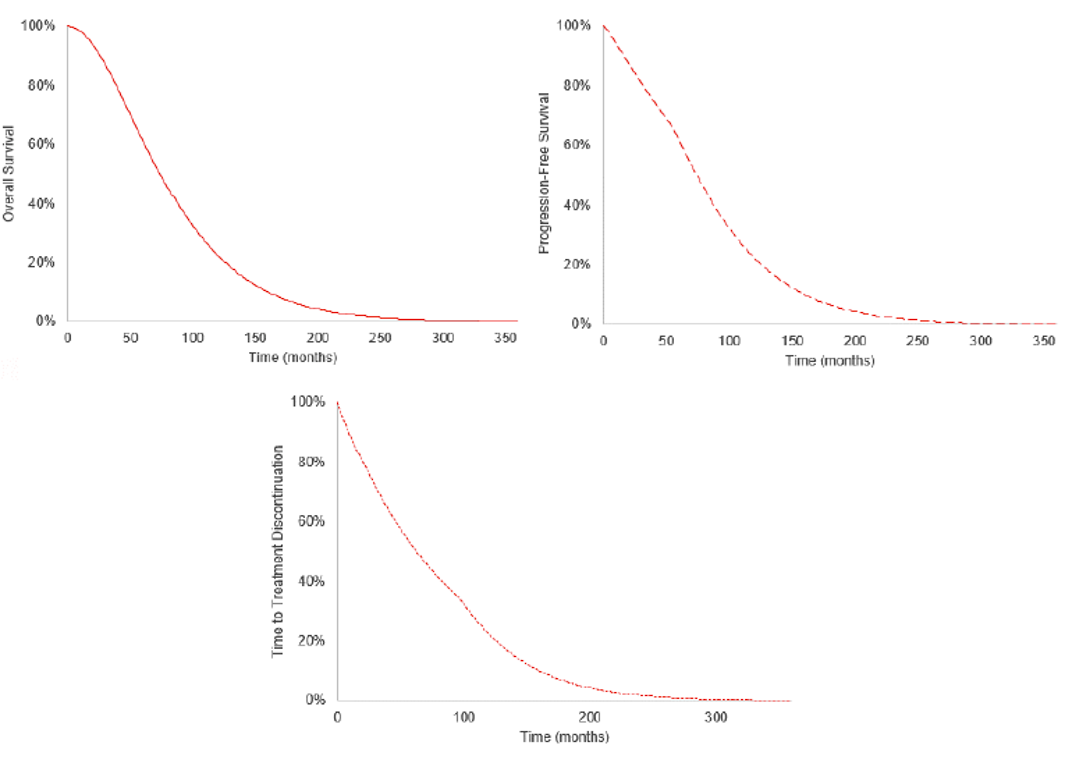
Appendix 5: Submitted BIA and CADTH Appraisal
Note that this appendix has not been copy-edited.
Table 12: Summary of Key Take-Aways
Key Take-aways of the BIA |
|---|
|
WM = Waldenström macroglobulinemia.
Summary of Sponsor’s BIA
The submitted BIA assessed the introduction of zanubrutinib for the treatment of adult patients with WM. The analysis was taken from the perspective of the Canadian public drug plans using an epidemiology-based approach, with drug acquisition costs, markup, and dispensing fees included. A 3-year time horizon was used, from 2022 to 2024, with 2021 as a base year. The population size was estimated using the prevalence and incidence of WM, and the sponsor considered both first- and second-line treatment. A summary of the sponsor’s derivation of the eligible population size is presented in Figure 2.
The comparators used in the BIA were the same as the pharmacoeconomic submission. The reference case scenario included chemoimmunotherapy with BR and DRC. The new drug scenario included zanubrutinib, BR, and DRC. Key inputs to the BIA are documented in Table 13.
Figure 2: Sponsor’s Estimation of the Size of the Eligible Population
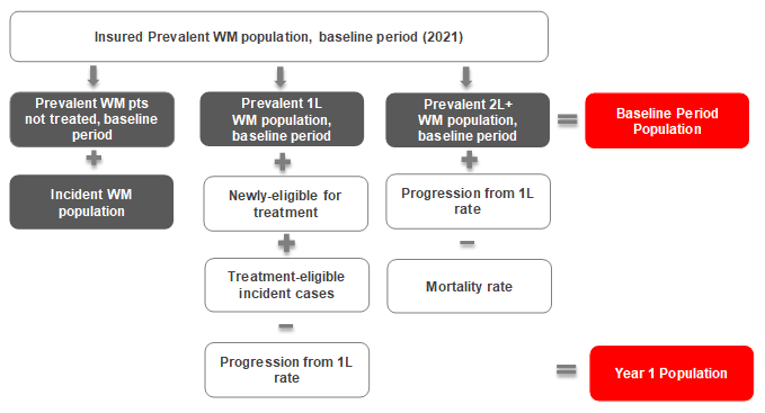
1L = first-line; 2L = second-line; WM = Waldenström macroglobulinemia.
Source: Sponsor’s budget impact submission.19
Table 13: Summary of Key Model Parameters
Parameter | Sponsor’s estimate (reported as Year 1 / Year 2 / Year 3 if appropriate) |
|---|---|
Target population | |
Canadian population | 29,104,29732 |
Prevalence of WM per million | 11.633 |
Incidence of WM per million | 0.4034 |
Proportion of prevalent/incident patients suitable for treatment | 72%35 |
Proportion of prevalent treated patients in 1L treatment | 75%17 |
Proportion of prevalent treated patients in 2L+ treatment | 25%17 |
Proportion of patients newly eligible for 1L treatment | 11.4%36 |
Proportion of 1L patients progressing to 2L+ per year | 11.4%36 |
Mortality rate in 2L+ | 0.33% (PE model) |
Proportion of patients eligible for public coverage | 80% (Assumption) |
Total eligible patients in 1L treatment | 151 / 147 / 144 |
Total eligible patients in 2L+ treatment | 65 / 82 / 99 |
Market Uptake (3 years) | |
Uptake (reference scenario) | |
1L treatment | |
BR | 85% / 85% / 85% |
DRC | 15% / 15% / 15% |
2L+ treatment | |
BR | 70% / 70% / 70% |
DRC | 30% / 30% / 30% |
Uptake (new drug scenario) | |
1L treatment | |
Zanubrutinib | 5% / 5% / 5% |
BR | 81% / 81% / 81% |
DRC | 14% / 14% / 14% |
2L+ treatment | |
Zanubrutinib | 15% / 20% / 25% |
BR | 60% / 56% / 53% |
DRC | 26% / 24% / 23% |
Cost of treatment annually (per patient) | |
Zanubrutinib BR DRC | $99,323.60 $33,186.18 $17,726.86 |
1L = first-line; 2L = second-line; BR = bendamustine and rituximab; DRC = dexamethasone, rituximab, and cyclophosphamide; PE = pharmacoeconomic; WM = Waldenström macroglobulinemia.
Summary of the Sponsor’s BIA Results
The overall estimated budget impact of funding zanubrutinib for the treatment of adult patients with WM was $1,207,021 in year 1, $1,669,979 in year 2, and $2,248,852 in year 3, for a 3-year budget impact of $5,125,851. It was estimated that the budget impact in the first-line setting would be $1,510,557 and $3,615,293 in the second-line setting over 3 years.
CADTH Appraisal of the Sponsor’s BIA
CADTH identified several key limitations to the sponsor’s analysis that have notable implications on the results of the BIA:
The incidence of WM was underestimated: The sponsor assumed an incidence of WM of 0.4 per million people, citing the CADTH clinical review of ibrutinib for WM in which is stated, “WM/lymphoplasmatic lymphoma (LPL) is a rare disease with an incidence of 3-5 per million in the US (WM and LPL combined).”34 CADTH sought clarification from the sponsor on the assumption used to calculate an incidence of 0.4 per million from the cited pCODR review. In response to the request, the sponsor submitted a new BIA and report in which numerous parameters and assumptions had been modified including population size, eligibility assumptions, progression and mortality assumptions, and market shares. As this analysis was received late in the review process, CADTH had already validated the majority of the original BIA parameters with clinical experts and did not have time to validate the new parameters submitted by the sponsor which had been modified without justification.
As part of the base case, CADTH used the original BIA submitted by the sponsor as part of the review and updated the incidence of WM to be 4 per million. This was based on retrospective data and estimates provided by clinical experts and also aligns with the midpoint of the 3 to 5 per million estimate cited in the pCODR review.34 Furthermore, it is similar to an incidence estimate of 5.5 per million from a UK registry of patients with WM.15
The proportion of patients with WM suitable for treatment was underestimated: Clinical experts consulted by CADTH noted that a proportion of patients diagnosed with WM based on their immunoglobulin M (IgM) levels may remain asymptomatic and never require chemotherapy. The sponsor assumed that 28% of patients with WM would remain asymptomatic, based on a published paper.35 However, the paper cited proposed that about 19% to 28% of patients have asymptomatic WM, of which the sponsor chose the higher proportion without justification.35
As part of the base case, CADTH estimated that about 19% of patients have asymptomatic WM based on the sponsor’s source.35 This estimate aligns with clinical expert opinion which suggested that between 15% to 25% of patients would never require therapy.
Proportion of patients covered by public drug plans underestimated: As part of their base case, the sponsor assumed that only 80% of patients would be covered under public drug plans, effectively reducing their population size estimate by 20% without justification. Based on a 2019 CIHI publication on prescribed drug spending in Canada CADTH calculated the proportion of patients with public drug coverage using the coverage rates for seniors, given that the mean age in the ASPEN trial was 69.5 years.37
As part of the base case, CADTH calculated the proportion of patients with public drug coverage to be 91.5%.
Market shares for zanubrutinib underestimated in the second-line (R/R) setting: The sponsor estimated the market share for zanubrutinib in years 1, 2, and 3 in the second-line setting to be 15%, 20%, and 25% based on oncology database data commissioned by the sponsor through a third party.19 Clinical experts consulted by CADTH suggested the market share for zanubrutinib in the second-line setting would be much higher based on a shift in treatment paradigm to second-generation Bruton tyrosine kinase inhibitors and lack of availability of ibrutinib and acalibrutinib in this population in Canada. Given the uncertainty in market share estimates (a fact acknowledged by the sponsor’s budget impact report), CADTH opted to use the estimates provided by the clinical experts. Finally, as with the pharmacoeconomic model, bortezomib was omitted as a comparator, further increasing the uncertainty in the market share estimates.
As part of the base case, CADTH used the average of the market share estimates provided directly by the clinical experts for patients in the second-line setting.
True budget impact of zanubrutinib on the drug plans is likely underestimated: The 3-year time horizon for the BIA, although aligned with the CADTH procedure for drug reimbursement reviews, does not consider the lifelong drug acquisition costs of zanubrutinib. The other comparators in the analysis, BR and DRC, are assumed to be given every 3 or 4 weeks for a maximum of 6 cycles while zanubrutinib is assumed to be given until disease progression or death (i.e., lifelong). This could be up to 10 years according to clinical experts, while the comparator costs will only be incurred for 18 or 24 weeks. Thus, the true budget impact of zanubrutinib to the drug plans is underestimated as these drug acquisition costs could continue to be incurred for an additional 5 to 7 years without a corresponding cost for the comparator treatments.
CADTH was unable to address this in reanalysis.
One additional limitation was identified but was not considered to be a key limitation. This involved the calculation of the Canadian population size in which the sponsor subtracted the Quebec population from the national population. CADTH corrected the estimate by summing the population of all 10 jurisdictions comprising CADTH’s target population.
CADTH Reanalyses of the BIA
Based on the limitations identified, CADTH corrected the base case by updating the Canadian population estimate and considering the generic price for bendamustine. Further reanalyses included changes to the incidence of WM, proportion of patients with WM requiring treatment, proportion with public drug coverage, and market share estimates.
Table 14: CADTH Revisions to the Submitted Budget Impact Analysis
Stepped analysis | Sponsor’s value or assumption | CADTH value or assumption |
|---|---|---|
Corrections to sponsor’s base case | ||
1. Canadian population | 29,104,297 | 29,847,586 |
2. Generic price of bendamustine | $1,250.00 per 100 mg | $1,062.50 per 100 mg |
— | 28-day cost: $2,581.86 | 28-day cost: $2,194.58 |
Changes to derive the CADTH base case | ||
1. Incidence of WM | 0.4 per million | 4 per million |
2. Proportion of WM patients not requiring treatment | 28% | 19% |
3. Proportion of patients with public drug coverage | 80% | 91.5% |
4. Market share estimates provided by clinical experts for 2L+ setting (year 1 / year 2 / year 3) | Zanubrutinib: 15% / 20% / 25% | Zanubrutinib: 30% / 50% / 62.5% |
BR: 60% / 56% / 53% | BR: 45% / 30% / 17.5% | |
DRC: 26% / 24% / 23% | DRC: 25% / 20% / 20% | |
CADTH base case (corrected) | Reanalysis 1 + 2 + 3 + 4 | |
2L = second-line; BR = bendamustine and rituximab; DRC = dexamethasone, rituximab, and cyclophosphamide; WM = Waldenström macroglobulinemia.
The results of the CADTH step-wise reanalysis are presented in summary format in Table 15 and a more detailed breakdown is presented in Table 16. Based on the CADTH base case, the budget impact of the reimbursement of zanubrutinib for the treatment of WM is expected to be $3,075,366 in year 1, $5,673,159 in year 2, $8,665,803 in year 3, with a 3-year budget impact of $17,414,328. CADTH estimated the budget impact in the first-line setting to be $4,435,153 and $12,979,175 in the second-line setting over 3 years. A scenario analysis was performed using a WM incidence of 5.5 per million15 which resulted in a 3-year budget impact of $19,081,277. The scenario analysis that assumed 25% of patients would remain asymptomatic and ineligible for therapy resulted in a 3-year budget impact of $16,217,253.
Table 15: Summary of the CADTH Reanalyses of the BIA
Stepped analysis | Three-year total |
|---|---|
Submitted base case (corrected) | $5,386,589 |
CADTH reanalysis 1 – incidence of WM | $7,829,921 |
CADTH reanalysis 2 – proportion of WM patients not requiring treatment | $5,980,543 |
CADTH reanalysis 3 – proportion of patients with public drug coverage | $6,012,007 |
CADTH reanalysis 4 – market share estimates | $10,505,252 |
CADTH base case | $17,414,328 |
BIA = budget impact analysis; WM = Waldenström macroglobulinemia.
Table 16: Detailed Breakdown of the CADTH Reanalyses of the BIA
Stepped analysis | Scenario | Year 0 (current situation) | Year 1 | Year 2 | Year 3 | Three-year total |
|---|---|---|---|---|---|---|
Submitted base case (corrected) | Reference | $5,862,403 | $6,260,041 | $6,636,289 | $6,995,549 | $25,754,282 |
New drug | $5,862,403 | $7,529,419 | $8,391,285 | $9,357,764 | $31,140,871 | |
Budget impact | $0 | $1,269,379 | $1,754,995 | $2,362,215 | $5,386,589 | |
CADTH base case | Reference | $9,844,164 | $12,597,916 | $15,370,225 | $18,159,683 | $55,971,988 |
New drug | $9,844,164 | $15,673,282 | $21,043,384 | $26,825,486 | $73,386,315 | |
Budget impact | $0 | $3,075,366 | $5,673,159 | $8,665,803 | $17,414,328 | |
CADTH scenario analysis 1: Incidence of 5.5 per million | Reference | $10,802,873 | $14,540,969 | $18,312,884 | $22,114,419 | $65,771,144 |
New drug | $10,802,873 | $17,853,168 | $24,466,757 | $31,729,625 | $84,852,421 | |
Budget impact | $0 | $3,312,198 | $6,153,873 | $9,615,206 | $19,081,277 | |
CADTH scenario analysis 2: 25% of patients not requiring therapy | Reference | $9,114,967 | $11,760,027 | $14,437,921 | $17,144,959 | $52,457,874 |
New drug | $9,114,967 | $14,619,307 | $19,716,169 | $25,224,685 | $68,675,127 | |
Budget impact | $0 | $2,859,279 | $5,278,248 | $8,079,726 | $16,217,253 |
BIA = budget impact analysis.
ISSN: 2563-6596
Disclaimer: The information in this document is intended to help Canadian health care decision-makers, health care professionals, health systems leaders, and policy-makers make well-informed decisions and thereby improve the quality of health care services. While patients and others may access this document, the document is made available for informational purposes only and no representations or warranties are made with respect to its fitness for any particular purpose. The information in this document should not be used as a substitute for professional medical advice or as a substitute for the application of clinical judgment in respect of the care of a particular patient or other professional judgment in any decision-making process. The Canadian Agency for Drugs and Technologies in Health (CADTH) does not endorse any information, drugs, therapies, treatments, products, processes, or services.
While care has been taken to ensure that the information prepared by CADTH in this document is accurate, complete, and up-to-date as at the applicable date the material was first published by CADTH, CADTH does not make any guarantees to that effect. CADTH does not guarantee and is not responsible for the quality, currency, propriety, accuracy, or reasonableness of any statements, information, or conclusions contained in any third-party materials used in preparing this document. The views and opinions of third parties published in this document do not necessarily state or reflect those of CADTH.
CADTH is not responsible for any errors, omissions, injury, loss, or damage arising from or relating to the use (or misuse) of any information, statements, or conclusions contained in or implied by the contents of this document or any of the source materials.
This document may contain links to third-party websites. CADTH does not have control over the content of such sites. Use of third-party sites is governed by the third-party website owners’ own terms and conditions set out for such sites. CADTH does not make any guarantee with respect to any information contained on such third-party sites and CADTH is not responsible for any injury, loss, or damage suffered as a result of using such third-party sites. CADTH has no responsibility for the collection, use, and disclosure of personal information by third-party sites.
Subject to the aforementioned limitations, the views expressed herein are those of CADTH and do not necessarily represent the views of Canada’s federal, provincial, or territorial governments or any third party supplier of information.
This document is prepared and intended for use in the context of the Canadian health care system. The use of this document outside of Canada is done so at the user’s own risk.
This disclaimer and any questions or matters of any nature arising from or relating to the content or use (or misuse) of this document will be governed by and interpreted in accordance with the laws of the Province of Ontario and the laws of Canada applicable therein, and all proceedings shall be subject to the exclusive jurisdiction of the courts of the Province of Ontario, Canada.
The copyright and other intellectual property rights in this document are owned by CADTH and its licensors. These rights are protected by the Canadian Copyright Act and other national and international laws and agreements. Users are permitted to make copies of this document for non-commercial purposes only, provided it is not modified when reproduced and appropriate credit is given to CADTH and its licensors.
About CADTH: CADTH is an independent, not-for-profit organization responsible for providing Canada’s health care decision-makers with objective evidence to help make informed decisions about the optimal use of drugs, medical devices, diagnostics, and procedures in our health care system.
Funding: CADTH receives funding from Canada’s federal, provincial, and territorial governments, with the exception of Quebec.