CADTH Reimbursement Review
Tucatinib (Tukysa)
Sponsor: Seagen Canada Inc.
Therapeutic Area: Advanced or metastatic breast cancer
This multi-part report includes:
Clinical Review
Pharmacoeconomic Review
Clinical Review
Abbreviations
AE
adverse event
BICR
blinded independent central review
CBCN
Canadian Breast Cancer Network
CI
confidence interval
CrI
credible interval
DOR
duration of response
ECOG PS
Eastern Cooperative Oncology Group performance status
EQ VAS
EuroQol Visual Analogue Scale
EQ-5D-5L
EuroQol 5-Dimensions 5-Levels questionnaire
FISH
fluorescence in-situ hybridization
HER2
human epidermal growth factor receptor 2
HR
hazard ratio
HRQoL
health-related quality of life
IHC
immunohistochemistry
ITC
indirect treatment comparison
ITT
intention to treat
MBC
metastatic breast cancer
NMA
network meta-analysis
OH-CCO B-DAC
Ontario Health (Cancer Care Ontario) Breast Disease Site Advisory Committee
OHCC
Ottawa Hospital Cancer Centre
ORR
objective response rate
OS
overall survival
PFS
progression-free survival
PFSBM
progression-free survival among the subgroup of patients with brain metastases
PFSINV
investigator-assessed progression-free survival
RECIST
Response Evaluation Criteria in Solid Tumors
SAE
serious adverse event
SD
standard deviation
T-DM1
trastuzumab emtansine
TKI
tyrosine kinase inhibitor
Executive Summary
An overview of the submission details for the drug under review is provided in Table 1.
Item | Description |
|---|---|
Drug product | Tucatinib (Tukysa), 50 mg and 150 mg tablets, orally |
Indication | Tucatinib in combination with trastuzumab and capecitabine for the treatment of patients with locally advanced unresectable or metastatic HER2-positive breast cancer, including patients with brain metastases, who have received prior treatment with trastuzumab, pertuzumab, and T-DM1 separately or in combination |
Reimbursement request | As per indication |
Health Canada approval status | NOC |
Health Canada review pathway | Standard |
NOC date | June 5, 2020 |
Sponsor | Seagen Canada Inc. |
HER2 = human epidermal growth factor receptor 2; NOC = Notice of Compliance; T-DM1 = trastuzumab emtansine.
Introduction
Breast cancer is the most commonly diagnosed cancer among women.1 Human epidermal growth factor receptor 2 (HER2) positivity may account for 15% to 20% of breast cancers. The development of metastases is common among patients with HER2-positive breast cancer. Brain metastases are frequently reported in patients with HER2-positive breast cancer, with some estimates suggesting that up to 30% of patients with HER2-positive breast cancer will develop metastases in the brain. Most HER2-positive breast cancers are detected early and can be treated with curable intent; however, for patients who develop metastases, treatment goals include prolonging life, controlling symptoms, limiting toxicities related to treatments, and improving or maintaining patients’ quality of life.
The treatment landscape for breast cancer has been evolving over the past 10 years and has resulted in paradigm shifts in the treatment of patients. Currently available treatments for patients with HER2-positive metastatic breast cancer (MBC) include taxane chemotherapy, trastuzumab, and pertuzumab in the first line, and trastuzumab emtansine (T-DM1) in the second line. No standard of care is currently available for the treatment of HER2-positive MBC patients in the third line. Patients who progress after second-line therapy may be treated with endocrine therapies or chemotherapies combined with HER2-targeted therapies. In particular, patients with brain metastases often do not have many effective therapy options. There is an unmet need for effective treatments for patients with HER2-positive MBCs in the third line and patients with brain metastases.
Tucatinib is a tyrosine kinase inhibitor (TKI) of the HER2 protein. Inhibition of the HER2 protein limits the growth of cancer cells.2 Tucatinib, in combination with trastuzumab and capecitabine, is approved by Health Canada for the treatment of patients with locally advanced or metastatic HER2-positive breast cancer, including patients with brain metastases, who have received prior treatment with trastuzumab, pertuzumab, and T-DM1, separately or in combination. It is noted in the Health Canada product monograph that the clinical trial data supporting the effectiveness of tucatinib in combination with trastuzumab and capecitabine are limited to patients who have received at least 1 prior HER2-directed therapy in the metastatic setting.2 The recommended dose of tucatinib is 300 mg orally twice daily, along with trastuzumab and capecitabine. Treatment with tucatinib should continue until disease progression or unacceptable toxicity.3 Previous CADTH reviews for advanced or metastatic HER2-positive breast cancer include T-DM1,4 apatinib in combination with letrozole,5 and eribulin mesylate.6 Of these previous reviews, the review for lapatinib in combination with letrozole did not receive a positive reimbursement recommendation. Of note, the CADTH review for eribulin mesylate was not specific to patients with HER2-positive cancer but was considered relevant to this review, as it can be used as a treatment option for patients with HER2-positive MBC.
The objective of this CADTH Reimbursement Review is to perform a systematic review of efficacy and safety of tucatinib in combination with trastuzumab and capecitabine in patients with locally advanced or metastatic HER2-positive breast cancer, including patients with brain metastases, who have received prior treatment with trastuzumab, pertuzumab, and T-DM1, separately or in combination.
Stakeholder Perspectives
The information in this section is a summary of input provided by the patient groups that responded to CADTH’s call for patient input and from the clinical experts consulted by CADTH for the purpose of this review.
Patient Input
Three patient groups provided input for the review of tucatinib: the Canadian Breast Cancer Network (CBCN), Rethink Breast Cancer, and the CanCertainty Coalition. Information from CBCN was obtained via online surveys. Information from Rethink Breast Cancer was obtained using an online patient survey and patient interviews. Input from CanCertainty was based on published reports on breast cancer statistics and patient drug coverage.
Quality of life was highlighted in the submitted inputs, as patients face difficulty in all aspects of life due to their condition. Patient groups stated that treatment options may vary for patients, depending on the line of therapy and patient characteristics. Trastuzumab and pertuzumab were reported by patients to be the most commonly received treatments, followed by T-DM1, capecitabine, paclitaxel, docetaxel, and trastuzumab/pertuzumab/T-DM1. Commonly reported side effects of treatment included fatigue, diarrhea, nausea, and insomnia. The patient groups identified a lack of effective treatment options for patients with brain metastases, who are typically offered local therapies including surgery and radiation.
Eight patients, 6 of whom had brain metastases, were identified as having experience with tucatinib. Commonly reported side effects due to treatment with tucatinib included diarrhea, decreased appetite, fatigue, nausea, hand-foot syndrome, and rash. In general, patients reported that side effects from tucatinib were manageable and did not negatively impact their quality of life. The patient groups highlighted that delayed progression, improved quality of life, and survival were important expectations for new treatments. Additional treatment options were also acknowledged as an important need for patients.
Clinician Input
Input From Clinical Experts Consulted by CADTH
The clinicians consulted by CADTH identified unmet treatment needs for patients with advanced or metastatic HER2-positive breast cancer, as patients lack an effective standard of care following progression on second-line therapy. In particular, patients with brain metastases lack effective systemic treatment options and are often excluded from clinical trials, resulting in significant unmet need in this patient subgroup. Tucatinib in combination with trastuzumab and capecitabine was suggested to be administered as per the HER2CLIMB trial eligibility criteria and dosing schedule, mainly in the third-line treatment setting. Tucatinib was suggested not to be used for patients with poor Eastern Cooperative Oncology Group performance status (ECOG PS) (i.e., an ECOG PS of 2 to 4); however, patients with an ECOG PS of 2 could be considered for treatment with tucatinib based on the judgment of the treating physician. As tucatinib is administered along with capecitabine and trastuzumab, the clinical experts stated that tucatinib would be administered in an outpatient clinical setting. Discontinuation of tucatinib should occur if there is evidence of disease progression or lack of benefit to patients with continued treatment, if a patient has poor performance status, or if a patient experiences severe treatment toxicity.
Clinician Group Input
Inputs from 2 clinician groups were received, 1 from the Ottawa Hospital Cancer Centre’s (OHCC) Breast Disease Site Group and the other from the Ontario Health (Cancer Care Ontario) Breast Disease Site Advisory Committee (OH-CCO B-DAC). Both groups stated that, after first-line treatment with taxane chemotherapy, trastuzumab, and pertuzumab, and second-line treatment with T-DM1, no standard third-line options are available for HER2-positive MBC patients. Third-line treatment options may differ across jurisdictions and across countries. Both groups also acknowledged there are limited treatment options for patients with brain metastases, aside from surgery and radiation. Both clinician group inputs suggested that tucatinib would be used in the third-line treatment setting. Both groups acknowledged that tucatinib-combination therapy addresses patient needs, as it demonstrated improved efficacy in patients with and without brain metastases.
Drug Program Input
Input from the CADTH pan-Canadian Oncology Drug Review (pCODR) Provincial Advisory Group identified factors pertaining to relevant comparators, generalizability, prescribing of therapy, companion diagnostics, and discontinuation criteria. The clinical experts consulted by CADTH weighed evidence from the HER2CLIMB trial and other clinical considerations to provide responses, which can be found in the Drug Program Input section.
Clinical Evidence
Pivotal Studies and Protocol Selected Studies
Description of Studies
One multi-centre, multinational, double-blind, randomized controlled phase II trial met the criteria for the CADTH systematic review protocol. The HER2CLIMB trial evaluated the efficacy and safety of tucatinib in combination with trastuzumab and capecitabine compared with placebo in combination with trastuzumab and capecitabine which, from here on, will be referred to as the tucatinib-combination group and the placebo-combination group, respectively. Eligible patients included adults with histologically confirmed HER2-positive advanced breast cancer confirmed using immunohistochemistry (IHC), in situ hybridization (ISH), or fluorescence in situ hybridization (FISH) testing. Patients must have had prior treatment with pertuzumab, trastuzumab, and T-DM1, measurable disease using Response Evaluation Criteria in Solid Tumors (RECIST) v1.1 criteria, and an ECOG PS of 0 or 1. Patients with brain metastases were also eligible for enrolment.7 The presence of brain metastases was identified based on medical history and screening contrast brain MRI, as assessed by an investigator.7 This international trial was conducted in 15 countries across 155 sites and included a total of 38 patients from Canada.7,8 A total of 410 patients were randomized to the tucatinib-combination group and 202 patients were randomized to the placebo-combination group. Randomization was stratified according to the following: presence of brain metastases (yes versus no), ECOG PS (0 versus 1), and geographic region (US versus Canada versus the rest of the world).
The dosages for each treatment in the tucatinib-combination group were as follows:
Tucatinib (300 mg) was administered orally twice daily.
Capecitabine (1,000 mg/m2) was administered orally twice daily on days 1 to 14 of each 21-day cycle.
Trastuzumab was administered with an initial loading dose of 8 mg/kg IV, after which it was administered at 6 mg/kg once every 21 days, except in specific circumstances where it was given weekly to compensate for modifications to the treatment schedule. Alternatively, trastuzumab could, after discussion with a medical monitor, have been administered at a dosage of 2 mg/kg IV every week (every 7 days), but only in circumstances where the trastuzumab infusion had been delayed and weekly infusions were therefore required to re-synchronize the cycle length to 21 days.
Subcutaneous use of trastuzumab was permitted; when subcutaneous trastuzumab was administered, a fixed dose of 600 mg was provided without a loading dose. Subcutaneous trastuzumab was administered once every 3 weeks, as there was no allowance for weekly administration. Crossover from IV to subcutaneous trastuzumab was permitted within the trial.
Where national regulatory authorities approved the use of a trastuzumab biosimilar, either IV or subcutaneous, a trastuzumab biosimilar could also be administered if considered by the investigator to be appropriate for the patient.
The treatment dosages in the placebo-combination group were the same as in the tucatinib-combination group, except that patients received placebo tablets in place of tucatinib; patients also received the placebo orally twice daily. Treatment continued until unacceptable toxicity, disease progression, withdrawal of consent, or study closure.
The primary end point of the trial was progression-free survival (PFS). Key secondary end points, which were part of a hierarchical testing scheme, included PFS among patients with brain metastases (PFSBM) and overall survival (OS). Other secondary and exploratory end points included objective response rate (ORR), PFS assessed by investigator (PFSINV), duration of response (DOR), and health-related quality of life (HRQoL) assessed using the EuroQol 5-Dimensions 5-Levels questionnaire (EQ-5D-5L).
Baseline characteristics of the HER2CLIMB trial were generally well balanced across both treatment groups in both the intention-to-treat (ITT) and ITT-PFS populations; baseline characteristics were also similar across both trial populations. In the ITT population, patients had a mean age of 54 years, with most patients (> 80%) being less than 65 years of age. Most patients were White (74%) and from the US (54%) or the rest of the world (40%). Relatively equal proportions of patients had an ECOG PS of 0 (48%) or 1 (51%).7 The majority of patients had metastatic disease (≥ 99%) and were positive for at least 1 hormone receptor (61%) or negative for both (38%). Non–central nervous system (CNS) metastases were reported among 98% of patients, with the most frequent metastasis sites being lung (49%), bone (55%), and liver (36%). Brain metastases were reported in 48% of patients.7 A mean of 4 lines of prior therapy were reported by all patients in both treatment groups, with a mean of 3 prior therapies specifically in the metastatic setting. As per eligibility criteria, all patients (100%) had received prior treatment with trastuzumab and T-DM1, and more than 99% of patients had also received prior therapy with pertuzumab.
Efficacy Results
Key efficacy results for the HER2CLIMB trial are reported in Table 2; they are based on a data cut-off date of September 4, 2019 and are considered to be the final analyses results. Results of the primary end point, PFS (stratified HR = 0.54; 95% confidence interval [CI], 0.42 to 0.71; stratified log-rank P value, < 0.00001), and key secondary end points, PFSBM (stratified HR = 0.48; 95% CI, 0.34 to 0.69, stratified log-rank P value, < 0.00001) and OS (HR = 0.66; 95% CI, 0.50 to 0.88; stratified log-rank P value, 0.00480), indicated a statistically significant improvement in patients treated with the tucatinib-combination over the placebo-combination therapy. ORR was considered another secondary end point and also supported the results of the primary and key secondary analyses showing improved efficacy with the tucatinib-combination versus the placebo-combination treatment. A post-hoc analysis was conducted by the sponsor that provided an additional 15.6 months of follow-up. The post-hoc analysis provided updated data for OS and PFS, assessed among all randomized patients. Results of the post-hoc analyses continued to support trastuzumab-combination over placebo-combination therapy.9 The assessments conducted at the post-hoc analysis were not formally tested; therefore, they should be considered descriptive. HRQoL data did not indicate any differences in EQ-5D-5L scores between patients in the tucatinib- and placebo-combination groups.
Harms Results
Safety data were reported based on a data cut-off date of September 4, 2019. In general, adverse events (AEs) were reported more commonly among patients in the tucatinib-combination group. The most common AEs of any grade in both the tucatinib-combination group and the placebo-combination group were diarrhea (80.9% versus 53.3%), hand-foot syndrome (63.4% versus 52.8%), nausea (58.4% versus 43.7%), fatigue (45.0% versus 43.1%), and vomiting (35.9% versus 25.4%); however, the proportion of patients experiencing these AEs was greater in the tucatinib-combination group.7 A total of 223 patients (55.2%) in the tucatinib-combination group experienced a grade 3 or greater AE compared with 96 patients (48.7%) in the placebo-combination group. In both the tucatinib-combination group and placebo-combination group, the most commonly reported AEs that were grade 3 or greater were hand-foot syndrome (13.1% versus 9.1%) and diarrhea (12.9% versus 8.6%).7 A time-at-risk exposure-adjusted analysis of grade 3 or greater AEs for hand-foot syndrome, diarrhea, and increase in alanine aminotransferase (ALT) and aspartate aminotransferase (AST) were performed to adjust for the longer exposure to treatment that patients in the tucatinib-combination group experienced, as these patients had a longer duration of treatment than patients in the placebo-combination group. After adjustment, the crude incidence of grade 3 or greater AEs of hand-foot syndrome (13.1% versus 9.1%), diarrhea (12.9% versus 8.6%), and ALT (5.4% versus 0.5%) and AST increase (4.5% versus 0.5%) was higher, for all of these AEs, in the tucatinib-combination group than in the placebo-combination group, respectively; the time-at-risk exposure-adjusted incidence rate per 100 person-years was 21 versus 19, 21 versus 17, 8 versus 1, and 7 versus 1, respectively. Serious adverse events (SAEs) of any grade were reported in a similar proportion of patients in the tucatinib- and placebo-combination groups (25.7% and 26.9%, respectively). Grade 5 AEs were reported in 8 patients (2.0%) in the tucatinib-combination group and 6 patients (3.0%) in the placebo-combination group.
Table 2: Summary of Key Results From the HER2CLIMB Trial (Data Cut-Off: February 8, 2021)
Key result | Tucatinib-combination | Placebo-combination |
|---|---|---|
PFS (ITT-PFS population) | N = 320 | N = 160 |
Events, n (%)a | 178 (55.6) | 97 (60.6) |
Median (months), (95% CI)b | 7.8 (7.5 to 9.6) | 5.6 (4.2 to 7.1) |
Stratified HR (95% CI)c,d | 0.544 (0.420 to 0.705) | |
Stratified log-rank P valued,e | < 0.00001 | |
PFSBM (ITT-PFSBM population) | N = 198 | N = 93 |
Events, n (%)a | 106 (53.5) | 51 (54.8) |
Median (months), (95% CI)b | 7.6 (6.2 to 9.5) | 5.4 (4.1, to 5.7) |
Stratified HR (95% CI)c,d | 0.483 (0.339 to 0.689) | |
Stratified log-rank P valued,e,f | < 0.00001 | |
OS (ITT population) | N = 410 | N = 202 |
Events, n (%) | 130 (31.7) | 85 (42.1) |
Median, months (95% CI)b | 21.9 (18.3 to 31.0) | 17.4 (13.6 to 19.9) |
Stratified HR (95% CI)c,d | 0.662 (0.501 TO 0.875) | |
Stratified log-rank P valued,e,g | 0.00480 | |
ORR (ITT population) | N = 410 | N = 202 |
Patients with measurable disease, nh | 340 | 171 |
ORR, n (%) | 138 (40.6) | 39 (22.8) |
95% CIi | 35.3 to 46.0 | 16.7 to 29.8 |
Stratified Cochrane-Mantel-Haenszel (2-sided) P valuej | 0.00008 | |
BOR, n (%)k | ||
CR | 3 (0.9) | 2 (1.2) |
PR | 135 (39.7) | 37 (21.6) |
SD | 155 (45.6) | 100 (58.5) |
PD | 27 (7.9) | 24 (14.0) |
Not evaluable | 0 | 1 (0.6) |
Not availablel | 20 (5.9) | 7 (4.1) |
Harms, n (%) (safety population) | N = 404 | N = 197 |
Patients with ≥ 1 adverse event, n (%) | 401 (99.3) | 191 (97.0) |
Patients with ≥ 1 grade ≥ 3 adverse event, n (%) | 223 (55.2) | 96 (48.7) |
Any serious adverse event | 104 (25.7) | 53 (26.9) |
Deaths | 8 (2.0) | 6 (3.0) |
BOR = best objective response; CI = confidence interval; CR = complete response; ECOG = Eastern Cooperative Oncology Group; HR = hazard ratio; ITT = intention to treat; ORR = objective response rate; OS = overall survival; PD = progressive disease; PFS = progression-free survival; PFSBM = progression-free survival among the subgroup of patients with brain metastases; PR = partial response; RECIST = Response Evaluation Criteria in Solid Tumors; SD = stable disease.
Note: Tucatinib-combination refers to tucatinib plus trastuzumab and capecitabine; placebo-combination refers to placebo plus trastuzumab and capecitabine.
aDeath without either prior progression or more than 2 missed assessment visits.
bCalculated using the complementary log-log transformation method (Collett, 1994).
cHR comparing the tucatinib-combination group with the placebo-combination group was calculated from the Cox proportional hazards model. An HR < 1.0 favours the tucatinib-combination group.
dComputed using stratification factors (presence or history of brain metastases [yes/no], ECOG performance status [0/1], and region of world [North America vs. the rest of the world]) at randomization.
eTwo-sided P value based on re-randomization procedure (Rosenberger and Lachin, 2002).
fStatistically significant after adjustment for multiplicity. The threshold for statistical significance was 0.0080.
gStatistically significant after adjustment for multiplicity. The threshold for statistical significance is 0.0074.
hAll calculations made using this as the denominator.
ITwo-sided 95% exact CI computed using the Clopper-Pearson (1934) method.
jCochran-Mantel-Haenszel test controlling for stratification factors (presence or history of brain metastases, yes/no).
kConfirmed best overall response assessed per RECIST 1.1.
lPatients with no post-baseline response assessments.
Source: HER2CLIMB Clinical Study Report.7
Critical Appraisal
The HER2CLIMB trial was an international, multi-centre, double-blind, placebo-controlled, phase II randomized controlled trial. The baseline demographic and clinical characteristics were balanced across the treatment groups overall and across important analysis populations (i.e., ITT and ITT-PFS populations). Patients were randomized based on the presence of brain metastases (yes versus no), ECOG PS (0 versus 1), and geographic region (US versus Canada versus the rest of the world). This helped to ensure the comparability of the subgroup analysis results between treatment arms, according to each pre-specified stratification factor. The sponsor also included specifications for using a biased-coin assignment in the randomization scheme to prevent imbalances between treatment groups and any given hierarchical level (i.e., ensure overall treatment group balance and balance within each stratification factor in each treatment group).
Results of the HER2CLIMB trial demonstrated statistically significantly improved OS and PFS among patients treated in the tucatinib-combination group compared with the placebo-combination group. In general, subgroup analyses favoured treatment with the tucatinib-combination group versus the placebo-combination group. However, it should be acknowledged that while the subgroups for the subgroup analyses were pre-specified, they were not adjusted for multiplicity, not powered to detect differences, and could be indicative of imprecision due to wide CIs. The lack of adjustment for subgroup analyses may increase the likelihood of type I error, resulting in an increased likelihood of detecting a treatment effect when 1 may not be present. The sponsor conducted a post-hoc analysis that provided 15.6 months of additional follow-up (resulting in a total of 29.7 months of follow-up for the tucatinib-combination group and 29.4 months of follow-up for the placebo-combination group), and provided additional efficacy (OS, PFS) and safety data. Of note, after the primary analysis, the trial was unblinded and assessments for PFS were conducted by the investigator. The results of the post-hoc analysis were consistent with the results of the primary analysis, which remained blinded and which used a blinded independent central review (BICR) for assessment of PFS.
It is possible that the choice of subsequent therapies could have affected the efficacy assessments of OS, as the analyses for OS included patients who received subsequent therapies. A total of 202 patients (69.2%) in the tucatinib-combination group and 139 patients (79.4%) in the placebo-combination group received subsequent anti-cancer therapies. There were disproportional differences noted between treatment groups in the types of subsequent anti-cancer therapies received, as more patients in the placebo-combination group received antibody (57.1% versus 50.0%, respectively) and TKI (24.0% versus 16.8%) anti-HER2 regimens and trastuzumab (12.2% versus 5.4%), while more patients in the tucatinib-combination group than in the placebo-combination group received trastuzumab plus chemotherapy (20.8% versus 15.8%, respectively). The differences in subsequent therapies are expected to have introduced bias in the efficacy analyses of OS and other patient outcomes. However, the direction and extent of the biases are difficult to predict.
Standard first-line therapies for patients with MBC may include treatment with pertuzumab in combination with trastuzumab and taxane followed by pertuzumab plus trastuzumab. Second-line therapies for these patients may then include T-DM1. Eligibility criteria in the HER2CLIMB trial specified that all patients must have had prior treatment with trastuzumab, pertuzumab, and T-DM1. Therefore, the population of patients in the HER2CLIMB trial is likely reflective of patients in the Canadian population and the treatment algorithms that are standard in Canadian clinical practice. Prior treatment with trastuzumab, T-DM1, and pertuzumab was not required to have taken place specifically in the metastatic setting. Although most patients did receive each drug in the metastatic setting, some patients received it in both neoadjuvant or adjuvant and metastatic settings; few patients received prior therapy in the neoadjuvant or adjuvant setting only. The sponsor noted that the treatment landscape for HER2-positive breast cancer patients has changed drastically since the completion of patient enrolment for the HER2CLIMB trial.10 During patient enrolment, T-DM1 was approved for and used only in the metastatic setting; however, since completion of patient enrolment, T-DM1 has been approved for use in the adjuvant setting. Almost all patients in the HER2CLIMB trial (> 98%) reported having received prior therapy with T-DM1 in the metastatic setting only.7 It is expected that a greater proportion of patients in clinical practice will have received prior therapy with T-DM1 in other treatment settings as well.
In the Health Canada–approved product monograph, tucatinib in combination with trastuzumab and capecitabine is indicated for patients who have received at least 1 prior HER2-directed therapy in the metastatic setting.2 The treatment landscape for patients with MBC is complex and has changed to include new HER2-directed treatments, such as pertuzumab and T-DM1. Patients in the HER2CLIMB trial reported having received a mean of 3 prior therapies in the metastatic setting, and the sponsor confirmed that every patient in the HER2CLIMB trial received at least 1 prior therapy in the metastatic setting.3,7 Therefore, given the changes to the treatment landscape for this setting and the characteristics of patients in the HER2CLIMB trial, it was considered appropriate for tucatinib, in combination with trastuzumab and capecitabine, to be used for patients who received at least 1 HER2-targeted therapy in the metastatic setting.
The HER2CLIMB trial eligibility criteria required patients to have prior treatment with trastuzumab, pertuzumab, and T-DM1, alone or in combination, and most patients (> 90%) reported having received each treatment. The median and mean number of therapies used among patients in the HER2CLIMB trial was 4, with most patients having received trastuzumab, pertuzumab, and T-DM1 in either the metastatic setting or in the metastatic and neoadjuvant or adjuvant setting. Therefore, patients would have received tucatinib-combination therapy in the second- or later-line setting. It may be unreasonable to suggest using tucatinib-combination therapy as a first-line treatment option for patients with MBC, as there is no evidence to support the use of this treatment in this context. The input received from the clinical expert consulted by CADTH and the Canadian clinician groups that provided input on this submission suggests that tucatinib-combination therapy would most likely be used as a third-line therapy.
Indirect Comparisons
Description of Studies
The sponsor-submitted indirect treatment comparison (ITC) compared the efficacy of tucatinib in combination with trastuzumab and capecitabine with relevant comparators, including lapatinib plus capecitabine, margetuximab plus capecitabine, neratinib, neratinib plus capecitabine, pertuzumab plus trastuzumab and capecitabine, trastuzumab plus capecitabine, capecitabine, T-DM1, and T-DM1 plus capecitabine, among patients with HER2-positive MBC who had received at least 1 prior therapy. The ITC was conducted using a network meta-analysis (NMA) that included 14 phase II and III trials identified by a systematic literature search.
Efficacy Results
Regarding PFS, the NMA results suggested that tucatinib-combination treatment was favoured compared with capecitabine monotherapy (HR = 0.33; 95% credible interval [CrI]: 0.23 to 0.47; P < 0.0001), neratinib (HR = 0.47; 95% CrI, 0.30 to 0.71; P = 0.0007), lapatinib plus capecitabine (HR = 0.55; 95% CrI, 0.40 to 0.76; P = 0.0003), trastuzumab plus capecitabine (HR = 0.53; 95% CrI, 0.42 to 0.68; P < 0.0001), and pertuzumab plus trastuzumab plus capecitabine (HR = 0.65; 95% CrI, 0.47 to 0.90; P = 0.0110). No differences were shown between the tucatinib combination and margetuximab plus capecitabine, neratinib plus capecitabine, T-DM1, and T-DM1 plus capecitabine.11
Regarding OS, the NMA results suggested that the tucatinib-combination treatment was favoured compared with capecitabine monotherapy (HR = 0.45; 95% CrI, 0.27 to 0.77; P < 0.0017), neratinib (HR = 0.47; 95% CrI, 0.27 to 0.80; P = 0.0073), lapatinib plus capecitabine (HR = 0.59; 95% CrI, 0.41 to 0.83; P = 0.0030), and trastuzumab plus capecitabine (HR = 0.66; 95% CrI, 0.50 to 0.88; P = 0.0040). No differences were shown between the tucatinib combination and margetuximab plus capecitabine, neratinib plus capecitabine, pertuzumab plus trastuzumab plus capecitabine, and T-DM1.11
Regarding ORR, the tucatinib-combination therapy was favoured over capecitabine (HR = 0.90; 95% CrI, 0.48 to 1.31; P < 0.0001), neratinib (HR = 0.82; 95% CrI, 0.29 to 1.33; P = 0.0010), and trastuzumab plus capecitabine (HR = 0.39; 95% CrI, 0.18 to 0.60; P = 0.003). There were no differences between tucatinib-combination therapy and lapatinib plus capecitabine, neratinib plus capecitabine, pertuzumab plus trastuzumab plus capecitabine, T-DM1, and T-DM1 plus capecitabine.11
Harms Results
No comparisons for harms or safety were incorporated in the sponsor’s ITC.
Critical Appraisal
The sponsor’s ITC included both phase II and III trials. Some phase II trials were not powered to detect differences between treatment groups, which may have affected the precision of the treatment estimates obtained from those studies. The inclusion of such studies in the sponsor’s ITC may have introduced uncertainty into the comparisons made within the network. The treatment crossover reported in trials is likely to have introduced bias into the comparisons of the ITC, as crossover is likely to have diluted estimates of treatments with investigational therapies. In addition, the differences in the patient characteristics across the studies introduce uncertainty regarding the comparability of patients across trials. For example, patients receiving treatment in later lines of therapy are likely to have worse clinical outcomes, as they have already progressed to more therapies than patients in earlier lines of treatment. Further, there were differences in patients’ ECOG PS, hormone receptor status, and presence of brain metastases. The sponsor’s ITC included trials published between 2008 and 2020. Due to changes in treatment paradigms for HER2-positive MBC, it is highly likely that patients across studies are not comparable due to the changing treatment landscapes, which would have affected overall patient outcomes over time. There were some methodological limitations, as some trials reported violation of the proportional hazard assumption and there was a lack of available data to incorporate relevant effect modifiers.
Other Relevant Evidence
The publication by Lin et al.12 reported exploratory analyses of intracranial efficacy and survival in a subgroup of patients with brain metastases from the pivotal HER2CLIMB study. Patients with brain metastases were classified as follows:
treated and stable (prior local treatment and no evidence of progression at baseline brain MRI, including patients treated during the screening period)
treated and progressing (prior local treatment but evidence of progression of existing lesions, new lesions, or untreated lesions remaining after prior treatment at baseline brain MRI)
untreated (no prior local treatment)
A total of 198 patients randomized to the tucatinib-combination group and 93 patients randomized to the placebo-combination group had brain metastases. The interventions have been previously described for the HER2CLIMB study. Treatment with dexamethasone (up to 2 mg per day) was permitted to control symptoms of brain metastases. The majority of patients were older than 65 years (83.5%); 60.8% resided in North America and 93.9% had non-CNS metastatic disease. Regarding ECOG PS, 44.7% of patients had a score of 0, 55.3% had a score of 1, and 57.0% of patients were hormone receptor–positive. The brain metastasis treatment status at baseline was treated and stable, treated and progressing, or untreated for 40.2%, 37.1%, and 22.7% of patients, respectively. Most patients (70.1%) had prior radiation therapy for brain metastases, 41.9% had whole-brain radiation therapy, 42.6% had targeted radiation therapy, and 15.8% had surgery.
The treatment groups were well balanced by baseline characteristics with the exception of the proportion of patients who were hormone receptor–positive (54.0% in the tucatinib-combination group versus 63.4% in the placebo-combination group), patients with an ECOG PS score of 1 (53.5% in the tucatinib-combination group versus 59.1% in the placebo-combination group), and patients with a history of prior targeted radiation therapy (46.5% in the tucatinib-combination group versus 34.4% in the placebo-combination group).
Efficacy Results
For patients treated in the tucatinib-combination group, 40.2% (95% CI, 29.5 to 50.6) of patients with brain metastases, 35.0% (95% CI, 23.2 to 47.0) of patients with active brain metastases, and 53.3% (95% CI, 31.4 to 71.0) of patients with stable brain metastases had CNS-PFS at 1 year. None of the patients receiving the placebo-combination had CNS-PFS at 1 year. A hazard ratio (HR) of 0.32 (95% CI, 0.22 to 0.48) was reported for the tucatinib-combination group compared with the placebo-combination group in all patients with brain metastases. Similar results were reported for patients with active brain metastases (HR = 0.36; 95% CI, 0.22 to 0.57) and patients with stable brain metastases (HR = 0.31; 95% CI, 0.14 to 0.67).
Among all patients with brain metastases, 1-year OS was reported for 70.1% (95% CI, 62.1 to 76.7) of patients in the tucatinib-combination treatment group and 46.7% (95% CI, 33.9 to 58.4) of patients in the placebo-combination treatment group. For patients with active brain metastases, 1-year OS was reported for 71.7% (95% CI, 61.4 to 79.7) and 41.1% (95% CI, 25.5 to 56.1) of patients randomized to the tucatinib- and placebo-combination groups, respectively. For patients with stable brain metastases, 1-year OS was reported for 67.6% (95% CI, 53.8 to 78.0) and 55.6% (95% CI, 34.1 to 72.6) of patients randomized to the tucatinib- and placebo-combination groups, respectively. These data for 1-year OS corresponded to an HR of 0.58 (95% CI, 0.40 to 0.85) for all patients with brain metastases, 0.49 (95% CI, 0.30 to 0.80) for patients with active brain metastases, and 0.88 (95% CI, 0.45 to 1.70) for patients with stable brain metastases.
Intracranial response was also reported for patients with active brain metastases and measurable intracranial lesions at baseline.
Harms Results
Safety outcomes were not assessed in this study.
Critical Appraisal
Information about reasons for or timing of discontinuation from treatment was not available. The proportion of patients who were hormone receptor–positive and who had a history of prior targeted radiation therapy was greater in the tucatinib treatment group, which may bias the results for PFS and OS against tucatinib. Additionally, a greater proportion of patients had received prior targeted radiation therapy in the tucatinib treatment group, which may also indicate bias against tucatinib. The analyses were exploratory and the statistical tests could not be interpreted as statistically significant. Lastly, CNS target lesions were assessed by the investigator and not externally validated. Issues of generalizability for the overall HER2CLIMB study also apply to the exploratory analyses described here. This study or exploratory analysis was specific to patients with brain lesions, which were identified using MRI and which is consistent with Canadian clinical practice. Trastuzumab was available for administration intravenously or subcutaneously; however, the Lin et al. study did not provide this level of detail for patients in the post-hoc analyses.
Conclusions
The results of a randomized phase II trial demonstrated significant improvement in PFS and OS. In particular, the improvement was observed in PFS among a subgroup of patients with brain metastases, a group of patients with limited effective treatment options available. HRQoL outcomes were reported to be important for patients; however, there were no differences observed. Despite the limitation of an early clinical development phase, the available evidence supports the comparative efficacy of tucatinib-combination therapy over trastuzumab plus capecitabine alone in the treatment of patients who are often difficult to treat if following the current treatment pathway in Canadian practice. There is a lack of evidence on the comparative effectiveness of other alternative therapies. One sponsor-submitted ITC suggested that tucatinib-combination therapy may be more efficacious than capecitabine alone, neratinib, lapatinib plus capecitabine, and trastuzumab plus capecitabine. However, the ITC had significant limitations that introduced uncertainty about the overall results. Specifically, the sponsor’s ITC included studies that reported differences in trial characteristics, differences in patient characteristics, lack of adjustment for relevant effect modifiers (e.g., prior exposure to treatments, line of therapy, and presence of brain metastases), and violation of the proportional hazard assumption, in particular, for PFS. While biases introduced in the sponsor’s ITC may introduce uncertainty in the magnitude of the estimates between treatments, the overall direction of estimates was considered reliable. Specific AEs were reported more frequently in the tucatinib-combination group, even though the overall AEs appeared to be similar based on the most updated results. Further study of AEs or SAEs may be required.
Introduction
Disease Background
Breast cancer is the most commonly diagnosed cancer among women in Canada. In 2020, it was expected to be the second-most commonly diagnosed cancer, with an estimated 27,400 new cases expected. Breast cancer was further expected to result in approximately 6% of all cancer-related deaths.1 While not as common, breast cancers can also develop in men.13 Breast cancers are heterogeneous and can be categorized into subtypes, 1 of which relies on HER2 receptor status. Patients with HER2-positive breast cancer may further be distinguished by hormone receptor status, referring to the activation of estrogen and/or progesterone receptors. Based on input from the clinical experts consulting with CADTH for this review, HER2-positive breast cancers account for 15% to 20% of breast cancers; when HER2-positive breast cancers are diagnosed early, the majority of patients will be cured. A certain proportion of patients will develop metastatic disease, which is generally incurable.
Patients with HER2-positive breast cancer have a high likelihood of developing metastases. In particular, brain metastases among patients with HER2-positive breast cancer is a common occurrence; some estimates suggest that approximately 30% of patients with HER2-positive breast cancer will involve metastases in the brain.14 The prognosis of patients with brain metastases remains poor, despite advancements in treatments for breast cancer patients.15 In general, patients with recurrent breast cancer or MBC have a poor prognosis. Treatment options for such patients require considering clinical benefits and limiting harms associated with treatment. Therefore, treatment goals for patients with metastatic disease are to prolong life, control symptoms, limit toxicities related to treatments, and improve or maintain patients’ quality of life.14
Standards of Therapy
Treatment strategies may differ according to the subtype of breast cancer that patients present with and involve an interdisciplinary approach that can include both locoregional treatment (i.e., surgery and radiation) and systemic therapies.14 Input from the clinical experts consulted by CADTH indicated that, after a patient develops MBC, options for systemic therapy depend on the prior treatments the patient has received in adjuvant or neoadjuvant settings, as well as the amount of time that has elapsed between when they received their last treatment and when they developed metastatic disease. Other patient characteristics, such as functional status, comorbidities, and patient preference are incorporated into the decision-making for systemic treatment options. The clinical experts consulted by CADTH highlighted that patients who have not received prior adjuvant therapy with trastuzumab, and patients whose disease recurs after 1 year of completing adjuvant treatment, may typically be treated with a taxane chemotherapy combined with trastuzumab and another HER2 monoclonal antibody (e.g., pertuzumab).
The clinical experts suggested that patients are often treated with T-DM1, based on results observed in the EMILIA study.16 Input from 1 clinical expert acknowledged that treatment paradigms may be changing, as some patients may receive T-DM1 in the adjuvant setting or after receiving neoadjuvant trastuzumab and chemotherapy for early HER2-positive breast cancer. Optimal treatment for patients with advanced or metastatic HER2-positive breast cancer in the third line remains unclear. The clinical experts identified that current treatment options for patients include: capecitabine monotherapy, lapatinib plus capecitabine, trastuzumab plus capecitabine, trastuzumab plus a chemotherapeutic drug (e.g., vinorelbine), or chemotherapy. Patients with endocrine receptor–positive HER2-positive breast cancer may also be treated with trastuzumab combined with endocrine therapy or trastuzumab plus pertuzumab. The clinical experts identified that most patients who are endocrine-sensitive receive upfront treatment with HER2-targeted therapies and chemotherapy unless they have minimal disease or are unable to tolerate chemotherapy.
The clinical experts noted that drugs without Health Canada approval are not usually accessible in clinical practice and would be considered for patients only in the setting of a clinical trial (e.g., trastuzumab deruxtecan or margetuximab). Some HER2-targeted therapies were stated to be available to patients through special access programs, for example, neratinib, a pan-HER2 TKI, in combination with capecitabine.
The clinical expert consulted by CADTH acknowledged that expectations of a cure for patients with metastatic disease are sometimes not feasible. Therefore, treatment goals for patients with metastatic disease were stated to include prolonged survival, optimization of quality of life, and reduction of disease symptoms. Delayed progression of disease and minimal side effects were also stated to be important considerations for patients’ treatment.
Drug
Tucatinib is indicated by Health Canada to be used in combination with trastuzumab and capecitabine for the treatment of patients with locally advanced unresectable or metastatic HER2-positive breast cancer, including patients with brain metastases, who have received prior treatment with trastuzumab, pertuzumab, and T-DM1, separately or in combination.2 As per the Health Canada indication, tucatinib in combination with trastuzumab and capecitabine should also be limited to patients who have received at least 1 prior HER2-directed therapy in the metastatic setting.2
Tucatinib is a TKI of the HER2 protein that promotes the growth of cancer cells. Tucatinib is selective for HER2 and results in inhibition of downstream cell signalling and proliferation; this inhibition ultimately results in the death of HER2-driven tumour cells.2
The Health Canada–recommended dosage for tucatinib is 300 mg (two 150 mg tablets) taken orally twice daily in combination with trastuzumab and capecitabine until disease progression or unacceptable toxicity.2 Dosages for trastuzumab and capecitabine should be as follows:
Capecitabine: 1,000 mg/m2 taken orally twice daily on days 1 to 14 every 21 days.
Trastuzumab: Administered via IV. It should be administered with an initial loading dose of 8 mg/kg followed by 6 mg/kg every 21 days. Subcutaneous trastuzumab should be administered at 600 mg every 21 days, without a loading dose.
The sponsor has requested reimbursement of tucatinib as per the indication under review, which is in combination with trastuzumab and capecitabine for the treatment of patients with locally advanced unresectable or metastatic HER2-positive breast cancer, including patients with brain metastases, who have received prior treatment with trastuzumab, pertuzumab, and T-DM1, separately or in combination. Tucatinib has not been previously reviewed by CADTH.
A table describing key characteristics of commonly used treatments for HER2-positive MBC is presented in Table 3.
Table 3: Key Characteristics of Tucatinib, Trastuzumab, and Capecitabine
Characteristic | Tucatinib | Trastuzumab | Capecitabine |
|---|---|---|---|
Mechanism of action | TKI | HER2-targeted therapy | Prodrug selectively tumour activated to 5-FU is further metabolized to FdUMP and FUTP and causes cell injury by 2 primary mechanisms |
Route of administration | Oral | IV, subcutaneous | Oral |
Recommended dose/dosage | 300 mg twice daily | IV dose: 8 mg/kg loading dose followed by 6 mg/kg Subcutaneous: 600 mg | 1,000 mg/m2 twice daily |
Serious adverse effects or safety issues | Serious warnings and precautions:
| Serious warnings and precautions:
| Serious warnings and precautions:
|
Other | None | None | None |
5-FU = fluorouracil; FdUMP = 5-fluoro-2'-deoxyuridine monophosphate; FUTP = 5-fluorouridine triphosphate; HER2 = human epidermal growth factor receptor 2; TKI = tyrosine kinase inhibitor.
aHealth Canada–approved indication.
Source: Product monographs for Tukysa (tucatinib),2 Herceptin (trastuzumab),17 and Xeloda (capecitabine).18
Stakeholder Perspectives
Patient Group Input
This section was prepared by CADTH staff based on the input provided by patient groups.
About the Patient Groups and Information Gathered
Three patient groups provided input for the review of tucatinib: CBCN, Rethink Breast Cancer, and the CanCertainty Coalition. CBCN is a patient-directed, national health charity committed to ensuring the best quality of care for all Canadians affected by breast cancer through the promotion of information and education and advocacy activities. Rethink Breast Cancer’s mission is to empower young people who are concerned about and affected by breast cancer through education, support, and advocacy. The CanCertainty Coalition represents more than 30 Canadian patient groups, cancer health charities, and caregiver organizations from across the country that collaborate with oncologists and other cancer care professionals to significantly improve the affordability and accessibility of cancer treatment.
The CBCN’s submission included information from 2 online surveys of patients living with MBC and their caregivers conducted in 2012 (N = 87) and 2017 (N = 180). The 2012 survey was conducted in collaboration with Rethink Breast Cancer and was completed by 71 patients and 16 caregivers. In the 2017 survey, 36 respondents (20%) identified as being HER2-positive, according to CBCN. Patients were contacted through the membership databases of CBCN and other patient organizations. CBCN also conducted phone interviews in 2020 and 2021 with 2 Canadian patients living with HER2-positive MBC who had direct experience with tucatinib. They also reviewed published information to identify issues and experiences that are commonly shared among many women living with breast cancer.
Rethink Breast Cancer contracted a freelance writer to help develop the survey used for data collection for their patient input submission and to analyze the findings of the survey and interviews. Data were collected through an online patient survey conducted between March 2 and April 7, 2021. Respondents for the survey were actively identified through messages to Rethink Breast Cancer’s mailing list, a private Facebook group, and a partner organization, as well as passively through posts to social media and online discussion forums. The survey included 51 patients with HER2-positive locally advanced unresectable breast cancer or MBC from across Canada (73%), the US (24%), and Mexico (2%); 1 patient chose not to answer. Of the 51 respondents, 21 were receiving first-line treatment, 5 were receiving second-line treatment, 9 were receiving third-line treatment or higher, 8 were receiving treatment after recurrence, 2 were under surveillance following treatment, 3 had no evidence of disease, and 3 reported they were in a different phase of treatment at the time of completing the survey. A total of 14 respondents reported also having brain metastases along with their MBC. Six of the respondents had experience with tucatinib, and 5 of the patients agreed to further participate in telephone interviews; of these patients, 3 were from the US and 3 were from Canada.
CanCertainty developed its submission based on published reports relating to breast cancer statistics in patients under the age of 65 who have developed brain metastases and are without either private or public Canadian drug coverage. In addition, CanCertainty estimated current incidence rates for breast cancer for each Canadian province based on incidence rates dating from 2017 from the Canadian Cancer Registry. CanCertainty was also able to estimate the number of HER2-positive MBC patients under 65 years who would be left without private or public drug coverage. Information regarding patient-reported disease and treatment, or patient expectations for improved outcomes, was not provided in this patient input submission.
Disease Experience
The CBCN described MBC as the spread of cancerous cell growth to areas of the body other than where the cancer first formed and which is often more severe. They noted it most commonly spreads to the bones but can include the lungs, liver, brain, and skin. According to the patient group, the current treatment options for MBC are only effective at prolonging progression-free disease; most cases of advanced disease will progress and symptoms will worsen. Patients with a diagnosis of MBC understand the limitations of current treatment options and seek to live their remaining months and years with the best possible quality of life they can achieve.
The CBCN reported that the symptoms, progression, and experience with disease varies among patients living with MBC, but many of the effects have a significant or debilitating impact on quality of life. In a survey conducted by the CBCN in 2012, patients were asked to choose from the following options regarding their treatment experience: very acceptable, somewhat acceptable, or not acceptable. Patients were also asked to determine the impact of their treatments with the following options: significant impact, some impact, or no impact; or not important, important, somewhat important, or very important. From the survey, patients with MBC and caregivers reported that fatigue, insomnia, and pain had a notable impact on quality of life. More specifically, 54% of patients reported that fatigue resulted in a significant or debilitating impact, and 40% reported some or moderate impact; 39% of patients reported that insomnia resulted in a significant or debilitating impact, and 46% reported some or moderate impact; 37% of patients reported that pain resulted in a significant or debilitating impact, and 44% reported some or moderate impact. These results were reinforced when the survey was conducted again in 2017.
The CBCN also reported that the impact of living with MBC extends across all aspects of a patient’s life, restricting an individual’s employment and career, ability to care for children and dependents, and their ability to socialize and meaningfully participate in their community. In general, based on the 2012 survey, most patients were negatively impacted in their ability to work or to maintain a career, engage in familial responsibilities, and participate in social activities. Specifically, 71% of employed patients identified significant restrictions on their ability to work; among those with children or dependents, 21% and 53% identified significant and some or moderate restrictions, respectively, to their caregiving responsibilities; and 49% and 38% of patients identified significant and some or moderate restrictions, respectively, in their ability to exercise. Further, 42% of patients identified significant restrictions and 42% identified some or moderate restrictions on their ability to pursue hobbies and personal interests; 41% of patients identified significant restrictions and 41% identified some or moderate restrictions on their ability to participate in social events and activities; and 22% of patients identified significant restrictions and 52% identified some or moderate restrictions on their ability to spend time with loved ones.
Other experiences identified by patients, as noted by the CBCN, included: guilt, the feeling of being a burden on caregivers, fear of death, poor body image, not knowing what functionality will be lost, fear of the impact of cancer and the effect of the loss of a parent on children, not knowing what will happen to children, the loss of the support of loved ones, and marital stress or loss of fidelity and affection from their husband.
Experience With Treatment:
According to the CBCN, the goals of current treatment options for MBC include controlling the progression of the disease (extending life) and reducing cancer-related symptoms (extending or stabilizing quality of life). They also noted that treatment options and effectiveness vary depending on the type of cancer, location of the cancer, and how symptoms are experienced. The first line of treatment for patients with HER2-positive MBC is trastuzumab plus pertuzumab and a taxane, followed by second-line T-DM1. Similarly, patients who responded to Rethink Breast Cancer’s survey reported that trastuzumab and pertuzumab were the most common forms of treatment, with 96% and 88% of patients having reported experience with the 2 treatments, respectively, followed by T-DM1 (24%), capecitabine (20%), paclitaxel (18%), docetaxel (8%), and trastuzumab/pertuzumab/T-DM1 (8%). Additionally, respondents reported experience with 17 other treatments (each reported by no more than 3 patients). No therapies are considered standard of care for patients who progress after second line.
According to the Rethink Breast Cancer survey, fatigue was the most commonly reported side effect of treatments (86%), followed by diarrhea (71%), nausea (49%), and insomnia (45%). Diarrhea and fatigue were most commonly cited by respondents as the most difficult to tolerate side effects of these treatments. Loss of appetite, neuropathy, skin problems, and breathing difficulties were also cited by multiple respondents. Of note, respondents to the CBCN surveys indicated a willingness to tolerate treatment side effects such as fatigue, nausea, depression, problems with concentration, memory loss, diarrhea, and insomnia, as well as pain, to a certain degree, as survival and effectiveness and quality of life were noted as the most important factors when considering treatment of disease.
The CBCN reported that, specifically in the case of brain metastases, while systemic therapies have improved, incidence rates of brain metastases in breast cancer patients have increased, developing in about half of patients. The CBCN’s 2017 survey reported that 12% of metastatic patients who responded had metastases to their brain while 20% reported metastases to other body parts. Rethink Breast Cancer noted that 27% of respondents reported brain metastases from their breast cancer. Effective treatment options for HER2-positive breast cancer in patients with brain metastases are limited; treatment options include local therapies such as neurosurgical resection and stereotactic radiation therapy. Trial data showing the effectiveness of some of these systemic therapies are lacking.
A majority (69%) of respondents to Rethink Breast Cancer’s survey did not have difficulty accessing treatment; however, 22% reported they were unable to access treatment because it was unavailable in Canada. CanCertainty Coalition and the CBCN described a substantial financial barrier to accessing treatments, and Rethink Breast Cancer stated that 28% of respondents reported they needed financial assistance due to the costs associated with breast cancer. The submission from CanCertainty detailed the complexities of navigating care for HER2-positive MBC across Canada and the costs associated with it. Both CanCertainty and the CBCN highlighted that, in addition to the costs of treatment, patients also need to finance additional treatments for symptoms and side effects, the time required to travel to access treatments, and time off work due to appointments or symptoms and side effects. In particular, CanCertainty highlighted oral therapies that are not covered by all of the provincial plans and may require payment from patients. CanCertainty also noted that for patients without access to private health insurance, payment for treatment puts these patients at risk of severe financial burden. With the emergence of more oral oncological therapies, payment for treatment, or co-payments for those with insurance, may result in significant financial burden. As a consequence, the patient groups noted quality of life is significantly impacted and patients may end up taking less medication than prescribed because of the costs of treatment. One patient reported that this is “always a concern, as you never know if the next drug will be covered or how long it takes to get approval from private coverage. Many times it delays treatment and this weighs on one’s mind.”
Six respondents to Rethink Breast Cancer’s survey and 2 patients interviewed by CBCN had experience with tucatinib. Patients who were interviewed by CBCN were described as having different levels of experience with tucatinib. Notably, 1 patient was diagnosed with brain metastases and the other had lung, lymph node, and rib metastases. Patients from Rethink Breast Cancer’s submission reported having received tucatinib for less than 3 months (n = 3), 3 to 6 months (n = 2), and between 6 and 12 months (n = 1). Two patients reported receiving tucatinib as a second-line treatment, and 4 patients reported receiving it as a third-line treatment or higher. All but 1 of the patients reported brain metastases. Both patient groups reported that patients felt that the side effects from tucatinib were preferable to the side effects they had experienced on other treatments and therapies, and the side effects that did occur were minimal and manageable. As 1 patient described, “there was nothing not acceptable to me. They were mild based on all of the other lines experienced and it’s a small [price] to pay for the extension of life.” However, 1 patient responding to Rethink Breast Cancer’s survey reported discontinuation of treatment due to side effects, and another reported a dosage reduction due to side effects. The most commonly reported side effects were diarrhea, decreased appetite, fatigue, nausea, hand-foot syndrome, and an itchy rash. Despite this, patients generally felt that tucatinib did not negatively impact their quality of life and some patients reported they have been able to maintain their lifestyle, taking care of their home and family and travelling. Patients also positively reflected on the availability of tucatinib as an option for treatment of brain metastases, as no treatments are currently indicated for this.
Improved Outcomes
The CBCN reported that extension of PFS is a critical concern for metastatic patients. The patient group stated that, “patients living with MBC are aware that their advanced disease will progress with worsening symptoms until death, and embrace opportunities to try new treatments, even if benefits may be as little as a 6-month extension of progression-free disease.” They also emphasized the impact that delaying progression of disease and relieving cancer-related symptoms has on the improvement of quality of life, and the desire for patients to be able to provide care for families, continue with employment, and engage in social activities and personal interests. Maintaining quality of life was also rated as very important to patients from Rethink Breast Cancer’s submission, but long-term outcomes such as control of disease and prevention of recurrence and, ultimately, survival were reported as being of utmost importance to this group of patients as well. This was reiterated by 1 of the patient respondents, who reported that “survival rate chances are paramount, followed by quality of life.” Feedback from the CBCN and Rethink Breast Cancer submissions also indicated a desire among patients for targeted treatments and the importance of having treatment options.
Clinician Input
Input From Clinical Experts Consulted by CADTH
All CADTH review teams include at least 1 clinical specialist with expertise regarding the diagnosis and management of the condition for which the drug is indicated. Clinical experts are a critical part of the review team and are involved in all phases of the review process (e.g., providing guidance on the development of the review protocol, assisting in the critical appraisal of clinical evidence, interpreting the clinical relevance of the results, and providing guidance on the potential place in therapy). The following input was provided by 3 clinical specialists with expertise in the diagnosis and management of metastatic or advanced breast cancer.
Unmet Needs
More effective therapies were stated to be needed for patients, as patients with metastatic HER2-positive breast cancer will eventually experience progression of their disease. More convenience for therapies was also stated to be helpful for patients; subcutaneous formulations of trastuzumab and pertuzumab were stated to be in development, but currently not funded in Canada or commonly used. In addition, more effective treatments for patients with leptomeningeal disease are needed, as these patients are typically excluded from clinical trials, including the HER2CLIMB trial, and have extremely poor prognoses.
Development of brain metastases is common for patients with HER2-positive MBC, with approximately 50% of patients expected to develop intracranial disease, and is associated with poor prognoses. Patients with brain metastases were stated to be seen more frequently in clinical practice, as HER2-directed therapies are controlling extracranial disease and resulting in longer life for patients. It was stated that the brain may be protected from treatments with monoclonal antibodies (e.g., trastuzumab, pertuzumab and, potentially, T-DM1), as they are thought to be unable to cross the blood-brain barrier; however, as more data emerge, this belief is being challenged. Some HER2-directed TKIs, such as neratinib and lapatinib, have been shown to have CNS activity with intracranial responses, and have been shown to be particularly effective when combined with capecitabine chemotherapy. However, neither neratinib nor lapatinib combined with capecitabine was stated to have shown improved survival for patients in this setting. Therefore, for patients with brain metastases, unmet needs included improved survival, improved intracranial disease control, reduction of neurologic symptoms, need for supportive medications, improved functional status, and drugs that have both intracranial activity and tolerable toxicities.
Place in Therapy
Ideally, tucatinib was stated to be used for patients as a third-line treatment option for metastatic disease, after prior exposure to trastuzumab, pertuzumab, and T-DM1. Use of tucatinib was suggested to be used as per the HER2CLIMB trial, which enrolled patients who had prior exposure to trastuzumab, pertuzumab, and T-DM1; therefore, it was considered inappropriate by the clinical expert to use tucatinib for patients who had not received these treatments, unless patients are enrolled in a clinical trial. However, tucatinib may be considered for patients in an earlier line of therapy, depending on their disease-free interval and so long as the patient had received adjuvant trastuzumab, pertuzumab, and T-DM1. Tucatinib may also be considered for patients with other indications (e.g., intolerance or contraindications to other therapies); however, this is expected to represent a small subgroup of patients. Overall, introduction of tucatinib into current clinical practice may result in a shift in the treatment paradigm and push current third-line treatment options to later lines of therapy.
The clinical expert suggested administering tucatinib to patients who align with HER2CLIMB eligibility criteria. For patients with previous treatment with lapatinib, the clinical experts acknowledged that patients with prior treatment with lapatinib were eligible in the HER2CLIMB trial if it was administered 12 months before enrolment. However, they noted that lapatinib is usually administered to patients in combination with capecitabine, and prior treatment with capecitabine was an exclusion criteria of the HER2CLIMB trial. No specific subgroups of patients who might respond better to the tucatinib-combination treatment were identified.
The clinical experts acknowledged that, in clinical practice, some patients may not tolerate or may have a contraindication to certain treatments, such as T-DM1 or pertuzumab. For example, a patient may have peripheral neuropathy, which is a relative contraindication to T-DM1. The clinical experts agreed that for patients who cannot receive T-DM1 or pertuzumab due to contraindications or toxicity issues, treatment with tucatinib-combination therapy would be reasonable. However, there was agreement among all clinical experts that this population would represent a small group of patients.
In addition, the clinical experts considered that there may be rare scenarios in clinical practice where some patients may not have received standard first-line treatment with chemotherapy in combination with pertuzumab and trastuzumab if they experience recurrence within 6 months of completing treatment with trastuzumab in the adjuvant setting. Subsequent treatment for such patients would then be T-DM1. The clinical experts agreed that patients who did not receive prior treatment with pertuzumab may then be considered for tucatinib-combination treatment if subsequent disease progression occurs after treatment with T-DM1.
Patient Population
To identify patients eligible for treatment with tucatinib-combination therapy, patients with MBC are followed regularly by a medical oncologist who would determine the patient’s suitability with tucatinib. No issues related to diagnosis were identified, as these patients would already be diagnosed with MBC and have a history of prior treatments. Tucatinib-combination therapy was suggested not to be used for patients with poor ECOG PS (i.e., ECOG PS of 2 to 4); some patients with an ECOG PS of 2 might be considered, based on the judgment of the treating physician. Further, tucatinib may not be used for patients with unstable symptoms related to brain metastases, patients with leptomeningeal disease, or patients with contraindications to capecitabine or trastuzumab; for patients with unstable brain metastases, tucatinib could be considered as a treatment after patients receive and respond to local therapy. It was noted that patients in this setting typically survive less than 3 to 6 months, and that patients may also be receiving palliative care.
Assessing Response to Treatment
Patient’s response to treatments was stated to be based on tumour-response assessment on re-imaging of known sites of disease, usually with CT scans (with or without bone scans), clinical assessment (e.g., palpable disease, symptom control), and laboratory assessments (e.g., improving liver function, tumour marker levels). Frequency of assessments can vary, occurring every 3 to 6 months, depending on a patient’s disease status. For patients with brain metastases, a CT scan is considered reasonable, but a brain MRI can reveal other lesions that may be amenable to gamma knife stereotactic radiosurgery or surgery; therefore, brain MRIs are the preferred modality for brain imaging.
The outcomes used in the clinical trials were stated to have some alignment with the outcomes typically used in clinical practice. A meaningful response to treatment would typically result in improved survival, improved performance status, fewer disease symptoms, reduction in use of analgesic or other supportive medications, and less need for thoracentesis, paracenteses, and palliative radiotherapy. The magnitude of response to treatment was stated to be difficult to define and that physicians often need to use their own judgment. However, improvement in survival of greater than 2 to 3 months and improvements in symptoms and in patients’ ability to perform tasks of daily living are generally considered significant.
Discontinuing Treatment
The decision to discontinue a treatment should be made with the following considerations: imaging or clinical evidence shows a lack of benefit to patients or results in disease progression, a patient experiences intolerance to treatment or shows toxicity to treatment (e.g., diarrhea, fatigue, hand-foot syndrome), a patient’s performance status decreases, or the patient decides to stop treatment.
For some patients who progress on treatment with the tucatinib-combination therapy, a decision may be made to allow patients to continue receiving treatment. In such cases, patients may be considered eligible to continue on tucatinib-combination therapy if they have isolated progression in the brain that is amenable to local therapies with radiation or surgery.
Prescribing Conditions
Tucatinib-combination therapy was stated to be administered in an outpatient clinical setting.
Clinician Group Input
This section was prepared by CADTH staff based on the input provided by clinician groups.
Inputs from 2 clinician groups were received for the Reimbursement Review of tucatinib (Tukysa) in combination with trastuzumab and capecitabine for the treatment of patients with locally advanced unresectable or metastatic HER2-positive breast cancer, including patients with brain metastases, who have received prior treatment with trastuzumab, pertuzumab, and T-DM1, separately or in combination.
The OHCC Breast Disease Site Group is a group of medical oncologists at the OHCC who treat breast cancer and are affiliated with the University of Ottawa in Ontario. They offer routine standard-of-care treatments and access to treatments through clinical trials. The group also serves as a large referral base for the Champlain Local Health Integration Network in Ontario. Input for this submission was collected through canvassing members electronically and in person for input and opinion. The recommendations from the clinicians were condensed and coalesced into summary statements, which reflect the breadth of opinions expressed. Clinician opinions were based on literature review and data from recent international congresses and publications.
The OH-CCO B-DAC provides evidence-based clinical and health system guidance on drug-related issues in support of OH-CCO’s mandate, including Ontario’s drug reimbursement programs and Systemic Treatment Program. Input on this review was discussed jointly via emails and at an OH-CCO B-DAC meeting.
Unmet Needs
Both clinician groups agreed that current first-line treatments include taxane chemotherapy combined with trastuzumab and pertuzumab followed by second-line T-DM1. Both groups acknowledged that there is no standard of care for patients in the third-line treatment setting following progression on T-DM1. Therefore, this particular population does not have access to effective treatments following progression on T-DM1, as treatments in this line of therapy do not have proven survival-prolonging benefits. The clinician groups highlighted the unmet need for HER2-targeted therapies in this treatment setting. They also stated that, other than radiation therapy, patients with brain metastases have limited effective treatment options. The OH-CCO B-DAC added that there is a considerable unmet need in patients with aggressive brain metastases who are not candidates for local therapies, as there are currently no other systemic drugs that offer significant CNS treatment options; as such, tucatinib may be preferred in this patient population. The OHCC’s Breast Disease Site Group noted that current standard third-line treatment options for patients may include endocrine or chemotherapy drugs used as single drugs sequentially.
The OHCC’s Breast Disease Site Group also noted that, internationally or for patients with private insurance, therapies in the third line can include: endocrine therapies with HER2-targeted options (e.g., fulvestrant and abemaciclib plus trastuzumab, aromatase inhibitors, or fulvestrant alone with trastuzumab), single-drug chemotherapy (i.e., capecitabine or vinorelbine) with trastuzumab, dual HER2-targeted combination therapy (i.e., trastuzumab with lapatinib), or chemotherapy and small molecule HER2-targeted approaches (i.e., lapatinib plus capecitabine or neratinib plus capecitabine). Treatments choices for patients are based on patient goals, performance status, symptoms, rapidity of disease progression, visceral organ involvement, and insurance coverage. OHCC’s Breast Disease Site Group added that clinical trials are recommended, when available for eligible patients.
Both clinician groups agreed that OS and quality of life are important treatment goals for patients. OHCC’s Breast Disease Site Group added that in this symptomatic patient population, improved response rates are also desirable to see more rapid symptom improvements. Both groups also agreed that dramatic PFS benefits are also valuable, deferring the need for earlier use of more toxic therapies. There was agreement that there is a need to prevent and delay brain metastases, which are common in this disease, and to effectively treat them, as other systemic therapies currently available to patients have not been effective in this line of treatment. Therefore, tucatinib, capecitabine, and trastuzumab fulfill a significant unmet need in treating HER2-positive breast cancer and have shown improved survival, including among those with brain metastases. The groups commented that, given the lack of other options in this setting, this regimen is critically needed to improve both mortality and morbidity in this patient population.
The OH-CCO B-DAC added that patients who received adjuvant T-DM1 and relapsed within 6 months are currently not eligible for pertuzumab funding in Ontario and are left without any anti-HER2-directed therapy. The group noted that although these patients were not eligible for tucatinib-combination therapy in the HER2CLIMB trial, funding should also be extended to this patient population.
With respect to which patients have the greatest unmet need for an intervention, both clinician groups agreed that patients with advanced HER2-positive breast cancer who have progressed on first- and second-line therapies are most in need, as they do not have any provincially funded options for third-line anti-HER2-directed therapy. OHCC’s Breast Disease Site Group added that patients receiving second-line treatment with contraindications to T-DM1 (e.g., persistent difficult residual peripheral neuropathy from preceding chemotherapy), recurrence or progression after preceding neoadjuvant or adjuvant trastuzumab (with or without pertuzumab or T-DM1), or those with active brain metastases (where the activity of T-DM1 alone is modest), would also be eligible for treatment with tucatinib-combination therapy.
Place in Therapy
Both clinician groups agreed that tucatinib in combination with capecitabine and trastuzumab would be added to existing treatment options and that, generally, tucatinib would fit in as a third line of treatment. OHCC’s Breast Disease Site Group noted that patients beyond the third-line treatment setting, such as those who were treated before tucatinib became available, would also be good candidates for this treatment, as long as their disease had not progressed while on capecitabine chemotherapy.
It was noted that this regimen under review would not, at present, alter the sequencing of therapies for the treatment of HER2-positive breast cancer because other available treatments could be offered beyond progression, as they have been in the past. The OH-CCO B-DAC commented that it is not expected that patients treated with tucatinib, capecitabine, and trastuzumab would be ineligible for subsequent treatment options. Additionally, the OHCC Breast Disease Site Group noted that, in light of expected attrition due to declining health and performance status, the number of subsequent lines of therapy would be fewer, commonly being between zero and 2 lines in practice.
Patient Population
Both clinician groups agreed that patients with advanced breast carcinoma (HER2-positive MBC as per the American Society of Clinical Oncology/College of American Pathologists HER2 criteria) on the basis of IHC analysis or ISH with good ECOG PS, and who had previously been treated with trastuzumab, pertuzumab, and T-DM1, would be best suited for treatment with the regimen under review. The OH-CCO B-DAC noted that testing using IHC, ISH, or FISH is considered standard in the treatment of breast cancer. The OHCC’s Breast Disease Site Group noted that patients who have been on active treatments, monitored closely by their medical oncologists and identified on the basis of objective disease progression, are best suited for treatment. Additionally, the OHCC’s Breast Disease Site Group noted that endocrine-based regimens should not disqualify from eligibility patients with more indolently behaving estrogen receptor–positive disease.
The OH-CCO B-DAC noted the patients least suitable for treatment with tucatinib include those patients previously treated with an anti-HER2 TKI, capecitabine (other than being considered on a time-limited basis), or patients with significant cardiac dysfunction. OHCC’s Breast Disease Site Group added that patients with an ECOG PS of 3 or 4, expected survival of less than 3 months, dysfunctional gastrointestinal tracts, or those ineligible for trastuzumab (based on past severe infusion reactions or cardiac dysfunction) or capecitabine, would be least suitable for treatment with tucatinib.
The OH-CCO B-DAC noted it is not possible to identify patients who would be most likely to exhibit a response to treatment with tucatinib. OHCC’s Breast Disease Site Group added that response rates in the HER2CLIMB trial were 40.6% per RECIST v1.1 criteria, and all eligible patients should have the opportunity to benefit based on the inclusion and exclusion criteria of the trial. The group added that no particular subgroups were found not to benefit from treatment.
Assessing Response to Treatment
The OH-CCO B-DAC noted the outcomes used in clinical practice are aligned with the outcomes that were used in the HER2CLIMB study. Treatment response should be assessed as per breast cancer guidelines and routine clinical and radiographic staging. The OHCC’s Breast Disease Site Group added that patients are evaluated before each cycle of treatment for efficacy and tolerability. The group noted that clinical examination, symptom improvement, biochemical parameters, and periodic radiographic restaging (usually every 3 to 4 cycles) are all used to determine whether a patient is responding to treatment in clinical practice.
Both clinician groups agreed that a clinically meaningful response to treatment would mean improving PFS, OS, and patients’ quality of life, which also includes improved control of CNS disease. The OHCC’s Breast Disease Site Group added that improvement in disease symptoms, which may vary depending on the extent of disease and location of metastatic involvement, or improvement of functional scores (e.g., ECOG PS, Edmonton Symptom Assessment Scale) is a clinically meaningful response. Additionally, radiographic responses by RECIST criteria are also important, signifying a disease-modifying effect that might imply longer PFS, delayed treatment with more toxic therapy, postponement of disability, and improved survival.
Discontinuing Treatment
Both clinician groups agreed that treatment should be discontinued due to disease progression (measured using radiographic RECIST criteria), intolerable or unmanageable toxicity, side effects, or patient or physician preference.
Prescribing Conditions
Both clinical groups agreed that tucatinib and capecitabine are oral therapies that can be given at the patient’s home (or in institutions), whereas IV trastuzumab is administered at specialized cancer clinics or infusion clinic environments. The OH-CCO B-DAC added that monitoring of oral anti-cancer medication would be helpful.
Additional Considerations
Both clinician groups noted that this regimen under review fills an urgent medical need and that the magnitude of benefit warrants approval and use based on the large phase II trial. The OHCC’s Breast Disease Site Group added that the activity seen in controlling or improving brain metastases (even if active) is unprecedented.
The OH-CCO B-DAC added that men were included in HER2CLIMB and should be eligible for tucatinib-combination therapy.
Drug Program Input
The drug programs provide input on each drug being reviewed through CADTH’s Reimbursement Review processes by identifying issues that may impact their ability to implement a recommendation. The implementation questions and corresponding responses from the clinical experts consulted by CADTH are summarized in Table 4.
Table 4: Summary of Drug Plan Input and Clinical Expert Response
Drug program implementation questions | Clinical expert response |
|---|---|
The combination of trastuzumab plus capecitabine (comparator in HER2CLIMB) is not a funded therapy in most Canadian jurisdictions when used after pertuzumab, trastuzumab, and T-DM1. Funded therapies in this setting include capecitabine (monotherapy), and various other chemotherapy options. How does the combination of tucatinib-trastuzumab-capecitabine compare in efficacy and tolerability with chemotherapy alone? | There is no direct evidence comparing tucatinib plus trastuzumab and capecitabine with chemotherapy alone; therefore, efficacy and safety comparisons between the regimens cannot be known with certainty. However, the HER2CLIMB trial showed improved patient outcomes (PFS, OS, ORR) with patients who received the tucatinib-combination therapy over patients who received trastuzumab plus capecitabine. Based on evidence from the HER2CLIMB trial, the clinical experts consulted by CADTH suggested that tucatinib-combination therapy would likely be more efficacious than chemotherapy alone. The clinical experts also acknowledged there may be additional toxicities to consider with the tucatinib-combination regimen compared with chemotherapy alone, including diarrhea, hand-foot syndrome, fatigue, nausea/emesis, elevated liver enzymes, and a small risk of cardiotoxicity. |
Some jurisdictions fund the combination of lapatinib plus capecitabine for patients with disease progression after trastuzumab-based therapy. Is lapatinib-capecitabine a relevant comparator to tucatinib-trastuzumab-capecitabine? If so, how do they compare with regard to efficacy and tolerability? | The clinical experts agreed that lapatinib plus capecitabine is a relevant comparator for tucatinib-trastuzumab-capecitabine. The choice of comparator made in the HER2CLIMB trial (trastuzumab plus capecitabine) was based on the CEREBEL study,19 which compared combination therapy with lapatinib and capecitabine with trastuzumab plus capecitabine and suggested better patient outcomes with trastuzumab plus capecitabine; however, these results are not definitive, as no differences in efficacy were detected between lapatinib plus capecitabine and trastuzumab plus capecitabine. The tucatinib-combination treatment has not been compared with lapatinib plus capecitabine directly. However, the clinical experts consulted by CADTH indicated that indirect comparisons between the HER2CLIMB and CEREBEL trials suggest that tucatinib-trastuzumab-capecitabine may perform better than lapatinib plus capecitabine. The sponsor conducted an ITC that suggested tucatinib-combination therapy improved PFS and OS over lapatinib plus capecitabine.11 However, without rigorous direct comparative evidence, the comparative efficacy and tolerability of each regimen remains uncertain. The clinical experts expected there may be fewer or equal rates of diarrhea and nausea with the tucatinib-combination therapy, as lapatinib and capecitabine toxicities are associated with more of these adverse events than trastuzumab plus capecitabine. |
All patients in HER2CLIMB were pre-treated with trastuzumab, pertuzumab, and T-DM1. In Canada, pertuzumab (in combination with trastuzumab) is funded only in the metastatic or relapsed setting. Patients with disease relapse during adjuvant trastuzumab or within 6 months of completing adjuvant trastuzumab therapy are eligible to receive T-DM1 at disease relapse but are not eligible for funding for pertuzumab-trastuzumab in some jurisdictions. Therefore, this subset of patients was not addressed in the HER2CLIMB population. Should eligibility for tucatinib-trastuzumab-capecitabine be limited to patients with prior exposure to T-DM1, trastuzumab, and pertuzumab? | The clinical experts agreed that eligibility for treatment with tucatinib in combination with trastuzumab and capecitabine should be limited to patients with prior exposure to trastuzumab, pertuzumab, and T-DM1, as these were eligibility criteria of the HER2CLIMB trial. No evidence is available on the efficacy and safety of the tucatinib-combination therapy in the subgroup of patients who have not received pertuzumab as part of a previous treatment regimen. |
HER2CLIMB excluded patients who received prior capecitabine or a HER2-targeted tyrosine kinase inhibitor (unless completed more than 12 months before trial). Are patients with previous treatment with lapatinib eligible to receive the tucatinib-trastuzumab-capecitabine combination? | Prior treatment with lapatinib was permitted within the HER2CLIMB trial as long as patients had received lapatinib > 12 months before initiating HER2CLIMB trial regimens. Therefore, the clinical experts agreed that patients may be eligible for treatment with tucatinib in combination with trastuzumab and capecitabine if they were previously treated with lapatinib, as long as they had completed (or stopped) treatment with lapatinib at least 12 months before initiating tucatinib-combination therapy. Patients in the HER2CLIMB trial previously treated with capecitabine in the metastatic setting were not eligible for enrolment in the HER2CLIMB trial. However, patients who had received capecitabine for adjuvant or neoadjuvant treatment ≥ 12 months before initiating treatment in the HER2CLIMB trial were eligible for enrolment. Therefore, clinical experts agreed that patients with prior treatment with capecitabine in the metastatic setting should not be treated with tucatinib-combination therapy. However, in clinical practice, patients may be considered for treatment with tucatinib-combination therapy if they had received capecitabine in the adjuvant setting at least 12 months before initiating treatment with tucatinib-combination therapy. |
HER2CLIMB included patients with brain metastases. For patients with brain metastases, how do the efficacy and tolerability of the tucatinib-trastuzumab-capecitabine combination compare with currently funded comparators (e.g., chemotherapy)? | The HER2CLIMB trial allowed for the enrolment of patients with brain metastases, and results of the trial supported the efficacy of treatment with the tucatinib-combination in patients with and without brain metastases. Tucatinib-combination therapy in patients with brain metastases was associated with increased tumour-response rates and reduced risk of intracranial progression and death. Most chemotherapeutic drugs currently used for patients with brain metastases have poor penetration of the CNS. Hence, tucatinib-combination therapy is more reasonable for patients with CNS metastasis. Toxicities are likely to be generally higher with the tucatinib, capecitabine, and trastuzumab combination. In an exploratory analysis, re-treatment with tucatinib-combination therapy improved CNS-PFS (time from randomization to disease progression in the brain or death) and OS in a subgroup of patients with brain metastases. The tucatinib-combination treatment has not been compared directly with lapatinib plus capecitabine or chemotherapy alone. Given that lapatinib is known to have CNS activity, the clinical experts suggested it is difficult to assume that tucatinib-combination therapy would be superior to lapatinib plus capecitabine in this subgroup. However, CNS-PFS with lapatinib plus capecitabine vs. trastuzumab plus capecitabine was not statistically significantly longer in the CEREBEL study.19 |
In HER2CLIMB, CT or MRI occurred every 6 weeks for 24 weeks, and every 9 weeks thereafter, to assess disease status using RECIST v1.1 criteria. Patients with brain metastases were required to be assessed using MRI. In practice, which modality and frequency is most appropriate to assess disease status in patients receiving the tucatinib-trastuzumab-capecitabine combination? Do all patients with brain metastases require assessment by MRI and not CT? | To assess a patient’s disease status, clinical experts stated that patients can be assessed using CT scans with or without bone scans in addition to clinical assessments. Imaging assessments are typically performed every 3 to 6 months, at the discretion of the treating physician. The clinical experts confirmed that MRI is the preferred modality for brain imaging. However, for patients with brain metastases, the clinical experts confirmed that imaging using CT would be reasonable where an MRI is not available. |
In HER2CLIMB, patients with only brain disease progression were eligible to continue on the study drugs after completion of local treatment (e.g., radiotherapy, surgery). In practice, which patients will be eligible to continue on the tucatinib-trastuzumab-capecitabine combination despite documented disease progression? | For patients who experience disease progression, the clinical experts consulted by CADTH agreed that patients with disease progression in an isolated brain lesion that is amenable to local therapies (i.e., radiation therapy or surgery) would be eligible to continue receiving tucatinib in combination with trastuzumab and capecitabine after the completion of the local treatment. |
In HER2CLIMB, patients who discontinued either capecitabine or trastuzumab (but not both) remained on tucatinib treatment. Patients who discontinued tucatinib or both capecitabine and trastuzumab were not permitted to remain on study. In practice, are treatment discontinuation parameters from HER2CLIMB reasonable? | In general, the clinical experts considered the treatment discontinuation parameters in the HER2CLIMB trial to be reasonable. However, in some cases, patients may need to discontinue tucatinib due to treatment-related toxicity and clinicians may consider keeping patients on treatment with trastuzumab plus capecitabine. Continuing patients on treatment with trastuzumab plus capecitabine should be made at the physician’s discretion, considering the continued benefit patients may experience and the toxicities of each treatment. Patients who experience disease progression would typically be considered for treatment with another regimen. |
The combination of tucatinib-trastuzumab-capecitabine is proposed for use after pertuzumab, trastuzumab, and T-DM1. Is it appropriate to offer the tucatinib-trastuzumab-capecitabine combination to patients who are otherwise eligible for HER2CLIMB criteria but who are currently receiving systemic therapy (e.g., capecitabine) with no evidence of progressive disease or intolerance? | The clinical experts agreed it would be appropriate to offer tucatinib in combination with trastuzumab and capecitabine to patients who are currently receiving systematic therapy (e.g., capecitabine) with no evidence of disease progression or intolerance, so long as patients otherwise meet the eligibility criteria of the HER2CLIMB trial. |
Patients with ECOG PS > 1 were excluded from the HER2CLIMB trial. Which performance status is most appropriate for treatment with the tucatinib-trastuzumab-capecitabine combination? | Patients with ECOG PS of 0 or 1 were enrolled into the HER2CLIMB trial, and the clinical experts agreed that these patients would be most appropriate for treatment with tucatinib in combination with trastuzumab and capecitabine. While the HER2CLIMB trial did not enrol patients with ECOG PS > 1, clinicians may consider using tucatinib-combination therapy for patients with an ECOG PS of 2. The decision to use this treatment for patients with an ECOG PS of 2 should be based on the judgment of the treating physician. |
CNS = central nervous system; ECOG PS = Eastern Cooperative Oncology Group performance status; HER2 = human epidermal growth factor receptor 2; ITC = indirect treatment comparison; ORR = objective response rate; OS = overall survival; PFS = progression-free survival; RECIST = Response Evaluation Criteria in Solid Tumors; T-DM1 = trastuzumab emtansine.
Clinical Evidence
The clinical evidence included in the review of tucatinib is presented in 3 sections. The first section, the Systematic Review, includes pivotal studies provided in the sponsor’s submission to CADTH and Health Canada, as well as those studies that were selected according to an a priori protocol. The second section includes indirect evidence from the sponsor and selected from the literature that met the selection criteria specified in the review. The third section includes sponsor-submitted long-term extension studies and additional relevant studies that were considered to address important gaps in the evidence included in the systematic review.
Systematic Review (Pivotal and Protocol Selected Studies)
Objectives
To perform a systematic review of the beneficial and harmful effects of tucatinib in combination with trastuzumab and capecitabine for the treatment of patients with locally advanced, unresectable, or metastatic HER2-positive breast cancer, including patients with brain metastases, who have received prior treatment with trastuzumab, pertuzumab, and T-DM1, separately or in combination.
Methods
Studies selected for inclusion in the systematic review included pivotal studies provided in the sponsor’s submission to CADTH and Health Canada, as well as those meeting the selection criteria presented in Table 5.
Table 5: Inclusion Criteria for the Systematic Review
Criteria | Description |
|---|---|
Patient population | Adults (≥ 18 years of age) with locally advanced, unresectable, or metastatic HER2-positive breast cancer, including patients with brain metastases, who have received prior treatment with trastuzumab, pertuzumab, and T-DM1, separately or in combination. Subgroups:
|
Intervention | Tucatinib (300 mg orally twice daily) in combination with trastuzumab (6 mg/kg of body weight IV once every 21 days) and capecitabine (1,000 mg/m2 of body surface area orally twice daily on days 1 to 14 of each 21-day cycle). |
Comparators |
|
Outcomes | Efficacy outcomes:
Harms outcomes:
|
Study design | Published and unpublished phase III and IV RCTs |
AE = adverse event; ALT = alanine aminotransferase; AST = aspartate aminotransferase; ECOG PS = Eastern Cooperative Oncology Group performance status; HER2 = human epidermal growth factor receptor 2; HRQoL = health-related quality of life; IV = IV; RCT = randomized controlled trial; SAE = serious adverse event; T-DM1 = trastuzumab emtansine; TEAE = treatment-emergent adverse event; WDAE = withdrawal due to adverse event.
aThese outcomes were identified as being of particular importance to patients in the input received by CADTH from patient groups.
Outcomes included in the CADTH review protocol reflect outcomes considered to be important to patients, clinicians, and drug plans.
The literature search for clinical studies was performed by an information specialist using a peer-reviewed search strategy according to the PRESS Peer Review of Electronic Search Strategies checklist.20
Published literature was identified by searching the following bibliographic databases: MEDLINE All (1946‒) through Ovid and Embase (1974‒) through Ovid. The search strategy comprised both controlled vocabulary, such as the National Library of Medicine’s MeSH (Medical Subject Headings), and keywords. The main search concept was Tukysa (tucatinib). Clinical trials registries were searched: the US National Institutes of Health’s clinicaltrials.gov, WHO’s International Clinical Trials Registry Platform (ICTRP) search portal, Health Canada’s Clinical Trials Database, and the European Union Clinical Trials Register.
No filters were applied to limit the retrieval by study type. Retrieval was not limited by publication date or by language. Conference abstracts were excluded from the search results. See Appendix 1 for the detailed search strategies.
The initial search was completed on April 19, 2021. Regular alerts updated the search until the meeting of the CADTH pan-Canadian Oncology Drug Review Expert Committee (pERC) on September 8, 2021.
Grey literature (literature that is not commercially published) was identified by searching relevant websites from the Grey Matters: A Practical Tool For Searching Health-Related Grey Literature checklist.21 Included in this search were the websites of regulatory agencies (US FDA and European Medicines Agency). Google was used to search for additional internet-based materials. See Appendix 1 for more information on the grey literature search strategy.
Two CADTH clinical reviewers independently selected studies for inclusion in the review based on titles and abstracts, according to the predetermined protocol. Full-text articles of all citations considered potentially relevant by at least 1 reviewer were acquired. Reviewers independently made the final selection of studies to be included in the review, and differences were resolved through discussion.
Objectives and Methods for the Summary of Indirect Evidence
A focused literature search for NMAs dealing with Tukysa (tucatinib) and breast cancer was run in MEDLINE All (1946–) on April 20, 2021. The search was limited to documents published between January 1, 2010 and April 20, 2021.
Findings From the Literature
A total of 2 studies were identified from the literature for inclusion in the systematic review (Figure 1). The included studies are summarized in Table 6. A list of excluded studies is presented in Appendix 2.
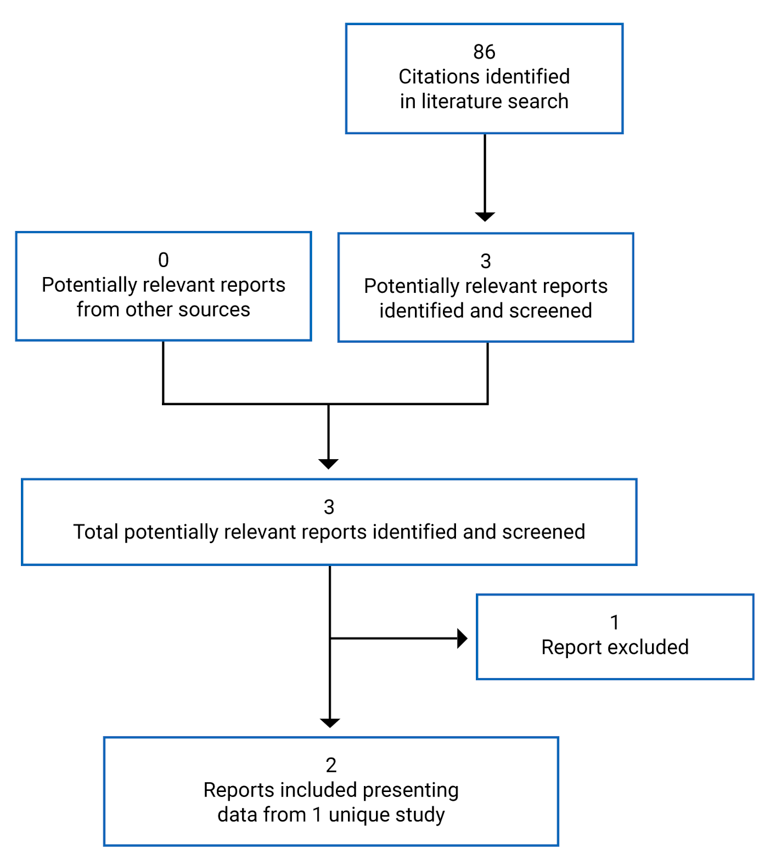
Table 6: Details of Included Studies
Detail | HER2CLIMB |
|---|---|
Designs and populations | |
Study design | International, multi-centre, double-blind, placebo-controlled, phase II randomized controlled trial |
Locations | 155 sites in 15 countries: US, Canada, Europe, Israel, Australia |
Patient enrolment dates | February 23, 2016 to May 3, 2019 |
Randomized (N) | 612 |
Inclusion criteria |
|
Inclusion criteria (continued) | CNS inclusion Patients must have had 1 of the following criteria, based on screening contrast MRI:
Patients with previously treated brain metastases
Patients with untreated brain metastases not needing local therapy
|
Exclusion criteria |
|
Exclusion criteria (continued) |
CNS exclusion Patients could not have any of the following, based on screening brain MRI:
|
Drugs | |
Intervention | Tucatinib plus trastuzumab and capecitabine
|
Comparator(s) | Placebo plus trastuzumab and capecitabine
|
Outcomes | |
Primary end point | PFS: This was defined as the time from randomization to independent centrally reviewed documented disease progression or death from any cause, whichever occurs first, per RECIST v1.1 criteria. |
Secondary and exploratory end points | PFSBM: This was defined as the length of PFS in the subgroup of patients with a history of brain metastases or brain metastases at baseline, or with brain lesions of equivocal significance on screening MRI, defined as the time from the date of randomization to the date of documented disease progression, or death from any cause, whichever occurs first. PFSBM was based on RECIST v1.1 criteria and determined by BICR assessment. OS: This was defined as the time from the date of randomization to the date of death from any cause. PFSINV: This was defined as the time from randomization to investigator-assessed documented disease progression, or death from any cause, whichever occurs first, per RECIST v1.1 criteria. ORR: Objective response rate was defined as achieving a best overall response of CR or PR, per RECIST v1.1 criteria and determined by a BICR. DOR: This was defined as the time from the first objective response (CR or PR) to documented PD, or death from any cause, whichever occurs first, per RECIST v1.1 criteria and determined by a BICR. |
Notes | |
Publications | |
ALT = alanine aminotransferase; AST = aspartate aminotransferase; BICR = blinded independent central review; CNS = central nervous system; CR = complete response; DOR = duration of response; EGFR = epidermal growth factor receptor; ECOG PS = Eastern Cooperative Oncology Group performance status; FISH = fluorescence in situ hybridization; GI = gastrointestinal; HBV = hepatitis B virus; HCV = hepatitis C virus; HER2 = human epidermal growth factor receptor 2; IHC = immunohistochemistry; ISH = in situ hybridization; ORR = objective response rate; OS = overall survival; PD = progressive disease; PFS = progression-free survival; PFSBM = progression-free survival among the subgroup of patients with brain metastases; PR = partial response; RECIST = Response Evaluation Criteria in Solid Tumors; SGOT = serum glutamic-oxaloacetic transaminase; SGPT = serum glutamate-pyruvate transaminase; T-DM1 = trastuzumab emtansine; TKI = tyrosine kinase inhibitor; ULN = upper limit of normal.
Source: HER2CLIMB trial protocol.7
Description of Studies
One multi-centre, multinational, double-blind, phase II randomized controlled trial met the criteria for the CADTH systematic review protocol. The HER2CLIMB trial (N = 612) evaluated the efficacy and safety of tucatinib in combination with trastuzumab and capecitabine compared with placebo in combination with trastuzumab and capecitabine, which will be referred to as the tucatinib-combination group and the placebo-combination group, respectively. Eligible patients included adults with histologically confirmed HER2-positive advanced breast cancer, confirmed using IHC, ISH, or FISH testing. Patients must have had prior treatment with pertuzumab, trastuzumab, and T-DM1, measurable disease using RECIST v1.1 criteria and an ECOG PS of 0 or 1. Patients with brain metastases were also eligible for enrolment.7 Patients were randomized in a 2:1 ratio using a hierarchical randomization scheme via an interactive response technology system to receive either tucatinib-combination or placebo-combination treatment. Patients were stratified according to the following: presence of brain metastases (yes versus no), ECOG PS (0 versus 1), and geographic region (US versus Canada versus the rest of the world). Presence of brain metastases was based on medical history and screening contrast brain MRI, as assessed by an investigator. Patients with a documented history of prior brain metastases and patients with brain lesions of equivocal significance on screening MRI were stratified into the “yes” category. The hierarchical randomization scheme included specifications for a biased-coin assignment to allow for randomization of approximately equal proportions of patients in each treatment group and stratification factor. The biased-coin assignment allowed for greater randomization of patients to specific groups when an imbalance at a given hierarchical level (i.e., overall treatment group balance, then treatment group balance within each stratification factor) exceeded a specified threshold.7
This international trial was conducted in 15 countries across 155 sites and included a total of 38 patients from Canada.7,8 The study was double-blinded; patients, personnel in contact with study patients, data-collection personnel, and others associated with patient procedures or data handling were blinded to the treatment allocation. Access to treatment allocation information in the trial was permitted only in the event of a suspected unexpected serious adverse reaction where unblinding for regulatory purposes became necessary; all such events were reported in accordance with local regulatory requirements. The following data were unblinded and monitored regularly by an independent data monitoring committee: deaths, discontinuations, dose reductions, AEs, and SAEs). Efficacy assessments were performed once every 6 weeks for the first 6 months while on study, and then once every 9 weeks.7 An overview of the HER2CLIMB trial is illustrated in Figure 2.
Figure 2: HER2CLIMB Trial Schematic
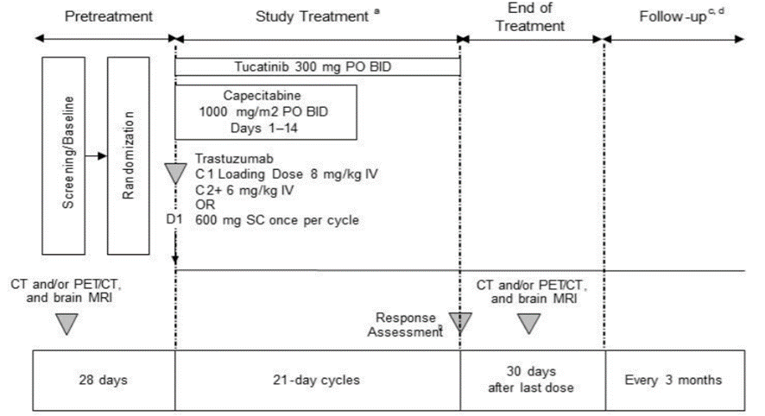
BID = twice a day; CNS = central nervous system; PD = progressive disease; PO = orally; SC = subcutaneous.
a Treatment continued until unacceptable toxicity, disease progression, withdrawal of consent, or study closure. Patients with CNS progression could undergo local therapy for CNS lesions and continue on study treatment with approval from the medical monitor for clinical benefit.
b Contrast CT, PET/CT, and/or MRI, and brain contrast MRI scan at baseline, every 6 weeks for the first 24 weeks, and then every 9 weeks thereafter until PD, initiation of a new therapy, withdrawal of consent, or study closure. Patients without brain metastases at baseline did not require brain contrast MRIs while on treatment. A brain contrast MRI was required at the 30-day follow-up visit for all patients.
c Assessment of overall survival and/or disease recurrence, as well as collection of information regarding any additional anti-cancer therapies administered after completion of study treatment.
d If study treatment was discontinued for reasons other than disease progression or death, every reasonable effort was to be made to obtain contrast CT, PET/CT, and/or MRI, and contrast brain MRI (only in patients with known brain metastases) approximately every 9 weeks until disease progression, death, withdrawal of consent, or study closure.
Source: HER2CLIMB Clinical Study Report.7
Baseline Assessments
Patients were provided with the option of being pre-screened for HER2 status by central review before any study screening. The screening period lasted up to 28 days, during which all patients received an MRI of the brain and underwent high-quality spiral contrast CT, PET/CT, and/or contrast MRI scan imaging including, at a minimum, the chest, abdomen, pelvis, and appropriate imaging of other known sites of disease (e.g., skin lesion photography, bone imaging). Blood samples were taken for assessment of biomarkers, hematology, coagulation, chemistry, and liver function. Patients were also screened for cardiac function, hepatitis B and C, urinalysis, and pregnancy (except in men and women of non-child-bearing age).7
Post-Treatment Discontinuation Assessments
Approximately 30 days after patients discontinued study treatment, a final routine safety assessment was conducted that included a physical examination and laboratory assessments. All patients were also required to undergo a repeat contrast MRI of the brain. Patients who discontinued treatment for reasons other than disease progression, repeat imaging scans of all known areas of metastatic or locally advanced unresectable disease were requested until patients experienced either progression of disease or death. Bloodwork was conducted to assess for the presence of certain biomarkers of response (i.e., analysis of mutations in circulating tumour DNA), and performed locally at sites.
Populations
Inclusion and Exclusion Criteria
Eligibility criteria for the HER2CLIMB trial are reported in Table 6. Briefly, eligible patients included adult women with histologically confirmed HER2-positive advanced breast cancer. HER2-positive status must have been confirmed via IHC, ISH, or FISH methodology. Patients must have had prior treatment with pertuzumab, trastuzumab, and T-DM1, measurable disease via RECIST v1.1 criteria, and an ECOG PS of 0 or 1.7 Patients with brain metastases were also eligible for enrolment so long as there was no need for immediate local intervention. Patients who required local intervention could subsequently enrol after they had received local therapy. Presence of brain metastases was based on medical history and screening contrast brain MRI, as assessed by an investigator. Patients were not eligible for enrolment if they had received prior treatment with capecitabine, lapatinib, neratinib, afatinib, or any other HER2-targeted EGFR or TKI; however, patients who were treated with capecitabine or lapatinib 12 or more months before initiating any trial treatment, or who received treatment within 21 days and who discontinued for reasons other than disease progression or severe toxicity, could enrol in the HER2CLIMB trial.7
Baseline Characteristics
Baseline characteristics of the HER2CLIMB trial are reported in Table 7.
In general, baseline characteristics were well balanced across both treatment groups in both the ITT and ITT-PFS populations; baseline characteristics were also similar across both trial populations. In the ITT population, patients had a mean age of 54 years with most patients (> 80%) being less than 65 years of age. In the tucatinib- and placebo-combination groups, most patients were White, with slightly fewer White patients in the tucatinib-combination group (70.0%) than in the placebo-combination group (77.7%). Most were from the US (53.7% versus 55.0%, respectively) or the rest of the world (40.0% versus 39.1%). Relatively equal proportions of patients had an ECOG PS of 0 (49.8% in the tucatinib-combination group and 46.5% in the placebo-combination group) or 1 (50.2% versus 53.5%, respectively).7
The majority of patients had metastatic disease (≥ 99%) at study entry. At initial diagnosis, patients were classified as having stage II (30.0% versus 26.2% in the tucatinib- and placebo-combination groups, respectively), stage III (23.7% versus 21.8%), or stage IV (34.9% versus 38.1%) disease, and were positive for at least 1 hormone receptor (59.3% versus 62.9%) or negative for both (39.3% versus 37.1%). Ninety-eight percent of patients in both treatment groups reported non-CNS metastases at baseline, reporting mostly lung (48.8% versus 49.5%), bone (54.4% versus 55.5%), or liver (33.4% versus 38.6%) metastases. Brain metastases were reported in 48.5% of patients in the tucatinib-combination group and 48.0% of patients in the placebo-combination group.7 A mean of 4 lines of prior therapy were reported by all patients in both treatment groups, with a mean of 3 prior therapies specifically in the metastatic setting. As per eligibility criteria, all patients (100%) received prior treatment with trastuzumab and T-DM1; most patients (> 99%) reported prior therapy with pertuzumab. Patients who received prior treatment with trastuzumab did so mostly in the metastatic setting (56.8% in the tucatinib-combination group versus 63.9% in the placebo-combination group), followed by the neoadjuvant or adjuvant and metastatic setting (37.1% versus 29.2%, respectively). Patients receiving prior T-DM1 did so primarily in the metastatic setting only (99.0% versus 98.0% in the tucatinib- and placebo-combination groups, respectively). Patients receiving prior pertuzumab did so mostly in the metastatic setting only (86.3% versus 86.1% in the tucatinib- and placebo-combination groups, respectively). Few patients received prior treatment with trastuzumab, T-DM1, and pertuzumab in the neoadjuvant or adjuvant setting only.7
Table 7: Summary of Baseline Characteristics Participants in the HER2CLIMB Trial
Characteristic | ITT population | ITT-PFS population | ||
|---|---|---|---|---|
Tucatinib-combination group N = 410 | Placebo-combination group N = 202 | Tucatinib-combination group N = 320 | Placebo-combination group N = 160 | |
Sex, n (%) | ||||
Female | 407 (99.3) | 200 (99.0) | 317 (99.1) | 158 (98.8) |
Male | 3 (0.7) | 2 (1.0) | 3 (0.9) | 2 (1.3) |
Age (years) | ||||
Mean (SD) | 53.8 (11.3) | 54.2 (10.4) | 53.9 (11.3) | 54.0 (10.4) |
Median | 55.0 | 54.0 | 54.0 | 54.0 |
Minimum, maximum | 22, 80 | 25, 82 | 27, 80 | 25, 78 |
Age category, n (%) | ||||
< 65 years | 328 (80.0) | 168 (83.2) | 252 (78.8) | 132 (82.5) |
≥ 65 years | 82 (20.0) | 34 (16.8) | 68 (21.3) | 28 (17.5) |
Race, n (%) | ||||
Asian | 18 (4.4) | 5 (2.5) | 17 (5.3) | 3 (1.9) |
Black or African American | 41 (10.0) | 14 (6.9) | 30 (9.4) | 13 (8.1) |
White | 287 (70.0) | 157 (77.7) | 225 (70.3) | 125 (78.1) |
Other | 3 (0.7) | 2 (1.0) | 3 (0.9) | 2 (1.3) |
Unknown | 61 (14.9) | 24 (11.9) | 45 (14.1) | 17 (10.6) |
Ethnicity, n (%) | ||||
Hispanic or Latino | 37 (9.0) | 14 (6.9) | 31 (9.7) | 11 (6.9) |
Not Hispanic or Latino | 362 (88.3) | 184 (91.1) | 283 (88.4) | 146 (91.3) |
Not available | 11 (2.7) | 4 (2.0) | 6 (1.9) | 3 (1.9) |
Region of world | ||||
US | 220 (53.7) | 111 (55.0) | 180 (56.3) | 95 (59.4) |
Canada | 26 (6.3) | 12 (5.9) | 24 (7.5) | 8 (5.0) |
Rest of world | 164 (40.0) | 79 (39.1) | 116 (36.3) | 57 (35.6) |
ECOG PS, n (%) | ||||
0 | 204 (49.8) | 94 (46.5) | 159 (49.7) | 76 (47.5) |
1 | 206 (50.2) | 108 (53.5) | 161 (50.3) | 84 (52.5) |
Presence or history of brain metastases | ||||
Yes | 199 (48.5) | 97 (48.0) | 149 (46.6) | 75 (46.9) |
No | 211 (51.5) | 105 (52.0) | 171 (53.4) | 85 (53.1) |
Disease status at study entry, n (%) | ||||
Unresectable, locally advanced | 1 (0.2) | 2 (1.0) | 1 (0.3) | 2 (1.3) |
Metastatic | 409 (99.8) | 200 (99.0) | 319 (99.7) | 158 (98.8) |
Stage at initial diagnosis, n (%) | ||||
0 | 6 (1.5) | 3 (1.5) | 6 (1.9) | 3 (1.9) |
1 | 38 (9.3) | 22 (10.9) | 29 (9.1) | 16 (10.0) |
2 | 123 (30.0) | 53 (26.2) | 98 (30.6) | 34 (21.3) |
3 | 97 (23.7) | 44 (21.8) | 78 (24.4) | 37 (23.1) |
4 | 143 (34.9) | 77 (38.1) | 108 (33.8) | 67 (41.9) |
Not available | 3 (0.7) | 3 (1.5) | 1 (0.3) | 3 (1.9) |
Hormone receptor status, n (%) | ||||
Positive for either or both | 243 (59.3) | 127 (62.9) | 190 (59.4) | 99 (61.9) |
Negative for both | 161 (39.3) | 75 (37.1) | 126 (39.4) | 61 (38.1) |
Other | 6 (1.5) | 0 | 4 (1.3) | 0 |
Sites of metastatic disease, n (%) | ||||
Subjects with history of brain metastases or brain metastases at study entry | 198 (48.3) | 93 (46.0) | 148 (46.3) | 71 (44.4) |
Subjects with non-CNS metastatic disease at study entry | 402 (98.0) | 198 (98.0) | 313 (97.8) | 157 (98.1) |
Lung | 200 (48.8) | 100 (49.5) | 160 (50.0) | 82 (51.3) |
Liver | 137 (33.4) | 78 (38.6) | 108 (33.8) | 64 (40.0) |
Bone | 223 (54.4) | 111 (55.0) | 178 (55.6) | 85 (53.1) |
Skin or subcutaneous | 58 (14.1) | 28 (13.9) | 49 (15.3) | 23 (14.4) |
Number of prior lines of systemic therapy | ||||
Mean (SD) | 4.0 (1.8) | 4.0 (1.9) | 4.1 (1.8) | 4.0 (2.0) |
Median | 4.0 | 4.0 | 4.0 | 4.0 |
Minimum, maximum | 2, 14 | 2, 17 | 2, 14 | 2, 17 |
Number of prior lines of systemic therapy in the metastatic setting | ||||
Mean (SD) | 3.1 (1.6) | 3.0 (1.6) | 3.1 (1.6) | 3.1 (1.7) |
Median | 3.0 | 3.0 | 3.0 | 3.0 |
Minimum, maximum | 1, 14 | 1, 13 | 1, 14 | 1, 13 |
Medication and disease setting, n (%) | ||||
Pertuzumab | 409 (99.8) | 201 (99.5) | 320 (100) | 159 (99.4) |
Neoadjuvant or adjuvant only | 38 (9.3) | 16 (7.9) | 31 (9.7) | 13 (8.1) |
Metastatic only | 354 (86.3) | 174 (86.1) | 277 (86.6) | 139 (86.9) |
Both neoadjuvant or adjuvant and metastatic | 17 (4.1) | 11 (5.4) | 12 (3.8) | 7 (4.4) |
T-DM1 | 410 (100) | 202 (100) | 320 (100) | 160 (100) |
Neoadjuvant or adjuvant only | 3 (0.7) | 4 (2.0) | 3 (0.9) | 2 (1.3) |
Metastatic only | 406 (99.0) | 198 (98.0) | 316 (98.8) | 158 (98.8) |
Both neoadjuvant or adjuvant and metastatic | 1 (0.2) | 0 | 1 (0.3) | 0 |
Trastuzumab | 410 (100) | 202 (100) | 320 (100) | 160 (100) |
Neoadjuvant/adjuvant only | 25 (6.1) | 14 (6.9) | 21 (6.6) | 12 (7.5) |
Metastatic only | 233 (56.8) | 129 (63.9) | 180 (56.3) | 107 (66.9) |
Both neoadjuvant/adjuvant and metastatic | 152 (37.1) | 59 (29.2) | 119 (37.2) | 41 (25.6) |
ECOG PS = Eastern Cooperative Oncology Group performance status; ITT = intention to treat; PFS = progression-free survival; SD = standard deviation; T-DM1 = (ado) trastuzumab emtansine.
Source: HER2CLIMB Clinical Study Report.7
Interventions
Treatments were administered in 21-day cycles in the HER2CLIMB trial. The experimental group of the trial received the tucatinib-combination, consisting of tucatinib in combination with capecitabine and trastuzumab. The control group received the placebo-combination, consisting of placebo in combination with capecitabine and trastuzumab.7 The treatment dosages in the tucatinib-combination group were as follows:
Tucatinib (300 mg) was administered orally twice daily.
Capecitabine (1,000 mg/m2) was administered orally twice daily on days 1 to 14 of each 21-day cycle.
Trastuzumab was administered with an initial loading dose of 8 mg/kg IV, after which it was administered at 6 mg/kg once every 21 days, except in specific circumstances where it was given weekly to compensate for modifications to the treatment schedule. Alternatively, trastuzumab could have been administered at a dose of 2 mg/kg IV every week (7 days), but only in circumstances when the trastuzumab infusion has been delayed, and weekly infusions are required to re-synchronize the cycle length to 21 days, after discussion with a medical monitor.
Subcutaneous use of trastuzumab was permitted; when subcutaneous trastuzumab was administered, a fixed dose of 600 mg was provided without a loading dose. Subcutaneous trastuzumab was administered once every 3 weeks, as there was no allowance for weekly dosages. Crossover from IV to subcutaneous trastuzumab was permitted within the trial.
Where national regulatory authorities approved the use of a trastuzumab biosimilar, either IV or subcutaneous, the biosimilar could be administered if considered appropriate by the investigator.
The treatment dosages in the placebo-combination group were the same as the tucatinib-combination group, except that patients received placebo tablets in place of tucatinib; patients also received the placebo orally twice daily. Treatment for patients continued until unacceptable toxicity, disease progression, withdrawal of consent, or study closure.7
Patients with isolated progression in the brain and stable systemic disease were permitted to be treated with local therapy (i.e., radiation therapy, surgery). These patients were permitted to continue the assigned study treatment for clinical benefit after a PFS event in the brain, with approval from a medical monitor. For patients to continue the study treatment after CNS progression, the following criteria were required to have been met:
No worsening of cancer-related symptoms. Patients who were clinically deteriorating and unlikely to continue to receive further benefit from the study treatment should be discontinued.
Patient should be tolerating the study treatment.
Continuation of study treatment reviewed and approved by the medical monitor.
Patient had no evidence of unequivocal systemic progression.
Patient had not had a previous isolated CNS progression while on study treatment.
Study treatments were permitted to be held for up to 6 weeks to allow for local CNS therapy. Oral therapies, including tucatinib, placebo, and capecitabine, were to be held 1 week before planned CNS-directed therapy. Capecitabine, which was stated to be a known radiation sensitizer, was required to be held before CNS-directed therapy. Trastuzumab was permitted to continue while patients received radiotherapy, as it has been shown not to increase the effects of radiation. The sponsor noted that this approach of continuing treatment after evidence of progression in the brain approximates common off-practice study in clinical practices; therefore, the duration of treatment after patients experience progression in the brain was assessed only as an exploratory objective.7
Patients who discontinued the study treatments received further care, as determined by their physician. For patients who did not have any clear evidence of clinical progression, development of CNS symptoms, or radiographic changes thought to pose immediate risk, efforts were made to maintain the study treatments until unequivocal evidence of radiologic or clinical progression as per RECIST v1.1 criteria. No crossover was permitted during the double-blind phase of the trial.7 In the absence of progressive disease, efforts were made to avoid radiation therapy or surgery to target lesions in the brain unless clinically necessary, in the opinion of the investigator. This was done because target lesions could not be adequately assessed for subsequent response to systemic therapy once treated with local CNS therapy; this might have interfered with assessment of PFS, which was the main end point of the HER2CLIMB trial.7
Dose Modifications or Reductions
Dose modifications were required for certain clinical AEs, significant changes in hepatotoxicities, measured cardiac ejection fraction, and QT interval. Dose modifications for other toxicities were also permitted at the investigator’s discretion.7 Dose modifications of tucatinib, placebo, and capecitabine were permitted. Tucatinib and placebo dose reductions were made in steps of 50 mg, 100 mg, or 150 mg per dose. Up to 3 dose reductions of tucatinib or placebo were permitted. However, dose reductions of tucatinib or placebo below 150 mg per dose were not permitted; patients requiring dose reductions lower than 150 mg per dose or who required a fourth dose reduction should discontinue from the study. Re-escalations of tucatinib or placebo were not permitted. Dose reductions of capecitabine occurred based on toxicities per Common Terminology Criteria for Adverse Events criteria, which specify modifications by grade of AEs; doses of capecitabine should not be re-escalated once a dose reduction was made. Dose reductions of trastuzumab were not permitted within the trial. Doses of any trial treatment were permitted to be held for up to 6 weeks for toxicity; however, doses held for periods longer than 6 weeks required approval from a medical monitor.7
Treatment Discontinuations
Patients who experienced toxicity from capecitabine or trastuzumab were permitted to discontinue 1 of these drugs and continue on tucatinib or placebo in combination with either capecitabine or trastuzumab. Patients were not permitted to continue the study treatments if they required discontinuation of both capecitabine and trastuzumab, or discontinuation of tucatinib or placebo; these patients were followed for efficacy assessments per the protocol schedule.7
Concomitant Medications
Concomitant medications, which included strong CYP3A4 or CYP2C8 inducers of inhibitors, warfarin therapy, or therapy with other coumarin derivatives that are known and accepted to prolong QTc, were not permitted while in the study. However, some treatments that are possibly associated with QTc prolongation were permitted to be administered with caution. Corticosteroids at a daily dose of greater than 2 mg dexamethasone or equivalent for control of symptoms of brain metastases were not permitted at the time of study entry. Any planned surgery that was not directly related to cancer required consultation with the sponsor’s medical monitor, and patients were required to suspend the study treatments 3 to 7 days before surgery and resume treatment 3 to 14 days post surgery. Standard supportive care measures (e.g., anti-emetics, antidiarrheal medications, permitted concomitant medications, and hematopoietic support) were permitted within the trial but were not required.7
Outcomes
A list of efficacy end points identified in the CADTH review protocol that were assessed in the clinical trials included in this review is provided in Table 8. These end points are further summarized subsequently. A detailed discussion and critical appraisal of the outcome measures is provided in Appendix 4.
Table 8: Summary of Outcomes of Interest Identified in the CADTH Review Protocol
Outcome measure | Definition |
|---|---|
Primary end point | |
PFS | PFS was defined as the time from the date of randomization to the date of documented disease progression or death due to any cause, whichever occurs first, as per RECIST v1.1 criteria and determined by a BICR. |
Key secondary end points | |
PFSBM | PFSBM was defined as the time in the subgroup of patients with a history of brain metastases or brain metastases at baseline, or with brain lesions of equivocal significance on screening MRI, defined as the time from the date of randomization to the date of documented disease progression or death from any cause, whichever occurs first. PFSBM was based on RECIST v1.1 criteria and determined by BICR assessment. |
OS | OS was defined as the time from the date of randomization to the date of death from any cause. |
Other secondary end points | |
ORR | Objective response was defined as achieving a best overall response of complete response (CR) or partial response (PR), per RECIST v1.1 criteria and determined by a BICR. |
PFSINV | The definition for PFSINV was the same as the definition for PFS of the primary end point; however, PFSINV was assessed by an investigator. |
DOR | DOR was defined as the time from the first objective response (CR or PR) to documented disease progression (PD), or death from any cause, whichever occurs first, per RECIST v1.1 criteria and determined by a BICR. |
BICR = blinded independent central review; CR = complete response; DOR = duration of response; ORR = objective response rate; OS = overall survival; PD = disease progression; PFS = progression-free survival; PFSBM = progression-free survival among the subgroup of patients with brain metastases; PFSINV = investigator-assessed progression-free survival; PR = partial response; RECIST = Response Evaluation Criteria in Solid Tumors.
Source: HER2CLIMB Clinical Study Report.7
Efficacy Assessments
Efficacy assessments included measurement of all known sites of metastatic or locally advanced unresectable disease (including, at a minimum, the chest, abdomen, and pelvis) by high-quality spiral contrast CT, PET/CT (if high-quality CT scan included), and/or MRI scan, as appropriate, as well as appropriate imaging of any other known sites of disease (e.g., skin lesion photography, bone imaging). Scans were taken at baseline, every 6 weeks for the first 24 weeks, and every 9 weeks thereafter, irrespective of dose holdings or interruptions.7 Efficacy assessments for each patient continued until PFS was confirmed and documented. Follow-up for survival will continue until study closure. A contrast MRI of the brain was required on this same schedule only for those patients with a prior history of brain metastases or if brain metastases were found at screening. Contrast brain MRI might also have been performed for patients without known brain metastases if there was clinical suspicion of new brain lesions. Additional imaging, such as nuclear medicine bone scan or other unscheduled scans, was performed at the discretion of the investigator. Treatment decisions were made based upon local assessment of radiologic scans. Patients in both arms of the study would continue to be followed for OS after completion of study treatment as well as after the occurrence of disease progression.7
Safety Assessments
Safety data were monitored and performed by the sponsor throughout the study on a blinded basis. An independent data monitoring committee regularly reviewed all safety and efficacy data. Patients were assessed throughout the study for safety. Safety assessments, including a physical exam and collection of AEs and laboratory abnormalities, were performed at least once every 3 weeks throughout study treatment and 30 days after the last dose of the study drugs. Laboratory assessments were performed locally.7 During cycle 1, an in-person safety assessment was performed on days 1 and 12. During cycle 2, an in-person safety assessment took place on day 1 and liver function tests (AST, ALT, and total bilirubin) were performed on day 12 of cycle 2. An in-person safety assessment was then performed on day 1 of each cycle throughout the remainder of the study or as clinically indicated. Cardiac ejection fraction was assessed by multiple-gated acquisition scan or echocardiogram performed at screening, once every 12 weeks thereafter until study discontinuation (irrespective of dose delays or interruption), and 30 days after the last dose of the study drugs (unless the last scan was done less than 12 weeks before the 30-day follow-up visit).7
Exploratory End Points
The objectives of the exploratory end points included assessment of the tucatinib combination compared with the placebo combination using Response Assessment in Neuro-Oncology Brain Metastases (RANO-BM) in the subgroup of patients with brain metastases, as determined by BICR, assessment of the effect of the tucatinib combination versus the placebo combination on progression in the brain in the subgroup of patients with brain metastases.7
Health-Related Quality of Life
HRQoL was assessed using the EQ-5D-5L questionnaire. The questionnaire was administered at cycle 1 on day 1 before the start of study treatment, after which patients were administered the questionnaire every 6 weeks for 24 weeks and then every 9 weeks until disease progression, death, toxicity, withdrawal of consent, or study closure. A post-treatment assessment also occurred approximately 30 days after the end of treatment.7
Statistical Analysis
Analysis Populations
A description of the main efficacy and safety analysis sets is provided in Table 9.
Table 9: Analysis Sets Used in the HER2CLIMB Trial
Analysis set | Description |
|---|---|
ITT | The ITT population included all randomized patients. This analysis set was used for analysis of the key secondary end points of OS and PFSBM. Patients in this analysis set were evaluated by the treatment group they were assigned to. |
ITT-PFS | The ITT-PFS set included the first 480 randomized patients included in the ITT population. This analysis set was used for the primary analysis of PFS per BICR. Patients in this analysis set were evaluated by the treatment group they were assigned to. |
ITT-PFSBM | The ITT-PFSBM set included all of the randomized patients in the subgroup of patients with brain metastases. This analysis set was used to analyze PFSBM, a key secondary end point. |
Safety population | The safety population included all randomized patients who received at least 1 dose of tucatinib or placebo, capecitabine, or trastuzumab, with patients allocated to the group for the treatment they actually received. |
BICR = blinded independent central review; ITT = intention to treat; OS = overall survival; PFS = progression-free survival; PFSBM = progression-free survival among the subgroup of patients with brain metastases.
Source: HER2CLIMB Clinical Study Report.7
Sample Size
The sample of patients in the HER2CLIMB trial was pre-specified to ensure enough power for the assessment of PFS, PFSBM, and OS. Details are provided in Table 10; this table and Figure 3 also describe the timing for the primary and interim analyses.
The accrual period for patients was expected to occur within 42 months, with 12 months of follow-up for PFS continuing after the last patient was randomized. Assuming that 10% of patients are lost to follow-up annually, it was expected that approximately 480 patients would have to be randomized to have 214 PFS events in the subgroup of patients with brain metastases at baseline.7 In addition, based on an accrual period of 48 months for OS and a 5% yearly dropout rate, 361 OS events were expected to occur after approximately 59 months after the first patient was randomized.3
Table 10: Summary of Power Considerations for the HER2CLIMB Trial
End point | Power considerations |
|---|---|
PFS | The power of the trial was set to 90% for assessment of PFS in the overall population with a 2-sided type I error rate of 5%; a total of 287 PFS events were required. The HER2CLIMB trial was designed to detect an HR of 0.67 (median PFS of 6.75 months in the tucatinib-combination group and 4.50 months in the placebo-combination group).3 The primary analysis was planned to be performed when approximately 288 PFS events had occurred among all randomized patients. No interim analyses were planned for this primary end point.7 |
PFSBM | The power of the analysis of PFS accounted for the 50% of patients who were expected to have brain metastases at baseline. The power of testing for PFS in the subgroup of patients with brain metastases at baseline was 80% with an alpha of 0.05, which represented a total of 220 PFS events and an expected HR of 0.67 (median PFSBM of 6.75 months in the tucatinib-combination group and 4.50 months in the placebo-combination group).3 Testing for PFSBM also took into account 1 interim analysis that was expected to have a power of 74% at a 2-sided alpha of 0.03.3 The interim analysis for PFSBM was performed at the time of the primary analysis for PFS. If PFSBM was found to be statistically significant at the first interim analysis, no further formal testing of this end point was conducted. If PFSBM was not found to be statistically significant at the first interim analysis, a second analysis of this end point was specified to be conducted:
|
OS | The analysis for OS was set to have 80% power with a 2-sided alpha of 0.02; a total of 361 events were required for 80% for detection of an HR of 0.70 (median OS of 21.4 months in the tucatinib-combination group and 15 months in the placebo-combination group). The analysis of OS took into account 2 interim analyses. The 361 OS events also corresponded to 88% power with an alpha of 0.05.3 The first interim analysis for OS occurred at the time of the primary analysis for PFS. The second interim analysis for OS was to be performed when approximately 75% of total OS events, or approximately 271 events, occurred in the ITT population. The final analysis for OS was specified to be conducted after approximately 361 events occurred in the ITT population. |
HR = hazard ratio; ITT = intention to treat; OS = overall survival; PFS = progression-free survival; PFSBM = progression-free survival among the subgroup of patients with brain metastases.
Figure 3: Timing of Primary and Interim Analyses
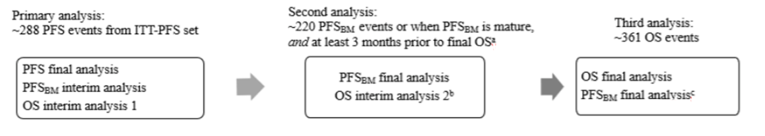
ITT = intention to treat; OS = overall survival; PFS = progression-free survival; PFSBM = progression-free survival among the subgroup of patients with brain metastases.
a If these 2 conditions are not met, then this analysis will be skipped.
b If PFSBM is positive at the primary analysis, OS interim analysis 2 will be conducted at 75% OS events (approximately 271 events).
c Only if conditions for second analysis timing are not met.
Source: HER2CLIMB statistical analysis plan.3
It should be noted that, as the trial included PFS among the overall trial population and within the subgroup of patients with brain metastases at baseline and OS as end points, the analysis of PFS was conducted hierarchically to control for the family-wise type I error rate of 0.05; therefore, the analysis of PFS among the overall population was tested first in the ITT-PFS population, and, if it was found to be statistically significant, testing was conducted for key secondary end points using the group sequential Holm variable procedure.8,23
The alpha was split between the end points of OS and PFSBM (with 0.03 and 0.02 allocated, respectively) and tested at both the interim and final analyses, if not rejected at the interim analysis. The statistical significance of the boundaries at the interim analysis was determined using a Lan-DeMets O’Brien-Fleming approximation spending function. The boundaries for PFSBM and OS at the interim analysis are outlined in Table 11.3
If both OS and PFSBM were reported to be statistically significant at the primary analysis, no formal testing for the 2 end points was specified to occur after that point. The protocol of the HER2CLIMB trial pre-specified the alphas to be used for the analyses of each efficacy end point, depending on whether 1 or both OS and PFSBM were found to be statistically significant at the primary analysis. However, as both end points were found to be statistically significant at the primary analyses, the details of other possible scenarios are not reported here.3 The initial boundaries for the first interim analysis follow Table 11.3
If both the OS and PFSBM end points were found to be statistically significant, then the secondary end point of ORR was to be formally tested between the treatment groups using a 2-sided alpha of 0.05.3
Table 11: Initial Testing Boundaries for PFSBM and OS
Analysis | PFS (alpha = 0.03, t = 0.812) | OS (alpha = 0.02, t1 = 0.626, t2 = 0.779) |
|---|---|---|
1 | 0.0139 | 0.0023 |
2 | 0.0259 | 0.0069 |
3 | — | 0.0176 |
OS = overall survival; PFS = progression-free survival; PFSBM = progression-free survival among the subgroup of patients with brain metastases.
Source: HER2CLIMB statistical analysis plan.3
Data collected in the study were presented using summary tables, patient data listings, and figures. Continuous outcomes were summarized using descriptive statistics (e.g., mean, median, standard deviation, and minimum and maximum). Categorical outcomes were summarized by frequencies and percentages. Two-sided 95% CIs were presented where needed.
Disease evaluations were performed by both an independent central review and investigator using RECIST v1.1 criteria. Exploratory efficacy end points, which analyze patients with and without brain metastases, disease evaluations were performed using the bi-compartmental tumour assessment method, with non-CNS disease evaluated using RECIST v1.1 criteria and the CNS disease evaluated using the RANO-BM criteria.3
The study continued to collect relevant clinical and survival follow-up data until approximately 350 deaths were recorded, which was described as the end of the study.3
Efficacy Analyses
Primary End Point
Progression-free survival: The primary end point of PFS was assessed through BICR. Treatment groups were compared using a 2-sided log-rank test. A procedure based on re-randomization was implemented that took into account stratification factors used for randomization (known history of treated or untreated brain metastases, ECOG PS, and region of the world).3 The primary analysis for PFS included all randomized patients, and Kaplan–Meier methodology was used to estimate PFS time curves, including the median. A Cox proportional hazards model was used to estimate the HR and corresponding 95% CI, taking into account stratification factors. The P value for PFS was calculated using a re-randomization-based procedure24 to reflect the dynamic, hierarchical allocation scheme used for randomization in this trial.3 Patients were censored under the following circumstances:
Patients without post-baseline tumour assessments were censored on the date of randomization.
Patients without documented disease progression or death were censored on the date of their last assessment for progression.3
Patients who began new anti-cancer treatment before disease progression or death were censored on the date of their last assessment before beginning new anti-cancer treatment.
Patients who died or progressed after consecutively missing 2 or more tumour assessments were censored on the date of their last assessment for progression.
Key Secondary End Points
The analyses of PFS in the subgroup of patients with CNS and OS were conducted in the same manner as the primary end point of PFS. Analyses of all other end points relied primarily on descriptive summary statistics and CIs.
Progression-free survival in patients with brain metastases at baseline: PFSBM was tested if PFS among the overall population reached statistical significance at the 2-sided 0.05 level. PFS for this subgroup of patients was assessed using the methodology outlined for PFS in the overall population (see Primary End Point discussed previously).
Overall survival: Follow-up for OS was expected to continue until a sufficient number of events were recorded to have 90% power to test the effect of treatment on OS. It was assumed that the effect of OS would be smaller than the effect expected for PFS; therefore, an HR of 0.70 was expected for OS and required approximately 350 OS events. The primary analysis for OS was expected to occur approximately 1 to 2 years after the primary analysis of PFS.3
OS was analyzed in the same manner as the primary end point PFS. A log-rank test was used to compare OS between treatment groups. Patients who did not experience an OS event were censored on their last assessment for vital status. OS was only considered to be formally tested if PFS in the overall population and among the subgroup of patients with brain metastases at baseline were statistically significant at the 0.05 alpha level. OS was assumed to be immature at the time of the primary analysis for PFS; however, testing of OS was still planned to occur.3 OS was considered to be statistically significant at the primary analysis for PFS only if the following conditions were met:
Both analyses for PFS in the overall population and among the subgroup of patients with brain metastases at baseline were statistically significant at the 0.05 alpha level.
The P value for OS was 0.001 or smaller.
Other Secondary End Points
The following secondary end points were not adjusted for multiplicity. These end points were analyzed using conventional log-rank statistical methods.
Progression-free survival (investigator-assessed): A stratified Cox proportional hazards regression model controlling for study stratification factors was used to estimate the HR and 95% CI for PFSINV. The comparison of 2 treatment groups was performed using a stratified log-rank test controlling for the study stratification factors with a nominal P value provided. Kaplan–Meier estimates of the median and corresponding 95% CIs were also computed for each treatment group.3
Censoring rules were the same as those specified for PFS as the primary end point.3
Objective response rate: Summaries for ORR included patients with measurable disease at baseline. The proportion of patients achieving an objective response (complete response or partial response) were calculated for each treatment group. The comparison of ORR between groups was performed using a 2-sided Cochran-Mantel-Haenszel test controlling for stratification factors. If both key secondary end points were statistically significant, then testing of ORR was conducted formally and a P value from the stratified Cochran-Mantel-Haenszel test was reported.3
Duration of response: Patients who achieved a confirmed response were included in the analysis for DOR. Estimates for medians and corresponding 95% CIs were computed using Kaplan–Meier methodology. A stratified log-rank test was used to calculate the nominal P value. Censoring for DOR occurred in the same manner as the primary end point, PFS.3
Subgroup Analysis
Subgroup analysis for the primary and key secondary end points included the following: history of brain metastases or brain metastases at baseline, geographic region, ECOG PS, age, race, and hormone receptor status. Analyses were conducted using stratified log-rank testing and stratified Cox proportional hazards regression models. For subgroups that are stratification factors, stratification occurred using the other stratification factors. Subgroup analyses for subgroups consisting of less than 10% of the number of patients in the total population were not to be performed.3
Safety
Safety data were assessed through summaries of AEs, changes in laboratory test results, changes in vital signs, changes in ECOG PS, changes in cardiac ejection fraction results, SAEs, treatment-emergent adverse events (TEAEs), AEs of special interest (i.e., any drug-induced liver injury, asymptomatic left ventricular systolic dysfunction, and/or cerebral edema), discontinuations, and deaths. AEs were classified by system organ class and preferred term using the Medical Dictionary for Regulatory Activities (MedDRA), with severity of AEs classified using the Common Terminology Criteria for Adverse Events v.4.03.7
Health-Related Quality of Life
The tucatinib-combination and placebo-combination groups index values using the EQ-5D-5L were compared using a t-test if the scores were distributed normally and using a Mann–Whitney test if the data were non-normal. HRQoL was analyzed using the ITT population.7
Results
Patient Disposition
Primary Analysis
The following data are based on the data cut-off date of September 4, 2019. Between February 23, 2016 and May 3, 2019, a total of 612 patients were randomized into the HER2CLIMB trial, including 410 patients in the tucatinib-combination group and 202 patients in the placebo-combination group (Table 12).7 Screening failures were most commonly due to patients not having HER2-positive breast cancer histologically confirmed by a central laboratory (inclusion criteria 1).
Of the patients randomized, a lower proportion in the tucatinib-combination group discontinued treatment (69.8%) compared with the placebo-combination group (84.2%). The main reason for treatment discontinuation in both treatment groups was disease progression, although fewer patients in the tucatinib-combination group experienced disease progression compared with the placebo-combination group (49.2% versus 66.3%, respectively). A greater proportion of patients in the tucatinib-combination group remained in treatment compared with the placebo-combination group (28.8% versus 13.4%, respectively), but fewer patients in the tucatinib-combination group than in the placebo-combination group remained in long-term follow-up (36.1% versus 42.1%). Discontinuations from the trial were lower in the tucatinib-combination group (35.1%) than in the placebo-combination group (44.6%); death was the main reason for trial discontinuation, accounting for 30.7% of discontinuations in the tucatinib-combination group versus 41.6% in the placebo-combination group.7
Of the randomized patients, 6 were not treated in the tucatinib-combination group and 5 were not treated in the placebo-combination group.7 The reasons for not being treated included the following:
Two patients in the tucatinib-combination group and 4 patients in the placebo-combination group did not meet all eligibility criteria at the time of randomization.
One patient in each treatment group withdrew consent after randomization.
One patient in each treatment group met eligibility criteria at the time of randomization, but were no longer considered eligible due to changes in laboratory values at cycle 1 day 1.
One patient in the tucatinib-combination group consented to enrol and was subsequently randomized, but then decided to pursue treatment at a different institution.
Patients who did not receive treatment were not included in the safety population, which included 404 patients in the tucatinib-combination group and 197 patients in the placebo-combination group; a greater proportion of patients in the tucatinib-combination group were on treatment than in the placebo-combination group (38.8% versus 13.4%, respectively).7
A summary of patient disposition for the ITT-PFS population, which was the analysis set used for the primary end point of the HER2CLIMB trial, is also provided in Table 13. In general, trends for both treatment groups reported for the ITT population were consistent with the patient disposition for the ITT-PFS population.7
Table 12: Patient Disposition for ITT Population (Data Cut-Off: September 4, 2019)
Patient disposition | HER2CLIMB | |
|---|---|---|
Tucatinib combination | Placebo combination | |
Screened, N | 819 | |
Randomized, N (%) | 410 | 202 |
Patients who received at least 1 dose of capecitabine | 401 (97.8) | 197 (97.5) |
Patients off capecitabine | 294 (71.7) | 173 (85.6) |
Patients who received at least 1 dose of trastuzumab | 403 (98.3) | 197 (97.5) |
Patients off trastuzumab | 292 (71.2) | 173 (85.6) |
Patients who received at least 1 dose of tucatinib or placebo | 404 (98.5) | 197 (97.5) |
Patients off tucatinib or placebo | 286 (69.8) | 170 (84.2) |
Discontinued from treatment, N (%) | 286 (69.8) | 170 (84.2) |
Progressive disease | 202 (49.3) | 134 (66.3) |
Clinical progression | 31 (7.6) | 17 (8.4) |
Adverse events | 23 (5.6) | 6 (3.0) |
Patient withdrawal | 19 (4.6) | 7 (3.5) |
Physician decision | 5 (1.2) | 4 (2.0) |
Death | 3 (0.7) | 0 (0) |
Lost to follow-up | 1 (0.2) | 0 (0) |
Other | 2 (0.5) | 2 (1.0) |
Patients remaining on treatment | 118 (28.8) | 27 (13.4) |
Patients in long-term follow-up | 148 (36.1) | 85 (42.1) |
Patients discontinued from study | 144 (35.1) | 90 (44.6) |
Deatha | 126 (30.7) | 84 (41.6) |
Withdrawal of consent | 16 (3.9) | 5 (2.5) |
Lost to follow-up | 2 (0.5) | 0 |
Physician decision | 0 | 1 (0.5) |
ITT, N | 410 | 202 |
ITT-PFS, N | 320 | 160 |
ITT-PFSBM, N | 198 | 93 |
Safety, N | 404 | 197 |
Patients on tucatinib or placebo | 118 (28.8) | 27 (13.4) |
Patients off tucatinib or placebo | 286 (69.8) | 170 (84.2) |
ITT = intention to treat; PFS = progression-free survival; PFS = progression-free survival among the subgroup of patients with brain metastases.
aDeath data obtained from end-of-study case report form.
Source: HER2CLIMB Clinical Study Report.7
Table 13: Patient Disposition for ITT-PFS Population (Data Cut-Off: September 4, 2019)
Disposition | HER2CLIMB | |
|---|---|---|
Tucatinib combination | Placebo combination | |
Randomized, N (%) | 320 | 160 |
Patients who received at least 1 dose of capecitabine | 314 (98.1) | 157 (98.1) |
Patients off capecitabine | 256 (80.0) | 148 (92.5) |
Patients who received at least 1 dose of trastuzumab | 316 (98.8) | 157 (98.1) |
Patients off trastuzumab | 255 (79.7) | 147 (91.9) |
Patients who received at least 1 dose of tucatinib or placebo | 317 (99.1) | 157 (98.1) |
Patients off tucatinib or placebo | 251 (78.4) | 146 (91.3) |
Discontinued from study treatment, N (%) | ||
Reason for discontinuation, N (%) | ||
Progressive disease | 182 (56.9) | 117 (36.6) |
Clinical progression | 28 (8.8) | 15 (9.4) |
Adverse events | 19 (5.9) | 5 (3.1) |
Patient withdrawal | 12 (3.8) | 4 (2.5) |
Physician decision | 5 (1.6) | 3 (1.9) |
Death | 2 (0.6) | 0 (0) |
Lost to follow-up | 1 (0.3) | 0 (0) |
Other | 2 (0.6) | 2 (1.3) |
Patients remaining on treatment | 66 (20.6) | 11 (6.9) |
Patients in long-term follow-up | 122 (38.1) | 64 (40.0) |
Patients discontinued from study | 132 (41.3) | 85 (53.1) |
Deatha | 116 (36.3) | 80 (50.0) |
Withdrawal of consent | 14 (4.4) | 4 (2.5) |
Lost to follow-up | 2 (0.6) | 0 |
Physician decision | 0 | 1 (0.6) |
Safety, N | 317 (99.1) | 157 (98.1) |
Patients on tucatinib or placebo | 66 (20.6) | 11 (6.9) |
Patients off tucatinib or placebo | 251 (78.4) | 146 (91.3) |
ITT = intention to treat; PFS = progression-free survival.
aDeath data obtained from end-of-study case report form.
Source: HER2CLIMB Clinical Study Report.7
Post-Hoc Analysis
Data from the post-hoc analysis are based on a data cut-off of February 8, 2021. The disposition of patients at the post-hoc analysis showed an increase of patients in both the tucatinib- and placebo-combination groups who were off tucatinib or placebo (90.0% and 97.0%, respectively); mainly, more patients in the tucatinib-combination group were off treatment at this longer follow-up than at the primary analysis. At this time, patients in the placebo-combination group were eligible for crossover into the tucatinib-combination group; a total of 26 patients (12.9%) crossed over to the tucatinib-combination group (Table 14).9
A total of 119 patients (29.0%) in the tucatinib-combination group and 50 patients (24.8%) in the placebo-combination group remained in long-term follow-up. Within the tucatinib- and placebo-combination groups, 256 patients (62.4%) and 142 patients (70.3%), respectively, discontinued from the study. The primary reasons for discontinuation were death (55.9% and 67.3% in the tucatinib- and placebo-combination groups, respectively), followed by withdrawal of consent (5.4% versus 2.5%), lost to follow-up (1.2% versus 0%) and physician decision (0% versus 0.5%).9 Of the patients who were off treatment, the majority continued to receive subsequent therapies (76.8% in the tucatinib-combination group versus 81.2% in the placebo-combination group).9
Table 14: Patient Disposition for ITT Population (Data Cut-Off: February 8, 2021)
Disposition | HER2CLIMB | |
|---|---|---|
Tucatinib combination N = 410, n (%) | Placebo combination N = 202, n (%) | |
Randomized, % | 410 (100) | 202 (100) |
Patients who received at least 1 dose of tucatinib or placebo | 404 (98.5) | 197 (97.5) |
Patients on tucatinib or placeboa | 35 (8.5) | 1 (0.5) |
Patients off tucatinib or placebo | 369 (90.0) | 196 (97.0) |
Patients who never received tucatinib or placebo | 6 (1.5) | 5 (2.5) |
Patients who crossed over | 0 | 26 (12.9) |
Patients on tucatinib after crossover | 0 | 9 (4.5) |
Patients off tucatinib after crossover | 0 | 17 (8.4) |
Patients in long-term follow-up | 119 (29.0) | 50 (24.8) |
Patients discontinued from study | 256 (62.4) | 142 (70.3) |
Deathb | 229 (55.9) | 136 (67.3) |
Withdrawal of consent | 22 (5.4) | 5 (2.5) |
Lost to follow-up | 5 (1.2) | 0 |
Physician decision | 0 | 1 (0.5) |
Patients off treatment who received subsequent therapies | Tucatinib combination N = 375,c n (%) | Placebo combination N = 202,c n (%) |
Total | 288 (76.8) | 164 (81.2) |
ITT = intention to treat.
aOriginal randomized treatment, not including crossover.
bDeath data obtained from end-of-study case report form.
cPatients who discontinued or never received tucatinib or placebo.
Source: Curigliano et al. (2021).9
Exposure to Study Treatments
Summaries of dose exposure and dose intensity are provided in Table 15 and Table 16 and are based on data from the primary analysis of the HER2CLIMB trial (data cut-off: September 4, 2019). In both the safety and ITT-PFS populations, patients in the tucatinib-combination group received treatment (with tucatinib, capecitabine, and trastuzumab) for longer mean periods of time compared with patients in the placebo-combination group (who received placebo, capecitabine, and trastuzumab). The cumulative dose of trastuzumab administered to patients was also greater in the tucatinib-combination group than in the placebo-combination group.7 Specifically regarding tucatinib versus placebo, the mean duration of treatment with tucatinib was 7.6 months (standard deviation [SD] = 6.3) compared with 5.6 months (SD = 4.3) for placebo.7 Additional data from a post-hoc analysis (data cut-off: February 8, 2021) showed consistent results with a greater mean length of treatment with tucatinib at 10.2 months (SD = 9.6) versus 6.1 months (SD = 5.0) with placebo.9
The absolute and relative dose intensities of tucatinib or placebo plus capecitabine were both greater in the placebo-combination group than in the tucatinib-combination group, although, the mean cumulative dose of capecitabine was greater in the tucatinib-combination group than in the placebo-combination group.7 The lower dose intensity of treatment for tucatinib or placebo plus capecitabine in the tucatinib-combination group, despite having a longer duration of treatment, may be due to a greater proportion of patients in the tucatinib-combination group reporting they had a dose held or had their dose reduced due to AEs (Table 17).
Table 15: Dose Exposure of Treatments in the HER2CLIMB Trial (Data Cut-Off: September 4, 2019)
Dose exposure of treatments in HER2CLIMB | Safety population | ITT-PFS population | ||
|---|---|---|---|---|
Tucatinib combination N = 404 | Placebo combination N = 197 | Tucatinib combination N = 317 | Placebo combination N = 157 | |
Number of patients receiving at least 1 dose of tucatinib or placebo | 404 (100) | 197 (100) | 317 (100) | 157 (100) |
Duration of tucatinib or placebo exposure (months), mean (SD) | 7.6 (6.3) | 5.6 (4.3) | 8.4 (6.9) | 5.9 (4.6) |
Number of treatment cycles initiated,a mean (SD) | 10.9 (9.0) | 7.9 (6.0) | 12.0 (9.7) | 8.4 (6.5) |
Number of patients receiving at least 1 dose of capecitabine | 401 (99.3) | 197 (100) | 314 (99.1) | 157 (100) |
Duration of capecitabine exposure (months), mean (SD) | 7.3 (6.0) | 5.4 (4.1) | 8.0 (6.5) | 5.8 (4.4) |
Number of treatment cycles initiated,a mean (SD) | 10.1 (8.3) | 7.4 (5.7) | 11.0 (9.0) | 7.8 (6.1) |
Number of patients receiving at least 1 dose of trastuzumab | 403 (99.8) | 197 (100) | 316 (99.7) | 157 (100) |
Duration of trastuzumab exposure (months), mean (SD) | 7.9 (6.4) | 5.7 (4.3) | 8.6 (6.9) | 6.1 (4.6) |
Number of treatment cycles initiated,a mean (SD) | 11.1 (9.0) | 8.1 (6.1) | 12.2 (9.8) | 8.5 (6.5) |
Total cumulative doses of trastuzumab administered (mg/kg) | ||||
Mean (SD) | 68.8 (54.5) | 50.0 (35.8) | 75.0 (59.2) | 52.8 (38.4) |
Median | 53.7 | 39.4 | 63.3 | 39.4 |
Minimum, maximum | 7.3, 308.5 | 7.6, 207.4 | 7.3, 308.5 | 7.6, 207.4 |
ITT = intention to treat; PFS = progression-free survival; SD = standard deviation.
aOne cycle is 21 days.
Source: HER2CLIMB Clinical Study Report.7
Table 16: Dose Intensity of Treatments in the HER2CLIMB Trial (Data Cut-Off: September 4, 2019)
Dose intensity of treatments in HER2CLIMB | Safety population | |
|---|---|---|
Tucatinib combination N = 404 | Placebo combination N = 197 | |
Tucatinib or placebo | ||
Absolute dose intensity (mg/day) | ||
Mean (SD) | 531.1 (81.7) | 548.4 (73.9) |
Relative dose intensity (%)a | ||
Mean (SD) | 88.5 (13.6) | 91.4 (12.3) |
Capecitabine | ||
Absolute dose intensity (mg/day) | ||
Mean (SD) | 985.5 (218.6) | 1,053.0 (240.8) |
Relative dose intensity (%)b | ||
Mean (SD) | 73.9 (16.4) | 79.0 (18.1) |
Total cumulative dose administered (mg/m2) | ||
Mean (SD) | 209,291.6 (16,6157.6) | 167,079.9 (119,569.6) |
SD = standard deviation.
aRelative dose intensity is computed as 100 × (absolute dose intensity ÷ intended dose intensity), where the intended dose intensity is 600 (mg/day)
bRelative dose intensity is computed as 100 × (absolute dose intensity ÷ intended dose intensity), where intended dose intensity is 2,000 × (14 ÷ 21) = 1,333.33 mg/m2/day.
Source: HER2CLIMB Clinical Study Report.7
Dose Modifications
Regarding tucatinib, of 84 patients (20.8%) requiring dose reductions, most were reduced to 250 mg (14.9%). Most patients in both the tucatinib- and placebo-combination groups resumed treatment at the same dose after a dose of tucatinib or placebo was held due to AEs (57.6% versus 58.3%, respectively), and most patients had only 1 dose hold (30.9% versus 28.4%, respectively) versus 2 (12.6% versus 8.1%) or more (9.9% versus 4.1%) dose holds. More patients in the tucatinib-combination group were reduced to a lower dose of tucatinib or placebo (26.2%) after a dose hold compared with patients in the placebo-combination group (17.4%). Patient doses of placebo or tucatinib were held for a mean number of 10.4 days (SD = 8.0) in the tucatinib-combination group and 13.6 days (SD = 10.6) in the placebo-combination group.7
Regarding capecitabine, most patients required only 1 dose hold (31.2% and 29.9% in the tucatinib- and placebo-combination groups, respectively), versus 2 (19.6% and 15.2%) or more (17.6% and 12.2%) dose holds. Most patients were able to resume capecitabine at the same dose (40.4% versus 35.2% in the tucatinib- and placebo-combination groups, respectively) or at a lower dose (36.3% versus 33.3%). The mean number of days for which capecitabine doses were held was 8.7 days (SD = 4.8) in the tucatinib-combination group and 8.3 days (SD = 5.4) in the placebo-combination group.7
More patients in the tucatinib-combination group (25.5%) also had a dose of trastuzumab held due to AEs than did patients in the placebo-combination group (19.3%). The proportion of patients who were permanently discontinued from treatment was similar across both treatment groups.7 The majority of patients in the tucatinib- and placebo-combination groups required 1 dose hold due to AEs (20.3% and 15.2%, respectively), and most were able to return to the same dose (83.6% and 73.5%). More patients in the placebo-combination group (20.4%) did not have any further dosing of trastuzumab after a dose hold compared with the tucatinib-combination group (11.7%). The mean duration of dose holds for trastuzumab was reported to be 11.6 days (SD = 7.5) in the tucatinib-combination group and 13.0 days (SD = 7.6) in the placebo-combination group.7
Treatment discontinuations of tucatinib or placebo, capecitabine, and trastuzumab were similarly reported in both treatment groups.7
Table 17: Dose Modifications (Data Cut-Off: September 4, 2019)
Dose modification | Safety population | |
|---|---|---|
Tucatinib combination N = 404 | Placebo combination N = 197 | |
Tucatinib or placebo, n (%) | ||
Dose held due to AE | 240 (59.4) | 87 (44.2) |
By investigator instruction | 216 (53.5) | 80 (40.6) |
By patient decision | 67 (16.6) | 18 (9.1) |
Any dose reduction due to AEa | 84 (20.8) | 21 (10.7) |
Reduced to 250 mg b.i.d. | 60 (14.9) | 19 (9.6) |
Reduced to 200 mg b.i.d. | 15 (3.7) | 1 (0.5) |
Reduced to 150 mg b.i.d. | 9 (2.2) | 1 (0.5) |
Treatment permanently discontinued due to AE | 23 (5.7) | 6 (3.0) |
Capecitabine, n (%) | ||
Dose held due to AE | 288 (71.3) | 119 (60.4) |
By investigator instruction | 276 (68.3) | 113 (57.4) |
By patient decision | 58 (14.4) | 25 (12.7) |
Any dose reduction due to AE | 243 (60.1) | 78 (39.6) |
Treatment permanently discontinued due to AE | 43 (10.6) | 18 (9.1) |
Trastuzumab | ||
Dose held due to AEa | 103 (25.5) | 38 (19.3) |
Treatment permanently discontinued due to AE | 17 (4.2) | 5 (2.5) |
AE = adverse event; b.i.d. = twice a day.
atemporary and physician-prescribed dose hold due to an AE. Dose hold includes both doses completely withheld and interruptions of infusion.
Source: HER2CLIMB Clinical Study Report.
Concomitant Medications
Concomitant medications were received by most patients in both the tucatinib- and placebo-combination groups (99.3% versus 97.5%, respectively). The most commonly administered types of concomitant medications were antipropulsives (65.6% in the tucatinib-combination group and 36.5% in the placebo-combination group), proton pump inhibitors (38.9% and 37.1%), anilides (36.1% and 36.5%), serotonin (5-hydroxytryptamine [5HT3]) antagonists (36.1% and 34.0%), other anti-emetics (32.7% and 28.4%), benzodiazepine derivatives (31.9% and 32.0%), vitamin D and analogues (26.2% and 27.4%), natural opium alkaloids (23.8% and 33.5%), propionic acid derivatives (23.3% and 24.4%), and other analgesics and antipyretics (20.3% and 20.8%). In general, except for antipropulsives and natural opium alkaloids, the proportions of patients receiving each type of concomitant medication were similar.7
Types of concomitant procedures, including surgery (13.4% and 10.7%), radiation (6.2% and 6.6%), and other (6.2% and 5.1%) were similar across the tucatinib- and placebo-combination groups, respectively.7 Concomitant systemic corticosteroids were used for a median number of 16.0 days (range, 1 to 849) in the tucatinib-combination group and 23.0 days (range, 1 to 432) in the placebo-combination group.7
Subsequent Anti-Cancer Therapies
A summary of subsequent anti-cancer therapies is provided in Table 18. A total of 292 patients in the tucatinib-combination group and 175 patients in the placebo-combination group discontinued or never received tucatinib or placebo. In the ITT population, subsequent anti-cancer therapies were administered to 202 patients (69.2%) in the tucatinib-combination group and 139 patients (79.4%) in the placebo-combination group. In general, a greater proportion of patients in the placebo-combination group received subsequent anti-cancer therapies than in the tucatinib-combination group, including antibody (57.1% versus 50.0%, respectively) and TKI (24.0% versus 16.8%) anti-HER2 regimens, and trastuzumab (12.2% versus 5.4%). Of note, trastuzumab plus chemotherapy was more commonly reported among patients in the tucatinib-combination group (20.8%) than in the placebo-combination group (15.8%). Other types of subsequent therapies were reported in similar proportions across both treatment groups.7
Table 18: Subsequent Anti-Cancer Therapies (ITT Population) (Data Cut-Off: September 4, 2019)
Subsequent anti-cancer therapies (ITT population) | HER2CLIMB | |
|---|---|---|
Tucatinib combination N = 410, n (%) | Placebo combination N = 202, n (%) | |
Patients who discontinued or never received tucatinib or placebo | 292 | 175 |
Patients receiving ≥ 1 subsequent anti-cancer systemic therapya | 202 (69.2) | 139 (79.4) |
Patients receiving ≥ 1 subsequent anti-HER2 regimena | 164 (56.2) | 119 (68.0) |
Antibody | 146 (50.0) | 100 (57.1) |
Trastuzumab | 141 (48.3) | 97 (55.4) |
Pertuzumab | 11 (3.8) | 10 (5.7) |
Margetuximab | 5 (1.7) | 4 (2.3) |
ZW25 | 2 (0.7) | 2 (1.1) |
MCLA-128 | 0 | 1 (0.6) |
Tyrosine kinase inhibitor | 49 (16.8) | 42 (24.0) |
Lapatinib | 37 (12.7) | 32 (18.3) |
Neratinib | 11 (3.8) | 11 (6.3) |
Poziotinib | 1 (0.3) | 0 |
Pyrotinib | 1 (0.3) | 0 |
Antibody drug conjugate | 11 (3.8) | 15 (8.6) |
T-DM1 | 5 (1.7) | 5 (2.9) |
DS-8201A | 4 (1.4) | 6 (3.4) |
SYD985 | 3 (1.0) | 3 (1.7) |
DHES0815A | 0 | 2 (1.1) |
Patients receiving ≥ 1 subsequent hormonal or CDK inhibitor therapiesa | 30 (10.3) | 17 (9.7) |
Patients receiving ≥ 1 subsequent PD-1/PD-L1 inhibitor therapiesa | 10 (3.4) | 3 (1.7) |
Subsequent systemic anti-cancer treatments ever received, regimen nameb,c | ||
Capecitabine and lapatinib | 9 (4.5) | 8 (5.8) |
Capecitabine and trastuzumab | 7 (3.5) | 12 (8.6) |
Eribulin | 19 (9.4) | 7 (5.0) |
Eribulin and trastuzumab | 28 (13.9) | 13 (9.4) |
Gemcitabine and trastuzumab | 10 (5.0) | 8 (5.8) |
Lapatinib and trastuzumab | 12 (5.9) | 13 (9.4) |
Trastuzumab | 11 (5.4) | 17 (12.2) |
Trastuzumab and vinorelbine | 42 (20.8) | 22 (15.8) |
CDK = cyclin-dependent kinase; HER2 = human epidermal growth factor receptor 2; ITT = intention to treat; PD-1 = programmed cell death protein 1; PD-L1 = programmed death-ligand 1; T-DM1 = trastuzumab emtansine.
aPercentage of patients under this category who discontinued or never received tucatinib or placebo as denominator.
bPercentage of patients under this category use the patients who received 1 or more subsequent new anti-cancer systemic therapies as denominator.
cTreatment regimens reported under this category with a frequency of > 5% in any treatment group.
Source: HER2CLIMB Clinical Study Report.7
Efficacy
Only those efficacy outcomes and analyses of subgroups identified in the review protocol are reported subsequently. See Appendix 3 for detailed efficacy data. A summary of efficacy end points is provided in Table 19 and is based on a data cut-off date of September 4, 2019. The HER2CLIMB trial met its primary and key secondary end points showing statistically significant improvement in patients treated with the tucatinib combination versus the placebo combination. As both OS and PFSBM were statistically significant at the time of this primary analysis, the results were considered to be from a final analysis; therefore, no formal testing for these end points was conducted at later time points (see Statistical Analysis section). ORR was considered to be another secondary end point that also supported the results of the primary and key secondary analyses showing improved efficacy with the tucatinib-combination versus the placebo-combination treatment. A detailed summary of efficacy outcomes is provided subsequently.
A post-hoc analysis, which was conducted by the sponsor approximately 2 years after the last patient of the HER2CLIMB trial was randomized, provided an additional 15.6 months of follow-up. The post-hoc analysis provided updated data for OS and PFS, assessed among all randomized patients, which continued to support trastuzumab-combination over placebo-combination therapy (Table 20).
The assessments conducted at the post-hoc analysis were not formally tested; therefore, they should be considered descriptive.
Table 19: Summary of Key Efficacy Results in the HER2CLIMB Trial (Data Cut-Off: September 4, 2019)
Efficacy result | Population | |
|---|---|---|
ITT-PFS population | Tucatinib combination N = 320 | Placebo combination N = 160 |
PFS | ||
Events, n (%)a | 178 (55.6) | 97 (60.6) |
Median (months), (95% CI)b | 7.8 (7.5 to 9.6) | 5.6 (4.2 to 7.1) |
Stratified HR (95% CI)c,d | 0.544 (0.420 to 0.705) | |
Stratified log-rank P valued,e | < 0.00001 | |
ITT-PFSBM population | Tucatinib combination N = 198 | Placebo combination N = 93 |
PFSBM | ||
Events, n (%)a | 106 (53.5) | 51 (54.8) |
Median (months), (95% CI)b | 7.6 (6.2 to 9.5) | 5.4 (4.1 to 5.7) |
Stratified HR (95% CI)c,d | 0.483 (0.339 to 0.689) | |
Stratified log-rank P valued,e,f | < 0.00001 | |
ITT population | Tucatinib combination N = 410 | Placebo combination N = 202 |
OS | ||
Events, n (%) | 130 (31.7) | 85 (42.1) |
Median, months (95% CI)b | 21.9 (18.3 to 31.0) | 17.4 (13.6 to 19.9) |
Stratified HR (95% CI)c,d | 0.662 (0.501 to 0.875) | |
Stratified log-rank P valued,e,g | 0.00480 | |
ORR | ||
Patients with measurable disease, nh | 340 | 171 |
ORR, n (%) | 138 (40.6) | 39 (22.8) |
95% CIi | 35.3 to 46.0 | 16.7 to 29.8 |
Stratified Cochrane-Mantel-Haenszel (2-sided) P valuej | 0.00008 | |
BOR, n (%)k | ||
Complete response | 3 (0.9) | 2 (1.2) |
Partial response | 135 (39.7) | 37 (21.6) |
Stable disease | 155 (45.6) | 100 (58.5) |
Progressive disease | 27 (7.9) | 24 (14.0) |
Not evaluable | 0 | 1 (0.6) |
Not availablel | 20 (5.9) | 7 (4.1) |
BOR = best objective response; CI = confidence interval; ECOG = Eastern Cooperative Oncology Group; HR = hazard ratio; ITT = intention to treat; ORR = objective response rate; OS = overall survival; PFS = progression-free survival; PFSBM = progression-free survival among the subgroup of patients with brain metastases.
aDeath without either prior progression or more than 2 missed assessment visits.
bCalculated using the complementary log-log transformation method (Collett, 1994).
cHR comparing tucatinib-combination group with placebo-combination group calculated from the Cox proportional hazards model. An HR of < 1.0 favours the tucatinib-combination group.
dComputed using stratification factors (presence or history of brain metastases [yes/no] ECOG performance status [0/1], and region of world [North America vs. the rest of the world]) at randomization.
eTwo-sided P value based on re-randomization procedure (Rosenberger and Lachin, 2002).
fStatistically significant after adjustment for multiplicity. The threshold for statistical significance was 0.0080.
gStatistically significant after adjustment for multiplicity. The threshold for statistical significance is 0.0074.
hAll calculations made using this as the denominator.
ITwo-sided 95% exact CI computed using the Clopper-Pearson method (1934).
jCochran-Mantel-Haenszel test controlling for stratification factors (presence or history of brain metastases, yes/no).
kConfirmed best overall response assessed per RECIST 1.1.
lPatients with no post-baseline response assessments.
Source: HER2CLIMB Clinical Study Report.
Table 20: Summary of Post-Hoc Analysis in the HER2CLIMB Trial (Data Cut-Off: February 8, 2021)
PFS and OS analyses | ITT population | |
|---|---|---|
Tucatinib combination N = 410 | Placebo combination N = 202 | |
PFS | ||
Events, n (%) | 319 | 163 |
Median (months), (95% CI) | 7.6 (6.9 to 8.3) | 4.9 (4.1 to 5.6) |
Stratified HR (95% CI) | 0.57 (0.47 to 0.70) | |
Stratified log-rank P value | 0.004a | |
OS | ||
Events, n (%) | 233 | 137 |
Median, months (95% CI) | 24.7 (21.6 to 28.9) | 19.2 (16.4 to 21.4) |
Stratified HR (95% CI) | 0.73 (0.59 to 0.90) | |
Stratified log-rank P value | 0.004a | |
CI = confidence interval; HR = hazard ratio; ITT = intention to treat; PFS = progression-free survival; OS = overall survival.
aP values have not been adjusted for multiple testing and should be interpreted as nominal.
Source: Curigliano et al. (2021).9
Progression-Free Survival
At the time of the primary analysis (data cut-off: September 4, 2019), the median duration of follow-up for PFS was 10.4 months for the total ITT-PFS population, per BICR. There were 178 events (55.65%) in the tucatinib-combination group and 97 events (60.6%) in the placebo-combination group. The median PFS was 7.8 months (95% CI, 7.5 to 9.6) in the tucatinib-combination group compared with 5.6 in the placebo-combination group, resulting in a 46% reduction in the risk of disease progression or death (stratified HR = 0.54; 95% CI, 0.42 to 0.71; stratified log-rank P value < 0.00001) (Figure 4).7 The results of the sensitivity analyses of PFSINV were consistent with the primary analysis (stratified HR = 0.56; 95% CI, 0.45 to 0.70; stratified log-rank P value < 0.00001).
At the updated analysis (data cut-off: February 8, 2021), the median follow-up for PFS was 28.1 months in the tucatinib-combination group and 20.1 months in the placebo-combination group. The post-hoc analysis of PFSINV continued to show improved PFS in the tucatinib-combination group, with a longer median PFS of 7.6 months (95% CI, 6.9 to 8.3) versus the placebo-combination group, which showed a median PFS of 4.9 months (95% CI, 4.1 to 5.6) (HR = 0.57; 95% CI, 0.47 to 0.70; nominal P value of < 0.00001) (Figure 5).9
Figure 4: PFS per BICR by Treatment Group (ITT-PFS)
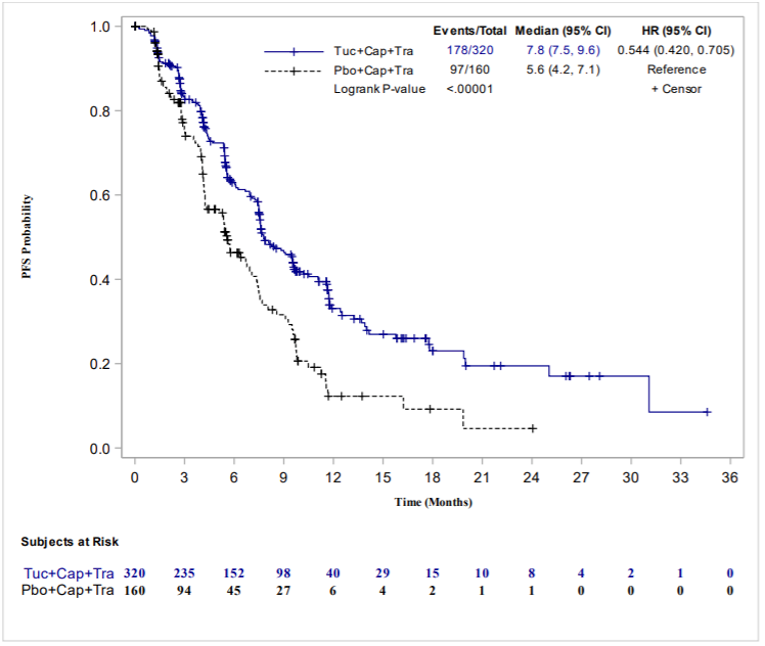
BICR = blinded independent central review; cap = capecitabine; CI = confidence interval; PFS = progression-free survival; ECOG PS = Eastern Cooperative Oncology Group performance status; HR = hazard ratio; ITT = intention to treat; pbo = placebo; tra = trastuzumab; tuc = tucatinib.
HR is computed from the Cox proportional hazards model using stratification factors (presence or history of brain metastases [yes/no], ECOG PS [0/1], and region of world [North America versus the rest of the world]) at randomization.
Two-sided P value based on stratified log-rank test and re-randomization procedure (Rosenberger and Lachin, 2002).
Source: HER2CLIMB Clinical Study Report.7
Figure 5: PFS per Investigator by Treatment Group (ITT Population)
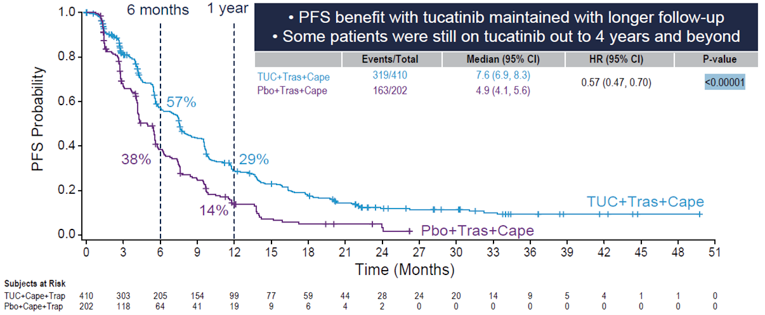
Cape = capecitabine; CI = confidence interval; HR = hazard ratio; ITT = intention to treat; PFS = progression-free survival; Pbo = placebo; Tras = trastuzumab; TUC = tucatinib.
Subgroup Analysis for PFS
A summary of subgroup analyses of the primary analysis is depicted in Figure 6. Subgroup analyses supported the primary analyses for PFS and favoured treatment with the tucatinib combination in all subgroups except for patients aged 65 years and older.7 Subgroup analyses were not adjusted for multiplicity and should be interpreted with caution.
Figure 6: Subgroup Analyses for PFS per BICR (Primary End Point, ITT-PFS Population) (Data Cut-Off: September 4, 2019)
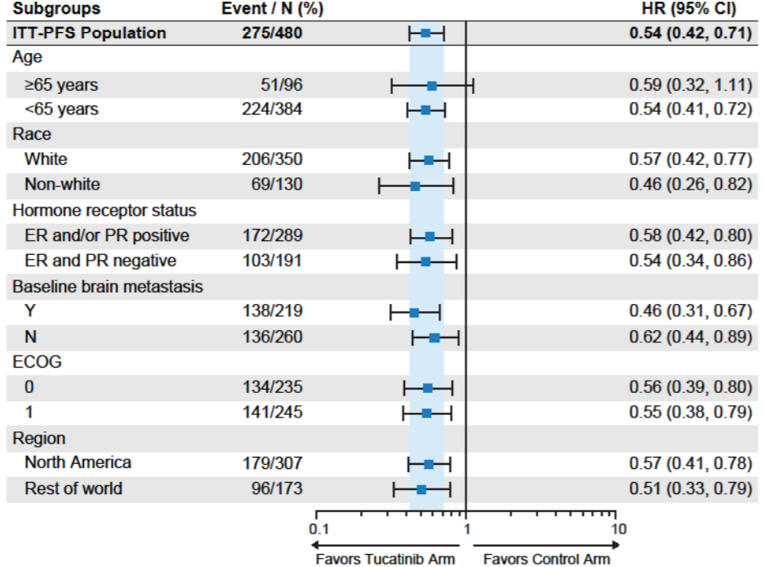
BICR = blinded independent central review; CI = confidence interval; ECOG = Eastern Cooperative Oncology Group; EDC = electronic data capture; ER = estrogen receptor; HR = hazard ratio; N = no; PFS = progression-free survival; PR = progesterone receptor; Y = yes.
HR was calculated from Cox regression model considering stratified factors from randomization.
“Race Non-White” included patients with race other than White.
“Hormone receptor status: ER and PR negative” included patients without positive estrogen or positive progesterone receptors.
“Baseline brain metastasis: Y” included patients with a history of brain metastases or presence of brain metastases or brain lesions of equivocal significance on screening MRI per EDC data.
Source: HER2CLIMB Clinical Study Report.7
Censoring occurred for 142 patients (44.4%) in the tucatinib-combination group and 63 patients (39.4%) in the placebo-combination group (Table 21). Fewer patients in the tucatinib-combination group were censored due to progression events than in the placebo-combination group, but more patients were censored due to starting a new anti-cancer therapy in the placebo-combination group versus the tucatinib-combination group.
Table 21: Censoring for PFS per BICR (Primary End Point) (Data Cut-Off: September 4, 2019)
Censoring for PFS per BICR | Tucatinib combination N = 320 | Placebo combination N = 160 |
|---|---|---|
Censored patients | 142 (44.4) | 63 (39.4) |
Reasons for censoringa | ||
No progression events, still on study | 54 (38.0) | 9 (14.3) |
New anti-cancer treatment (systemic or radiation) started before PD or death observed | 75 (52.8) | 47 (74.6) |
PD or death occurred after 2 or more consecutive missing scheduled response assessments | 6 (4.2) | 5 (7.9) |
Off study without events | 7 (4.9) | 2 (3.2) |
BICR = blinded independent central review; PFS = progression-free survival; PD = progressive disease.
aDenominator is the number of censored patients.
Source: HER2CLIMB Clinical Study Report.7
Progression-Free Survival Among Patients With Brain Metastases (per BICR)
At the time of the data cut-off, there were 106 events (53.5%) in the tucatinib-combination group and 51 events (54.8%) in the placebo-combination group, accounting for 71% of planned PFS events in the ITT-PFSBM population. As previously stated in the Statistical Analysis section of this report, a 2-sided alpha level of 0.0080 (under the total alpha of 0.03) was used for the analysis of PFSBM.7
The median PFSBM was 7.6 months (95% CI, 6.2 to 9.5) in the tucatinib-combination group compared with 5.4 months (95% CI, 4.1 to 5.7) in the placebo-combination group, resulting in a 52% reduction in the risk of disease progression or death (stratified HR = 0.48; 95% CI, 0.34 to 0.69, stratified log-rank P value < 0.00001) (Figure 7).7
Figure 7: PFSBM per BICR in Patients with Brain Metastases by Treatment Arm (ITT-PFSBM) (Data Cut-Off: September 4, 2019)
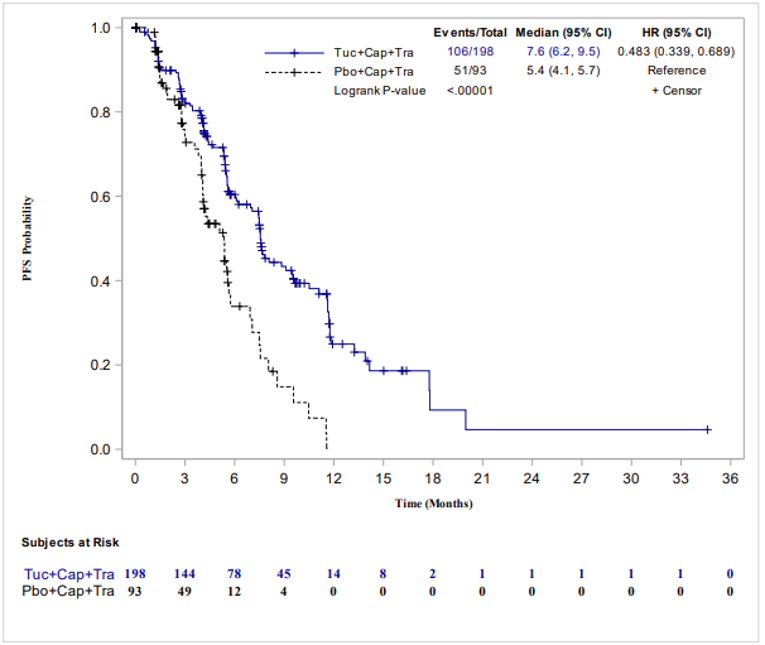
BICR = blinded independent central review; Cap = capecitabine; CI = confidence interval; ECOG PS = Eastern Cooperative Oncology Group performance status; HR = hazard ratio; ITT = intention to treat; PFS = progression-free survival; PFSBM = progression-free survival among the subgroup of patients with brain metastases; Pbo = placebo; Tra = trastuzumab; Tuc = tucatinib.
Note: Statistically significant after adjustment for multiplicity. The threshold for statistical significance was 0.0080.
The brain metastases population was defined as a subset of patients with a history of brain metastases or presence of brain metastases or brain lesions of equivocal significance on screening MRI.
HR was computed from the Cox proportional hazards model using stratification factors (ECOG PS [0/1], and region of world [North America versus the rest of the world]) at randomization.
Two-sided P value based on stratified log-rank test and re-randomization procedure (Rosenberger and Lachin, 2002).
Source: HER2CLIMB Clinical Study Report.7
Subgroup Analysis for PFSBM
Subgroup analyses for PFSBM are illustrated in Figure 8. The subgroup analyses were consistent with the primary analyses for PFSBM and favoured treatment with the tucatinib-combination in all subgroups except for patients aged 65 years and older, patients with an ECOG PS of 0, and patients who were from the rest of the world.7 The subgroup analyses were not adjusted for multiplicity.
Figure 8: Subgroup Analyses for PFSBrainMets (Data Cut-Off: September 4, 2019)
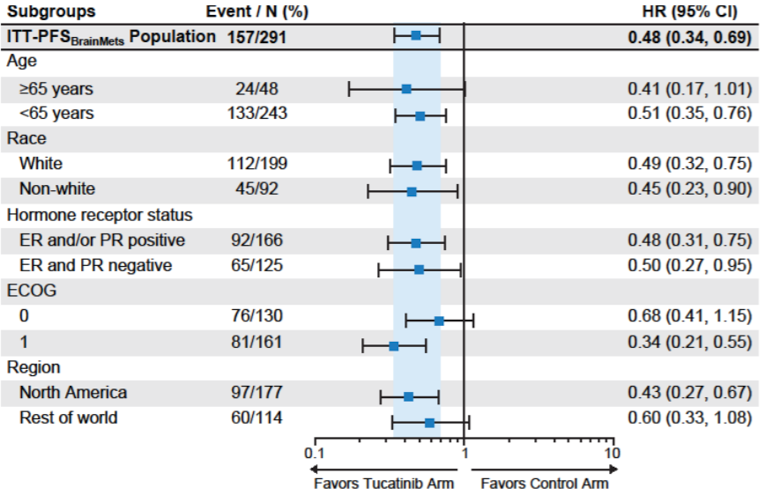
CI = confidence interval; ECOG = Eastern Cooperative Oncology Group; ER = estrogen receptor; HR = hazard ratio; ITT = intention to treat; PFSBrainMets = progression-free survival among the subgroup of patients with brain metastases; PR = progesterone receptor.
HR is calculated from Cox regression model considering stratification factors from randomization.
“Race Non-White” includes patients with race other than White. “Hormone receptor status: ER and PR negative” includes patients without positive estrogen or positive progesterone receptors.
Source: HER2CLIMB Clinical Study Report.7
Overall Survival
At the time of this pre-specified analysis, the median duration of follow-up for the ITT population for OS was 14 months. A total of 130 patients (31.7%) in the tucatinib-combination group experienced an OS event compared with 85 patients (42.1%) in the placebo-combination group; 60% of all planned OS events had occurred by the time of this analysis. The median OS was 21.9 months (95% CI, 18.3 to 31.0) in the tucatinib-combination group compared with 17.4 months (95% CI, 13.6 to 19.9) in the placebo-controlled group. A statistically significant improvement in OS was observed among patients in the tucatinib-combination group, with a 34% reduction in risk of death compared with the placebo-combination group (HR = 0.66; 95% CI, 0.50 to 0.88; stratified log-rank P value 0.00480) (Figure 9).
At the updated analysis (data cut-off: February 8, 2021), the median follow-up for OS was 29.7 months in the tucatinib-combination group and 29.4 months in the placebo-combination group. The results of the post-hoc analysis of OS were consistent with the primary analysis and continued to show improved OS in the tucatinib-combination group, with a longer median OS of 24.7 months (95% CI, 21.6 to 28.9) versus the placebo-combination group, which showed a median OS of 19.2 months (95% CI, 16.4 to 21.4) (HR = 0.73; 95% CI, 0.59 to 0.90; nominal P value: < 0.004) (Figure 10).9
Figure 9: OS by Treatment Group (ITT Population) (Data Cut-Off: September 4, 2019)
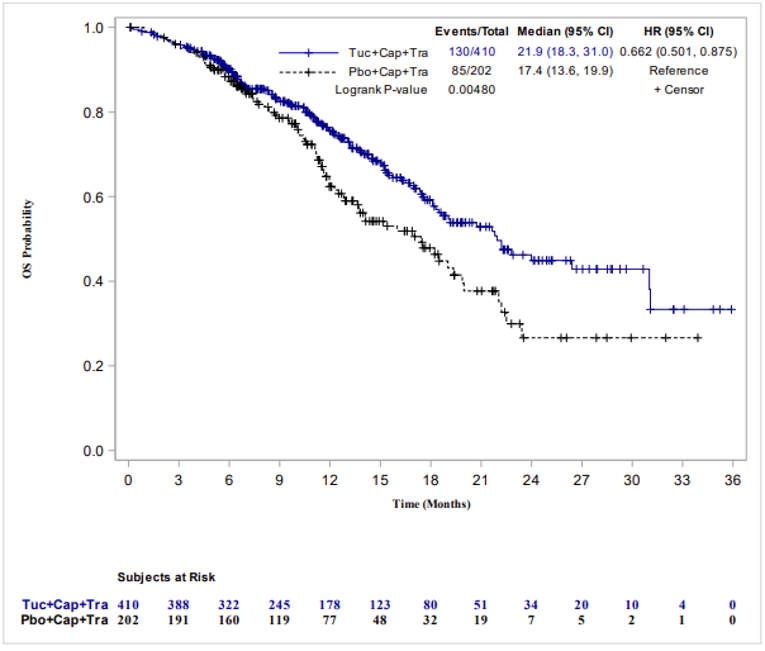
Cap = capecitabine; CI = confidence interval; ECOG PS = Eastern Cooperative Oncology Group performance status; HR = hazard ratio; ITT = intention to treat; OS = overall survival; Pbo = placebo; Tra = trastuzumab; Tuc = tucatinib.
Statistically significant after adjustment for multiplicity. The threshold for statistical significance was 0.0074.
HR was computed from the Cox proportional hazards model using stratification factors (presence or history of brain metastases [yes/no], ECOG PS [0/1], and region of world [North America versus the rest of the world]) at randomization.
Two-sided P value based on stratified log-rank test and re-randomization procedure (Rosenberger and Lachin, 2002).
Source: HER2CLIMB Clinical Study Report.7
Figure 10: OS by Treatment Group (ITT Population) (Data Cut-Off: February 8, 2021)
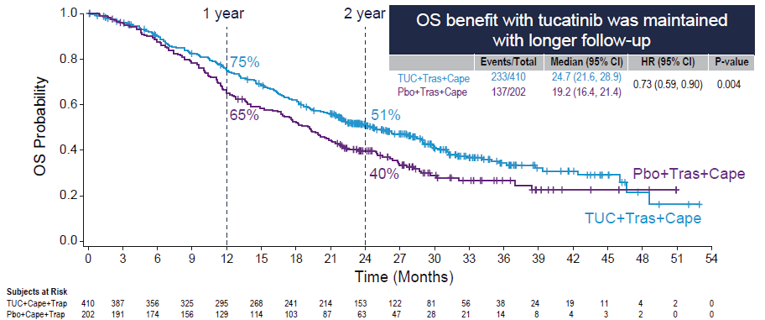
Cape = capecitabine; CI = confidence interval; HR = hazard ratio; ITT = intention to treat; OS = overall survival; Pbo = placebo; Tras = trastuzumab; TUC = tucatinib.
Source: Curigliano et al. (2021).9
Subgroup Analysis for OS
A summary of subgroup analyses conducted at the time of the primary analysis for OS is depicted in Figure 11. Results for subgroup analyses favoured treatment with the tucatinib-combination over the placebo-combination in all groups, consistent with the overall results for OS, except for patients: aged 65 years and older, with positive hormone receptor status, without brain metastases, with an ECOG PS of 1, or who were from the rest of the world.7 Subgroup analyses were not adjusted for multiplicity and should be interpreted with caution.
Subgroup analyses for OS were also conducted at the post-hoc analysis and continued to show benefit for patients treated with tucatinib-combination therapy over the placebo-combination therapy. The results of the post-hoc subgroup analyses for OS were consistent with results of the primary analysis; tucatinib-combination therapy was favoured for all subgroups except for patients: aged 65 years and older, with positive hormone receptor status, without brain metastases, with an ECOG PS of 1, or who were from North America.9 Subgroup analyses were not adjusted for multiplicity.
Figure 11: Subgroup Analyses for OS (Data Cut-Off: September 4, 2019)
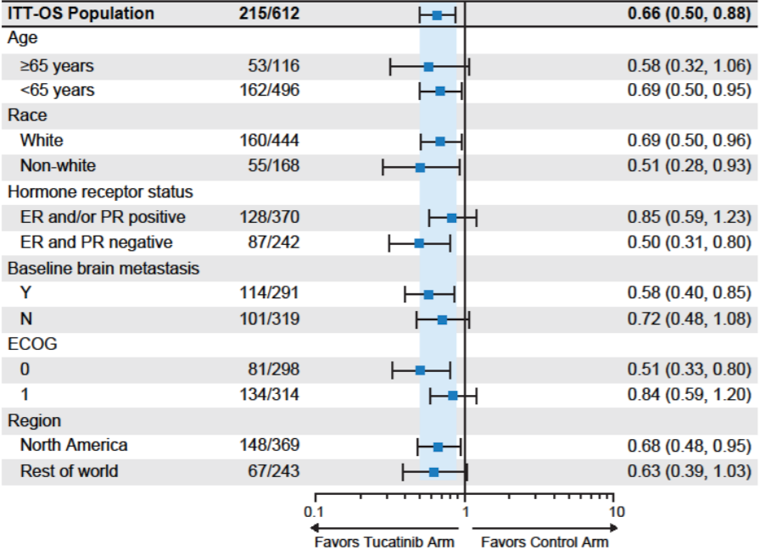
BICR = blinded independent central review; CI = confidence interval; ECOG PS = Eastern Cooperative Oncology Group; EDC = electronic data capture; ER = estrogen receptor; ITT = intention to treat; N = no; OS = overall survival; PR = progesterone receptor; Y = yes.
Note: Hazard ratio was calculated from a Cox regression model considering stratified factors from randomization.
“Race Non-White” included patients with race other than White.
“Hormone receptor status: ER and PR negative” included patients without positive estrogen or positive progesterone receptors.
“Baseline brain metastasis: Y” included patients with a history of brain metastases or presence of brain metastases or brain lesions of equivocal significance on screening MRI per EDC data.
Source: HER2CLIMB Clinical Study Report.7
Figure 12: Subgroup Analyses for OS (Data Cut-Off: February 8, 2021)
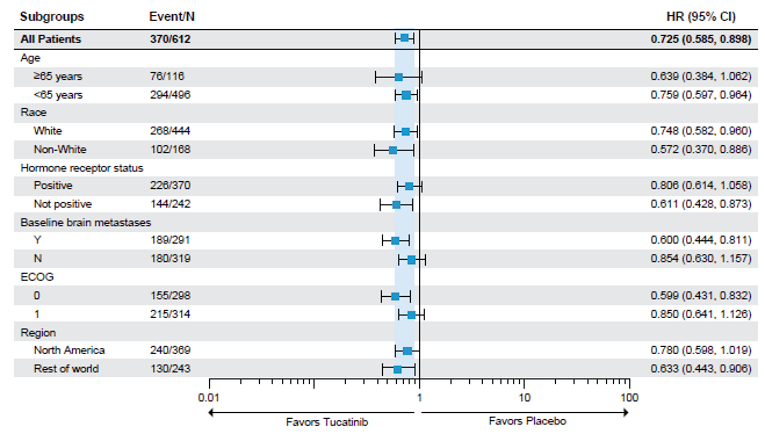
CI = confidence interval; ECOG PS = Eastern Cooperative Oncology Group; HR = hazard ratio; N = no; OS = overall survival; Y = yes.
Source: Curigliano et al. (2021).9
Objective Response Rate (per BICR)
At the primary analysis, based on assessment by BICR, more patients in the tucatinib-combination group than in the placebo-combination group had a complete response (0.9% versus 1.2%, respectively) or partial response (39.7% versus 21.6%). A greater proportion of patients in the placebo-combination group (14.0%) had a reported response progressive disease than patients in the tucatinib-combination group (7.9%). A greater proportion of patients in the tucatinib-combination group had a confirmed response (40.6%; 95% CI, 35.3 to 46.0) versus the placebo-combination group (22.8%; 95% CI, 16.7 to 29.8). Patients treated with the tucatinib-combination therapy showed statistically significantly improved ORR compared with the control group (P < 0.00008, stratified Cochrane-Mantel-Haenszel test).7
Other Secondary End Points
The following end points were included as other secondary end points: PFSINV, ORR per investigator, DOR. These end points were not adjusted for multiple testing and are at risk for type I error. The results of these end points were supportive of the primary and key secondary end points, which favoured treatment with tucatinib-combination therapy compared with the placebo-combination.7 These results are summarized in Appendix 3.
Health-Related Quality of Life (EQ-5D-5L)
Assessment of HRQoL was conducted in the ITT population using the EQ-5D-5L, which was incorporated into the HER2CLIMB trial after a protocol amendment on August 30, 2017. Therefore, only patients who consented to version 7 of the trial protocol could be included in the analysis for HRQoL, which included 217 patients in the tucatinib-combination group and 113 patients in the placebo-combination group.7 There were no differences between the 2 treatment groups in the 5 domains of the descriptive system of the EQ-5D (anxiety/depression, mobility, pain/discomfort, self-care, and usual activities) (Figure 29, Figure 30, Figure 31, Figure 32, and Figure 33 in Appendix 3).7
Further, there were no differences in the mean EuroQol Visual Analogue Scale (EQ VAS) scores between treatment groups; the results of the EQ-5D-5L assessment suggested maintenance of HRQoL in both the tucatinib- and placebo-control groups (Figure 13).7,25 A meaningful time to deterioration, based on the EQ VAS, was defined as a decrease of 7 or more points. There was a 19% reduction in the risk of meaningful deterioration of HRQoL based on the EQ VAS in the tucatinib-combination group compared with the placebo-combination group, although the difference in risk of meaningful deterioration between the 2 treatment groups was not considered meaningful (HR = 0.81; 95% CI, 0.55 to 1.18). The median time to deterioration was not reached in the tucatinib-combination group (95% CI, 7.6 to not estimable), while the median time to deterioration in the placebo-combination group was 5.8 months (95% CI, 4.3 to not estimable).26
Similar results were reported for patients with brain metastases, which indicated no difference between the tucatinib- and placebo-combination groups.26
Figure 13: EQ-5D-5L of Health Score (Data Cut-Off: September 4, 2019)
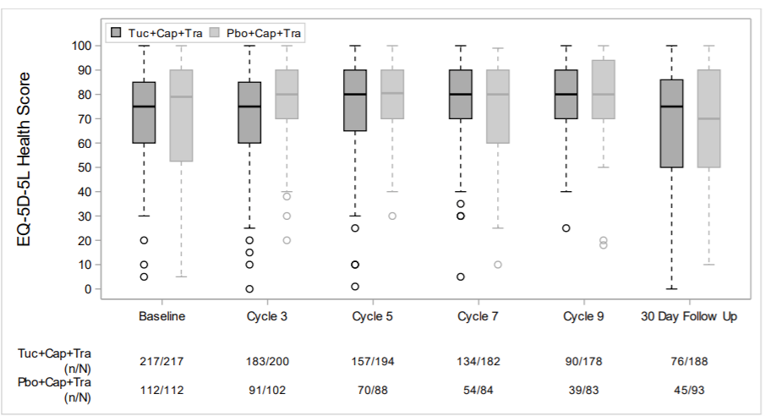
Cap = capecitabine; EQ-5D-5L = EuroQol 5-Dimensions 5-Levels questionnaire; Pbo = placebo; Tra = trastuzumab; Tuc = tucatinib.
Baseline was defined as most recent non-missing assessment on or before first dose date.
n/N: n is the number of patients who completed the survey. N is the number of patients who completed baseline survey and are still on study. Cycles where the number of patients in each arm remained ≥ 20% of initial cohort size are presented.
The length of the box represents the interquartile range (the distance between the 25th and 75th percentiles). The horizontal line in the box interior represents the group median. The whiskers extend to the group minimum and maximum values.
Source: HER2CLIMB Clinical Study Report.7
Harms
Only those harms identified in the review protocol are reported subsequently. Harms data are reported based mainly on the primary analysis (data cut-off: September 4, 2019). Additional data were provided by the sponsor based on a post-hoc analysis (data cut-off: February 8, 2021); however, longer-term data were generally consistent with the harms data of the primary analysis and are not included in this report.
Adverse Events
A summary of AEs from any cause is reported in Table 22. Most patients in both treatment groups reported an AE of any grade. In general, AEs were more commonly reported among patients in the tucatinib-combination group. The most common AEs of any grade in both the tucatinib-combination group and the placebo-combination group were diarrhea (80.9% versus 53.3%), hand-foot syndrome (63.4% versus 52.8%), nausea (58.4% versus 43.7%), fatigue (45.0% versus 25.4%), and vomiting (35.9% versus 25.4%); however, the proportion of patients experiencing these AEs was greater in the tucatinib-combination group.7
Table 23 summarizes AEs that were grade 3 or greater. In general, AEs that were grade 3 or greater were more commonly reported in the tucatinib-combination group. A total of 223 patients (55.2%) in the tucatinib-combination group experienced a grade 3 or greater AE compared with 96 patients (48.7%) in the placebo-combination group. In both the tucatinib-combination group and placebo-combination group, the most commonly reported AEs that were grade 3 or greater were hand-foot syndrome (13.1% versus 9.1%) and diarrhea (12.9% versus 8.6%).7
A time-at-risk exposure-adjusted analysis of grade 3 or greater AEs of hand-foot syndrome, diarrhea, and increased ALT and AST was performed to adjust for the longer exposure to treatment that patients in the tucatinib-combination group experienced, as these patients had a longer duration of treatment than patients in the placebo-combination group.7 The incidence of each grade 3 or greater AE was lessened after adjusting for exposure, resulting in the following:
Crude incidence of grade 3 or greater hand-foot syndrome was 13.1% in the tucatinib-combination group and 9.1% in the placebo-combination group, with a time-at-risk exposure-adjusted incidence of 21 versus 19 per 100 person-years.
Crude incidence of grade 3 or greater diarrhea was 12.9% in the tucatinib-combination group and 8.6% in the placebo-combination group, with a time-at-risk exposure-adjusted incidence of 21 versus 17 per 100 person-years.
Crude incidence of grade 3 or greater ALT increase was 5.4% in the tucatinib-combination group and 0.5% in the placebo-combination group, with a time-at-risk exposure-adjusted incidence of 8 versus 1 per 100 person-years.
Crude incidence of grade 3 or greater AST increase was 4.5% in the tucatinib-combination group and 0.5% in the placebo-combination group, with a time-at-risk exposure-adjusted incidence of 7 versus 1 per 100 person-years.
Table 22: Summary of Any-Cause Adverse Events of Any Grade (Safety Population)
AEs | Tucatinib combination N = 404 | Placebo combination N = 197 |
|---|---|---|
Patients with ≥ 1 adverse event,a n (%) | 401 (99.3) | 191 (97.0) |
Most common events,a n (%) | ||
Diarrhea | 327 (80.9) | 105 (53.3) |
Hand-foot syndrome | 256 (63.4) | 104 (52.8) |
Nausea | 236 (58.4) | 86 (43.7) |
Fatigue | 182 (45.0) | 85 (43.1) |
Vomiting | 145 (35.9) | 50 (25.4) |
Stomatitis | 103 (25.5) | 28 (14.2) |
Decreased appetite | 100 (24.8) | 39 (19.8) |
Headache | 87 (21.5) | 40 (20.3) |
Aspartate aminotransferase increased | 86 (21.3) | 22 (11.2) |
Alanine aminotransferase increased | 81 (20.0) | 13 (6.6) |
AE = adverse event.
aFrequency ≥ 20% in any treatment group.
Source: HER2CLIMB Clinical Study Report.7
Table 23: Summary of Grade 3 or Greater AEs
AEs (grade 3 or greater) | Tucatinib combination N = 404 | Placebo combination N = 197 |
|---|---|---|
Patients with ≥ 1 adverse event,a n (%) | 223 (55.2) | 96 (48.7) |
Most common events,a n (%) | ||
Hand-foot syndrome | 53 (13.1) | 18 (9.1) |
Diarrhea | 52 (12.9) | 17 (8.6) |
Alanine aminotransferase increased | 22 (5.4) | 1 (0.5) |
Fatigue | 19 (4.7) | 8 (4.1) |
Aspartate aminotransferase increased | 18 (4.5) | 1 (0.5) |
Anemia | 15 (3.7) | 5 (2.5) |
Nausea | 15 (3.7) | 6 (3.0) |
Hypokalemia | 13 (3.2) | 10 (5.1) |
Pulmonary embolism | 13 (3.2) | 4 (2.0) |
Vomiting | 12 (3.0) | 7 (3.6) |
Hypophosphatemia | 11 (2.7) | 4 (2.0) |
Stomatitis | 10 (2.5) | 1 (0.5) |
Neutropenia | 9 (2.2) | 9 (4.6) |
AE = adverse event.
aFrequency ≥ 2% in any treatment group.
Source: HER2CLIMB Clinical Study Report.7
Serious Adverse Events
SAEs of any grade were reported in similar proportions of patients in the tucatinib- and placebo-combination groups (25.7% and 26.9%, respectively). SAEs that were treatment-related were reported among 10.9% of patients in the tucatinib-combination group versus 6.6% of patients in the placebo-combination group. Serious TEAEs related specifically to tucatinib or placebo, capecitabine, or trastuzumab also occurred in similar proportions across both treatment groups (Table 24). Of the treatments in each regimen, trastuzumab-related serious TEAEs were reported the least compared with tucatinib, placebo, and capecitabine.7
Table 24: Summary of SAEs (Safety Population)
SAEs | Tucatinib combination N = 404 | Placebo combination N = 197 |
|---|---|---|
Any grade | Any grade | |
Any SAEa | 104 (25.7) | 53 (26.9) |
Diarrhea | 16 (4.0) | 7 (3.6) |
Vomiting | 10 (2.5) | 5 (2.5) |
Nausea | 8 (2.0) | 3 (1.5) |
Dyspnea | 5 (1.2) | 6 (3.0) |
Pleural effusion | 3 (0.7) | 6 (3.0) |
SAE = serious adverse event.
Mortality
Grade 5 AEs were reported in 8 patients (2.0%) in the tucatinib-combination group and 6 patients (3.0%) in the placebo-combination group. In the tucatinib-combination group, grade 5 AEs included sudden death due to unknown cause (n = 2), cardiac failure, sepsis, multiple organ failure, dehydration, cardiac arrest, and septic shock (n = 1 each). In the placebo-combination group, grade 5 AEs included respiratory failure, cardiac arrest, systemic inflammatory response syndrome, myocardial infarction, sepsis, and multiple organ failure (n = 1 each). Grade 5 AEs were considered by the investigator to be related to treatment with tucatinib or placebo in 2 patients in the tucatinib-combination group due to sepsis and dehydration, and 1 patient in the placebo-combination group due to sepsis.7
Notable Harms
Diarrhea
In the tucatinib-combination group, 80.9% of patients experienced diarrhea compared with 53.3% of patients in the placebo-combination group, which required antidiarrheal medication for 77.1% and 58.1% of patients, respectively; most events of diarrhea were grade 1 (43.3% versus 32.0%, respectively) or grade 2 (24.8% versus 12.7%). Events of diarrhea were reported to be manageable with antidiarrheal medication and dose modification. Antidiarrheal medication was required for 49.7% of cycles where diarrhea was reported, and the mean length of treatment with antidiarrheal medication per cycle was 5.0 days (SD = 4.6) in the tucatinib-combination group.7 Of all events of diarrhea that took place, most (79.6%) resolved with a mean and median time of 37 days (SD = 67.6) and 8.0 days, respectively. Grade 3 or greater events of diarrhea occurred in 12.9% of patients in the tucatinib-combination group compared with 8.6% in the placebo-combination group. Doses of tucatinib or placebo were held due to diarrhea for 13.9% of patients in the tucatinib-combination group and 8.6% of patients in the placebo-combination group. Dose reductions due to diarrhea were reported for 5.7% of patients in the tucatinib-combination group and 4.6% of patients in the placebo-combination group. Few patients permanently discontinued treatment due to diarrhea (1.0% and 0.5% in the tucatinib- and placebo-combination groups, respectively).7
Potential Drug-Induced Liver Injury
A total of 9 patients (2.2%) in the tucatinib-combination group and 2 patients (1.0%) in the placebo-combination group met criteria for potential drug-induced liver injury. Of these patients, 3 in the tucatinib group were considered at high risk for fatal drug-induced liver injury under Hy’s Law (defined as AST or ALT elevations > 3 × the upper limit of normal [ULN] with concurrent elevation [within 21 days of AST and/or ALT elevations] of total bilirubin > 2 × ULN and alkaline phosphatase).7
Cerebral Edema Not Attributable to Progression of Disease
While no patients in the tucatinib-combination group reported AEs related to cerebral edema, 2 patients (1.0%) in the placebo-combination group did.
Left Ventricular Ejection Fraction
Few patients in the HER2CLIMB trial had a reported event of left ventricular ejection fraction. A total of 7 patients (1.7%) and 4 patients (2.0%) in the tucatinib- and placebo-combination groups, respectively, reported left ventricular ejection fraction. Few events required dose modification or discontinuation (1.7% in the tucatinib-combination group and 2.0% in the placebo-combination group). Dose modification was able to resolve events in 5 of 7 patients in the tucatinib-combination group. One patient in the tucatinib-combination group discontinued treatment due to left ventricular ejection fraction and 1 patient discontinued because they experienced a grade 5 event of cardiac failure; neither event was considered related to tucatinib treatment.7
Creatinine Increase
Creatinine increase was observed in 13.9% of patients in the tucatinib-combination group versus 1.5% of patients in the placebo-combination group, with all events being either grade 1 or grade 2. A mean creatinine increase of approximately 30% was observed within the first cycle of treatment with tucatinib. Mean levels of creatinine were reported to remain stable while on treatment in the tucatinib-combination group, with creatinine levels returning to baseline values upon discontinuation of treatment. No impacts on renal function for patients were reported, as acute kidney injury and renal failure AEs were infrequently reported and in similar proportions across both treatment groups.7
Critical Appraisal
Internal Validity
The HER2CLIMB trial was an international, multi-centre, double-blind, placebo-controlled, phase II RCT. Patients in the tucatinib-combination group received 300 mg tablets, and patients in the placebo-combination group received a tablet that did not contain the active ingredient but was identical in appearance to maintain the blinding. The baseline demographic and clinical characteristics were balanced across the treatment groups overall and across important analysis populations (i.e., ITT and ITT-PFS populations). Patients were randomized based on the presence of brain metastases (yes versus no), ECOG PS (0 versus 1), and geographic region (US versus Canada versus the rest of the world). This helped to ensure the comparability between treatment arms in the subgroup analysis results according to each pre-specified stratification factor. In general, subgroup analyses favoured treatment with the tucatinib combination versus the placebo combination across all subgroups.
The original protocol of the HER2CLIMB trial was dated August 11, 2015 and was amended 9 times. None of the amendments were considered to have negatively affected study outcomes, as none of the amendments were made before the unblinding of data. Also, the study amendments were not considered to have affected the interpretation of the study results. Important protocol deviations occurred in similar proportions across both the tucatinib- and placebo-combination groups (3.4% versus 3.5%). Important protocol deviations were due to dosing (n = 4), eligibility criteria (n = 4), missed assessments (n = 3), safety (n = 2), consent (n = 1), and other reasons (n = 8). As there were few important protocol deviations, and as both treatment groups reported similar proportions of important protocol deviations, it is unlikely that such deviations had a significant impact on the patient efficacy or safety analyses.
Patients were randomized in the HER2CLIMB trial using a hierarchical randomization scheme via interactive response technology. Patients were randomized based on the presence of brain metastases (yes versus no), ECOG PS (0 versus 1), and geographic region (US versus Canada versus the rest of the world). The sponsor also included specifications for a biased-coin assignment in the randomization scheme to prevent imbalances between treatment groups and any given hierarchical level (i.e., overall treatment group balance, then treatment group balance within each stratification factor). The methods for randomization were considered by the CADTH team to result in a low risk of bias, as patients were randomly assigned to a treatment group using technology that prevented unblinding of investigators and ensured that relatively equal proportions of patients would be randomized not only to each treatment group, but to each pre-specified stratification factor. The resulting baseline characteristics of the trial showed well-balanced demographic and clinical characteristics across both treatment groups in the HER2CLIMB trial and across important analysis populations (i.e., ITT and ITT-PFS populations). Therefore, there were no imbalances across treatment groups or analysis populations, which could have resulted in important differences in patient outcomes.
Geographic region was pre-specified as 1 of the stratification factors of the HER2CLIMB trial, stratifying patients into the following categories: US, Canada, and the rest of the world. The clinical experts consulted by CADTH indicated that stratification by geographic region is likely reflective of differences in treatment availability across the globe. Mainly, differences in post- and pre-protocol treatments may differ across countries and it is possible that the efficacy of tucatinib may be affected based on the treatment patterns of patients in these regions. It is unclear how differences in treatment patterns across the globe may affect patients who received treatment with tucatinib in the HER2CLIMB trial.
In general, the subgroup analyses favoured treatment with the tucatinib-combination group versus the placebo-combination group. However, it should be acknowledged that while the subgroups for the subgroup analyses were pre-specified, they were not adjusted for multiplicity, not powered to detect differences, and may be indicative of imprecision due to wide CIs. The lack of adjustment for subgroup analyses may increase the likelihood of type I error, resulting in an increased likelihood of detecting a treatment effect when 1 may not be present; as such, subgroup analyses should be considered descriptive and interpreted with caution.
Statistical analyses of OS and PFS were conducted using Cox proportional hazards models, which rely on the assumption of proportional hazards in both treatment groups. The sponsor conducted an assessment of proportional hazards by performing tests for statistical significance using log(-log(Survival)) plots. An analysis of proportional hazards did not reveal any significant violation of the assumption for either the OS or PFS analyses.
The analyses of the primary end point and key secondary end points were conducted hierarchically, whereby key secondary end points (PFSBM and OS) were tested only if PFS was found to be statistically significant at the primary analysis. In addition, the sponsor pre-specified alpha to be split across key end points, and pre-specified the boundaries for statistical significance. Alpha values were allocated to key secondary end points, depending on whether the statistical significance of the primary end point and each key secondary end point of the trial was achieved. As all primary and key secondary end points were statistically significant at the time of the primary analysis, the results were considered final and no further formal testing were specified.
Other secondary end points of the trial included ORR, PFSINV, and DOR. No adjustments for multiple testing were specified for these secondary end points. It is possible that analyses of other secondary end points are at greater risk for inflated type I error. The results of the other secondary end points are supportive of the results for the primary and key secondary end points, which favour treatment with tucatinib in combination with trastuzumab and capecitabine over placebo in combination with trastuzumab and capecitabine.
The sponsor conducted a post-hoc analysis that provided an additional 15.6 months of follow-up. This resulted in a total follow-up of 29.7 months for the tucatinib-combination group and 29.4 months for the placebo-combination group and provided additional efficacy (OS, PFS) and safety data. Of note, after the primary analysis, the trial was unblinded and assessments for PFS were conducted by the investigator. The results of the post-hoc analysis were consistent with the results of the primary analysis, which remained blinded and which used BICR for assessment of PFS.
It is possible the choice of subsequent therapies could have affected efficacy assessments of OS, as analyses for OS included patients who received subsequent therapies. A total of 202 patients (69.2%) in the tucatinib-combination group and 139 patients (79.4%) in the placebo-combination group received subsequent anti-cancer therapies. There were disproportional differences noted between treatment groups in the types of subsequent anti-cancer therapies received, as more patients in the placebo-combination group received antibody (57.1% versus 50.0%, respectively) and TKI (24.0% versus 16.8%) anti-HER2 regimens, and trastuzumab (12.2% versus 5.4%), while more patients in the tucatinib-combination group than in the placebo-combination group received trastuzumab plus chemotherapy (20.8% versus 15.8%, respectively). The differences in subsequent therapies are expected to introduce bias in the efficacy analyses of OS and other patient outcomes. However, the direction and extent of the biases are difficult to predict.
The analyses of PFS involved the censoring of patients who began new anti-cancer treatment before disease progression or death. Censoring patients for subsequent therapies is considered a form of informative censoring, especially considering the much greater proportion of patients in the placebo-combination group who were censored at the primary analysis for PFS compared with the tucatinib-combination group (74.6% versus 52.8%, respectively).7,27 Sensitivity analyses for PFS that did not censor for patients receiving subsequent therapies were not conducted, and this definition of censoring was deemed conservative in the assessment of PFS. Post-hoc analysis revealed more equal proportions of patients in the tucatinib- and placebo-combination groups who eventually discontinued from study treatment and reported receiving subsequent therapies (76.8% versus 81.2%, respectively).9 The post-hoc analyses of PFS continued to support improved efficacy of tucatinib-combination over the placebo-combination therapy.
No treatment crossover was permitted within the HER2CLIMB trial.7 However, based on specific inclusion and exclusion criteria, patients could have crossed over from the placebo-combination group to the tucatinib-combination group after the double-blinded phase of the HER2CLIMB trial, which occurred after the primary analysis. There were 26 patients from the placebo-combination group who crossed over to the tucatinib-combination group, potentially biasing results against the tucatinib-combination group. As a minimal number of patients crossed over to the tucatinib-combination group, it is unlikely that the impact of crossover affected the efficacy results of the trial.
HRQoL was assessed using the EQ-5D-5L and was considered an exploratory end point for the HER2CLIMB trial; the results revealed no differences between the tucatinib- and placebo-combination groups. Analyses of patient-reported outcomes were conducted using the EQ-5D-5L, which previously demonstrated responsiveness among breast cancer patients following curative treatment, although small changes in health were not recognized as being meaningful.28,29 Previous evidence also suggests that the EQ-5D-5L shows both reliability and validity for use among patients living with breast cancer.30 However, none of the previously identified evidence included patients with brain metastases. The EQ-5D-5L is a generic tool used to measure HRQoL of patients across many diseases; the validity and reliability of this tool has been demonstrated across many patient populations, including breast cancer. It is possible that small differences in HRQoL that may be important to patients living with cancer were not detectable with the EQ-5D-5L.29
A summary of dose exposure showed that patients in the tucatinib-combination group received treatment with tucatinib, capecitabine, and trastuzumab for longer mean periods of time than the patients in the placebo-combination group, who received placebo, capecitabine, and trastuzumab. Dose exposure was measured by the number of treatment cycles initiated among patients who received at least 1 dose. The total mean cumulative dose of trastuzumab was also greater in the tucatinib-combination group than in the placebo-combination group. The mean duration of exposure to tucatinib or placebo was longer in the tucatinib-combination group than in the placebo-combination group (7.6 months versus 5.6 months, respectively). The mean duration was also longer in the tucatinib-combination group than in the placebo-combination group for trastuzumab (7.3 months versus 5.4 months, respectively) and capecitabine (7.9 months versus 5.7 months). Overall, these differences likely resulted in a better treatment effect in the tucatinib-combination group than its counterpart. The longer treatment duration should be considered when interpreting HRQoL data, as longer exposure to treatment may influence toxicities and quality of life for patients.
Concomitant medications were administered in generally similar frequencies across both HER2CLIMB treatment groups, with most patients in both groups requiring a concomitant medication (99.3% in the tucatinib-combination group versus 97.5% in the placebo-combination group). However, more patients in the tucatinib-combination group required antipropulsive medications compared with the placebo-combination group (65.6% versus 36.5%, respectively), and more patients in the placebo-combination group than in the tucatinib-combination group received natural opium alkaloids (33.5% versus 23.8%, respectively).7 Consultation with clinical experts confirmed it is possible that differences in concomitant medications could result in differences in patient outcomes, particularly symptom or pain controls and HRQoL. However, the effect of concomitant medications on patients is unclear.
External Validity
The protocol of the HER2CLIMB trial stated that efforts were made to avoid radiation or surgery to target lesions in the brain in the absence of disease progression (per RECIST v1.1 criteria) unless clinically necessary in the opinion of the investigator. This was done to ensure accurate assessments for PFS, as target lesions cannot be adequately assessed for subsequent response to systemic therapy once treated with local CNS therapy and could, therefore, interfere with efficacy assessments. The clinical experts consulted by CADTH confirmed that avoidance of radiation or surgery to target lesions in the brain is not conducted in clinical practice. The clinical experts stated that radiation or surgery are typically preferentially chosen for the treatment of patients with progressive brain lesions, as previous systemic therapies in this setting were not associated with meaningful intracranial activity.
The protocol of the HER2CLIMB trial also stated that all patients underwent imaging for brain metastases at baseline. The clinical experts consulting with CADTH confirmed it is not typical clinical practice to scan all breast cancer patients for brain metastases upon initial assessment. Patients would undergo imaging only when brain metastases are suspected.
Efficacy assessments were performed once every 6 weeks for the first 6 months while on study and then once every 9 weeks. The sponsor stated that these assessment intervals were consistent with standard-of-care practice and the schedules used in prior studies in similar populations.7 The clinical experts consulted for this review stated that the assessments of patients in the HER2CLIMB trial were conducted more frequently than what might be typical in Canadian clinical practice; in general, imaging for patients occurs after approximately 4 cycles of treatment, or every 9 to 12 weeks. Assessments may occur more frequently for patients who require greater observation. The increased frequency of assessments in the HER2CLIMB trial may have allowed for greater detection of patients’ treatment response. It is not expected that the frequency of assessments in the HER2CLIMB trial negatively impacted patient outcomes; however, the frequency of assessments is likely too frequent and not reflective of clinical practice.
The interventions of the HER2CLIMB trial included tucatinib, trastuzumab, and capecitabine, which were administered at 300 mg orally twice daily, 6 mg/kg once every 21 days (with a loading dose of 8 mg/kg), and 1,000 mg/m2 administered orally twice daily on days 1 to 14 of each 21-day cycle, respectively. These dosages align with the Health Canada–approved dosages for each treatment and align with what patients are administered in clinical practice. The baseline characteristics of patients in the HER2CLIMB trial included mostly women from North America or the rest of the world, good performance status (ECOG PS 0 or 1), and presence of metastases (including CNS and non-CNS metastases). While the trial included highly selective and mostly White patients, based on input from the clinical experts consulted by CADTH, the baseline characteristics of the HER2CLIMB trial were generally considered to be representative of Canadian patients. However, it should be noted the eligibility criteria of the HER2CLIMB trial were highly restrictive and may not capture all patients who may be treated with tucatinib-combination therapy in clinical practice. It is unclear whether the treatment effects of tucatinib-combination therapy will be generalizable to patients who were excluded from the HER2CLIMB trial. Key outcome measures of the trial included PFS and OS. These outcomes were identified by clinical experts consulted by CADTH as being important to patients. ORR was also captured as a secondary end point in the HER2CLIMB trial; response rates may also be useful for capturing the responsiveness of patients to treatment. In general, outcomes were clinically relevant and were considered appropriate measures for the assessment of patient outcomes. Overall, the interventions, patient characteristics, and outcomes measures were all considered generalizable to the Canadian context.
The HER2CLIMB trial enrolled mostly female patients but also enrolled 3 male patients (0.7%) in the tucatinib-combination group and 2 male patients (1.0%) in the placebo-combination group. Males are also at risk of developing breast cancer and are often excluded from clinical trials. The HER2CLIMB trial enrolled male patients in addition to women. While the number of male patients is low, generalizability to male patients should be considered and tucatinib in combination with trastuzumab and capecitabine should be provided to male patients with HER2-positive MBC as a treatment option.
Within the HER2CLIMB trial, both trial groups received trastuzumab, which could have been administered to patients in varying formulations. Patients may have been administered trastuzumab intravenously or subcutaneously. In addition, the IV and subcutaneous formulations of trastuzumab are administered at different dosages: 6 mg/kg once every 21 days (with a loading dose of 8 mg/kg) and 600 mg every 21 days (without a loading dose, respectively).7 While no direct evidence exists to compare the efficacy of the 2 formulations and doses of trastuzumab, the clinical experts agreed the efficacy of both versions of trastuzumab should be equivalent. Additionally, the clinical experts also confirmed that the IV formulation of trastuzumab is more commonly used among Canadian patients, and consultation with the Provincial Advisory Group confirmed that the biosimilar formulation of trastuzumab would be used in most Canadian jurisdictions.
Standard first-line therapies for patients with MBC may include treatment with pertuzumab in combination with trastuzumab and taxane followed by pertuzumab plus trastuzumab. Second-line therapies for these patients may then include T-DM1. Eligibility criteria in the HER2CLIMB trial specified that all patients must have had prior treatment with trastuzumab, pertuzumab, and T-DM1. Therefore, the patient population of patients in the HER2CLIMB trial is likely reflective of patients in the Canadian population and treatment algorithms standard in Canadian clinical practice. Prior treatment with trastuzumab, T-DM1, and pertuzumab was not required to have been specifically in the metastatic setting, although most patients did receive each drug in the metastatic setting, with some patients receiving it in both the neoadjuvant or adjuvant and metastatic setting, and few patients receiving prior therapy in the neoadjuvant or adjuvant setting only. The sponsor noted that the treatment landscape for HER2-positive breast cancer patients has changed drastically since the completion of the patient enrolment for the HER2CLIMB trial.10 During patient enrolment, T-DM1 was approved for and used only in the metastatic setting; however, since completion of patient enrolment, T-DM1 has been approved for use in the adjuvant setting. Almost all patients in the HER2CLIMB trial (> 98%) reported having received prior therapy with T-DM1 in the metastatic setting only.7 It is expected that a greater proportion of patients in clinical practice will have received prior therapy with T-DM1 in other treatment settings as well.
Treatments in the HER2CLIMB trial included tucatinib or placebo, trastuzumab, and capecitabine. The doses and administration schedules in the trial were in alignment with Health Canada and Canadian clinical practice. At the time the HER2CLIMB trial was conducted, the combination of trastuzumab and capecitabine was considered an appropriate comparator based on phase III data from the CEREBEL trial. This regimen supported improved PFS and OS for patients compared with lapatinib plus capecitabine therapy.19 Therefore, the choice of treatment comparator was considered appropriate, given the evidence at the time the HER2CLIMB trial was being conducted. However, the clinical experts consulted by CADTH highlighted that the results of the CEREBEL trial may not be conclusive and that lapatinib plus capecitabine might also be a relevant comparator for tucatinib-combination therapy. No direct evidence exists to compare the efficacy and safety of tucatinib in combination with trastuzumab and capecitabine versus lapatinib plus capecitabine. Regarding toxicity, the clinical experts commented that there may be fewer or equal rates of some AEs, such as diarrhea and nausea, with tucatinib-combination therapy, as lapatinib and capecitabine are associated with more of these toxicities than trastuzumab plus capecitabine.
In addition, the HER2CLIMB trial allowed for enrolment of patients with brain metastases who comprised 48.3% of the total study population and, traditionally, this subgroup of patients has been excluded from clinical trials. The inclusion of patients with brain metastases is highly relevant, as many patients with HER2-positive MBC develop brain metastases.31 The HER2CLIMB trial demonstrated statistically significantly improved efficacy in the tucatinib-combination group compared with the placebo-combination group, even with patients with brain metastases who may face worse prognoses. In addition, subgroup analyses for PFS and OS supported treatment with tucatinib-combination therapy over the placebo-combination treatment. The clinical experts confirmed that the patient population of the HER2CLIMB trial was reflective of Canadian patients and supported the results of the HER2CLIMB trial that suggested treatment with tucatinib in combination with trastuzumab and capecitabine for patients with brain metastases.
In the Health Canada–approved product monograph, tucatinib in combination with trastuzumab and capecitabine is indicated for patients who have received at least 1 prior HER2-directed therapy in the metastatic setting.2 The treatment landscape for patients with MBC is complex and has changed to include new HER2-directed treatments, such as pertuzumab and T-DM1. Patients in the HER2CLIMB trial reported having received a mean of 3 prior therapies in the metastatic setting, and the sponsor confirmed that every patient in the HER2CLIMB trial received at least 1 prior therapy in the metastatic setting.3,7 Therefore, it was considered appropriate, given the changes to the treatment landscape for this setting and the characteristics of patients in the HER2CLIMB trial, that treatment with tucatinib in combination with trastuzumab and capecitabine be used for patients who received at least 1 HER2-targeted therapy in the metastatic setting.
The HER2CLIMB trial eligibility criteria required patients to have prior treatment with trastuzumab, pertuzumab, and T-DM1, alone or in combination, and most patients (> 90%) reported having received each treatment. The median and mean number of therapies used among patients in the HER2CLIMB trial was 4, with most patients having received trastuzumab, pertuzumab, and T-DM1 in either the metastatic setting or in the metastatic and neoadjuvant or adjuvant setting. Therefore, patients would have received tucatinib-combination therapy in the second- or later-line setting. It may be unreasonable to suggest using tucatinib-combination therapy as a first-line treatment option for patients with MBC, as there is no evidence to support the use of this treatment in this context. The input received from the clinical expert consulted by CADTH and the Canadian clinician groups providing input on this submission suggests that tucatinib-combination therapy would most likely be used as a third-line therapy.
Regarding treatment discontinuations, the HER2CLIMB trial did not allow patients to continue the remaining study treatments if discontinuation was required for both trastuzumab and capecitabine (concurrently), or tucatinib or placebo. However, patients who experienced toxicity from capecitabine or trastuzumab were permitted to discontinue 1 of these drugs and continue on tucatinib or placebo in combination with either capecitabine or trastuzumab. The clinical experts consulted by CADTH agreed the discontinuation criteria of the trial were acceptable.
Indirect Evidence
Objectives and Methods for the Summary of Indirect Evidence
The HER2CLIMB trial compared tucatinib in combination with trastuzumab and capecitabine with placebo in combination with trastuzumab and capecitabine for patients with locally advanced, unresectable, or metastatic HER2-positive breast cancer, including patients with brain metastases, who have received prior treatment with trastuzumab, pertuzumab, and T-DM1, separately or in combination. In Canada, numerous treatment options are available for such patients in the second- or later-line setting. The objective of this section is to summarize and critically appraise available indirect evidence comparing tucatinib in combination with trastuzumab and capecitabine with relevant treatments for HER2-positive MBC patients.
The sponsor conducted a systemic literature review to identify relevant studies for its submitted ITC. The search for the systematic literature review was performed on January 22, 2020 for electronic databases (Table 25) and on January 27, 2020 for conference websites. Relevant systematic reviews and meta-analyses were handsearched for relevant publications that were not identified in the electronic searches.11 It was noted by the sponsor that the protocol for the systematic literature review was amended in March 2020; the original protocol specified searching for literature pertaining to treatments administered to HER2-positive MBC patients who received at least 2 prior anti-HER2 regimens in any setting. However, due to limited studies fitting these criteria, the protocol was expanded to identify at least 1 prior anti-HER2 regimen in any setting.11
Description of the Indirect Comparison
The sponsor-submitted ITC was summarized and appraised. A supplemental search of the medical literature for publicly available ITCs was conducted by CADTH staff, and no additional ITCs were identified that evaluated the efficacy or safety of tucatinib in combination with trastuzumab and capecitabine against relevant comparators for HER2-positive MBC patients.
Table 25: Study Selection Criteria and Methods for the ITC
Criteria | Sponsor’s ITC |
|---|---|
Population | Adults (≥ 18 years) with unresectable, locally advanced, or metastatic HER2-positive breast cancer with or without brain metastases with progression after previous treatment with at least 1 prior anti-HER2 regimens in any setting. |
Intervention |
Note: Hormone receptor–positive patients could also have received a hormonal therapy in combination with any comparator of interest. |
Comparator | Any interventions listed in the previous row. |
Outcome |
|
Study design |
|
Publication characteristics | No data limit for publication date, language, or geography placed on electronic database searches. Conference proceedings were limited to abstracted published within 2 years (2018 to 2020).c |
Exclusion criteria | Population
Intervention
Comparators
Study design
|
Databases searchedd | Electronic databases
Websites and other resourcese
|
Databases searchedd (continued) | HTA websites
|
Selection process | Titles and abstracts followed by full texts from search results from electronic databases and internet searches were screened independently by 2 researchers; disagreements were settled by consensus between the 2 researchers. |
Data extraction process |
|
Quality assessment | RCTs were assessed for quality based on standards recommended by NICE 2015a, which were stated to be consistent with methods recommended by the Centre for Reviews and Dissemination (2009). |
AE = adverse event; ALT = alanine aminotransferase; ASCO = American Society of Clinical Oncology; AST = aspartate aminotransferase; ESMO = European Society for Medical Oncology; HER2 = human epidermal growth factor receptor 2; HR = hormone receptor; HRQoL = health-related quality of life; HTA = health technology assessment; ITC = indirect treatment comparison; MBC = metastatic breast cancer; NA = not applicable; NICE = National Institute for Health and Care Excellence; OS = overall survival; ORR = overall response rate; PFS = progression-free survival; RCT = randomized controlled trial; SAE = serious adverse event; RTI-HS = RTI Health Solutions.
aThis was intended to identify long-term follow-up studies of included RCTs only.
bSystematic reviews were included at level 1 screening, used for identification of primary studies, and then excluded at level 2 screening.
cThis limitation was placed because it was expected that all studies of a reasonable quality reported in abstract form before this date would have been published in a peer-reviewed journal.
dReference lists of up to 10 relevant and robust identified systematic reviews or meta-analyses were searched for further studies of interest because such reference lists typically are good sources of additional material that can supplement the publications identified in the medical literature databases.
eThese websites of professional organizations were searched to identify conference abstracts (i.e., those abstracts not indexed in a medical literature database).
fThese websites were searched to identify ongoing, discontinued, or completed clinical trials of tucatinib and its comparators.
Source: Sponsor’s ITC.11
Methods of the ITC
Objectives
The aim of the submitted ITC was to compare the efficacy of tucatinib and comparators of interest among adult patients with HER2-positive MBC who have had at least 1 prior anti-HER2 regimen in any setting.
Study Selection Methods
A literature search was conducted based on details in Table 25. Studies were screened by title and abstract followed by full-text screening, resulting in the inclusion of 39 studies that were considered for inclusion in the sponsor’s ITC; of those studies, 25 were not included in the ITC due to a lack of connected networks or lack of a connection between tucatinib and a comparator of interest (n = 24), or because the trial was a dose comparison study (n = 1). The sponsor’s systematic literature search identified 14 trials that included patients who had been treated previously with at least 1 anti-HER2 regimen (Figure 14).11
Figure 14: PRISMA Diagram of Systematic Literature Review for Sponsor's ITC
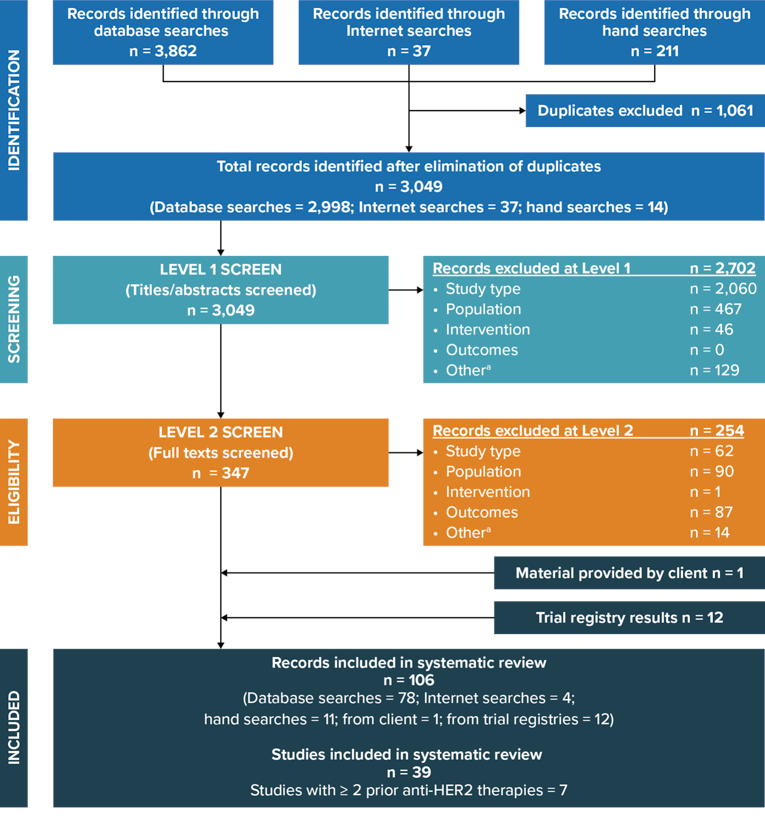
HER2 = human epidermal growth factor receptor 2; ITC = indirect treatment comparison; PRISMA = Preferred Reporting Items for Systematic Reviews and Meta-Analyses.
Note: This figure demonstrates the results of the sponsor’s systematic literature search based on the initial criteria of patients receiving at least 2 prior anti-HER2 regimens. Once the criteria were updated to include patients who had received at least 1 prior anti-HER2 regimen, a total of 14 trials were identified by the systematic literature search and included into the sponsor’s ITC.
a The category “Other” includes duplicate references and conference abstracts published before 2018.
Source: Sponsor’s ITC.11
ITC Analysis Methods
Details of the methodology for the sponsor’s ITC are reported in Table 26.
Four trials reported treatment crossover (EGF100151,32 EMILIA,16 GBG-26,33 Jiang et al.34). The sponsor used the rank-preserving structural failure time model to adjust for treatment crossover.11
Progression-free survival: The LANTERN35 and TRAXHER236 trials did not report HRs for PFS, but reported median PFS for both the experimental and control groups. Methods reported by Hackshaw37 were used by the sponsor to estimate HRs based on reported median PFS data. Therefore, all 14 trials were used in the network of evidence for PFS.11
Overall survival: HRs were reported for 10 of the 14 trials. It was noted that the LANTERN35 study did not report an HR for OS but did report data that were used to estimate the hazard for death in the trial. The following trials were not used for the network of evidence for OS in the NMA:
The TRAXHER236 study did not report median survival in either treatment group, as the 50% survival rate threshold was not reached for the comparator group.
The statistical analysis methods reported in the GBG-2633 trial were not considered to robustly account for treatment switching. Almost half of all patients in the GBG-26 trial had crossover anti-HER2 treatment after receiving the treatment they were randomized to in the trial (capecitabine or trastuzumab plus capecitabine). The authors of the GBG-26 trial reported the analyses that were conducted excluded patients who received crossover treatment, but that the power of the analyses was limited due to the low number of patients (N = 31).33 Therefore, to minimize the amount of bias being introduced into the ITC, the sponsor did not include this trial in the analysis for OS in the NMA.
OS data were not reported in either the Jiang et al.34 or Ma et al.38 studies.
Best tumour response: The original probit model was used in the analysis of best tumour response, which analyzed patients’ best responses (complete response, partial response, stable disease, or progressive disease). Ten of the 14 trials were used for the analysis of best tumour response. It was noted by the sponsor that 7 of the 10 studies included in this analysis evaluated best tumour response for patients with measurable lesions at baseline; for 3 trials (Jiang et al.,34 GBG-26,33 TRAXHER236), there was no clear statement regarding measurable disease at baseline, but it was assumed by the sponsor that this was the case.11
The sponsor considered prior exposure to HER2-targeted therapies, differences in line of therapy, and patients with brain metastases as potential effect modifiers. However, no analysis was deemed able to robustly account for the differences in these effect modifiers due to the lack of available data.
Table 26: ITC Analysis Methods
Method | Sponsor’s ITC |
|---|---|
ITC methods | The primary analyses were conducted using frequentist and Bayesian methods using fixed-effects models. NMAs based on reconstructed patient-level data and analyses based on HRs were performed. The primary analysis approach for PFS and OS was the HR method, with the results compared for consistency with the fractional polynomial method. Estimates of relative differences between treatments were made, along with corresponding 95% CrIs. |
Priors | Informative priors as presented by Turner et al. (2015)39 were used:
|
Assessment of model fit | DIC |
Assessment of consistency | Heterogeneity of all end points was assessed in the following manners:
When the network of evidence consisted of duplicate comparisons and/or closed loops, heterogeneity and inconsistency were assessed using I2, Cochran’s Q, and node splitting. |
Assessment of convergence | For the Bayesian models for PFS and OS, 300,000 iterations were used, with a burn-in of 100,000 iterations, a thin rate of 100 and 3 chains with different initial values. For the Bayesian models for ORR, 350,000 iterations were used with a burn-in of 150,000 iterations, a thin rate of 100, and 3 chains with different initial values. |
Outcomes |
|
Sensitivity analyses | Including pyrotinib in the network of evidence: Trials reporting data for pyrotinib in combination with capecitabine (Jiang et al. [2019] and Ma et al. [2019]) reported immature data and were not included in the network of evidence for the primary analysis of the NMA. Sensitivity analyses were conducted that included trials assessing this treatment. Heterogeneity from Takano et al. (2018): The study by Takano et al. (2018)40 compared lapatinib plus capecitabine with trastuzumab plus capecitabine among Japanese patients. Results of the trial suggested improved clinical outcomes when treated with lapatinib plus capecitabine compared with trastuzumab plus capecitabine. Two other trials included in the sponsor’s ITC compared the lapatinib plus capecitabine combination with trastuzumab plus capecitabine (LANTERN and Pivot et al., 2015), but suggested improved efficacy with trastuzumab plus capecitabine. The sponsor identified evidence suggesting improved efficacy of lapatinib among Asian populations. To address the conflicting evidence, sensitivity analyses were conducted that excluded the study by Takano et al. (2018).40 |
Subgroup analysis | None conducted. |
Methods for pairwise meta-analysis | A cross-reference table was used to present results for pairwise comparisons for HRs, mean differences or probit differences and associated 95% CrIs for each comparator pair. |
BTR = best tumour response; CR = complete response; CrI = credible interval; DIC = deviance information criterion; HR = hazard ratio; ITC = indirect treatment comparison; NMA = network meta-analysis; ORR = objective response rate; OS = overall survival; PD = progressive disease; PFS = progression-free survival; PR = partial response; SD = stable disease.
Source: Sponsor’s ITC.11
The proportional hazards assumption was reported not to be met for 3 studies included in the network of evidence for PFS and 1 study included in the network of evidence for OS. Fractional polynomials were fitted to reconstructed patient-level data to further examine whether proportional hazards assumptions were met. Patient-level data were reconstructed from publications of trials included in the ITC network using Kaplan–Meier survival curves and the number of patients at risk. Available data for reconstruction of patient-level data were available from 11 trials for the analysis of PFS and 8 trials for the analysis of OS. The sponsor conducted NMAs based on HRs and based on the fractional polynomial method and compared results for consistency. However, the primary analyses for both OS and PFS were based on HR data.11
Random-effects fractional polynomial models were also conducted as sensitivity analyses. Random-effects models were compared with fixed-effects models but revealed difficulty with model convergence, inconsistency between direct trial data and results from random-effects Bayesian modelling, and generally had higher deviance information criterion (DIC) values compared with fixed-effects models. Overall, fixed-effects models were considered more robust.11 Frequentist random-effects models were performed when there was at least 1 closed-loop or duplicate comparison. Bayesian random-effects models were performed with the use of informative priors presented by Turner et al. 11,39,
Results of the ITC
Summary of Included Studies
The following trials were included for analyses in the sponsor’s ITC: CEREBEL,19 EGF100151,32 ELTOP,40 EMILIA,16 GBG-26,33 HER2CLIMB,22 LANTERN,35 NALA,41 Martin et al.,42 Ma et al.,38 Jiang et al.,34 PHEREXA,43 SOPHIA,44 and TRAXHER2.36
A summary of the overall network of trials is included in Table 27, which depicts the number of trials by treatment of interest. Most treatments of interest had only 1 or 2 trials that had information available for comparisons in the NMA, except for lapatinib plus capecitabine and trastuzumab plus capecitabine, which had 8 and 7 trials, respectively, with information available to inform on treatment efficacy.
Table 27: Number of Trials Included in Sponsor’s ITC by Treatment of Interest
Generic name | Route | Dose range | Number of trials |
|---|---|---|---|
Lapatiniba | Oral | 1,250 mg/daily | 8 |
Margetuximaba | IV infusion | 15 mg/kg q.3.w. | 1 |
Neratinib | Oral | 240 mg daily | 1 |
Neratiniba | Oral | 240 mg daily | 1 |
Pertuzumab + trastuzumaba | IV infusion | 420 mg q.3.w. after a loading dose of 840 mg | 1 |
6 mg/kg q.3.w. after a loading dose of 8 mg/kg | |||
Pyrotiniba | Oral | 400 mg daily | 2 |
Trastuzumaba | IV infusion | 2 mg/kg or 6 mg/kg q.3.w. after a loading dose of 0 mg/kg, 4 mg/kg, or 8 mg/kg | 7 |
Trastuzumab emtansine | IV infusion | 3.6 mg/kg q.3.w. | 2 |
Trastuzumab emtansinea | IV infusion | 3.6 mg/kg q.3.w. | 1 |
Tucatinib + trastuzumaba | Oral (tucatinib) | 300 mg twice daily | 1 |
IV infusion (trastuzumab) | 6 mg/kg q.3.w. after a loading dose of 8 mg/kg |
ITC = indirect treatment comparison; q.3.w. = 3 times per week.
aCapecitabine was also administered.
Source: Sponsor’s ITC.11
Study Characteristics
A summary of the trial-level characteristics of the studies included in the sponsor’s ITC is reported in Table 28. Trials were phase II or III randomized controlled trials. Except for 2 studies, HER2CLIMB22 and Jiang et al.,34 all trials were open label. Most trials (n = 12) reported prior trastuzumab treatment for nearly 100% of patients, with the remaining 2 trials reporting approximately half of patients receiving prior trastuzumab; the majority of trials involving prior treatment with trastuzumab was included as eligibility criteria for the trial. Most trials included patients who had received at least 1 prior therapy in the metastatic setting. Two trials36,40 did not report information on the prior therapies received by patients in the metastatic setting. Most trials enrolled patients of many races, although most patients were White (n = 7); the remaining trials enrolled Chinese (n = 2) or Japanese patients (n = 1). The race of patients was not reported in 4 trials. Treatment crossover was reported for 4 of the studies; for 3 of these trials (EGF100151,32 EMILIA,16 and Jiang et al.34), switching to the investigational treatment from the comparator group was permitted after patients had reported disease progression, while the fourth trial, GBG-26,33 re-randomized patients from both treatment groups to receive either chemotherapy or chemotherapy combined with trastuzumab or lapatinib for treatment in the third line.
Table 28: Trial-Level Characteristics of Studies Included in the NMA
Trial, citation | Phase | Blinding | Prior TZB (%) | Prior TZB subgroup data available | Line of therapy, metastatic setting | Crossover (%) | Race |
|---|---|---|---|---|---|---|---|
CEREBEL, | III | Open label | 60 | Yes | ≥ 1 | Parallel group | Mixed, mainly White |
EGF100151, Cameron et al. (2008) | III | Open label | 98 to 99 | No | ≥ 1 | Crossover (18) | NR |
ELTOP, Takano et al. (2018) | II | Open label | 100a | No | NR | Parallel group | Japanese |
EMILIA, Verma et al. (2012) | III | Open label | 100 | No | ≥ 1 | Crossover (27) | Mixed, mainly White |
GBG 26, von Minckwitz et al. (2009) | III | Open label | 100 | No | 2b | Crossover (28)c | NR |
HER2CLIMB, Murthy et al. (2019) | II | Double blind | 100 | No | ≥ 2 | Parallel group | Mixed, mainly White |
LANTERN, (EUCTR2010 to 0227) | II | Open label | 100a | No | ≥ 2d | Parallel group | NR |
NALA, Saura et al., (2019) | III | Open label | 100 | No | ≥ 3 | Parallel group | Mixed, mainly White |
NCT00777101, Martin et al. (2013) | II | Open label | 99 to 100 | No | ≥ 1 | Parallel group | Mixed, mainly White |
NCT02422199, Ma et al. (2019) | II | Open label | 53.9 | Yes | ≥ 1 | Parallel group | Chinese |
NCT02973737, Jiang et al. (2019) | III | Double blind | 100 | No | ≥ 1 | Crossover (76) | Chinese |
PHEREXA, Urruticoechea et al. (2017) | III | Open label | 99.1 to 100 | No | 2e | Parallel group | Mixed, mainly White |
SOPHIA, Rugo et al. (2019) | III | Open label | 100 | Yes | ≤ 2 (66% to 67%) or > 2 (33% to 34%) | Parallel group | NR |
TRAXHER2, Cortés et al. (2018) | II | Open label | 100a | No | NR | Parallel group | Mixed, mainly White |
HER2 = human epidermal growth factor receptor 2; NCT = National Clinical Trial number; NMA = network meta-analysis; NR = not reported; TZB = trastuzumab.
Note: All trials were randomized controlled trials.
aPrevious trastuzumab treatment was an inclusion criterion, so assumed to be 100%.
bMost patients (96% to 100%).
cPatients were re-randomized at progression in both arms to receive either HER2-targeted therapy (trastuzumab or lapatinib) plus third-line chemotherapy or third-line chemotherapy alone.
dSystemic setting.
eThree patients in 1 arm may have received first-line metastatic treatment, as they did not appear to have prior trastuzumab in the metastatic setting.
Source: Sponsor’s indirect treatment comparison.11
Baseline Characteristics
Baseline characteristics of patients in each treatment group of the trials included in the sponsor’s ITC are reported in Table 29. These trials enrolled between 43 and 271 patients in each treatment group; the LANTERN35 trial enrolled only 30 patients across both treatment groups, as recruitment was slow and never reached the target sample size for the trial; it was thus underpowered for detection of treatment differences across treatment groups. To avoid selection bias, the LANTERN35 trial was still included in the sponsor’s NMA. All trials, except for the HER2CLIMB trial,22 either enrolled few patients (less than 20%) with brain metastases or did not allow patients with brain metastases to enroll, as per eligibility criteria. Of the trials with available information, the median time to diagnosis was between 30 and 50 months. The median age was similar across most trials, with patients reporting a median age of between 48 and 59 years of age. In most trials, less than 50% of patients had an ECOG PS of 1; the CEREBEL,19 Ma et al.,38 and Jiang et al.34 trials included treatment groups in which more than 50% of patients had an ECOG PS of 1. Only the CEREBEL19 trial comprised mainly patients with an ECOG PS of 1. Across treatment groups and trials, between 1-third and 2-thirds of patients, approximately, reported estrogen receptor positivity.
In general, baseline characteristics were balanced across treatment groups in all of the trials included in the ITC. However, differences were observed between treatment groups regarding the proportion of patients with an ECOG PS of 1 in the ELTOP,40 Ma et al.,38 LANTERN,35 and Jiang et al.34 trials. In addition, the proportions of patients reporting estrogen receptor and/or progesterone receptor positivity varied in the Ma et al.38 trial.
Table 29: Baseline Characteristics Across Treatment Groups Included in the NMA
Trial, citation | Treatment | ITT (N) | BM (N) | Median time to diagnosis (months) | Mean age (years) | ECOG performance status = 1 (%) | ER+ and/or PR+ (%) |
|---|---|---|---|---|---|---|---|
CEREBEL, Pivot et al. (2015) | Lapatinib + capecitabine | 271 | 20a | 31.2 | 53.4 | 96b | ER+ = 49 PR+ = 36c |
Trastuzumab + capecitabine | 269 | 19a | 36 | 55.8 | 98b | ER+ = 45 PR+ = 30c | |
EGF100151, Cameron et al. (2008) | Lapatinib + capecitabine | 198 | 23d | 45.6 | 54e | 38 | 48 |
Capecitabine | 201 | 49.2 | 51e | 41 | 46 | ||
ELTOP, Takano et al. (2018) | Lapatinib + capecitabine | 43 | 7 | NR | 59e | 28 | 63 |
Trastuzumab + capecitabine | 43 | 6 | NR | 57e | 42 | 63 | |
EMILIA, Verma et al. (2012) | T-DM1 | 495 | 45 | 39.6 | 52.2 | 39 | 57 |
Lapatinib + capecitabine | 496 | 50 | 37.2 | 53.2 | 35 | 53 | |
GBG 26, von Minckwitz et al. (2009) | Trastuzumab + capecitabine | 78 | 1a | NR | 52.5e | NR | 56 |
Capecitabine | 78 | 2a | NR | 59e | NR | 62 | |
HER2CLIMB, Murthy et al. (2019) | Tucatinib + trastuzumab + capecitabine | 410 | 198 | 48.1 | 53.8 | 50.2 | 59.3 |
Trastuzumab + capecitabine | 202 | 93 | 49.1 | 54.2 | 53.5 | 62.9 | |
LANTERN, EUCTR2010 to 0227) | Lapatinib + capecitabine | 16 | 16 | NR | 52.6 | 56.3 | 37.5 |
Trastuzumab + capecitabine | 14 | 14 | NR | 50.6 | 35.7 | 46.5 | |
NALA, Saura et al. (2019) | Neratinib + capecitabine | 307 | 51 | NR | 55.0 | NR | 59 |
Lapatinib + capecitabine | 314 | 50 | NR | 54.3 | NR | 59.2 | |
NCT00777101, Martin et al. (2013) | Neratinib | 117 | NRf | NR | 53.1 | 37 | ER+ = 44 PR+ = 27c |
Lapatinib + capecitabine | 116 | NRf | NR | 54.7 | 34 | ER+ = 40 PR+ = 28c | |
NCT02422199, Ma et al. (2019) | Pyrotinib + capecitabine | 65 | NAg | NR | 48e | 40 | 56.9 |
Lapatinib + capecitabine | 63 | NAg | NR | 49e | 52.4 | 68.3 | |
NCT02973737, Jiang et al. (2019) | Pyrotinib + capecitabine | 185 | 21 | NR | 50e | 56.8 | 54.1 |
Capecitabine | 94 | 10 | NR | 50e | 68.1 | 54.3 | |
PHEREXA, Urruticoechea et al. (2017) | Pertuzumab + trastuzumab + capecitabine | 228 | 25 | NR | 53 | 30 | 55 |
Trastuzumab + capecitabine | 224 | 28 | NR | 55.1 | 33.2 | 55 | |
SOPHIA, Rugo et al. (2019) | Margetuximab + chemotherapy | 266 | NRh | NR | 55e | 44 | 62 |
Trastuzumab + chemotherapy | 270 | NRh | NR | 56e | 40 | 63 | |
TRAXHER2, Cortés et al. (2018) | T-DM1 + capecitabine | 81 | NRh | NR | 53.3 | NR | NR |
T-DM1 | 80 | NRh | NR | 52.6 | NR | NR |
BM = brain metastases; ECOG = Eastern Cooperative Oncology Group; ER = estrogen receptor; ITT = intention to treat; NA = not applicable; NCT = National Clinical Trial number; NMA = network meta-analysis; NR = not reported; PR = progesterone receptor; T-DM1 = trastuzumab emtansine.
aCentral nervous system metastases.
bECOG performance status 0 or 1.
cHormone receptor status reported separately.
dNR by treatment arm.
eMedian age in years.
fPatients with controlled and asymptomatic central nervous system metastases were eligible, but the number of such patients included was NR.
gPatients with brain metastases were excluded as part of the eligibility criteria.
hPatients with controlled and asymptomatic brain metastases were eligible, but the number of such patients included was NR.
Source: Sponsor’s indirect treatment comparison.11
Risk-of-Bias Assessment
The sponsor also conducted a risk-of-bias assessment for each trial that categorized the following components of each study as low, medium, or high risk of bias: method of randomization, allocation concealment, balance across treatment groups, selective reporting, population representative of other studies, sample size, re-treatment switching, and other. In all categories, most studies reported either a low or medium risk of bias.11 Overall, 6 of the trials were categorized as having a low risk of bias (EGF100151,32 EMILIA,16 HER2CLIMB,22 Martin et al.,42 NALA,41 and PHEREXA43). The CEREBEL19 and SOPHIA44 trials were categorized as having a medium risk of bias, and the ELTOP,40 GBG-26,33 Jiang et al.,34 LANTERN,35 Ma et al.,38 and TRAXHER236 studies were classified as having a high risk of bias. Due to the sponsor’s risk-of-bias assessments, the following conclusions were made:
The LANTERN35 and TRAXHER236 trials were reported by the sponsor to be of particularly poor quality due to early termination with a small sample size; however, these studies were not excluded to avoid publication bias and were included in the sponsor’s ITC.
Three studies recruited only Chinese or Japanese patients (ELTOP,40 Jiang et al.,34 Ma et al.38); these 3 studies also had small sizes and issues with treatment crossover and selective reporting. The sponsor did not include these 3 studies in the main analysis of their ITC but did conduct sensitivity analyses that included these 3 trials.
Subgroup data were used from the CEREBEL,19 Ma et al.,38 and SOPHIA44 studies. CEREBEL19 and SOPHIA44 were reported by the sponsor as having a medium risk of bias; while these studies did not have a high risk of bias, the use of subgroup-level data, which could lead to imbalanced between treatment groups, resulted in a classification of a medium risk of bias.
Further details regarding the sponsor’s risk-of-bias assessment are reported subsequently.
Regarding the method of randomization, all studies were categorized by the sponsor as having a low or medium risk of bias; it should be noted that trials that did not report details for methods of randomization were categorized as having a medium risk of bias. Regarding allocation concealment, all but 2 trials, the HER2CLIMB22 trial and a study by Jiang et al.34 (which were double-blind randomized controlled trials that were categorized as having a low risk of bias), had a medium risk of bias, as they were all open label. Some differences in baseline characteristics across trials are noted earlier; the ELTOP,40 GBG-26,33 and PHEREXIA43 trials as well as the study by Ma et al.38 were categorized as having a high risk of bias. The LANTERN,35 TAXHER2,36 and Jiang et al.34 studies did not report baseline characteristics. The following studies reported a high risk of bias for selective reporting, while the remaining all reported a low risk of bias: CEREBEL,19 GBG-26,33 Jiang et al.,34 LANTERN,35 Ma et al.,38 and TAXHER2.36
When assessing whether study populations were representative of other studies, the following studies were considered to have a low risk of bias, as they included patients who had progressed on prior therapy with trastuzumab: ELTOP,40 EGF100151,32 EMILIA,16 GBG-26,33 Jiang et al.,34 LANTERN,35 Martin et al.,42 PHEREXA,43 and TAXHER2.36 Studies that had a medium or high risk of bias included studies that enrolled mixed populations of patients with and without prior treatment with trastuzumab (CEREBEL,19 Ma et al.38), enrolled patients from specific subgroups (i.e., only brain metastases) (LANTERN35), enrolled patients who had received multiple (≥ 2) previous lines of therapy (NALA,41 SOPHIA, HER2CLIMB), and studies that included patients of races that differed from populations in the majority of studies (ELTOP,40 Jiang et al.34).
Studies with a medium or high risk of bias in terms of sample size included those with medium or low sample sizes (ELTOP,40 GBG-26,33 TRAXHER2,36 LANTERN,35 Ma et al.38). As mentioned previously, most studies did not allow for crossover except for the EGF10015,32 EMILIA,16 GBG-26,33 and Jiang et al.34 studies. Specifically, 36% of patients in the EGF100151 trial32 switched from treatment with capecitabine monotherapy to lapatinib plus capecitabine, 27% of patients receiving lapatinib plus capecitabine crossed over to receive T-DM1 in the EMILIA trial,16 and 76% of patients in the capecitabine group switched over to pyrotinib after disease progression. In the GBG-26 trial,33 patients who experienced disease progression were re-randomized to receive third-line therapy with either chemotherapy or chemotherapy combined with trastuzumab or lapatinib; in the trastuzumab plus capecitabine group, 51% of patients received chemotherapy, while 27% of patients in the capecitabine group received chemotherapy plus lapatinib or trastuzumab. Information about treatment crossover was not reported for the TRAXHER236 trial.11
No “other” sources of bias were noted for any trials except for the SOPHIA44 trial, where the sponsor noted that patients could have received the physician’s choice of capecitabine, eribulin, gemcitabine, or vinorelbine to be combined with either margetuximab or trastuzumab, and that approximately 27% of patients received capecitabine.11 Upon review by the CADTH team, it was noted that the proportion of patients who received each type of chemotherapy was similar across both treatment groups in the SOPHIA44 trial.11
Assessment of Proportional Hazards
Progression-Free Survival: Visual inspection of log(-log(Survival)) plots for PFS indicated that the Ma et al.,38 Martin et al.,42 NALA,41 ELTOP,40 and EMILIA16 studies showed deviation of the proportional hazards assumption. Results for significance testing of the proportional hazard assumption for PFS are reported in Table 30. Three studies (Martin et al.,42 NALA,41 and EMILIA,16) showed violation of the proportional hazard assumption.11
Table 30: Significance Tests for the Proportional Hazard Assumption for PFS
Study | Chi-square | df | P value | Treatment 1 | Treatment 2 |
|---|---|---|---|---|---|
Cameron et al. (2008) | 0.78 | 1 | 0.3763 | Capecitabine | Lapatinib + capecitabine |
Jiang et al. (2019) | 0.40 | 1 | 0.5281 | Capecitabine | Pyrotinib + capecitabine |
Ma et al. (2019) | 0.11 | 1 | 0.7387 | Lapatinib + capecitabine | Pyrotinib + capecitabine |
Martin et al. (2013)a | 20.71 | 1 | < 0.0001 | Lapatinib + capecitabine | Neratinib |
Murthy et al. (2019) | 0.27 | 1 | 0.6000 | Trastuzumab + capecitabine | Tucatinib + trastuzumab + capecitabine |
Pivot et al. (2015) | 0.59 | 1 | 0.4408 | Lapatinib + capecitabine | Trastuzumab + capecitabine |
Saura et al. (2019)a | 5.34 | 1 | 0.0209 | Lapatinib + capecitabine | Neratinib + capecitabine |
Takano et al. (2018) | 2.05 | 1 | 0.1524 | Lapatinib + capecitabine | Trastuzumab + capecitabine |
Urruticoechea et al. (2017) | 0.56 | 1 | 0.4548 | Pertuzumab + trastuzumab + capecitabine | Trastuzumab + capecitabine |
Verma et al. (2012)a | 4.52 | 1 | 0.0335 | Lapatinib + capecitabine | T-DM1 |
von Minckwitz et al. (2009) | 2.15 | 1 | 0.1424 | Capecitabine | Trastuzumab + capecitabine |
df = degrees of freedom; PFS = progression-free survival; T-DM1 = trastuzumab emtansine.
aStudies that did not meet the proportional hazard assumption.
Source: Sponsor’s indirect treatment comparison.11
Overall Survival: Visual inspection of log(-log(Survival)) plots for OS by the sponsor suggested that deviation of the proportional hazards assumption was present in the following studies: Martin et al.,42 PHEREXA,43 and Takano et al.40 Results of significance testing for the proportional hazard assumption are reported in Table 31. Only Martin et al.42 showed deviation from the proportional hazard assumption.
Table 31: Significance Tests for the Proportional Hazard Assumption for OS
Study | Chi-square | df | P value | Treatment 1 | Treatment 2 |
|---|---|---|---|---|---|
Cameron et al. (2008); Latimer (2012) | 0.65 | 1 | 0.4216 | Capecitabine | Lapatinib + capecitabine |
Martin et al. (2013)a | 6.65 | 1 | 0.0099 | Lapatinib + capecitabine | Neratinib |
Murthy et al. (2019) | 0.29 | 1 | 0.5929 | Trastuzumab + capecitabine | Tucatinib + trastuzumab + capecitabine |
Pivot et al. (2015) | 0.02 | 1 | 0.9023 | Lapatinib + capecitabine | Trastuzumab + capecitabine |
Saura et al. (2019) | 1.11 | 1 | 0.2925 | Lapatinib + capecitabine | Neratinib + capecitabine |
Takano et al. (2018) | 1.94 | 1 | 0.1631 | Lapatinib + capecitabine | Trastuzumab + capecitabine |
Urruticoechea et al. (2017) | 2.57 | 1 | 0.1090 | Pertuzumab + trastuzumab + capecitabine | Trastuzumab + capecitabine |
Verma et al. (2012); NICE (2016) | 0.21 | 1 | 0.6451 | Lapatinib + capecitabine | T-DM1 |
df = degrees of freedom; NICE = National Institute for Health and Care Excellence; OS = overall survival; T-DM1 = trastuzumab emtansine.
aStudy that did not meet the proportional hazard assumption.
Source: Sponsor’s indirect treatment comparison.11
Progression-Free Survival
The network of evidence for PFS in the NMA is depicted in Figure 15. The sponsor reported that the network for PFS contained minimal information on heterogeneity in the form of 1 closed loop (between the following treatments: capecitabine, lapatinib plus capecitabine, and trastuzumab plus capecitabine) and multiple duplicate comparisons (3 trials that provided information to compare lapatinib plus capecitabine versus trastuzumab plus capecitabine). The node-splitting analysis revealed no significant difference between the direct and indirect evidence for the comparisons within the closed loop containing capecitabine, lapatinib plus capecitabine, and trastuzumab plus capecitabine (P > 0.05). Regarding the 3 trials informing the comparison of lapatinib plus capecitabine and trastuzumab plus capecitabine, the node-splitting analysis did not reveal significant differences between treatments. However, it should be noted that the direct evidence from 1 trial (Takano et al.40) suggested improved efficacy for lapatinib plus capecitabine versus trastuzumab plus capecitabine, whereas the other 2 trials (LANTERN35 and Pivot et al.19) suggested the opposite. Also, the Higgins I2 value was 20.8% and Cochran’s Q value was 1.879 (P = 0.391), suggesting low heterogeneity between the 3 trials.11
Bayesian fixed-effects and random-effects models were conducted and compared. The fixed-effects models indicated convergence while the random-effects models suggested the models had difficulty converging. In addition, the random-effects models showed inconsistency with direct trial data in terms of significant treatment comparisons. The DIC value for the fixed-effects model was lower than the random-effects model (−0.8 versus −0.3, respectively); the difference of 5 points was considered meaningful. Therefore, the fixed-effects Bayesian models were used as the key results of the sponsor’s NMA.11
Figure 15: Network of Evidence for the Primary PFS Hazard Ratio Analysis
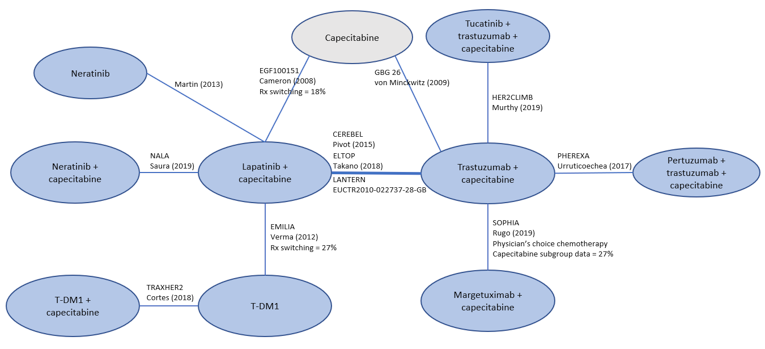
PFS = progression-free survival; Rx = treatment; T-DM1 = trastuzumab emtansine.
Note: Blue ovals indicate treatment of interest; grey ovals indicate common comparator.
Source: Sponsor’s indirect treatment comparison.11
Overall Survival
The network of evidence for OS is depicted in Figure 16. As there were no closed loops, limited information was available for assessment of heterogeneity. Multiple trials (Takano et al.,40 LANTERN,35 Pivot et al.19) were available to inform the HRs for comparisons of lapatinib plus capecitabine and trastuzumab plus capecitabine; there were no indications of significant heterogeneity between treatments. As previously mentioned, direct evidence from the trial by Takano et al.40 suggested improved efficacy of lapatinib plus capecitabine versus trastuzumab plus capecitabine, whereas the other 2 trials (LANTERN35 and Pivot et al.19) suggested the opposite. The I2 value for this comparison was 38.8% with a Cochrane’s Q value of 2.759 (P = 0.252) suggesting a moderate level of heterogeneity between the Takeno et al.,40 LANTERN,35 and Pivot et al.19 trials.
The fixed-effects Bayesian models indicated convergence, and the results from the fixed-effects model were consistent with the direct trial treatment comparisons. The random-effects models suggested that models had difficulty converging and showed inconsistency with direct trial data in terms of significant treatment comparisons. The DIC value for the fixed-effects model was slightly lower than the random-effects model (4.2 versus 4.5, respectively). Therefore, the fixed-effects Bayesian models were used as the key results of the sponsor’s NMA.
Figure 16: Network of Evidence for the Primary OS Hazard Ratio Analysis
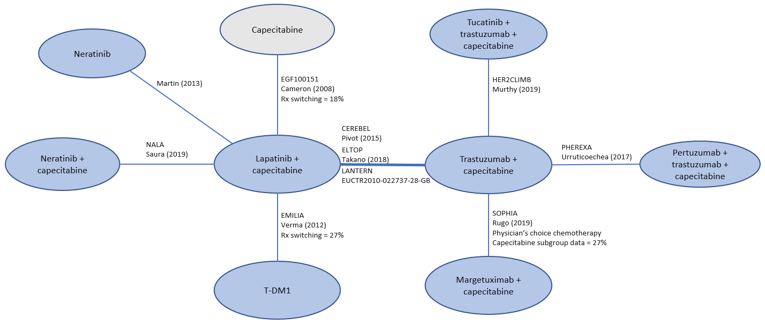
OS = overall survival; Rx = treatment; T-DM1 = trastuzumab emtansine.
Note: Blue ovals indicate treatment of interest; grey ovals indicate common comparator.
Source: Sponsor’s indirect treatment comparison.11
Objective Response Rate
The network of evidence for the analysis of best tumour response is illustrated in Figure 17. There was limited information on heterogeneity in the single closed loop in the network, which consisted of the following treatments: capecitabine, lapatinib plus capecitabine, and trastuzumab plus capecitabine. The node-splitting analysis of inconsistency did not reveal any significant differences (P > 0.05) between the direct or indirect evidence used for the comparisons in the closed loop; therefore, all trials were included in the analysis for best tumour response. There was convergence of Bayesian fixed-effects models, and the results from the fixed-effects models were consistent with the direct evidence from the trials in terms of significant differences in ORR. The Bayesian random-effects models suggested difficulty with convergence, and there was inconsistency between the random-effects models and the direct trial data. The DIC value was slightly higher for the fixed-effects model (DIC = 241.3) compared with the random-effects model (DIC = 241.1), However, due to the inconsistencies of the random-effects model, the fixed-effects Bayesian model was chosen as the primary analysis for ORR.11
Figure 17: Network of Evidence for the Best Tumour-Response Analysis
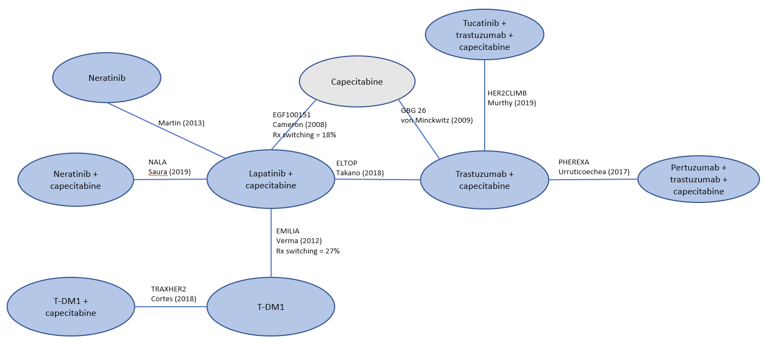
Rx = treatment; T-DM1 = trastuzumab emtansine.
Note: Blue ovals indicate treatment of interest; grey ovals indicate common comparator
Source: Sponsor’s indirect treatment comparison.11
Results
Progression-Free Survival
Primary HR Analysis: The results for the pairwise comparisons of the HR analysis are shown in Figure 18. Results of the pairwise comparisons suggested that the tucatinib-combination treatment was favoured compared with capecitabine monotherapy (HR = 0.33; 95% CrI, 0.23 to 0.47; P < 0.0001), neratinib (HR = 0.47; 95% CrI, 0.30 to 0.71; P = 0.0007), lapatinib plus capecitabine (HR = 0.55; 95% CrI, 0.40 to 0.76; P = 0.0003), trastuzumab plus capecitabine (HR = 0.53; 95% CrI, 0.42 to 0.68; P < 0.0001), and pertuzumab plus trastuzumab plus capecitabine (HR = 0.65; 95% CrI, 0.47 to 0.90; P = 0.0110). No difference was shown between the tucatinib combination and margetuximab plus capecitabine, neratinib plus capecitabine, T-DM1, and T-DM1 plus capecitabine.11
Both the Bayesian and frequentist fixed-effects models were consistent in terms of the results of the treatment comparisons (Figure 19); comparisons of treatments were made against lapatinib plus capecitabine. Both analyses suggested that lapatinib plus capecitabine was favoured over the tucatinib-combination treatment, T-DM1 plus capecitabine, T-DM1, neratinib plus capecitabine.11
Sensitivity Analyses That Included Pyrotinib: When including information from trials that assessed pyrotinib plus capecitabine, the results of the fixed-effects Bayesian models were consistent with the results of the primary analysis of PFS, except that pyrotinib plus capecitabine was favoured compared with the tucatinib-combination treatment (HR = 1.75; 95% CrI, 1.09 to 3; P = 0.0177).11
Figure 18: Pairwise Treatment Comparisons for the Primary PFS Hazard Ratio Analysis
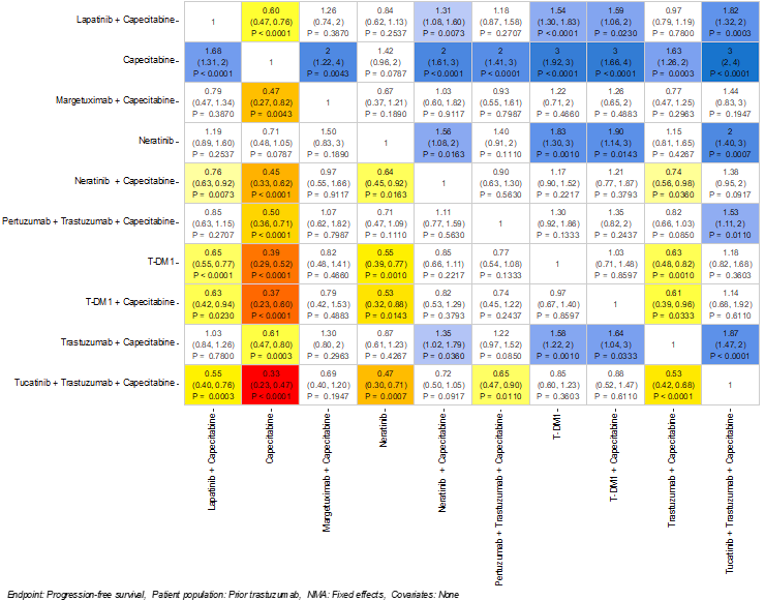
NMA = network meta-analysis; PFS = progression-free survival; T-DM1 = trastuzumab emtansine.
Source: Sponsor’s indirect treatment comparison.11
Figure 19: Bayesian Versus Frequentist Forest Plots for the Primary PFS Hazard Ratio Analysis
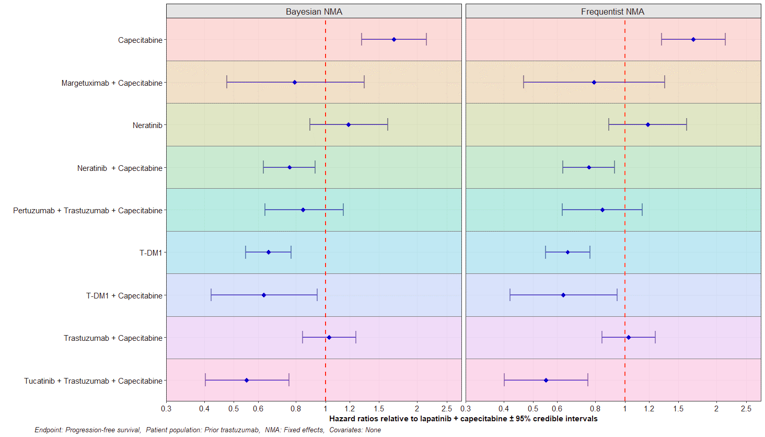
NMA = network meta-analysis; PFS = progression-free survival; T-DM1 = trastuzumab emtansine.
Source: Sponsor’s indirect treatment comparison.11
Overall Survival
The results for the pairwise comparisons of the HR analysis for OS are reported in Figure 20. The results of the pairwise comparisons suggested that the tucatinib-combination treatment was favoured compared with capecitabine monotherapy (HR = 0.45; 95% CrI, 0.27 to 0.77; P < 0.0017), neratinib (HR = 0.47; 95% CrI, 0.27 to 0.80; P = 0.0073), lapatinib plus capecitabine (HR = 0.59; 95% CrI, 0.41 to 0.83; P = 0.0030), and trastuzumab plus capecitabine (HR = 0.66; 95% CrI, 0.50 to 0.88; P = 0.0040). No difference was shown between the tucatinib combination and margetuximab plus capecitabine, neratinib plus capecitabine, pertuzumab plus trastuzumab plus capecitabine, and T-DM1.11
Both the Bayesian and frequentist fixed-effects models were consistent in terms of the results of the treatment comparisons (Figure 21); comparisons of treatments were made against lapatinib plus capecitabine. Both analyses suggested that lapatinib plus capecitabine was favoured over tucatinib-combination treatment, pertuzumab plus trastuzumab plus capecitabine, and T-DM1.11
Sensitivity Analysis Excluding Takano et al.40
After excluding the trial by Takano et al.,40 the results of the fixed-effects Bayesian models were consistent with the results of the primary analysis of OS, which favoured tucatinib-combination therapy over lapatinib plus capecitabine, capecitabine, neratinib, neratinib plus capecitabine, and trastuzumab plus capecitabine.11
Figure 20: Pairwise Treatment Comparisons for the Primary OS Hazard Ratio Analysis
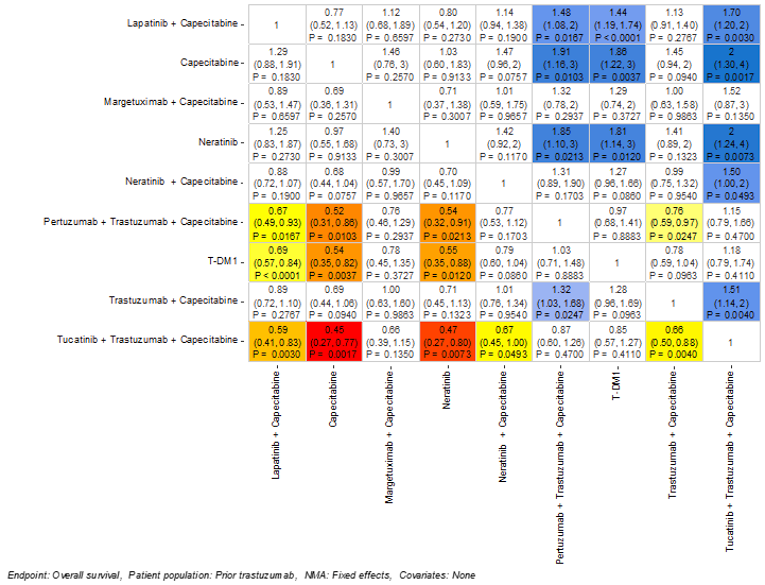
NMA = network meta-analysis; OS = overall survival; T-DM1 = trastuzumab emtansine.
Source: Sponsor’s indirect treatment comparison.11
Figure 21: Bayesian Versus Frequentist Forest Plots for the Primary OS Hazard Ratio Analysis
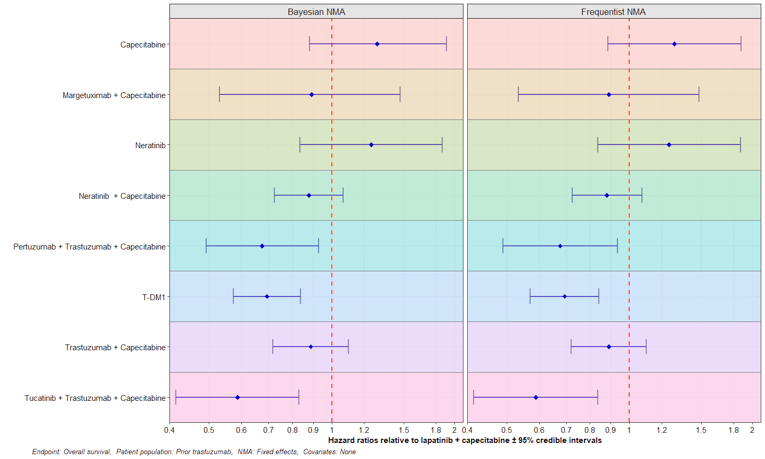
NMA = network meta-analysis; OS = overall survival; T-DM1 = trastuzumab emtansine.
Source: Sponsor’s indirect treatment comparison.11
Objective Response Rate
The probit differences for the pairwise comparisons of ORR are depicted in Figure 22. Tucatinib-combination therapy was favoured over capecitabine (HR = 0.90; 95% CrI, 0.48 to 1.31; P < 0.0001), neratinib (HR = 0.82; 95% CrI, 0.29 to 1.33; P = 0.0010), and trastuzumab plus capecitabine (HR = 0.39; 95% CrI, 0.18 to 0.60; P = 0.003). There were no differences between tucatinib-combination therapy and lapatinib plus capecitabine, neratinib plus capecitabine, pertuzumab plus trastuzumab plus capecitabine, T-DM1, and T-DM1 plus capecitabine.11
Both the Bayesian and frequentist fixed-effects models were consistent with the results of the treatment comparisons (Figure 24); comparisons of treatments were made against lapatinib plus capecitabine. Both analyses suggested that lapatinib plus capecitabine was favoured over capecitabine or neratinib, but that T-DM1 and T-DM1 plus capecitabine were favoured over lapatinib plus capecitabine.11
Figure 22: Pairwise Treatment Comparisons for ORR
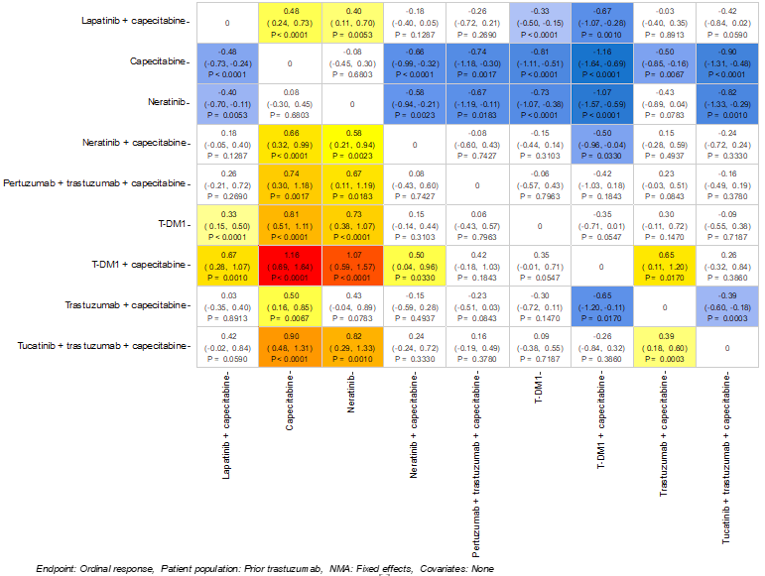
NMA = network meta-analysis; ORR = objective response rate; T-DM1 = trastuzumab emtansine.
Note: Probit differences for all pairwise comparisons: Bayesian NMA.
Source: Sponsor’s indirect treatment comparison.11
Figure 23: Predicted Response Rates by Category for the Best Tumour Response
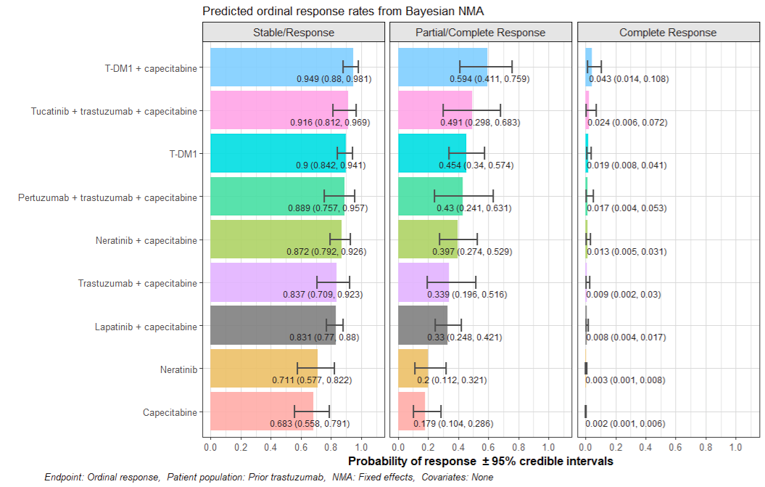
NMA = network meta-analysis; T-DM1 = trastuzumab emtansine.
Source: Sponsor’s indirect treatment comparison.11
Figure 24: Bayesian Versus Frequentist Forest Plots for the Best Tumour-Response Analysis
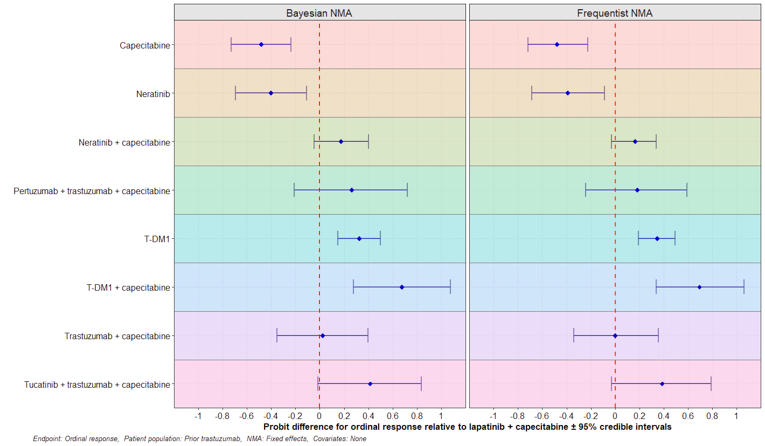
NMA = network meta-analysis; T-DM1 = trastuzumab emtansine.
Source: Sponsor’s indirect treatment comparison.11
Critical Appraisal of the ITC
The ITC included both randomized phase II and III trials. Phase II trials are typically not powered for hypothesis testing, for example, 2 trials included only 14 and 16 patients, respectively. Small sample sizes may affect the precision of treatment effect estimates. The inclusion of phase II trials may have added uncertainty in the comparison of treatment effect despite the fact these trials would have broadened the evidence base and perhaps strengthened the network of trials included in this ITC.
Treatment crossover was also reported for some trials, which may have biased the efficacy analyses of these trials. Treatment crossover, if due to lack of efficacy of the assigned treatment or disease progression, would most likely have created bias against investigational treatments, particularly in terms of OS; however, it may not bias the estimates of PFS. The patient population in the trials varied in terms of line of therapy. Patients receiving treatment in later lines of therapy were likely to have worse prognoses or to be more difficult to treat compared with patients in earlier lines of therapy (i.e., first or second line). The heterogeneity of the study patient populations resulted in significantly incomparable proportions of patients in terms of ECOG PS status (1 or greater), brain metastasis, and varied degrees of hormone receptor status (estrogen receptor–positive and/or progesterone receptor–positive). These all increased the difficulty of assessing the validity of ITC results.
The sponsor indicated there may be effect modifiers that could affect the ITC’s efficacy comparisons, including prior exposure to treatments, line of therapy, and presence of brain metastases. For all 3 potential effect modifiers, the sponsor considered it unnecessary to perform a meta-regression due to the lack of available data to provide reliable estimates. The lack of adjustment for effect modifiers was considered to introduce bias into the NMA analyses, as there was heterogeneity in the patient populations that was not accounted for and resulted in patient populations that were not comparable. However, due to the minimal amount of data available for exploration of bias, any additional analyses might also have raised other concerns about statistical integrity.
The trials included in the ITC were published between 2008 to 2020. The clinical experts consulting with CADTH for this review highlighted the complex and diverse treatment paradigms for patients with metastatic HER2-positive breast cancer who have received prior treatments. In addition, they acknowledged that new therapies have been introduced that have altered the treatment pathways for patients and, ultimately, the outcomes of patients who were advancing through the health care systems. It is unclear how these evolving differences over the past decades may have affected treatment comparisons in the network.
The studies included in the network involved mostly White patients. Three studies enrolled only Chinese34,38 or Japanese40 patients. These 3 studies were not included in the main analysis for the ITC; however, sensitivity analyses that included these 3 trials showed the results were consistent with the main analyses for PFS and OS.
The risk-of-bias assessment conducted by the sponsor classified 3 trials19,38,44 as having a medium level of bias, while the trials themselves did not reveal any significant sources of bias. However, these trials relied on the use of subgroup-level data only, which could have resulted in an imbalance in patient characteristics between treatment groups. For the PFS and ORR end points, evaluations by independent review committees or by central assessment were preferred, particularly when all of the included trials except for 1 had an open-label design. However, 4 studies assessed ORR via individual investigator assessment and 7 assessed for PFS. This may have biased the assessment in favour of the study treatment in these trials.
The sponsor conducted an assessment of the proportional hazard assumption in each trial. For PFS, 3 studies16,40,42 revealed a violation of the proportional hazard assumption, and 1 trial42 revealed a violation of the proportional hazard assumption in the analysis of OS. Regarding OS, only 1 trial demonstrated a violation of the proportional hazard assumption. The proportional hazard assumption is important for Cox proportional hazards models, which were used in the analyses of PFS and OS across the trials. The violation of the proportional hazard assumption is expected to impact the analyses of PFS more so than the analyses of OS, as there were greater examples of trials with a violation of the proportional hazard assumption among the trials included in the network of PFS. The sponsor conducted NMAs based on HRs and based on the fractional polynomial method and compared results for consistency.
For the NMAs, the sponsor explored the use of both fixed-effects and random-effects models. It was acknowledged that a fixed-effects model would likely underestimate the error, while a random-effects model might overestimate the error, and that the true values may likely be somewhere in between the results of these 2 models. In fact, more significant differences were found for the fixed-effects models than for the random-effects models, mainly due to insufficient data in the network. For PFS, OS, and ORR, the fixed-effects models exhibited convergence; meanwhile, the random-effects models showed examples of peaks in the iteration plots that suggested difficulties with convergence. In addition, the DIC values were lower (i.e., better) for the fixed-effects models for PFS and OS compared with the random-effects models for the same end points. For ORR, the DIC value was nearly the same for the fixed-effects model compared with the random-effects model (241.3 versus 241.1, respectively); however, due to the inconsistencies of the random-effects model, the fixed-effects model was considered appropriate for analyses of ORR. Based on the CADTH review, the choice to use fixed-effects over random-effects models was considered appropriate, given the improved model convergence and consistency versus the random-effects models.
Patients in most trials were required to have previous treatment with trastuzumab; thus, most trials reported nearly 100% of patients with exposure to trastuzumab. This aligned with the funding request for this review of tucatinib, as patients were also required to have previous exposure to trastuzumab. Overall, the sponsor’s ITC included most of the relevant treatments available in Canadian clinical practice. However, other treatments that could be administered to patients were noted to be missing from the ITC, including regimens that include chemotherapies other than capecitabine (i.e., vinorelbine, carboplatin, paclitaxel) as well as endocrine therapies (i.e., fulvestrant, tamoxifen, aromatase inhibitors). While the frequency of treatments involving only chemotherapy or endocrine therapy is expected to be less than other regimens, they remain options for patients.
Additional end points such as safety or quality of life were not considered in the sponsor’s ITC. It is expected the lack of comparisons for HRQoL end points was due mainly to the lack of available data, as some trials included in the analysis were published when collecting such information was not standard. However, without comparisons of safety data, it is not possible to confidently estimate how the harms of each treatment that would impact patients’ outcomes and choice of therapy.
Summary
One ITC submitted by the sponsor was summarized and appraised. The results of this ITC indicated that treatment with tucatinib plus trastuzumab and capecitabine was favoured when compared with capecitabine, neratinib, lapatinib plus capecitabine, trastuzumab plus capecitabine, and pertuzumab plus trastuzumab plus capecitabine when considering PFS. When considering OS, tucatinib-combination therapy was favoured over capecitabine monotherapy, neratinib, lapatinib plus capecitabine, and trastuzumab plus capecitabine. Regarding ORR, tucatinib-combination therapy was favoured over capecitabine, neratinib, and trastuzumab plus capecitabine. Due to the sparse network, considerable heterogeneity, and the limitations of the methods for analyses, the true magnitude of relative treatment effects is not certain. However, based on the opinions of the clinical experts consulting with CADTH, the overall directions of effects may be reliable. No analyses were conducted that compared the harms and HRQoL for patients treated with tucatinib-combination therapy versus the relevant comparator treatments.
Other Relevant Evidence
This section includes submitted long-term extension studies and additional relevant studies included in the sponsor’s submission to CADTH that were considered to address important gaps in the evidence included in the systematic review.
Other Studies: Efficacy in Patients With Brain Metastases, Study by Lin et al.
The publication by Lin et al.12 reported exploratory analyses of intracranial efficacy and survival in patients with brain metastases derived from the pivotal HER2CLIMB study. This study has been summarized to provide additional evidence on the impact of tucatinib on intracranial efficacy and survival in patients with brain metastases who were randomized in the HER2CLIMB trial.
Methods
The design of the HER2CLIMB trial has been described earlier in this report. Randomization was stratified by the presence or absence of brain metastases, in addition to ECOG PS score and geographic region. Brain metastases were identified at baseline using MRI and were classified as follows:
treated and stable (prior local treatment and no evidence of progression at baseline brain MRI, including patients treated during the screening period)
treated and progressing (prior local treatment but evidence of progression of existing lesions, new lesions, or untreated lesions remaining after prior treatment at baseline brain MRI)
untreated (no prior local treatment).
Treatment with dexamethasone (up to 2 mg per day) was permitted for patients with brain metastases to control symptoms of brain metastases.
Populations
Patients with untreated brain lesions greater than 2 cm were able to enrol in the HER2CLIMB trial if immediate local therapy was not required, although these patients could enrol after receiving radiation therapy or surgery and after a washout period. These patients were subsequently classified as treated and stable.
Patients were excluded if they had leptomeningeal disease.
A summary of baseline characteristics for patients with brain metastases included in the Lin et al. study is provided in Table 32. The majority of patients were older than 65 years (83.5%) and female (99.3%); 60.8% resided in North America and 93.9% had non-CNS metastatic disease. Regarding ECOG PS, 44.7% of patients had a score of 0 and 55.3% had a score of 1, while 57.0% of patients were hormone receptor–positive. The brain metastasis treatment status at baseline was treated and stable, treated and progressing, or untreated for 40.2%, 37.1%, and 22.7% of patients, respectively. Most patients (70.1%) had prior radiation therapy for brain metastases, 41.9% had whole-brain radiation therapy, 42.6% had targeted radiation therapy, and 15.8% had surgery. In addition, the median number of months from the diagnosis of metastatic disease to the development of brain metastases was 13.0 (range, < 0.1 to 100.7) for the tucatinib-combination treatment group and 9.8 (range, < 0.1 to 172.7) for the placebo-combination treatment group.
The baseline characteristics of the treatment groups were well balanced with the exception of the proportion of patients who were hormone receptor–positive (54.0% in the tucatinib-combination group versus 63.4% in the placebo-combination group), patients with an ECOG PS score of 1 (53.5% in the tucatinib-combination group versus 59.1% in the placebo-combination group), history of prior targeted radiation therapy (46.5% in the tucatinib-combination group versus 34.4% in the placebo-combination group).
Table 32: Baseline Characteristics for Patients with Brain Metastases in HER2CLIMB
Characteristic | Tucatinib-combination group, N = 198 | Placebo-combination group, N = 93 |
|---|---|---|
Age, median (range) | 53 (22 to 75) | 52 (25 to 75) |
< 65, n (%) | 166 (83.8) | 77 (82.8) |
≥ 65, n (%) | 32 (16.2) | 16 (17.2) |
Sex, n (%) female | 197 (99.5) | 92 (98.9) |
Geographic region, n (%) | ||
North America (US and Canada) | 116 (58.6) | 61 (65.6) |
Rest of the world | 82 (41.4) | 32 (34.4) |
ECOG PS score, n (%) | ||
0 | 92 (46.5) | 38 (40.9) |
1 | 106 (53.5) | 55 (59.1) |
Histology, n (%) | ||
Estrogen and/or progesterone receptor–positive | 107 (54.0) | 59 (63.4) |
Estrogen and progesterone receptor–negative | 88 (44.4) | 34 (36.6) |
Metastatic at initial diagnosis, n (%) | 77 (38.9) | 39 (41.9) |
Non-CNS metastatic disease, n (%) | 192 (97.0) | 90 (96.8) |
Brain metastasis treatment status at baseline, n (%) | ||
Treated and stable | 80 (40.4) | 37 (39.8) |
Treated and progressing | 74 (37.4) | 34 (36.6) |
Untreated | 44 (22.2) | 22 (23.7) |
Prior therapy for brain metastases, n (%) | ||
Radiation therapy | 140 (70.7) | 64 (68.8) |
WBRT | 77 (38.9) | 45 (48.4) |
Targeted radiation therapy | 92 (46.5) | 32 (34.4) |
Surgery | 33 (16.7) | 13 (14.0) |
Number of months from diagnosis of metastatic disease to development of brain metastases, median (range) | 13.0 (< 0.1 to 100.7) | 9.8 (< 0.1 to 172.7) |
Number of months from first diagnosis of brain metastases to study enrolment, median (range) | 15.8 (1.1 to 169.2) | 14.5 (0.5 to 99.3) |
ECOG = Eastern Cooperative Oncology Group; PS = performance status; WBRT = whole-brain radiation therapy.
Source: Lin (2020).12
Interventions
The interventions for the HER2CLIMB study have been described previously. Briefly, patients were randomized to receive tucatinib or placebo. Both were used in combination with trastuzumab and capecitabine.
Outcomes
Disease response and progression in the brain were evaluated using the RECIST 1.1 guidelines and assessed by the study investigator. Two exploratory end points, confirmed intracranial ORR (ORR-IC) and duration of intracranial response (DOR-IC), were reported in patients with measurable intracranial lesions at baseline and CNS-PFS. CNS-PFS was defined as time from randomization to disease progression in the brain or death resulting from any cause, whichever occurred first. DOR-IC was defined as the time from the first intracranial objective response (confirmed complete or partial) to documented intracranial disease progression or death resulting from any cause, whichever occurred first. CNS-PFS and OS were also reported.
Statistical Analysis
CNS-PFS, OS, and time to second progression were estimated using Kaplan–Meier curves and 95% CIs. A stratified Cox proportional hazards model was used to estimate HRs and 95% CIs for CNS-PFS and OS. An unstratified Cox proportional hazards model was used for the time to second progression.
All reported P values were nominal and obtained from a stratified log-rank test.
A between-group comparison of ORR-IC was analyzed using a 2-sided Cochran-Mantel-Haenszel test controlled for the stratification factors (presence or absence of brain metastases, in addition to ECOG PS score and geographic region). Kaplan–Meier estimates of median DOR-IC were also provided using methods similar to the analysis of PFS used for the DOR-IC analysis.
Patient Disposition
Patient disposition for the HER2CLIMB trial is summarized in Figure 25. A total of 612 patients were enrolled in the HER2CLIMB trial, 291 (48%) of whom had brain metastases at baseline or a history of brain metastases. The 281 patients with brain metastases were included in the exploratory analyses reported by Lin et al. A total of 198 patients randomized to the tucatinib combination and 93 patients randomized to the placebo combination had brain metastases. No additional information was provided for patient disposition.
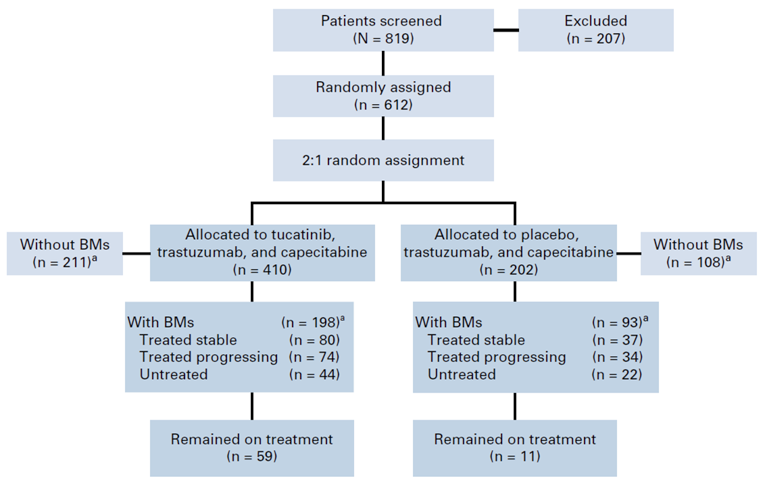
Exposure to Study Treatments
Exposure to treatment was not reported.
Efficacy
CNS-PFS and OS
A summary of results for 1-year CNS-PFS and OS in patients with brain metastases is provided in Table 33. Kaplan–Meier curves for all patients with brain metastases (Figure 26), patients with active brain metastases (Figure 27), and patients with stable brain metastases (Figure 28) have also been provided. For patients treated with the tucatinib combination, 40.2% (95% CI, 29.5 to 50.6) of patients with brain metastases, 35.0% (95% CI, 23.2 to 47.0) of patients with active brain metastases, and 53.3% (95% CI, 31.4 to 71.0) of patients with stable brain metastases had CNS-PFS at 1 year. None of the patients receiving the placebo combination had CNS-PFS at 1 year. An HR of 0.32 (95% CI, 0.22 to 0.48) was reported for the tucatinib combination compared with the placebo combination in all patients with brain metastases. Similar results were reported for patients with active brain metastases (HR = 0.36; 95% CI, 0.22 to 0.57) and patients with stable brain metastases (HR = 0.31; 95% CI, 0.14 to 0.67).
Among all patients with brain metastases, 1-year OS was reported for 70.1% (95% CI, 62.1 to 76.7) of patients in the tucatinib-combination treatment group and 46.7% (95% CI, 33.9 to 58.4) of patients in the placebo-combination treatment group. For patients with active brain metastases, 1-year OS was reported for 71.7% (95% CI, 61.4 to 79.7) and 41.1% (95% CI, 25.5 to 56.1) of patients randomized to the tucatinib-combination and placebo-combination groups, respectively. For patients with stable brain metastases, 1-year OS was reported for 67.6% (95% CI, 53.8 to 78.0) and 55.6% (95% CI, 34.1 to 72.6) of patients randomized to tucatinib-combination and placebo-combination treatment, respectively. This data for 1-year OS corresponded to an HR of 0.58 (95% CI, 0.40 to 0.85) for all patients with brain metastases, 0.49 (95% CI, 0.30 to 0.80) for patients with active brain metastases, and 0.88 (95% CI, 0.45 to 1.70) for patients with stable brain metastases.
Table 33: One-Year CNS-PFS and OS for Patients With Brain Metastases (All, Active, Stable)
One-year CNS-PFS and OS | Tucatinib-combination group N = 198 | Placebo-combination group N = 93 |
|---|---|---|
One-year CNS-PFSa | ||
All patients with brain metastases | ||
One-year CNS-PFS, % (95% CI) | 40.2 (29.5 to 50.6) | 0 |
Hazard ratio (95% CI), P value | 0.32 (0.22 to 0.48), P < 0.0001 | |
Duration (months) of CNS-PFS, median (95% CI) | 9.9 (8.0 to 13.9) | 4.2 (3.6 to 5.7) |
Patients with active brain metastases | ||
One-year CNS-PFS, % (95% CI) | 35.0 (23.2 to 47.0) | 0 |
Hazard ratio (95% CI), P value | 0.36 (0.22 to 0.57), P < 0.0001 | |
Duration (months) of CNS-PFS, median (95% CI) | 9.5 (7.5 to 11.1) | 4.1 (2.9 to 5.6) |
Patients with stable brain metastases | ||
One-year CNS-PFS, % (95% CI) | 53.3 (31.4 to 71.0) | 0 |
Hazard ratio (95% CI), P value | 0.31 (0.14 to 0.67), P = 0.002 | |
Duration (months) of CNS-PFS, median (95% CI) | 13.9 (9.7 to 32.2) | 5.6 (3.0 to 9.5) |
One-year OSa | ||
All patients with brain metastases | ||
One-year OS, % (95% CI) | 70.1 (62.1 to 76.7) | 46.7 (33.9 to 58.4) |
Hazard ratio (95% CI), P value | 0.58 (0.40 to 0.85), P = 0.005 | |
Time (months) to all-cause death, median (95% CI) | 18.1 (15.5 to not estimable) | 12.0 (11.2 to 15.2) |
Patients with active brain metastases | ||
One-year OS, % (95% CI) | 71.7 (61.4 to 79.7) | 41.1 (25.5 to 56.1) |
Hazard ratio (95% CI), P value | 0.49 (0.30 to 0.80), P = 0.004 | |
Time (months) to all-cause death, median (95% CI) | 20.7 (15.1 to not estimable) | 11.6 (10.5 to 13.8) |
Patients with stable brain metastases | ||
One-year OS, % (95% CI) | 67.6 (53.8 to 78.0) | 55.6 (34.1 to 72.6) |
Hazard ratio (95% CI), P value | 0.88 (0.45 to 1.70), P = 0.696 | |
Time (months) to all-cause death, median (95% CI) | 15.7 (13.8 to not estimable) | 13.6 (10.2 to 22.0) |
CI = confidence interval; CNS = central nervous system; OS = overall survival; PFS = progression-free survival.
aAll patients with brain metastases, active brain metastases, or stable brain metastases.
Source: Lin et al. (2020).12
Figure 26: Kaplan–Meier Curves for All Patients With Brain Metastases
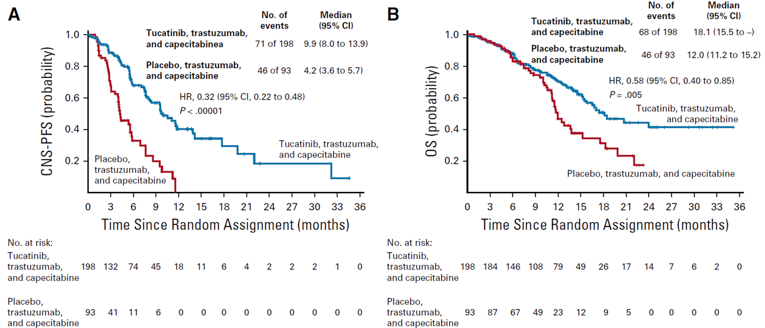
CI = confidence interval; CNS = central nervous system; HR = hazard ratio; OS = overall survival; PFS = progression-free survival.
Source: Lin et al. (2020).12
Figure 27: Kaplan–Meier Curves for Patients With Active Brain Metastases
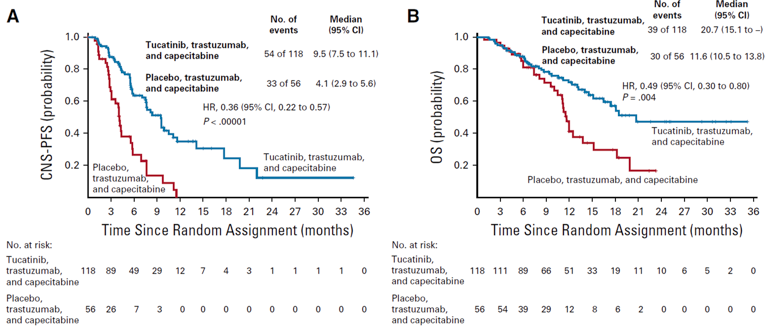
CI = confidence interval; CNS = central nervous system; HR = hazard ratio; OS = overall survival; PFS = progression-free survival.
Source: Lin et al. (2020).12
Figure 28: Kaplan–Meier Curves for Patients With Stable Brain Metastases
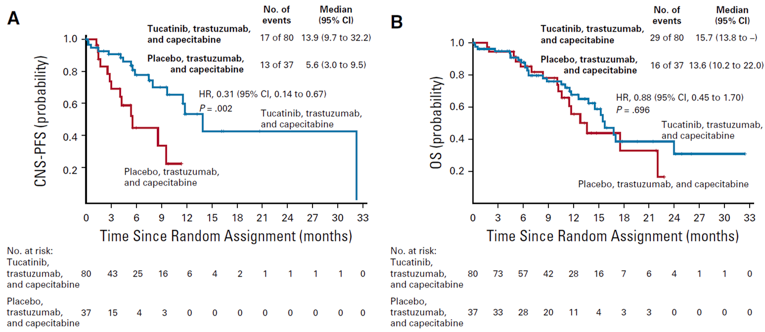
CI = confidence interval; CNS = central nervous system; HR = hazard ratio; OS = overall survival; PFS = progression-free survival.
Source: Lin et al. (2020).12
Intracranial Response
Outcomes related to intracranial response in patients with active brain metastases who had a measurable intracranial lesion at baseline are summarized in Table 34. A total of 55 patients in the tucatinib-combination treatment group and 20 patients in the placebo-combination treatment group were included in this assessment. The best overall intracranial response was stable disease for 43.6% of patients in the tucatinib-combination treatment group and 80.0% of patients in the placebo-combination treatment group, and partial disease for 41.8% and 15.0% of patients receiving tucatinib-combination and placebo-combination treatment, respectively. Complete response was reported for 5.5% and 5.0% of patients receiving tucatinib-combination and placebo-combination therapy, respectively. Progressive disease was reported for 3.6% of patients in the tucatinib-combination treatment group and 0 patients in the placebo-combination treatment group. The ORR-IC was 47.3% (95% CI, 33.7 to 61.2) for tucatinib-combination and 20.0% (95% CI, 5.7 to 43.7) for placebo-combination treatment. Additionally, the DOR-IC was 6.8 months (95% CI, 5.5 to 16.5) for patients receiving tucatinib-combination and 3.0 (95% CI, 3.0 to 10.3) for patients receiving placebo-combination treatment.
Table 34: Intracranial Response in Patients With Active Brain Metastases and Measurable Intracranial Lesions at Baseline
Intracranial response | Tucatinib-combination group N = 55 | Placebo-combination group N = 20 |
|---|---|---|
Best overall intracranial response, n (%) | ||
Complete response | 3 (5.5) | 1 (5.0) |
Partial response | 23 (41.8) | 3 (15.0) |
Stable disease | 24 (43.6) | 16 (80.0) |
Progressive disease | 2 (3.6) | 0 |
Not availablea | 3 (5.5) | 0 |
Objective response of confirmed complete response or partial response | 26 | 4 |
ORR-IC, % (95% CI) | 47.3 (33.7 to 61.2) | 20.0 (5.7 to 43.7) |
Stratified P | 0.03 | |
DOR-IC, number of months (95% CI) | 6.8 (5.5 to 16.4) | 3.0 (3.0 to 10.3) |
CI = confidence interval; DOR-IC = duration of intracranial response; ORR-IC = confirmed intracranial objective response rate
aPatients with no post-baseline response assessments.
Source: Lin et al. (2020).12
Harms
Safety outcomes were not assessed in this study.
Critical Appraisal
Internal Validity
Patients in the HER2CLIMB trial were stratified by the presence or absence of brain metastases during randomization. Details regarding the disposition of patients with brain metastases were limited and did not provide information on reasons for or timing of discontinuation from treatment. The treatment groups were well balanced by baseline characteristics with the exception of the proportion of patients who were hormone receptor–positive and with a history of prior targeted radiation therapy, which was more common among patients in the tucatinib-combination treatment group. Breast cancer that is hormone receptor–positive may be associated with a better prognosis than hormone receptor–negative cancers,45 which may bias the results for PFS and OS against the tucatinib-combination group. Additionally, a greater proportion of patients had received prior targeted radiation therapy in the tucatinib-combination treatment group, which may also indicate bias against that group. The analyses summarized by Lin et al. were exploratory and all reported P values were nominal. As a result, none of the statistical tests could be interpreted as statistically significant. Lastly, CNS target lesions were assessed by the investigator and not externally validated.
External Validity
Issues of generalizability for the overall HER2CLIMB study also apply to the exploratory analyses described here. Based on feedback from the clinical experts, the baseline characteristics of the subset of patients with HER2-positive advanced breast cancer from HER2CLIMB included in these analyses are representative of patients living in Canada. Of note, this study was specific to patients with brain lesions; these were identified using MRI, which is consistent with Canadian clinical practice. The intervention, tucatinib or placebo, used in combination with trastuzumab and capecitabine, was aligned with the Health Canada indication. Trastuzumab was available for administration intravenously or subcutaneously; however, the Lin et al. study did not provide this level of detail for patients in the post-hoc analyses. The clinical experts stated that radiation or surgery are typically preferentially chosen for the treatment of patients with brain lesions before initiating any systemic therapies. This is consistent with the prior therapy used by patients with brain metastases included in this study. The key outcomes included in the Lin et al. study, PFS and OS, were identified by the clinical experts consulting with CADTH as being important to patients.
Discussion
Summary of Available Evidence
One multi-centre, multinational, double-blind, randomized controlled phase II trial met the criteria for the CADTH systematic review. A total of 410 patients were randomized into the tucatinib-combination group of the HER2CLIMB trial, and 202 patients were randomized into the placebo-combination group. Enrolled patients included adults with histologically confirmed HER2-positive advanced breast cancer, confirmed via IHC, ISH, or FISH methodology, who had received prior treatment with trastuzumab, pertuzumab, and T-DM1. Treatment was continued until disease progression, unacceptable toxicity, withdrawal of consent, initiation of subsequent anti-cancer therapy, or death. The primary outcome of the trial was PFS, and key secondary outcomes included PFSBM and OS. ORR, DOR, and HRQoL were included as exploratory end points. Baseline characteristics were similar across both treatment groups. In the ITT population, patients had a mean age of 54 years, were mostly (> 80%) younger than 65 years of age, were from the US (54%) or the rest of the world (46%), and had an ECOG PS of 0 (48%) or 1 (52%). Approximately 48% of patients reported the presence of brain metastases; all patients reported having previously received trastuzumab and T-DM1, and nearly all patients (> 99%) reported having previously received pertuzumab.7
In addition to the systematic review, an exploratory analysis of intracranial efficacy among patients with brain metastases12 and 1 sponsor-submitted ITC were summarized and appraised for this review.11
Interpretation of Results
Efficacy
The results of the HER2CLIMB trial demonstrated statistically significant improvement in PFS and OS with tucatinib-combination therapy compared with placebo-combination therapy. Other secondary end points, including ORR, also favoured treatment with tucatinib-combination therapy compared with the placebo-combination group. The sponsor conducted a post-hoc analysis of the HER2CLIMB trial that did not formally test primary and key secondary end points (PFS and OS), and the results of this analysis are considered descriptive. However, the results of the post-hoc analysis, which provided an additional 15.6 months of follow-up, continued to show improved efficacy in the tucatinib-combination group versus the placebo-combination group.
Clinician and patient groups highlighted that treatments with improved efficacy are needed for patients with brain metastases. Tucatinib-combination therapy addresses an important unmet need among this subgroup of patients, as patients with brain metastases have been typically excluded from clinical trials and have limited effective treatment options available to them. HER2CLIMB demonstrated statistically significant improvement in PFSBM, which indicated longer PFS among the subgroup of patients with brain metastases when treated with tucatinib-combination therapy compared with placebo-combination therapy. In addition, an exploratory analysis of intracranial efficacy and survival among patients with brain metastases was reported for the HER2CLIMB trial; the results of the exploratory analyses were not powered and are considered descriptive. The results of the exploratory analysis demonstrated improved rates of CNS-PFS and OS in the tucatinib-combination group compared with the placebo-combination group.
Quality of life was also highlighted as an important outcome and treatment goal by patient and clinician groups. The HRQoL analyses in the HER2CLIMB trial were summarized by treatment group at baseline and at follow-up time points. No differences in HRQoL, as measured using the EQ-5D-5L, were observed between the tucatinib- and placebo-combination groups of the HER2CLIMB trial, suggesting that HRQoL was maintained in both treatment groups.
The comparator in the HER2CLIMB trial was trastuzumab plus capecitabine; this treatment combination was chosen as the comparator based on evidence from the CEREBEL trial, which compared lapatinib plus capecitabine with trastuzumab plus capecitabine; that trial was inconclusive and did not detect any statistically significant differences between treatment groups. Clinical experts consulted by CADTH identified that, while trastuzumab plus capecitabine was chosen as the comparator for the HER2CLIMB trial, lapatinib plus capecitabine may also be a relevant comparator for tucatinib-combination therapy.
Indirect Treatment Comparisons
No direct evidence currently exists comparing tucatinib-combination therapy with relevant comparators, such as T-DM1 or lapatinib plus capecitabine. However, the sponsor provided an ITC that included comparisons of tucatinib in combination with trastuzumab and capecitabine versus lapatinib plus capecitabine, margetuximab plus capecitabine, neratinib, neratinib plus capecitabine, pertuzumab plus trastuzumab and capecitabine, trastuzumab plus capecitabine, capecitabine, T-DM1, and T-DM1 plus capecitabine. The results of the ITC favoured treatment with tucatinib-combination therapy compared with capecitabine, neratinib, lapatinib plus capecitabine, and trastuzumab plus capecitabine when considering both PFS and OS. It should be noted that, without direct evidence, it is not possible to know with certainty the comparative efficacy of 2 treatments. Trastuzumab plus capecitabine is a relevant comparator for patients in this treatment setting, but the relative efficacy and toxicity of tucatinib-combination therapy versus other relevant comparators is unknown. The sponsor’s ITC also included a number of sources of bias, including differences in trial characteristics, differences in patient characteristics, limitations of the methods for the analyses, and violation of the proportional hazard assumption, which may have affected the PFS analyses more than the OS analyses. The magnitude of the relative efficacy of tucatinib-combination therapy relative to important comparators is not clear, as the results of the ITC may be both underestimating and overestimating relative treatment effects. However, the clinicians consulting with CADTH suggested that the directions of effect determined by the sponsor’s ITC may be reliable. However, the results of the sponsor’s ITC should be interpreted with caution.
Harms
Almost all patients in the tucatinib- and placebo-combination groups experienced at least 1 AE (99% versus 97%, respectively). Frequently reported AEs included gastrointestinal, liver, skin, and renal disorders, all of which were reported more frequently in the tucatinib-combination group than in the placebo-combination group. Input from patient groups identified the following AEs as being the most common among patients who had received tucatinib: diarrhea, decreased appetite, fatigue, nausea, hand-foot syndrome, and an itchy rash. Reporting of these AEs from patient groups aligns with the AEs observed in the HER2CLIMB; the most common AEs of any grade reported in both the tucatinib-combination group and placebo-combination group were diarrhea (81% versus 53%), hand-foot syndrome (63% versus 53%), nausea (58% versus 44%), fatigue (45% versus 25%), and vomiting (36% versus 25%).
Reduced treatment toxicity and reduced side effects were also acknowledged as important treatment goals by clinicians and patient groups. Patients with metastatic disease have a low likelihood of being cured and have poor clinical prognoses, making treatments with superior toxicity profiles an important treatment consideration for patients. In general, specific AEs were reported more often in the tucatinib-combination group than in the placebo-combination group. However, most AEs were reported to be grade 1 or 2 and easily manageable. Treatment discontinuations due to AEs were also reported infrequently among both treatment groups in the HER2CLIMB trial (6% patients in the tucatinib-combination group and 3% in the placebo-combination group); however, dose reductions and dose holds among patients due to AEs were reported more commonly than treatment discontinuations. It is worth noting that tucatinib-combination therapy may be associated with toxicities that may require additional monitoring by clinicians, but that most side effects may be manageable. Specifically, input on behalf of patient groups identified a total of 8 patients with direct experience with tucatinib who reported the side effects of tucatinib to be generally manageable, and that they were able to maintain their quality of life and continue with daily living.
The sponsor’s ITC did not conduct comparisons of safety or quality of life, so it was not possible to discuss the relative toxicities of tucatinib-combination therapy with other comparators.
Conclusions
The results of a randomized phase II trial demonstrated significant improvement in PFS and OS. In particular, the improvement was observed in PFS among a subgroup of patients with brain metastases, a group of patients with limited effective treatment options available. HRQoL outcomes were reported to be important for patients; however, there were no differences observed. Despite the limitation of an early clinical development phase, the available evidence supports the comparative efficacy of tucatinib-combination therapy over trastuzumab plus capecitabine alone in the treatment of patients who are often difficult to treat if following the current treatment pathway in Canadian practice. There is a lack of evidence on the comparative effectiveness of other alternative therapies. One sponsor-submitted ITC suggested that tucatinib-combination therapy may be more efficacious than capecitabine alone, neratinib, lapatinib plus capecitabine, and trastuzumab plus capecitabine. However, the ITC had significant limitations that introduced uncertainty about the overall results. Specifically, the sponsor’s ITC included studies that reported differences in trial characteristics, differences in patient characteristics, lack of adjustment for relevant effect modifiers (e.g., prior exposure to treatments, line of therapy, and presence of brain metastases), and violation of the proportional hazard assumption, in particular, for PFS. While biases introduced in the sponsor’s ITC may introduce uncertainty in the magnitude of the estimates between treatments, the overall direction of estimates was considered reliable. Specific AEs were reported more frequently in the tucatinib-combination group, even though the overall AEs appeared to be similar based on the most updated results. Further study of AEs or SAEs may be required.
References
1.Brenner DR, Weir HK, Demers AA, et al. Projected estimates of cancer in Canada in 2020. Can Med Assoc J. 2020;192(9):E199-E205. PubMed
2.Tukysa (tucatinib): 50 mg and 150 mg oral tablets [product monograph]. In: Milton (ON): McKesson Speciality Distribution Inc; 2020 Jun 3.
3.Drug Reimbursement Review sponsor submission: Tukysa (tucatinib), 50 mg and 150 mg oral tablets [internal sponsor's package]. In: Mississauga (ON): Seagen Canada Inc; 2021 Mar 26.
4.CADTH pCODR Expert Review Committee (pERC) final recommendation: trastuzumab emtansive (Kadcyla - Hoffman-La Roche Ltd). In: Ottawa (ON): CADTH; 2014 Jan 10: https://cadth.ca/sites/default/files/pcodr/pcodr-kadcyla-mbc-fn-rec.pdf?bcs-agent-scanner=f4f78fd4-8940-f945-8c21-ad8c35e785d6. Accessed 2021 Jun 17.
5.CADTH pCODR Expert Reivew Committee (pERC) final recommendation: ditosylate (Tykerb - GlaxoSmithKline Inc). In: Ottawa (ON): CADTH; 2013 Jul 5: https://cadth.ca/sites/default/files/pcodr/pcodr-tykerb-mbc-fn-rec.pdf?bcs-agent-scanner=bfc08a77-50bb-7249-9970-7dff05c45887. Accessed 2021 Jun 17.
6.CADTH pCODR Expert Review Committee (pERC) final recommendation: mesylate (Halaven - Eisai Ltd). In: Ottawa (ON): CADTH; 2012 Aug 2: https://cadth.ca/sites/default/files/pcodr/pcodr-halavenmb-fn-rec.pdf?bcs-agent-scanner=e36deb53-6ecb-d140-b3f9-a20a7c9583e7. Accessed 2021 Jun 17.
7.Clinical Study Report: ONT-380-206 (HER2CLIMB). Phase 2 randomized, double-blinded, controlled study of tucatinib vs. placebo in combination with capecitabine and trastuzumab in patients with pretreated unresectable locally advanced or metastatic HER2+ breast carcinoma [internal sponsor's report]. In: Bothell (WA): Seattle Genetics, Inc; 2019 Nov 7.
8.Clinical Study Protocol: Phase 2 Randomized, Double-Blinded, Controlled Study of Tucatinib vs. Placebo in Combination with Capecitabine and Trastuzumab in Patients with Pretreated Unresectable Locally Advanced or Metastatic HER2+ Breast Carcinoma (HER2CLIMB) [internal sponsor's report]. In: City (PROV): Seattle Genetics, Inc; 2017.
9.Seagen Canada Inc response to April 28, 2021 DRR request for additional information regarding Tukysa (tucatinib) DRR review: updated results for the HER2CLIMB trial - poster cited [internal additional sponsor's information] In: Mississauga (ON): Seagen Canada Inc; 2021 Jun 3.
10.Seagen Canada Inc. response to May 20, 2021 request for additional information regarding Tukysa (tucatinib) review: clarifying details of the HER2CLIMB trial [internal additional sponsor's information]. In: Mississauga (ON): Seagen Canada Inc; 2021 Jun 2.
11.Development of economic models to support tucatinib in metastatic breast cancer: network meta-analysis report final report [internal sponsor's report]. Drug Reimbursement Review sponsor submission: Tukysa (tucatinib), 50 mg and 150 mg oral tablets. In: Mississauga (ON): Seagen Canada Inc; 2021 Mar 26.
12.Lin NU, Borges V, Anders C, et al. Intracranial efficacy and survival with tucatinib plus trastuzumab and capecitabine for previously treated HER2-positive breast cancer with brain metastases in the HER2CLIMB trial. J Clin Oncol. 2020;38(23):2610-2619. PubMed
13.Konduri S, Singh M, Bobustuc G, Rovin R, Kassam A. Epidemiology of male breast cancer. Breast. 2020;54:8-14. PubMed
14.Harbeck N, Penault-Llorca F, Cortes J, et al. Breast cancer. Nat Rev Dis Primers. 2019;5(1):66. PubMed
15.Hosonaga M, Saya H, Arima Y. Molecular and cellular mechanisms underlying brain metastasis of breast cancer. Cancer Metastasis Rev. 2020;39(3):711-720. PubMed
16.Verma S, Miles D, Gianni L, et al. Trastuzumab emtansine for HER2-positive advanced breast cancer. N Engl J Med. 2012;367(19):1783-1791. PubMed
17.Herceptin (trastuzumab): 440 mg sterile powder for intravenoius infusion only [product monograph]. In: Mississauga (ON): Hoffmann-La Roche Limited; 2021 Feb 19: https://www.rochecanada.com/PMs/Herceptin/Herceptin_PM_E.pdf. Accessed 2021 Jun 17.
18.Xeloda (capecitabine): 150 mg and 500 mg tablets [product monograph]. In: Mississauga (ON): Hoffmann-La Roche Limited; 2021 Apr 19: https://pdf.hres.ca/dpd_pm/00060777.PDF?bcs-agent-scanner=d7e772e6-7110-a742-adec-1540153cc691. Accessed 2021 Jun 17.
19.Pivot X, Manikhas A, Żurawski B, et al. CEREBEL (EGF111438): a phase III, randomized, open-label study of lapatinib plus capecitabine versus trastuzumab plus capecitabine in patients with human epidermal growth factor receptor 2-positive metastatic breast cancer. J Clin Oncol. 2015;33(14):1564-1573. PubMed
20.McGowan J, Sampson M, Salzwedel DM, Cogo E, Foerster V, Lefebvre C. PRESS Peer Review of Electronic Search Strategies: 2015 guideline statement. J Clin Epidemiol. 2016;75:40-46. PubMed
21.Grey matters: a practical tool for searching health-related grey literature. In: Ottawa (ON): CADTH; 2019: https://www.cadth.ca/grey-matters. Accessed 2021 April 19.
22.Murthy RK, Loi S, Okines A, et al. Tucatinib, trastuzumab, and capecitabine for HER2-positive metastatic breast cancer. N Engl J Med. 2020;382(7):597-609. PubMed
23.Statistical Analysis Plan: Phase 2 randomized, Double-Blinded, Controlled Study of Tucatinib vs. Placebo in Combination with Capecitabine and Trastuzumab in Patients with Pretreated Unresectable Locally Advanced or Metastatic HER2+ Breast Carcinoma In: Seattle Genetics, Inc.; 2019: URL.
24.Rosenberger WF, Lachin JM. Randomization in clinical trials: theory and practice. In: Hoboken (NJ): John Wiley & Sons, Inc; 2002.
25.Mueller V, Paplomata E, Hamilton EP, et al. 275O Impact of tucatinib on health-related quality of life (HRQoL) in patients with HER2+ metastatic breast cancer (MBC) with and without brain metastases (BM). Ann Oncol. 2020;31:S349-S350.
26.Mueller V, Wardley A, Paplomata E, et al. Preservation of quality of life in patients with human epidermal growth factor receptor 2-positive metastatic breast cancer treated with tucatinib or placebo when added to trastuzumab and capecitabine (HER2CLIMB trial). Eur J Cancer. 2021;153:223-233. PubMed
27.Templeton AJ, Amir E, Tannock IF. Informative censoring — a neglected cause of bias in oncology trials. Nat Rev Clin Oncol. 2020;17(6):327-328. PubMed
28.Kimman ML, Dirksen CD, Lambin P, Boersma LJ. Responsiveness of the EQ-5D in breast cancer patients in their first year after treatment. Health Qual Life Outcomes. 2009;7:11. PubMed
29.Conner-Spady B, Cumming C, Nabholtz JM, Jacobs P, Stewart D. Responsiveness of the EuroQol in breast cancer patients undergoing high dose chemotherapy. Qual Life Res. 2001;10(6):479-486. PubMed
30.Lee CF, Ng R, Luo N, et al. The English and Chinese versions of the five-level EuroQoL Group's five-dimension questionnaire (EQ-5D) were valid and reliable and provided comparable scores in Asian breast cancer patients. Support Care Cancer. 2013;21(1):201-209. PubMed
31.Kuksis M, Gao Y, Tran W, et al. The incidence of brain metastases among patients with metastatic breast cancer: a systematic review and meta-analysis. Neuro Oncol. 2021;23(6):894-904. PubMed
32.Cameron D, Casey M, Oliva C, Newstat B, Imwalle B, Geyer CE. Lapatinib plus capecitabine in women with HER-2-positive advanced breast cancer: final survival analysis of a phase III randomized trial. Oncologist. 2010;15(9):924-934. PubMed
33.von Minckwitz G, Schwedler K, Schmidt M, et al. Trastuzumab beyond progression: overall survival analysis of the GBG 26/BIG 3-05 phase III study in HER2-positive breast cancer. Eur J Cancer. 2011;47(15):2273-2281. PubMed
34.Jiang Z, Yan M, Hu X, et al. Pyrotinib combined with capecitabine in women with HER2+ metastatic breast cancer previously treated with trastuzumab and taxanes: a randomized phase III study. J Clin Oncol. 2019;37(Suppl 15):1001-1001.
35.Seligmann JF, Wright-Hughes A, Pottinger A, et al. Lapatinib plus capecitabine versus trastuzumab plus capecitabine in the treatment of human epidermal growth factor receptor 2-positive metastatic breast cancer with central nervous system metastases for patients currently or previously treated with trastuzumab (LANTERN): a phase II randomised trial. Clin Oncol (R Coll Radiol). 2020;32(10):656-664. PubMed
36.Cortés J, Diéras V, Lorenzen S, et al. Efficacy and safety of trastuzumab emtansine plus capecitabine vs trastuzumab emtansine alone in patients with previously treated ERBB2 (HER2)-positive metastatic breast cancer: a phase 1 and randomized phase 2 trial. JAMA Oncol. 2020;6(8):1203-1209. PubMed
37.Hackshaw A. A concise guide to clinical trials. In: Hoboken (NJ): Wiley-Blackwell/BMJ Books; 2009.
38.Ma F, Ouyang Q, Li W, et al. Pyrotinib or lapatinib combined with capecitabine in HER2-positive metastatic breast cancer with prior taxanes, anthracyclines, and/or trastuzumab: a randomized, phase II study. J Clin Oncol. 2019;37(29):2610-2619. PubMed
39.Turner RM, Jackson D, Wei Y, Thompson SG, Higgins JP. Predictive distributions for between-study heterogeneity and simple methods for their application in Bayesian meta-analysis. Stat Med. 2015;34(6):984-998. PubMed
40.Takano T, Tsurutani J, Takahashi M, et al. A randomized phase II trial of trastuzumab plus capecitabine versus lapatinib plus capecitabine in patients with HER2-positive metastatic breast cancer previously treated with trastuzumab and taxanes: WJOG6110B/ELTOP. Breast. 2018;40:67-75. PubMed
41.Saura C, Oliveira M, Feng YH, et al. Neratinib plus capecitabine versus lapatinib plus capecitabine in HER2-positive metastatic breast cancer previously treated with ≥ 2 HER2-directed regimens: phase III NALA trial. J Clin Oncol. 2020;38(27):3138-3149. PubMed
42.Martin M, Bonneterre J, Geyer CE, Jr., et al. A phase two randomised trial of neratinib monotherapy versus lapatinib plus capecitabine combination therapy in patients with HER2+ advanced breast cancer. Eur J Cancer. 2013;49(18):3763-3772. PubMed
43.Urruticoechea A, Rizwanullah M, Im SA, et al. Randomized phase III trial of trastuzumab plus capecitabine with or without pertuzumab in patients with human epidermal growth factor receptor 2-positive metastatic breast cancer who experienced disease progression during or after trastuzumab-based therapy. J Clin Oncol. 2017;35(26):3030-3038. PubMed
44.Rugo HS, Im SA, Cardoso F, et al. Efficacy of margetuximab vs trastuzumab in patients with pretreated ERBB2-positive advanced breast cancer: a phase 3 randomized clinical trial. JAMA Oncol. 2021;7(4):573-584. PubMed
45.Canadian Cancer Society. Prognosis and survival for breast cancer. https://www.cancer.ca/en/cancer-information/cancer-type/breast/prognosis-and-survival/?region=on. Published 2021. Accessed 2021 Jun 10.
46.van Reenen M, Janssen B. EQ-5D-5L user guide: basic information on how to use the EQ-5D-5L instrument version 2.1. In: Rotterdam (NL): The EuroQol Research Foundation; 2015.
47.2014 Alberta population norms for EQ-5D-5L. In: Calgary (AB): Health Quality Council of Alberta; 2014: https://d10k7k7mywg42z.cloudfront.net/assets/542f01f2edb2f37083002e54/2014_EQ_5D_5L_report_FINALFINAL.pdf. Accessed 2021 Aug 6.
48.Revicki D, Hays RD, Cella D, Sloan J. Recommended methods for determining responsiveness and minimally important differences for patient-reported outcomes. J Clin Epidemiol. 2008;61(2):102-109. PubMed
49.Cohen J. Statistical power analysis for behavioral science. In: 2nd ed. Hilsdale (NJ): Lawrence Earlbaum Associates; 1988.
50.Cohen J. A power primer. Psychol Bull. 1992;112(1):155-159. PubMed
51.Landis JR, Koch GG. The measurement of observer agreement for categorical data. Biometrics. 1977;33(1):159-174. PubMed
52.McClure NS, Sayah FA, Xie F, Luo N, Johnson JA. Instrument-defined estimates of the minimally important difference for EQ-5D-5L Index Scores. Value Health. 2017;20(4):644-650. PubMed
Appendix 1: Literature Search Strategy
Note that this appendix has not been copy-edited.
Clinical Literature Search
Overview
Interface: Ovid
Databases:
MEDLINE All (1946–present)
Embase (1974–present)
Note: Subject headings and search fields have been customized for each database. Duplicates between databases were removed in Ovid.
Date of Search: April 19, 2021
Alerts: Weekly search updates until project completion
Study Types: No filters were applied to limit the retrieval by study type
Limits:
Publication date limit: none
Language limit: none
Conference abstracts: excluded
Syntax | Description |
|---|---|
/ | At the end of a phrase, searches the phrase as a subject heading |
MeSH | Medical Subject Heading |
exp | Explode a subject heading |
* | Before a word, indicates that the marked subject heading is a primary topic; or, after a word, a truncation symbol (wildcard) to retrieve plurals or varying endings |
# | Truncation symbol for one character |
adj# | Requires terms to be adjacent to each other within # number of words (in any order) |
.ti | Title |
.ot | Original title |
.ab | Abstract |
.hw | Heading word; usually includes subject headings and controlled vocabulary |
.kf | Author keyword heading word (MEDLINE) |
.kw | Author keyword (Embase) |
.dq | Candidate term word (Embase) |
.pt | Publication type |
.rn | Registry number |
.nm | Name of substance word (MEDLINE) |
medall | Ovid database code: MEDLINE All, 1946 to present, updated daily |
oemezd | Ovid database code; Embase, 1974 to present, updated daily |
Multi-Database Strategy
Search Strategy:
(tucatinib* or Tukysa* or irbinitinib* or arry380 or arry 380 or ont380 or ont 380 or 234248D0HH).ti,ab,kf,ot,hw,nm,rn.
1 use medall
*tucatinib/ or (tucatinib* or Tukysa* or irbinitinib* or arry380 or arry 380 or ont380 or ont 380).ti,ab,kw,dq.
3 use oemezd
4 not (conference review or conference abstract).pt.
2 or 5
remove duplicates from 6
Clinical Trials Registries
ClinicalTrials.gov
Produced by the US National Library of Medicine. Targeted search used to capture registered clinical trials.
Search terms: Tukysa/tucatinib, breast cancer
WHO ICTRP
International Clinical Trials Registry Platform, produced by the World Health Organization. Targeted search used to capture registered clinical trials.
Search terms: Tukysa/tucatinib, breast cancer
Health Canada’s Clinical Trials Database
Produced by Health Canada. Targeted search used to capture registered clinical trials.
Search terms: Tukysa/tucatinib, breast cancer
EU Clinical Trials
Register European Union Clinical Trials Register, produced by the European Union. Targeted search used to capture registered clinical trials.
Search terms: Tukysa/tucatinib, breast cancer
Grey Literature
Search dates: April 13 to 20, 2021
Keywords: Tukysa/tucatinib; HER2+ breast cancer
Limits: Publication years: none
Updated: Search updated prior to the completion of stakeholder feedback period
Relevant websites from the following sections of the CADTH grey literature checklist Grey Matters: A Practical Tool For Searching Health-Related Grey Literature were searched:
Health Technology Assessment Agencies
Health Economics
Clinical Practice Guidelines
Drug and Device Regulatory Approvals
Advisories and Warnings
Drug Class Reviews
Clinical Trials Registries
Databases (free)
Internet Search
Open Access Journals.
Appendix 2: Excluded Studies
Note that this appendix has not been copy-edited.
Reference | Reason for Exclusion |
|---|---|
Paplomata E, Bachelot T, Mueller V, et al. A randomized, double-blinded, controlled study of tucatinib (ONT-380) vs placebo in combination with capecitabine (C) and trastuzumab (T) in patients with pretreated HER2+ unresectable locally advanced or metastatic breast carcinoma (mBC) (HER2CLIMB). Annals of Oncology: Official Journal of the European Society for Medical Oncology. 2019;30(Supplement 3):iii63-iii64. | Abstract |
Appendix 3: Detailed Outcome Data
Note that this appendix has not been copy-edited.
EQ-5D-5L Descriptive System Results
Figure 29: EQ-5D-5L of Mobility (ITT Population)
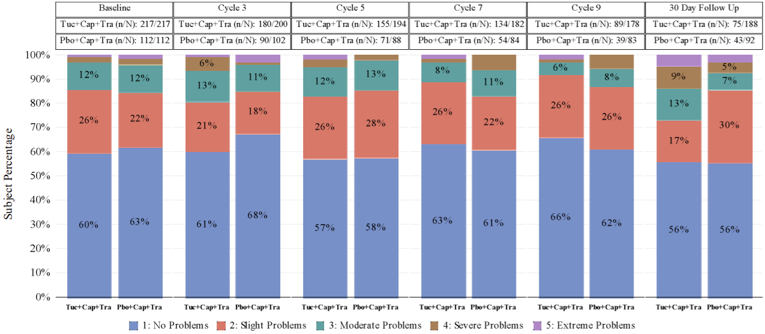
cap = capecitabine; EQ-5D-5L = EuroQol 5-Dimensions 5-Levels questionnaire; ITT = intention to treat; pbo = placebo; tra = trastuzumab; tuc = tucatinib.
Note: Baseline is defined as most recent non-missing assessment on or before first dose date.
n/N: n is the number of patients who completed survey. N is the number of patients who completed baseline survey and still on study. Cycles where the number of patients in each arm remain ≥ 20% of initial cohort size are presented.
Source: HER2CLIMB Clinical Study Report.7
Figure 30: EQ-5D-5L of Self-Care
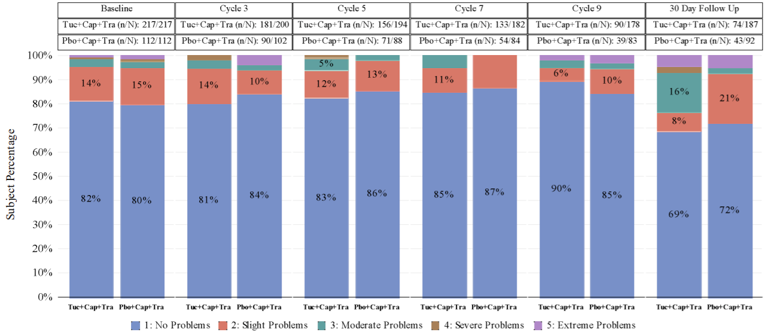
Cap = capecitabine; EQ-5D-5L = EuroQol 5-Dimensions 5-Levels questionnaire; Pbo = placebo; Tra = trastuzumab; Tuc = tucatinib.
Note: Baseline is defined as most recent non-missing assessment on or before first dose date.
n/N: n is the number of patients who completed survey. N is the number of patients who completed baseline survey and still on study. Cycles where the number of patients in each arm remain ≥ 20% of initial cohort size are presented.
Source: HER2CLIMB Clinical Study Report.7
Figure 31: EQ-5D-5L of Usual Activities
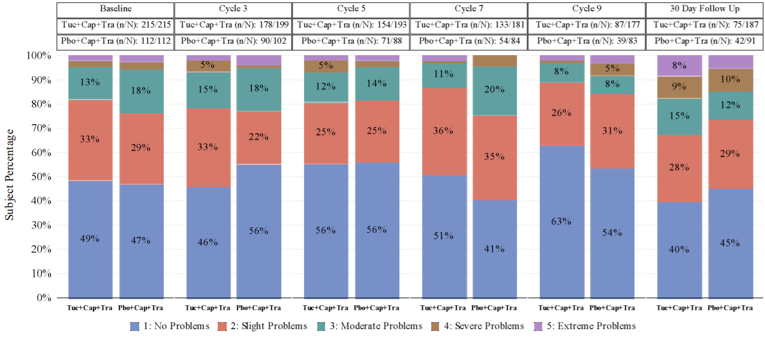
Cap = capecitabine; EQ-5D-5L = EuroQol 5-Dimensions 5-Levels questionnaire; Pbo = placebo; Tra = trastuzumab; Tuc = tucatinib.
Note: Baseline is defined as most recent non-missing assessment on or before first dose date.
n/N: n is the number of patients who completed survey. N is the number of patients who completed baseline survey and still on study. Cycles where the number of patients in each arm remain ≥ 20% of initial cohort size are presented.
Source: HER2CLIMB Clinical Study Report.7
Figure 32: EQ-5D-5L of Pain or Discomfort
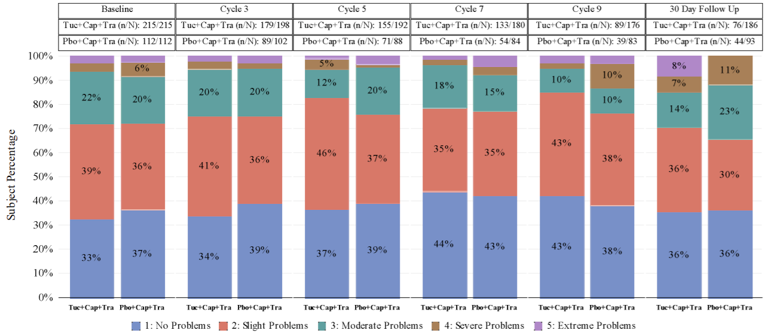
Cap = capecitabine; EQ-5D-5L = EuroQol 5-Dimensions 5-Levels questionnaire; Pbo = placebo; Tra = trastuzumab; Tuc = tucatinib.
Note: Baseline is defined as most recent non-missing assessment on or before first dose date.
n/N: n is the number of patients who completed survey. N is the number of patients who completed baseline survey and still on study. Cycles where the number of patients in each arm remain ≥ 20% of initial cohort size are presented.
Source: HER2CLIMB Clinical Study Report.7
Figure 33: EQ-5D-5L of Anxiety or Depression
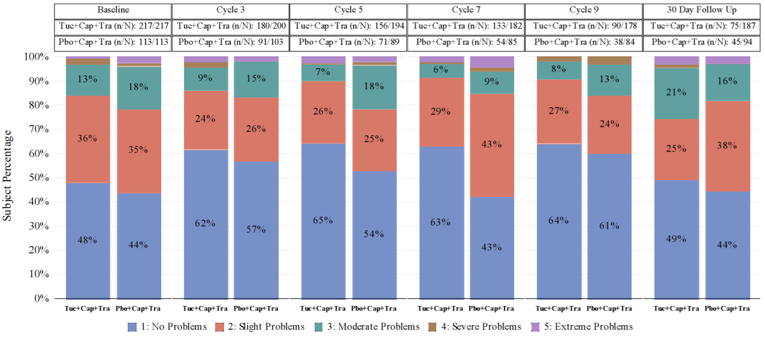
Cap = capecitabine; EQ-5D-5L = EuroQol 5-Dimensions 5-Levels questionnaire; Pbo = placebo; Tra = trastuzumab; Tuc = tucatinib.
Note: Baseline is defined as most recent non-missing assessment on or before first dose date.
n/N: n is the number of patients who completed survey. N is the number of patients who completed baseline survey and still on study. Cycles where the number of patients in each arm remain ≥ 20% of initial cohort size are presented.
Source: HER2CLIMB Clinical Study Report.7
Appendix 4: Description and Appraisal of Outcome Measures
Note that this appendix has not been copy-edited.
Aim
To describe the following outcome measures and review their measurement properties (validity, reliability, responsiveness to change, and minimal important difference [MID]):
EQ-5D-5L (exploratory)
Findings
Table 37: Summary of Outcome Measures and Their Measurement Properties
Outcome measure | Type | Conclusions about measurement properties | MID |
|---|---|---|---|
EQ-5D-5L | EQ-5D-5L index: Generic, preference-based measure of HRQoL consisting of 5 domains: mobility, self-care, usual activities, pain/discomfort, and anxiety/depression. Scores range from 0 to 1 with higher scores indicating better health status. EQ VAS: Generic, preference-based measure of HRQoL presented as a scale from 0 to 100 with 0 anchored as the worst possible health state and 100 as the best. | Validity and reliability have been demonstrated in a diverse population. Responsiveness was demonstrated in patients with breast cancer following curative treatment; however, small changes in health were not recognized as being meaningful.28,29 Strong evidence of validity and reliability were demonstrated in patients living with breast cancer and no history of brain metastasis.30 | MID for the index score was estimated to range from 0.037 to 0.056 in the general Canadian population. A MID specific to patients with breast cancer was not identified. |
EQ-5D-5L = EuroQol 5-Dimensions 5-Levels questionnaire; HRQoL = health-related quality of life; MID = minimal important difference; EQ VAS = EuroQol Visual Analogue Scale.
EuroQol 5-Dimensions 5-Levels Questionnaire
The EuroQol 5-Dimensions questionnaire (EQ-5D) is a generic, self-reported, HRQoL instrument developed by the EuroQol Group that is applicable to a wide range of health conditions and treatments.46 As a generic measure of HRQoL that can capture the net effect of treatment benefits and harms, the EQ-5D provides valuable information from the patient perspective. The original 3-level version of the EQ-5D (EQ-5D-3L) was introduced in 1990 and was composed of 5 dimensions pertaining to HRQoL.46 Respondents indicate their health status in terms of 5 dimensions based on 3 levels of severity. To improve sensitivity and reduce ceiling effects, the EQ-5D-3L was updated in 2005 and expanded to 5 levels for respondents to answer each dimension with, thus creating the EQ-5D-5L, which was used in the HER2CLIMB trial.46
The EQ-5D-5L consists of a descriptive system and the EQ VAS. The descriptive system comprises 5 dimensions: mobility, self-care, usual activities, pain/discomfort, and anxiety/depression. Each dimension is answered based on 5 levels, where 1 = “no problems,” 2 = “slight problems,” 3 = “moderate problems,” 4 = “severe problems,” and 5 = “extreme problems,” or “unable to perform,” which is the worst response in the dimension.46 Respondents choose the level that reflects their health state for each of the 5 dimensions.
In total, there are 3,125 possible unique health states defined by the EQ-5D-5L, with 11111 and 55555 representing the best and worst health states, respectively. The numerical values assigned to levels 1 to 5 for each dimension reflect rank order categories of function. In terms of measurement properties, these are ordinal data and do not have interval properties; therefore, they should not be summed or averaged to, for example, produce a single dimension score. Results from the EQ-5D-5L descriptive system can be converted into a single index score using a scoring algorithm taking the local patient and population preferences into account. Therefore, the index score is a country-specific value and a major feature of the EQ-5D instrument.47 The range of index scores will differ according to the scoring algorithm used; however, in all scoring algorithms of the EQ-5D-5L, a score of 0 represents the health state “dead” and 1.0 reflects “perfect health.” Negative scores are also possible for those health states that society (not the individual patient) considers to be “worse than dead.”
The EQ VAS records the respondent’s self-rated health on a vertical VAS where the end points are labelled 0 (“the worst health you can imagine”) and 100 (“the best health you can imagine”). Respondents are asked to mark an X on the point of the VAS that best represents their health on that day. The EQ-5D index and VAS scores can be summarized and analyzed as continuous data.46,47
Overall, the EQ-5D produces 3 types of data for each respondent:
a profile indicating the extent of problems on each of the 5 dimensions represented by a 5-digit descriptor, such as 11121 or 21143
a population preference-weighted health index score based on the descriptive system
a self-reported assessment of health status based on the EQ VAS
The EQ-5D-5L has been validated in terms of feasibility, ceiling effects, discriminatory power, and convergent validity in a diverse patient population from 6 countries with chronic conditions.46
Responsiveness of the EQ-5D-5L in 192 patients who were enrolled in a clinical trial investigating the cost-effectiveness of nurse-led telephone follow-up and an educational program after curative treatment for breast cancer. Anchor-based methods recommended by Revicki (2008)48 were used and the global health subscale of the EORTC QLQ-C30 was the anchor selected for clinical change. The global health subscale consists of 2 items: “How would you rate your physical condition during the past week?” and “how would you rate your overall quality of life during the past week?” Following demonstration of correlation to the EQ-5D-5L index and EQ VAS, the use of the global health subscale as an anchor was deemed appropriate. Patients were classified into the following subgroups using the EORTC QLQ-C30: moderate-large deterioration, small deterioration, no change, a small improvement, moderate-large improvement in health status. Responsiveness was evaluated by calculating the standardized response mean for the EQ-5D-5L index, EQ VAS, and patient subgroups. The following benchmarks for effect sizes were used to interpret scores: 0.20 through 0.49 was interpreted as small, 0.50 through 0.79 as moderate and ≥ 0.80 as large.49 Additionally, analysis of variance (ANOVA) procedures were used to determine the ability of the EQ-5D-5L to discriminate between subgroups. Overall, the EQ-5D-5L was able to detect improvements and deteriorations in health. Further, it demonstrated the ability to discriminate between patients with no change in health and patients with moderate-large changes in health; however, it was not able to differentiate between the “no change” subgroup and small improvements or a small or moderate-large deterioration.28 Evidence of responsiveness for the EQ-5D-5L was also demonstrated in a study by Conner-Spady (2001). HRQoL was evaluated in 52 patients with stage II and III breast cancer at high risk of relapse following high dose chemotherapy with autologous blood stem cell transplantation. The Functional Living Index—Cancer (FLIC) was used as an anchor and the responsiveness of the EQ-5D-5L was assessed by effect size and ANOVA, which demonstrated responsiveness but a lack of sensitivity for smaller changes in HRQoL that are important to patients living with cancer.29
The validity and reliability of the English and Chinese versions of the EQ-5D-5L was evaluated in a study that recruited patients from a specialist outpatient clinic in Singapore. Adult English and/or Chinese-speaking patients with histologically confirmed breast cancer and no evidence of brain metastasis, psychosis, or severe depression were included.30 In the study by Lee et al. (2013), both the English and Chinese version of the EQ-5D-5L utility index and EQ VAS were strongly correlated50 with the Functional Assessment of Cancer Therapy—Breast (FACT-B) total score [correlation coefficient (r) = 0.53 to 0.73] and the EQ-5D-5L utility index presented evidence of convergent and divergent validity as well.30 Test-retest reliability was assessed in patients that reported no change in performance status based on a 30-day follow-up period. The EQ-5D-5L index and EQ VAS demonstrated substantial to almost perfect agreement51 among the English-speaking sample (N = 169) based on an intraclass correlation of 0.81 (95% CI, 0.73 to 0.87) and 0.83 (95% CI, 0.76 to 0.89), respectively.
A Canadian-specific estimate of a MID for the EQ-5D-5L was generated by simulating the effects of single level transitions in each dimension.52 The results yielded MIDs with a summarized mean of 0.056 (SD = 0.011), and a summarized median of 0.056 (interquartile range = 0.049 to 0.063).52 An MID specific to patients with breast cancer was not identified.
Pharmacoeconomic Review
Abbreviations
AE
adverse event
EQ-5D-5L
EuroQol 5-Dimensions 5-Levels questionnaire
HER2
human epidermal growth factor receptor 2
HRQoL
health-related quality of life
ICER
incremental cost-effectiveness ratio
ITC
indirect treatment comparison
NMA
network meta-analysis
OS
overall survival
PFS
progression-free survival
QALY
quality-adjusted life-year
RDI
relative dose intensity
T-DM1
trastuzumab emtansine
WTP
willingness to pay
Executive Summary
The executive summary comprises 2 tables (Table 1 and Table 2) and a conclusion.
Item | Description |
|---|---|
Drug product | Tucatinib (Tukysa), oral tablets |
Submitted price | Tucatinib, 50 mg: $60.17 per tablet Tucatinib, 150 mg: $119.50 per tablet |
Indication | In combination with trastuzumab and capecitabine for treatment of patients with locally advanced unresectable or metastatic HER2-positive breast cancer, including patients with brain metastases, who have received prior treatment with trastuzumab, pertuzumab, and trastuzumab emtansine, separately or in combination |
Health Canada approval status | NOC |
Health Canada review pathway | Other expedited pathway: Project Orbis |
NOC date | June 5, 2020 |
Reimbursement request | As per indication |
Sponsor | Seagen Canada Inc. |
Submission history | Previously reviewed: No |
HER2 = human epidermal growth factor receptor 2; NOC = Notice of Compliance.
Table 2: Summary of Economic Evaluation
Component | Description |
|---|---|
Type of economic evaluation | Cost-utility analysis Partitioned survival model |
Target population | Adults with locally advanced unresectable or metastatic HER2+ breast cancer who have received prior treatment with trastuzumab, pertuzumab, and T-DM1, separately or in combination |
Treatment | Tucatinib in combination with trastuzumab + capecitabine (tucatinib-combination therapy) |
Comparators |
|
Perspective | Canadian publicly funded health care payer |
Outcomes | QALYs, LYs |
Time horizon | Lifetime (10 years) |
Key data sources | HER2CLIMB trial and network meta-analysis |
Submitted results |
|
Key limitations |
|
CADTH reanalysis results |
|
HER2+ = human epidermal growth factor receptor 2–positive; ICER = incremental cost-effectiveness ratio; ITC = indirect treatment comparison; LY = life-year; OS = overall survival; QALY = quality-adjusted life-year; RDI = relative dose intensity; T-DM1 = trastuzumab emtansine.
Conclusions
Based on the CADTH Clinical Review Report, tucatinib in combination with trastuzumab plus capecitabine (tucatinib-combination therapy) had a statistically and clinically significant improvement in overall survival (OS) and progression-free survival (PFS) compared with the combination of trastuzumab and capecitabine alone, based on data from the HER2CLIMB trial. The comparative efficacy and safety data for tucatinib-combination therapy versus other relevant comparators (e.g., trastuzumab emtansine [T-DM1], lapatinib plus capecitabine, or chemotherapy alone) was based on indirect evidence that favoured tucatinib-combination therapy; however, the magnitude of the effect was associated with some uncertainty due to several key limitations with the indirect treatment comparison (ITC), which included a limited number of studies informing each comparison within the network, considerable heterogeneity between trials, and limitations in the methods of the analyses. The expected impact of these limitations on the magnitude of the efficacy of tucatinib-combination therapy relative to comparators is uncertain.
CADTH undertook reanalyses to address the limitations in the sponsor’s economic submission, which included using an alternative OS curve for trastuzumab and capecitabine, using the relative efficacy data directly from the HER2CLIMB trial for tucatinib-combination therapy rather than from the ITC, assuming 100% relative dose intensity (RDI) for trastuzumab in cycle 2 and later cycles and for drugs administered orally, applying the same progression-free health state utility value regardless of treatment cycle number, and presenting the results for tucatinib-combination therapy according to its use in the second- and third-line setting, given the differences in relevant comparator drugs according to line of therapy. In the CADTH base case, tucatinib-combination therapy had an incremental cost-effectiveness ratio (ICER) of $512,403 per quality-adjusted life-year (QALY) compared with T-DM1 in the second-line setting and a sequential ICER of $381,429 compared with trastuzumab plus capecitabine in the third-line setting. CADTH’s results were similar to the sponsor’s, which indicated that tucatinib-combination therapy was not cost-effective at a $50,000 per QALY threshold. A price reduction of at least 48% for the second- and 94% for the third-line setting is required for tucatinib-combination therapy to be cost-effective at this threshold.
Tucatinib-combination therapy was not cost-effective under any scenarios undertaken in the CADTH reanalysis at a willingness-to-pay (WTP) threshold of $50,000 per QALY. CADTH was unable to address the omission of relevant comparators (e.g., neratinib with capecitabine, trastuzumab with endocrine therapy, and endocrine therapy alone) in the third-line treatment setting, nor could CADTH determine the cost-effectiveness of tucatinib-combination therapy according to the presence of brain metastasis. CADTH’s reanalysis demonstrated that the cost-effectiveness of tucatinib-combination therapy varied according to use in the second- or third-line setting; however, it was not cost-effective in either setting. Given the limitations with the comparative clinical efficacy data informing the model, the price reduction required for tucatinib to be cost-effective in the second- and third-line setting may be higher than estimated.
Stakeholder Input Relevant to the Economic Review
This section is a summary of the feedback received from the patient groups, registered clinicians, and drug plans that participated in the CADTH review process, specifically, information that pertains to the economic submission.
CADTH received input from 3 patient groups: the Canadian Breast Cancer Network, the CanCertainty Coalition, and Rethink Breast Cancer. Information was gathered from online surveys, key participant interviews, and the literature. Patient input emphasized the importance of a treatment that is effective in controlling disease, preventing recurrence, and maintaining quality of life. Side effect management, cost, and accessibility were also reported as important. Patients with experience taking tucatinib reported diarrhea as the most common side effect; decreased appetite, fatigue, nausea, hand-foot syndrome, and itchy rash were also reported. Side effects were manageable in most patients. Patient group input reported that tucatinib was better than other therapies in preventing recurrence and controlling disease progression. The effectiveness of treatment for patients with brain metastasis was also reported by patient groups as an important consideration for tucatinib.
CADTH received clinician input from 2 clinician groups: The Ottawa Hospital Cancer Centre (medical oncology Breast Disease Site Group), and Ontario Health (Cancer Care Ontario), Breast Disease Site Advisory Committee). The current pathway of care for patients with locally advanced unresectable or metastatic human epidermal growth factor receptor 2 (HER2)-positive breast cancer includes first-line treatment with trastuzumab plus pertuzumab plus a taxane-based chemotherapy followed by second-line treatment with T-DM1. Clinician groups indicated that tucatinib is most relevant in the third-line setting, as there are currently no publicly funded third-line options; however, for patients with active brain metastases, use in the second-line setting may be relevant in place of T-DM1 for patients with contraindications to T-DM1 or recurrence or progression after receiving T-DM1 or neoadjuvant or adjuvant trastuzumab (with or without pertuzumab). The clinician groups indicated they do not expect that tucatinib will alter the sequencing of therapies, and cited that OS, quality of life, and delaying progression (because of the lack of downstream treatment options) are important treatment goals. Their input also emphasized there is a large unmet need for effective therapies for treating brain metastasis in this population.
Feedback from the drug plans identified issues for consideration, which included: the variability across jurisdictions in currently funded regimens in the third-line setting (i.e., when used after pertuzumab, trastuzumab, and T-DM1), the potential for wastage of tucatinib if dose modification is required, the complexity of the multi-drug combination (including self-administration of multiple tablets per dose, multiple doses per day, and differing days of administration), the budget impact given the high cost per cycle and given that the combination of oral and IV drugs would result in reimbursement through different drug programs in most jurisdictions. The drug plans noted that most Canadian jurisdictions do not fund the combination of trastuzumab plus capecitabine and, therefore, the introduction of the tucatinib-combination regimen will also transfer the cost of trastuzumab to a patient population that currently does not receive funding for trastuzumab.
The sponsor addressed several of these concerns in its model by including outcomes considered important to patient and clinician groups, including OS, remaining progression-free, quality of life, side effect management, and cost.
In addition, CADTH addressed some of these by presenting the results according to the second- and third-line setting to account for differences in relevant comparators. It also conducted an exploratory analysis of the budget impact of patients with brain metastasis who are otherwise eligible for treatment.
CADTH was unable to address the following concerns raised in the stakeholder input:
the potential impact of the complexity of the multi-drug tucatinib regimen, including self-administration of multiple tablets per dose, multiple doses per day, and differing days of administration, and potential drug wastage because of dose modification
the expected budget impact on different drug programs, given the combination of oral and IV drugs.
Economic Review
The current review is for tucatinib (Tukysa) in combination with trastuzumab and capecitabine for the treatment of patients with locally advanced unresectable or metastatic HER2-positive breast cancer.
Economic Evaluation
Summary of Sponsor’s Economic Evaluation
Overview
The sponsor submitted a cost-utility analysis of tucatinib in combination with trastuzumab and capecitabine (i.e., tucatinib-combination therapy) compared with trastuzumab and capecitabine, lapatinib and capecitabine, T-DM1, and capecitabine monotherapy. The model population comprised patients with locally advanced unresectable or metastatic HER2-positive breast cancer, including patients with brain metastases, who have received prior treatment with trastuzumab, pertuzumab, and T-DM1, separately or in combination. The model population was in line with the Health Canada–approved indication and the sponsor’s reimbursement request.
Tucatinib is available in 50 mg and 150 mg oral tablets. The recommended dose of tucatinib is 300 mg taken orally twice daily in combination with trastuzumab (8 mg/kg on day 1 of the first 21-day cycle and 6 mg/kg on the first day of subsequent 21-day cycles) and capecitabine (1,000 mg/m2 twice daily for days 1 to 14 of a 21-day cycle) until disease progression or unacceptable toxicity.1 The sponsor’s submitted price for tucatinib is $7,170 per package of 60 150 mg tablets and $3,610 per package of 60 50 mg tablets.2 Weight-based dosing was based on a mean body weight of 69.5 kg and a mean body surface area of 1.80 m2, the measures used in the HER2CLIMB trial. The sponsor reported a drug acquisition cost for tucatinib of $8,884 per 21-day cycle based on an RDI of |||||||||| which, when combined with trastuzumab (cycle 1 cost, $1,791; subsequent cycle cost, $992.57; RDI |||||||||| and ||||||||||, respectively) and capecitabine ($114 per cycle; RDI ||||||), resulted in an assumed 21-day cycle cost of $10,788 for cycle 1 and $9,989.80 for subsequent 21-day cycles. The sponsor also included a 1-time drug administration cost of $25.75 for oral treatments and $92.16 per cycle for IV treatments.
The comparators evaluated in the sponsor’s model included trastuzumab and capecitabine at the same dosage as when combined with tucatinib, lapatinib (1,250 mg once daily) and capecitabine (2,000 mg/m2 twice daily for days 1 to 14), T-DM1 (3.6 mg/kg on day 1 of a 21-day cycle), and capecitabine monotherapy (1,250 mg/m2 twice daily for days 1 to 14). The sponsor reported a 21-day cycle cost for trastuzumab (cycle 1 cost, $1,791; subsequent cycle cost, $1,061; RDI |||||||||| and ||||||||||, respectively) and capecitabine ($121 per cycle; RDI ||||||||) of $1,912 for cycle 1 and $1,183 for subsequent 21-day cycles. The 21-day cycle cost for lapatinib ($2,587; RDI, 100%) and capecitabine ($133; RDI, 86.5%) was $2,720, $5,179 (RDI, 97.2%) for T-DM1, and $151 (RDI, 78.8%) for capecitabine monotherapy. A 1-time administration cost of $25.75 for oral treatments and $92.16 per cycle for IV treatments were also included for all comparator treatments.
The outcomes of interest were life-years and QALYs. The analysis was undertaken from a Canadian publicly funded health care payer perspective over a lifetime time horizon (10 years). A discount rate of 1.5% was applied for costs and effects after 1 year.
Model Structure
The sponsor submitted a partitioned survival model based on 3 health states: progression-free, progressed, and dead. All patients started in the progression-free health state and started treatment with either tucatinib or a comparator drug. In subsequent cycles, patients could either stay in the progression-free health state, experience disease progression, or die. In the progressed health state, patients could receive subsequent lines of treatments (to account for costs, not additional treatment efficacy) or best supportive care, but could no longer receive the intervention or comparator treatment. The time spent in each state was derived using OS and PFS curves; the time spent in the progressed health state was estimated by calculating the difference between the proportion of patients living (from the OS curve) and the proportion of patients with progression-free disease (from the PFS curve). A hypothetical visual structure of the model is presented in Appendix 3.
Model Inputs
The modelled patient characteristics were based on the HER2CLIMB trial, which was a phase II, randomized, double-blind, controlled study of tucatinib versus placebo in combination with trastuzumab and capecitabine. Patients included in the study had a mean age of 54 years, a mean body weight of 69.5 kg, and a mean body surface area of 1.80 m2.
The sponsor conducted a survival analysis to extrapolate the 36 months of OS and PFS data from the HER2CLIMB trial over the entire 10-year time horizon. The sponsor assessed the fit of parametric models, flexible spline-based models, and hybrid model extrapolations using visual inspection, Akaike information criterion and Bayesian information criterion statistics, comparison with external data, and clinical plausibility. The sponsor selected a flexible Weibull 2-knot curve for PFS and Weibull for the OS curve. In the submitted base case, the sponsor used the OS and PFS curves that were derived for the placebo plus trastuzumab and capecitabine arm of the HER2CLIMB trial and applied hazard ratios from a sponsor-submitted network meta-analysis (NMA) to derive the OS and PFS curves for the comparator treatments (including the tucatinib-combination therapy). The sponsor assessed the proportional hazards assumption using a log-(log) survival plot for both the within-trial data and the NMA data and indicated that the proportional hazards assumption was appropriate in both scenarios. For the within-trial analysis, the sponsor noted that although the PFS curves on the log-(log) scale for tucatinib-combination therapy and placebo plus trastuzumab and capecitabine did cross, they were also approximately parallel. For the NMA, the sponsor noted that significant departures from proportionality were only observed for PFS data for 1 intervention (T-DM1), so non-proportionality was not deemed to be a major concern for the NMA. Rates for adverse events (AEs) were derived from clinical trial data (HER2CLIMB3 and EMILIA4). The sponsor also conducted a scenario analysis where the efficacy of tucatinib, trastuzumab, and capecitabine was informed by the fitted survival curves according to the HER2CLIMB trial, rather than using the hazard ratios from the NMA, as was done in the submitted base case.
Health state utilities were sourced from health-related quality of life data (HRQoL) collected using the EuroQol 5-Dimensions 5-Levels questionnaire (EQ-5D-5L) as part of the HER2CLIMB trial. The EQ-5D-5L was added as part of a protocol change, so approximately half of the patients included in the trial had quality of life data collected (331 out of 612; 54%). Utility data were pooled (i.e., not treatment-specific) from all patients included in the trial, and varied according to treatment cycle number (i.e., separate utility values for cycles 1 to 2, 3 to 4, 5 to 6, and 7 or later) when patients were in the progression-free health state. Disutilities were applied for grade 3 to 4 AEs that occurred in 2% or more of trial participants for the treatments included in the model. Disutility values were sourced from literature-based data and the duration of AEs was derived from National Institute for Health and Care Excellence technology appraisals, where available.5 The sponsor accounted for these events in the first cycle of the model.
The model included costs for treatment acquisition, treatment administration, post-progression treatment, AEs, antidiarrheal medication, end-of-life care, and health state costs. Treatment acquisition costs were calculated based on the unit costs of treatment (sourced from a published CADTH report, the Association québécoise des pharmaciens propriétaires drug price list, the Ontario Exceptional Access Program, and the Ontario Drug Benefit Formulary for T-DM1, trastuzumab, lapatinib, and capecitabine, respectively), recommended dosage (sourced from trial data and Cancer Care Ontario), mean treatment exposure (sourced from trial data), and RDI (sourced from trial data). For lapatinib and capecitabine, and T-DM1 and capecitabine monotherapy, RDI was calculated based on the median dose received, as reported in the trial data, divided by the planned dose. The sponsor assumed no wastage in the reference case. Treatment administration costs included a 1-off cost of $25.75 for oral treatments (based on the physician fee from the Ontario Schedule of Benefits: Physician Services) and a $92.16 per cycle cost for IV treatments (considering nurse, pharmacist, and physician costs, and overhead costs for infusion chair time). Time on treatment was applied as a mean duration for each treatment based on the median PFS sourced from clinical trial data (HER2CLIMB3 and EMILIA4). Post-progression treatment costs included costs of capecitabine monotherapy; no cost was assumed for best supportive care. AE costs were primarily derived using the Ontario Case Costing Analysis tool, supplemented by the sponsor’s assumptions for AEs requiring inpatient care. Antidiarrheal medication costs were taken from the Ontario Drug Benefit Formulary. End-of-life care costs (one-time cost of $22,250) were based on a published study assessing the costs of care in the last 12 months of life for female patients with breast cancer in Ontario from 1997 to 2007.6 Health state costs were derived from a published study assessing health care utilization and costs for postmenopausal women with estrogen receptor–positive, HER2-negative unresectable advanced breast cancer ($361.58 per month for the progression-free health state, and $544.59 per month for the progressed health state).7 Health state, end-of-life care costs, and costs of chair time for infusion therapies were inflated to 2020 Canadian dollars using the Canadian Consumer Price Index.
Summary of Sponsor’s Economic Evaluation Results
All analyses were run probabilistically using 5,000 iterations. The deterministic and probabilistic results were similar. The probabilistic findings are presented subsequently. Comparator costs are based on publicly available list prices and may not reflect actual costs paid by public drug plans.
Base-Case Results
In the sponsor’s base case, tucatinib-combination therapy was associated with estimated costs of $150,588 and 1.73 QALYs over a 10-year time horizon. Tucatinib-combination therapy was associated with more costs and more QALYs compared with capecitabine monotherapy, trastuzumab and capecitabine, lapatinib and capecitabine, and T-DM1. Based on the sequential analysis, tucatinib-combination therapy is the preferred treatment option at a cost-effectiveness threshold of $245,096 per QALY or greater. Results are presented in Table 3. At a cost-effectiveness threshold of $50,000 per QALY, the probability of tucatinib-combination therapy being the most cost-effective intervention was 0%.
Drug acquisition costs were a key driver of the results. The majority of the QALY gains were accrued while patients were in the progression-free health state (57%) and during the within-trial period (86%). Additional results from the sponsor’s submitted economic evaluation base case are presented in Appendix 3 (i.e., efficacy frontier and cost-effectiveness acceptability curve).
Table 3: Summary of the Sponsor’s Economic Evaluation Results
Drug | Total costs ($) | Total QALYs | ICER vs. capecitabine monotherapy ($/QALY) | Sequential ICER ($/QALY) |
|---|---|---|---|---|
Capecitabine monotherapy | 32,169 | 0.99 | Reference | Reference |
Trastuzumab + capecitabine | 44,587 | 1.30 | 40,495 | 40,495 |
T-DM1 | 107,628 | 1.56 | 133,277 | 242,908 |
Tucatinib + trastuzumab + capecitabine | 150,588 | 1.73 | 159,710 | 245,096 |
Lapatinib + capecitabine | 58,726 | 1.21 | 122,121 | Dominated by trastuzumab + capecitabine |
ICER = incremental cost-effectiveness ratio; QALY = quality-adjusted life-year; T-DM1 = trastuzumab emtansine.
Note: Dominated refers to a treatment having a higher total cost and lower total QALYs when compared with the previous less costly treatment.
Source: Sponsor’s pharmacoeconomic submission.5
Sensitivity and Scenario Analysis Results
The sponsor conducted scenario analyses to assess the impact of conducting the cost-effectiveness analysis over a 5-year time horizon, using alternative health state utility values from the literature, including consideration for drug wastage, and conducting an analysis using the HER2CLIMB data for a comparison of tucatinib-combination therapy compared with trastuzumab and capecitabine. Scenario analyses were run at 2,000 iterations and all scenarios resulted in higher ICER estimates, which ranged from $245,857 per QALY for tucatinib-combination therapy compared with trastuzumab plus capecitabine when including drug wastage (T-DM1 subject to extended dominance), to $279,135 per QALY for tucatinib-combination therapy compared with T-DM1 when considering a 5-year time horizon. No subgroup analyses were conducted by the sponsor.
CADTH Appraisal of the Sponsor’s Economic Evaluation
CADTH identified several key limitations of the sponsor’s analysis that have notable implications on the economic analysis:
The magnitude of benefit of tucatinib-combination therapy compared with included comparators is uncertain. Due to the lack of direct evidence available for the comparative efficacy of tucatinib-combination therapy versus all comparators included in the sponsor’s model (i.e., trastuzumab with capecitabine, lapatinib with capecitabine, T-DM1, and capecitabine monotherapy), the sponsor conducted an NMA to obtain relative treatment effects to inform the submitted pharmacoeconomic model. The baseline PFS and OS curves for trastuzumab and capecitabine were derived from the HER2CLIMB trial, and all other comparator curves (including tucatinib-combination therapy) were derived by applying the hazard ratios from the NMA to the trastuzumab and capecitabine PFS and OS curves. As indicated in the CADTH Clinical Review Report’s appraisal of the indirect evidence, there were a limited number of studies informing each comparison within the network, differences in trial characteristics between studies included in the NMA, changes in treatment paradigms for metastatic breast cancer over the past 10 years (which are likely to have resulted in differences in overall patient outcomes, given that the included trials were published between 2008 and 2020), a lack of adjustment for effect modifiers (e.g., differences in study and patient characteristics, such as line of treatment and presence of brain metastasis), and concerns regarding the sponsor’s assumption of the proportional hazards assumption being met, especially for PFS. As a result, the CADTH Clinical Review concluded that the true magnitude of the relative treatment effects for tucatinib-combination therapy, in comparison with the comparators included in the submitted economic model and based on the submitted NMA, is uncertain.
Given that direct OS and PFS data for tucatinib-combination therapy are available from the HER2CLIMB trial, CADTH used the results of the HER2CLIMB data to inform the OS and PFS curves for tucatinib-combination therapy in the base-case reanalysis. In the absence of alternative data, CADTH retained the hazard ratio estimates derived from the sponsor-submitted NMA for the rest of the included comparators.
CADTH conducted a scenario analysis to assess the impact of using the hazard ratios from the NMA to derive the OS and PFS curves for tucatinib-combination therapy, and using the random-effects results from the NMA instead of the fixed-effects results.
There are concerns regarding the external validity of the OS and PFS extrapolations. The survival functions used in the economic model for the trastuzumab and capecitabine treatment were based on HER2CLIMB trial data that include approximately 36 months (3 years) of data. The remainder of the time horizon (total of 10 years in the sponsor’s base case) is based on the extrapolation of these functions. As stated in the CADTH Clinical Review Report, the differences in subsequent therapies received by patients in the HER2CLIMB trial are expected to introduce bias in the efficacy analyses, including OS; however, the magnitude and direction of this bias is unknown. Additionally, based on feedback from the clinical experts consulted for this review, the OS and PFS data predicted by the sponsor’s survival functions are higher than what would be expected in clinical practice. Most patients in this population are unlikely to remain alive after 5 years; however, the curve selected by the sponsor suggests that approximately 1.4% and 5.4% of patients would be alive at 5 years with trastuzumab and capecitabine, and tucatinib-combination therapy, respectively, which was deemed unlikely by the clinical experts consulted by CADTH for this review. Consequently, the extrapolations selected by the sponsor were not plausible and led to an overestimation of underlying survival. These extrapolations led to an overestimation of the incremental QALYs associated with tucatinib-combination therapy relative to its comparators and biased the results in its favour.
CADTH used alternative assumptions for the OS curve (Gompertz) for trastuzumab and capecitabine in the CADTH base-case reanalysis. CADTH retained the sponsor’s assumption for the PFS curve for trastuzumab and capecitabine.
CADTH conducted a scenario analysis using a time horizon of 5 years.
The comparators included in the sponsor’s model vary according to line of therapy and may not align with Canadian clinical practice. Several issues with the comparators considered in the sponsor’s model were identified. The sponsor’s model compared tucatinib-combination therapy with capecitabine monotherapy, trastuzumab and capecitabine, lapatinib and capecitabine, and T-DM1 regardless of line of therapy. According to the clinical experts consulted by CADTH for this review, T-DM1 would not be a relevant comparator for tucatinib-combination therapy when tucatinib is used in the third-line metastatic setting (given that T-DM1 is a standard second-line treatment option). T-DM1 may be a relevant comparator in the second-line metastatic setting in cases where a patient may be eligible for tucatinib as a result of receiving T-DM1 in the adjuvant or neoadjuvant setting (and depending on the disease-free interval). When undertaking a sequential analysis, the inclusion of comparators that may not be relevant in certain settings impacts the appropriate interpretation of the cost-effectiveness of tucatinib-combination therapy. As stated in the CADTH Clinical Review Report, the average number of therapies used among patients in the HER2CLIMB trial was 4, with most patients having received trastuzumab, pertuzumab, and T-DM1 in either the metastatic setting or in the metastatic and neoadjuvant or adjuvant setting; however, no efficacy or safety data according to line of therapy were identified. The clinical experts consulted by CADTH indicated they would expect the relative clinical efficacy and safety of tucatinib-combination therapy to be similar regardless of treatment setting; however, the clinical experts recognized the lack of data in this setting as well as uncertainty in potential differences in underlying survival for these 2 populations. The duration of therapy and post-progression treatments received are likely to vary according to treatment setting, which could have implications on the relative costs and QALYs attained.
The clinical experts consulted by CADTH identified neratinib with capecitabine, trastuzumab with endocrine therapy, and endocrine therapy alone as additional relevant comparators in the third-line treatment setting that were not included in the sponsor’s pharmacoeconomic model. As a result, the cost-effectiveness of tucatinib-combination therapy versus neratinib with capecitabine, trastuzumab with endocrine therapy, and endocrine therapy alone in the third-line setting is unknown.
CADTH interpreted the results of the reanalysis according to the relevant comparators separately for the second (tucatinib-combination therapy versus T-DM1) and third-line setting (tucatinib-combination therapy versus capecitabine monotherapy, trastuzumab and capecitabine, and lapatinib and capecitabine).
CADTH was unable to address the omission of relevant comparators in the third-line setting (e.g., neratinib with capecitabine, trastuzumab with endocrine therapy, and endocrine therapy alone).
There is uncertainty associated with how the RDI assumptions impact treatment costs. The sponsor calculated pre-progression treatment costs per patient per cycle based on the price of the drug(s), the dose required per cycle, RDI, and the anticipated duration of treatment. RDIs were calculated separately for each drug within a regimen. For trastuzumab, the sponsor assumed that the RDI in cycle 2 and later cycles was ||||||||| for tucatinib-combination therapy, and |||||||||| when used with capecitabine, which was in line with the RDI used for capecitabine based on the HER2CLIMB trial. The clinical experts consulted by CADTH for this review indicated that a 100% RDI for trastuzumab for cycle 2 and later cycles would be more reasonable, given that dose reductions are not recommended with the use of trastuzumab.8 In this case, the RDI would be intended to reflect missed doses, which are typically due to cardiotoxicity only which, based on HER2CLIMB trial data, were relatively infrequent (≤ 2% of patients in each arm were reported with treatment-emergent left ventricular systolic dysfunction leading to dose modification or discontinuation2). The underestimation of RDI for trastuzumab led to an underestimation of the incremental costs associated with tucatinib-combination therapy when compared with other relevant comparators.
The sponsor also adjusted the costs of drugs administered orally using an RDI. This practice likely underestimated the total expenditure associated with all oral-based regimens. For oral treatments, Canadian pharmacies are likely to dispense the full quantity of medication for each treatment cycle and excess tablets are unlikely to be recuperated. The cost of medication is therefore independent of any dose reductions observed in the trial during the course of the treatment. Due to the high cost of tucatinib, this underestimated the incremental costs associated with tucatinib, biasing results in its favour.
CADTH revised the sponsor’s base case to include 100% trastuzumab RDI in cycle 2 and later cycles and 100% RDI for all orally administered therapies (i.e., tucatinib, lapatinib, and capecitabine). CADTH also conducted a scenario analysis that assumed 100% RDI for all treatments.
There are limitations associated with health state utility estimates. Health state utility estimates were sourced from HRQoL data collected using the EQ-5D-5L questionnaire as part of the HER2CLIMB trial. As stated in the CADTH Clinical Review Report, the EQ-5D-5L questionnaire was included as part of a protocol amendment, resulting in only half of the patients in the trial having utility data available. In the progression-free health state, utility values varied according to the cycle of treatment received by patients. According to the clinical experts consulted by CADTH for this review, it is likely that the quality of life for the majority of patients is expected to remain relatively stable over the course of progressive cycles of treatment. Some patients may experience improved HRQoL with dose adjustments or side effect management, and some patients may experience a reduction in HRQoL due to cumulative fatigue; however, quality of life is unlikely to change substantially beyond 3 treatment cycles. An overestimate of the utility associated with a greater number of treatment cycles led to an overestimate of the incremental QALYs associated with tucatinib-combination therapy relative to comparator drugs.
CADTH revised the health state utility values for patients in the progression-free health state to remain constant regardless of the cycle of treatment. Given the limitations in the HRQoL data obtained from the HER2CLIMB trial, CADTH conducted a scenario analysis using the sponsor-provided published literature values.
Calculation errors are present in the probabilistic results of the sponsor’s model. When an alternative OS curve (Gompertz) was selected for the CADTH reanalysis, the probabilistic analysis resulted in calculation errors, the source of which CADTH was unable to determine. The sponsor’s model was programmed with limited transparency, preventing CADTH from fully exploring uncertainty with the parameters in the model.
Removing the variability (i.e., using the point estimates) in the Gompertz curve while running the rest of the model probabilistically produced valid results. This approach was used for the revised CADTH base case.
Additionally, the following key assumptions were made by the sponsor and have been appraised by CADTH (Table 4).
Table 4: Key Assumptions of the Submitted Economic Evaluation (Not Noted as Limitations of the Submission)
Sponsor’s key assumption | CADTH comment |
|---|---|
Capecitabine included as chemotherapy comparator only. | Reasonable. Clinical experts consulted by CADTH indicated that although other chemotherapies (e.g., carboplatin, paclitaxel, and vinorelbine) may be used, capecitabine is most commonly used. |
Median PFS was used to estimate the mean treatment duration for all interventions. | Uncertain. Using median PFS as a proxy for mean treatment duration assumes that treatment will continue until progression, which may not occur in clinical practice. The clinical experts consulted by CADTH indicated that the mean treatment duration for all interventions seemed reasonable. |
A patient progressing on third-line treatment would receive chemotherapy (i.e., capecitabine monotherapy) or BSC. | The clinical experts consulted by CADTH indicated that this assumption is reasonable. |
A total of 50% of patients would likely require inpatient care to manage vomiting, thrombocytopenia, and diarrhea. All other AEs were assumed to be managed on an outpatient basis only. | The clinical experts consulted by CADTH indicated that this assumption is reasonable. |
Assumed 10% variability in mean values to inform uncertainty in input parameters (e.g., for drug administration costs, adverse event unit costs, health state costs, adverse event utility decrements). | Not appropriate. Some cost parameters may be appropriately fixed (i.e., have no uncertainty) and, for others, the generic 10% variability in mean values may overestimate or underestimate the uncertainty, depending on the parameter. |
AE = adverse event; BSC = best supportive care; OS = overall survival; PFS = progression-free survival; QALY = quality-adjusted life-year.
CADTH Reanalyses of the Economic Evaluation
Base-Case Results
The CADTH base case was derived by making changes in model parameter values and assumptions, in consultation with the clinical experts. Results are reported separately according to second- and third-line setting. The reanalyses that are incorporated in the CADTH base-case reanalysis include using an alternate OS survival curve for trastuzumab plus capecitabine (Gompertz), using the dependent survival curves as the source of clinical efficacy information for tucatinib-combination therapy, adjusting the RDI of trastuzumab within trastuzumab-containing regimens and drugs administered orally, and setting the progression-free utility to be consistent across treatment cycles. These reanalyses are outlined in Table 5. Comparator costs are based on publicly available list prices and may not reflect actual costs paid by public drug plans. All analyses were run probabilistically (5,000 iterations), though the Gompertz curve parameters had to remain deterministic within the relevant analyses in order for the sponsor’s model to produce valid results.
Table 5: CADTH Revisions to the Submitted Economic Evaluation
Stepped analysis | Sponsor’s value or assumption | CADTH value or assumption |
|---|---|---|
Corrections to sponsor’s base case | ||
None | None | None |
Changes to derive the CADTH base case | ||
1. OS survival curve for trastuzumab + capecitabine | Weibull | Gompertza |
2. Source of efficacy data for tucatinib + trastuzumab + capecitabine | Based on HRs from the NMA | Based on dependent survival curves from HER2CLIMB data |
3. RDI for cycle 2+ for trastuzumab and for all drugs administered orally (i.e., tucatinib, lapatinib, and capecitabine) | Tucatinib + trastuzumab + capecitabine Tucatinib = |||||||||| RDI Trastuzumab = |||||||||| cycle 1; |||||||||| cycle 2+ RDI Capecitabine = |||||||||| RDI Trastuzumab + capecitabine Trastuzumab = |||||||||| cycle 1; |||||| cycle 2+ RDI Capecitabine = |||||| RDI Lapatinib + capecitabine Lapatinib = 100% Capecitabine = 86.5% Capecitabine monotherapy Capecitabine = 78.8% | Tucatinib + trastuzumab + capecitabine Tucatinib = 100% Trastuzumab = As per sponsor cycle 1; 100% cycle 2+ RDI Capecitabine = 100% Trastuzumab + capecitabine Trastuzumab = As per sponsor cycle 1; 100% cycle 2+ RDI Capecitabine = 100% Lapatinib + capecitabine Lapatinib = 100% Capecitabine = 100% Capecitabine monotherapy Capecitabine = 100% |
4. Progression-free health state utility values | Progression-free, cycle 1 to 2: |||||||| Progression-free, cycle 3 to 4: |||||||| Progression-free, cycle 5 to 6: |||||||| Progression-free, cycle 7+: |||||| | Progression-free, cycle 1 to 2: |||||||| Progression-free, cycle 3 to 4: |||||||| Progression-free, cycle 5 to 6: |||||||| Progression-free, cycle 7+: |||||| |
CADTH base case | Reanalysis 1 + 2 + 3 + 4 | |
HR = hazard ratio; OS = overall survival; RDI = relative dose intensity.
aParameters for the Gompertz curve were incorporated deterministically due to limitations with the sponsor’s model.
In the CADTH base case, the costs associated with tucatinib therapy totalled $166,368 and the total QALYs were 1.53. The CADTH base-case results for tucatinib-combination therapy in the second-line and third-line setting are presented in Table 6 and Table 7, respectively.
In the second-line setting, tucatinib-combination therapy was associated with an ICER of $512,403 per QALY compared with T-DM1, with the majority of the incremental QALYs accrued during the within-trial period (75%). The probability of tucatinib-combination therapy being cost-effective at a WTP of $50,000 per QALY was 0%. Disaggregated results of the CADTH base case for the second-line setting are presented in Table 14.
In the third-line setting, tucatinib-combination therapy was associated with a sequential ICER of $381,429 per QALY compared with trastuzumab plus capecitabine, with the majority of the incremental QALYs accrued during the within-trial period (81%). The probability of tucatinib-combination therapy being cost-effective at a WTP of $50,000 per QALY was 0% in the third-line setting. Disaggregated results of the CADTH base case in the third-line setting are presented in Table 15.
Table 6: Summary of the CADTH Reanalysis Results — Second Line
Drug | Total costs | Incremental costs ($) | Total QALYs | Incremental QALYs | ICER vs. reference ($/QALYs) |
|---|---|---|---|---|---|
T-DM1 | 107,205 | Reference | 1.41 | Reference | Reference |
Tucatinib-combination therapy | 166,368 | 59,163 | 1.53 | 0.12 | 512,403 |
ICER = incremental cost-effectiveness ratio; QALY = quality-adjusted life-year; T-DM1 = trastuzumab emtansine.
Table 7: Summary of the CADTH Reanalysis Results — Third Line
Drug | Total costs ($) | Total QALYs | ICER vs. capecitabine monotherapy ($/QALY) | Sequential ICER ($/QALY) |
|---|---|---|---|---|
Capecitabine monotherapy | 32,183 | 0.96 | Reference | Reference |
Trastuzumab + capecitabine | 46,418 | 1.22 | 54,750 | $54,750 |
Tucatinib-combination therapy | 166,368 | 1.53 | 233,579 | $381,429 |
Lapatinib + capecitabine | 58,597 | 1.14 | 141,706 | Dominated by trastuzumab + capecitabine |
ICER = incremental cost-effectiveness ratio; QALY = quality-adjusted life-year.
Scenario Analysis Results
Scenario analyses were conducted using the CADTH base case to investigate the impact of shortening the time horizon, using the efficacy estimates from the NMA for tucatinib-combination therapy, using the random-effects results instead of the fixed-effects results from the sponsor-submitted ITC, using the sponsor’s OS curve for trastuzumab plus capecitabine (i.e., Weibull), and assuming 100% RDIs for all drugs. Results for these scenario analyses ranged from $397,487 per QALY to $832,113 per QALY in the second-line setting, and $301,681 per QALY to $382,571 per QALY in the third-line setting. Results of the scenario analyses are presented in Table 18 and Table 19. Under no scenario did tucatinib-combination therapy approach an ICER considered cost-effective at a WTP threshold of $50,000 per QALY at the submitted price.
Price reduction analyses were also conducted using both the sponsor’s and CADTH’s base case. When considering the CADTH base case, the submitted price of tucatinib would need to be reduced by approximately 48% in the second-line setting and 94% in the third-line setting for tucatinib-combination therapy to be considered cost-effective at a WTP threshold of $50,000 per QALY. Details of the CADTH price reduction analyses in the second- and third-line setting are shown in Table 8 and Table 9, respectively.
Table 8: CADTH Price Reduction Analyses — Second Line
Price reduction | ICERs for tucatinib-combination therapy vs. T-DM1 | |
|---|---|---|
Sponsor base case ($) | CADTH reanalysis ($) | |
No price reduction | 245,096 | 512,403 |
10% | 184,452 | 415,042 |
20% | 127,715 | 317,281 |
30% | 71,257 | 219,520 |
40% | 15,240 | 121,759 |
50% | Tucatinib-combination therapy is dominant | 23,997 |
60% | Tucatinib-combination therapy is dominant | Tucatinib-combination therapy is dominant |
ICER = incremental cost-effectiveness ratio; T-DM1 = trastuzumab emtansine.
Note: Deterministic results presented for price reductions on CADTH base case.
Table 9: CADTH Price Reduction Analyses — Third Line
Price reduction | ICERs for tucatinib-combination therapy vs. capecitabine monotherapy and trastuzumab + capecitabinea | ||
|---|---|---|---|
Therapy | Willingness to pay | ||
Sponsor base case | CADTH reanalysis | ||
No price reduction | Capecitabine monotherapy | < $40,495 | < $54,750 |
Trastuzumab with capecitabine | ≥ $40,495 and < $243,790 | ≥ $54,750 and < $381,429 | |
Tucatinib-combination therapy | ≥ $243,790 | ≥ $381,429 | |
10% | Capecitabine monotherapy | < $40,241 | < $54,655 |
Trastuzumab with capecitabine | ≥ $40,241 and < $219,611 | ≥ $54,655 and < $345,185 | |
Tucatinib-combination therapy | ≥ $219,611 | ≥ $345,185 | |
20% | Capecitabine monotherapy | < $40,406 | < $54,655 |
Trastuzumab with capecitabine | ≥ $40,406 and < $196,858 | ≥ $54,655 and < $309,222 | |
Tucatinib-combination therapy | ≥ $196,858 | ≥ $309,222 | |
30% | Capecitabine monotherapy | < $40,282 | < $54,655 |
Trastuzumab with capecitabine | ≥ $40,282 and < $173,280 | ≥ $54,655 and < $273,259 | |
Tucatinib-combination therapy | ≥ $173,280 | ≥ $273,259 | |
40% | Capecitabine monotherapy | < $40,328 | < $54,655 |
Trastuzumab with capecitabine | ≥ $40,328 and < $151,566 | ≥ $54,655 and < $237,296 | |
Tucatinib-combination therapy | ≥ $151,566 | ≥ $237,296 | |
50% | Capecitabine monotherapy | < $40,312 | < $54,655 |
Trastuzumab with capecitabine | ≥ $40,312 and < $128,445 | ≥ $54,655 and < $201,333 | |
Tucatinib-combination therapy | ≥ $128,445 | ≥ $201,333 | |
60% | Capecitabine monotherapy | < $40,501 | < $54,655 |
Trastuzumab with capecitabine | ≥ $40,501 and < $105,572 | ≥ $54,655 and < $165,370 | |
Tucatinib-combination therapy | ≥ $105,572 | ≥ $165,370 | |
70% | Capecitabine monotherapy | < $40,409 | < $54,655 |
Trastuzumab with capecitabine | ≥ $40,409 and < $82,370 | ≥ $54,655 and < $129,407 | |
Tucatinib-combination therapy | ≥ $82,370 | ≥ $129,407 | |
80% | Capecitabine monotherapy | < $40,207 | < $54,655 |
Trastuzumab with capecitabine | ≥ $40,207 and < $58,703 | ≥ $54,655 and < $93,444 | |
Tucatinib-combination therapy | ≥ $58,703 | ≥ $93,444 | |
90% | Capecitabine monotherapy | < $37,719 | < 54,655 |
Trastuzumab with capecitabine | Trastuzumab + capecitabine subject to extended dominance through capecitabine monotherapy and tucatinib-combination therapy | ≥ $54,655 and < $57,482 | |
Tucatinib-combination therapy | ≥ $37,719 | ≥ $57,482 | |
100% | Capecitabine monotherapy | < $24,357 | < 36,502 |
Trastuzumab with capecitabine | Trastuzumab + capecitabine subject to extended dominance through capecitabine monotherapy and tucatinib-combination therapy | ||
Tucatinib-combination therapy | ≥ $24,357 | ≥ 36,502 | |
ICER = incremental cost-effectiveness ratio.
Note: Deterministic results presented for price reductions on CADTH base case.
aLapatinib with capecitabine was dominated in the CADTH reanalysis and therefore not considered in the price reduction analysis.
Issues for Consideration
Approximately 48% of patients in the HER2CLIMB trial had brain metastasis. While the HER2CLIMB trial’s statistical analysis plan pre-specified enrolling enough patients with brain metastases to ensure appropriate statistical power, comparator trials included in the sponsor’s ITC did not follow a similar statistical protocol. The trials included in the sponsor’s ITC enrolled few or no patients with brain metastases, which did not allow for comparisons of treatment efficacy between tucatinib-combination therapy and relevant comparator treatments. Therefore, comparisons of treatment effects for the subgroup of patients with brain metastases are unknown and the cost-effectiveness of tucatinib-combination therapy compared with relevant comparator drugs for patients with and without brain metastasis is unknown, as well.
The HER2CLIMB trial excluded patients previously treated with capecitabine and lapatinib unless treatment with capecitabine as adjuvant or neoadjuvant treatment was administered 12 or more months before initiating treatment in the trial and unless treatment with lapatinib was received 12 or more months before initiating treatment in the trial. As stated in the CADTH Clinical Review Report, the clinical experts consulted by CADTH for this review indicated that patients who received capecitabine and lapatinib under the circumstances described may be eligible for tucatinib-combination therapy in practice. The cost-effectiveness of tucatinib-combination therapy in these settings is unknown.
The potential safety issues of take-home cancer drugs were reported by patient groups as important considerations for the use of tucatinib; however, these concerns were not included in the model, nor could they be addressed in the CADTH reanalysis.
Input from public drug plans indicated that trastuzumab and capecitabine combination therapy is not currently funded in most Canadian jurisdictions when used after pertuzumab, trastuzumab, and T-DM1; funded therapies typically include capecitabine monotherapy and other chemotherapy options. The inclusion of comparators that are not currently publicly funded may limit the interpretation of the cost-effectiveness and may underestimate the overall budget impact of tucatinib-combination therapy, as well.
Overall Conclusions
Based on the CADTH Clinical Review Report, tucatinib-combination therapy had a statistically and clinically significant improvement in OS and PFS compared with the trastuzumab and capecitabine combination alone, based on data from the HER2CLIMB trial. The comparative efficacy and safety data for tucatinib-combination therapy versus other relevant comparators (e.g., T-DM1, lapatinib plus capecitabine, and chemotherapy alone) were based on indirect evidence that favoured tucatinib-combination therapy; however, the magnitude of the effect was associated with some uncertainty due to several key limitations of the ITC. These limitations included the limited number of studies informing the network, considerable heterogeneity between trials, and limitations in the methods of analyses. The expected impact of these limitations on the magnitude of the efficacy of tucatinib-combination therapy relative to comparators is uncertain.
CADTH identified several limitations with the submitted economic evaluation, including uncertainty in the OS and PFS data informing the model due to limitations in the sponsor-submitted ITC, an overestimation of underlying survival estimates, the lack of distinction between the cost-effectiveness of tucatinib-combination therapy according to use in the second- or third-line setting, an underestimate of the RDI assumed for trastuzumab and drugs administered orally, and an overestimation of the utility associated with progressive cycles of treatment. CADTH undertook a reanalysis to address the limitations in the sponsor’s submission, which included using an alternative OS curve for trastuzumab and capecitabine, using efficacy data from the HER2CLIMB trial for tucatinib-combination therapy, assuming 100% RDI for trastuzumab in cycle 2 and later cycles and for drugs administered orally, applying the same progression-free health state utility value regardless of treatment cycle number, and presenting the results for tucatinib-combination therapy according to its use in the second- and third-line setting, given the differences in relevant comparator drugs according to line of therapy.
In the CADTH base case, tucatinib-combination therapy was more effective (gain of 0.12 QALYs) and more costly (increased costs of $59,163) than T-DM1 in the second-line setting, with an ICER of $512,403 per QALY. In the third-line setting, tucatinib-combination therapy was more effective and more costly than trastuzumab plus capecitabine and capecitabine monotherapy, with a sequential ICER of $381,429 per QALY compared with trastuzumab with capecitabine. Tucatinib-combination therapy had a 0% chance of being cost-effective in the second- and third-line setting at a WTP threshold of $50,000 per QALY. A price reduction of at least 48% for the second- and 94% for the third-line setting is required for tucatinib-combination therapy to be cost-effective at this threshold.
Tucatinib-combination therapy was not cost-effective under any scenarios undertaken in the CADTH reanalysis at a WTP threshold of $50,000 per QALY. CADTH was unable to address the omission of relevant comparators (e.g., neratinib with capecitabine, trastuzumab with endocrine therapy, and endocrine therapy alone) in the third-line treatment setting and the cost-effectiveness of tucatinib-combination therapy according to the presence of brain metastasis. CADTH’s reanalysis demonstrated that the cost-effectiveness of tucatinib-combination therapy varied according to whether it was used in the second or third line; however, it was not cost-effective in either setting. Given the associated limitations in the clinical evidence, the price reduction required for tucatinib to be cost-effective in the second- and third-line setting may be higher.
References
1.Tukysa (tucatinib): 50 mg and 150 mg oral tablets [product monograph]. Milton (ON): McKesson Speciality Distribution Inc; 2020 Jun 3.
2.Drug Reimbursement Review sponsor submission: Tukysa (tucatinib), doses and administration [internal sponsor's package]. Mississauga (ON): Seagen Canada Inc; 2021 Mar 26.
3.Murthy RK, Loi S, Okines A, et al. Tucatinib, Trastuzumab, and Capecitabine for HER2-Positive Metastatic Breast Cancer. N Engl J Med. 2020;382(7):597-609. PubMed
4.Verma S, Miles D, Gianni L, et al. Trastuzumab Emtansine for HER2-Positive Advanced Breast Cancer. N Engl J Med. 2012;367(19):1783-1791. PubMed
5.Pharmacoeconomic evaluation [internal sponsor's report]. In: Drug Reimbursement Review sponsor submission: Tukysa (tucatinib), 50 mg and 150 mg oral tablets. Mississauga (ON): Seagen Canada Inc; 2021 Mar 26.
6.de Oliveira C, Pataky R, Bremner KE, et al. Phase-specific and lifetime costs of cancer care in Ontario, Canada. BMC Cancer. 2016;16(1):809. PubMed
7.Lambert-Obry V, Gouault-Laliberte A, Castonguay A, et al. Real-world patient- and caregiver-reported outcomes in advanced breast cancer. Curr Oncol. 2018;25(4):e282-e290. PubMed
8.Product Monograph - Herceptin.
9.Ontario Ministry of H, Ontario Ministry of Long-Term C. Ontario drug benefit formulary/comparative drug index. 2021; https://www.formulary.health.gov.on.ca/formulary/. Accessed 1800 Mth Dd.
10.Cancer Care Ontario: funded evidence-informed regimens. 2021; https://www.cancercareontario.ca/en/drugformulary/regimens. Accessed Mth Dd, 1800.
11.Saura C, Oliveira M, Feng Y-H, et al. Neratinib Plus Capecitabine Versus Lapatinib Plus Capecitabine in HER2-Positive Metastatic Breast Cancer Previously Treated With ≥ 2 HER2-Directed Regimens: Phase III NALA Trial. J Clin Oncol. 2020;38(27):3138-3149. PubMed
12.Budget Impact Analysis [internal sponsor's report]. In: Drug Reimbursement Review sponsor submission: Drug name, doses and administration. City (PROV): Sponsor name; 1800 Jan 1.
13.Canada H. Summary Basis of Decision - Tukysa - Health Canada. 2020; https://hpr-rps.hres.ca/reg-content/summary-basis-decision-detailTwo.php?lang=en&linkID=SBD00498. Accessed May, 2021.
14.Choong GM, Cullen GD, O’Sullivan CC. Evolving standards of care and new challenges in the management of HER2-positive breast cancer. CA Cancer J Clin. 2020;70(5):355-374. PubMed
15.Slamon DJ, Clark GM, Wong SG, Levin WJ, Ullrich A, McGuire WL. Human breast cancer: correlation of relapse and survival with amplification of the HER-2/neu oncogene. Science. 1987;235(4785):177-182. PubMed
16.Mariotto AB, Etzioni R, Hurlbert M, Penberthy L, Mayer M. Estimation of the Number of Women Living with Metastatic Breast Cancer in the United States. Cancer Epidemiol Biomarkers Prev. 2017;26(6):809-815. PubMed
17.Swain SM, Baselga J, Kim SB, et al. Pertuzumab, trastuzumab, and docetaxel in HER2-positive metastatic breast cancer. N Engl J Med. 2015;372(8):724-734. PubMed
18.Verma S, Miles D, Gianni L, et al. Trastuzumab emtansine for HER2-positive advanced breast cancer. N Engl J Med. 2012;367(19):1783-1791. PubMed
Appendix 1: Cost Comparison Table
Note that this appendix has not been copy-edited.
The comparators presented in the following table have been deemed to be appropriate based on feedback from clinical experts and drug plans. Comparators may be recommended (appropriate) practice or actual practice. Existing Product Listing Agreements are not reflected in the table and as such, the table may not represent the actual costs to public drug plans.
Table 10: CADTH Cost Comparison Table for Advanced or Metastatic Breast Cancer — Second Line
Treatment | Strength or concentration | Form | Price ($) | Recommended dosage | Daily cost ($) | 21-day cycle cost ($) |
|---|---|---|---|---|---|---|
Tucatinib-combination therapy | ||||||
Tucatinib (Tukysa) | 50 mg 150 mg | Tablet | 3,610.00a 7,170.00a | 300 mg (twice daily, continuously in combination with trastuzumab and capecitabine until disease progression or unacceptable toxicity) | 478.00 | 10,038 |
Trastuzumab (biosimilar) | 21 mg/mL | Powder for IV infusion:
| 506.1405 1,417.2060 1,417.1960 | 8 mg/kg intravenously on day 1 and 6 mg/kg intravenously (every 21 days) | First cycle:b
Thereafter:b
| First cycle:b
Thereafter:b
|
Capecitabine (generic) | 150 mg 500 mg | Tablet | 0.4575c 1.5250c | 1,000 mg/m2 (twice daily, days 1 to 14 every 21 days) | 7.32 | 154 |
Tucatinib + trastuzumab + capecitabine (first cycle) | 581.73 | 12,216 | ||||
Tucatinib + trastuzumab + capecitabine (thereafter) | 557.63 | 11,710 | ||||
Trastuzumab emtansine | ||||||
Trastuzumab emtansine (Kadcyla) | 20 mg/mL | Powder for IV infusion:
| 2,128.93003 406.2880 | 3.6 mg/kg (every 21 days until disease progression or unmanageable toxicity) | 304.13 | 6,387 |
Note: All prices are from IQVIA Delta PA database (accessed April 2021), unless otherwise indicated, and do not include dispensing fees.
Costs assume a body weight of 75 kg or a body surface area of 1.8 m2 and include wastage of unused medication in vials.
aSponsor’s submitted price.2
bTrastuzumab (biosimilar) is available in a 150 mg vial (single use) which, when including wastage, is the lowest-cost alternative. The 440 mg and 420 mg options including wastage cost an additional $809 in the first cycle and an additional $1,316 in subsequent cycles. If no wastage is assumed, the 440 mg option is the lowest-cost alternative (first cycle cost, $1,933; subsequent cycle cost, $1,449).
cPrice from Ontario Drug Benefit Formulary (accessed May 2021).9
Table 11: CADTH Cost Comparison Table for Advanced or Metastatic Breast Cancer — Third Line (Common Comparators)
Treatment | Strength or concentration | Form | Price ($) | Recommended dosage | Daily cost ($) | 21-day cycle cost ($) | |
|---|---|---|---|---|---|---|---|
Tucatinib-combination therapya | |||||||
Tucatinib + trastuzumab + capecitabine (first cycle) | 581.73 | 12,216 | |||||
Tucatinib + trastuzumab + capecitabine (thereafter) | 557.63 | 11,710 | |||||
Trastuzumab-based regimen (with capecitabine chemotherapy)b | |||||||
Trastuzumab (biosimilar) | 21 mg/mL | Powder for IV infusion:
| 506.1405 1,417.2060 1,417.1960 | 8 mg/kg intravenously on day 1 and 6 mg/kg intravenously (every 21 days until evidence of disease progression, or limited by drug toxicity) | First cycle:c
Thereafter:c
| First cycle:c
Thereafter:c
| |
Capecitabine (generic) | 150 mg 500 mg | Tablet | 0.4575d 1.5250d | 1,000 mg/m2 (twice daily, days 1 to 14 every 21 days) | 7.32 | 154 | |
Trastuzumab + capecitabine (first cycle) Trastuzumab + capecitabine (thereafter) | 103.73 79.63 | 2,178 1,672 | |||||
Lapatinib + capecitabineb | |||||||
Lapatinib (Tykerb) | 250 mg | Tablet | 24.641 | 1,250 mg (once daily, continuously in combination with capecitabine until disease progression or unmanageable toxicity) | 123.21 | 2,587 | |
Capecitabine (generic) | 150 mg 500 mg | Tablet | 0.4575d 1.5250d | 1,000 mg/m2 (twice daily, days 1 to 14 every 21 days) | 7.32 | 154 | |
Lapatinib + capecitabine | 130.53 | 2,741 | |||||
Chemotherapy (as monotherapy)b | |||||||
Capecitabine (generic) | 150 mg 500 mg | Tablet | 0.4575d 1.5250d | 1,250 mg/m2 (twice daily, days 1 to 14 every 21 days) | 9.15 | 192 | |
Note: All prices are from IQVIA Delta PA database (accessed April 2021), unless otherwise indicated, and do not include dispensing fees.
Costs assume a body weight of 75 kg or a body surface area of 1.8 m2 and include wastage of unused medication in vials.
Common comparators are comparators included in the sponsor’s pharmacoeconomic model.
aFull calculations for tucatinib-combination therapy are shown in Table 10.
bCancer Care Ontario regimens.10
cTrastuzumab (biosimilar) is available in a 150 mg vial (single use) which, when including wastage, is the lowest-cost alternative. The 440 mg and 420 mg options including wastage cost an additional $809 in the first cycle and an additional $1,316 in subsequent cycles. If no wastage is assumed, the 440 mg option is the lowest-cost alternative. The 150 mg and 420 mg options cost an additional $92 in the first cycle and an additional $69 in subsequent cycles.
dPrice from the Ontario Drug Benefit Formulary (accessed May 2021).9
Table 12: CADTH Cost Comparison Table for Advanced or Metastatic Breast Cancer — Third Line (Less-Common Comparators)
Treatment | Strength or concentration | Form | Price ($) | Recommended dosage | Daily cost ($) | 21-day cycle cost ($) |
|---|---|---|---|---|---|---|
Tucatinib-combination therapy a | ||||||
Tucatinib + trastuzumab + capecitabine (first cycle) | 581.73 | 12,216 | ||||
Tucatinib + trastuzumab + capecitabine (thereafter) | 557.63 | 11,710 | ||||
Trastuzumab-based regimens (with chemotherapy)b | ||||||
Trastuzumab (biosimilar) | 21 mg/mL | Powder for IV infusion:
| 506.1405 1,417.2060 1,417.1960 | 8 mg/kg intravenously on day 1 and 6 mg/kg intravenously (every 21 days until evidence of disease progression, or limited by drug toxicity) | First cycle:c
Thereafter:c
| First cycle:c
Thereafter:c
|
Carboplatin (generic) | 10 mg/mL | Vial for IV infusion:
| 70.00 210.00 600.00 775.00 | 400 mg/m2 (once every 3 weeks until disease progression or unacceptable toxicity)e | 50.00 | 1,050 |
Trastuzumab + carboplatin (first cycle) Trastuzumab + carboplatin (thereafter) | 257.14 146.41 | 5,400 3,075 | ||||
Paclitaxel (generic) | 6 mg/mL | Vial for IV infusion:
| 300.00 1,196.80 3,740.00 | 175 mg/m2 (once every 3 weeks) | 157.14 | 3,300 |
Trastuzumab + paclitaxel (first cycle) Trastuzumab + paclitaxel (thereafter) | 253.55 364.29 | 5,325 7,650 | ||||
Trastuzumab + carboplatin + paclitaxel (first cycle) Trastuzumab + carboplatin + paclitaxel (thereafter) | 303.55 414.29 | 6,375 8,700 | ||||
Vinorelbine (generic) | 10 mg/mL | Solution for injection:
| 80.00 400.00 | 30 mg/m2 weekly (until progression or dose- limiting toxicity) | 68.57 | 1,440 |
Trastuzumab + vinorelbine (first cycle) Trastuzumab + vinorelbine (thereafter) | 164.98 275.71 | 3,465 5,790 | ||||
Trastuzumab-based regimens (with endocrine therapy)b | ||||||
Trastuzumab (biosimilar) | 21 mg/mL | Powder for IV infusion:
| 506.1405 1,417.2060 1,417.1960 | 8 mg/kg intravenously on day 1 and 6 mg/kg intravenously (every 21 days until evidence of disease progression, or limited by drug toxicity) | First cycle:c
Thereafter:c
| First cycle:c
Thereafter:c
|
Fulvestrant (generic) | 50 mg/mL | Pre-filled syringe (1 dose) 2 × 5 mL | 582.8950d | 500 mg on days 1, 15, and 28 and every 28 days thereafter | First cycle:
Thereafter:
| First cycle:
Thereafter:
|
Trastuzumab + fulvestrant (first cycle) Trastuzumab + fulvestrant (thereafter) | 158.86 93.12 | 3,773 3,267 | ||||
Tamoxifen (generic) | 10 mg 20 mg | Tablet | 0.175 d 0.35 d | 20 to 40 mg daily (continuously usually until progression) | 0.35 to 0.70 | 7 to 15 |
Trastuzumab + tamoxifen (first cycle) Trastuzumab + tamoxifen (thereafter) | 96.76 to 97.11 72.66 to 73.01 | 2,032 to 2,039 1,526 to 1,533 | ||||
Letrozole (generic) | 2.5 mg | Tablet | 1.378d | 2.5 mg daily (continuously) | 1.38 | 29 |
Trastuzumab + letrozole (first cycle) Trastuzumab + letrozole (thereafter) | 97.79 73.68 | 2,054 1,547 | ||||
Exemestane (generic) | 25 mg | Tablet | 1.3263d | 25 mg (one daily, continuously until tumour progression) | 1.33 | 28 |
Trastuzumab + exemestane (first cycle) Trastuzumab + exemestane (thereafter) | 97.73 73.63 | 2,052 1,546 | ||||
Anastrozole (generic) | 1 mg | Tablet | 0.9522d | 2.5 mg daily (continuously) | 0.95 | 20 |
Trastuzumab + anastrozole (first cycle) Trastuzumab + anastrozole (thereafter) | 97.36 73.26 | 2,045 1,538 | ||||
Chemotherapy (as monotherapy) b | ||||||
Carboplatin (generic) | 10 mg/mL | Vial for IV infusion:
| 70.00 210.00 600.00 775.00 | 400 mg/m2 (once every 3 weeks until disease progression or unacceptable toxicity.)e | 50.00 | 1,050 |
Paclitaxel (generic) | 6 mg/mL | Vial for IV infusion:
| 300.00 1,196.80 3,740.00 | 175 mg/m2 (once every 3 weeks) | 157.14 | 3,300 |
Vinorelbine (generic) | 10 mg/mL | Solution for injection:
| 80.00 400.00 | 30 mg/m2 weekly (until progression or dose- limiting toxicity) | 68.57 | 1,440 |
Chemotherapy (as dual therapy: paclitaxel + carboplatin) b | ||||||
Carboplatin (generic) | 10 mg/mL | Vial for IV infusion:
| 70.00 210.00 600.00 775.00 | 400 mg/m2 (once every 3 weeks usually for a total of 6 cycles unless disease progression or unacceptable toxicity occurs) e | 50.00 | 1,050 |
Paclitaxel (generic) | 6 mg/mL | Vial for IV infusion:
| 300.00 1,196.80 3,740.00 | 175 mg/m2 (once every 3 weeks usually for a total of 6 cycles unless disease progression or unacceptable toxicity occurs) | 157.14 | 3,300 |
Paclitaxel + carboplatin | 207.14 | 4,350 | ||||
Endocrine therapy (as monotherapy)b | ||||||
Fulvestrant (generic) | 50 mg/mL | Pre-filled syringe (1 dose): 2 × 5 mL | 582.8950d | 500 mg on days 1, 15, and 28 and every 28 days thereafter. | First cycle:
Thereafter:
| First cycle:
Thereafter:
|
Tamoxifen (generic) | 10 mg 20 mg | Tablet | 0.175d 0.35d | 20 to 40 mg daily (continuously usually until progression) | 0.35 to 0.70 | 7 to 15 |
Letrozole (generic) | 2.5 mg | Tablet | 1.378d | 2.5 mg daily (continuously) | 1.38 | 29 |
Exemestane (generic) | 25 mg | Tablet | 1.3263d | 25 mg (one daily, continuously until tumour progression) | 1.33 | 28 |
Anastrozole (generic) | 1 mg | Tablet | 0.9522d | 1 mg daily (continuously) | 0.95 | 20 |
Neratinib + capecitabine | ||||||
Neratinib (Nerlynx) | 40 mg | Tablet | 45.00 | 240 mg (once daily, continuously for one year) | 270.00 | 5,670 |
Capecitabine (generic) | 150 mg 500 mg | Tablet | 0.4575d 1.5250d | 1,500 mg/m2 (daily in 2 doses of 750 mg/m2 on days 1 to 14 every 21 days)11 | 5.49 | 115 |
Neratinib + capecitabine | 275.49 | 5,785 | ||||
Note: All prices are from IQVIA Delta PA database (accessed April 2021), unless otherwise indicated, and do not include dispensing fees.
Costs assume a body weight of 75 kg or a body surface area of 1.8 m2 and include wastage of unused medication in vials.
Less-common comparators are comparators identified as relevant for the pharmacoeconomic evaluation but are less commonly used in practice and not included in the sponsor’s pharmacoeconomic model.
aFull calculations for tucatinib-combination therapy are shown in Table 10.
bCancer Care Ontario regimens.10
cTrastuzumab (biosimilar) is available in a 150 mg vial (single use) which, when including wastage, is the lowest-cost alternative. The 440 mg and 420 mg options including wastage cost an additional $809 in the first cycle and an additional $1,316 in subsequent cycles). If no wastage is assumed, the 440 mg option is the lowest-cost alternative. The 150 mg and 420 mg options cost an additional $92 in the first cycle and an additional $69 in subsequent cycles.
dPrice from the Ontario Drug Benefit Formulary (accessed May 2021).9
eProduct monograph for carboplatin suggests frequency being every 4 weeks, however, this is not breast cancer–specific.
Appendix 2: Submission Quality
Note that this appendix has not been copy-edited.
Description | Yes/No | Comments |
|---|---|---|
Population is relevant, with no critical intervention missing, and no relevant outcome missing. | No | As discussed in the key limitations section of the report, the generalizability of the comparators included in the model are limited. |
Model has been adequately programmed and has sufficient face validity . | No | Calculation errors occur when running a 5,000 iteration PSA using the Gompertz curve for OS. See key limitations. |
Model structure is adequate for decision problem. | Yes | No comment. |
Data incorporation into the model has been done adequately (e.g., parameters for probabilistic analysis). | Yes | No comment. |
Parameter and structural uncertainty were adequately assessed; analyses were adequate to inform the decision problem. | Yes | No comment. |
The submission was well organized and complete; the information was easy to locate (clear and transparent reporting; technical documentation available in enough details). | No | Results are presented in multiple sheets: deterministic, pairwise (deterministic and probabilistic), and multiway (deterministic and probabilistic), and it is unclear why pairwise and multiway calculations are running from separate probabilistic macros. |
OS = overall survival; PSA = probabilistic sensitivity analysis.
Appendix 3: Additional Information on the Submitted Economic Evaluation
Note that this appendix has not been copy-edited.
Detailed Results of the Sponsor’s Base Case
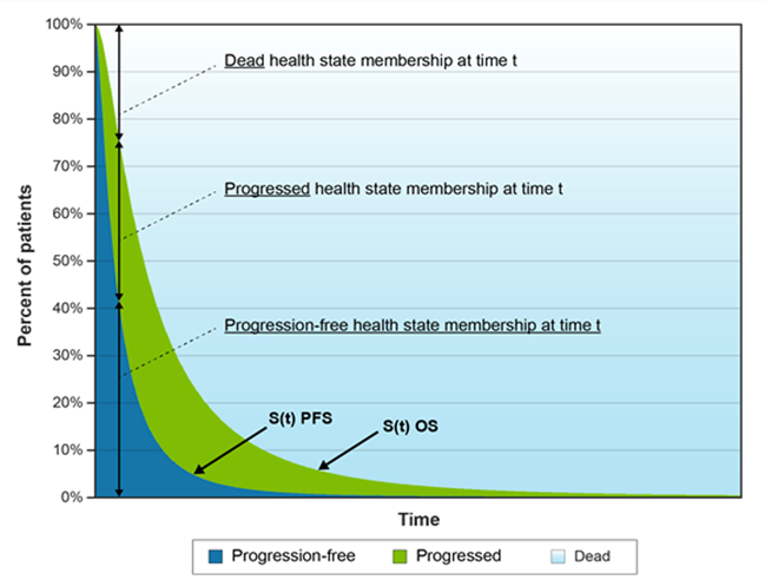
Figure 2: Cost-Effectiveness Acceptability Curve for the Sponsor's Submitted Base-Case Analysis Results
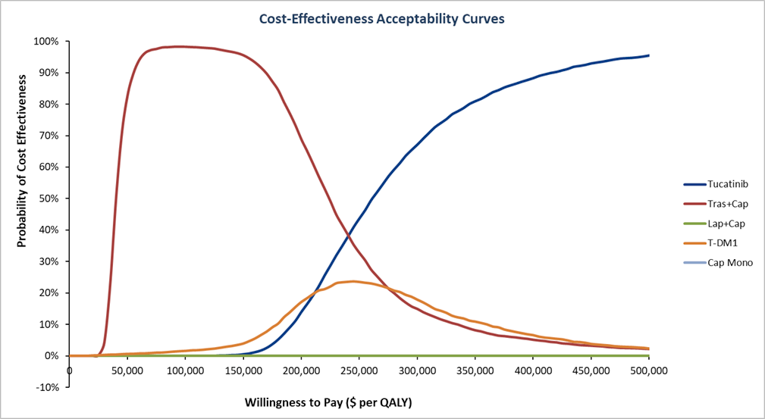
Cap = capecitabine; Lap = lapatinib; Mono = monotherapy; QALY = quality-adjusted life-year; Tras = trastuzumab; T-DM1 = trastuzumab emtansine.
Source: Sponsor’s submission.5
Appendix 4: Additional Details on the CADTH Reanalyses and Sensitivity Analyses of the Economic Evaluation
Note that this appendix has not been copy-edited.
Detailed Results of CADTH Base Case
Table 14: Disaggregated Summary of CADTH’s Economic Evaluation Results — Second Line
Parameter | Tucatinib-combination therapy | T-DM1 | Incremental |
|---|---|---|---|
Discounted LYs | |||
Total | 1.95 | 1.81 | 0.15 |
Discounted QALYs | |||
Total | 1.53 | 1.41 | 0.12 |
Health state | |||
Progression-free | 0.89 | 0.81 | 0.08 |
Progressed | 0.64 | 0.61 | 0.03 |
Trial vs. extrapolation period | |||
In trial | 1.43 | 1.35 | 0.09 |
After trial | 0.10 | 0.07 | 0.03 |
Discounted costs ($) | |||
Total | 166,368 | 107,205 | 59,163 |
Acquisition | 130,525 | 72,095 | 58,430 |
Administration | 1,067 | 1,282 | −214 |
Subsequent treatments | 1,497 | 1,496 | 1 |
Antidiarrheals | 6 | 2 | 5 |
Adverse events | 1,154 | 900 | 254 |
Health state costs | |||
Progression-free | 4,729 | 4,290 | 439 |
Progressed | 5,660 | 5,362 | 297 |
Dead | 21,730 | 21,778 | −48 |
ICER ($/QALY) | 512,403 | ||
ICER = incremental cost-effectiveness ratio; LY = life-year; QALY = quality-adjusted life-year; T-DM1 = trastuzumab emtansine.
Table 15: Disaggregated Summary of CADTH’s Economic Evaluation Results — Third Line
Treatment | Component | Value | Incremental (vs. reference) | Incremental (sequential) |
|---|---|---|---|---|
Discounted LYs | ||||
Capecitabine monotherapy | Total | 1.24 | NA | NA |
Trastuzumab + capecitabine | Total | 1.57 | 0.33 | 0.33 |
Tucatinib + trastuzumab + capecitabine | Total | 1.95 | 0.71 | 0.38 |
Lapatinib + capecitabine | Total | 1.47 | 0.23 | Dominated by trastuzumab + capecitabine |
Discounted QALYs | ||||
Capecitabine monotherapy | Health state | |||
Progression-free | 0.34 | NA | NA | |
Progressed | 0.61 | NA | NA | |
Trial vs. extrapolation period | ||||
In trial | 0.95 | NA | NA | |
After trial | 0.01 | NA | NA | |
Total | 0.96 | NA | NA | |
Trastuzumab + capecitabine | Progression-free | 0.53 | 0.18 | NA |
Progressed | 0.69 | 0.08 | NA | |
Trial vs. extrapolation period | ||||
In trial | 1.18 | 0.24 | NA | |
After trial | 0.03 | 0.02 | NA | |
Total | 1.22 | 0.26 | NA | |
Tucatinib + trastuzumab + capecitabine | Progression-free | 0.89 | 0.54 | 0.36 |
Progressed | 0.64 | 0.03 | −0.05 | |
Trial vs. extrapolation period | ||||
In trial | 1.43 | 0.49 | 0.25 | |
After trial | 0.10 | 0.09 | 0.06 | |
Total | 1.54 | 0.57 | 0.31 | |
Lapatinib + capecitabine | Progression-free | 0.54 | 0.20 | Dominated by trastuzumab + capecitabine |
Progressed | 0.60 | −0.01 | ||
Trial vs. extrapolation period | ||||
In trial | 1.12 | 0.17 | ||
After trial | 0.02 | 0.01 | ||
Total | 1.14 | 0.19 | ||
Discounted costs ($) | ||||
Capecitabine monotherapy | Acquisition | 1,561 | NA | NA |
Administration | 26 | NA | NA | |
Subsequent treatments | 25 | NA | NA | |
Antidiarrheals | 2 | NA | NA | |
Adverse events | 1,389 | NA | NA | |
Health state costs | NA | NA | ||
Progression-free | 1,827 | NA | NA | |
Progressed | 5,394 | NA | NA | |
Dead | 21,958 | NA | NA | |
Total | 32,183 | NA | NA | |
Trastuzumab + capecitabine | Acquisition | 12,601 | 11,040 | NA |
Administration | 774 | 748 | NA | |
Subsequent treatments | 1,501 | 1,475 | NA | |
Antidiarrheals | 2 | 0 | NA | |
Adverse events | 819 | −570 | NA | |
Health state costs | NA | |||
Progression-free | 2,804 | 977 | NA | |
Progressed | 6,064 | 670 | NA | |
Dead | 21,854 | −105 | NA | |
Total | 46,418 | 14,235 | NA | |
Tucatinib + trastuzumab + capecitabine | Acquisition | 130,525 | 128,963 | 117,923 |
Administration | 1,067 | 1,041 | 293 | |
Subsequent treatments | 1,497 | 1,472 | −3 | |
Antidiarrheals | 6 | 5 | 5 | |
Adverse events | 1,154 | −236 | 335 | |
Health state costs | ||||
Progression-free | 4,729 | 2,902 | 1,925 | |
Progressed | 5,660 | 265 | −404 | |
Dead | 21,730 | −228 | −124 | |
Total | 166,368 | 134,184 | 119,950 | |
Lapatinib + capecitabine | Acquisition | 25,396 | 23,835 | Dominated by trastuzumab + capecitabine |
Administration | 26 | 0 | ||
Subsequent treatments | 1,499 | 1,473 | ||
Antidiarrheals | 6 | 5 | ||
Adverse events | 1,612 | 222 | ||
Health state costs | ||||
Progression-free | 2,889 | 1,062 | ||
Progressed | 5,283 | −111 | ||
Dead | 21,886 | −72 | ||
Total | 58,597 | 26,413 | ||
ICER vs. capecitabine monotherapy ($/QALY) | Sequential ICER ($/QALY) | |||
Capecitabine monotherapy | Reference | Reference | ||
Trastuzumab + capecitabine | 54,750 | 54,750 | ||
Tucatinib + trastuzumab + capecitabine | 233,579 | 381,429 | ||
Lapatinib + capecitabine | 141,706 | Dominated by trastuzumab + capecitabine | ||
ICER = incremental cost-effectiveness ratio; LY = life-year; NA = not applicable; QALY = quality-adjusted life-year.
Table 16: Summary of the Stepped Analysis of the CADTH Reanalysis Results — Second Line
Stepped analysis | Drug | Total costs ($) | Total QALYs | ICER ($/QALY) |
|---|---|---|---|---|
Sponsor’s base case | T-DM1 | 107,628 | 1.56 | Reference |
Tucatinib combination | 150,588 | 1.73 | 245,096 | |
CADTH reanalysis 1: OS Curve (Gompertz) | T-DM1 | 107,088 | 1.43 | Reference |
Tucatinib combination | 149,629 | 1.56 | 328,458 | |
CADTH reanalysis 2: OS and PFS data for tucatinib-combination therapy from HER2CLIMB | T-DM1 | 107,843 | 1.56 | Reference |
Tucatinib combination | 150,596 | 1.71 | 281,470 | |
CADTH reanalysis 3: 100% RDI for trastuzumab and all oral drugs | T-DM1 | 108,136 | 1.55 | Reference |
Tucatinib combination | 168,202 | 1.73 | 342,787 | |
CADTH reanalysis 4: Non-cycle-specific utility values | T-DM1 | 107,865 | 1.54 | Reference |
Tucatinib combination | 150,374 | 1.72 | 246,664 | |
CADTH base case 1 + 2 + 3 + 4 | T-DM1 | 107,205 | 1.41 | Reference |
Tucatinib combination | 166,368 | 1.53 | 512,403 |
ICER = incremental cost-effectiveness ratio; OS = overall survival; QALY = quality-adjusted life-year; RDI = relative dose intensity; T-DM1 = trastuzumab emtansine.
Table 17: Summary of the Stepped Analysis of the CADTH Reanalysis Results — Third Line
Stepped analysis | Drug | Total costs ($) | Total QALYs | ICER vs. capecitabine monotherapy ($/QALY) | Sequential ICER ($/QALYs) |
|---|---|---|---|---|---|
Sponsor’s base case | Capecitabine monotherapy | 32,169 | 0.99 | Reference | Reference |
Trastuzumab + capecitabine | 44,587 | 1.30 | 40,495 | 40,495 | |
Tucatinib combination | 150,588 | 1.73 | 159,710 | 243,790 | |
Lapatinib + capecitabine | 58,726 | 1.21 | 122,121 | Dominated | |
CADTH reanalysis 1: OS Curve (Gompertz) | Capecitabine monotherapy | 31,832 | 0.96 | Reference | Reference |
Trastuzumab + capecitabine | 43,910 | 1.23 | 45,534 | 45,534 | |
Tucatinib combination | 149,629 | 1.56 | 195,768 | 314,205 | |
Lapatinib + capecitabine | 58,150 | 1.15 | 137,093 | Dominated | |
CADTH reanalysis 2: OS and PFS data for tucatinib-combination therapy from HER2CLIMB | Capecitabine monotherapy | 32,151 | 0.99 | Reference | Reference |
Trastuzumab + capecitabine | 44,575 | 1.30 | 40,302 | 40,302 | |
Tucatinib combination | 150,596 | 1.71 | 164,205 | 256,686 | |
Lapatinib + capecitabine | 58,700 | 1.21 | 121,446 | Dominated | |
CADTH reanalysis 3: 100% RDI for trastuzumab and all oral drugs | Capecitabine monotherapy | 32,395 | 0.99 | Reference | Reference |
Trastuzumab + capecitabine | 46,957 | 1.30 | 47,517 | 47,517 | |
Tucatinib combination | 168,202 | 1.73 | 183,221 | 278,879 | |
Lapatinib + capecitabine | 59,043 | 1.21 | 122,580 | Dominated | |
CADTH reanalysis 4: Non-cycle-specific utility values | Capecitabine monotherapy | 32,116 | 0.99 | Reference | Reference |
Trastuzumab + capecitabine | 44,532 | 1.29 | 41,010 | 41,010 | |
Tucatinib combination | 150,374 | 1.72 | 162,405 | 248,800 | |
Lapatinib + capecitabine | 58,725 | 1.20 | 124,862 | Dominated | |
CADTH base case 1 + 2 + 3 + 4 | Capecitabine monotherapy | 32,183 | 0.96 | Reference | Reference |
Trastuzumab + capecitabine | 46,418 | 1.22 | 54,750 | 54,750 | |
Tucatinib combination | 166,368 | 1.53 | 233,579 | 381,429 | |
Lapatinib + capecitabine | 58,597 | 1.14 | 141,706 | Dominated |
ICER = incremental cost-effectiveness ratio; OS = overall survival; QALY = quality-adjusted life-year; RDI = relative dose intensity.
Scenario Analyses
Table 18: Summary of the CADTH Scenario Analyses — Second Line
Scenario analysis | Drug | Total costs ($) | Total QALYs | ICER ($/QALY) |
|---|---|---|---|---|
Scenario 1: 5-year time horizon | T-DM1 | 106,894 | 1.42 | Reference |
Tucatinib combination | 166,760 | 1.54 | 517,048 | |
Scenario 2: NMA results for tucatinib-combination therapy | T-DM1 | 107,232 | 1.42 | Reference |
Tucatinib combination | 166,793 | 1.55 | 470,869 | |
Scenario 3: Random-effects model NMA | T-DM1 | 107,517 | 1.46 | Reference |
Tucatinib combination | 166,991 | 1.53 | 832,113 | |
Scenario 4: Sponsor’s OS curve for trastuzumab + capecitabine (Weibull) | T-DM1 | 108,105 | 1.54 | Reference |
Tucatinib combination | 168,007 | 1.69 | 397,487 | |
Scenario 5: 100% RDIs for all drugsa | T-DM1 | 109,298 | 1.43 | Reference |
Tucatinib combination | 166,625 | 1.54 | 490,927 | |
Scenario 6: Published utility values | T-DM1 | 107,115 | 1.22 | Reference |
Tucatinib combination | 166,759 | 1.33 | 572,298 |
ICER = incremental cost-effectiveness ratio; NMA = network meta-analysis; OS = overall survival; QALY = quality-adjusted life-year; RDI = relative dose intensity.
aGiven the changes to RDIs in the CADTH base case reanalysis, the only RDI changed in this reanalysis was for T-DM1.
Table 19: Summary of the CADTH Scenario Analyses — Third Line
Scenario analysis | Drug | Total costs ($) | Total QALYs | ICER vs. capecitabine monotherapy ($/QALY) | Sequential ICER ($/QALYs) |
|---|---|---|---|---|---|
Scenario 1: 5-year time horizon | Capecitabine monotherapy | 32,251 | 0.96 | Reference | Reference |
Trastuzumab + capecitabine | 46,458 | 1.22 | 54,322 | 54,322 | |
Tucatinib combination | 166,760 | 1.54 | 233,007 | 381,016 | |
Lapatinib + capecitabine | 58,662 | 1.15 | 140,909 | Dominated | |
Scenario 2: NMA results for tucatinib-combination therapy | Capecitabine monotherapy | 32,189 | 0.96 | Reference | Reference |
Trastuzumab + capecitabine | 46,422 | 1.22 | 54,463 | 54,463 | |
Tucatinib combination | 166,793 | 1.55 | 229,177 | 369,232 | |
Lapatinib + capecitabine | 58,667 | 1.15 | 141,560 | Dominated | |
Scenario 3: Random-effects model NMA | Capecitabine monotherapy | 32,604 | 1.00 | Reference | Reference |
Trastuzumab + capecitabine | 46,476 | 1.22 | 63,447 | 63,447 | |
Tucatinib combination | 166,991 | 1.53 | 251,829 | 382,571 | |
Lapatinib + capecitabine | 59,110 | 1.20 | 135,250 | Dominated | |
Scenario 4: Sponsor’s OS curve for trastuzumab + capecitabine (Weibull) | Capecitabine monotherapy | 32,480 | 0.99 | Reference | Reference |
Trastuzumab + capecitabine | 47,041 | 1.29 | 48,286 | 48,286 | |
Tucatinib combination | 168,007 | 1.69 | 192,912 | 301,681 | |
Lapatinib + capecitabine | 59,126 | 1.20 | 126,018 | Dominated | |
Scenario 6: Published utility values | Capecitabine monotherapy | 32,210 | 0.77 | Reference | Reference |
Trastuzumab + capecitabine | 46,475 | 1.01 | 60,868 | 60,868 | |
Tucatinib combination | 166,759 | 1.33 | 242,330 | 374,867 | |
Lapatinib + capecitabine | 58,706 | 0.96 | 142,376 | Dominated |
ICER = incremental cost-effectiveness ratio; NMA = network meta-analysis; OS = overall survival; QALY = quality-adjusted life-year.
Note: Scenario 4 is not relevant to the third-line setting, as all drugs already have 100% RDI.
Appendix 5: Submitted BIA and CADTH Appraisal
Note that this appendix has not been copy-edited.
Table 20: Key Takeaways of the BIA
Key takeaways of the BIA |
|---|
|
Summary of Sponsor’s BIA
The sponsor submitted a budget impact analysis (BIA) that compared the change in expenditure with the adoption of tucatinib used in combination with trastuzumab and capecitabine (i.e., tucatinib-combination therapy), compared with a reference scenario where tucatinib was not available. The population of interest was patients with locally advanced unresectable or metastatic HER2-positive breast cancer who have received prior treatment with trastuzumab, pertuzumab, or T-DM1 separately or in combination, which is in line with the Health Canada–approved indication and the sponsor’s reimbursement request. The reference scenario included T-DM1 in the second-line setting, and trastuzumab in combination with capecitabine, lapatinib in combination with capecitabine, or capecitabine monotherapy in the third-line setting. The new drug scenario included these same treatment options, as well as tucatinib-combination therapy in the second- or third-line setting. The analysis was undertaken from a Canadian public drug plan perspective (excluding Quebec) over a 3-year time horizon (2022 to 2024) including a baseline year (2021).
The sponsor used an epidemiologic, incidence-based approach to estimate the size of the eligible population as outlined in Figure 3. Key inputs to the BIA are documented in Table 21. Key assumptions of the sponsor’s submission included:
Treatment durations for each treatment option based on median durations of treatment from clinical trial data.
Drug acquisition costs (including wastage), which excluded deductions and premiums, were included. Dispensing fees and markups for oral therapies were included, as well as co-payments where applicable.
The sponsor performed several 1-way sensitivity analyses to assess the impact of varying parameters included in the model by +/− ||||. The sponsor also assessed the impact of excluding drug wastage and including treatment administration costs.
Figure 3: Sponsor’s Estimation of the Size of the Eligible Population

Source: Sponsor’s submission.12
Table 21: Third-Line Summary of Key Model Parameters
Parameter | Sponsor’s estimate (reported as baseline year / year 1 / year 2 / year 3) |
|---|---|
Target population | |
New cases of breast cancer (mean annual growth of 1.6%) | 0 / 20,831 / 21,164 / 21,502 |
Mortality due to breast cancer (mean annual growth of 0.5%) | 0 / −3,594 / −3,612 / −3,630 |
Prevalent cases | 95,807 / 0 / 0 / 0 |
Patients with HER2+ breast cancer (15%) | 14,371 / 16,957 / 19,589 / 22,270 |
Patients with HER2+ metastatic recurrent or locally advanced unresectable breast cancer:
| 862 / 1,017 / 1,175 / 1,336 776 / 916 / 1,058 / 1,203 1,006 / 1,187 / 1,371 / 1,559 338 / 398 / 460 / 523 |
Patients receiving T-DM1 in (neo)-adjuvant setting (stage I to III) (15%) | 318 / 375 / 433 / 493 |
Patient eligibility: second-line setting | |
Patients eligible for receiving a second-line treatment for metastatic recurrent or locally advanced unresectable HER2+ breast cancer (stages I to III) (40%) | 127 / 150 / 173 / 197 |
Number of patients eligible for drug under review (second line)b | 105 / 124 / 143 / 163 |
Patient eligibility: third-line setting | |
Patients eligible for receiving a third-line treatment for metastatic recurrent or locally advanced unresectable HER2+ breast cancer (stages I to IV) (26%) | 775 / 915 / 1,057 / 1,201 |
Number of patients eligible for drug under review (third line)b | 641 / 756 / 873 / 993 |
Market uptake (3 years): second-line setting | |
Uptake (reference scenario):
| |||||||||||||||||||||||||||||||||||| |
Uptake (new drug scenario):
| |||||||||||||||||||||||||||| |||||||||||||||||||||||||||||||| |
Market uptake (3 years): third-line setting | |
Uptake (reference scenario):
| |||||||||||||||||||||||||||| |||||||||||||||||||||||||||| |||||||||||||||||||||||||||| |
Uptake (new drug scenario):
| |||||||||||||||||||||||||||||||| |||||||||||||||||||||||||||||||||||| |||||||||||||||||||||||||||||||||||| |||||||||||||||||||||||||||||||| |
Cost of treatment (per patient) | |
Cost of treatment over a 21-day cycle (first cycle):c
| $13,038 $5,535 $2,988 $2,741 $192 |
HER2+ = human epidermal growth factor receptor 2–positive; T-DM1 = trastuzumab emtansine.
aPercentage of patients developing metastatic recurrent or locally advanced unresectable breast cancer according to stage.
bBased on an assumption for the percentage of individuals in each jurisdiction who are < 65 years of age and the percentage of patients < 65 years and ≥ 65 years covered by public drug plans.
cSponsor’s assumptions based on a mean body weight of 69.5 kg and a body surface area of 1.8 m2 and including drug wastage, markups, and dispensing fees where applicable.
Summary of the Sponsor’s BIA Results
The sponsor estimated that the total 3-year budget impact of introducing tucatinib for patients with locally advanced unresectable or metastatic HER2-positive breast cancer in the second and third-line setting would be $102,814,084 (year 1: $17,658,976; year 2: $33,097,246; year 3: $52,057,861). The majority (98%) of the budget impact is from the use of tucatinib in the third-line setting (3-year total: $101,002,764) compared with the second-line setting (3-year total: $1,811,319).
CADTH Appraisal of the Sponsor’s BIA
CADTH identified several key limitations to the sponsor’s analysis that have notable implications on the results of the BIA:
Uncertainty associated with included comparators: The sponsor compared tucatinib-combination therapy to a reference scenario that included trastuzumab and capecitabine, lapatinib and capecitabine, and capecitabine monotherapy in the third-line setting to estimate the budget impact of the introduction of tucatinib-combination therapy. The clinical experts consulted by CADTH identified neratinib with capecitabine, trastuzumab with endocrine therapy, and endocrine therapy alone as additional relevant comparators in the third-line treatment setting that were not included in the sponsor’s model. Consequently, calculating the incremental costs of the tucatinib-combination regimen compared with other therapies that cost more than other relevant comparators (e.g., trastuzumab with endocrine therapy or endocrine therapy alone) likely overestimated the total costs in the reference scenario and underestimated the overall budget impact.
Additionally, of the comparators included in the sponsor’s BIA, trastuzumab and other third-line HER2-directed therapies are not funded in most jurisdictions across Canada; chemotherapy alone is likely most commonly used in this setting. The sponsor assumed that |||||| of the market share in the reference scenario is allocated to chemotherapy alone. Given the variability in funding across in Canada, this estimate could be higher in some jurisdictions, resulting in an underestimate of the overall budget impact, given single-chemotherapy regimens are less expensive than trastuzumab in combination with capecitabine (e.g., 21-day cycle cost of capecitabine monotherapy is $192 compared with $2,988 for trastuzumab plus capecitabine).
CADTH could not address the exclusion of relevant comparators in the reanalysis. CADTH conducted a scenario analysis that estimated the incremental budget impact if capecitabine monotherapy was assumed to comprise 100% market share as the only alternative to tucatinib-combination therapy in the new drug scenario in the third-line setting.
Uncertain estimates for the derivation of the eligible patient population: The sponsor assumed that 15% of patients diagnosed with breast cancer would be of HER2-positive subtype which was based on 3 published sources reporting 16.4% (Press, 2017, US data), 14.3% (Seung, 2020, Ontario data) and 13.3% (Xiong, 2018, US data) each of which was limited by the inclusion of a group of patients with unknown subtype. Other published estimates range from 15% to 30%,13 10 to 20%,14 and 18%,15 suggesting that there is variability in the literature and that 15% may be a relatively low estimate within the reported ranges. According to the clinical experts consulted by CADTH for this review, 18% was felt to be the most reasonable estimate.
The sponsor estimated the proportion of patients eligible for tucatinib-combination therapy in the third-line setting (i.e., those patients with metastatic disease, all stages) based on a study by Mariotto et al. which estimated that, among the prevalent cases of metastatic breast cancer in the US, 26.4% had been diagnosed within 2 to 5 years.16 The sponsor stated that because the median PFS associated with first-line treatment is 18.7 months and the median PFS for T-DM1 in second-line is 9.6 months, by the time patients make it to 2 years after diagnosis of metastatic breast cancer, they were estimated to be in the third-line treatment setting.17,18 This estimate was applied to both prevalent and year 1 to 3 incident cases. This estimate, however, would not account for incident cases in year 1 or 2 that may progress within the 3-year model time horizon and was thought to be an underestimate according to the clinical experts consulted by CADTH. Each of these identified issues likely contributed to an underestimate of the eligible population, which would result in an underestimate of the anticipated overall budget impact of tucatinib.
CADTH revised the base case to include 18% of patients being HER2-positive.
CADTH conducted a scenario analysis to assess the impact of alternate assumptions for the proportion of patients eligible for tucatinib-combination therapy in the third-line setting (40%), and the percentage of patients with stage IV HER2-positive breast cancer (7.2%).
Underestimate of market share estimates for tucatinib in the third-line treatment setting: The sponsor assumed that market share estimates for tucatinib-combination therapy would be |||||| in year 1, |||||| in year 2, and |||||| in year 3. According to clinical experts consulted by CADTH for this review, the sponsor’s assumptions are likely to be an underestimate of the anticipated market uptake for tucatinib. It was anticipated that tucatinib-combination therapy was likely to have a market share of at least 60 to 70% in year 1 alone, with at least a similar market share in subsequent years.
CADTH revised the base case to assume an incremental increase in the percent market share for tucatinib from 60% in year 1, 65% in year 2, and 70% in year 3.
Given the uncertainty in the market share estimates, CADTH conducted a scenario analysis varying the market share assumptions from a low of 50% in years 1 to 3 to a high of 80% in years 1 to 3.
Additional limitations were identified but were not considered to be key limitations. These limitations include:
Mean duration of treatment for tucatinib-combination therapy and trastuzumab with capecitabine: CADTH revised the mean duration of treatment with tucatinib-combination therapy (7.8 months) and trastuzumab plus capecitabine (5.6 months) to align with the sponsor’s pharmacoeconomic model.
Uncertainty in the percentage of patients covered by public drug plans: CADTH retained the sponsors assumptions regarding the percentage of the eligible population covered by public drug plans (i.e., 74.9% for patients 18 to 64 years, and 100% for patients 65 years of age and older) in the CADTH base case. CADTH undertook a scenario analysis to assess the impact of 100% of patients aged 18 to 64 years covered by public drug plans.
Uncertainty in the estimated percentage of patients eligible for tucatinib in the second-line setting and associated market share assumptions for tucatinib in the second-line setting: The sponsor assumed that 15% of patients with early breast cancer would receive T-DM1 in the neoadjuvant or adjuvant setting. The sponsor calculated this based on an assumption that 17.4% of patients would be eligible for T-DM1 and that T-DM1 would take up |||| of the market share in that setting. The clinical experts consulted by CADTH for this review indicated that the percentage of patients who are likely to have received T-DM1 in the adjuvant or neo-adjuvant setting is likely to be low given that T-DM1 has only recently been available on a compassionate funding basis in this setting. The sponsor assumed that tucatinib-combination therapy would achieve a market share of |||| in year 1, || in year 2, and |||| in year 3. CADTH retained the sponsors assumptions regarding the percentage of patients eligible for tucatinib, and market share assumptions in the second-line setting in the CADTH base case. These assumptions were anticipated to have minimal impact on the overall incremental budget impact of tucatinib.
CADTH Reanalyses of the BIA
The revisions made by CADTH to the sponsor’s submitted BIA are presented in Table 22.
Table 22: Revisions to the Submitted BIA
Stepped analysis | Sponsor’s value or assumption | CADTH value or assumption |
|---|---|---|
Correctionsa to sponsor’s base case | ||
1. Mean treatment durations | Tucatinib + trastuzumab + capecitabine: 7.6 months; 7.9 months; 7.3 months, respectively Trastuzumab + capecitabine: 5.7 months; 5.4 months, respectively | Tucatinib + trastuzumab + capecitabine: 7.8 months for each Trastuzumab + capecitabine: 5.6 months for each |
Changes to derive the CADTH base case | ||
1. Percentage of patients with breast cancer that are HER2+ | |||| | 18% |
2. Market share estimates for tucatinib in the third-line treatment setting | Year 1: |||||| Year 2: |||| Year 3: |||||| | Year 1: 60% Year 2: 65% Year 3: 70% |
CADTH base case reanalysis | Reanalysis 1 + 2 | |
HER2+ = human epidermal growth factor receptor 2–positive.
aCorrections made to align with the sponsor’s pharmacoeconomic model.
In the CADTH reanalysis, the estimated budget impact for tucatinib-combination therapy is $64,395,873 in year 1, $80,786,751 in year 2, and $99,110,926 in year 3, for a 3-year expected total budget impact of $244,293,549. The majority of the budget impact (98% to 99%) in the CADTH base case and across all scenario analyses is driven by the use of tucatinib-combination therapy in the third-line setting. The results of the CADTH stepwise reanalysis are presented in summary format in Table 23 and a more detailed breakdown is presented in Table 24. The submitted analysis is based on the publicly available prices of the comparator treatments.
Table 23: Third Line — Summary of the CADTH Reanalyses of the BIA
Stepped analysis | Three-year total ($) | Second line ($) | Third line ($) |
|---|---|---|---|
Submitted base case | 102,814,084 | 1,811,319 | 101,002,764 |
Corrected base case | 105,523,941 | 1,908,311 | 103,615,630 |
CADTH reanalysis 1: Increased percentage of patients HER2+ | 126,628,729 | 2,289,974 | 124,338,755 |
CADTH reanalysis 2: Increased market share for years 1 to 3 | 203,577,958 | 1,908,311 | 201,669,646 |
CADTH base case | 244,293,549 | 2,289,974 | 242,003,576 |
BIA = budget impact analysis; HER2+ = human epidermal growth factor receptor 2–positive.
CADTH also conducted scenario analyses considering:
A price reduction for tucatinib of 48% in the second-line setting and 94% in the third-line setting.
A market share assumption of 100% for capecitabine monotherapy in the reference scenario of the third-line setting.
Alternate assumptions for the percentage of patients eligible for tucatinib-combination therapy in the third line (40%), and the percentage of patients that have stage IV HER2-positive breast cancer (7.2%).
Alternate market share estimates for tucatinib-combination therapy in the third line (50% and 80% in years 1 to 3).
CADTH also undertook an exploratory analysis to estimate the incremental budget impact for patients with brain metastasis based on the percentage of patients reported to have brain metastasis in the intention-to-treat population of the HER2CLIMB trial (48%).
Of the scenarios considered by CADTH, the price reductions for tucatinib, and the assumptions regarding the percentage of patients eligible for treatment with tucatinib-combination therapy in the third-line setting were most impactful on the anticipated budget impact. With a price reduction of 94% for tucatinib, the 3-year budget impact is expected to decrease to $13,489,882, and an assumption of 40% of patients eligible for tucatinib-combination therapy is expected to increase the 3-year budget impact to $374,603,167.
The exploratory analysis undertaken for patients with brain metastasis who are otherwise eligible for treatment, resulted in an expected budget impact that was approximately half of CADTH’s base case estimate (3-year budget impact of $117,260,904).
Table 24: Detailed Breakdown of the CADTH Reanalyses and Scenario Analyses of the BIA (Second and Third Line)
Stepped analysis | Scenario | Year 0 (current situation) ($) | Year 1 ($) | Year 2 ($) | Year 3 ($) | Three-year total ($) |
|---|---|---|---|---|---|---|
Submitted base case | Reference | 18,900,356 | 22,295,771 | 25,753,255 | 29,273,836 | 77,322,862 |
New drug | 18,900,356 | 39,954,747 | 58,850,501 | 81,331,697 | 180,136,945 | |
Budget impact | 0 | 17,658,976 | 33,097,246 | 52,057,861 | 102,814,084 | |
Corrected base case | Reference | 18,871,866 | 22,262,164 | 25,714,436 | 29,229,710 | 77,206,310 |
New drug | 18,871,866 | 40,387,320 | 59,684,093 | 82,658,837 | 182,730,251 | |
Budget impact | 0 | 18,125,156 | 33,969,657 | 53,429,128 | 105,523,941 | |
CADTH base case | Reference | 22,646,239 | 26,714,597 | 30,857,323 | 35,075,652 | 92,647,572 |
New drug | 22,646,239 | 91,110,470 | 111,644,074 | 134,186,578 | 336,941,121 | |
Budget impact | 0 | 64,395,873 | 80,786,751 | 99,110,926 | 244,293,549 | |
CADTH scenario analysis: 48% price reduction for tucatiniba | Reference | 22,646,239 | 26,714,597 | 30,857,323 | 35,075,652 | 92,647,572 |
New drug | 22,646,239 | 59,826,469 | 72,293,961 | 85,802,916 | 217,923,346 | |
Budget impact | 0 | 33,111,872 | 41,436,638 | 50,727,264 | 125,275,774 | |
CADTH scenario analysis: 94% price reduction for tucatinibb | Reference | 22,646,239 | 26,714,597 | 30,857,323 | 35,075,652 | 92,647,572 |
New drug | 22,646,239 | 30,443,172 | 35,334,869 | 40,359,413 | 106,137,454 | |
Budget impact | 0 | 3,728,575 | 4,477,546 | 5,283,761 | 13,489,882 | |
CADTH scenario analysis: 100% market share for capecitabine monotherapy | Reference | 10,901,294 | 12,859,723 | 14,853,951 | 16,884,573 | 44,598,247 |
New drug | 10,901,294 | 85,568,520 | 106,042,893 | 128,729,254 | 320,340,667 | |
Budget impact | 0 | 72,708,797 | 91,188,942 | 111,844,681 | 275,742,421 | |
CADTH scenario analysis: Percentage of patients eligible for tucatinib (40%)c | Reference | 29,615,428 | 34,935,748 | 40,353,323 | 45,869,767 | 121,158,838 |
New drug | 29,615,428 | 133,776,214 | 164,241,940 | 197,743,851 | 495,762,005 | |
Budget impact | 0 | 98,840,465 | 123,888,617 | 151,874,084 | 374,603,167 | |
CADTH scenario analysis: Patients with stage IV HER2+ breast cancer (7.2%) | Reference | 23,170,582 | 27,333,133 | 31,571,773 | 35,887,767 | 94,792,673 |
New drug | 23,170,582 | 94,884,134 | 116,304,221 | 139,826,260 | 351,014,615 | |
Budget impact | 0 | 67,551,001 | 84,732,448 | 103,938,492 | 256,221,942 | |
CADTH scenario analysis: 100% public coverage | Reference | 27,669,322 | 32,648,702 | 37,718,990 | 42,881,693 | 113,249,384 |
New drug | 27,669,322 | 111,011,833 | 136,046,692 | 163,529,574 | 410,588,099 | |
Budget impact | 0 | 78,363,131 | 98,327,703 | 120,647,882 | 297,338,715 | |
CADTH scenario analysis: 50% market share estimates for tucatinib combinationc | Reference | 22,646,239 | 26,714,597 | 30,857,323 | 35,075,652 | 92,647,572 |
New drug | 22,646,239 | 80,449,048 | 93,171,845 | 106,189,799 | 279,810,693 | |
Budget impact | 0 | 53,734,451 | 62,314,522 | 71,114,148 | 187,163,121 | |
CADTH scenario analysis: 80% market share estimates for tucatinib combinationc | Reference | 22,646,239 | 26,714,597 | 30,857,323 | 35,075,652 | 92,647,572 |
New drug | 22,646,239 | 112,433,313 | 130,116,302 | 148,184,967 | 390,734,581 | |
Budget impact | 0 | 85,718,716 | 99,258,979 | 113,109,315 | 298,087,010 | |
CADTH exploratory analysis: Patients with brain metastasis | Reference | 10,870,195 | 12,823,007 | 14,811,515 | 16,836,313 | 44,470,834 |
New drug | 10,870,195 | 43,733,026 | 53,589,155 | 64,409,557 | 161,731,738 | |
Budget impact | 0 | 30,910,019 | 38,777,640 | 47,573,244 | 117,260,904 |
BIA = budget impact analysis; HER2+ = human epidermal growth factor receptor 2–positive.
aPrice reduction required for tucatinib to be cost-effective at $50,000 per QALY in the second-line setting.
bPrice reduction required for tucatinib to be cost-effective at $50,000 per QALY in the third-line setting.
cSpecific to the third line.
ISSN: 2563-6596
Disclaimer: The information in this document is intended to help Canadian health care decision-makers, health care professionals, health systems leaders, and policy-makers make well-informed decisions and thereby improve the quality of health care services. While patients and others may access this document, the document is made available for informational purposes only and no representations or warranties are made with respect to its fitness for any particular purpose. The information in this document should not be used as a substitute for professional medical advice or as a substitute for the application of clinical judgment in respect of the care of a particular patient or other professional judgment in any decision-making process. The Canadian Agency for Drugs and Technologies in Health (CADTH) does not endorse any information, drugs, therapies, treatments, products, processes, or services.
While care has been taken to ensure that the information prepared by CADTH in this document is accurate, complete, and up-to-date as at the applicable date the material was first published by CADTH, CADTH does not make any guarantees to that effect. CADTH does not guarantee and is not responsible for the quality, currency, propriety, accuracy, or reasonableness of any statements, information, or conclusions contained in any third-party materials used in preparing this document. The views and opinions of third parties published in this document do not necessarily state or reflect those of CADTH.
CADTH is not responsible for any errors, omissions, injury, loss, or damage arising from or relating to the use (or misuse) of any information, statements, or conclusions contained in or implied by the contents of this document or any of the source materials.
This document may contain links to third-party websites. CADTH does not have control over the content of such sites. Use of third-party sites is governed by the third-party website owners’ own terms and conditions set out for such sites. CADTH does not make any guarantee with respect to any information contained on such third-party sites and CADTH is not responsible for any injury, loss, or damage suffered as a result of using such third-party sites. CADTH has no responsibility for the collection, use, and disclosure of personal information by third-party sites.
Subject to the aforementioned limitations, the views expressed herein are those of CADTH and do not necessarily represent the views of Canada’s federal, provincial, or territorial governments or any third-party supplier of information.
This document is prepared and intended for use in the context of the Canadian health care system. The use of this document outside of Canada is done so at the user’s own risk.
This disclaimer and any questions or matters of any nature arising from or relating to the content or use (or misuse) of this document will be governed by and interpreted in accordance with the laws of the Province of Ontario and the laws of Canada applicable therein, and all proceedings shall be subject to the exclusive jurisdiction of the courts of the Province of Ontario, Canada.
The copyright and other intellectual property rights in this document are owned by CADTH and its licensors. These rights are protected by the Canadian Copyright Act and other national and international laws and agreements. Users are permitted to make copies of this document for non-commercial purposes only, provided it is not modified when reproduced and appropriate credit is given to CADTH and its licensors.
About CADTH: CADTH is an independent, not-for-profit organization responsible for providing Canada’s health care decision-makers with objective evidence to help make informed decisions about the optimal use of drugs, medical devices, diagnostics, and procedures in our health care system.
Funding: CADTH receives funding from Canada’s federal, provincial, and territorial governments, with the exception of Quebec.