CADTH Reimbursement Review
Venetoclax (Venclexta)
Sponsor: AbbVie Corporation
Therapeutic area: Acute myeloid leukemia
This multi-part report includes:
Clinical Review
Pharmacoeconomic Review
Clinical Review
Abbreviations
AE
adverse event
AML
acute myeloid leukemia
AZA
azacitidine
BSC
best supportive care
CBC
complete blood count
CI
confidence interval
CLL
chronic lymphocytic leukemia
CLSG
Canadian Leukemia Study Group
CNS
central nervous system
CR
complete remission
CRh
complete remission with partial hematologic recovery
CRi
complete remission with incomplete blood count recovery
ECOG PS
Eastern Cooperative Oncology Group Performance Status
EFS
event-free survival
EORTC
European Organisation for Research and Treatment of Cancer
HMA
hypomethylating agent
HR
hazard ratio
HRQoL
health-related quality of life
IDH
isocitrate dehydrogenase
IRC
independent review committee
ITC
indirect treatment comparison
ITT
intention to treat
IWG
International Working Group
LDAC
low-dose cytarabine
LLSC
Leukemia & Lymphoma Society of Canada
LSM
least squares mean
MDS
myelodysplastic syndrome
MID
minimal important difference
NMA
network meta-analysis
NOC
Notice of Compliance
OH HDSDAC
Ontario Health (Cancer Care Ontario) Hematology Disease Site Drug Advisory Committee
OR
odds ratio
OS
overall survival
PLA
placebo
PROMIS
Patient-Reported Outcome Measurement System
QLQ-C30
Quality of Life Questionnaire Core 30
RBC
red blood cell
RCT
randomized controlled trial
SAE
serious adverse event
SCT
stem cell transplant
SD
standard deviation
TLS
tumour lysis syndrome
VEN
venetoclax
Executive Summary
An overview of the submission details for the drug under review is provided in Table 1.
Item | Description |
|---|---|
Drug product | Venetoclax (Venclexta), 10 mg, 50 mg, and 100 mg oral tablets |
Indication | In combination with azacitidine or low-dose cytarabine for the treatment of patients with newly diagnosed AML who are 75 years or older, or who have comorbidities that preclude the use of intensive induction chemotherapy |
Reimbursement request | In combination with low-dose cytarabine for the treatment of patients with newly diagnosed AML who are 75 years or older, or who have comorbidities that preclude the use of intensive induction chemotherapy |
Health Canada approval status | NOC |
Health Canada review pathway | Project Orbis pathway |
NOC date | December 4, 2020 |
Sponsor | AbbVie Corporation |
AML = acute myeloid leukemia; NOC = Notice of Compliance.
Introduction
Acute myeloid leukemia (AML) is a hematopoietic neoplasm that is characterized by an abnormal proliferation of immature blast cells from the bone marrow, which do not differentiate into red blood cells, platelets, and granulocytes, ultimately resulting in a variety of cytopenias. WHO defines AML as having more than 20% blast cells in peripheral blood or bone marrow. It is the second-most common form of leukemia in adults, with most cases occurring in older adults; the median age of onset is 67 years. In 2016, 1,090 Canadians were diagnosed with AML.1 According to statistics from the Canadian Cancer Society, approximately 65% to 70% of patients achieve complete remission after induction therapy. However, the prognosis for AML appears to be poorer in those older than 60 years compared to younger patients; only 25% to 40% of those older than age 60 are expected to survive 3 years or longer. If an allogeneic stem cell transplant (SCT) is performed during the first remission, the 5-year disease-free survival rate is 30% to 50%. If there has been no recurrence by 2 years post-transplant, patients have about an 80% chance of staying in complete remission for a long period of time.1
Standard treatment for patients who are medically fit consists of cytotoxic remission induction therapy with cytarabine combined with an anthracycline. Induction therapy is followed by high-intensity consolidation therapy. This may be accompanied by targeted therapy for specific clinical situations or genetic mutations. The determination of eligibility for intensive chemotherapy is based on patient age, fitness, and preference, and the presence of comorbidities. In general, intensive therapy is poorly tolerated by older patients. According to the 2017 Canadian consensus guidelines for the treatment of older patients with AML, induction therapy shows a survival benefit for patients up to age 80, with the exception of those who have major comorbidities or those with adverse risk cytogenetics who were not candidates for hematopoietic SCT. For patients who are not eligible for induction therapy, azacytidine (AZA) is recommended for those with adverse risk cytogenetics or transformed from myelodysplastic syndrome (MDS), while either hypomethylating agent (HMA) or low-dose cytarabine (LDAC) could be used for others.
The B-cell lymphoma 2 (BCL-2) inhibitor venetoclax (VEN) is administered at a dose of 600 mg orally when combined with LDAC. The indication under review is VEN in combination with AZA or LDAC for the treatment of patients with newly diagnosed AML who are 75 years or older, or who have comorbidities that preclude the use of intensive induction chemotherapy. The sponsor’s reimbursement request is consistent with that of the indication. A concurrent CADTH review of VEN in combination with AZA is ongoing.
The objective of the current review is to perform a systematic review of the beneficial and harmful effects of VEN in combination with LDAC (VEN-LDAC) for the treatment of patients with newly diagnosed AML who are 75 years or older or who have comorbidities that preclude the use of intensive induction therapy.
Stakeholder Perspectives
The information in this section is a summary of input provided by the patient groups who responded to CADTH’s call for patient input and from clinical expert(s) consulted by CADTH for the purpose of this review.
Patient Input
One patient group, the Leukemia & Lymphoma Society of Canada (LLSC), provided input for this review. The LLSC used an online survey, conducted between December 7, 2020, and January 24, 2021, to gather input. There were 29 patient respondents, ranging in age from 25 years to 84 years.
Patients noted the impact that symptoms such as fatigue, suddenness of symptom development, anxiety, and fear of relapse have on their quality of life. Many patients reported symptoms that affected their social and family lives, and some noted that they were unable to work due to their condition.
With respect to outcomes of importance to patients, respondents hoped that new treatment options could maintain remission. Quality of life was mentioned repeatedly. Patients also hoped that a new therapy would have fewer associated side effects. Patients appeared to value any treatment that could be administered on an outpatient basis or close to their home.
Clinician Input
Input From Clinical Experts Consulted by CADTH
The clinical experts noted that current treatments have low rates of complete remission (CR), and that patients’ responses are not very durable when these do occur. They also noted that treatments that are associated with higher CR rates tend to have increased toxicity and are poorly tolerated in this population.
The clinical experts noted that VEN combinations will likely become first-line treatments for patients who are not fit for induction chemotherapy, and that this will likely change the standard of care for AML. The preferred combination will likely be VEN in combination with an HMA; VEN-LDAC will likely be the treatment of choice in patients who have had prior HMA. The ability to administer VEN-LDAC at home will be an advantage for a certain subset of patients. In patients who have not received a prior HMA, the clinical experts recommended VEN plus an HMA, and also suggested that VEN plus an HMA may even be suitable in patients with prior HMA use. One clinical expert also noted that ivosidenib plus AZA may be reasonable in patients with IDH1 mutations, if available.
With respect to VEN-LDAC, the clinical experts believed this combination would be the first-line treatment or standard of care in patients who are unfit for induction and who had received a prior HMA; they would not prescribe VEN-LDAC in patients who were eligible for induction. It is currently not possible to identify which patients would and would not respond to treatment. The outcomes used to determine response include complete blood count (CBC) and bone marrow blasts. A clinically meaningful response would be indicated by improved survival and CR rates, decreased hospitalizations and transfusion requirements, and decreased rates of progression. Response should be assessed after cycle 1 and cycle 2, with a response expected after a maximum of 2 cycles.
The clinical experts agreed that disease progression and intolerable adverse events (AEs) were factors in the decision to discontinue treatment. Disease progression would be indicated by worsening CBC, increased marrow blasts, or loss of transfusion independence.
Clinician Group Input
Two clinician groups provided input: the Canadian Leukemia Study Group (CLSG) and the Ontario Health (Cancer Care Ontario) Hematology Disease Site Drug Advisory Committee (OH HDSDAC).
Neither of the 2 clinician groups held views that differed materially from those of the clinical experts consulted by CADTH for this review.
Both clinician groups saw VEN-LDAC as replacing LDAC monotherapy in this patient population.
Drug Program Input
The drug programs indicated that the current treatment options for patients with newly diagnosed AML who are ineligible for intensive induction chemotherapy include AZA, LDAC, and best supportive care (BSC). It was noted that some patients 75 years of age and older may be fit to tolerate induction chemotherapy. The ramp-up dosing schedule for VEN with LDAC differs significantly from the ramp-up dosing schedule already in use for chronic lymphocytic leukemia (CLL) indications, and the current packaging for VEN is designed for the CLL ramp-up dosing schedule. The drug programs indicated that this combination treatment may change the place in therapy of comparator drugs. They also identified the potential for indication creep for patients with a high risk of MDS, patients who have progressed or had an inadequate response on low-dose chemotherapy for AML, and patients who have relapsed after induction chemotherapy (who are not eligible for SCT and are then treated with LDAC). It was noted that VEN-LDAC may require increased health care resources (i.e., related to hospital admission, additional pharmacy and nursing resources if management of tumour lysis syndrome [TLS] is necessary, monitoring for drug interactions, and home care resources and training if LDAC is administered at home). Affordability was also identified as an issue, given that VEN is an add-on to an existing treatment.
Clinical experts were consulted by CADTH for questions related to implementing VEN-LDAC into current provincial drug plans. Overall, most implementation questions related to the dosing schedule and administration and the eligible patient population.
Clinical Evidence
Pivotal Studies and Protocol-Selected Studies
Description of Studies
One study met the inclusion criteria for this review. The VIALE-C study is an ongoing, sponsor-funded, phase III, double-blind, randomized controlled trial (RCT) that compared VEN-LDAC (N = 143) to placebo plus LDAC (PLA-LDAC) (N = 68) in treatment-naive patients with AML who were ineligible for intensive induction chemotherapy. The study was conducted at 76 sites in 21 countries, including Canada (10 patients). The primary outcome was overall survival (OS). The secondary outcomes included CR with complete remission with incomplete blood count recovery (CR + CRi) rate, CR with complete remission with partial hematologic recovery (CR + CRh) rate, and event-free survival (EFS).
The majority of patients in the study were male (55.5%) and White (70.6%). The median age was 76 years (range = 36 to 93). The majority of patients had de novo AML (61.6%), while the remainder had secondary AML. The majority of patients (65.2%) had intermediate cytogenetic risk, while most of the remainder (32.8%) had poor cytogenetic risk. Most patients were considered ineligible for intensive induction chemotherapy based on age (≥ 75 years), followed by Eastern Cooperative Oncology Group Performance Status (ECOG PS) in patients 18 years to 74 years of age. Approximately 40% of patients were 75 years or older and had 1 comorbidity in addition to age.
Efficacy Results
The median OS at the final analysis (after a median follow-up of 12 months) in the VEN-LDAC group was 7.2 months versus 4.1 months in the PLA-LDAC group, for a hazard ratio (HR) of 0.75 (95% confidence interval [CI], 0.52 to 1.27; P = 0.114). Thus, the VIALE-C trial failed to meet its primary outcome because it did not demonstrate a statistically significant difference in OS at the final analysis data cut-off date. Nevertheless, Health Canada granted VEN-LDAC a Notice of Compliance (NOC) because of what it described as the “totality of the evidence”; namely, a clear, consistent difference in favour of the combined therapy of VEN-LDAC when compared to LDAC alone for other outcomes, including CR + CRi, CR + CRh, median duration of CR, and transfusion independence. At a post hoc 6-month follow-up analysis (after a median follow-up of 17.5 months), the median OS was 8.4 months in the VEN-LDAC group, and it remained at 4.1 months in the PLA-LDAC group, for an HR of 0.70 (95% CI, 0.50 to 0.99). These results for OS remained the same in a 12-month post hoc follow-up analysis.2
At the final analysis, the median EFS was 4.7 months (95% CI, 3.7 to 6.4) in the VEN-LDAC group and 2.0 months (95% CI, 1.6 to 3.1) in the PLA-LDAC group, for an HR of 0.58 (95% CI, 0.42 to 0.82; P = 0.002). At the time of the 6-month post hoc follow-up analysis, the EFS in the VEN-LDAC group was 4.9 months (95% CI, 3.7 to 6.4); in the PLA-LDAC group, it was 2.1 months (95% CI, 1.5 to 3.2), indicating a limited increase in EFS from the final analysis to the 6-month post hoc follow-up, for an HR of 0.61 (95% CI, 0.44 to 0.84).
At the final analysis, per investigator assessment, the CR + CRi rate was 47.6% (95% CI, 39.1% to 56.1%) in the VEN-LDAC group and 13.2% (95% CI, 6.2% to 23.6%) in the PLA-LDAC group. At the 6-month post hoc follow-up analysis, the CR + CRi rate was 48.3% (95% CI, 39.8% to 56.8%) in the VEN-LDAC group and was unchanged from the final analysis in the PLA-LDAC group.
At the final analysis, the CR + CRh rate was 46.9% in the VEN-LDAC group (95% CI, 38.5% to 55.4%) versus 14.7% in the PLA-LDAC group (95% CI, 7.3 to 25.4). At the 6-month post hoc follow-up analysis, the CR + CRh rate for patients in the VEN-LDAC group was 48.3% (95% CI, 39.8% to 56.8%), and was unchanged in the PLA-LDAC group at 14.7% (95% CI, 7.3% to 25.4%).
At the final analysis, the median time to first remission (CR + CRi) was 1.1 months (range = 0.8 to 4.7) in the VEN-LDAC group and 3.7 months (range = 0.9 to 6.5) in the PLA-LDAC group. At the 6-month post hoc follow-up analysis, the median time to first remission (CR + CRi) was similar to the results from the final analysis.
At the final analysis, the median duration of remission (DOR) (CR + CRi) was 10.8 months in the VEN-LDAC group and 6.2 months in the PLA-LDAC group. At the 6-month post hoc follow-up analysis, the median DOR (CR + CRi) was 11.7 months in the VEN-LDAC group. It remained at 6.2 months in the PLA-LDAC group.
At the final analysis, transfusion independence (red blood cell [RBC] and platelet) was achieved by 37.1% of patients in the VEN-LDAC group and by 16.2% of patients in the PLA-LDAC group. At the 6-month post hoc follow-up analysis, transfusion independence was achieved by 39.2% of patients in the VEN-LDAC group and by 17.6% of patients in the PLA-LDAC group. Therefore, there was a slight increase in the percentage of patients who were transfusion-independent in each treatment group from the final analysis to the 6-month post hoc follow-up analysis.
Harms Results
At the time of the 6-month post hoc follow-up analysis, 99.3% of patients in the VEN-LDAC group and 98.5% of patients in the PLA-LDAC group experienced at least 1 AE. The most common AEs (VEN-LDAC versus PLA-LDAC) were neutropenia (45.8% versus 17.6%), thrombocytopenia (45.8% versus 39.7%), nausea (43.0% versus 30.9%), diarrhea (33.1% versus 17.6%), and febrile neutropenia (32.4% versus 29.4%). Grade 3 or higher AEs occurred in 97.2% of patients in the VEN-LDAC group and in 95.6% of patients in the PLA-LDAC group. The most common were neutropenia (48.6% versus 17.6%), thrombocytopenia (45.8% versus 38.2%), and febrile neutropenia (32.4% versus 29.4%).
Serious adverse events (SAEs) occurred in 66.9% of patients in the VEN-LDAC group and in 61.8% of patients in the PLA-LDAC group. The most common SAEs (VEN-LDAC versus PLA-LDAC) were febrile neutropenia (16.9% versus 17.6%) and pneumonia (14.1% versus 10.3%).
AEs leading to death occurred in 23.2% patients in the VEN-LDAC group versus 20.6% of patients in the PLA-LDAC group. The most common AE that led to death in the VEN-LDAC group was pneumonia, which occurred in 4.9% of patients treated with VEN-LDAC and in 0 patients treated with PLA-LDAC.
Notable harms included infections, which were under the broader category of infections and infestations; 64.8% of patients in the VEN-LDAC group and 60.3% of patients in the PLA-LDAC group experienced an event. Pneumonia was the most common infection, occurring in 21.8% and 16.2% of patients in the VEN-LDAC and PLA-LDAC groups, respectively. All of the following notable harms occurred more frequently in the VEN-LDAC group: second primary malignancy in 2.1% versus 0% of patients, TLS in 5.6% versus 0% of patients, and hemorrhage in 41.5% versus 30.9% of patients. Any AE of neutropenia was reported in 68.3% and 45.6% patients, respectively.
Table 2: Summary of Key Results From the VIALE-C Study
Outcomes | Final analysis (data cut-off date: February 15, 2019) | 6-month post hoc analysis (data cut-off date: August 15, 2019) | ||
|---|---|---|---|---|
VEN-LDAC N = 143 | PLA-LDAC N = 68 | VEN-LDAC N = 143 | PLA-LDAC N = 68 | |
Follow-up time (months), median | 12 | 17.5 | ||
Overall survival | ||||
Deaths, n (%) | 86 (60.1) | 47 (69.1) | 99 (69.2) | 54 (79.4) |
Median OS, months (95% CI) | 7.2 (5.6 to 10.1) | 4.1 (3.1 to 8.8) | 8.4 (5.9 to 10.1) | 4.1 (3.1 to 8.1) |
Cox proportional hazard model HR (stratified) (95% CI)a | 0.749 (0.524 to 1.071) | 0.704 (0.503 to 0.985) | ||
P value | 0.114 | 0.041 | ||
Event-free survival | ||||
Patients with an event, n (%): | 100 (69.9) | 54 (79.4) | 109 (76.2) | 59 (86.8) |
| 42 | 18 | 47 | 18 |
| 16 | 13 | 17 | 13 |
| 42 | 23 | 45 | 28 |
Duration of EFS, median (95% CI), months | 4.7 (3.7 to 6.4) | 2.0 (1.6 to 3.1) | 4.9 (3.7 to 6.4) | 2.1 (1.5 to 3.2) |
HR (unstratified) (95% CI) | 0.601 (0.430 to 0.839) | NA | ||
P value | 0.003b | NA | ||
HR (stratified) (95% CI) | 0.583 (0.416 to 0.817) | 0.610 (0.442 to 0.841) | ||
P value | 0.002a,b | 0.003a,b | ||
Complete remission | ||||
CR rate (best response), n (%) [95% CI] | 39 (27.3) [20.2 to 35.3] | 5 (7.4) [2.4 to 16.3] | 40 (28.0) [20.8 to 36.1] | 5 (7.4) [2.4 to 16.3] |
CRi, n (%) [95% CI] | 29 (20.3) [14.0 to 27.8] | 4 (5.9) [1.6 to 14.4] | 29 (20.3) [14.0 to 27.8] | 4 (5.9) [1.6 to 14.4] |
CR + CRi, n (%) [95% CI] | 68 (47.6) [39.1 to 56.1] | 9 (13.2) [6.2 to 23.6] | 69 (48.3) [39.8 to 56.8] | 9 (13.2) [6.2 to 23.6] |
P value (CR + CRi) | < 0.001a,b | < 0.001a,b | ||
Best IWG response | ||||
PR, n (%) | 3 (2.1) | 0 | 3 (2.1) | 0 |
MLFS, n (%) | 7 (4.9) | 1 (1.5) | 7 (4.9) | 2 (2.9) |
RD, n (%) | 41 (28.7) | 37 (54.4) | 40 (28.0) | 36 (52.9) |
CR + CRi rate (as best response) by initiation of cycle 2 | ||||
CR, n (%) [95% CI] | 23 (16.1) [10.5 to 23.1] | 2 (2.9) [0.4 to 10.2] | 23 (16.1) [10.5 to 23.1] | 2 (2.9) [0.4 to 10.2] |
CRi, n (%) [95% CI] | 26 (18.2) [12.2 to 25.5] | 0 | 26 (18.2) [12.2 to 25.5] | 0 |
CR + CRi, n (%) [95% CI] | 49 (34.3) [26.5 to 42.7] | 2 (2.9) [0.4 to 10.2] | 49 (34.3) [26.5 to 42.7] | 2 (2.9) [0.4 to 10.2] |
P value (CR + CRi) | 0.001a,b | NA | ||
Hematologic response | ||||
CR + CRh rate (as best response) | ||||
CR, n (%) [95% CI] | 39 (27.3) [20.2 to 35.3] | 5 (7.4) [2.4 to 16.3] | 40 (28.0) [20.8 to 36.1] | 5 (7.4) [2.4 to 16.3] |
CRh, n (%) [95% CI] | 28 (19.6) [13.4 to 27.0] | 5 (7.4) [2.4 to 16.3] | 29 (20.3) [14.0 to 27.8] | 5 (7.4) [2.4 to 16.3] |
CR + CRh, n (%) [95% CI] | 67 (46.9) [38.5 to 55.4] | 10 (14.7) [7.3 to 25.4] | 69 (48.3) [39.8 to 56.8] | 10 (14.7) [7.3 to 25.4] |
P value (CR + CRh) | 0.001a,b | 0.001a,b | ||
Time to response | ||||
Time to first response of CR + CRi, median months (range) | 1.1 (0.8 to 4.7) | 3.7 (0.9 to 6.5) | 1.1 (0.8 to 16.3) | 3.7 (0.9 to 6.5) |
Time to best response for: | ||||
CR, median (range) | 1.3 (0.9 to 5.9) | 3.7 (0.9 to 9.2) | 1.3 (0.9 to 16.1) | 3.7 (0.9 to 9.2) |
CRi, median (range) | 1.2 (0.8 to 4.3) | 3.8 (1.7 to 6.5) | 1.2 (0.8 to 16.3) | 3.8 (1.7 to 6.5) |
CR + CRi, median (range) | 1.2 (0.8 to 5.9) | 3.7 (0.9 to 9.2) | 1.1 (0.8 to 16.3) | 3.7 (0.9 to 6.5) |
Duration of remission | ||||
Median duration of CR + CRi, months (95% CI) | 10.8 (5.9 to NE) | 6.2 (1.1 to NE) | 11.7 (7.6 to NE) | 6.2 (1.1 to NE) |
Median duration of CR, months (95% CI) | 11.1 (5.9 to NE) | 8.3 (3.1 to 8.3) | 17.1 (8.2 to NE) | 8.3 (2.8 to NE) |
Transfusion independence | ||||
Post-baseline transfusion independence rate: | ||||
RBC and platelet, n (%) [95% CI] | 53 (37.1) [29.1 to 45.5] | 11 (16.2) [8.4 to 27.1] | 56 (39.2) [31.1 to 47.7] | 12 (17.6) [9.5 to 28.8] |
Treatment difference (95% CI) | 20.9 (9.1 to 32.7) | 21.5 (9.4 to 33.6) | ||
RBC, n (%) [95% CI] | 58 (40.6) [32.4 to 49.1] | 12 (17.6) [9.5 to 28.8] | 62 (43.4) [35.1 to 51.9] | 13 (19.1) [10.6 to 30.5] |
Treatment difference (95% CI) | 22.9 (10.8 to 35.0) | 24.2 (11.9 to 36.6) | ||
Platelet, n (%) [95% CI] | 68 (47.6) [39.1 to 56.1] | 22 (32.4) [21.5 to 44.8] | 70 (49.0) [40.5 to 57.4] | 22 (32.4) [21.5 to 44.8] |
Treatment difference (95% CI) | 15.2 (1.4 to 29.0) | 16.6 (2.8 to 30.4) | ||
Harms | ||||
Patients with an AE, n (%) | NA | NA | 141 (99.3) | 67 (98.5) |
Patients with an SAE, n (%) | NA | NA | 95 (66.9) | 42 (61.8) |
Patients with a TEAE leading to death, n (%) | NA | NA | 33 (23.2) | 14 (20.6) |
Patients with an AE leading to VEN or PLA discontinuation | NA | NA | 37 (26.1) | 16 (23.5) |
AE = adverse event; AML = acute myeloid leukemia; CI = confidence interval; CR = complete remission; CRh = complete remission with partial hematologic recovery; CRi = complete remission with incomplete blood count recovery; EFS = event-free survival; HR = hazard ratio; IWG = International Working Group; MLFS = morphologic leukemia-free state; NA = not available; NE = not estimable; OS = overall survival; PLA = placebo; PR = partial remission; RBC = red blood cell; RD = resistant disease; SAE = serious adverse event; TEAE = treatment-emergent adverse event; VEN = venetoclax.
Note: All P values reported in the table outside of the final analysis of the primary outcome should be considered nominal.
aStratified by AML status (de novo, secondary) and age (18 years to < 75 years; ≥ 75 years) from interactive voice or web response systems.
bBecause statistical significance was not met for the primary objective, statistical significance cannot be declared for any of the secondary efficacy end points. Therefore, these P values are only descriptive in nature.
Source: Clinical Study Report for VIALE-C.3
Critical Appraisal
The VIALE-C study failed to meet its primary outcome of OS. However, it is plausible for a trial not to meet a pre-specified end point when the parameters used for statistical planning are unknown or uncertain at the time a trial is executed. Therefore, it was not surprising to see a greater difference in OS at the 6-month post hoc follow-up analysis, by which time more deaths had occurred. All of the secondary outcomes assessed in the trial consistently demonstrated improvement in favour of VEN-LDAC over PLA-LDAC.
A large number of patients withdrew from the study, and there were numerically fewer withdrawals in the VEN-LDAC group than in the PLA-LDAC group (72.0% versus 82.4% of patients, respectively). Most of these withdrawals were due to deaths, and this also accounted for the difference between groups. This difference in withdrawals may have affected the interpretation of patient-reported outcomes and harms. The VEN-LDAC group also had longer exposure to the study drug.
The population included in the VIALE-C study was consistent with the population one would expect to use VEN-LDAC in Canada, according to the clinical experts consulted by CADTH. Dosing of LDAC may have been different in the VIALE-C study — which used body surface area to determine dosing — than in Canada, where a flat dose tends to be used.
Indirect Comparisons
Description of Studies
A systematic review and network meta-analysis (NMA) were conducted of trials comparing VEN-LDAC, venetoclax plus azacitidine (VEN-AZA), LDAC, AZA, and BSC in adults with AML who were not eligible for standard induction chemotherapy. Data were available for OS for 4 trials in a connected network and for CR + CRi for 3 trials.
Efficacy Results
For OS, VEN-LDAC was favoured over LDAC (HR = 0.70; 95% credible interval, 0.50 to 0.99) and BSC (HR = 0.46; 95% credible interval, 0.26 to 0.81), with no difference seen between VEN-LDAC and AZA (HR = 0.82; 95% credible interval, 0.54 to 1.24) or between VEN-LDAC and VEN-AZA (HR = 1.23; 95% credible interval, 0.76 to 2.01). For CR + CRi, VEN-LDAC was favoured over LDAC (odds ratio [OR] = 6.24; credible interval, 2.98 to 14.42), AZA (OR = 5.84; credible interval, 2.39 to 15.22), and BSC (OR = 73.35; 95% credible interval, 8.05 to 2,370.88), with no difference seen between VEN-LDAC and VEN-AZA (OR = 1.16; 95% credible interval, 0.43 to 3.33).
Harms Results
No analysis of harms was included in the NMA.
Critical Appraisal
A key limitation of the NMA was the clinical heterogeneity between studies in important prognostic indicators and potential treatment-effect modifiers of blast count at baseline, prior treatment with HMAs, and cytogenetic risk. Because the network was sparse, fixed-effects models had to be used, and there was no opportunity for baseline covariate adjustments. Due to the previously described limitations, the comparative efficacy estimates may be biased, and it is not possible to quantify or identify the direction of the bias. Certain estimates, particularly for CR + CRi, were highly imprecise because of low numbers of responses in some study arms.
Conclusions
One multinational, sponsor-funded, double-blind, placebo-controlled RCT was included in this review. The VIALE-C trial evaluated the treatment effect of a combination therapy of VEN-LDAC compared to LDAC alone in patients with AML who were ineligible to receive intensive induction chemotherapy. Although results for the primary outcome, OS, were not statistically significant, there were consistent improvements in secondary outcomes, such as EFS, CR + CRi rate, CR + CRh rate, and transfusion independence in favour of VEN-LDAC versus LDAC alone. Health-related quality of life (HRQoL) and symptoms (fatigue) are deemed important outcomes by patients; however, these analyses were confounded by the large amount of attrition that occurred in both treatment groups and the early failure of the statistical testing hierarchy of outcomes. The treatment effects of VEN-LDAC and VEN-AZA may be comparable; however, comparative efficacy was based on a small indirect treatment comparison (ITC) with limitations, and only OS and CR + CRi were assessed. It remains uncertain whether VEN-LDAC is better than AZA alone, given that the ITC failed to show consistent results based on OS and CR + CRi. Neutropenia was the most common AE associated with the use of VEN-LDAC, and although there was no clear indication of more infections, there did appear to be numerically more cases of pneumonia compared to LDAC alone.
Introduction
Disease Background
AML is a hematopoietic neoplasm that is characterized by an abnormal proliferation of immature blast cells from the bone marrow that do not differentiate into red blood cells, platelets, and granulocytes, ultimately resulting in a variety of cytopenias. WHO defines AML as having greater than 20% blast cells in peripheral blood or bone marrow. Initial presentation is often a manifestation of these various cytopenias because patients may be fatigued (anemia) or suffer from an infection (neutropenia) or bleeding (thrombocytopenia). AML is the second-most common leukemia in adults, with most cases occurring in older adults; the median age of onset is 67 years. In 2016, 1,090 Canadians were diagnosed with AML.1 According to statistics from the Canadian Cancer Society, approximately 65% to 70% of patients achieve CR after induction therapy.1 The prognosis for AML appears to be poorer in patients over the age of 60 compared to younger patients, including those who have unfavourable cytogenetics and multidrug resistance. Approximately 25% to 40% of patients over the age of 60 are expected to survive 3 years or more. The risk of secondary AML (due to MDS or therapy for other malignancies) also appears to increase with age; this also predicts a poor prognosis.4 If an allogeneic SCT is performed during the first remission, the 5-year disease-free survival is 30% to 50%. If there is no recurrence by 2 years post-transplant, patients have about an 80% chance of staying in CR for a long period of time.1
Standards of Therapy
Standard treatment for patients who are medically fit consists of cytotoxic remission induction therapy with cytarabine, administered by infusion over 7 days, combined with an anthracycline, usually daunorubicin or idarubicin, given daily for the first 3 days. Induction therapy is followed by high-intensity consolidation therapy. This may be accompanied by targeted therapy for specific clinical situations or genetic mutations: midostaurin in patients with FLT3 mutation and gemtuzumab ozogamicin (a monoclonal antibody against CD33) in patients with favourable- and intermediate-risk disease.
The determination of eligibility for intensive chemotherapy is based on patient age, fitness, and preference, and on the presence of comorbidities. In general, intensive therapy is poorly tolerated by older patients. According to the 2017 Canadian consensus guidelines for treatment of older patients with AML, induction therapy shows a survival benefit for patients up to age 80, with the exception of those patients with major comorbidities or adverse risk cytogenetics who are not candidates for hematopoietic SCT. Daunorubicin is the recommended drug for induction therapy, with midostaurin added for patients aged 70 years or younger with an FLT3 mutation, and gemtuzumab ozogamicin added for patients aged 70 years or younger with de novo AML and favourable- or intermediate-risk cytogenetics. For patients who are not eligible for induction therapy, AZA is recommended for those with adverse risk cytogenetics or transformed from MDS, while either HMA or LDAC can be used for others.
In the past decade, there has been a growing trend toward treating more elderly patients (65 years to 80 years) with AML. The elderly pose additional challenges and considerations when it comes to treatment, including toxicity and tolerability issues, and as noted previously, they have a poorer prognosis than younger patients at baseline. According to the clinical experts consulted by CADTH for this review, patients who are not eligible for induction chemotherapy can receive AZA, LDAC, BSC, or other drugs in clinical trials as first-line therapies. According to the clinical experts, approximately 10% of patients older than 75 years are eligible for induction chemotherapy (depending on their disease risk and performance status), although few patients over 80 would be eligible. VEN-AZA, which is also being reviewed by CADTH, is likely to be used ahead of VEN-LDAC, except in most patients who have had prior treatment with an HMA.
The key goals of treatment are to prolong survival, induce remission, decrease the number of hospital visits and transfusion requirements, and improve HRQoL. In AML, CR and response are considered surrogates for those outcomes. Not all patients respond to first-line therapy, and all eventually become refractory to current treatment options, with limited life expectancy. There are few effective treatment options following relapse on front-line AML therapy; many patients will receive a drug that is an alternative to the one initially given (e.g., LDAC following AZA) or off-label AZA (with or without VEN), or will participate in a clinical trial. A minority of patients with FLT3 mutations receive gilteritinib, but many patients are not well enough to tolerate further therapy; hence, they receive BSC only.
Drug
VEN is an orally administered selective inhibitor of the anti-apoptotic protein BCL-2, which is overexpressed and appears to contribute to cancer cell survival in various malignancies, including hematologic. It may also be associated with resistance to chemotherapy.
VEN was granted a Health Canada NOC on December 4, 2020. The approved indication is for VEN (Venclexta) in combination with AZA or LDAC for the treatment of patients with newly diagnosed AML who are 75 years of age or older, or who have comorbidities that preclude the use of intensive induction therapy.5 This indication is consistent with the reimbursement request. VEN underwent expedited review under Project Orbis.
After an initial dose ramp-up of 4 days, VEN is administered at a dose of 600 mg orally when combined with LDAC (administered at a dose of 20 mg/m2 subcutaneously once daily on day 1 to day 10 of each 28-day cycle). According to the product monograph, VEN in combination with LDAC should be continued if the patient is considered to be deriving clinical benefit or until unacceptable toxicity is observed. It is recommended that patients without unacceptable toxicity be treated for a minimum of 6 cycles. VEN is also indicated for use in CLL, either alone or in combination with obinutuzumab or rituximab.5
Table 3 summarizes the characteristics and indications for VEN, AZA, and LDAC.
Table 3: Key Characteristics of VEN, AZA, and LDAC
Characteristic | VEN | AZA | LDAC |
|---|---|---|---|
Mechanism of action | Selective inhibitor of the anti-apoptotic protein BCL-2. | Inhibits DNA methyltransferase, blocking methylation of new DNA. Hypomethylation of DNA can reverse hypermethylation, leading to gene silencing. | Kills cells undergoing DNA synthesis (S phase). Under certain conditions, blocks the progression of cells from G1 phase to S phase. Acts through inhibition of DNA polymerase. |
Indicationa | In combination with AZA or LDAC for the treatment of patients with newly diagnosed AML who are 75 years or older or who have comorbidities that preclude the use of intensive induction therapy | AML with 20% to 30% blasts and multi-lineage dysplasia, according to WHO classification | NA |
Route of administration | Oral, tablet | Subcutaneous | Subcutaneous |
Recommended dose | In combination with AZA: 400 mg/day following 3-day ramp-up In combination with LDAC: 600 mg/day following 4-day ramp-up | 75 mg/m2 daily for 7 consecutive days in a 28-day treatment cycle for a recommended minimum of 6 cycles | 20 mg SC b.i.d. or 20 mg/m2 SC daily for 10 consecutive days in a 28-day treatment cycle for a recommended minimum of 4 cycles |
Serious adverse effects or safety issues | Serious warnings and precautions:
Warnings and precautions:
| Serious warnings and precautions:
Warnings and precautions:
| Serious warnings and precautions:
|
Other | Concomitant use of strong CYP3A inhibitors during initiation; ramp-up requires VEN dose reduction | NA | Not beneficial in patients with poor-risk cytogenetics |
AML = acute myeloid leukemia, AZA = azacitidine; BCL-2 = B-cell leukemia protein 2; b.i.d. = twice daily; CYP3A = cytochrome P450; LDAC = low-dose cytarabine; NA = not applicable; SC = subcutaneous; TLS = tumour lysis syndrome; VEN = venetoclax.
aHealth Canada–approved indication.
Source: Product monographs for Venetoclax, LDAC, and AZA.6
Patient Group Input
This section was prepared by CADTH staff based on the input provided by the patient group.
About the Patient Group and Information Gathered
One patient advocacy group, the LLSC, provided input on VEN-LDAC for the treatment of AML. The LLSC’s mission is to cure leukemia, lymphoma, Hodgkin’s disease, and myeloma, as well as to improve the quality of life of all Canadians affected by blood cancers. The LLSC has received funding from AbbVie.
The LLSC used an online survey to gather information for its submission. The survey was conducted from December 7, 2020 to January 24, 2021.
Respondents included 29 patients, all from Canada: 13 from Ontario, 6 from Quebec, 6 from British Columbia, and 4 from Alberta. Patients’ ages ranged from 25 years to 84 years; 2 were aged 75 years or older. There were 18 females and 10 males. One did not report gender. Information on comorbidities was not reported. All patients had been diagnosed with AML within the past 7 years. None of the respondents had experience with VEN-LDAC.
Disease Experience
According to the patients with AML who responded to the LLSC survey, the symptoms that affect their quality of life include fatigue, suddenness of symptom development, anxiety, fear of relapse (number of patients unspecified for preceding symptoms), and loss of eyesight (n = 1). One patient experienced a ruptured spleen and was in a coma for 8 days. Fatigue was the symptom mentioned most often. Fatigue and other symptoms affect social and family life. Some patients reported that these symptoms were compounded by changes related to the coronavirus 2019 (COVID-19) pandemic, leading to further social isolation. Some patients reported that they are unable to work due to their disease and associated symptoms. Many patients did not provide information about the specific symptoms they experienced but described being diagnosed with AML as a life-changing event. The following are comments from patients regarding their experiences with AML:
Pre-diagnosis, I was very, very active, holding 3 jobs that equalled a full pay cheque — librarian in the morning, massage therapist 3 afternoons, and teaching at a local university on the weekends. As I become ‘sicker,’ I could barely walk across the room. The day I was diagnosed, I was wheeled up to the cancer ward from emergency and was there for 5 months. Everything in my life stopped cold turkey — employment, social life, relationships, etc. I made a complete personal 360 degree pivot to focus on my healing and living.
Well COVID and my compromised immune system has caused me to be very socially isolated. I haven't seen some very important people in my life for almost 2 years at this point. Symptoms have also caused an impact to my physical fitness and being able to do things that I normally would.
When asked if there are any aspects or symptoms of AML that are easier to control, most patients (n = 7) indicated no, and 1 commented that there was no control with AML. Three patients indicated that exercise was helpful in alleviating some symptoms. They reported that exercise and keeping active helped, particularly with fatigue.
Two patients reported feeling no impact or felt back to normal at the time of survey.
AML affects not only those who are diagnosed, but also their caregivers. These may include a spouse, immediate family members, and friends. Patients considered the emotional support they received from caregivers as important and reported that they required assistance for medical visits and daily activities. According to the LLSC survey, patients reported that caregivers may feel multiple emotions about the patient’s AML; stress, worry, sadness, insecurity, and fear of dying were all frequently mentioned. Their companion through the disease journey was important for patients.
Experiences With Currently Available Treatments
According to the LLSC survey, the front-line treatments that patients received after diagnosis included chemotherapy (n = 24), SCT or bone marrow transplant (n = 16), drug therapy (n = 6), radiation therapy (n = 5), and chimeric antigen receptor T-cell therapy (n = 1). Two patients cited specific drugs they had received: 1 reported receiving treatment with VEN, and the other received Vyxeos (daunorubicin and cytarabine). Patients reported a wide range of side effects with current treatments. Those they considered to have a large impact on their quality of life included hair loss (n = 17), weakness (n = 15), extreme fatigue (n = 14), diarrhea (n = 10), infections (n = 8), anemia (n = 8), mouth sores (n = 8), nausea and vomiting (n = 7), fever (n = 6), low blood cell counts (n = 6), tingling sensations (n = 4), constipation (n = 2), graft-versus-host disease (n = 2), lung, heart, kidney, or nerve problems (n = 2), cough (n = 1), rashes (n = 1), shortness of breath (n = 1), and psychological distress (n = 1). Patients frequently mentioned the side effects of chemotherapy and SCT and the impact of these treatments on their quality of life. These side effects from front-line treatments affected patients in terms of physical activity (n = 15), eating challenges (n = 12), anxiety (n = 11), and problems in mental health and overall happiness (n = 11), social development (n = 6), and educational development (n = 6). Overall, the side effects from front-line therapies caused significant disturbance to daily living and quality of life. During SCT, patients were at risk of opportunistic infections and were isolated from visitors. The following are comments from patients regarding their experiences with front-line AML treatments:
“The main challenge was the nausea and vomiting. I didn’t seem to have much control over it and had my wonderful bucket always with me. I could be fast asleep and awake and vomit.”
“Your whole world changes when you are diagnosed with AML. Suddenly, you confront your mortality. You feel extremely weak, you have to go into hospital for months, and you don't realize you MUST go into remission to have a stem cell transplant.”
“Extremely tired and little desire to be active. Difficulty eating and keeping it down. A few days of low hemoglobin and fluid on the lung that caused shortness of breath.”
“The worst issue is that I have no more job and that the treatments made me lose a lot of concentration and I get exhausted easily.”
“Had to move to Vancouver for treatment for 9 months. Two or 3 months total in hospitals. Daily outpatient care. Kinda turns your life upside-down.”
Patients who responded to the LLSC survey reported a mixture of positive and negative experiences accessing treatments. Thirteen respondents reported generally positive experiences, and some attributed their experience to the support from medical staff. Six patients reported negative experiences. Negative experiences were related to challenges with receiving care and being informed about treatment plans. Some patients needed to relocate to receive their treatment.
Improved Outcomes
The majority of respondents to the LLSC survey indicated that the factors they considered when evaluating a new cancer treatment were physician recommendation (n = 19), possible impact on disease (n = 17), quality of life (n = 12), closeness to home (n = 9), and outpatient treatment (n = 8).
The LLSC survey respondents also reported that they hoped new treatment options could maintain remission, be targeted and have fewer side effects, be covered by public plans, and be accessible in more geographic regions. The opportunity to have access to other supportive options, such as meditation, hypnosis, neuro-linguistic programming support, and awareness support (thoughts, emotions, and behaviours), was also mentioned.
Experience With the Drug Under Review
None of the LLSC respondents had experience with VEN-LDAC.
Companion Diagnostic Test
Not applicable.
Additional Information
Not applicable.
Clinician Input
Input From Clinical Experts Consulted by CADTH
All CADTH review teams include at least 1 clinical specialist with expertise regarding the diagnosis and management of the condition for which the drug is indicated. Clinical experts are a critical part of the review team and are involved in all phases of the review process (e.g., providing guidance on the development of the review protocol; assisting in the critical appraisal of clinical evidence; and interpreting the clinical relevance of the results; and providing guidance on the potential place in therapy). The following input was provided by 2 clinical specialists with expertise in the diagnosis and management of AML.
Unmet Needs
Key goals of treatment include prolonging survival, inducing remission, decreasing hospitalizations and transfusion requirements, and improving HRQoL. The clinical experts indicated that current lower-intensity treatments have low rates of CR, and the CR rates that occur are not durable. Treatments with intensive chemotherapy are associated with higher CR rates but tend to have increased toxicity and are not well tolerated in the population under review.
Place in Therapy
The clinical experts indicated that VEN combinations will likely become the new standard of care for the first-line treatment of patients aged 18 years or older with AML who are not eligible for induction chemotherapy. VEN in combination with an HMA is expected to be the preferred combination, although VEN will be used in combination with LDAC in some patients who have received prior treatment with an HMA. Overall, VEN-LDAC will likely be used in a smaller number of patients than will VEN-AZA, although an advantage of VEN-LDAC will be the ability to administer the treatment at home. For patients with treatment-naive AML aged 75 years or older who are eligible for intensive chemotherapy, especially those with good- or intermediate-risk cytogenetics, there would have to be a discussion with the patient about the risks and benefits of the potential different treatment options. It should be noted there is no consistency as to the upper age limit at which an acute leukemia treatment centre would administer intensive chemotherapy. Given that VEN-LDAC is myelosuppressive, it may not be suitable for a small number of frail patients, or for those who would be unable to travel to the treating hospital for count checks. This, too, would need to be an assessment made by the treating physician in conjunction with the patient.
Patient Population
VEN-LDAC will be most suited for patients who have AML and are unfit for induction, and who have received a prior HMA. The identification of these patients will likely be based on clinical judgment and patient preference. There is also a subset of patients who may be fit for induction chemotherapy but choose VEN-LDAC based on their goals of care, toxicity profile, and lifestyle factors, such as distance from hospital. Patients should have a diagnosis of AML with greater than 20% blasts. The use of therapy will not be dependent on symptoms. At present, it is not possible to identify patients who are more or less likely to respond to VEN-LDAC.
Patients with good risk cytogenetics and patients with myeloproliferative neoplasm in blast crisis have been excluded from studies of VEN-LDAC, as have patients with isolated granulocytic sarcoma. One clinical expert indicated that clinical studies suggest that response to VEN plus an HMA in patients with prior HMA exposure is similar to the response observed with VEN-LDAC; however, there are no direct comparisons of these 2 treatments post-HMA. Patients with central nervous system (CNS) involvement by AML have been excluded from all AML studies, but this does not mean that this group of patients would not benefit from VEN-LDAC with concomitant intrathecal therapy, similar to the current practice of administering systemic intensive chemotherapy and intrathecal therapy to those patients who have CNS involvement by AML.
Assessing Response to Treatment
The outcomes used to measure response include CBC and bone marrow blasts, although 1 clinical expert noted that the strict definitions of response do not always capture responding patients. A clinically meaningful response would be indicated by improved survival, CR rate, decreased need for hospitalization and transfusion, and decreased rate of progression. One clinical expert indicated that response should be assessed using bone marrow biopsy after the first and second cycle, and a response would be expected after 2 cycles if there is going to be a response. The other clinical expert indicated that response should be assessed at minimum after 4 cycles to 6 cycles, but that most clinicians assess after the first cycle, given cost and to guide the dosing of VEN for subsequent cycles. Once a response is obtained, then CBC could be followed for evidence of progression.
Discontinuing Treatment
The experts agreed that disease progression and intolerable AEs were factors in the decision to discontinue treatment. Disease progression would be indicated by worsening CBC, increased marrow blasts, or loss of transfusion independence. The clinicians could not comment on whether VEN could be continued as a single drug if a patient stopped LDAC.
Prescribing Conditions
The clinical experts indicated that a hospital or outpatient clinic would be an appropriate setting for treatment. Because VEN-LDAC is myelosuppressive, physicians should have experience in looking after acute leukemia patients. Patients might require hospital admission for VEN dose ramp-up. The proportion of patients depends upon the population: 1 clinician indicated that the proportion would be small, and another that it could be 25% to 50%. Patients would also require pre-treatment and monitoring for TLS, which occurs in 1% to 2% of patients. A not-insignificant proportion of patients will need to be hospitalized for neutropenic fever and other complications during their cycle of therapy. Pharmacists would be involved in reviewing medications, given that a significant proportion of patients are on azoles, which interact with VEN and require dose modifications.
Clinician Group Input
This section was prepared by CADTH staff based on the input provided by clinician groups.
Two group clinician inputs were provided for the reimbursement review of VEN-LDAC for the treatment of AML.
The CLSG is a cross-Canada collective of physicians who treat acute leukemia, representing all major leukemia centres in all Canadian provinces. CLSG notes that its mission is to “improve the diagnosis and treatment of leukemia in Canada, by identifying diagnostic and management best practices, promoting Canada-wide standards of care, fostering clinical and basic leukemia research and improving new drug access.” CLSG gathered information for this review from its board members, who are all leukemia physicians working in academic, university-based treatment settings. CLSG opinions were formulated through ongoing group discussions and polling of members. Input was also requested from other international experts, as appropriate. Written opinions were further reviewed, edited, and approved by the group.
The OH HDSDAC provided evidence-based clinical and health system guidance on drug-related issues in support of Cancer Care Ontario’s mandate, including the Provincial Drug Reimbursement Programs and Systemic Treatment Program. Information for this submission was collected through joint discussions at the Disease Advisory Committee meeting.
Unmet Needs
The CLSG noted that approximately 40% to 50% of newly diagnosed patients with AML are judged to be unfit for intensive induction chemotherapy. CLSG added that these patients are generally older than 75 years of age or younger with severe comorbidities. For these patient populations, both clinician groups noted that the current standard of care treatments include AZA and LDAC along with BSC. The CLSG added that AZA is only approved for patients with AML with 20% to 30% blasts; however, it is widely used in Canada for patients with greater than 30% blasts.
The CLSG noted that for patients with poor-risk cytogenetics or AML transformed from MDS, AZA is the current treatment of choice; however, for patients with AML arising de novo with standard-risk cytogenetics, both AZA and LDAC can be used. CLSG added that in real-world clinical practice, many Canadian patients are not able to receive AZA-based therapy because, given its instability after reconstitution, the drug needs to be given in an oncology clinic setting. The CLSG also noted that for patients who live in rural or remote areas — and for some patients in urban settings — regular travel to these clinics may be problematic because of patient frailty and difficulty obtaining suitable transportation. It was also noted that unlike AZA, LDAC is stable for up to 14 days and can be administered at home, either by self-injection or by a home care nurse; further, this regimen requires only 1 clinic visit per month to receive the medicine and is considerably less costly than AZA and well tolerated. The CLSG estimated that approximately 70% to 75% of unfit patients with AML who receive treatment will receive AZA, and about 25% to 30% will receive LDAC. The group referenced the Canadian consensus guidelines for the use of these drugs.
Both clinician groups noted that the goals of treatment for this population are to improve survival, improve or maintain quality of life, and achieve transfusion independence (including improving hematopoiesis), given that the latter is an important surrogate determination of HRQoL.
Both clinician groups noted that currently available treatments offer a short survival advantage and short duration of transfusion independence for this patient population, and that overall response rates are low, with remission rates in the range of 15% to 25%. The CLSG also noted that nearly all patients who respond will become resistant and experience disease progression, usually within months; the median OS is approximately 4 months to 7 months with LDAC and 7 months to 10 months with AZA. The CLSG emphasized that AZA treatment requires frequent clinic visits for injections, which may not be feasible for many frail, older patients, especially those who live far from cancer centres.
Both clinician groups noted that the patients with the greatest unmet needs are those with AML who are not eligible for standard 7 + 3 induction therapy. This includes patients who are older or have comorbidities, because they generally have poor response rates and outcomes with standard therapies. The CLSG added that those who live farther away from cancer centres face the greatest unmet needs and challenges; according to CLSG, VEN-LDAC would provide the greatest benefit for those patients because they would be able to receive this treatment at home.
Place in Therapy
Both clinician groups agreed that VEN-LDAC would replace LDAC monotherapy. The CLSG added that VEN-LDAC would become the treatment of choice for previously untreated, unfit patients with AML who are unable to regularly visit a clinic for treatment (due to distance from a cancer centre, patient frailty, or lack of suitable transportation). The CLSG further noted that treatment with VEN-LDAC would be suitable for patients who have progressed to AML while receiving treatment with AZA for MDS. Given that most of these patients already receive LDAC, the CLSG noted that the addition of VEN would greatly improve response rates and allow for transfusion independence, thereby improving quality of life.
Both clinician groups indicated that it would not be appropriate for patients try other treatments before initiating treatment with VEN-LDAC because the submission is for first-line treatment, and the VIALE-C trial only included previously untreated patients with AML.
Both clinician groups also noted that the combination under review will replace the current first-line treatment. The CLSG noted that if treatment with VEN-LDAC fails, patients could potentially receive AZA if they have not previously received it. The CLSG reasons that this is done frequently for LDAC failures at present.
Patient Population
Both clinician groups noted that older, frail patients, or those with considerable comorbidities, would be best suited for treatment with VEN-LDAC. The OH HDSDAC added that no companion diagnostics are required to identify the patient population best suited.
Both clinician groups indicated that the patients who are least suitable for treatment with VEN-LDAC are those who are easily able to travel to a clinic to receive AZA injections and who have not previously received AZA or decitabine treatment; these patients would be offered VEN-AZA. The groups added that VEN-LDAC may be more suitable for the very frail or very elderly. Patients who have an ECOG PS of 4 due to major comorbidities (e.g., are incapacitated due to major stroke or advanced dementia) would, in most cases, receive BSC. The OH HDSDAC added that subcutaneous LDAC can be given by home care.
The CLSG identified patients with standard-risk cytogenetics to have better OS; however, they indicated that all patients could benefit from treatment with VEN-LDAC.
Assessing Response to Treatment
Both clinician groups noted that blood counts should be monitored frequently, particularly during the initial treatment cycles, and that the indicators of response include improvement in blood counts, achievement of CR (less than 5% blasts in a cellular marrow), and transfusion independence.
Both clinician groups also agreed that an improvement in hematopoiesis would be considered a clinically meaningful response to treatment with VEN-LDAC. The CLSG added that a CR with achievement of transfusion independence would be of major clinical benefit to patients. The advantages include not having to return to clinic frequently for red cell and platelets transfusions and chemotherapy injections, improvement in fatigue, and lower risk of bleeding and infections. The CLSG noted that these advantages were demonstrated in the clinical study through sustained improvements in the fatigue and Global Health Status/Quality of Life scores compared with LDAC alone.
Both clinician groups agreed that frequent and regular CBCs should be performed to assess response to treatment because treatment delays and dose modifications may be needed. The OH HDSDAC added that bone marrow assessments should be performed as needed and based on clinical judgment. The CLSG indicated that patients should be re-evaluated for response every 4 weeks (at the start of each treatment cycle) and that bone marrow assessment may be performed after 1 to 2 cycles to assess remission status.
Discontinuing Treatment
Both clinician groups indicated that disease progression at any time (significant increase in blasts in the marrow or blood) would be considered a factor for treatment discontinuation. The CLSG added that lack of objective hematologic response after 4 treatment cycles should be considered cause for treatment discontinuation. The OH HDSDAC also indicated that treatment-related toxicities and patient preference should be considered when deciding to discontinue treatment.
Prescribing Conditions
Both clinician groups agreed that outpatient-specialized hematology or leukemia clinics, either community-based or at academic centres, are appropriate settings for treatment with VEN-LDAC. Both clinician groups indicated that patients may be admitted as inpatients due to TLS or AML complications while they continue with treatment. The CLSG noted that treatment should be administered and supervised by a hematologist with expertise in managing acute leukemia patients and experience in the use of VEN.
Additional Considerations
The OH HDSDAC added that VEN dose adjustments with co-administration of an azole are sometimes required. In the pivotal study (VIALE-C trial), the LDAC dose is lower than what is commonly used in Canadian practice. The OH HDSDAC also indicated that in patients who present with hyperleukocytosis, a longer ramp-up phase should be considered when initiating VEN.
Drug Program Input
The drug programs provide input on each drug being reviewed through CADTH’s reimbursement review processes by identifying issues that may affect their ability to implement a recommendation.
The drug programs indicated that current treatment options for patients newly diagnosed with AML who are ineligible for intensive induction chemotherapy include AZA, LDAC, and BSC. It was noted that some patients 75 years of age and older may be fit to tolerate induction chemotherapy. The ramp-up dosing schedule for VEN-LDAC differs significantly from the ramp-up dosing schedule already in use for CLL indications, and the current packaging for VEN is designed for the CLL ramp-up dosing schedule. The sponsor provided additional information related to this concern, stating that the ramp-up schedule is more gradual for CLL because the dosage starts at 20 mg per day and is increased over a period of 4 weeks, whereas the ramp-up schedule for VEN-LDAC in AML starts at 100 mg and lasts only 4 days. Therefore, for patients with AML, physicians will have the option of either ordering the appropriate number of 100 mg tablets for the ramp-up or initiating treatment with the standard bottle of 100 mg tablets. The drug programs indicated that VEN-LDAC may change the place in therapy of comparator drugs. They also identified the potential for indication creep for patients with a high risk of MDS, those who have progressed or have had an inadequate response on low-dose chemotherapy for AML, and those who have relapsed after induction chemotherapy, are not eligible for SCT, and are then treated with LDAC. It was noted that the treatment combination may require increased health care resources (i.e., hospital admission, additional pharmacy and nursing resources to manage TLS if needed and monitor for drug interactions, and home care resources and training if LDAC is administered at home). Affordability was also identified as an issue because VEN is an add-on to existing treatment.
The implementation questions and corresponding responses from the clinical experts consulted by CADTH are summarized in Table 4.
Table 4: Summary of Drug Plan Input and Clinical Expert Response
Drug program implementation questions | Clinical expert response |
|---|---|
Are all patients with newly diagnosed AML who are ineligible for treatment with intensive induction chemotherapy, regardless of cytogenetic risk, eligible for treatment with VEN-LDAC? | The VIALE-C trial included patients regardless of cytogenetic risk; therefore, all patients who are considered ineligible for treatment with intensive induction chemotherapy should be eligible for treatment with VEN-LDAC. |
Are patients with AML who have received prior treatment with AZA for MDS eligible for treatment with VEN-LDAC (i.e., were these patients included in the VIALE-C trial)? | The VIALE-C trial included patients who had received previous treatment with an HMA for MDS; therefore, these patients would be eligible for treatment with VEN-LDAC. |
Can VEN be used with alternate LDAC dosing schedules; namely, 20 mg (flat dosing) by subcutaneous injection twice daily on day 1 to day 10 of each 28-day cycle, as is typically prescribed? | In clinical practice, LDAC is usually administered according to the fixed- or flat-based dosing schedule. Because a difference in clinical outcome is not expected based on the dosing scheduled used (i.e., fixed vs. weight-based), VEN can be used with alternative dosing schedules for LDAC. |
The highest strength of VEN available is a 100 mg tablet. At full dose, patients will need to take 6 100 mg tablets to make up the dose, which is a high pill burden. Is there a plan to manufacture a higher-strength tablet? Is any supportive care required during “ramp-up” (i.e., for TLS prophylaxis)? | During the ramp-up period for VEN, patients need to be treated in a setting where they can be monitored daily. They would be treated with allopurinol as prophylaxis for TLS. Hydroxyurea should be administered to patients with a high WBC to lower the WBC to less than 25 × 109/L before administering VEN to reduce the risk of developing TLS (same as in the VIALE-C trial). It is unknown whether the sponsor has plans to manufacture a higher-strength tablet. |
There are differences in the eligibility criteria of the VIALE-C and VIALE-A trials. Should the eligibility criteria for VEN-LDAC be consistent with the criteria for VEN-AZA? Should patients who have received prior HMA (AZA) or chemotherapy for the treatment of MDS be considered for treatment with VEN-LDAC? | Although there were some differences in the patient eligibility requirements for each trial, the criteria for reimbursement should be consistent for both of the VEN-based regimens. The major differences in eligibility between the trials were:
|
Can VEN-LDAC be given to improve response as a bridge to allogeneic SCT in patients with AML who have a contraindication to chemotherapy but are otherwise candidates for an allogeneic SCT or for those who relapse after an allogeneic SCT as a bridge to donor lymphocyte infusion? | It is uncommon to have a patient with a contraindication to chemotherapy proceed to allogeneic SCT, but it may happen in some circumstances (e.g., for patients who have an ejection fraction of less than 50%). In these patients, performance status may improve after a response to VEN-LDAC, and allogeneic SCT could be considered. However, there is little evidence to support its use for this purpose7; instead, based on a head-to-head comparison with VEN-AZA, most physicians would opt for VEN-AZA as a bridge to allogeneic SCT in newly diagnosed patients with AML. The use of VEN-LDAC in patients who relapse after an allogeneic SCT as a bridge to donor lymphocyte infusion is considered out of scope for this review. |
There is a time-limited need to allow patients currently on LDAC whose disease has not yet progressed to add VEN if they otherwise meet the eligibility criteria. What is the appropriate time frame for treatment on LDAC to consider the addition of VEN? | There is no evidence to inform the appropriate time frame to consider adding VEN for patients who are receiving LDAC. In general, clinicians typically give up to 4 cycles (i.e., 4 months) of LDAC to determine a patient’s response to therapy. Therefore, it would be reasonable to add VEN to LDAC if patients were within the 4-month time frame of initiating LDAC and had not progressed. The value of adding VEN to a patient who has achieved a response or remission on LDAC is unknown. |
Inpatient administration may be required during the ramp-up portion for VEN. Are there specific groups, or an estimated percentage of patients, who would require hospital admission for the ramp-up portion of VEN? | Hospital administration will be required for some patients, and this is not necessarily limited to the ramp-up portion of VEN. This is an older patient population, some of whom may be frail, and patients may develop febrile neutropenia or infection at any time during the treatment window. It is difficult to estimate, but up to 30% of patients may require hospitalization during the ramp-up portion of VEN, and this may vary depending on the treatment setting (i.e., treatment centre vs. community, where there may not be the appropriate resources to monitor for TLS daily during the ramp-up period); however, this percentage is expected to decrease over time as clinicians become more experienced with administering VEN. Special groups of patients who may be at increased risk of hospitalization during the ramp-up period include those who have an elevated WBC count, high tumour burden, or underlying renal insufficiency. |
Are all cytogenetic risk categories eligible for treatment with VEN-LDAC? | As previously noted, all patients considered ineligible for intensive induction chemotherapy, regardless of cytogenetic risk, should be eligible for VEN-LDAC. |
If a patient stops treatment with the LDAC component for reasons other than disease progression, can the VEN be continued until disease progression? | The VIALE-C trial did not have a provision for patients to stop LDAC and continue on VEN or placebo. |
AML = acute myeloid leukemia; AZA = azacitidine; HMA = hypomethylating agent; LDAC = low-dose cytarabine; MDS = myelodysplastic syndrome; SCT = stem cell transplant; TLS = tumour lysis syndrome; VEN = venetoclax; VEN-LDAC = venetoclax plus LDAC; WBC = white blood cell count.
Clinical Evidence
The clinical evidence included in the review of VEN-LDAC is presented in 3 sections. The first section, the Systematic Review, includes pivotal studies provided in the sponsor’s submission to CADTH and Health Canada, as well as those studies that were selected according to an a priori protocol. The second section includes indirect evidence from the sponsor and indirect evidence selected from the literature that met the selection criteria specified in the review.
Systematic Review (Pivotal and Protocol-Selected Studies)
Objectives
To perform a systematic review of the beneficial and harmful effects of VEN in combination with LDAC for the treatment of patients with newly diagnosed AML who are 75 years or older, or who have comorbidities that preclude the use of intensive induction chemotherapy.
Methods
Studies selected for inclusion in the systematic review included pivotal studies provided in the sponsor’s submission to CADTH and Health Canada, as well as those meeting the selection criteria presented in Table 5.
Outcomes included in the CADTH review protocol reflect outcomes considered to be important to patients, clinicians, and drug plans.
Table 5: Inclusion Criteria for the Systematic Review
Criteria | Description |
|---|---|
Patient population | Patients with newly diagnosed AML who are 75 years or older or who have comorbidities that preclude the use of intensive induction therapy Subgroups:
|
Intervention | Venetoclax 600 mg oral once daily (after a 4-day ramp-up) and cytarabine 20 mg/m2 SC once daily (day 1 through day 10 of each 28-day cycle) |
Comparators | LDAC BSC AZA monotherapy VEN-AZA Induction chemotherapy (75 years or older)a |
Outcomes | OSb EFSb Complete remission rate with and without incomplete blood count recovery (CR/CRi) PR or hematological improvement Time to remission Duration of remission Health-related quality of lifeb Symptom severityb Need for transfusion or transfusion independence Hospital admission Harms outcomes: AEs, SAEs, WDAEs, mortality Notable harms or harms of special interest:
|
Study design | Published and unpublished phase III and IV RCTs |
AE = adverse event; AML = acute myeloid leukemia; AZA = azacitidine; BSC = best supportive care; CR = complete remission; CRi = complete remission with incomplete hematologic recovery; ECOG PS = Eastern Cooperative Oncology Group Performance Status; EFS = event-free survival; HMA = hypomethylating agent; LDAC = low-dose cytarabine; MDS = myelodysplastic syndrome; OS = overall survival; PR = partial remission; RCT = randomized controlled trial; SAE = serious adverse events; SC = subcutaneous; TLS = tumour lysis syndrome; VEN-AZA = venetoclax plus azacitidine; WDAE = withdrawal due to adverse event.
aInduction chemotherapy was added as a comparator based on feedback from clinical experts consulted by CADTH for this review because it is considered a potential option for approximately 10% of patients who are 75 years of age or older.
bThese outcomes were identified as being of particular importance to patients in the input received by CADTH from patient groups.
The literature search for clinical studies was performed by an information specialist using a peer-reviewed search strategy according to the PRESS Peer Review of Electronic Search Strategies checklist (https://www.cadth.ca/resources/finding-evidence/press).8
Published literature was identified by searching the following bibliographic databases: MEDLINE All (1946‒) through Ovid and Embase (1974‒) through Ovid. The search strategy comprised both controlled vocabulary, such as the National Library of Medicine’s MeSH (Medical Subject Headings), and keywords. The main search concepts were Venclexta (venetoclax) and AML. Clinical trials registries were searched: the US National Institutes of Health’s clinicaltrials.gov, the WHO International Clinical Trials Registry Platform (ICTRP) search portal, Health Canada’s Clinical Trials Database, and the European Union Clinical Trials Register.
No filters were applied to limit the retrieval by study type. Retrieval was not limited by publication date or by language. Conference abstracts were excluded from the search results. See Appendix 1 for the detailed search strategies.
The initial search was completed on February 11, 2021. Regular alerts updated the search until the meeting of the CADTH pan-Canadian Oncology Drug Review Expert Committee on June 10, 2021.
Grey literature (literature that is not commercially published) was identified by searching relevant websites from the CADTH Grey Matters: A Practical Tool for Searching Health-Related Grey Literature checklist.9 Included in this search were the websites of regulatory agencies (US FDA and European Medicines Agency). Google was used to search for additional internet-based materials. See Appendix 1 for more information on the grey literature search strategy.
Two CADTH clinical reviewers independently selected studies for inclusion in the review based on titles and abstracts, according to the predetermined protocol. Full-text articles of all citations considered potentially relevant by at least 1 reviewer were acquired. Reviewers independently made the final selection of studies to be included in the review, and differences were resolved through discussion.
Findings From the Literature
A total of 1 study was identified from the literature for inclusion in the systematic review (Figure 1).10 The included study is summarized in Table 6. A list of excluded studies is presented in Appendix 2.
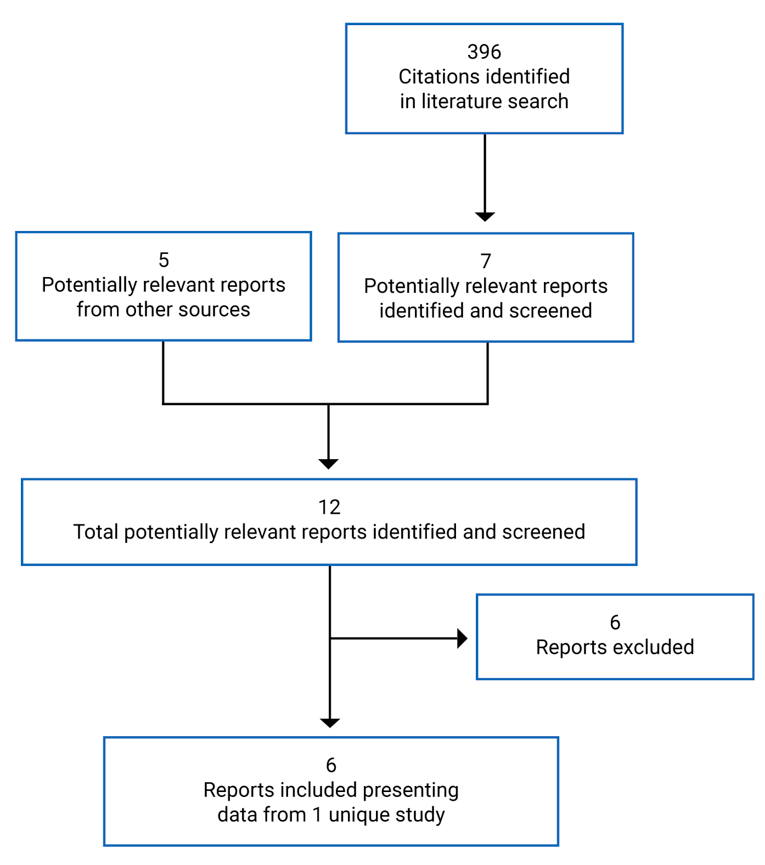
Table 6: Details of Included Studies — VIALE-C Study
Detail | Description |
|---|---|
Designs and populations | |
Study design | Double-blind randomized controlled trial |
Locations | 76 sites in 21 countries, including Canada, US, EU, Australia, New Zealand, Brazil, South Africa, Korea, Japan, and China |
Study period | May 24, 2017 to ongoing Last patient’s last visit: still to occur Data cut-off date for the final analysis was February 15, 2019; date for the 6-month follow-up analysis was August 15, 2019 |
Randomized (N) | 210 |
Inclusion criteria | AML by WHO criteria, and either be:
An ECOG PS of 0 to 2 (≥ 75 years of age) or 0 to 3 (18 years to 74 years of age) Projected life expectancy of at least 12 weeks Adequate renal function (creatinine clearance ≥ 30 mL/minute; calculated by the Cockcroft Gault formula or measured by 24-hour urine collection) Adequate liver function as demonstrated by:
|
Exclusion criteria |
|
Drugs | |
Intervention | Venetoclax 600 mg orally once daily on day 1 to day 28 plus LDAC 20 mg/m2 SC once daily on day 1 to day 10 |
Comparator | Placebo orally once daily on day 1 to day 28 plus LDAC 20 mg/m2 SC once daily on day 1 to day 10 |
Duration | |
Phase | |
Screening | Up to 21 days |
Double-blind | Not reported |
Follow-up | Safety visits 30 days after discontinuation Survival information and post-treatment follow-up every 2 months until the end of the study |
Outcomes | |
Primary end point | OS |
Other end points | Secondary:
Exploratory:
Safety: Adverse events, serious adverse events, deaths, changes in labs and vital signs |
Notes | |
Publications | Wei et al. (2020)10 |
AML = acute myeloid leukemia; CHF = chronic heart failure; CNS = central nervous system; CR = complete remission; CRh = complete remission with partial hematologic recovery; CRi = complete remission with incomplete blood count recovery; CYP = cytochrome P450; DLCO = diffusing capacity of lungs for carbon monoxide; ECOG PS = Eastern Cooperative Oncology Group Performance Status; EFS = event-free survival; EORTC QLQ-C30 = European Organisation for the Research and Treatment of Cancer Quality of Life Questionnaire Core 30; EQ-5D-5L = EuroQol 5-Dimensions 5-Levels; EQ-5D VAS = EuroQol 5-Dimensions Visual Analogue Scale; FEV1 = forced expiratory volume in 1 second; GHS/QoL = Global Health Status/Quality of Life; HBV = hepatitis B virus; HCV = hepatitis C virus; LDAC = low-dose cytarabine; MDS = myelodysplastic syndrome; MPN = myeloproliferative neoplasm; MRD = minimal residual disease; NYHA = New York Heart Association; OS = overall survival; PROMIS F-SF = Patient-Reported Outcome Measurement System Short Form v1.0 – Fatigue 7a; RBC = red blood cell; SC = subcutaneous; ULN = upper limit of normal.
Note: Five additional reports were included (Clinical Study Report for VIALE-C,11 Health Canada Reviewer’s Report,12 FDA Clinical and Statistical Review,13,14 and the sponsor’s submission15).
Source: Clinical Study Report for VIALE-C.3
Description of Studies
VIALE-C
The VIALE-C study is an ongoing, sponsor-funded, phase III, double-blind RCT that compared VEN-LDAC (N = 143) versus PLA-LDAC (N = 68) in treatment-naive patients with AML who were ineligible for intensive induction chemotherapy. Randomization was stratified by AML status (secondary, de novo), age (18 years to < 75 years, ≥ 75 years), and region (US, EU, China, Japan, rest of world). The trial was conducted at 76 sites in 21 countries, including Canada (10 patients).
The primary objective of the trial was to evaluate whether VEN-LDAC improves OS versus PLA-LDAC in treatment-naive patients with AML. The secondary objectives were to evaluate whether VEN-LDAC improved CR + CRi, CR + CRh, CR + CRi by the initiation of cycle 2, CR + CRh by the initiation of cycle 2, CR, rate of transfusion independence, fatigue, HRQoL, minimal residual disease response rate, EFS, and response rates and OS in molecular subgroups like IDH1, IDH2, and FLT3. Definitions and further details of outcomes are provided in Table 8.
There was a 21-day screening period, although bone marrow samples and peripheral blasts used for AML diagnosis could be collected within 30 days of randomization. A total of 255 patients were screened, and 211 were randomized. Randomization was stratified by AML status (secondary or de novo), age (18 years to < 75 years, ≥ 75 years), and region (US, Europe, China, Japan, rest of world).
An interim analysis of OS was performed by the independent data monitoring committee based on a data cut-off date of October 1, 2018, when 100 OS events (75%) were observed. After the data were reviewed and extracted for the interim analysis, the total number of OS events included in the full analysis set by the October 1, 2018, cut-off date was 103. When making the decision to recommend termination of the study, the committee used a stopping boundary for the final analysis based on the number of accrued events (N = 133) and an efficacy stopping boundary (one-sided P value) of P = 0.022 (HR = approximately 0.690). The final analysis had a cut-off date of February 15, 2019.
The clinical study report presented efficacy data for the final analysis (data cut-off date of February 15, 2019) as well a 6-month post hoc follow-up analysis based on a data cut-off of date of August 15, 2019. Safety data were presented for patients through 6 months of follow-up.
Populations
Inclusion and Exclusion Criteria
Eligible patients had to be 18 years or older with histologically confirmed AML (WHO criteria) and be considered ineligible for intensive induction chemotherapy on the basis of age (≥ 75 years) or significant cardiac, pulmonary, renal, hepatic, or other comorbidity (refer to Table 6) that the investigator believed could make them incompatible with conventional intensive chemotherapy. Patients aged ≥ 75 years had to have an ECOG PS of 0 to 2; those aged 18 years to 74 years could have an ECOG PS of 0 to 3. Patients also had to have a projected life expectancy of greater than 12 weeks, and adequate renal and hepatic function.
Reasons for exclusion from the trial included having received any prior treatment for AML (with the exception of hydroxyurea, if patients had any antecedent myeloproliferative neoplasm, or acute promyelocytic leukemia). Patients with CNS involvement were also excluded, as were those with HIV, hepatitis B or C, or New York Heart Association disability status greater than 2.
Baseline Characteristics
The majority of patients in the study were male (55.5%) and White (70.6%); the median age was 76 years (range = 36 to 93) (Table 7). The majority of patients had de novo AML (61.6%), while the remainder had secondary AML. Most of the patients with secondary AML had MDS. The majority of patients (65.2%) had intermediate cytogenetic risk, and most of the remainder (32.8%) had poor cytogenetic risk. With respect to performance status, 48.8% of patients had an ECOG PS of 2 or more.
The majority of patients were considered ineligible for intensive chemotherapy based on age (≥ 75 years), followed by ECOG PS in patients 18 years to 74 years of age. Approximately 40% of patients 75 years or older also had 1 comorbidity in addition to age.
The treatment groups were generally well-balanced with respect to demographics and clinical characteristics at baseline; there were small numerical differences between the VEN-LDAC and PLA-LDAC groups for ECOG PS of 2 (44.1% versus 36.8%, respectively), patients with secondary AML (40.6% versus 33.8%) and those with grade 4 neutropenia (54.9% versus 44.1%).
Table 7: Summary of Baseline Characteristics
Characteristic | VEN-LDAC N = 143 | PLA-LDAC N = 68 |
|---|---|---|
Age (years), mean (SD) | 75.1 (8.09) | 74.3 (8.63) |
18 years to < 75 years | 65 (45.5) | 29 (42.6) |
≥ 75 years | 78 (54.5) | 39 (57.4) |
Male, n (%) | 78 (54.5) | 39 (57.4) |
Race, n (%) | ||
White | 102 (71.3) | 47 (69.1) |
Black/African descent | 2 (1.4) | 1 (1.5) |
Asian | 39 (27.3) | 20 (29.4) |
ECOG PS, n (%) | ||
0 | 22 (15.4) | 11 (16.2) |
1 | 52 (36.4) | 23 (33.8) |
2 | 63 (44.1) | 25 (36.8) |
3 | 6 (4.2) | 9 (13.2) |
AML status (reported from EDC), n (%) | ||
De novo AML | 85 (59.4) | 45 (66.2) |
Secondary AML | 58 (40.6) | 23 (33.8) |
Type of secondary AML (reported from EDC), n | ||
Therapy-related AML | 6 (4.2)a | 4 (5.9)a |
Post-MDS/CMML | 52 (36.4)a | 19 (27.9)a |
Other | 0 | 0 |
AML-MRC, n (%) | ||
Yes | 57 (39.9) | 27 (39.7) |
No | 86 (60.1) | 41 (60.3) |
Cytogenetic risk, n (%) | ||
Favourable | 1 (0.7) | 3 (4.5) |
Intermediate | 90 (65.2) | 43 (65.2) |
Poor | 47 (34.1) | 20 (30.3) |
Missing | 5 (3.5) a | 2 (2.9) a |
Bone marrow blast count, n (%) | ||
< 30% | 42 (29.4) | 18 (26.5) |
≥ 30% to < 50% | 36 (25.2) | 22 (32.4) |
≥ 50% | 65 (45.5) | 28 (41.2) |
Bone marrow blast count, mean (SD) | 48.4 (24.64) | 47.2 (22.22) |
CTC grade of neutropenia, n (%) | ||
0 | 26 (18.3) | 15 (22.1) |
1 | 4 (2.8) | 2 (2.9) |
2 | 8 (5.6) | 6 (8.8) |
3 | 26 (18.3) | 15 (22.1) |
4 | 78 (54.9) | 30 (44.1) |
Missing | 1 (< 1) a | 0 |
Neutrophils value (× 109/L), mean (SD) | 1.1 (1.67) | 1.8 (3.79) |
CTC grade of anemia, n (%) | ||
0 | 0 | 2 (2.9) |
1 | 19 (13.3) | 6 (8.8) |
2 | 86 (60.1) | 38 (55.9) |
3 | 38 (26.6) | 22 (32.4) |
4 | 0 | 0 |
Hemoglobin value (g/L), mean (SD) | 103.3 (118.23) | 94.8 (72.17) |
CTC grade of thrombocytopenia, n (%) | ||
0 | 10 (7.0) | 9 (13.2) |
1 | 22 (15.4) | 12 (17.6) |
2 | 22 (15.4) | 9 (13.2) |
3 | 41 (28.7) | 19 (27.9) |
4 | 48 (33.6) | 19 (27.9) |
Platelet count (× 109/L), mean (SD) | 54.6 (49.67) | 64.6 (54.41) |
Reason for ineligibility for standard induction therapy (there can be > 1 reason per patient), n (%) | ||
≥ 75 years of age | 80 (55.9) | 39 (57.4) |
≥ 18 to 74 years of age | 63 (44.1) | 29 (42.6) |
ECOG PS 2 or 3 | 49 (34.3) | 25 (36.8) |
History of congestive heart failure requiring treatment | 6 (4.2) | 0 |
Ejection fraction ≤ 50% | 10 (7.0) | 4 (5.9) |
Chronic stable angina | 4 (2.8) | 2 (2.9) |
DLCO ≤ 65% | 6 (4.2) | 2 (2.9) |
FEV1 ≤ 65% | 7 (4.9) | 5 (7.4) |
Creatinine clearance ≥ 30 mL/minute to < 45 mL/minute | 7 (4.9) | 1 (1.5) |
Moderate hepatic impairment with total bilirubin > 1.5 to ≤ 3.0 × ULN | 1 (0.7) | 0 |
Other | 3 (2.1) | 2 (2.9) |
Mutations from central lab | ||
FLT3 | 20 (17.9) | 9 (17.3) |
IDH1 or IDH2 | 21 (18.8) | 12 (23.1) |
TP53 | 22 (19.6) | 9 (17.3) |
NPM1 | 19 (17.0) | 7 (13.5) |
Missing | 31 (21.7)a | 16 (23.5)a |
AML = acute myeloid leukemia; AML-MRC = AML with myelodysplasia-related changes; CTC = common terminology criteria; DLCO = diffusing capacity of the lungs for carbon monoxide; ECOG PS = Eastern Cooperative Oncology Group Performance Status; EDC = electronic data capture; FEV1 = forced expiratory volume in 1 second; FLT-3 = FMS-like tyrosine kinase-3; IDH = isocitrate dehydrogenase; ITT = intention to treat; MDS = myelodysplastic syndrome; MRC = myelodysplasia-related changes; NPM-1 = nucleophosmin-1; PLA-LDAC = placebo plus low-dose cytarabine; SD = standard deviation; ULN = upper limit of normal; VEN-LDAC = venetoclax plus low-dose cytarabine.
aPercentages were calculated by CADTH using the ITT population.
Source: Clinical Study Report for VIALE-C.3
Interventions
VEN or placebo tablets were administered by patients once daily and dosed before LDAC on days when LDAC was administered. LDAC was administered by a trained provider as a subcutaneous injection daily at a dose of 20 mg/m2 on day 1 to day 10 of each 28-day cycle.
Patients continued treatment until documented (investigator-assessed) disease progression, unacceptable toxicity, withdrawn consent, or if they met protocol criteria for discontinuation. Treatments could be administered in hospital, in clinic, or at home, depending on local regulations. VEN was initiated with a 4-day ramp-up, with 100 mg on day 1, 200 mg on day 2, 400 mg on day 3, and 600 mg on day 4 of cycle 1.
There was a protocol for dose interruptions to manage cytopenias and other AEs. In patients who achieved a CRi or morphologic leukemia-free bone marrow and experienced grade 4 neutropenia or thrombocytopenia that persisted beyond day 28, VEN was to be interrupted from day 28 until absolute neutrophil count was greater than or equal to 500 per µL to 1,000 per µL and platelet counts of greater than or equal to 25 × 103 per µL to 100 × 103 per µL were achieved. This approach was taken because typically, if AML persists in the bone marrow, then cytopenias would be attributable to the disease process, and VEN-LDAC may continue; however, if a patient with previous CR presents with new-onset grade 4 neutropenia or thrombocytopenia lasting longer than 1 week, unless due to underlying disease, a dose interruption would be considered, in consultation with the sponsor’s medical monitor.
For patients who continued to respond based on bone marrow assessment after cycle 2, but had persistent cytopenias, dose interruptions could be considered following a specific protocol. Patients who were on VEN 600 mg for a 28-day cycle had a week-long interruption in dosing, while patients who were on 21-day out of 28-day cycles had a 14-day interruption, and patients on a 14-day out of 28-day cycle were reduced to 400 mg daily with a 14-day interruption. Cytopenias that occurred during cycle 1 or cycle 2 were considered more likely due to the disease process rather than the study drug; therefore, dose reductions were not typically recommended during cycle 1 or 2.
With respect to LDAC, during cycle 2 and subsequent cycles, study treatments could be delayed at the discretion of the investigator if the patient experienced myelosuppression, such as febrile neutropenia, acute infection (viral, bacterial, or fungal) requiring IV anti-infectives, or extensive supportive care for hemorrhage. Myelosuppression is reversible, and LDAC dosing was interrupted in these cases; dose reductions were not recommended but were permitted in rare instances.
Outcomes
A list of efficacy end points specified in the CADTH review protocol that were assessed in the VIALE-C trial included in this review is provided in Table 8. These end points are summarized in this section. A detailed description and critical appraisal (in terms of measurement properties) of the patient-reported measures assessed in the VIALE-C trial (i.e., the European Organisation for Research and Treatment of Cancer Quality of Life Questionnaire Core 30 [EORTC QLQ-C30] and Patient-Reported Outcome Measurement System Short Form v1.0 – Fatigue 7a [PROMIS F-SF]) is provided in Appendix 4.
Table 8: Summary of Outcomes of Interest Specified in the CADTH Review Protocol
Outcome measure | Primary or secondary | In statistical hierarchy? |
|---|---|---|
OS | Primary | Yes |
CR + CRi rate | Secondary | Yes |
CR + CRh rate | Secondary | Yes |
CR + CRi rate by initiation of cycle 2 | Secondary | Yes |
CR + CRh rate by initiation of cycle 2 | Secondary | Yes |
CR rate | Secondary | Yes |
Fatigue based on PROMIS F-SF | Secondary | Yes |
GHS/QoL from EORTC QLQ-C30 | Secondary | Yes |
EFS | Secondary | Yes |
Transfusion independence (RBC or platelets) | Secondary | Yes |
CR + CRi + and MRD response rate | Secondary | Yes |
CR + CRh and MRD response rate | Secondary | Yes |
CR + CRi rate in biomarker subgroups (e.g., FLT3, IDH1, IDH2) | Secondary | Yes |
OS in biomarker subgroups (e.g., FLT3, IDH1, IDH2) | Secondary | Yes |
EQ-5D-5L utility score | Exploratory | No |
EORTC QLQ-C30 subscales | Exploratory | No |
EQ-5D VAS | Exploratory | No |
CR = complete remission; CRh = complete remission with partial hematologic recovery; CRi = complete remission with incomplete blood count recovery; EFS = event-free survival; EORTC QLQ-C30 = European Organisation for Research and Treatment of Cancer Quality of Life Questionnaire Core 30; EQ-5D-5L = EuroQol 5-Dimensions 5-Levels; EQ-5D VAS = EuroQol 5-Dimensions Visual Analogue Scale; GHS/QoL = Global Health Status/Quality of Life; MRD = minimal residual disease; OS = overall survival; PROMIS F-SF = Patient-Reported Outcome Measurement System Short Form v1.0 – Fatigue 7a; RBC = red blood cell.
Source: Clinical Study Report for VIALE-C.3
The primary outcome of the VIALE-C trial was OS, which was defined as the number of days from randomization to death. All events of death were included in the final analysis regardless of whether the patient was still on the study drug. For patients who had not died, their data were censored at the date they were last known to be alive on, or before the cut-off date. The date which patients were last known to be alive was determined by selecting the last available date from a list of study procedures.
Table 9: Description of Outcome Measures
Outcome measure | VIALE-C definition |
|---|---|
Overall survival | Number of days from date of randomization to the date of death |
Event-free survival | Number of days from randomization to the date of progressive disease, relapse from CR or CRi, treatment failure (failure to achieve CR, CRi, or MLFS after at least 6 cycles of study treatment), or death from any cause |
Complete remission | Absolute neutrophil counts > 103/µL, platelets > 105/µL, RBC transfusion independence, and bone marrow with < 5% blasts. Absence of circulating blasts and blasts with Auer rods; absence of extramedullary disease. |
Complete remission with incomplete blood count recovery | All criteria as CR except for residual neutropenia ≤ 103/µL (1,000/µL), thrombocytopenia ≤ 105/µL (100,000/µL), or RBC dependence |
Complete remission with incomplete hematological recovery | Peripheral blood neutrophil count > 0.5 × 10³/µL, peripheral blood platelet count > 0.5 × 10⁵/µL, bone marrow < 5% blasts |
Partial remission | All hematologic values for a CR, but with a decrease of at least 50% in the percentage of blasts to 5% to 25% in the bone marrow aspirate |
Morphologic leukemia-free state | Less than 5% blasts in aspirate sample with marrow spicules and with a count of at least 200 nucleated cells. Absence of circulating blasts and extramedullary disease without peripheral blood cell recovery that meets thresholds for either CR or CRi |
Resistant disease | Failure to achieve CR, CRi, PR, or MLFS; only for patients surviving at least 7 days following completion of cycle 1 treatment with evidence of persistent leukemia by blood or bone marrow examination |
Morphological relapse | Reappearance of ≥ 5% blasts after CR or CRi in peripheral blood or bone marrow or development of extramedullary disease |
Progressive diseasea | The occurrence of at least 1 of the following:
|
Duration of remission | The number of days from the date of first response (CR, CRi, or CRh) to the earliest evidence of confirmed MR, PD, or death due to disease progression |
Transfusion independence | ≥ 56 days with no transfusion between the first dose of study drug and the last dose of study drug + 30 days. Applies to both RBC and platelets. |
EORTC QLQ-C30 | Consists of 30 items assessing quality of life in cancer patients. Includes 15 questions that assess HRQoL domains, including 5 multi-item functional scales (physical, emotional, cognitive, social, and role functioning), 3 multi-item symptom scales (fatigue, nausea and vomiting, pain), 6 single-item symptom scales (dyspnea, insomnia, appetite loss, constipation, diarrhea, and financial difficulties) and a Global Health Status/Quality of Life scale. MID = 10. |
PROMIS F-SF | Consists of 7 items assessing the impact of fatigue over the past 7 days in patients with cancer. Each response is on a 5-item scale, ranging from 1 = never to 5 = always. MID = 5. |
EQ-5D-5L VAS | Visual Analogue Scale ranging from 100 (best imaginable health) to 0 (worst imaginable health). MID = 7. |
ANC = absolute neutrophil count; CR = complete remission; CRh = complete remission with partial hematological recovery; CRi = complete remission with incomplete blood count recovery; EORTC QLQ-C30 = European Organisation for Research and Treatment of Cancer Quality of Life Questionnaire; EQ-5D-5L VAS = EuroQol 5-Dimensions 5-Levels Visual Analogue Scale; HRQoL = health-related quality of life; MID = minimal important difference; MLFS = morphologic leukemia-free state; MR = morphologic relapse; PD = progressive disease; PR = partial remission; PROMIS F-SF = Patient-Reported Outcome Measurement System Short Form v1.0 – Fatigue 7a; RBC = red blood cell; WBC = white blood cell.
aPD based on European Leukemia Net criteria.
Source: Clinical Study Report for VIALE-C.3
Disease assessments were performed using modified International Working Group (IWG) criteria. Assessments were performed at the end of cycle 1 (± 3 days), and patients with resistant disease at the end of cycle 1 had their assessments repeated at the end of cycle 2 or cycle 3 based on hematologic recovery to confirm a suspected response. Thereafter, assessments were performed every 3 cycles starting at the end of cycle 4 and continued until disease progression as defined by the European Leukemia Net, or until 2 successive disease assessments resulted in CR, CRi, or withdrawal of consent. For patients with 2 consecutive disease assessments of CR or CRi, further disease assessments consisted of laboratory and physical exam and included bone marrow evaluation if there was concern of relapse.
Disease assessments were reviewed by investigators in conjunction with hematopathologists as well as an independent review committee (IRC). The assessments by the IRC were not shared with trial sites. A charter that outlined the review process was used by the IRC. The CR + CRi rate was defined as the percentage of patients who achieved a CR + CRi at any time point during the study using the modified IWG criteria for AML. Randomized patients who had no IWG disease assessments were considered non-responders.
The CRh was derived using bone marrow blast and hematology lab values: bone marrow blasts less than 5%, a peripheral blood neutrophil count greater than 0.5 × 10³/µL, a peripheral blood platelet count of greater than 0.5 × 10⁵/µL, and a 1-week platelet transfusion-free period before the hematology lab collection. For a bone marrow sample collected during or after the last cycle of treatment, the hematology lab results collected within 14 days after the bone marrow sample collection date were used for CRh analysis. The CR + CRh rate was defined as the proportion of patients who achieved a CR or CRh at any time point during the study. Randomized patients who had no disease assessment were considered non-responders. The CR + CRh rate by initiation of cycle 2 was defined as the percentage of patients who achieved a CR or CRh by the initiation of cycle 2. For randomized patients who discontinued treatment before the initiation of cycle 2, all assessments performed before the cut-off date or the initiation of post-treatment therapy, whichever occurred earlier, were included in the analysis.
Post-baseline transfusion independence was defined as a period of at least 56 days with no transfusion after the first dose of study drug and before the last dose of study drug (plus 30 days), or before death or the initiation of post-treatment therapy, whichever was earlier. Transfusion independence was calculated for RBCs and platelets. The rate of conversion was calculated as the percentage of patients who achieved transfusion independence post-baseline compared to baseline.
The PROMIS F-SF measures the impact and experience of fatigue on patients over the past 7 days. Fatigue is measured using a 7-item instrument, with responses scored on a 5-point scale ranging from 1 (never) to 5 (always). Data were collected and reported as a least squares mean (LSM) change from baseline every 2 cycles beginning with cycle 3. The minimal important difference (MID) for this instrument ranges between 3 and 5.
Global Health Status on the EORTC QLQ-C30 was a secondary outcome of the trial. The EORTC QLQ-C30 consists of a Global Health Status/Quality of Life scale, a financial difficulties scale, 5 functional scales (cognitive, social, physical, emotional, and role functioning) and 8 symptom scales or items (fatigue, insomnia, appetite loss, pain, constipation, diarrhea, dyspnea, and nausea and vomiting). For the Global Health Status and 5 functional scales, an increase in score indicates improvement, whereas a decrease in score indicates worsening. The MID is 10 for this instrument. The EuroQol 5-Dimensions was also assessed as an exploratory outcome using a Visual Analogue Scale ranging from 100 (best imaginable health) to 0 (worst imaginable health). The MID is 7 for this scale.
EFS was defined as the number of days from randomization to date of progressive disease, relapse of CR or CRi, treatment failure (defined as failure to achieve CR, CRi, or morphologic leukemia-free state after at least 6 cycles of study treatment), or death from any cause. If a specified event did not occur, then patients were to be censored at the date of last disease assessment. Data for any patients without post-randomization disease assessments were censored at the date of randomization.
Statistical Analysis
Primary Outcome
Power Calculation
The calculation of sample size was based on the following assumptions: median OS of 6 months in the PLA-LDAC treatment group and 11 months in the VEN-LDAC group (HR = 0.545); an interim analysis of OS at 75% of the death events with an O’Brien-Fleming boundary; and a 2:1 randomization ratio of VEN-LDAC to PLA-LDAC. Based on these assumptions, 133 death events were required to provide 90% power to detect a statistically significant difference between groups at an alpha of 0.05; as a result, 210 patients were randomized into the trial, 140 patients in the VEN-LDAC group and 70 in the PLA-LDAC group.
Statistical Test or Model
For the primary outcome, the distribution of OS was estimated for each treatment group using Kaplan-Meier methodology, and the difference between groups was compared using the log rank test stratified by AML status (de novo or secondary) and age (18 years to < 75 years, ≥ 75 years). The HR between treatment groups was estimated using a Cox proportional hazards model with these same stratification factors.
Multiplicity
A hierarchical testing procedure was used to account for multiple comparison testing. The primary outcome of OS was tested first; secondary outcomes were then tested in a specified order. If the statistical test was not significant at a level of P = 0.05 for the primary outcome, then statistical significance was not to be declared for any of the secondary outcomes. The Lan-DeMets alpha spending function with O’Brien-Fleming boundary was used at the interim analysis to ensure that the false-positive rate for each primary or key secondary efficacy outcome was 0.05 or less.
Data Imputation Methods
Patients who had no disease assessment were considered non-responders for the estimation of response rates. Patients who had not experienced disease progression or death were censored at the last disease assessment date for analyses of DOR and EFS.
Sensitivity Analysis
A stepwise multivariate Cox regression was performed to identify pre-treatment factors that may be associated with survival, and included numerous baseline factors, such as treatment group, age, sex, AML status, bone marrow blast count, ECOG PS, cytogenetics risk, prior HMA use, geographic region, FLT3 mutation status, IDH mutation status, and NPM1 mutation status.
Subgroup Analyses
Preplanned subgroup analyses were performed for a variety of outcomes: OS, CR rate, CR + CRi rate, CR + CRh rate, and CR + CRi rate by the initiation of cycle 2. These analyses do not appear to have been adjusted for multiple comparisons.
Preplanned subgroup analyses were performed for the following subgroups of interest to the CADTH review protocol: age (18 years to < 65 years, 65 years to < 75 years, ≥ 75 years), AML status (de novo, secondary), baseline ECOG PS (< 2, ≥ 2), prior HMA for MDS (yes or no), cytogenetic risk (favourable, intermediate, poor), molecular markers (FLT3, IDH1, IDH2, TP53, NPM1), and bone marrow blast count (< 30%, 30% to < 50%, and ≥ 50%).
Secondary Outcomes
For the secondary outcomes of CR + CRi rate, CR + CRh rate, and transfusion independence, rates were compared between groups using the Cochran-Mantel-Haenszel test using the same stratification factors as OS. For the PROMIS F-SF and EORTC QLQ-C30, a linear mixed-effects regression model with an appropriate covariance structure was fitted to the longitudinal data to test for differences between treatment groups. For the analysis of EORTC QLQ-C30 outcomes, the model included the following factors: baseline score, stratification factors (age and AML status), treatment group, visit, and treatment group by visit interaction.
Sensitivity Analyses
The final analysis of response- or progression-related outcomes was based on investigator assessment. Sensitivity analyses were performed based on IRC assessment.
Duration of CR, CR + CRi, and CR + CRh were also assessed, including death from all causes by the cut-off date, as a sensitivity analysis.
Table 10: Statistical Analysis of Efficacy End Points
End point | Statistical model | Adjustment factors | Sensitivity analyses |
|---|---|---|---|
OS | Log rank Cox proportional hazards model | Both log rank and Cox were stratified by AML status (de novo or secondary) and age (18 years to < 75 years; ≥ 75 years) | Stepwise Cox regression analysis performed to identify factors associated with survival, including treatment arm, age, sex, AML status, bone marrow blast count, ECOG PS, cytogenetics risk, prior HMA use, geographic region, FLT3 mutation status, IDH mutation status, and NPM1 mutation status |
EFS | HR estimated from stratified Kaplan-Meier model Comparisons between groups using a stratified log rank test | Log rank stratified by AML status (de novo or secondary) and age (18 years to < 75 years, ≥ 75 years) | Censoring of patients who received post-study treatment before experiencing event at start of post-study treatment |
CR + CRi rate CR + CRh rate Transfusion independence rate | CMH | Stratified by AML status (de novo or secondary) and age (18 years to < 75 years, ≥ 75 years) | Final analysis of response or progression outcomes were based on investigator assessment, while sensitivity analyses were performed using IRC |
PROMIS F-SF EORTC QLQ-C30 | Linear fixed-effects regression model | Adjusted for baseline score, stratification factors (age, AML status), treatment arm, visit, and treatment arm by visit interaction | None reported |
AML = acute myeloid leukemia; CMH = Cochran-Mantel-Haenszel; CR = complete remission; CRh = complete remission with partial hematologic recovery; CRi = complete remission with incomplete blood count recovery; ECOG PS = Eastern Cooperative Oncology Group Performance Status; EFS = event-free survival; EORTC QLQ-C30 = European Organisation for the Research and Treatment of Cancer Quality of Life Questionnaire Core 30; FLT3 = FMS-like tyrosine kinase-3; HMA = hypomethylating agent; HR = hazard ratio; IDH = isocitrate dehydrogenase; IRC = independent review committee; NPM1 = nucleophosmin-1; OS = overall survival; PROMIS F-SF = Patient-Reported Outcome Measurement System Short Form v1.0 – Fatigue 7a.
Source: Clinical Study Report for VIALE-C.3
There were 5 amendments to the VIALE-C trial protocol:
February 17, 2017: The study was updated to include non-elderly patients with AML (18 years of age and older) to address feedback from regulatory agencies and include females of child-bearing potential. The definition of the secondary outcome of EFS and the description of the justification for the choice of VEN dose of 600 mg were updated.
October 6, 2017: This amendment clarified the phase of the trial and the fact that patients who had previously been treated with VEN or were receiving other concurrent investigational drugs could not be enrolled.
June 22, 2018: Evaluation of CR + CRh as a secondary outcome and evaluation of transfusion independence during any consecutive 56 days during the study treatment period were added as exploratory outcomes.
November 29, 2018: Transfusion independence rates, minimal residual disease response rate, CR + CRh rate by initiation of cycle 2, and OS in molecular subgroups were added as secondary outcomes. It was also clarified that CR rate was an outcome to be evaluated.
May 29, 2018: The sponsor could unblind patient treatment assignments following the final analysis results and provide investigators with this information if requested so that a decision could be made about a patient’s treatment continuation.
Analysis Populations
The full analysis set comprised the intention-to-treat (ITT) population that consisted of all patients randomized by interactive voice or web response system, while the safety analysis set included all patients who received at least 1 dose of study drug.
Results
Patient Disposition
All total of 211 patients were randomized into the trial and included in the full analysis set. The 44 screen failures were due to failure to meet inclusion or exclusion criteria (n = 27), withdrawn consent (n = 5), loss to follow-up (n = 1), and other (n = 11).
There were 210 patients who received at least 1 dose of the study drug and were included in the safety analysis set. In the VEN-LDAC group, 72.0% of patients discontinued the study, while in the PLA-LDAC group, 82.4% of patients discontinued. The most common reason for study discontinuation in both treatment groups was death.
Table 11: Patient Disposition in the VIALE-C Study
Characteristic | VEN-LDAC N = 143 | PLA-LDAC N = 68 |
|---|---|---|
Screened, N | 255 | |
Screen failure, n | 44 | |
Inclusion or exclusion criteria | 27 | |
Withdrawn consent | 5 | |
Loss to follow-up | 1 | |
Other | 11 | |
Randomized, N | 143 | 68 |
Randomized and treated, n | 142 | 68 |
Discontinued study, n (%) | 103 (72.0) | 56 (82.4) |
Withdrawal by patient | 4 (2.8) | 3 (4.4) |
Loss to follow-up | 2 (1.4) | 0 |
Death | 97 (67.8) | 53 (77.9) |
Other | 3 (2.1) | 0 |
Full analysis set, N | 143 | 68 |
Safety analysis set, N | 142 | 68 |
PLA-LDAC = placebo plus low-dose cytarabine; VEN-LDAC = venetoclax plus low-dose cytarabine.
Source: Clinical Study Report for VIALE-C.3
Exposure to Study Treatments
The exposure to study treatments in the VIALE-C trial is summarized in Table 12. At the time of the final analysis, the median duration of exposure to VEN-LDAC was 3.9 months (range = 0.0 to 17.1), and the median duration of exposure to PLA-LDAC was 1.7 months (range = 0.1 to 14.2); at the 6-month follow-up post hoc analysis, the median duration of exposure was 4.1 months (range = 0.0 to 23.5) versus 1.7 months (range = 0.1 to 20.2), respectively. In the VEN-LDAC group, 20.4% of patients had 1 dose reduction, 4.2% had 2 dose reductions, and 1.4% had more than 2 dose reductions. Dose interruptions occurred at least once in approximately 91% of patients in the VEN-LDAC group and in 71% of patients in the PLA-LDAC group. Data on the use of subsequent therapies were not reported.
Table 12: Exposure to Study Drug in the VIALE-C Study
Characteristic | Final analysis (data cut-off date: February 15, 2019) | 6-month post hoc analysis (data cut-off date: August 15, 2019) | ||
|---|---|---|---|---|
VEN-LDAC N = 143 | PLA-LDAC N = 68 | VEN-LDAC N = 143 | PLA-LDAC N = 68 | |
Follow-up, median | 12 months | 17.5 months | ||
To VEN-LDAC or PLA-LDAC | ||||
Duration of exposure, months, mean (SD) | 5.0 (4.38) | 3.2 (3.52) | 6.3 (6.04) | 3.7 (4.69) |
Median (range) | 3.9 (0.0 to 17.1) | 1.7 (0.1 to 14.2) | 4.1 (0.0 to 23.5) | 1.7 (0.1 to 20.2) |
Duration interval, days, n (%) | ||||
0 weeks to 4 weeks | 29 (20.4) | 23 (33.8) | 29 (20.4) | 23 (33.8) |
4 weeks to 8 weeks | 16 (11.3) | 13 (19.1) | 16 (11.3) | 13 (19.1) |
8 weeks to 12 weeks | 15 (10.6) | 10 (14.7) | 14 (9.9) | 10 (14.7) |
12 weeks to 16 weeks | 8 (5.6) | 2 (2.9) | 6 (4.2) | 2 (2.9) |
16 weeks to 20 weeks | 16 (11.3) | 5 (7.4) | 11 (7.7) | 3 (4.4) |
20 weeks to 24 weeks | 7 (4.9) | 0 | 4 (2.8) | 1 (1.5) |
24 weeks to 28 weeks | 8 (5.6) | 2 (2.9) | 8 (5.6) | 2 (2.9) |
28 weeks to 32 weeks | 4 (2.8) | 4 (5.9) | 4 (2.8) | 1 (1.5) |
32 weeks to 36 weeks | 7 (4.9) | 1 (1.5) | 9 (6.3) | 1 (1.5) |
36 weeks to 52 weeks | 18 (12.7) | 6 (8.8) | 17 (12.0) | 4 (5.9) |
52 weeks | 14 (9.9) | 2 (2.9) | 24 (16.9) | 5 (7.4) |
Average dosed days per cycle, mean (SD) | 22.8 (6.82) | 22.2 (6.90) | 22.8 (6.90) | 22.2 (6.90) |
Number of cycles, mean (SD) | 5.0 (4.01) | 3.6 (3.70) | 6.1 (5.47) | 4.1 (4.99) |
Dose reductions, n (%) | ||||
None | 108 (76.1) | 60 (88.2) | 105 (73.9) | 60 (88.2) |
1 reduction | 26 (18.3) | 5 (7.4) | 29 (20.4) | 5 (7.4) |
2 reductions | 6 (4.2) | 2 (2.9) | 6 (4.2) | 2 (2.9) |
> 2 reductions | 2 (1.4) | 1 (1.5) | 2 (1.4) | 1 (1.5) |
Dose interruptions, n (%) | 128 (90.1) | 49 (72.1) | 130 (91.5) | 48 (70.6) |
No interruptions | 14 (9.9) | 19 (27.9) | 12 (8.5) | 20 (29.4) |
1 interruption | 46 (32.4) | 23 (33.8) | 46 (32.4) | 22 (32.4) |
2 interruptions | 18 (12.7) | 14 (20.6) | 18 (12.7) | 12 (19.1) |
> 2 interruptions | 64 (45.1) | 12 (17.6) | 66 (46.5) | 13 (19.1) |
Due to count recovery | 70 (49.3) | 12 (17.6) | 72 (50.7) | 12 (17.6) |
1 interruption | 22 (15.5) | 7 (10.3) | 23 (16.2) | 7 (10.3) |
2 interruptions | 16 (11.3) | 3 (4.4) | 12 (8.5) | 3 (4.4) |
> 2 interruptions | 32 (22.5) | 2 (2.9) | 37 (26.1) | 2 (2.9) |
To LDAC | ||||
Duration of exposure, months, mean (SD) | 4.7 (4.41) | 2.9 (3.49) | 6.0 (6.06) | 3.4 (4.70) |
Median (range) | 3.5 (0.0 to 16.9) | 1.3 (0.0 to 14.2) | 3.5 (0 to 23.4) | 1.3 (0.0 to 19.9) |
Duration interval, days, n (%) | ||||
0 weeks to 4 weeks | 32 (22.5) | 25 (36.8) | 32 (22.5) | 25 (36.8) |
4 weeks to 8 weeks | 19 (13.4) | 15 (22.1) | 19 (13.4) | 15 (22.1) |
8 weeks to 12 weeks | 10 (7.0) | 8 (11.8) | 9 (6.3) | 8 (11.8) |
12 weeks to 16 weeks | 15 (10.6) | 3 (4.4) | 12 (8.5) | 3 (4.4) |
16 weeks to 20 weeks | 12 (8.5) | 2 (2.9) | 7 (4.9) | 0 |
20 weeks to 24 weeks | 3 (2.1) | 1 (1.5) | 1 (0.7) | 2 (2.9) |
24 weeks to 28 weeks | 11 (7.7) | 2 (2.9) | 11 (7.7) | 2 (2.9) |
28 weeks to 32 weeks | 5 (3.5) | 4 (5.9) | 7 (4.9) | 4 (5.9) |
32 weeks to 36 weeks | 3 (2.1) | 0 | 3 (2.1) | 0 |
36 weeks to 52 weeks | 19 (13.4) | 7 (10.3) | 17 (12.0) | 4 (5.9) |
52 weeks | 13 (9.2) | 1 (1.5) | 24 (16.9) | 5 (7.4) |
Average dosed days per cycle, mean (SD) | 9.3 (1.74) | 9.6 (1.39) | 9.3 (1.76) | 9.5 (1.39) |
Number of cycles, mean (SD) | 5.0 (4.01) | 3.6 (3.70) | 6.1 (5.47) | 4.2 (5.04) |
Dose reductions, n (%) | ||||
None | 139 (97.9) | 68 (100) | 139 (97.9) | 68 (100) |
1 reduction | 3 (2.1) | 0 | 3 (2.1) | 0 |
2 reductions | 0 | 0 | 0 | 0 |
> 2 reductions | 0 | 0 | 0 | 0 |
Dose interruptions, n (%) | 119 (83.8) | 46 (67.6) | 120 (84.5) | 45 (66.2) |
No interruptions | 23 (16.2) | 22 (32.4) | 22 (15.5) | 23 (33.9) |
1 interruption | 47 (33.1) | 25 (36.8) | 47 (33.1) | 23 (33.8) |
2 interruptions | 14 (9.9) | 13 (19.1) | 12 (8.5) | 14 (20.6) |
> 2 interruptions | 58 (40.8) | 8 (11.8) | 61 (43.0) | 8 (11.8) |
Due to count recovery | 65 (45.8) | 9 (13.2) | 68 (47.9) | 10 (14.7) |
1 interruption | 18 (12.7) | 6 (8.8) | 21 (14.8) | 7 (10.3) |
2 interruptions | 16 (11.3) | 2 (2.9) | 10 (7.0) | 2 (2.9) |
> 2 interruptions | 31 (21.8) | 1 (1.5) | 37 (26.1) | 1 (1.5) |
Dose intensity accounting for dose reduction, %, mean (SD) | 94.4 (48.28) | 105.6 (121.69) | 94.4 (47.91) | 105.6 (121.69) |
Dose intensity accounting for dose reductions and interruptions, n (%) | 81.8 (45.77) | 98.6 (123.08) | 80.8 (46.13) | 98.4 (123.13) |
Duration of study follow-up, median, months (range) | 12.0 (10.8 to 12.7) | 12.0 (10.6 to 12.8) | 17.5 (0.1 to 23.5) | 17.7 (0.2 to 20.8) |
LDAC = low-dose cytarabine; PLA-LDAC = placebo + low-dose cytarabine; SD = standard deviation; VEN-LDAC = venetoclax plus low-dose cytarabine.
Source: Clinical Study Report for VIALE-C.3
Efficacy
The results of the final analysis were based on a data cut-off date of February 15, 2019, and a median follow-up of 12 months. The results of the 6-month follow-up post hoc analysis were also reported by the sponsor and were based on a data cut-off date of August 15, 2019, and median follow-up of 17.5 months. A summary of the efficacy outcomes in the VIALE-C trial is provided in Table 13. The final analysis of response- or progression-related outcomes was based on investigator assessment; sensitivity analyses were performed based on IRC assessment. The results of subgroup analyses are reported for the efficacy outcomes specified in the CADTH review protocol; refer to Appendix 3 for the detailed results of these analyses.
Overall Survival
At the final analysis, the median OS in the VEN-LDAC group was 7.2 months versus 4.1 months in the PLA-LDAC group, for an HR of 0.75 (95% CI, 0.52 to 1.07; P = 0.114). Overall survival was the primary outcome; thus, the VIALE-C study failed to meet its primary outcome. At the 6-month post hoc follow-up analysis, the median OS in the VEN-LDAC group was 8.4 months, and the median remained at 4.1 months in PLA-LDAC group, for an HR of 0.70 (95% CI, 0.50 to 0.99); these results remained the same at a 12-month post hoc follow-up analysis.15 The results of a Cox regression sensitivity analysis showed 5 covariates were found to be associated with OS (treatment group, age, AML status, ECOG PS, and cytogenetic risk). Figure 2 shows the Kaplan–Meier analysis of OS over time. Most patients had died by the end of the study. The results of pre-specified subgroup analyses that were performed suggest there was heterogeneity in treatment effect based on patient subgroups (refer to Appendix 3, Table 26).
Table 13: Summary of Efficacy Outcomes in the VIALE-C Study
Outcomes | Final analysis (data cut-off date: February 15, 2019) | 6-month post hoc analysis (data cut-off date: August 15, 2019) | ||
|---|---|---|---|---|
VEN-LDAC N = 143 | PLA-LDAC N = 68 | VEN-LDAC N = 143 | PLA-LDAC N = 68 | |
Follow-up, median | 12 months | 17.5 months | ||
Overall survival | ||||
Deaths, n (%) | 86 (60.1) | 47 (69.1) | 99 (69.2) | 54 (79.4) |
Median OS, months (95% CI) | 7.2 (5.6 to 10.1) | 4.1 (3.1 to 8.8) | 8.4 (5.9 to 10.1) | 4.1 (3.1 to 8.1) |
Cox proportional hazard model, HR (stratified) (95% CI)a | 0.749 (0.524 to 1.071) | 0.704 (0.503 to 0.985) | ||
P value | 0.114 | 0.041 | ||
Event-free survival | ||||
Patients with an event, n (%) | 100 (69.9) | 54 (79.4) | 109 (76.2) | 59 (86.8) |
Confirmed morphologic relapse/disease progression, n | 42 | 18 | 47 | 18 |
Treatment failure, n | 16 | 13 | 17 | 13 |
Death, n | 42 | 23 | 45 | 28 |
Duration of EFS, months, median (95% CI) | 4.7 (3.7 to 6.4) | 2.0 (1.6 to 3.1) | 4.9 (3.7 to 6.4) | 2.1 (1.5 to 3.2) |
HR (unstratified) (95% CI) | 0.601 (0.430 to 0.839) | NA | ||
P value | 0.003b | NA | ||
HR (stratified) (95% CI) | 0.583 (0.416 to 0.817) | 0.610 (0.442 to 0.841) | ||
P value | 0.002a,b | 0.003a,b | ||
Complete remission | ||||
Best IWG response | ||||
CR rate (best response), n (%) (95% CI) | 39 (27.3) (20.2 to 35.3) | 5 (7.4) (2.4 to 16.3) | 40 (28.0) (20.8 to 36.1) | 5 (7.4) (2.4 to 16.3) |
CRi, n (%) (95% CI) | 29 (20.3) (14.0 to 27.8) | 4 (5.9) (1.6 to 14.4) | 29 (20.3) (14.0 to 27.8) | 4 (5.9) (1.6 to 14.4) |
CR + CRi, n (%) (95% CI) | 68 (47.6) (39.1 to 56.1) | 9 (13.2) (6.2 to 23.6) | 69 (48.3) (39.8 to 56.8) | 9 (13.2) (6.2 to 23.6) |
P value (CR + CRi response) | < 0.001a,b | < 0.001a,b | ||
PR, n (%) | 3 (2.1) | 0 | 3 (2.1) | 0 |
MLFS, n (%) | 7 (4.9) | 1 (1.5) | 7 (4.9) | 2 (2.9) |
RD, n (%) | 41 (28.7) | 37 (54.4) | 40 (28.0) | 36 (52.9) |
MR, n (%) | 0 | 0 | 0 | 0 |
PD, n (%) | 4 (2.8) | 4 (5.9) | 4 (2.8) | 4 (5.9) |
Discontinued with no response data, n (%) | 17 (11.9) | 16 (23.5) | 18 (12.6) | 17 (25.0) |
No response but still active, n (%) | 3 (2.1) | 1 (1.5) | 2 (1.4) | 0 |
CR + CRi rate (as best response) by initiation of cycle 2 | ||||
CR, n (%) (95% CI) | 23 (16.1) (10.5 to 23.1) | 2 (2.9) (0.4 to 10.2) | 23 (16.1) (10.5 to 23.1) | 2 (2.9) (0.4 to 10.2) |
CRi, n (%) (95% CI) | 26 (18.2) (12.2 to 25.5) | 0 | 26 (18.2) (12.2 to 25.5) | 0 |
CR + CRi, n (%) (95% CI) | 49 (34.3) (26.5 to 42.7) | 2 (2.9) (0.4 to 10.2) | 49 (34.3) (26.5 to 42.7) | 2 (2.9) (0.4 to 10.2) |
P value (CR + CRi response) | < 0.001a,b | < 0.001a,b | ||
Hematologic response | ||||
CR + CRh rate (as best response) | ||||
CR, n (%) (95% CI) | 39 (27.3) (20.2 to 35.3) | 5 (7.4) (2.4 to 16.3) | 40 (28.0) (20.8 to 36.1) | 5 (7.4) (2.4 to 16.3) |
CRh, n (%) (95% CI) | 28 (19.6) (13.4 to 27.0) | 5 (7.4) (2.4 to 16.3) | 29 (20.3) (14.0 to 27.8) | 5 (7.4) (2.4 to 16.3) |
CR + CRh, n (%) (95% CI) | 67 (46.9) (38.5 to 55.4) | 10 (14.7) (7.3 to 25.4) | 69 (48.3) (39.8 to 56.8) | 10 (14.7) (7.3 to 25.4) |
P value (CR + CRh) | < 0.001a,b | < 0.001a,b | ||
Time to response | ||||
Time to first response of CR + CRi, median months (range) | 1.1 (0.8 to 4.7) | 3.7 (0.9 to 6.5) | 1.1 (0.8 to 16.3) | 3.7 (0.9 to 6.5) |
Time to best response for: | ||||
CR, median (range) | 1.3 (0.9 to 5.9) | 3.7 (0.9 to 9.2) | 1.3 (0.9 to 16.1) | 3.7 (0.9 to 9.2) |
CRi, median (range) | 1.2 (0.8 to 4.3) | 3.8 (1.7 to 6.5) | 1.2 (0.8 to 16.3) | 3.8 (1.7 to 6.5) |
CR + CRi, median (range) | 1.2 (0.8 to 5.9) | 3.7 (0.9 to 9.2) | 1.1 (0.8 to 16.3) | 3.7 (0.9 to 6.5) |
Duration of remission | ||||
Median duration of CR + CRi, investigator assessment, months (95% CI) | 10.8 (5.9 to NE) | 6.2 (1.1 to NE) | 11.7 (7.6 to NE) | 6.2 (1.1 to NE) |
Median duration of CR, investigator assessment, months (95% CI) | 11.1 (5.9 to NE) | 8.3 (3.1 to 8.3) | 17.1 (8.2 to NE) | 8.3 (2.8 to NE) |
Post-baseline transfusion independence | ||||
Post-baseline transfusion independence rate | ||||
RBC and platelet, n (%) (95% CI) | 53 (37.1) (29.1 to 45.5) | 11 (16.2) (8.4 to 27.1) | 56 (39.2) (31.1 to 47.7) | 12 (17.6) (9.5 to 28.8) |
Treatment difference, % (95% CI) | 20.9 (9.1 to 32.7) | 21.5 (9.4 to 33.6) | ||
RBC, n (%) (95% CI) | 58 (40.6) (32.4 to 49.1) | 12 (17.6) (9.5 to 28.8) | 62 (43.4) (35.1 to 51.9) | 13 (19.1) (10.6 to 30.5) |
Treatment difference, % (95% CI) | 22.9 (10.8 to 35.0) | 24.2 (11.9 to 36.6) | ||
Platelet, n (%) (95% CI) | 68 (47.6) (39.1 to 56.1) | 22 (32.4) (21.5 to 44.8) | 70 (49.0) (40.5 to 57.4) | 22 (32.4) (21.5 to 44.8) |
Treatment difference, % (95% CI) | 15.2 (1.4 to 29.0) | 16.6 (2.8 to 30.4) | ||
Duration of post-baseline transfusion independence | ||||
RBC and platelet, mean (SD) | 176.1 (113.31) | 158.2 (87.54) | 217.5 (166.53) | 180.1 (138.54) |
RBC, mean (SD) | 169.9 (111.81) | 156.3 (90.94) | 205.7 (163.49) | 176.6 (137.56) |
Platelet, mean (SD) | 194.6 (121.59) | 157.5 (94.18) | 241.5 (178.99) | 183.1 (133.35) |
Hospital admission | ||||
TEAE leading to hospitalization, n (%) | NA | NA | 80 (56.3) | 35 (51.5) |
CI = confidence interval; CR = complete remission; CRh = complete remission with partial hematologic recovery; CRi = complete remission with incomplete blood count recovery; EFS = event-free survival; HR = hazard ratio; IWG = International Working Group; MLFS = morphologic leukemia-free state; MR = morphologic relapse; NA = not available; OS = overall survival; PD = progressive disease; PLA-LDAC = placebo plus low-dose cytarabine; PR = partial remission; RBC = red blood cell; RD = resistant disease; SD = standard deviation; TEAE = treatment-emergent adverse event; VEN-LDAC = venetoclax plus low-dose cytarabine.
aStratified by AML status (de novo, secondary) and age (18 years to < 75 years, ≥ 75 years) from interactive voice or web response systems.
bBecause statistical significance was not met for the primary outcome, statistical significance cannot be declared for any of the secondary efficacy end points. Therefore, these P values are descriptive in nature.
Source: Clinical Study Report for VIALE-C.3
Figure 2: Kaplan-Meier Analysis of Overall Survival From the VIALE-C Study
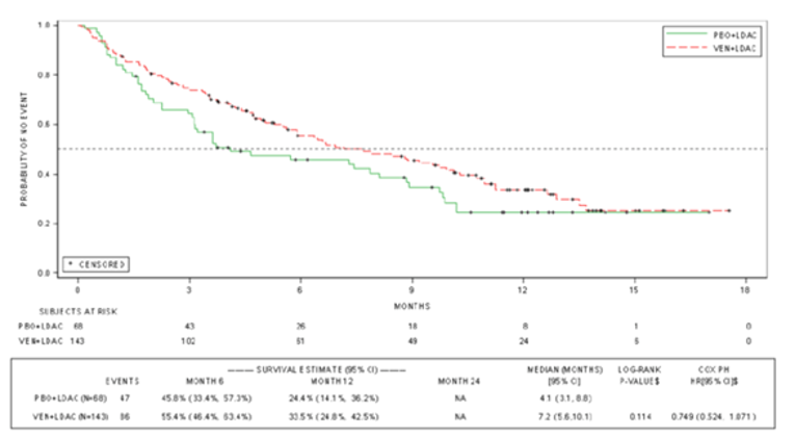
CI = confidence interval; HR = hazard ratio; PBO + LDAC = placebo plus low-dose cytarabine; PH = proportional hazard; VEN + LDAC = venetoclax in combination with low-dose cytarabine.
Data cut-off: February 15, 2019 (median follow-up was 12 months).
Source: Clinical Study Report for VIALE-C.3
Event-Free Survival
At the final analysis, the median EFS was 4.7 months (95% CI, 3.7 to 6.4) in the VEN-LDAC group and 2.0 months (95% CI, 1.6 to 3.1) in the PLA-LDAC group, for an HR of 0.58 (95% CI, 0.42 to 0.82). Refer to Figure 3 for a Kaplan–Meier analysis of EFS. At the time of the 6-month post hoc follow-up analysis, the EFS in the VEN-LDAC group was 4.9 months (95% CI, 3.7 to 6.4); for the PLA-LDAC group, it was 2.1 months (95% CI, 1.5 to 3.2), indicating a limited increase in EFS from the final analysis to the 6-month post hoc follow-up, for an HR of 0.61 (95% CI, 0.44 to 0.84).
Figure 3: Kaplan-Meier Analysis of Event-Free Survival From the VIALE-C Study
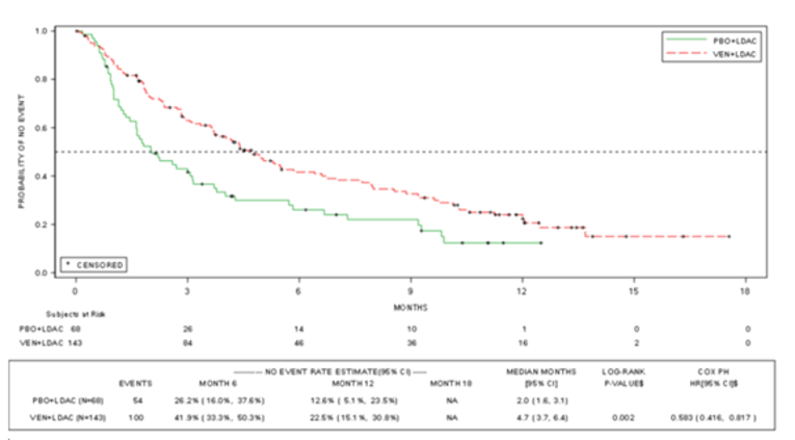
CI = confidence interval; HR = hazard ratio; PBO + LDAC = placebo plus low-dose cytarabine; PH = proportional hazard; VEN + LDAC = venetoclax in combination with low-dose cytarabine.
Source: Clinical Study Report for VIALE-C.3
A sensitivity analysis of the final analysis of EFS based on IRC assessment was also performed; the median EFS by IRC assessment was 5.0 months in the VEN-LDAC group versus 2.2 months in the PLA-LDAC group, for an HR of 0.62 (95% CI, 0.44 to 0.88).
Complete Remission Plus Complete Remission With Incomplete Blood Count Recovery
At the final analysis, per investigator assessment, the CR + CRi rate was 47.6% (95% CI, 39.1% to 56.1%) in the VEN-LDAC group and 13.2% (95% CI, 6.2% to 23.6%) in the PLA-LDAC group. At the 6-month post hoc follow-up, the CR + CRi rate was 48.3% (95% CI, 39.8% to 56.8%) in the VEN-LDAC group and was unchanged from the final analysis in the PLA-LDAC group.
The CR + CRi rate based on IRC assessment was performed as a sensitivity analysis. The IRC-assessed CR + CRi rate was 39.9% in the VEN-LDAC group and 13.2% in the PLA-LDAC group. The sponsor attributed the difference in results between investigator and IRC assessment primarily to interpretation of RBC transfusion independence and growth factor use to support a CR, although the sponsor did not elaborate on specifically how these factors would lead to differences in results.
Complete Remission Plus Complete Remission With Partial Hematologic Recovery
At the final analysis, the CR + CRh rate was 46.9% (95% CI, 38.5% to 55.4%) in the VEN-LDAC group versus 14.7% (95% CI, 7.3% to 25.4%) in the PLA-LDAC group. At the 6-month post hoc follow-up analysis, the CR + CRh rate for patients in the VEN-LDAC group was 48.3% (95% CI, 39.8% to 56.8%), and was unchanged in the PLA-LDAC group, at 14.7% (95% CI, 7.3% to 25.4%).
Time to Remission
At the final analysis, the median time to first remission (CR + CRi) was 1.1 months (range = 0.8 to 4.7) in the VEN-LDAC group and 3.7 months (range = 0.9 to 6.5) in the PLA-LDAC group. At the 6-month post hoc follow-up analysis, the median times to first remission (CR + CRi) were similar to the final analysis.
Duration of Remission
At the final analysis, the median DOR (CR + CRi) was 10.8 months in the VEN-LDAC group and 6.2 months in the PLA-LDAC group. At the 6-month post hoc follow-up, the median DOR (CR + CRi) was 11.7 months in the VEN-LDAC group and remained at 6.2 months in the PLA-LDAC group.
DOR based on IRC assessment was performed as a sensitivity analysis. The median DOR (CR + CRi) based on IRC assessment was not reached in the VEN-LDAC group and was 8.3 months in the PLA-LDAC group.
Post-Baseline Transfusion Independence
At the final analysis, the median duration of RBC transfusion independence was 118.5 days in the VEN-LDAC group and 146.0 days in the PLA-LDAC group. At the 6-month post hoc follow-up analysis, the median duration of first RBC transfusion independence was 133.5 days in the VEN-LDAC group and 110.0 days in the PLA-LDAC group. The median duration of platelet transfusion independence was 163.5 days in the VEN-LDAC group and 112.0 days in the PLA-LDAC group. At the 6-month post hoc follow-up analysis, the median duration of platelet transfusion independence was 198.5 days in the VEN-LDAC group and 132.5 days in the PLA-LDAC group.
At the final analysis, transfusion independence (RBC and platelet) was achieved by 37.1% of patients in the VEN-LDAC group and 16.2% of patients in the PLA-LDAC group. At the 6-month post hoc follow-up analysis, transfusion independence was achieved by 39.2% of patients in the VEN-LDAC group and 17.6% in the PLA-LDAC group. Therefore, there was a slight increase in the percentage of patients who were transfusion-independent in each group from the final analysis to the 6-month post hoc follow-up.
Health-Related Quality of Life
Refer to Appendix 3, Table 27 for detailed data on HRQoL and symptoms (fatigue) outcomes. The EORTC QLQ-C30 Global Health Status/Quality of Life Scale was assessed as a secondary outcome, and subscales were assessed as exploratory outcomes. There were differences in baseline scores between the VEN-LDAC and PLA-LDAC groups, although there was no consistent pattern in the differences. There was a large amount of missing data, with assessments missing for more than 50% of the ITT population. A large portion of the missing data were missing due to attrition; however, compliance with filling out the instrument was typically around 70% to 80% across time points.16 Data were reported every 2 cycles, starting with cycle 3. By cycle 3, data were available for only 69 patients out of 127 patients in the VEN-LDAC group, and for 22 patients of 59 patients in the PLA-LDAC group; by cycle 9, data were available for 22 patients in the VEN-LDAC group and 7 patients in the PLA-LDAC group. For the EORTC QLQ-C30 Global Health Status/Quality of Life Scale, the LSM difference between the VEN-LDAC and PLA-LDAC groups based on changes from baseline after 9 cycles was 6.381 (95% CI, –8.49 to 21.28). The results for individual subscales varied widely, with some reporting improvement from baseline for VEN-LDAC and improvement over PLA-LDAC (appetite loss), while for other scales, there was a worsening (diarrhea and dyspnea) that exceeded the MID of 10 for this instrument. Diarrhea is an adverse effect associated with VEN-LDAC; therefore, a worsening on this subscale is not surprising. It is unclear why appetite might have improved and dyspnea might have worsened; however, any results must be interpreted with caution, given the large amount of missing data. The EuroQol 5-Dimensions was also assessed as an exploratory outcome. These results can be found in in Appendix 3.
Symptoms
Fatigue was assessed using the PROMIS F-SF score (Table 27). There was a significant amount of missing data, just as for the EORTC QLQ-C30 Global Health Status/Quality of Life Scale, again due mainly to attrition and also due to compliance of 70% to 80%.16 Fatigue scores decreased (improved) from baseline in the VEN-LDAC group at the end of all cycles, and this exceeded the MID of 3 starting at cycle 5. Improvements from baseline were also seen in the PLA-LDAC group beginning at cycle 7. The largest between-group difference occurred at cycle 5, with an LSM difference between VEN-LDAC and PLA-LDAC of –4.923 (95% CI, –10.03 to 0.19). Note that the large amount of missing data precludes any conclusions being drawn about the efficacy of VEN-LDAC for this outcome.
Hospital Admission
This outcome was not specifically assessed in the VIALE-C trial, although hospital admissions were reported as AEs. AEs resulted in hospitalizations for 56.3% of patients in the VEN-LDAC group and 51.5% of patients in the PLA-LDAC group at the time of the 6-month post hoc follow-up analysis.
Harms
Only the specific harms specified in the review protocol are reported in this section. Refer to Table 14 for detailed data on harms outcomes, which are based on the 6-month post hoc follow-up analysis.
Adverse Events
At the time of the 6-month post hoc follow-up analysis, 99.3% of patients in the VEN-LDAC group and 98.5% of patients in the PLA-LDAC group had experienced at least 1 AE. The most common AEs (VEN-LDAC versus PLA-LDAC) were neutropenia (45.8% versus 17.6%), thrombocytopenia (45.8% versus 39.7%), nausea (43.0% versus 30.9%), diarrhea (33.1% versus 17.6%), and febrile neutropenia (32.4% versus 29.4%). AEs of grade 3 or higher occurred in 97.2% of patients in the VEN-LDAC group and in 95.6% of patients in the PLA-LDAC group; the most common were neutropenia (48.6% versus 17.6%), thrombocytopenia (45.8% versus 38.2%), and febrile neutropenia (32.4% versus 29.4%).
Serious Adverse Events
SAEs occurred in 66.9% of patients in the VEN-LDAC group and 61.8% of patients in the PLA-LDAC group. The most common SAEs (VEN-LDAC versus PLA-LDAC) were febrile neutropenia (16.9% versus 17.6%) and pneumonia (14.1% versus10.3%).
Withdrawals Due to Adverse Events
AEs resulting in discontinuation of VEN-LDAC occurred in 26.1% of patients; AEs resulting in discontinuation of PLA-LDAC occurred in 23.5% of patients. Pneumonia was the most common reason for discontinuation in the VEN-LDAC group, occurring in 4.9% of patients versus 1.5% of patients treated with PLA-LDAC.
Mortality
AEs leading to death occurred in 23.2% of patients in the VEN-LDAC group versus 20.6% of patients in the PLA-LDAC group. The most common AE that led to death in the VEN-LDAC group was pneumonia, which occurred in 4.9% of patients treated with VEN-LDAC and in no patients treated with PLA-LDAC.
Notable Harms
Notable harms included infections, which were grouped under the broader category of infections and infestations; 64.8% of patients in the VEN-LDAC group and 60.3% of patients in the PLA-LDAC group experienced an event. Pneumonia was the most common infection, occurring in 21.8% and 16.2% of patients in the VEN-LDAC and of PLA-LDAC groups, respectively. All of the following notable harms occurred more frequently in the VEN-LDAC group: second primary malignancy in 2.1% versus zero patients, TLS in 5.6% versus zero patients, and hemorrhage in 41.5% versus 30.9% of patients (grade ≥ 3: 11.3% versus 7.4%); any AE of neutropenia was reported in 68.3% and 45.6% patients, respectively.
Table 14: Summary of Harms in the VIALE-C Study — Safety Analysis Set, 6-Month Post Hoc Follow-Up
Harms | All grades | Grade ≥ 3 | ||
|---|---|---|---|---|
VEN-LDAC N = 142 | PLA-LDAC N = 68 | VEN-LDAC N = 142 | PLA-LDAC N = 68 | |
Patients with an AE n (%) | 141 (99.3) | 67 (98.5) | 138 (97.2) | 65 (95.6) |
Any AE with NCI CTCAE toxicity grade 4 | 102 (71.8) | 38 (55.9) | NA | NA |
Specific AE (≥ 15% of patients), n (%) | ||||
Neutropenia | 69 (48.6) | 12 (17.6) | 69 (48.6) | 12 (17.6) |
Thrombocytopenia | 65 (45.8) | 27 (39.7) | 65 (45.8) | 26 (38.2) |
Nausea | 61 (43.0) | 21 (30.9) | 2 (1.4) | 0 |
Diarrhea | 47 (33.1) | 12 (17.6) | 4 (2.8) | 0 |
Febrile neutropenia | 46 (32.4) | 20 (29.4) | 46 (32.4) | 20 (29.4) |
Hypokalemia | 44 (31.0) | 17 (25.0) | 17 (12.0) | 11 (16.2) |
Anemia | 41 (28.9) | 15 (22.1) | 38 (26.8) | 15 (22.1) |
Vomiting | 41 (28.9) | 10 (14.7) | NA | NA |
Decreased appetite | 31 (21.8) | 13 (19.1) | NA | NA |
Pneumonia | 31 (21.8) | 11 (16.2) | 25 (17.6) | 11 (16.2) |
Constipation | 29 (20.4) | 22 (32.4) | NA | NA |
Pyrexia | 25 (17.6) | 13 (19.1) | 4 (2.8) | 4 (5.9) |
Fatigue | 22 (15.5) | 10 (14.7) | 2 (1.4) | 0 |
Edema peripheral | 20 (14.1) | 14 (20.6) | NA | NA |
Patients with a serious adverse event, n (%) | 95 (66.9) | 42 (61.8) | NA | NA |
Febrile neutropenia | 24 (16.9) | 12 (17.6) | NA | NA |
Pneumonia | 20 (14.1) | 7 (10.3) | NA | NA |
Sepsis | 8 (5.6) | 4 (5.9) | NA | NA |
Septic shock | 5 (3.5) | 4 (5.9) | NA | NA |
Thrombocytopenia | 7 (4.9) | 2 (2.9) | NA | NA |
Patients with a TEAE leading to death, n (%) | 33 (23.2) | 14 (20.6) | NA | NA |
Events occurring in more than 1 patient, n (%) | ||||
Pneumonia | 7 (4.9) | 0 | NA | NA |
Septic shock | 5 (3.5) | 3 (4.4) | NA | NA |
Sepsis | 4 (2.8) | 1 (1.5) | NA | NA |
Acute cardiac failure | 3 (2.1) | 1 (1.5) | NA | NA |
TLS | 2 (1.4) | 0 | NA | NA |
Patients with a TEAE leading to study drug discontinuation, n (%) | ||||
Any AE leading to VEN/PLA discontinuation | 37 (26.1) | 16 (23.5) | NA | NA |
Pneumonia | 7 (4.9) | 1 (1.5) | NA | NA |
Any AE leading to LDAC discontinuation | 37 (26.1) | 16 (23.5) | NA | NA |
Any AE leading to VEN or PLA interruption | 90 (63.4) | 35 (51.5) | NA | NA |
Any AE leading to LDAC interruption | 82 (57.7) | 32 (47.1) | NA | NA |
Any AE leading to VEN or PLA reduction | 14 (9.9) | 5 (7.4) | NA | NA |
Any AE leading to LDAC reduction | 4 (2.8) | 0 | NA | NA |
Notable harms (system organ class preferred terms), n (%) | ||||
Infections and infestations (AE) | 92 (64.8) | 41 (60.3) | NA | NA |
Pneumonia | 31 (21.8) | 11 (16.2) | NA | NA |
Second primary malignancy | 3 (2.1) | 0 | NA | NA |
Leukemic infiltration gingiva | 1 | 0 | NA | NA |
Leukemic infiltration pulmonary | 1 | 0 | NA | NA |
Squamous cell carcinoma of skin | 1 | 0 | NA | NA |
TLS (AE) | 8 (5.6) | 0 | NA | NA |
Neutropenia (any AE) | 97 (68.3) | 31 (45.6) | NA | NA |
Hemorrhage | 59 (41.5) | 21 (30.9) | NA | NA |
Grade ≥ 3 | 16 (11.3) | 5 (7.4) | NA | NA |
AE = adverse event; CTCAE = common toxicity criteria for adverse events; LDAC = low-dose cytarabine; NA = not applicable; NCI = National Cancer Institute; PLA = placebo; PLA-LDAC = placebo plus low-dose cytarabine; TEAE = treatment-emergent adverse event; TLS = tumour lysis syndrome; VEN = venetoclax; VEN-LDAC = venetoclax plus low-dose cytarabine.
Source: Clinical Study Report for VIALE-C.3
Critical Appraisal
Internal Validity
The VIALE-C study was a double-blind RCT, and steps were taken to maintain blinding, such as the use of a placebo that was identical in appearance to VEN. There was a large numerical imbalance in a number of AEs, including neutropenia, between the VEN-LDAC and PLA-LDAC treatment groups; this may have resulted in loss of blinding in those patients experiencing these AE, given that many are known adverse effects of VEN. However, the primary outcome of OS and those outcomes that were largely based on laboratory testing results should not have been affected.
Overall survival is a standard outcome in oncology drug investigation, with robust methods for ascertainment. Collection was likely to be complete and the timing of events was likely to be accurately determined. Standard methods for survival analysis were used, with surviving patients censored at the date they were known to be alive on or before the data cut-off date. There was minimal loss to follow-up or withdrawal and good balance between demographic and clinical characteristics at baseline; therefore, censoring is unlikely to be related to prognosis. The prognosis of recruited patients is unlikely to have changed with time because there were no changes to inclusion or exclusion criteria that were likely to affect prognosis and that recruitment took place over a relatively short time period. There was no evidence of violation of the proportional hazards assumption, and competing risks for this end point are unlikely.
A statistical hierarchy was used to account for multiplicity; however, early failure of the hierarchy (at the level of the primary outcome) meant that subsequent testing lacked control for type I error. This limits any statistical inferences that can be drawn with respect to statistical significance for any of the subsequent outcomes that were to be tested in the hierarchy after OS. Health Canada noted this limitation in its review of VEN-LDAC for this indication, but still granted a NOC based on the “totality of evidence,” citing clear numerical differences between VEN-LDAC and PLA-LDAC for outcomes like CR + CRi (19.9% difference between groups) and transfusion independence (20% difference between groups).12
Event-free survival is a composite end point consisting of death from any cause, confirmed morphologic relapse from CR + CRi, confirmed disease progression, and treatment failure. Treatment failure was defined as failure to reach CR, CRi, or a morphologic leukemia-free state after at least 6 cycles. EFS is an accepted end point in the development of treatments for leukemia,17 although empirical data show inconsistent correlation between EFS and OS.18 However, compared to OS, EFS provides a more direct measurement of the ability of the treatment to achieve a response and the durability of response because it is affected by trial treatment alone, whereas OS is affected by trial treatment, post-trial treatment, and supportive or palliative care.18 A time-to-event analysis of all individual end points making up the composite EFS outcome was not reported, making it difficult to fully assess for violations of the assumptions underlying the composite end point (i.e., the events were of equal importance to patients, occur with similar frequency, and have a similar sensitivity to the treatment). The proportion of patients with each individual end point was reported, and the distribution of these in each treatment group is consistent with observed results for OS and CR + CRi, which were higher in the VEN-LDAC group compared to the PLA-LDAC group. Results for the individual analyses of OS, DOR, and CR + CRi show similar directions of effect, but this does not adjust for competing events. Standard methods for survival analysis were used, with surviving patients censored at the date they were known to be alive on or before the cut-off date. There was minimal loss to follow-up or withdrawal and good balance between demographic and clinical characteristics at baseline; therefore, censoring is unlikely to be related to prognosis. The prognosis of recruited patients is unlikely to have changed with time because there were no changes to the inclusion or exclusion criteria that were likely to affect prognosis and because recruitment took place over a relatively short time period. There was also no evidence of violation of the proportional hazards assumption.
An a priori sample size calculation was performed, although the assumptions upon which the estimates used were based was not reported (i.e., median OS of 11 months with VEN-LDAC and 6 months with PLA-LDAC). These assumed estimates differed from the actual median OS observed in the trial, perhaps leading to a non-statistically significant finding for OS in the final analysis (7.2 months with VEN-LDAC and 4.1 months with PLA-LDAC). It is reasonable for a trial not to reach its pre-specified outcome when the parameters used for statistical planning were unknown or uncertain at the time of executing the trial. Therefore, it is not surprising to see a greater difference between VEN-LDAC and PLA-LDAC at the 6-month post hoc follow-up analysis, by which time more death events had occurred. The trial was relatively small, with fewer than 100 patients in the PLA-LDAC group; the small number may not have provided adequate power to assess some of the patient-reported outcomes due to the high rate of attrition in the study.
The interpretation of outcomes like fatigue and HRQoL is limited by the large amount of missing data. For example, by cycle 5, in the assessment of EORTC QLQ-C30 Global Health Status, only about 30% of the original ITT population remained in the VEN-LDAC group, while about 20% of the original ITT population remained in the PLA-LDAC group. Even after cycle 3, the earliest time point assessed, nearly 50% of the ITT population was missing from the VEN-LDAC group, and nearly two-thirds were missing from the PLA-LDAC group. The large amount of missing data was not only due to attrition because compliance with filling out these instruments was relatively low, at about 78% at cycle 3, and lower at some other later time points. A MID has been established for the EORTC QLQ C30 Global Health Status in a diverse group of patients with cancer; the PROMIS instrument has been validated in various chronic diseases. The sponsor took steps to validate PROMIS in a population reflective of the indication using data from the VIALE-C study. Using the study population under review to validate the instrument is an unusual approach to validation, and there is risk of bias in it.
There was a numerical difference in the number of patients discontinuing the study, with a lower percentage in the VEN-LDAC group than in the PLA-LDAC group (72.0% versus 82.4%). This difference between groups is accounted for by the difference in deaths between the 2 groups; thus, it can be considered informed censoring, given the primary outcome of OS. However, the difference in exposure to study drug could affect other outcomes, including patient-reported outcomes and the interpretation of harms data.
Protocol deviations occurred due to violations related to inclusion or exclusion criteria, receipt of wrong treatment or incorrect dose of study drug, demonstration of withdrawal criteria without being withdrawn, and use of prohibited concomitant medications. An assessment of deviations was performed to assess their impact on data integrity or patient safety; no protocol deviations were found to affect either.
Both CR and CR + CRi and were investigator-assessed based on laboratory and clinical findings, with an independent review assessed as sensitivity analyses. CR + CRi is an accepted end point in the development of treatments for leukemia,17 although empirical data suggest that the strength of the correlation between CR + CRi and OS maybe be population- and treatment-dependent.18 The differences in results between investigator and IRC methods of assessment were minimal. Both CR and CRi reflect bone marrow and peripheral blood improvement, with different thresholds, and the direction of effect was the same for each outcome. Randomized patients without a post-baseline disease assessment were considered non-responders. This is a conservative assumption that biases the individual estimates of response downwards, but it does account for a competing risk of death in an aged population.
It is not clear how data on transfusion independence were collected, or whether it might be susceptible to survivor bias; (i.e., if patients had to survive to a visit for transfusion since the last visit to be captured in the analysis). There is the risk of undercounting transfusion in seriously ill patients.
External Validity
Input from the clinical experts consulted by CADTH was sought to assess the generalizability of evidence for VEN-LDAC. The clinical experts believed that the population included in the VIALE-C study was representative of those who would be treated with VEN-LDAC under the indication, and that the outcomes assessed in the trial covered all the major outcomes of interest. The clinical experts noted that the dose of VEN-LDAC used (adjusted based on body surface area) was expressed differently than in Canadian practice, where a flat dose is used; this resulted in a lower dose being used in the VIALE-C study than what would typically be used in Canadian practice.
In practice, for those patients who are under 75 years old, the indication requires at least 1 criterion associated with lack of fitness for intensive induction chemotherapy be met, such as an ECOG PS of 2 to 3 or comorbidities such as cardiovascular disorders (ejection fraction ≤ 50%) requiring treatment, respiratory functions (diffusing capacity of the lungs for carbon monoxide ≤ 65% or forced expiratory volume in 1 second [FEV1] ≤ 65%), or impaired renal functions (creatinine clearance ≥ 30 mL/minute to < 45 mL/minute). Nearly 50% of patients in the study had an ECOG PS of 0 to 1, which probably reflects the target population for which the drug could be used in clinical practice. Most of the study patients (60%) were newly diagnosed and likely without prior treatment for AML except for MDS. It is unknown whether these restricted criteria could affect the generalizability of the findings to all patients with multiple comorbidities or with prior treatment.
A concern was identified surrounding the assumption within the study inclusion criteria that patients aged 75 years or older would not be eligible for standard induction chemotherapy. In the Canadian setting, such patients would be considered for treatment if they were medically fit, especially if they had favourable- or intermediate-risk cytogenetics.
The settings for the study were predominantly urban hospitals and clinics. Therefore, the study does not necessarily address the rural or remote Canadian context, in which patients would not have access to frequent laboratory testing for monitoring of ramp-up of VEN and cytopenias and outpatient or inpatient treatment for side effects and complications.
Indirect Evidence
Description of Indirect Comparison(s)
Objectives and Methods for the Summary of Indirect Evidence
An ITC was required because of the lack of studies directly comparing VEN-LDAC with other treatments currently in use in the Canadian setting.
Search Methods
A focused literature search for NMAs dealing with VEN and AML was run in MEDLINE All (1946–) on February 11, 2021. No limits were applied.
Description of Indirect Comparison
One report including ITCs was supplied by the sponsor. It included a systematic review with an NMA comparing VEN-LDAC and VEN-AZA with AZA, LDAC, and BSC as well as 2 propensity score analyses comparing VEN-AZA with LDAC (2-way) and VEN-AZA with AZA with LDAC (i.e., a 3-way comparison).
Table 15 shows the study selection criteria and key aspects of the methods for the systematic review. The patient population of interest included treatment-naive adult patients with AML who were ineligible for intensive chemotherapy; however, the search allowed flexible wording to ensure retrieval of studies. The term “treatment-naive” was considered interchangeable with “previously untreated” or “newly diagnosed,” and “ineligible for chemotherapy” included patients described as old or elderly, unfit for intensive chemotherapy, unfit for standard chemotherapy, or unfit for high-dose chemotherapy. The initial search for articles included a broader set of comparators and included controlled clinical trials as a study design. More restricted selection criteria that were developed for a planned EUnetHTA submission were applied at the stage of full-text review; the table reflects these criteria. The reasons for selection of comparators were not given, but the overall declared intention was to select high-quality studies that might enable ITC.
Table 15: Study Selection Criteria and Methods for the Systematic Review
Criteria | Indirect treatment comparison |
|---|---|
Population | Treatment-naive adult patients (age ≥ 18 years) with AML who were ineligible for intensive chemotherapy.
Studies were excluded if these were not in humans, not in adults, not in treatment-naive patients with AML, or if they were in patients with APL or specifically recruited patients with HIV, HBV, or HCV infection. |
Intervention and/or comparator | Studies with at least 1 of the following regimens:
|
Outcome | Studies reporting at least 1 of the following outcomes:
|
Study design | Included designs: Randomized clinical trials |
Other selection criteria | Inclusion restricted to English language studies Inclusion limited to studies with ≥ 20 patients per arm Excluded studies with mixed MDS and AML populations, unless outcomes were reported for AML subgroup Bibliographies of systematic reviews and meta-analyses identified in the search were screened for studies before exclusion |
Databases searched | Searched through the Ovid platform:
Abstract search (2017 onwards) through Ovid Northern Light Life Sciences Conference Abstracts (http://www.ovid.com/site/catalog/databases/13207.jsp) or through the conference website, if the latest conference abstracts were not indexed in the Northern Light database:
Also searched:
Validated filters (Scottish Intercollegiate Guidelines Network) were used to retrieve RCTs. |
Selection process | Level I screening was by title and abstract. Potentially relevant studies were passed on to level II, where the full text was screened. Each level of screening was conducted by 2 independent reviewers. Discrepancies were reconciled by a third reviewer. |
Data extraction process | Data were extracted independently into a predefined extraction table by 2 reviewers. Discrepancies were reconciled by a third reviewer. |
Quality assessment | The quality assessment was according to the Centre for Reviews and Dissemination Risk of Bias Assessment checklist for RCTs:
|
AML = acute myeloid leukemia; APL = acute promyelocytic leukemia; CR = complete remission; CRh = complete remission with partial hematologic recovery; CRi = complete remission with incomplete blood count recovery; HBV = hepatitis B virus; HCV = hepatitis C virus; HMA = hypomethylating agent; MDS = myelodysplastic syndrome; NICE = National Institute for Health and Care Excellence; RCT = randomized controlled trial.
Source: Systematic Review report.19
Methods of the ITC
Objectives
The objective of this study was to compare the efficacy of VEN combination therapies with alternative treatments in treatment-naive patients with AML who were ineligible for intensive chemotherapy, including:
Objective 1: Comparison of VEN-LDAC and VEN-AZA with LDAC, AZA, and BSC using NMA
Objective 2: Comparison of VEN-AZA versus LDAC using propensity score weighting analysis
Objective 3: Comparison of VEN-AZA versus AZA versus LDAC using 3-way propensity score weighting analysis
Study Selection Methods
To be included in the ITCs, trials retrieved by the systematic review had to meet the following criteria:
Study design: phase III RCTs
Population: treatment-naive adult patients with AML who were ineligible for intensive chemotherapy
Interventions: VEN-LDAC, VEN-AZA, LDAC, AZA, and BSC (including blood transfusion, etoposide, mercaptopurine, and hydroxyurea)
Outcomes of interest: OS, EFS, CR, CRi, CR + CRi
The decision to restrict the ITC to phase III RCTs for reasons of quality led to the exclusion of trials containing glasdegib because there was no phase III trial connected to the network containing VEN-LDAC and VEN-AZA.
ITC Analysis Methods
Three analyses were conducted: 1 NMA and 2 propensity score weighted comparisons. The propensity score weighted comparisons were not relevant to this review and will not be discussed further.
The NMA compared VEN-LDAC with VEN-AZA and comparator treatments for the available end points of OS and CR + CRi. The feasibility of pooling to create a network for analysis was pre-assessed on the basis of study and patient characteristics. The main analysis excluded patients from the VIALE-C LDAC group who would not have been eligible to enter VIALE-A because they had previously been treated with HMAs or had good cytogenetic risk. For OS, the proportional hazards assumption was assessed using log-log cumulative hazard plots, which led to the decision to model OS using proportional hazards.
The model was a Bayesian mixed treatment comparison in the generalized linear model framework, with OS modelled using the identity link and dichotomous outcomes modelled using the logit link. Due to limited data, only fixed-effects models were estimated. Prior distributions were non-informative, following a selection process that was not detailed. Posterior probabilities were modelled using Bayesian Markov chain Monte Carlo methods, with 50,000 iterations on 3 chains and a burn-in period of 50,000 iterations. Convergence was assessed by trace and density plots and Gelman-Rubin plots and diagnostics. Selection between models was made by the difference information criterion. The chosen definition of a meaningful difference in the difference information criterion was not given.
Results of the ITC
Summary of Included Studies
Following the removal of duplicates, 7,319 records were screened by title and abstract; of these, 225 were screened in full text. With the addition of the VIALE-A and VIALE-C study reports, the final selection was 7 RCTs with at least 2 arms of interest.
With the additional restriction of the comparators for the NMA inclusion criteria, removing decitabine from the comparators, 4 trials were included in the NMA: VIALE-C, VIALE-A, AZA-001, and AZA-AML-001. Table 16 shows a summary of the study characteristics for these 4 trials.
Table 16: Study Characteristics of Trials Included in the Systematic Review
Study | Design | N | Intervention vs. comparator | Key inclusion criteria | Key exclusion criteria |
|---|---|---|---|---|---|
VIALE-A (M15-656) | Phase III, double-blind RCT Randomized 2:1, VEN-AZA:PBO-AZA | VEN-AZA: 286; PBO-AZA: 145 | VEN-AZA vs. PBO-AZA VEN 400 mg orally once a day (1 day to 28 days) AZA 75 mg/m2 SC or IV daily (1 day to 7 days) | Aged ≥ 18 years, with AML, ineligible for standard induction due age or comorbidities Treatment-naive ECOG PS 75 years: 0 to 2 ECOG PS 18 years to 74 years: 0 to 3 | Prior treatment for AML, except hydroxyurea. Prior HMA, VEN, chemotherapy for MDS. Prior CAR T-cell therapy. Strong/moderate CYP3A inducers within 7 days. Prior myeloproliferative neoplasm, acute promyelocytic leukemia, active CNS involvement Cytogenetic risk: good |
VAILE-C (M16-043) | Phase III, double-blind trial Randomized 2:1, VEN-AZA:PBO-AZA | VEN-LCAD: 143; LDAC: 68 | VEN-LDAC vs. LDAC VEN 600 mg orally once a day (1 day to 28 days) LDAC 20 mg/m2 SC (1 day to 10 days) | ≥ 18 years, with AML, ineligible for intensive induction therapy (i.e., aged ≥ 75 years, or ≥ 18 years to 74 years and met at least 1 of the criteria for lack of fitness for intensive induction therapy) Treated for MDS (except cytarabine) ECOG PS 75 years: 0 to 2 ECOG PS 18 years to 74 years: 0 to 3 | Prior treatment for AML, except hydroxyurea Prior myeloproliferative neoplasm, acute PML, active CNS involvement |
AZA-001 | Phase III, open-label trial | AZA: 55; LDAC: 20; BSC: 27 | AZA vs. LDAC AZA vs. BSC AZA 75 mg/m2 SC daily (1 day to 7 days) BSC (blood product infusion, antibiotics, GSF) LDAC 20 mg/m2 SC (1 day to 14 days) | Patients with AML ≥ 20% bone marrow or peripheral blasts | Therapy-related disease |
AZA-AML-001 | Phase III, open-label trial | AZA: 241; LDAC: 158; BSC: 45 | AZA vs. BSC AZA vs. LDAC AZA 75 mg/m2 SC daily (1 day to 7 days) BSC (blood product infusion, antibiotics, GSF) LDAC 20 mg/m2 SC (1 day to 10 days) | Aged ≥ 65 years, newly diagnosed AML, > 30% blasts Intermediate- or poor-risk cytogenetics | Acute AML with t(15;17)(q22;q12) and AML with inv(16)(p13.1q22) or t(16;16)(p13.1;q22), t(8;21)(q22;q22), or t(9;22)(q34;q11.2). Not FAB M3 AML. |
AML = acute myeloid leukemia; AZ = azacitidine; BSC = best supportive care; CAR T-cell therapy = chimeric antigen receptor T; CNS = central nervous system; CYP3A = cytochrome P450; ECOG PS = Eastern Cooperative Oncology Group Performance Status; GSF = granulocyte stimulating factor; HMA = hypomethylating agent; ITC = indirect treatment comparison; LDAC = low-dose cytarabine; MDS = myelodysplastic syndrome; PBO-AZA = placebo plus azacitidine; PML = promyelocytic leukemia; RCT = randomized controlled trial; SC = subcutaneous; VEN = venetoclax; VEN-AZA = venetoclax plus azacitidine; VEN-LDAC = venetoclax plus low-dose cytarabine; vs. = versus.
Source: ITC report.20
Table 17 shows a summary of patient baseline characteristics for the 4 studies included in the NMA. Only the treatment arms used in the NMA are presented. The table is in 2 panels, the first showing demographic and clinical characteristics, and the second showing the cytogenetic and mutation data. Table 18 shows an assessment of heterogeneity based on the study and patient characteristics. The most important sources of heterogeneity were in the indicators of disease severity, bone marrow blast counts, proportion of patients with poor cytogenetic risk, and baseline ECOG PS.
Table 17: Summary of Patient Baseline Characteristics
Study name and treatment | N | Age (years), median (range) | Gender (male), n (%) | ECOG/WHO PS 0/1, n (%) | ECOG/WHO PS 2, n (%) | Primary/de novo AML, n (%) | Secondary AML, n (%) |
|---|---|---|---|---|---|---|---|
VIALE-A | |||||||
VEN + AZA | 286 | 76.0 (49 to 91) | 172 (60.1%) | 157 (54.9%) | 113 (39.5%) | 214 (74.8%) | 72 (25.2%) |
Placebo + AZA | 145 | 76.0 (60 to 90) | 87 (60.0%) | 81 (55.9%) | 59 (40.7%) | 110 (75.9%) | 35 (24.1%) |
VIALE-C | |||||||
VEN + LDAC | 143 | 76.0 (36 to 93) | 78 (54.5%) | 74 (51.7%) | 63 (44.1%) | 85 (59.4%) | 58 (40.6%) |
Placebo + LDAC | 68 | 76.0 (41 to 88) | 39 (57.4%) | 34 (50.0%) | 25 (36.8%) | 45 (66.2%) | 23 (33.8%) |
AZA-001 | |||||||
AZA: pre-selected BSC | 36 | 70.0 (52 to 80) | 21 (58.3%) | 32 (88.9%) | 4 (11.1%) | NR | NR |
CCR: pre-selected BSC | 27 | 70.0 (56 to 80) | 16 (59.3%) | 26 (96.3%) | 0 (0.0%) | NR | NR |
AZA: pre-selected LDAC | 14 | 69.0 (55 to 78) | 13 (92.9%) | 14 (100.0%) | 0 (0.0%) | NR | NR |
CCR: pre-selected LDAC | 20 | 71.0 (56 to 83) | 15 (75.0%) | 19 (95.0%) | 0 (0.0%) | NR | NR |
AZA-AML-001 | |||||||
AZA: pre-selected BSC | 44 | NR | NR | NR | NR | NR | NR |
CCR: pre-selected BSC | 45 | 78.0 (67 to 89) | 29 (64.4%) | 30 (66.7%) | 15 (33.3%) | NR | NR |
AZA: pre-selected LDAC | 154 | 76.0 (64 to 90) | NR | NR | 39 (25.0%) | NR | NR |
CCR: pre-selected LDAC | 158 | 75.0 (65 to 88) | 94 (59.5%) | 123 (77.8%) | 35 (22.2%) | NR | NR |
AML = acute myeloid leukemia; AZA = azacitidine; BSC = best supportive care; CCR = conventional care regimen; ECOG = Eastern Cooperative Oncology Group; LDAC = low-dose cytarabine; NR = not reported; PS = performance score; VEN = venetoclax.
Source: Systematic Review report.19
Table 18: Summary of Cytogenic and Mutation Data
Study name and treatment | Cytogenetic risk | WBC | Platelets | Bone marrow blasts | ||||
|---|---|---|---|---|---|---|---|---|
Intermediate, n (%) | Poor, n (%) | n (%) | n (%) | % (95% CI) | < 30% n (%) | 30% to < 50% n (%) | ≥ 50% n (%) | |
VIALE-A | ||||||||
VEN + AZA | 182 (63.6%) | 104 (36.4%) | NR | NR | 47.0 (4.4 to 100.0) | 85 (29.7%) | 61 (21.3%) | 140 (49.0%) |
Placebo + AZA | 89 (61.4%) | 56 (38.6%) | NR | NR | 47.0 (11.0 to 99.0) | 41 (28.3%) | 33 (22.8%) | 71 (49.0%) |
VIALE-C | ||||||||
VEN + LDAC | 91 (63.6%) | 47 (32.9%) | NR | NR | NR | 42 (29.4%) | 36 (25.2%) | 65 (45.5%) |
Placebo + LDAC | 46 (67.6%) | 20 (29.4%) | NR | NR | NR | 18 (26.5%) | 22 (32.4%) | 28 (41.2%) |
AZA-001 | ||||||||
AZA: pre-selected BSC | NR | NR | NR | NR | NR | NR | NR | NR |
CCR: pre-selected BSC | 19 (70.4%) | 8 (29.6%) | NR | NR | 22.5 (13.0 to 29.2) | NR | NR | NR |
AZA: pre-selected LDAC | NR | NR | NR | NR | NR | NR | NR | NR |
CCR: pre-selected LDAC | 18 (90.0%) | 1 (5.0%) | NR | NR | 22.0 (20.0 to 28.0) | NR | NR | NR |
AZA-AML-001 | ||||||||
AZA: pre-selected BSC | NR | NR | NR | NR | NR | NR | NR | NR |
CCR: pre-selected BSC | 29 (64.4%) | 16 (35.6%) | 2.3 (1.0, 23.0) | 52 (7, 161) | 76.0 (9.0 to 100.0) | NR | NR | 36 (80.0%) |
AZA: pre-selected LDAC | NR | NR | NR | NR | 70.0 (2.0 to 100.0) | NR | NR | NR |
CCR: pre-selected LDAC | 104 (65.8%) | 54 (34.2%) | 2.3 (0.0, 73.0) | 54 (6, 327) | 74.0 (4.0 to 100.0) | NR | NR | 128 (81.0%) |
AML = acute myeloid leukemia; AZA = azacitidine; BSC = best supportive care; CCR = conventional care regimen; CI = confidence interval; ECOG = Eastern Cooperative Oncology Group; LDAC = low-dose cytarabine; NR = not reported; PS = performance score; VEN = venetoclax; WBC = white blood cell.
Source: Systematic Review report.19
Table 19: Assessment of Homogeneity for NMA
Potential effect modifiers | Description and handling |
|---|---|
Disease severity | Patient groups varied in bone marrow blast counts, which is a prognostic indicator. Where available, median bone marrow blasts ranged from 23.0% to 76%; and 42.1% to 81% of patients had ≥ 50% blasts. Where available, the proportion of patients with poor cytogenetic risk ranged from 29.6% to 38.6%, with the exception of 1 arm with a single patient (0.5%). The proportion of patients with poorer ECOG PS (= 2) varied from 0% to 44.1% across trial arms. |
Treatment history | All studies included treatment-naive or newly diagnosed patients with AML. |
Clinical trial eligibility criteria | 3 studies selected older adults and/or treatment-ineligible patients. One did not specify. 2 studies did not specify a threshold for bone marrow blasts;1 specified ≥ 20% blasts; and 1 specified > 30% blasts. 3 studies prohibited prior treatment with HMAs. 1 study (VIALE-C) permitted it. |
Comparators | Dosing was largely consistent across studies:
|
Definitions of end points | Details of end points were not extracted in the report. Variability in end point definitions or assessments was not identified as a source of heterogeneity. |
Timing of end point evaluation or trial duration | The median length of study follow-up ranged from 17.5 months (VIALE-C) to 24 months (AZA-AML-001). |
Withdrawal frequency | Not reported in the data extraction. Quality appraisal rated risk of bias due to unexpected imbalances in dropouts between groups as high for AZA-001 and low for other studies. |
Clinical trial setting | Details of settings were not extracted in the report. |
Study design | All were parallel-group, randomized controlled trials. VIALE-A and VIALE-C were double-blind studies, and AZA-001 and AZA-AML-001 were open-label studies. They included stratified randomization according to investigator’s pre-selection of comparator to LDAC, AZA, and intensive chemotherapy. (Data from the intensive chemotherapy were not used in the ITC.) |
AML = acute myeloid leukemia; AZA = azacitidine; ECOG PS = Eastern Cooperative Oncology Group Performance Status; HMA = hypomethylating agent; ITC = indirect treatment comparison; LDAC = low-dose cytarabine; VEN = venetoclax.
Table 20 shows the results of the risk of bias assessment for the 4 trials included in the ITC. The Quality Assessment Questions appear in Table 15: Study Selection Criteria and Methods for the Systematic Review. The risk of bias was low for all trials for treatment randomization, allocation concealment, and baseline balance. Trials AZA-001 and AZA-AML-001 were open-label studies; therefore, the risk of bias was high. In comparison, trials VIALE-C and VIALE-A were double-blind studies, with low risk of bias. Trial AZA-001 was at high risk of bias for imbalance in dropouts because more patients appear to have dropped out of the conventional care arm, and for selective reporting because overall AEs were not available. All trials were at unclear risk of bias for the inclusion of an ITT analysis. Where a reason was given, the concern was with lack of detail on the methods for the handling of missing data.
Table 20: Summary of Risk of Bias Assessment
Study | Risk of bias (high, low, or unclear) | ||||||
|---|---|---|---|---|---|---|---|
Randomization | Allocation concealment | Baseline balance | Blinding | Imbalance in dropouts | Selective reporting | Inclusion of ITT analysis | |
VIALE-A | Low | Low | Low | Low | Low | Unclear | Unclear |
VIALE-C | Low | Low | Low | Low | Low | Unclear | Unclear |
AZA-001 | Low | Low | Low | High | High | High | Unclear |
AZA-AML-001 | Low | Low | Low | High | Low | Unclear | Unclear |
Trial Networks
Figure 4 shows the network for the NMA for OS. Four trials reported this end point and were included in the NMA. The network was linear, with a single branch, and included 5 treatments. There were no closed loops. AZA was the best represented treatment, with 3 trials contributing data, followed by LDAC, with 2 trials contributing data.
Figure 4: Network Diagram for the NMA for OS
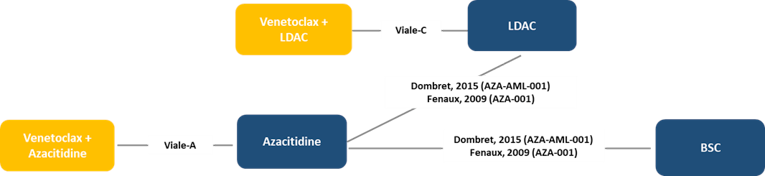
BSC = best supportive care; ITC = indirect treatment comparison; LDAC = low-dose cytarabine.
Source: ITC report.20
Figure 5 shows the network for the NMA for CR + CRi. Three trials reported this end point and were included in the NMA; the fourth, AZA-001, did not report data on CRi. The network was linear, with a single branch, and included 5 treatments. There were no closed loops. AZA and LDAC were the best represented treatments, with 2 contributing trials each.
Figure 5: Network Diagram for the NMA for CR + CRi
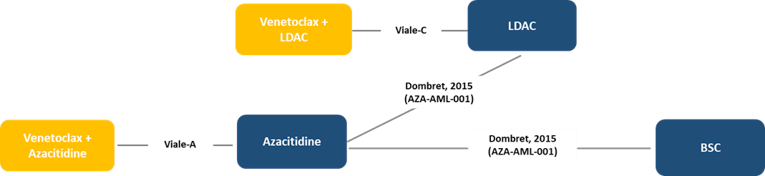
BSC = best supportive care; ITC = indirect treatment comparison; LDAC = low-dose cytarabine.
Source: ITC report.20
Table 21 shows the data included in the NMAs for the end points of OS and CR + CRi. In the 2 trials comparing AZA with BSC, the HRs for OS were 0.60 (95% CI, 0.38 to 0.95) and 0.48 (95% CI, 0.24 to 0.94) for AZA-001 and AZA-AML-001, respectively. In the 2 trials comparing AZA with LDAC, the HRs for OS were 0.37 (95% CI, 0.12 to 1.13) and 0.90 (95% CI, 0.70 to 1.16) for AZA-001 and AZA-AML-001, respectively.
Table 21: Data Included in the NMAs of OS and CR + CRi, Whole Population
Trial | Treatment arm | OS | CR + CRi | ||
|---|---|---|---|---|---|
N | HR (95% CI) | N | n (%) | ||
Viale-A | VEN-AZA | 286 | 0.66 (0.52 to 0.85) | 286 | 190 (66.43) |
AZA | 145 | 145 | 41 (28.28) | ||
Viale-C | VEN-LDAC | 143 | 0.70 (0.50 to 0.99) | 143 | 69 (48.25) |
LDAC | 68 | 68 | 9 (13.24) | ||
AZA-001a | AZA | 36 | 0.48 (0.24 to 0.94) | NR | NR |
BSC | 27 | NR | NR | ||
AZA-001a | AZA | 14 | 0.37 (0.12 to 1.13) | NR | NR |
LDAC | 20 | NR | NR | ||
AZA-AML-001b,c | AZA | 44 | 0.60 (0.38 to 0.95) | 44 | 7 (15.91) |
BSC | 45 | 47 | 1 (2.13) | ||
AZA-AML-001b | AZA | 154 | 0.90 (0.70 to 1.16) | 154 | 42 (27.27) |
LDAC | 158 | 158 | 41 (25.95) | ||
AZA = azacitidine; BSC = best supportive care; CI = confidence interval; CR = complete response; CRi = complete response with incomplete hematological recovery; HR = hazard ratio; ITC = indirect treatment comparison; LDAC = low-dose cytarabine; NICE = National Institute for Health and Care Excellence; NR = not reported; OS = overall survival; VEN-AZA = venetoclax plus azacitidine.
aAZA-001 (Fenaux, 2009) included patients with 20% to 30% bone marrow blasts. One patient in the BSC group had a bone marrow blast count of 13% but was included based on a peripheral blast count of 20%. In addition, 1 patient in the LDAC arm had blast count of 34%.
bAZA-AML-001 (Dombret, 2015) included patients > 30% bone marrow blasts. Patients were randomly assigned on the basis of local pathology assessment of baseline bone marrow blast count, which was subsequently reviewed by the central pathologist; in a small number of cases, baseline blast count was < 30% upon central review.
cA CR + CRi rate of 0 was reported. In accordance with NICE guidance, the numerator and denominator were increased by 1 and 2 respectively to allow for estimation of treatment effect.
Source: ITC report.20
Results
Results of the NMA
Overall Survival: Table 22 shows the results for the NMA for OS. VEN-LDAC was favoured over comparators LDAC (HR = 0.70; 95% credible interval, 0.50 to 0.99) and BSC (HR = 0.46; 95% credible interval, 0.26 to 0.81), with no treatment favoured between VEN-LDAC and VEN-AZA (HR = 0.81; 95% credible interval, 0.50 to 1.31) and VEN-LDAC and AZA (HR = 0.82; 95% credible interval, 0.54 to 1.24).
Table 22: Pairwise Treatment Comparisons for Overall Survival
Treatment, HR (95% Crl) | LDAC | VEN + AZA | AZA | BSC | VEN + LDAC |
|---|---|---|---|---|---|
LDAC | — | 0.57a (0.40 to 0.81) | 0.86 (0.67 to 1.10) | 1.54 (0.98 to 2.43) | 0.70a (0.50 to 0.99) |
VEN + AZ | 1.75a (1.24 to 2.49) | — | 1.51a (1.18 to 1.94) | 2.70a (1.72 to 4.25) | 1.23 (0.76 to 2.01) |
AZA | 1.16 (0.91 to 1.49) | 0.66a (0.52 to 0.85) | — | 1.78a (1.22 to 2.62) | 0.82 (0.54 to 1.24) |
BSC | 0.65 (0.41 to 1.03) | 0.37a (0.24 to 0.58) | 0.56a (0.38 to 0.82) | — | 0.46a (0.26 to 0.81) |
VEN + LDAC | 1.42a (1.01 to 1.99) | 0.81 (0.50 to 1.31) | 1.23 (0.80 to 1.86) | 2.19a (1.23 to 3.85) | — |
AZA = azacitidine; BSC = best supportive care; HR = hazard ratio; ITC = indirect treatment comparison; LDAC = low-dose cytarabine; OS = overall survival; VEN-AZA = venetoclax plus azacitidine; VEN-LDAC = venetoclax plus low-dose cytarabine.
Note: Comparisons should be read as HR for the treatment specified in the column vs. that specified in the row. A HR < 1 favours the treatment specified in the column.
aThe 95% credible interval does not contain 1.
Source: ITC report.20
Complete Remission Plus Complete Remission With Incomplete Blood Count Recovery: Table 23 shows the results of the NMA for OS. VEN-LDAC was favoured over comparators LDAC (OR = 6.24; 95% credible interval, 2.98 to 14.42), AZA (OR = 5.84; 95% credible interval, 2.38 to 15.22), and BSC (OR = 73.35; 95% credible interval, 8.05 to 2,370.88), with no treatment favoured between VEN-LDAC and VEN-AZA (OR = 1.16; 95% credible interval, 0.43 to 3.33).
Table 23: Pairwise Treatment Comparisons for CR + CRi
OR (95% credible interval) | LDAC | VEN + AZA | AZA | BSC | VEN + LDAC |
|---|---|---|---|---|---|
LDAC | — | 5.42a (2.80 to 10.50) | 1.07 (0.64 to 1.78) | 0.09a (0.00 to 0.68) | 6.24a (2.98 to 14.42) |
VEN + AZ | 0.18a (0.10 to 0.36) | — | 0.20a (0.13 to 0.30) | 0.02a (0.00 to 0.12) | 1.16 (0.43 to 3.33) |
AZA | 0.94 (0.56 to 1.56) | 5.05a (3.30 to 7.87) | — | 0.08a (0.00 to 0.59) | 5.84a (2.39 to 15.22) |
BSC | 11.38a (1.47 to 344.71) | 61.55a (8.23 to 1,881.53) | 12.07a (1.70 to 356.61) | — | 73.35a (8.05 to 2,370.88) |
VEN + LDAC | 0.16a (0.07 to 0.34) | 0.86 (0.30 to 2.35) | 0.17a (0.07 to 0.42) | 0.01a (0.00 to 0.12) | — |
AZA = azacitidine; BSC = best supportive care; CR = complete remission; CRi = complete remission with incomplete blood count recovery; ITC = indirect treatment comparison; LDAC = low-dose cytarabine; OR = odds ratio; OS = overall survival; VEN-AZA = venetoclax plus azacitidine; VEN-LDAC = venetoclax plus low-dose cytarabine.
Note: Comparisons should be read as OR for the treatment specified in the column vs. that specified in the row. An OR < 1 favours the treatment specified in the row.
aThe 95% credible interval does not contain 1.
Source: ITC report.20
Critical Appraisal of the ITC
The key limitations of the NMA include the small size and structure of the network (which had no closed loops), potential sources of heterogeneity across the trials related to differences in study design and patient characteristics. These limitations resulted in imprecise estimates and the potential for bias.
Critical Appraisal of the Systematic Review
The NMA was based on an systematic literature review that identified studies according to pre-specified inclusion criteria. These included a broad selection of comparators and outcomes. The literature search was last conducted in October 2000 and appeared comprehensive in terms of the databases searched and the search strategy. Two sets of selection criteria were applied: an initial broader set of criteria and, at the full-text review step, a narrowed set of criteria intended to create a high-quality dataset for meta-analysis. The selection of comparators was not justified, but those meaningful to the Canadian context were included. Lists of studies excluded at the full-text state for both sets of criteria were provided. Screening and selection were done by 2 independent reviewers, with a third reviewer involved to reconcile differences. Data extraction was also completed by 2 independent reviewers. Data were extracted to pre-designed data sheets, with any differences reconciled by a third reviewer.
Critical Appraisal of the NMA
Studies included in the NMA were selected from those identified by the systematic literature review. The criteria for inclusion were provided and are consistent with the objective. The eligible interventions were restricted further to those used in Canada for the treatment of the population of interest, which was defined as treatment-naive adult patients with AML who are ineligible for intensive chemotherapy. Only clinical efficacy outcomes were pre-specified for the NMA. Available data limited the end points further to OS and CR + CRi for the NMA. Patient-reported quality of life and safety end points were not represented.
Heterogeneity in study and patient baseline characteristics were reported and reviewed by the authors as part of the assessment of feasibility for the meta-analysis. Baseline differences were noted in the prognostic variables and in the potential treatment-effect modifiers of blast count at baseline, prior treatment with HMAs, and cytogenetic risk. The proportion of patients with 50% or greater bone marrow blasts at baseline ranged from 0% (AZA-001 trial) to 100% (AZA-AML-001) in the network for OS and from 70.8% (VIALE-A) to 100% (AZA-AML-001) in the network for CR + CRi. Patients with prior HMA treatment were excluded from the VIALE-A, AZA-001, and AZA-AML-001 studies, but not from VIALE-C, in which 19.9% were treated with HMAs. This might represent a group more refractory to treatment with AZA, affecting both OS and CR + CRi end points. Patients with poor cytogenetic risk were more represented in the AZA arm of the VIALE-A trial compared with the AZA arm of the AZA-001 trial (39% versus 26%). This difference potentially affects the NMA network for OS. The median length of study follow-up ranged from 17.5 months (VIALE-C) to 24 months (AZA-AML-001). The variability was unlikely to affect CR + CRi, as response tended to occur early, but it may affect OS because patients may be censored before OS events in studies with short follow-up times.
Four studies formed a mainly linear connected network for OS, with 3 studies for CR + CRi. The end point of CR + CRi was not reported for AZA-001. There were no closed loops in either network, meaning that inconsistency within the networks could not be statistically assessed. The dose and duration for AZA and the dose (but not duration) for LDAC was the same across trials; BSC included the same constituents, limiting heterogeneity in dosing. In studies AZA-001 and AZA-AML-001, patients were pre-selected for the comparator therapy. As a result, the comparison of AZA against LDAC was made in patients pre-selected for LDAC, while the comparison of AZA against BSC was made in patients pre-selected for BSC. These were treated as 2 separate contrasts, not a 3-armed trial.
A standard Bayesian generalized linear model was used for the meta-analysis, and the diagnostics and model selection were sufficiently described. The reviewers checked the proportional hazards assumption for OS for the contributing plots using log-log plots. The risk of violation of the proportional hazards assumption was low for the VIALE-A and VIALE-C trials and low to moderate for the AZA-AML-001 trial, in which the survival curves were largely overlapping and intermittently crossing. The model in the NMA assumed constant hazards, which was an appropriate choice, given the low to moderate risk of violation of the proportional hazards assumption and the small number of studies available.
The networks for all analyses were small. Thus, the decision was made a priori to limit the analysis to fixed-effects models. This entailed the assumption that between-study heterogeneity was 0, which was unlikely to be the case. The small number of studies led to imprecise estimates, with the risk of not detecting a difference. In the analysis of CR + CRi, low response counts (including 0, requiring a 0-cell adjustment) led to highly uncertain estimates with wide credible intervals. The small number of studies meant there was no opportunity to use statistical methods (such as meta-regression) to adjust for variability in baseline treatment-effect modifiers and correct for potential bias. Finally, non-informative prior distributions were used in the models, as is usual practice, under the assumption that the final estimates will reflect only the data. However, with a low information dataset, the prior may add to the imprecision. Consideration of alternative priors was mentioned, but not detailed.
Summary
Seven trials met the systematic review inclusion criteria. With the additional restriction of the comparators for the NMA inclusion criteria, removing decitabine from the comparators, 4 trials were included in the ITC. Data were available for OS for 4 trials in a connected network and for CR + CRi for 3 trials.
For OS, VEN-LDAC was favoured over LDAC and BSC, with no treatment favoured between VEN-LDAC and AZA or VEN-LDAC and VEN-AZA. For CR + CRi, VEN-LDAC was favoured over LDAC, AZA, and BSC, with treatment favoured between VEN-LDAC and VEN-AZA.
The systematic review was well conducted and documented. The NMA used appropriate methods to model survival, having assessed the risk of violation of the proportional hazards assumption. There was clinical heterogeneity in important prognostic indicators and potential treatment-effect modifiers of blast count at baseline, prior treatment of HMAs, and cytogenetic risk. Because the network was sparse, fixed-effects models had to be used, and there was no opportunity for baseline covariate adjustments. Due to the aforementioned limitations, the comparative efficacy estimates may be biased, and it is not possible to quantify or identify the direction of the bias. Results of the ITC must be interpreted with caution.
Discussion
Summary of Available Evidence
One multinational, sponsor-funded, double-blind RCT met the selection criteria for this review. The VIALE-C trial compared VEN-LDAC to PLA-LDAC in a population of patients who were not considered eligible for intensive induction chemotherapy. VIALE-C was an event-driven study, and the final analysis occurred once 133 deaths had occurred, corresponding to a median follow-up of 12 months. The primary outcome of the trial was OS. A hierarchical testing strategy was employed to control for multiplicity. Secondary outcomes included CR + CRi rate, CR + CRh rate, EFS, and transfusion independence. Patient-reported outcomes, such as fatigue and HRQoL, were also assessed. Due to failure of the statistical hierarchy at the level of the primary outcome, the statistical significance of the secondary outcomes remains inconclusive. The majority of patients in the study were male (55.5%) and White (70.6%); the median age was 76 years (range = 36 to 93). The majority of patients had de novo AML (61.6%), while the remainder had secondary AML. The majority (65.2%) had intermediate cytogenetic risk, and most of the remainder (32.8%) had poor cytogenetic risk. The majority of patients were considered ineligible for intensive chemotherapy based on age (≥ 75 years), followed by ECOG Performance Status in patients 18 years to 74 years of age.
The results of an ITC were also reviewed. Seven trials met the inclusion criteria for the systematic review, and 4 were included in an NMA. The NMA included VEN-LDAC, VEN-AZA, and their individual components, as well as BSC. No additional studies were found that were considered relevant to the population of interest in this review.
Interpretation of Results
Efficacy
The VIALE-C trial demonstrated a median OS of 7.2 months in the VEN-LDAC group and 4.1 months in the PLA-LDAC group at the final analysis data cut-off date that was based on a median follow-up of 12 months. The between-group difference was associated with a 25% reduction in hazard (HR = 0.75; 95% CI, 0.52 to 1.07), which was confirmed by a 30% reduction in hazard (8.4 months versus 4.1 months) by a post hoc analysis performed 6 months after the final analysis data cut-off date. Health Canada–approved the drug combination based on the “totality of evidence,” which included the consistent improvement in all other disease-specific and clinically important outcomes, such as CR + CRi rate, DOR, and transfusion independence.
The observed treatment effect was based on the administration of VEN with a 4-day ramp-up and 600 mg on day 4 of cycle 1 and beyond, along with treatment interruption or reduction. The treatment effect was nearly depleted after 12 months of follow-up, when the majority of patients had died. The add-on treatment extended median OS for 3 to 4 months in a difficult-to-treat AML patient population. The analysis of OS in patient subgroups suggested heterogeneity across some subgroups; however, interpretation of these results is limited by small sample sizes, lack of statistical comparison, and wide CIs around point estimates.
Overall, as an add-on combination therapy when comparing to LDAC alone, VEN-LDAC demonstrated a clinically significant improvement in all the relevant outcome measures except for patient-reported outcomes, such as fatigue and HRQoL, for which there is high uncertainty due to poor data quality. For example, CR was achieved in 27% of patients in the VEN-LDAC group and in 7% of patients in the PLA-LDAC group (a difference of 20% between groups), and CR + CRi was achieved in 48% versus 13% of patients (a difference of 35%), respectively. Transfusion independence (RBC and platelets) was achieved by 37% of patients in the VEN-LDAC group and by 16% of patients in the PLA-LDAC group (a difference of 21% between groups). It is clear from clinician input that transfusion independence is an important outcome for the population that falls under the indication because these are elderly patients who are often frail and find it difficult to get to transfusion centres. The importance of achieving transfusion independence is supported by patient input submitted to CADTH.
Patient-reported outcomes were also assessed. However, as previously noted, there was a significant amount of missing data due to a large number of deaths occurring in the study and the potential of unblinding due to patients’ or investigators’ awareness of treatment assignment as a result of treatment-related AEs, such as gastrointestinal events, neutropenia, blood disorders, and infections, which combined prevented the evaluation of the impact of VEN-LDAC on HRQoL and symptoms. This is an important limitation, given the importance that patients placed on symptoms — most notably fatigue — in the input they provided to CADTH.
Although the most appropriate comparator for VEN-LDAC is likely PLA-LDAC, AZA was also included as a potential comparator in the protocol for this systematic review because some patients may use an HMA as an alternative to VEN-LDAC. In the sponsor-submitted NMA, there was no difference in OS between VEN-LDAC and AZA, or between VEN-LDAC and VEN-AZA because the 95% credible interval included the null value of 1. With respect to CR + CRi rates, VEN-LDAC was favoured over LDAC, AZA, and BSC because the 95% credible interval included the null value, and there was no significant difference between VEN-LDAC and VEN-AZA. Therefore, both VEN-LDAC and VEN-AZA appear to demonstrate benefit over BSC, AZA, and LDAC with respect to CR + CRi rates. The clinical experts consulted by CADTH, as well as the clinician groups, were all clearly of the opinion that VEN-AZA, or VEN-LDAC in patients who have prior HMA use, will become the new standard of care for this indication. The ITC results may support this assertion; however, as noted earlier in this clinical review, there are limitations that should be considered when interpreting results from the NMA. Additionally, there is no comparative evidence of VEN-LDAC versus intensive induction chemotherapy, which may be an option for some patients.
Harms
Neutropenia was the most common adverse effect of VEN-LDAC therapy, and it occurred numerically more frequently with VEN-LDAC than with PLA-LDAC. All of the events of neutropenia were grade 3 or higher, occurring in 48.6% of patients in the VEN-LDAC group and in 17.6% of patients in the PLA-LDAC group. Thrombocytopenia was the next most common AE; however, there was no clear numerical difference between groups: it occurred in 45.8% of patients treated with VEN-LDAC and in 39.7% of patients treated with PLA-LDAC. Gastrointestinal AEs, most notably nausea, vomiting, and diarrhea, were also more frequent in the VEN-LDAC group than in the PLA-LDAC group. In their input to CADTH, patients expressed concern about nausea and vomiting associated with prior treatments; thus, this adverse effect may be of particular concern for some patients.
The product monograph for VEN contains black-box warnings for TLS and serious infections. TLS is a serious adverse effect seen in hematologic malignancies and is due to the release of the contents of lysed cells. The release of these cellular contents, which include electrolytes like phosphorous and potassium, as well as cytokines, can lead to significant electrolyte imbalances and metabolic issues, which can ultimately be fatal. TLS was reported in 5.6% of patients in the VEN-LDAC group and in none in the PLA-LDAC group; SAEs were reported in 1.4% of patients treated with VEN-LDAC and in none with PLA-LDAC. The product monograph recommends a 3-day dose ramp-up for VEN when combined with LDAC and regular blood chemistry monitoring on each ramp-up, as well as prophylactic hydration and anti-hyperuricemics as a means of preventing and reducing harm from TLS when it does occur. The product monograph also recommends avoiding concomitant use of strong cytochrome P450 (family 3, subfamily A) inhibitors, as VEN is a substrate for this isozyme.
There was no clear numerical difference between VEN-LDAC and PLA-LDAC when it came to overall infections and infestations, which occurred in 64.8% versus 60.3% of patients, respectively. The only serious infection that occurred numerically more frequently in the VEN-LDAC group was pneumonia, which was reported in 4.9% of patients treated with VEN-LDAC and in none with placebo. The product monograph recommends that patients treated with VEN be monitored for the development of fever and other signs of infection, and have CBCs taken on a regular basis.
Other notable harms included the development of a second primary malignancy and hemorrhage. Hemorrhage is noted as a cause of some fatal AEs in the product monograph, which cites data from both the trial that combined VEN-LDAC and the trial that combined VEN-AZA.
Conclusions
One multinational, sponsor-funded, double-blind, placebo-controlled RCT was included in this review. The VIALE-C trial evaluated the treatment effect of combination therapy VEN-LDAC compared to LDAC alone in patients with AML who were ineligible to receive intensive induction chemotherapy. Although results for the primary outcome, OS, were not statistically significant, there were consistent improvements in secondary outcomes (e.g., EFS, CR + CRi rate, CR + CRh rate, and transfusion independence) in favour of VEN-LDAC versus LDAC alone. HRQoL and symptoms (fatigue) are deemed important outcomes by patients; however, analyses of these factors were confounded by the large amount of attrition that occurred in both treatment groups and the early failure of the statistical testing hierarchy of outcomes. The treatment effects of VEN-LDAC and VEN-AZA may be comparable; however, comparative efficacy was based on a small ITC with limitations, and only OS and CR + CRi were assessed. It remains uncertain whether VEN-LDAC is better than AZA alone because the ITC failed to show consistent results based on OS and CR + CRi. Neutropenia was the most common AE associated with the use of VEN-LDAC. Although there was no clear indication of more infections, there were numerically more cases of pneumonia among patients in the VEN-LDAC group compared with those in the LDAC alone group.
References
1.Canadian Cancer Society. Acute myelogenous leukemia (AML). 2021; www.cancer.ca, 2021.
2.Center for Drug Evaluation R. Medical review(s). Brand Name (Generic) administration. Company: Manufacturer. Application No.:XXXXX. Approval date: MM/DD/YYYY (FDA approval package). Silver Spring (MD): U.S. Food and Drug Administration (FDA); 1800: URL. Accessed 1800 Jan 01.
3.Clinical Study Report: M16-043. A randomized, double-blind, placebo controlled phase 3 study of venetoclax co-administered with low dose cytarabine versus low dose cytarabine in treatment-naive patients with acute myeloid leukemia who are ineligible for intensive chemotherapy [internal sponsor's report]. North Chicago (IL): AbbVie; 2020 Mar 20.
4.Abdallah M, Xie Z, Ready A, Manogna D, Mendler JH, Loh KP. Management of Acute Myeloid Leukemia (AML) in Older Patients. Curr Oncol Rep. 2020;22(10):103. PubMed
5.Venclexta (venetoclax): 10 mg, 50 mg, and 100 mg tablets [product monograph]. St-Laurent (QC): AbbVie Corporation; 2020 Dec 3.
6.Canadian Pharmacists Association. electronic Compendium of Pharmaceuticals and Specialties (eCPS). 2021.
7.Stahl M, Menghrajani K, Derkach A, et al. Clinical Outcomes of Acute Myeloid Leukemia Patients Bridged to Allogeneic Stem Cell Transplant By Venetoclax Combination Therapy. Blood. 2020;136(Supplement 1):16-17.
8.McGowan J, Sampson M, Salzwedel DM, Cogo E, Foerster V, Lefebvre C. PRESS Peer Review of Electronic Search Strategies: 2015 guideline statement. J Clin Epidemiol. 2016;75:40-46. PubMed
9.Grey matters: a practical tool for searching health-related grey literature. Ottawa (ON): CADTH; 2019: https://www.cadth.ca/grey-matters. Accessed 2021 Feb 11.
10.Wei AH, Montesinos P, Ivanov V, et al. Venetoclax plus LDAC for newly diagnosed AML ineligible for intensive chemotherapy: a phase 3 randomized placebo-controlled trial. Blood. 2020;135(24):2137-2145. PubMed
11.Clinical Study Report [interim]: study M15-656. A randomized, double-blind, placebo controlled phase 3 study of venetoclax in combination with azacitidine versus azacitidine in treatment naive subjects with acute myeloid leukemia who are ineligible for standard induction therapy [internal sponsor's report]. North Chicago (IL): AbbVie; 2020 May 8.
12.Health Canada reviewer's report: Venetoclax (Venclexta) [internal sponsor's report]. Ottawa (ON): AbbVie; 2020.
13.Center for Drug Evaluation Research. Medical review(s). Venclexta (venetoclax) administration. Company: AbbVie Inc. Application No.: 208573. Approval date: 10/16/2020 (FDA approval package). Silver Spring (MD): U.S. Food and Drug Administration (FDA); 2020: URL. Accessed 2021 May 14.
14.Center for Drug Evaluation R. Statistical review(s). Venclexta (Venetoclax) administration. Company: AbbVie Inc. Application No.:208573Orig1s020, s021. Approval date: 10/16/2020 (FDA approval package). Silver Spring (MD): U.S. Food and Drug Administration (FDA); 2020: URL. Accessed 1800 Jan 01.
15.Drug Reimbursement Review sponsor submission: Venclexta (venetoclax) in combination with low-dose cytarabine for the treatment of acute myeloid leukemia (AML), 10 mg, 50 mg, and 100 mg tablets [internal sponsor's package]. Pointe-Claire (QC): AbbVie Corporation; 2021 Jan 22.
16.AbbVie Corporation response to April 6, 2021 DRR request for additional information regarding Venclexta (venetoclax) DRR review: compliance for PRO instruments [internal additional sponsor's information]. Pointe-Claire (QC): AbbVie Corporation; 2021 Apr 20.
17.Center for Drug Evaluation and Research FaDA. Acute Myeloid Leukemia: Developing Drugs and Biological Products for Treatment Guidance for Industry. 2020.
18.Estey E, Othus M, Lee SJ, Appelbaum FR, Gale RP. New drug approvals in acute myeloid leukemia: what's the best end point? Leukemia. 2016;30(3):521-525. PubMed
19.Clinical Group. Clinical Efficacy and Safety of Treatments in Naive Acute Myeloid Leukemia Patients who are Ineligible for Intensive Chemotherapy: A Systematic Literature Review. 2021.
20.Analysis Group. Study Report: Indirect Comparisons of Venetoclax Combinations and Other Treatments in Treatment Naive Patients with Acute Myeloid Leukemia (AML) who are Ineligible for Induction Chemotherapy. 2021.
21.Braun DP, Gupta D, Grutsch JF, Staren ED. Can changes in health related quality of life scores predict survival in stages III and IV colorectal cancer? Health Qual Life Outcomes. 2011;9:62. PubMed
22.Osoba D, Rodrigues G, Myles J, Zee B, Pater J. Interpreting the significance of changes in health-related quality-of-life scores. J Clin Oncol. 1998;16(1):139-144. PubMed
23.Snyder CF, Blackford AL, Sussman J, et al. Identifying changes in scores on the EORTC-QLQ-C30 representing a change in patients' supportive care needs. Qual Life Res. 2015;24(5):1207-1216. PubMed
24.DiNardo CD, Jonas BA, Pullarkat V, et al. Azacitidine and venetoclax in previously untreated acute myeloid leukemia. N Engl J Med. 2020;383(7):617-629. PubMed
25.Ameringer S, Elswick Jr RK, Menzies V, et al. Psychometric evaluation of the PROMIS Fatigue-short form across diverse populations. Nurs Res. 2016;65(4):279. PubMed
26.Giesinger JM, Kieffer JM, Fayers PM, et al. Replication and validation of higher order models demonstrated that a summary score for the EORTC QLQ-C30 is robust. J Clin Epidemiol. 2016;69:79-88. PubMed
27.EQRTC. EORTC Quality of life: FAQs. 2021; https://qol.eortc.org/faq/. Accessed 2021 Mar 19.
28.EORTC QLC-C30 scoring manual. Brussels (BE): EORTC; 2001: https://www.eortc.org/app/uploads/sites/2/2018/02/SCmanual.pdf. Accessed 2021 Mar 19.
29.Davda J, Kibet H, Achieng E, Atundo L, Komen T. Assessing the acceptability, reliability, and validity of the EORTC Quality of Life Questionnaire (QLQ-C30) in Kenyan cancer patients: a cross-sectional study. Journal of Patientreported Outcomes. 2021;5(1):4. PubMed
30.Luo N, Fones CS, Lim SE, Xie F, Thumboo J, Li SC. The European Organization for Research and Treatment of Cancer Quality of Life Questionnaire (EORTC QLQ-c30): validation of English version in Singapore. Qual Life Res. 2005;14(4):1181-1186. PubMed
31.Bedard G, Zeng L, Zhang L, et al. Minimal important differences in the EORTC QLQ-C30 in patients with advanced cancer. Asia Pac J Clin Oncol. 2014;10(2):109-117. PubMed
Appendix 1: Literature Search Strategy
Clinical Literature Search
Overview
Interface: Ovid
Databases:
MEDLINE All (1946–present)
Embase (1974–present)
Note: Subject headings and search fields have been customized for each database. Duplicates between databases were removed in Ovid.
Date of search: February 11, 2021
Alerts: Weekly search updates until project completion
Study types: No filters were applied to limit the retrieval by study type
Limits:
Publication date limit: none
Language limit: none
Conference abstracts: excluded
Syntax | Description |
|---|---|
/ | At the end of a phrase, searches the phrase as a subject heading |
MeSH | Medical Subject Heading |
exp | Explode a subject heading |
* | Before a word, indicates that the marked subject heading is a primary topic; or, after a word, a truncation symbol (wildcard) to retrieve plurals or varying endings |
# | Truncation symbol for 1 character |
adj# | Requires terms to be adjacent to each other within # number of words (in any order) |
.ti | Title |
.ot | Original title |
.ab | Abstract |
.hw | Heading word; usually includes subject headings and controlled vocabulary |
.kf | Author keyword heading word (MEDLINE) |
.kw | Author keyword (Embase) |
.dq | Candidate term word (Embase) |
.pt | Publication type |
.rn | Registry number |
.nm | Name of substance word (MEDLINE) |
medall | Ovid database code: MEDLINE All, 1946 to present, updated daily |
oemezd | Ovid database code; Embase, 1974 to present, updated daily |
Multi-Database Strategy
(venetoclax* or Venclexta* or Venclyxto* or ABT199 or ABT-199 or GDC0199 or GDC-0199 or RG7601 or RG-7601 or N54AIC43PW).ti,ab,kf,ot,hw,nm,rn.
exp Leukemia, Myeloid, Acute/
(AML or ANLL).ti,ab,kf.
(Acute adj5 (granulocytic* or myeloblastic* or myelocytic* or myelogenous* or myeloid* or nonlymphoblastic* or non-lymphoblastic* or nonlymphocytic* or non-lymphocytic* or basophilic* or eosinophilic* or erythroblastic* or megakaryoblastic* or monocytic* or megakaryocytic* or myelomonocytic*) adj5 (leukemia* or leukemia*)).ti,ab,kf.
(erythroleukemia* or erythroleukemia*).ti,ab,kf.
((mast-cell or promyelocytic*) adj3 (leukemia* or leukemia*)).ti,ab,kf.
or/2 to 6
1 and 7
8 use medall
*venetoclax/ or (venetoclax* or Venclexta* or Venclyxto* or ABT199 or ABT-199 or GDC0199 or GDC-0199 or RG7601 or RG-7601).ti,ab,kw,dq.
exp Acute myeloid leukemia/
(AML or ANLL).ti,ab,kw,dq.
(Acute adj5 (granulocytic* or myeloblastic* or myelocytic* or myelogenous* or myeloid* or nonlymphoblastic* or non-lymphoblastic* or nonlymphocytic* or non-lymphocytic* or basophilic* or eosinophilic* or erythroblastic* or megakaryoblastic* or monocytic* or megakaryocytic* or myelomonocytic*) adj5 (leukemia* or leukemia*)).ti,ab,kw,dq.
(erythroleukemia* or erythroleukemia*).ti,ab,kw,dq.
((mast-cell or promyelocytic*) adj3 (leukemia* or leukemia*)).ti,ab,kw,dq.
or/11 to 15
10 and 16
17 use oemezd
18 not (conference review or conference abstract).pt.
9 or 19
remove duplicates from 20
Clinical Trials Registries
ClinicalTrials.gov
Produced by the US National Library of Medicine. Targeted search used to capture registered clinical trials.
[Search terms: Venclexta (venetoclax), acute myeloid leukemia]
WHO ICTRP
International Clinical Trials Registry Platform, produced by the WHO. Targeted search used to capture registered clinical trials.
[Search terms: Venclexta (venetoclax), acute myeloid leukemia]
Health Canada’s Clinical Trials Database
Produced by Health Canada. Targeted search used to capture registered clinical trials.
[Search terms: Venclexta (venetoclax), acute myeloid leukemia]
EU Clinical Trials Register
European Union Clinical Trials Register, produced by the European Union. Targeted search used to capture registered clinical trials.
[Search terms: Venclexta (venetoclax), acute myeloid leukemia]
Grey Literature
Search dates: February 8 to 22, 2021
Keywords: Venclexta (venetoclax), acute myeloid leukemia
Limits: Publication years: none
Updated: Search updated before the completion of stakeholder feedback period
Relevant websites from the following sections of the CADTH grey literature checklist Grey Matters: A Practical Tool For Searching Health-Related Grey Literature were searched:
Health Technology Assessment Agencies
Health Economics
Clinical Practice Guidelines
Drug and Device Regulatory Approvals
Advisories and Warnings
Drug Class Reviews
Clinical Trials Registries
Databases (free)
Internet Search
Open Access Journals
Appendix 2: Excluded Studies
Note that this appendix has not been copy-edited.
Reference | Reason for exclusion |
|---|---|
Diao 2020 | Study design |
Maiti 2021 | Study design |
Tremblay 2020 | Study design |
Wang 2020 | Study design |
Wei 2019 | Study design |
Esparaza 2020 | Study design |
Appendix 3: Detailed Outcome Data
Note that this appendix has not been copy-edited.
Table 26: Subgroup Analyses (Final Analysis)
Subgroups | VEN-LDAC N = 143 | PLA-LDAC N = 68 |
|---|---|---|
Overall survival | ||
By age group | ||
Age ≥ 75 years | 52/82 (63.4) | 30/40 (75.0) |
HR [95% CI] | 0.691 [0.440, 1.085] | |
Age 18 - < 75 years | 34/61 (55.7) | 17/28 (60.7) |
HR [95% CI] | 0.850 [0.474, 1.524] | |
Baseline ECOG PS | ||
Grade < 2 | 43/74 (58.1) | 20/34 (58.8) |
HR [95% CI] | 0.952 [0.559, 1.619] | |
Grade ≥ 2 | 43/69 (62.3) | 27/34 (79.4) |
HR [95% CI] | 0.584 [0.360, 0.948] | |
Cytogenetic risk | ||
Favourable | 1/1 (100) | 2/3 (66.7) |
HR [95% CI] | NA | |
Intermediate | 46/90 (51.1) | 29/43 (67.4) |
HR [95% CI] | 0.627 [0.393, 1.000] | |
Poor | 35/47 (74.5) | 15/20 (75.0) |
HR [95% CI] | 1.039 [0.566, 1.906] | |
Molecular marker | ||
FLT3 | 12/20 (60.0) | 6/9 (66.7) |
Median, months [95% CI] | 5.9 [1.6,10.9] | 9.8 [0.9, NE] |
HR [95% CI] | 1.113 [0.415, 2.986] | |
IDH1/2 | 11/21 (52.4) | 9/12 (75.0) |
Median, months [95% CI] | 10.8 [4.2, NE] | 9.0 [2.2, NE] |
HR [95% CI] | 0.724 [0.299, 1.751] | |
TP53 | 20/22 (90.9) | 9/9 (100.0) |
Median, months [95% CI] | 2.9 [2.1, 3.6] | 2.2 [0.6, 3.6] |
HR [95% CI] | 0.551 [0.242, 1.254] | |
NPM1 | 6/18 (33.3) | 5/7 (71.4) |
Median, months [95% CI] | NE [8.4, NE] | 9.8 [0.2, NE] |
HR [95% CI] | 0.458 [0.139, 1.507] | |
Bone marrow blasts | ||
Bone marrow blast count (< 30%) | 26/42 (61.9) | 12/18 (66.7) |
HR [95% CI] | 0.740 [0.370, 1.481] | |
30% to < 50% | 23/36 (63.9) | 17/22 (77.3) |
HR [95% CI] | 0.595 [0.316, 1.118] | |
≥ 50% | 37/65 (56.9) | 18/28 (64.3) |
HR [95% CI] | 0.840 [0.478, 1.475] | |
AML status | ||
De novo | 46/85 (54.1) | 29/45 (64.4) |
HR [95% CI] | 0.736 [0.462, 1.171] | |
Secondary | 40/58 (69.0) | 18/23 (78.3) |
HR [95% CI] | 0.708 [0.403, 1.243] | |
Type of secondary AML | ||
Therapy related to AML | 2/6 (33.3) | 4/4 (100.0) |
HR [95% CI] | 0.246 [0.044, 1.380] | |
Post-MDS/CMML | 38/52 (73.1) | 14/19 (73.7) |
HR [95% CI] | 0.844 [0.455, 1.566] | |
Prior HMA for MDS | ||
Yes | 20/28 (71.4) | 11/14 (78.6) |
HR [95% CI] | 0.816 [0.390, 1.708] | |
No | 66/115 (57.4) | 36/54 (66.7) |
HR [95% CI] | 0.731 [0.487, 1.098] | |
AML = acute myeloid leukemia; CI = confidence interval; CMML = chronic myelomonocytic leukemia; CTC = common terminology criteria; ECOG PS = Eastern Cooperative Oncology Group Performance Status; EDC = electronic data capture; FEV1 = forced expiratory volume in 1 second; FLT-3 = FMS-like tyrosine kinase-3; HR = hazard ratio; IDH = isocitrate dehydrogenase; MDS = myelodysplastic syndrome; SD = standard deviation; NPM-1 = nucleophosmin-1
Source: Clinical Study Report for VIALE-C.3
Table 27: Health-Related Quality of Life and Fatigue Symptom Scales
Characteristic | VEN-LDAC N = 143 | PLA-LDAC N = 68 | VEN-LDAC N = 143 | PLA-LDAC N = 68 |
|---|---|---|---|---|
QLQ-C30 GHS/QoL | ||||
Mean (SD) baseline | 56.96 N = 127 | 54.52 N = 59 | — | — |
LSM (SE) change, baseline to cycle 3 day 1 | 4.857 (2.413) N = 69 | 1.941 (4.126) N = 22 | 5.655 (2.427) N = 69 | 2.838 (4.192) N = 22 |
LSM difference between groups [95% CI] | 2.917 [–6.23, 12.06] | 2.817 [–6.46, 12.09] | ||
LSM (SE) change, baseline to cycle 5 day 1 | 16.015 (2.853) N = 40 | 2.627 (5.047) N = 12 | 14.841 (2.761) | 5.724 (4.982) |
LSM difference between groups [95% CI] | 13.388 [2.18, 24.59] | 9.117 [–1.86, 20.09] | ||
LSM (SE) change, baseline to cycle 7 day 1 | 10.599 (3.092) N = 36 | 3.110 (5.337) N = 12 | 9.783 (2.929) | 5.913 (5.235) |
LSM difference between groups [95% CI] | 7.119 [–4.83, 19.06] | 3.869 (–7.69, 15.43) | ||
LSM (SE) change, baseline to cycle 9 day 1 | 3.110 (3.772) N = 22 | 6.918 (6.642) N = 7 | 15.291 (3.447) | 8.837 (6.356) |
LSM difference between groups [95% CI] | 6.381 (–8.49, 21.26) | 6.454 (–7.58, 20.49) | ||
QLQ-C30 APPETITE LOSS | ||||
Mean (SD) baseline | 32.28 N = 127 | 27.68 N = 59 | — | — |
LSM (SE) change, baseline to cycle 3 day 1 | 0.062 (3.298) N = 69 | −6.042 (5.614) N = 22 | −1.330 (3.249) | −7.214 (5.589) |
LSM difference between groups [95% CI] | 6.104 [-6.43, 18.64] | 5.884 (−6.55, 18.32)] | ||
LSM (SE) change, baseline to cycle 5 day 1 | −9.120 (4.045) N = 40 | −4.776 (7.129) N = 12 | −10.001 (3.789) | −4.986 (6.803) |
LSM difference between groups [95% CI] | −4.343 [-20.24, 11.56] | −5.015 (−20.05, 10.02) | ||
LSM (SE) change, baseline to cycle 7 day 1 | −6.853 (5.053) N = 36 | −4.095 (7.145) N = 12 | −8.078 (3.847) | −6.148 (6.808) |
LSM difference between groups [95% CI] | −5.853 [-21.90, 10.19] | −1.931 (−17.00, 13.14) | ||
LSM (SE) change, baseline to cycle 9 day 1 | −9.948 (4.184) N = 22 | −17.142 (8.853) N = 7 | −6.891 (4.504) | −18.055 (8.149) |
LSM difference between groups [95% CI] | 10.289 [-9.58, 30.16] | — | — | |
QLQ-C30 cognitive functioning | ||||
Mean (SD) baseline | 80.97 N = 127 | 76.27 N = 59 | — | — |
LSM (SE) change, baseline to cycle 3 day 1 | 0.697 (1.901) | 5.972 (3.240) | 1.442 (1.896) N = 69 | 6.361 (3.259) N = 22 |
LSM difference between groups [95% CI] | −5.275 (−12.48, 1.93) | −4.919 [-12.13, 2.30] | ||
LSM (SE) change, baseline to cycle 5 day 1 | 4.161 (2.356) N = 40 | 5.531 (4.180) N = 12 | 5.083 (2.224) N = 45 | 5.980 (4.006) N = 13 |
LSM difference between groups [95% CI] | −1.370 (−10.67, 7.93) | −0.897 (−9.73, 7.93) | ||
LSM (SE) change, baseline to cycle 7 day 1 | 2.271 (2.459) N = 36 | 1.447 (4.190) N = 12 | 2.398 (2.272) N = 43 | 2.431 (4.011) N = 13 |
LSM difference between groups [95% CI] | 0.824 (−8.59, 10.24) | −0.033 (−8.91, 8.84) | ||
LSM (SE) change, baseline to cycle 9 day 1 | 3.110 3.075 (2.993) N = 22 | 3.110 3.885 (5.252) N = 7 | 2.562 (2.670) N = 27 | 4.752 (4.832) N = 8 |
LSM difference between groups [95% CI] | −0.810 (−12.61, 10.99) | −2.189 (−12.90, 8.53) | ||
QLQ-C30 CONSTIPATION | ||||
Mean (SD) baseline | 17.06 N = 127 | 14.69 N = 59 | — | — |
LSM (SE) change, baseline to cycle 3 day 1 | 1.871 (2.708) N = 69 | −3.906 (4.635) N = 22 | 1.765 (2.694) | −3.915 (4.661) |
LSM difference between groups [95% CI] | 5.777 (−4.50, 16.06) | 5.679 (−4.63, 15.98) | ||
LSM (SE) change, baseline to cycle 5 day 1 | −1.538 (3.309) N = 40 | 16.150 (5.877) N = 12 | −2.313 (3.157) N = 45 | 16.734 (5.719) |
LSM difference between groups [95% CI] | −17.688 (−30.75, −4.63) | −19.047 (−31.64, −6.46) | ||
LSM (SE) change, baseline to cycle 7 day 1 | −5.412 (3.440) N = 36 | −6.524 (5.896) N = 12 | −4.408 (3.222) | −6.738 (5.726) |
LSM difference between groups [95% CI] | 1.112 (−12.11, 14.33) | 2.330 (−10.32, 14.98) | ||
LSM (SE) change, baseline to cycle 9 day 1 | −7.981 (4.145) N = 22 | −8.865 (7.263) N = 7 | −7.434 (3.790) | −8.943 (6.871) |
LSM difference between groups [95% CI] | 0.883 (−15.41, 17.18) | 1.509 (−13.72, 16.74) | ||
QLQ-C30 DIARRHEA | ||||
Mean (SD) baseline | 8.40 N = 127 | 8.47 N = 59 | — | — |
LSM (SE) change, baseline to cycle 3 day 1 | 2.975 (2.259) N = 69 | −1.134 (3.872) N = 22 | 2.657 (2.221) | −1.432 (3.841) |
LSM difference between groups [95% CI] | 4.109 (−4.46, 12.68) | 4.088 (−4.41, 12.58) | ||
LSM (SE) change, baseline to cycle 5 day 1 | −4.237 (2.682) N = 40 | 0.100 (4.729) N = 12 | −4.790 (2.595) N = 45 | 1.898 (4.683) |
LSM difference between groups [95% CI] | −4.336 (−14.84, 6.17) | −6.688 (−17.01, 3.64) | ||
LSM (SE) change, baseline to cycle 7 day 1 | −0.507 (2.771) N = 36 | 0.324 (4.740) N = 12 | −0.822 (2.645) | 0.303 (4.689) |
LSM difference between groups [95% CI] | −0.831 (−11.44, 9.78) | −1.125 (−11.50, 9.25) | ||
LSM (SE) change, baseline to cycle 9 day 1 | −7.876 (3.249) N = 22 | 3.110 7.117 (5.677) N = 7 | −7.036 (3.094) | 6.044 (5.612) |
LSM difference between groups [95% CI] | −14.993 (−27.71, −2.27) | 6.296 (−25.52, −0.64) | ||
QLQ-C30 DYSPNEA | ||||
Mean (SD) baseline | 30.18 N = 127 | 33.90 N = 59 | — | — |
LSM (SE) change, baseline to cycle 3 day 1 | −8.176 (3.120) N = 69 | −7.152 (5.346) N = 22 | −9.335 (3.131) | −8.050 (5.411) |
LSM difference between groups [95% CI] | −1.024 (−12.91, 10.86) | −1.284 (−13.26, 10.69) | ||
LSM (SE) change, baseline to cycle 5 day 1 | −13.237(3.923) N = 40 | −0.988 (7.001) N = 12 | −12.756 (3.715) N = 45 | 0.026 (6.735) |
LSM difference between groups [95% CI] | −12.249 (−27.84, 3.34) | −12.782 (−27.62, 2.06) | ||
LSM (SE) change, baseline to cycle 7 day 1 | −10.880 (4.104) N = 36 | −6.505 (7.015) N = 12 | −8.615 (3.798) | −7.759 (6.746) |
LSM difference between groups [95% CI] | −4.375 (−20.16, 11.41) | −0.856 (−15.78, 14.07) | ||
LSM (SE) change, baseline to cycle 9 day 1 | −14.090 (5.070) N = 22 | 4.047 (8.923) N = 7 | −12.475 (4.525) | 0.543 (8.226) |
LSM difference between groups [95% CI] | −18.137 (−38.20, 1.92) | −13.018 (−31.27, 5.23) | ||
QLQ-C30 EMOTIONAL FUNCTIONING | ||||
Mean (SD) baseline | 71.06 N = 127 | 71.33 N = 59 | — | — |
LSM (SE) change, baseline to cycle 3 day 1 | 3.110 9.861 (1.893) N = 69 | 5.387 (3.221) N = 22 | 10.623 (1.869) | 5.910 (3.214) |
LSM difference between groups [95% CI] | 4.474 (−2.70, 11.65) | 4.712 (−2.43, 11.85) | ||
LSM (SE) change, baseline to cycle 5 day 1 | 14.836 (2.336) N = 40 | 8.235 (4.135) N = 12 | 14.612 (2.204) N = 45 | 8.504 (3.982) |
LSM difference between groups [95% CI] | 6.601 (−2.62, 15.82) | 6.108 (−2.68, 14.90) | ||
LSM (SE) change, baseline to cycle 7 day 1 | 3.110 13.118 (2.435) N = 36 | 3.110 9.238 (4.149) N = 12 | 13.632 (2.252) | 9.194 (3.987) |
LSM difference between groups [95% CI] | 3.879 (−5.47, 13.23) | 4.438 (−4.40, 13.28) | ||
LSM (SE) change, baseline to cycle 9 day 1 | 3.110 13.859 (2.953) N = 22 | 6.938 (5.185) N = 7 | 15.001 (2.668) | 8.983 (4.843) |
LSM difference between groups [95% CI] | 6.921 (−4.74, 18.59) | 6.018 (−4.74, 16.77) | ||
QLQ-C30 FATIGUE | ||||
Mean (SD) baseline | 46.19 N = 127 | 45.01 N = 59 | — | — |
LSM (SE) change, baseline to cycle 3 day 1 | −6.136 (2.678) N = 69 | 0.032 (4.525) N = 22 | −7.635 (2.649) | −1.209 (4.541) |
LSM difference between groups [95% CI] | −6.169 (−16.22, 3.88) | −6.426 (−16.48, 3.63) | ||
LSM (SE) change, baseline to cycle 5 day 1 | −12.225 (3.208) N = 40 | 5.893 (5.655) N = 12 | −12.751 (3.047) N = 45 | 3.279 (5.476) |
LSM difference between groups [95% CI] | −18.118 (−30.68, −5.56) | −16.030 (−28.09, −3.98) | ||
LSM (SE) change, baseline to cycle 7 day 1 | −9.674 (3.326) N = 36 | −2.608 (5.669) N = 12 | −9.575 (3.110) | −4.451 (5.482) |
LSM difference between groups [95% CI] | −7.066 (−19.77, 5.64) | −5.123 (−17.24, 7.00) | ||
LSM (SE) change, baseline to cycle 9 day 1 | −10.235 (3.955) N = 22 | −1.513 (6.912) N = 7 | −11.418 (3.601) | −3.492 (6.494) |
LSM difference between groups [95% CI] | −8.722 (−24.22, 6.77) | −7.927 (−22.31, 6.46) | ||
QLQ-C30 FINANCIAL DIFFICULTIES | ||||
Mean (SD) baseline | 21.78 N = 127 | 25.99 N = 59 | — | — |
LSM (SE) change, baseline to cycle 3 day 1 | −3.176 (2.788) N = 69 | −5.578 (4.738) N = 22 | −3.079 (2.723) | −5.204 (4.672) |
LSM difference between groups [95% CI] | 2.402 (−8.12, 12.92) | 2.126 (−8.21, 12.46) | ||
LSM (SE) change, baseline to cycle 5 day 1 | −7.369 (3.325) N = 40 | −2.946 (5.843) N = 12 | −7.988 (3.115) N = 45 | −1.196 (5.561) |
LSM difference between groups [95% CI] | −4.424 (−17.42, 8.57) | −6.792 (−19.05, 5.46) | ||
LSM (SE) change, baseline to cycle 7 day 1 | −5.471 (3.438) N = 36 | −3.414 (5.860) N = 12 | −6.958 (3.161) | −2.411 (5.570) |
LSM difference between groups [95% CI] | −2.057 (−15.20, 11.09) | −4.547 (−16.85, 7.76) | ||
LSM (SE) change, baseline to cycle 9 day 1 | −6.376 (4.052) N = 22 | −7.680 (7.074) N = 7 | −6.072 (3.626) | −10.145 (6.528) |
LSM difference between groups [95% CI] | 1.304 (−14.57, 17.18) | 4.073 (−10.39, 18.53) | ||
QLQ-C30 INSOMNIA | ||||
Mean (SD) baseline | 29.40 N = 127 | 28.81 N = 59 | — | — |
LSM (SE) change, baseline to cycle 3 day 1 | −2.473 (3.156) N = 69 | 2.130 (5.401) N = 22 | −4.617 (3.149) | 0.544 (5.439) |
LSM difference between groups [95% CI] | −4.603 (−16.56, 7.35) | −5.161 (−17.19, 6.87) | ||
LSM (SE) change, baseline to cycle 5 day 1 | −8.168 (3.930) N = 40 | −4.559 (6.954) N = 12 | −9.763 (3.749) | −8.147 (6.777) |
LSM difference between groups [95% CI] | −3.609 (−19.10, 11.89) | −1.616 (−16.57, 13.34) | ||
LSM (SE) change, baseline to cycle 7 day 1 | −10.933 (4.096) N = 36 | 5.439 (6.971) N = 12 | −12.931 (3.833) | −0.459 (6.785) |
LSM difference between groups [95% CI] | −16.372 (−32.07, −0.68) | −12.472 (−27.52, 2.57) | ||
LSM (SE) change, baseline to cycle 9 day 1 | −15.515 (4.982) N = 22 | −9.472 (8.757) N = 7 | −18.087 (4.563) | −15.360 (8.298) |
LSM difference between groups [95% CI] | −6.043 (−25.72, 13.63) | −2.727 (−21.15, 15.70) | ||
QLQ-C30 NAUSEA AND VOMITING | ||||
Mean (SD) baseline | 8.01 N = 127 | 8.19 N = 59 | — | — |
LSM (SE) change, baseline to cycle 3 day 1 | 2.682 (2.018) N = 69 | 0.354 (3.432) N = 22 | 2.371 (2.036) | 0.029 (3.491) |
LSM difference between groups [95% CI] | 2.328 (−5.34, 10.00) | 2.342 (−5.43, 10.11) | ||
LSM (SE) change, baseline to cycle 5 day 1 | −0.210 (2.560) N = 40 | 0.020 (4.545) N = 12 | −0.789 (2.445) | 2.011 (4.415) |
LSM difference between groups [95% CI] | −0.230 (−10.37, 9.91) | −2.800 (−12.56, 6.96) | ||
LSM (SE) change, baseline to cycle 7 day 1 | 3.110 3.645 (2.675) N = 36 | 1.860 (4.553) N = 12 | 3.154 (2.496) | 1.635 (4.419) |
LSM difference between groups [95% CI] | 1.785 (−8.49, 12.06) | 1.518 (−8.29, 11.33) | ||
LSM (SE) change, baseline to cycle 9 day 1 | 3.110 3.287 (3.319) N = 22 | −0.834 (5.856) N = 7 | 1.709 (3.003) | −1.144 (5.475) |
LSM difference between groups [95% CI] | 4.122 (−9.05, 17.30) | 2.853 (−9.31, 15.02) | ||
QLQ-C30 PAIN | ||||
Mean (SD) baseline | 21.52 N = 127 | 23.45 N = 59 | — | — |
LSM (SE) change, baseline to cycle 3 day 1 | −2.091 (2.842) N = 69 | 0.438 (4.852) N = 22 | 2.756 (2.725) | 0.023 (4.681) |
LSM difference between groups [95% CI] | −2.529 (−13.35, 8.29) | −2.779 (−13.19, 7.64) | ||
LSM (SE) change, baseline to cycle 5 day 1 | −7.971 (3.558) N = 40 | −5.255 (6.361) N = 12 | −7.452 (3.282) | −5.587 (5.977) |
LSM difference between groups [95% CI] | −2.716 (−16.90, 11.47) | −1.866 (−15.07, 11.34) | ||
LSM (SE) change, baseline to cycle 7 day 1 | −2.270 (3.783) N = 36 | 1.242 (6.487) N = 12 | −3.862 (3.363) | 0.628 (5.980) |
LSM difference between groups [95% CI] | −3.512 (−18.13, 11.11) | −4.491 (−17.77, 8.79) | ||
LSM (SE) change, baseline to cycle 9 day 1 | −6.352 (4.758) N = 22 | −3.006 (8.375) N = 7 | −7.059 (4.099) | −3.585 (7.486) |
LSM difference between groups [95% CI] | −3.347 (−22.25, 15.55) | −3.474 (−20.13, 13.18) | ||
QLQ-C30 PHYSICAL FUNCTIONING | ||||
Mean (SD) baseline | 61.84 N = 127 | 59.44 N = 59 | — | — |
LSM (SE) change, baseline to cycle 3 day 1 | 1.532 (2.290) N = 69 | 0.597 (3.899) N = 22 | 2.717 (2.311) | 1.459 (3.976) |
LSM difference between groups [95% CI] | 0.935 (−7.71, 9.58) | 1.259 (−7.52, 10.03) | ||
LSM (SE) change, baseline to cycle 5 day 1 | 10.196 (2.824) N = 40 | 3.110 7.797 (5.012) N = 12 | 9.548 (2.685) | 7.880 (4.833) |
LSM difference between groups [95% CI] | 2.399 (−8.71, 13.51) | 1.668 (−8.95, 12.28) | ||
LSM (SE) change, baseline to cycle 7 day 1 | 8.735 (2.937) N = 36 | 10.643 (5.032) N = 12 | 8.783 (2.739) | 11.593 (4.844) |
LSM difference between groups [95% CI] | −1.908 (−13.17, 9.36) | −2.810 (−13.48, 7.86) | ||
LSM (SE) change, baseline to cycle 9 day 1 | 3.110 9.166 (3.561) N = 22 | 10.380 (6.256) N = 7 | 8.875 (3.189) | 9.713 (5.765) |
LSM difference between groups [95% CI] | −1.214 [-15.25, 12.82] | −0.838 (−13.59, 11.91) | ||
QLQ-C30 ROLE FUNCTIONING | ||||
Mean (SD) baseline | 61.94 N = 127 | 59.89 N = 59 | — | — |
LSM (SE) change, baseline to cycle 3 day 1 | 4.417 (3.074) N = 69 | 3.110 7.423 (5.265) N = 22 | 5.401 (3.068) | 8.655 (5.306) |
LSM difference between groups [95% CI] | −3.006 [-14.61, 8.59] | −3.253 (−14.94, 8.43) | ||
LSM (SE) change, baseline to cycle 5 day 1 | 10.438 (3.693) N = 40 | 5.162 (6.562) N = 12 | 10.917 (3.572) | 7.855 (6.468) |
LSM difference between groups [95% CI] | 5.275 [-9.22, 19.77] | 3.062 (−11.13, 17.26) | ||
LSM (SE) change, baseline to cycle 7 day 1 | 8.709 (3.829) N = 36 | 3.110 9.970 (6.581) N = 12 | 9.066 (3.648) | 13.474 (6.484) |
LSM difference between groups [95% CI] | −1.261 [-15.93, 13.41] | −4.408 (−18.68, 9.86) | ||
LSM (SE) change, baseline to cycle 9 day 1 | 16.582 (4.549) N = 22 | 3.110 9.040 (7.971) N = 7 | 14.064 (4.266) | 11.498 (7.731) |
LSM difference between groups [95% CI] | 7.542 [-10.29, 25.37] | 2.565 (−14.53, 19.66) | ||
QLQ-C30 SOCIAL FUNCTIONING | ||||
Mean (SD) baseline | 69.16 N = 127 | 66.38 N = 59 | — | — |
LSM (SE) change, baseline to cycle 3 day 1 | 1.929 (2.861) N = 69 | 2.368 (4.864) N = 22 | 3.070 (2.781) | 3.110 (4.787) |
LSM difference between groups [95% CI] | −0.439 [-11.15, 10.27] | −0.040 (−10.56, 10.48) | ||
LSM (SE) change, baseline to cycle 5 day 1 | 3.110 9.253 (3.442) N = 40 | 8.484 (6.099) N = 12 | 10.513 (3.216) | 9.034 (5.802) |
LSM difference between groups [95% CI] | 0.769 [-12.73, 14.27] | 1.479 (−11.25, 14.21) | ||
LSM (SE) change, baseline to cycle 7 day 1 | 11.548 (3.578) N = 36 | 1.435 (6.113) N = 12 | 12.575 (3.285) | 2.439 (5.813) |
LSM difference between groups [95% CI] | 10.114 [-3.54, 23.77] | 10.135 (−2.66, 22.93) | ||
LSM (SE) change, baseline to cycle 9 day 1 | 12.110 (4.274) N = 22 | 3.110 7.864 (7.462) N = 7 | 13.121 (3.826) | 8.127 (6.904) |
LSM difference between groups [95% CI] | 4.247 [-12.48, 20.97] | 4.993 (−10.28, 20.27) | ||
EQ-5D HEALTH INDEX SCORE | ||||
Mean (SD) baseline | 0.76 N = 127 | 0.71 N = 59 | — | — |
LSM (SE) change, baseline to cycle 3 day 1 | 0.023 (0.018) N = 69 | 0.023 (0.030) N = 22 | 0.027 (0.017) | 0.025 (0.030) |
LSM difference between groups [95% CI] | 0.000 [-0.07, 0.07] | 0.002 (−0.06, 0.07) | ||
LSM (SE) change, baseline to cycle 5 day 1 | 0.069 (0.022) N = 40 | 0.028 (0.039) N = 12 | 0.060 (0.020) | 0.029 (0.037) |
LSM difference between groups [95% CI] | 0.040 [-0.05, 0.13] | 0.031 (−0.05, 0.11) | ||
LSM (SE) change, baseline to cycle 7 day 1 | 0.064 (0.023) N = 36 | 0.032 (0.039) N = 12 | 0.065 (0.021) | 0.040 (0.037) |
LSM difference between groups [95% CI] | 0.032 [-0.05, 0.12] | 0.025 (−0.06, 0.11) | ||
LSM (SE) change, baseline to cycle 9 day 1 | 0.073 (0.027) N = 22 | 0.012 (0.048) N = 7 | 0.075 (0.025) | 0.021 (0.045) |
LSM difference between groups [95% CI] | 0.061 [-0.05, 0.17] | 0.053 (−0.05, 0.15) | ||
EQ5D02-EQ VAS SCORE | ||||
Mean (SD) baseline | 62.92 N = 127 | 60.07 N = 59 | — | — |
LSM (SE) change, baseline to cycle 3 day 1 | 5.064 (2.155) N = 69 | −0.722 (3.753) N = 22 | 4.821 (2.034) | −0.566 (3.580) |
LSM difference between groups [95% CI] | 5.786 [-2.45, 14.02] | 5.387 (−2.44, 13.21) | ||
LSM (SE) change, baseline to cycle 5 day 1 | 12.289 (2.438) N = 40 | 2.755 (4.328) N = 12 | 12.765 (2.274) | 3.103 (4.116) |
LSM difference between groups [95% CI] | 9.535 [0.01, 19.06] | 9.662 (0.66, 18.66) | ||
LSM (SE) change, baseline to cycle 7 day 1 | 10.497 (2.499) N = 36 | 5.359 (4.341) N = 12 | 10.838 (2.309) | 5.569 (4.128) |
LSM difference between groups [95% CI] | 5.138 [-4.47, 14.74] | 5.270 (−3.77, 14.31) | ||
LSM (SE) change, baseline to cycle 9 day 1 | 10.317 (2.822) N = 22 | 1.123 (4.955) N = 7 | 11.220 (2.594) | 2.251 (4.697) |
LSM difference between groups [95% CI] | 9.194 [-1.82, 20.21] | 8.968 (−1.37, 19.30) | ||
Symptoms | ||||
PROMIS Fatigue scale | ||||
Mean baseline | 54.28 N = 127 | 54.89 N = 60 | — | — |
LSM (SE) change, baseline to cycle 3 day 1 | –2.940 (1.093) N = 69 | 1.567 (1.855) N = 22 | –3.410 (1.062) N = 69 | 1.110 (1.826) N = 22 |
LSM difference between groups [95% CI] | –4.507 [–8.60, –0.41] | –4.520 [–8.54, –0.50] | ||
LSM (SE) change, baseline to cycle 5 day 1 | –5.259 (1.308) N = 40 | –0.336 (2.307) N = 12 | –5.489 (1.219) N = 45 | –0.538 (2.187) N = 13 |
LSM difference between groups [95% CI] | –4.923 [–10.03, 0.19] | –4.951 [–9.75, –0.15] | ||
LSM (SE) change, baseline to cycle 7 day 1 | –4.625 (1.354) N = 36 | –3.818 (2.314) N = 12 | –4.376 (1.242) N = 43 | –3.855 (2.191) N = 13 |
LSM difference between groups [95% CI] | –0.807 [–5.98, 4.36] | –0.522 [–5.35, 4.31] | ||
LSM (SE) change, baseline to cycle 9 day 1 | –5.101 (1.606) N = 22 | –3.453 (2.811) N = 7 | –5.562 (1.431) N = 27 | –3.326 (2.582) N = 8 |
LSM difference between groups [95% CI] | –1.648 [–7.94, 4.64] | –2.236 [–7.94, 3.47] | ||
CI = confidence interval; EQ-5D = European Quality of Life 5 Dimensions; LSM = least squares mean; QLQ-C30 = Quality of Life Questionnaire, 30 items; RBC = red blood cell; SD = standard deviation; SE = standard error; VAS = visual analogue scale
Source: Clinical Study Report for VIALE-C.3
Appendix 4: Description and Appraisal of Outcome Measures
Note that this appendix has not been copy-edited.
Aim
To describe the following outcome measures and review their measurement properties (validity, reliability, responsiveness to change, and MID):
Findings
Table 28: Summary of Outcome Measures and Their Measurement Properties
Outcome measure | Type | Conclusions about measurement properties | MID |
|---|---|---|---|
European Organization for Research and Treatment of Cancer Quality of Life Questionnaire Core (EORTC QLQ-C30)21 | Cancer-specific measure of HRQoL 30-item questionnaire, consisting of 4 scales; 4-item response scale: Function Scale, Symptoms Scale, Single-Item Symptom Scale, 7-item Likert scale: Global QoL Scale/GHS | Validity Construct validity assessed through convergent and discriminative approach Reliability Internal consistency assessed using the Cronbach alpha Responsiveness No relevant studies found | 10 points change for the individual items and scale scores.22,23 Meaningful Change Threshold used in the VIALE-C trial = 524 |
Patient-Reported Outcome Measurement Information System Fatigue-Short Form v1.0 –Fatigue 7a (PROMIS F-SF)25 | 7-item, patient-reported, tool that measure both the experience of fatigue and the interference of fatigue on daily activities over the past week, using 5-point Likert scales from 1 = never to 5 = always | Validity Concurrent validity examined through Pearson’s correlations between scores from the PROMIS F-SF, the Multidimensional Fatigue Symptom Inventory-Short Form (MFSI-SF), and the Brief Fatigue Inventory (BFI). Discriminant validity evaluated by examining Pearson’s correlations between scores on the PROMIS F-SF and measures of stress and depressive symptoms. Known-groups validity assessed by comparing PROMIS F-SH scores in the clinical samples to healthy controls.25 Reliability Internal consistency assessed using the Cronbach alpha25 Responsiveness No relevant studies found | No relevant studies found. 3 points validated and reported in the VIALE-A and VIALE-C trials (patients with AML).3 |
AML = acute myelogenous leukemia; EORTC QLQ-C30 = European Organisation for Research and Treatment of Cancer Quality of Life Questionnaire Core 30; GHS = Global Health Score; HRQoL = health-related quality of life; EQ-5D-5L = European Quality of Life 5-Dimensions 5-Levels; MID = minimal important difference; PedsQL Core = Pediatric Quality of Life-Core Module; PROMIS F-SF = Patient-Reported Outcome Measurement System Short Form v1.0 – Fatigue 7a.
EORTC QLQ-C30
Description
The European Organization for Research and Treatment of Cancer (EORTC) Quality of Life Questionnaire Core 30 (EORTC QLQ-C30) is 1 of the most commonly used patient-reported outcomes (PRO) measures in oncology clinical trials.26 It is a multi-dimensional, cancer-specific, evaluative measure of HRQoL. It was designed specifically for the purpose of assessing changes in participants’ HRQoL in clinical trials, in response to treatment.27 The core questionnaire of the EORTC QLQ-C30 consists of 30 questions that are scored to create 5 multi-item functional scales, 3 multi-item symptom scales, 6 single-item symptom scales, and a 2-item quality of life scale:
Functional scales (15 questions)
Physical function (5)
Role function (2)
Cognitive function (2)
Emotional function (4)
Social function (2)
Symptom scales (7 questions)
Fatigue (3)
Pain (2)
Nausea and vomiting (2)
Single-item symptom scales (6 questions)
Dyspnea (1)
Insomnia (1)
Appetite loss (1)
Constipation (1)
Diarrhea (1)
Financial impact (1)
Global quality of life (2 questions)
Global Quality of Life (2)
Version 3.0 of the questionnaire, used in the included trials in this report, is the most current version and has been in use since December of 1997.28 It is available in 90 different languages and is intended for use in adult populations only. Notably, the global QoL scale is also known as the Global Health Status (GHS), which was reported in the trial above.29
Scoring
The EORTC QLQ-C30 uses a 1-week recall period in assessing function and symptoms. Most questions have 4 response options (“not at all,” “a little,” “quite a bit,” “very much”), with scores on these items ranging from 1 to 4.28 For the 2 items that form the global quality of life scale, however, the response format is a 7-point Likert-type scale, with anchors between 1 (very poor) and 7 (excellent).28
Raw scores for each scale are computed as the average of the items that contribute to a particular scale. This scaling approach is based upon the assumption that it is appropriate to provide equal weighting to each item that comprises a scale. There is also an assumption that, for each item, the interval between response options is equal (for example, the difference in score between “not at all” and “a little” is the same as “a little” and “quite a bit,” at a value of 1 unit). Each raw scale score is converted to a standardized score that ranges from 0 to 100 using a linear transformation, with a higher score reflecting better function on the function scales, higher symptoms on the symptom scales, and better quality of life (i.e., higher scores simply reflect higher levels of response on that scale). Thus, a decline in score on the symptom scale would reflect an improvement, whereas an increase in score on the function and quality of life scale would reflect an improvement. According to the EORTC QLQ-C30s scoring algorithm, if there are missing items for a scale (i.e., the participant did not provide a response), the score for the scale can still be computed if there are responses for at least 1-half of the items. In calculating the scale score, the missing items are simply ignored — an approach that assumes that the missing items have values equal to the average of those items for what the respondent completed.28
Psychometric Properties
Validity
One cross-sectional study aimed to validate the EORTC QLQ-30 in a convenience sample of 57 cancer patients in Singapore.30 Most patients had breast and colorectal cancer, but leukemia, lung cancer, lymphoma, germ cell tumour, and other cancers were also reported. Construct validity was assessed by cross-sectional correlational evidence and discriminative evidence. First, convergent validity was assessed using spearman’s correlations between QLQ-30 and Short Form-36 (SF-36) scales, hypothesizing moderate to strong correlation (defined as correlation coefficient of 0.35 to 0.5, and > 0.5, respectively) between scales of these 2 instruments measuring similar dimensions of HRQoL. Results showed moderate to strong correlations between QLC-30 and SF-36 scales, ranging from 0.35 to 0.67 across the assessed scales. Next, known-groups approach was used to compare 6 QLQ-30 scale scores between patients reporting mild and severe symptoms, as well as by stage of disease and presence of comorbid conditions. With the exception of emotional functioning, the remaining 5 scales showed better scores in patients with mild symptoms than those with severe symptoms (P < 0.05 for all other comparisons). Patients in early stages of cancer (or with no comorbid conditions) generally had better QLQ-30 scores than those in advanced disease stages (or with comorbid conditions); however, none of these differences was statistically significant.30
A recent cross-sectional study in Kenya was conducted to evaluate the psychometric properties of the EORTC QLQ-C30, using the English or Kiswahili version in 100 patients with cancer.29 Most patients had breast cancer, followed by prostate, Kaposi sarcoma, lung, and other cancers. Construct validity was assessed by examining the inter-scale correlations among the subscales of EORTC QLQ-C 30. The inter-scale correlations were weak to strong; absolute magnitude ranged from 0.07 to 0.73. Notably, with the exception of cognitive functioning, emotional functioning, nausea and vomiting, dyspnea, appetite loss, constipation, and diarrhea, the GHS correlated moderately with the remaining subscales (r ≥ 0.30). Cross-cultural validity was evaluated but not reported here as not relevant.29
Reliability
The Singaporean cross-sectional study above also assessed internal consistency reliability by calculating the Cronbach alpha for all QLQ-C30 scales. The Cronbach alpha was ≥ 0.70 for 6 of the 9 assessed QLQ-30 scales; cognitive functioning, physical functioning, and nausea and vomiting had a Cronbach alpha ranging from 0.19 to 0.68.30
The Kenyan study described above assessed the internal consistency of each scale of the questionnaire using Cronbach alpha coefficients. With the exception of the Cognitive Function scale, all of the scales had a Cronbach Alpha ≥ 0.70.29
Studies evaluating the responsiveness of the instrument was not found.
MID
For use in clinical trials, scores on the EORTC QLQ-C30 can be compared between different groups of patients or within a group of patients over time. One study conducted in breast cancer and small-cell lung cancer patients in 1998 estimated a clinically relevant change in score on any scale of the EORTC QLQ-C30 to be 10 points.22 The estimate was based on a study that used an anchor-based approach to estimating the MID in which patients who reported “a little” change (for better or worse) on the subjective significance questionnaire had corresponding changes on a function or symptom scale of the EORTC QLQ-C30 of approximately 5 to 10 points. Participants who reported a “moderate” change had corresponding changes in the EORTC QLQ-C30 of about 10 to 20, and those who reported being “very much” changed had corresponding changes of more than 20.22
More recently in 2015, a Canadian study estimated the MIDs of EORTC QLQ C-30 scales using data from 193 newly diagnosed breast and colorectal cancer patients.23 The Supportive Care Needs Survey-Short Form-34 (SCNS-SF34) was used as an anchor; mean changes in EORTC QLQ C-30 scales associated with improvement, worsening, and no-change in supportive care based on the SCNS-SF34 was then calculated. MIDs were assessed for the following scales: Physical function, role function, emotional function, global health/QoL (i.e., GHS), pain, and fatigue. For improvement, MIDs associated with a statistically significantly improved supportive care needs ranged from 10 to 32 points. For worsening, MIDs associated with a statistically significantly worsening of supportive care needs ranged from 9 to 21 points. The range for unchanged supportive care needs was from 1-point worsening to 16-point improvement in EORTC QLQ C-30 score.23 Based on this, the authors suggested a 10-point change in EORTC QLQ-C30 score represented changes in supportive care needs, and therefore should be considered for clinical use.23
In 2014, another Canadian study estimated the MID for EORTC QLQ-C30 in 369 patients with advanced cancer, who completed the questionnaire at baseline and 1-month post-radiation.31 Most common cancer type was breast cancer, followed by lung, prostate, gastrointestinal, renal cell, and others. MID was estimated using both anchor and distribution-based methods for improvement and deterioration. Two anchors of overall health and overall QoL were used, both taken directly from the EORTC QLQ-C30 (questions 29 and 30) where patients rated their overall health and QoL themselves. Improvement and deterioration were categorized as an increase or decrease by 2 units to account for the natural fluctuation of patient scoring. With these 2 anchors, the estimated MIDs across all EORTC QLQ C-30 scales ranged from 9.1 units to 23.5 units for improvement, and from 7.2 units to 13.5 units for deterioration. Distribution-based estimates were closest to 0.5 SD.31 Notably, this study used the global score as an anchor, without providing an MID for this scale, which was the scale used in the NAVIGATE trial, thereby the MIDs from this study are not applicable to this review.
PROMIS F-SF
Description
The PROMIS is a standardized tools funded by the National Institutes of Health for measuring patient-reported outcomes.25 The PROMIS has 2 major frameworks—Adult Self-Reported Health and Pediatric Self- and Proxy-Reported Health.25 Each framework has their own physical, mental, and social health domains. Item banks and subsequent PROMIS measures were developed within each framework to assess patient-reported outcomes, such as fatigue and disease conditions.25 Fatigue is part of the PROMIS physical health domain.25 The PROMIS F-SF has 7 items to measure both the experience of fatigue and the interference of fatigue on daily activities over the past week.25
Scoring
For the 7 items, the response options are measured on a 5-point Likert scale, from 1 = never to 5 = always. One item, “How often did you have enough energy to exercise strenuously,” is reverse scored.25 The total score is the sum of the keyed scores of all items. Total scores can range from 7 to 35, with higher scores indicating greater fatigue.25
Psychometric Properties
Reliability
In a secondary analysis that compared fatigue measures in the PROMIS F-SF, the Multidimensional Fatigue Symptom Inventory-Short Form (MFSI-SF), and the Brief Fatigue Inventory (BFI) in patients with fibromyalgia (n = 72), patient with sickle cell disease (n = 60), individuals with cardiometabolic risks (n = 63), pregnant women (n = 72), and healthy controls (n = 40) in 4 studies.25 Reliability of PROMIS F-SF scores was adequate across samples, ranging from 0.72 in pregnant women to 0.88 in healthy controls.25
Validity
Concurrent validity was strong based on the correlations between the PROMIS F-SF and the MFSI-SF (r = 0.70 to.85) and those between the PROMIS F-SF and the BFI (r = 0.60 to.85).25 Discriminant correlations between the PROMIS F-SF and the PSS were from r = 0.37 to.62, and between the PROMIS F-SF and the CES-D ranged from r = 0.45 to.64.25 For known-groups validity, the samples in the 4 study had significantly higher levels of fatigue on the PROMIS F-SF than the healthy controls.25
Responsiveness
Responsiveness was not reported.25
MID
The researchers that conducted the VIALE-A trial assessed the MID using anchor- and distribution-based approaches in a group of patients with AML.11 A 3-point difference that fell within the range of 3 to 5 proposed in the literature was considered an appropriate MID for patients with AML.11 The 3-point difference was also applied for the patients with AML in another related trial, the VIALE-C trial.3
Pharmacoeconomic Review
Abbreviations
AE
adverse event
AML
acute myeloid leukemia
AZA
azacitidine
BIC
Bayesian information criterion
BSC
best supportive care
CR
complete remission
CRi
complete remission with incomplete blood count recovery
EFS
event-free survival
HRQoL
health-related quality of life
HSCT
hematopoietic stem cell transplant
IC
intensive chemotherapy
ICER
incremental cost-effectiveness ratio
KOL
key opinion leader
LDAC
low-dose cytarabine
LY
life-year
NMA
network meta-analysis
OS
overall survival
PD/RL
progressive or relapsed disease
QALY
quality-adjusted life-year
VEN
venetoclax
WTP
willingness to pay
Executive Summary
The executive summary comprises 2 tables (Table 1 and Table 2) and a conclusion.
Item | Description |
|---|---|
Drug product | Venetoclax (Venclexta) 10 mg, 50 mg, and 100 mg tablets, oral |
Submitted price | Venetoclax, 100 mg, oral: $70 |
Indication | In combination with azacitidine or low-dose cytarabine for the treatment of patients with newly diagnosed AML who are 75 years or older or who have comorbidities that preclude the use of intensive induction chemotherapy |
Health Canada approval status | NOC |
Health Canada review pathway | Project Orbis pathway |
NOC date | December 4, 2020 |
Reimbursement request | In combination with low-dose cytarabine for the treatment of patients with newly diagnosed AML who are 75 years or older or who have comorbidities that preclude the use of intensive induction chemotherapy |
Sponsor | AbbVie Corporation |
Submission history | Previously reviewed: Yes Indication: For the treatment of patients with CLL who have received at least 1 prior therapy and have a 17p deletion Recommendation date: December 1, 2016 Recommendation: Not recommended. Indication: As monotherapy for the treatment of patients with CLL who have received at least 1 prior therapy and who have failed a B-cell receptor inhibitor Recommendation date: November 30, 2017 Recommendation: Recommended on the condition of cost-effectiveness being improved to an acceptable level Indication: In combination with rituximab for the treatment of adult patients with CLL who have received at least 1 prior therapy, irrespective of their 17p deletion status Recommendation date: May 31, 2019 Recommendation: Recommended on the condition of cost-effectiveness being improved to an acceptable level Indication: In combination with obinutuzumab for the treatment of adult patients with previously untreated CLL who are ineligible for fludarabine Recommendation date: November 17, 2020 Recommendation: Recommended on the condition of cost-effectiveness being improved to an acceptable level |
AML = acute myeloid leukemia; CLL = chronic lymphocytic leukemia; NOC = Notice of Compliance.
Table 2: Summary of Economic Evaluation
Component | Description |
|---|---|
Type of economic evaluation | Cost-utility analysis Partitioned survival model |
Target population | Patients who are 75 years or older with newly diagnosed AML who have comorbidities that preclude the use of intensive induction chemotherapy |
Treatment | Venetoclax in combination with low-dose cytarabine |
Comparators | Low-dose cytarabine alone Best supportive care |
Perspective | Canadian publicly funded health care payer |
Outcome | QALYs, LYs |
Time horizon | Lifetime horizon (90 years) |
Key data source | VIALE-C trial and network meta-analysis |
Submitted results |
|
Key limitations |
|
CADTH reanalysis results |
|
AML = acute myeloid leukemia; BSC = best supportive care; CR = complete remission; CRi = complete remission with incomplete blood count recovery; EFS = event-free survival; IC = intensive chemotherapy; ICER = incremental cost-effectiveness ratio; LDAC = low-dose cytarabine; LY = life-year; OS = overall survival; QALY = quality-adjusted life-year; VEN-LDAC = venetoclax plus low-dose cytarabine; WTP = willingness to pay.
Conclusions
According to the CADTH Clinical Review, patients treated with venetoclax plus low-dose cytarabine (VEN-LDAC) experienced a benefit in event-free survival (EFS), complete remission with complete remission with incomplete blood count recovery (CR + CRi) rate, CR with complete remission with partial hematologic recovery rate, and transfusion independence compared with patients treated with LDAC alone. However, the evidence from the VIALE-C trial did not demonstrate a statistically significant improvement in overall survival (OS). The comparative efficacy of VEN-LDAC versus azacitidine (AZA) is uncertain due to limitations within the indirect treatment comparison.
CADTH undertook reanalyses to address limitations with the sponsor’s submission. These reanalyses included applying a different assumption about the functional form of the OS probability for VEN-LDAC (exponential distribution) and LDAC (exponential), which resulted in more plausible estimates of survival post-EFS for VEN-LDAC, and changing the sponsor’s assumption of disease being cured for those who remain in the CR + CRi health state from 5 years to 10 years. In the CADTH base case, best supportive care (BSC), LDAC, and VEN-LDAC were considered optimal treatments (i.e., on the efficiency frontier). LDAC was more effective and more costly than BSC (incremental quality-adjusted life-year [QALY] = 0.43; incremental cost = $20,121), with an incremental cost-effectiveness ratio (ICER) of $46,333 per QALY, while VEN-LDAC was more effective and more costly than LDAC (incremental QALY = 0.18; incremental cost = $60,724), with an ICER of $337,964 per QALY. The probability that VEN-LDAC was cost-effective at a $50,000 willingness-to-pay (WTP) threshold compared to LDAC was 0%. A price reduction of 92% was required to achieve a WTP of $50,000 per QALY when comparing VEN-LDAC to LDAC.
The cost-effectiveness of VEN-LDAC was driven by assumptions about treatment duration and the extrapolation of OS and progression-free survival beyond the observation period of the trial. The pharmacoeconomic model was also associated with notable structural uncertainty that appeared to confer a post-event survival benefit for VEN-LDAC that was not adequately supported by the available data. These findings, taken together, suggest that the cost-effectiveness of VEN-LDAC compared to LDAC and BSC is uncertain and likely overestimated. The cost-effectiveness of VEN-LDAC compared to intensive chemotherapy (IC), which the clinical experts indicated is an important comparator for those 75 years of age and older, is unknown.
Stakeholder Input Relevant to the Economic Review
This section is a summary of the feedback received from the patient groups, registered clinicians, and drug plans that participated in the CADTH review process.
One patient advocacy group, the Leukemia and Lymphoma Society of Canada (LLSC), provided input for this review. Using an online survey conducted from December 7, 2020, to January 24, 2021, LLSC gathered responses from 29 Canadian patients who had been diagnosed with acute myeloid leukemia (AML). Respondents reported receiving the following front-line treatments after diagnosis: chemotherapy (n = 24), stem cell transplant or bone marrow transplant (n = 16), drug therapy (n = 6), radiation therapy (n = 5), chimeric antigen receptor T-cell therapy (n = 1), venetoclax (VEN) (n = 1) and liposomal daunorubicin and cytarabine (n = 1). None of the respondents had experience with VEN-LDAC. Respondents hoped that new treatment options could maintain remission, have fewer side effects, and be covered in public plans and accessible in a wider set of geographic areas.
According to the respondents, the impacts of AML on quality of life included fatigue, sudden symptom development, anxiety, fear of relapse, and loss of eyesight. The respondents also reported a wide range of side effects with current treatments. Respondents highlighted that they were unable to work due to disease symptoms. They also mentioned the impact on caregivers.
The LLSC survey patient respondents also reported that they hoped new treatment options could maintain remission, be targeted and have fewer side effects, be covered by public plans, and be accessible in more geographic regions. The opportunity to have access to other supportive options, such as meditation, hypnosis, neuro-linguistic programming support, and awareness support (thoughts, emotions, and behaviours), was also mentioned.
Feedback from registered clinicians suggested that the options for standard of care for first-line AML treatment were AZA monotherapy, LDAC, and supportive care. Feedback from this group identified that the treatment goals are longer survival and improved quality of life, including transfusion independence. Clinicians also noted that LDAC is less costly than AZA and stable for up to 14 days, meaning it can be administered at home. This property makes VEN-LDAC more suitable for patients who would experience challenges travelling to clinics to receive regular treatment.
The drug plans highlighted considerations for the implementation of VEN-LDAC that are relevant to the economic analysis. One issue is the exclusion of relevant comparators, particularly for the age 75 and older age category, which may have many patients fit to tolerate IC. Another issue related to the funding scheme for VEN-LDAC that the current packaging for VEN does not support this ramp-up dosing. Additionally, drug plans highlighted the potential inpatient administration that may be required during the ramp-up process for VEN.
Several of these concerns were addressed in the sponsor’s model:
the probability of remaining in remission (i.e., event-free) and the development of side effects (both were incorporated in the submitted model)
health-related quality of life (HRQoL) (estimates in the model capture some of the impacts listed by patients)
HRQoL impact of major adverse events (AEs).
CADTH was unable to address the following concerns raised in the stakeholder input:
the omission of IC as a comparator in the model
the indirect impact on caregivers associated with AML
the indirect impact on employment due to AML
the potential inpatient administration required during the ramp-up process for VEN.
Economic Review
The current review is for venetoclax for patients who are 75 years of age or older with newly diagnosed AML or patients with newly diagnosed AML who have comorbidities that preclude the use of intensive induction chemotherapy.
Economic Evaluation
Summary of Sponsor’s Economic Evaluation
Overview
The sponsor submitted a cost-utility analysis assessing VEN-LDAC compared with LDAC alone and BSC in patients who are newly diagnosed with AML and who are 75 years of age or older or have comorbidities that preclude the use of intensive induction chemotherapy. The modelled population was not consistent with the VIALE-C clinical trial. The modelled population aligned with the reimbursement request. The sponsor conducted a subgroup analysis of the subgroup with greater than 30% blast cells. The cost-utility analysis was conducted from the perspective of the Canadian publicly funded health system.
The recommended dose of VEN when used in combination with LDAC consists of 100 mg on day 1, 200 mg on day 2, 400 mg on day 3, and 600 mg on day 4 to day 28 for the first 28-day cycle, with subsequent 28-day cycles consisting of 400 mg administered daily. The recommended dose of LDAC when used in combination or standalone consisted of 20 mg/m2 on day 1 to day 10 of each 28-day cycle. BSC was not explicitly defined in the submitted report, but no drug administration was assumed for that strategy.
Administration costs of VEN consist of pharmacy dispensing fees and physician fees for the management of oral chemotherapy. The administration costs of LDAC were associated with inpatient IV therapy administration. The total drug acquisition cost per patient for the first 28-day cycle of VEN-LDAC was $9,089 (VEN: $9,050; LDAC: $40) and $9,542 (VEN: $9,502; LDAC: $40) for subsequent 28-day cycles, based on a VEN unit price of $70 per 100 mg tablet. The total drug acquisition cost per patient for each 28-day cycle of LDAC was $48 based on a price per vial of $4.90. The sponsor assumed no drug acquisition costs associated with BSC.
The clinical outcomes modelled included QALYs and life-years (LYs). The economic analysis was undertaken over a lifetime horizon using a 28-day cycle length. The economic evaluation was conducted from the perspective of a publicly funded health care system, and discounting (1.5% per year) was applied to both costs and outcomes.
Model Structure
A partitioned survival model was developed in Microsoft Excel. The PSM model consisted of 3 mutually exclusive health states: EFS, progressive or relapsed disease (PD/RL), and death (Figure 1). EFS was defined as the time from treatment initiation to first progression or relapse from CR + CRi, treatment failure, or death due to any cause. All patients entered the model in the EFS health state. Within EFS, a proportion of time was assumed to be spent with CR + CRi and the remaining time without CR + CRi. Duration of first-line treatment was modelled independently from EFS, and patients could stop treatment without transitioning to another state. Patients then transitioned to the PD/RL state, which included alive patients who progressed or relapsed. After transitioning to PD/RL, patients underwent subsequent treatment. Individuals remained in the PD/RL state until death, either due to AML-related mortality or due to other cause mortality. It was assumed that individuals who remained in the EFS health state with CR + CRi for more than 5 years were “cured” and no longer at risk of transitioning to PD/RL or experiencing disease-related mortality. Patients could also experience treatment-related AEs, which were assumed to occur during the first model cycle.
Parametric survival models in combination with hazard ratios were used to inform OS and EFS. EFS was assumed to be less than or equal to OS at all time points. The proportion of patients in the EFS health state of the model was set to be equal to the EFS curve of each treatment. The proportion of patients in the PD/RL health state was set to be equal to the difference between the proportion of living patients, which was based on the OS curve, and the proportion of EFS patients. During each cycle, the cohort of patients was redistributed among the 3 health states, with death being an absorbing state.
Model Inputs
Baseline patient characteristics for the modelled population and the clinical efficacy of VEN-LDAC and LDAC were sourced from the VIALE-C trial (data cut-off: August 15, 2019), a multi-centre, randomized, double-blind, placebo-controlled phase III trial in which patients were assigned in a 2:1 ratio to either VEN-LDAC or LDAC.1 The baseline characteristics of the patient population in the VIALE-C trial consisted of a median age of 76 years, with 76% having a greater than 30% bone marrow blast count. In the VEN-LDAC (n = 143) and LDAC (n = 68) groups, 20% and 21% had prior hypomethylating drug use, respectively.2 Information about BSC efficacy in the network meta-analysis (NMA) was based on Study NCT01074047 (Dombret et al.),3 a multi-centre, randomized, open-label, phase III trial that evaluated AZA efficacy and safety versus conventional care regimens in patients aged 65 years and older with newly diagnosed AML who were not considered eligible for hematopoietic stem cell transplant (HSCT). The median age of this arm was 78 years, with 100% of the patients having greater than 30% bone marrow blast counts and 0% having prior hypomethylating drug use.
OS and EFS for VEN-LDAC and LDAC were obtained using parametric survival models on the individual patient-level data from the VIALE-C trial and extrapolated beyond the trial period.2 Exponential, Weibull, log-logistic, log-normal, Gompertz, and generalized gamma models were considered. Akaike information criterion or Bayesian information criterion (BIC) tests, visual inspection, examination of log-cumulative hazard plots, Schoenfeld residuals tests, clinical input, and external validation were also used in the survival model selection process.2 Graphical representation of the fitted parametric distributions for EFS and OS extrapolations are shown in Figure 2 to Figure 5.
The proportion of time in CR + CRi for VEN-LDAC and LDAC was estimated by the CR + CRi rate in the VIALE-C trial. The OS for BSC was estimated using an NMA with VEN-LDAC as the reference.2 The NMA was conducted using Bayesian mixed-treatment comparison techniques. Bayesian Markov chain Monte Carlo methods were used to estimate the posterior probability distribution and generate pairwise comparisons for treatments of interest by outcome.2 EFS for BSC was estimated by assuming the same constant hazard ratio between EFS and OS as observed in the LDAC arm of the VIALE-C trial. Survival for the patients assumed to be cured was modelled using general population mortality data based on 2019 Canadian life tables.4
HRQoL was measured using the EuroQol 5-Dimensions 5 Levels instrument (EQ-5D-5L) in the VIALE-A and VIALE-C trials.1,5 It was measured at day 1 of cycle 1, on day 1 of every other cycle, and at the last visit after patients discontinued the treatment. EQ-5D-5L utility scores were estimated using pooled data from the VIALE-A and VIALE-C trials, based on individual dimension scores and using Canadian preference weights.6 A linear mixed-effects model was developed to estimate patient utility scores with a robust variance estimator to account for correlation within patients' repeated assessments. The linear model adjusted for the grade 3 or 4 AEs that occurred in greater than or equal to 5% of patients in the VIALE-A and VIALE-C trials. AE utility and disutility inputs were derived from Wehler (2018).7 For AEs that were not reported in the literature, values were assumed to be equal to those under the same AE category or the average disutility of all the AEs.
The dosing schedule, dose intensity, and treatment duration for VEN-LDAC and LDAC were obtained from the VIALE-C trial. VEN had a dose intensity of 81%; LDAC had a dose intensity of 81% when used in combination with VEN and 98% when used alone. The median treatment durations for VEN-LDAC and LDAC were obtained from the trial, and an exponential model was used to extrapolate the time on treatment beyond the trial observation period. The proportion of patients receiving subsequent treatments for the VEN-LDAC and LDAC arms were obtained from a Canadian key opinion leader (KOL). For BSC, all patients are assumed to receive subsequent treatment with hydroxycarbamide, also based on the Canadian KOL input. Only subsequent treatments with a prevalence rate of greater than or equal to 5% in any of the treatment arms were considered. The dosing schedule for subsequent treatments was sourced from the VIALE-C trial and Cancer Care Ontario. The mean treatment duration of AZA as a subsequent treatment was derived from a retrospective database study and used as treatment duration for all subsequent therapies.8 The AE rates for BSC were based on Dombret et al. (2015).3 Only grade 3 or grade 4 AEs with 5% or higher rates in any of the arms were considered. The proportion of grade 3 or grade 4 AEs managed as inpatients or outpatients were established based on Canadian KOL input.
The model considered the following cost components: initial treatment costs (including drug and administration), subsequent HSCT costs, subsequent pharmacological treatment costs (including drug and administration costs), AE costs associated with initial treatments, and terminal care costs. The unit drug costs of VEN and all other treatments were obtained from the IQVIA price list (October 2020). Resource utilization and unit costs were sourced from the overall population in the VIALE-C trial, the literature, public databases, and a Canadian KOL. An inpatient hospitalization cost of $1,817.86 was sourced from the Patient Cost Estimator provided by the Canadian Institute for Health Information (CIHI). A daily cost of being in an intensive care unit (ICU) of $3,927.67 was sourced from a 2019 CIHI report.9 All patients who transitioned to death were assumed to incur terminal care costs of $86,582.31 during the last cycle before death.10 The inpatient length of stay per cycle, the number of red blood cell transfusions per cycle, and the number of platelet transfusions per cycle were sourced from the KOL. Monitoring costs were mostly obtained from the Schedule of Benefits for Physician Services and from the Schedule of Benefits for Laboratory Services.11 The Ontario Care Costing Analysis Tool was also used to retrieve the procedure costs for bone marrow aspirates and biopsies.12 The cost per event for both outpatient AE and inpatient AE management was sourced from the Ontario Care Costing Analysis Tool for all AEs.13 All of these costs were inflated to 2020 Canadian dollars using the all-item Consumer Price Index.4
Summary of the Sponsor’s Economic Evaluation Results
The sponsor presented probabilistic analyses (5,000 iterations for the base case and 2,000 iterations for each scenario analysis).
Base-Case Results
In the sponsor’s base case, VEN-LDAC was associated with 1.56 discounted QALYs and $128,505 in discounted costs. Compared to LDAC, VEN-LDAC was associated with 0.64 additional expected QALYs and an additional expected cost of $78,294. Compared to BSC, LDAC was associated with 0.43 additional expected QALYs and expected cost of $15,297. This resulted in an ICER for VEN-LDAC versus LDAC of $122,766 per QALY gained, and an ICER for LDAC versus BSC of $35,682 per QALY gained. At a WTP threshold of $50,000 per QALY, there was a 0% probability that VEN-LDAC was cost-effective compared to LDAC.2
The majority of the benefits (QALYs and LY) were accrued after the trial period for VEN-LDAC, but not for LDAC or BSC. The main cost driver in the VEN-LDAC arm was initial treatment, followed by medical costs accrued in the PD/RL state. The main cost drivers for LDAC and BSC were medical costs.
Table 3: Summary of the Sponsor’s Economic Evaluation Results
Drug | Total costs ($) | Total QALYs | Sequential ICER ($/QALY) |
|---|---|---|---|
BSC | $34,916 | 0.49 | Reference |
LDAC | $50,213 | 0.92 | $35,682 |
VEN-LDAC | $128,506 | 1.56 | $122,766 |
BSC = best supportive care; ICER = incremental cost-effectiveness ratio; LDAC: low-dose cytarabine; QALY = quality-adjusted life-year; VEN-LDAC = venetoclax plus low-dose cytarabine.
Source: Sponsor’s pharmacoeconomic submission.
Additional results from the sponsor’s submitted economic evaluation base case are presented in Table 11.
Sensitivity and Scenario Analysis Results
The sponsor conducted a subgroup analysis of the subgroup with greater than 30% blast cells. The incremental cost per QALY gained for VEN-LDAC when compared to LDAC was $61,059. The sponsor performed scenario analyses related to the duration of treatment, the inclusion of cure assumption, and the model time horizon. The results of these analyses are presented in Table 12.
CADTH Appraisal of the Sponsor’s Economic Evaluation
CADTH identified several key limitations to the sponsor’s analysis that have notable implications on the economic analysis:
Exclusion of IC as a comparator: The model submitted by the sponsor did not include IC as a comparator. The modelled population consisted of individuals newly diagnosed with AML who are 75 years or older or who have comorbidities that preclude the use of IC. The sponsor stated that patients 75 years of age and older would, by definition, be ineligible for IC. However, according to clinical experts' feedback, a notable proportion of patients aged 75 years or older (upward of 30%) would receive IC in Canada. The pivotal trial data excluded people who were IC-eligible; consequently, the cost-effectiveness of VEN-LDAC compared with IC remains unknown.
CADTH was unable to address this limitation in its reanalysis.
Cure assumption for those who remain in the CR + CRi state for more than 5 years: The sponsor’s model assumed that individuals who remain in CR + CRi for more than 5 years are cured, and are at risk of dying only from causes unrelated to the disease. Clinical experts indicated that this is not likely to be the case, given that individuals in clinical practice can relapse and die of the disease after 5 years.
As a response to this limitation, CADTH revised the base case with the assumption that individuals need to remain in CR + CRi for 10 years before being considered cured.
Modelling approach produces biased estimate of incremental QALYs: In the submission, a substantial portion of the life-expectancy benefits associated with VEN-LDAC were accrued after patients exited the EFS health state and were no longer on first-line treatment. The QALYs observed in the VEN-LDAC group after EFS (0.57 QALYs in the PD/RL health state) are more than double the PD/RL estimate for LDAC of 0.22 QALYs. CADTH asked the sponsor to provide clinical evidence supporting the implied post-event benefit of first-line VEN-LDAC. CADTH's clinical review team and clinical experts evaluated the response from the sponsor and concluded that there was insufficient evidence to justify the 0.57 QALYs accrued after PD/RL in the VEN-plus-AZA arm.
To address this limitation, CADTH revised its base case by selecting the exponential distribution for VEN-LDAC OS. The exponential distribution was selected due to its improved fit compared to other distributions (i.e., lowest BIC) and the more realistic behaviour past the duration of trial follow-up. The exponential distribution resulted in LYs accrued after EFS that were comparable to those in other interventions. Lastly, the sponsor’s base-case selection of OS for VEN-LDAC assumes that the risk of dying decreases over time. The exponential distribution assumes that the risk of mortality does not change over time. Similarly, CADTH has selected the exponential distribution for LDAC due to its improved fit compared to other distributions (i.e., lowest BIC).
EFS and duration of first-line treatment estimated independently: The sponsor's model estimates time receiving first-line treatment and time in the EFS state independently. This is likely to be incorrect for 2 reasons. First, in the sponsor’s definition of EFS, if a patient experienced treatment failure, they would no longer be in EFS. Second, time spent on treatment and the risk of PD/RL are likely to be correlated. One consequence of independently estimating and extrapolating the risk of ending treatment and the risk of disease progression is that patients in the model can be considered off treatment, but remain in the EFS state for unrealistic durations. Conversely, for some iterations of the probabilistic analysis, patients could be on treatment and in the PD/RL health state, if values from the EFS parameters are randomly drawn in such a way that the mean EFS is lower than the mean duration of first-line treatment. This limitation has 2 possible effects: a possible bias on the extrapolated outcomes and an effect on the uncertainty associated with both the EFS and the treatment-related parameter.
CADTH conducted a scenario analysis in which patients were assumed to remain on treatment if they were in the EFS health state (i.e., duration of treatment was assumed to be equal to EFS).
Uncertainty surrounding the extrapolation of parametric survival models: Due to the limited follow-up and sample size of the VIALE-C trial, efficacy must be estimated beyond the trial period. The uncertainty associated with the selection of parametric distribution for all survival probabilities in the model was not explored in the submission.
CADTH conducted a scenario analysis where the second-best fitting curves (as per BIC) for all distributions of all comparators were used instead.
Additionally, the following key assumptions were made by the sponsor and have been appraised by CADTH (see Table 4).
Table 4: Key Assumptions of the Submitted Economic Evaluation (Not Noted as Limitations to the Submission)
Sponsor’s key assumption | CADTH comment |
|---|---|
Gamma distribution was not considered. | The sponsor did not implement the gamma distribution in the submitted model. CADTH was not able to assess the impact of not including that distribution on the outcomes of the economic analysis. However, the gamma distribution did not provide the best-fitting curve, according to the Bayesian information criterion or Akaike information criterion for any of the treatments. |
The EFS was artificially restricted such that it remains under OS. This is a by-product of OS and EFS being modelled independently. | When a partitioned survival model is used, the OS and EFS curves are typically modelled independently. In situations where either of the 2 probabilities are non-zero by the end of the trial follow-up, this assumption is particularly problematic, because it can result in biased estimates. The bias is amplified in the context of a probabilistic analysis, where restrictions that are introduced in the model (such as the EFS being artificially restricted to be lower than OS) can amplify the bias. This is a structural assumption shared by all PSMs. |
The sponsor did not define what BSC consisted of in the submission. | This limits the usefulness of the model with regard to the comparator arm in decision-making. However, experts agreed that BSC is an unlikely treatment option. |
Administration costs were incomplete. | According to the product monograph, treatment with venetoclax requires preparatory steps, including anti-hyperuricemic drugs, cytoreduction before treatment, assessment and monitoring of blood chemistry, and laboratory monitoring. These additional steps are associated with additional administration costs. The sponsor’s model assumed that the administration costs for venetoclax were limited to pharmacy dispensing fees and physician monitoring for chemotherapy regimes. This is likely to underestimate the initial treatment costs for venetoclax and the estimates of the cost-effectiveness of VEN-AZA as a result. |
The sponsor did not consider an alternative reference when estimating the OS under BSC using NMA input. | When estimating an absolute effect size (e.g., the probability of event) using estimates from an NMA, a reference treatment needs to be assumed. In the submitted model, the reference treatment when estimating BSC OS was assumed to be AZA. However, the choice of AZA as a reference treatment is arbitrary. Ideally, the sponsor would want to assess the sensitivity of the results of that reference treatment assumption by choosing a different reference treatment. However, the sponsor did not conduct such sensitivity analysis of this assumption. |
Hospitalization costs were accrued based on time in state, not treatment-specific impacts. | The sponsor assumed that hospitalizations were dependent on time in a specific health state, not treatment-specific risks of inpatient hospitalization. However, experts agreed that there is limited evidence on inpatient hospitalization risks for the treatments considered. |
The sponsor did not consider drug vial sharing. | The sponsor assumed no vial sharing. This generated uncertainty in the treatment cost estimates. |
AZA = azacitidine; BSC = best supportive care; EFS = event-free survival; NMA = network meta-analysis; OS = overall survival; PSM = partitioned survival model; VEN = venetoclax; VEN-AZA = venetoclax plus azacitidine.
CADTH Reanalyses of the Economic Evaluation
Base-Case Results
To address the limitations identified within the economic model, the CADTH base case was derived by making changes in the model parameter values and assumptions in consultation with clinical experts (Table 5).
Table 5: CADTH Revisions to the Submitted Economic Evaluation
Stepped analysis | Sponsor’s value or assumption | CADTH value or assumption |
|---|---|---|
Corrections to the sponsor’s base case | ||
1. LDAC drug acquisition costs: The sponsor used a lower drug cost for LDAC based on an expired wholesale price. CADTH selected the available pricing in the IQVIA database for the concentration of LDAC based on its product monograph (i.e., 100 mg/mL). | — | — |
Changes to derive the CADTH base case | ||
1. Cure assumption for those who remain in the CR + CRi state for more than 5 years | Cure assumption for those who remain in the CR + CRi state for more than 5 years | Cure assumption for those who remain in the CR + CRi state for more than 10 years |
2. Substantial benefit of VEN-LDAC occurring after EFS | OS distribution for VEN-LDAC: Gompertz and LDAC: log-normal | OS distribution for VEN-LDAC: Exponential and LDAC: log-exponential |
CADTH base case | Combined revisions 1 + 2 | |
CR = complete remission; CRi = complete remission with incomplete blood count recovery; EFS = event-free survival; LDAC = low-dose cytarabine; OS = overall survival; VEN-LDAC = venetoclax plus low-dose cytarabine.
CADTH’s base-case results for the main population are presented in Table 6, with stepped reanalysis in Table 12. Disaggregated results of the CADTH reanalysis are presented in Table 14. In CADTH’s base case, VEN-LDAC was associated with the highest total discounted costs ($110,727) and the most discounted QALYs (1.00) over the lifetime time horizon. According to the sequential analysis, BSC is preferred for WTP thresholds below $46,333 per QALY; LDAC is preferred for WTP thresholds between $46,333 and $337,964; and VEN-LDAC is preferred for WTP thresholds above $337,964. The probability that VEN-LDAC was cost-effective at a WTP threshold of $50,000 per QALY was 0%; at a WTP threshold of $100,000, it was 0.6%. In the CADTH base case, 31% of the QALYs in the VEN-LDAC arm were accrued over the duration of the VIALE-C trial (0.30 QALYs).
Table 6: Summary of the CADTH Reanalysis Results
Drug | Total costs | Total QALYs | ICER vs. BSC | Sequential ICER |
|---|---|---|---|---|
CADTH base case | ||||
BSC | $29,882 | 0.38 | Reference | Reference |
LDAC | $50,003 | 0.82 | $46,333 | $46,333 |
VEN-LDAC | $110,727 | 1.00 | $130,395 | $337,964 |
BSC = best supportive care; ICER = incremental cost-effectiveness ratio; LDAC = low-dose cytarabine; QALY = quality-adjusted life-year; VEN-LDAC = venetoclax plus low-dose cytarabine; vs. = versus .
Note: Reanalyses are based on publicly available prices of the comparator treatments.
Scenario Analysis Results
Price reduction analyses were conducted using both the sponsor and CADTH base case (Table 7). Within the sponsor’s base case, a price reduction of 83% was required to produce an ICER of $50,000 per QALY when comparing VEN-LDAC to LDAC. Within the CADTH base case, a price reduction of 92% was required to produce an ICER of $50,000 per QALY when comparing VEN-LDAC to LDAC.
Table 7: CADTH Price Reduction Analyses
Price reduction | ICERs for VEN-LDAC vs. LDAC | |
|---|---|---|
Sponsor base case | CADTH reanalysis | |
No price reduction | $127,582 | $298,804 |
10% | $118,168 | $271,605 |
20% | $108,753 | $244,406 |
30% | $99,339 | $217,207 |
40% | $89,924 | $190,008 |
50% | $80,510 | $162,809 |
60% | $71,095 | $135,610 |
70% | $61,681 | $108,411 |
80% | $52,266 | $81,211 |
90% | $42,852 | $54,012 |
95% | $38,145 | $26,813 |
ICER = incremental cost-effectiveness ratio; LDAC = low-dose cytarabine; VEN-LDAC = venetoclax plus low-dose cytarabine; vs. = versus.
Note: Reanalyses are based on publicly available prices of the comparator treatments.
CADTH also performed analyses of alternate scenarios (Table 15). The scenarios included: first-line treatment lasting the duration of time in the EFS health state and using second best-fitting curves according to BIC. Detailed results are presented in Appendix 4. Additionally, CADTH conducted exploratory analyses that considered venetoclax plus azacitidine (VEN-AZA) as a comparator and used a shortened time horizon.
Based on the sequential analysis, all the scenarios considered altered the ICER for VEN-LDAC versus other comparators. The 2 largest impacts were assuming that all individuals in the EFS health state were on first-line treatment (the ICER for VEN-LDAC compared to LDAC was $754,852 per QALY) and including VEN-AZA as a comparator (VEN-LDAC is extendedly dominated by VEN-AZA and LDAC).
Taken together, the findings within the CADTH base-case reanalysis and scenario analyses suggest that in the absence of long-term data, the predicted incremental QALYs remain highly uncertain. The CADTH base-case and scenario results suggest that the magnitude of incremental effectiveness appears to be driven by 2 principal factors: the benefit of VEN-LDAC after EFS and the amount of time that an individual can remain in the EFS health state while being event-free. The model findings were not robust to changes in parametric extrapolation assumptions for OS and EFS, as seen by the second best-fit scenario analysis. In particular, although most of the distributions for OS and EFS that were implemented in the submitted model fit the observed data well, they diverged considerably in extrapolation beyond the trial follow-up time. The distributional assumptions made by CADTH ensured that the post-progression survival benefit is similar between strategies, because an assumption of a post-progression survival benefit for VEN-LDAC was not supported by the submitted evidence or by clinical feedback from experts consulted by CADTH.
Issues for Consideration
CADTH is currently evaluating VEN-AZA. These 2 reviews were conducted independently; however, if both VEN-AZA and VEN-LDAC are approved, they would be considered comparators. An exploratory analysis was conducted to estimate the cost-effectiveness of VEN-LDAC if VEN-AZA was available as a comparator; however, these results are subject to limitations in the efficacy evidence for the VIALE-A trial that are not discussed within this report.
Overall Conclusions
Based on the CADTH Clinical Review of the VIALE-C study results and a sponsor-conducted indirect treatment comparison, treatment with VEN-LDAC increased EFS, but did not improve OS compared with LDAC and BSC among patients with newly diagnosed AML who have comorbidities that preclude the use of IC over the trial’s follow-up period (17 months median follow-up). The extrapolated differences in EFS and OS between VEN-LDAC and both LDAC and BSC were the key drivers of effectiveness in the economic analysis. The duration of first-line treatment was a key driver of costs in the economic analysis. The clinical review found that the OS benefit beyond progression that was observed in the economic analysis is not supported by evidence or clinical experience. IC was excluded as a comparator despite the indication from clinical experts that a notable proportion of patients aged 75 years or older (upward of 30%) would receive IC in Canada.
CADTH undertook reanalyses to address the limitations in the sponsor’s submission. These included applying a different assumption of the functional form of the OS probability for VEN-LDAC and LDAC and assuming a cure for those who remain in the CR + CRi health state for more than 10 years. LDAC was more effective and more costly than BSC (incremental QALY = 0.43; incremental cost = $20,121), with an ICER of $46,333 per QALY, while VEN-LDAC was more effective and more costly than LDAC (incremental QALY = 0.18; incremental cost = $60,724), with an ICER of $337,964 per QALY. The probability that VEN-LDAC was cost-effective at a $50,000 WTP threshold compared to LDAC was 0%. A price reduction of 92% was required to achieve a WTP of $50,000 per QALY when comparing VEN-LDAC to LDAC.
The CADTH base-case results are associated with substantial uncertainty for multiple reasons. First, the modelling approach followed by the sponsor inaccurately assumed independence between EFS and treatment duration. This resulted in uncertainty in the extrapolation of the treatment duration. The sponsor provided limited evidence of the probability of stopping treatment over time; as a result, CADTH was not able to assess adequately what the duration of treatment would be. In a scenario analysis where individuals were assumed to be on treatment throughout the EFS, the ICER of VEN-LDAC versus LDAC increased to $754,852 per QALY.
The model also had several limitations that prevented us from arriving at an unbiased estimate of cost-effectiveness. A significant portion of the treatment benefit was estimated in the economic analysis during the post-progression state. As noted previously, there is no clinical justification for this finding. The EFS and OS were estimated independently, which likely resulted in unrealistic scenarios in the extrapolation of the model (e.g., EFS probability > OS probability). The coding of the Microsoft Excel model with numerous IFERROR statements prevented the debugging of some of these unrealistic scenarios. Taken together, these findings suggest that the cost-effectiveness results were driven primarily by assumptions about the relationship between time to treatment discontinuation, EFS, and OS - the relationship between these 3 outcomes was uncertain within the trial data.
The cost-effectiveness of VEN-LDAC in patients older than 75 years who would be deemed eligible to receive IC is unknown.
References
1.Wei AH, Montesinos P, Ivanov V, et al. Venetoclax plus LDAC for newly diagnosed AML ineligible for intensive chemotherapy: a phase 3 randomized placebo-controlled trial. Blood. 2020;135(24):2137-2145. PubMed
2.Pharmacoeconomic evaluation [internal sponsor's report]. In: Drug Reimbursement Review sponsor submission: Venclexta (venetoclax) in combination with azacitidine for the treatment of acute myeloid leukemia (AML), 10 mg, 50 mg, and 100 mg tablets. Pointe-Claire (QC): AbbVie Corporation; 2021 Jan 8.
3.Dombret H, Seymour JF, Butrym A, et al. International phase 3 study of azacitidine vs conventional care regimens in older patients with newly diagnosed AML with >30% blasts. Blood. 2015;126(3):291-299. PubMed
4.Statistics Canada. Consumer Price Index by product group, monthly, percentage change, not seasonally adjusted, Canada, provinces, Whitehorse, Yellowknife and Iqaluit (Table: 18-10-0004-13). . 2020: https://www150.statcan.gc.ca/t1/tbl1/en/tv.action?pid=1810000413.
5.DiNardo CD, Jonas BA, Pullarkat V, et al. Azacitidine and venetoclax in previously untreated acute myeloid leukemia. N Engl J Med. 2020;383(7):617-629. PubMed
6.Xie F, Pullenayegum E, Gaebel K, et al. A time trade-off-derived value set of the EQ-5D-5L for Canada. Med Care. 2016;54(1):98-105. PubMed
7.Wehler E, Storm, M., Kowal, S., Campbell, C., Boscoe, A. A health state utility model estimating the impact of ivosidenib on quality of life in patients with relapsed/refractory acute myeloid leukemia. Presented at: 23rd Congress of the European Hematology Associtation, 2018 Jun 14-18, Stockholm, Sweden. 2018: https://investor.agios.com/static-files/25de7161-9a10-4d8c-8a03-8bd5e7d0a5d3. Accessed 2021 Feb 18.
8.Stahl M, DeVeaux M, Montesinos P, et al. Hypomethylating agents in relapsed and refractory AML: outcomes and their predictors in a large international patient cohort. Blood Adv. 2018;2(8):923-932. PubMed
9.Canadian Institute for Health Information. Care in Canadian ICUs. 2016.
10.de Oliveira C, Pataky R, Bremner KE, et al. Phase-specific and lifetime costs of cancer care in Ontario, Canada. BMC Cancer. 2016;16(1):809. PubMed
11.Schedule of benefits for laboratory services: effective July 1, 2020. Toronto (ON): Ontario Ministry of Health; 2020: https://www.health.gov.on.ca/en/pro/programs/ohip/sob/lab/lab_mn2020.pdf. Accessed 1800 Mth Dd.
12.Ontario Ministry of Health and Long Term Care. Ontario Care Costing Analysis Tool. . 2020: https://hsimi.ca/occp/occpreports/.
13.Ontario Case Costing Initiative (OCCI). Toronto (ON): Ontario Health and Long-Term Care; 2017: https://data.ontario.ca/dataset/ontario-case-costing-initiative-occi. Accessed 1800 Mth Dd.
14.Venclexta (venetoclax): 10 mg, 50 mg, and 100 mg tablets [product monograph]. St-Laurent (QC): AbbVie Corporation; 2020 Dec 3.
15.Celgene Corporation. Azacitidine for injection, Product Monograph. 2018.
16.Cancer Care Ontario. 3+7 Regimen CCO. 2019.
17.Cancer Care Ontario. FLAG+IDA Regimen. Fludarabine-cytarabine-filgrastim-idarubicin. 2019.
18.Ontario Ministry of Long-Term Care. Ontario drug benefit formulary/comparative drug index. 2020; https://www.formulary.health.gov.on.ca/formulary/. Accessed 1800 Mth Dd.
19.Budget Impact Analysis [internal sponsor's report]. In: Drug Reimbursement Review sponsor submission: Venetoclax in combination with Low-Dose Cytarabine, 100 mg Oral Tablets. Montreal (Quebec): AbbVie; 2021.
Appendix 1: Cost Comparison Table
Note that this appendix has not been copy-edited.
The comparators presented in the following table have been deemed to be appropriate based on feedback from clinical expert(s) and drug plans. Comparators may be recommended (appropriate) practice or actual practice. Existing Product Listing Agreements are not reflected in the table and as such, the table may not represent the actual costs to public drug plans.
Table 8: CADTH Cost Comparison Table for Acute Myeloid Leukemia
Treatment | Concentration | Form | Price ($) | Recommended dosage | 28-day cycle cost ($) | Average annual cost ($) |
|---|---|---|---|---|---|---|
Venetoclax + low-dose cytarabinea | ||||||
Venetoclax (Venclexta) | 10 mg 50 mg 100 mg | Tablet | 7.0000a 35.0000a 70.0000a | 100 mg on Day 1; 200 mg on Day 2; 400 mg on Day 3; 600 mg on Day 4 and onwardb | Cycle 1: 10,990 Cycle 2+: 11,760 | 162,548 |
Low-dose cytarabine | 100 mg/mL (5 mL vial) | Injectable solution | 76.8500 (15.3700 per mL) | 20 mg/m2 on days 1 to 10b,c | 769 | 10,018 |
100 mg/mL (20 mL vial) | Injectable solution | 306.5000 (15.3250 per mL) | ||||
Venetoclax + low-dose cytarabine | Cycle 1: 11,759 Cycle 2+: 12,529 | 172,566 | ||||
Non-intensive Chemotherapies | ||||||
Azacitadined | 100 mg | Powdered suspension | 599.9900 (5.9999 per mg) | 75 mg/m2 daily for days 1 to 7 | 8,400 | 109,498 |
Low-dose cytarabinec | 100 mg/mL (5 mL vial) | Injectable solution | 76.8500 (15.37 per mL) | 20 mg/m2, days 1 to 10 | 769 | 10,018 |
100 mg/mL (20 mL vial) | Injectable solution | 306.5000 (15.3250 per mL) | ||||
Induction Therapy (“7 + 3”) e | ||||||
Cytarabine | 100 mg/mL (5 mL vial) | Injectable solution | 76.8500 (15.37 per mL) | 100 mg/m2, days 1 to 7 200 mg/m2, days 1 to 7f | 538 | N/A |
100 mg/mL (20 mL vial) | Injectable solution | 306.5000 (15.3250 per mL) | ||||
Daunorubicin | 20 mg | Powdered solution | 91.0000 | 60 mg/m2 IV days 1 to 3e | 1,638 | N/A |
Idarubicin | 1 mg/mL (5 mL vial) | IV solution | 211.5200 (42.304 per mL) | 12 mg/m2 days 1, 2, 3e,f | 3,173 | N/A |
7+3 Induction Therapy (Cytarabine 100 or 200 mg/m2 + Daunorubicin 60 mg/m2)f | 2,176 | N/A | ||||
7+3 Induction Therapy (Cytarabine 200 mg/m2 + Idarubicin 12mg/m2)f | 3,711 | N/A | ||||
FLAG-IDA (first-line and salvage therapy) | ||||||
Filgrastim | 0.30 mg/0.5mL | Pre-filled syringe | 144.3135 (per 0.5mL pre-filled syringe) | 0.30 mg Days 1 to 4 | 577 | 7,525 |
0.30 mg/mL | Vial | 176.1330 | ||||
0.480 mg/0.8mL | Pre-filled syringe | 230.9000 230.9017 | ||||
0.480 mg/1.6mL | Vial | 230.9000 | ||||
0.600 mg/mL | Vial | 352.2650 (mL in 10 x 0.8 mL pen) 352.2660 (mL in 10 x 0.5 mL pen) | ||||
Idarubicin | 1 mg/mL (5 mL vial) | IV solution | 211.5200 (42.3040 per mL) | 10 mg/m2 Days 1 to 2 | 1,692 | 22,059 |
Fludarabine | 10 mg | Tablet | 40.0760h | 30 mg/m2 Days 1 to 4 | 962 | 12,538 |
Cytarabine | 100 mg/mL (5 mL vial) | Injectable solution | 76.8500 (15.37 per mL) | 2000 mg/m2 Days 1 to 4 | 2,452 | 31,964 |
100 mg/mL (20 mL vial) | Injectable solution | 306.5000 (15.3250 per mL) | ||||
FLAG-IDA (first-line and salvage therapy) | 5,683 | 74,082 | ||||
AML = acute myeloid leukemia; LDAC = low-dose cytarabine; N/A = Not applicable due to being a single cycle for induction (see Regimen Monograph)
Note: All prices are from the IQVIA (DeltaPA database) (accessed March 26, 2021), unless otherwise indicated, and do not include dispensing fees. Where applicable, assumes 1.81 m2 and no vial sharing.
aSponsor-submitted price.
bBased on 28-day cycles as per Venclexta product monograph.14
cCytarabine product monograph.
dAzacitidine product monograph.15
e3+7 protocol as per Cancer Care Ontario.16
fAs per CL expert input from CADTH’s review of Vyxeos.
gEvery 28 days as per Cancer Care Ontario regimen monograph FLAG-IDA.17
hPrice obtained from the Ontario Drug Benefit Formulary.18
Appendix 2: Submission Quality
Note that this appendix has not been copy-edited.
Description | Yes/No | Comments |
|---|---|---|
Population is relevant, with no critical intervention missing, and no relevant outcome missing | No | Missing IC as a relevant treatment. |
Model has been adequately programmed and has sufficient face validity | No | The sponsor used numerous IFERROR statements in their model. IFERROR statements lead to situations in which the parameter value is over-written with an alternative value without alerting the user to the automatized overwriting. The systematic use of IFERROR statements makes thorough auditing of the sponsor’s model impossible, as it remains unclear whether the model is running inappropriately by overriding errors. Best programming practices are such that any errors alert the user to a specific error. |
Model structure is adequate for decision problem | No | The PSM has a structural assumption that EFS and OS are independent, this can result in substantial benefits after individuals have exited the event-free state and are no longer on first-line treatment. |
Data incorporation into the model has been done adequately (e.g., parameters for probabilistic analysis) | Yes | NA |
Parameter and structural uncertainty were adequately assessed; analyses were adequate to inform the decision problem | Yes | NA |
The submission was well organized and complete; the information was easy to locate (clear and transparent reporting; technical documentation available in enough details) | Yes | NA |
NA = not applicable
Appendix 3: Additional Information on the Submitted Economic Evaluation
Note that this appendix has not been copy-edited.
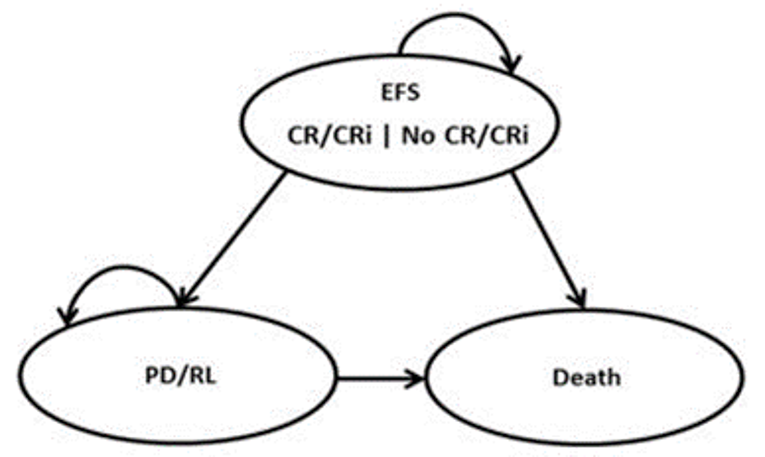
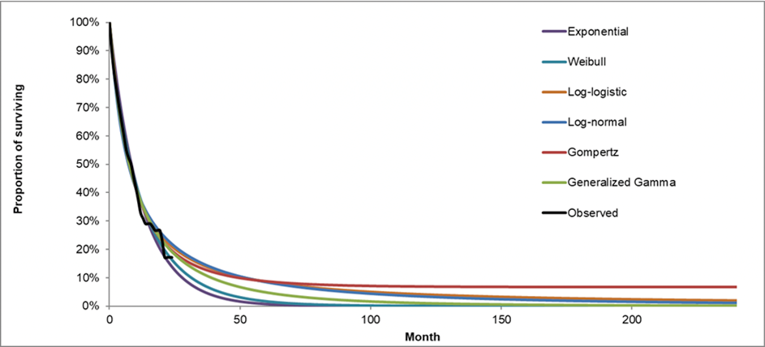
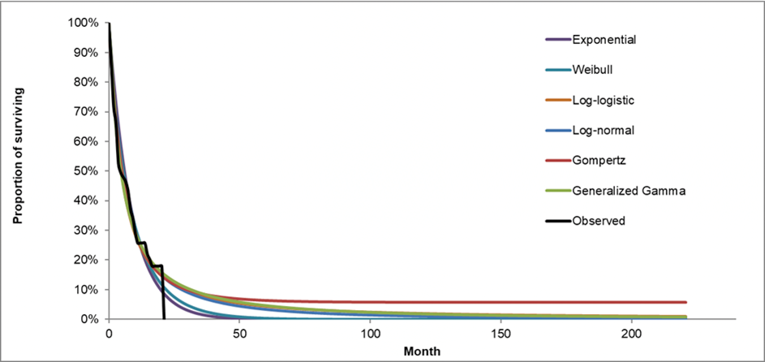
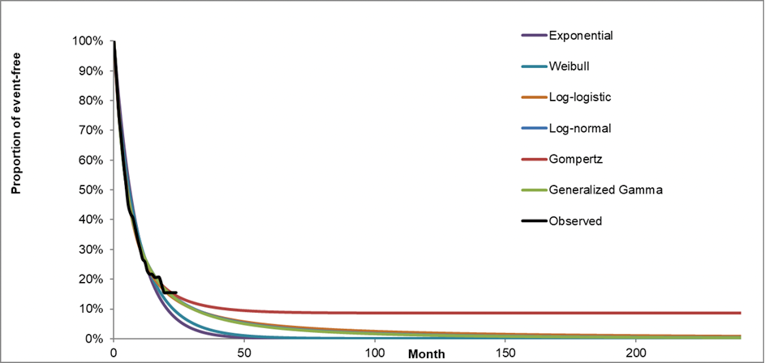
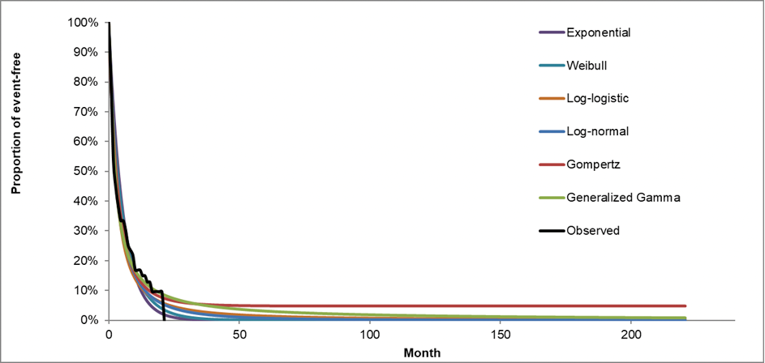
Table 10: Total Drug Acquisition and Administration Cost per Treatment
Treatment | Median treatment duration (cycle) | Source of treatment duration | Drug and administration costs for the first cycle (CAD) | Drug and administration costs for subsequent cycles (CAD) |
|---|---|---|---|---|
VEN-LDAC | 4.46 | VIALE-C trial | $10,517.37 | $10,959.85 |
LDAC | 1.85 | VIALE-C trial | $1,441.82 | $1,441.82 |
LDAC: low-dose cytarabine; VEN-LDAC: venetoclax in combination with low-dose cytarabine.
Table 11: Disaggregated Summary of Sponsor’s Submitted Economic Evaluation Results
Treatment | Component | Value | Incremental (vs. BSC) |
|---|---|---|---|
Discounted LY | |||
BSC | Event-free survival | 0.32 | NA |
PD/RL | 0.32 | NA | |
Total LYs | 0.64 | NA | |
LDAC | Event-free survival | 0.87 | 0.56 |
PD/RL | 0.3 | –0.02 | |
Total LYs | 1.17 | 0.53 | |
VEN-LDAC | Event-free survival | 1.23 | 0.91 |
PD/RL | 0.78 | 0.46 | |
Total LYs | 2.01 | 1.37 | |
Discounted QALYs | |||
BSC | Event-free survival with CR/CRi | 0 | NA |
Event-free survival without CR/CRi | 0.26 | NA | |
PD/RL | 0.24 | NA | |
Total QALYs | 0.49 | NA | |
LDAC | Event-free survival with CR/CRi | 0.09 | 0.09 |
Event-free survival without CR/CRi | 0.62 | 0.36 | |
PD/RL | 0.22 | –0.02 | |
Total QALYs | 0.92 | 0.43 | |
VEN-LDAC | Event-free survival with CR/CRi | 0.45 | 0.45 |
Event-free survival without CR/CRi | 0.54 | 0.28 | |
PD/RL | 0.57 | 0.34 | |
Total QALYs | 1.56 | 1.07 | |
Discounted costs ($) | |||
BSC | Initial Treatment Costs | $0 | NA |
Subsequent Treatment Costs | $760 | NA | |
Subsequent HSCT Costs | $0 | NA | |
Adverse Event Costs | $2,599 | NA | |
Medical Costs | $31,556 | NA | |
Total Costs | $34,916 | NA | |
LDAC | Initial Treatment Costs | $3,117 | $3,117 |
Subsequent Treatment Costs | $4,834 | $4,073 | |
Subsequent HSCT Costs | $0 | $0 | |
Adverse Event Costs | $4,492 | $1,893 | |
Medical Costs | $37,770 | $6,213 | |
Total Costs | $50,213 | $15,297 | |
VEN-LDAC | Initial Treatment Costs | $64,233 | $64,233 |
Subsequent Treatment Costs | $2,047 | $1,287 | |
Subsequent HSCT Costs | $0 | $0 | |
Adverse Event Costs | $4,645 | $2,046 | |
Medical Costs | $57,581 | $26,025 | |
Total Costs | $128,506 | $93,591 | |
Sequential ICER ($/QALY) | ICER vs. BSC ($ per QALY) | ||
BSC | Reference | Reference | |
LDAC | $35,682 | $35,682 | |
VEN-LDAC | $122,766 | $87,759 | |
CR: complete remission; CRi: complete remission with incomplete blood count recovery; EFS: event-free survival; KOL: Key opinion leader; PD/RL: progressive or relapsed disease; NA = not applicable.
Source: Sponsor’s submission
Table 12: Sponsor’s Submitted Scenario Analysis Results
Scenario | ICER for LDAC vs. BSC ($/QALY) | ICER for VEN-LDAC vs. BSC ($/QALY) | |
|---|---|---|---|
Base case | $35,682 | $87,759 | |
1 | Median Treatment Duration | $41,600 | $97,736 |
2 | Excluding cure assumption | $50,455 | $95,932 |
3 | 10-year time horizon | $43,497 | $107,186 |
ICER = incremental cost-effectiveness ratio; QALY = quality-adjusted life-year; vs. = versus; VEN-LDAC = venetoclax plus low-dose cytarabine. LDAC = low-dose cytarabine; BSC = best supportive care.
Appendix 4: Additional Details on the CADTH Reanalyses and Sensitivity Analyses of the Economic Evaluation
Note that this appendix has not been copy-edited.
Detailed Results of CADTH Base Case
Table 13: Summary of the Stepped Analysis of the CADTH Reanalysis Results
Scenario | Drug | Total costs | Total QALYs | Sequential ICER |
|---|---|---|---|---|
Sponsor’s base case | BSC | $34,916 | 0.492 | — |
LDAC | $50,213 | 0.921 | $35,682 | |
VEN-LDAC | $128,506 | 1.558 | $122,766 | |
1. Cure assumption = 10 year | BSC | $34,513 | 0.48 | — |
LDAC | $52,792 | 0.88 | $46,287 | |
VEN-LDAC | $136,011 | 1.54 | $126,361 | |
2. OS VEN-LDAC: exponential distribution. OS LDAC: exponential distribution | BSC | $29,882 | 0.38 | — |
LDAC | $49,607 | 0.87 | $40,554 | |
VEN-LDAC | $111,467 | 1.12 | $251,075 | |
CADTH Base case (1+2) | BSC | $29,882 | 0.38 | — |
LDAC | $50,003 | 0.82 | $46,333 | |
VEN-LDAC | $110,727 | 1.00 | $337,964 |
ED = Extendedly Dominated, ICER = incremental cost-effectiveness ratio; LY= life-year; QALY = quality-adjusted life-year; VEN-LDAC = venetoclax plus low-dose cytarabine. LDAC = low-dose cytarabine; BSC = best supportive care; OS = Overall Survival.
Table 14: Disaggregated Summary of CADTH’s Economic Evaluation Results
Treatment | Component | Value | Incremental (vs. BSC) |
|---|---|---|---|
Discounted LY | |||
BSC | Event-free survival | 0.32 | NA |
PD/RL | 0.18 | NA | |
Total LYs | 0.49 | NA | |
LDAC | Event-free survival | 0.80 | 0.48 |
PD/RL | 0.24 | 0.06 | |
Total LYs | 1.04 | 0.55 | |
VEN-LDAC | Event-free survival | 1.07 | 0.75 |
PD/RL | 0.19 | 0.02 | |
Total LYs | 1.26 | 0.77 | |
Discounted QALYs | |||
BSC | Event-free survival with CR/CRi | 0.00 | NA |
Event-free survival without CR/CRi | 0.25 | NA | |
PD/RL | 0.13 | NA | |
Total QALYs | 0.38 | NA | |
LDAC | Event-free survival with CR/CRi | 0.08 | 0.08 |
Event-free survival without CR/CRi | 0.57 | 0.31 | |
PD/RL | 0.17 | 0.05 | |
Total QALYs | 0.82 | 0.43 | |
VEN-LDAC | Event-free survival with CR/CRi | 0.39 | 0.39 |
Event-free survival without CR/CRi | 0.47 | 0.22 | |
PD/RL | 0.14 | 0.01 | |
Total QALYs | 1.00 | 0.61 | |
Discounted costs ($) | |||
BSC | Initial treatment costs | $0 | NA |
Subsequent treatment costs | $768 | NA | |
Subsequent HSCT costs | $0 | NA | |
AE costs associated with initial treatment | $2,612 | NA | |
Medical costs | $26,502 | NA | |
Total costs | $29,882 | NA | |
LDAC | Initial treatment costs | $4,648 | $4,648 |
Subsequent treatment costs | $4,851 | $4,083 | |
Subsequent HSCT costs | $0 | $0 | |
AE costs associated with initial treatment | $4,537 | $1,925 | |
Medical costs | $35,967 | $9,465 | |
Total costs | $50,003 | $20,121 | |
VEN-LDAC | Initial treatment costs | $67,659 | $67,659 |
Subsequent treatment costs | $2,044 | $1,275 | |
Subsequent HSCT costs | $0 | $0 | |
AE costs associated with initial treatment | $4,644 | $2,032 | |
Medical costs | $36,380 | $9,878 | |
Total costs | $110,727 | $80,845 | |
ICER vs. BSC | Sequential ICER | ||
BSC | — | — | |
LDAC | $45,730 | $46,333 | |
VEN-LDAC | $130,395 | $337,964 | |
AE = adverse event; ICER = incremental cost-effectiveness ratio; LY = life-year; NA = not applicable; QALY = quality-adjusted life-year; vs. = versus; VEN-LDAC = venetoclax in combination with low-dose cytarabine; LDAC = low-dose cytarabine; BSC = best supportive care; NA = not applicable
Scenario Analyses
Table 15: Summary of the CADTH Scenario Analysis
Scenario | Drug | Sequential ICER ($/QALY) |
|---|---|---|
1. Second best-fitting according to BIC for all models. VEN-LDAC: OS =gompertz, EFS =log-normal. LDAC = OS = log-logistic, PFS = log-normal. | BSC | Reference |
LDAC | $64,248 | |
VEN-LDAC | $114,029 | |
2. For all treatments, time on first-line treatments is the same as time event-free. | BSC | Reference |
LDAC | $87,424 | |
VEN-LDAC | $754,852 |
ICER = incremental cost-effectiveness ratio; LY= life-year; QALY = quality-adjusted life-year; ED = Extendedly Dominated; VEN-LDAC = venetoclax in combination with low-dose cytarabine. LDAC = low-dose cytarabine; BSC = best supportive care.
Additionally, CADTH conducted 2 exploratory scenario analyses. The first set the model time horizon to that of VIALE-C to quantify the amount of health and cost outcomes incurred during that period. The second exploratory analysis included venetoclax in combination with azacitidine (VEN-AZA) as a comparator, as CADTH experts indicated there maybe potential overlap in the population that would receive either VEN-AZA or VEN-LDAC. The results of these analyses are presented in Table 16.
Table 16: Summary of the CADTH Exploratory Scenario Analysis
Exploratory analysis | Drug | Sequential ICER ($/QALY) |
|---|---|---|
1. Considering VEN-AZA a comparator. | BSC | Reference |
LDAC | $44,583 | |
VEN-AZA | $117,538 | |
VEN-LDAC | ED | |
2. Time horizon is equal to that of the pivotal trial (2 years). | BSC | Reference |
LDAC | $89,923 | |
VEN-LDAC | $395,156 |
ICER = incremental cost-effectiveness ratio; LY= life-year; QALY = quality-adjusted life-year; ED = Extendedly Dominated; VEN-LDAC = venetoclax in combination with low-dose cytarabine. LDAC = low-dose cytarabine; BSC = best supportive care.
Appendix 5: Submitted Budget Impact Analysis and CADTH Appraisal
Note that this appendix has not been copy-edited.
Table 17: Summary of Key Take-Aways
Key take-aways of the business impact analysis |
|---|
|
Summary of Sponsor’s Business Impact Analysis
In the submitted budget impact analysis (BIA), the sponsor assessed the introduction of venetoclax for adults with newly diagnosed AML who are 75 years or older, or who are between the ages of 18 and 74 who have comorbidities that preclude the use of intensive induction chemotherapy.19 The BIA was undertaken from the perspective of the public health care payer in the Canadian setting (excluding Quebec) over a 3-year time horizon. In the reference scenario, the sponsor assumed that these patients would be eligible to receive either azacitidine monotherapy, or low-dose cytarabine. In the new drug scenario, VEN-LDAC was assumed to displace all market shares from azacitidine monotherapy.19
By leveraging data from multiple sources in the literature and assumptions based on clinical expert input, the sponsor estimated the eligible population size using an epidemiological approach. Only drug acquisition costs were considered without assuming drug wastage for azacitidine monotherapy and LDAC.19
Key inputs to the BIA are documented in Table 18.
Table 18: Summary of Key Model Parameters
Parameter | Sponsor’s estimate (reported as year 1/year 2/year 3 if appropriate) |
|---|---|
Target population | |
Incidence | 0.004% |
Proportion ineligible for induction chemotherapy | 50% |
Percentage of patients aged less than 65 years | 12% |
Percentage of patients aged less than 65 years, covered by public drug plans | 58.9% |
Percentage of patients aged 65 years and over | 88% |
Percentage of patients aged 65 years and over, covered by public drug plans | 100% |
Number of patients eligible for drug under review | 544 / 552 / 559 |
Market Uptake (3 years) | |
Uptake (reference scenario) LDAC monotherapy Azacitidine monotherapy BSC Other | 83.8% / 83.8% / 83.8% 9.5% / 9.5% / 9.5% 4.8% / 4.8% / 4.8% 1.9% / 1.9% / 1.9% |
Uptake (new drug scenario) Venetoclax + LDAC LDAC monotherapy Azacitidine monotherapy BSC Other | 1.9% / 3.8% / 5.2% 7.6% / 5.7% / 4.3% 83.8% / 83.8% / 83.8% 4.8% / 4.8% / 4.8% 1.9% / 1.9% / 1.9% |
Cost of treatment (per patient) | |
Cost of treatment per treatment coursea Venetoclax + LDAC LDAC monotherapy Azacitidine monotherapy BSC Other | $79,786.00 $69.73 $39,682.55 $0 $0 |
BSC = best supportive care; LDAC = low-dose cytarabine
aBased on mean number of treatment cycles, as per the sponsor’s base case.19
Summary of the Sponsor’s BIA Results
Results of the sponsor’s base-case analysis revealed VEN-LDAC in patients with newly diagnosed AML who are 75 years or older, or who are between the ages of 18 and 74 who have comorbidities that preclude the use of intensive induction chemotherapy would result in incremental costs of $825,490 in Year 1, $1,673,422 in Year 2, $2,332,232 in Year 3, for a total incremental cost of $4,831,144 over the 3-year time horizon.19
CADTH Appraisal of the Sponsor’s BIA
CADTH identified several key limitations to the sponsor’s analysis that have notable implications on the results of the BIA:
Exclusion of relevant comparators: As per the Health Canada indication and the sponsor’s submitted reimbursement request, the submitted pharmacoeconomic model for (VEN-LDAC) is indicated for the treatment of patients with newly diagnosed AML who are 75 years or older, or who are between the ages of 18 and 74 who have comorbidities that preclude the use of intensive induction chemotherapy. Feedback from clinical experts consulted by CADTH for this review indicates that induction chemotherapy is a common first-line treatment option for patients with AML over the age of 75. These experts estimated that as many as 50% of patients 75 years or older would likely receive IC if Venclexta-based approaches were not available. As such, CADTH considers IC a relevant comparator for both combination treatments: VEN+AZA and VEN-LDAC.
CADTH was unable to address this limitation.
Uncertainty in the uptake of venetoclax in combination with LDAC: The sponsor anticipated that VEN-LDAC would capture approximately 2%, 4% and 5% of the market share distribution in years 1, 2, and 3, by only displacing the market share from patients receiving LDAC monotherapy. CADTH’s clinical experts noted uncertainty in the uptake rate of VEN-LDAC, as they expected VEN-LDAC also to capture market shares from azacitidine monotherapy. Uncertainty was further raised regarding the market share distribution of VEN-LDAC in a world where VEN-AZA was also publicly funded.
CADTH addressed this limitation by revising the market share uptake of VEN-LDAC to 26.9% in Year 1, 53.8% in Year 2, and 65.2% in Year 3 and revising the market share uptake of azacitidine monotherapy to 60.7% in Year 1, 35.7% in Year 2, and 25.7% in Year 3, respectively.
Uncertainty regarding the number of patients eligible to receive VEN-LDAC: The sponsor used an epidemiological approach to identify the patient population eligible to receive VEN-LDAC which resulted in a total number of 544, 552, and 559 patients in years 1, 2, and 3, respectively. The clinical experts consulted by CADTH indicated that these numbers appeared to be lower than expected, and they noted several areas of uncertainty with the estimates and assumptions used to derive the market size. First, the sponsor used an incident approach and did not consider prevalence statistics as part of their methodological approach to estimating the market size, which would include the proportion of patients who are currently being treated for the condition and eligible for the treatment (i.e., those who are currently on azacitidine or low-dose cytarabine). Second, the sponsor assumed that approximately 59% of patients less than 65 years of age who would be eligible for publicly funded coverage across Canada, however, CADTH’s clinical experts expressed their uncertainty with this estimate, noting that they felt it was high. Lastly, the sponsor assumed that approximately 50% of patients would be ineligible for induction chemotherapy, however, CADTH’s clinical experts noted that this was likely overestimated since approximately 10% of patients over the age of 75 are expected to receive induction chemotherapy in Canadian clinical practice rather than none. As such, approximately 10% fewer newly diagnosed patients with AML were expected to be ineligible to receive induction chemotherapy, and a range of 30% to 50% of patients may be in eligible.
CADTH partially addressed this limitation by revising the proportion of newly diagnosed patients who were ineligible for induction chemotherapy to 40%. In a scenario analysis, CADTH explored the assumption that (i) 30% and (ii) 50% of newly diagnosed patients were ineligible for induction chemotherapy. To further address the uncertainty in the estimated market size, CADTH conducted scenario analyses to decrease the proportion of patients less than the age of 65 years covered by public drug plans by 10%, and varied the target population by +/-10%.
Misalignment of drug cost inputs between the sponsor-submitted pharmacoeconomic and budget impact analyses: Several drug cost inputs affecting cost calculations in the sponsor-submitted BIA did not align with drug cost inputs in the pharmacoeconomic analysis. First, the sponsor applied a cost for LDAC based on an expired wholesale price in the IQVIA database rather than based on the available wholesale price aligned with the concentration in the product monograph for cytarabine for injection. To align with CADTH’s cost comparison table, the price for LDAC was corrected to reflect available pricing, at $76.85 per vial. Second, while sponsor appropriate assumed drug wastage in the pharmacoeconomic analysis (i.e., no vial sharing for both, azacitidine monotherapy and LDAC), in contrast, vial sharing was assumed in the BIA. Drug wastage should be assumed for intravenous treatments as it is unlikely for patients to share vials, and without accounting for drug wastage, the total daily cost for these comparator treatments would be underestimated. Lastly, the sponsor extrapolated time on treatment based on the median time on treatment. To align with the pharmacoeconomic analysis, the median time on treatment was further selected in the BIA rather than using the mean time on treatment, as the clinical experts consulted by CADTH indicated the median was appropriate.
CADTH addressed this limitation by correcting the cost of LDAC, assuming drug wastage for the comparator regimens, and selecting the median time on treatment to calculate treatment duration.
CADTH Reanalyses of the BIA
A table noting the changes made to the sponsor’s BIA as part of CADTH’s reanalysis is available in Table 19.
Table 19: CADTH Revisions to the Submitted Budget Impact Analysis
Stepped analysis | Sponsor’s value or assumption | CADTH value or assumption |
|---|---|---|
Corrections to sponsor’s base case | ||
None | ||
Changes to derive the CADTH base case | ||
1. Market share estimates in the new drug scenario (across Years 1 to 3) | VEN-LDAC: 1.9% / 3.8% / 5.2% Azacitidine monotherapy: 7.6% / 5.7% / 4.3% LDAC monotherapy: 83.8% / 83.8% / 83.8% Other: 1.9% / 1.9% / 1.9% | VEN-LDAC: 26.9% / 53.8% / 65.2% Azacitidine monotherapy: 7.6% / 5.7% / 4.3% LDAC monotherapy: 60.7% / 35.7% / 25.7% Other: 0.0% / 0.0% / 0.0% |
2. Approach to derive market size | Proportion of newly diagnosed patients ineligible for induction chemotherapy = 50% | Proportion of newly diagnosed patients ineligible for induction chemotherapy = 40% |
3. Alignment of drug cost inputs | a. Lower cost of LDAC = $33.75 per vial (or $6.75 per mL [20 mg/mL in 5 mL vial]) b. Drug wastage = excluded c. Treatment duration based on the mean time on treatment | a. Cost of LDAC = $76.85 per vial (or $15.37 per mL [100 mg/mL in 5 mL vial]) b. Drug wastage = included c. Treatment duration based on the median time on treatment |
CADTH base case | Reanalysis 1 + 2 + 3 | |
BSC = best supportive care; LDAC = low-dose cytarabine; VEN = venetoclax.
The results of the CADTH stepwise reanalysis are presented in summary format in Table 20 and a more detailed breakdown is presented in Table 21.
Table 20: Summary of the CADTH Reanalyses of the BIA
Stepped analysis | 3-year total |
|---|---|
Submitted base case | $4,831,144 |
CADTH reanalysis 1 | $36,145,216 |
CADTH reanalysis 2 | $3,864,915 |
CADTH reanalysis 3 | $4,959,783 |
CADTH base case | $13,124,920 |
BIA = budget impact analysis.
CADTH also conducted additional scenario analyses to address the remaining uncertainty regarding the potential size of the eligible population:
Assumed fewer patients less than the age of 65 years may be eligible for public drug plan coverage by decreasing the proportion by (a) 10% and (b) 25%.
Assumed that (a) 30% and (b) 50% of patients newly diagnosed with AML may be ineligible for induction chemotherapy.
Explored the impact of varying the estimated market size by +/- 10%.
Assumed that the treatment duration was reflected by the mean time on treatment to calculate drug acquisition costs.
Applied a 92% price reduction for venetoclax.
Table 21: Detailed Breakdown of the CADTH Reanalyses of the BIA
Stepped analysis | Scenario | Year 0 (current situation) | Year 1 | Year 2 | Year 3 | 3-year total |
|---|---|---|---|---|---|---|
Submitted base case | Reference | $17,859,974 | $18,102,739 | $18,348,804 | $18,598,214 | $55,049,757 |
New drug | $17,859,974 | $18,928,230 | $20,022,226 | $20,930,445 | $59,880,901 | |
Budget impact | $0 | $825,490 | $1,673,422 | $2,332,232 | $4,831,144 | |
CADTH base case | Reference | $14,156,118 | $14,348,538 | $14,543,573 | $14,741,259 | $43,633,370 |
New drug | $14,156,118 | $16,856,719 | $19,294,978 | $20,606,592 | $56,758,289 | |
Budget impact | $0 | $2,508,181 | $4,751,405 | $5,865,333 | $13,124,920 | |
CADTH scenario analysis 1a | Reference | $13,977,486 | $14,167,477 | $14,360,051 | $14,555,243 | $43,082,772 |
New drug | $13,977,486 | $16,644,009 | $19,051,500 | $20,346,563 | $56,042,072 | |
Budget impact | $0 | $2,476,531 | $4,691,448 | $5,791,320 | $12,959,300 | |
CADTH scenario analysis 1b | Reference | $13,709,486 | $13,895,835 | $14,084,717 | $14,276,166 | $42,256,718 |
New drug | $13,709,486 | $16,324,882 | $18,686,213 | $19,956,445 | $54,967,540 | |
Budget impact | $0 | $2,429,047 | $4,601,496 | $5,680,279 | $12,710,823 | |
CADTH scenario analysis 2a | Reference | $10,617,089 | $10,761,403 | $10,907,680 | $11,055,944 | $32,725,027 |
New drug | $10,617,089 | $12,642,539 | $14,471,234 | $15,454,944 | $42,568,717 | |
Budget impact | $0 | $1,881,136 | $3,563,554 | $4,399,000 | $9,843,690 | |
CADTH scenario analysis 2b | Reference | $17,695,148 | $17,935,672 | $18,179,466 | $18,426,574 | $54,541,712 |
New drug | $17,695,148 | $21,070,899 | $24,118,723 | $25,758,241 | $70,947,862 | |
Budget impact | $0 | $3,135,227 | $5,939,256 | $7,331,667 | $16,406,150 | |
CADTH scenario analysis 3a (+10%) | Reference | $14,156,118 | $15,783,392 | $15,997,930 | $16,215,385 | $47,996,707 |
New drug | $14,156,118 | $18,542,391 | $21,224,476 | $22,667,252 | $62,434,118 | |
Budget impact | $0 | $2,758,999 | $5,226,546 | $6,451,867 | $14,437,412 | |
CADTH scenario analysis 3b (-10%) | Reference | $14,156,118 | $14,241,713 | $14,435,296 | $14,631,511 | $43,308,521 |
New drug | $14,156,118 | $16,731,221 | $19,151,328 | $20,453,177 | $56,335,726 | |
Budget impact | $0 | $2,489,508 | $4,716,031 | $5,821,666 | $13,027,205 | |
CADTH scenario analysis 4 | Reference | $22,103,496 | $22,403,942 | $22,708,472 | $23,017,141 | $68,129,555 |
New drug | $22,103,496 | $26,206,408 | $29,897,535 | $31,890,641 | $87,994,585 | |
Budget impact | $0 | $3,802,466 | $7,189,063 | $8,873,500 | $19,865,030 | |
CADTH scenario analysis 5 | Reference | $14,156,118 | $14,348,538 | $14,543,573 | $14,741,259 | $43,633,370 |
New drug | $14,156,118 | $11,288,531 | $8,007,230 | $6,741,074 | $26,036,836 | |
Budget impact | $0 | –$3,060,006 | –$6,536,343 | –$8,000,185 | –$17,596,534 |
BIA = budget impact analysis.
ISSN: 2563-6596
Disclaimer: The information in this document is intended to help Canadian health care decision-makers, health care professionals, health systems leaders, and policy-makers make well-informed decisions and thereby improve the quality of health care services. While patients and others may access this document, the document is made available for informational purposes only and no representations or warranties are made with respect to its fitness for any particular purpose. The information in this document should not be used as a substitute for professional medical advice or as a substitute for the application of clinical judgment in respect of the care of a particular patient or other professional judgment in any decision-making process. The Canadian Agency for Drugs and Technologies in Health (CADTH) does not endorse any information, drugs, therapies, treatments, products, processes, or services.
While care has been taken to ensure that the information prepared by CADTH in this document is accurate, complete, and up-to-date as at the applicable date the material was first published by CADTH, CADTH does not make any guarantees to that effect. CADTH does not guarantee and is not responsible for the quality, currency, propriety, accuracy, or reasonableness of any statements, information, or conclusions contained in any third-party materials used in preparing this document. The views and opinions of third parties published in this document do not necessarily state or reflect those of CADTH.
CADTH is not responsible for any errors, omissions, injury, loss, or damage arising from or relating to the use (or misuse) of any information, statements, or conclusions contained in or implied by the contents of this document or any of the source materials.
This document may contain links to third-party websites. CADTH does not have control over the content of such sites. Use of third-party sites is governed by the third-party website owners’ own terms and conditions set out for such sites. CADTH does not make any guarantee with respect to any information contained on such third-party sites and CADTH is not responsible for any injury, loss, or damage suffered as a result of using such third-party sites. CADTH has no responsibility for the collection, use, and disclosure of personal information by third-party sites.
Subject to the aforementioned limitations, the views expressed herein are those of CADTH and do not necessarily represent the views of Canada’s federal, provincial, or territorial governments or any third party supplier of information.
This document is prepared and intended for use in the context of the Canadian health care system. The use of this document outside of Canada is done so at the user’s own risk.
This disclaimer and any questions or matters of any nature arising from or relating to the content or use (or misuse) of this document will be governed by and interpreted in accordance with the laws of the Province of Ontario and the laws of Canada applicable therein, and all proceedings shall be subject to the exclusive jurisdiction of the courts of the Province of Ontario, Canada.
The copyright and other intellectual property rights in this document are owned by CADTH and its licensors. These rights are protected by the Canadian Copyright Act and other national and international laws and agreements. Users are permitted to make copies of this document for non-commercial purposes only, provided it is not modified when reproduced and appropriate credit is given to CADTH and its licensors.
About CADTH: CADTH is an independent, not-for-profit organization responsible for providing Canada’s health care decision-makers with objective evidence to help make informed decisions about the optimal use of drugs, medical devices, diagnostics, and procedures in our health care system.
Funding: CADTH receives funding from Canada’s federal, provincial, and territorial governments, with the exception of Quebec.