CADTH Reimbursement Review
Encorafenib in Combination With Binimetinib (Braftovi and Mektovi)
Sponsor: Pfizer Canada ULC
Therapeutic area: Advanced melanoma
This multi-part report includes:
Clinical Review
Pharmacoeconomic Review
Clinical Review
Abbreviations
AE
adverse event
AJCC
American Joint Committee on Cancer
BIRC
Blinded Independent Review Committee
BOR
best overall response
BRAFi
BRAF inhibitor
CNS
central nervous system
CI
confidence interval
CR
complete response
CSR
clinical study report
DCR
disease control rate
DOR
duration of response
ECOG PS
Eastern Cooperative Oncology Group Performance Status
EORTC QLQ-C30
European Organisation for Research and Treatment of Cancer Quality of Life Questionnaire Core 30
EQ-5D-5L
EuroQol 5-Dimensions 5-Levels questionnaire
FACT-M
Functional Assessment of Cancer Therapy–Melanoma
FAS
full analysis set
HR
hazard ratio
HRQoL
health-related quality of life
INV
investigator
IO
immuno-oncology agent
IRC
independent review committee
ITC
indirect treatment comparison
LDH
lactate dehydrogenase
MEKi
MEK inhibitor
MID
minimal important difference
MNC
Melanoma Network of Canada
NE
not estimable
NICE
National Institute for Health and Care Excellence
NMA
network meta-analysis
ORR
objective response rate
OS
overall survival
pCODR
pan-Canadian Oncology Drug Review
pERC
pCODR Expert Review Committee
PD
progressive disease
PD1
programmed cell death protein 1
PFS
progression-free survival
PR
partial response
QoL
quality of life
RCT
randomized controlled trial
RECIST
Response Evaluation Criteria in Solid Tumors
SAE
serious adverse event
SD
standard deviation
SYSF
Save Your Skin Foundation
TTR
time to objective response
Executive Summary
An overview of the submission details for the drug under review is provided in Table 1.
Item | Description |
|---|---|
Drug product | Encorafenib (Braftovi), 75 mg oral capsules in combination with binimetinib (Mektovi), 15 mg oral tablets |
Indication | Braftovi (encorafenib) is indicated, in combination with binimetinib, for the treatment of patients with unresectable metastatic melanoma with a BRAF V600 mutation, as detected by a validated test. Mektovi (binimetinib) is indicated, in combination with encorafenib, for the treatment of patients with unresectable metastatic melanoma with a BRAF V600 mutation, as detected by a validated test. |
Reimbursement request | As per indication |
Health Canada approval status | NOC |
Health Canada review pathway | Standard review |
NOC date | March 2, 2021 |
Sponsor | Pfizer Canada ULC |
NOC = Notice of Compliance.
Introduction
Melanoma is a cancer that occurs in skin cells that produce melanin, known as melanocytes. Most cases of melanoma are clinically identified early and cured with surgical excision alone. In 2019, an estimated 8,000 Canadians were diagnosed with melanoma (4,400 males and 3,600 females) and 1,300 died from the disease.1 The lifetime probability of developing melanoma is 1 in 42 for males and 1 in 56 for females.2 In total, melanoma accounts for 3.8% of new cancer cases and 1.9% of cancer deaths per year for men and 3.3% cases and 1.2% deaths in women.3 Although the incidence of melanoma has increased, metastatic disease (defined as stage IV or unresectable stage III disease) remains relatively rare. The 5-year survival rate of metastatic disease remains low at 15% to 20% compared to individuals diagnosed early; the 5-year survival rate of stages I to II is 84% to 91%.4 A variety of genetic alterations exist within melanoma which influence cancer cell proliferation and treatment response. In melanoma, the MAPK pathway plays an important role controlling the cell cycle and survival. Within this cycle, effector molecules such as BRAF also contribute to cell cycle regulation. A single mutation, for example in the gene encoding the BRAF protein, can cause increased activation and lead to downstream signalling of the RAS/RAF/MEK/ERK pathway and dysregulated melanocyte proliferation, leading to cancer and potential metastases. Approximately 40% to 60% of melanoma cases include a BRAF mutation. Of these mutations, approximately 90% are BRAF V600E mutations, whereas 5% to 6% are BRAF V600K mutations.5 For these reasons, when a patient is diagnosed with metastatic melanoma, BRAF mutational analysis is often conducted.
Encorafenib is a selective BRAF inhibitor (BRAFi) that suppresses the RAS/RAF/MEK/ERK pathways inhibiting BRAF V600E, D, and K mutation-positive melanoma cell growth. Binimetinib is a reversible MEK inhibitor (MEKi) that inhibits proliferation of human BRAF-mutant melanoma cell lines and tumour growth. The recommended dose of encorafenib is 450 mg once daily and of binimetinib is 45 mg twice daily, both administered orally with or without food. The sponsor is requesting reimbursement of encorafenib in combination with binimetinib for the treatment of patients with unresectable or metastatic melanoma with a BRAF V600 mutation, as detected by a validated test. The drug combination was reviewed by Health Canada through the Standard Review Pathway and has not been previously reviewed by CADTH. The reimbursement request does not differ from the approved Health Canada indication.
The systematic review protocol for the current review was established before the Notice of Compliance was granted from Health Canada for encorafenib in combination with binimetinib. The objective of this CADTH Drug Reimbursement Review is to perform a systematic review of the beneficial and harmful effects of encorafenib in combination with binimetinib for the treatment of patients with unresectable or metastatic melanoma with a BRAF V600 mutation.
Stakeholder Perspectives
The information in this section is a summary of input provided by patient groups who responded to CADTH’s call for patient input and from clinical experts consulted by CADTH for the purpose of this review.
Patient Input
CADTH received joint submission from 2 patient groups, the Save Your Skin Foundation (SYSF) and Melanoma Network of Canada (MNC). Patients explained that pain, fatigue, depression, and disfigurement were common symptoms of metastatic disease that affect day-to-day life. Further, patients commented on the significant fear and anxiety associated with living with melanoma. Further, the disease can significantly impact their ability to work and can strain relationships with other family members, as well as affect their ability to form new relationships. Other difficulties reported were travelling to treatment centres, accessing treatments, financial costs of treatments, emotional hardships of dealing with the disease, and impact on family.
Patients had experience with a variety of treatments such as surgery, immunotherapies, radiation, and targeted therapies and reported side effects such as fatigue, fever, chills, rashes, gastrointestinal issues, arthritis, and autoimmune issues. Most patients reported that the side effects of treatments were manageable and that the benefits of the treatments outweighed the negative side effects. Patients who had experience with encorafenib in combination with binimetinib seemed to experience fewer side effects compared to previously used therapies and reported slower disease progression.
Patients explained that timely access to treatment, decreased side effects, access to oral medications for targeted therapy, and communication between physicians and surgeons regarding each patient’s treatment plan are important outcomes. Further, therapies that require less travel would not only save time, but also result in lower associated expenses such as parking and gas and decrease caregiver burden. This is of utmost importance given the current COVID-19 pandemic, as many patients have indicated that the ongoing pandemic has led to more fear and anxiety of visiting the hospital. Respondents stated that if the above outcomes were achieved, they would experience less anxiety and fear and have an improved quality of life (QoL). Overall, both surveys seemed to indicate that treatment with encorafenib in combination with binimetinib would provide patients and caregivers with prospects of prolonged survival and better QoL.
Clinician Input
The following input is a summary of information provided by 2 clinical specialists consulted by CADTH with expertise in the diagnosis and management of metastatic melanoma.
Encorafenib in combination with binimetinib joins similar BRAFi/MEKi agents in the treatment of metastatic melanoma. These agents include therapies such as dabrafenib in combination with trametinib (the most commonly used regimen) and vemurafenib in combination with cobimetinib. The clinical experts consulted by CADTH for this review indicated that encorafenib in combination with binimetinib will likely not cause a shift in the approach to the treatment of patients with metastatic melanoma, but may rather provide clinicians and patients with a novel BRAF-directed regimen with a novel toxicity profile, and provide an alternative for patients with BRAF V600-mutated melanoma who might demonstrate intolerance to currently available BRAFi regimens. The clinical experts noted that dabrafenib in combination with trametinib induces a pyrexia syndrome in approximately 60% of patients, which many patients find intolerable.
The clinical experts advise that eligible patients would be identified through BRAF mutational analysis and that this testing is currently performed as standard of care for patients with metastatic melanoma. A clinically meaningful response could encompass a wide range of factors such as improved survival, reduction in symptoms, improved activities of daily living, and QoL. The clinical experts in this review believe that there is a need for an additional BRAF/MEK treatment for patients with a BRAF mutation who are not tolerating current therapies.
Clinician Group Input
Two clinician groups provided input from the SYSF Medical Advisory Group and Ontario Health (Cancer Care Ontario) Skin Cancer Drug Advisory Committee. Overall, the clinician group input was similar to the clinical experts consulted in this review. There was consensus that encorafenib in combination with binimetinib represents an additional option that might be better tolerated for patients with BRAF-mutated metastatic melanoma. This tolerability means improved survival, QoL, and response rates and would be considered the treatment of choice for BRAF-mutated cases
Drug Program Input
Clinical experts were consulted by CADTH for questions related to treatment implementation of encorafenib in combination with binimetinib into current provincial drug plans. Overall, the main concerns were related to eligible population, optimal sequencing between existing immunotherapies and targeted treatments, trial characteristics, and tolerability (toxicity) concerns.
Clinical Evidence
Pivotal Studies and Protocol Selected Studies
Description of Studies
One pivotal trial, COLUMBUS (N = 577), was included in the CADTH systematic review. The COLUMBUS trial was a 2-part, multi-centre, randomized, open-label, phase III trial that aimed to compare the efficacy and safety of encorafenib in combination with binimetinib to vemurafenib monotherapy and encorafenib monotherapy in patients with locally advanced, unresectable or metastatic melanoma with BRAF V600 mutation. The COLUMBUS trial was conducted with adult patients 18 years of age and older with histologically confirmed, locally advanced, unresectable or metastatic BRAF V600 mutant cutaneous melanoma or unknown primary melanoma (stage IIIB, IIIC, or IV per the American Joint Committee on Cancer [AJCC]). The COLUMBUS trial was composed of 2 parts; however, data were only available for Part 1. In Part 1, patients with locally advanced, unresectable or metastatic melanoma with BRAF V600 mutation were randomized in a 1:1:1 ratio to 3 treatment arms: encorafenib 450 mg once daily and binimetinib 45 mg twice daily, encorafenib 300 mg once daily, and vemurafenib 960 mg twice daily. The purpose of Part 2 was to isolate the contribution of binimetinib to the combination by equalizing the encorafenib dose in both the combination and monotherapy arm to 300 mg each. Therefore, both encorafenib in combination with binimetinib and encorafenib arms had an equivalent dose.
Efficacy Results
The primary efficacy outcome was progression-free survival (PFS). Secondary efficacy outcomes included overall survival (OS), objective response rate (ORR), time to objective response (TTR), disease control rate (DCR), and duration of response (DOR). Health-related quality of life (HRQoL) was assessed by 3 scales: the Functional Assessment of Cancer Therapy–Melanoma (FACT-M), the European Organisation for Research and Treatment of Cancer Quality of Life Questionnaire Core 30 (EORTC QLQ-C30), and the EuroQol 5-Dimensions 5-Levels questionnaire (EQ-5D-5L). Part 1 efficacy data were primarily based on clinical study reports (CSRs) with 2 data cuts: May 19, 2016 and November 7, 2017. Further, 1 peer-reviewed journal that reported an updated data cut (November 2018) was included to supplement these results.6 The clinical experts consulted during this review indicated that both vemurafenib and encorafenib monotherapies were not relevant comparators to current standard of practice in the Canadian setting. The comparison with encorafenib monotherapy was deemed to be more appropriate than the comparison with vemurafenib as vemurafenib monotherapy is administered to less than 5% of patients with metastatic melanoma.
Progression-Free Survival
The primary efficacy end point was PFS between encorafenib in combination with binimetinib and vemurafenib monotherapy, as assessed by the Blinded Independent Review Committee (BIRC). At the time of primary analysis (2016),the encorafenib in combination with binimetinib arm demonstrated a 7.6 month longer PFS (median PFS = 14.9 months; 95% confidence interval [CI], 11.0 to 18.5) compared to the vemurafenib arm (median PFS = 7.3 months; 95% CI, 5.6 to 8.2). The encorafenib in combination with binimetinib arm did demonstrate a statistically significant difference (P < 0.001) when compared to the vemurafenib monotherapy arm.
PFS assessed by BIRC for the comparison between the encorafenib and binimetinib combination therapy arm and the encorafenib monotherapy arms of Parts 1 and Part 2 combined was a key secondary outcome in the COLUMBUS trial. At the time of the primary analysis, the encorafenib in combination with binimetinib arm demonstrated a 5.3 month longer PFS (median PFS = 14.9 months; 95% CI, 11.0 to 18.5) when compared to encorafenib monotherapy arm (median PFS = 9.6 months; 95% CI, 7.5 to 14.8); however, this was not statistically significant (P = 0.0256). The encorafenib in combination with binimetinib arm demonstrated a 25% risk reduction to disease progression or death compared to encorafenib monotherapy (hazard ratio [HR] = 0.75, 95% CI, 0.56 to 1.00).
The PFS results provided from November 2017 data cut were similar to those from the May 2016 cut-off. Median PFS remained consistent at 14.9 months (95% CI, 11.0 to 20.2) in the encorafenib in combination with binimetinib arm compared to 9.6 months (95% CI, 7.4 to 14.8) in the encorafenib arm and 7.3 months (95% CI, 7.4 to 14.8) in the vemurafenib arm. The encorafenib in combination with binimetinib arm demonstrated a 23% risk reduction to disease progression or death compared to encorafenib monotherapy (HR = 0.77; 95% CI, 0.59 to 1.00) and 49% risk reduction compared to vemurafenib (HR = 0.51; 95% CI, 0.39 to 0.67). The peer-reviewed journal article (data cut 2018) demonstrated 1-year updated PFS data. PFS for the encorafenib in combination with binimetinib arm remained consistent at 14.9 months (95% CI, 11.0 to 20.2) compared to 9.6 months for the encorafenib arm (95% CI, 7.4 to 14.8) and 7.3 months in the vemurafenib arm (95% CI, 5.6 to 7.9).6
Overall Survival
Given that the pre-specified criteria for hierarchical statistical testing was not met, formal testing of OS was not conducted for the comparison between the encorafenib and binimetinib combination therapy arm and encorafenib monotherapy arm, but rather was presented descriptively. The median OS was 33.6 months in the encorafenib in combination with binimetinib arm (95% CI, 24.4 to 39.2) versus 23.5 months (95% CI, 19.6 to 33.6) in the encorafenib monotherapy arm and 16.9 months in the vemurafenib monotherapy arm (95% CI, 14.0 to 24.5). Encorafenib in combination with binimetinib demonstrated a 19% risk reduction compared to encorafenib monotherapy (HR = 0.81; 95% CI, 0.61 to 1.06) (Figure 8) and 39% risk reduction compared to vemurafenib monotherapy (HR 0.61; 95% CI, 0.47 to 0.79). The comparison between encorafenib in combination with binimetinib and vemurafenib monotherapy was statistically significant (P < 0.001). The estimates of OS at 12 months and 24 months were 75.5% (95% CI, 68.8 to 81.0) and 57.6% (95% CI, 50.3 to 64.3) for encorafenib in combination with binimetinib compared to 74.6% (95% CI, 67.6 to 80.3) and 49.1% (95% CI, 41.5 to 56.2) for encorafenib.
As of November 2018,6 the median OS for the encorafenib in combination with binimetinib arm remained consistent as previously reported (33.6 months; 95% CI, 24.4 to 39.2) compared to the encorafenib arm (23.5 months; 95% CI, 19.6 to 33.6). Compared to vemurafenib, encorafenib in combination with binimetinib remained consistent at a 39% decreased risk of death (HR = 0.61; 95% CI, 0.48 to 0.79).6
Response
Overall, all response outcomes demonstrated estimates in favour of the encorafenib in combination with binimetinib arm. ORR was 63% (95% CI, 55.8 to 69.9) in the encorafenib in combination with binimetinib arm compared to 50.5% in the encorafenib arm and 40% in the vemurafenib arm. TTR by BIRC was similar across all treatment arms (2 months each). It was noted that this timing is due to the protocol design as the first tumour assessment was at cycle 3, day 1. DCR was 92.2% compared with 84.0% in the encorafenib arm and 81.7% in the vemurafenib arm. The median DOR for confirmed responses was 16.6 months for the encorafenib in combination with binimetinib arm (95% CI, 12.2 to 20.4). and 14.9 months in the encorafenib arm (95% CI, 11.1 to not estimable [NE]).
Health-Related Quality of Life
Patients at risk completed the HRQoL assessments from baseline through cycle 25, day 1 using 3 scales; FACT-M, EORTC QLQ-C30, and EQ-5D-5L; therefore, compliance does not reflect the entire study population but rather those who remained in the study. It is important to note that there is uncertainty in the validity of both scales for use with melanoma patients. A higher score demonstrates improvements in QoL. Neither arm met the minimal important difference (MID) for FACT-M, EORTC QLQ-C30 (10-point change), nor EQ-5D-5L (4.5-point change). Due to lack of type I error per-protocol testing hierarchy, HRQoL outcomes are considered exploratory.
Harms Results
Almost all patients in the COLUMBUS study experienced at least 1 adverse event (AE) (> 98%). The most common reported AEs in the encorafenib in combination with binimetinib arm (all grades) were nausea (41.1%), diarrhea (36.5%), fatigue (28.6%), and arthralgia (25.5%). Nausea and diarrhea occurred more frequently in the encorafenib in combination with binimetinib arm (41.1% and 36.5%, respectively) compared to encorafenib monotherapy (38.5% and 13.5%, respectively) and the vemurafenib arm (33.9% and 33.9%, respectively). However, the events of nausea, diarrhea, and fatigue, at less than grade 3 or 4, ranged from 1.6% to 4.2% across the 3 treatment arms. Further, almost all patients experienced a skin and subcutaneous tissue disorder (encorafenib 95.8%; vemurafenib 91.4%); however, this number was lower in the encorafenib in combination with binimetinib arm (65.1%). There was a total of 200 (35%) patients who experienced at least 1 serious adverse event (SAE). The incidence of grade 3 or 4 SAEs was lower in the encorafenib in combination with binimetinib arm (57.8%) compared to the 66.1% of patients in the encorafenib arm and 63.4% in the vemurafenib arm. The most common grade 3 or 4 event was pyrexia, which occurred more frequently in the encorafenib in combination of binimetinib arm (3.1%) versus the encorafenib (1%) and (0%) the vemurafenib monotherapy arm. Overall, 12.5% of patients receiving encorafenib in combination with binimetinib, 14.1% of patients receiving encorafenib, and 16.7% of patients receiving vemurafenib withdrew from treatment due to AEs. The most commonly cited reason in the encorafenib in combination with binimetinib arm was increased alanine aminotransferase and aspartate aminotransferase (2.6%). Mortality was comparable across treatment arms. The encorafenib in combination with binimetinib arm had a total of 17 deaths (8.9%) compared to 14 (7.3%) in the encorafenib and 19 (10.2%) in the vemurafenib arms. The majority of deaths (80%) were attributable to disease progression.
Table 2: Summary of Key Results
Outcome measures | Encorafenib and binimetinib N = 192 | Encorafenib N = 194 | Vemurafenib N = 191 |
|---|---|---|---|
Progression-free survival by BIRC (2016) | |||
Patients with events/patients included in analysis (%) | 98/192 (51.0) | 96/194 (49.5) | 106/191 (55.5) |
Median time, monthsa | 14.9 | 9.6 | 7.3 |
HR (95% CI)b | Reference group | 0.75 (0.56 to 1.00) | 0.54 (0.41 to 0.71) |
P valuec | Reference group | 0.0256 | < 0.001 |
Updated progression- free survival by BIRCh (2017) | |||
Median time, monthsa | 14.9 | 9.6 | 7.3 |
HR (95% CI)b | Reference group | 0.77 (0.59 to 1.00) | 0.51 (0.39 to 0.67) |
P valuec | Reference group | 0.0259 | < 0.0001 |
Updated progression- free survival by BIRC (2018)6 | |||
Median time, monthsa | 14.9 (11.0 to 20.2) | 9.6 (5.6 to 14.8) | 7.3 (5.6 to 7.9) |
HR (95% CI)b | Reference group | NA | 0.51 (0.39 to 0.67) |
P valuec | Reference group | NA | NA |
Overall survival (2017) | |||
Patients with events/patients included in analysis (%) | 105/192 (54.7) | 106/194 (54.6) | 127/191 (66.5) |
Median time, monthsa | 33.6 (24.4 to 39.2) | 23.5 (19.6 to 33.6) | 16.9 (14.0 to 24.5) |
HR (95% CI)b | Reference group | 0.81 (0.61 to 1.06) | 0.61 (0.47 to 0.79) |
P valuec | Reference group | 0.061 | < 0.001 |
Updated overall survival by BIRC (2018)6 | |||
Median time, monthsa | 33.6 (24.4 to 39.2) | 23.5 (19.6 to 33.6) | 16.9 (14.0 to 24.5) |
HR (95% CI)b | Reference group | NA | 0.61 (0.48 to 0.79) |
P valuec | Reference group | NA | NA |
BOR by BIRC | |||
Patients with measurable disease at baseline, n (%)e | 175 (91.1) | 180 (92.8) | 183 (95.8) |
Patients with non-measurable disease only at baseline, n (%)e | 15 (7.8) | 12 (6.2) | 8 (4.2) |
Confirmed ORR: CR + PR, n (%)f,g | 121 (63.0) | 98 (50.5) | 77 (40.3) |
95% CI | (55.8 to 69.9) | (43.3 to 57.8) | (33.3 to 47.6) |
DCR: CR + PR + stable disease + non-PD/non-CR, n (%) | 177 (92.2) | 163 (84.0) | 156 (81.7) |
95% CIe | (87.4 to 95.6) | (78.1 to 88.9) | (75.4 to 86.9) |
Unknownf | 11 (5.7) | 25 (12.9) | 22 (11.5) |
Not assessed | 2 (1.0) | 0 | 0 |
Time to objective response by BIRC | |||
All patients | |||
Patients with events/patients included in analysis (%) | 146/192 (76.0) | 120/194 (61.9) | 113/191 (59.2) |
Percentiles (95% CI) | |||
25th | 1.8 (1.8 to 1.8) | 1.8 (1.8 to 1.9) | 1.8 (1.8 to 1.9) |
50th | 1.9 (1.9 to 1.9) | 2.0 (1.9 to 3.6) | 2.1 (1.9 to 3.7) |
75th | 7.4 (3.7 to NE) | NE (NE to NE) | NE (NE to NE) |
Duration of response by BIRC | |||
Responders | |||
n/N (%) | 54/121 (44.6) | 41/98 (41.8) | 39/77 (50.6) |
Percentiles (95% CI)d | |||
25th | 6.0 (5.6 to 9.5) | 7.0 (5.5 to 7.6) | 5.6 (3.8 to 6.7) |
50th | 16.6 (12.2 to 20.4) | 14.9 (11.1 to NE) | 12.3 (6.9 to 16.9) |
75th | 22.1 (20.3 to NE) | NE (NE to NE) | NE (16.6 to NE) |
Harms (safety set), n (%) | |||
AEs | 189 (98.4) | 191 (99.5) | 185 (99.5) |
SAEs | 66 (34.4) | 65 (33.9) | 69 (37.1) |
WDAE (from study treatment) | 24 (12.5) | 27 (14.1) | 31 (16.7) |
Deaths | 17 (8.9) | 14 (7.3) | 19 (10.2) |
Notable harms (n%) | |||
Eye disorders | 104 (54.2) | 53 (27.6) | 62 (33.3) |
Cardiac disorders | 25 (13.0) | NA | NA |
Cardiomyopathy | NR | NR | NR |
Skin and subcutaneous tissue disordersa | 125 (65.1) | 184 (95.8) | 170 (91.4) |
Dry skin | 27 (14.1) | 58 (30.2) | 42 (22.6) |
Hyperkeratosis | 27 (14.1) | 72 (37.5) | 54 (29.0) |
Rash | 27 (14.1) | 41 (21.4) | 54 (29.0) |
Keratosis pilaris | 9 (4.7) | 33 (17.2) | 43 (23.1) |
Photosensitivity reaction | 8 (4.2) | 7 (3.6) | 45 (24.2) |
PPE syndrome | 0 (0) | 5 (2.6) | 0 (0) |
Pyrexia | 35 (18.2) | 29 (15.1) | 52 (28.0) |
AE = adverse event; BIRC = Blinded Independent Review Committee; BOR = best overall response; CI = confidence interval; CR = complete response; DCR = disease control rate; FAS = full analysis set; HR = hazard ratio; ITT = intention to treat; NA = not applicable; NE = not estimable; NR = not reported; ORR = objective response rate; PD = progressive disease; PPE = palmar-plantar erythrodysesthesia; PR = partial response; RECIST = Response Evaluation Criteria in Solid Tumors; SAE = serious adverse event; WDAE = withdrawal due to adverse event.
Note: Safety set for AE and SAE analysis; FAS for efficacy analysis.
Note: Median duration of exposure for encorafenib in combination with binimetinib was 52.21 weeks, encorafenib was 31.36 weeks, and vemurafenib was 27.14 weeks.
aMedian (time to event) and its 95% CI is generated by Kaplan-Meier estimation with Brookmeyer and Crowley CIs.
bHRs and CIs are derived from the Cox proportional hazards model using the Wald test. Log-rank test and Cox proportional hazards model are stratified by American Joint Committed on Cancer stage and Eastern Cooperative Oncology Group Performance Status per randomization.
dRepresents the estimated time (95% CI), reported in months, at which the specified percentiles occur based on the Kaplan-Meier analysis. Values were calculated using the Brookmeyer and Crowley method in PROC LIFETEST.
cP value pre-specified value of 0.025 (1-sided) is based on the log-rank score test.
eDoes not include the 2 patients who were not assessed by BIRC.
fBOR is based on central reviewer’s assessment using RECIST, version 1.1.
gCR and PR are confirmed by repeat assessments performed not less than 4 weeks after the criteria for response is first met.
hUpdated progression-free survival estimates from data cut-off date of November 7, 2017.
Source: Clinical Study Report for COLUMBUS study7 and Ascierto et al. 2020.6
Critical Appraisal
One of the most significant limitation of the COLUMBUS trial is lack of comparison to current standard of care. The included study compared encorafenib in combination with binimetinib to encorafenib monotherapy and vemurafenib monotherapy but not to other BRAFi/MEKi combination therapies. It should be noted that when the COLUMBUS trial was initiated, single-agent BRAFi was standard of care, therefore the choice of comparators was deemed appropriate at the time. Instead, an indirect treatment comparison (ITC) among the 3 combinations was performed. Such a trial design largely limited our understanding whether encorafenib in combination with binimetinib would have provided comparative advantage in terms of either additional benefit or a more favourable safety profile, as compared to dabrafenib in combination with trametinib. The clinical experts consulted by CADTH for this review indicated that in clinical practice, targeted therapies are seldom prescribed as monotherapies except in rare cases to manage significant toxicities. This trial design and the results may only be helpful in providing a common comparator for an indirect comparison with other BRAFi/MEKi combination therapies. However, as demonstrated in the ITCs summarized and critically appraised in this review, the comparative efficacy and safety largely remained inconclusive.
The study population in the COLUMBUS trial was reflective of the unresectable metastatic melanoma patient population in Canada. The inclusion and exclusion criteria were reasonable for a more favourable benefit and risk ratio and safety profile. It should be noted, however, that the trial excluded patients with central nervous system (CNS) metastases and Eastern Cooperative Oncology Group Performance Status (ECOG PS) greater than 1. These patients would be considered to receive encorafenib in combination with binimetinib combination for treatment in clinical practice. However, higher ECOG PS (> 1) usually indicates more severe disease and more likely with unfavourable prognosis. Therefore, the efficacy and safety profiles that were observed in a patient population with ECOG PS 0 to 1 in this trial may not be readily generalizable to those patients with ECOG PS greater than 1 in clinical practice. Lastly it should be noted that the COLUMBUS trial included patients only with V600E or V600K mutations; however, the Health Canada–approved indication (and reimbursement request) includes all V600 mutations. BRAF mutations are present in approximately 50% of melanomas. Of these, approximately 90% occur at amino acid 600, of which the majority are BRAF V600E. Others include V600K, V600 D, and V600M. In the COLUMBUS trial, 86.6% of patients were positive for the BRAF V600E mutation, while the remainder were positive for the V600K mutation.
Indirect Comparisons
Description of Studies
Four ITCs were summarized and appraised for this report: an unpublished Bayesian network meta-analysis (NMA) submitted by the sponsor focused only on the BRAFi/MEKi combination therapy trials and reporting only overall OS and PFS outcomes;8 an adjusted ITC (Bucher method) reported by Consoli et al. focused only on the BRAFi/MEKi combination therapy trials but reported ORR and grade 3 to 4 toxicities as well as OS and PFS as outcomes;9 a Bayesian NMA reported by Wu et al., which compared dabrafenib in combination with trametinib to other BRAFi/MEKi combinations (including encorafenib in combination with binimetinib), monotherapy with BRAFi, immuno-oncology agents (IOs), and chemotherapy agents,10 and a Bayesian NMA reported by Franken et al., which compared a pooled chemotherapy group to various IOs, targeted agents, and other chemotherapy treatments.11 Encorafenib in combination with binimetinib was not included in the main NMA analysis of the Franken et al. report, but was included in an extended NMA conducted as a sensitivity analysis.
Efficacy Results
All of the NMAs reported similar results for comparisons of OS and PFS between the available BRAFi/MEKi combination treatments, concluding that there were no statistically significant differences between encorafenib in combination with binimetinib, dabrafenib in combination with trametinib and vemurafenib in combination with cobimetinib for these outcomes. However, in all NMAs, the credible intervals or CIs were wide, reflecting imprecision and introducing uncertainty to the non-statistically significant results. Only the Consoli et al. NMA also assessed ORR and grade 3 to 4 AEs. No statistically significant differences were found between the combination therapies for the ORR outcome; however, statistically significant differences were found for specific grade 3 to 4 AEs between the combination treatments. Only the Wu et al. NMA included comparisons of a BRAFi/MEKi combination therapy (dabrafenib in combination with trametinib) with IOs. However, results were difficult to interpret due to inconsistencies between results for OS and PFS outcomes and the impact of different baseline BRAF mutation status across the trials.
Harms Results
Only 1 NMA included an indirect comparison of grade 3 to 4 toxicities across the BRAFi/MEKi combination therapy treatments.9 The NMA found that toxicities differed between the 3 combination therapy regimens. When compared to encorafenib with binimetinib, vemurafenib with cobimetinib was associated with significantly higher grade 3 to 4 liver toxicity, rash, arthralgia, basal cell carcinomas, and diarrhea, but less decrease of left ventricular ejection fraction. When compared to dabrafenib in combination with trametinib, encorafenib in combination with binimetinib demonstrated few statistically significant differences in grade 3 to 4 toxicities. Only hypertension occurred more frequently with dabrafenib in combination with trametinib, while only squamous cell carcinoma occurred more frequently with encorafenib in combination with binimetinib. It should be noted that CIs were wide, reflecting imprecision in the results.
Critical Appraisal
Despite differences in methodologies and data cuts used, the NMAs reported by the sponsor, Consoli et al., and Wu et al., reached similar conclusions; that there were no statistically significant differences between the 3 BRAKi/MEKi combination treatments for unresected or metastatic melanoma for OS and PFS outcomes. Overall, the limited data suggests that encorafenib in combination with binimetinib likely has comparable efficacy to dabrafenib in combination with trametinib and vemurafenib in combination with cobimetinib, for both OS and PFS outcomes. However, this conclusion is associated with considerable uncertainty due to unclear and/or incomplete reporting on NMA methods, small or sparse networks, imprecision in results, and the unknown influence of effective post-progression treatments on the observed results, particularly for the OS outcome. IOs are key comparators for BRAFi/MEKi combinations for the first-line treatment of unresectable or metastatic melanoma and comparisons between agents within these 2 classes are of high clinical interest. However, results for comparisons between dabrafenib in combination with trametinib and IOs were difficult to interpret due to inconsistency between results for OS and PFS outcomes for the same comparisons.
Conclusions
Overall, there is uncertainty in the clinical benefit of encorafenib in combination with binimetinib compared with encorafenib monotherapy (based on the pre-specified criteria for statistical significance, open-label study design, uncertain OS data, and inclusion and exclusion criteria). The combination therapy (encorafenib with binimetinib) did demonstrate some benefit compared with vemurafenib monotherapy; however, these results must be interpreted with several methodological limitations which affect internal and external validity (irrelevant comparators, open-label study design, uncertain OS data, and inclusion and exclusion criteria). The ITCs reported similar results for comparisons of OS and PFS between the available BRAFi/MEKi combination treatments, concluding that there were no differences between encorafenib in combination with binimetinib, dabrafenib in combination with trametinib, and vemurafenib in combination with cobimetinib for these outcomes. However, these results were associated with imprecision and uncertainty. QoL was deemed an important factor for consideration in the patient group input; however, the exploratory nature of the HRQoL data (due to lack of statistical testing and data collection methods) make it difficult to detect the magnitude of improvement that encorafenib in combination with binimetinib offers. In terms of AEs, the percentage of patients experiencing 1 AE was similar between the study arms, with gastrointestinal AEs (nausea and diarrhea) reported at a higher frequency among patients taking encorafenib and binimetinib compared to vemurafenib and encorafenib monotherapy arms. Similarly, in the ITCs, there were few differences in grade 3 and 4 toxicities between dabrafenib in combination with trametinib and encorafenib in combination with binimetinib. Overall, the trial design and the results may only be helpful in providing a common comparator for an indirect comparison with other BRAFi/MEKi combination therapies. However, as demonstrated in the ITCs, the comparative efficacy and safety largely remained inconclusive.
Introduction
Disease Background
Melanoma is a cancer that occurs in skin cells that produce melanin, known as melanocytes. The top layer of the skin (epidermis) comprises 3 types of cells in which cancer can originate: squamous cells, basal cells, and melanocytes. Most cases of melanoma are clinically identified early and cured with surgical excision alone. However, a small subset (5%) of patients will develop metastatic disease. There are 4 different types of melanomas and superficial spreading is the most common. The other types are nodular melanoma, acral lentiginous melanoma, mucosal, and lentigo malignant melanoma. There is no single cause of melanoma; however, some risk factors include family history, presence of moles, light-coloured skin, excessive sun exposure, age, and occupational exposure to some chemicals (coal tar, pitch, arsenic, or radium).12 Melanoma is less common than other skin cancers such as basal and squamous cell carcinomas, however, has a poor prognosis due to a higher risk of metastasis.4
In 2019, an estimated 8,000 Canadians were diagnosed with melanoma (4,400 males and 3,600 females) and 1,300 died from the disease.1 In total, melanoma accounts for 3.8% of new cancer cases and 1.9% of cancer deaths per year for men (3.3% cases and 1.2% deaths in women).3 Men are at slightly at higher risk of developing melanoma. The lifetime probability of developing melanoma is 1 in 42 for males and 1 in 56 for females.2 The incidence of melanoma skin cancer continues to rise in the Canadian population. Since 1984, the incidence rate has increased by 2.2% (per year) for males and 2.0% (per year) for females.2 Although the incidence of melanoma has increased, metastatic disease (defined as stage IV or unresectable stage III disease) remains relatively rare. The 5-year survival rate remains low (15% to 20%) compared to patients who are diagnosed early; the 5-year survival rate of stage I to II is 84% to 91%.4 The median OS for metastatic melanoma is 8 months to 18 months.13 It the fourth most common malignancies in individuals aged 15 to 29, where 7% of new cancer cases in Canada between the years 2011 to 2015 were melanomas.2 Melanoma often affects patients during their most productive years. The clinical experts consulted by CADTH for this review indicated that a melanoma diagnosis can impact patients’ social relationships, financial affairs, and careers. For this reason, melanoma is associated with high costs to manage the disease. The economic burden is estimated to rise to CAD$696 million or 75.5% of the total budget projection of skin cancer for 2031.14
A variety of genetic alterations exist within melanoma which influence cancer cell proliferation and treatment response. In melanoma, the MAPK pathway plays an important role controlling the cell cycle and survival. Within this cycle, effector molecules such as BRAF also contribute to cell cycle regulation. A single mutation, for example in the gene encoding the BRAF protein, can cause increased activation and lead to downstream signalling of the RAS/RAF/MEK/ERK pathway and dysregulated melanocyte proliferation. Approximately 40% to 60% of melanoma cases include a BRAF mutation. Of these mutations, approximately 90% are BRAF V600E, whereas 5% to 6% are BRAF V600K.5 For these reasons, when a patient is diagnosed with metastatic melanoma, BRAF mutational analysis is conducted. The clinical experts consulted by CADTH for this review indicated that in Canada, this testing is standard of care and funded by provincial governments.
Standards of Therapy
Systemic therapy has been the mainstay of therapy for most patients with metastatic melanoma. Chemotherapies have been displaced by either immune checkpoint inhibitor or BRAF-directed targeted therapy. Treatment and management of patients with unresectable or metastatic melanoma with a BRAF mutation tend to be centred on immune checkpoint inhibitors and targeted therapies (kinase inhibitors).
The CADTH pan-Canadian Oncology Drug Review (pCODR) Expert Review Committee (pERC) has provided recommendations for ipilimumab (Yervoy),15,16 nivolumab (Opdivo),17 pembrolizumab (Keytruda),18 and nivolumab in combination with ipilimumab19 for patients with unresectable stage III or stage IV melanoma, regardless of BRAF mutation carrier status. These immunotherapies were all recommended by pERC conditional on improved cost-effectiveness and adoption feasibilities and are now routinely used across Canada as standard of care therapy.
In addition to immunotherapies, patients who carry a BRAF mutation, such as the specific patient population in this review, can be treated with BRAF/MEK-targeted therapies. pERC has recommended BRAFis and MEKis for BRAF-mutated metastatic melanoma in the first-line setting, including vemurafenib monotherapy, dabrafenib monotherapy, trametinib monotherapy, dabrafenib in combination with trametinib, and vemurafenib in combination with cobimetinib. Similarly, pERC recommended these therapies conditional on improved cost-effectiveness. The clinical experts consulted by CADTH for this review indicated that combination therapy with BRAFis and MEKis have replaced BRAFi monotherapy as current standard of care.
Optimal sequencing of immunotherapies and BRAFis is unknown. There is no evidence to firmly establish whether patients with BRAF-mutated melanoma ought to receive BRAFi or immunotherapy in the first- or second-line of treatment. In 2018, a CADTH gap analysis20 concluded that BRAF-targeted therapies can be an option for patients previously treated with immunotherapy and immunotherapy can be an option for patients previously treated with BRAF-targeted therapies. However, this conclusion remains limited as it was an indirect comparison of retrospective studies with different patient populations.
The following information is based on input from clinicians consulted by CADTH for the purpose of this review.
The clinical experts identified 2 main treatment options that exist for patients in the BRAF-mutated melanoma population: immunotherapy and BRAF-targeted therapy. Most clinicians would consider both BRAF-directed therapy and immunotherapy as first-line options. There are no data to suggest a rationale for choosing one class over the other. Factors such as age, disease burden, and medical comorbidities are considered in treatment decision-making. Although practice might differ across the country, immunotherapy is generally the preferred option for first-line treatment. Treatment with immunotherapy has demonstrated highly durable treatment responses, even after treatment discontinuation. All provinces have access to first-line immunotherapy, either combination ipilimumab and nivolumab or monotherapy with nivolumab or pembrolizumab. After progression, most Canadian jurisdictions allow for treatment with second-line ipilimumab. BRAFi therapy has mostly been studied as a first-line treatment, except for the trial included in this review (COLUMBUS) which allowed enrolment of both immunotherapy-naive and immunotherapy-treated patients. In Canada, all provinces allow BRAFi in either first or subsequent lines of therapy. Generally, patients who receive first-line immunotherapy may transition to second-line BRAFi and vice versa.
Targeted therapies are generally used in combination and not as monotherapy. When used in combination, they are associated with an improved response and better patient tolerability.
The most clinically relevant comparator to encorafenib in combination with binimetinib would be dabrafenib in combination with trametinib. Encorafenib in combination with binimetinib would likely occupy a similar place in the care pathway. However, the clinical experts felt it was important to distinguish between the toxicity profiles of the 2 regimens. Treatment with encorafenib in combination with binimetinib would represent an alternative treatment for patients with BRAF-mutated melanoma who demonstrate intolerance to dabrafenib in combination with trametinib.
The most important treatment goals identified by the clinical experts include improved survival and prolongation of life. Other treatment goals include minimization of treatment side effects, reduction of symptoms, and improved QoL where a patient could maintain employment and independence.
Drug
Encorafenib is a selective BRAFi that suppresses the RAS/RAF/MEK/ERK pathways inhibiting BRAF V600E, D, and K mutation-positive melanoma cell growth. Binimetinib is a reversible MEKi that inhibits proliferation of human BRAF-mutant melanoma cell lines and tumour growth. The recommended dose of encorafenib is 450 mg once daily and of binimetinib is 45 mg twice daily, both administered orally with or without food. Encorafenib is supplied as 75 mg capsules in bottles of 60 and 90 capsules.21 Binimetinib is supplied as 15 mg tablets in bottles containing either 90 or 180 tablets.22
The sponsor is requesting reimbursement of encorafenib in combination with binimetinib for the treatment of patients with unresectable or metastatic melanoma with a BRAF V600 mutation, as detected by a validated test.
The drug combination was reviewed by Health Canada through the Standard Review Pathway. It has not been reviewed previously by CADTH. The reimbursement request does not differ from the approved Health Canada indication.
A table describing key characteristics of commonly used BRAF and MEKis for the treatment of patients with unresectable or metastatic melanoma with a BRAF V600 mutation is presented in Table 3.
Table 3: Key Characteristics of Encorafenib in Combination With Binimetinib, Dabrafenib in Combination With Trametinib, and Vemurafenib in Combination With Cobimetinib
Characteristic | Encorafenib with binimetinib | Dabrafenib with trametinib | Vemurafenib with cobimetinib |
|---|---|---|---|
Mechanism of action | Encorafenib (Braftovi) is a highly selective BRAF inhibitor that suppresses RAS/RAF/MEK/ERK pathways which inhibits BRAF V600 E, D, and K mutation-positive cell growth. Binimetinib (Mektovi) is a MEK inhibitor that inhibits proliferation of human BRAF-mutant cell lines and tumour growth. | Dabrafenib (Tafinlar) is a BRAF V600 inhibitor. Trametinib (Mekinist) is a MEK inhibitor. | Vemurafenib (Zelboraf) is a selective BRAF V600 inhibitor. Cobimetinib (Cotellic) is a MEK inhibitor. |
Indicationa | Encorafenib in combination with binimetinib for the treatment of patients with unresectable or metastatic melanoma with a BRAF V600 mutation, as detected by a validated test. | Dabrafenib in combination with trametinib for the treatment of patients with unresectable or metastatic melanoma with a BRAF V600 mutation, as detected by a validated test. | Cobimetinib in combination with vemurafenib for treatment of patients with unresectable or metastatic melanoma with BRAF V600 mutation. |
Route of administration | Oral | Oral | Oral |
Recommended dose | Encorafenib 450 mg (six 75 mg capsules) orally once daily and binimetinib 45 mg (three 15 mg tablets) orally taken twice daily, approximately 12 hours apart, until disease progression or unacceptable toxicity | Dabrafenib 150 mg orally, and trametinib 2 mg orally, both once daily, until disease progression | Vemurafenib 960 mg twice daily and cobimetinib 60 mg daily for 21 days followed by a 7-day break |
Serious adverse effects or safety issues (grade 3 and higher) | New primary cutaneous malignancies, major hemorrhagic events, uveitis, venous thromboembolism, and QT prolongation | Hypertension, pyrexia, and elevated alanine aminotransferase, cutaneous squamous cell carcinoma, including keratoacanthoma | Alanine aminotransferase increase, aspartate aminotransferase increase, blood creatinine phosphokinase increase, diarrhea, blood alkaline phosphatase increase, photosensitivity reaction, hyponatremia, and retinal detachment |
aHealth Canada–approved indication
Source: Encorafenib in combination with binimetinib product monographs,21,22 Clinical Guidance Report (CADTH) for Dabrafenib and Trametinib,23 Clinical Guidance Report (CADTH) for Vemurafenib and Cobimetinib.24
Stakeholder Perspectives
Patient Group Input
This section was prepared by CADTH staff based on the input provided by patient groups.
About the Patient Groups and Information Gathered
Two patient groups provided input for the review of encorafenib in combination with binimetinib for the treatment of patients with unresectable or metastatic melanoma with a BRAF V600 mutation—SYSF and the MNC. SYSF is a national, patient-led, not-for-profit group committed to the fight against non-melanoma skin cancers, melanoma, and ocular melanoma through nationwide education, advocacy, and awareness initiatives. MNC is a nationally based organization that advocates on behalf of melanoma patients, coordinates educational and prevention strategies, and assists in funding for melanoma research.
SYSF obtained patient input from one-on-one patient and caregiver interviews, surveys via online and email platforms, patient feedback at roundtable discussion forums, and through email and survey responses from outreach to medical advisory board members and treating physicians in Canada, the US, and Europe. Input was gathered from June 15 through December 16, 2020, from 53 melanoma patients (including 6 who have experience with encorafenib in combination with binimetinib). Input regarding the companion diagnostic testing was collected from December 2 to 16, 2020 from the 6 patients who had experience with encorafenib in combination with binimetinib.
MNC recruited patients from Canada and the US through social media and outreach to medical centres and patient organizations. Responses were gathered from an online survey. A letter was also sent out to physicians in Canada and the US detailing the survey and its purpose with the online link. A total of 184 patients and 108 caregivers responded to the survey. Of the patient respondents, 108 were female and 76 were male. Seven patients were being treated with encorafenib in combination with binimetinib, 5 of whom were from Canada and 2 from the US. The survey was open to all patients, regardless of the stage of disease. Ninety-eight (53%) patient respondents were early-stage patients (< stage III), 62 (34%) were advanced stage, and 24 (13%) did not know the stage of their disease.
Disease Experience
Respondents of the SYSF survey and interviews were asked to report the most significant challenges of living with melanoma. The most common challenges reported by more than half of the patients were fear and/or anxiety (75.47%; n = 40), fatigue (67.92%; n = 36), and financial loss or job loss (52.83%; n = 28). The full results are listed in Table 4.
Table 4: Challenges of Living With Melanoma (SYSF)
Challenges | Respondents, n (%) N = 53 |
|---|---|
Fear and/or anxiety | 40 (75.47) |
Fatigue | 36 (67.92) |
Financial loss or job loss | 28 (52.83) |
Scarring and disfigurement | 26 (49.06) |
Pain | 25 (47.17) |
Weight loss or weight gain | 25 (47.17) |
Disrupted sleep | 25 (47.17) |
Nausea or vomiting | 22 (45.51) |
Negative impact to family or social life | 21 (39.62) |
Depression | 21 (39.62) |
Loss of/gain of appetite | 17 (32.08) |
Nerve pain or damage | 15 (28.30) |
Lymphedema | 13 (24.53) |
Gastro Issues | 13 (24.53) |
PTSD | 13 (24.53) |
Cognitive Impairment | 10 (18.87) |
Damage to organ | 10 (18.87) |
Breathing problems | 9 (16.98) |
Mobility issues | 7 (13.21) |
Headaches | 5 (9.43) |
No side effects | 2 (3.77) |
PTSD = post-traumatic stress disorder; SYSF = Save Your Skin Foundation.
Note: SYSF respondents noted ongoing symptoms that affected day-to-day life were fatigue (24.53%, 13/53), depression (24.53%, 13/53) and pain (9.43%, 5/53), and 21 respondents (39.62%) responded with “nothing.” The most important symptoms to control reported by the respondents were pain (18.87%, 10/53), fatigue (45.28%, 24/53), gastrointestinal issues (24.53%,13/53), and mental health symptoms (67.92% n = 36) such as fear, anxiety, depression, and an overall outlook on life. Out of the total respondents, 48 (90.57%) stated that they were able to manage their ongoing symptoms and side effects and 5 (9.43%) respondents noted that they were unable to work as the cancer and its treatments have posed limitations on their day-to-day life.
The following are some comments provided by patients of the SYSF survey and interviews regarding their disease experience.
“It has affected my ability to be employed, the type of employment I choose, my marital status, my activity level, the location where I live, and it is something I think about daily.“
“Nothing really—I can do as much as I could before to some degree but not as fast and with less strength.”
“Completely takes over your life. Because of rare sub-type, I’ve needed to advocate for myself and seek numerous opinions in Canada and USA. More sharing of information needs to happen with sub-types (mucosal) melanoma. More access to trials needs to happen.”
MNC asked respondents to describe the impact of the cancer on their day-to-day life and QoL. The most common impact reported was scarring or disfigurement (59.71%; 83 of 139), followed by fear and anxiety (58.27%; 81 of 139), pain (46.04%; 64 of 139) and fatigue (41.01%; 57 of 139). The responses are summarized in Table 5.
Table 5: Impact of Melanoma (MNC Survey)
Answer choices | Number of responses, n (%) N = 139 |
|---|---|
Pain | 64 (46.04) |
Scarring or disfigurement | 83 (59.71) |
Edema or fluid retention | 36 (25.90) |
Peripheral neuropathy (nerve pain or damage) | 35 (25.18) |
Lymphedema | 40 (28.78) |
Disrupted sleep | 50 (35.97) |
Mobility Issues (unable to walk or impaired movement) | 19 (13.67) |
Fear or anxiety | 81 (58.27) |
Nausea or vomiting | 15 (10.79) |
Fatigue | 57 (41.01) |
Diarrhea | 15 (10.79) |
Gastrointestinal issues | 15 (10.79) |
Depression | 35 (25.18) |
Negative impact to self image, family, or social life | 33 (23.74) |
Post-traumatic stress | 20 (14.39) |
Appetite loss or weight gain | 31 (22.30) |
Cognitive impairment | 13 (9.35) |
Financial loss or job loss | 33 (23.74) |
Damaged organs such as lung, liver, brain | 22 (15.83) |
Negative impact on family or social life | 39 (28.06) |
Impact on sexuality | 25 (17.99) |
None—there has been no impact | 13 (9.35) |
Other | 15 (10.79) |
MNC = Melanoma Network of Canada.
Note: Of the 15 patients who responded with “Other,” 2 reported diabetes and 1 reported problem with the pituitary gland.
The following are some comments provided by the MNC survey respondents. Patients mainly commented on the significant fear and anxiety associated with living with melanoma. The disease can significantly impact their ability to work and can strain relationships with other family members, as well as affect their ability to form new relationships.
“No quality of life—in bed almost all of the time in pain with no pain control, little relationship with any members of my family except my husband (caregiver). Very depressing.”
“Until I have reconstruction surgery on my face and upper lip, I am limited to a high calorie liquid diet and lost 25 pounds since diagnosis and drink from a straw.”
“Taints normal everyday life. Always on your mind or in the back of your mind even on good days. Always worrying, anxious etc. Was laid off from work 2 months post-op.”
“I was diagnosed at age 62, and the choice I made was to walk away from all stressors which happened to be a troubled business. I retired with nothing except my pension after a long career. At this age one doesn't recover quickly from such financial loss and drama. My long-term partner left, and I have stopped looking for a new partner even though my health is good today. Depression is a regular thing.”
MNC noted that many patients are unable to secure a caregiver given their older age and limited circumstances. Having an oral therapy could be especially beneficial to these patients who live on their own. When asked for their input regarding their caregiving experiences, many caregivers reported financial issues and increased fatigue, stress, and anxiety due to excessive burnout associated with the heavy demands of caregiving. The following are some comments provided by caregivers.
“I attend all appointments. Mainly time commitments, stress, and related uncertainty about our future, inability to travel outside country with difficulty getting travel medical insurance—our travel plans are on hold.”
“More household responsibilities on me as there are some mobility issues with arm and of course financial at the time so 2 surgeries and the stress of checkups and worrying about it coming back.”
“My wife is in bed most of the time and in extreme pain it is very hard for me to watch this with little solutions I also am totally responsible for making meals cleaning the house and it has definitely taken over my life I love her, so I don't mind but it definitely has changed our lives.”
“Financial disaster with no reasonable help in terms of what we are offered to live on the minuscule pension that we receive. In fact the pension never covers what I pay for supplements and for better quality food. This is insane! I have worked my entire life in this country and was an employer of many people and an active contributor to Canada. This was misfortune not of my own doing and I'm left living on a government pension plus GIS [Guaranteed Income Supplement] which doesn't even cover my rent in the city where I invested my entire life. It's a very sad end.”
Experiences With Currently Available Treatments
Respondents of the SYSF survey/interviews reported the following treatments that they have used to treat the disease: Yervoy, trametinib, dabrafenib (as monotherapies or in combination for the BRAF mutation-positive population), vemurafenib (Zelboraf), cobimetinib (as monotherapies or in combination for the BRAF mutation-positive population), aldesleukin (Proleukin), pembrolizumab (Keytruda), nivolumab (Opdivo), and nivolumab in combination with ipilimumab (Yervoy). Table 6 lists the most common adverse effects of current treatment as reported by respondents. As noted, the most common adverse effects of current treatments were fatigue or weakness (71.7%; 38 of 53), skin rash (49.05%; 26 of 53), muscle or joint pain (43.4%; 23 of 53), and weight loss or loss of appetite (43.4%; 23 of 53).
Table 6: Adverse Effects of Current Treatments for Melanoma (SYSF)
Adverse effects | Respondents, n (%) N = 53 |
|---|---|
Fatigue or weakness | 38 (66.03) |
Skin rash | 26 (49.06) |
Muscle or joint pain | 23 (43.40) |
Weight loss or loss of appetite | 23 (43.40) |
Shortness of breath, cough, or chest pain | 19 (35.85) |
Hormone and thyroid problems | 16 (30.19) |
Diarrhea or colitis | 16 (30.19) |
SYSF = Save Your Skin Foundation.
Out of the total 53 respondents, 48 (90.57%) respondents felt that side effects were manageable, and 36 (67.92%) patients felt that their QoL was improved while on treatment. Forty-eight respondents (90.57%) felt that the benefits of treatment outweighed the side effects, and 47 respondents (88.68%) are no longer receiving treatment. Twenty-one (39.62%) respondents reported that they are presently cancer free and 16 (30.19%) experienced slower disease progression. Thirty respondents (56.6%) who have had a response reported that they had not been treated in the last 6 months and 5 did not respond.
Respondents noted that they have encountered the following difficulties regarding treatments for melanoma: travelling to treatment centres (75.47%; n = 40), difficulties accessing treatments (18.87%; 10 of 53), financial costs of treatments (18.87%; 10 of 53), and emotional hardships of dealing with the disease and impact on family (18.87%; 10 of 53).
The following are some comments provided by patients regarding their experience with currently available treatments.
“I had to travel to the Cross Cancer Institute in Edmonton from Kamloops BC and still do every 2 weeks as I am still on treatment! My parents had to rent a house for us while I was there. I am very fortunate to have been able to be on the study and am forever grateful. If it happened this year with the new protocol, I'm not sure the outcome would have been so good.”
“My insurance was responsible to pay for the 1/2 the cost and I was denied. My wife did crowd funding which yielded media attention ... Once the local news began airing how an insurance company was denying him coverage- they reversed their denial.”
“Unmet needs for patients in the advanced/metastatic setting include treatment options available for them. Access to available treatments without delays. Sequencing of treatment options.”
SYSF conducted interviews with 5 melanoma patients who currently have no evidence of disease and have had experience with 1 of the available treatments identified above. Overall, patients were very pleased that treatments have enabled them to live longer as many were told upon diagnosis that their chances of survival are low. In particular, 1 patient was diagnosed with metastatic melanoma that spread to her brain when she was 7 months pregnant. The patient underwent a risky surgery during her pregnancy as it was uncertain whether or not she and her baby would survive it. The patient was very pleased to report that her daughter is now 9 years old and that she and her family are living their life to the fullest. The patients commented that although the side effects of some treatments were harsh, the effectiveness of the treatments far outweighed the side effects. Many patients expressed strong hopes for other melanoma patients to be able to access the treatments in a timely manner to effectively halt the progression of the disease and enable longer survival.
Respondents of the MNC survey reported a variety of treatments such as surgery, immunotherapies, radiation, and targeted therapies, as listed in Table 7. The most common treatment reported was surgery, (72.18%; 96 of 133), followed by nivolumab (28.57%; 38 of 133), and radiation (24.06%; 32 of 133).
Table 7: Previously Used Treatments for Melanoma (MNC)
Treatment | Number of responses, n(%) N = 133 |
|---|---|
Ipilimumab (Yervoy) | 30 (22.56) |
Nivolumab (Opdivo) | 38 (28.57) |
Pembrolizumab (Keytruda) | 23 (17.29) |
Dabrafenib (Tafinlar) plus trametinib (Mekinist) | 24 (18.05) |
Vemurafenib (Zelboraf) plus cobimetinib (Cotellic) | 5 (3.76) |
Interferon | 17 (12.78) |
Radiation | 32 (24.06) |
Surgery | 96 (72.18) |
chemotherapy | 7 (5.26) |
None (not applicable) | 9 (6.77) |
Othera | 23 (17.29) |
MNC = Melanoma Network of Canada.
aOther treatments identified by the respondents of the MNC survey were naturopathy, levamisole, and Interleukin-2 injections.
Respondents of the MNC survey provided varying responses regarding their experiences with currently available treatments. Many patients who had been on immunotherapies or prior targeted therapies reported side effects such as fatigue, fever, chills, rashes, gastrointestinal issues, arthritis, and autoimmune issues. Two patients had to discontinue immunotherapy due to AEs and had to be hospitalized. Side effects reported by patients who had experience with surgery or radiation included pain, mobility issues, and lymphedema. Most patients reported that the side effects of treatments were manageable and that the benefits of the treatments outweighed the negative side effects. Caregivers commented that as patients continued treatment, the heavy burden of care persisted and that access to effective therapies with fewer side effects is very essential and would help alleviate the stress and anxiety associated with caregiving.
Improved Outcomes
Respondents of the SYSF survey and interviews reported the following concerns as the most important ones they would like to see addressed with new treatments:
Timely access to treatment
Less side effects and/or quick and easy management of side effects
Increased access to oral medications for targeted therapy
Increased communication between physicians and surgeons regarding each patient’s treatment plan
Respondents stated that if the above outcomes were achieved, they would experience less anxiety and fear and have an improved QoL. Increased consistency and efficiency in treatment protocols would help them make better informed decisions for their treatment plan and provide them with more confidence and hope.
Patients from the MNC survey also desire treatments that are not only curative, but also have fewer side effects. Patient would also like treatments that do not require much travel as it would not only save time, but also result in lower associated expenses such as parking and gas. Additionally, reduced travel would lessen the need for a caregiver to accompany them to treatments. MNC commented that since encorafenib in combination with binimetinib is an oral therapy, it would provide significant benefits and improve QoL of patients and caregivers as it does not require patients to visit the hospital frequently. This is of utmost importance given the current COVID-19 pandemic, as many patients have indicated that the ongoing pandemic has led to more fear and anxiety of visiting the hospital.
Experience With Drug Under Review
A total of 6 respondents from the SYSF survey and interviews reported having experience with the drug. Two respondents received the drug through a compassionate access program, 1 patient received it through a clinical trial and the other 3 respondents were unsure how they received the treatment. Three respondents are still on treatment, 2 have completed the full course of treatment, and 1 did not complete the treatment. Table 8 lists the side effects of encorafenib in combination with binimetinib as reported by patients. The most reported symptom was liver problems (50%; n = 3).
Table 8: Side Effects of Encorafenib in Combination With Binimetinib (SYSF)
Reported side effects of encorafenib in combination with binimetinib | Number of respondents, n N = 6 |
|---|---|
Liver problems | 3 |
Fatigue | 2 |
Cognitive impairment | 2 |
Nausea or vomiting | 2 |
Skin rash | 2 |
Weight loss of weight gain | 2 |
Breathing problems | 1 |
SYSF = Save Your Skin Foundation.
Two of the respondents of the SYSF survey and interviews reported that the side effects were manageable and 1 reported that they were somewhat manageable. Three patients who were still on treatment responded with “not applicable.” Three patients that experienced side effects said that the benefits of treatment outweighed the side effects. One patient said the benefit of treatment did not outweigh the side effects and 2 responded with “not applicable.”
The following are some comments provided by patients regarding their experience with encorafenib in combination with binimetinib.
“It’s very important that I received this treatment, it’s basically extending my life. Obviously, I’m looking for a cure, but realistically looking to extend my life as long as possible without debilitating side effects.”
“Immunotherapy knocked me around and didn’t work for me. Braftovi/Mektovi has been great.”
“I’m currently NED (no evidence of disease) with little to no side effects.”
A total of 7 patients from the MNC survey had experience with encorafenib in combination with binimetinib, 5 of whom were from Canada and 2 of whom were from the US. Two of the Canadian patients accessed the drug through a trial and 2 patients accessed the drug through a compassionate access program. Table 9 lists the side effects reported by patients. The most commonly reported side effect was fatigue (85.71%; n = 6). All 7 respondents stated that the side effects were manageable and worth the treatment. Specifically, 1 patient indicated that the side effects of encorafenib in combination with binimetinib were much more tolerable than the dabrafenib in combination with trametinib therapy that they were previously taking. Four patients reported that the drug had slowed down the progression of the disease and the other 3 stated that it was too early to tell. One of the patients had prior treatment with immunotherapy (nivolumab in combination with ipilimumab) and targeted combination before that. The patient reported that the encorafenib in combination with binimetinib combination has significantly slowed down the progression of the disease.
Table 9: Side Effects of Encorafenib in Combination With Binimetinib (MNC)
Reported side effects | Number of respondents, n (%) N = 7 |
|---|---|
Fatigue | 6 (85.71) |
Pyrexia | 0 (0.00) |
Peripheral edema | 0 (0.00) |
Diarrhea | 0 (0.00) |
Abdominal pain | 2 (28.57) |
Headaches | 1 (14.29) |
Vomiting | 1 (14.29) |
Constipation | 1 (14.29) |
Arthralgia | 1 (14.29) |
Itching or dry skin | 1 (14.29) |
Rash | 0 (0.00) |
Neuropathy | 0 (0.00) |
Alopecia | 1 (14.29) |
Retinopathy | 0 (0.00) |
None | 0 (0.00) |
Other (please specify any other side effects you experienced)a | 2 (28.57) |
MNC = Melanoma Network of Canada.
aBoth respondents who responded with “Other” reported internal bleeding as a side effect of encorafenib in combination with binimetinib.
Companion Diagnostic Test
SYSF stated that not all patients either know about companion diagnostic testing or have received testing. Those that received it either did not know what the testing was for and/or were not told about the results. Testing is not associated with any adverse effects and although it is free of cost, patients incur out-of-pocket expenses to travel to the testing centre. SYSF also commented that treatment for many patients was delayed because the tests results were not received by the oncologist and patients often experience anxiety while waiting for their test results. SYSF emphasized that better communication among all health care team members and timely access to test results would greatly help clinicians make informed decisions about patients’ treatment plans and help reduce patients’ anxiety.
Patients from the MNC survey did not report any issues receiving the BRAF V600 mutation testing. However, MNC also commented on the delay in receiving the test as it is not regularly offered to all melanoma patients, which can lead to treatment delays. MNC asserted that testing for the BRAF V600E mutation should be considered as a standard practice for all melanoma patients to avoid unnecessary treatment delays and reduce patients’ fear and anxiety.
Additional Information
SYSF provided additional comments for CADTH’S consideration. SYSF commented that melanoma is often associated with an approximately 3-month to 6-month survival rate, and timely access to effective therapies can result in longer survival. SYSF also expressed concerns that many patients and physicians do not have knowledge of the BRAF V600 mutation testing. In smaller remote regions, testing is either not happening or it can take about 2 weeks to 3 weeks to get results.
MNC reiterated the importance of enabling access to effective therapies that not only prolong survival but improve the overall QoL of patients. MNC emphasized that all 7 patients who had experience with encorafenib in combination with binimetinib experienced fewer side effects compared to previously used therapies and 4 reported slower disease progression. There remains significant opportunity for improvements for melanoma patients and a treatment like encorafenib in combination with binimetinib would provide these patients and caregivers with hopes of prolonged survival and better QoL.
Clinician Input
All CADTH review teams include at least 1 clinical specialist with expertise regarding the diagnosis and management of the condition for which the drug is indicated. Clinical experts are a critical part of the review team and are involved in all phases of the review process (e.g., providing guidance on the development of the review protocol, assisting in the critical appraisal of clinical evidence, interpreting the clinical relevance of the results, and providing guidance on the potential place in therapy). The following input was provided by 2 clinical specialists with expertise in the diagnosis and management of metastatic melanoma (including patients with V600-mutated disease).
Unmet Needs
There are a number of unmet needs that exist within the BRAF V600-mutated melanoma patient population. These include the following.
Treatments that are better tolerated. The current treatment option in this treatment space is dabrafenib in combination with trametinib, which can induce fever or fever syndrome in approximately 60% to 70% of patients. This can be detrimental to the patient and often leads to treatment interruptions, delays, or even cessation.
Treatments that overcome innate and acquired resistance to current immunotherapeutic regiments and BRAFi therapy.
Place in Therapy
The combination of encorafenib in combination with binimetinib will likely occupy the same place in the care pathway as dabrafenib in combination with trametinib and may not cause a shift in the current treatment paradigm. However, because there are important differences with respect to the toxicity profiles associated with each regimen, encorafenib in combination with binimetinib might represent an alternative treatment for patients with BRAF V600-mutated melanoma who demonstrate intolerance to dabrafenib in combination with trametinib.
Encorafenib in combination with binimetinib could be used in either first or subsequent lines of therapy. Currently, there is insufficient clinical evidence to stipulate whether BRAFi/MEKis or immunotherapies should be attempted first. This decision depends on the patients’ history, comorbidities, and risk of side effects.
Patient Population
Only patients with a BRAF V600 disease mutation would most likely demonstrate response to treatment with encorafenib in combination with binimetinib. The greatest need falls to those with unresectable stage III or IV metastatic disease with documentation of a V600 mutation. The COLUMBUS trial recruited patients with BRAF V600 E and K mutations but in practice, most clinicians would also consider BRAFi for patients with non-canonical BRAF V600 mutations (i.e., V600D or R). It is reasonable to consider the use of encorafenib in combination with binimetinib with these patients as well.
Eligible patients would be identified through BRAF mutational analysis. This testing is currently performed as standard of care for metastatic melanoma patients and funded through provincial governments. The test is highly specific and sensitive; therefore, misdiagnosis is unlikely to occur in clinical practice. Results are generally available within 2 weeks.
Since metastatic melanoma can spread rapidly, treatment of patients with low-burden and asymptomatic (and symptomatic) disease is common clinical practice. Although the COLUMBUS trial was restricted to patients with an ECOG PS of 0 to 1, similar BRAFi agents (such as dabrafenib in combination with trametinib) are routinely prescribed for patients with an ECOG PS greater than 1. It is reasonable to assume encorafenib in combination with binimetinib might also be prescribed for patients with an ECOG PS greater than 1. Patients with stable CNS metastases might also benefit from encorafenib in combination with binimetinib.
Patients with a V600 mutation who have demonstrated disease progression during treatment on another BRAFi regimen are unlikely to benefit from treatment with encorafenib in combination with binimetinib.
Assessing Response to Treatment
Patients who are treated with BRAFi (any regimen) are evaluated clinically every 1 month to 2 months with radiologic assessment every 3 months to 6 months (e.g., CT or PET/CT). Assessments are more frequent at the initiation of therapy and move to longer intervals once the patient demonstrates tolerability and response.
BRAFi regimens would be continued until disease progression or development of intolerable side effects from treatment.
A clinically meaningful response could encompass a wide range of factors (i.e., improved survival, reduction in symptoms, improved activities of daily living, and QoL). The magnitude of response will vary from patient to patient.
Discontinuing Treatment
Treatment with encorafenib in combination with binimetinib would be continued until disease progression and/or the development of treatment-limiting, treatment-related AEs. Patient wishes would also be factored into decision-making to discontinue treatment.
Prescribing Conditions
The treatment of melanoma is often centralized within academic cancer centres, although highly experienced and knowledgeable oncologists may often be found in community settings. The initial triage of melanoma patients, including determination of optimal first-line therapy, should be conducted in a multi-disciplinary setting. However, once treatment is determined, administration could occur in either community or specialized settings. Both of these settings are appropriate for the drugs under review.
Encorafenib in combination with binimetinib should only be prescribed by medical oncologists familiar with the toxicity profile associated with the regimen.
Additional Considerations
There is a need for an additional BRAF/MEK treatment for patients with a BRAF mutation who are intolerant of currently available BRAF/MEK regimens. Clinicians might find encorafenib in combination with binimetinib to be a suitable replacement for dabrafenib in combination with trametinib in cases of intolerance. While it might be considered as adjuvant treatment to surgery where dabrafenib in combination with trametinib is poorly tolerated, it should be noted that there is no evidence for the efficacy of encorafenib in combination with binimetinib in the adjuvant setting.
Clinician Group Input
This section was prepared by CADTH staff based on the input provided by patient groups.
Two clinician groups provided input were received for this review. One input was from the SYSF Medical Advisory Group and Supporters. The second input was from Ontario Health Cancer Care Ontario (OH-CCO) Skin Cancer Drug Advisory Committee. SYSF is a national, patient-led, not-for-profit group dedicated to the fight against non-melanoma skin cancers, melanoma, and ocular melanoma through nationwide education, advocacy, and awareness initiatives. Based in British Columbia, it is committed to playing an active role in reducing the incidence of skin cancer in Canada, and ensuring equal, timely, and affordable access to best care and compassionate support for all Canadians living with skin cancers, wherever they are in their journey. OH-CCO Skin Cancer Drug Advisory Committee is a drug advisory committee that provides timely evidence-based clinical and health system guidance on drug-related issues in support of Cancer Care Ontario’s mandate, including the Provincial Drug Reimbursement Programs and the Systemic Treatment Program.
Unmet Needs
The OH-CCO Skin Cancer Drug Advisory Committee indicated that the need for therapy that is better tolerated by patients (e.g., less photosensitivity reaction, less discontinuation due to treatment-related toxicities) is a key unmet need. Additional unmet needs include treatments that improved HRQoL and improved compliance (e.g., pyrexia is a common AE with dabrafenib in combination with trametinib, the current standard of care, which affects patients’ compliance with treatment). The goals of treatment with encorafenib in combination with binimetinib would be to improve survival and/or prolong life, and to improve HRQoL.
The SYSF Medical Advisory Group and Supporters noted that, given the long-term nature of therapy, the very frequent toxicities of dabrafenib in combination with trametinib are very challenging to treat and difficult for patients (mostly high grade fevers and chills, and rarely ocular and cardiac toxicity). Therefore, there is a need for treatment with similar or better efficacy and fewer toxicities than dabrafenib in combination with trametinib.
Place in Therapy
The OH-CCO Skin Cancer Drug Advisory Committee noted that the current standard of care is a combination therapy such as dabrafenib in combination with trametinib or cobimetinib in combination with vemurafenib. However, it was noted that vemurafenib is rarely used. The OH-CCO Skin Cancer Drug Advisory Committee indicated that encorafenib in combination with binimetinib, could potentially replace the current standard of care. Encorafenib in combination with binimetinib would provide an additional treatment option for patients unable to tolerate the current standard of care. It was noted that encorafenib in combination with binimetinib has a different toxicity profile than the current standard of care, and that prescribers need to be able to switch between agents for toxicity management.
The SYSF Medical Advisory Group and Supporters noted that the current treatment is dabrafenib in combination with trametinib for BRAF-mutant disease with normal lactate dehydrogenase (LDH) and less than 3 organs with metastases, or ineligibility for immunotherapy. Encorafenib in combination with binimetinib will likely be prescribed in a similar patient population. They added that toxicities related to these types of treatments are best avoided altogether, so they would not recommend trialling new patients on dabrafenib in combination with trametinib or vemurafenib in combination with cobimetinib “first.” Finally, they explained that they already use immunotherapy “first” in appropriate patients, and this new option would not change that (it would simply replace dabrafenib in combination with trametinib, or vemurafenib in combination with cobimetinib). In other words, the sequence of treatment in relationship to immunotherapy would remain exactly as it is now.
Patient Population
The OH-CCO Skin Cancer Drug Advisory Committee noted that patients with the greatest need would be those with unresectable stage III or IV BRAF V600 melanoma (including patients previously treated with immunotherapy) who are unable to tolerate the current standard of care. They noted that prescribers need to be able to switch patients to another combination (i.e., additional treatment options should be available for the management of treatment-related toxicities). The OH-CCO Skin Cancer Drug Advisory Committee also noted that this new therapy may be prescribed preferentially to new patients due to its decreased toxicity and added that reduced toxicities would also lead to less emergency room and clinic visits. Patients would be identified via BRAF molecular testing, which is already routinely done as part of the standard of care, and the treatment decision would also be based on clinical judgment. Patients without a BRAF mutation would not be suitable for treatment with encorafenib in combination with binimetinib.
The SYSF Medical Advisory Group and Supporters noted that treatment with encorafenib in combination with binimetinib would apply to the entire current dabrafenib in combination with trametinib population with BRAF V600 mutated melanoma. However, there would be a particular need for patients who might not be compliant with reporting, monitoring, or management of toxicities of current treatment (dabrafenib in combination with trametinib). They noted that the new therapy would likely be given to all patients with new incident cases, as well as those who could not tolerate the toxicities of current treatments. However, they said that they would not usually switch patients currently on dabrafenib in combination with trametinib unless their toxicities were unmanageable. Patients would be identified for treatment precisely as they are now for dabrafenib in combination with trametinib. That is, patients with BRAF V600-mutated melanoma, which is advanced or unresectable, ideally normal LDH, and less than 3 organs with metastases, unless the patient was not a candidate for immunotherapy as then ECOG PS should not be limited to 0 to 1 since patients can benefit extremely rapidly from cancer symptoms even if they are “sicker” because of disease symptoms. Patients not suitable for treatment would be those without the BRAF V600 mutation.
Assessing Response to Treatment
The OH-CCO Skin Cancer Drug Advisory Committee noted that clinical assessment (every 4 weeks to 6 weeks), imaging (every 2 months to 3 months), bloodwork (every 4 weeks to 6 weeks), and toxicity assessments would be used to assess patients’ response to treatment. A clinically meaningful response may include: a reduction in the frequency or severity of symptoms, an improved ability to perform activities of daily living, an improvement in symptoms, and/or a stabilization of symptoms (i.e., no deterioration).
The SYSF Medical Advisory Group and Supporters said that a measurable tumour response by examination or imaging, and/or an improvement of symptoms and stable disease, would be considered clinically meaningful responses to treatment. They stated that treatment response should be assessed clinically every 4 weeks initially and then as required, sometimes every 3 months. Radiographically the patient should be assessed at least every 3 months.
Discontinuing Treatment
The OH-CCO Skin Cancer Drug Advisory Committee noted that disease progression and treatment tolerability are factors that should be considered when deciding to discontinue treatment.
The SYSF Medical Advisory Group and Supporters noted that true progression (by Response Evaluation Criteria in Solid Tumors [RECIST] criteria), or high grade or refractory toxicities (as per the clinical trial protocol), would be reasons to discontinue treatment.
Prescribing Conditions
The Ontario Health Skin Cancer Drug Advisory Committee noted that this is a take-home cancer drug for use in the community setting. The SYSF Medical Advisory Group and Supporters noted that any setting is appropriate for encorafenib in combination with binimetinib, if the patient is under the care of a licensed medical oncologist.
Additional Considerations
The Ontario Health Skin Cancer Drug Advisory Committee noted that a significant proportion of patients are unable to tolerate currently funded treatments such as dabrafenib in combination with trametinib due to toxicities. The SYSF Medical Advisory Group and Supporters noted that the clinical benefit in terms of a better toxicity profile is very significant, and that it would likely be their agent(s) of choice.
Drug Program Input
The drug programs provide input on each drug being reviewed through CADTH’s reimbursement review processes by identifying issues that may impact their ability to implement a recommendation. The implementation questions and corresponding responses from the clinical experts consulted by CADTH are summarized in Table 10.
Table 10: Summary of Drug Plan Input and Clinical Expert Response
Drug program implementation questions | Clinical expert response |
|---|---|
How does encorafenib in combination with binimetinib compare to dabrafenib in combination with trametinib as well as cobimetinib in combination with vemurafenib? | Vemurafenib is not used often in clinical practice; less than 5% of patients would receive vemurafenib in combination with cobimetinib. Dabrafenib in combination with trametinib is better tolerated. The combination of encorafenib in combination with binimetinib would most likely be used in place of dabrafenib in combination with trametinib or in patients who do not tolerate dabrafenib in combination with trametinib. |
Can encorafenib in combination with binimetinib be used in patients with ECOG PS > 1? | Yes, in clinical practice, encorafenib in combination with binimetinib would be used in patients with ECOG PS > 1, even though it was not examined in the trial. The therapeutic index is quite wide. |
Are patients with CNS metastases eligible for encorafenib in combination with binimetinib? If so, should patients be asymptomatic or have stable symptoms? | Patients with CNS metastases are eligible. There is an ongoing trial that is looking at encorafenib in combination with binimetinib specifically for this group of patients. Currently, there is data looking at dabrafenib in combination with trametinib that shows an intracranial response rate of 50% for this group of patients, so we know that these drugs work very well for these patients and a risk/benefit analysis generally supports offering these patients treatment. |
Would it be appropriate to have the same eligibility as the other BRAF/MEK inhibitors? | Yes, the use of encorafenib in combination with binimetinib should align with dabrafenib in combination with trametinib. |
Should patients be limited to either encorafenib in combination with binimetinib or vemurafenib in combination with cobimetinib or dabrafenib in combination with trametinib other than a switch for toxicity? | If a patient is doing reasonably well on dabrafenib in combination with trametinib, patients would not be switched. The toxicity profiles between encorafenib in combination with binimetinib and dabrafenib in combination with trametinib are different; therefore, it might be reasonable to try switching within class for toxicities. The biggest difference is pyrexia as dabrafenib in combination with trametinib can lead to pyretic syndrome. In this case, a patient might be able to switch for better tolerability. Patients would not be switched unless they were enduring significant issues. |
Are patients eligible to receive encorafenib in combination with binimetinib if they received prior adjuvant BRAF/MEK inhibitors as prior BRAF/MEK inhibitor? (This was an exclusion criterion in the COLUMBUS trial.) | Unfortunately, there is no data to support this. The time period of 6 months has come up repeatedly in immunotherapy reviews over the last few years. Patients who are treated with an agent in the adjuvant setting such as nivolumab immunotherapy, can access nivolumab in the metastatic setting provided that there is a minimum 6-month interval between completion of adjuvant therapy and disease relapse. Practically, it would be a good way to handle encorafenib in combination with binimetinib. It would be nice for the clinician to have this option; it would be beneficial to give patients immunotherapy but there are patients with contraindications to immunotherapy. If the gap between completion of adjuvant therapy and disease relapse is a minimum of 6 months, the clinician may want to try rechallenging the metastatic setting. Further. there are data for re-treatment in patients who had previous response with dabrafenib in combination with trametinib. |
What line of therapy is encorafenib in combination with binimetinib recommended for as the funding request does not indicate line of therapy for the intended patient population? Would it be used as a first-line option or post-immunotherapy? | In clinical practice, it would be used either in the first-line or second-line setting. Currently, it is uncertain whether a patient would be treated first with immunotherapy and reserve targeted therapies for second-line or vice versa. If a patient is very unwell, targeted therapy would be used, but most clinicians would use immunotherapy first because it holds the potential for very dramatic and long-term responses. |
If a patient stopped because of tolerability, is it reasonable to restart encorafenib in combination with binimetinib? | Yes, tolerability can be a complex issue, but patients are often given treatment breaks on therapy. It is not often for intolerable toxicity, but the clinician does want to have the option to restart, which can be in the form of a dose reduction or a drug holiday that is customized. |
Do the eligible BRAF V600 mutation variants need to be specified (e.g., V600E, V600K)? | Practically speaking, a V600 mutation is a V600 mutation. There are data that suggest that these agents work for V600 K, V600D, and V600E. They tend to work with varying degrees but that is a reflection of small data. |
How will both drugs be packaged (e.g., bottle and blister packaging, and in what quantity)? | Encorafenib is supplied as 75 mg capsules in bottles of 60 and 90 capsules.21 Binimetinib is supplied as 15 mg tablets in bottles of 90 or 180 tablets.22 |
How frequently were dose interruptions or delays required in the COLUMBUS trial? What was the dose intensity of Combo 450? | The median duration of treatment was 51.2 weeks for Combo 450 (encorafenib in combination with binimetinib). The median dose intensity was 100% (IQR 93 to 100) of planned doses for encorafenib and 99.6% (IQR 80 to 100) of planned doses for binimetinib. This is compared to 86% (55 to 100) of planned doses for encorafenib and 94% for vemurafenib. In the encorafenib in combination with binimetinib arm, pyrexia was the most common AE leading to dose interruption (32%), dose reduction (13%), and discontinuation (2%). |
If a patient fails encorafenib in combination with binimetinib, could a single-agent BRAF inhibitor or MEK inhibitor be used? | Unless there is a hypersensitivity reaction to an agent that was MEK-related, there would be few reasons to use a single-agent BRAF inhibitor. Further, there is no data to support a MEK inhibitor as monotherapy. Only in rare instances of a specific toxicity, a clinician might cease binimetinib and continue encorafenib, but this would not occur in cases with drug resistance. |
Can patients receive checkpoint inhibitors and then encorafenib in combination with binimetinib, or encorafenib in combination with binimetinib and then checkpoint inhibitors? | There is no data to suggest optimal sequencing.20 Encorafenib in combination with binimetinib could be used in both first and subsequent lines of therapy in the same manner as dabrafenib in combination with trametinib currently used. |
AE = adverse event; CNS = central nervous system; Combo 450 = encorafenib 450 mg once daily plus binimetinib 45 mg twice daily; ECOG PS = Eastern Corporative Oncology Group Performance Scale; IQR = interquartile range; MEK = mitogen/extracellular signal-regulated kinase.
Source: CADTH Metastatic Melanoma Gap Analysis,20 encorafenib product monograph,21 and binimetinib product monograph.22
Clinical Evidence
The clinical evidence included in the review of encorafenib in combination with binimetinib is presented in 3 sections. The first section, the Systematic Review, includes pivotal studies provided in the sponsor’s submission to CADTH and Health Canada, as well as those studies that were selected according to an a priori protocol. The second section includes indirect evidence from the sponsor and indirect evidence selected from the literature that met the selection criteria specified in the review.
Systematic Review (Pivotal and Protocol Selected Studies)
Objectives
To perform a systematic review of the beneficial and harmful effects of encorafenib (75 mg capsules) and binimetinib (15 mg tablets) for the treatment of patients with unresectable or metastatic melanoma with a BRAF V600 mutation.
Methods
Studies selected for inclusion in the systematic review will include pivotal studies provided in the sponsor’s submission to CADTH and Health Canada, as well as those meeting the selection criteria presented in Table 11. Outcomes included in the CADTH review protocol reflect outcomes considered to be important to patients, clinicians, and drug plans.
Of note, the systematic review protocol presented below was established before the granting of a Notice of Compliance from Health Canada.
Table 11: Inclusion Criteria tor the Systematic Review
Criteria | Description |
|---|---|
Patient population | Patients with unresectable or metastatic melanoma with a BRAF V600 mutation Subgroups:
|
Intervention | Encorafenib 450 mg q.d., orally Binimetinib 45 mg b.i.d., orally |
Comparators | trametinib + dabrafenib cobimetinib + vemurafenib pembrolizumab monotherapy ipilimumab monotherapy nivolumab monotherapy ipilimumab + nivolumab |
Outcomes | Efficacy outcomes:
Harms outcomes: AEs, SAEs, WDAEs, mortality, dose modifications, notable harms (e.g., eye toxicity, cardiomyopathy, second malignancy, dermatological AEs, pyrexia) |
Study design | Published and unpublished phase III and IV RCTs |
AE = adverse event; b.i.d. = twice a day; HRQoL = health-related quality of life; q.d. = every day; RCT = randomized controlled trial; SAE = serious adverse event; WDAE = withdrawal due to adverse event.
aThese outcomes were identified as being of particular importance to patients in the input received by CADTH from patient groups.
The literature search for clinical studies was performed by an information specialist using a peer-reviewed search strategy according to the PRESS Peer Review of Electronic Search Strategies checklist (https://www.cadth.ca/resources/finding-evidence/press).25
Published literature was identified by searching the following bibliographic databases: MEDLINE All (1946‒) via Ovid and Embase (1974‒) via Ovid. The search strategy comprised both controlled vocabulary, such as the National Library of Medicine’s MeSH (Medical Subject Headings), and keywords. The main search concept was Braftovi (encorafenib). Clinical trials registries were searched: the US National Institutes of Health’s clinicaltrials.gov, Health Canada’s Clinical Trials Database, and the European Union Clinical Trials Register.
No filters were applied to limit the retrieval by study type. Retrieval was not limited by publication date or by language. Conference abstracts were excluded from the search results. See Appendix 1 for the detailed search strategies.
The initial search was completed on January 20, 2021. Regular alerts updated the search until the meeting of the pERC on May 14, 2021.
Grey literature (literature that is not commercially published) was identified by searching relevant websites from the Grey Matters: A Practical Tool For Searching Health-Related Grey Literature checklist (https://www.cadth.ca/grey-matters).26 Included in this search were the websites of regulatory agencies (US FDA and European Medicines Agency). Google was used to search for additional internet-based materials. See Appendix 1 for more information on the grey literature search strategy.
These searches were supplemented by reviewing bibliographies of key papers and through contacts with appropriate experts. In addition, the manufacturer of the drug was contacted for information regarding unpublished studies.
Two CADTH clinical reviewers independently selected studies for inclusion in the review based on titles and abstracts, according to the predetermined protocol. Full text articles of all citations considered potentially relevant by at least 1 reviewer were acquired. Reviewers independently made the final selection of studies to be included in the review, and differences were resolved through discussion.
Findings from the Literature
A total of 1 study was identified from the literature for inclusion in the systematic review (Figure 1). The included study is summarized in Table 12. A list of excluded studies is presented in Appendix 2.
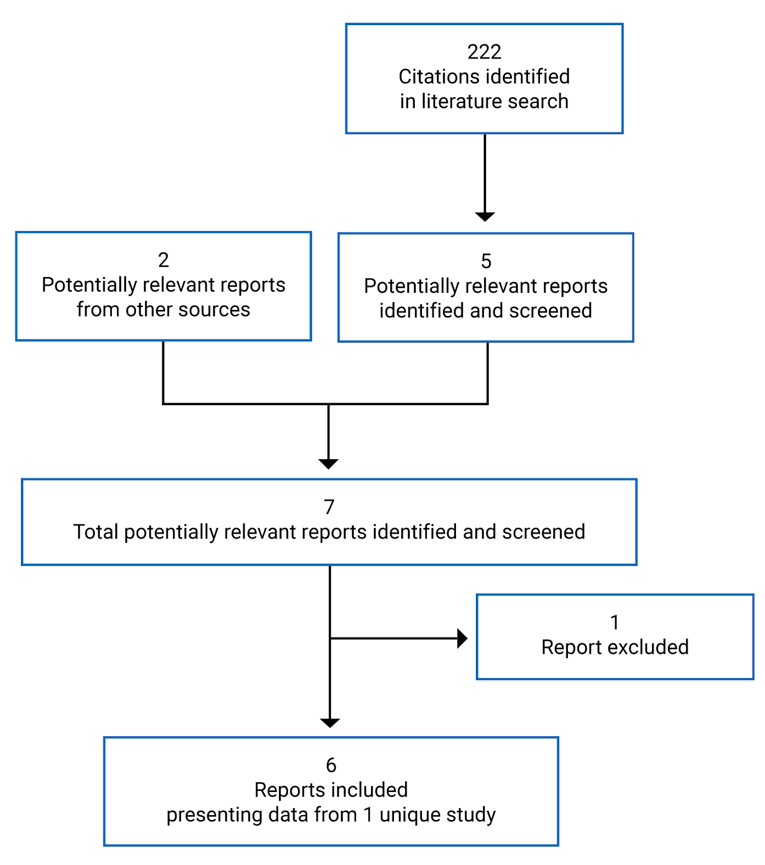
Table 12: Details of Included Studies
COLUMBUS | |
|---|---|
Designs and populations | |
Study design | OL RCT |
Locations | North America, Europe, Asia, Australia |
Patient enrolment dates | November 20, 2013 to May 19, 2016 |
Randomized (N) | 577 |
Inclusion criteria | Age ≥ 18 years Histologically confirmed locally advanced, unresectable or metastatic BRAF V600E and/or V600K-mutant cutaneous melanoma or unknown primary melanoma (stage IIIB, IIIC, or IV per AJCC) Previously untreated (treatment naive) or had progressed on or after prior first-line immunotherapy for advanced or metastatic disease. Prior systemic treatment in the adjuvant setting was allowed, except for the administration of BRAF or MEK inhibitors. At least 1 measurable lesion per RECIST, version 1.1 ECOG PS of 0 to 1 and adequate organ, bone marrow, and cardiac function, including left ventricular ejection fraction ≥ 50% by cardiac imaging and laboratory parameters. |
Exclusion criteria |
|
Drugs | |
Intervention | Encorafenib 450 mg once daily and binimetinib 45 mg twice daily |
Comparators | Encorafenib 300 mg once daily Vemurafenib 960 mg twice daily |
Duration | |
Phase | III |
Run-in | 21 days |
Treatment | 22 months |
Follow up | 30-day safety follow-up; survival follow-up every 12 weeks |
Data cut-offs | Data included in this submission is based on COLUMBUS Part 1 only Primary Analysis: May 19, 2016 Interim OS + PFS analysis: November 7, 2017 Updated OS + PFS analysis: November 8 20186 |
Outcomes | |
Primary end point | PFS |
Secondary and exploratory end points | Secondary:
Exploratory:
|
Notes | |
Publications | Ascierto et al. (2020)6 Gogas, et al. (2019)27 Dummer et al. (2018)28 Dummer et al (2018)29 |
AJCC = American Joint Committee on Cancer; CNS = central nervous system; ECOG PS = Eastern Cooperative Oncology Group Performance Status; EORTC QLQ-C30 = European Organisation for Research and Treatment of Cancer Quality of Life Questionnaire Core 30; EQ-5D-5L = EuroQol 5-Dimensions 5-Levels questionnaire; FACT-M = Functional Assessment of Cancer Therapy–Melanoma; OL = open label; OS = overall survival; PFS = progression-free survival; RCT = randomized controlled trial; RECIST = Response Evaluation Criteria in Solid Tumours; SCC = squamous cell carcinoma.
Note: One additional report was included (CADTH submission30).
Source: Clinical Study Report for the COLUMBUS study7 and Ascierto et al. (2020).6
Description of Studies
One pivotal trial, COLUMBUS (N = 577), was included in the CADTH systematic review. Details of the COLUMBUS trial are provided in Table 12.
The COLUMBUS trial was a multi-centre, randomized, open-label, phase III trial that aimed to compare the efficacy and safety of encorafenib in combination with binimetinib to vemurafenib monotherapy and encorafenib monotherapy in patients with locally advanced, unresectable or metastatic melanoma with BRAF V600 mutation. The COLUMBUS trial was performed between November 20, 2013 and May 19, 2016 at 162 clinical sites in 28 countries including 6 sites in Canada that enrolled 29 patients.
The COLUMBUS trial was composed of 2 parts (Figure 2); data are available for Part 1 only. The purpose of Part 2 was to isolate the contribution of binimetinib to the combination by equalizing the encorafenib dose in both the combination and monotherapy arm to 300 mg each. Therefore, both encorafenib in combination with binimetinib and encorafenib arms had an equivalent dose. This change was made via protocol amendment 3 (November 4, 2014).
In Part 1, patients with locally advanced, unresectable or metastatic melanoma with BRAF V600 mutation were randomized in a 1:1:1 ratio to the following treatment arms:
encorafenib 450 mg once daily and binimetinib 45 mg twice daily,
encorafenib 300 mg once daily,
vemurafenib 960 mg twice daily.
The data cut-off for the COLUMBUS trial Part 1 (primary analysis) was May 19, 2016. An interim OS and PFS analysis was provided with an updated data cut of November 7, 2017. Further, an updated 3-year analysis was published in a peer-reviewed journal in 2019 (data cut-off November 2018). CSRs were provided for the Part 1 primary analysis (2016) and interim analysis (2017). A table comparing November 2017 and 2018 data cuts is available in Appendix 3, Table 29.
Randomization was performed via interactive response technology that includes interactive voice response system and interactive web response system. Randomization was stratified based on AJCC stage (IIIB, IIIC, IVM1a, and IVM1c versus IVM1c), ECOG PS (0 versus 1), and prior first-line immunotherapy (yes versus no).
Figure 2: Study Design for COLUMBUS
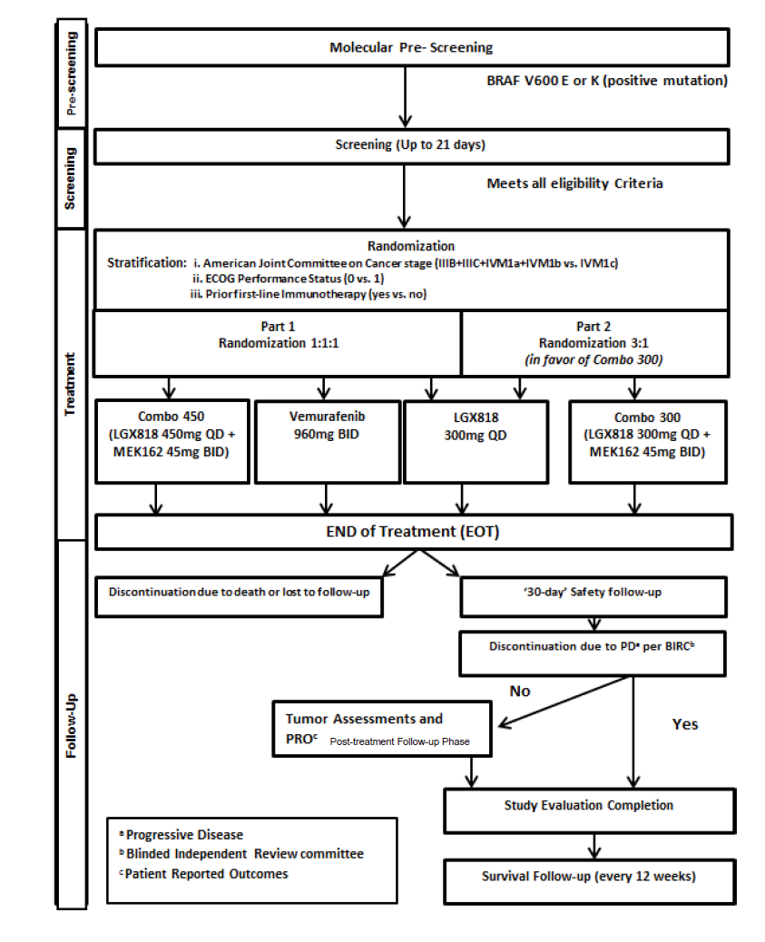
BID = twice a day; BIRC = Blinded Independent Review Committee; ECOG = Eastern Cooperative Oncology Group; LGX818 = encorafenib; QD = every day; PD = progressive disease; PRO = patient-reported outcome.
Source: Clinical Study Report for the COLUMBUS study.7
Populations
Inclusion and Exclusion Criteria
Detailed inclusion and exclusion criteria for the COLUMBUS trial are presented in Table 12. The COLUMBUS trial was conducted in adult patients 18 years of age and older with histologically confirmed locally advanced, unresectable or metastatic BRAF V600 mutant cutaneous melanoma or unknown primary melanoma (stage IIIB, IIIC, or IV per AJCC). Patients were required to be previously untreated (treatment naive) or had progressed on or after prior first-line immunotherapy for unresectable, locally advanced or metastatic melanoma. Prior adjuvant therapy was permitted (e.g., interferon, interleukin-2 therapy, any other immunotherapy, radiotherapy, or chemotherapy), with the exception of the administration of BRAFis or MEKis. Other key exclusion criteria were any untreated CNS lesions, uveal and mucosal melanoma, history of leptomeningeal metastases, retinal vein occlusion, history of allogeneic bone marrow transplantation, prior therapy with a BRAFi and/or MEKi, any previous systemic chemotherapy, extensive radiotherapy, and more than 1 line of immunotherapy.
Baseline Characteristics
The baseline characteristics were balanced between the randomized treatment arms in the COLUMBUS trial (Table 13). Patients had a mean age between 54.6 (standard deviation [SD] = 12.63) and 56.2 (SD = 16.62). Male patients accounted for 55.7% to 59.9% of the population in each arm. The majority (86.9% to 94.3%) of patients were Caucasian. Most patients had a BRAF V600E mutation (88.6%), while the remainder were V600K-mutant positive (10.9%), except for 1 patient in the vemurafenib arm who was V600E- and K-mutant positive. The majority of patients across the 3 treatment arms had an ECOG PS of 0 (encorafenib in combination with binimetinib, 136 of 192 [70.8%]; encorafenib, 140 of 194 [72.2%]; and vemurafenib, 140 of 191 [73.3%]). Prior antineoplastic therapy was balanced between treatment groups. Characteristics for use of prior antineoplastic therapy are reported in Table 14.
Table 13: Summary of Baseline Characteristics
Characteristic | Encorafenib and binimetinib N = 192 | Encorafenib N = 194 | Vemurafenib N = 191 |
|---|---|---|---|
Age, years | |||
Mean (SD) | 56.2 (13.62) | 54.6 (12.63) | 55.2 (14.18) |
Median | 57.0 | 54.0 | 56.0 |
Range | 20 to 89 | 23 to 88 | 21 to 82 |
Age category, years, n (%) | |||
< 65 | 132 (68.8) | 154 (79.4) | 140 (73.3) |
≥ 65 | 60 (31.3) | 40 (20.6) | 51 (26.7) |
Sex, n (%) | |||
Female | 77 (40.1) | 86 (44.3) | 80 (41.9) |
Male | 115 (59.9) | 108 (55.7) | 111 (58.1) |
Race, n (%) | |||
Caucasian | 181 (94.3) | 174 (89.7) | 166 (86.9) |
Asian | 5 (2.6) | 6 (3.1) | 8 (4.2) |
Native American | 0 (0) | 2 (1.0) | 2 (1.0) |
Other | 3 (1.6) | 2 (1.0) | 2 (1.0) |
Unknown | 2 (1.0) | 9 (4.6) | 12 (6.3) |
Missing | 1 (0.5) | 1 (0.5) | 1 (0.5) |
ECOG Performance Status, n (%)a | |||
0 | 136 (70.8) | 140 (72.2) | 140 (73.3) |
1 | 56 (29.2) | 54 (27.8) | 51 (26.7) |
Primary site of cancer, n (%) | |||
Skin melanoma | 191 (99.5) | 192 (99.0) | 190 (99.5) |
Unknown | 1 (0.5) | 2 (1.0) | 1 (0.5) |
Stage at time of study entry, n (%) | |||
Stage IIIB | 0 | 2 (1.0) | 1 (0.5) |
Stage IIIC | 9 (4.7) | 4 (2.1) | 10 (5.2) |
Stage IV M1A | 26 (13.5) | 29 (14.9) | 24 (12.6) |
Stage IV M1B | 34 (17.7) | 39 (20.1) | 31 (16.2) |
Stage IV M1C with elevated LDH | 50 (26.0) | 50 (25.8) | 36 (18.8) |
Stage IV M1C with normal LDH | 73 (38.0) | 70 (36.1) | 89 (46.6) |
Time from initial diagnosis to onset of metastatic disease, months | |||
n | 187 | 191 | 187 |
Mean (SD) | 37.02 (61.090) | 36.45 (62.708) | 38.14 (52.994) |
Median | 15.05 | 13.04 | 14.92 |
Min to max | 0.0 to 448.5 | 0.0 to 388.8 | 0.0 to 280.5 |
BRAF mutation status, n (%) | |||
V600E | 170 (88.5) | 173 (89.2) | 168 (88.0) |
V600K | 22 (11.5) | 19 (9.8) | 23 (12) |
Number of organs involved at baselineb, n (%) | |||
1 | 47 (24.5) | 56 (28.9) | 45 (23.6) |
2 | 58 (30.2) | 52 (26.8) | 59 (30.9) |
3 | 45 (23.4) | 42 (21.6) | 42 (22.0) |
> 3 | 42 (21.9) | 44 (22.7) | 45 (23.6) |
LDH at baseline (U/L) | |||
n | 192 | 194 | 191 |
Mean (SD) | 298.7 (368.93) | 265.2 (251.21) | 239.8 (189.27) |
Median | 173.0 | 188.5 | 174.0 |
Min to max | 76 to 3,590 | 75 to 1,886 | 57 to 1,285 |
LDH at baseline, n (%) | |||
Low | 0 | 0 | 0 |
Normal | 137 (71.4) | 147 (75.8) | 139 (72.8) |
High | 55 (28.6) | 47 (24.2) | 52 (27.2) |
Missing | 0 | 0 | 0 |
ECOG = Eastern Cooperative Oncology Group; LDH = lactate dehydrogenase; NA = not applicable; SD = standard deviation.
aLast non-missing ECOG Performance Status before or on the start of study treatment for patients who took at least 1 study treatment or before or on day 1 of cycle 1 for patients who did not take any study treatment.
bFor patients with stage IIIB and IIIC at study entry, the number of organs involved at baseline is equal to 1 and presented as skin.
Source: Clinical Study Report for the COLUMBUS study.7
Table 14: Prior Antineoplastic Therapy Characteristics
Characteristic | Encorafenib and binimetiniba N = 192 | Encorafeniba N = 194 | Vemurafeniba N = 191 |
|---|---|---|---|
Any therapyb | 158 (82.3) | 161 (83.0) | 165 (86.4) |
Medication | 62 (32.3) | 63 (32.5) | 59 (30.9) |
Surgery | 146 (76.0) | 149 (76.8) | 157 (82.2) |
Radiotherapy | 30 (15.6) | 42 (21.6) | 25 (13.1) |
Medication: setting at last treatment | NA | NA | NA |
Adjuvant | 52 (27.1) | 46 (23.7) | 46 (24.1) |
Neoadjuvant | 0 (0) | 1 (0.5) | 1 (0.5) |
Therapeutic, metastatic | 10 (5.2) | 16 (8.2) | 12 (6.3) |
Radiotherapy: setting at last radiotherapy | |||
Adjuvant | 17 (8.9) | 20 (10.3) | 11 (5.8) |
Neoadjuvant | 0 (0) | 1 (0.5) | 0 (0) |
Therapeutic, metastatic | 6 (3.1) | 11 (5.7) | 6 (3.1) |
Therapeutic | 3 (1.6) | 6 (3.1) | 4 (2.1) |
Palliative | 2 (1.0) | 4 (2.1) | 2 (1.0) |
Other | 2 (1.0) | 0 (0) | 0 (0) |
Missing | 0 (0) | 0 (0) | 2 (1.0) |
Any immunotherapy | 57 (29.7) | 58 (29.9) | 57 (29.8) |
Ipilimumab | 7 (3.6) | 10 (5.2) | 7 (3.7) |
Anti-PD1/PDL1 | 1 (0.5) | 2 (1.0) | 0 (0) |
Interferons/Interleukins | 51 (26.6) | 51 (26.3) | 52 (27.2) |
Ipilimumab setting b,c | n = 7 | n = 10 | n = 7 |
Adjuvant | 2 (28.6) | 1 (10.0) | 2 (28.6) |
Therapeutic, metastatic | 5 (71.4) | 9 (90.0) | 5 (71.4) |
Anti-PD1/PDL1 setting b,c | n = 1 | n = 2 | n = 0 |
Therapeutic, metastatic | 1 (100) | 2 (100) | 0 (0) |
Interferons/Interleukins, setting a | n = 51 | n = 51 | n = 52 |
Adjuvant | 47 (92.2) | 46 (90.2) | 46 (88.5) |
Neoadjuvant | 0 (0) | 1 (2.0) | 1 (1.9) |
Therapeutic, metastatic | 4 (7.8) | 4 (7.8) | 5 (9.6) |
PD1 = programmed cell death protein 1; PDL1 = programmed cell death-ligand 1
aValues are presented as n (%), unless otherwise indicated.
bA patient may have had multiple therapy types.
cA patient may have received ipilimumab or anti-PD1/PDL1 in combination.
Source: Clinical Study Report for the COLUMBUS study.7
Interventions
Patients eligible for enrolment in the COLUMBUS trial were randomized in a 1:1:1 ratio to encorafenib 450 mg once daily in combination with binimetinib 45 mg twice daily, encorafenib 300 mg once daily, or vemurafenib 960 mg twice daily.
Encorafenib was supplied centrally as capsules for oral administration in dosage strengths of 50 mg and 100 mg and packaged per strength into bottles. Binimetinib was supplied centrally as film-coated tablets for oral administration in a dosage strength of 15 mg and packaged into high-density polyethylene bottles. The prescribed doses of encorafenib were to be taken once daily, approximately 24 hours apart, and the prescribed doses of binimetinib were to be taken twice daily, approximately 12 ± 2 hours apart. Vemurafenib was supplied as tablets for oral administration in a dosage strength of 240 mg, either centrally or purchased locally for those countries where it was available and feasible, in blisters, boxes, or bottles, depending on the source. Vemurafenib was to be administered according to the locally approved prescribing information, that is 960 mg twice daily orally with a large glass of water (approximately 250 mL), doses approximately 12 ± 2 hours apart.
Encorafenib, binimetinib, and vemurafenib were administered on a daily schedule as a flat-fixed dose and were dispensed to the patient by authorized site personnel. Patients were supplied with a sufficient number of tablets and/or capsules for the number of doses to be taken before the next scheduled visit.
Dose modifications and interruptions were permitted for patients who were unable to tolerate the protocol-specified dose(s) to prolong the patient’s overall exposure to study drug and to increase the likelihood of potential benefit to the patient.
Patients taking concomitant medications chronically were to maintain the same dose and dosing schedule throughout the study, if medically feasible.
Treatment with the following therapies was prohibited during the study: anticancer therapies (including chemo-, biologic, or radiation therapy [covering > 30% of the red bone marrow reserve], and surgery) and strong inhibitors of the CYP3A4 substrate. Patients that required palliative radiotherapy and/or stereotactic radiotherapy were to interrupt treatment for at least 5 half-lives of the respective study drug(s) (e.g., interruption of approximately 1 day for encorafenib monotherapy, 2 days for encorafenib in combination with binimetinib combination therapy, and 12 days for vemurafenib) before and after radiotherapy or after having recovered from the side effects of such a procedure.
Outcomes
A list of efficacy end points identified in the CADTH review protocol that were assessed in the clinical trials included in this review is provided in Table 15. These end points are further summarized as follows. A detailed discussion and critical appraisal of the outcome measures is provided in Appendix 4.
Table 15: Summary of Outcomes of Interest Identified in the CADTH Review Protocol
Outcome measure | COLUMBUS |
|---|---|
PFS | Primary |
OS | Secondary |
ORR | Secondary |
TTR | Secondary |
DCR | Secondary |
DOR | Secondary |
FACT-M | Secondary |
EORTC QLQ-C30 | Secondary |
EQ-5D-5L | Secondary |
DCR = disease control rate; DOR = duration of response; EORTC QLQ-C30 = European Organisation for Research and Treatment of Cancer Quality of Life Questionnaire Core 30; EQ-5D-5L = EuroQol 5-Dimensions 5-Levels questionnaire; FACT-M = Functional Assessment of Cancer Therapy–Melanoma; ORR = objective response rate; OS = overall survival; PFS = progression-free survival; TTR = time to objective response.
Survival
Survival was assessed in the COLUMBUS trial as PFS and OS, every 12 weeks until death, via visits, phone calls, or letters. These were assessed by BIRC, which reviewed all of the study radiographic and photographic data. A designated imaging vendor was responsible for operationalizing and managing the BIRC.
PFS was defined as the time from the date of randomization to the date of the first documented progression or death due to any cause, whichever occurred first. If a patient did not have an event at the time of the analysis cut-off or at the start of any new antineoplastic therapy, PFS was censored at the date of the last adequate tumour assessment. Disease progression was determined based on tumour assessment according to RECIST, version 1.1 criteria. Blinded tumour assessment data read centrally by a BIRC were used in the primary efficacy analysis.
OS was defined as the time from the date of randomization to the date of death due to any cause. If a death was not observed by the date of analysis cut-off, OS was to be censored at the date of last contact. Survival time for patients with no post-baseline survival information was to be censored on the date of randomization.
Response
Response was assessed as best overall response (BOR), ORR, TTR and DOR, and DCR. Baseline imaging was performed with CT, MRI, X-ray, or digital photography of skin lesions.
BOR was derived as per RECIST, version 1.1. The BOR for each patient was determined from the sequence of overall (lesion) responses according to the following rules.
Complete response (CR), defined as at least 2 determinations of CR at least 4 weeks apart before progression, where confirmation was required, or 1 determination of CR before progression, where confirmation was not required.
Partial response (PR), defined as at least 2 determinations of PR or better at least 4 weeks apart before progression, (and not qualifying for a CR), where confirmation was required, or 1 determination of PR before progression, where confirmation was not required.
Stable disease, defined as at least 1 stable disease assessment (or better) greater than 6 weeks after randomization or start of treatment (and not qualifying for CR or PR).
Progressive disease (PD), defined as early progression at least 12 weeks or earlier after randomization or start of treatment (and not qualifying for CR, PR, or stable disease).
Unknown, defined as all other cases (i.e., not qualifying for confirmed CR or PR and without stable disease after more than 6 weeks or early progression within the first 12 weeks).
ORR was defined as the proportion of patients with BOR of CR or PR. Two sets of ORR were to be considered, 1 for confirmed and 1 for confirmed and unconfirmed responses.
TTR was defined as the time between the date of randomization until first documented response of CR or PR.
DOR was calculated as the time from the date of first documented response (CR or PR) to the first documented progression or death due to underlying cancer. If a patient with a CR or PR had no progression or death due to underlying cancer, the patient was censored at the date of last adequate tumour assessment.
DCR was calculated as the proportion of patients with a BOR of CR, PR, stable disease or non-CR/non-PD (i.e., for patients with no target lesions) per RECIST, version 1.1. Two sets of DCR were to be considered, 1 for confirmed and 1 for unconfirmed responses.
Health-Related Quality of Life
HRQoL was assessed using the FACT-M, version 4, EORTC QLQ-C30, version 3.0, and EQ-5D-5L, version 4.0. Each of the tests assessed patients (who remained in the study) who were considered at risk. The instruments were administered every 8 weeks from randomization during the first 24 months (until week 105) and every 12 weeks after until disease progression per BIRC.
FACT-M (version 4) is a melanoma-specific QoL questionnaire from the Functional Assessment of Chronic Illness Therapy (FACIT) catalogue of HRQoL questionnaires.
EORTC QLQ-C30 is composed of both multi-item scales and single-item measures, which include 5 functional scales (physical, role, emotional, cognitive, and social functioning), 3 symptom scales (fatigue, nausea/vomiting, and pain), 6 single items (dyspnea, insomnia, appetite loss, constipation, diarrhea, and financial impact), and a global health status/QoL scale.
EQ-5D-5L is a standardized measure of health utility that provides a single index value for one’s health status. A higher score reflects better a better QoL. EQ-5D-5L measurement properties have not been identified in melanoma patients.
Statistical Analysis
In the COLUMBUS trial, statistical analysis occurred according to intention-to-treat principles which consisted of all randomized patients according to the treatment they were assigned to at the time of randomization. BIRC assessments were used for the main analyses of primary and secondary end points to prevent evaluation bias. Investigator (INV) assessments were used as supportive analyses. Analyses used the full analysis set (FAS) unless otherwise specified. Patients were stratified into 2 strata at randomization: cancer stage and ECOG PS. An initial “prior immunotherapy” (yes versus no) strata was combined due to low prevalence. Therefore, all models and tests in the study were stratified by cancer stage and ECOG PS.
Determination of Sample Size
Sample size assumptions for the treatment arms were based on PFS results of a phase IB or II trial for the encorafenib in combination with binimetinib arm in the COLUMBO study, phase I study for encorafenib 300 mg once daily (ENCO300), and updated results from the BRIM-3, BRIM-2/COMBI-v, and coBRIM trials for vemurafenib. For the comparison between the encorafenib in combination with binimetinib, and encorafenib arms, 191 PFS events were required to detect a HR of 0.667 with 80% power using a log-rank test at a-sided 2.5% level of significance, assuming a 15% loss to follow up. A total of 576 patients (192 in each arm) were planned to be recruited over 15 months for Part 1 of the trial.7
Primary End Point
The primary end point of the COLUMBUS trial was PFS for the comparison between the encorafenib and binimetinib combination therapy arm versus the vemurafenib monotherapy arm, as assessed by BIRC. PFS is an accepted surrogate end point for survival for metastatic melanoma. PFS was analyzed using a Cox regression model, stratified by randomization factors (cancer stage [IIIB, IIIC, IVM1a, and IVM1b versus IVM1c] and ECOG PS score [0 versus 1]). This method was used to estimate HRs, along with the 2-sided 95% CI based on the Wald test. PFS curves were estimated using Kaplan-Meier methods, reporting estimates in median months with 95% CI at the 25th and 75th percentiles. To assess the validity of the proportional hazard assumption, the log-cumulative hazard plot was produced for each stratum. The difference between treatments arms (encorafenib in combination with binimetinib versus encorafenib) were tested statistically by a 1-sided stratified log-rank test with a significance level of P less than 0.025. PFS was censored at the date of last tumour assessment.
Secondary End Points
PFS assessed by BIRC for the comparison between the encorafenib and binimetinib combination therapy and the encorafenib monotherapy was a key secondary outcome in the COLUMBUS trial. The encorafenib population used in this comparison included all patients randomized to encorafenib (from both Part 1 and Part 2). This end point was to be tested if the Part 1 primary and key secondary end points were both statistically significant.
OS was a key secondary end point included in the testing hierarchy for the trial. Based on the statistical testing hierarchy, OS would only be tested if testing for PFS was statistically significant (Figure 3). The timing of the OS interim analysis was changed in Protocol Version 5 after discussions with the FDA. The number of events required for OS analysis was 232. The sponsor was blinded to OS summaries until these events were observed (data cut-off November 7, 2017).
Other key secondary efficacy end points included BOR, ORR, TTR and DOR, and DCR. The same method of analysis and supportive analysis for the primary end point was used for key secondary end points.
BOR was summarized per treatment arm. Tumour assessments performed before the start of any antineoplastic therapy (and not later than 30 days after last dose) were considered and ORR was described by treatment arm along with 95% CI. TRR was also described in median months per treatment arm using Kaplan-Meier methods with 95% CI, 25th, and 75th percentiles. No formal statistical test was performed. CR and PR did not need to be confirmed. Two sets of DOR were considered; 1 for confirmed and 1 for both unconfirmed and confirmed responses combined. DCR was presented descriptively by treatment arm along with exact 95% CI.
HRQoL data were collected as patient-reported outcomes at baseline, cycle 3 day 1, every 8 weeks for 24 months, and every 12 weeks afterwards until progression. Each scale was scored according to the test manual. The primary analysis was to assess the time to definitive 10% deterioration in each treatment arm. Time to deterioration was analyzed by treatment arm using the Kaplan-Meier method in median months with the 95% CI at the 25th and 75th percentiles. The Cox regression model, stratified by randomization factors (cancer stage and ECOG PS) was used to estimate the HR. No formal statistical test was performed to compare the treatment arms, and therefore, no multiplicity adjustments were made. Mixed-effect model repeated measure was used to compare treatment arms from change from baseline in the domain score over time (including the FACT-M subscale, index score of the EQ-5D-5L and global health status, and QoL scale score). The model included terms for treatment, randomization stratification factors, time, baseline value as main effects, and an interaction term for treatment by time. Time was a continuous variable.
Multiplicity Considerations
The study employed a hierarchical testing procedure that is described in Figure 3.
Figure 3: COLUMBUS: Statistical Testing Hierarchy for Primary and Key Secondary Outcomes
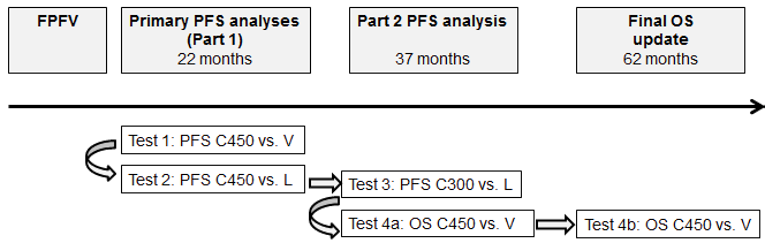
C300 = encorafenib 300 mg once daily plus binimetinib 45 mg twice daily; C450 = encorafenib 450 mg once daily plus binimetinib 45 mg twice daily; FPFV = first patient first visit; L = encorafenib 300 mg once daily; OS = overall survival; PFS = progression-free survival; V = vemurafenib 960 mg twice daily; vs. = versus.
Note: The hierarchical testing sequence is from left to right. The timing of the analyses refers to the analysis cut-off date (i.e., when the expected number of events or time point was reached)
Source: Clinical Study Report for the COLUMBUS trial7
Subgroup Analyses
PFS subgroup analyses were performed on PFS for a variety of groups. However, clinical experts determined that disease stage, line of therapy, and brain metastases were most clinically relevant for the purposes of this review. Subgroups were pre-specified in the statistical analysis plan a priori. A forest plot was to be provided. The analyses included Kaplan-Meier summaries and HRs from unstratified Cox models.
Sensitivity Analysis
Multiple sensitivity analyses were conducted to support the analysis of primary and key secondary end points. Nominal P values were displayed to support the sensitivity analysis. Sensitivity analysis included the following.
The analyses for PFS were repeated with local review data and used the same analytical conventions as BIRC.
The analyses of PFS were also repeated using the BIRC data for the PPS.
The distribution of PFS in the FAS was compared among the treatment arms using an unstratified log-rank test and the HR results from an unstratified Cox model were to be presented.
The PFS analyses were repeated with a censoring rule that included a PFS event even if the event was recorded after 2 or more missing tumour assessments.
The PFS analyses were repeated with a censoring rule that backdated events occurring after 1 or more missing tumour assessments. Events were meant to be backdated to 8 weeks (or 12 weeks if the patient had been on treatment for at least 12 weeks) after the last adequate tumour assessment.
If 15 patients had tumour assessments that occurred after the start of another anticancer therapy, assessed per the BIRC, an additional sensitivity analysis for PFS by BIRC was performed to include these assessments.
Safety data were summarized descriptively using the safety set.
Protocol Amendments
Over the course of the study, there were several protocol amendments, some which affected the planned analyses. Of note, first-line immunotherapy (yes versus no) was added as a stratification factor for randomization and in the primary analysis in version 2. In Protocol Version 3, it was removed to avoid an empty or small stratum. However, given the timing of these amendments, they are not expected to affect the integrity of the study design or the results.
Analysis Populations
In the COLUMBUS trial, the FAS (n = 577) was defined according to the intention-to-treat principle which consisted of all randomized patients. Analysis for efficacy end points was performed using the FAS.
The per-protocol set (n = 556) consisted of all patients from the FAS without any major deviations who received at least 1 dose of the study medication.
The safety set (n = 570) included all patients who received at least 1 dose of the study medication and 1 baseline safety evaluation. Patients in the safety set were analyzed according to the study treatment they received.
Results
Patient Disposition
Table 16 provides a summary of the patient disposition at the time of data cut-offs (May 19, 2016 and November 7, 2017) in the COLUMBUS study. As of May 2016, 141 patients (24%) remained in the treatment period of the study. The discontinuation rate was highest in the vemurafenib arm (83.2%) compared to the encorafenib and binimetinib (64.6%) and encorafenib monotherapy (75.3%) arms. The most common reason for study discontinuation was PD (44%), followed by AEs (11%). Discontinuation due to PD was also highest in the vemurafenib arm (52%) when compared to the encorafenib and binimetinib (43.2%) and encorafenib (44.8%) arms.
Patient disposition | Encorafenib and binimetinib | Encorafenib | Vemurafenib | |||
|---|---|---|---|---|---|---|
Screened, N | 1,345 | |||||
Randomized, N (%) | 192 (100) | 194 (100) | 191 (100) | |||
Data cut-off, year | 2016 | 2017 | 2016 | 2017 | 2016 | 2017 |
Patients treated, n (%) | ||||||
Treatment ongoing | 68 (35.4) | 43 (22.4) | 46 (23.7) | 24 (12.4) | 27 (14.1) | 13 (6.8) |
Discontinued from treatment | 124 (64.6) | 149 (77.6) | 146 (75.3) | 168 (86.6) | 159 (83.2) | 173 (90.6) |
Reason for treatment discontinuation, n (%) | ||||||
Adverse event | 16 (8.3) | 20 (10.4) | 24 (12.4) | 25 (12.9) | 26 (13.6) | 25 (13.1) |
Death | 7 (3.6) | 8 (4.2) | 1 (0.5) | 1 (0.5) | 4 (2.1) | 4 (2.1) |
Lost to follow up | 1 (0.5) | 1 (0.5) | 1 (0.5) | 0 (0) | 0 (0) | 0 (0) |
Physician decision | 8 (4.2) | 9 (4.7) | 19 (9.8) | 24 (12.4) | 13 (6.8) | 17 (8.9) |
Progressive disease | 83 (43.2) | 99 (51.6) | 87 (44.8) | 100 (51.5) | 101 (52.9) | NA |
Protocol deviation | 2 (1.0) | 1 (0.5) | 1 (0.5) | 0 (0) | 0 (0) | 0 (0) |
Subject/guardian decision | 7 (3.6) | 8 (4.2) | 13 (6.7) | 5 (2.6) | 15 (7.9) | 6 (3.1) |
FAS, N | 192 (100) | 194 (100) | 191 (100) | |||
PP, N | 188 (97.9) | 184 (94.8) | 184 (96.3) | |||
Safety, N | 192 (100) | 192 (99.0) | 186 (97.4) | |||
FAS = full analysis set; NA = not available; PP = per protocol.
Note: Primary analysis (May 2016) and updated data (November 2017) are provided in this table. Data are based on the FAS population.
Source: Clinical Study Report for the COLUMBUS study.7
Exposure to Study Treatments
The median duration of exposure to study treatment was longer in the encorafenib in combination with binimetinib arm (51.2 weeks), compared to the median duration in both the encorafenib monotherapy (31.4 weeks) and vemurafenib (27.1 weeks) arms.
The median dose intensity in the encorafenib in combination with binimetinib arm was 99.6% (encorafenib) and 99.2% (binimetinib), compared with 79.6% in the encorafenib arm and 93.5% in the vemurafenib arm. The median actual dose intensity for the encorafenib in combination with binimetinib arm was encorafenib 450.00 mg/day and binimetinib 89.61 mg/day, for the encorafenib arm was 258.59 mg/day, and for the vemurafenib arm was 1,814.13 mg/day. The total duration of mean exposure was longer in the encorafenib in combination with binimetinib arm (10,429.4 patient-weeks) compared to patients in the encorafenib arm (8,144.6 patient-weeks), and vemurafenib arm (6,684.4 patient-weeks).
Efficacy
Only those efficacy outcomes and analyses of subgroups identified in the review protocol are reported below. See Appendix 3 for detailed efficacy data. Efficacy results included in this review are based on 2 data cuts, May 2016 and November 2017. Further, the sponsor provided a published peer-reviewed article with an updated data cut of November 2018.6 The clinical experts consulted during this review indicated that both vemurafenib and encorafenib monotherapies were not relevant comparators to current standard of practice in the Canadian setting. The comparison with encorafenib monotherapy was deemed to be more appropriate than the comparison with vemurafenib as vemurafenib monotherapy is administered to less than 5% of patients with metastatic melanoma.
Progression-Free Survival
Table 17 provides a summary of survival outcomes included in the study (including the 2016, 2017, and 2018 data cuts).
At the time of primary analysis (2016), the primary efficacy end point was PFS of encorafenib in combination with binimetinib versus vemurafenib monotherapy. The encorafenib in combination with binimetinib arm demonstrated a 7.6 month longer PFS (14.9 months; 95% CI, 11.0 to18.5) compared to the vemurafenib arm (7.3 months; 95% CI, 5.6 to 8.2). The encorafenib in combination with binimetinib arm did demonstrate a statistically significant difference (P < 0.001) when compared to the vemurafenib monotherapy arm. No imputations were used for start or end dates for primary PFS analysis. PFS curves for encorafenib in combination with binimetinib compared to vemurafenib are presented in Figure 13 and Figure 14 in Appendix 3.
The encorafenib in combination with binimetinib arm demonstrated no statistically significant increase in PFS (14.9 months; 95% CI, 11.0 to 18.5) compared to that in the encorafenib monotherapy arm (9.6 months; 95%; CI, 7.5 to 14.8; P = 0.0256). The encorafenib in combination with binimetinib arm demonstrated a 25% risk reduction to disease progression or death compared to encorafenib monotherapy (HR 0.75; 95% CI, 0.56 to 1.00). No imputations were used for missing dates for the primary PFS analysis. PFS curves are presented in Figure 4. The most common reasons for censoring of PFS by INV assessment in the encorafenib in combination with binimetinib and encorafenib arms were that patients remained on treatment (32.8% and 24.2% patients, respectively), and patients had started a new cancer therapy (14.1% in the vemurafenib arm).
The PFS results provided from the November 2017 data cut were similar to those from the May 2016 cut-off (Figure 5). Median PFS remained consistent at 14.9 months (95% CI, 11.0 to 20.2) compared to 9.6 months (95% CI, 7.4 to 14.8) in the encorafenib arm and 7.3 months (95% CI, 7.4 to 14.8) in the vemurafenib arm. The encorafenib in combination with binimetinib arm demonstrated a 23% risk reduction to disease progression or death compared to encorafenib monotherapy (HR 0.77; 95% CI, 0.59 to 1.00) and 49% risk reduction compared to vemurafenib (HR 0.51; 95% CI, 0.39 to 0.67).
The peer-reviewed journal article included in this review (data cut-off November 2018) demonstrated consistent PFS data as previously reported. The encorafenib in combination with binimetinib arm remained consistent at 14.9 months (95% CI, 11.0 to 20.2), compared to 9.6 months for the encorafenib arm (95% CI, 7.4 to 14.8), and 7.3 months in the vemurafenib arm (95% CI, 5.6 to 7.9).6
Figure 4: Kaplan-Meier Estimate of 2016 PFS by BIRC (Encorafenib in Combination With Binimetinib Versus Encorafenib)
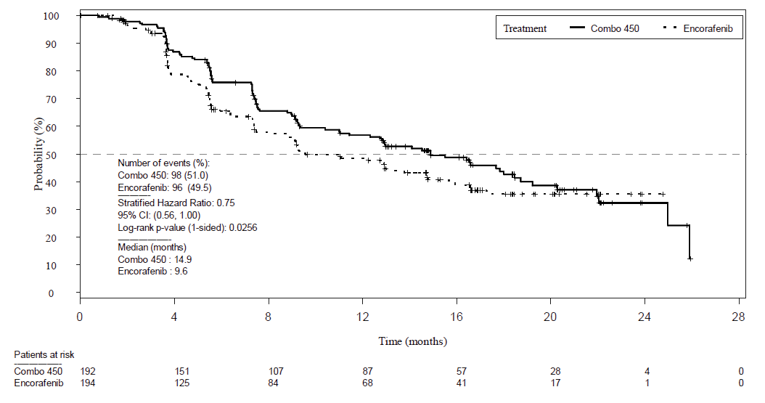
BIRC = Blinded Independent Review Committee; CI = confidence interval; Combo 450 = encorafenib 450 mg once daily plus binimetinib 45 mg twice daily; PFS = progression-free survival.
Note: Full analysis set.
Source: Clinical Study Report for the COLUMBUS study.7
Figure 5: Kaplan-Meier Estimate of 2017 PFS by BIRC (Encorafenib in Combination With Binimetinib Versus Encorafenib)
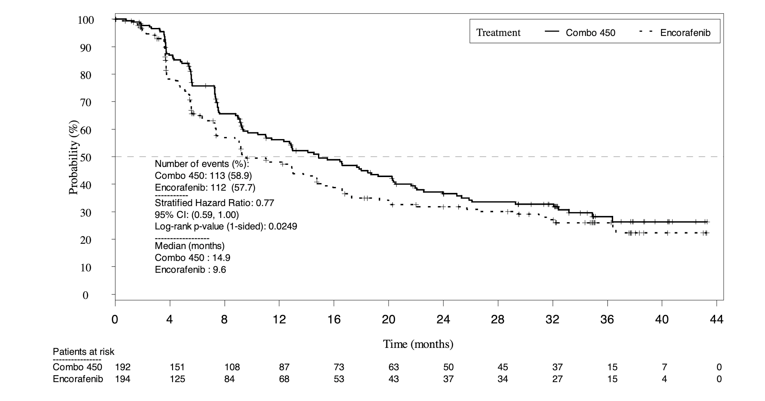
BIRC = Blinded Independent Review Committee; CI = confidence interval; Combo 450 = encorafenib 450 mg once daily plus binimetinib 45 mg twice daily; PFS = progression-free survival.
Note: Full analysis set.
Source: Clinical Study Report for the COLUMBUS study.7
Subgroup Analyses of PFS
Similar to the primary analysis (with a data cut-off year of 2016), all subgroup analyses demonstrated point estimates in favour of the encorafenib in combination with binimetinib arm compared with the encorafenib and vemurafenib monotherapy arms. Subgroup analyses as pre-specified for this review were performed on disease stage, line of therapy, and brain metastases.
When compared to vemurafenib, the stage IIIB, IIIC, IVM1a, and IVM1b subgroup demonstrated a HR of 0.97 (95% CI, 0.61 to 1.53) compared to the stage IVM1c HR of 0.68 (95% CI, 0.47 to 0.98). Patients with prior first-line immunotherapy demonstrated a larger risk reduction (HR 0.40; 95% CI, 0.10 to 1.64) compared to patients who did not receive prior first-line immunotherapy (HR 0.59; 95% CI, 0.44 to 0.78). Patients with prior adjuvant immunotherapy demonstrated a HR of 0.78 (95% CI, 0.45 to 1.35) compared to 0.51 (95% CI, 0.37 to 0.71) for patients who did not receive prior adjuvant immunotherapy.
For the comparison with the encorafenib arm, patients with prior first-line immunotherapy demonstrated a similar risk reduction (HR 0.81; 95% CI, 0.23 to 2.83) compared to patients who did not receive prior first-line immunotherapy (HR 0.81; 95% CI, 0.60 to 1.08). Patients with prior adjuvant immunotherapy also demonstrated a similar HR of 0.80 (95% CI, 0.40 to 1.40) compared to 0.82 (95% CI, 0.59 to 1.13) for patients who did not receive prior adjuvant immunotherapy. The only subgroup with a HR of less than 0.50 was patients with baseline CNS metastases (n = 9 in the encorafenib in combination with binimetinib arm and n = 8 in the encorafenib arm; HR 0.31; 95% CI, 0.09 to 1.07). Figure 6 and Figure 7 demonstrate subgroup analyses for the 2016 data cut-off. Forest plots of the estimates for the vemurafenib arm can be found in Figure 15 and Figure 16.
Figure 6: Forest Plot of PFS Subgroups by BIRC (2016) (Encorafenib in Combination With Binimetinib Versus Encorafenib)
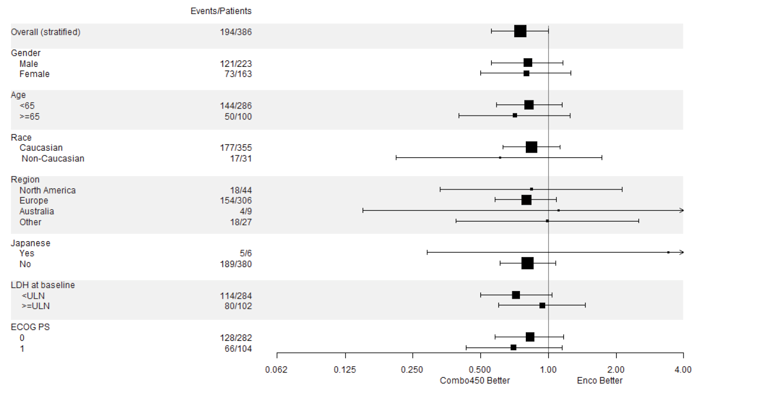
BIRC = Blinded Independent Review Committee; Combo 450 = encorafenib 450 mg once daily plus binimetinib 45 mg twice daily; ECOG PS = Eastern Cooperative Oncology Group Performance Status; Enco = encorafenib 300 mg once daily; LDH = lactate dehydrogenase; PFS = progression-free survival; ULN = upper limit of normal.
Note: Full analysis set.
Source: Clinical Study Report for the COLUMBUS study.7
Figure 7: Forest Plot of PFS Subgroups by BIRC (2016) (Encorafenib in Combination With Binimetinib Versus Encorafenib)
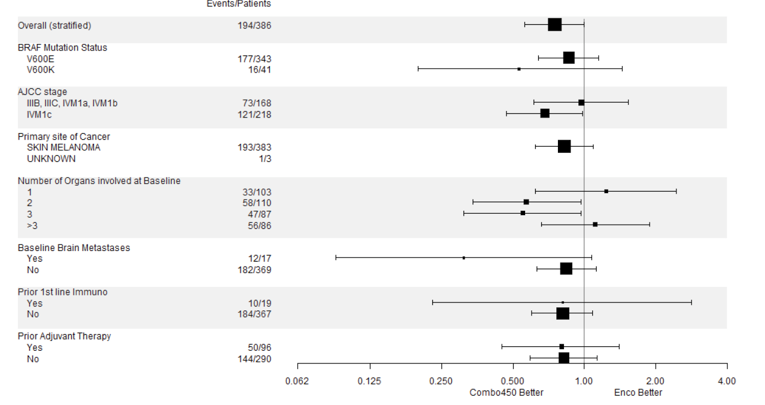
AJCC = American Joint Committee on Cancer; BIRC = Blinded Independent Review Committee; Combo 450 = encorafenib 450 mg once daily plus binimetinib 45 mg twice daily; Enco = encorafenib 300 mg once daily; PFS = progression-free survival.
Note: Full analysis set.
Source: Clinical Study Report for the COLUMBUS study.7
Overall Survival
Since the pre-specified criteria for hierarchical statistical significance was not met, formal testing of OS was not conducted for the comparison between the encorafenib and binimetinib combination therapy arm and encorafenib monotherapy arm, as per the testing hierarchy but rather was presented descriptively.
At the November 7, 2017 data cut-off, 80 patients (13.9%) were receiving treatment within the study (22.4%, encorafenib in combination with binimetinib; 12.4%, encorafenib; and 6.8% vemurafenib). The median OS was 33.6 months in the encorafenib in combination with binimetinib arm (95% CI, 24.4 to 39.2) versus 23.5 months (95% CI, 19.6 to 33.6) in the encorafenib monotherapy arm, and 16.9 months in the vemurafenib monotherapy arm (95% CI, 14.0 to 24.5). The encorafenib in combination with binimetinib arm demonstrated a 19% risk reduction compared to encorafenib monotherapy (HR 0.81; 95% CI, 0.61 to 1.06) (Figure 8) and a 39% risk reduction compared to vemurafenib monotherapy (HR 0.61; 95% CI, 0.47 to 0.79). The comparison between encorafenib in combination with binimetinib and vemurafenib monotherapy was statistically significant (P < 0.001). The estimates of OS at 12 months and 24 months were 75.5% (95% CI, 68.8 to 81.0) and 57.6% (95% CI, 50.3 to 64.3) for encorafenib in combination with binimetinib, respectively, compared to 74.6% (95% CI, 67.6 to 80.3) and 49.1% (95% CI, 41.5 to 56.2) for encorafenib, respectively.
As of November, 2018,6 the median OS for the encorafenib in combination with binimetinib arm remained consistent as previously reported (33.6 months; 95% CI, 24.4 to 39.2) compared to the encorafenib arm (23.5 months; 95% CI, 19.6 to 33.6). Compared to vemurafenib, encorafenib in combination with binimetinib remained consistent at a 39% decreased risk of death (HR 0.61; 95% C,I 0.48 to 0.79).
Figure 8: Kaplan-Meier Plot of Overall Survival (2017) (Encorafenib in Combination With Binimetinib Versus Encorafenib)
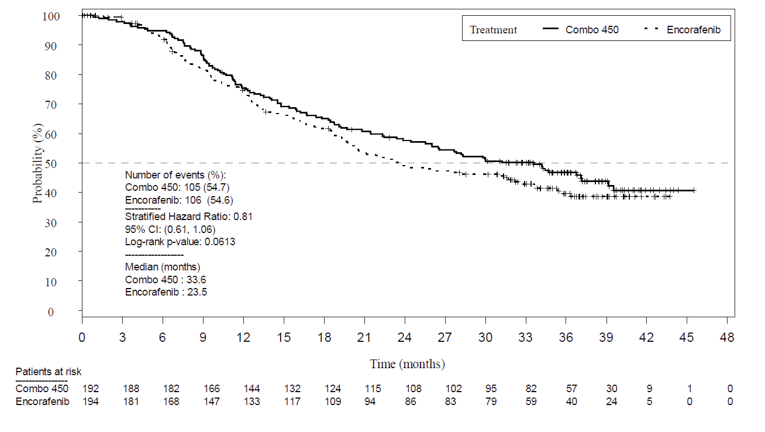
CI = confidence interval; Combo 450 = encorafenib 450 mg once daily plus binimetinib 45 mg twice daily.
Note: Full analysis set.
Note: Overall survival data only available from the November 2017 data cut.
Source: Clinical Study Report for the COLUMBUS study.7
Survival | Encorafenib and binimetinib N = 192 | Encorafenib N = 194 | Vemurafenib N = 191 |
|---|---|---|---|
PFS by BIRC (2016) | |||
Patients with events/patients included in analysis (%) | 98/192 (51.0) | 96/194 (49.5) | 106/191 (55.5) |
Median time, monthsa | 14.9 | 9.6 | 7.3 |
Hazard ratio (95% CI)b | Reference group | 0.75 (0.56 to 1.00) | 0.54 (0.41 to 0.71) |
P valuec | Reference group | 0.0256 | < 0.001 |
Percentiles (95% CI)d | |||
25th | 7.3 (5.5 to 7.5) | 5.0 (3.7 to 5.6) | 3.7 (3.6 to 4.0) |
50th | 14.9 (11.0 to 18.5) | 9.6 (7.5 to 14.8) | 7.3 (5.6 to 8.2) |
75th | 25.0 (22.0 to NE) | NE (NE to NE) | 18.5 (12.8 to NE) |
Updated PFS by BIRC (2017) | |||
Median time, monthsa | 14.9 | 9.6 | 7.3 |
Hazard ratio (95% CI)b | Reference group | 0.77 (0.59 to 1.00) | 0.51 (0.39 to 0.67) |
P valuec | Reference group | 0.0249 | < 0.0001 |
Percentiles (95% CI)d | |||
25th | 7.3 (5.5 to 7.5) | 5.0 (3.7, 5.6) | 3.7 (3.6 to 3.9) |
50th | 14.9 (11.0 to 20.2) | 9.6 (7.5, 14.8) | 7.3 (5.6 to 7.9) |
75th | NE (32.1 to NE) | 36.4 (22.0 to NE) | 16.6 (12.8 to 33.6) |
Updated PFS by BIRC (2018)6 | |||
Median time, monthsa | 14.9 (11.0 to 20.2) | 9.6 (5.6 to 14.8) | 7.3 (5.6 to 7.9) |
Hazard ratio (95% CI)b | Reference group | NA | 0.51 (0.39 to 0.67) |
P valuec | Reference group | NA | NA |
Percentiles (95% CI)d | |||
25th | NA | NA | NA |
50th | NA | NA | NA |
75th | NA | NA | NA |
OS (2017) | |||
Patients with events/patients included in analysis (%) | 105/192 (54.7) | 106/194 (54.6) | 127/191 (66.5) |
Median time, monthsa | 33.6 (24.4 to 39.2) | 23.5 (19.6 to 33.6) | 16.9 (14.0 to 24.5) |
Hazard ratio (95% CI)b | Reference group | 0.81 (0.61 to 1.06) | 0.61 (0.47 to 0.79) |
P valuec | Reference group | 0.061 | < 0.001 |
Percentiles (95% CI)d | |||
25th | 12.2 (10.1 to 15.4) | 11.8 (9.2 to 13.1) | 9.5 (8.3 to 10.4) |
50th | 33.6 (24.4 to 39.2) | 23.5 (19.6 to 33.6) | 16.9 (14.0 to 24.5) |
75th | NE (NE to NE) | NE (NE to NE) | NE (39.2 to NE) |
Updated OS by BIRC (2018)6 | |||
Median time, monthsa | 33.6 (24.4 to 39.2) | 23.5 (19.6 to 33.6) | 16.9 (14.0 to 24.5) |
Hazard ratio (95% CI)b | Reference group | NA | 0.61 (0.48 to 0.79) |
P valuec | Reference group | NA | NA |
Percentiles (95% CI)d | |||
25th | NA | NA | NA |
50th | NA | NA | NA |
75th | NA | NA | NA |
AJCC = American Joint Committee on Cancer; BIRC = Blinded Independent Review Committee; CI = confidence interval; ECOG PS = Eastern Cooperative Oncology Group Performance Status; NA = not available; NE = not estimable; OS = overall survival; PFS = progression-free survival.
Note: Full analysis set.
Note: Data are from 3 data cuts: May 2016 (PFS), November 2017 (PFS and OS), and November 2018 (PFS and OS).
aMedian (time to event) and its 95% CI are generated by Kaplan-Meier estimation with Brookmeyer and Crowley CIs.
bHazard ratios and CIs are derived from the Cox proportional hazards model using the Wald test. Log-rank test and Cox proportional hazards model are stratified by AJCC stage and ECOG PS per randomization.
cThe P value pre-specified as 0.025 (1-sided) is based on the log-rank score test.
dRepresents the estimated time (95% CI), reported in months, at which the specified percentiles occur based on the Kaplan-Meier analysis. Values were calculated using the Brookmeyer and Crowley method in PROC LIFETEST.
Source: Clinical Study Report for the COLUMBUS study7 and Ascierto et al. (2020).6
Response
Table 18 provides a summary of response outcomes of interest in this review at the 2016 and 2017 cut-off dates. These include ORR, TTR, DCR, and DOR. Figure 9 and Figure 10 provides the Kaplan-Meier plot for TTR and of DOR, respectively, for encorafenib and binimetinib versus encorafenib.
Overall, all response outcomes demonstrated estimates in favour of the encorafenib in combination with binimetinib arm. ORR was 63% (95% CI, 55.8 to 69.9) compared to 50.5% in the encorafenib arm and 40% in the vemurafenib arm. TTR by BIRC was similar across all treatment arms (2 months each). It was noted that this timing is due to the protocol design as the first tumour assessment was at cycle 3, day 1. The DCR was 92.2% compared with 84.0% in the encorafenib arm and 81.7% in the vemurafenib arm. The median DOR for confirmed responses was 16.6 months for the encorafenib in combination with binimetinib arm (95% CI, 12.2 to 20.4) and 14.9 months in the encorafenib arm (95% CI, 11.1 to NE).
Response | Encorafenib and binimetinib N = 192 | Encorafenib N = 194 | Vemurafenib N = 191 |
|---|---|---|---|
BOR by BIRC | |||
Patients with measurable disease at baseline, n (%)a | 175 (91.1) | 180 (92.8) | 183 (95.8) |
Patients with non-measurable disease only at baseline, n (%)a | 15 (7.8) | 12 (6.2) | 8 (4.2) |
Confirmed ORR: CR + PR, n (%) | 121 (63.0) | 98 (50.5) | 77 (40.3) |
95% CI | 55.8 to 69.9 | 43.3 to 57.8 | 33.3 to 47.6 |
Confirmed BOR, n (%)b,c | |||
CR | 15 (7.8) | 10 (5.2) | 11 (5.8) |
PR | 106 (55.2) | 88 (45.4) | 66 (34.6) |
Stable disease | 46 (24.0) | 53 (27.3) | 73 (38.2) |
Non-CR/non-PDd | 10 (5.2) | 12 (6.2) | 6 (3.1) |
PD | 2 (1.0) | 6 (3.1) | 13 (6.8) |
DCR: CR + PR + stable disease + non-PD/non-CR, n (%) | 177 (92.2) | 163 (84.0) | 156 (81.7) |
95% CIe | 87.4 to 95.6 | 78.1 to 88.9 | 75.4 to 86.9 |
Unknownf | 11 (5.7) | 25 (12.9) | 22 (11.5) |
Not assessedg | 2 (1.0) | 0 (0) | 0 (0) |
TTR by BIRC | |||
All Patients | |||
Patients with events/patients included in analysis (%) | 146/192 (76.0) | 120/194 (61.9) | 113/191 (59.2) |
Median TTR | 1.9 (1.9 to 1.9) _ | 2.0 (1.9 to 3.6) | 2.1 (1.9 to 3.7) |
Percentiles (95% CI)h | |||
25th | 1.8 (1.8 to 1.8) | 1.8 (1.8 to 1.9) | 1.8 (1.8 to 1.9) |
50th | 1.9 (1.9 to 1.9) | 2.0 (1.9 to 3.6) | 2.1 (1.9 to 3.7) |
75th | 7.4 (3.7 to NE) | NE (NE to NE) | NE (NE to NE) |
Duration of response by BIRC | |||
Respondersj | |||
n/N (%) | 54/121 (44.6) | 41/98 (41.8) | 39/77 (50.6) |
Percentiles (95% CI)h | |||
25th | 6.0 (5.6 to 9.5) | 7.0 (5.5 to 7.6) | 5.6 (3.8 to 6.7) |
50th | 16.6 (12.2 to 20.4) | 14.9 (11.1 to NE) | 12.3 (6.9 to 16.9) |
75th | 22.1 (20.3 to NE) | NE (NE to NE) | NE (16.6 to NE) |
BIRC = Blinded Independent Review Committee; BOR = best overall response; CI = confidence interval; CR = complete response; DCR = disease control rate; NE = not estimable; ORR = objective response rate; PD = progressive disease; PR = partial response; RECIST = Response Evaluation Criteria in Solid Tumors; TTR = time to objective response.
Note: Full analysis set.
aDoes not include the 2 patients who were not assessed by BIRC.
bBOR is based on central reviewer’s assessment using RECIST, version 1.1.
cCR and PR are confirmed by repeat assessments performed not less than 4 weeks after the criteria for response is first met.
dNon-CR/non-PD applies only to patients with non-target lesions at baseline who did not achieve a CR or have PD.
eThe 95% CI for the frequency distribution of each variable were computed using the Clopper-Pearson method.
fUnknown response; not included in BOR assessment but included in denominator for ORR and DCR. Progression has not been documented and 1 or more lesions have not been assessed or have been assessed using a different method than baseline.
gNot included in BOR assessment but included in denominator for ORR and DCR. No assessment has occurred by BIRC; not included in patients with measurable or non-measurable disease at baseline.
hPercentiles with 95% CIs are calculated from PROC LIFETEST output using the Brookmeyer and Crowley method.
jResponders are defined as patients achieving at least once CR or PR.
Source: Clinical Study Report for the COLUMBUS study.7
Figure 9: Kaplan-Meier Plot for Time to Objective Response (Encorafenib in Combination With Binimetinib Versus Encorafenib)
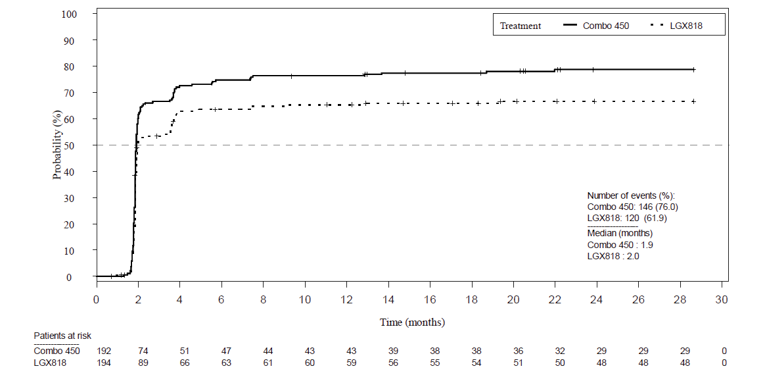
Combo 450 = encorafenib 450 mg once daily plus binimetinib 45 mg twice daily; LGX818 = encorafenib.
Note: Full analysis set.
Source: Clinical Study Report for the COLUMBUS study.7
Figure 10: Kaplan-Meier Plot of DOR (Encorafenib in Combination With Binimetinib Versus Encorafenib)
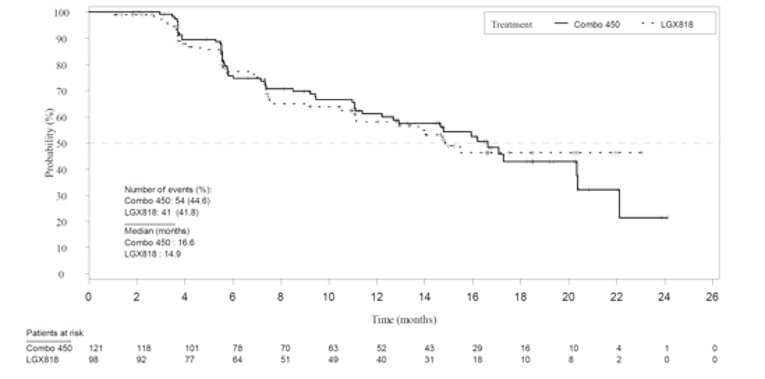
Combo 450 = encorafenib 450 mg once daily plus binimetinib 45 mg twice daily; DOR = duration of response; LGX818 = encorafenib.
Note: Full analysis set.
Source: Clinical Study Report for the COLUMBUS study.7
Quality of Life
Table 19 summarizes QoL results. Patients at risk completed the HRQoL assessments from baseline through cycle 25 day 1. Assessments were based on patients who remained in the study; therefore, compliance was high across the 3 treatment arms (85% to 90%). QoL was reported as “time to definitive 10% deterioration” and mean change from baseline score to cycle 25 day 1.
The mean FACT-M scores across baseline were similar across the 3 treatment arms (see Table 19). Scores were assessed again at cycle 25 day 1. The MID of FACT-M is between 4 points to 9 points (Appendix 4). A higher score on FACT-M denotes an improvement in QoL. The median time to definitive 10% deterioration in the FACT-M score was NE in the encorafenib in combination with binimetinib arm and was 22.1 months (95% CI, 15.2 to NE) in the vemurafenib arm with a corresponding HR for the difference of 0.46 (95% CI, 0.29 to 0.72; Figure 21) and 20.3 months (95% CI, 15.0 to NE) in the encorafenib arm with a corresponding HR for the difference of 0.48 (95% CI, 0.31 to 0.75) (Figure 20).
At baseline, the mean EORTC QLQ-C30 global health status scores were similar in each group (see Table 19). The median time to definitive 10% deterioration in the EORTC QLQ-C30 global health status score was higher in the encorafenib in combination with binimetinib arm (23.9 months) compared to the vemurafenib arm (16.6 months) and encorafenib arm (14.7 months), corresponding with a HR for the difference of 0.55 (95% CI, 0.37 to 0.80) in comparison with the vemurafenib arm, and 0.45 (95% CI, 0.31 to 0.65; Figure 22) in comparison with encorafenib arm.
For the EQ-5D-5L, baseline scores were also similar across 3 treatment arms (see Table 19). For EQ-5D-5L, the mean change from baseline in the encorafenib in combination with binimetinib arm was 0.07 compared to –0.15 in the encorafenib arm and –0.17 in the vemurafenib arm.
Neither arm met the MID for FACT-M, EORTC QLQ-C30 (10-point change), or EQ-5D-5L (4.5-point change). Due to lack of statistical testing, HRQoL outcomes were considered exploratory.
Table 19: Health-Related Quality of Life
Health-Related Quality of Life | Encorafenib and binimetinib N = 192 | Encorafenib N = 194 | Vemurafenib N = 191 |
|---|---|---|---|
FACT-M | |||
Time to definitive 10% deterioration | |||
Number of events, n (%) | 33 (17.2) | 51 (26.3) | 47 (24.6) |
Mediana, months (95% CI) | NE (22.1 to NE) | 20.3 (15.0 to NE) | 22.1 (15.2 to NE) |
Difference, hazard ratio (95% CI) | Reference group | 0.48 (0.31 to 0.75) | 0.46 (0.29 to 0.72) |
Baseline | |||
n | 165 | 157 | 159 |
Mean (SD) | 52.39 (9.053) | 52.84 (8.225) | 52.01 (8.650) |
Cycle 25, day 1 | |||
n | 18 | 9 | 10 |
Mean (SD) | 54.39 (6.409) | 54.00 (5.545) | 55.60 (5.680) |
Change from baseline | |||
n | 18 | 7 | 7 |
Mean (SD) | −1.83 (6.205) | −0.29 (6.448) | −0.14 (5.305) |
EORTC QLQ-C30 | |||
Time to definitive 10% deterioration | |||
Number of events, n (%) | 52 (27.1) | 75 (38.7) | 57 (29.8) |
Mediana, months | 23.9 | 14.7 | 16.6 |
Difference, hazard ratio (95% CI) | Reference group | 0.45 (0.31 to 0.65) | 0.55 (0.37 to 0.80) |
Baseline | |||
n | 166 | 162 | 160 |
Mean (SD) | 74.68 (21.23) | 74.50 (22.62) | 72.31 (24.69) |
Cycle 25, day 1 | |||
n | 18 | 10 | 10 |
Mean (SD) | 80.56 (15.12) | 73.33 (20.33) | 85.83 (21.17) |
Change from baseline | |||
n | 17 | 7 | 7 |
Mean (SD) | 3.92 (11.45) | −1.19 (34.16) | −1.19 (34.50) |
EQ-5D-5L | |||
Baseline | |||
n | 167 | 160 | 161 |
Mean (SD) | 0.74 (0.210) | 0.76 (0.175) | 0.73 (0.222) |
Cycle 25, Day 1 | |||
n | 17 | 10 | 9 |
Mean (SD) | 0.82 (0.134) | 0.64 (0.075) | 0.76 (0.210) |
Change from baseline | |||
n | 16 | 7 | 5 |
Mean (SD) | 0.07 (0.135) | −0.15 (0.149) | −0.17 (0.221) |
CI = confidence interval; EQ-5D-5L = EuroQol 5-Dimensions 5-Levels questionnaire; EORTC QLQ-C30 = European Organisation for Research and Treatment of Cancer Quality of Life Questionnaire Core 30; FACT-M = Functional Assessment of Cancer Therapy–Melanoma; NE = not estimable; SD = standard deviation.
Note: Full analysis set.
aDefinitive 10% deterioration is defined as at least 10% relative to baseline worsening of the corresponding scale score with no later improvement above this threshold observed while on treatment, or death due to any cause.
Source: Clinical Study Report for the COLUMBUS study.7
Harms
Only those harms identified in the review protocol are reported below. See Table 20 for detailed harms data.
Adverse Events
Almost all patients in the COLUMBUS trial experienced at least 1 AE (> 98%). The most common reported AEs in the encorafenib in combination with binimetinib arm (all grades) were nausea (41.1%), diarrhea (36.5), fatigue (28.6%), and arthralgia (25.5%). Nausea and diarrhea occurred more frequently in the encorafenib in combination with binimetinib arm (41.1% and 36.5%, respectively) compared to encorafenib monotherapy (38.5% and 13.5%, respectively) and vemurafenib arm (33.9% and 33.9%, respectively). However, these events of nausea, diarrhea, and fatigue, at less than grade 3 or 4, ranged from 1.6% to 4.2% across the 3 treatment arms. Further, almost all patients experienced a skin and subcutaneous tissue disorder (encorafenib 95.8%; vemurafenib 91.4%), however, this number was lower in the encorafenib in combination with binimetinib arm (65.1%).
Serious Adverse Events
In the COLUMBUS trial, there was a total of 200 (35%) patients who experienced at least 1 SAE. The incidence of grade 3 or 4 SAEs was lower in the encorafenib in combination with binimetinib arm (57.8%) compared to 66.1% of patients in the encorafenib arm and 63.4% in the vemurafenib arm. The most common grade 3 or 4 event was pyrexia, which occurred more frequently in the encorafenib in combination of binimetinib arm (3.1%) versus the encorafenib (1%) and 0 in the vemurafenib monotherapy arm.
There were no other differences in frequencies of events across treatment arms.
Withdrawals Due to Adverse Events
Overall, 12.5% of encorafenib in combination with binimetinib patients, 14.1% of encorafenib patients, and 16.7% of vemurafenib patients withdrew from treatment due to AEs. The most common cited reason in the encorafenib in combination with binimetinib arm was increased alanine aminotransferase and aspartate aminotransferase (2.6%) and in the encorafenib arm was palmar-plantar erythrodysesthesia syndrome (2.6%).
Mortality
In the COLUMBUS trial, 50 deaths occurred during treatment or within 30 days of the last dose. Deaths were comparable across treatment arms. The encorafenib in combination with binimetinib arm had a total of 17 deaths (8.9%) compared to 14 (7.3%) in the encorafenib arm and 19 (10.2%) in the vemurafenib arm. The majority of deaths (80%) were attributable to disease progression. Of the 10 that were not related to disease progression, 6 (3.1%) occurred in the encorafenib in combination with binimetinib arm, while 2 each occurred in the encorafenib (1.0%) vemurafenib (1.2%) arms. Of the 6 deaths in the encorafenib and binimetinib arm, 2 were caused by unknown reasons, 1 caused by multiple organ dysfunction syndrome, 1 by cerebral hemorrhage, 1 by suicide, and 1 by euthanasia. In these cases, there was no clear relationship between the study treatment.
Notable Harms
The frequency of notable harms was similar across treatment arms, with the exception of a higher proportion of patients who experienced eye disorders in the encorafenib in combination with binimetinib arm (54.2%) versus the encorafenib (27.6%) and vemurafenib (33.3%) monotherapy arms. A similar proportion of patients experienced a cardiac disorder in the encorafenib in combination with binimetinib arm (13.0%) compared to the encorafenib arm (14.1%) and vemurafenib arm (15.1%). The same proportion of patients in the encorafenib with binimetinib arm experienced dry skin (14.1%), hyperkeratosis (14.1%), and rash (14.1%). These proportions were lower than those experienced in the encorafenib and vemurafenib arms (> 20%).
Harms | Encorafenib and binimetinib N = 192 | Encorafenib N = 194 | Vemurafenib N = 191 | |||
|---|---|---|---|---|---|---|
All grades | Grade 3 and 4 | All grades | Grade 3 and 4 | All grades | Grade 3 and 4 | |
Patients with ≥ 1 adverse event | ||||||
n (%) | 189 (98.4) | 111 (57.8) | 191 (99.5) | 127 (66.1) | 185 (99.5) | 118 (63.4) |
Most common eventsa, n (%) | ||||||
Nausea | 79 (41.1) | 3 (1.6) | 74 (38.5) | 8 (4.2) | 63 (33.9) | 3 (1.6) |
Diarrhea | 70 (36.5) | 5 (2.6) | 26 (13.5) | 3 (1.6) | 63 (33.9) | 4 (2.2) |
Fatigue | 55 (28.6) | 4 (2.1) | 48 (25.0) | 1 (0.5) | 57 (30.6) | 4 (2.2) |
Arthralgia | 49 (25.5) | 1 (0.5) | 84 (43.8) | 18 (9.4) | 83 (44.6) | 11 (5.9) |
Dry skin | 27 (14.1) | 0 (0) | 58 (30.2) | 0 (0) | 42 (22.6) | 0 (0) |
Hyperkeratosis | 27 (14.1) | 1 (0.5) | 72 (37.5) | 7 (3.6) | 54 (29.0) | 0 (0) |
Alopecia | 26 (13.5) | 0 (0) | 107 (55.7) | 0 (0) | 68 (36.6) | 0 (0) |
PPE syndrome | 13 (6.8) | 0 (0) | 98 (51.0) | 26 (13.5) | 26 (14.0) | 2 (1.1) |
Patients with ≥ 1 SAE (all grades) | ||||||
n (%) | 66 (34.4) | 57 (29.7) | 65 (33.9) | 54 (28.1) | 69 (37.1) | 60 (32.3) |
Most common eventsb, n (%) | ||||||
Pyrexia | 6 (3.1) | 5 (2.6) | 3 (1.6) | 2 (1.0) | 2 (1.1) | 0 (0) |
General physical health | 3 (1.6) | 2 (1.0) | 2 (1.0) | 2 (1.0) | 6 (3.2) | 6 (3.2) |
Vomiting | 3 (1.6) | 2 (1.0) | 6 (3.1) | 6 (3.1) | 2 (1.1) | 1 (0.5) |
Nausea | 2 (1.0) | 1 (0.5) | 6 (3.1) | 4 (2.1) | 0 (0) | 0 (0) |
Patients who stopped treatment due to adverse events | ||||||
n (%) | 24 (12.5) | 22 (11.5) | 27 (14.1) | 21 (10.9) | 31 (16.7) | 18 (9.7) |
Most common eventsc, n (%) | ||||||
ALT increased | 5 (2.6) | 4 (2.1) | 0 (0) | 0 (0) | 2 (1.1) | 2 (1.1) |
AST increased | 5 (2.6) | 2 (1.0) | 0 (0) | 0 (0) | 2 (1.1) | 2 (1.1) |
PPE syndrome | 0 (0) | 0 (0) | 5 (2.6) | 3 (1.6) | 0 (0) | 0 (0) |
Deaths | ||||||
n (%) | 17 (8.9) | NA | 14 (7.3) | NA | 19 (10.2) | NA |
Malignant melanoma, n (%) | 10 (5.2) | NA | 12 (6.3) | NA | 17 (9.1) | NA |
Notable harms | ||||||
Eye disorders, n (%) | 104 (54.2) | 5 (2.6) | 53 (27.6) | 1 (0.5) | 62 (33.3) | 1 (0.5) |
Cardiac disorders | 25 (13.0) | 2 (1.0) | 27 (14.1) | 4 (2.1) | 28 (15.1) | 5 (2.7) |
Cardiomyopathy, n (%) | NR | NR | NR | NR | NR | NR |
Second malignancy, n (%) | NR | NR | NR | NR | NR | NR |
Skin and subcutaneous tissue disordersa, n (%) | 125 (65.1) | 6 (3.1) | 184 (95.8) | 43 (22.4) | 170 (91.4) | 38 (20.4) |
Dry skin | 27 (14.1) | 0 (0) | 58 (30.2) | 0 (0) | 42 (22.6) | 0 (0) |
Hyperkeratosis | 27 (14.1) | 1 (0.5) | 72 (37.5) | 7 (3.6) | 54 (29.0) | 0 (0) |
Rash | 27 (14.1) | 2 (1.0) | 41 (21.4) | 4 (2.1) | 54 (29.0) | 6 (3.2) |
Keratosis pilaris | 9 (4.7) | 0 (0) | 33 (17.2) | 0 (0) | 43 (23.1) | 0 (0) |
Photosensitivity reaction | 8 (4.2) | 1 (0.5) | 7 (3.6) | 0 (0) | 45 (24.2) | 2 (1.1) |
PPE syndrome | 0 (0) | 0 (0) | 5 (2.6) | 3 (1.6) | 0 (0) | 0 (0) |
Pyrexia, n (%) | 35 (18.2) | 7 (3.6) | 29 (15.1) | 2 (1.0) | 52 (28.0) | 0 (0) |
ALT = alanine aminotransferase; AST = aspartate aminotransferase; NA = not applicable; NR = not reported; PPE = palmar-plantar erythrodysesthesia; SAE = serious adverse event.
Note: Safety set.
Note: Median duration of exposure for encorafenib in combination with binimetinib was 52.21 weeks, encorafenib was 31.36 weeks, and vemurafenib was 27.14 weeks.
aFrequency of greater than 30% in any treatment arm.
bFrequency of greater than 3% in any treatment arm.
cFrequency of greater than 2% in any treatment arm.
Source: Clinical Study Report for the COLUMBUS study.7
Critical Appraisal
Internal Validity
Baseline characteristics were balanced across treatment arms despite the study having an open-label design where INVs, patients, and certain study personnel were unblinded to study treatment assignments for practical reasons. The open-label design may have introduced bias in the assessment of subjective outcomes, such as PFS, AEs, and HRQoLs. Of note, the assessment of PFS was performed by a BIRC. Therefore, the impact of open-label design on the primary outcome of PFS was almost unlikely, except for the individual INV assessment of PFS in practice. It remains unknown, however, what impact an open-label design would have had on the assessment of AEs and the severity of the events, particularly in regard to the gastrointestinal events (e.g., nausea, diarrhea, vomiting, and fatigue) and skin disorders. These are the events that showed considerable differences between treatment arms. Moreover, patient-reported QoL and satisfaction were important according to the patient input for this review. The potential bias due to the study design and the relatively small differences in those HRQoL measures (e.g., 10% deterioration in FACT-M and EORTC QLQ-C30) between treatment arms rendered it difficult to draw a conclusion on the differences in treatment effect. Further, the included study used 3 scales to measure HRQoL (FACT-M, EORTC QLQ-C30, and EQ-5D-5L). Compliance was high across all 3 treatment arms. However, only patients who were deemed “at risk” were required to fill in the questionnaire; therefore, compliance does not reflect the entire study population but rather those who remained in the study. This can potentially add selection bias and may affect the interpretation of the findings. Further, there was no statistical inference of the findings and these outcomes are deemed exploratory.
One of the most significant limitations of the COLUMBUS trial is a lack of comparison to current standard of care. The included study compared a combination of encorafenib with binimetinib to encorafenib and vemurafenib monotherapies but not to other BRAFi/MEKi combination therapies. It should be noted that at the time the COLUMBUS trial was completed, single-agent BRAFis were the standard of care; therefore, the choice of comparators was appropriate at that time. Other BRAFi/MEKi combination therapies identified were dabrafenib in combination with trametinib and vemurafenib in combination with cobimetinib. Instead, an indirect comparison among the 3 combinations was performed. Such a trial design largely limited our understanding whether encorafenib in combination with binimetinib would have provided a comparative advantage in terms of either additional benefits or a more favourable safety profile, in comparison to dabrafenib in combination with trametinib. According to the clinical experts consulted, in current practice, targeted therapies are seldom prescribed as monotherapies, except in rare cases to manage significant toxicities. Further, vemurafenib is rarely prescribed (approximately 5% of the time according to the clinical experts). This trial design and the results may only be helpful in providing a common comparator for an indirect comparison with other BRAFi/MEKi combination therapies. However, as demonstrated in the following ITC, the comparative efficacy and safety largely remained inconclusive.
Although subgroup analyses seemed to favour the combination of encorafenib with binimetinib, the groups were small and potentially underpowered to detect differences (e.g., disease stage or line of therapy) in PFS. The dose intensity was higher for the encorafenib in combination with binimetinib arm (100%) despite the higher dose of encorafenib in the combination arm (450 mg, versus 300 mg as monotherapy). Of patients in the encorafenib arm, 48.4% received less than 80% dose intensity, with 21.9% receiving less than 50%, and 70% of patients required a dose modification during the study period. The incidence of patients with at least 1 protocol deviation was similar among the 3 treatment arms. Most protocol deviations were due to key procedures (62.0% in the encorafenib in combination with binimetinib arm, 66.0% in the encorafenib arm, and 64.4% in the vemurafenib arm).
No data imputations were used for the primary PFS analysis. To estimate the HR of PFS, a Cox regression model was used. The validity of the proportional hazard assumption was assessed using a log-cumulative hazard plot. No significant violation of proportional hazard assumption was detected. The number of patients censored in the primary and secondary PFS analyses were reported across treatment arms, with 29.7% in the encorafenib in combination with binimetinib arm versus 24.2% in the encorafenib monotherapy arm. There were no discrepancies between treatment arms for the timing of tumour assessments per BIRC. OS was a key secondary end point included in the pre-specified testing hierarchy, which indicated that OS was tested if PFS was statistically significant at a 1-sided level of 0.025. At the cut-off date of November 2017, when testing of PFS in a stratified HR crossed the pre-specified significance level (HR = 0.77; 95% CI, 0.59 to 1.0; 1-sided log-rank P = 0.0246), OS in the 2017 and 2018 cut-off dates remained statistically non-significant (HR = 0.81; 95% CI, 0.61 to 1.06; log-rank P = 0.0614).
External Validity
Overall, the study population in the COLUMBUS trial was reflective of the unresectable metastatic melanoma patient population in Canada. The inclusion and exclusion criteria were reasonable for a more favourable benefit and risk ratio and safety profile. It should be noted, however, that the trial excluded patients with CNS metastases and an ECOG PS greater than 1. These patients would be considered to receive encorafenib in combination with binimetinib as treatment in clinical practice. However, a higher ECOG PS (> 1) usually indicates more severe disease and is more likely with an unfavourable prognosis. Therefore, the efficacy and safety profile that was observed in a patient population with an ECOG PS of 0 to 1 in this trial may not be readily generalizable to those patients with an ECOG PS of greater than 1 in clinical practice.
It was noted that there were a higher percentage of males (60%) in the trial, which is also representative as men are more likely to be diagnosed with melanoma than women. There was also a high percentage of Caucasians (94.3%) in the trial. The clinical experts consulted in this review indicated that this is generally representative of Canadian practice (Caucasians are at greater risk to develop melanoma. Also it was noted that the proportion of patients enrolled in the trial who received prior antineoplastic therapy might be underestimated compared to what might be found in clinical practice. According to the clinical experts, more patients would likely be exposed to prior immunotherapy, especially PD1 and PDL1 therapies. The clinical experts estimated that approximately 75% of patients would be exposed to PD1 therapies (either nivolumab, pembrolizumab, or nivolumab in combination with ipilimumab). For this reason, the patient enrolment of ECOG PS 0 or 1 is not reflective of clinical practice because the majority of patients in the real world will use first-line immunotherapy before targeted therapies such as encorafenib in combination with binimetinib.
The encorafenib monotherapy and vemurafenib monotherapy are not clinically relevant comparators. More clinically relevant comparators are dabrafenib in combination with trametinib. Further, double-agent BRAFis are more common in clinical practice while single-agent BRAFis would only be used in cases where there is severe toxicity; therefore, the comparative efficacy with encorafenib and vemurafenib monotherapies as observed in this trial is not generalizable to what would be observed when compared to current standard of care in clinical practice.
Lastly it should be noted that the COLUMBUS trial included patients only with V600E or V600K mutations, however, the Health Canada indication (and reimbursement request) includes all V600 mutations. BRAF mutations are present in approximately 50% of melanomas. Of these, approximately 90% occur at amino acid 600, of which the majority are BRAF V600E mutations. Others include V600K, V600 D, and V600M. In the COLUMBUS trial, 86.6% of patients were positive for the BRAF V600E mutation, while the remainder were positive for the V600K mutation.
Indirect Evidence
Objectives and Methods for the Summary of Indirect Evidence
The protocol for the Braftovi and Mektovi CADTH pCODR review identified other BRAFi/MEKi combination treatments and immune-oncology agent as the key comparators for encorafenib in combination with binimetinib for the treatment of unresectable or metastatic melanoma in patients with BRAF V600 mutations. The other BRAFi/MEKi combination treatments identified were dabrafenib in combination with trametinib and vemurafenib in combination with cobimetinib. The key IOs identified as comparators were pembrolizumab, nivolumab, and the combination of nivolumab and ipilimumab. Information on comparative efficacy and safety between encorafenib in combination with binimetinib and these comparator treatments is lacking since no head-to-head trials are available. The objective of this section is to summarize and critically appraise the unpublished ITC submitted by the sponsor, as well as to summarize and critically appraise other published ITCs, evaluating the relative efficacy and harms of encorafenib in combination with binimetinib compared to other treatments for unresectable or metastatic BRAF V600 mutation-positive melanoma.
A focused literature search for NMAs dealing with melanoma was run-in MEDLINE All (1946–) on January 20, 2021. No limits were applied.
Description of Indirect Comparisons
Summaries and critical appraisals of 4 ITC reports included in this section are: an unpublished Bayesian NMA submitted by the sponsor focused only on the BRAFi/MEKi combination therapy trials and reporting only overall OS and PFS outcomes;8 an adjusted ITC (Bucher method) reported by Consoli et al., focused only on the BRAFi/MEKi combination therapy trials but reporting ORR and grade 3 to 4 toxicities as well as OS and PFS as outcomes;9 a Bayesian NMA reported by Wu et al., which compared dabrafenib in combination with trametinib to other BRAFi/MEKi combinations (including encorafenib in combination with binimetinib), monotherapy with BRAFi, IOs, and chemotherapy agents;10 and a Bayesian NMA reported by Franken et al., which compared a pooled chemotherapy group to various IOs, targeted agents, and other chemotherapy treatments.11 Encorafenib in combination with binimetinib was not included in the main NMA analysis of the Franken et al. report, but was included in an extended NMA conducted as a sensitivity analysis.
Methods of Sponsor-Submitted ITC
Objectives
In the absence of head-to-head trials, the sponsor conducted an ITC to investigate the efficacy of encorafenib in combination with binimetinib compared to other approved targeted therapies for the treatment of BRAF mutation-positive advanced or metastatic melanoma.8 Given the emergence of IO treatments in this indication, the feasibility of conducting an exploratory analysis including various IOs was also undertaken. The results of the analyses were planned to support the Braftovi and Mektovi submission to the CADTH pCODR, and to provide inputs for the economic model.
Study Selection Methods
An systematic literature review was conducted to identify relevant studies for inclusion in the ITC. The authors stated that the aim of the systematic literature review was to identify RCTs evaluating treatment of patients with BRAF mutation-positive advanced or metastatic (stage III or IV) melanoma who had not received systematic therapy for advanced or metastatic disease previously. Interventions of interest were approved targeted therapies (of particular interest were BRAF-targeted therapies), IOs, and chemotherapies (including platinum derivatives). Studies of interest were required to report HRs or Kaplan-Meier curves for OS or PFS, either assessed by an INV or evaluated by an IRC.
A table presenting the study selection criteria was provided in an appendix to the sponsor’s report. There were some inconsistencies between the stated aims of the systematic literature review and the provided table of study selection criteria. For example, the table of study selection criteria did not include the requirements for BRAF-positive mutation status or treatment-naive status in the metastatic setting, both indicated as criteria for the systematic literature review in the text of the sponsor’s report. In addition, the study selection criteria table included a wide range of efficacy and harms outcomes, whereas OS and PFS were specified as the key outcomes for the search in the text. Similarly, in contrast to focusing on RCTs, the table of selection criteria identified both RCTs and observational studies as eligible study designs for inclusion.
Literature searches involving both database and grey literature sources were conducted in April 2017 and updated in April 2018. Database search sources included MEDLINE, Embase, and the Cochrane Library. Grey literature search sources included websites of health technology authorities in Europe and Australia, reference lists of included papers, and non-systematic searches of abstracts presented at conferences held between 2015 and 2017 by key organizations (American Society for Clinical Oncology, European Society for Medical Oncology, and the Society for Melanoma Research). In addition, ancillary searches for relevant publications related to the previously identified trials were conducted in April 2020 via www.clinicaltrials.gov, and previous submissions to the National Institute for Health and Care Excellence (NICE) and CADTH pCODR were reviewed to identify any additional data of interest.
The authors of the report stated that the systematic literature review was conducted in accordance with guidelines published by the Cochrane Collaboration and by the Centre for Reviews and Dissemination of the University of York (referenced by NICE). However, details regarding the study selection process, such as the number of researchers involved or the process for resolving disagreements were not reported. Similarly, the process and number of researchers involved in data extraction were not fully described. It was reported that relevant data from marked studies were extracted into a data extraction template, based on the latest data cut from each trial. However, the number of researchers involved, and the data extraction processes used (such as duplicate data extraction versus single data extraction with check or resolution of discrepancies) were not described. Methods used to assess study quality were not described.
Initial Systematic Literature Review Results and Feasibility Assessments
Overall,14 unique trials were identified in the systematic literature review and originally considered for the ITC. Of the 14 trials, 5 evaluated BRAFi/MEKi combinations, 3 evaluated BRAFi monotherapies, and 6 evaluated IOs. Total number of patients was not reported.
The feasibility of performing an ITC with the identified trials was examined by determining if there was a connected network comparing the treatments and outcomes of interest and if there were differences in study, patient, or outcome characteristics across comparisons that were likely modifiers of the relative treatment effects. Potential issues related to comparability were identified a priori based on concerns previously raised in published submissions to NICE and pCODR/CADTH, and in previously conducted NMAs and meta-analyses. These included BRAF mutation status, prior and subsequent therapies, LDH level, crossover to experimental arm, lack of blinding (particularly for PFS outcomes), and follow-up times across trials. Table 21 below summarizes information on these issues for the set of 14 initially selected studies based on the sponsor’s report.
Table 21: Potential Comparability Issues and Relation to Initially Selected Studies
Potential comparability issue | Relation to initially selected studies |
|---|---|
BRAF mutation status: Differences in patient populations with regard to BRAF mutation status were a major concern raised in both HTAs and published NMAs. | While all included targeted therapy trials only enrolled BRAF mutation-positive patients, 5 of the 6 IO trials included patients irrespective of BRAF mutation status. The CheckMate 066 trial, which crucially connects the other IO trials with the network of targeted therapy trials, included only BRAF mutation-negative patients. |
Prior and subsequent therapies: The prior and subsequent therapies received by patients in the targeted therapy trials were not deemed to be reflective of clinical practice. | Most of the trials included in the published SLRs or NMAs were in treatment-naive patients, with only the COLUMBUS trial including a small proportion of patients who had received first-line IO therapy for metastatic disease. These differences may have been due to changes in the treatment landscape over time. The differences in the proportion of subsequent IO treatments received in the trials could impact OS results. |
LDH level | Differences in the proportion of patients with LDH > upper limit of normal across trials were not considered to impact the efficacy results, based on findings from subgroup analyses in previous NMAs. |
Crossover to experimental treatment following disease progression | Crossover to experimental treatment following disease progression was allowed in 3 of the 6 targeted therapy trials and 5 of the 6 IO trials. While none of the published NMAs considered adjusted OS results, the NICE HTA for encorafenib in combination with binimetinib found the adjusted results to be similar to those of the unadjusted base case. |
Lack of blinding: Lack of blinding in many of the included trials was a concern, particularly for PFS. | Separate analyses for INV-assessed PFS and IRC-assessed PFS should be conducted, if data permitting. |
Follow-up times across trials | There was considerable heterogeneity in the follow-up time across trials, suggesting that OS results should be interpreted with caution. |
HTA = health technology assessment; INV = investigator; IO = immuno-oncology agent; IRC = independent review committee; LDH = lactate dehydrogenase; NICE = National Institute for Health and Care Excellence; NMA = network meta-analysis; OS = overall survival; PFS = progression-free survival; SLR = systematic literature review.
Source: Information from sponsor-submitted indirect treatment comparison8; tabulation by reviewer.
Results of the feasibility assessment determined that the 8 trials assessing targeted therapies (both in combination and as monotherapy) were sufficiently comparable regarding study design, population size, and study site geography for inclusion in the ITC. The reported results of the comparability assessment for the 8 targeted therapy trials are shown in Table 22. Although follow-up times were indicated a priori as a potential comparability issue, an assessment of follow-up times between the trials was not reported for the feasibility assessment of the targeted trials.
Table 22: Assessment of Comparability of Targeted Trials
Study characteristic | Comparison of studies assessing targeted therapy N = 8 |
|---|---|
Study design | All trials but 1 were large (including 250 to 704 patients), multi-centre, multi-country RCTs; the one exception was the BRF113220 Part C trial, which included 162 patients and was conducted in the US only. Six of the 8 trials were open label (COLUMBUS, COMBI-v, BRF113220 Part C, BREAK-3, BRIM-3, and METRIC), and 2 had a double-blind design (coBRIM and COMBI-d). Six trials allowed crossover to the experimental arm upon disease progression (COLUMBUS, COMBI-v, BRF113220 Part C, BREAK-3, BRIM-3, and METRIC) and as a result a sensitivity analysis with crossover-adjusted OS results was conducted. |
Prior therapy | In the COLUMBUS, METRIC, and BRF113220 Part C trials, patients could have received prior systemic therapy for advanced or metastatic disease; however, the remaining 5 trials enrolled only treatment-naive patients.
|
Comparators | Common comparators were similar for all trials regarding route of administration, frequency, dosing, and treatment stopping rules, with the exception of the METRIC trial, where the comparator arm included the investigator’s choice of dacarbazine (63% of patients in this treatment arm) or paclitaxel (37%). Clinical experts involved with the validation of assumptions for the pCODR #10070 submission for cobimetinib + vemurafenib stated that the chemotherapy arm in the METRIC trial would have comparable efficacy to the dacarbazine monotherapy arms in the BRIM-3 and BREAK-3 trials. Median treatment duration was considerably longer in the COMBI-d trial. |
Patient characteristics | All 8 trials enrolled patients with BRAF V600 mutation-positive status only. There were no considerable differences with regard to age (50 to 58 years), sex (49% to 63% male), disease stage (91% to 100% metastatic disease), and ECOG PS (63% to 76% PS = 0; 24% to 35% PS = 1). While trials differed considerably in the proportion of patients with LDH > ULN (24% to 58%), these differences were not expected to impact the relative treatment effects estimated in the NMA. |
Study quality | Overall, the risk of bias was reported to be low across studies, although it was noted that the open-label study design of 6 of the targeted therapy trials could result in biased estimates of subjective outcomes, such as PFS. |
ECOG PS = Eastern Cooperative Oncology Group Performance Status; IO = immuno-oncology agent; LDH = lactate dehydrogenase; MEKi = MEK inhibitor; NMA = network meta-analysis; OS = overall survival; pCODR = pan-Canadian Oncology Drug Review; PFS = progression-free survival; RCT = randomized controlled trial; ULN = upper limit of normal.
Source: Information from sponsor-submitted ITC8; tabulation and categorization by reviewer.
The feasibility assessment for the IO therapy studies determined that the 6 IO trials differed considerably in terms of their inclusion criteria and patient baseline characteristics compared to the trials evaluating targeted therapies. In particular, the CheckMate 066 trial, which was the sole trial connecting the network of IO trials with the network of targeted therapy trials, included only BRAF mutation-negative patients, whereas the targeted therapy trials enrolled only BRAF mutation-positive patients. As noted in Table 21 above, the other 5 IO trials included patients irrespective of BRAF mutation status. The authors also noted that the CA184-024 trial had an ipilimumab maintenance treatment option in both arms, while the other IO trials did not. No further study, patient, or intervention characteristics for the IO therapy trials were reported.
Approach to ITC After Feasibility Analysis
Due to the considerable differences in patient characteristics (particularly with regards to BRAF mutation status) between the targeted therapy and IO trials, an analysis comparing targeted therapies and IO therapies was not considered feasible. Thus, the targeted therapies were determined to be the focus of the ITC. A further decision was made to exclude BRAFi monotherapy trials since BRAF monotherapy is no longer used or recommended in clinical practice and is not considered to be a comparator for encorafenib in combination with binimetinib. This left 3 trials of BRAFi/MEKi combination therapy for inclusion in the ITC: the COLUMBUS (encorafenib in combination with binimetinib), COMBI-v (dabrafenib in combination with trametinib), and coBRIM (vemurafenib in combination with cobimetinib) trials. Each combination treatment was compared to vemurafenib monotherapy in the available trials. Thus, vemurafenib monotherapy was the common comparator arm in the network to allow for indirect comparison of the 3 combination therapies. It was also noted that any extension of the network beyond the relevant set of comparators (i.e., inclusion of other BRAFi monotherapy trials) was not warranted. The COMBI-d and BRF113220 Part C trials, which evaluated dabrafenib in combination with trametinib versus dabrafenib monotherapy were also not included in the network as they did not contribute to direct or indirect evidence. In addition, encorafenib monotherapy (included as a third arm in the COLUMBUS trial) was excluded because it is not approved for treatment of advanced or metastatic melanoma (only licensed treatments were considered for inclusion in the NMA). No rationale was provided for the inclusion of OS and PFS outcomes or for the exclusion of other efficacy and harms outcomes. However, it was determined that separate analyses would be performed for PFS assessed by an INV and PFS assessed by IRC so that any potential bias from unblinded INV assessment of PFS could be assessed.
ITC Analysis Methods
The sponsor-submitted ITC was a Bayesian NMA. No justification for the choice of ITC model was provided. The authors indicated that the methods followed guidance from NICE and pCODR. In particular, they noted that techniques for integrating HRs into NMAs from these references were followed. However, the specific techniques used were not described. Fixed-effects Bayesian NMAs were conducted for the outcomes of interest (OS, INV-assessed PFS, and IRC-assessed PFS). The fixed-effects model assumed that all included studies shared a common effect size, and that observed effects were distributed around this common effect size with a variance that depended primarily on each study’s sample size. Random-effects models were deemed inappropriate, given the limited data available from which to estimate random-effects variance. It was further noted that a random-effects model would require use of a prior distribution that would pre-determine the estimate of the random-effects variance. Therefore, estimation of random-effects variance would be highly sensitive to the choice of prior. No information was provided on the use of priors in the fixed-effects Bayesian NMA.
All analyses included a 100,000 run-in phase and a 100,000-iteration phase for parameter estimation. All calculations were performed using OpenBugs 3.2.3. The authors reported that convergence was checked through inspection of the ratios of Monte Carlo error to the SDs of the posteriors and that values greater than 5% are strong signs of convergence issues. A sensitivity analysis for the OS outcome was planned to adjust for crossover to the experimental treatment at disease progression. No subgroup or meta-regression analyses were planned.
Table 23: Analysis Methods for Sponsor-Submitted ITC
Analysis Method | ITC |
|---|---|
ITC methods | Bayesian fixed-effects NMA. |
Priors | Not reported. |
Assessment of model fit | Not reported. |
Assessment of consistency | Not reported. |
Assessment of convergence | Convergence was checked through inspection of the ratios of Monte Carlo error to the standard deviations of the posteriors; values > 5% are strong signs of convergence issues. No results were reported. |
Outcomes | OS, INV-assessed PFS, and IRC-assessed PFS. OS and IRC-assessed PFS results from the NMA were reported in the pharmacoeconomic analysis. |
Follow-up time points | OS = 48.8, 16.8 to 22.2, and 23 months for the COLUMBUS, coBRIM, and COMBI-v trials, respectively. INV-assessed PFS = 14.4 to 16.7, 14.2, and 23 months, respectively, for the 3 trials. IRC-assessed PFS = 48.8 and 7.3 months for the COLUMBUS and coBRIM trials, respectively; COMBI-v did not include PFS by IRC. |
Construction of nodes | Not reported. |
Sensitivity analyses | OS adjusted for crossover to experimental arm at progression. |
Subgroup analysis | None. |
Methods for pairwise meta-analysis | Not reported. |
CI = confidence interval; INV = investigator; IRC = independent review committee; ITC = indirect treatment comparison; NMA = network meta-analysis; OS = overall survival; PFS = progression-free survival.
Source: Data from sponsor-submitted ITC8; tabulation by reviewer.
Results of Sponsor-Submitted ITC
Summary of Included Studies
After the feasibility assessment, 3 trials were included in the sponsor-submitted NMA: the COLUMBUS (for encorafenib in combination with binimetinib), COMBI-v (for dabrafenib in combination with trametinib), and coBRIM (for vemurafenib in combination with cobimetinib) trials (Figure 11). All 3 trials were phase III, randomized, multi-centre trials comparing the BRAFi/MEKi to vemurafenib monotherapy. The COLUMBUS trial also included an encorafenib monotherapy arm which was not included in the NMA because it is not a licensed treatment for advanced or metastatic melanoma. The COLUMBUS and COMBI-v trials were open-label trials, whereas the coBRIM trial was a double-blind RCT. All 3 trials included OS and PFS assessments. PFS assessment was done by both INV and IRC in the COLUMBUS and coBRIM trials. However, PFS was assessed only by INV in COMBI-v. Based on the sponsor-provided information in Table 23, it appears that the COLUMBUS and COMBI-v trials, but not the coBRiM trial, allowed crossover to the experimental arm at disease progression. No dosing information was reported for any of the trials.
As part of the feasibility assessments conducted before identification of the final 3 included studies, potential comparability issues were discussed for the initial 14 selected studies (see Table 22) and comparability was assessed for the 8 targeted therapy trials in terms of specific study design characteristics, prior therapy, comparators, patient characteristics, and study quality. However, no table of study and patient characteristics was provided for the final 3 included trials. Thus, although the 3 included trials were part of the 8 initially identified targeted therapy trials, considered to be sufficiently comparable for analysis by NMA, the specific characteristics of the 3 included trials were not reported, and therefore similarities and differences between them could not be directly assessed. The authors of the ITC did highlight some key points related to homogeneity of patient populations across the 3 included trials. Differences across the trials in baseline LDH (proportion of patients with elevated LDH level) were reported not to bias the results, since LDH level was indicated not to be an effect modifier. The rationale for this statement was noted to be based on findings from subgroup analyses in previous NMAs, which were not presented in the report. Although the proportion of patients with elevated LDH levels was reported to range from 23% to 58% across the 8 targeted therapy trials, the proportion of patients with elevated LDH level across the 3 included trials was not reported.
The authors also stated that prior IO therapy was not an effect modifier and differences across trials would not bias the results. No rationale or references were provided for this statement. Although prior IO therapy was not reported across the 3 trials, a review of data provided for the 8 targeted therapy trials indicates that only the COLUMBUS trial included a small proportion of patients with prior IO therapy in the metastatic treatment setting (4% to 5%).
The discussion of comparability issues for the feasibility assessment indicated that differences in the proportion of post-progression IO treatments could impact OS results (see Table 23). Specifically, for the final 3 included trials, the impact of post-progression treatments on the OS results was discussed as a limitation of the NMA.
Although the discussion of comparability issues for the feasibility assessment also indicated that OS results should be interpreted with caution due to considerable heterogeneity in follow-up times across trials (Table 23), no comments on comparability of follow-up times between the 8 targeted therapy trials or the 3 included trials were made. However, follow-up times were reported and varied widely across the 3 trials. For the OS outcome, median follow up was 48.8 months, 16.8 to 22.2 months, and 23 months for COLUMBUS, coBRIM, and COMBI-v trials, respectively. For INV-assessed PFS, median follow up was 14.4 to 16.7 months, 14.2 months, and 23 months, respectively for the 3 trials. For IRC-assessed PFS, median follow up was 48.8 months and 7.3 months for the COLUMBUS and coBRIM trials, respectively, (COMBI-v did not include IRC-assessed PFS).
Although the risk of bias was considered to be low across the 8 targeted trials initially identified, quality assessment results for the subset of 3 trials included in the NMA were not reported.
Results
The NMA network included all 3 trials: COLUMBUS, COMBI-v, and coBRIM (Figure 11). The number of patients in each trial and the total number of patients included in the NMA were not reported.
The NMA network geometry is shown in Figure 11 below. Each combination BRAFi/MEKi treatment node is associated with a single trial. The combination BRAFi/MEKi trials each included vemurafenib as a common comparator. Thus, the vemurafenib node is associated with all 3 trials, and allows for indirect comparison between the 3 combination BRAFi/MEKi treatments.
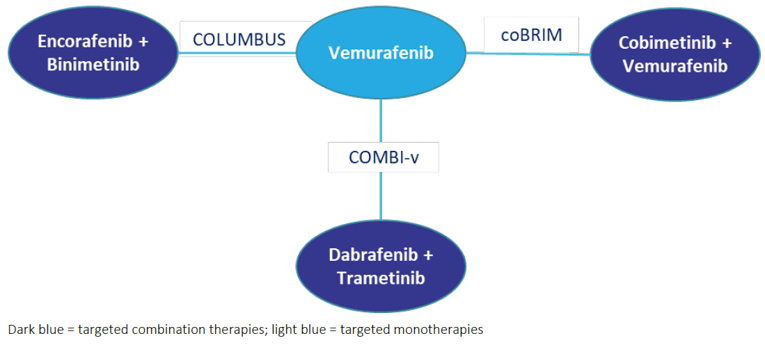
No assessment of model fit was described for the fixed-effects NMA model chosen. No results for convergence were reported. The authors indicated that statistical heterogeneity could not be formally assessed given the lack of more than 1 trial for each comparison. The authors indicated that analyses based on HRs were appropriate because the proportional hazards assumption held across “most” trials. However, they noted that there were slight violations for 2 of the 3 included trials. Slight violations were noted for the OS outcome in the coBRIM trial and the INV-assessed PFS outcome in the COLUMBUS trial. No details were provided on the methods used to check the proportional hazards assumption and it is unclear what a “slight” violation means. Results of the NMA are presented in the Table 24.
Table 24: Results of the Sponsor-Submitted ITC for Encorafenib in Combination With Binimetinib Versus Comparators
| |||
|---|---|---|---|
|
|
| |
|
|
|
|
|
|
|
|
|
|
|
|
|
|
|
|
|
|
|
|
|||||||||||||||||||||||||||||||||||||||||||||||||||||||||||||||||||||||||||||||||||||||||||||||||||||||||||||||||||||||||||||||||||||||||||||||||||||||||||||||||||||||||| |||||||||||||||||||||||||||||||||||||||||||||||||||||||||||||||||||||||||||||||||||||||||||||||||||||||||||||||||||||||||||||||||||||||||||||||||||||||||||||||||||| ||||||||||
ITC = indirect treatment comparison.
Source: Data from sponsor-submitted ITC8; tabulated by reviewer.
Consistent with the choice of BRAFi/MEKi combination therapy over BRAFi monotherapy in clinical practice, encorafenib in combination with binimetinib produced statistically superior results compared to vemurafenib monotherapy for OS, INV-assessed PFS, and IRC-assessed PFS. Although no statistically significant differences were found between encorafenib in combination with binimetinib and either dabrafenib in combination with trametinib or vemurafenib in combination with cobimetinib for the OS, INV-assessed PFS, and IRC-assessed PFS outcomes, results favoured encorafenib in combination with trametinib numerically for all outcomes. However, credible intervals were wide, reflecting imprecision in the results. Outcomes for INV-assessed PFS and IRC-assessed PFS were very similar, providing no signal for potential bias in PFS outcomes for unblinded assessments by INVs. However, as previously noted, credible intervals were wide, reflecting imprecision in the results.
The authors indicated that a sensitivity analysis was conducted for OS to adjust for crossover to the experimental treatment at disease progression, which was permitted in 2 of the 3 included trials. Sensitivity analysis findings were consistent with the base case, but the estimated relative effects for encorafenib in combination with binimetinib versus each comparator improved slightly. The relative effect of encorafenib in combination with binimetinib was still statistically significant over vemurafenib monotherapy and numerically, but not statistically, significant over cobimetinib in combination with vemurafenib and dabrafenib in combination with trametinib. Credible intervals for the comparisons between combination BRAFi/MEKi treatments remained wide.
Critical Appraisal of Sponsor-Submitted ITC
A strength of the sponsor-submitted NMA was the comprehensive systematic literature review, which included multiple databases and grey literature searches at 2 points in time, as well as ancillary searches at a third point in time. However, it is notable that updated results for the COLUMBUS trial at a median follow up of 60.6 months (November 2019 data cut) were published in abstract from May 25, 2020, after the final April 2020 search for additional publications related to the included trials was completed for the sponsor-submitted ITC.31 These latest results are therefore not included in the sponsor-submitted ITC.
Many of the limitations associated with the NMA were related to incomplete or unclear reporting. Several details regarding the study selection process were unclear. There were inconsistencies between the stated aims of the systematic literature review and the provided table of study selection criteria. The number of researchers involved in the study selection process and the process for resolving disagreements were not reported. Similarly, the number of researchers involved in data extraction and the process used (such as duplicate data extraction versus single data extraction with check or resolution of discrepancies) were not described. Methods used to assess study quality were also not described. In addition, no rationale was provided for the inclusion of OS and PFS outcomes and the exclusion of other outcomes, such as ORR and AEs. However, the decision to include separate analyses for INV-assessed PFS and IRC-assessed PFS in an attempt to identify any potential bias in the PFS outcome due to unblinded assessment by INVs was a strength of this NMA not found in other the published NMAs included in this report.
A critical assumption of an NMA is that the distribution of effect modifiers is comparable across the RCTs within the network. A strength of the sponsor-submitted NMA was the a priori identification of potential treatment-effect modifiers. However, lack of explicit reporting on each of the identified potential treatment-effect modifiers, specifically for the final 3 studies included in the NMA, was a limitation. A related limitation was the lack of any overall description for study characteristics and patient baseline characteristics for the 3 included trials. Although some of these data were reported for the initial 14 included trials and for the 8 targeted therapy trials, there was no clear description of the comparability of the 3 included trials. However, it is notable that specific key issues were addressed, including LDH level and prior therapy with IOs. Although elevated an LDH level is a known indicator of poor prognosis and the proportions of patients with elevated LDH levels presumably varied across the 3 trials (LDH was only reported for the 8 targeted therapy trials, not for the 3 included trials), LDH was not considered to be a treatment-effect modifier based on subgroup results of previous NMAs. As long as prognostic factors have no influence on the treatment effect, the assumption that the distribution of effect modifier is comparable across trials included in a network is not violated even if there are differences in the proportion of patients with given prognostic factors across trials. However, no data were provided regarding the subgroup analyses referenced to confirm that LDH did not impact results. In particular, it is not clear if LDH was excluded as an effect modifier for both the OS and PFS outcomes.
The sponsor’s report also indicated that prior IO therapy was not a treatment modifier in the NMA. However, no justification was provided for this. In the absence of additional information or rationale, it is expected that prior IO therapy in the metastatic treatment setting would be a treatment-effect modifier since patients who have had prior IO treatment are expected to be further along in their disease process, with worse survival prognosis compared to their treatment-naive counterparts in this setting. However, it should be noted that data on sequencing is a current gap and results from current trials are pending. Prior IO therapy across the 3 included trials was not specifically reported. However, a review of data provided for the 8 targeted therapy trials indicates that only the COLUMBUS trial included a small proportion of patients with prior IO therapy in the metastatic setting (4% to 5%). Although any impact of prior IO therapy on the overall NMA is expected to be minimal due to the small proportion of patients involved, an impact of inclusion of these patients on the overall NMA results cannot be excluded.
No justification for the choice of Bayesian NMA was provided. Although a rationale was provided for use of the fixed-effects model, no assessment of model fit was described. No information was provided on use of priors or results for model convergence. The authors indicated that statistical heterogeneity was not assessed since there was only 1 trial for each comparison. However, a global assessment of statistical heterogeneity such as an I2 score could potentially have been calculated with meta-analysis of all the trials as was done by Consoli et al.9 The authors did not mention assessment of consistency. However, consistency between direct and indirect estimates could not be assessed as there were no closed loops in the network. The overall network was also limited by the small number of trials included (n = 3).
In order for the NMA to produce valid HRs for indirect OS and PFS estimates, the proportional hazards assumption must hold for OS and PFS outcomes across the included trials. While this assumption was reported to be assessed, no details were provided on the methods used and it is unclear what a ”slight” violation means. Thus, it is not possible to assess whether use of HRs was appropriate in the NMA. Other methods, such as multivariate NMA and fractional polynomial NMA can be used to assess OS and PFS data in NMAs when the proportional hazards assumption does not hold across included trials.32,33 However, the authors indicated that use of fractional polynomial NMAs was not recommended because parametric extrapolation introduces additional statistical assumptions and potential biases (e.g., using unadjusted published curves that do not account for potential effect modifiers). The potential for bias from the reported slight violations in the proportional hazard’s assumption, for both PFS and OS outcomes, cannot be excluded. However, the size and impact of any potential bias cannot be determined from the available information.
The results of the NMA showed no statistically significant differences between encorafenib in combination with binimetinib and the 2 other combination therapies for all outcomes (INV-assessed PFS, IRC-assessed PFS, and OS), although results consistently favoured encorafenib numerically. However, results were imprecise with wide credible intervals, adding uncertainty to the non-statistically significant conclusions. The results of the sensitivity analysis, which adjusted OS results based on crossover to the experimental arm, was consistent with the base case; however, no details of the analysis methods or results were provided. The proportion of patients who received crossover treatment versus post-progression treatment with other therapies was not reported. At progression, these patients would more likely be given an IO. As an effective treatment post-BRAFi/MEKi combination therapy, post-progression treatment with IOs is more likely to be a cause for bias in OS outcomes than crossover from BRAFi monotherapy to BRAFi/MEKi combination therapy.
Post-progression treatments are a key limitation of the OS analysis, acknowledged by the authors of the sponsor’s report. Post-progression treatments likely had an unequal and important influence on long-term survival across the trials, making comparisons of OS between trials challenging and importantly increasing uncertainty in the OS results. Further, it is not possible to determine the direction of any potential bias created by post-progression treatments. Differences in follow-up durations, which varied widely between the 3 trials, also potentially affected both PFS and OS outcomes, further increasing uncertainty in the results.
The results of the sponsor-submitted NMA indicated that there were no statistically significant differences between encorafenib in combination with binimetinib and either dabrafenib in combination with trametinib or vemurafenib in combination with cobimetinib for the outcomes of OS, INV-assessed PFS, and IRC-assessed PFS. However, all results favoured encorafenib in combination with binimetinib numerically. Based on the results of the sponsor-submitted NMA, it is likely that encorafenib in combination with binimetinib is as effective as the other BRAFi/MEKi combination therapies. However, this conclusion is associated with some uncertainty due to unclear and incomplete reporting of NMA methods, small network size, imprecision in results, and the unknown influence of effective post-progression treatments on the observed OS outcome.
Methods of Consoli et al. ITC
Objectives
The objective of this ITC was to identify the published RCTs of BRAFi/MEKi combination therapies compared to a BRAFi alone in advanced BRAF mutation-positive malignant melanoma and to conduct an indirect adjusted NMA using the Bucher method to synthesize the magnitude of benefit and the toxicity patterns of each combination regimen over the others.9 The primary outcome was OS. Secondary outcomes were PFS, ORR, and grade 3 to 4 toxicities.
Study Selection Methods
Study selection criteria for the NMA included phase III RCTs in patients with advanced BRAF V600-mutated malignant melanoma treated with BRAFi/MEKi combination therapies. The intervention was required to be a BRAFi plus either cobimetinib, trametinib, or binimetinib. The comparator was required to consist of monotherapy using the BRAFi component of the intervention combination therapy. Outcomes included OS, PFS, ORR, and grade 3 to 4 toxicities. Definitions and methods of assessment for OS, PFS, and ORR outcomes were not reported. In particular, it was not reported whether PFS and ORR outcomes were assessed by INV or by IRC. Grade 3 to 4 AEs were graded according to the Common Terminology Criteria for Adverse Events version 4.0, and included those occurring in at least 5% of patients in the experimental arms (i.e., the combination therapy arms).
A literature search, involving multiple databases (PubMed, Embase, and the Cochrane Library) and searches of reference lists, with no language restrictions, was conducted up to January 13, 2019 to identify relevant trials based on the pre-specified study selection criteria. Ongoing trials with preliminary data only, trials published only in abstract form, and observational studies were excluded. Two reviewers independently performed study selection, data extraction, and quality assessment. Disagreements were resolved by consensus (study selection) or by discussion with a third reviewer (data extraction and quality assessment). The Jadad scale was used for quality assessment of studies.
ITC Analysis Methods
An adjusted indirect comparison using the Bucher method was conducted. No justification for the choice of this method for indirect comparison was provided. Both random-effects and fixed-effects models were conducted. No information on model fit was provided and no final choice of random-effects or fixed-effects model was reported. Indirect HRs (with 95% CI) for OS and PFS and indirect relative risks (with 95% CI) for ORR and grade 3 to 4 toxicities were calculated for combination therapies, adjusted by the results of their comparisons against the control arm (BRAFi alone with or without placebo). Assessment of the proportional hazards assumption was required since violations could bias the results of the indirect comparison for the OS and PFS outcomes. However, no assessment of the proportional hazards assumption was reported.
The plausibility of the transitivity assumption was evaluated based on comparison of individual study characteristics. Clinical homogeneity across the studies was further evaluated by reviewing the results of previously reported subgroup analyses for potential treatment-effect modifiers to assess their impact on OS. Characteristics considered to be potential effect modifiers across the trials included elevated LDH, ECOG PS score, BRAF V600E mutation status, sex, age, and M1c disease stage. Statistical heterogeneity was assessed by calculating the percentage of the total variance due to between-study variability (I2 statistic). Similarly, consistency between direct and indirect effect estimates was evaluated through heterogeneity and was measured with the I2 statistic. No plans for new subgroup analyses, meta-regression analyses, or sensitivity analyses were reported.
Results of the Consoli et al. ITC
Summary of Included Studies
The same 3 phase III trials were included in this NMA as were included in the sponsor-submitted NMA: the COLUMBUS, COMBI-v, and coBRIM trials. Unlike the sponsor-submitted NMA, this NMA included a table presenting key characteristics of the included trials such as study characteristics, baseline patient characteristics, efficacy results (OS, PFS, and ORR), quality assessment results (Jadad scale score), and subgroup analysis results of potential treatment-effect modifiers for the OS outcome. Study design varied across the trials. CoBRIM was a double-blind trial, while COLUMBUS and COMBI-v were open-label trials. The primary outcome was PFS in the coBRIM and COLUMBUS trials, and OS in the COMBI-v trial. The experimental arms of the coBRIM, COMBI-v, and COLUMBUS trials included 247, 352, and 192 patients, respectively. Sample size was reported to be significantly smaller in the COLUMBUS study; however, the authors noted that the apparent imbalance in trial sample sizes did not result in statistical heterogeneity or inconsistency between trial results in pairwise comparison. All trials were reported to include patients with untreated advanced melanoma and BRAF mutations. Inclusion and exclusion criteria were reported to not vary systematically across studies. Baseline characteristics across the trials were reported to be comparable except for the proportion of patients with elevated LDH, a known indicator of poor prognosis, which was lower in the COLUMBUS trial (29%) compared to COMBI-v and coBRIM trials (35% and 46%, respectively).
Upon review of the reported subgroup results for characteristics considered to be potential effect modifiers across the trials, it was found that the effect on OS was homogeneous for all pre-specified characteristics: raised LDH, BRAF V600E mutation, ECOG PS of 1, age greater than 65 years, M1c disease stage, and sex. Further, the proportion of patients in each of these categories was comparable across the trials, except for the proportion of patients with elevated LDH, as previously noted above. However, since the effect of elevated LDH on OS was homogeneous for all of the trials, LDH was not considered to be an effect modifier, despite the differences across the trials. It is notable that the assessment of potential treatment-effect modifiers was limited to the OS outcome. No plans were reported for assessment of the impact of the potential treatment-effect modifiers on the PFS or ORR outcomes.
All 3 trials were reported to have a low risk of bias across the 5 domains of the Jadad score. Jadad scores for the coBRIM, COMBI-v and COLUMBUS trials were reported to be 5, 4, and 4, points, respectively (higher score represents higher quality; best score = 5). The lower scores of 4 out of 5 for the COMBI-v and COLUMBUS trials were due to their open-label design.
Differences in post-progression treatments between trials were noted as a limitation that may have influenced the OS results of the NMA. The authors stated:
The proportion of patients who received anti-PD1 as subsequent treatment at progression was higher in the COLUMBUS trial than in the COMBI-v or coBRIM trials (23%, 1%, and 17%, respectively), as a consequence of historically different periods of the 3 studies. As a consequence, long-term survivals could be partially conditioned by post-progression treatments and could interfere with this indirect comparison.
The duration of follow-up for OS was noted to be longer for encorafenib in combination with binimetinib (36.8 months) than for dabrafenib in combination with trametinib and vemurafenib in combination with cobimetinib (23 and 14.2 months, respectively). The authors indicated that the apparent unbalanced duration of follow-up did not result in statistical heterogeneity or inconsistency between trial results in pairwise comparison. No statements were made regarding duration of follow-up for other outcomes (i.e., PFS, ORR, or grade 3 to 4 toxicities), which were also longer for encorafenib in combination with binimetinib, compared to the other combination therapies.
Results
All 3 trials contributed to the NMA analyses for OS, PFS, ORR, and grade 3 to 4 toxicities. As in the sponsor-submitted NMA, the encorafenib monotherapy arm of the COLUMBUS trial was not included in this NMA. Unlike the sponsor-submitted NMA, the number of included patients was reported for this NMA. Across the trials, there were 1,230 patients (194 patients randomized to the encorafenib arm of COLUMBUS trial were not considered). As with the sponsor-submitted NMA, the 3 included trials were connected to each other through the common comparator (vemurafenib). Thus, there were no direct comparisons corresponding to the indirect estimates between combination therapies (i.e., no closed loops). A network diagram was not provided. Construction of nodes was not reported; however, there were only 3 trials, therefore no pooling of treatments or doses was required or possible. Statistical heterogeneity was evaluated in the whole population. Higher I2 values (> 50%) were reported to indicate greater between-study heterogeneity. For OS and PFS outcomes, statistical heterogeneity was absent (pooled HR for OS = 0.667; 95% CI, 0.57 to 0.77; P ≤ 0.001; I2 = 0; P = 0.71 and pooled HR for PFS = 0.57; 95% CI, 0.51 to 0.65; P < 0.001; I2 = 0; P = 0.55). For the ORR and grade 3 to 4 toxicity outcomes, statistical heterogeneity was not reported. However, it was reported that there was no heterogeneity or inconsistency between trial results in pairwise comparison. The results of the NMA analyses for OS and PFS (HR, 95% CI) and for ORR and grade 3 to 4 toxicities (relative risk, 95% CI) are presented in Table 25 below.
Table 25: Results of Consoli et al. ITC
Results of adjusted indirect comparisons using the Bucher method (3 studies; 1,230 patients) | |||
|---|---|---|---|
Comparisons | VEM + COB vs. DAB + TRAM | DAB + TRAM vs. ENC + BIN | VEM + COB vs. ENC + BIN |
Follow up, months | 14.2 vs. 23 | 23 vs. 36.8 (OS) 23 vs. 32.1 (PFS)a | 14.2 vs. 36.8 (OS) 23 vs. 32.1 (PFS)a |
Efficacy (OS, PFS, and ORR) | |||
OS (HRind, 95% CI); P value | 1.01 (0.71 to 1.45); 0.93 | 1.13 (0.78 to 1.63); 0.51 | 1.15 (0.8 to 1.64); 0.45 |
PFS (HRind, 95% CI); P value | 0.95 (0.71 to 1.27); 0.73 | 1.2 (0.86 to 1.75); 0.27 | 1.14 (0.8 to 1.62); 0.47 |
ORR (RRind, 95% CI); P value | 1.06 (0.87 to 1.29); 0.54 | 0.84 (0.66 to 1.07); 0.15 | 0.89 (0.69 to 1.15); 0.36 |
Grade 3 to 4 toxicities, RRind (95% CI) | |||
Grade 3 to 4 rash | 16 (5.4 to 47.1)b | 0.5 (0.11 to 2.1) | 9.3 (3.2 to 27.1)b |
Grade 3 to 4 arthralgia | 6.2 (1.7 to 22.6)b | 0.8 (0.12 to 4.97) | 5.2 (1.1 to 24.2)b |
Grade 3 to 4 AST | 8.9 (2.9 to 27.1)b | 0.49 (0.11 to 2.13) | 4.7 (1.5 to 14.3)b |
Grade 3 to 4 ALT | 3.7 (1.8 to 7.5)b | 0.6 (0.25 to 1.41) | 2.4 (1.1 to 5.1)b |
GGT | NR | NR | 1.7 (0.9 to 3.1) |
Grade 1 to 4 SCC | 6 (1.8 to 19)b | 0.2 (0.06 to 0.67)b | 1.4 (0.5 to 4.1) |
KA | NR | Included in SCC rate | 0.8 (0.19 to 3.2) |
BCC | NR | NR | 3.1 (1 to 9.9)b |
Diarrhea | 6.5 (2 to 20.4)b | 0.33 (0.08 to .24) | 3.3 (0.8 to 5.9) |
CPK | NR | NR | 1.8 (0.9 to 3.6) |
Grade 1 to 4 HT | 0.6 (0.4 to 0.8)b | 2.36 (1.52 to 3.66)b | 1.5 (0.8 to 2.6) |
Anemia | NR | NR | 0.3 (0.08 to 1) |
Grade 1 to 4 LVEF | 0.5 (0.18 to 1.37) | 0.5 (0.24 to 1.0) | 0.2 (0.08 to 0.65)b |
ALT = alanine aminotransferase; AST = aspartate aminotransferase; BCC = basal cell carcinoma; CI = confidence interval; CPK = creatine phosphokinase; DAB + TRAM = dabrafenib in combination with trametinib; ENC + BIN = encorafenib in combination with binimetinib; GGT = gamma-glutamyl transferase; HRind = indirect hazard ratio; HT = hypertension; ITC = indirect treatment comparison; KA = keratoacanthoma; LVEF = decreased left ventricular ejection fraction decreased; NR = not reported; ORR = objective response rate; OS = overall survival; PFS = progression-free survival; RRind = indirect relative risk; SCC = squamous cell carcinoma; VEM + COB = vemurafenib in combination with cobimetinib; vs. = versus.
aFollow-up duration for ORR and grade 3 to 4 toxicities was not reported.
bStatistically significant.
Source: Data from Consoli et al. (2020)9; tabulated by reviewer.
Consistent with the results of the sponsor-submitted NMA, there were no statistically significant differences between the combination regimens for the efficacy outcomes of OS and PFS in this NMA. Similar results were found for the additional ORR efficacy outcome, not assessed in the sponsor-submitted NMA. CIs were wide for all relative efficacy estimates, reflecting imprecision in the results. Unlike the sponsor-submitted NMA, this NMA included indirect comparison of grade 3 to 4 toxicities across the BRAFi/MEKi combination therapy treatments. Grade 3 to 4 AEs were found to differ between the 3 combination therapy regimens. Compared to encorafenib in combination with binimetinib, the combination of vemurafenib in combination with cobimetinib was associated with significantly higher grade 3 to 4 liver toxicity, rash, arthralgia, basal cell carcinomas, and diarrhea, but less decrease of left ventricular ejection fraction. There were few statistically significant differences in grade 3 to 4 toxicities between dabrafenib in combination with trametinib and encorafenib in combination with binimetinib. Only hypertension occurred more frequently with dabrafenib in combination with trametinib, while only squamous cell carcinoma arose more frequently with encorafenib in combination with binimetinib. However, CIs were wide, reflecting imprecision in the results.
This NMA included results from older data cuts for OS and PFS outcomes compared to the sponsor-submitted NMA. Although older data cuts were used, both the PFS and OS direct trial results used as inputs for the NMA and the indirect estimates produced by the NMA were similar to those of the sponsor-submitted NMA.8
Critical Appraisal of Consoli et al. ITC
Key differences for this NMA compared to the sponsor-submitted NMA included the use of a frequentist approach for the indirect comparison (Bucher method) compared to the Bayesian fixed-effects NMA approach used by the sponsor, and the inclusion of ORR and grade 3 to 4 toxicities as additional outcomes. In addition, the sponsor-submitted NMA assessed PFS INV -assessed and PFS IRC-assessed as separate outcomes; whereas the Consoli et al. NMA assessed PFS as a single outcome for which method of assessment was not reported. Compared to the sponsor-submitted NMA, this NMA used trial results based on older data cuts as inputs for the NMA.
This NMA included a comprehensive literature search which involved multiple databases and searches of reference lists with no language restrictions. Grey literature was not included in the searches and trials published only in abstract form were excluded. Although exclusion of abstracts may increase homogeneity across included trials by exclusion of non-peer-reviewed sources, it may also exclude relevant data. For this NMA, results of trials used as inputs to the analyses were older than those used in the sponsor-submitted NMA. However, this appears to be more related to the timing of conducting the literature search and the NMA, rather than the exclusion of abstracts. Strong study selection, data extraction, and quality assessment processes were described for this NMA, with all processes involving 2 reviewers independently performing tasks and use of consensus or involvement of a third reviewer to resolve disagreements. Methods and results for quality assessment of included studies were well-reported.
Another strength of this NMA was the inclusion of both efficacy (OS, PFS, and ORR) and harms outcomes (grade 3 to 4 toxicities). However, definitions were not reported for the efficacy outcomes. In particular, it was not reported whether the PFS and ORR outcomes were assessed by and INV or by a blinded or unblinded IRC. Assessments by an IRC are considered to be more objective, particularly in open-label trials where INV assessments could be subject to bias. Of note, the authors of the sponsor-submitted NMA indicated that the Consoli et al. NMA compared PFS IRC data for COLUMBUS with PFS INV data for the coBRIM and COMBI-v trials in contrast to their own NMA which included separate PFS assessed by an INV and PFS assessed by an IRC analyses.8 Thus, comparison of PFS assessed by different methods across the trials is a limitation of the Consoli et al. NMA.
The authors stated that all trials included untreated patients with advanced melanoma and that inclusion and exclusion criteria did not vary systematically across the trials. However, these statements do not accurately represent the trials. The sponsor-submitted NMA noted that a key difference in eligibility criteria between the trials was treatment history. Whereas the COMBI-v and coBRIM trials required patients to be untreated in the metastatic setting, the COLUMBUS trial allowed for inclusion of both treatment-naive and previously treated patients. The sponsor submitted an NMA report which indicated that although 30% of patients in the COLUMBUS trial received prior immunotherapy, only 4% to 5% received prior IO therapy in the advanced or metastatic setting; the remaining 26% to 27% received interferon or interleukin treatment, presumably in earlier treatment settings (i.e., adjuvant setting). Treatment in the adjuvant setting with older drugs that are considered ineffective and no longer used (i.e., high dose interleukin-2) is expected to have minimal influence on outcomes in the metastatic setting. In contrast, prior treatment with IOs in the metastatic setting is expected to influence outcomes since patients with prior IO treatment in the metastatic setting are at a later stage in their disease process, with a worse prognosis compared to treatment-naive patients in this setting. Based on the small proportion of patients involved, the impact of prior IOs in the metastatic setting on the overall NMA results is expected to be minimal; however, an impact on the results cannot be excluded. Although inclusion of this small proportion of patients who received prior IOs in the metastatic setting is not considered to violate the transitivity assumption for the overall NMA, the inaccurate reporting of inclusion criteria and baseline characteristics related to treatment history across the trials is a significant limitation of this NMA.
Assessment of comparability between the trials for pre-specified potential treatment-effect modifiers was a strength of the NMA. The proportions of patients with the pre-specified characteristics were compared across the trials and the impact of each pre-specified characteristic on OS was assessed through review of previously reported subgroup analyses for the OS outcome (subgroup data presented in the Consoli et al.9). These assessments allowed for exclusion of each of the pre-specified characteristics as effect modifiers for the OS outcome. However, similar analyses were not reported for the other efficacy outcomes. The results of the NMA would have been strengthened by a similar assessment of the pre-specified potential effect modifiers for the PFS and ORR outcomes, particularly for LDH level since the proportion of patients with elevated LDH levels differed across the trials.
Differences between trials were also described for sample size and follow-up durations. However, the authors noted that these differences did not result in statistical heterogeneity. While this was true, the absence of statistical heterogeneity does not guarantee the absence of clinical heterogeneity. It is not possible to exclude the possibility that differences in sample size and follow-up durations influenced the results of the NMA. The impact of combining open-label (COMBI-v and COLUMBUS) and double-blind (coBRiM) trials in the NMA could also have influenced results since open-label trials tend to have larger effect sizes.
As with the sponsor-submitted NMA, post-progression treatments were also a key limitation of the Consoli et al. NMA. A strength of the Consoli et al. NMA was the specific reporting of differences across the trials in terms of the proportions of patients who received post-progression treatment with anti-PD1 IOs and the direct acknowledgement by the authors that these differences could interfere with the OS results for the NMA.
Incomplete and unclear reporting was a limitation preventing full assessment of the NMA methods. Although both fixed-effects and random-effects models appear to have been explored, no information on model fit was provided and the final choice of model was not reported. Assessment of the proportional hazards assumption for the PFS and OS outcomes was not reported. Thus, it is unknown whether violations in this assumption introduced bias into the NMA results. The network for this NMA was also limited by the small number of included trials (n = 3).
Consistent with the results of the sponsor-submitted Bayesian fixed-effects NMA, the results of this adjusted indirect NMA using the Bucher method showed no statistically significant differences between encorafenib in combination with binimetinib and the 2 other combination therapies for OS and PFS outcomes. In addition, no statistically significant differences were found between combination treatments for the additional efficacy outcome of ORR, not included in the sponsor-submitted NMA. However, CIs were wide, adding uncertainty to the non-statistically significant results for these efficacy outcomes. The results for grade 3 to 4 toxicities assessed only in this NMA demonstrated differences in specific grade 3 to 4 AEs between encorafenib in combination with binimetinib and the other BRAFi/MEKi combinations.
Based on this NMA, it appears that encorafenib in combination with binimetinib is as effective as the other 2 BRAFi/MEKi combination therapies. Further, the similar results for OS and PFS between the sponsor-submitted NMA and this NMA, despite differences in methodology and data cuts used, provide additional support for comparable efficacy between encorafenib in combination with binimetinib and both dabrafenib in combination with trametinib and vemurafenib in combination with cobimetinib for these outcomes. However, the conclusion of comparable efficacy between these combination treatments is associated with considerable uncertainty due to similar limitations in both NMAs, including incomplete reporting of NMA methods, small network size, imprecision in results, and the unknown influence of effective post-progression treatments on the observed results for the OS outcome.
Methods of Wu et al. ITC
Objectives
The objective of this ITC was to systematically review the literature and use Bayesian NMA to indirectly assess the relative efficacy of agents approved in first-line settings for the treatment of metastatic melanoma.10
The first-line treatment options considered for this NMA included targeted therapies as monotherapies (encorafenib, vemurafenib and dabrafenib) or as combination treatments (dabrafenib in combination with trametinib, encorafenib in combination with binimetinib, and cobimetinib in combination with vemurafenib), immune checkpoint inhibitors (nivolumab, pembrolizumab, and nivolumab in combination with ipilimumab), and chemotherapy alone or in combination with other agents (dacarbazine and dacarbazine in combination with ipilimumab). Dabrafenib in combination with trametinib was the reference treatment. NMA was used to estimate the relative treatment effect of dabrafenib in combination with trametinib on OS and PFS outcomes compared to all possible treatments. AE data were not included in the NMA but were discussed qualitatively (not reported further here).
Study Selection Methods
Studies eligible for inclusion in the NMA were phase II or III RCTs in treatment-naive adult patients with unresectable lymph node metastases (AJCC Tumour Node Metastases stage IIIC) or distant metastatic (AJCC Tumour Node Metastases stage IV) melanoma. Either the intervention or the comparator had to be a targeted inhibitor (BRAFi or MEKi or combination BRAFi/MEKi) or an IO (cytotoxic T-lymphocyte-associated protein 4 or PD1 inhibitor, or combination of both). The authors indicated that although the population of interest was patients with BRAF-mutated melanoma, no restriction was placed on eligibility by BRAF mutation status as IOs have largely been assessed in either a mixed population or in a BRAF wild-type population. Outcomes of interest were OS and PFS. Definitions and methods of assessment for outcomes were not reported. In particular, it was not reported whether PFS was assessed by INV or by IRC.
The literature search was conducted in May 2020 and involved searches of multiple databases (MEDLINE, Embase, and the Cochrane Central Register of Controlled Trials) and selected conference proceedings (American Society for Clinical Oncology, International Melanoma Congress of the Society for Melanoma Research, and the European Society for Medical Oncology; 2017 to 2019) for English language records. Abstracts of new trials not yet published as full publications and abstracts providing updated data to supplement the results of previously published trials were eligible for inclusion.
Two reviewers independently screened citations based on title and abstract. Any discrepancies were resolved by a third reviewer. The eligibility criteria were then applied to the full text of the articles. Two independent researchers were also involved in data extraction. However, the data extraction processes used (such as duplicate data extraction versus single data extraction with check, and resolution of discrepancies) were not described. The authors indicated that the longest follow-up data for PFS and OS were extracted from multiple citations of the same trial and used for analysis. No assessment of study quality was reported.
ITC Analysis Methods
A set of Bayesian hierarchical models were developed to perform the NMA analyses. No justification for choice of NMA model was provided. Analyses were conducted based on the reported HRs between trial arms. In the case of multi-arm trials (i.e., trials with 3 or more interventions), adjustments were made to reflect the correlations between relative treatment effects by converting log-HRs to log-hazards. Both fixed-effects and random-effects models were fitted to the data using the Markov chain Monte Carlo methods and conducted under the Bayesian paradigm. The models were adapted from the NICE technical support document 2. A 3-chain model with noninformative priors was run for 100,000 iterations with a burn-in of 30,000 model iterations. Model fit was assessed according to the deviance information criteria. Assessment of convergence was not reported. No testing of the validity of the proportional hazards assumption across the trials was reported for the OS and PFS outcomes.
Study and patient characteristics that may impact treatment effects were assessed. First, clinical heterogeneity was qualitatively assessed based on the inclusion and exclusion criteria of each study included in the NMA. Then, meta-regression analyses were performed for baseline characteristics of ECOG PS, LDH level, and BRAF mutation status to potentially explain between-study heterogeneity and minimize inconsistency. No details about the meta-regression analysis methods were provided. No testing of statistical heterogeneity was reported. Inconsistency was evaluated by edge-splitting, an approach that estimates relative treatment effects based on direct evidence (i.e., pairwise comparisons between treatment nodes) and indirect evidence (i.e., relative treatment effects estimated using only indirect evidence) separately. If a model is consistent, the direction and statistical importance of the effect will be maintained. Models were programmed in R v3.6.2 (www.r-project.org) using R2OpenBUGS package and RStudio (version 1.1.456).
Results of Wu et al. ITC
Summary of Included Studies
A total of 15 unique studies, including 7,194 patients, were identified. Eight trials involved targeted therapies (monotherapies or combination therapies) and 7 trials involved IOs (monotherapies and combinations with chemotherapy or PD1 inhibitor plus cytotoxic T-lymphocyte-associated protein 4 inhibitor). All included studies were phase III RCTs, except for 3 trials which were phase II RCTs. Seven studies were double blind, 3 were assessor blinded, and 5 were open label. Eleven studies reported data for treatment-naive patients and 4 studies reported data for a mixed population of first- and second-line patients. Of the 4 studies reporting data for a mixed population, 3 reported subgroup data for first-line settings which could be used in the NMAs, while 1 did not report first and second-line patients separately (COLUMBUS). Thus, the combined results for the COLUMBUS trial were used in the NMA.
Although the authors indicated that clinical heterogeneity would be assessed qualitatively based on inclusion and exclusion criteria for each trial, inclusion criteria were not reported or discussed. However, a table presenting baseline characteristics across the included trials was provided. The majority of patients in the included trials (> 60%) had an ECOG PS of 0 at baseline. The proportion of patients with LDH levels more than the upper limit of normal ranged from 23% to 58% across the trials. The proportion of patients with BRAF mutations also varied across the trials: 7 trials had populations of 100% BRAF mutation-positive patients, 5 trials included mixed populations, 2 trials did not report BRAF mutation status, and 1 trial included 100% BRAF wild-type patients (CheckMate 066). Meta-regression analyses were performed to assess the effects of ECOG PS, LDH level, and BRAF mutation status on OS and PFS. These analyses found that ECOG PS and elevated LDH did not significantly affect results for OS or PFS. However, BRAF mutation status was found to significantly affect PFS but not OS. Thus, the authors considered the inclusion of trials with mixed populations of BRAF mutation-positive and BRAF wild-type to be a key source of heterogeneity in the NMA. However, the rationale provided for inclusion of the mixed BRAF mutation status trials was the necessity of including these trials to form a connected network that linked targeted therapies and IO therapies. The authors further noted that evidence suggests IOs demonstrate efficacy irrespective of BRAF mutation status.
Inclusion of the COLUMBUS trial which had both treatment-naive and pre-treated patients was also considered by the authors to be a key source of heterogeneity in the NMA. However, inclusion of the COLUMBUS trial was justified by the authors based on the National Comprehensive Cancer Network and the European Society for Medical Oncology guidelines, which recommend encorafenib in combination with binimetinib in the first-line setting. Differences in follow-up durations across trials (2 to 5 years across trials and outcomes) and post-progression treatments (not reported) were not discussed as sources of heterogeneity. Quality assessment of the trials was also not reported.
Results
Of the 15 trials (7,194 patients) identified in the systematic literature review, 13 trials contributed to the PFS NMA and 14 trials contributed to the OS NMA. Figure 12 shows the network diagram constructed from the trials. The reference treatment was dabrafenib in combination with trametinib. In most cases, comparisons in the network were informed by a single trial.
Figure 12: Network Diagram for Wu et al. ITC
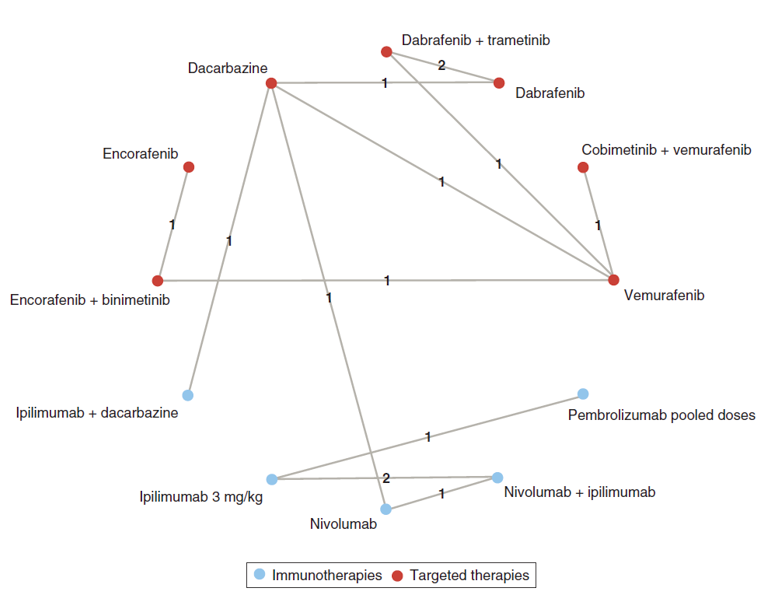
ITC = indirect treatment comparison.
Source: Wu et al. (2021),10 copyright 2021. This work is licensed under the Attribution-NonCommercial-NoDerivatives 4.0 Unported License. Full text available here: https://www.futuremedicine.com/doi/10.2217/cer-2020-0249
Construction of nodes was not reported. However, it was noted that HRs for pooled doses of pembrolizumab (10 mg/kg every 3 weeks and 10 mg/kg every 2 weeks) compared to ipilimumab 3 mg/kg were used in the NMA based on a recent publication providing this information for treatment-naive patients from the KEYNOTE-006 trial. It was reported that the fixed-effects model was selected as the appropriate fit for both the OS and PFS outcomes, since data for most of the comparisons were derived from a single trial, and since the deviance information criteria for the fixed-effects and random-effects models were similar (data not shown in the publication). No results for model convergence were provided. It was not reported whether the proportional hazards assumption was found to hold across the trials for the OS and PFS outcomes. No results for statistical heterogeneity were reported. Using the edge-splitting method, evidence of inconsistency was found based on comparison of direct and indirect estimates for dabrafenib in combination with trametinib versus vemurafenib (OS and PFS outcomes) and for dabrafenib in combination with trametinib versus dabrafenib (PFS outcome). For these comparisons, the HR of dabrafenib in combination with trametinib versus vemurafenib or dabrafenib was significant via mixed treatment comparisons, but significance was not achieved via ITC. However, the point estimates were similar, demonstrating a consistent direction of effect. Table 26 summarizes the most relevant results of the NMAs for dabrafenib in combination with trametinib (reference treatment) compared to other therapies, for the outcomes of OS and PFS.
Table 26: Results of the Wu et al. ITC for Dabrafenib in Combination With Trametinib Versus Selected Comparators
HR (95% CrI) for OS and PFS for DAB+TRAM vs. selected comparators | ||
|---|---|---|
Comparator | OS [HR (95% CrI)] | PFS [HR (95% CrI)] |
Number of studies (patients), model | 14 (NR), FE Bayesian NMA | 13, (NR), FE Bayesian NMA |
ENC + BIN | 1.14 (0.84 to 1.54) | 1.2 (0.88 to 1.63) |
VEM + COB | 1 (0.74 to 1.35) | 1.08 (0.82 to 1.43) |
NIV | 1.28 (0.91 to 1.78) | 0.57 (0.41 to 0.79) |
PEM | 1.33 (0.78 to 2.28) | 0.54 (0.34 to 0.88) |
NIV + IPI | 1.54 (1.03 to 2.28) | 0.73 (0.5 to 1.07) |
IPI 3 | 0.83 (0.54 to 1.29) | 0.3 (0.2 to 0.46) |
IPI 10 | 0.99 (0.59, 1.64) | Not reported |
CrI = credible interval; ENC + BIN = encorafenib in combination with binimetinib; FE = fixed effects; HR = hazard ratio; IPI = ipilimumab; ITC = indirect treatment comparison; NIV = nivolumab; NMA = network meta-analysis; NR = not reported; OS = overall survival; PEM = pembrolizumab; PFS = progression-free survival; VEM + COB = vemurafenib + cobimetinib.
Source: Data from Wu et al. (2021)10; tabulated by reviewer.
Consistent with the results of the 2 previously reviewed NMAs, results of this NMA showed that there were no statistically significant differences in OS or PFS for dabrafenib in combination with trametinib compared to either encorafenib in combination with binimetinib or vemurafenib in combination with cobimetinib. Similar to the other NMA results, credible intervals were wide, reflecting imprecision in the results. This NMA was the only analysis to provide information on BRAFi/MEKi combination therapy (dabrafenib in combination with trametinib) compared to IO therapies. There were no statistically significant differences for OS between dabrafenib in combination with trametinib versus nivolumab, pembrolizumab, or ipilimumab monotherapies. However, for PFS, there were statistically significant improvements for dabrafenib in combination with trametinib compared the IO monotherapies. In addition, dabrafenib in combination with trametinib was associated with a significantly worse OS compared to combination therapy with nivolumab in combination with ipilimumab, but there were no statistically significant differences between these treatments for PFS. Interpretation of the results between dabrafenib in combination with trametinib and IOs is challenging due to inconsistent results for OS and PFS in these comparisons.
Since BRAF mutation status was identified as an effect modifier for the PFS outcome in the NMA, a sensitivity analysis was conducted to address the effect of BRAF status on the PFS outcome. The sensitivity analysis involved removal of the CheckMate 066 trial, which included a 100% BRAF wild-type population, from the PFS NMA analysis. Results of the sensitivity analysis were reported to be similar to the base-case results. However, data were not shown.
Critical Appraisal of Wu et al. ITC
Like the sponsor-submitted NMA, Wu et al., used a fixed-effects Bayesian NMA approach and focused on OS and PFS outcomes. However, the sponsor-submitted NMA assessed PFS INV-assessed and PFS IRC-assessed as separate outcomes; whereas Wu et al. assessed PFS as a single outcome for which method of assessment was not reported. Compared to both the sponsor-submitted and the Consoli et al. NMAs, Wu et al. included a wider range of comparators, including both targeted agents and IOs. IO trials were excluded from the sponsor-submitted NMA due to a lack of comparability with the targeted therapy trials and were not considered in the Consoli et al. NMA. For the coBRIM and COLUMBUS trials evaluating combination BRAFi/MEKi therapies, data inputs for OS and PFS used in the NMA by Wu et al. appear to be the same as those used by Consoli et al. (i.e., older data cuts compared to the sponsor-submitted NMA). Although data inputs for OS and PFS for the COMBI-v (dabrafenib in combination with trametinib) trial were obtained from the dabrafenib in combination with trametinib CSR in the Wu et al. NMA, the values were very similar to those used by Consoli et al.
A comprehensive systematic literature review that involved searches of multiple databases and selected conference proceedings for English language records was conducted in May 2020 for the Wu et al. NMA. Proceedings from selected conferences from 2017 to 2019 were also searched for relevant abstracts. It is notable that updated results for the COLUMBUS trial at median follow-up of 60.6 months (November 2019 data cut) were published in abstract from on May 25, 2020, but were not referenced in the NMA since searches for abstracts were limited to the years 2017 to 2019.31 Two independent reviewers were appropriately involved in study selection and data extraction. However, the data extraction processes used (such as duplicate data extraction versus single data extraction with check, and resolution of discrepancies) were not described and no assessment of study quality was reported.
The Wu et al. NMA included an assessment of study and patient characteristics that could impact treatment effects. A strength was the use of meta-regression analyses to determine the impact of key potential treatment-effect modifiers on both the OS and PFS outcomes. Based on these analyses, BRAF mutation status was found to be a treatment-effect modifier for the PFS outcome. Trials included in the Wu et al. NMA varied widely in the proportions of patients with BRAF-positive mutations. The heterogeneity in BRAF mutation status across the trials was a result of the inclusion of both targeted therapy trials and IO trials in the NMA. It is notable that the feasibility assessment conducted for the sponsor-submitted NMA concluded that IO trials were not sufficiently comparable with targeted therapy trials to be included in the NMA, mainly due to differences in BRAF mutation status. However, IOs are key comparators for BRAFi/MEKi combinations for the first-line treatment of unresectable or metastatic melanoma and comparisons between agents within these 2 classes are of high clinical interest. Wu et al. indicated that BRAF mutation-positive patients have worse prognosis with higher mortality than the general metastatic melanoma population and noted that BRAF mutation status was a key source of heterogeneity across the included trials. Results of the sensitivity analysis removing the CheckMate 066 trial in which 100% of patients were BRAF wild-type, were reported not to change results of the NMA (data not shown in publication). Presumably, the statement that results did not change refers to the results of comparisons between dabrafenib in combination with trametinib and other targeted therapies, since removal of the CheckMate 066 trial (nivolumab versus dacarbazine) would result in 2 disconnected networks, preventing any indirect comparisons between dabrafenib in combination with trametinib and IOs (see Figure 12). Overall, the differences in BRAF mutation status across the trials in the Wu et al. NMA resulted in important heterogeneity that was confirmed in meta-regression analyses for the PFS outcome. Although acknowledgement of this limitation by the authors was a strength of the report, it remains a key limitation of the Wu et al., 2021 NMA that increases uncertainty in the NMA results, particularly for the PFS outcomes.
Wu et al. also identified the inclusion of the COLUMBUS trial, which allowed enrolment of both treatment-naive and previously treated patients, as a key source of heterogeneity in the NMA. As previously discussed for both the sponsor-submitted NMA and the Consoli et al. NMA, inclusion of patients with prior treatment with IOs in the metastatic setting is likely to affect outcomes of the NMA since these patients are at a later stage of their disease, with a worse prognosis compared to treatment-naive patients in the metastatic setting. However, only 4% to 5% of patients in the COLUMBUS trial received prior IOs in the metastatic setting. Although the proportion of affected patients was small and expected to have minimal impact on the overall NMA results, the presence of a treatment-modifying effect associated with inclusion of these patients cannot be excluded.
Although not mentioned in the Wu et al. NMA, unknown and likely unequal post-progression treatments represent an important limitation affecting interpretation of OS results for the NMA. This limitation was also noted for both the sponsor-submitted NMA and the Consoli et al. NMA. Similarly, differences in follow-up durations across the trials (reported as 2 years to 5 years) may also affect the NMA results for both the OS and PFS outcomes. The inclusion of trials with open-label, assessor-blinded, and double-blind study designs could also influence the NMA results since open-label trials tend to have larger effect sizes. Further, since quality assessment of the studies was not reported, other differences in the quality of the trials could also impact the NMA results.
Incomplete and unclear reporting was a limitation preventing full assessment of the NMA methods. No justification for the choice of Bayesian NMA was provided. A rationale was provided for the choice of the fixed-effects model over the random-effects model and model fit methods were described. However, results were not reported for model convergence. In addition, no testing of the proportional hazards assumption for OS and PFS outcomes was reported. No results for statistical heterogeneity were reported and there was evidence of inconsistency in the network. Although the network for this NMA was larger than those of the sponsor-submitted NMA and the Consoli et al. NMA due to the inclusion of a wider range of treatments (15 trials versus 3 trials), the network was similarly sparse since most comparisons were still informed by a single trial.
Consistent with the results of the 2 previously reviewed NMAs, results of this third NMA by Wu et al. showed that there were no statistically significant differences in OS or PFS for dabrafenib in combination with trametinib compared to either encorafenib in combination with binimetinib or vemurafenib in combination with cobimetinib. Despite differences in methodologies and data cuts used, the similar OS and PFS results for the 3 BRAFi/MEKi combinations, across 3 different NMAs, provide additional support for comparable efficacy between them. However, this conclusion is associated with considerable uncertainty due to similar limitations across all 3 NMAs, including incomplete reporting of NMA methods, small network size, imprecision in results, and the unknown influence of effective post-progression treatments on the observed results for the OS outcome. Interpretation of the results between dabrafenib in combination with trametinib and IOs is challenging due to inconsistent results for OS and PFS for the same comparisons and due to the heterogeneity across trials in baseline BRAF mutation status.
Franken et al. ITC
Note that a full critical appraisal was not performed for this ITC since the extended NMA that included encorafenib in combination with binimetinib was considered to have limitations that seriously compromised the results. The extended NMA was conducted as a sensitivity analysis and was not necessarily intended to provide stand-alone results. A brief description of the main and extended NMA analyses, as well as the key limitations of the extended NMA analysis for our purposes of comparing encorafenib in combination with binimetinib to other therapies for advanced melanoma are discussed below.
The objective of this ITC was to conduct an NMA of phase III RCTs in patients with advanced cutaneous melanoma to evaluate the relative effectiveness (PFS and OS) and AEs (treatment-related AEs) of each systemic treatment, thus providing relevant information to develop evidence-based clinical guidelines, to support medical decision-making in everyday clinical practice and to facilitate economic analyses evaluating the relative cost-effectiveness of all treatment options.11
The main analysis was a fixed-effects Bayesian NMA of trials in patients with advanced melanoma who had no prior treatment. Studies were included if they described a phase III RCT of a systemic treatment (chemotherapy, targeted therapy, and IOs) for unresectable stage III and/or stage IV cutaneous melanoma. The outcomes assessed included OS, PFS, and treatment-related grade 3 to 4 AEs. A pooled chemotherapy group (dacarbazine, temozolomide, paclitaxel, or paclitaxel in combination with carboplatin) was the reference treatment.
The main analysis included only treatment-naive patients to increase homogeneity across the studies. However, trials including patients whose previous treatment consisted only of older therapies (specific examples provided by the authors were dacarbazine, temozolomide, fotemustine, carboplatin, interleukin-2, sorafenib, interferon, and cytokine) were also permitted in the main analysis. The authors made the assumption that inclusion of patients previously receiving an “older” treatment would have no impact on the results since the “older” treatments had never demonstrated efficacy.
Based on the approach described above, 4 of the 21 initially identified trials were excluded from the main analysis for the NMA due to inclusion of patients previously treated with an effective therapy. The 4 excluded trials were Larkin et al. (CheckMate 037; nivolumab versus paclitaxel in combination with carboplatin or versus dacarbazine; all patients previously treated with ipilimumab); Dummer et al. (binimetinib monotherapy versus dacarbazine; mixed treatment-naive and previously treated patients); Ugurel et al. (cisplatin in combination with paclitaxel, treosulfan in combination with gemcitabine, or treosulfan in combination with cytarabine versus dacarbazine; mixed treatment-naive and previously treated patients); and Dummer et al. (COLUMBUS; encorafenib in combination with binimetinib versus encorafenib and versus vemurafenib; mixed treatment naive and previously treated).
Thus, the COLUMBUS trial (encorafenib in combination with binimetinib) was excluded from the main NMA analysis. However, the paper reported results of an extended NMA, in which the 4 previously excluded trials were added to the main NMA as a sensitivity analysis to investigate the effect of including trials with previously treated patients on the results of the main NMA analysis. Thus, encorafenib in combination with binimetinib was included in the extended NMA.
Although not discussed by the authors of the paper, there was important heterogeneity between the trials including previously treated patients that were added to create the extended NMA analysis. For example, although 30% of patients in the COLUMBUS trial for encorafenib in combination with binimetinib were previously treated, only 4% to 5% had received prior treatment with an IO in the metastatic setting.8 The remaining 26% to 27% were previously treated with interferon or interleukin (older ineffective therapies as defined by the authors), presumably in earlier treatment settings.8 As previously discussed for the other NMAs included in this report, inclusion of patients with prior IO therapy in the metastatic setting could impact the NMA results since these patients are at a later stage of their disease with worse prognosis compared to treatment-naive patients in the metastatic setting. There is rationale for exploring addition of this the COLUMBUS trial to an extended analysis of treatment-naive patients with advanced melanoma since the proportion of patients previously treated with an effective IO was small and may not bias results. In contrast, the trial by Larkin et al. (CheckMate 037) investigated nivolumab versus paclitaxel plus carboplatin or dacarbazine, specifically in ipilimumab-refractory patients with advanced melanoma. Thus, all patients in the CheckMate 037 trial had received prior treatment with an IO in the metastatic setting and were considered more likely to have worse prognosis compared to treatment-naive patients in this setting. Inclusion of a trial of ipilimumab-refractory patients in an NMA of patients naive to treatment in the metastatic setting would be considered to violate the transitivity assumption for the NMA (when viewed as a stand-alone NMA rather than as a sensitivity analysis). Further, as noted by the authors, the CheckMate 037 trial contributed to the key link for any comparison between targeted therapies and IOs in the network, thus increasing its (inappropriate) influence on multiple key comparisons in the NMA. In the main network, the link between targeted therapies and IOs was only based on Ascierto et al. (CheckMate 066); whereas, in the extended network including the additional 4 trials, the link included both the CheckMate 066 and CheckMate 037 trials. The HR for PFS and OS were much more favourable for untreated patients in CheckMate 066 (HR PFS = 0.42 and HR OS = 0.46) than for ipilimumab-refractory patients in CheckMate 037 (HR PFS = 1.00 and HR OS = 0.95). Further, the 95% CIs were not overlapping. These data are consistent with the ipilimumab-refractory patients representing a different population with worse prognosis. Thus, the inclusion of the CheckMate 037 trial in the extended NMA resulted in less favourable outcomes for nivolumab compared with the chemotherapy reference group when compared to the results of the main NMA analysis (HR PFS = 0.42 in the main network versus 0.58 in the extended network; HR OS = 0.46 in the main network versus 0.62 in the extended network). More importantly, however, all immunotherapies became less favourable in comparison with all targeted therapies owing to this link in the network (less favourable estimated HR for PFS and OS). Due to this significant limitation in the extended NMA, the analysis was not considered to provide relevant information on the relative treatment effect of encorafenib in combination with binimetinib compared to other treatments (particularly compared to IOs). Therefore, the extended NMA was not further appraised here.
Summary of ITCs
Four ITCs were summarized and appraised for this report: an unpublished Bayesian NMA submitted by the sponsor focused only on the BRAFi/MEKi combination therapy trials and reporting only overall OS and PFS outcomes;8 an adjusted ITC (Bucher method) reported by Consoli et al., focused only on the BRAFi/MEKi combination therapy trials but reporting ORR and grade 3 to 4 toxicities as well as OS and PFS as outcomes;9 a Bayesian NMA reported by Wu et al., which compared dabrafenib in combination with trametinib to other BRAFi/MEKi combinations (including encorafenib in combination with binimetinib), monotherapy with BRAFi, IOs, and chemotherapy agents;10 and (4) a Bayesian NMA reported by Franken et al., which compared a pooled chemotherapy group to various IOs, targeted agents, and other chemotherapy treatments.11 Encorafenib in combination with binimetinib was not included in the main NMA analysis of the Franken et al. report, but was included in an extended NMA conducted as a sensitivity analysis.
Table 27 provides a summary of the key ITCs. The Franken et al. ITC is not included in the table since the extended NMA which included encorafenib in combination with trametinib was considered to have limitations that seriously compromised the results for use in comparing encorafenib in combination with trametinib to other treatments (particularly IOs).
Table 27: Summary of Key Included ITCs
Sponsor-submitted NMA | Consoli F et al. (2020) NMA | Wu J et al. (2021) NMA | |
|---|---|---|---|
ITC description | FE Bayesian NMA | Adjusted indirect comparison using the Bucher method (FE vs. RE not clear) | FE Bayesian NMA |
Population | Unresectable or metastatic melanoma, BRAF mutation-positive | Unresectable or metastatic melanoma, BRAF mutation-positive | Unresectable or metastatic melanoma, no restriction on BRAF mutation status |
Included trials | 3 RCTs (COLUMBUS, COMBI-v, and coBRIM) | 3 RCTs (COLUMBUS, COMBI-v, and coBRIM) | 15 RCTs (7 targeted therapy trials, 8 IO therapy trials; COLUMBUS, COMBI-v, and coBRIM were included) |
Comparisons of interest reported in NMA | Enc + Bin vs. Dab + Tram Enc + Bin vs. Vem + Cob | Enc + Bin vs. Dab + Tram Enc + Bin vs. Vem + Cob | Dab + Tram vs. Enc + Bin Dab + Tram vs. Vem + Cob Dab + Tram vs. Niv Dab + Tram vs. Pem Dab + Tram vs. Niv + Ipi Dab + Tram vs. Ipi |
Outcomes assessed | OS, PFS IRC, PFS INV | OS, PFS, ORR, grade 3 to 4 toxicities in ≥ 5% of the experimental arm | OS, PFS |
Follow-up duration | OS: 16.8 to 48.8 months PFS INV: 14.2 to 23 months PFS IRC: 7.3 to 48.8 months | OS: 14.2 to 36.8 months PFS: 14.2 to 32.1 ORR/grade 3 to 4 AEs: NR | OS and PFS: 2 to 5 years |
Key OS results for NMA based on HR (95% CI or CrI) | NSS for Enc + Bin vs. Dab + Tram and Vem + Cob | NSS for Enc + Bin vs. Dab + Tram and Vem + Cob | NSS for Dab + Tram vs. Enc + Bin and Vem + Cob NSS for Dab + Tram vs. Niv, Pem, Ipi 3, Ipi 10 SS for Dab + Tram vs. Niv + Ipi (Niv + Ipi had improved OS vs. Dab + Tram) |
Key PFS results for NMA based on HR (95% CI or CrI) | PFS INV: NSS for Enc + Bin vs. Dab + Tram and Vem + Cob PFS IRC: NSS for Enc + Bin vs. Vem + Cob | NSS for Enc + Bin vs. Dab + Tram and Vem + Cob | NSS for Dab + Tram vs. Enc + Bin and Vem + Cob SS improvement for Dab + Tram vs. Niv, Pem, Ipi 3 NSS for Dab + Tram vs. Niv + Ipi |
Key ORR results for NMA based on RR (95% CI) | NR | NSS for Enc + Bin vs. Dab + Tram and Vem + Cob | NR |
Key grade 3 to 4 AE results for NMA based on RR (95% CI) | NR | Enc + Bin vs. Dab + Tram: SS more HT with Dab + Tram and SS more SCC with Enc + Bin Enc + Bin vs. Vem + Cob: Vem + Cob had SS more liver toxicity, rash, arthralgia, basal cell carcinomas, and diarrhea, but SS less decrease in LVEF | NR |
AE = adverse event; CI = confidence interval; CrI = credible interval; Dab + Tram = dabrafenib in combination with trametinib; Enc + Bin = encorafenib in combination with binimetinib; FE = fixed effects; HR = hazard ratio; HT = hypertension; INV = investigator-assessed; IO = immuno-oncology agent; Ipi = ipilimumab; IRC = independent review committee-assessed; ITC = indirect treatment comparison; LVEF = left ventricular ejection fraction; NIV = nivolumab; NMA = network meta-analysis; NR = not reported; NSS = not statistically significant; ORR = objective response rate; OS = overall survival; PEM = pembrolizumab; PFS = progression-free survival; RCT = randomized controlled trial; RE = random effects; RR = relative risk; SCC = squamous cell carcinoma; SS = statistically significant; Vem + Cob = vemurafenib + cobimetinib; vs. = versus.
Source: Table created by reviewer based on data from sponsor-submitted ITC,8 Consoli et al. (2020),9 and Wu et al. (2021).10
Although the sponsor’s NMA and the Consoli et al. NMA used different NMA approaches (fixed-effects Bayesian NMA and adjusted indirect comparison using the Bucher method, respectively), the same 3 trials were included in both NMAs. Despite the use of different NMA methodology and the inclusion of PFS and OS values from different data cuts, similar non-statistically significant results were found for all comparisons between encorafenib in combination with binimetinib, dabrafenib in combination with trametinib, and vemurafenib in combination with cobimetinib for these 2 NMAs. Credible intervals or CIs were wide in both NMAs, reflecting imprecision in the PFS and OS results. A strength of the sponsor’s NMA was separate analyses for PFS INV-assessed and PFS IRC-assessed. A limitation of the Consoli et al. NMA was inclusion of PFS results assessed by different methods (INV or IRC) across the trials. A major limitation of both NMAs was the unknown and likely unequal influence of effective IO therapies in the post-progression setting on the OS results. Similarly, the unknown influence of different follow-up durations across the trials increased uncertainty in PFS and OS result for both NMAs. The sponsor’s NMA was comprehensive in the description of characteristics that might influence comparability of trials but was unclear in relating these characteristics specifically to the 3 included trials. The Consoli et al. NMA provided a better description of comparability of the 3 included trials as well as a better description of data supporting the exclusion of key characteristics such as LDH, BRAF V600E mutation, ECOG PS of 1, age greater 65 years, M1c disease stage, and sex, as potential treatment modifiers for the OS outcome. However, data supporting exclusion of these characteristics as potential treatment effect modifiers for the PFS outcome was not reported. The Consoli et al. NMA was the only NMA to include the additional outcomes of ORR and grade 3 to 4 AEs, considered a strength of the NMA. Both NMAs provided incomplete and/or unclear reporting of NMA methods, preventing verification of the appropriateness of the approaches taken. Both NMAs were limited by the small size of the network (inclusion of only 3 trials).
Like the sponsor-submitted NMA, Wu et al. used a fixed-effects Bayesian NMA approach and focused on OS and PFS outcomes. However, unlike the sponsor-submitted NMA, Wu et al. included a wider range of comparators, including both targeted agents and IOs. Dabrafenib in combination with trametinib was used as the reference treatment. Results from Wu et al. for comparisons between the BRAFi/MEKi combination treatments were consistent with those reported in the other NMAs. No statistically significant differences between combination treatments were found and credible intervals were wide, reflecting imprecision in the results, and adding uncertainty to the non-statistically significant conclusions. The Wu et al. NMA was the only NMA to include comparisons between BRAFi/MEKi combination treatments (dabrafenib in combination with trametinib) and IOs. IOs are key comparators for BRAFi/MEKi combinations for the first-line treatment of unresectable or metastatic melanoma and comparisons between agents within these 2 classes are of high clinical interest. However, results for comparisons between dabrafenib in combination with trametinib and IOs were difficult to interpret due to inconsistency between results for OS and PFS outcomes for the same comparisons. In addition, interpretation of these results was limited by differences in baseline BRAF mutation status across the trials. The inclusion of IO trials in the Wu et al. NMA resulted in a network consisting of trials with wide variability in the proportion of patients with BRAF mutation-positive status. It is notable that the feasibility assessment conducted for the sponsor-submitted NMA concluded that IO trials were not sufficiently comparable with targeted therapy trials to be included in the NMA, mainly due to BRAF mutation status. Wu et al. indicated that BRAF mutation-positive patients have worse prognosis with higher mortality than the general metastatic melanoma population and noted that BRAF mutation status was a key source of heterogeneity across the included trials in their NMA. Meta-regression analyses confirmed BRAF mutation status as an effect modifier for the PFS outcome but not for the OS outcome. Although this limitation was acknowledged by the authors, it remains a key limitation of the Wu et al. NMA that increases uncertainty in the results of the NMA, particularly for comparisons between dabrafenib in combination with trametinib and IOs. As with the sponsor-submitted NMA and the Consoli et al. NMA, the unknown influence of post-progression treatments on the OS outcomes and the unknown influence of different durations of follow-up on both OS and PFS outcomes were additional key limitations increasing uncertainty of the Wu et al. NMA results. Similar to other NMAs reviewed, the Wu et al. NMA provided incomplete reporting of NMA methods, preventing verification of the appropriateness of the approaches taken. Some evidence of inconsistency in the network was also reported. The Wu et al. NMA was also limited by the sparseness of network, where most comparisons were informed by a single trial.
All of the NMAs reported similar results for comparisons of OS and PFS between the available BRAFi/MEKi combination treatments, concluding that there were no statistically significant differences between encorafenib in combination with binimetinib, dabrafenib in combination with trametinib and vemurafenib in combination with cobimetinib for these outcomes. However, in all NMAs, the credible or CIs were wide, reflecting imprecision and introducing uncertainty to the non-statistically significant results. Only the Consoli et al. NMA also assessed ORR and grade 3 to 4 AEs. No statistically significant differences were found between the combination therapies for the ORR outcome; however, statistically significant differences were found for specific grade 3 to 4 AEs between the combination treatments. Only the Wu et al. NMA included comparisons of a BRAFi/MEKi combination therapy (dabrafenib in combination with trametinib) with IOs. However, results were difficult to interpret due to inconsistencies between results for OS and PFS outcomes and the impact of different baseline BRAF mutation status across the trials.
Despite differences in methodologies and data cuts used, the NMAs reported by the sponsor, Consoli et al., and Wu et al. each reached the same conclusion that there were no statistically significant differences between the 3 BRAKi/MEKi combination treatments for unresected or metastatic melanoma for OS and PFS outcomes. Overall, the limited data suggests that encorafenib in combination with binimetinib likely has comparable efficacy to dabrafenib in combination with trametinib and vemurafenib in combination with cobimetinib, for both OS and PFS outcomes. However, this conclusion is associated with considerable uncertainty due to unclear and/or incomplete reporting on NMA methods, small or sparse networks, imprecision in results, and the unknown influence of effective post-progression treatments on the observed results, particularly for the OS outcome.
Discussion
Summary of Available Evidence
One pivotal multinational RCT met the inclusion criteria for this systematic review. The COLUMBUS study was a 2-part, multi-centre, randomized, open-label, phase III trial (N = 577) that aimed to compare the efficacy and safety of encorafenib in combination with binimetinib to vemurafenib monotherapy and encorafenib monotherapy in patients with locally advanced, unresectable or metastatic melanoma with BRAF V600 mutation. Patients were randomized in a 1:1:1 ratio to either encorafenib 450 mg once daily and binimetinib 45 mg twice daily; encorafenib 300 mg once daily; and vemurafenib 960 mg twice daily. The primary efficacy end point in this study was PFS. Key secondary end points included OS, ORR, DOR, TTR, and DCR. HRQoL outcomes were measured using 3 scales: FACT-M, EORTC QLQ-C30, and EQ-5D-5L.
The mean age of participants ranged between 54 years and 56 years, with a slightly higher proportion of male participants. Men accounted for 55.7% to 59.9% of the population in each arm. The majority (86.9% to 94.3%) of patients were Caucasian. According to the clinical experts consulted during this review, the baseline characteristics of patients were generalizable to the broader Canadian practice setting and are representative to a patient population who would be eligible for encorafenib in combination with binimetinib.
Interpretation of Results
Efficacy
Efficacy data included in this review is based on CSRs with data cuts: May 20167 and November 2017.6,34 Further, 1 published peer review article with a 1-year updated data cut of November 2018 was included.6 At the time of primary analysis (2016), the study demonstrated an increase in PFS (14.9 months; 95% CI, 11.0 to 18.5) compared to the encorafenib monotherapy arm at 9.6 months (95% CI, 7.5 to 14.8) and vemurafenib monotherapy arm at 7.3 months (95% CI, 5.6 to 8.2) . The encorafenib in combination with binimetinib arm demonstrated a 25% risk reduction to disease progression or death compared to encorafenib monotherapy (HR = 0.75; 95% CI, 0.56 to 1.00) and 46% risk deduction to disease progression or death when compared with vemurafenib monotherapy (HR = 0.54; 95% CI, 0.41 to 0.71) . Acknowledging several methodological limitations of the pivotal trial outlined in the Critical Appraisal section, the clinical experts indicated that these results remained clinically relevant.
OS was a key secondary end point. At data cut-off (2017), the median OS was 33.6 months in the encorafenib in combination with binimetinib arm (95% CI, 24.4 to 39.2) versus 23.5 months (95% CI, 19.6 to 33.6) in the encorafenib monotherapy arm and 16.9 months (95% CI, 14.0 to 24.5) in the vemurafenib monotherapy arm. Encorafenib in combination with binimetinib arm demonstrated a 19% risk reduction for compared to encorafenib monotherapy (HR = 0.81; 95% CI, 0.61 to 1.06), however was not statistically significant (P = 0.061) according to the pre-specified hierarchical testing procedure.6 In comparison to vemurafenib monotherapy arm, the combination of encorafenib with binimetinib demonstrated a risk reduction of 39% (HR = 0.61; 95% CI, 0.47 to 0.79). As of November 2018, the median OS for the encorafenib in combination with binimetinib arm remained consistent as previously reported (33.6 months, 95% CI, 24.4 to 39.2) compared to encorafenib arm of 23.5 months (95% CI, 16.6 to 33.6) and 16.9 months (95% CI, 14.0 to 24.5) for vemurafenib. According to the clinical experts consulted during this review, the improvement in OS and PFS was a clinically relevant. It is important to note that this data must be interpreted with several limitations of the study design that might inflate the data.
Additional end points of interest for this review included ORR, DOR, TTR, and DCR. The assessment of responses was provided per BIRC assessment and per INV assessment, respectively. The INV assessment results were similar to BIRC although with higher rates. All response outcomes (per BIRC) demonstrated estimates in favour of the encorafenib in combination with binimetinib arm. ORR was 63% (95% CI, 55.8 to 69.9) compared to 50.5% in the encorafenib arm and 40% in the vemurafenib arm. TTR by BIRC was similar across all treatment arms (2 months each). The clinical expert noted that the timing might be due to the protocol design as the first tumour assessment was at cycle 3 day 1. DCR was higher in the encorafenib in combination with binimetinib arm (92.2% compared with 84.0% in the encorafenib arm and 81.7% in the vemurafenib arm). The median DOR for confirmed responses was 16.6 months for encorafenib in combination with binimetinib arm (95% CI, 12.2 to 20.4). and 14.9 months in the encorafenib arm (95% CI, 11.1 to NE). It is important to note that clinical experts consulted during this review indicated that ORR is an important outcome because melanoma carries a high burden of disease and a favourable ORR indicates that there is significant clinical benefit.
QoL was indicated as an important factor according to the patient groups and clinicians consulted during this review. There can be significant toxicities associated with BRAF monotherapies and BRAF/MEK combination therapies. Therefore, decreased AEs and SAEs and improved HRQoL are considered important factors when deciding treatment options. In COLUMBUS, HRQoL was considered a key secondary outcome; however, the results are considered exploratory due to a lack of type I error pre-specified in the testing hierarchy. There is uncertainty due to the lack of statistical testing and data collection methods. Data were collected only from patients who remained in the study completed the survey. Collecting data from only those who remain in studies introduces bias and will inflate the observed benefit. Further, there is added uncertainty from 2 of the scales used (EORTC QLQ-C30 and EQ-5D-5L) which are not validated for melanoma patients (see Appendix 4 for further details). Despite small improvements in QoL across all 3 scales (0.1 to 4 points), no treatment arm reached the MID (between 5 points to 9 points for FACT-M, > 10 points for EORTC QLQ-C30, and 4.5 for EQ-5D-5L).
In addition to the systematic review, 3 ITCs were summarized and appraised for this review. All of the ITCs reported similar results for comparisons of OS and PFS between the available BRAFi/MEKi combination treatments, concluding that there were no statistically significant differences between encorafenib in combination with binimetinib, dabrafenib in combination with trametinib and vemurafenib in combination with cobimetinib for these outcomes. However, in all ITCs, the credible or CIs were wide, reflecting imprecision and introducing uncertainty to the non-statistically significant results. Only the Consoli et al. ITC assessed ORR and no statistically significant differences were found between the combination therapies for the ORR outcome. Only the Wu et al. ITC included comparisons of a BRAFi/MEKi combination therapy (dabrafenib in combination with trametinib) with IOs. However, results were difficult to interpret due to inconsistencies between results for OS and PFS outcomes and the impact of different baseline BRAF mutation status across the trials. Despite differences in methodologies and data cuts used, the ITCs reported by the sponsor, Consoli et al. and Wu et al. each reached the same conclusion that there were no differences between the 3 BRAKi/MEKi combination treatments for unresected or metastatic melanoma for OS and PFS outcomes. Overall, the limited data suggests that encorafenib in combination with binimetinib likely has comparable efficacy to dabrafenib in combination with trametinib and vemurafenib in combination with cobimetinib, for both OS and PFS outcomes. However, this conclusion is associated with considerable uncertainty due to unclear or incomplete reporting on ITC methods, small or sparse networks, imprecision in results, and the unknown influence of effective post-progression treatments on the observed results, particularly for the OS outcome.
Harms
The frequency of AEs in patients treated with encorafenib in combination with binimetinib, encorafenib monotherapy, and vemurafenib monotherapy was similar between groups (98.4% in the encorafenib group versus 99.5% encorafenib and 99.5% in vemurafenib group). The most common reported AEs (> 20%) in the encorafenib in combination with binimetinib arm were fatigue, nausea, diarrhea, vomiting, constipation, abdominal pain, headache, rash, hyperkeratosis, increased blood creatine kinase, arthralgia, myopathy, and visual impairment. Although certain AEs need monitoring, the product monograph states that many of these are common.21,22 Further, the clinical experts consulted during this review indicated that these AEs are consistent with other targeted therapies. Similarly, these AEs were listed as common symptoms of living with melanoma per patient group survey included in this review. Although AEs were reported similarly across treatments arms, grade 3 and 4 AEs were reported in fewer patients receiving encorafenib in combination with binimetinib (57.8%) compared to patients receiving encorafenib (66.1%) and vemurafenib (63.4%) monotherapies. However, according to the clinical experts, this finding is a class effect and combination BRAF/MEKis are better tolerated than single-agent therapies such as vemurafenib and encorafenib monotherapies in COLUMBUS.
The clinician experts involved in this review indicated that pyrexia is a frequent side effect for patients on BRAF/MEK combination therapy, such as dabrafenib in combination with trametinib. Overall, 18.2% of patients in the encorafenib in combination with binimetinib experienced pyrexia. This result was higher than the encorafenib monotherapy arm (15.1%) but lower than vemurafenib arm (28%). This includes grade 3 or 4 pyrexia, which was higher in the encorafenib in combination with binimetinib arm (7%) compared to encorafenib (2%) and vemurafenib (0%) monotherapy arms. It is important to note that the encorafenib dose was higher in the combination arm (450 mg) than monotherapy arm (300 mg). Further, the duration of exposure was also longer in the encorafenib and combination arm (51.2 weeks) compared to the vemurafenib (27.1 weeks) and encorafenib (31.4 weeks) monotherapy arms. The clinical experts also noted that myalgia and arthralgia are commonly experienced by patients on dabrafenib in combination with trametinib. The incidence of both myalgia (13.5%) and arthralgia (25.5%) were less in the encorafenib in combination with binimetinib arm compared to encorafenib monotherapy (myalgia 28.1%; arthralgia 43.8%) and vemurafenib monotherapy (myalgia 18.1%; arthralgia 44.6%). This was deemed a clinically relevant and acceptable toxicity profile for the benefit these agents provide.
Dose interruptions occurred in 30% of patients receiving encorafenib in combination with binimetinib. The most common reason for dose interruption was nausea (7%), vomiting (7%), and pyrexia (4%). Adverse reactions leading to permanent discontinuation occurred in 5% of patients receiving encorafenib in combination with binimetinib; most commonly hemorrhage (2%) and headache (1%).
One ITC provided a comparison of harms between treatment arms.9 There were few statistically significant differences in grade 3 and 4 toxicities between dabrafenib in combination with trametinib and encorafenib in combination with binimetinib. Only hypertension occurred more frequently with dabrafenib in combination with trametinib, while only squamous cell carcinoma arose more frequently with encorafenib in combination with binimetinib. However, CIs were wide, reflecting imprecision in the results. When compared to encorafenib in combination with binimetinib, the combination of vemurafenib with cobimetinib was associated with significantly higher grade 3 to 4 liver toxicity, rash, arthralgia, basal cell carcinomas, and diarrhea, but less incidence of decreased of left ventricular ejection fraction.
The clinical experts consulted during this review indicated that a targeted therapy with a better toxicity profile, and therefore fewer side effects, is an unmet need for patients living with BRAF-mutated metastatic melanoma. Similarly, patient goals of treatment (per patient group input) include access to additional oral medication for targeted therapy with less or more manageable side effects. Further, acknowledging uncertainties related to potential bias in the COLUMBUS study design, encorafenib in combination with binimetinib demonstrated fewer grade 3 and 4 AEs and fewer treatment interruptions compared to vemurafenib and encorafenib monotherapy arms.
Conclusions
Overall, there is uncertainty in the clinical benefit of encorafenib in combination with binimetinib compared with encorafenib monotherapy (based on the pre-specified criteria for statistical significance, open-label study design, uncertain OS data, and inclusion and exclusion criteria). The combination therapy (encorafenib with binimetinib) did demonstrate some benefit compared with vemurafenib monotherapy; however, these results must be interpreted with several methodological limitations which affect internal and external validity (irrelevant comparators, open-label study design, uncertain OS data, and inclusion and exclusion criteria). The ITCs reported similar results for comparisons of OS and PFS between the available BRAFi/MEKi combination treatments, concluding that there were no differences between encorafenib in combination with binimetinib, dabrafenib in combination with trametinib, and vemurafenib in combination with cobimetinib for these outcomes. However, these results were associated with imprecision and uncertainty. QoL was deemed an important factor for consideration in the patient group input; however, the exploratory nature of the HRQoL data (due to lack of statistical testing and data collection methods) make it difficult to detect the magnitude of improvement that encorafenib in combination with binimetinib offers. In terms of AEs, the percentage of patients experiencing 1 AE was similar between the study arms, with gastrointestinal AEs (nausea and diarrhea) reported at a higher frequency among patients taking encorafenib and binimetinib compared to vemurafenib and encorafenib monotherapy arms. Similarly, in the ITCs, there were few differences in grade 3 and 4 toxicities between dabrafenib in combination with trametinib and encorafenib in combination with binimetinib. Overall, the trial design and the results may only be helpful in providing a common comparator for an indirect comparison with other BRAFi/MEKi combination therapies. However, as demonstrated in the ITCs, the comparative efficacy and safety largely remained inconclusive.
References
1.Brenner DR, Weir HK, Demers AA, et al. Projected estimates of cancer in Canada in 2020. CMAJ. 2020;192(9):E199-E205. PubMed
2.Canadian Cancer Statistics Advisory Committee. Canadian Cancer Statistics 2019. Toronto (ON): Canadian Cancer Society; 2019: https://cdn.cancer.ca/-/media/files/research/cancer-statistics/2020-statistics/canadian-cancer-statistics/res-cancerstatistics-canadiancancerstatistics-2019-en.pdf?rev=82dc3652fe3648988b9174ad4b397a24&hash=6D3186DF3AC76787C58EE95D1712033C. Accessed 2021 Apr 23.
3.Melanoma skin cancer. Ottawa (ON): Public Health Agency of Canada; 2019: https://www.canada.ca/en/public-health/services/chronic-diseases/cancer/melanoma-skin-cancer.html. Accessed 2021 Apr 23.
4.Canadian Cancer Society. Survival statistics for melanoma skin cancer. 2021; https://www.cancer.ca/en/cancer-information/cancer-type/skin-melanoma/prognosis-and-survival/survival-statistics/?region=sk. Accessed 2021 Apr 26.
5.Ascierto PA, Kirkwood JM, Grob JJ, et al. The role of BRAF V600 mutation in melanoma. J Transl Med. 2012;10(85):85. PubMed
6.Ascierto PA, Dummer R, Gogas HJ, et al. Update on tolerability and overall survival in COLUMBUS: landmark analysis of a randomised phase 3 trial of encorafenib plus binimetinib vs vemurafenib or encorafenib in patients with BRAF V600-mutant melanoma. Eur J Cancer. 2020;126:33-44. PubMed
7.Clinical Study: CMEK162B2301. A 2-part phase III randomized, open label, multicenter study of LGX818 plus MEK162 versus vemurafenib and LGX818 monotherapy in patients with unresectable or metastatic BRAF V600 mutant melanoma [internal sponsor's report]. Boulder (CO): Array BioPharma Inc.; 2017 Feb 24.
8.Network Meta-analyses of Systemic Treatments for BRAF-positive Advanced or Metastatic Melanoma. Technical Report Version 2.1 [internal sponsor's report]. In: Drug Reimbursement Review sponsor submission: Braftovi (encorafenib), 75 mg oral capsules, with Mektovi (binimetinib), 15 mg oral tablets. Kirkland (QC): Pfizer Canada ULC; 2020 Nov 07.
9.Consoli F, Bersanelli M, Perego G, et al. Network indirect comparison of 3 BRAF + MEK inhibitors for the treatment of advanced BRAF mutated melanoma. Clin Transl Oncol. 2020;22(6):900-907. PubMed
10.Wu J, Das J, Kalra M, Ratto B. Comparative efficacy of dabrafenib + trametinib versus treatment options for metastatic melanoma in first-line settings. J Comp Eff Res. 2021;10(4):267-280. PubMed
11.Franken MG, Leeneman B, Gheorghe M, Uyl-de Groot CA, Haanen J, van Baal PHM. A systematic literature review and network meta-analysis of effectiveness and safety outcomes in advanced melanoma. Eur J Cancer. 2019;123:58-71. PubMed
12.Canadian Cancer Society. What is melanoma skin cancer? 2021; https://www.cancer.ca/en/cancer-information/cancer-type/skin-melanoma/melanoma/?region=sk. Accessed 2021 Apr 23.
13.Moreau S, Saiag P, Aegerter P, et al. Prognostic value of BRAF(V600) mutations in melanoma patients after resection of metastatic lymph nodes. Ann Surg Oncol. 2012;19(13):4314-4321. PubMed
14.Krueger H, Williams D, Chomiak M, Trenaman L. The economic burden of skin cancer in Canada: current and projected. Toronto (ON): Canadian Partnership Against Cancer; 2010: http://krueger.ca/wp-content/uploads/2015/08/skincancer.pdf. Accessed 2021 Apr 26.
15.CADTH pCODR Expert Review Committee (pERC) final recommendation: ipilimumab (Yervoy). Ottawa (ON): CADTH; 2014 Dec 22: https://cadth.ca/sites/default/files/pcodr/pcodr-yervoy1st-fn-rec.pdf. Accessed 2021 Apr 26.
16.CADTH pCODR Expert Review Committee (pERC) final recommendation: ipilimumab (Yervoy). Ottawa (ON): CADTH; 2012 Apr 18: https://cadth.ca/sites/default/files/pcodr/pcodr-yervoy-adv-mel-fn-rec.pdf. Accessed 2021 Apr 26.
17.CADTH pCODR Expert Review Committee (pERC) final recommendation: nivolumab (Opdivo). Ottawa (ON): CADTH; 2016 Apr 01: https://cadth.ca/sites/default/files/pcodr/nivolumab_opdivo_mm_fn_rec.pdf. Accessed 2021 Apr 23.
18.CADTH pCODR Expert Review Committee (pERC) final recommendation: pembrolizumab (Keytruda). Ottawa (ON): CADTH; 2015 Nov 16: https://cadth.ca/sites/default/files/pcodr/pcodr_pembrolizumab_keytruda_mm_fn_rec.pdf. Accessed 2021 Apr 23.
19.CADTH pCODR Expert Review Committee (pERC) final recommendation: nivolumab (Opdivo) plus ipilimumab (Yervoy). Ottawa (ON): CADTH; 2017 Nov 30: https://cadth.ca/sites/default/files/pcodr/pcodr_opdivo_yervoy_metmela_fn_rec.pdf. Accessed 2021 Apr 23.
20.Metastatic melanoma gap analysis. (CADTH technology review; no.9)2018: https://cadth.ca/sites/default/files/pdf/HE0004_Metastatic_Melanoma_Gap_Analysis_TR_Final.pdf. Accessed 2021 Apr 26.
21.Braftovi (encorafenib): 75 mg oral capsules [product monograph]. Kirkland (QC): Pfizer Canada ULC; 2021 Mar 02.
22.Mektovi (binimetinib): 15 mg oral tablets [product monograph]. Kirkland (QC): Pfizer Canada ULC; 2021 Mar 09.
23.Dabrafenib (Tafinlar) in combination with trametinib (Mekinist). (CADTH pan-Canadian Oncology Drug Review: final clinical guidance report). Ottawa (ON): CADTH; 2015: https://cadth.ca/sites/default/files/pcodr/pcodr_tafinlar_mekinist_metmelanoma_fn_cgr.pdf. Accessed 2021 Apr 23.
24.Cobimetinib (Cotellic) for metastatic melanoma. (CADTH pan-Canadian Oncology Drug Review: final clinical guidance report). Ottawa (ON): CADTH; 2016: https://cadth.ca/sites/default/files/pcodr/pcodr_cobimetinib_cotellic_metmela_fn_cgr.pdf. Accessed 2021 Apr 26.
25.McGowan J, Sampson M, Salzwedel DM, Cogo E, Foerster V, Lefebvre C. PRESS Peer Review of Electronic Search Strategies: 2015 guideline statement. J Clin Epidemiol. 2016;75:40-46. PubMed
26.Grey matters: a practical tool for searching health-related grey literature. Ottawa (ON): CADTH; 2019: https://www.cadth.ca/grey-matters. Accessed 2021 Jan 11.
27.Gogas HJ, Flaherty KT, Dummer R, et al. Adverse events associated with encorafenib plus binimetinib in the COLUMBUS study: incidence, course and management. Eur J Cancer. 2019;119:97-106. PubMed
28.Dummer R, Ascierto PA, Gogas HJ, et al. Overall survival in patients with BRAF-mutant melanoma receiving encorafenib plus binimetinib versus vemurafenib or encorafenib (COLUMBUS): a multicentre, open-label, randomised, phase 3 trial. Lancet Oncol. 2018;19(10):1315-1327. PubMed
29.Dummer R, Ascierto PA, Gogas HJ, et al. Encorafenib plus binimetinib versus vemurafenib or encorafenib in patients with BRAF-mutant melanoma (COLUMBUS): a multicentre, open-label, randomised phase 3 trial. Lancet Oncol. 2018;19(5):603-615. PubMed
30.Drug Reimbursement Review sponsor submission: Braftovi (encorafenib), 75 mg oral capsules, with Mektovi (binimetinib), 15 mg oral tablets [internal sponsor's package]. Kirkland (QC): Pfizer Canada ULC; 2021 Jan 08.
31.Gogas H, Ascierto PA, Flaherty K, et al. Update on overall survival in COLUMBUS: A randomized phase III trial of encorafenib (ENCO) plus binimetinib (BINI) versus vemurafenib (VEM) or ENCO in patients with BRAF V600-mutant melanoma. J Clin Oncol. 2020;38(15_suppl):10012-10012.
32.Cope S, Chan K, Jansen JP. Multivariate network meta-analysis of survival function parameters. Res Synth Methods. 2020;11(3):443-456. PubMed
33.Jansen JP. Network meta-analysis of survival data with fractional polynomials. BMC Med Res Methodol. 2011;11:61. PubMed
34.Clinical Study Report: CMEK162B2301. Addendum: Analysis of overall survival (OS): a 2-part phase III randomized, open-label, multicenter study of LGX818 plus MEK162 versus vemurafenib and LGX818 monotherapy in patients with unresectable or metastatic BRAF V600 mutant melanoma [internal sponsor's report]. Boulder (CO): Array BioPharma Inc.; 2018 Feb 27.
35.Graf NP, Koelblinger P, Galliker N, et al. The spectrum of cutaneous adverse events during encorafenib and binimetinib treatment in B-rapidly accelerated fibrosarcoma-mutated advanced melanoma. J Eur Acad Dermatol Venereol. 2019;33(4):686-692. PubMed
36.Pfizer Canada ULC response to March 03, 2021 DRR request for additional information regarding Braftovi DRR review: clinical study reports (CSRs) for the analyses of PFS and OS [internal additional sponsor's information]. Kirkland (QC): Pfizer Canada ULC; 2021 Mar 09.
37.Cormier JN, Ross MI, Gershenwald JE, et al. Prospective assessment of the reliability, validity, and sensitivity to change of the Functional Assessment of Cancer Therapy-Melanoma questionnaire. Cancer. 2008;112(10):2249-2257. PubMed
38.Askew RL, Xing Y, Palmer JL, Cella D, Moye LA, Cormier JN. Evaluating minimal important differences for the FACT-Melanoma quality of life questionnaire. Value Health. 2009;12(8):1144-1150. PubMed
39.Giesinger JM, Kieffer JM, Fayers PM, et al. Replication and validation of higher order models demonstrated that a summary score for the EORTC QLQ-C30 is robust. J Clin Epidemiol. 2016;69:79-88. PubMed
40.Fayers PM, Aaronson NK, Bjordal K, et al. The EORTC QLC-C30 scoring manual (3rd Edition). Brussels (BE): European Organisation for Research and Treatment of Cancer (EORTC); 2001: https://www.eortc.org/app/uploads/sites/2/2018/02/SCmanual.pdf. Accessed 2021 Apr 23.
41.Luo N, Fones CS, Lim SE, Xie F, Thumboo J, Li SC. The European Organization for Research and Treatment of Cancer Quality of Life Questionnaire (EORTC QLQ-c30): validation of English version in Singapore. Qual Life Res. 2005;14(4):1181-1186. PubMed
42.Davda J, Kibet H, Achieng E, Atundo L, Komen T. Assessing the acceptability, reliability, and validity of the EORTC Quality of Life Questionnaire (QLQ-C30) in Kenyan cancer patients: a cross-sectional study. J Patient Rep Outcomes. 2021;5(1):4. PubMed
43.Osoba D, Rodrigues G, Myles J, Zee B, Pater J. Interpreting the significance of changes in health-related quality-of-life scores. J Clin Oncol. 1998;16(1):139-144. PubMed
44.Snyder CF, Blackford AL, Sussman J, et al. Identifying changes in scores on the EORTC-QLQ-C30 representing a change in patients' supportive care needs. Qual Life Res. 2015;24(5):1207-1216. PubMed
45.Bedard G, Zeng L, Zhang L, et al. Minimal important differences in the EORTC QLQ-C30 in patients with advanced cancer. Asia Pac J Clin Oncol. 2014;10(2):109-117. PubMed
46.Herdman M, Gudex C, Lloyd A, et al. Development and preliminary testing of the new five-level version of EQ-5D (EQ-5D-5L). Qual Life Res. 2011;20(10):1727-1736. PubMed
47.McClure NS, Sayah FA, Xie F, Luo N, Johnson JA. Instrument-Defined Estimates of the Minimally Important Difference for EQ-5D-5L Index Scores. Value Health. 2017;20(4):644-650. PubMed
48.Herdman M, Kerr C, Pavesi M, et al. Testing the validity and responsiveness of a new cancer-specific health utility measure (FACT-8D) in relapsed/refractory mantle cell lymphoma, and comparison to EQ-5D-5L. J Patient Rep Outcomes. 2020;4(1):22. PubMed
49.Richardson J, Iezzi A, Khan MA, Chen G, Maxwell A. Measuring the Sensitivity and Construct Validity of 6 Utility Instruments in 7 Disease Areas. Med Decis Making. 2016;36(2):147-159. PubMed
50.Pickard AS, Neary MP, Cella D. Estimation of minimally important differences in EQ-5D utility and VAS scores in cancer. Health Qual Life Outcomes. 2007;5:70. PubMed
Appendix 1: Literature Search Strategy
Note that this appendix has been formatted but has not copy-edited.
Clinical Literature Search
Overview
Interface: Ovid
Databases:
MEDLINE All (1946-present)
Embase (1974-present)
Note: Subject headings and search fields have been customized for each database. Duplicates between databases were removed in Ovid.
Date of Search: January 20, 2021
Alerts: Biweekly search updates until project completion
Study types: No filters were applied to limit retrieval by study type
Limits:
Publication date limit: none
Language limit: none
Conference abstracts: excluded
Syntax | Description |
|---|---|
/ | At the end of a phrase, searches the phrase as a subject heading |
MeSH | Medical Subject Heading |
* | Before a word, indicates that the marked subject heading is a primary topic; or, after a word, a truncation symbol (wildcard) to retrieve plurals or varying endings |
.ti | Title |
.ot | Original title |
.ab | Abstract |
.hw | Heading word; usually includes subject headings and controlled vocabulary |
.kf | Author keyword heading word (MEDLINE) |
.kw | Author keyword (Embase); keyword (CDSR) |
.dq | Candidate term word (Embase) |
.pt | Publication type |
.rn | Registry number |
.nm | Name of substance word (MEDLINE) |
freq = # | Requires terms to occur # number of times in the specified fields |
medall | Ovid database code: MEDLINE All, 1946 to present, updated daily |
oemezd | Ovid database code; Embase, 1974 to present, updated daily |
Multi-Database Strategy
Search Strategy:
(encorafenib* or braftovi* or LGX818 or LGX 818 or NVP LGX 818* or NVPLGX 818* or NVP LGX818* or NVPLGX818* or 8L7891MRB6).ti,ab,kf,ot,hw,rn,nm.
1 use medall
*encorafenib/
(encorafenib* or braftovi* or LGX818 or LGX 818 or NVP LGX 818* or NVPLGX 818* or NVP LGX818* or NVPLGX818*).ti,ab,kw,dq.
or/3-4
5 use oemezd
6 not conference abstract.pt.
2 or 7
remove duplicates from 8
Clinical Trials Registries
ClinicalTrials.gov
Produced by the US National Library of Medicine. Targeted search used to capture registered clinical trials.
Search terms – Braftovi/encorafenib
Health Canada’s
Produced by Health Canada. Targeted search used to capture registered clinical trials.
Clinical Trials Database
Search terms – Braftovi/encorafenib
EU Clinical Trials
European Union Clinical Trials Register, produced by the European Union. Targeted search used to capture registered clinical trials.
Register
Search terms – Braftovi/encorafenib
Grey Literature
Search dates: January 11, 2021 – January 20, 2021
Keywords: Braftovi/encorafenib and melanoma
Limits: No limits
Updated: Search updated before meeting of the CADTH pan-Canadian Oncology Drug Review Expert Committee (pERC)
Relevant websites from the following sections of the CADTH grey literature checklist Grey Matters: A Practical Tool For Searching Health-Related Grey Literature (https://www.cadth.ca/grey-matters) were searched:
Health Technology Assessment Agencies
Health Economics
Clinical Practice Guidelines
Drug and Device Regulatory Approvals
Advisories and Warnings
Drug Class Reviews
Clinical Trials Registries
Databases (free)
Internet Search
Appendix 2: Excluded Studies
Note that this appendix has been formatted but has not copy-edited.
Reference | Reason for Exclusion |
|---|---|
Graf NP, Koelblinger P, Galliker N, et al. The spectrum of cutaneous adverse events during encorafenib and binimetinib treatment in B-rapidly accelerated fibrosarcoma-mutated advanced melanoma. J Eur Acad Dermatol Venereol. 2019;33(4):686-692.35 | Study design |
Appendix 3: Detailed Outcome Data
Note that this appendix has been formatted but has not copy-edited.
Figure 13: Kaplan-Meier Estimate of PFS per BIRC (Encorafenib and Binimetinib Versus Vemurafenib)a
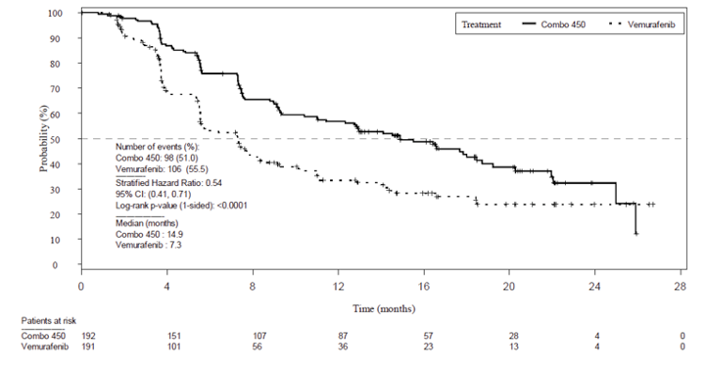
BIRC = Blinded Independent Review Committee; CI = confidence interval; Combo 450 = encorafenib in combination with binimetinib; PFS = progression-free survival; vs. = versus
Note: Full analysis set.
a Based on May 2016 data cut.
Source: COLUMBUS Clinical Study Report.7
Figure 14: Kaplan-Meier Estimate of PFS per BIRC (Encorafenib and Binimetinib Versus Vemurafenib)a
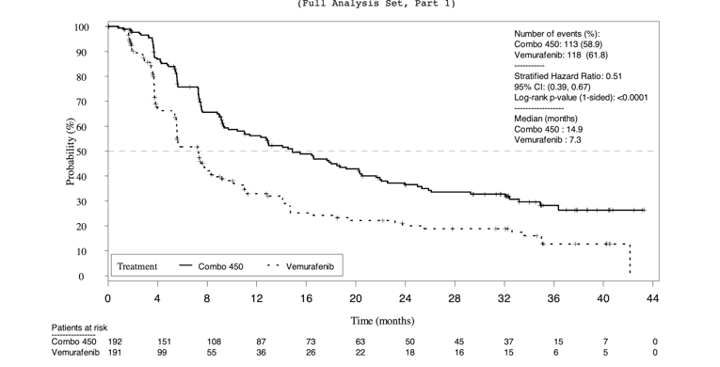
BIRC = Blinded Independent Review Committee; CI = confidence interval; Combo 450 = encorafenib in combination with binimetinib; PFS = progression-free survival; vs. = versus.
Note: Full analysis set.
a Based on November 2017 data cut.
Source: Clinical Study Report for COLUMBUS Study.7
Table 29: PFS and OS Results Based on Cut-Off Date
Median and HR | November 2017 data cut | November 2018 data cut | ||
|---|---|---|---|---|
Encorafenib and binimetinib | Vemurafenib | Encorafenib and binimetinib | Vemurafenib | |
Median PFS (Cl) | 14.9 months (11.0 to 20.2) | 7.3 months (5.6 to 7.9) | 14.9 months (11.0 to 20.2) | 7.3 months (5.6 to 7.9) |
HR | 0.51 (95% Cl; 0.39 to 0.67) | 0.51 (95% Cl; 0.39 to 0.67) | ||
Median OS (Cl) | 33.6 months (24.4 to 39.2) | 16.9 months (14.0 to 24.5) | 33.6 months (24.4 to 39.2) | 16.9 months (14.0 to 24.5) |
HR | 0.61 (95% Cl; 0.47 to 0.79) | 0.61 (95% Cl; 0.48 to 0.79) | ||
BIRC = Blinded Independent Review Committee; CI = confidence interval; Combo 450 = encorafenib in combination with binimetinib; PFS = progression-free survival; vs. = versus.
Note: Full analysis set.
Source: Sponsor-provided additional information.36
Figure 15: Forest Plot of PFS Subgroups by BIRC (Encorafenib in Combination With Binimetinib vs. Vemurafenib)a
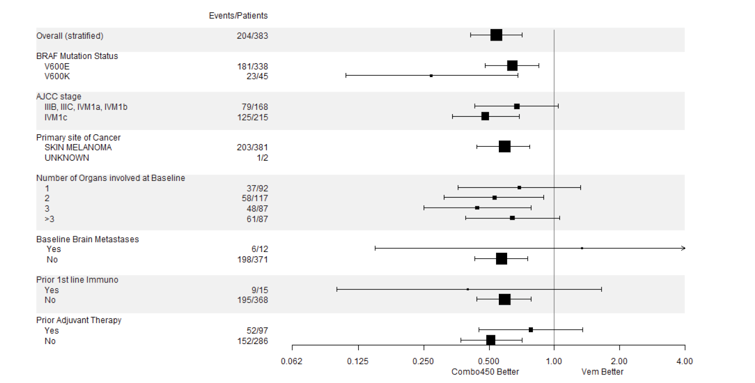
AJCC = American Joint Committee on Cancer; BIRC = Blinded Independent Review Committee; CI = confidence interval; Combo 450 = encorafenib in combination with binimetinib; ECOG = Eastern Cooperative Oncology Group; HR = hazard ratio; PFS = progression-free survival; PS = performance status; vs. = versus
a Based on May 2016 data cut.
Note: Full Analysis Set.
Source: Clinical Study Report for COLUMBUS Study.7
Figure 16: Forest Plot of PFS Subgroups by BIRC (Encorafenib and Binimetinib vs. Vemurafenib)
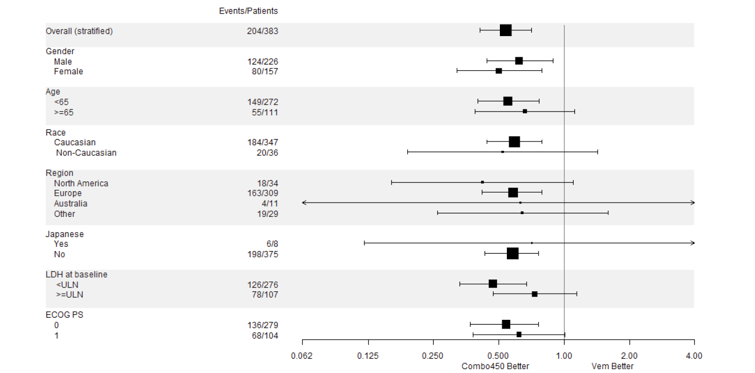
AJCC = American Joint Committee on Cancer; BIRC = Blinded Independent Review Committee; CI = confidence interval; Combo 450 = encorafenib in combination with binimetinib; ECOG PS = Eastern Cooperative Oncology Group performance status; HR = hazard ratio; PFS = progression-free survival; vs. = versus
Note: Full Analysis Set
Source: Clinical Study Report for COLUMBUS Study.7
Figure 17: Kaplan-Meier Estimate of OS per BIRC (Encorafenib And Binimetinib Versus Vemurafenib)a
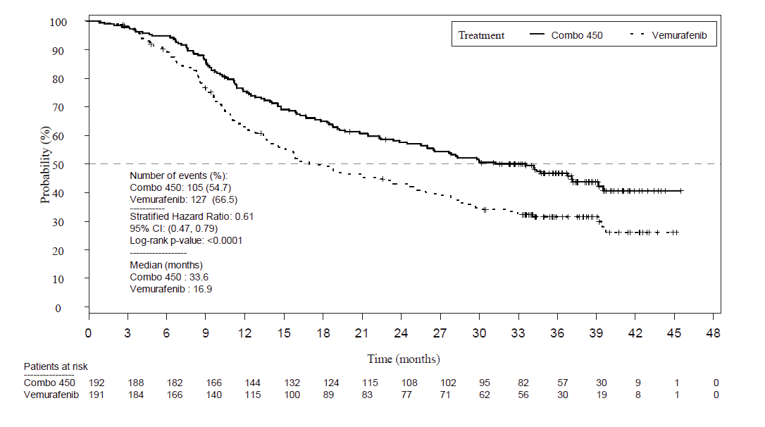
BIRC = Blinded Independent Review Committee; CI = confidence interval; Combo 450 = encorafenib in combination with binimetinib; OS= overall survival; vs. = versus
a Based on November 2017 data cut.
Note: Full Analysis Set.
Source: Clinical Study Report for COLUMBUS Study.7
Figure 18: Kaplan-Meier Plot of DOR by BIRC – Combo 450 vs. Vemurafeniba
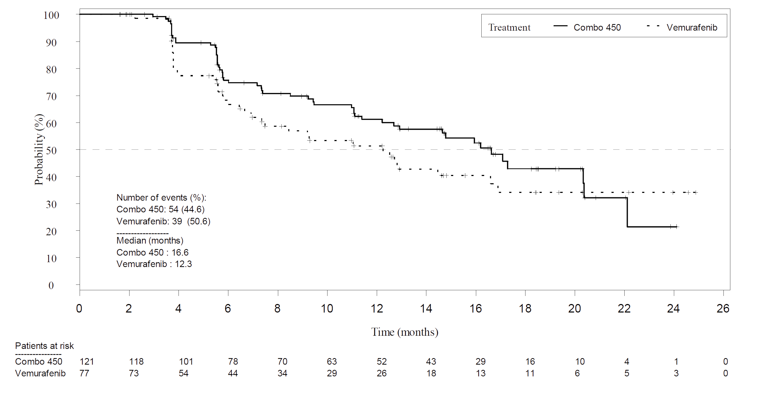
BIRC = Blinded Independent Review Committee; CI = confidence interval; Combo 450 = encorafenib in combination with binimetinib; DOR = duration of response ; vs. = versus
a Based on May 2016 data cut.
Note: Full Analysis Set.
Source: Clinical Study Report for COLUMBUS Study.7
Figure 19: Kaplan-Meier Plot of Time to Response by BIRC – Combo 450 vs. Vemurafeniba
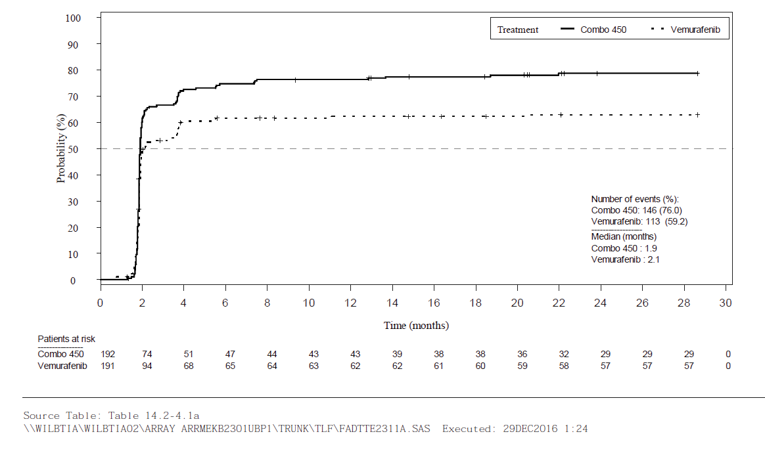
BIRC = Blinded Independent Review Committee; CI = confidence interval; Combo 450 = encorafenib in combination with binimetinib; vs. = versus
a Based on May 2016 data cut.
Note: Full Analysis Set.
Source: Clinical Study Report for COLUMBUS Study.7
Figure 20: Kaplan-Meier Plot of Time to Definitive 10% Deterioration in FACT-M Subscore by BIRC – Combo 450 vs. Encorafenib)a
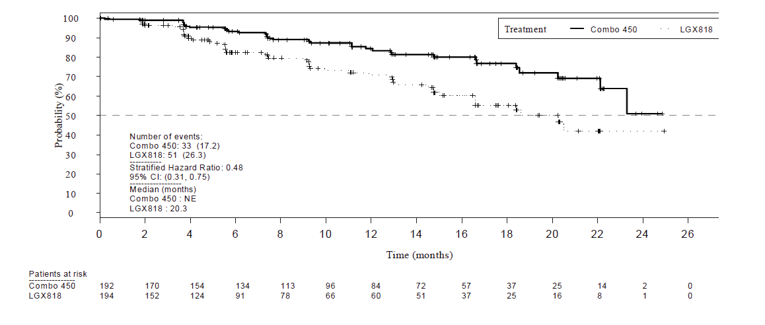
CI = confidence interval; Combo 450 = encorafenib in combination with binimetinib; FACT-M = Functional Assessment of Cancer Therapy–Melanoma; LGX818 = encorafenib; NE = not estimable; vs. = versus
a Based on May 2016 data cut.
Note: Full Analysis Set.
Source: Clinical Study Report for COLUMBUS Study.7
Figure 21: Kaplan-Meier Plot of Time to Definitive 10% Deterioration in FACT-M Subscore by BIRC – Combo 450 vs. Vemurafenib)a
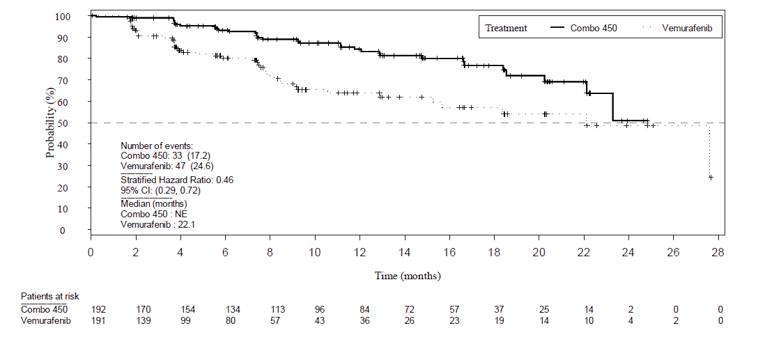
CI = confidence interval; Combo 450 = encorafenib in combination with binimetinib; FACT-M = Functional Assessment of Cancer Therapy–Melanoma; NE = not estimable; vs. = versus
a Based on May 2016 data cut.
Note: Full Analysis Set.
Source: Clinical Study Report for COLUMBUS Study.7
Figure 22: Kaplan-Meier Plot of Time to Definitive 10% Deterioration in EORTC QLQ-C30 Global Health Status (Encorafenib and Binimetinib vs. Encorafenib)a
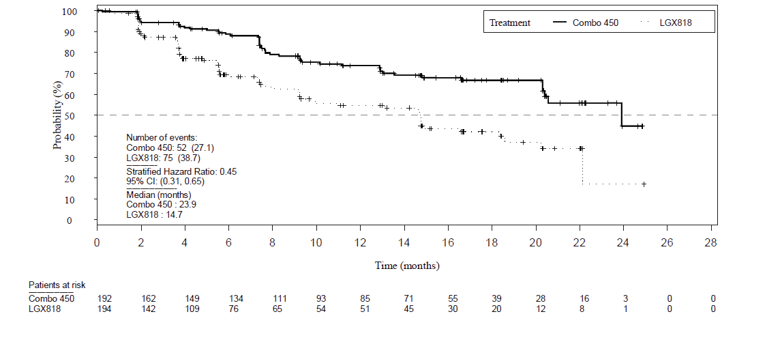
CI = confidence interval; Combo 450 = encorafenib in combination with binimetinib; EORTC QLQ-C30 = European Organisation for Research and Treatment of Cancer Quality of Life Questionnaire Core 30; LGX818 = encorafenib; NE = not estimable; vs. = versus
a Based on May 2016 data cut-off time.
Note: Full Analysis Set.
Source: Clinical Study Report for COLUMBUS Study.7
Figure 23: Adverse Events Leading to Study Discontinuation
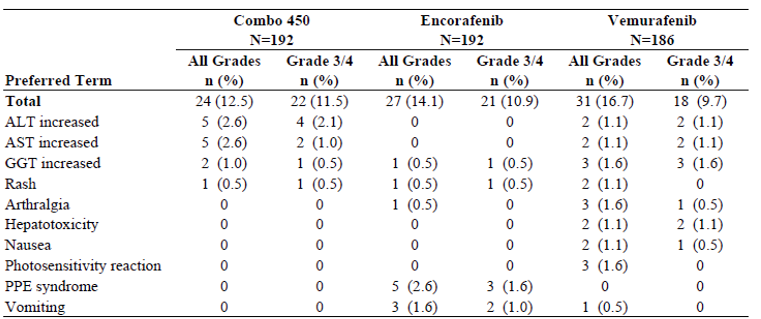
AE = adverse event; ALT = alanine aminotransferase; AST = aspartate aminotransferase; CI = confidence interval; Combo 450 = encorafenib in combination with binimetinib; EORTC QLQ-C30 = European Organization for Research and Treatment of Cancer’s core quality of life questionnaire; GGT = gamma-glutamyl transferase; LGX818 = encorafenib; NE = not estimable; vs. = versus PPE = palmar-plantar erythrodysesthesia; PT = preferred term
Note: Full Analysis Set
Source: Clinical Study Report for COLUMBUS Study.7
Appendix 4: Description and Appraisal of Outcome Measures
Note that this appendix has been formatted but has not copy-edited.
Aim
To describe the following outcome measures and review their measurement properties (validity, reliability, responsiveness to change, and MID):
Functional Assessment of Cancer Therapy–Melanoma (FACT-M, v4)
European Organization for Research and Treatment of Cancer’s core quality of life questionnaire (EORTC QLQ-C30, v3.0)
EuroQol-5 Dimension-5 Level (EQ-5D-5L, v4.0)
Findings
Table 30: Summary of Outcome Measures and Their Measurement Properties
Outcome measure | Type | Conclusions about Measurement Properties | MID |
|---|---|---|---|
Functional Assessment of Cancer Therapy–Melanoma (FACT-M, v4) | Disease-specific QoL questionnaire from the Functional Assessment of Chronic Illness Therapy catalogue of health-related QoL questionnaires | Reliability: Excellent internal consistency and test-retest reliability observed for the FACT-Melanoma total score Validity: High criterion and convergent validity Responsiveness: High responsiveness to change | Between 5 to 9 points for the Trial Outcome Index, 4 to 6 points for the Melanoma Combined Subscale, 2 to 4 points for the Melanoma Subscale, and 1 to 2 points for the Melanoma Surgery Subscale |
European Organization for Research and Treatment of Cancer’s Core quality of life questionnaire (EORTC QLQ-C30, v3.0) | Cancer-specific measure of HRQoL 30-item questionnaire, consisting of 4 scales; 4-item response scale: Function Scale, Symptoms Scale, Single-Item Symptom Scale, 7-item Likert scale: Global QoL Scale/GHS | Validity: Construct validity assessed through convergent and discriminative approach; high construct validity observed in patients with various cancers Reliability: Internal consistency assessed using Cronbach alpha; high internal consistency in patients with various cancers Responsiveness: Not relevant studies found | 10 points change for the individual items and scale scores |
EuroQol-5 Dimension-5 Level (EQ-5D-5L, v4.0) | Generic preference based HRQoL instrument, consisting of a VAS and a composite index score of 5 dimensions: mobility, self-care, usual activities, pain/discomfort, and anxiety/depression | Validity: In patients with relapsed MCL,EQ-5D-5L showed good construct validity based on the known-groups approach and convergence with other disease-specific HRQoL instruments Reliability: No data Responsiveness: Good responsiveness in patients with MCL | Child self-report: 4.4-point change Parent proxy-report: 4.5-point change |
FACT-M = Functional Assessment of Cancer Therapy; GHS = global health status; HRQoL = health-related quality of life; MID = minimal important difference; MCL: Mantle Cell Lymphoma.
FACT-M, v4: The FACT-M (v4) is a melanoma-specific QoL questionnaire from the FACIT catalogue of health-related QoL questionnaires. The FACT-G (G for general) questionnaire (27 questions) is the core of all subscales and is applicable to all tumour types. The FACT-M questionnaire contains 24 additional questions on symptoms specific to melanoma. The melanoma subscale score from the FACT-M consists of 16 items related to signs, symptoms and physical/social activities most relevant to patients with advanced melanoma. The patient self-reports his/her QoL for the previous 7 days. The overall score is calculated across all items and a higher score reflects better QoL.7
Cormier et al.37 assessed the reliability and validity of the FACT-M among 273 melanoma patients with stages I through IV melanoma. Overall, the results of the study concluded that the FACT-M is a reliable and valid instrument for melanoma patients with high responsiveness to detect changes in performance status. The reliability and validity of the FACT-Melanoma were gauged by a total score: Individual components of the FACT-Melanoma module were examined and identified as the melanoma subscale, and surgical items were included in a Melanoma Surgery subscale (MSS). The internal consistency of each melanoma subscale and the total scale was assessed by calculating the Cronbach Alpha coefficient. Values greater than 0.80 were considered optimal and values from 0.70 to 0.80 indicate adequate reliability for use in moderate or larger sample sizes. Test-retest reliability was assessed by using Spearman correlations between the initial test scores and the 1-week retest scores. Excellent internal consistency and test-retest reliability was observed for the FACT-Melanoma total score (Cronbach Alpha = 0.95; and r = 0.90) and the melanoma subscale (Cronbach alpha = 0.85; r = 0.81). The validity of FACT-M was assessed by comparing FACT-M scores with performance status, disease stage, treatment status, and other scales, including the EORTC QLQ Melanoma Module, the Profile of Mood States, and the Marlowe-Crowne Social Desirability Scale. The convergent validity of the FACT-Melanoma was assessed by examining Spearman correlations between the FACT-Melanoma scores and QoL scores (VAS and EORTC QLQ), Karnofsky performance scale (KPS), Profile of Mood States, and the Marlowe-Crowne Social Desirability Scale. The FACT-Melanoma scores correlated positively with the scores from the EORTC-Melanoma (0.6) VAS (0.67), and KPS (0.63) (P < 0.0001). To evaluate criterion validity, the correlation between disease stage and FACT-Melanoma scores was assessed using the Kruskal-Wallis test. A similar analysis was performed of the ECOG performance status (ECOG-PSR) tool, KPS, and treatment status. When there were greater than 2 categories (e.g., disease stage), a pairwise comparison was performed using the Duncan multiple-range test based on ranked data to control for inflation of a type I error. All subscales were related significantly to performance status, in that patients with poorer performance status also scored lower on the QoL subscales.37
Sensitivity to change and instrument responsiveness were evaluated through the repeated administration of the FACT-M instrument and repeated assessment of performance status, as rated by providers using the ECOG-PSR tool and by patients using the KPS. Follow-up questionnaires were completed by 163 patients (60%) at 3 months and by 127 patients (47%) at 6 months after baseline.37 Three groups of patients were created on the basis of performance status over time (improved, stable, and declined). At 3 months, self-reported performance had improved in 40 patients (25%), worsened in 13 patients (8%), and remained stable in 110 patients (67%). Similarly, the KPS at 3 months was improved in 22 patients (13%), worse in 6 patients (4%), and stable in 135 patients. The correlation between performance status changes at 3 months and the noted changes in scores from the MS, MSS, and total FACT-M were found to be statistically significant, whereas individual domains of the FACT-G, including the social well-being (SWB), EWB, and functional well-being, did not demonstrate significant changes. Overall, the patient-reported KPS was correlated better with changes in scores for the MS, MSS, and FACT-Melanoma than the provider-rated ECOG performance status.37
A prospective validation study was conducted for the 273 patients in the Cormier et al. (2008) study by Askew et al. (2009), to assess MIDs for FACT-M. FACT-M, KPS, and ECOG Performance Status scores were obtained at baseline and 3 months following enrolment. Anchor- and distribution-based methods for assessing MIDs were compared, and pattern-mixture modelling was employed to derive multivariate adjusted estimates. The results of the study revealed that an approximate range for MIDs of the FACT-M subscales is between 5 to 9 points for the Trial Outcome Index, 4 to 6 points for the Melanoma Combined Subscale, 2 to 4 points for the Melanoma Subscale, and 1 to 2 points for the MSS.38
EORTC QLQ-C30: The EORTC QLQ-C30, is 1 of the most commonly used patient-reported outcome measures in oncology clinical trials. It is a multi-dimensional, cancer-specific, evaluative measure of HRQoL. It was designed specifically for the purpose of assessing changes in participants’ HRQoL in clinical trials, in response to treatment.39 The core questionnaire of the EORTC QLQ-C30 consists of 30 questions that are scored to create 5 multi-item functional scales (physical, role, emotional, cognitive and social functioning), 3 multi-item symptom scales (fatigue, nausea/vomiting and pain), 6 single-item symptom scales (dyspnea, insomnia, appetite loss, constipation, diarrhea and financial impact), and a 2-item QoL scale. A higher score on the global health status and the functional assessments represents QoL improvement.7
The EORTC QLQ-C30 uses a 1-week recall period in assessing function and symptoms. Most questions have 4 response options (“not at all,” “a little,” “quite a bit,” “very much”), with scores on these items ranging from 1 to 4. For the 2 items that form the global QoL scale, however, the response format is a 7-point Likert-type scale, with anchors between 1 (very poor) and 7 (excellent).40
Raw scores for each scale are computed as the average of the items that contribute to a particular scale. This scaling approach is based upon the assumption that it is appropriate to provide equal weighting to each item that comprises a scale. There is also an assumption that, for each item, the interval between response options is equal (for example, the difference in score between “not at all” and “a little” is the same as “a little” and “quite a bit,” at a value of 1 unit). Each raw scale score is converted to a standardized score that ranges from 0 to 100 using a linear transformation, with a higher score reflecting better function on the function scales, higher symptoms on the symptom scales, and better QoL (i.e., higher scores simply reflect higher levels of response on that scale). Thus, a decline in score on the symptom scale would reflect an improvement, whereas an increase in score on the function and QoL scale would reflect an improvement.40
Psychometric properties
Validity
There have been no studies evaluating the psychometric properties of the EORTC QLQ-C30 for melanoma patients. One cross-sectional study aimed to validate the EORTC QLQ-C30 in 57 convenience sample of cancer patients in Singapore.41 Most patients had breast and colorectal cancer, leukemia, lung cancer, lymphoma, germ cell tumour, and other cancers were also reported. Construct validity was assessed by cross-sectional correlational evidence and discriminative evidence. First, convergent validity was assessed using spearman’s correlations between QLQ-30 and Short Form-36 (SF-36) scales, hypothesizing moderate to strong correlation (defined as correlation coefficient of 0.35 to 0.5, and > 0.5, respectively) between scales of these 2 instruments measuring similar dimensions of HRQoL. Results showed moderate to strong correlations between QLC-30 and SF-36 scales, ranging from 0.35 to 0.67 across the assessed scales. Next, the known-groups approach was used to compare 6 QLQ-30 scale scores between patients reporting mild and severe symptoms, as well as by stage of disease and presence of comorbid conditions. With the exception of emotional functioning, the remaining 5 scales showed better scores in patients with mild symptoms than those with severe symptoms (P < 0.05). Patients in early stages of cancer (or with no comorbid conditions) generally had better QLQ-30 scores than those in advanced disease stages (or with comorbid conditions); however, none of these differences were statistically significant.41
A recent cross-sectional study in Kenya was conducted to evaluate the psychometric properties of the EORTC QLQ-C30, using the English or Kiswahili version in a mix of 100 cancer patients.42 Most patients had breast cancer, followed by prostate, Kaposi sarcoma, lung, and other cancers. Construct validity was assessed by examining the inter-scale correlations among the subscales of EORTC QLQ-C30. The inter-scale correlations were weak to strong and the absolute magnitude ranged from 0.07 to 0.73. Notably, with the exception of Cognitive Functioning, Emotional Functioning, Nausea and Vomiting, Dyspnea, Appetite Loss, Constipation, and Diarrhea, the GHS correlated moderately with the remaining subscales (r ≥ 0.30).42
Reliability
The Singaporean cross-sectional study above also assessed internal consistency reliability by calculating Cronbach alpha for all QLQ-C30 scales. Cronbach alpha was ≥ 0.70 for 6 of the 9 assessed QLQ-30 scales; cognitive functioning, physical functioning, and nausea and vomiting had a Cronbach alpha ranging from 0.19 to 0.68.41
The Kenyan study described above assessed the internal consistency of each scale of the questionnaire using Cronbach alpha coefficients. With the exception of the Cognitive Function scale, all of the scales had a Cronbach Alpha ≥ 0.70.42
Studies evaluating the responsiveness of the instrument was not found.
MID
For use in clinical trials, scores on the EORTC QLQ-C30 can be compared between different groups of patients or within a group of patients over time. One study conducted in breast cancer and small-cell lung cancer patients in 1998 estimated a clinically relevant change in score on any scale of the EORTC QLQ-C30 to be 10 points.43 The estimate was based on a study that used an anchor-based approach to estimating the MID in which patients who reported “a little” change (for better or worse) on the subjective significance questionnaire had corresponding changes on a function or symptom scale of the EORTC QLQ-C30 of approximately 5 to 10 points. Participants who reported a “moderate” change had corresponding changes in the EORTC QLQ-C30 of about 10 to 20, and those who reported being “very much” changed had corresponding changes of more than 20.43
More recently in 2015, a Canadian study estimated the MIDs of EORTC QLQ C-30 scales using data from 193 newly diagnosed breast and colorectal cancer patients.44 The Supportive Care Needs Survey-Short Form-34 (SCNS-SF34) was used as an anchor; mean changes in EORTC QLQ-C30 scales associated with improvement, worsening, and no-change in supportive care based on the SCNS-SF34 was then calculated. MIDs were assessed for the following scales: Physical function, role function, emotional function, global health/QoL (i.e., GHS), pain, and fatigue. For improvement, MIDs associated with a statistically significantly improved supportive care needs ranged from 10 to 32 points. For worsening, MIDs associated with a statistically significantly worsening of supportive care needs ranged from 9 to 21 points. The range for unchanged supportive care needs was from 1-point worsening to 16-point improvement in EORTC QLQ-C30 score.44 Based on this, the authors suggested a 10-point change in EORTC QLQ-C30 score represented changes in supportive care needs, and therefore should be considered for clinical use.44
In 2014, another 1 Canadian study estimated the MID for EORTC QLQ-C30 in 369 patients with advanced cancer, who completed the questionnaire at baseline and 1-month post-radiation.45 The most common cancer type was breast cancer, followed by lung, prostate, gastrointestinal, renal cell, and others. MID was estimated using both anchor and distribution-based methods for improvement and deterioration. Two anchors of overall health and overall QoL were used, both taken directly from the EORTC QLQ-C30 (questions 29 and 30) where patients rated their overall health and QoL themselves. Improvement and deterioration were categorized as an increase or decrease by 2 units to account for the natural fluctuation of patient scoring. With these 2 anchors, the estimated MIDs across all EORTC QLQ-C30 scales ranged from 9.1 units to 23.5 units for improvement, and from 7.2 units to 13.5 units for deterioration. Distribution-based estimates were closest to 0.5 SD.45
EQ-5D-5L
The EQ-5D-5L was developed by the EuroQol Group as an improvement to the EQ-5D-3L to measure small and medium health changes and reduce ceiling effects.46,47 The instrument comprises 5 dimensions: mobility, self-care, usual activities, pain/discomfort, and anxiety/depression. Each dimension is rated on 5 levels: level 1 “no problems,” level 2 “slight problems,” level 3 “moderate problems,” level 4 “severe problems,” and level 5 “extreme problems” or “unable to perform.”46,47 A total of 3,125 unique health states are possible, with 55,555 representing the worst health state and 11,111 representing the best state. The corresponding scoring of EQ-5D-5L health states is based on a scoring algorithm that is derived from preference data obtained from interviews using choice-based techniques (e.g., time trade-off) and discrete choice experiment tasks.46,47 The lowest and highest score varies depending on the scoring algorithm used. The anchors are 0 (dead) and 1 (full health), however negative values are also allowed to represent health states that a population considers worse than death. As an example, a Canadian scoring algorithm results in a score of −0.148 for health state 55,555 (worst health state) and a score of 0.949 for health state 11,111 (best health state). Another component of the EQ-5D-5L is a visual analogue scale (EQ VAS), which asks respondents to rate their health on a visual scale from 0 (worst health imaginable) to 100 (best health imaginable).46
Data from a clinical trial of 132 patients with relapsed MCL was used to assess the validity and responsiveness of the EQ-5D-5L.48 Convergent validity was assessed by testing a priori hypotheses about the strength of correlation with other instruments that measured similar constructs. The EQ-5D-5L showed good convergent validity, reporting moderate correlation with the EQ VAS (r = 0.50) and strong correlation with Functional Assessment of Cancer Therapy (FACT) lymphoma specific subscale (r = 0.60) and FACT lymphoma total score, Trial Outcome Index (TOI) (r = 0.70). The EQ-5D-5L was able to discriminate between known groups based on presence or absence of lymphoma symptoms, ECOG performance score, and Mantle Cell Lymphoma International Prognostic Index, showing statistically significantly differences between groups in the mean index scores. The index score showed good responsiveness, reporting an effect size of 0.67 for improvement and 0.80 for worsening based on the FACT lymphoma subscale.48
Richardson et al.49 examined various instruments, including the EQ-5D-5L, in respondents who were healthy and who had a chronic disease (i.e., arthritis, asthma, cancer, depression, diabetes, hearing loss, and heart disease) through an online survey in Australia, Canada, Germany, Norway, the UK, and the US. For discriminant validity, the mean EQ-5D-5L differed between healthy respondents and respondents with a chronic disease (0.88 in healthy, 0.18 in patients with cancer). For construct validity, the EQ-5D-5L was strongly correlated with the physical component of the SF-36 in cancer patients (r = 0.66), moderately correlated with the psychosocial content of the mental component of the SF-36, the Capabilities Instrument, and the Subjective Well-Being Instrument of the UK Office of National Statistics (r = 0.50), and moderately correlated with preference measures of VAS and time trade-off on own health state (r = 0.43).49
McClure et al. (2017) obtained the MID for the EQ-5D-5L by calculating the average absolute difference between the index score of the baseline health state and the index score of all single-level transitions from the baseline state.47 A single-level transition was defined as a change in a single dimension to the next worse/better level, while holding all other dimensions constant. Such single-level transitions across all 3,125 health states were averaged to arrive at MIDs for various countries, by applying country-specific scoring algorithms. For Canada, transitions between levels 3 and 4 were excluded from the average to form a constant distribution of MID values across the range of baseline scores. This analysis resulted in a Canadian-specific MID of 0.037.47 No estimates of the MID were identified for patients with MCL.
Pickard et al. (2007) estimated the MID of the EQ-5D VAS based on cross-sectional data collected from 534 patients with advanced (stage III or IV) cancer of the bladder, brain, breast, colon or rectum, head or neck, liver or pancreas, kidney, lung, lymphoma, ovary, or prostate.50 Using both anchor- based and distribution-based methods, estimates of the MID ranged from 8 to 12 based on the ECOG performance status, and from 7 to 10 based on FACT QoL questionnaire quintiles.50
Pharmacoeconomic Review
Abbreviations
AE
adverse event
AJCC
American Joint Committee on Cancer
BIA
budget impact analysis
BRAFi
BRAF inhibitor
HR
hazard ratio
ICER
incremental cost-effectiveness ratio
LY
life-year
MEKi
MEK inhibitor
NMA
network meta-analysis
OS
overall survival
PFS
progression-free survival
QALY
quality-adjusted life-year
RDI
relative dose intensity
TTD
time-to-treatment discontinuation
Executive Summary
The executive summary is comprised of 2 tables (Table 1 and Table 2) and a conclusion.
Item | Description |
|---|---|
Drug product | Encorafenib (Braftovi), 75 mg capsules, in combination with binimetinib (Mektovi), 15 mg tablets |
Submitted price | Encorafenib, 75 mg capsule: $50.25 Binimetinib, 15 mg tablet: $36.50 |
Indication | Treatment of patients with unresectable or metastatic melanoma with a BRAF V600 mutation |
Health Canada approval status | NOC |
Health Canada review pathway | Standard review |
NOC date | March 2, 2021 |
Reimbursement request | As per indication |
Sponsor | Pfizer Canada |
Submission history | Previously reviewed: No |
NOC = Notice of Compliance.
Table 2: Summary of Economic Evaluation
Component | Description |
|---|---|
Type of economic evaluation | Cost-utility analysis Partitioned survival model |
Target population | Patients with BRAF V600 mutation-positive unresectable or metastatic melanoma |
Treatment | Encorafenib in combination with binimetinib |
Comparators | Vemurafenib monotherapy Trametinib in combination with dabrafenib Cobimetinib in combination with vemurafenib |
Perspective | Canadian publicly funded health care payer |
Outcome | QALYs, LYs |
Time horizon | 20 years |
Key data source | PFS, OS, and TTD survival curves for encorafenib + binimetinib and vemurafenib monotherapy: COLUMBUS trial (data cut-off date: November 2017). OS adjusted to account for the availability of new treatments based on American Joint Committee on Cancer – melanoma registry and CheckMate 066 trial HRs for PFS and OS for encorafenib + binimetinib vs. dabrafenib + trametinib and cobimetinib + vemurafenib: sponsor’s submitted NMA with vemurafenib as the anchor treatment |
Submitted results | The sequential ICER for encorafenib + binimetinib vs. vemurafenib monotherapy was $167,182 per QALY. Trametinib + dabrafenib and cobimetinib + vemurafenib were both dominated by encorafenib + binimetinib (i.e., encorafenib + binimetinib was less costly and more effective). |
Key limitations | Vemurafenib monotherapy is rarely prescribed in Canadian practice according to clinical experts consulted by CADTH given the improved response and patient tolerability of targeted combination therapy. It is therefore not considered an appropriate comparator. The sponsor excluded immunotherapy, a first-line treatment for BRAF mutation-positive unresectable or metastatic melanoma, as a comparator from the submitted economic evaluation. Comparative clinical efficacy of encorafenib + binimetinib to BRAFi/MEKi combination treatments is uncertain given several concerns about the internal validity of the sponsor’s submitted NMA. The use of a partitioned survival model failed to account for the impact of subsequent treatments on patient outcomes. In terms of the subsequent therapies which patients received in the trials, that contributed to the comparative efficacy estimates, these were not reflective of Canadian clinical practice. As such, there is high uncertainty in the predicted QALYs accrued post-progression. The costs of oral medications were underestimated due to inappropriate adjustment to account for RDI. |
CADTH reanalysis results | CADTH changed the sponsor's model by removing vemurafenib monotherapy as a comparator, assuming equal efficacy and TTD for BRAFi/MEKi combination treatments and setting a 100% RDI for all oral medications. Based on CADTH's reanalysis, encorafenib + binimetinib dominated other BRAFi/MEKi combination treatments at the listed price as this regimen was less costly at $633,406 (cobimetinib + vemurafenib: $675,449, trametinib + dabrafenib: $684,588) but produced the same QALYs (5.16) when compared to other targeted combination therapies. However, the cost-effectiveness of encorafenib + binimetinib compared to immunotherapies is unknown and most immunotherapies have lower annual drug costs than encorafenib + binimetinib. |
BRAFi = BRAF inhibitor; HR = hazard ratio; ICER = incremental cost-effectiveness ratio; LY = life-year; MEKi = MEK inhibitor; NMA = network meta-analysis; OS = overall survival; PFS = progression-free survival; QALY = quality-adjusted life-year; RDI = relative dose intensity; TTD = time-to-treatment discontinuation; vs. = versus.
Conclusions
The COLUMBUS trial suggested that encorafenib (Braftovi) in combination with binimetinib (Mektovi) was associated with significant improvement in progression-free survival (PFS) and overall survival (OS) compared to vemurafenib monotherapy. Both the sponsor’s base case and CADTH’s scenario analysis suggested that, when compared to vemurafenib monotherapy, encorafenib in combination with binimetinib would not be cost-effective. However, vemurafenib monotherapy may not be an appropriate comparator according to clinical experts consulted by CADTH given it is rarely used in Canadian practice since targeted combination therapy is associated with improved clinical response and patient tolerability.
Evidence from the sponsor’s network meta-analysis (NMA) and the additional NMAs identified in CADTH’s clinical review found no statistically significant differences between the 3 BRAF inhibitor/MEK inhibitor (BRAFi/MEKi) combination treatments for unresected or metastatic melanoma. However, these findings were imprecise and had considerable uncertainty. As such, any analyses based on these indirect clinical data must be viewed with caution. CADTH's base case attempted to address some of the limitations by excluding vemurafenib monotherapy as a comparator, assuming equivalent comparative efficacy (i.e., OS, PFS) and time-to-treatment discontinuation (TTD) for all BRAFi/MEKi combination treatments, and setting relative dose intensity (RDI) to 100% for all oral medications. Consequently, in CADTH's base case, encorafenib in combination with binimetinib dominated other BRAFi/MEKi combination treatments at available list prices because this regimen is associated with lower total costs ($633,406; cobimetinib in combination with vemurafenib: $675,449; trametinib in combination with dabrafenib: $684,588), but produced the same quality-adjusted life-years (QALYs) of 5.16. The interpretation of CADTH’s reanalysis relies on confidence in the assumption that the relative efficacy across targeted therapies is identical given that no direct clinical evidence exists comparing encorafenib in combination with binimetinib to targeted treatments. Drug acquisition cost was a key driver on the cost estimates although these predicted cost savings may not be realized if the actual price of comparators is lower than the list prices used in the analysis.
Although the cost-effectiveness findings were robust to changes in input parameters and model assumptions, the findings should be interpreted with caution as there exist several limitations that could not be addressed in the CADTH base-case and scenario analyses. The cost-effectiveness of encorafenib in combination with binimetinib compared to immunotherapies is unknown, as immunotherapies were not considered by the sponsor. Based on the sponsor’s submitted price, most immunotherapy regimens are less expensive than encorafenib in combination with binimetinib in terms of their average annual drug costs.
Stakeholder Input Relevant to the Economic Review
This section is a summary of the feedback received from the patient groups, registered clinicians, and drug plans that participated in the CADTH review process (specifically, information that pertains to the economic submission).
Patient input was received from 2 patient groups: Save Your Skin Foundation and the Melanoma Network of Canada. Patients on existing treatments reported that fatigue or weakness, skin rash, muscle or joint pain, weight loss, or loss of appetite are some of the most common adverse effects of current treatments. However, they noted that existing treatments helped to improve quality of life and that their benefits outweigh side effects. Logistical challenges noted by patients included travelling to melanoma treatment centres, accessing treatments, and dealing with the emotional and financial burden associated with the disease and its impacts on their families. Patients identified the following pharmacotherapy options: monotherapy with ipilimumab, nivolumab, pembrolizumab, dabrafenib in combination with trametinib, and vemurafenib in combination with cobimetinib. Patients expressed their desire to have new therapies that are curative, associated with fewer adverse effects and require less travel to reduce dependence on caregivers, particularly in the ongoing COVID-19 pandemic. Among patients with experience on the encorafenib in combination with binimetinib regimen, fatigue was the most commonly experienced side effect, though this was tolerable and outweighed by the benefits of the treatment.
Registered clinicians indicated that currently funded and available treatments such as dabrafenib in combination with trametinib are associated with high toxicity, including pyrexia and ocular and cardiac toxicity. Registered clinicians noted that the same patient population eligible for dabrafenib plus trametinib is expected to be eligible for the other targeted combination therapies. The registered clinician input further indicated that they do not expect any changes to the order of treatment sequencing as encorafenib in combination with binimetinib could be used in either first or subsequent line of therapy. The approach will remain immunotherapy “first” in the appropriate patients and the sequence of targeted combination treatment in relationship to immunotherapy is expected to remain as observed in the present.
Drug plans identified key considerations related to relevant treatment comparators and potential implementation factors. Drug plans aligned with the registered clinicians’ feedback on the commonly used treatments for the indicated population. Drug plans described concerns around the potential for drug wastage due to dose interruptions or delays and dose reductions. They further noted that encorafenib plus binimetinib would require screening (i.e., echocardiogram or multigated acquisition scan) and monitoring to manage potential adverse events (AEs) (e.g., tumour lysis syndrome).
Several of these concerns were addressed in the sponsor's model:
More tolerable toxicity profiles (i.e., lower incidence rates of pyrexia, skin rash, or muscle or joint pain) associated with encorafenib in combination with binimetinib compared to other BRAFi/MEKi treatments were considered, which was sourced from the COLUMBUS trial and product monographs, respectively.
Although the public health care payer perspective was appropriate in the sponsor’s base-case analysis, the sponsor also submitted a scenario analysis of a societal perspective to capture the financial burden borne by patients and their caregivers given lost productivity attributed to each health state. CADTH similarly reported a scenario analysis under a societal perspective.
In addition, CADTH addressed some of these concerns as follows:
Vemurafenib was removed as a comparator in CADTH base-case reanalyses.
For the BRAFi/MEKi combination treatments, the sponsor’s submitted analysis adjusted costs by the RDI, thus assuming drug costs would reflect the expected amount of drug received by patients. CADTH’s base-case reanalysis assumed 100% RDI given pharmacies are likely to dispense the full quantity noted in the prescription for oral therapies. Drug wastage was assumed for all subsequent treatments in the sponsor’s submitted model and this was not revised in the CADTH reanalysis.
CADTH was unable to address the following concerns raised from stakeholder input:
The cost-effectiveness of encorafenib in combination with binimetinib compared to immunotherapies was not feasible given the lack of direct or indirect clinical evidence.
Fatigue was not an AE that has been accounted for within the submitted economic evaluation. In the COLUMBUS trial, fatigue was reported in 28.6% (all grades) and 2.1% (grades 3 and 4) of patients treated with encorafenib in combination with binimetinib (all grades).1 As the sponsor only included grade 3 and 4 AEs with an incidence of at least 5%, fatigue was omitted from their economic analysis.
The costs of screening (i.e., echocardiogram or multigated acquisition scan) and management of tumour lysis syndrome, specific to the encorafenib in combination with binimetinib regimen, were not captured in the sponsor’s submitted model. In the COLUMBUS trial, no patients on encorafenib in combination with binimetinib reported experiencing tumour lysis syndrome.
Economic Review
The current review is for encorafenib in combination with binimetinib for patients with unresectable or metastatic melanoma with a BRAF V600 mutation.
Economic Evaluation
Summary of Sponsor's Economic Evaluation
Overview
The sponsor submitted a cost-utility analysis comparing costs and outcomes for encorafenib in combination with binimetinib for the treatment of BRAF V600 mutation-positive unresectable or advanced melanoma.2 Comparators included targeted therapies such as vemurafenib monotherapy, trametinib in combination with dabrafenib, and cobimetinib in combination with vemurafenib.2 The modelled population was in line with the reimbursement request and Health Canada–approved indication.3,4
Encorafenib is available as 75 mg capsules, while binimetinib is available as 15 mg tablets. The recommended dosage is encorafenib 450 mg (i.e., six 75 mg capsules) taken once a day in combination with binimetinib 45 mg (three 15 mg tablets) twice a day.3,4 The per cycle cost of encorafenib was estimated to be $7,661 and, when used in combination with binimetinib, the total regimen cost per cycle was $13,046.2 Within the sponsor’s submitted model, the total regimen costs per cycle for vemurafenib monotherapy, trametinib in combination with dabrafenib, and cobimetinib in combination with vemurafenib were $6,679, $15,170, and $15,211, respectively. The sponsor included drug wastage and considered RDI in the drug cost calculation.2
The clinical outcome was QALYs and life-years (LYs). The economic analysis was undertaken over a time horizon of 20 years from the perspective of a Canadian publicly funded health care system. Costs and QALYs were discounted at a rate of 1.5% per annum.2
Model Structure
The sponsor submitted a partitioned survival model with 3 health states: progression-free, post-progression, and death (Appendix 3; Figure 1).2 The proportion of patients who were progression-free, who experienced progressive disease, or who were deceased at any time over the model horizon was derived from non-mutually exclusive survival curves. All patients entered the progression-free state and were assumed to receive treatments until disease progression and/or the development of treatment-limiting, treatment-related AEs. Patients could discontinue treatment but remain in the progression-free health state based on the TTD curve and, upon discontinuation, the cost of treatment would no longer be incurred. At the end of each monthly cycle, the proportion of patients with progressive disease or death was derived based on the area under the survival curves. Specifically, OS was partitioned to estimate the proportion of patients in the death state, while the PFS was partitioned to estimate the proportion of patients in the progression-free health state. The difference between the OS curve and PFS curve was partitioned at each time point to estimate the proportion of patients in the post-progression health state.2 Disease progression was determined based on blind tumour assessment according to Response Evaluation Criteria in Solid Tumours Version 1.1.2
Model Inputs
The modelled population reflected the baseline patient characteristics of the COLUMBUS trial, a multi-centre, randomized, open-label, 3-arm, phase III trial that compared the efficacy and safety of encorafenib in combination with binimetinib to vemurafenib monotherapy and encorafenib monotherapy in patients with locally advanced, unresectable or metastatic melanoma with BRAF V600 mutation.1 The submitted model assumed a mean age of 55 years, mean body surface area of 1.92 m2, mean weight of 80.43 kg, and an average height of 171.25 cm.2
PFS, OS, and TTD curves for encorafenib in combination with binimetinib and vemurafenib monotherapy were generated using patient-level data from the COLUMBUS trial (data cut-off date: November 2017).2 Prior to 44 months, OS was based on the Kaplan-Meier data from the COLUMBUS trial; thereafter, OS was informed by mortality hazard rates from American Joint Committee on Cancer (AJCC) melanoma registry.2 As the AJCC melanoma registry reflects the state of therapies for unresectable or metastatic melanoma up to 2009, the sponsor further adjusted OS based on applying a hazard ratio (HR) of 0.42 (95% confidence interval, 0.25 to 0.73; P < 0.001) to incorporate the effect of newer therapies on survival. This HR was based on a comparison of hazard rates between nivolumab and dacarbazine from the CheckMate 066 trial.5 PFS was informed directly from the Kaplan-Meier data where such data were available; thereafter, a generalized gamma model was fitted to patient-level data to inform long-term extrapolation.2 This distribution was selected based on clinical validity and statistical fit. Comparative efficacy of encorafenib in combination with binimetinib versus trametinib in combination with dabrafenib and versus cobimetinib in combination with vemurafenib were derived from a sponsor’s submitted fixed-effect Bayesian NMAs with vemurafenib as the anchor treatment.6 The sponsor’s NMA pooled data from the COLUMBUS, coBRIM, and COMBI-v trials.
The model accounted for AEs grade 3 or higher in at least 5% of patients receiving encorafenib in combination with binimetinib or vemurafenib monotherapy within the COLUMBUS trial.2 The frequency of AEs for trametinib in combination with dabrafenib and cobimetinib in combination with vemurafenib were informed by their respective product monographs.
State and treatment-specific health utility values were based on a post hoc analysis of the COLUMBUS trial’s EuroQol 5-Dimensions 5-Levels questionnaire data, which were adapted to the Canadian population using Canadian tariffs. The sponsor used generalized estimating equations to derive utility scores for each health state, with coefficients for Eastern Cooperative Oncology Group Performance Status, AJCC cancer stage, number of visits, progression status, and treatment status (on versus off any antineoplastic treatments).2 Utility scores were further adjusted to reflect declining utility with age.7 Health utility values for trametinib in combination with dabrafenib and cobimetinib in combination with vemurafenib were assumed to be equal to those estimated for encorafenib in combination with binimetinib.2
Costs included drug (acquisition, administration, subsequent treatments), health state, AEs, and terminal care. Drug prices were obtained from the Ontario Ministry of Health and the IQVIA DeltaPA pricing tool8 with dosage based on the COLUMBUS trial1 or on previous health technology assessment reports,9,10 with drug wastage assumed. Treatment duration for encorafenib in combination with binimetinib and vemurafenib monotherapy were similarly estimated using a piecewise approach in which Kaplan-Meier data from the COLUMBUS trial were used where available, and long-term extrapolation based on a log-logistic distribution was applied thereafter.2 Treatment duration for other BRAF-targeted combination therapies was assumed to be the same as encorafenib in combination with binimetinib. Drug administration costs included costs associated with vial administration for IV therapies and dispensing fees for oral drugs.2 Subsequent treatment costs were estimated based on the weighted average utilization of subsequent treatments observed in the COLUMBUS trial,1 multiplied by the unit cost of each treatment and its expected duration based on a previous National Institute for Health and Care Excellence Health Technology Assessment report.9 The distribution of subsequent treatment for encorafenib in combination with binimetinib arm was assumed to also apply to other BRAFi/MEKi-targeted combination therapies. The treatment distribution was assumed consistent for those who discontinued in the progression-free state and for those who enter the post-progression state.2 The model also considered health state costs, including medical consultations, hospitalizations, examinations, and procedures sourced from Ontario and Quebec databases. Costs for each AE were obtained from the Ontario Case Costing Initiative database.11 Terminal care costs were applied to patients who transitioned to the “death” health state, based on a study by Yu et al., which reported both direct and societal end-of-life care costs associated with home and hospital care for palliative care for cancer patients in Ontario.12
Summary of Sponsor's Economic Evaluation Results
All analyses were run probabilistically with 5,000 iterations with the deterministic and probabilistic results being similar.2 The probabilistic findings are presented below. The submitted analyses were based on the publicly available prices of the comparator treatments.
Base-Case Results
In the sponsor's base-case analysis, encorafenib in combination with binimetinib was associated with an incremental cost-effectiveness ratio (ICER) of $167,182 per QALY compared to vemurafenib monotherapy over a 20-year time horizon (Table 3). Cobimetinib in combination with vemurafenib and trametinib in combination with dabrafenib were dominated by encorafenib in combination with binimetinib (i.e., encorafenib in combination with binimetinib was less costly and more effective than alternative BRAFi/MEKi combination therapies). At a willingness-to-pay value of $50,000 per QALY, the probability of encorafenib in combination with binimetinib being cost-effective was 0.04% compared to vemurafenib monotherapy.2
The main cost driver was drug cost, followed by progression-free health state costs and subsequent treatment costs. At the end of the model time horizon (i.e., 20 years), 17.2% of patients in the model were still alive. A breakdown of the sponsor-submitted results for the base-case population by trial duration and extrapolated period shows that 72.4% of the expected QALY gains come from the time beyond the trial period.
Table 3: Summary of the Sponsor's Economic Evaluation Results
Drug | Total costs ($) | Total QALYs | Sequential ICER ($/QALY) |
|---|---|---|---|
Vemurafenib monotherapy | $256,578 | 3.21 | Ref. |
Encorafenib + binimetinib | $583,022 | 5.17 | $167,182 |
Cobimetinib + vemurafenib | $647,679 | 4.01 | Dominated |
Trametinib + dabrafenib | $651,102 | 4.59 | Dominated |
ICER = incremental cost-effectiveness ratio; QALY = quality-adjusted life-year; Ref. = reference.
Source: Sponsor's pharmacoeconomic submission.2
Sensitivity and Scenario Analysis Results
The sponsor performed scenario analyses by excluding RDI or drug wastage, applying equal utility scores for all treatments, deriving utility scores from the European Organisation for Research and Treatment of Cancer Quality of Life Questionnaire Core 30, assuming equal efficacy for all comparators, using local review of PFS data (as opposed to central review), and applying the best-fit curves to predict PFS, OS, and TTD data.2 Encorafenib in combination with binimetinib consistently dominated cobimetinib in combination with vemurafenib and trametinib in combination with dabrafenib in all scenarios. Compared to vemurafenib monotherapy, the estimated ICERs of encorafenib in combination with binimetinib ranged between $166,758 (exclusion of drug wastage) and $213,077 (assumption of equal efficacy) per QALY.2 Key drivers of the cost-effectiveness results included changes in the approaches informing comparative efficacy parameters (i.e., applying the best-fit curve) and excluding RDI.
CADTH Appraisal of the Sponsor's Economic Evaluation
CADTH identified several key limitations to the sponsor's analysis that have notable implications on the economic analysis.
Exclusion of clinical meaningful comparators and inclusion of an irrelevant comparator. As noted in the CADTH clinical review, clinical experts noted that encorafenib in combination with binimetinib could either be used in first or subsequent lines of therapy. In such instances, targeted therapies (i.e., dabrafenib in combination with trametinib or cobimetinib in combination with vemurafenib) are not the only therapies considered current standard of care as immunotherapy constitutes another treatment option that is available in all provinces. These immunotherapies include pembrolizumab, ipilimumab monotherapy, nivolumab monotherapy, or nivolumab in combination with ipilimumab. Immunotherapies are therefore considered to be relevant comparators within this economic analysis although the sponsor's submitted economic analysis did not consider them as comparators.
Concerns were further raised about the inclusion of vemurafenib monotherapy as a comparator. According to clinical experts, targeted therapies are generally used in combination due to superior efficacy and better tolerability. In current Canadian practice, there are few exceptions when vemurafenib monotherapy would be considered in this patient population. This is further aligned with the input received from clinician groups who noted that vemurafenib monotherapy is rarely used. Indeed, the sponsor’s submitted budget impact analysis (BIA) assumed 0% of patients would be receiving vemurafenib within the reference scenario. As such, vemurafenib is not considered to be an appropriate comparator within the economic analysis.
CADTH was unable to address the limitation regarding the omission of immunotherapies due to the lack of direct and indirect evidence on their relative safety and efficacy compared to encorafenib in combination with binimetinib. Most of the immunotherapy regimens are cheaper than encorafenib in combination with binimetinib in terms of their annual drug costs (Appendix 1). CADTH removed vemurafenib monotherapy from the list of comparators in its reanalysis. As the clinical experts further noted that approximately 5% of the time patients would be prescribed vemurafenib monotherapy, CADTH conducted a scenario analysis including vemurafenib monotherapy as a comparator.
Comparative clinical efficacy is highly uncertain. Cobimetinib in combination with vemurafenib and trametinib in combination with dabrafenib were considered as comparators in the sponsor’s submitted economic evaluation. However, there have been no head-to-head trials studying encorafenib in combination with binimetinib compared to other BRAFi/MEKi-targeted regimens. Due to the lack of a direct head-to-head comparison, the sponsor derived the relative efficacy of encorafenib in combination with binimetinib and other BRAFi/MEKi-targeted therapies from their submitted NMA.6 In addition, the CADTH clinical review identified several other published NMAs. Despite differences in methodologies and data cuts used between the sponsor’s submitted NMA and the NMAs identified by CADTH’s clinical review (e.g., Consoli et al. and Wu et al.),13,14 each NMA was found to reach the same conclusion that there were no statistically significant differences between the 3 BRAKi/MEKi combination treatments for unresected or metastatic melanoma for OS and PFS outcomes. The limited data suggests that encorafenib in combination with binimetinib likely has comparable efficacy to dabrafenib in combination with trametinib and vemurafenib in combination with cobimetinib, for both OS and PFS outcomes. However, this conclusion is associated with considerable uncertainty and the estimated HRs from the NMAs are highly uncertain and imprecise due to unclear and/or incomplete reporting of NMA methods, small or sparse network size, and the unknown influence of effective post-progression treatments, especially on the observed OS outcome.
The results of the sponsor-submitted NMA indicated that there were no statistically significant differences between encorafenib in combination with binimetinib and either dabrafenib in combination with trametinib or vemurafenib in combination with cobimetinib for the outcomes of OS and PFS.6 Clinical experts consulted by CADTH noted that it is likely that encorafenib in combination with binimetinib is as effective as the other BRAFi/MEKi-targeted therapies, despite the uncertainties in the sponsor’s NMA methods. CADTH therefore attempted to address this limitation in its reanalysis by assuming no difference in the clinical efficacy between BRAFi/MEKi-targeted therapies (i.e., HRs for OS and PFS = 1).
Structural uncertainty from partitioned survival models in accounting for the impact of subsequent therapies. The sponsor used a 3-health state-partitioned survival model to simulate costs and QALYs of patients receiving each treatment option.2 Although this modelling technique is commonly used in pCODR submissions, a partitioned survival model may not accurately represent the treatment pathway experienced by patients with BRAF-mutated melanoma. Patients can experience progressions after treatment and this modelling approach does not transparently account for costs and health outcomes (QALYs and potential health utility decrements) associated with subsequent therapies. As such, the validity of the survival estimates used within partitioned survival models are dependent on the validity of the subsequent therapies in which patients received during the trials. As noted, the subsequent therapies received by patients in the targeted combination therapy trials were deemed to not be reflective of Canadian clinical practice according to the CADTH clinical report. For instance, in the COLUMBUS trial, ipilimumab would not be used as a second-line treatment and the proportion of patients receiving a combination of ipilimumab and nivolumab as second-line treatments was expected to be higher than the rates observed in the trial (i.e., 4.7%).1 The use of a partitioned survival model is therefore an inappropriate modelling approach that introduces further uncertainty in the estimated cost-effectiveness results.
CADTH was unable to address this limitation given the submitted model structure. The submitted model is not sufficiently transparent to capture the clinical and cost outcomes of patients who progress after the first-line treatments and the impact of subsequent therapy. It remains unclear how costs and clinical outcomes may differ if patients who have progressed were receiving subsequent therapy that better reflected Canadian clinical practice. The sponsor’s model predicted that patients who progress following treatment by encorafenib in combination with binimetinib would have 2.86 discounted LYs.
Outdated clinical input parameters. The sponsor derived PFS, OS, and TTD data for encorafenib in combination with binimetinib and vemurafenib monotherapy from the COLUMBUS trial based on a data cut-off date of November 2017.2 Although more recent data (November 2018 and November 2019 data cuts) were available, the sponsor was unable to provide more recent clinical estimates based on these later data cut-off points. The implication of using outdated data is unknown but it does introduce greater uncertainty in the extrapolation period. This is particularly concerning as 72.4% of the expected incremental QALYs come from the time beyond the trial data cut-off date.
CADTH had requested that the sponsor submit a revised economic evaluation based on the more recent data, but the sponsor declined and justified that the updated efficacy and safety data were not ready. As such, CADTH was unable to address this limitation in its reanalysis.
Additional limitations were identified, but were not considered to be key limitations:
Uncertainty associated with utility values used in the model. The sponsor derived treatment- and state-specific utility values from a post hoc analysis of the COLUMBUS trial.2 The use of treatment-specific utility values is not appropriate as it lacks transparency and face validity. Indeed, the CADTH Guidelines for the Economic Evaluation of Health Technologies: Canada recommends that utilities should reflect the health state within the model.15 Differences by treatment should be transparently modelled and justified. Although it may be reasonable to expect a lower quality of life in patients on vemurafenib monotherapy in the pre-progression health state due to treatment-related differences, such differences should be transparently documented. In the post-progression health state, clinical experts consulted by CADTH advised that the quality of life of patients is unlikely to depend on the type of primary treatment received. Rather, they would expect their quality of life to be identical when in this health state. It is, therefore, inappropriate to assign a different post-progression utility value based on the prior treatment option as assumed in the sponsor’s economic model (BRAFi/MEKi-targeted therapy:0.80; vemurafenib monotherapy: 0.68). The clinical experts also advised that the utility value of 0.80 in the post-progression health state was too optimistic for patients who received targeted therapy.
As CADTH base-case reanalysis removes vemurafenib monotherapy as a comparator, this was considered a minor limitation as health state utilities were identical across targeted combination therapies. CADTH performed a scenario analysis whereby the post-progression health utility value for patients was assumed to be equal to the utility estimate of the post-progression patients receiving vemurafenib monotherapy.
Inappropriate adjustment of costs according to dose intensity. The sponsor adjusted drug costs proportionally to the dose received in their respective clinical trials, referred to as the RDI.2 This practice likely underestimated the total expenditure associated with all oral-based regimens. For oral treatments, Canadian pharmacies are likely to dispense the full quantity of medication for each treatment cycle and excess tablets are unlikely to be recuperated. The cost of medication is therefore independent of any dose reductions observed in the trial during the course of the treatment.
As part of CADTH’s reanalysis, treatment dose intensity was adjusted to be 100% for oral treatments.
Additionally, the sponsor made the following key assumptions and have been appraised by CADTH (Table 4).
Table 4: Key Assumptions of the Submitted Economic Evaluation
Sponsor's key assumption | CADTH comment |
|---|---|
Characteristics of the modelled population were based on participants of the COLUMBUS trial.1 | Acceptable. Baseline characteristics of the COLUMBUS trial participants were generalizable to Canadian patients with BRAF V600 mutation-positive unresectable or metastatic melanoma. |
OS was adjusted by mortality hazard rates from the AJCC melanoma registry data and the CheckMate 066 trial.2 | Acceptable. The adjustment was performed to address a concern raised by the NICE Evidence Review Groups on the potential underestimation of OS given the rate of deaths was extrapolated based on within-trial time trends that may increase with ongoing disease progression. In practice, this rate is expected to plateau if all or most patients have progressed. This assumption was considered acceptable by clinical experts consulted by CADTH. CADTH tested the uncertainty associated with this assumption by using alternative survival models to predict OS data. |
The sponsor assumed a class effect for BRAFi/MEKi- targeted therapies. Treatment duration, health utility scores, and the proportion of patients receiving subsequent antineoplastic treatments after discontinuation of primary treatment in patients receiving encorafenib in combination with binimetinib were assumed equal for other BRAFi/MEKi-targeted combination therapies.2 | This assumption was considered acceptable by clinical experts consulted by CADTH. |
A one-off disutility value was included in the model upon progression.2 | Inappropriate. Including an additional one-off disutility upon progression would double count the impact of disease progression on health utility because the sponsor has already incorporated post-progression utility within the model. However, a one-off disutility value is unlikely to impact the results given the short-term duration to which this disutility is applied. CADTH performed a scenario analysis excluding this one-off disutility value. |
Drug wastage was assumed for first-line and subsequent treatments. The wastage was applied to both oral and IV drugs.2 | Acceptable. |
A one-time BRAF testing cost of $389.95 was assumed.16 | Clinical experts consulted by CADTH advised that BRAF testing has already been part of usual care, and this is aligned with public drug plan input. As this test was applied to all comparators, the inclusion of the testing cost is unlikely to influence the estimated ICERs. CADTH performed a scenario analysis removing the one-time BRAF testing cost. |
AJCC = American Joint Committee on Cancer; BRAFi = BRAF inhibitor; ICER = incremental cost-effectiveness ratio; MEKi = MEK inhibitor; NICE = National Institute for Health and Care Excellence; OS = overall survival.
CADTH Reanalyses of the Economic Evaluation
Base-Case Results
Several limitations with the sponsor's submitted economic model could not be adequately addressed due to data limitations and the model structure (i.e., the omission of clinically meaningful comparators, lack of head-to-head comparative clinical data, inability to account for the expected impact of subsequent treatment distribution, and uncertainty in the extrapolation given short-term clinical data informing the economic model).
CADTH's reanalyses was derived by making the following changes to the model: excluding vemurafenib monotherapy from the list of comparators; assuming equal OS, PFS, and TTD curves for all BRAFi/MEKi-targeted combination therapies; and assuming a 100% RDI for all oral medications. It should be noted for consistency across drug reviews that dispensing fees were removed as part of the CADTH reanalyses.
Table 5 details each change made to derive the CADTH reanalysis, which was conducted in a stepwise approach to the sponsor's base case to highlight each change's impact. The summary results of the CADTH base-case reanalysis are presented in Table 6 while the disaggregated results of the CADTH reanalysis are presented in Table 10. Results from CADTH's revised base case suggests that encorafenib in combination with binimetinib dominated other BRAFi/MEKi combination therapies because this regimen was less costly (encorafenib in combination with binimetinib: $633,406 versus $675,449 [cobimetinib in combination with vemurafenib] and $684,588 [trametinib in combination with dabrafenib]) but produced the same QALYs (5.16). The interpretation of this finding is contingent on the acceptability of the assumption that the relative efficacy across targeted therapies is identical. The predicted QALYs were identical to 2 decimal places, despite the fact that CADTH reanalysis did not change the AE profile between the targeted therapies. This is due to the fact that AEs had a minor impact contributing to the QALY estimates. Although the CADTH reanalyses suggest encorafenib in combination with binimetinib is optimal, it is important to note that the analyses are based on publicly listed price and a different conclusion may be reached if confidential effective price was employed.
Table 5: CADTH Revisions to the Submitted Economic Evaluation
Stepped analysis | Sponsor's value or assumption | CADTH value or assumption |
|---|---|---|
Corrections to sponsor's base case | ||
1. Remove dispensing fee | $8.83 | $0.00 |
Changes to derive the CADTH base case | ||
1. Vemurafenib monotherapy | Included | Excluded |
2. Comparative efficacy of BRAFi/MEKi | Based on HRs estimated from the NMA | HR = 1 |
3. RDI for oral drugs | Based on the COLUMBUS trial | 100% |
CADTH base case | 1 + 2 + 3 | |
BRAFi = BRAF inhibitor; HR = hazard ratio; MEKi = MEK inhibitor; NMA = network meta-analysis; RDI = relative dose intensity.
Table 6: Summary of the Stepped Analysis of the CADTH Reanalysis Results
Stepped analysis | Drug | Total costs ($) | Total QALYs | ICER ($/QALYs) |
|---|---|---|---|---|
Sponsor's base case | Vemurafenib monotherapy | 256,578 | 3.21 | Reference |
Encorafenib + binimetinib | 583,022 | 5.17 | 167,182 | |
Cobimetinib + vemurafenib | 647,679 | 4.01 | Dominated | |
Trametinib + dabrafenib | 651,102 | 4.59 | Dominated | |
Sponsor's corrected base case | Vemurafenib monotherapy | 256,076 | 3.21 | Ref. |
Encorafenib + binimetinib | 583,676 | 5.17 | 167,793 | |
Cobimetinib + vemurafenib | 649,248 | 4.02 | Dominated | |
Trametinib + dabrafenib | 652,931 | 4.64 | Dominated | |
CADTH reanalysis 1. Removal of vemurafenib monotherapy | Encorafenib + binimetinib | 583,022 | 5.17 | Ref. |
Cobimetinib + vemurafenib | 647,679 | 4.01 | Dominated | |
Trametinib + dabrafenib | 651,102 | 4.59 | Dominated | |
CADTH reanalysis 2. HRs of PFS and OS for BRAFi/MEKi | Vemurafenib monotherapy | 256,157 | 3.21 | Ref. |
Encorafenib + binimetinib | 583,163 | 5.16 | 167,274 | |
Cobimetinib + vemurafenib | 651,233 | 5.16 | Dominated | |
Trametinib + dabrafenib | 654,156 | 5.16 | Dominated | |
CADTH reanalysis 3. 100% RDI for oral drugs | Vemurafenib monotherapy | 273,348 | 3.22 | Ref. |
Encorafenib + binimetinib | 633,014 | 5.15 | 186,461 | |
Cobimetinib + vemurafenib | 669,474 | 4.01 | Dominated | |
Trametinib + dabrafenib | 684,724 | 4.64 | Dominated | |
CADTH base case (Reanalysis 1 + 2 + 3) | Encorafenib + binimetinib | 633,406 | 5.16 | Ref. |
Cobimetinib + vemurafenib | 675,449 | 5.16 | Dominated | |
Trametinib + dabrafenib | 684,588 | 5.16 | Dominated |
BRAFi = BRAF inhibitor; HR = hazard ratio; ICER = incremental cost-effectiveness ratio; MEKi = MEK inhibitor; OS = overall survival; PFS = progression-free survival; QALY = quality-adjusted life-year; RDI = relative dose intensity.
Note: The submitted results were based on the publicly available price of the comparator treatments.
Scenario Analysis Results
Based on CADTH's base case, a series of scenario analyses were conducted. These scenario analyses explored the impact of the following model parameters and assumptions: inclusion of vemurafenib monotherapy as a comparator; alternate survival distributions to extrapolate OS, PFS, and TTD data after the end of the trial cut-off data; alternate health utility values for the post-progression health state; removal of one-off progression disutility; omission of BRAF testing cost; alternate relative efficacy estimate for BRAFi/MEKi combination treatments based on the sponsor’s NMA; and adopting a societal perspective.
Scenario analyses demonstrated that the results were sensitive to the inclusion of vemurafenib monotherapy as a comparator (Appendix 4, Table 11). This scenario was conducted on the CADTH base case with the assumption that the health state utility value for encorafenib in combination with binimetinib would be identical to the health state utility values for vemurafenib monotherapy. Under this scenario, encorafenib in combination with binimetinib was no longer the dominant strategy as vemurafenib monotherapy was both less costly and less effective. The ICER of encorafenib in combination with binimetinib was $232,689 per QALY when compared to vemurafenib monotherapy. The ICER estimated by CADTH was higher than the sponsor’s estimate primarily due to the removal of treatment-specific utilities.
Cost-effectiveness findings were found to be robust to changes in input parameters; encorafenib in combination with binimetinib remained dominant in all scenarios (Appendix 4, Table 11). It should be noted that the expected QALYs were highly sensitive to the type of survival models used to predict OS beyond the trial follow-up ranging from 5.16 to 2.80. Similarly, if post-progression health utility values were assumed to be equal across comparators, the expected QALYs were reduced from 5.16 to 4.82. The type of survival models used to predict TTD after the trial was a key driver for the expected costs.
CADTH undertook a price-reduction analysis based on the sponsor's base case (Table 7 and Appendix 4, Table 12). Cautious interpretation of the price-reduction analysis in the sponsor’s base case is required given vemurafenib monotherapy was included as a comparator. In this instance, a price reduction of both encorafenib and binimetinib by at least 57% was required for the ICER of encorafenib in combination with binimetinib to be cost-effective. Price reduction of individual drugs (i.e., price reduction applied to only encorafenib or binimetinib) are presented in Table 12. Price-reduction analyses were not conducted on the CADTH base case given encorafenib in combination with binimetinib was already dominant at the submitted price.
Table 7: CADTH Price-Reduction Analyses
ICERs for encorafenib + binimetinib vs. comparators | |
|---|---|
Price reduction | Sponsor base case |
No price reduction | If WTP < $167,182/QALY, vemurafenib monotherapy is optimal. If WTP > $167,182/QALY, encorafenib + binimetinib are optimal. |
20% | If WTP < $125,042/QALY, vemurafenib monotherapy is optimal. If WTP > $125,042/QALY, encorafenib + binimetinib are optimal. |
40% | If WTP < $83,560/QALY, vemurafenib monotherapy is optimal. If WTP > $83,560/QALY, encorafenib + binimetinib are optimal. |
57% | If WTP < $48,654/QALY, vemurafenib monotherapy is optimal. If WTP > $48,654/QALY, encorafenib + binimetinib are optimal. |
ICER = incremental cost-effectiveness ratio; QALY = quality-adjusted life-year; vs. = versus; WTP = willingness to pay.
Issues for Consideration
Encorafenib is also currently under review by CADTH for the treatment of patients with metastatic colorectal cancer with a recommendation expected to be issued in May 2021.
Although the tablet formulation may improve convenience for patients, the oral route of administration may limit access to treatment and introduce financial barriers for patients in jurisdictions where oral medications are not funded in the same mechanisms as IV oncology regimens. Additionally, some patients may not adhere to the treatment regimen due to pill burden, as patients needed to take 12 tablets per day. The impact of adherence on the economic evaluation was not considered.
CADTH was unable to assess the impact of potentially lower prices of comparators on the economic results. Thus, it is unknown if lowered effective price of comparators, arising from confidential pricing negotiations such as product listing agreements, would lead to differing conclusions than the current analysis that is based on the list price of the branded drugs.
Clinical experts consulted in this review advised that encorafenib in combination with binimetinib could be used in either first or subsequent lines of therapy. This decision depends on the patients' history, comorbidities, and risk of side effects.
The Health Canada indication for encorafenib in combination with binimetinib includes all V600 mutations. This is broader than the COLUMBUS study population which recruited patients only with V600E or V600K mutations. According to the clinical experts consulted, majority of mutations at amino acid 600 are BRAF V600E. Others may include V600 D and V600M which have not been studied in the COLUMBUS trial. As the economic analysis was based on clinical inputs from the COLUMBUS study, it is unclear if subgroup effects exist by type of mutation.
Overall Conclusions
The COLUMBUS trial suggested that encorafenib in combination with binimetinib was associated with significant improvement in PFS and OS compared to vemurafenib monotherapy. Both the sponsor base case and CADTH scenario analysis suggested that, when compared to vemurafenib monotherapy, encorafenib in combination with binimetinib would not be cost-effective. Specifically, under the sponsor’s base case, a 57% price reduction on both encorafenib and binimetinib would be required in order for this regimen to be cost-effective at $50,000 per QALY. However, vemurafenib monotherapy may not be an appropriate comparator according to clinical experts consulted by CADTH given it is rarely used in Canadian practice since targeted combination therapy is associated with improved clinical response and patient tolerability.
Evidence from the sponsor’s NMA and the additional NMAs identified in CADTH’s clinical review found no statistically significant differences between the 3 BRAFi/MEKi combination treatments for unresected or metastatic melanoma; however, these findings were imprecise and had considerable uncertainty due to unclear and/or incomplete reporting on NMA methods, small or sparse networks, and the unknown influence of effective post-progression treatments on the observed results, particularly for the OS outcome. As such, any analyses based on these indirect clinical data must be viewed with caution. CADTH's base case attempted to address some of the limitations by: excluding vemurafenib monotherapy as a comparator; assuming equivalent comparative efficacy (i.e., OS and PFS) and TTD for all BRAFi/MEKi combination treatments; and setting RDI to be 100% for all oral medications. Consequently, in CADTH's base case, encorafenib in combination with binimetinib dominated other BRAFi/MEKi combination treatments at available list prices because this regimen is associated with lower total costs of $633,406 (versus cobimetinib in combination with vemurafenib = $675,449; trametinib in combination with dabrafenib = $684,588) but produced the same QALYs (5.16). The interpretation of CADTH reanalysis relies on confidence in the assumption that the relative efficacy across targeted therapies is identical given that no direct clinical evidence exists comparing encorafenib in combination with binimetinib to targeted treatments. Drug acquisition cost was a key driver of the cost estimates although these predicted cost savings may not be realized if the actual price of comparators is lower than the list prices used in the analysis.
Although the cost-effectiveness findings were robust to changes in input parameters and model assumptions, the findings should be interpreted with caution as there exist several limitations that could not be addressed in the CADTH's base case and scenario analyses. CADTH was unable to address several key limitations due to data limitations and constraints introduced by the submitted model structure. Uncertainties remain to the extrapolation given the comparative efficacy estimates failed to account for the impact of subsequent therapies that would be reflective of real-world Canadian clinical practice and outdated clinical estimates were used to inform the economic model. The cost-effectiveness of encorafenib in combination with binimetinib compared to immunotherapies is unknown as immunotherapies were not considered by the sponsor. Based on the sponsor’s submitted price, some immunotherapy regimens are less expensive than encorafenib in combination with binimetinib in terms of their average annual drug costs.
References
1.Dummer R, Ascierto PA, Gogas HJ, et al. Overall survival in patients with BRAF-mutant melanoma receiving encorafenib plus binimetinib versus vemurafenib or encorafenib (COLUMBUS): a multicentre, open-label, randomised, phase 3 trial. Lancet Oncol. 2018;19(10):1315-1327. PubMed
2.Pharmacoeconomic evaluation [internal sponsor's report]. In: Drug Reimbursement Review sponsor submission: Braftovi (encorafenib), 75 mg oral capsules, with Mektovi (binimetinib), 15 mg oral tablets Kirkland (QC): Pfizer Canada ULC; 2021 Jan 21.
3.Braftovi (encorafenib): 75 mg oral capsules [product monograph]. Kirkland (QC): Pfizer Canada ULC; 2021 Mar 30.
4.Mektovi (binimetinib): 15 mg oral capsules [product monograph]. Kirkland (QC): Pfizer Canada ULC; 2020 Mar 09.
5.Robert C, Long GV, Brady B, et al. Nivolumab in previously untreated melanoma without BRAF mutation. N Engl J Med. 2015;372(4):320-330. PubMed
6.Network Meta-analyses of Systemic Treatments for BRAF-positive Advanced or Metastatic Melanoma. Technical Report Version 2.1 [internal sponsor's report]. In: Drug Reimbursement Review sponsor submission: Braftovi (encorafenib), 75 mg oral capsules, with Mektovi (binimetinib), 15 mg oral tablets. Kirkland (QC): Pfizer Canada ULC; 2020 Nov 07.
7.Kind P, Hardman G, Macran S. UK population norms for EQ-5D: discussion paper 172. York (UK): Centre of Health Economics, University of York; 1999: https://www.york.ac.uk/media/che/documents/papers/discussionpapers/CHE%20Discussion%20Paper%20172.pdf. Accessed 2021 Apr 21.
8.DeltaPA. Ottawa (ON): IQVIA; 2021: https://www.iqvia.com/. Accessed 2021 Feb 15.
9.National Institute for Health and Care Excellence. Trametinib in combination with dabrafenib for treating unresectable or metastatic melanoma (Technology appraisal guidance TA396) 2016; https://www.nice.org.uk/guidance/ta396/resources/trametinib-in-combination-with-dabrafenib-for-treating-unresectable-or-metastatic-melanoma-pdf-82602913532101. Accessed 2021 Apr 21.
10.National Institute for Health and Care Excellence. Cobimetinib in combination with vemurafenib for treating unresectable or metastatic BRAF V600 mutationpositive melanoma (Technology appraisal guidance TA414) 2016; https://www.nice.org.uk/guidance/ta414/resources/cobimetinib-in-combination-with-vemurafenib-for-treating-unresectable-or-metastatic-braf-v600-mutationpositive-melanoma-pdf-82604603225797. Accessed 2021 Apr 21.
11.Ontario Case Costing Initiative (OCCI). Toronto (ON): Ontario Health and Long-Term Care; 2017: https://data.ontario.ca/dataset/ontario-case-costing-initiative-occi. Accessed 2021 Feb 15.
12.Yu M, Guerriere DN, Coyte PC. Societal costs of home and hospital end-of-life care for palliative care patients in Ontario, Canada. Health Soc Care Community. 2015;23(6):605-618. PubMed
13.Consoli F, Bersanelli M, Perego G, et al. Network indirect comparison of 3 BRAF + MEK inhibitors for the treatment of advanced BRAF mutated melanoma. Clin Transl Oncol. 2020;22(6):900-907. PubMed
14.Wu J, Das J, Kalra M, Ratto B. Comparative efficacy of dabrafenib + trametinib versus treatment options for metastatic melanoma in first-line settings. J Comp Eff Res. 2021;10(4):267-280. PubMed
15.Guidelines for the economic evaluation of health technologies: Canada. 4th ed. Ottawa (ON): CADTH; 2017: https://www.cadth.ca/dv/guidelines-economic-evaluation-health-technologies-canada-4th-edition. Accessed 2021 Mar 01.
16.Institut national d'excellence en santé et en services sociaux. Analyse combinée des gènes KRAS-NRAS-BRAF par séquençage de nouvelle génération pour le traitement du cancer colorectal métastatique. Montreal (QC): INESSS; 2018: https://www.inesss.qc.ca/fileadmin/doc/INESSS/Analyse_biomedicale/Mars_2018/INESSS_Avis_Analyse-combinee-genes-KRAS-NRAS-BRAF.pdf. Accessed 2021 Apr 21.
17.Drug Reimbursement Review sponsor submission: Braftovi (encorafenib), 75 mg oral capsules, with Mektovi (binimetinib), 15 mg oral tablets [internal sponsor's package]. Kirkland (QC): Pfizer Canada ULC; 2021 Jan 08.
18.CCO Formulary. DABRTRAM (dabrafenib-trametinib) [regimen monograph]. Toronto (ON): Cancer Care Ontario (CCO); 2019: https://www.cancercareontario.ca/sites/ccocancercare/files/DABRTRAM_LU_NSC_P.pdf. Accessed 2021 Apr 21.
19.CCO Formulary. COBIVEMU (cobimetinib-vemURAfenib) [regimen monograph]. Toronto (ON): Cancer Care Ontario (CCO); 2019: https://www.cancercareontario.ca/sites/ccocancercare/files/COBIVEMU_SKIN_ME_P.pdf. Accessed 2021 Apr 21.
20.CCO Formulary. Keytruda (pembrolizumab) [product monograph]. Toronto (ON): Cancer Care Ontario (CCO); 2020: https://www.cancercareontario.ca/system/files_force/pembrolizumab.pdf. Accessed 2021 Apr 21.
21.CADTH pCODR Expert Review Committee (pERC) final recommendation: pembrolizumab (Keytruda). Ottawa (ON): CADTH; 2020 Dec 22: https://cadth.ca/sites/default/files/pcodr/Reviews2020/10216PembrolizumabHNSCC_FnRec_EC22Dec2020_final.pdf. Accessed 2021 Apr 21.
22.CCO Formulary. Opdivo (nivolumab) [product monograph]. Toronto (ON): Cancer Care Ontario (CCO); 2020: https://www.cancercareontario.ca/system/files_force/nivolumab.pdf. Accessed 2021 Apr 21.
23.CCO Formulary. Yervoy (ipilimumab) [product monograph]. Toronto (ON): Cancer Care Ontario (CCO); 2019: https://www.cancercareontario.ca/system/files_force/ipilimumab.pdf. Accessed 2021 Apr 21.
24.CCO Formulary. NIVL+IPIL regimen: nivolumab-ipilimumab. Toronto (ON): Cancer Care Ontario (CCO); 2020: https://www.cancercareontario.ca/sites/ccocancercare/files/NIVLIPIL_ME.pdf. Accessed 2021 Apr 21.
25.CADTH pCODR Expert Review Committee (pERC) initial recommendation: nivolumab (Opdivo). Ottawa (ON): CADTH; 2021 Jan 08: https://www.cadth.ca/sites/default/files/pcodr/Reviews2020/10218Nivolumab-IpilimumabNSCLC_InRec_pERC%20Chair%20Approved_REDACT_Post08Jan2021_final.pdf. Accessed 2021 Apr 21.
26.Budget Impact Analysis [internal sponsor's report]. In: Drug Reimbursement Review sponsor submission: Braftovi (encorafenib), 75 mg oral capsules, with Mektovi (binimetinib), 15 mg oral tablets. Kirkland (QC): Pfizer Canada ULC; 2021 Jan 08.
Appendix 1: Cost Comparison Table
Note that this appendix has been formatted and has not been copy-edited.
The comparators presented in the following table have been deemed to be appropriate based on feedback from clinical experts and the Provincial Advisory Group (PAG). Comparators may be recommended (appropriate) practice or actual practice. Existing product listing agreements are not reflected in the table and as such, the table may not represent the actual costs to public drug plans.
Table 8: CADTH Cost Comparison Table for Unresectable or Metastatic Melanoma with a BRAF V600 Mutation
Treatment | Strength | Form | Price ($) | Recommended dosage | Cost per treatment course ($) | Average annual cost ($) | |
|---|---|---|---|---|---|---|---|
Encorafenib (BRAFTOVI)a in combination with Binimetinib (MEKTOVI)b | |||||||
Encorafenib | 75 mg | Capsule | 50.2500c | 450 mg daily | 8,442 | 110,048 | |
Binimetinib | 15 mg | Tablet | 36.5000c | 45 mg twice daily | 6,132 | 79,935 | |
Encorafenib in combination with Binimetinib | 14,574 | 189,983 | |||||
Targeted therapies (BRAF/MEK inhibitors) | |||||||
Dabrafenib in combination with trametinib (Dabrtram)d | |||||||
Dabrafenib | 50 mg 75 mg | Capsule | 44.8775 67.3165 | 150 mg twice daily | 7,539 | 98,282 | |
Trametinib | 0.5 mg 2 mg | Tablet | 76.9840 307.9380 | 2 mg daily | 8,622 | 112,397 | |
Dabrafenib (TAFINLAR) in combination with trametinib (MEKINIST) | 16,162 | 210.678 | |||||
Cobimetinib in combination with vemurafenib (Cobivemu)e | |||||||
Cobimetinib | 20 mg | Tablet | 125.1025 | 60 mg daily for 21 days | 7,881 | 102,740 | |
Vemurafenib | 240 mg | Tablet | 35.5539 | 960 mg twice daily | 7,964 | 103,817 | |
Vemurafenib (ZELBORAF) in combination with cobimetinib (COTELLIC) | 15,846 | 206,558 | |||||
Immunotherapies | |||||||
Pembrolizumab | 25 mg/mL | IV infusion 4 mL | 4,400.0000 | 200 mg, every 21 daysf | 8,800 | 152,952 | |
Nivolumab | 10 mg/mL | IV infusion 4 mL 10mL | 782.2200 1,955.5600 | 3 mg/kg, every 2 weeks or 480 mg IV, every 4 weeksg | 4,693 | 122,362 | |
Ipilimumab | 5 mg/mL | IV infusion 10 mL | 5,800.0000 | 3 mg/kg, every 3 weeks, for a total of 4 dosesh | 29,000 | 116,000 | |
Nivolumab in combination with ipilimumab (NIVIL + IPIL)i,j | |||||||
Nivolumab | 10 mg/mL | IV infusion 4 mL 10 mL | 782.2200 1,955.5600 | Combination phase (4 cycles): 1 mg/kg every 3 weeksi Monotherapy phase: 3 mg/kg every 2 weeks or 240 mg every 2 weeks or 480 mg every 4 weeks j | Combination phase: 1,564 Monotherapy phase: 4,693 | Year 1: 100,459 Year 2 + : 122,362 | |
Ipilimumab | 5 mg/mL | IV infusion 10 mL | 5,800.0000 | Combination phase (4 cycles): 3 mg/kg, every 3 weeksk | Combination phase: 29,000 | Year 1: 116,000 | |
Nivolumab in combination with ipilimumab (NIVIL + IPIL) | Combination phase: 30,564 Monotherapy phase: 4,693 | Year 1: 216,459 Year 2 + : 122,362 | |||||
Note: All prices are from the Ontario Exceptional Access Program (accessed February 2021), unless otherwise indicated, and do not include dispensing fees. CADTH assumed 76 kg, for calculations, where required.
aTreatment course assumed to follow a 28-day cycle frequency. Drug may be administered until disease progression or toxicity as per sponsor-submitted draft product monograph for Braftovi3
bTreatment course assumed to follow a 28-day cycle frequency. Drug may be administered until disease progression or toxicity as per sponsor-submitted draft product monograph for Mektovi}4
cSponsor-submitted price.17
dTreatment course assumed to follow a 28-day cycle frequency. Drug administered for 12 months until disease progression or toxicity as per CCO regimen for dabrafenib in combination with trametinib.18
eAnnual costs for vemurafenib in combination with cobimetinib calculated based on 28-day cycle frequency. Drug may be administered until disease progression or toxicity as per CCO regimen for cobimetinib in combination with vemurafenib.19
fAs per CCO product monograph for pembrolizumab20 and drug costs obtained from CADTH review on Pembrolizumab.21 Cycle cost based on 21-day cycle frequency.
gUntil disease progression or toxicity as per CCO regimen for nivolumab monotherapy22 Cycle cost based on 21-day cycle frequency.
hAs per CCO regimen for ipilimumab monotherapy23 Cycle cost based on 21-day cycle frequency.
iAs per CCO regimen for nivolumab plus ipilimumab24 and drug costs obtained from pCODR review for nivolumab in combination with ipilimumab and 2 cycles of platinum-based chemotherapy.25
jCycle cost in the combination phase based on 21-day and 14 days for monotherapy phase. Nivolumab maintenance treatment follows combination treatment with nivolumab plus ipilimumab.24
Appendix 2: Submission Quality
Note that this appendix has been formatted and has not been copy-edited.
Description | Yes/No | Comments |
|---|---|---|
Population is relevant, with no critical intervention missing, and no relevant outcome missing | No | See CADTH appraisal section regarding inappropriate comparators within the economic analysis. |
Model has been adequately programmed and has sufficient face validity | Yes | Acceptable. |
Model structure is adequate for decision problem | No | See CADTH appraisal section. |
Data incorporation into the model has been done adequately (e.g., parameters for probabilistic analysis) | No | PFS, OS and TTD are outdated (data cut-off date: November 2017). There is the lack of direct evidence on comparative efficacy of BRAFi/MEKi-targeted therapies. See CADTH appraisal section. |
Parameter and structural uncertainty were adequately assessed; analyses were adequate to inform the decision problem | Yes | Acceptable. |
The submission was well organized and complete; the information was easy to locate (clear and transparent reporting; technical documentation available in enough details) | Yes | Acceptable. |
PFS = progression-free survival; OS = overall survival; TTD = time-to-treatment discontinuation.
Appendix 3: Additional Information on the Submitted Economic Evaluation
Note that this appendix has been formatted and has not been copy-edited.
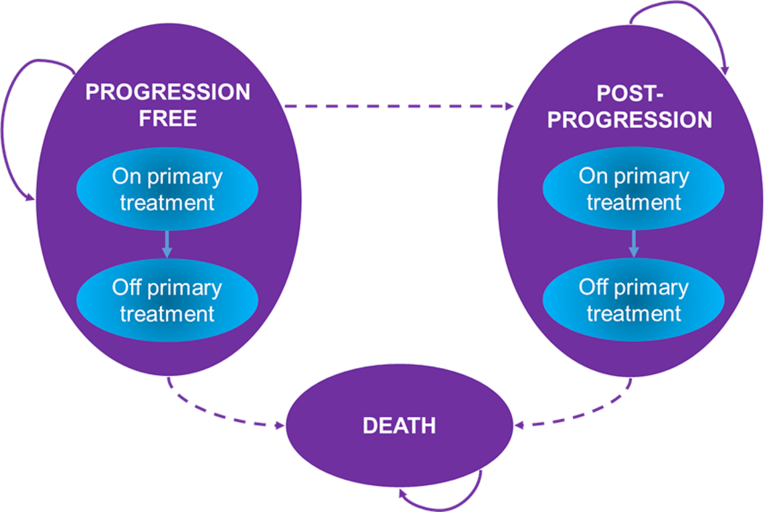
Appendix 4: Additional Details on the CADTH Reanalyses and Sensitivity Analyses of the Economic Evaluation
Note that this appendix has been formatted and has not been copy-edited.
Table 10: Disaggregated Summary of CADTH's Economic Evaluation Results
Treatment | Component | Value | Incremental (vs. reference) | Incremental (sequential) |
|---|---|---|---|---|
Discounted LYs | ||||
Encorafenib + binimetinib | Pre-progression | 3.53 | NA | NA |
Post-progression | 2.86 | NA | NA | |
Total | 6.39 | NA | NA | |
Vemurafenib + cobimetinib | Pre-progression | 3.53 | 0.00 | 0.00 |
Post-progression | 2.86 | 0.00 | 0.00 | |
Total | 6.39 | 0.00 | 0.00 | |
Dabrafenib + trametinib | Pre-progression | 3.53 | 0.00 | 0.00 |
Post-progression | 2.86 | 0.00 | 0.00 | |
Total | 6.39 | 0.00 | 0.00 | |
Discounted QALYs | ||||
Encorafenib + binimetinib | Pre-progression | 2.89 | NA | NA |
Post-progression | 2.27 | NA | NA | |
Total | 5.16 | NA | NA | |
Vemurafenib + cobimetinib | Pre-progression | 2.89 | 0.00 | 0.00 |
Post-progression | 2.27 | 0.00 | 0.00 | |
Total | 5.16 | 0.00 | 0.00 | |
Dabrafenib + trametinib | Pre-progression | 2.89 | 0.00 | 0.00 |
Post-progression | 2.27 | 0.00 | 0.00 | |
Total | 5.16 | 0.00 | 0.00 | |
Discounted costs ($) | ||||
Encorafenib + binimetinib | Primary treatments | $465,281 | NA | NA |
Subsequent treatments | $43,749 | NA | NA | |
Routine management and best supporting care | $109,866 | |||
AEs | $1,221 | NA | NA | |
Terminal care | $13,290 | |||
Total | $633,406 | NA | NA | |
Cobimetinib + vemurafenib | Acquisition | $505,975 | $40,594 | $40,594 |
Subsequent treatments | $43,749 | -$26 | -$26 | |
Routine management and best supporting care | $109,863 | -$3 | -$3 | |
AEs | $2,699 | $1,478 | $1,478 | |
Terminal care | $13,290 | $0 | $0 | |
Total | $675,449 | $42,043 | $42,043 | |
Trametinib + dabrafenib | Acquisition | $515,969 | $50,688 | $10,094 |
Subsequent treatments | $43,734 | -$15 | $11 | |
Routine management and best supporting care | $109,868 | $2 | -$5 | |
AEs | $1,727 | $506 | -$971 | |
Terminal care | $13,290 | $0 | $0 | |
Total | $684,588 | $51,182 | $9,139 | |
ICER vs. reference ($) | Sequential ICER ($) | |||
Encorafenib + binimetinib | Reference | Reference | ||
Cobimetinib + vemurafenib | Dominated by encorafenib + binimetinib | Dominated by encorafenib + binimetinib | ||
Trametinib + dabrafenib | Dominated by encorafenib + binimetinib | Dominated by encorafenib + binimetinib | ||
ICER = incremental cost-effectiveness ratio; LY = life-year; NA = not applicable; QALY = quality-adjusted life-year; vs. = versus.
Detailed Results of CADTH Base Case
Scenario Analyses
Based on CADTH's base case, a series of scenario analyses were conducted (Table 11).
Cost-effectiveness findings were robust to changes in input parameters with the exception of the addition of vemurafenib monotherapy as a comparator. In all other scenarios, encorafenib in combination with binimetinib remained dominant in all scenarios.
Table 11: Summary of CADTH Scenario Analyses
Drug | Total costs ($) | Total QALYs | Sequential ICER |
|---|---|---|---|
Sponsor's base case | |||
Vemurafenib monotherapy | 256,578 | 3.21 | Reference |
Encorafenib + binimetinib | 583,022 | 5.17 | $167,182 |
Cobimetinib + vemurafenib | 647,679 | 4.01 | Dominated by encorafenib + binimetinib |
Trametinib + dabrafenib | 651,102 | 4.59 | Dominated by encorafenib + binimetinib |
CADTH's base case | |||
Encorafenib + binimetinib | 633,406 | 5.16 | Reference |
Cobimetinib + vemurafenib | 675,449 | 5.16 | Dominated by encorafenib + binimetinib |
Trametinib + dabrafenib | 684,588 | 5.16 | Dominated by encorafenib + binimetinib |
CADTH's scenario analysis 1: Vemurafenib monotherapy as a comparator | |||
Vemurafenib monotherapy | 273,133 | 3.62 | Reference |
Encorafenib + binimetinib | 630,781 | 5.15 | $232,689 |
Cobimetinib + vemurafenib | 672,652 | 5.15 | Dominated by encorafenib + binimetinib |
Trametinib + dabrafenib | 681,759 | 5.15 | Dominated by encorafenib + binimetinib |
CADTH's scenario analysis 2: Using a generalized gamma distribution for OS prediction after the end of the trial | |||
Encorafenib + binimetinib | 623,242 | 3.74 | Reference |
Cobimetinib + vemurafenib | 665,175 | 3.74 | Dominated by encorafenib + binimetinib |
Trametinib + dabrafenib | 674,273 | 3.74 | Dominated by encorafenib + binimetinib |
CADTH's scenario analysis 3: Using a Weibull distribution for OS prediction after the end of the trial | |||
Encorafenib + binimetinib | 575,905 | 2.80 | Reference |
Cobimetinib + vemurafenib | 614,565 | 2.80 | Dominated by encorafenib + binimetinib |
Trametinib + dabrafenib | 622,803 | 2.80 | Dominated by encorafenib + binimetinib |
CADTH's scenario analysis 4: Using a gamma distribution for PFS prediction after the end of the trial | |||
Encorafenib + binimetinib | 648,239 | 5.16 | Reference |
Cobimetinib + vemurafenib | 690,339 | 5.16 | Dominated by encorafenib + binimetinib |
Trametinib + dabrafenib | 699,447 | 5.16 | Dominated by encorafenib + binimetinib |
CADTH's scenario analysis 5: Using an exponential distribution for PFS prediction after the end of the trial | |||
Encorafenib + binimetinib | 646,422 | 5.13 | Reference |
Cobimetinib + vemurafenib | 688,346 | 5.13 | Dominated by encorafenib + binimetinib |
Trametinib + dabrafenib | 697,438 | 5.13 | Dominated by encorafenib + binimetinib |
CADTH's scenario analysis 6: Using a log-logistic distribution for TTD prediction after the end of the trial | |||
Encorafenib + binimetinib | 631,881 | 5.15 | Reference |
Cobimetinib + vemurafenib | 673,874 | 5.15 | Dominated by encorafenib + binimetinib |
Trametinib + dabrafenib | 682,952 | 5.15 | Dominated by encorafenib + binimetinib |
CADTH's scenario analysis 7: Using a gamma distribution for TTD prediction after the end of the trial | |||
Encorafenib + binimetinib | 511,419 | 5.19 | Reference |
Cobimetinib + vemurafenib | 544,344 | 5.19 | Dominated by encorafenib + binimetinib |
Trametinib + dabrafenib | 551,158 | 5.19 | Dominated by encorafenib + binimetinib |
CADTH's scenario analysis 8: Assuming the same post-progression health utility across treatment options | |||
Encorafenib + binimetinib | 632,144 | 4.82 | Reference |
Cobimetinib + vemurafenib | 674,121 | 4.82 | Dominated by encorafenib + binimetinib |
Trametinib + dabrafenib | 683,248 | 4.82 | Dominated by encorafenib + binimetinib |
CADTH's scenario analysis 9: Removing a one-off health utility decrement due to progression | |||
Encorafenib + binimetinib | 633,613 | 5.17 | Reference |
Cobimetinib + vemurafenib | 675,789 | 5.17 | Dominated by encorafenib + binimetinib |
Trametinib + dabrafenib | 684,847 | 5.17 | Dominated by encorafenib + binimetinib |
CADTH's scenario analysis 10: Removing a one-off BRAF testing cost | |||
Encorafenib + binimetinib | 630,839 | 5.16 | Reference |
Cobimetinib + vemurafenib | 672,755 | 5.16 | Dominated by encorafenib + binimetinib |
Trametinib + dabrafenib | 681,857 | 5.16 | Dominated by encorafenib + binimetinib |
CADTH's scenario analysis 11: Using the relative efficacy from the sponsor’s submitted NMA | |||
Encorafenib + binimetinib | 632,285 | 5.19 | Reference |
Cobimetinib + vemurafenib | 668,818 | 4.04 | Dominated by encorafenib + binimetinib |
Trametinib + dabrafenib | 683,800 | 4.63 | Dominated by encorafenib + binimetinib |
CADTH's scenario analysis 12: Societal perspective | |||
Encorafenib + binimetinib | 647,883 | 5.16 | Reference |
Cobimetinib + vemurafenib | 689,915 | 5.16 | Dominated by encorafenib + binimetinib |
Trametinib + dabrafenib | 699,030 | 5.16 | Dominated by encorafenib + binimetinib |
ICER = incremental cost-effectiveness ratio; NMA = network meta-analysis; PFS = progression-free survival; OS = overall survival; TTD = time to discontinuation; QALY = quality-adjusted life-year.
Table 12: CADTH Price-Reduction Analyses on Sponsor Base Case
Price reduction | Price reduction for encorafenib only | Price reduction for binimetinib only |
|---|---|---|
ICERs for encorafenib + binimetinib vs. comparators | ||
No price reduction | If WTP < $167,182 /QALY, vemurafenib monotherapy is optimal. If WTP > $167,182 /QALY, encorafenib + binimetinib are optimal. | |
20% | If WTP < $142,445/QALY, vemurafenib monotherapy is optimal. If WTP > $142,445/QALY, encorafenib + binimetinib are optimal. | If WTP < $151,148/QALY, vemurafenib monotherapy is optimal. If WTP > $151,148/QALY, encorafenib + binimetinib are optimal. |
40% | If WTP < $116,114/QALY, vemurafenib monotherapy is optimal. If WTP > $ 116,114/QALY, encorafenib + binimetinib are optimal. | If WTP < $133,014/QALY, vemurafenib monotherapy is optimal. If WTP > $133,014/QALY, encorafenib + binimetinib are optimal. |
60% | If WTP < $93,549/QALY, vemurafenib monotherapy is optimal. If WTP > $93,549/QALY, encorafenib + binimetinib are optimal. | If WTP < $ 117,450 /QALY, vemurafenib monotherapy is optimal. If WTP > $117,450 /QALY, encorafenib + binimetinib are optimal. |
80% | If WTP < $68,717 /QALY, vemurafenib monotherapy is optimal. If WTP > $68,717 /QALY, encorafenib + binimetinib are optimal. | If WTP < $98,498/QALY, vemurafenib monotherapy is optimal. If WTP > $98,498/QALY, encorafenib + binimetinib are optimal. |
96% | If WTP < $49,559/QALY, vemurafenib monotherapy is optimal. If WTP > $49,559/QALY, encorafenib + binimetinib are optimal. | If WTP < $85,913/QALY, vemurafenib monotherapy is optimal. If WTP > $85,913/QALY, encorafenib + binimetinib are optimal. |
ICER = incremental cost-effectiveness ratio; vs. = versus ; WTP = willingness to pay; QALY = quality-adjusted life-year.
Appendix 5: Submitted BIA and CADTH Appraisal
Note that this appendix has been formatted and has not been copy-edited.
Table 13: Summary of Key Takeaways
Key Take-aways of the BIA |
|---|
|
Summary of Sponsor’s BIA
In the submitted BIA, the sponsor assessed the introduction of encorafenib in combination with binimetinib for adult patients with unresectable or metastatic cutaneous melanoma with a BRAF V600 mutation. The BIA was undertaken from the perspective of the Canadian drug plans over a 3-year time horizon. The sponsor estimated the eligible population size using an epidemiological approach by leveraging data from multiple sources in the literature and assumptions based on clinical expert input. In the reference scenario, the sponsor assumed that patients would be eligible to receive dabrafenib plus trametinib, cobimetinib plus vemurafenib. In the new drug scenario, encorafenib in combination with binimetinib was assumed to displace dabrafenib plus trametinib and cobimetinib plus venmurafenib.26
The sponsor’s base case considered drug acquisition costs, pharmacy/mark-up costs and dispensing fees, as well as costs of subsequent treatment. Median duration of therapy for encorafenib in combination with binimetinib was approximately 12.5 months and was assumed to be the same for the other targeted combination therapies. The proportion of patients on subsequent therapies and the distribution of subsequent therapy was aligned with the approach in the cost-utility analysis with no difference assumed across targeted combination therapies Two separate scenario analyses were provided by the sponsor including the cost of BRAF testing and the drug-related costs of managing AEs.26
Key inputs to the BIA are documented in Table 14.
Table 14: Summary of Key Model Parameters
Parameter | Sponsor’s estimate (reported as year 1 / year 2 / year 3 if appropriate) |
|---|---|
Target population | |
Incidence of cutaneous melanoma in Canada | 0.0259% |
Relative increase in the incidence of cutaneous melanoma per year in Canada | 2.44% |
Proportion of patients diagnosed at an unresectable or metastatic stage | 5% |
Proportion receiving BRAF test (metastatic) | 100% |
Proportion with a BRAF mutation (metastatic) | 50% |
Proportion of patients diagnosed at an early stage | 95% |
Proportion diagnosed at an early. stage progressing to an unresectable or metastatic stage | 33.33% |
Proportion receiving BRAF test (early stage) | 100% |
Proportion with a BRAF mutation (early stage) | 50% |
Proportion of patients with (diagnosed or progressed) unresectable or metastatic cancer with BRAF mutation receiving first-line treatment | 90% |
Proportion receiving BRAF-targeted therapy in 1 L | 22% |
Proportion receiving second-line treatment | 50% |
Proportion receiving BRAF-targeted therapy in 2 L | 40% |
Number of patients eligible for drug under review | 328 / 341 / 353 |
Market uptake (3 years) | |
Uptake (reference scenario) Dabrafenib + trametinib Cobimetinib + vemurafenib | 91% / 91% / 91% 9% / 9% / 9% |
Uptake (new drug scenario) Encorafenib + binimetinib Dabrafenib + trametinib Cobimetinib + vemurafenib |
|
Cost of treatment (per patient) | |
Cost of treatment per montha with RDI Encorafenib + binimetinib Encorafenib Binimetinib Dabrafenib + trametinib Dabrafenib Trametinib Cobimetinib + vemurafenib Cobimetinib Vemurafenib | $6,661 $9,171 $8,190 $9,366 $8,562 $8,651 |
RDI = relative dose intensity.
aRDI values differ by treatment: encorafenib (0.91); binimetinib (0.88); trametinib (0.92); dabrafenib (0.96); cobimetinib (0.97); vemurafenib (0.95).26
Summary of the Sponsor’s BIA Results
Results of the sponsor’s base case suggested that the introduction of encorafenib in combination with binimetinib in patients with unresectable or metastatic cutaneous melanoma with a BRAF V600 mutation would result in a cost savings of $6,697,250 in year 1; $7,249,356 in year 2, and $7,523,861 in year 3, from Canadian public payers’ perspective. This translated into the total cumulative budget savings of -$21,470,467 over the 3-year time horizon.26
CADTH Appraisal of the Sponsor’s BIA
CADTH identified several key limitations to the sponsor’s analysis that have notable implications on the results of the BIA:
Exclusion of clinically meaningful comparator. The sponsor assumed that targeted therapies (i.e., dabrafenib in combination with trametinib or cobimetinib in combination with vemurafenib) are the current standard of care.26 As noted in the CADTH clinical review, clinical experts noted that immunotherapies including pembrolizumab, ipilimumab monotherapy, nivolumab monotherapy, or nivolumab in combination with ipilimumab, are also available treatments for BRAF mutation-positive unresectable or metastatic melanoma. However, the sponsor excluded all immunotherapies from the submitted BIA. As such, there remains uncertainty with the estimated incremental budget impact of introducing encorafenib in combination with binimetinib in the current treatment landscape.
CADTH was unable to address this limitation. However, most of the immunotherapy regimens are cheaper than encorafenib in combination with binimetinib in terms of their annual drug costs.
Drug costs adjusted according to RDI. The sponsor calculated drug costs proportionally to the relative dosing intensity used in the COLUMBUS trial,26 which likely underestimated the total expenditure associated with all oral-based regimens. Given that Canadian pharmacies are likely to dispense the full quantity of medication for each treatment cycle, the cost of medication should reflect the full course of treatment rather than dose reductions observed in the trial.
As part of CADTH’s reanalysis, treatment dose intensity was adjusted to be 100% for oral treatments, to align with the model inputs in the pharmacoeconomic analysis.
Use of incident population to estimate the market size. The sponsor used an incident rather than a prevalent population as part of their methodological approach. The prevalent population may be more appropriate as it would include patients who are currently being treated for the condition and who would be eligible for treatment. Although the final identified target population estimate seemed to be reasonable to CADTH’s clinical experts, uncertainty remains with the estimated population size.
CADTH was unable to address this limitation. CADTH conducted scenario analyses to vary the target population by +/−10%.
CADTH Reanalyses of the BIA
A table noting the changes made to the sponsor’s BIA as part of CADTH reanalysis is available in Table 16.
Table 15: CADTH Revisions to the Submitted Budget Impact Analysis
Stepped analysis | Sponsor’s value or assumption | CADTH value or assumption |
|---|---|---|
Corrections to sponsor’s base case | ||
None | ||
Changes to derive the CADTH base case | ||
1. Relative dosing intensity for oral drugs | According to the values in the COLUMBUS trial: Encorafenib + binimetinib: Encorafenib = 91% Binimetinib = 88 Trametinib + dabrafenib Trametinib = 92 Dabrafenib = 96% Cobimetinib + vemurafenib Cobimetinib = 97% Vemurafenib = 95% | 100% for all treatments |
CADTH base case | Reanalysis 1 | |
Applying these changes resulted in a lower predicted savings under the drug plan program perspective. From the drug plan program perspective, 3-year total costs were estimated as a savings of $15,733,868 under the assumption that encorafenib in combination with binimetinib would only displace targeted therapies. Costs in the BIA are based on publicly available prices. The results of the CADTH stepwise reanalysis are presented in summary format in Table 16 and a more detailed breakdown is presented in Table 17.
Table 16: Summary of the CADTH Reanalyses of the BIA
Stepped analysis | Three-year total | |
|---|---|---|
Drug costs only | Drug plan perspectivea | |
Submitted base case | -$2,425,548 | -$21,470,467 |
CADTH reanalysis 1 | -$14,968,137 | -$15,733,868 |
CADTH base case | -$14,968,137 | -$15,733,868 |
BIA = budget impact analysis.
aIncludes drug costs, subsequent treatment costs, dispensing fees, and markups.
CADTH also conducted additional scenario analyses to address the remaining uncertainty regarding the potential size of the eligible population:
Assessed the impact of a 10% increase in the population size.
Assessed the impact of a 10% decrease in the population size.
Clinical experts consulted by CADTH noted that the proportion and distribution of patients on subsequent therapy lacked face validity although, given this was assumed identical across targeted combination therapy, this was not expected to impact the BIA. To demonstrate this, CADTH revised the proportion of patients who would receive subsequent antineoplastic treatment from 40% to 60% and revised the proportion of patients assigned to subsequent therapy (i.e., pembrolizumab: 28%, nivolumab: 17%, chemotherapy: 40%, ipilimumab + nivolumab: 15%) to align with the experts’ feedback.
Included the cost of BRAF testing and drug-related costs of managing AEs.
In all scenario analyses, encorafenib in combination with binimetinib was associated with cost savings. As the sponsor’s submitted BIA did not include immunotherapy regimens, the estimated cost savings may not be realized given most immunotherapy regimens are less expensive than encorafenib in combination with binimetinib. Furthermore, drug prices were based on publicly listed prices; if the confidential price of targeted therapies are lower than the list price, this may not result in the savings reported here.
Table 17: Detailed Breakdown of the CADTH Reanalyses of the BIA
Stepped analysis | Scenario | Year 1 | Year 2 | Year 3 | Three-year total (including markups and fees) |
|---|---|---|---|---|---|
Submitted base case | Reference | $83,995,569 | $87,178,959 | $90,481,818 | $261,656,346 |
New drug | $77,298,319 | $79,929,603 | $82,957,957 | $240,185,879 | |
Budget impact | -$6,697,250 | -$7,249,356 | -$7,523,861 | -$21,470,467 | |
CADTH base case | Reference | $88,494,240 | $91,847,833 | $95,327,484 | $275,669,557 |
New drug | $83,586,399 | $86,535,400 | $89,813,890 | $259,935,689 | |
Budget impact | -$4,907,841 | -$5,312,433 | -$5,513,594 | -$15,733,868 | |
CADTH scenario analysis: Increase population size by 10% | Reference | $88,494,240 | $91,847,833 | $95,327,484 | $275,669,557 |
New drug | $83,586,399 | $86,535,400 | $89,813,890 | $259,935,689 | |
Budget impact | -$4,907,841 | -$5,312,433 | -$5,513,594 | -$15,733,868 | |
CADTH scenario analysis: Decrease population size by 10% | Reference | $88,494,240 | $91,847,833 | $95,327,484 | $275,669,557 |
New drug | $83,586,399 | $86,535,400 | $89,813,890 | $259,935,689 | |
Budget impact | -$4,907,841 | -$5,312,433 | -$5,513,594 | -$15,733,868 | |
CADTH scenario analysis: Revisions to subsequent therapy | Reference | $88,438,689 | $91,790,160 | $95,267,626 | $275,496,475 |
New drug | $83,530,847 | $86,477,727 | $89,754,032 | $259,762,607 | |
Budget impact | -$4,907,841 | -$5,312,433 | -$5,513,594 | -$15,733,868 | |
CADTH scenario analysis: Costs of BRAF testing and adverse events | Reference | $89,820,196 | $93,196,431 | $96,699,615 | $279,716,243 |
New drug | $84,775,809 | $87,742,279 | $91,038,924 | $263,557,012 | |
Budget impact | -$5,044,387 | -$5,454,153 | -$5,660,691 | -$16,159,231 |
BIA = budget impact analysis.
ISSN: 2563-6596
Disclaimer: The information in this document is intended to help Canadian health care decision-makers, health care professionals, health systems leaders, and policy-makers make well-informed decisions and thereby improve the quality of health care services. While patients and others may access this document, the document is made available for informational purposes only and no representations or warranties are made with respect to its fitness for any particular purpose. The information in this document should not be used as a substitute for professional medical advice or as a substitute for the application of clinical judgment in respect of the care of a particular patient or other professional judgment in any decision-making process. The Canadian Agency for Drugs and Technologies in Health (CADTH) does not endorse any information, drugs, therapies, treatments, products, processes, or services.
While care has been taken to ensure that the information prepared by CADTH in this document is accurate, complete, and up-to-date as at the applicable date the material was first published by CADTH, CADTH does not make any guarantees to that effect. CADTH does not guarantee and is not responsible for the quality, currency, propriety, accuracy, or reasonableness of any statements, information, or conclusions contained in any third-party materials used in preparing this document. The views and opinions of third parties published in this document do not necessarily state or reflect those of CADTH.
CADTH is not responsible for any errors, omissions, injury, loss, or damage arising from or relating to the use (or misuse) of any information, statements, or conclusions contained in or implied by the contents of this document or any of the source materials.
This document may contain links to third-party websites. CADTH does not have control over the content of such sites. Use of third-party sites is governed by the third-party website owners’ own terms and conditions set out for such sites. CADTH does not make any guarantee with respect to any information contained on such third-party sites and CADTH is not responsible for any injury, loss, or damage suffered as a result of using such third-party sites. CADTH has no responsibility for the collection, use, and disclosure of personal information by third-party sites.
Subject to the aforementioned limitations, the views expressed herein are those of CADTH and do not necessarily represent the views of Canada’s federal, provincial, or territorial governments or any third-party supplier of information.
This document is prepared and intended for use in the context of the Canadian health care system. The use of this document outside of Canada is done so at the user’s own risk.
This disclaimer and any questions or matters of any nature arising from or relating to the content or use (or misuse) of this document will be governed by and interpreted in accordance with the laws of the Province of Ontario and the laws of Canada applicable therein, and all proceedings shall be subject to the exclusive jurisdiction of the courts of the Province of Ontario, Canada.
The copyright and other intellectual property rights in this document are owned by CADTH and its licensors. These rights are protected by the Canadian Copyright Act and other national and international laws and agreements. Users are permitted to make copies of this document for non-commercial purposes only, provided it is not modified when reproduced and appropriate credit is given to CADTH and its licensors.
About CADTH: CADTH is an independent, not-for-profit organization responsible for providing Canada’s health care decision-makers with objective evidence to help make informed decisions about the optimal use of drugs, medical devices, diagnostics, and procedures in our health care system.
Funding: CADTH receives funding from Canada’s federal, provincial, and territorial governments, with the exception of Quebec.