CADTH Reimbursement Review
Larotrectinib (Vitrakvi)
Sponsor: Bayer Inc.
Therapeutic area: Solid tumours with NTRK gene fusion
This multi-part report includes:
Clinical Review
Pharmacoeconomic Review
Clinical Review
Abbreviations
AE
adverse event
ALK
anaplastic lymphoma kinase
ALT
alanine transaminase
AST
aspartate aminotransferase
BHM
Bayesian hierarchical model
BOR
best overall response
BSA
body surface area
CBCN
Canadian Breast Cancer Network
CBR
clinical benefit rate
CCC
Colorectal Cancer Canada
CCSN
Canadian Cancer Survivor Network
CGOEN
Canadian Gastrointestinal Oncology Evidence Network
CI
confidence interval
CLIA
Clinical Laboratory Improvement Amendment
CMN
cellular congenital mesoblastic nephroma
CNS
central nervous system
CR
complete response
CRC
colorectal cancer
DAC
drug advisory committee
DCR
disease control rate
DLT
dose-limiting toxicity
DOR
duration of response
ECOG
Eastern Cooperative Oncology Group
EGFR
epidermal growth factor receptor
EORTC QLQ-C30
European Organisation for Research and Treatment of Cancer Quality of Life Questionnaire Core 30
ePAS
extended primary analysis set
ePAS4
extended primary analysis set 4
ePAS5
extended primary analysis set 5
EQ-5D-5L
EuroQol 5-Dimensions 5-Levels questionnaire
FAS
full analysis set
FISH
fluorescence in situ hybridization
GBM
glioblastoma multiforme
GHS
global health score
GIST
gastrointestinal stromal tumour
GMI
Growth Modulation Index
HGG
high-grade glioma
HRQoL
health-related quality of life
IFS
infantile fibrosarcoma
IHC
immunohistochemistry
IRC
independent review committee
KPS
Karnofsky Performance Scale
LCC
Lung Cancer Canada
LGG
low-grade glioma
LPS
Lansky Performance Scale
MASC
mammary analogue secretory carcinoma
MID
minimal importance difference
MSI
microsatellite instability
MTD
maximum tolerated dose
NE
not estimable
NGS
next-generation sequencing
NICE
National Institute for Health and Care Excellence
NSCLC
non–small cell lung carcinoma
NTRK
neurotrophic tyrosine receptor kinase
OH-CCO
Ontario Health Cancer Care Ontario
ORR
overall response rate
OS
overall survival
PAG
Provincial Advisory Group
PAS
primary analysis set
pCODR
CADTH pan-Canadian Oncology Drug Review
PedsQL
Pediatric Quality of Life Inventory
pERC
CADTH pan-Canadian Oncology Drug Review Expert Committee
PFS
progression-free survival
PR
partial response
QoL
quality of life
RANO
Response Assessment in Neuro-Oncology
RECIST 1.1
Response Evaluation Criteria in Solid Tumours Version 1.1
ROS1
ROS proto-oncogene 1
RWE
real-world evidence
SAE
serious adverse event
SAS3
safety analysis set 3
SBC
secretory breast carcinoma
SCFC
Sarcoma Cancer Foundation of Canada
SD
standard deviation
STS
soft tissue sarcoma
TEAE
treatment-emergent adverse event
TRK
tropomyosin receptor kinase
TTBR
time to best response
TTPF
time to progression or treatment failure
TTR
time to tumour response
Executive Summary
An overview of the submission details for the drug under review is provided in Table 1.
Item | Description |
|---|---|
Drug product | Larotrectinib (Vitrakvi); 25 mg and 100 mg capsules (as larotrectinib sulphate) and 20 mg/mL oral solution (as larotrectinib sulphate) |
Indication | For the treatment of adult and pediatric patients with solid tumours that:
|
Reimbursement request | As per indication |
Health Canada approval status | NOC with conditions |
Health Canada review pathway | Advanced consideration under NOC/c |
NOC date | July 10, 2019 |
Sponsor | Bayer Inc. |
NOC = Notice of Compliance; NOC/c = Notice of Compliance with conditions, NTRK = neurotrophic tyrosine receptor kinase.
Introduction
The neurotrophic tyrosine receptor kinase genes, NTRK, encode the neurotrophin family of receptors.1 Fusion of NTRK genes results from chromosomal rearrangements, which pre-clinical data indicates lead to constant activation of downstream signalling pathways without the need for ligands.2 Although reported to be prevalent in 0.28% of all solid cancers, NTRK oncogenic fusions are observed at variable frequencies across a spectrum of pediatric and adult cancers, depending in part on the number of patients screened and NTRK fusion–detection techniques.1 In Canadian adults, the 3 most common cancer diagnoses are lung, colorectal, and breast cancer.3 Childhood cancer accounts for less than 1% of all new cancer cases in Canada. Brain and central nervous system (CNS) cancers account for 19% of cancers and 34% of deaths, while neuroblastoma and other peripheral nervous cell tumours account for 11% of deaths.4 NTRK fusions are generally less prevalent in common cancers (approximately 0.1% to 1% in non–small cell lung cancer [NSCLC]5-7 and 2% to 3% in sporadic colorectal cancers [CRCs5]), although NTRK fusion is more common in certain colorectal tumours with high levels of microsatellite instability (MSI)8,9 and in primary thyroid cancers (6%).10 In contrast, NTRK fusions are nearly ubiquitous among rare cancer types, such as mammary analogue secretory carcinoma (MASC) and infantile fibrosarcoma (IFS).5,11 In pediatric oncology, NTRK fusions are pathognomonic of specific, rare cancers including IFS (91% to 100%)12 and cellular congenital mesoblastic nephroma (CMN) (83%).5 These fusions are also commonly observed in several other very rare pediatric cancers, including secretory breast cancer (SBC) (92%)13 and MASC of the salivary gland (100%).14 In addition, significant numbers of NTRK fusion cancers occur in children with papillary thyroid carcinoma (9.4% to 25.9%),15,16 undifferentiated sarcomas (1%; frequency in adult versus pediatric patients not specified),17 high-grade gliomas (HGGs) (7.1%),5 and inflammatory myofibroblastic tumours, but rarely in acute leukemia.18
According to the clinical experts consulted for this review, no currently reimbursed drug targets the NTRK pathway. Among adult cancers, defining accepted clinical practice is difficult as NTRK fusions can be observed in a wide variety of solid cancers. Patients with locally advanced or metastatic solid tumours are currently largely treated with standard of care (chemotherapy, immunotherapy, and/or targeted therapy) as determined by the primary disease site.19 Ultimately, many of these cancers have a poor prognosis, and patients who progress on upfront therapies will have few subsequent therapeutic options. For patients with pediatric NTRK fusion cancers that are refractory to upfront therapy, there is no standard of care at relapse.20 In addition, for infants with locally advanced, unresectable IFS, standard upfront conventional cytotoxic chemotherapy is poorly tolerated, has limited efficacy, and is associated with significant morbidity.5
Larotrectinib is an oral selective inhibitor of tropomyosin kinase receptors TrkA, TrkB, and TrkC, which are encoded by NTRK1, NTRK2, and NTRK3, respectively.21 Health Canada has issued marketing authorization for the use of larotrectinib for the treatment of adult and pediatric patients with solid tumours that have NTRK gene fusion without a known acquired resistance mutation or that are metastatic, or for whom surgical resection is likely to result in severe morbidity with no satisfactory treatment options. The marketing authorization was issued with conditions, pending the results of trials to verify its clinical benefit.21 The recommended dosage of larotrectinib in adults is 100 mg taken orally twice daily until the patient is no longer clinically benefiting from therapy or until unacceptable toxicity occurs. In pediatric patients, dosing is based on body surface area (BSA). The recommended dosage of larotrectinib in pediatric patients (1 month to 18 years of age) is 100 mg/m2 taken orally twice daily, with a maximum of 100 mg per dose, until the patient is no longer clinically benefiting from therapy or until unacceptable toxicity occurs.21
The objective of this systematic review is to assess the beneficial and harmful effects of larotrectinib (adults: 100 mg taken orally twice daily; pediatric patients: 100 mg/m2 taken orally twice daily up to a maximum of 100 mg per dose) for the treatment of adult and pediatric patients with solid tumours that have NTRK gene fusion without a known acquired resistance mutation or that are metastatic, or for whom surgical resection is likely to result in severe morbidity and who have no satisfactory treatment options.
Stakeholder Perspectives
The information in this section is a summary of input provided by the patient groups who responded to CADTH’s call for patient input and from clinical expert(s) consulted by CADTH for the purpose of this review.
Patient Input
Five patient group submissions were received for this review from prominent national patient advocacy groups, including Lung Cancer Canada (LCC), the Canadian Breast Cancer Network (CBCN), Colorectal Cancer Canada (CCC), the Sarcoma Cancer Foundation of Canada (SCFC), and the Canadian Cancer Survivor Network (CCSN). These submissions were based on information collected through surveys, interviews, literature reviews, and various patient engagement events. A total of 29 patients with NTRK fusion provided input, including 28 who received larotrectinib for their conditions. Responding patients were diagnosed at an advanced stage or had an aggressive form of rare cancer, were treated with multiple therapies with suboptimal success, and therefore needed a targeted therapy with a better efficacy and safety profile than conventional therapies. Patients as well as their caregivers reported significant negative impacts on virtually all aspects of their day-to-day life. Patients are often bound to limited physical work, resulting in limited employment opportunities; household activities and chores become difficult or impossible; and financial and personal stress becomes overwhelming, causing a significant drop in quality of life. The most important symptoms that need to be managed include pain in various parts of the body while minimizing or managing the side effects of chemotherapy treatment, fatigue and shortness (or loss) of breath, insomnia, loss of appetite, vomiting, diarrhea, wheezing, and coughing up blood. For pediatric patients, trouble swallowing and breathing, difficulty breathing, loss of appetite, and cachexia were noted as important symptoms to be managed. Overall, disease control, extension of life, improvement in quality of life (QoL), improvement of cancer and treatment-induced symptoms, longer-lasting and durable treatment, and minimal or tolerable toxicity were all noted as outcomes expected from a new therapy. Another important consideration for patients is accessibility and relative ease of administration, such that any additional burdens from travel, hospital visits, and resulting costs are minimized. Finally, a treatment that specifically targets the underlying NTRK mutation and minimizes the non-specific targeting of other tissues and organs was regarded as highly desirable.
Clinician Input
Input From Clinical Experts Consulted by CADTH
Five clinical experts from across Canada provided input for this review. Patients have unmet needs that vary by tumour type, but, in general, patients with metastatic solid malignancies eventually progress on currently available therapies. Certain tumours could be suitable candidates for larotrectinib treatment. Examples of such tumours in adults include MASC, which is a rare malignancy with a high prevalence of NTRK fusions and no established treatment options; differentiated thyroid cancer; anaplastic thyroid cancer, which has a dismal prognosis with standard cytotoxic treatments; and sarcoma with unresectable disease for which currently available chemotherapy often does not offer adequate response to facilitate surgery. In children and adolescents, this includes unresectable or metastatic IFS and soft tissue sarcoma (STS), which are chemorefractory and have no curative alternative therapy options; radioactive-iodine refractory NTRK fusion–positive thyroid cancers that require repeated invasive surgeries with no access to effective systemic therapies; unresectable and progressive/symptomatic low-grade gliomas (LGGs) that do not respond to conventional chemotherapy; several cancers with disease-related morbidity (e.g., loss of vision due to progressive optic pathway glioma) or that require multiple surgeries and ultimately radiation therapy (when old enough); and NTRK fusion HGGs that are unresectable or refractory to chemotherapy and for which no alternative curative options are available.
In both adult and pediatric patients, larotrectinib would be considered early in the course of NTRK fusion cancer treatment, even as first-line treatment for rare cancers without an effective option, or as a second-line treatment if the patient progressed on standard therapy. Examples include cancers for which no, limited, or inefficacious treatments are available, such as MASC, anaplastic thyroid cancer, or adult sarcomas with a NTRK gene fusion, IFS, pediatric unresectable or metastatic STS, NTRK fusion–positive thyroid carcinoma, unresectable and progressive/symptomatic LGG, or unresectable HGG in patients for whom radiation therapy is not possible.
Clinicians indicated that larotrectinib should be considered in adults with a good performance status and pediatric patients with advanced solid tumours that harbour an NTRK fusion. Patients with relapsed/refractory, unresectable, or metastatic NTRK fusion–positive STS (including IFS) and HGG are the patients with the greatest need. Conversely, patients with a poor performance status or those unable to tolerate oral therapies, a lack of NTRK gene fusions, or who have resectable disease would be least suitable. Response to treatment can be assessed by cross-sectional imaging modalities (MRI, CT, PET/CT) following Response Evaluation Criteria in Solid Tumours Version 1.1 (RECIST 1.1) or Response Assessment in Neuro-Oncology (RANO) criteria for CNS tumours, symptom improvement, tumour markers (thyroglobulin in differentiated thyroid cancers), treatment tolerability, and time to progression. Treatment response is typically assessed every 3 months in adult and pediatric patients; this interval may be prolonged once a response is established or remission is achieved. Treatment failure would be determined by disease progression, treatment intolerability, or patient request to discontinue treatment in adults, and if a response that facilitated curative surgery was achieved or there was objective evidence of disease progression on imaging evaluations in pediatric patients.
Clinician Group Input
A total of 9 clinician group inputs were received; all were joint clinician inputs, comprised primarily of 52 oncologists. Overall, the clinical groups shared mostly similar views as the clinical experts consulted by CADTH. Patients with advanced stages of cancer almost always fail on multiple therapies and have no or limited effective therapeutic options left. These patients would benefit most from a new treatment, particularly if it targets the underlying tumour cause, NTRK fusion in this case. While the current practice and the indication of larotrectinib is for use after all other treatment options have been exhausted, clinicians noted that larotrectinib could be prioritized in certain circumstances, depending on cancer type and underlying cause, stage, the availability of the treatment, and the efficacy and toxicity of treatment alternatives. Patients harbouring NTRK fusion were expected to be best suited for larotrectinib treatment, irrespective of the cancer type and location. Aside from NTRK status, patients with a good performance status were considered the most suitable candidates. In cases of pediatric cancers, patients with a poor prognosis were noted as suitable candidates for larotrectinib, unlike those with favourable prognosis. Conversely, the absence of NTRK fusion in adults, and children with an alternative, low-morbidity curative option would be least suitable for larotrectinib treatment. With respect to clinically meaningful response to treatment, clinician groups identified stabilization, no deterioration of symptoms, reduction in disease-related symptoms, overall reduction in tumour burden, improvement in survival, and QoL as important indicators of treatment efficacy. In pediatric cancers, clinically meaningful responses can vary, given the variety of histologies and presentations in the potential patient population. Patients initiating treatment are expected to be monitored frequently, at intervals ranging from 2 weeks up to 6 months, whereas those showing sustained responses may require assessment less frequently. Disease progression and certain unacceptable toxicities were noted as key factors when considering treatment discontinuation, which should be based on clinical status and objective progression on imaging.
Drug Program Input
Two main implementation issues were raised by the drug programs. First, the Provincial Advisory Group (PAG) inquired if larotrectinib can be used in patients with an Eastern Cooperative Oncology Group (ECOG) performance status of greater than 2, a Lansky Performance Scale (LPS) score of less than 40%, or a Karnofsky Performance Scale (KPS) score of less than 50%. Patients included in the trials (and therefore in the pooled analysis) had an ECOG status of 0 to 2, an LPS score greater than 40%, or a KPS score greater than 50%. To address the PAG’s question, the clinical experts consulted for this review indicated that patients with worse performance scores would not have been eligible for the phase I/II clinical trials, as per standard practice; however, children with worse performance scores may still benefit from larotrectinib. Second, in response to questions regarding the testing landscape, clinicians noted that testing in adults should be done at diagnosis or in a first-line treatment setting, with a provincial approach, on selected and/or enriched populations (with a known high prevalence of NTRK fusion, e.g., metastatic CRC with MLH1-promoter hypermethylation), or by incorporating NTRK testing in next-generation sequencing (NGS) for tumour sites that are routinely tested with NGS. For pediatric patients, testing depends on the diagnostic category for the underlying tumour; certain tumours (such as IFS and CMN) are routinely tested with fluorescence in situ hybridization (FISH) or NGS (for non-rhabdomyosarcoma STS) during diagnosis and can readily incorporate NTRK testing. For other tumours, molecular testing is conducted for a small subset of patients, e.g., unresectable or symptomatic or progressive radioactive-iodine refractory papillary thyroid carcinoma, which are gliomas that lack other clear oncogenic drivers. No information was provided on whether and how to incorporate NTRK testing for the latter tumour types.
Clinical Evidence
Pivotal Studies and Protocol-Selected Studies
Description of Studies
The CADTH resubmission of larotrectinib was based on a pooled analysis22 of 3 multi-centre, open-label, single-arm trials of larotrectinib in adult and pediatric patients with advanced or metastatic solid tumours: LOXO-TRK-14001 (phase I), LOXO-TRK-15003/SCOUT (phase I/II), and LOXO-TRK-15002/NAVIGATE (phase II basket trial). The trials are ongoing; the pooled analysis has been updated periodically for regulatory submissions, with updated data, larger sample sizes, and longer follow-ups at each update. The original larotrectinib submission to CADTH was based on the integrated dataset (data cut-off date: July 30, 2018).23 The current resubmission was based on the following pooled datasets, with a data cut-off date of July 15, 2019: extended primary analysis set 4 (ePAS4) (n = 164 patients with NTRK gene fusion and a non-CNS primary tumour who had an independent review committee [IRC]-assessed response), safety analysis set 3 (SAS3) (n = 24 patients with NTRK-positive primary CNS tumours who had an investigator-assessed response), patients in the health-related quality of life (HRQoL) analyses (n = 126 patients with non-CNS primary solid tumours with an NTRK gene fusion (n = 74 adults, 24 children ≥ 2 years old, and 28 infants < 2 years old) for efficacy), a tropomyosin receptor kinase (TRK) fusion cancer labelled-dose safety analysis set (n = 196 patients with TRK fusion cancer), and an overall labelled-dose safety analysis set (n = 238 patients with or without TRK fusion cancer) for safety.22 A new data cut-off at July 2020 was used to create 4 updated datasets, which were submitted before this report being finalized, and included the following: extended primary analysis set 5 (ePAS5) (n = 192 patients, the most updated dataset with the highest number of patients and follow-up data, which was an update of the ePAS4 dataset), SAS3 (n = 33, an update of the previous data cut-off point), NTRK fusion cancer safety set (n = 260, an update of the TRK fusion cancer labelled-dose safety analysis set), and an overall safety set (n = 331, an update of the overall labelled-dose safety analysis set).
Most patients in the pooled analysis were treated with larotrectinib 100 mg orally twice daily in individuals with a BSA of at least 1 m2, or 100 mg/m2 orally twice daily for children with a BSA of less than 1 m2, although some patients in the LOXO-TRK-14001 and LOXO-TRK-15003 trials received 50 mg/day to 400 mg/day and 150 mg twice daily of larotrectinib, respectively. The primary and secondary outcomes varied by trial, which was dependent on the objective, phase, and design of the trials. The primary efficacy end point in the pooled analysis was overall response rate (ORR), defined as the proportion of patients with a best overall response (BOR) of either complete response (CR) or partial response (PR), according to the RECIST 1.1 as determined by an IRC. Secondary efficacy end points included time to tumour response (TTR), duration of response (DOR), disease control rate (DCR), progression-free survival (PFS), and overall survival (OS). Additionally, HRQoL was assessed using the European Organisation for Research and Treatment of Cancer Quality of Life Questionnaire Core 30 (EORTC QLQ-C30) and Pediatric Quality of Life (PedsQL) Version 4.0 Generic Core Scale.22
The ePAS4 dataset included 13, 53, and 98 patients from the LOXO-TRK-14001, LOXO-TRK-15003, and LOXO-TRK-15002 trials, respectively. The included patients had a median age of 42.0 years; most patients had an ECOG performance status of 0 (49%) or 1 (38%); 49% were male; and 94% received 1 prior treatment of surgery (76%), systemic therapy (77%), or radiotherapy (46%). The most common tumour types were STS (22%), IFS (20%), thyroid tumours (16%), or salivary gland tumours (13%), and the following tumours were less frequent (< 10%): lung, colon, melanoma, breast, gastrointestinal stromal tumour (GIST), pancreatic, bone sarcoma, cholangiocarcinoma, appendix, hepatic, CMN, prostate, and unknown primary cancer. Most patients (74%) had metastatic disease at enrolment. In the SAS3 dataset, the primary CNS tumour types included glioblastoma (n = 7), glioma (n = 6), astrocytoma (n = 5), not otherwise specified (3), glioneuronal (1), neuronal and mixed neuronal-glial tumours (n = 1), and primitive neuroectodermal tumours (n = 1). The median age for patients in the SAS3 dataset was 8 years; 83% were pediatric patients, 46% were male, most had an ECOG status of 0 (63%) or 1 (29%), and most had received 1 to 2 lines of previous systemic treatment (67%). In terms of patient disposition, 84 of the 164 patients (51.2%) in ePAS4 dataset discontinued treatment primarily due to disease progression (29.9%). Disposition for the SAS3 dataset was not available.22
Efficacy Results
All efficacy outcomes, with the exception of HRQoL, were reported in the ePAS4 dataset, which consisted of 164 patients with non-CNS solid tumours, and in the SAS3 dataset for 24 patients with primary CNS tumours. Outcomes for HRQoL were reported in 126 patients in the HRQoL analyses. Additionally, results of ePAS5 (n = 192) and SAS3 (n = 33), the newest datasets, were presented when data were available.
ORR: In the ePAS4 dataset, the ORR by IRC assessment was 73% (95% confidence interval [CI], 65% to 79%); 19% of patients achieved a CR, 5% achieved a pathological CR, and 49% achieved a PR. The DCR (defined as CR, pathological CR, PR, and stable disease lasting ≥ 16 weeks) was 84% (95% CI, 77% to 89%). Consistent with ePAS5, the ORR was 72% (95% CI, 65% to 79%); 23% and 7% patients achieved CR and pathological CR, respectively. In the original larotrectinib submission, as of the data cut-off date of July 30, 2018, the ORR was 81% (95% CI, 72% to 88%); 17% of patients achieved a CR and 63% achieved a PR.
In the SAS3 dataset, the ORR by investigator assessment was 21% (95% CI, 7% to 42%); 8% of patients achieved a CR, 13% achieved a confirmed PR, and the DCR was 63%. With the new data cut-off date of July 2020, the ORR was 24% (95% CI, 11% to 42%), with 9% and 15% of patients achieving a CR and PR, respectively. The estimated ORR in the original submission was 36% (95% CI, 13% to 65%), with a CR reported in 14% and PR in 21% of the patients.22
The range of ORR across the different subgroups varied widely, although the subgroup analyses were noninferential and presented descriptively. The ORRs ranged from 91% (95% CI, 80% to 97%) in pediatric patients to 63% (95% CI, 54% to 72%) in adults; from 33% (95% CI, 1% to 92%) in patients with an ECOG status of 3 to 83% (95% CI, 72% to 90%) in patients with an ECOG status of 0; from 59% (95% CI, 41% to 75%) in patients who received 2 prior systemic treatments to 86% (95% CI, 71% to 95%) in patients who received 0 prior systemic treatments; from 67% (95% CI, 58% to 75%) in patients with metastatic cancer to 88% (95% CI, 74% to 96%) in patients with locally advanced metastatic cancer at baseline; and from 50% (95% CI, 7% to 93%) in patients with an NTRK2 gene fusion to 80% (95% CI, 71% to 88%) in patients with NTRK3 gene fusion. Across various tumour types, the ORRs ranged from 0% (95% CI, not estimated) for appendix and pancreas tumours and cholangiosarcoma (with ≤ 2 patients each) to 100% (95% CI, 40% to 100%) for GIST (with 4 patients). Although noninferential, the wide range of ORRs as well as the associated 95% CIs across the different tumour types limit the interpretability of the ORR for the individual tumour types. Given the small number of cases of any single tumour type, which was particularly true for cancers with fewer than 10 patients, it is unclear if the observed effects can be generalized to a larger sample of patients with the same cancer type. For example, based on 27 patients in ePAS4, the ORR in patients with thyroid cancer was 56% (95% CI, 35% to 75%), which was much lower than the 100% ORR (95% CI, 48% to 100%) seen in 5 patients with thyroid cancer based on a previous dataset, whereas the ORR improved from 25% to 38% in the case of colon cancer when 4 additional patients were included.22
TTR: In the ePAS4 dataset, the median TTR was 1.84 months (range = 0.92 to 14.55 months). The percentage of patients experiencing a TTR of 2 months or less was 81% (96 of 119). In the SAS3 dataset, the median TTR was 1.82 months (range = 0.99 to 3.75); 67% of patients experienced a response in less than 2 months. The TTR was not reported in the original submission.22
DOR: In the ePAS4 dataset, the median DOR was not estimable (NE) (95% CI, 27.6 months to NE) after a median follow-up of 15.7 months (interquartile range [IQR] = 6.6 months to 24.8 months). In the original submission, the median DOR had not been reached either. However, in the ePAS5 dataset, the DOR was 34.5 months (95% CI, 27.6 to 54.7) with a median follow-up of 20.3 months (IQR = data not applicable [NA]). In the SAS3 dataset, the median DOR had not been reached (95% CI, 3.8 months to NE) after a median follow-up duration of 5.3 months (IQR = 3.6 to 10.1 months).22
PFS: In the ePAS4 dataset, the median PFS was 33.4 months (95% CI, 19.3 months to NE) after a median follow-up of 14.0 months (IQR = 7.9 months to 26.6 months). In the ePAS5 dataset, after a median follow-up of 22.1 months (IQR = data NA), the median PFS was 33.4 months (95% CI, 22.5 to 43.5). In the original submission, the median PFS was 28.3 months (95% CI, 9.9 to NE). In the SAS3 dataset, the median PFS was 11.0 months (95% CI, 5.4 to NE), with a median follow-up duration of 5.6 months (IQR = 3.6 to 13.1 months). With the new data cut-off, the median PFS was 18.3 months (95% CI, 6.7 to NE) after a median follow-up of 16.5 months.22
OS: In the ePAS4 dataset, the median OS was NE (95% CI, 44.4 months to NE), and 85% of patients were alive after a median follow-up of 15.8 months (IQR = 9.3 months to 28.8 months). In the original submission, the median OS had not been reached after a median follow-up of 14.8 months. In the SAS3 dataset, the median OS was NE (95% CI, 9.4 months to NE), with a median duration of follow-up of 6 months.22 With the new data cut-off, the OS was still NE for ePAS5 and SAS3.
HRQoL: HRQoL outcomes were only measured in Study 15002 and Study 15003; analyses were not pre-specified in the sponsor-submitted statistical analysis plan for the pooled analyses, and it was not clear which analyses or subgroups were pre-specified, if any. Nonetheless, HRQoL data were presented descriptively, as part of conference proceedings; the most notable results are presented here. For adults and pediatric patients, the proportions of patients with HRQoL scores that were within the normal reference range or above the norm (norm/above norm) and below the norm (below norm) were determined at baseline and at best response using the EORTC QLQ-C30 global health score (GHS) and PedsQL total score. The mean GHS of the EORTC QLQ-C30 for the US general population (63.9)24 minus 10 points (the estimated minimal important difference [MID]) was used to construct the norm/above norm (≥ 53.9) and below norm (< 53.9) score categories for adults.25 The average score for the combined self- and proxy-reported PedsQL questionnaire for healthy US children (85.0)26 minus 4.5 points (the estimated MID) was used to construct the norm/above norm (≥ 80.5) and below norm (< 80.5) score categories for children 2 years of age and older. The sponsor-identified MID for a PedsQL total score for children less than 2 years of age was 7.2 points.22
Of the 52 adult patients with a norm/above norm EORTC QLQ-C30 GHS at baseline, 98% remained in this category at the best response, and of the 22 patients below norm at baseline, 9% remained in this category and 91% improved to norm/above norm. Of the 9 pediatric patients 2 years of age and older with a PedsQL total score norm/above norm at baseline, 100% remained in this category at the best response, and of the 15 patients below norm at baseline, 33% remained in this category and 67% improved to norm/above norm. Data were not available for pediatric patients younger than 2 years of age.22
When compared with baseline, the mean of best changes in total score (standard deviation [SD]) was 17.5 (20.0), 20.7 (17.2), and 12.0 (13.8) for adults, children 2 years of age or older and children younger than 2, respectively. The changes exceeded the sponsor-identified (and literature-supported) MIDs for the respective instruments: 10 points for an EORTC QLQ C-30 GHS in adults and 4.5 points and 7.2 points for a PedsQL total score in pediatric patients older and younger than 2 years of age, respectively. Among patients (or parents and/or caregivers) who completed the respective questionnaires (74 adults, 24 children ≥ 2 years, and 28 children < 2 years), 59% of adult patients, 79% of children 2 years of age or older, and 57% of children less than 2 years of age had improvements in the best post-baseline score at or above the estimated MIDs. Of the patients evaluable for a sustained improvement (i.e., with a baseline and 2 or more post-baseline assessments, magnitude not defined), the improvement was sustained for at least 2 consecutive cycles for 47% of adult patients, 75% of children 2 years of age or older, and 43% of children younger than 2 years of age, and the improvement was sustained until the end of assessments in 30%, 50%, and 29% of patients, respectively.22
The HRQoL results were associated with various methodological limitations, which are discussed in the critical appraisal section, limiting the interpretability of the data. Because HRQoL was not assessed in the previous pooled analyses, a comparison of change in HRQoL over time (different cut-off data for pooled analysis) could not be conducted.
Harms Results
The majority of the reported adverse events (AEs) in the pooled analysis were grade 1 or 2, most commonly reported as increased aspartate aminotransferase (ALT) and alanine aminotransferase (AST), cough, constipation, dizziness, fatigue, nausea, vomiting, pyrexia, anemia, and constipation. Treatment-related grade 3 or 4 AEs occurred in 15% or less of patients, which represents an increase in the incidence in comparison to the original CADTH submission, in which treatment-related grade 3 or 4 AEs occurred in less than 5% of patients. The most common grade 3 or 4 AEs included anemia, increase in liver enzyme (ALT and AST) levels, and decreased neutrophil count. Larotrectinib treatment interruptions or dosage modifications attributable to treatment occurred in 19% of patients in the TRK fusion cancer labelled-dose safety set (n = 196) and in 15% of patients in the overall labelled-dose safety set (n = 238), while permanent discontinuation of larotrectinib for treatment-emergent adverse events (TEAEs), regardless of attribution, occurred in 5% of patients and 8% of patients, respectively, in the 2 safety sets.22
Overall, despite the increase in grade 3 or 4 AEs in the larger sample size and longer follow-up time compared to the original CADTH submission, the clinical experts consulted by CADTH agreed that the safety and tolerability of larotrectinib was acceptable. Larotrectinib resulted in minimal significant toxicity. Additionally, the availability of a liquid formulation, which facilitates dosing in young children as well as in adults, which was noted as a positive factor considering most treatment alternatives involve invasive surgery or IV therapy. Results were consistent in the newly submitted overall NTRK fusion cancers safety set (N = 260) and the overall safety set (N = 331).22
Table 2: Summary of Key Results From Pivotal and Protocol-Selected Studies
Result | ePAS4a N = 164 | ePAS5a N = 192 | SAS3b N = 24 | New SASb N = 33 |
|---|---|---|---|---|
Overall safety set | ||||
n (%) | 119 (73)c | 139 (72) | 5 (21) | NR (24) |
95% CI | 65 to 79 | 65 to 79 | 7 to 42 | 11 to 42 |
Time to tumour responsed | ||||
Patients with best response of confirmed CR, pathological CR, or PR, n (%) | 119 (73) | NR | 5 (21) | NR |
Median time to tumour response (range), months | 1.84 (0.92 to 14.55) | NR | 1.82 (0.99 to 3.75) | NR |
Duration of response | ||||
Median follow-up (IQR), months | 15.7 (6.6 to 24.8) | 20.3 (NR) | 5.3 (3.6 to 10.1) | NR |
Median duration of response (95% CI), months | NE (27.6 to NE) | 34.5 (27.6 to 54.7) | NE (3.8 to NE) | NR |
Progression-free survival | ||||
Median follow-up (IQR), months | 14.0 (7.9 to 26.6) | 22.1 (NR) | 5.6 (3.6 to 13.1) | 16.5 (NR) |
Median progression-free survival (95% CI), months | 33.4 (19.3 to NE) | 33.4 (22.5 to 43.5) | 11.0 (5.4 to NE) | 18.3 (6.7 to NE) |
Overall survival | ||||
Median follow-up (IQR), months | 15.8 (9.3 to 28.2) | 24.0 (NR) | 6 (NR) | 16.5 (NR) |
Median, months | NE | NE | NE | NE |
95% CI, months | 44.4 to NE | NE to NE | 9.4 to NE | 16.9 to NE |
CI = confidence interval; CR = complete response; ePAS4 = extended primary analysis set 4; ePAS5 = extended primary analysis set 5; IQR = interquartile range; NE = not estimable; NR = not reported; PR = partial response; SAS = safety analysis set; SAS3 = safety analysis set 3.
aIndependent review committee–assessed for efficacy outcomes.
bInvestigator-assessed for efficacy outcomes.
cOverall response rate is the sum of confirmed CR, pathological CR, and PR. Patients on larotrectinib therapy who underwent surgical resection with no viable tumours cells and negative margins on post-surgical pathology report were considered to have achieved a CR by surgery and/or pathology, and their pre-surgical best response was reclassified as pathological CR after surgery following Response Evaluation Criteria in Solid Tumours Version 1.1; previously referred to as surgical CR.
dTime to response is defined as the number of months elapsed between the date of the first dose of larotrectinib and the first documentation of objective response (CR, pathological CR, or PR, whichever occurred earlier) that was subsequently confirmed.
Source: Note to clinical reviewer (2020)22 and updated ePAS5 data.27
Table 3: Summary of Key Safety Results From Pooled Studies
Safety result | TRK fusion cancer labelled-dose safety set (N = 196) | Overall NTRK fusion cancers safety set (N = 260) | Overall labelled-dose safety set (N = 238) | Overall safety set (N = 331) |
|---|---|---|---|---|
Harms | ||||
Treatment interruption or modification, n (%) | 79 (40) | — | 97 (41) | — |
Treatment-attributable treatment interruption or modification, n (%) | 37 (19) | — | 49 (21) | — |
Grade 3 or 4 AE, n (%) | 96 (49) | — | 120 (50) | — |
Treatment-attributable grade 3 or 4 AE, n (%) | 27 (14) | 46 (18) | 35 (15) | 59 (18) |
WDAE (from study treatment), % | 5 | — | 8 | — |
Notable grade 3 or 4 AEs, n (%) | ||||
Anemia | 15 (8) | — | 21 (9) | — |
Neutrophil count decrease | 15 (8) | — | 16 (7) | — |
Lymphocyte count decrease | 9 (5) | — | 11 (5) | — |
AE = adverse event; NTRK = neurotrophic tyrosine receptor kinase; TRK = tropomyosin receptor kinase; WDAE = withdrawal due to adverse event.
Source: Note to clinical reviewer (2020).22
Critical Appraisal
Internal Validity
Although the rationale to pool data from the 3 trials was based on the rarity of NTRK fusion cancer, the pooled analysis had several methodological limitations. First, interpretation of pooled analysis results remains difficult due to the between-study heterogeneity resulting from the differences in the design feature of the included trials, including different objectives, phases, outcome measures, and eligibility criteria across trials. The sponsor provided a sensitivity analysis showing the inclusion or exclusion of phase I data with phase II data did not meaningfully affect the primary outcome (ORR). The sponsor also submitted 3 additional analyses to address concerns about the inherent heterogeneity of the trials (details are provided in a following section), 1 of which mitigated concerns about patient heterogeneity due to the lack of controls (if the underlying assumptions are considered valid). However, none of the supplementary analyses addressed concerns about heterogeneity in tumour types, as well as heterogeneities across studies due to design features. Second, the following uncertainties around the pooled analysis results should be considered: the sample size for each individual cancer type was too small (in some cases fewer than 10 patients per tumour type) and the consequent 95% CI was too wide to make any conclusion about larotrectinib’s effect on different cancer types separately; the ongoing nature of the trial data means results could change as data on more patients and longer follow-up become available; the efficacy analyses for the SAS3 dataset used investigator-assessed outcomes, which is particularly problematic given the small sample sizes in this dataset and the open-label design of the trial. In addition, a number of survival outcomes (PFS, OS, and DOR) were analyzed using the Kaplan-Meier method to pool data across the 3 trials, which could be problematic as traditional survival analysis methods such as Kaplan-Meier curves rely on the assumption that a single survival distribution can be used to estimate the survival outcome for all patients included in the analysis.
The HRQoL analyses had a different set of limitations, aside from the lack of pre-specification in the sponsor’s statistical analysis plan. Patients’ best responses were considered in evaluating effects on HRQoL, not their last reported responses. As HRQoL could vary over time, it is unclear whether the best change was, in fact, a transient improvement in HRQoL. The categorization of norm/above norm or below norm means patients could move from 1 category to another without actually exceeding the estimated MIDs for the respective instruments, particularly if their baseline values were closer to the chosen cut-off (53.9 for EORTC QLQ C-30 GHS in adults and 80.5 for PedsQL in children ≥ 2 years of age). Additionally, patients could experience a clinically relevant decline in HRQoL and still be in the norm/above norm category as long as they did not fall below norm (e.g., if they started with a high baseline HRQoL level, dropped to a level that exceeded the respective MIDs after treatment, and were still above the norm). Although a sensitivity analysis conducted using a higher threshold (58.9 for adults and 82.75 for children) showed similar results, the aforementioned limitations remained. Given these issues, and the lack of a statistical comparison between baseline and post-baseline levels of HRQoL, the maintenance and/or improvement in HRQoL is unclear.
External Validity
Overall, the 3 trials included in the pooled analysis consisted of patients with tumours at various sites, although not all solid tumour types were represented in the studies. While this suggests the results are generalizable to the various tumour types, some of these tumour types were under-represented in the study population, resulting in wide confidence intervals, reducing confidence in their generalizability. Patients included in the pooled analysis mostly had an ECOG status of 0, 1, or 2 (and their respective performance status equivalence for the pediatric population). There are insufficient data to support generalizing to patients with poorer performance status as the number of patients with an ECOG status of 3 in the pooled analysis was too small.
Other Relevant Evidence
Three analyses were submitted by the sponsor to address sources of heterogeneity using the available data. The submitted analyses include a Bayesian hierarchical model (BHM), a permutation analysis, and an intra-person Growth Modulation Index (GMI) analysis. The first and second analyses attempt to quantify and account for the heterogeneity in ORR across tumour locations and studies, and possibly for other differences in histology, while the third attempts to mitigate for the lack of control and therefore heterogeneity between participants due to histology and location, as well as many other factors, by using the individual’s time to progression or treatment failure (TTPF) under previous treatment to compare to their PFS under their later treatment with larotrectinib.
The BHM analysis, although appropriately performed, is presented as a means of accounting for, rather than investigating heterogeneity in, ORR across tumour types. The BHM clearly identifies heterogeneity across tumour types, and no further analysis is presented to show that this heterogeneity can be explained by participant-level characteristics outside of tumour type, i.e., the subject-level characteristics that are controlled for in the GMI analysis. The BHM analysis does not provide evidence to support the combined analysis of the data for approval across all tumour types. The permutation analysis does not seem to add to the evidence to support or reject the pooling of all data in a single analysis, as the presented distribution across all subgroups may merely be an artifact of smaller groups having lower ORRs and larger groups having higher ORRs. Additionally, in both of these analyses, ORR and not PFS or OS is used as the outcome. This may not answer the more relevant question of the effect on survival, as ORR may not be a reasonable surrogate for PFS or OS across all tumour types, participants, or treatments.
The intra-patient GMI analysis provides the best evidence that larotrectinib is effective over a number of patient types. If the assumptions underlying this analysis are valid, it helps mitigate concerns about patient heterogeneity due to the lack of controls. However, it is not clear if the needed assumptions hold, and the lack of information about how the end point was calculated and how well the analysis performed raises further questions about the results. Additionally, this analysis does not directly address concerns about heterogeneity across tumour types. This is particularly evident as most tumour types with a low ORR are not included in the GMI analysis. None of the analyses provides strong evidence that larotrectinib is as active in these smaller groups defined by particular tumour types.
In June 2021, the sponsor submitted a summary of key information on NTRK gene fusion testing in response to the PAG’s request for reconsideration of the draft recommendation issued by the CADTH pan-Canadian Oncology Drug Review (pCODR) Expert Committee (pERC) in May 2021, and the implementation questions raised by the PAG. In this summary document, the sponsor provided a summary of key considerations for NTRK gene fusion testing along with information on the current situation and future directions of NTRK testing in Canada (see Appendix 6 for more details).
Conclusions
The clinical data supporting the efficacy of larotrectinib in a histology-agnostic patient population with NTRK fusion–positive cancer is derived from a pooled analysis of 3 open-label, single-arm trials; including a phase I trial, a phase I/II trial, and a phase II basket trial. The current CADTH resubmission is based on a larger sample size than that of the previous submission, with longer patient follow-up. Additionally, alternative methods for evaluating ORR and PFS, and observational data submitted by the sponsor, were considered in this submission. In total, 164 adults and pediatric patients with NTRK-positive cancer of different histologies were included in the most recent pooled analysis.
Results showed that, among patients with a non-CNS tumour, larotrectinib treatment was associated with a 73% improvement in ORR; half of the responders had a PR, 19% patients achieved a CR, and the median time to response was less than 2 months. Across different tumour types, the ORRs varied widely, with a similarly wide range of uncertainty. Combined with differences in sample sizes across the different tumour types, some of which had fewer than 10 patients, these factors limit the generalizability of the findings of the mixed cancer population. The ORRs also varied between adults and pediatric patients, as well as by patient baseline state and previous treatment history. Effects on other outcomes important for clinicians and patients, including PFS, OS, DOR, and HRQoL, remain uncertain or inconclusive among patients with primary CNS or non-CNS tumours due to the lack of accrual of sufficient events and multiple methodological limitations. Among patients with primary CNS tumours, of which the majority were children, the ORR was 21%. Other measures of effect varied widely, with small sample sizes and consequently low event numbers adding to the uncertainty. Overall, these results and methodological limitations remained largely unchanged compared to the previous review. While the rarity of NTRK fusion creates practical and ethical challenges to conducting a randomized controlled trial, the lack of comparative evidence as well as multiple methodological limitations means the results should be interpreted based on clinical judgment.
Three additional analyses were submitted in response to concerns raised in the previous submission regarding the inherent heterogeneity across tumour types as well as patients included in the aforementioned trials and the lack of a comparator group. Results from the intra-patient GMI analysis mitigated concerns about between-patient heterogeneity due to the lack of controls. However, none of the alternative analyses supported uniform effectiveness of larotrectinib across tumour types. Four real-world evidence (RWE) studies with thousands of cancer samples supported the oncogenicity and mutual exclusivity of NTRK fusion in certain cancers, but showed no increase or reduction in PFS or OS among NTRK-positive cancer patients.
Introduction
Disease Background
The NTRK genes encode the neurotrophin family of receptors.1 A recent study estimated that NTRK gene fusions occur in 0.28% of all solid cancers. Oncogenic fusion of NTRK genes arise from exact intrachromosomal or interchromosomal rearrangements that juxtapose the kinase domain–containing 3' region of NTRK with the 5' region of NTRK gene partners. Pre-clinical data demonstrated that chimeric oncogenic fusions may lead to partial or complete deletion of the immunoglobulin-like domain of TRK, which inhibits downstream signalling pathways in the absence of activating ligands.2 Available literature demonstrates that NTRK gene fusions are oncogenic drivers in various cancers.17 Appendix 4 provides further details.17,28-30
Although reported to be prevalent in 0.28% of all solid cancers,31 NTRK oncogenic fusions are observed at variable frequencies across a spectrum of pediatric and adult cancers, with some uncertainty regarding exact frequencies.1 Different studies have reported varying frequencies, possibly due to the number of patients screened and fusion detection techniques.
Lung, colorectal, and breast cancer represent the 3 most common cancer diagnoses in Canada (Table 4).
In NSCLC, NTRK fusions are less common (with an occurrence rate of approximately 0.1% to 1%)5-7 compared with other oncogenic gene rearrangements that involve the anaplastic lymphoma kinase (ALK) gene, ROS proto-oncogene 1 (ROS1), and RET proto-oncogene, which occur at frequencies of approximately 4% to 6%, 1% to 2%, and 1% to 2%, respectively.33-35
The NTRK mutation is also quite rare in breast cancer, with the exception of the rare subtype of SBC, in which the prevalence of NTRK fusion has been reported to be 92%.
NTRK gene fusions are also rare in sporadic colorectal cancers (2% to 3%),5 and appear to be more common in colorectal tumours with high levels of MSI, and mutually exclusive of RAS and BRAF mutations, which represent about 55% of metastatic CRCs.9
The NTRK mutation is uncommon in adult sarcomas (1%); it is found at a higher frequency in GIST,36 particularly wild-type GIST (lacking mutations in KIT and PDGFRA).
NTRK gene fusions are observed in 6% of adults with primary thyroid cancers.10
While the frequency of NTRK fusions is low in common cancer types, NTRK3 fusions are nearly ubiquitous among rare cancer types such as MASC and IFS.5,11 In pediatric oncology, NTRK fusions are pathognomonic of specific, rare cancers including IFS (91% to 100%)12 and cellular CMN (83%).5 Fusions of NTRK genes are also commonly observed in several other rare pediatric cancers, including SBC (92%)13 and MASC of the salivary gland (100%).14 In addition, significant numbers of NTRK fusion cancers have been reported among children with papillary thyroid carcinoma (9.4% to 25.9%),15,16 undifferentiated sarcomas (1%; frequency in adult versus pediatric patients not specified),17 HGGs (7.1%),5 inflammatory myofibroblastic tumours, and (rarely) acute leukemia.18
Table 4: Incidence and Mortality Associated With Solid Tumours Among Canadians in 2019
Tumour type | Projected incidence | Projected mortalitya | 5-year net survival (%) | ||||
|---|---|---|---|---|---|---|---|
Cases, n | ASIRb | Males | Females | ||||
Deaths, n | ASMRb | Deaths, na | ASMRb | ||||
Lung and bronchus | 29,300 | 62.1 | 10,900 | 54.7 | 10,100 | 43.1 | 19 |
Breast | 27,200 | 66.8 | 55 | 0.3 | 5,000 | 22.4 | 88 |
Colorectal | 26,300 | 60.6 | 5,200 | 26.8 | 4,400 | 18.2 | 65 |
Prostate | 22,900 | 118.1 | 4,100 | 22.2 | — | — | 93 |
Bladder | 11,800 | 25.0 | 1,800 | 9.7 | 700 | 2.8 | 75 |
Thyroid | 8,200 | 21.8 | 100 | 0.5 | 130 | 0.5 | 98 |
Melanoma | 7,800 | 21.7 | 840 | 4.4 | 450 | 2.0 | 88 |
Uterus (body, NOS) | 7,200 | 34.5 | — | — | 1,250 | 5.3 | 83 |
Kidney and renal pelvis | 7,200 | 17.0 | 1,250 | 6.4 | 670 | 2.8 | 71 |
Pancreas | 5,800 | 12.9 | 2,700 | 13.5 | 2,500 | 10.7 | 8 |
Oral | 5,300 | 12.7 | 1,050 | 5.3 | 430 | 1.8 | 64 |
Stomach | 4,100 | 9.3 | 1,200 | 6.2 | 760 | 3.3 | 28 |
Brain/CNS | 3,000 | 7.1 | 1,400 | 7.1 | 1,050 | 4.7 | 23 |
Ovary | 3,000 | 14.2 | — | — | 1,900 | 8.4 | 45 |
Liver | 3,000 | 6.7 | 1,100 | 5.4 | 280 | 1.2 | 19 |
Esophagus | 2,300 | 5.6 | 1,700 | 8.6 | 500 | 2.1 | 15 |
Cervix | 1,350 | 7.2 | — | — | 410 | 2.0 | 72 |
Larynx | 1,150 | 2.4 | 330 | 1.7 | 75 | 0.3 | 62 |
Testis | 1,150 | 6.4 | 35 | 0.2 | — | — | 97 |
ASIR = age-standardized incidence rate; ASMR = age-standardized mortality rate; CNS = central nervous system; NOS = not otherwise specified.
aCanada totals include provincial and territorial estimates. Territories are not listed due to small numbers.
bRates are age-standardized to the 2011 Canadian population and are per 100,000.
Data Source: Canadian Cancer Statistics Advisory Committee (2019).3
Childhood cancer accounts for less than 1% of all new cancer cases in Canada. Between 2009 and 2013, there were 4,715 new cases of cancer in children 0 to 14 years of age in Canada (average of 943 cases per year). Between 2008 and 2012, there were 595 cancer deaths in children 0 to 14 years of age in Canada (average of 119 deaths per year). Brain and CNS cancers account for 19% of cancers and 34% of deaths, respectively, whereas neuroblastomas and other peripheral nervous cell tumours account for 11% of deaths.4
The most common types of solid tumours found in adolescents and young adults (15 to 29 years) include thyroid (16%), testicular (13%) and melanoma (8%), while the majority of cancer deaths (from solid tumours) in this same age group are attributed to brain and CNS cancers (15%) and bone cancers (11%).4
Standards of Therapy
There is currently no reimbursed drug that targets the NTRK pathway. For adult cancers, defining accepted clinical practice is difficult, as NTRK gene fusions can be observed in a wide variety of solid cancers. Patients with locally advanced or metastatic solid tumours are currently treated largely with standard of care (chemotherapy, immunotherapy, and/or targeted therapy) according to the primary disease site.19 Ultimately, many of these cancers have a poor prognosis, and patients who progress on upfront therapies will have limited subsequent therapeutic options.
For patients with pediatric NTRK fusion cancers that are refractory to upfront therapy, there is no standard of care at relapse.37 In addition, for infants with locally advanced, unresectable IFS, standard upfront conventional cytotoxic chemotherapy is poorly tolerated, has limited efficacy, and is associated with significant morbidity.
Selected Disease Site-Specific Burden and Need Considerations
Pediatric Solid Cancers
Despite their relative rarity in pediatric oncology, NTRK fusions are pathognomonic of specific, rare cancers (IFS and cellular CMN). Several other very rare pediatric cancers, including SBC and MASC of the salivary gland, are also expected to carry NTRK fusions. In addition, there are significant numbers of NTRK fusion cancers among children with papillary thyroid carcinoma, undifferentiated sarcomas, HGGs, and inflammatory myofibroblastic tumours, but they rarely occur in those with acute leukemia.20
Infantile fibrosarcoma is the most common STS in infants younger than 1 year of age. It is rare, and many patients present with localized disease, in which case upfront resection with negative margins is the treatment of choice if feasible. In the largest retrospective review of IFS, surgical resection was the initial treatment for 68% of patients.38 For children with locally advanced (unresectable) or metastatic IFS, the historical approach to therapy has been conventional cytotoxic chemotherapy. In Canada, the most common regimen used would include vincristine or actinomycin with or without cyclophosphamide.20 The response rate to chemotherapy is approximately 68% to 71% but requires a central line and carries acute and long-term toxicity risks. An estimated 9% to 10% of children ultimately required disfiguring amputations to achieve a cure in the era before TRK inhibitors.38
Among other childhood non-rhabdomyosarcoma, examples of STS, NTRK fusions are rare. Similarly, surgical resection is the mainstay for IFS that is localized and resectable, with adjuvant or neoadjuvant cytotoxic chemotherapy (typically doxorubicin and ifosfamide) used if it is unresectable or metastatic. The response rate to chemotherapy in a pediatric STS is approximately 55%.39 According to the clinical experts consulted for this review, anthracycline and alkylator therapies come with significant late toxicities, including cardiomyopathy and infertility, when used in young children. There are no standard conventional chemotherapeutic approaches to second-line therapy for chemorefractory disease.
Fusions of NTRK genes are found in approximately 26% of pediatric patients with differentiated thyroid carcinomas, which often present at a more advanced stage than in adults. Surgery (thyroidectomy) is the primary therapy, and a subgroup also receives radioactive-iodine therapy based on the risk groups defined by the American Thyroid Association. The clinical experts consulted by the review team indicated that, based on their experience, outcomes of this first-line treatment are typically good, and few children need systemic therapy. Selective NTRK-inhibitor therapy would be considered as second-line therapy for NTRK fusion–positive thyroid cancer that is radioactive-iodine refractory and either symptomatic or progressive.20
Finally, NTRK fusions are rare, accounting for 0.4% to 3.1% of pediatric brain tumours, both in LGGs and HGGs, and often in younger children. For LGGs, resection is recommended if it is in a resectable location. However, if the tumour is unresectable and progressive, first-line systemic therapy would be vinblastine, which is associated with an ORR of approximately 26%, or vincristine and carboplatin.40 The clinical experts consulted by the review team noted that radiation therapy is often not possible due to the young age of children (< 5 years) and profound neurocognitive toxicity. Selective NTRK-inhibitor therapy would be considered second-line for NTRK fusion–positive patients if no clinical trial is available. High-grade gliomas are also treated with surgery, when possible, and accompanied by intensive cytotoxic chemotherapy in young children. Again, radiation therapy is standard in older children, but it is often not possible in young children due to morbidity. Recent work has shown that NTRK fusion accounts for a large number of alterations of hemispheric gliomas in infants. While this population is small in size, the management of these tumours is extremely challenging and most survivors have profound neurologic and cognitive deficits. There is a clear need to change the management of these tumours in this age group.41
Secretory Breast Cancer
Fusion of NTRK genes is quite rare in breast cancer.13,18 A number of standard therapy options offer considerably improved survival rates are available for patients with advanced breast cancer,5 but many patients will ultimately go on to exhaust available therapies and be left with no suitable therapeutic options.19
Secretory breast carcinoma is a rare histologic subtype of breast cancer that is seen in less than 1% of invasive breast cancer in children and adults and is associated with a generally favourable prognosis and a low likelihood of metastases.13,18 However, for patients with advanced, inoperable disease, treatment options are limited. Secretory breast carcinomas are also associated with a greater than 90% prevalence of NTRK gene fusions.5
Sarcoma and Gastrointestinal Stromal Tumour
Sarcomas are a relatively rare tumour subtype comprising more than 100 hundred subtypes. They are often categorized into STS varieties and bony sarcomas. The former are associated with a less-favourable prognosis, and in the adult population, are often not curable. Limited effective cytotoxic therapies exist for STS, particularly in the metastatic setting or upon relapse.42
In adults with sarcoma and NTRK fusions, standard therapies include radiation and surgery, and cytotoxic therapy (i.e., doxorubicin) for those with advanced disease. However, in the advanced setting, traditional chemotherapy is essentially ineffective.19 The clinical exerts consulted by the review team stated that there are examples of fusion-positive pediatric patients with locally advanced disease who show enough response to the drug to facilitate curative surgical resection.
Fusions of NTRK genes are also seen in 3% to 4% of GIST tumours.36 For GIST tumours with cKIT and PDGFRA mutations, targeted therapies represent the current standard of care. For the 10% to 15% of GISTs that are wild-type, there is a significant unmet need for effective therapies.43
Thyroid Cancer
For patients with advanced, inoperable thyroid cancer that has progressed on radioactive-iodine therapy, current treatments include small-molecule tyrosine kinase inhibitors.19 An estimated 6% of thyroid cancers may involve NTRK gene fusions.10
Gastrointestinal Cancers
For patients with advanced CRC, there is an unmet need for better therapies in patients with chemorefractory disease (i.e., those who have progressed on 2 or more prior lines of therapy). While NTRK gene fusions are uncommon in CRC,8,9 the clinical experts consulted by the review team noted that there is a significant unmet need for better therapies for patients with non-colorectal gastrointestinal cancers, particularly pancreatic cancer and cholangiocarcinoma.
Lung Cancer
Lung cancer remains the most common cancer in Canada.44 NTRK fusions are estimated in up to 1% of NSCLCs5 (as compared to ALK fusions in 3% to 5%, ROS1 fusions in 1% to 2%, and epidermal growth factor receptor (EGFR) gene mutations in 20%).7 Systemic treatment options for advanced NSCLC include chemotherapy, immunotherapy, combinations, and biomarker-directed targeted therapies, with response rates ranging from 45% to 60% in those without ALK/EGFR/ROS1/BRAF-deranged lung cancer. While these current therapies have improved outcomes for patients with NSCLC, patients will ultimately become refractory and/or intolerant to available therapies, and effective and tolerable therapies are need for pre-treated patients.44
Drug
Larotrectinib is an oral selective inhibitor of tropomyosin kinase receptors TrkA, TrkB, and TrkC, which are encoded by NTRK1, NTRK2, and NTRK3, respectively. Larotrectinib is a highly selective, potent, adenosine triphosphate–competitive, and small-molecule pan-TRK inhibitor with a half-maximal inhibitory concentration (IC50) in the low nanomolar range.21 Health Canada has issued marketing authorization for the use of larotrectinib for the treatment of adult and pediatric patients with solid tumours who have NTRK gene fusion without a known acquired resistance mutation, are metastatic or where surgical resection is likely to result in severe morbidity, and have no satisfactory treatment options.21 The marketing authorization was issued with conditions, pending the results of trials to verify its clinical benefit.21The recommended dosage of larotrectinib in adults is 100 mg taken orally twice daily until the patient is no longer clinically benefiting from therapy or until unacceptable toxicity occurs.21 In pediatric patients, dosing is based on BSA. The recommended dosage of larotrectinib in pediatric patients (1 month to 18 years) is 100 mg/m2 taken orally twice daily, with a maximum of 100 mg per dose until the patient is no longer clinically benefiting from therapy or until unacceptable toxicity occurs.21
Table 5: Key Characteristics of Larotrectinib
Characteristic | Larotrectinib |
|---|---|
Mechanism of action | Larotrectinib is an orally bioavailable, ATP-competitive, potent and highly selective TRK inhibitor. Larotrectinib targets the TRK family of proteins inclusive of TrkA, TrkB, and TrkC that are encoded by the NTRK1, NTRK2, and NTRK3 genes, respectively. |
Indicationa | Larotrectinib for the treatment of adult and pediatric patients with solid tumours that have NTRK gene fusion without a known acquired resistance mutation; are metastatic or where surgical resection is likely to result in severe morbidity; and have no satisfactory treatment options. |
Route of administration | Oral (capsule: 25 mg and 100 mg; oral solution: 20 mg/mL) |
Recommended dose | Adults: 100 mg taken orally twice daily Pediatric patients: 100 mg/m2 taken orally twice daily up to a maximum of 100 mg per dose |
Serious adverse effects or safety Issues | Notable harms include fatigue, nausea, dizziness, vomiting, anemia, increased ALT, increased AST, cough, constipation, diarrhea, sepsis, pyrexia, decreased neutrophil count, decreased lymphocyte count, hypokalemia, hyponatremia, hypoglycemia, hypophosphatemia, gait disturbance, paresthesia, myalgia, and/or weight increase |
Other | The marketing authorization was issued with conditions, pending the results of trials to verify its clinical benefit. |
ALT = alanine transaminase; AST = aspartate aminotransferase; ATP = adenosine triphosphate; NTRK = neurotrophic tyrosine receptor kinase; Trk = tyrosine receptor kinase.
aHealth Canada–approved indication.
Source: Larotrectinib product monograph.21
Stakeholder Perspectives
Patient Group Input
This section was prepared by CADTH staff based on the input provided by patient groups.
About the Patient Groups and Information Gathered
Five patient group submissions were received for this review: LCC, the CBCN, CCC, the SCFC, and the CCSN. All participating organizations are prominent national patient advocacy groups in their respective cancer area. LCC is a charitable organization providing resources for lung cancer education, patient and caregiver support, research, and advocacy. The CBCN is a patient-directed organization that aims to voice the issues and concerns of breast cancer patients through education and advocacy activities, and promote a national network through information sharing. CCC is a charitable not-for-profit organization dedicated to colorectal cancer awareness and education, supporting patients and caregivers, and advocacy on their behalf. The SCFC is a charitable organization dedicated to providing patient support, including education and advocacy, disease awareness, and support for Canadian sarcoma cancer research. Finally, the CCSN provided a collective patient input submission, with input from the following patient advocacy groups: the Advocacy for Canadian Childhood Oncology Research Network, Colorectal Cancer Resource and Action Network, and GIST Sarcoma Life Raft Group Canada. A disclosure of any conflicts of interest for the patient groups is available on the CADTH website. The CCSN collective patient input submission was coordinated and authored by the Blue Ribbon Project (Filomena Servidio-Italiano). The remaining submissions were prepared by the respective organizations without any external help.
Lung Cancer Canada collected information through interviews and environmental scans between November and December of 2020 in addition to information from a previous larotrectinib submission. The thoughts and experiences of 6 patients (4 males and 2 females; age range = 33 years to 66 years) were included. The CBCN submission collected information through a 2017 online survey, with data from 180 Canadians living with metastatic breast cancer. A similar online survey was conducted in 2012, with input from 71 patients with metastatic breast cancer and 16 caregivers. In addition, a review of current studies and grey literature was conducted to identify issues and experiences that are commonly shared among many women living with metastatic breast cancer. The information for the CCC submission was collected by a combination of an online survey and patient outreach by CCC representatives. An online patient/caregiver survey conducted between October and November 30, 2020, was used to gather data from 6 patients and 5 caregivers across Canada, the US, and Brazil. The patients and caregivers of patients included in the survey had different cancer types and stages, with most patients having cancer that had metastasized from the organ of origin. In addition, CCC reached out to patients via 2 conferences (1 in 2018 and 1 in 2020) and personal interviews (individually and as groups) to gather input on patient perspectives and experience with larotrectinib. Eight patients were interviewed; 5 female patients (age range: 30 years to 69 years) and 3 male caregivers (age range: 50 years to 69 years). The 5 caregivers surveyed provided care for pediatric and adult patients; 3 cared for a female patient (age range: 0 years to 39 years), and 2 cared for a male patient (age range: 0 years to 59 years). In 2019, CCC also submitted input based on a survey conducted between January 7, 2019, and January 29, 2019. Input from the SCFC was collected through multiple interviews with 3 patients, 2 caregivers, and several physicians across Canada. Additionally, general information on sarcoma cancers collected from personal experiences and the collective experience of SCFC members and the sarcoma community were shared. The CCSN submission was based on interviews conducted between October and November 2020 with 8 adult patients experienced with larotrectinib treatment solicited through the LOXO-101 clinical trial principal investigator, an online CRC support group in US and Canada, an online NTRKers support group, and Canadian clinicians who have been prescribing larotrectinib. In addition, CCSN received information from multiple interviews with 4 pediatric patients conducted by the Advocacy for Canadian Childhood Oncology Research Network, between February 2019 and October 2020. Patients included in the CCSN submission had cancers of 6 different sites. The patient group submissions from the CBCN had no reported cases of patients with NTRK mutations, whereas the SCFC, LCC, CCC, and CCSN incorporated input from 3, 3, 9, and 12 patients with the gene fusion, respectively.
Disease Experience
Patients’ experiences with the various cancers shared a common theme. In most cases, patients were diagnosed at an advanced stage, had an aggressive or rare form of cancer, or both. Most patients had suboptimal success with conventional therapies and longed for a targeted approach with a better safety and efficacy profile than that of conventional therapy. While the disease presentation, symptoms, progression, and how it was experienced varied by patients, they overwhelmingly indicated that the negative effects cancer had on their day-to-day life as well as their caregivers were debilitating. Most patients experienced a number of symptoms induced by the cancer as well as by the treatment they received, with the following symptoms noted as the most urgently in need of management: pain in various parts of the body, the side effects of chemotherapy treatment, fatigue and shortness (or loss) of breath, insomnia, loss of appetite, vomiting, diarrhea, wheezing, and coughing up blood. The severity of these symptoms varied, although most patients reported that their symptoms were severe or extreme. In some instances, patients reported being confined to bed or a wheelchair due to severe pain, having to stop driving, and difficulty walking or climbing stairs. One group that expressed the views of pediatric patients noted the need to manage the following cancer-induced symptoms: trouble swallowing and breathing, difficulty breathing, loss of appetite, and cachexia. Patients also experienced various disease- and treatment-specific complications. For example, sarcoma patients must sometimes contend with surgical amputation of a limb as a treatment, which is associated with a significant and lengthy rehabilitation process and the need to become comfortable with prosthetics. Some patients develop growths in various parts of the body that lead to appearance anxiety, annoyance, and pain.
The patient input stated that the debilitating symptoms cancer patients experience invariably affect their everyday life and activities. Patients are often restricted to limited forms of physical work, which can greatly reduce or completely diminish their employment opportunities. In addition, household activities and chores become difficult and sometimes impossible to carry out. Patients reported an inability to participate in social activities and hobbies, play sports, participate in family gatherings, and maintain a personal life. Their professional careers are often ruined, or severely limited, financial burdens become overwhelming, and some find themselves in significant debt to pay for treatments, resulting in the loss of their home, breakup of their marriage, and end of their career. All of these inevitably affect their psychological well-being, and patients reported a constant feeling of anxiety, depression, fear, and poor mental health. Overall, all aspects of patients’ lives are severely affected by the cancer and treatment-induced symptoms, resulting in a poor quality of life. One patient expressed her current state with breast cancer in the following way:
I’m 43 now and I will be in treatments for the rest of my life. I have a very difficult time still trying to figure out how to move forward while taking advantage of all the wonderful moments I still have. I have no choice but to continue to battle this war that my body has bombarded my family and me with… the most difficult aspect is planning for my mortality and trying to keep my chin up and not burden my family.
It was noted that the negative impacts that patients experience in their daily lives, mental health, and overall quality of life invariably seep into the lives of their caregivers. Caregivers often must devote a significant portion of their time to caring for family members or friends suffering from cancer. As a result, all aspects of their daily lives are negatively affected. Caregivers consulted by the patient groups described their experience as physically and emotionally draining; they felt stress in their own lives, feared for the survival of patients they cared for, and suffered from a poor quality of life.
Experiences With Currently Available Treatments
As with patient experiences with disease, treatment regimens depend on the underlying cancer location, stage, type and subtype, availability and access of effective alternative treatment, and toxicity profile. The following section provides a general description of the various treatments patients receive to manage their disease and symptoms, as well as the benefits and challenges of the existing therapy options.
Overall, patients participating in the surveys received 1 or more of the following therapies — alone, in combination, or sequentially (based on guideline or consensus-driven algorithm): systemic chemotherapy, radiation therapy, immunotherapy, (targeted) surgery, and/or oral adjuvant and oral adjunct therapies. Chemotherapy was by far the most common form of treatment irrespective of cancer type, histology, and metastatic status, in patients with NSCLC, SBC, CRC, sarcoma, thyroid cancer, salivary gland tumour, glioblastoma, IFS, and other less-commonly reported cancers. While chemotherapy is reportedly a viable treatment option in some instances, this was described as ineffective in halting tumour growth or progression, and was associated with various side effects, some of which were unmanageable, such as extreme fatigue, pain, nausea, diarrhea, weight loss, skin issues, food allergies, and edema. For a few patients, treatment was associated with rare but excruciating eczema, failure to thrive, or memory loss. In addition, patients and their caregivers reported that the need for hospitalization, commuting, and managing side effects were added burdens of chemotherapies, particularly from a financial standpoint. The low effectiveness and high toxicity of chemotherapies invariably resulted in loss of productivity and poor quality of life for the patients and their caregivers.
Immunotherapy, particularly for patients with NSCLC, temporarily demonstrated an improvement in managing disease progression and minimizing side effects; however, this treatment was not able to prevent disease progression.
Radiation therapy was seen as an important treatment option, particularly for patients with colorectal cancer, thyroid cancer, salivary gland cancer, and glioblastoma. Similar to chemotherapies, the effectiveness of radiation therapy varied by patient depending primarily on cancer location, type and subtype, stage, and treatment history pre- and post-radiation. Radiation therapy was also associated with significant side effects; patients reported treatment-induced toxicities similar to those for chemotherapies, most notably fatigue, pain, nausea, diarrhea, weight loss, and skin issues.
Partial or complete surgical resection of tumours was described as a relatively effective treatment option in the early stages of several cancer types. However, as noted by some patients, surgery is not an infallible method to halt or prevent disease progression, even when cancer is diagnosed early. Further, surgery is not feasible in metastatic cases and in some cancer types, such as STS. Surgery is often supplemented with chemotherapy or radiation therapy before or after, resulting in the addition of the side effects associated with these treatments. Furthermore, surgery is often associated with the undesired outcome of the amputation of a critical limb or body part, which adds the burdens of long-term rehabilitation, adjustment with prosthetics, and physical and mental challenges associated with the predicament. The following quote captures the plea of a patient with little to no effective treatment available:
Had you asked me some of these questions 4 years ago, the answers would have been different. My oncologist tells me that I am running out of treatment options. […] It is very scary to face the day (soon) when I will have no treatment and the cancer will be allowed to run its course.
In addition to the treatments described previously, a number of adjuvant oral medications were described by the patients as supplemental therapies to prevent or halt tumour growth and the progression of disease, and/or increase the chances of survival. These medications have varying degrees of effectiveness and side effects, although the side effects were described as manageable overall. These adjuvant therapies were noted as particularly efficacious when guided by the underlying mutational status of a patient’s tumour. However, mutational diagnosis was reportedly not always part of the standard treatment procedure.
Improved Outcomes
The aspects of disease and outcomes highlighted by patients as important were largely similar irrespective of tumour type, and included disease control, extension of life, improvement in quality of life, and minimal or tolerable toxicity. Patients expected a new therapy to improve PFS and OS, delay disease progression, reduce cancer- and treatment-induced symptoms, and provide longer-lasting, durable, and well-tolerated treatment. The presentation of cancer- and treatment-associated side effects varied by individual and cancer type; however, all patients overwhelmingly shared a common desire for no or minimal cancer-induced symptoms and treatment-induced side effects. Trade-offs commonly considered when choosing a therapy included extended OS and PFS and quality of life. Some patients reported that an improved quality of life is no less important than extension of survival, whereby one can resume a daily life as normal as possible. Another important consideration for patients is accessibility and relative ease of administration, so that any additional burden from travel, hospital visits, and resulting costs are minimized. Patients strongly value personal and professional life experiences from family, friends, personal interests, and careers, making a treatment option that allows them to prolong survival, manage symptoms and the underlying cancer, and improve quality of life with no or minimal and manageable side effects highly desirable. Patients also expressed a desire for a treatment that specifically targets the underlying NTRK mutation and minimizes the non-specific targeting of other tissues and organs is highly desired. Below are some quotes from the patients that captures their views from a new treatment:
“I never really had a good response to any of the previous therapies. My tumours just kept growing and spreading which is why I am so happy to be on Vitrakvi. I became so ill where I was given a timeline for death.”
“Nothing worked for me. My disease progressed on every therapy I have been on before larotrectinib.”
Experience With Drug Under Review
Input from 28 patients experienced with larotrectinib (3 from LCC, 13 from CCC, and 12 from the CCSN) was scarce given the relative rarity of cancer types with an NTRK mutation, with even fewer patients eligible or having had access to this treatment. Patients had access to the drug via clinical trials, special access programs from the sponsor or their government, scholarships, and insurance plans. In all instances, patients received larotrectinib after failing on multiple therapies, sometimes as a last treatment option, and had no possible alternative.
Overall, patients reported a reduction in tumour size, spread, and a general stabilization in cancer progression. After being on the treatment for a period ranging from a few months to a few years, most patients reported that they had achieved a complete or partial remission in all or nearly all cancer sites. In 1 particular case, a patient noted improved symptoms within days, and nearly full tumour shrinkage within a month. Few cases of recurrence were reported, although most noted a histological disappearance of cancer tissues with supplementary radiation or other therapies. In all cases, patients perceived larotrectinib as vastly superior to current treatment alternatives.
Patients also reported an improvement in their cancer- and treatment-induced symptoms after treatment with larotrectinib. Regardless of cancer type, patients reported that they felt both physically and mentally better, that their pain was resolved or greatly reduced, and that they were able to resume or return to daily activities, function, and participate in social activities and work. Some patients indicated larotrectinib treatment allowed them to progress from being in the last stage of life to being disease-free. Larotrectinib showed a similar effectiveness in pediatric patients, where the response was described as life-saving, with markedly improved disease response rates seldom observed with traditional therapies. In addition to the histological, physical, and mental improvement, both pediatric and adult patients greatly appreciated the convenience of the oral route of administration of larotrectinib, which they considered a feature that could make the uptake of this drug very high. The benefit of circumventing the need for IV chemotherapy or invasive surgery was also regarded as a key advantage of larotrectinib over standard of care, as the cost and inconvenience of commuting, hospitalization, and various complications associated with dosing and administration were causes of concern. Patients also welcomed the drug due to its targeted nature, particularly as larotrectinib is the only known therapy targeted at NTRK gene fusion.
Larotrectinib was also described as a relatively well-tolerated treatment, with few and manageable side effects. The most common side effects reported with larotrectinib treatment were myalgia, dizziness, diarrhea, mild constipation, withdrawal symptoms as the next dose approached, nerve sensations, skin tenderness, ear pain, minor or moderate fatigue, minor cough, general unwellness that resolved with a dose adjustment, and elevated liver enzymes. Following are some quotes from patients describing their experience with larotrectinib:
“The worry that it won't be covered by our private insurance or our government insurance. If the tumours are inoperable and the other therapies won't work, the worry that Vitrakvi will not be available in Canada is very difficult.”
“To be able to have a normal life and go to work, to the theatre, dinner, social events, charitable events, go to the gym, and go out with my partner is priceless.”
“I had the most extraordinary response. I had so many tumours – they couldn’t count how many tumours I had in my lymph nodes, liver, kidneys etc. and they certainly couldn’t remove them surgically. I remember, at one point, they had doubled in size and number in just 5 days. They were growing and spreading so fast. I recall being so ill in hospital bed just before starting this Vitrakvi. I was told I had 3-4 weeks to live. I couldn’t even sit in a chair. They started me on the drug and in just one week, I felt remarkably better and I kept feeling better and better after that. After the first CT scan, all my tumours were gone except for one which had shrunk by 65%. Now that tumour has disappeared and is merely scar tissue. I no longer have any sign of cancer detectable through CT and there have been no new tumours. I am an NED patient because of Vitrakvi. I am fully restored.”
“I wish I could have been spared dizziness, short-term memory loss and so much more from the other therapies I had to endure. This is a therapy that spares patients from toxic effects. I have had to give up driving because of brain radiation affecting cognitive skills and memory loss. I just didn’t want to kill someone or myself. This could have been avoided had I been able to access Vitrakvi. Others can be spared this.”
Companion Diagnostic Test
All patient groups unequivocally indicated the importance of having a testing platform to detect NTRK fusion mutations. The respondents indicated that testing early in the treatment scheme may allow them to receive this targeted therapy, thereby saving precious time that may be wasted on less-effective treatment. Given the indication of larotrectinib, an established testing platform with costs covered by public or private insurance was seen as imperative. Patients spoke of the ease of receiving genomic testing, with several patients indicating that faster results would be a welcome change.
Additional Information
Patients perceived the effectiveness and safety profile of larotrectinib as substantially better than current alternatives and valued its ease of administration. Among patients who often have no other effective treatment option, larotrectinib was considered a great step forward that offered much-needed hope.
Clinician Input
Input From the Clinical Expert Panel Consulted by CADTH
All CADTH review teams include at least 1 clinical specialist with expertise in the diagnosis and management of the condition for which the drug is indicated. Clinical experts are a critical part of the review team and are involved in all phases of the review process, providing guidance on the development of the review protocol, assisting in the critical appraisal of clinical evidence, interpreting the clinical relevance of the results, and providing guidance on the potential place in therapy. In addition, as part of the larotrectinib review, a panel of 5 clinical experts from across Canada was convened to characterize unmet therapeutic needs, assist in identifying and communicating situations where there are gaps in the evidence that could be addressed through the collection of additional data, promote the early identification of potential implementation challenges, acquire further insight into the clinical management of patients living with a condition, and explore the potential place in therapy of the drug (e.g., potential reimbursement conditions). A summary of this panel discussion follows, along with specific input received from the clinical experts consulted by CADTH.
Unmet Needs
Overall, the clinicians felt that it was difficult to specify the unmet need given the breadth of potential advanced solid tumours. However, they agreed that, in the case of metastatic solid malignancies, virtually all patients eventually progress on currently available therapies, with the possible exception of select patients receiving immunotherapies in select cancer types.
One clinician noted that the data to date for larotrectinib suggest a response rate that generally exceeds many available standard treatments. In some settings, there are no established and efficacious treatments, and larotrectinib would fill an unmet need. The following examples were provided in the clinician input: MASC, a rare malignancy with a very high prevalence of NTRK fusions and no established treatment options; differentiated thyroid cancer; anaplastic thyroid cancer, which has a dismal prognosis with standard cytotoxic treatments; and unresectable sarcomas in adults for whom currently available chemotherapy often does not offer enough response to facilitate surgery. The clinician also noted that chemotherapy results in toxicity not associated with NTRK inhibitors, further affecting quality of life.
The clinicians commented that, in the absence of access to selective NTRK inhibitors suitable for use in pediatric patients (which are currently available only through clinical trials and patient support programs in Canada), there is specifically unmet needs for the following groups:
Children with unresectable or metastatic IFS and STS undergo cytotoxic chemotherapy with acute and long-term toxicities, and some may be unable to avoid disfiguring surgeries. Those with chemorefractory disease have no curative alternative therapy options.
Children and adolescents with radioactive-iodine refractory NTRK fusion–positive thyroid cancers who may need repeated invasive surgeries but have no access to effective systemic therapies.
Children with unresectable and progressive and/or symptomatic LGG who do not respond to conventional chemotherapy and may have additional disease-related morbidity (e.g., loss of vision due to progressive optic pathway glioma) or require multiples surgeries, and ultimately radiation therapy (when old enough).
Children with NTRK fusion HGGs that are unresectable or refractory to chemotherapy and who have no alternative curative options.
Overall, the clinicians felt that an ideal treatment would prolong survival, which was noted as the most important goal for adult patients with advanced, incurable disease. Additional important treatment goals included minimizing toxicity, decreasing cancer-related symptoms (i.e., pain and shortness of breath), maintaining or improving quality of life, delaying disease progression, improving performance status, prolonging life, maintaining independence, and reducing burdens on caregivers. Additionally, the clinicians noted that an ideal treatment would be accessible to all age groups and would result in disease response facilitating curative surgery. This could prevent the need for aggressive and disfiguring surgeries (e.g., in patients with IFS or STS), neurocognitively devastating radiation therapy (e.g., in patients CNS tumours in young children) while avoiding the known significant long-term side effects of conventional alkylator and anthracycline chemotherapy in young children. The clinicians felt that achieving durable remissions and a cure in children with NTRK fusion cancers would reduce short- and long-term burdens on health care systems, and improve quality of life and survival.
Place in Therapy
In adult patients, given the risk of patient attrition across lines of therapy, the clinicians recommended that larotrectinib be considered early in the course of NTRK fusion cancer treatment. In most NTRK fusion cancers, this would be after a first line of standard therapy. One clinician added that this would be particularly relevant in settings with no, limited, or inefficacious treatments (e.g., when treating MASC, anaplastic thyroid cancer, or sarcoma with NTRK gene fusion).
For pediatric patients, 1 panellist indicated that larotrectinib would be considered as the first-line treatment of rare cancers with NTRK fusion, such as in patients with IFS or another STS who have unresectable or metastatic disease; as a second-line treatment in NTRK fusion–positive thyroid carcinoma patients after surgery and radioactive-iodine therapy; as a first- or second-line treatment (in the absence of a clinical trial) in patients with NTRK fusion–positive LGGs that are unresectable and progressive or symptomatic after failure of conventional chemotherapies; as a first-line treatment in patients with NTRK fusion–positive HGGs that are unresectable; and in a young child for whom radiation therapy is not feasible.
The clinicians noted that the appropriateness of recommending that patients try other treatments before initiating treatment with larotrectinib would depend on the cancer subtype and efficacy of front-line therapy. For example, in melanoma, immunotherapy can result in an excellent and durable response, and this would take precedence over larotrectinib.
Patient Population
Clinicians indicated that larotrectinib should be considered in adult and pediatric patients with a good performance status and advanced solid tumours that harbour an NTRK fusion. Patients with a CNS tumour are in high need of an intervention, and larotrectinib offers a targeted therapy with minimal morbidity when there are few or no other options. Patients with a relapsed and/or refractory, unresectable, or metastatic NTRK fusion–positive STS (including IFS) and HGG have the greatest need.
When asked how to identify the patients best suited for treatment with larotrectinib, the clinicians noted that, aside from the rare tumours in which NTRK fusions are common (such as IFS or MASC), they are relatively rare in common cancers, and a diagnostic testing algorithm would therefore be required. Given the rarity, targeting tumour NTRK assessment in enriched populations may also be required. Specifically, routine clinical testing (i.e., FISH) establishes NTRK fusion status in classic histologies (e.g., IFS and CMN). Fusion panels in NGS are routinely used for other STS cases at diagnosis and include NTRK coverage. In patients with glioma who lack BRAF (V600E) or BRAF fusion, H3K27M mutations will require NGS testing that includes NTRK1, NTRK2, and NTRK3 gene fusions. Patients with differentiated thyroid cancer that is either unresectable or progressive and/or symptomatic after surgery and refractory to radioactive-iodine therapy will receive NGS screening. Reflex testing should also be considered. The clinicians noted that patients with poor performance status, those who are unable to tolerate oral therapies, patients who lack NTRK gene fusions, and patients who have resectable disease would be least suitable for treatment with larotrectinib. In adult patients, the clinicians were not aware of any additional predictive biomarkers of efficacy for larotrectinib beyond the presence of NTRK gene fusion.
Assessing Response to Treatment
In terms of outcomes that are used to determine whether a patient is responding to treatment in clinical practice, the clinicians indicated that typical metrics of treatment efficacy include disease evaluation by cross-sectional imaging modalities (MRI, CT, PET/CT) to assess response by RECIST (for solid tumours) or RANO (for CNS tumours), symptom improvement, treatment tolerability, and time to progression. In addition, for patients with differentiated thyroid cancer, thyroglobulin levels are monitored.
The clinicians noted that, in adults, objective response, non-progression, patient-reported improvements in their ability to perform activities, improved survival, stabilization, improvement, or reduced severity of symptoms would all be considered clinically meaningful outcomes. In pediatric patients, a clinically meaningful response to treatment would include improved survival; avoidance of aggressive and disfiguring surgeries or amputation; avoidance of neurocognitively devastating radiation therapy; improvement in symptoms, quality of life, and other patient- or parent-reported outcomes; and avoidance of long-term side effects of therapy for survivors of childhood cancer, such as cardiomyopathy (anthracycline), infertility (alkylators), second malignancy (alkylators, radiation, and radioactive iodine), pulmonary fibrosis (alkylators and radiation), or neurocognitive impairment (radiation therapy).
Clinicians noted that treatment response is typically assessed every 3 months in adults and pediatric patients, and once response is established or remission is achieved, this interval may be prolonged.
Discontinuing Treatment
In adult patients, the clinicians noted that treatment failure would be determined by disease progression, treatment intolerability, or patient request to discontinue treatment. In pediatric patients, the clinicians noted that therapy could be stopped if a response was achieved that facilitated curative surgery, or imaging evaluations produced objective evidence of disease progression. However, the optimal duration of treatment in children with a CNS tumour is still not known.
Prescribing Conditions
The clinicians reported that all treatment settings are appropriate for larotrectinib administration in adults, given that it is an oral therapy. They also noted that larotrectinib therapy for pediatric patients should be supervised by a subspecialty of pediatric oncology, or an endocrinology team based at 1 of 16 Canadian pediatric oncology programs.
The clinicians also noted the requirement for NTRK fusion status of the tumour to be documented. This can be done with FISH (which is routine in IFS or CMN) or NGS panels (for non-IFS, STS, glioma, and differentiated thyroid tumours), and that immunohistochemistry (IHC) screening has utility in non-CNS histologies.
Clinician Group Input
This section was prepared by CADTH staff based on the input provided by clinicians.
A total of 9 clinician group inputs were received for the review of larotrectinib for solid tumours harbouring a NTRK gene fusion. All were joint clinician inputs, comprised primarily of oncologists, from the following groups: Advanced Thyroid Cancer (ATC; 4 clinicians); Canadian Gastrointestinal Oncology Evidence Network (CGOEN) with the Medical Advisory Board of Colorectal Cancer Canada (CCC) and other GI cancer-treating clinicians (19 clinicians and pathologists); Ontario Health Cancer Care Ontario (OH-CCO) Gastrointestinal Cancer Drug Advisory Committee (DAC) (4 clinicians); OH-CCO Head, Neck, and Thyroid Cancer (HNTC) DAC (3 clinicians); LCC (1 clinician on behalf of 18 clinicians), OH-CCO Lung and Thoracic Cancer (LTC) DAC (4 clinicians), Pediatric Oncology Group of Ontario (POGO) (8 clinicians), Pediatric Oncology Group (POG) (3 clinicians); and OH-CCO Skin Cancer DAC (6 clinicians). In total, input was received from 52 oncologists.
Unmet Needs
A common theme was echoed across clinician groups with respect to treatment goals and unmet needs. Irrespective of tumour histology and subtype, the goal of treatment was to minimize cancer and treatment-induced symptoms, as well as to achieve meaningful improvement in the following areas: life expectancy and survival, PFS, response rate, HRQoL, control or delay of disease progression, and duration of response. The tolerability of treatment was another key treatment goal shared unanimously by the clinician groups. Several clinician groups, including the OH-CCO LTC DAC and CGOEN, indicated the need for a therapy that specifically targets the underlying tumour biology or disease-causing factor(s), in this case, NTRK fusion. In addition, several clinician groups referred to a number of treatment goals specific to some cancer types. These included prevention of brain metastases and skeletal-related events in the case of advanced thyroid cancer and minimizing the life-long impact of surgery, particularly in pediatric cases (i.e., IFS), even when such interventions were feasible. Clinicians noted that improvements in patients were expected to reduce caregiver burden, another key treatment goal.
All clinician groups agreed that patients with advanced stages of cancer almost always failed on multiple therapies, leaving them with limited effective therapeutic options (i.e., therapies that extend survival without compromising quality of life), or any treatment at all. The following cancer types were noted as particularly nonresponsive to current therapies or as types that inevitably become refractory over time: stage IV or advanced NSCLC, advanced colorectal cancer, gastrointestinal cancer, and some forms of skin cancer. Example of tumours with little or no available treatment options include thyroid cancer, salivary gland tumour, and MASC of the salivary glands. For some cancer types, treatment options were based on low-quality evidence and associated with significant toxicity in addition to low efficacy. Pediatric patients have similar unmet needs. Infants, children, and adolescents with metastatic tumours such as sarcomas and thyroid malignancies have minimal treatment options to provide even transient disease response; the need for an effective and low-toxicity therapy is not met. Treatments for other HGGs, such as palliative chemotherapy and radiation therapy for intracranial HGGs, were considered less effective in sustaining response, stabilizing, or reducing disease burden. Some patients have an unmet need for an effective therapy at second or subsequent lines. Finally, the lack of a targeted therapy for NTRK gene fusion was a notable unmet need. Clinicians agreed that a treatment based on tumour genomics, rather than the tissue of origin, would constitute an important advance.
Place in Therapy
All clinicians agreed that larotrectinib should be used as a monotherapy. With respect to which line of therapy larotrectinib should be used in, their responses varied, depending on cancer type and underlying cause, stage, and the availability of the treatment, as well as the efficacy and toxicity of treatment alternatives. While the current practice and the indication of larotrectinib is for use after all other treatment options have been exhausted, clinicians noted that larotrectinib could be prioritized in certain circumstances.
First, some clinicians suggested that larotrectinib could be used as a first-line therapy for NTRK fusion cases because its mechanism of action targets the driver mutation (e.g., in NTRK-positive NSCLC, gastrointestinal cancer, differentiated thyroid cancer, or advanced anaplastic thyroid cancer).
Second, clinicians suggested that larotrectinib may be used early in a treatment scheme when 1 or more of the following circumstances are present: absence of any treatment alternative, certain cases of refractory tumours, or cancers with poor prognosis. Examples include salivary gland tumours, advanced radioactive-iodine refractory thyroid cancers, and anaplastic thyroid cancers, respectively. The LCC group noted that first-line use of larotrectinib would be more likely if diagnosed with NGS analysis, and that it provides an opportunity to avoid the potential toxicities of CNS radiotherapy as CNS metastasis is a common occurrence in these patients.
With the exception of these circumstances, clinicians indicated that larotrectinib would generally be used as second- or subsequent-line therapy. For example, larotrectinib was expected to be used after chemotherapy and immunotherapy in lung cancer, or after conventional therapies in gastrointestinal cancer. In pediatric cases, larotrectinib was expected to be used as a second-line treatment in diseases with good prognoses and as a front-line option in diseases with poorer prognoses.
Patient Population
All clinician groups indicated that the patient populations with the greatest unmet need for larotrectinib treatment would be those harbouring NTRK fusion, and that this is also the group expected to be best suited for this treatment. The targeting of the driver mutation by larotrectinib was regarded as the primary reason for the clinicians’ expected benefit of the drug. This was noted irrespective of the cancer type and location, including melanoma and salivary gland, gastrointestinal, lung, and thyroid cancers. The rarity of NTRK fusion in otherwise common cancers such as those of the lung, thyroid, and gastrointestinal system were noted as an important reason for the lack of treatment options in this subpopulation. In some cases, (e.g., in metastatic CRC and advanced radioactive-iodine refractory anaplastic thyroid cancer with NTRK fusion), patients reportedly have an extremely poor prognosis, highlighting the unmet need for treatment for these populations. Aside from NTRK status, patients with a good performance status were considered the most suitable candidates. In the case of pediatric cancers, patients with a poor prognosis were candidates for larotrectinib, unlike those with favourable prognosis. This includes infants with IFS or high-grade intracranial gliomas, if NTRK fusion mutation was present.
As with treatment suitability, the overwhelming reason for not considering larotrectinib treatment was the absence of an NTRK mutation. With respect to treatment unsuitability due to contraindication, clinicians in the LCC group noted that patient age, performance status, or comorbidities were more frequently a contraindication to current standard of care options. In children, patients with an alternative low-morbidity curative option may be least suitable for front-line therapy with larotrectinib given the lack of long-term efficacy data.
Patients would be selected for treatment by testing for NTRK through companion diagnostics. Clinicians noted that a number of testing platforms and programs are available in Canada. Testing NTRK using NGS panels was described as the optimal test, although several clinician groups reported different methods for optimizing patient selection. In addition to tumour testing for NTRK fusion, clinical judgment was considered necessary to identify patients in an efficient manner. Some clinician groups indicated that IHC is carried out first to identify NTRK mutations, followed by confirmation with NGS. The CGOEN group noted a diagnostic framework to improve the selection of patients with NTRK fusion involving testing in high-risk groups such as patients with BRAF/RAS wild-type, high-level MSI colorectal carcinoma, and MLH1-promoter hypermethylation. Clinical judgment was also noted as key to identifying patients with a higher likelihood of NTRK fusion (i.e., those with characteristics in line with larotrectinib treatment eligibility). For pediatric patients, NTRK testing is routinely carried out for histologies in which fusion is common, specifically IFS, CMN, SBC, and MASC. However, in cancers with a low frequency of NTRK alterations (i.e., HGGs, metastatic sarcomas, and metastatic papillary thyroid cancers), NTRK positivity may be detected as part of broader tumour-sequencing efforts or by targeted assessment by IHC or a genetic assessment.
Among the currently available platforms, Bayer’s FAST-TRK program, and several provincial and local genomic testing programs, such as the Ontario-wide Cancer TArgeted Nucleic Acid Evaluation, were noted by the clinicians. Some groups indicated that many other centres currently perform NGS panels, and they expected that testing will increase with time as multiple molecular subtypes of various cancers (e.g., EGFR, ALK, ROS1, BRAF, KRAS G12C, Her2, c-Met exon14, RET fusion and NTRK fusions) will be incorporated in the same testing platforms.
Assessing Response to Treatment
Clinicians noted that the outcomes used in clinical practice align with the those typically used in clinical trials. These include a combination of any of the following: clinical assessment of OS, PFS, treatment tolerance, and quality of life; blood work; imaging (CT, MRI or PET); tumour markers (thyroglobulin in differentiated thyroid cancers); radiologic response; and performance status.
The following were noted by clinicians to be clinically meaningful responses to treatment: stabilization, no deterioration of symptoms, reduction in disease-related symptoms (e.g., pain, dyspnea, fatigue, and weight loss), overall reduction in tumour burden, and improvement in survival. In addition, an improved sense of well-being, being more active clinically, and being able to carry out more activities of daily living were important indicators of treatment efficacy. In pediatric cancer, clinically meaningful responses can vary given the variety of histologies and presentations in the potential patient population. For example, in patients with IFS, clinically meaningful responses would include the facilitation of a low-morbidity resection. In patients with an HGG, a clinically meaningful response may be stable disease and/or improvement of existing neurologic deficits.
With respect to the frequency of monitoring treatment responses, clinicians noted a period of 2 to 6 months, depending on the clinical presentation and type of assessment performed. Clinical assessment should be carried out every 2 to 4 weeks, although 4 to 8 weeks was noted by some clinicians. Assessments should be conducted at the following time points: every 2 to 3 months for imaging (although CT scans could be done every 3 to 6 months), every 4 weeks for tumour markers, every 8 to 12 weeks for radiology; and every 4 weeks for bloodwork and physical exams. Early assessment (i.e., 2 to 4 months) was favoured in patients initiating therapy. Patients showing sustained responses may require assessment less frequently, particularly if there are challenges such as sedation requirements around radiologic assessment.
Discontinuing Treatment
Overall, clinicians noted disease progression and certain unacceptable toxicities as the key factors when considering treatment discontinuation. Progression of disease should be based on deterioration in clinical status and objective progression on imaging. Significant AEs requiring dose interruption or discontinuation could vary by cancer and treatment type; the advanced thyroid cancer group noted grade 3 or higher elevated liver enzymes, and grade 3 or higher neurologic AEs (i.e., delirium, dysarthria, dizziness, gait disturbance, and/or paresthesia) as examples of unacceptable side effects. The Pediatric Oncology Group of Ontario noted that decisions to stop therapy in patients with a clinical response should be made in conjunction with patients and their families, considering both the clinical impact of therapy and the acceptability of associated toxicities.
Prescribing Conditions
Overall, clinicians noted disease progression and certain unacceptable toxicities as the key factors when considering treatment. Patients will be assessed and prescribed larotrectinib at cancer centres, with the medication administered at home in an outpatient setting as it is an oral medication and does not require a medical setting for administration. For pediatric patients, a specialized pediatric cancer program may be necessary.
Drug Program Input
The drug programs provide input on each drug being reviewed through CADTH’s reimbursement review processes by identifying issues that may affect their ability to implement a recommendation. The implementation questions and corresponding responses from the clinical experts consulted by CADTH are summarized in Table 6.
The PAG includes representatives from provincial cancer agencies and provincial and territorial Ministries of Health participating in pCODR. The complete list of PAG members is available on the CADTH website (www.cadth.ca/pcodr). The PAG identifies factors that could affect the feasibility of implementing a funding recommendation.
Overall Summary
Input was obtained from all 9 provinces (ministries of health and/or cancer agencies) participating in pCODR. The PAG identified the following as factors that could affect implementation:
clinical factors:
place in therapy for larotrectinib
economic factors:
additional health care resources may be required to monitor and treat toxicities
number of patients requiring and access to NTRK gene fusion testing.
More details are supplied in the following section.
Currently Funded Treatments
The PAG identified that there is no standard of care for the treatment of adult and pediatric patients with locally advanced or metastatic solid tumours harbouring NTRK gene fusion. Treatment is dependent on the specific type of solid tumour, and clinical trials may be offered to patients harbouring NTRK gene fusion. For patients who have experienced disease progression on all available treatment options, best supportive care would be available. The PAG concluded that the relevant comparator for this drug submission would be best supportive care. Because best supportive care is meant to alleviate patient discomfort, the PAG appreciates a demonstration that larotrectinib improves quality of life or other outcomes meaningful to patients, relative to usual care.
Eligible Patient Population
The 3 pivotal trials of larotrectinib are a phase I study in adult patients with solid tumours, the SCOUT trial in advanced pediatric solid or primary CNS tumours, and the NAVIGATE trial in patients with NTRK fusion–positive solid tumours. The PAG observed that this resubmission to CADTH includes an expanded pool of patients, including those with an ECOG status of 0 to 2, an LPS score of greater than 40%, or a KPS score of greater than 50%. The PAG is seeking guidance on the use of larotrectinib in patients with a poor performance status (i.e., an ECOG status > 2, an LPS score < 40%, and a KPS score < 50%).
If larotrectinib is recommended for reimbursement, the PAG noted that patients harbouring NTRK gene fusion and currently on other treatments would need to be addressed on a time-limited basis. The PAG identified potential indication creep in the use of larotrectinib in earlier lines of treatment or when other lines continue to be available, and as an alternative to surgical resection (i.e., not only for patients in whom surgical resection would result in severe morbidity).
Implementation Factors
Depending on other treatment options, larotrectinib may be associated with less chair time, which would be an enabler to implementation. Larotrectinib is available as a capsule or oral solution formulation. The PAG noted that the oral solution formulation, particularly for pediatric patients or those unable to take the capsule form, would be an enabler of implementation. However, dispensing larotrectinib would require additional pharmacy resources.
Additional health care resources (e.g., frequent clinic visits while patients are on therapy) are required to monitor adverse effects and tolerability with larotrectinib.
Larotrectinib is an oral drug that can be delivered to patients more easily than can IV therapy in both rural and urban settings, as patients can take oral drugs at home. PAG identified that the oral route of administration is an enabler of implementation. However, in some jurisdictions, oral medications are not funded through the same mechanism as IV cancer medications. This may limit accessibility of treatment for patients in these jurisdictions as they would first require an application to their pharmacare program and these programs can be associated with copayments and deductibles, which may cause a financial burden on patients and their families. Other coverage options in those jurisdictions that fund oral and IV cancer medications differently include private insurance coverage or full out-of-pocket expenses.
Sequencing and Priority of Treatments
PAG recognizes that larotrectinib would be positioned as last-line therapy. As such, patients would experience a customary series of tumour-specific treatments, culminating with this drug upon failure of all options.
Companion Diagnostic Testing
PAG noted that NTRK gene fusion testing is not routinely available in all provinces. Some jurisdictions do not currently have testing for NTRK gene fusion available, and other options, such as sending tissue samples out of province, would need to be explored. As there is no formalized testing process or funding in place for NTRK gene fusion testing in all jurisdictions, this would be a barrier to implementation. Health care resources and coordination to conduct NTRK gene fusion testing will also be required. The increase in costs for NTRK gene fusion testing is a barrier to implementation.
PAG had concerns related to:
the turnaround time for NTRK gene fusion testing
guidelines on criteria for testing and whether all patients should be tested
the expected number of patients eligible for larotrectinib (e.g., anticipated number of patients requiring testing per year, with tumours harbouring a NTRK gene fusion, and who would receive larotrectinib treatment)
timing of testing and whether patients should be tested at diagnosis or at relapse.
The number of patients requiring access to NTRK gene fusion testing may therefore be a barrier to implementation.
Additional Information
None.
Table 6: Summary of Drug Plan Input and Clinical Expert Response
Drug program implementation questions | Clinical expert response |
|---|---|
The PAG observed that this resubmission to pCODR includes an expanded pool of patients. The PAG noted that these trials included patients with an ECOG status of 0 to 2, LPS score > 40%, or KPS score > 50%. The PAG is seeking guidance on the use of larotrectinib in patients with poor performance status (i.e., ECOG > 2, LPS score < 40%, and KPS score < 50%). | Patients with worse performance scores would not have been eligible for the phase I/II clinical trials, as would be standard. However, as larotrectinib is oral and well-tolerated, the clinical experts noted that children with worse performance scores, which is fortunately very rare, may still benefit from the opportunity to access this therapy for TRK fusion cancers. |
With respect to NTRK gene fusion testing, how are patients currently being tested? Should all adult and pediatric patients with locally advanced or metastatic solid tumours be tested, or specific types of solid tumours? Should testing be available at all cancer centres? When should testing be completed (i.e., at diagnosis or at time of relapse)? | For adults: There will need to be a provincial approach to testing and there may be selected enriched populations to test (e.g., mCRC with MLH1-promoter hypermethylation). As well, at tumour sites where NGS testing is done routinely, this could be incorporated without significant incremental cost. Testing should be completed at diagnosis or in the first-line treatment setting. For pediatrics: The clinical experts noted that testing depends on the underlying tumour diagnostic category:
|
CMN = cellular congenital mesoblastic nephroma; ECOG = Eastern Cooperative Oncology Group; FISH = fluorescence in situ hybridization; HGG = high-grade glioma; IFS = infantile fibrosarcoma; KPS = Karnofsky Performance Scale; LGG = low-grade glioma; LPS = Lansky Performance Scale; mCRC = metastatic colorectal cancer; NGS = next-generation sequencing; NTRK = neurotrophic tyrosine receptor kinase; PAG = Provincial Advisory Group; TRK = tropomyosin receptor kinase.
Clinical Evidence
The clinical evidence included in the review of larotrectinib is presented in 3 sections. The first section, the systematic review, includes pivotal studies provided in the sponsor’s submission to CADTH and Health Canada, as well as those studies that were selected according to an a priori protocol. The second section includes alternative methodologies to evaluate the ORR and PFS from the sponsor. No indirect evidence met the inclusion criteria for this review.
Systematic Review (Pivotal and Protocol-Selected Studies)
Objectives
To perform a systematic review of the beneficial and harmful effects of larotrectinib (adults: 100 mg taken orally twice daily; pediatric patients: 100 mg/m2 taken orally twice daily up to a maximum of 100 mg per dose) for the treatment of adult and pediatric patients with solid tumours that have NTRK gene fusion without a known acquired resistance mutation, are metastatic or for whom surgical resection is likely to result in severe morbidity, and have no satisfactory treatment options.
Methods
Studies selected for inclusion in the systematic review included pivotal studies provided in the sponsor’s submission to CADTH and Health Canada, as well as those meeting the selection criteria presented in Table 7. Outcomes included in the CADTH review protocol reflect outcomes considered to be important to patients, clinicians, and drug plans.
Table 7: Inclusion Criteria for the Systematic Review
Criteria | Description |
|---|---|
Patient population | Adult and pediatric patients with locally advanced or metastatic solid tumours harbouring NTRK gene fusion. Subgroups:
|
Intervention | Larotrectinib (adults: 100 mg taken orally twice daily; pediatrics: 100 mg/m2 taken orally twice daily up to a maximum of 100 mg per dose) |
Comparators | Standard of care for each histologic tumour type, such as:
|
Outcomes | Efficacy outcomes
Harms outcomes
|
Study design | Phase II, III, or IV randomized and non-randomized trials |
AE = adverse event; ALT = alanine transaminase; AST = aspartate aminotransferase; BSA = body surface area; BSC = best supportive care; CBR = clinical benefit rate; DOR = duration of response; HRQoL = health-related quality of life; NTRK = neurotrophic tyrosine receptor kinase; ORR = objective response rate; OS = overall survival; PFS = progression-free survival; SAE = serious adverse events; TTR = time to tumour response; WDAE = withdrawal due to adverse event.
The literature search for clinical studies was performed by an information specialist using a peer-reviewed search strategy according to the Peer Review of Electronic Search Strategies checklist (https://www.cadth.ca/resources/finding-evidence/press).45
Published literature was identified by searching the following bibliographic databases: MEDLINE All (1946‒) via Ovid and Embase (1974‒) via Ovid. The search strategy comprised both controlled vocabulary, such as the National Library of Medicine’s MeSH (Medical Subject Headings), and keywords. The main search concept was Vitrakvi (larotrectinib). Clinical trials registries searched included the US National Institutes of Health’s clinicaltrials.gov, WHO’s International Clinical Trials Registry Platform (ICTRP) search portal, Health Canada’s Clinical Trials Database, European Union Clinical Trials Register, and Canadian Partnership Against Cancer Corporation’s Canadian Cancer Trials.
No filters were applied to limit the retrieval by study type. Retrieval was not limited by publication date or by language. Conference abstracts were excluded from the search results. See Appendix 1 for the detailed search strategies.
The initial search was completed on December 10, 2020. Regular alerts updated the search until the meeting of the pERC on April 15, 2021.
Grey literature (literature that is not commercially published) was identified by searching relevant websites from the Grey Matters: A Practical Tool For Searching Health-Related Grey Literature checklist (https://www.cadth.ca/grey-matters).46 Included in this search were the websites of regulatory agencies (US FDA and European Medicines Agency). Google was used to search for additional internet-based materials. Appendix 1 provides more information on the grey literature search strategy.
These searches were supplemented by reviewing bibliographies of key papers and through contacts with appropriate experts. In addition, the manufacturer of the drug was contacted for information regarding unpublished studies.
Two CADTH clinical reviewers independently selected studies for inclusion in the review based on titles and abstracts, according to the predetermined protocol. Full-text articles of all citations considered potentially relevant by at least 1 reviewer were acquired. Reviewers independently made the final selection of studies to be included in the review, and differences were resolved through discussion.
Findings From the Literature
No studies were identified from the literature for inclusion in the systematic review (Figure 1). Three unique studies and 1 pooled analysis of the studies were identified as part of the CADTH submission. The included studies are summarized in Table 8.
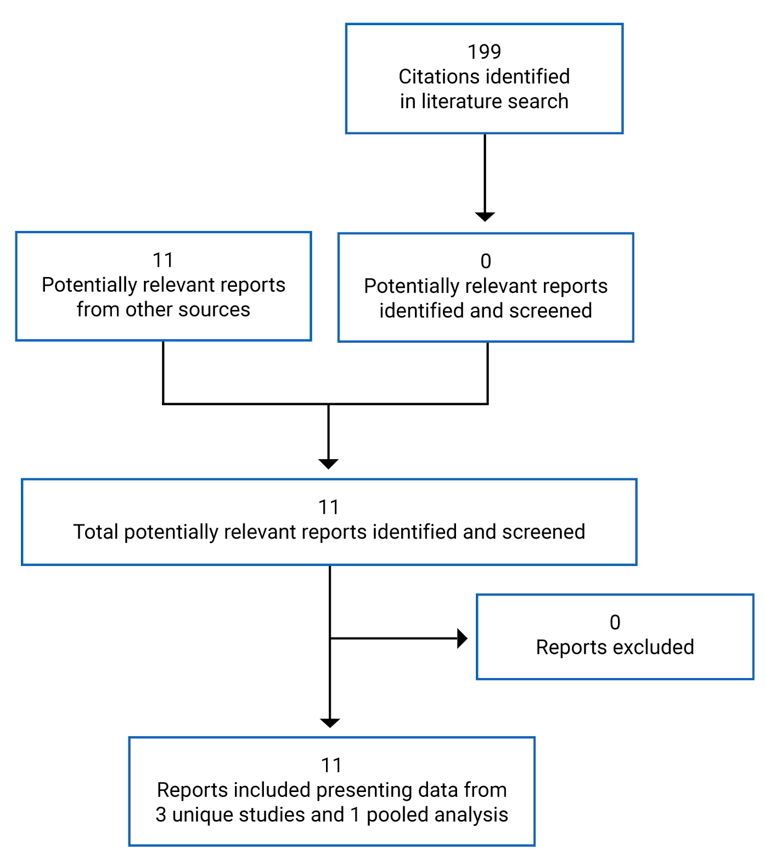
Table 8: Details of Included Studies
Detail | LOXO-TRK-14001 NCT02122913 | LOXO-TRK-15003 (SCOUT) NCT02637687 | LOXO-TRK-15002 (NAVIGATE) |
|---|---|---|---|
Designs and populations | |||
Study design | Multi-centre, open-label, single-arm, phase I dose escalation study | Multi-centre, open-label, single-arm, phase I/II trial | Open-label, single-arm, phase II basket trial |
Locations | 8 centres in US | 27 centres internationally, including Canada, US, EU, and Australia | 33 centres internationally |
Patient enrolment dates | May 12, 2014 (ongoing) | December 16, 2015 (ongoing) | October 13, 2015 (ongoing) |
Data cut-off | July 17, 2017 (primary analysis) February 19, 2018 (extended analysis) July 30, 2018 (integrated analysis) July 15, 2019 (ePAS4)a | July 17, 2017 (primary analysis) February 19, 2018 (extended analysis) July 30, 2018 (integrated analysis) July 15, 2019 (ePAS4)a | July 17, 2017 (primary analysis) February 19, 2018 (extended analysis) July 30, 2018 (integrated analysis) July 15, 2019 (ePAS4)a |
N | N = 75 (total); 8 (primary analysis); 10 (integrated analysis); 13 (ePAS4) | N = 88 (total); 12 (primary analysis); 37 (integrated analysis); 53 (ePAS4) | N = 116 (total); 35 (primary analysis); 75 (integrated analysis); 98 (ePAS4) |
Inclusion criteria |
| Phase I:
Phase II:
|
|
In both phases, patients had to have tumours that:
|
| ||
Patient inclusion by NTRK status Two expansion cohorts: 1 in patients with an alteration in the NTRK1, NTRK2, or NTRK3 genes (rearrangement, fusion, or mutation), and 1 in patients without known NTRK alterations | Patient inclusion by NTRK status Phase I: Patients with malignancy and documented NTRK fusion that had progressed or were nonresponsive to available therapies, and for whom no standard or available curative therapy exists Phase II: Patients with a locally advanced or metastatic solid tumour or primary CNS tumour with documented NTRK gene fusion | Patient inclusion by NTRK status Patients with NTRK1, NTRK2, or NTRK3 gene fusion | |
Exclusion criteria |
|
|
|
Drugs | |||
Intervention | Larotrectinib (oral capsules [2 strengths: 25 mg and 100 mg] or solution of 20 mg/mL) Dose escalation phase: 50 mg/day to 400 mg/day (50 mg to 200 mg once or twice daily) Expansion phase: 100 mg twice daily | Larotrectinib (oral capsules [2 strengths: 25 mg and 100 mg] or solution of 20 mg/mL) Treatment cohort 1: dosing according to age and body weight based on adult equivalent of 100 mg twice daily Treatment cohort 2: dosing according to age and body weight based on adult equivalent of 150 mg twice daily Treatment cohort 3: 100 mg/m2 twice daily (maximum of 100 mg twice daily) | Larotrectinib (oral capsules [2 strengths: 25 mg and 100 mg] or solution of 20 mg/mL) 100 mg twice daily |
Comparator(s) | NA (single-arm trial) | NA (single-arm trial) | NA (single-arm trial) |
Outcomes | |||
Primary end point |
| Phase I Primary:
Phase II Primary:
| Primary:
|
Secondary and exploratory end points |
| Phase I Secondary:
Phase II Secondary:
| Secondary:
Exploratory:
|
Notes | |||
Publications | Doebele et al. (2015)47 Drilon et al. (2018)31 Hyman et al. (2017)48 Lassen et al. (2018)49 Hong et al. (2019)50 Hong et al. (2020)25 | Drilon et al. (2018)31 DuBois et al. (2018)51 Halalsheh et al. (2018)52 Hyman et al. (2017)48 Laetsch et al. (2018)53 Lassen et al. (2018)49 Bielack et al. (2019)54 Nagasubramanian et al. (2016)55 Ronsley et al. (2018)56 Hong et al. (2020)25 | Drilon et al. (2018)31 Hong et al. (2020)25 |
CBR = clinical benefit rate; CLIA = Clinical Laboratory Improvement Amendment; CNS = central nervous system; CR = complete response; DLT = dose-limiting toxicity; ECOG PS = Eastern Cooperative Oncology Group performance status; EORTC QLQ-C30 European Organisation for Research and Treatment of Cancer Quality of Life Questionnaire Core 30; ePAS4 = extended primary analysis set 4; EQ-5D-5L = EuroQol 5-Dimensions 5-Levels questionnaire; EU = European Union; IFS = infantile fibrosarcoma; MTD = maximum tolerated dose; NTRK = neurotrophic tyrosine receptor kinase; ORR = objective response rate; OS = overall survival; PFS = progression-free survival; PedsQL = Pediatric Quality of Life Inventory; PR = partial response; RANO = Response Assessment in Neuro-Oncology criteria; RECIST = Response Evaluation Criteria in Solid Tumours.
aData cut-off date for the pooled analysis used in this analysis; not an interim analysis.
Source: Clinical Summary Report for LOXO-TRK-14001,61 Clinical Summary Report for LOXO-TRK-15003,62 and Clinical Summary Report for LOXO-TRK-15002.63
Description of Studies
This CADTH review included 3 open-label, single-arm trials of larotrectinib in adult and pediatric patients with advanced or metastatic solid tumours: the LOXO-TRK-14001, LOXO-TRK-15003 (SCOUT), and LOXO-TRK-15002 (NAVIGATE) trials. All 3 trials are ongoing; however, the reimbursement submission for larotrectinib is supported with pooled analyses of efficacy and safety data from NTRK fusion cancer patients enrolled in these 3 trials. After consideration of the methodological challenges attributable to the rarity of NTRK-positive solid tumours and the multiplicity of tumour types in which NTRK gene fusions can occur, the sponsor made the decision to pool efficacy data across the 3 trials from patients with NTRK fusion cancer based on global regulatory advice. The sponsor’s rationale for pooling the data included the common eligibility criteria and study procedures as well as the consistency of treatment response, safety, and tolerability across tumours and age groups. The current report represents a resubmission to CADTH with a larger pooled dataset and longer patient follow-up than what was provided for the original submission to CADTH.23
LOXO-TRK-14001
The LOXO-TRK-14001 study is a multi-centre, open-label, ongoing (initiated in May 2014) phase I dose escalation and expansion trial in adult patients with an advanced or metastatic solid tumour.61 The trial was conducted at 8 centres in the US. The first part of the trial (dose escalation) enrolled adults with metastatic solid tumours (regardless of NTRK gene fusion status) to 6 cohorts. The expansion part, which is ongoing, includes 2 expansion cohorts: 1 in patients with an alteration in the NTRK1, NTRK2, or NTRK3 genes (rearrangement, fusion, or mutation), and 1 in patients without known NTRK alterations. During the dose escalation phase, patients received larotrectinib in doses of 50 mg once daily to 200 mg twice daily. During the expansion phase, patients received larotrectinib at 100 mg twice daily.
LOXO-TRK-15003 (SCOUT Trial)
The SCOUT trial is a multi-centre, open-label, phase I/II trial in pediatric patients with locally advanced or metastatic solid tumours or primary CNS tumours.62 The study was conducted internationally and consisted of 2 parts. The phase I dose escalation part of the study was designed to identify the maximum tolerated dose (MTD) through characterization of safety, specifically dose-limiting toxicity (DLT). The phase I portion of the trial used a sequential rolling 6-dose escalation design. Escalation in phase I was to proceed through 5 planned dose levels or until the MTD was reached. When the optimal dose was identified, a phase I expansion cohort of up to 18 patients was planned to further define the safety profile. Phase II aimed to determine the ORR in pediatric patients with an advanced cancer harbouring NTRK fusion who received larotrectinib and was conducted in 3 selected cohorts of pediatric patients with tumours with NTRK fusions: IFS, other extracranial solid tumours, and primary CNS tumours. The recommended phase II dose was 100 mg/m2 twice daily, not to exceed a dose of 100 mg twice daily.
LOXO-TRK-15002 (NAVIGATE Trial)
The NAVIGATE trial is an ongoing open-label, phase II, multi-centre trial in patients with advanced cancer harbouring fusion of NTRK1, NTRK2, or NTRK3.63 The trial consisted of 9 cohorts of patients with solid tumours bearing NTRK fusions, including: NSCLC, thyroid cancer, sarcoma, colorectal cancer, salivary gland cancer, biliary cancer, primary CNS tumour, all other solid tumour types with evaluable but not measurable disease, and patients with NTRK gene fusion without laboratory Clinical Laboratory Improvement Amendments (CLIA)-equivalent certification. Patients were administered larotrectinib at 100 mg twice daily in 28-day cycle increments.
Pooled Analysis
The pooled analyses included data from patients with NTRK gene fusions enrolled in each of the 3 clinical trials.22 The datasets are detailed later in this report. Briefly, datasets included a primary analysis dataset (PAS), extended PAS (ePAS), ePAS4, and ePAS5; a primary CNS tumour analysis set (SAS3); and safety analysis sets (TRK fusion cancer safety analysis set, overall safety analysis set, TRK fusion cancer labelled-dose safety analysis set, and overall labelled-dose safety analysis set). Figure 2 provides an overview of these different datasets.
The current resubmission is based primarily on ePAS5, ePAS4, and SAS3 for efficacy outcomes and on the TRK fusion cancer labelled-dose safety set and the overall labelled-dose safety set for safety outcomes.
Populations
Inclusion and Exclusion Criteria
LOXO-TRK-14001
The LOXO-TRK-14001 trial included adult patients (≥ 18 years of age) with a locally advanced or metastatic solid tumour that had progressed, was nonresponsive to available therapies, was unfit for standard chemotherapy, or for which no standard or available curative therapy existed.61 Patients also must have had an ECOG performance status of 0 to 2 and a life expectancy of at least 3 months. Although NTRK gene fusion status was not an inclusion criterion for the trial, only patients with NTRK-positive gene fusion were prospectively selected for inclusion for the pooled analysis informing the main clinical evidence in the CADTH review. For the NTRK expansion cohort, evidence of NTRK gene fusion was assessed before enrolment in a CLIA-certified or equivalent local laboratory. Patients were excluded if they had symptomatic brain metastases without CNS disease or active spinal cord compression, clinically significant active cardiovascular disease or a history of prolonged QT interval, or if they were on treatment with a strong cytochrome P450 (CYP) 3A4 inhibitor or inducer.
LOXO-TRK-15003 (SCOUT Trial)
In phase I, the SCOUT trial included: infants, children, and adolescents aged 1 month to 21 years with locally advanced or metastatic solid tumours or CNS tumours that had relapsed, progressed, or were nonresponsive to available therapies and for which no standard or available systemic curative therapy existed; infants from birth with a diagnosis of malignancy and documented NTRK fusion that had progressed or was nonresponsive to available therapies, and for which no standard or available curative therapy existed; and patients with locally advanced IFS that would otherwise require disfiguring surgery or limb amputation to achieve a complete surgical resection.62 In the phase I dose expansion, in addition to the previously listed inclusion criteria, patients must have had a malignancy with documented NTRK gene fusion, with the exception of patients with IFS, CMN, or SBC. Patients with IFS, CMN, or SBC may have been enrolled with documentation of an ETV6 rearrangement by FISH or reverse transcriptase–polymerase chain reaction (RT-PCR), or documented NTRK fusion by NGS. In phase II, the SCOUT trial included: patients from birth with either locally advanced or metastatic IFS that required disfiguring surgery or limb amputation to achieve a complete surgical resection; patients from birth through 21 years with locally advanced or metastatic solid tumours or CNS tumours that had relapsed, progressed, or were nonresponsive to available therapies and for which there was no standard or available systemic curative treatment and with documented NTRK gene fusion; and patients older than 21 with a tumour diagnosis with histology typical of a pediatric patient and NTRK fusion who could have been considered for enrolment following discussion between the local site investigator and the sponsor’s medical monitor.
To be eligible patients were required to have a Karnofsky (if ≥ 16 years of age) or Lansky (if < 16 years of age) performance status score of 50 or more, evaluable or measurable disease (as defined by RECIST, RANO, or International Neuroblastoma Response Criteria), adequate organ function, and full recovery from the acute toxic effects of all previous anticancer therapy. NTRK gene fusion status was not part of the eligibility criteria for all patients of the trial.62
LOXO-TRK-15002 (NAVIGATE Trial)
The NAVIGATE trial included: patients 12 years of age and older with locally advanced or metastatic cancer with an NTRK1, NTRK2 or NTRK3 gene fusion, identified through molecular assays routinely performed at laboratories certified by CLIA or similar laboratories (exception: patients with NTRK gene fusion identified in a laboratory where certification of the laboratory could not be confirmed by the sponsor at the time of consent were eligible for cohort 9); patients who had received prior standard therapy or, in the opinion of the investigator, would be unlikely to tolerate or derive clinically meaningful benefit from appropriate standard of care therapy; and those who had at least 1 measurable lesion as defined by RECIST 1.1 (exception: patients without RECIST 1.1–measurable disease [evaluable disease only] were eligible for enrolment in cohort 8, regardless of tumour type).63 Patients in cohort 7 (primary CNS tumours) must have received prior treatment, including radiation and/or chemotherapy, have at least 1 site of bi-dimensionally measurable disease (per RANO criteria), and have had an imaging study performed within 28 days before enrolment. Patients must have had an ECOG status of 0 to 3 (for patients ≥ 16 years old) or an LPS score of 40% or greater (if < 16 years old). If the patient was enrolled with a primary CNS tumour to be assessed by RANO, a Karnofsky (if ≥ 16 years of age) or Lansky (if < 16 years of age) score of 50 or more was required. Patients were excluded if they had symptomatic or unstable brain metastases (patients with asymptomatic brain metastases and patients with primary CNS tumours were eligible), unstable cardiovascular disease, and an inability to discontinue treatment with a strong CYP3A4 inhibitor or inducer before treatment initiation.
Pooled Analysis
Adults and pediatrics enrolled across the three3 larotrectinib studies (LOXO-TRK-14001, LOXO-TRK-15003 [SCOUT], and LOXO-TRK-15002 [NAVIGATE] trials) were included in the pooled efficacy analysis if they met all the following criteria22:
documented NTRK gene fusion as determined by local testing
non-CNS primary tumour with 1 or more measurable lesions at baseline that could be assessed according to RECIST, version 1.1
received 1 or more doses of larotrectinib.
The PAS consisted of the first 55 consecutively enrolled patients across the 3 larotrectinib studies (LOXO-TRK-14001, LOXO-TRK-15003, and LOXO-TRK-15002) meeting the aforementioned criteria.57 The ePAS4 (the pooled efficacy dataset relevant for this review) included patients in the PAS plus patients who subsequently started treatment by February 19, 2019, and fulfilled the definition of the PAS in the Description of Studies section. The initial evaluation of ePAS4 had been performed using data from the July 15, 2019, cut-off date. The ePAS5 dataset, the most updated efficacy dataset, had a July 2020 cut-off.
All patients were included if they met these criteria. Patients in ePAS4 as well as ePAS5 must also have had an IRC-assessed response. Of the 208 patients included in the TRK fusion cancer safety analysis set (the pooled safety dataset relevant for this review), patients were excluded from ePAS4 for the following reasons: 11 patients had not yet received an IRC assessment, 9 did not have RECIST-measurable disease at baseline, and 24 had a primary CNS tumour. The primary CNS tumour patients were included in a separate CNS tumour dataset (SAS3).
The SAS3 population consisted of patients with primary CNS tumours.22 These patients were excluded from the overall analysis sets and analyzed separately for the following reasons:
Patients with a primary CNS tumour were evaluated using either RANO or RECIST 1.1, whereas all other tumour types were evaluated using RECIST 1.1 only.
The effect of edema, inflammation, and scarring from surgery and radiation on the radiological assessment was a concern in these patients.
Data for these patients were not IRC-assessed (only investigator assessment).
Baseline Characteristics
Pooled Analysis
ePAS4: A total of 164 patients (13, 53, and 98 patients from LOXO-TRK-14001, LOXO-TRK-15003, and LOXO-TRK-15002, respectively) were included in ePAS4 (Table 9).22 Patient ages ranged from 0.1 to 84.0 years, with a median of 42.0 years. Most patients had an ECOG status of 0 (49%) or 1 (38%). Approximately half of the patients were male (49%) and had received 1 to 2 previous systemic chemotherapies, (41%). The most common tumour types were STS (22%), IFS (20%), thyroid (16%), or salivary gland (13%). Most patients (74%) had metastatic disease at enrolment.
Table 9: Summary of Baseline Characteristics of the Patients Included in the Pooled Analysis Sets for Efficacy From Larotrectinib Trials (LOXO-TRK-14001, LOXO-TRK-15003, and LOXO-TRK-15002)
Characteristic | PAS | ePAS | Integrated analysis | ePAS4 | ePAS5 (n = 192) |
|---|---|---|---|---|---|
Age, median (range), years | 45.0 (0.3 to 76.0) | 41.0 (0.1 to 76.0) | 41.0 (0.1 to 80.0) | 42.0 (0.1 to 84.0) | — |
Age, distribution, n (%) | |||||
< 1 year | — | — | — | 25 (15) | — |
1 to 5 years | — | — | — | 16 (10) | — |
6 to 11 years | — | — | — | 9 (5) | — |
12 to 15 years | — | — | — | 5 (3) | — |
16 to 17 years | — | — | — | 0 (0) | — |
18 to 44 years | — | — | — | 30 (18) | — |
45 to 64 years | — | — | — | 48 (29) | — |
65 to 74 years | — | — | — | 22 (13) | — |
≥ 75 years | — | — | — | 9 (5) | — |
Male, n (%) | 29 (53) | 38 (52) | 60 (49) | 80 (49) | NR (51) |
ECOG PS score, n (%) | |||||
0 | 24 (44) | 33 (45) | 59 (47) | 80 (49) | NR (51) |
1 | 27 (49) | 33 (45) | 53 (43) | 62 (38) | NR (36) |
2 | 4 (7) | 7 (10) | 12 (10) | 19 (12) | — |
3 | 0 (0) | 0 (0) | 0 (0) | 3 (2) | — |
Tumour type, n (%) | |||||
STS | 11 (20) | 17 (23.3) | 28 (22.9) | 36 (22) | NR (25) |
IFS | 7 (13) | 10 (13.7) | 18 (14.8) | 32 (20) | NR (21) |
Thyroid | 5 (9) | 6 (8.2) | 18 (14.8) | 27 (16) | NR (15) |
Salivary gland | 12 (22) | 13 (17.8) | 19 (15.6) | 21 (13) | NR (11) |
Lung | 4 (7) | 4 (5.5) | 11 (9.0) | 13 (8) | NR (8) |
Colon | 4 (7) | 6 (8.2) | 6 (4.9) | 8 (5) | — |
Melanoma | 4 (7) | 4 (5.5) | 7 (5.7) | 7 (4) | — |
Breast | 1 (2) | 1 (1.4) | 2 (1.6) | 5 (3) | — |
GIST | 3 (5) | 5 (6.8) | 5 (4.1) | 4 (2) | — |
Pancreatic | 1 (2) | 1 (1.4) | 1 (0.8) | 2 (1) | — |
Bone sarcoma | 0 (0) | 2 (2.7) | 2 (1.6) | 2 (1) | — |
Cholangiocarcinoma | 2 (4) | 2 (2.7) | 2 (1.6) | 2 (1) | — |
Appendix | 1 (2) | 1 (1.4) | 1 (0.8) | 1 (1) | — |
Hepatic | 0 (0) | 0 (0) | 0 (0) | 1 (1) | — |
Congenital mesoblastic nephroma | 0 (0) | 1 (1.4) | 1 (0.8) | 1 (1) | — |
Cancer of unknown primary | 0 (0) | 0 (0) | 1 (0.8) | 1 (1) | — |
Prostate | 0 (0) | 0 (0) | 0 (0) | 1 (1) | — |
Disease status at enrolment, n (%) | |||||
Locally advanced | — | — | — | 42 (26) | — |
Metastatic | — | — | — | 122 (74) | — |
NTRK gene, n (%) | |||||
NTRK1 | — | — | — | 68 (41) | — |
NTRK2 | — | — | — | 4 (2) | — |
NTRK3 | — | — | — | 83 (51) | — |
Inferred NTRK3 | — | — | — | 9 (5) | — |
Received prior therapy, n (%) | |||||
Yes | — | — | — | 154 (94) | — |
No | — | — | — | 10 (6) | — |
Prior cancer treatment, n (%) | |||||
Surgery | — | — | — | 125 (76) | — |
Systemic therapy | — | — | — | 127 (77) | — |
Radiotherapy | — | — | — | 75 (46) | — |
Number of previous systemic chemotherapies, n (%) | |||||
0 | 27 (49) | 15 (21) | 66 (54) | 36 (22) | — |
1 to 2 | 9 (16) | 35 (48) | 25 (20) | 84 (51) | — |
≥ 3 | 19 (35) | 23 (32) | 31 (25) | 44 (27) | — |
ECOG = Eastern Cooperative Oncology Group; ePAS = extended primary analysis set; ePAS4 = extended primary analysis set 4; ePAS5 = extended primary analysis set 5; GIST = gastrointestinal stromal tumour; IFS = infantile fibrosarcoma; NR = not reported; NTRK = neurotrophic tyrosine kinase receptor; PAS = primary analysis set; PS = performance status; STS = soft tissue sarcoma.
Source: Note to clinical reviewer (2020)22 and updated ePAS5 data.27
SAS3
A total of 24 patients with an investigator-assessed data cut-off of July 15, 2019, (Table 10) were included in SAS3.22 The primary CNS tumour types included glioblastomas (n = 7), gliomas (n = 6), astrocytomas (n = 5), not otherwise specified (n = 3), glioneuronal (n = 1), neuronal and mixed neuronal-glial tumours (n = 1), and primitive neuroectodermal tumours (n = 1). The median age was 8 years (range = 1.3 to 79 years), and pediatric patients accounted for 83% (n = 20) of patients. Approximately half (46%) of patients were male, and most had an ECOG status of 0 (63%) or 1 (29%). Most patients had received 1 to 2 lines of previous systemic treatment (67%) and had an NTRK2 gene (67%). Baseline characteristics were not available for SAS3 (n = 33) with a July 2020 data cut-off.
Table 10: Summary of Baseline Characteristics of the Patients With Primary CNS Tumours Included in the SAS3 Dataset for Efficacy From Larotrectinib Trials (LOXO-TRK-14001, LOXO-TRK-15003, and LOXO-TRK-15002)
Characteristic | SAS3 (n = 24) |
|---|---|
Age, median (range), years | 8 (1.3 to 79) |
Age, distribution, n (%) | |
Pediatric | 20 (83) |
Adult | 4 (17) |
Male, n (%) | 11 (46) |
ECOG PS score, n (%) | |
0 | 15 (63) |
1 | 7 (29) |
2 | 1 (4) |
Not reported | 1 (4) |
NTRK gene, n (%) | |
NTRK1 | 5 (21) |
NTRK2 | 16 (67) |
NTRK3 | 3 (13) |
Number of previous systemic chemotherapies, n (%) | |
0 | 3 (13) |
1 to 2 | 16 (67) |
≥ 3 | 5 (21) |
CNS = central nervous system; ECOG = Eastern Cooperative Oncology Group; NTRK = neurotrophic tyrosine kinase receptor; PS = performance status.
Source: Note to clinical reviewer (2020).22
Safety Sets
As of the July 15, 2019, data cut-off date, the median time on treatment for the TRK fusion cancer labelled-dose safety set was 9.3 months (range = 0.1 to 51.6 months) and 7.4 months (range = 0.03 to 51.6 months) in the overall labelled-dose safety set.22 The median age was 37.5 years (range = 0.1 to 84.0 years) with 37% of patients younger than 18 years of age in the TRK fusion cancer labelled-dose safety set and was 46.0 years (0.1 to 84.0 years) with 33% of patients younger than 18 years of age in the overall labelled-dose safety set.
Interventions
LOXO-TRK-14001
In the dose escalation phase, increasing dose levels (i.e., 50 mg daily, 100 mg daily, 100 mg twice daily, 200 mg daily, 150 mg twice daily, 200 mg twice daily) were used according to the occurrence of DLT in cycle 1, or until the MTD was reached or the sponsor determined that a suitable dose had been achieved (based on available safety, clinical activity, and pharmacokinetic exposure).61 The starting dose of 50 mg once daily was determined based on data from animal toxicity studies. Patients in the expansion cohorts were treated at the MTD, or at a dose level lower than the identified MTD but deemed by the sponsor to provide significant TRK inhibition. Larotrectinib was administered orally once or twice daily, based on 28-day cycles. Treatment was continued until progression, unacceptable toxicity, or patient withdrawal. Dose interruptions were allowed of up to 4 weeks for clinically significant AEs. After recovery, patients could either continue at the assigned dose of larotrectinib or receive a reduced dose. Patients with drug-related toxicities requiring more than 4 weeks to recover were to be withdrawn from the trial unless there was compelling evidence of response and no alternative treatment.
LOXO-TRK-15003 (SCOUT Trial)
During phase I dose escalation, patients received larotrectinib orally (capsule or liquid formulation).62 For cohorts 1 and 2, the starting dose was determined by pharmacokinetic (SimCyp dose escalation) modelling, which took both age and BSA into consideration. Because interim analysis of pharmacokinetic data from cohorts 1 and 2 indicated that a BSA-based dose would provide a more consistent pharmacokinetic response, doses for patients enrolled in phase I dose escalation cohort 3, phase I dose expansion cohort, and phase II cohorts were dosed based on the calculated BSA at day 1 of each cycle visit. The recommended phase II dosage (100 mg/m2 twice daily, not to exceed a dosage of 100 mg twice daily) was declared on April 13, 2017. In patients aged between 0 and 1 month, a dose of 1 mg/kg was used. If no DLTs were reported during cycle 1, patients were increased to the recommended phase II dose on day 1 of cycle 2.
Larotrectinib was administered in 28-day cycles.62 Treatment was continued until progression, unacceptable toxicity, or other reasons as outlined in the protocol. Patients with locally advanced disease and a response of at least a PR for a period of 1 year after PR was initially confirmed may have had their larotrectinib treatment held. Patients with a confirmed PR were permitted to undergo optional biopsy and/or a PET scan at that time to better assess the response and to gather additional information regarding their disease. If study treatment was held in these patients, clinical assessments and disease assessments were performed. If patients who held treatment in this “wait and see” period exhibited evidence of radiographic disease progression, the patient was permitted to restart larotrectinib. At the time of larotrectinib re-initiation, the patients began assessments per protocol as delineated for patients on active treatment. Patients who re-initiated larotrectinib treatment were permitted to have their larotrectinib treatment held again. Patients who underwent surgical resection for local control may have continued to receive larotrectinib after surgical recovery and discussion between the investigator and the sponsor. These patients should have stopped larotrectinib for 24 hours before surgery and resumed no sooner than 24 hours after surgery. If the resection surgery resulted in negative margins and study treatment was stopped, disease assessments were performed every 3 months following the last dose of study medication. These patients are permitted to restart study treatment if they experienced progressive disease after discussion with the medical monitor.
LOXO-TRK-15002 (NAVIGATE Trial)
Larotrectinib was administered at a dosage of 100 mg orally twice daily in 28-day cycles.63 Treatment was continued until disease progression, unacceptable toxicity, patient withdrawal of consent, or death. Patients who developed disease progression were allowed to continue larotrectinib if, in the opinion of the investigator, the patient was deriving clinical benefit from continuing the study drug and continuation of treatment was approved by the sponsor. For patients who experienced a clinically significant hematologic or non-hematologic TEAE (greater than grade 2, or an increase of more than 1 grade from baseline if the baseline was grade 2 or higher) larotrectinib dosing was held for up to 4 weeks to evaluate the AE and to allow for recovery (to grade 1 or baseline). In patients who had previously experienced a clinical benefit from larotrectinib, larotrectinib dosing could be held for more than 4 weeks to allow for resolution of AEs, with the sponsor’s permission. Upon resolution of the AE and/or symptoms related to the AE, and if the AE was considered unrelated to larotrectinib, dosing may have been restarted at the same dose. If the AE was considered related to the dose of larotrectinib, then dose modifications were made.
Pooled Analysis
The pooled analysis included patients with NTRK gene fusions who were enrolled in 1 of the 3 larotrectinib trials.22 Most patients were treated with larotrectinib 100 mg orally twice daily (in individuals with a BSA equal to or greater than 1 m2) or 100 mg/m2 orally twice daily (for children with a BSA larger than 1 m2); however, some patients from the dose escalation phases of the trials were also included.25
Outcomes
A list of efficacy end points identified in the CADTH review protocol that were assessed in the clinical trials included in this review is provided in Table 11. These end points are further summarized in the following section.
Table 11: Summary of Outcomes of Interest Identified in the CADTH Review Protocol
Outcome measure | LOXO-TRK-14001 | LOXO-TRK-15003 (SCOUT) | LOXO-TRK-15002 (NAVIGATE) | |
|---|---|---|---|---|
Phase I | Phase II | |||
ORR | Secondary | Secondary | Primary | Primary |
DOR | Secondary | Secondary | Secondary | Secondary |
BOR | Secondary | — | Secondary | Secondary |
CBR | — | — | — | Secondary |
PFS | — | — | — | Secondary |
OS | — | — | — | Secondary |
Wong-Baker FACES Scale | — | Secondary | — | — |
PedsQL-Core | — | Secondary | — | Exploratory |
EORTC QLQ-C30 | — | — | — | Exploratory |
EQ-5D-5L | — | — | — | Exploratory |
Safety | Primary | Primary | — | Secondary |
BOR = best overall response; CBR = clinical benefit rate; DOR = duration of response; EORTC QLQ-C30 = European Organisation for Research and Treatment of Cancer Quality of Life Questionnaire Core 30; EQ-5D-5L = EuroQol 5-Dimensions 5-Levels questionnaire; ORR = overall response rate; OS = overall survival; PedsQL-Core = Pediatrics Quality of Life Inventory–Core Module; PFS = progression-free survival.
Source: EPAR (2019),58 Clinical Summary Report for LOXO-TRK-14001,61 Clinical Summary Report for LOXO-TRK-15003,62 and Clinical Summary Report for LOXO-TRK-15002.63
LOXO-TRK-14001
The primary end point of study LOXO-TRK-14001 was the safety of larotrectinib (including DLT) and identification of the MTD.61 Secondary end points were to characterize its pharmacokinetic properties and antitumour activity, which included ORR and DOR, and other measures of antitumour efficacy as determined by investigator assessment.
Disease assessments were performed by the investigator using RECIST 1.1, RANO, or a comparable assessment method depending on location of tumour.61 The estimate of the ORR was calculated based on a crude proportion of patients with a confirmed BOR of confirmed CR or PR. The DOR was calculated for patients who achieved a CR or PR and was defined as the number of months from the start date of CR or PR (whichever was observed first) to the first date that recurrent or progressive disease was objectively documented. Repeat tumour assessments were conducted on or before day 1 of cycles 3, 5, 7, 9, 11, and 13, and every 3 cycles thereafter until the onset of progressive disease. The severity of each AE was graded by the investigators using version 4.03 of the National Cancer Institute’s Common Terminology Criteria for Adverse Events. Any AEs occurring after cycle 1 or other cumulative toxicities were considered in the final definition of MTD and the ultimate dose was selected for further investigation. Patients who received at least 75% of the planned total dose in cycle 1 were considered to have sufficient study drug exposure to be evaluated in support of dose escalation.
Long-term follow-up assessments occurred every 3 months (± 1 month) and included: date of progressive disease (if not already documented), subsequent anticancer therapies, and survival status.61
LOXO-TRK-15003 (SCOUT Trial)
The primary objective of the phase I portion of the study was to determine the safety and DLTs of oral larotrectinib in pediatric patients with advanced solid or primary CNS tumours.62 Secondary objectives included pharmacokinetic characterization and identification of MTD and/or the appropriate dose of larotrectinib, to describe antitumour activity, and to study pain and HRQoL outcomes. The primary objective of the phase II portion of the study was to determine the ORR by IRC assessment in pediatric patients with an advanced cancer harbouring NTRK fusion who received larotrectinib. Secondary objectives included the study of other efficacy parameters including the DOR, and further assessment of the safety and tolerability of larotrectinib. Assessment of potential biomarkers (including TRK fusion status) of response and resistance to larotrectinib was an exploratory objective.
Disease assessments consisted of CT and/or MRI scans performed pre-treatment, at the beginning of odd cycles through cycle 13, and every third cycle thereafter.62 The antitumour activity of larotrectinib included measurement of ORR, clinical benefit rate (CBR), DOR, PFS, and OS. Response criteria were based on RECIST 1.1 for non-CNS solid tumours and RANO criteria for CNS tumours. The CBR was defined as the sum of patients with either a CR, PR, or stable disease. The DOR, which was calculated for patients who achieved a CR or PR, was defined as the number of months from the start date of CR or PR (whichever was observed first) to the first date that recurrent or progressive disease was objectively documented. If a patient died, irrespective of cause, without documentation of recurrent or progressive disease beforehand, then the date of death was used to denote the response end date. Progression-free survival was defined as the number of months from the date of the first dose of larotrectinib to the earliest date of documented evidence of progressive disease or death (whatever the cause) without evidence of prior progression. Overall survival was defined as the number of months from the date of the first dose of larotrectinib to the date of death (due to any cause).
Pain and HRQoL assessments were collected every cycle. In patients 3 years of age or older, pain was assessed by the Wong-Baker FACES Scale. For all patients, HRQoL was assessed using the PedsQL for the patient or their parent/caregiver.62
Long-term follow-up assessments occurred every 3 months (± 1 month) and included the date of progressive disease (if not already documented), subsequent anticancer therapies, and survival status.62
LOXO-TRK-15002 (NAVIGATE Trial)
The primary end point of the trial was to determine the IRC-assessed ORR following treatment with larotrectinib in patients age 12 years and older with an advanced cancer harbouring fusion involving NTRK1, NTRK2, or NTRK3 (collectively referred to as NTRK fusions) for each tumour-specific disease cohort.63 Secondary end points included investigator-assessed ORR, DOR, CBR, PFS, OS, and safety. Exploratory objectives included determining the relationship between pharmacokinetic and treatment effects, including efficacy and safety, and evaluating changes from baseline in quality of life and health-utilities measures.
Patients underwent radiographic evaluation of their disease at the end of cycle 2, and every other cycle for the first 12 months, followed by 3 cycles thereafter. Patients with primary CNS disease underwent radiographic evaluation of their disease at the end of each cycle between cycle 1 and cycle 4, and every 2 cycles between cycle 5 and cycle 12, and every 3 cycles thereafter.63 The ORR was defined as the rate of patients with a BOR of confirmed CR or PR using RECIST 1.1 or RANO criteria, as appropriate to tumour type. A confirmed CR or PR is defined as a CR or PR that was confirmed by repeat assessments performed no less than 28 days after the criteria for response was first met. The BOR was defined as the best response designation (in the order of CR, PR, stable disease, and progressive disease) for each patient recorded between the date of the first dose of treatment and the date of documented progressive disease per RECIST 1.1 or RANO criteria or the date of subsequent anticancer therapy or cancer-related surgery (i.e., surgical resection of tumour), whichever occurs first. The DOR was calculated for patients who achieved a CR or PR and was defined as the number of months from the start date of CR or PR (whichever was observed first) and subsequently confirmed as the first date that radiological recurrent or progressive disease was objectively documented or when death occurred due to any cause. The CBR was defined as the BOR of confirmed CR, PR, or stable disease lasting 16 or more weeks following initiation of larotrectinib. Stable disease was measured from the date of the first dose of larotrectinib until the criteria for progressive disease are first met. Progression-free survival was defined as the number of months from initiation of larotrectinib to the earliest of documented radiological evidence of progressive disease or death due to any cause without prior progression. Overall survival was defined as the number of months from the initiation of larotrectinib to the date of death due to any cause.
Patient-reported outcomes were measured using the EORTC QLQ-C30 and EuroQol 5 Dimensions 5-Levels questionnaire (EQ-5D-5L) for patients age 18 years and older, and PedsQL for patients age 12 to 17.63 The HRQoL measures were collected at the same cycle visits as the disease assessment and at the end of treatment period.
Long-term follow-up assessments occurred every 3 months (± 1 month) and included date of progressive disease (if not already documented) and subsequent anticancer therapies.63
Pooled Analysis
The primary end point of the pooled analysis was ORR (IRC-assessed in ePAS4, investigator-assessed in SAS3).22 The ORR was defined as the proportion of patients with a BOR of either a CR or a PR according to RECIST 1.1. A CR was defined as no radiological evidence of disease, negative surgical margins, and no viable tumour cells. A PR was defined according to RECIST criteria as a minimum decrease from baseline of at least 30% in the sum of target lesion diameters. The BOR was defined as the best response designation for each patient that was recorded between the date of the first dose of larotrectinib and the date of documented progressive disease by RECIST 1.1, International Neuroblastoma Response Criteria, or the date of subsequent therapy or cancer-related surgery, whichever occurs first.57 Patients who underwent surgical resection and had no viable tumour cells and negative margins on a post-surgical pathology report were considered complete responders by surgery and/or pathology. Response (PR or CR) must have been confirmed by a repeat assessment performed no less than 28 days after the criteria for response were first met. When stable disease was believed to be the best response, it must also have met the minimum interval of 6 weeks (42 days) from the start of study treatment. If the minimum time was not met when stable disease was otherwise the best time point response, the patient’s best response depended on the subsequent assessments.
Secondary end points include ORR based on local investigator assessment, as well as the following (both investigator- and IRC-assessed): TTR, time to best response (TTBR), DOR, DCR, PFS, and OS.57 The TTR was defined as the number of months between the date of the first dose of larotrectinib and the first documentation of objective response (CR or PR, whichever occurred earlier) that was subsequently confirmed. The TTR was only defined for patients with a BOR of a confirmed CR or confirmed PR. The DOR was defined as the number of months from the start date of a PR or CR (whichever response was recorded first), and subsequently confirmed, to the date of progressive disease or death, whichever occurred first. The TTBR was defined as the number of months between the date of the first dose of larotrectinib and the first documentation of a CR (if the patient’s BOR is a confirmed CR) or PR (if the patient’s BOR is a confirmed PR) that was subsequently confirmed. The TTBR was only defined for patients with a BOR of a confirmed CR or confirmed PR. The DCR was calculated based on the proportion of patients with a BOR of a confirmed CR, PR, or stable disease lasting 16 weeks or more. Stable disease was measured from the first date of larotrectinib administration until the criteria for progressive disease were first met. Progression-free survival was defined as the number of months from date of the first dose of larotrectinib to the earliest date of documented progressive disease or death. Overall survival was defined as the number of months that elapsed between the first dose of larotrectinib and death.
Analyses of HRQoL outcomes were not pre-specified in the sponsor-submitted statistical analysis plan for the pooled analyses, and it was not clear which analyses or subgroups were pre-specified (if any); however, analyses were performed and presented as part of conference preceedings.59,60 Such outcomes were secondary end points in the NAVIGATE and SCOUT trials, for which the pooled analysis only included the EORTC QLQ C-30 and PedsQL. The NAVIGATE trial used the EORTC QLQ C-30 for patients 18 years of age and older, and the PedsQL 4.0 Generic Core Scale for patients aged 12 to 17 years.64,65 The SCOUT trial used the PedsQL 4.0 Generic Core Scale. The HRQoL questionnaires were completed at the baseline and planned cycle visits (NAVIGATE: day 1 of cycles 3, 5, 7, 9, 11, 13, and every 3 cycles or months thereafter until disease progression; SCOUT: every cycle).
The EORTC QLQ C-30 is a cancer-specific measure of HRQoL, consisting of 30 items, including 5 multi-item functional scales, 3 multi-item symptom scales, 6 single-item symptom scales, and a 2-item QoL scale (also known as the GHS score).66 The first 3 scales are rated on a 4-point scale, whereas the GHS is rated on a 7-point Likert scale. Responses for each scale are then converted to a standardized score ranging from 0 to 100, with higher scores indicating better function and QoL, whereas a decline in the symptom scales score reflects an improvement.67 The PedsQL is a modular instrument with a 23-item Generic Core Scale, which can be combined with various disease-specific modules, to measure HRQoL in children and adolescents aged 2 to 18 years. The generic scale consists of 4 dimensions, including physical functioning (8 items), emotional functioning (5 items), social functioning (5 items), and school functioning (5 items).68 Each item is rated on a 5-point Likert scale, then reverse-scored and linearly transformed to a 0-to-100 scale; higher scores indicate better HRQoL. The total score is the sum of all the items over the number of items answered on all the scales.69 Both instruments have been validated extensively and are available in many languages for various cancer types. The MID for these measures was estimated in separate studies using a mixed cancer population and was defined as a change in score of 10 points for all EORTC QLQ-C30 scales, and 4.4 to 4.5 points for PedsQL total scores for patients ≥ 2 years of age.65,70,71 No literature could be found to obtain an MID for infants younger than 2 years of age; the MID was therefore defined by the sponsor as half the SD of the baseline total PedsQL score for this group (7.2).22 A detailed discussion of these HRQoL measures is provided in Appendix 5.
Statistical Analysis
LOXO-TRK-14001
The dose escalation portion of the study employed a classical “3 + 3” dose escalation design, with 3 to 6 patients enrolled in each cohort.61 The total number of patients to be enrolled in the dose escalation phase was anticipated to be approximately 60, depending on the observed safety profile, which would determine the number of patients per dose cohort, as well as the number of dose escalations required to achieve the MTD. For the dose expansion portion of the study, approximately 20 patients were targeted for enrolment in each cohort, largely based on clinical consideration for phase I studies. The rationale provided was that if the observed ORR was high (exceeding 50%) within a cohort, then the corresponding lower limit of a 1-sided exact 90% CI would exclude true response rates that were considered marginal or uninteresting (e.g., < 30%).
For patients with NTRK1, NTRK2, or NTRK3 gene fusion, imaging was evaluated by site Investigators and by an IRC.61 For such patients, ORR and DOR was based on the time point and BORs as determined by the IRC, and a secondary analysis was based on site investigator assessments. Differences between the IRC and investigator assessments of response were reported. The statistical analysis plan stated that efficacy tables may be presented for subgroups, including patients with or without NTRK fusion cancer. The estimate of the ORR was calculated based on the maximum likelihood estimator (i.e., crude proportion of patients with a BOR or CR or PR, based on RECIST 1.1). The estimate of the ORR included 1- and 2-sided CIs with various coverage probabilities (e.g., 80% to 95%). The DOR was summarized descriptively using the Kaplan-Meier method with a 95% CI and calculated using the Greenwood formula. Median follow-up was estimated according to the Kaplan-Meier estimate of potential follow-up. The Greenwood formula was used to calculate the standard errors of the Kaplan-Meier estimate and the upper and lower limits of the 95% CI. The DOR was right-censored (the progression or censoring date was determined based on described conventions from the FDA [2007]) for patients who met 1 or more of the following conditions:
initiated subsequent anticancer therapy in the absence of documented progressive disease
died or had progressive disease after missing 2 or more consecutively scheduled disease assessment visits
were last known to be alive and without documented progressive disease on or before the data cut-off date.
Tabular summaries were provided for all TEAEs, including summaries by relationship to study drug, maximum severity grade, study drug action taken, serious adverse events (SAEs), and fatal AEs. Laboratory variables and vital signs were assessed by means of standard shift tables and summary statistics.61
Unless noted otherwise, missing data were not imputed, and all analyses were based only on observed data.61 The effective sample sizes at each assessment visit was based on the total number of patients with non-missing data for the parameter of interest at that visit.
One interim analysis was performed on July 15, 2019.61 Additional unplanned interim analyses may be performed, but these will be considered as exploratory in nature. Unplanned interim analyses will be detailed in a separate interim statistical analysis plan and described in a subsequent Clinical Study Report.
LOXO-TRK-15003 (SCOUT Trial)
In the phase I dose escalation stage of the study, up to 36 patients were anticipated to be enrolled to define the MTD or larotrectinib; up to 6 patients evaluable for safety were to be enrolled in each dose cohort based on a phase I, rolling 6 design, with the exception of cohorts 3, 4, and 5, which may have enrolled up to 9 patients each to fulfill the requirement for at least 3 patients who meet minimum BSA criteria.62 In the phase II expansion cohort stage of the study, approximately 12 to 18 patients with specific abnormalities in NTRK genes or proteins were planned for enrolment to provide additional safety, pharmacokinetic, and antitumour activity information when larotrectinib is administered to such patients at the recommended phase II dose. The rationale provided was that the sample size was chosen based on clinical considerations for phase I studies. In phase II of the study, up to 40 patients were to be enrolled in each cohort. The number of patients planned for each phase II cohort was determined largely by feasibility considerations owing to the rarity of pediatric NTRK fusion cancers. It was anticipated that the ORR may be high (≥ 50%) for each cohort evaluated and that if such response rates were observed for phase II, then the lower limit of the CI about the observed response rate could be used to identify true response rates considered promising enough to warrant further development of larotrectinib within a disease indication. For example, if among 10 patients enrolled within a cohort, there were 5 (50%), 6 (60%), 7 (70%), or 8 (80%) patients with a CR or PR, then the 80% CI about this response rate would be (27% to 73%), (35% to 81%), (45% to 88%), or (55% to 95%), respectively. Similarly, there is a 90% confidence that the response rate observed in similar future trials will not be lower than 27% to 35%, 45%, or 55%, respectively.
The estimate of the ORR was calculated based on the maximum likelihood estimator (i.e., the crude proportion of patients with a BOR or a CR or PR, based on RECIST 1.1).62 Patients with a non-confirmed CR or PR were included in the ORR calculation, but were not considered as a responder. Patients without measurable disease at baseline or who continued but had no evaluable post-baseline assessment were excluded from the calculation of ORR. Two-sided exact binomial 95% CIs (Clopper-Pearson) were presented. The CBR was analyzed similarly.
The DOR was summarized descriptively using the Kaplan-Meier method with a 95% CI, calculated using the Greenwood formula. Median follow-up was estimated according to the Kaplan-Meier estimate of potential follow-up.62 The DOR was right-censored as follows (the progression or censoring date was determined based on described conventions from the FDA [2007]) for patients who met 1 or more of the following conditions:
underwent an amputation or surgical resection of tumour in the absence of documented progressive disease; patients who underwent surgical resection and had no viable tumour cells and negative margins on post-surgical pathology report were excluded from this category; such patients were considered to have achieved CR by surgery/pathology and continued to undergo assessments for disease recurrence following surgery, and patients who underwent resection of lesions that were determined to be benign were excluded from this censoring condition
initiated subsequent anticancer therapy in the absence of documented progressive disease
died or had progressive disease after missing 2 or more consecutively scheduled disease assessment visits
were last known to be alive and without documented progressive disease on or before the data cut-off date.
Progression-free survival was analyzed according to the same methods as DOR analyses with the addition that patients with no baseline or post-baseline disease assessments were right-censored unless death occurred before the first planned assessment (in which case the death was considered a PFS event).62 Kaplan-Meier estimates of PFS rates at 6 and 12 months, with corresponding 95% CIs calculated using the Greenwood formula, were presented.
For OS analyses, patients who were alive or lost to follow-up as of the data cut-off date were right-censored.62 The censoring date was determined from the date the patient was last known to be alive. The duration of OS was summarized descriptively using the Kaplan-Meier method, with a 95% CI about the median calculated using the Greenwood formula. Median follow-up for OS was estimated according to the Kaplan-Meier estimate of potential follow-up. Kaplan-Meier estimates of OS at 6 and 12 months, with corresponding 95% CIs calculated using the Greenwood formula, were presented. Analyses at additional time points (e.g., 24 months) may be performed as the follow-up data mature.
Analyses of HRQoL, which was assessed using the PedsQL, were analyzed descriptively by time point and mean changes over time in scores.62 Pain scores were analyzed descriptively by time point.
Safety data were tabulated and presented by nominal-dose cohort across both phase I and phase II and by all patients.62 For certain presentations (such as laboratory analyses and vital signs), data were presented across all dosed patients only. A tabulation of all AEs by NTRK fusion status was also presented. Adverse events were summarized based on the number and percentage of patients experiencing the event mapped to the Medical Dictionary for Regulatory Activities preferred term and grouped by system organ class. The causal relationship between the occurrence of an AE and the study drug was judged by the investigator. If a patient experienced repeat episodes of the same AE, then the event with the highest severity grade and strongest causal relationship to the study drug was used for the incidence tabulations. All deaths were reported in a patient listing, and included the treatment cohort, primary cause of death, and the number of days between the date of the last dose of study drug and death.
For data summarized over time by visit, no imputations were performed on missing data and all analyses were based on observed data only.62 The effective sample sizes at each assessment visit were based on the total number of patients with non-missing data for the parameter of interest at that visit.
Two interim analyses have been performed.62 Additional unplanned interim may be performed, but these will be considered exploratory in nature. Unplanned interim analyses will be detailed in a separate interim statistical analysis plan and described in a subsequent Clinical Study Report. Although, according to the protocol, the primary analysis of ORR was to be based on IRC assessments, investigator assessment was used for the interim Clinical Study Report. In the final Clinical Study Report analysis and in the Integrated Summary of Efficacy, the central IRC assessment was/will be used and the concordance between the methods was/will be examined.
LOXO-TRK-15002 (NAVIGATE Trial)
For the cancer-specific cohorts (1 through 7), Simon’s 2-stage design was used to determine whether larotrectinib had sufficient anticancer activity to warrant further development for that tumour type, and enrolment within a cohort could have been terminated early if larotrectinib was deemed to be insufficiently effective.63 The decision to terminate or continue enrolment within a cohort is made independently of the other cohorts. For each cohort, a true ORR of 10% or less is considered insufficient to warrant further study (null hypothesis), whereas a true ORR of 30% or more is considered sufficiently effective (alternative hypothesis). The number of patients evaluated in each stage and the minimum number of responders needed to continue to the next stage were determined based on the optimum version of the aforementioned design with an 80% power and a 1-sided significance level of 10%. Based on these design considerations, up to 7 patients could be enrolled in each cohort (stage 1). If no patients achieved a CR or PR (confirmed or unconfirmed) within a cohort, then enrolment within that cohort would terminate. Otherwise, 11 additional patients would be enrolled within the cohort (second stage). Up to 18 patients per tumour-specific cohort (cohorts 1 through 7), and up to 25 patients in the other histologic tumour types cohort (cohort 8) or patients without measurable disease cohort (cohort 9), were estimated, for a maximum total sample of approximately 176 patients. In case 7, patients with the same histology were enrolled without a response, and no further patients would therefore be enrolled with that histology. Up to 18 additional subjects may have been enrolled in cohorts 1 through 8 once the second stage of the Simon 2-stage design had been fully completed for cohorts 1 through 7 and once cohort 8 had been fully enrolled. These patients constituted a “post–stage 2” enrolment group. Unless otherwise specified, data were summarized by cohort and in total. Patients enrolled in the post–stage 2 group were included in each respective cohort for the analyses.
The point estimate of the ORR was calculated based on the maximum likelihood estimator (i.e., the crude proportion of patients with the BOR of CR or PR), based on all evaluable subjects, where evaluable subjects are defined as subjects with measurable disease at baseline and with evaluable post-baseline disease assessment(s).63 Patients with measurable disease at baseline who discontinued from study treatment were considered evaluable even if they had no post-baseline disease assessment. The point estimate of ORR was accompanied by a 1-sided 90% exact binomial CI using the Clopper-Pearson method. Additionally, 1-sided 97.5% exact binomial CIs for the ORR may also be presented. A forest plot of the ORRs and the associated 1-sided 90% CIs was presented by cohort.
The BOR was to be summarized descriptively and derived from the time point responses as determined by the investigator.63 Response (PR or CR) must have been confirmed by a repeated assessment performed no less than 28 days after the criteria for response is first met. When stable disease is believed to be the best response, it must also have met the minimum interval of 6 weeks from the start of study treatment. If the minimum time was not met when stable disease was otherwise the best time point response, the subject’s best response was dependent on the subsequent assessments. For patients with measurable solid tumours, the sum of the longest diameters (shortest for lymph nodes) was calculated for target lesions. The baseline and the minimum post-baseline values of the sum of diameters as well as the best percentage change in the sum of diameters from baseline were summarized using descriptive statistics for subjects with measurable solid tumours. For subjects with primary CNS tumours in cohort 7, the sum of the product of diameters was calculated for target lesions. The sum of the product of diameters was summarized in the same manner as for the sum of the diameters of measurable solid tumours.
Time-to-event efficacy variables including DOR, PFS, and OS were summarized descriptively using the Kaplan-Meier method for medians and corresponding 2-sided 95% CIs, calculated using the Greenwood formula and presented by cohort.63 Rates and the corresponding 2-sided 95% CIs were provided by 6-month intervals. Plots of the Kaplan-Meier estimate of the survival distribution function over time were presented. The median follow-up for each end point was estimated according to the Kaplan-Meier estimate of potential follow-up, calculated in the same way as the Kaplan-Meier estimate of the corresponding survival function, but with the meaning of the status indicator reversed. Exploratory subgroup analyses of selected efficacy end points were planned, subject to the availability of data. The subgroups would be defined based on the patient and disease characteristics as well as treatment history (e.g., extent of prior therapy), and were not predefined in the protocol
The DOR was right-censored as follows for63:
patients who had an amputation or surgical resection of tumour in the absence of documented progressive disease; those who underwent surgical resection and had no viable tumour cells and negative margins on post-surgical pathology report were excluded from this category, and such patients were considered a CR by surgery/pathology and continued to undergo assessments for disease recurrence following surgery; patients who underwent resection of lesions that were determined to be benign were also excluded from this censoring condition
patients who initiated subsequent anticancer therapy in the absence of documented progressive disease
patients who died or had progressive disease after missing 2 or more consecutively scheduled disease assessment visits
patients who are were last known to be alive and without documented progressive disease on or before the data cut-off date.
Progression-free survival was analyzed according to the same methods as DOR analyses, with the addition that patients with no baseline or post-baseline disease assessments were right-censored unless death occurred before the first planned assessment (in which case the death was considered a PFS event).63 For OS analyses, patients who were lost to follow-up or who were still alive at the time of analysis were censored at the last day the subject was known to be alive.
Scores from the EORTC QLQ-C30 and changes from baseline were summarized descriptively over time at scheduled time points by cohort for subjects 18 years and older.63 The PedsQL generic module total scores and changes from baseline were summarized descriptively over time at scheduled time points by cohort for subjects aged 12 to 17 years. Frequency tables were used to display the number and percentage of subjects of reported problems for each level and each dimension of the EQ-5D-5L by scheduled time point.
Safety was assessed by clinical review of all relevant parameters, including AEs, SAEs, laboratory values, vital signs, and electrocardiogram results.63 Safety analyses in general were descriptive and were presented in tabular format with the appropriate summary statistics. Tabulations were provided by cohort and in total. No formal statistical comparison was applied. TEAEs were defined as those that started on or after the first administration of the study drug. For the number and percentage of subjects with TEAEs, drug-related TEAEs, treatment-emergent SAEs, drug-related treatment-emergent SAEs, TEAEs leading to discontinuation of the study drug, drug-related TEAEs leading to discontinuation of study drug, TEAEs leading to dose reduction and/or interruption of the study drug, and drug-related TEAEs leading to dose reduction and/or interruption of the study drug summaries, subjects with multiple AEs were counted only once per system organ class and preferred term.
Unless noted otherwise, missing data for individual data points were not imputed, and all analyses were based on observed data only.63 A single interim analysis was conducted based on an amended protocol. The interim analysis was performed for the purposes of supporting an application for marketing approval of larotrectinib. The interim Clinical Study Report included all subjects enrolled as of the data cut-off of July 15, 2019.
Pooled Analysis
The statistical analysis plan for the integrated summary of efficacy was based on interactions with the FDA and other global regulatory agencies.25,57 The plan was finalized before the database was closed and before IRC assessment of tumours was conducted; however, time points for additional data cut-offs were chosen to fulfill requests for updated data from regulatory agencies. The plan included: sample size; the PAS; the rationale for lack of randomization, comparator arm, and balanced cohort recruitment; pooling (reasons, appropriateness, and design); and procedures for modifying the study design. The datasets represent different data cut-offs of the patients enrolled in the larotrectinib clinical trials who were eligible for analysis at a given point in time (i.e., these datasets are not derived from different patient cohorts, and the later dataset included the patients from earlier datasets). Due to different regional requirements for required sample sizes by regulatory agencies as well as the interest in longer-term follow-up of patients, regular data cut-offs, including incremental datasets of patients, were planned.57
The point estimate of the ORR was calculated based on the crude proportion of patients’ BOR of a confirmed CR or confirmed PR. The point estimate will be accompanied by a 2-sided 95% exact binomial CI using the Clopper-Pearson method.57 The BORs (CR, surgical CR, PR, stable disease, progressive disease, and unevaluable) were summarized descriptively to show the number and percentage of patients in each response category. The agreement rate between IRC assessment and investigator assessment was evaluated by frequency table. Heterogeneity of the estimated ORR by study was evaluated based on the quantity I2, which describes the percentage of total variation across studies due to heterogeneity rather than chance. The analysis of DCR was based on the methods described for ORR.
The TTR was summarized descriptively by calculating the median, quartiles, and minimum and maximum values.57 The number and percentage of patients with TTR, measured relative to the date of the first dose of larotrectinib, were tabulated by the following time points: 2 months or less, more than 2 months to 4 months, more than 4 months to 6 months, more than 6 months to 9 months, and more than 9 months. Kaplan-Meier curves were used to graphically present the TTR distribution over time. The TTBR was summarized descriptively in the same manner as the TTR.
The DOR was summarized descriptively using the Kaplan-Meier method with the 95% CI about the median calculated using the Greenwood formula.57 Median follow-up for DOR was estimated according to the Kaplan-Meier estimate of potential follow-up. Using the Kaplan-Meier method, the rates of continuing responders (irrespective of censoring status of patient) for at least 6, at least 12, at least 18, and at least 24 months were estimated, including 95% CIs. A separate table assessing DOR by tumour type was provided, including 12- and 24-month DOR rates. The DOR was right-censored as follows for:
patients who had an amputation or surgical resection of tumour in the absence of documented progressive disease; those who underwent surgical resection and had no viable tumour cells and negative margins on post-surgical pathology report were excluded from this category; such patients were considered a CR by surgery/pathology and continued to undergo assessments for disease recurrence following surgery; patients who underwent resection of lesions that were determined to be benign were also excluded from this censoring condition
patients who initiated subsequent anticancer therapy in the absence of documented progressive disease
patients who died or had progressive disease after missing 2 or more consecutively scheduled disease assessment visits
patients who were last known to be alive and without documented progressive disease on or before the data cut-off date.
Progression-free survival was analyzed according to the same methods as the DOR analyses, with the addition that patients with no baseline or post-baseline disease assessments were right-censored unless death occurred before the first planned assessment (in which case the death was considered a PFS event).57
The duration of OS was summarized descriptively using the Kaplan-Meier method with the 95% CI about the median calculated using the Greenwood formula.57 Using the Kaplan-Meier method, the rates of patients alive for at least 6, at least 12, at least 18, and at least 24 months were estimated, including 95% CIs. Median follow-up for OS was estimated according to the Kaplan-Meier estimate of potential follow-up. Patients who are alive or lost to follow-up as of the data cut-off date were right-censored. The censoring date was determined from the date the patient was last known to be alive.
For HRQoL, the proportion of adults and children with norm/above norm and below norm QoL scores was compared with values in published literature for the US general population.60 The mean EORTC QLQ-C30 GHS for the US general population (63.9)24 minus 10 points (the MID) was used to construct the norm/above norm (≥ 53.9) and below norm (< 53.9) score categories for adults.25 The average score for the combined self and proxy-reported PedsQL questionnaire for healthy US children (85.0)26 minus 4.5 points (the MID) was used to construct the norm/above norm (≥ 80.5) and below norm (< 80.5) score categories for children 2 years of age or older. As no established normative PedsQL total score for infants younger than 2 years of age was identified, no comparisons were performed in this group. For patients who exhibited sustained improvement or deterioration for at least 2 consecutive cycles, the following method was used to calculate sustained improvement/deterioration. The duration of improvement was calculated as the duration (in months) for those patients with improvement from the date of the first increase from baseline greater than or equal to the MID for the respective HRQoL instrument until the date of the last adjacent increase from baseline greater than or equal to the MID (i.e., an increase from baseline greater than or equal to the MID after a decrease was ignored). A patient was censored at the date of last available questionnaire if there was no visit with an increase less than the MID before the last available measurement.
Safety was assessed based on the incidence and severity of all AEs and AEs that were deemed SAEs.57 Changes in clinical laboratory tests, vital signs, body weight, performance status, and 12-lead electrocardiograms were also assessed. These data presentations were performed for each of the analysis sets, with the exception of the analysis set of only patients treated at the recommended dose, which was only used to analyze AEs, deaths, and laboratory abnormalities (according to toxicity grading). All deaths that occurred while on treatment or after the last dose of the study drug were displayed in a patient-listing format.
Supportive analyses were performed to assess ORR for consistency across selected subgroups and special populations.57 The point estimate of the ORR (and 95% CI), based on IRC assessment, was calculated for the subgroups and special populations defined by the following:
age at enrolment (1 month to < 2 years, 2 to < 6 years, 6 to < 12 years, 12 to < 18 years, 18 to < 65 years, ≥ 65 years)
pediatric (age at enrolment < 18 years) versus adults (age at enrolment ≥ 18 years)
sex (male, female)
race (White, Black, Asian, other)
ECOG performance status at baseline (0 to 1, 2, or 3)
NTRK fusion (NTRK1, NTRK2, NTRK3)
NTRK fusion partner (e.g., ETV6)
primary cancer diagnosis (according to standardized term)
cancers considered pathognomonic for NTRK fusions (IFS and MASC)
disease status (metastatic or locally advanced)
number of prior systemic regimens or treatment courses (0, 1, 2, ≥ 3)
BOR to most recent prior systemic regimen or treatment course (CR, PR, stable disease, progressive disease, unknown or unevaluable, or not applicable)
starting dose of larotrectinib and frequency of administration (separately for adult versus pediatric patients).
Depending on the requests or requirements of individual regulatory agencies, age groupings other than those specified above may have been used for supplemental analyses.57 The subgroups and special populations were determined based on the data recorded for the screening or baseline assessments. Subgroups based on larotrectinib dosing parameters were determined from the actual dose, frequency, and formulation recorded for study day 1.
As a sensitivity analysis to assess the potential impact of requiring 6 months of follow-up for inclusion into the respective latest analysis set on response rate, the subset of patients of that were immature for the dataset that discontinued or died within less than 6 months after recruitment were assessed by IRC and combined with the analysis set for a sensitivity analysis.57 Response rates were determined and evaluated using a method similar to that previously described.
Unless noted otherwise, missing data were not imputed.57 For efficacy outcome data summarized over time by visit, no imputations were performed on missing data. All analyses were based on observed data only. The effective sample sizes at each assessment visit were based on the total number of patients with non-missing data for the parameter of interest at that visit. For safety outcomes, all analyses were based on observed data only. The effective sample sizes at each assessment visit were based on the total number of patients with non-missing data for the parameter of interest at that visit.
Table 12: Statistical Analysis of Efficacy End Points
End point | Statistical model | Adjustment factors | Sensitivity analyses |
|---|---|---|---|
Pooled analysis | |||
Overall response rate | Two-sided 95% exact binomial CIs for the proportion of patients with response were calculated using the Clopper-Pearson method | None | Assessment of the potential impact of requiring 6 months of follow-up for inclusion into the respective latest analysis set on response rate |
Disease control rate | Two-sided 95% exact binomial CIs for the proportion of patients with response were calculated using the Clopper-Pearson method | None | None |
Time to tumour response | Kaplan-Meier method with 95% CIs calculated using the Greenwood calculation | None | None |
Time to best response | Kaplan-Meier method with 95% CIs calculated using the Greenwood calculation | None | None |
Duration of overall response | Kaplan-Meier method with 95% CIs calculated using the Greenwood calculation | None | None |
Progression-free survival | Kaplan-Meier method with 95% CIs calculated using the Greenwood calculation | None | None |
Overall survival | Kaplan-Meier method with 95% CIs calculated using the Greenwood calculation | None | None |
EORTC QLQ-C30 GHS | Change from baseline and comparative to norm score categorization | None | None |
PedsQL-Core | Change from baseline and comparative to norm score categorization | None | None |
CI = confidence interval; EORTC QLQ-C30 GHS European Organization for Research and Treatment of Cancer Quality of Life Questionnaire Core 30 global health score; PedsQL-Core = Pediatric Quality of Life Inventory.
Source: Statistical Analysis Plan for Integrated Summary of Efficacy and Safety.57
Analysis Populations
LOXO-TRK-14001
The following analysis sets were used in the trial61:
A full analysis set (FAS) was used primarily for the analysis of tumour response and other efficacy-related data. It included all enrolled patients who received 1 or more doses of larotrectinib. For the final analysis, the protocol-specified FAS was used and included the following: patients in either the escalation or expansion phase who received 1 or more doses of larotrectinib, patients with a documented NTRK abnormality, and patients with 1 or more measurable lesions at baseline as determined by RECIST 1.1 or RANO criteria as appropriate.
A safety analysis set was used primarily for the analysis of safety data. It consisted of all enrolled patients who received at least 1 dose of larotrectinib.
LOXO-TRK-15003 (SCOUT Trial)
The following analysis sets were used in the trial62:
An FAS was used primarily for the analysis of tumour response and other efficacy-related data. It included all enrolled patients who receive 1 or more doses of larotrectinib.
A safety analysis set was used primarily for the analysis of safety data. It consisted of all enrolled patients who received at least 1 dose of larotrectinib.
LOXO-TRK-15002 (NAVIGATE Trial)
The following analysis sets were used in the trial63:
An FAS was used for all efficacy analyses in the interim analyses and included all enrolled patients who received 1 dose of larotrectinib, including patients enrolled as part of the post–stage 2 enrolment group. The FAS designation for the interim analysis was more inclusive than the FAS specified in the protocol as it also included post–stage 2 patients who were dosed. For the final analysis, the protocol-specified FAS will be used.
A safety analysis set was used for safety data and consisted of all enrolled patients who received at least 1 dose of larotrectinib. A baseline measurement and at least 1 laboratory or other safety-related measurement obtained after at least 1 dose of the study drug may have been required for inclusion in the analysis of a specific safety parameter.
Pooled Analysis
The following datasets were used for the pooled analyses22:
The PAS (July 17, 2017, data cut-off) included the first 55 patients across the 3 studies (8 patients form LOXO-TRK-14001, 12 patients from LOXO-TRK-15003, and 35 patients from LOXO-TRK-15002) who met the inclusion criteria for the pooled analysis. This dataset constituted the FDA submission.31
The ePAS (February 19, 2018, data cut-off) included an additional 18 patients (9 patients from LOXO-TRK-15003 and 9 patients from LOXO-TRK-15002) who met inclusion criteria for the pooled analysis. A total of 73 patients with NTRK gene fusions were analyzed at this data cut-off date. The results of the ePAS were submitted to Health Canada for regulatory review and to CADTH for the original consideration.
Extended primary analysis set 4 (July 15, 2019, data cut-off) included a total of 164 patients (13 patients from LOXO-TRK-14001, 53 patients from LOXO-TRK-15003, and 98 patients from LOXO-TRK-15002) who met inclusion criteria for the pooled analysis (including having an IRC-assessed response). The results of ePAS4 were submitted to CADTH and L'Institut national d’excellence en santé et en services sociaux (INESSS) for reconsideration.
Extended primary analysis set 5 (July 2020 data cut-off) included a total of 192 patients. This was the most updated dataset with the largest number of patients and follow-up data.
Safety analysis set 3 (July 15, 2019, data cut-off) included 24 patients with primary CNS tumours. Additionally, a new SAS3 dataset with a longer follow-up (July 2020 data cut-off) and 33 patients was submitted.
Patients included in the HRQoL analyses (July 15, 2019, data cut-off) had non-CNS primary solid tumours with NTRK gene fusion and measurable disease from LOXO-TRK-15003 and LOXO-TRK-15002. This analysis included 126 patients who had received larotrectinib and completed a baseline and at least 1 post-baseline questionnaire (74 adults, 24 children ≥ 2 years old, and 28 infants < 2 years old).
The TRK fusion cancer labelled-dose safety analysis set (July 15, 2019, data cut-off) included 196 patients with TRK fusion cancer who received at least 1 dose of larotrectinib at the labelled or recommended dose.
The overall labelled-dose safety analysis set (July 15, 2019, data cut-off) included 238 patients (with or without TRK fusion cancer) who received at least 1 dose of larotrectinib at the labelled or recommended dose.
The integrated dataset (July 30, 2018, data cut-off) consisted of 122 patients from the combined extended primary and supplementary datasets, i.e., larotrectinib-treated patients with NTRK gene fusions who had their outcomes assessed by the investigator. This dataset was the basis for the 2019 CADTH submission.23
The safety dataset (July 30, 2018, data cut-off) encompasses the entire larotrectinib safety database (n = 207), which includes 122 patients with NTRK gene fusion cancer and 70 patients without confirmed NTRK gene fusions.
The NTRK fusion cancer safety set (July 2020 data cut-off) consisted of updated safety data from 260 cancer patients with NTRK fusion.
The overall safety set (July 2020 data cut-off) consisted of the entire larotrectinib safety database with a larger sample (n = 331).
Figure 2 provides an overview of the different pooled datasets submitted to different regulatory agencies at different time points, with different data cut-offs and sample sizes.
Figure 2: Overview of Pooled Datasets for Larotrectinib
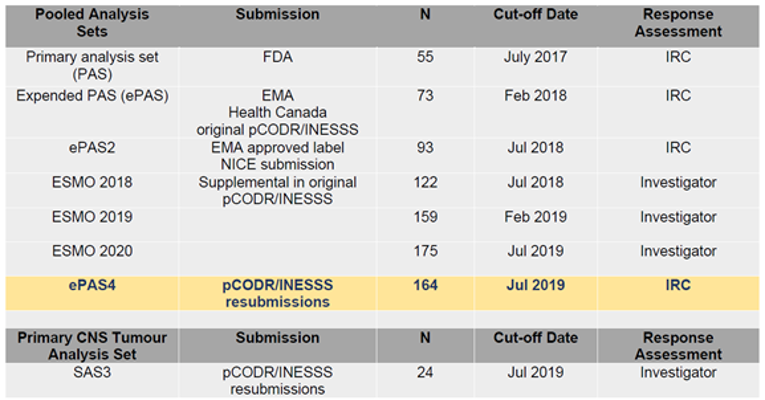
EMA = European Medicines Agency; ePAS = extended primary analysis set; ePAS4 = extended primary analysis set 4; ESMO = European Society for Medical Oncology; INESSS = Institut national d’excellence en santé et en services sociaux; IRC = independent review committee; NICE = National Institute for Health and Care Excellence; PAS = primary analysis set; pCODR = CADTH pan-Canadian Oncology Drug Review; SAS3 = safety analysis set 3.
Source: Note to clinical reviewer (2020).22
Results
Patient Disposition
A total of 164 eligible patients with NTRK gene fusions from the 3 aforementioned trials were included in ePAS4 (Table 13); of those, 84 patients (51.2%) had discontinued treatment as of the July 15, 2019, data cut-off. Reasons for discontinuation included disease progression in 49 patients (29.9%), AEs in 4 patients (2.4%), physician decision in 7 patients (4.3%), subject decision in 6 patients (3.7%), protocol deviation in 2 patients (1.2%), death in 3 patients (1.8%), and other reasons in 7 patients (7.9%).22
Disposition | LOXO-TRK-14001a | LOXO-TRK-15003a (SCOUT) | LOXO-TRK-15002 | ePAS4 |
|---|---|---|---|---|
Enrolled, overall, N | 75 (61 in dose escalation phase and 14 in dose expansion phase) | 88 (38 in phase I and 50 in phase II) | 116 (13, 23, 20, 8, 19, 2, 7, 21, and 3 from cohorts 1 through 9, respectively) | NA |
Total NTRK fusion + patients | 13 | 79 | 116 | 208b |
Continuing treatment, n (%) | Overall: 9 (12) NTRK fusion patients: 9 (69) | Overall: 55 (63) | Overall: 60 (51.7) | 124 (59.6) |
Discontinued from treatment, N (%) | Overall: 66 (88) NTRK fusion patients: 4 (31) | Overall: 33 (38) | Overall: 56 (48.3) | 84 (51.2) |
Reason for discontinuation, N (%) | ||||
Disease progression | Overall: 50 (67) NTRK fusion patients: 3 (23) | 12 (14) | 36 (31.0) | 49 (29.9) |
Clinical progression | NR | 4 (5) | NR | NR |
Physician decision | NR | NR | 7 (6.0) | 7 (4.3) |
Subject decision | Overall: 6 (8) NTRK fusion patients: 1 (8) | NR | 5 (4.3) | 6 (3.7) |
Adverse event | Overall: 5 (7) NTRK fusion patients: 0 | 2 (2) | 3 (2.6) | 4 (2.4) |
Non-compliance or protocol deviation | Overall: 2 (3) NTRK fusion patients: 0 | NR | 2 (1.7) | 2 (1.2) |
Death | NR | 1 (1) | 3 (2.6) | 3 (1.8) |
Other | Overall: 3 (4) NTRK fusion patients: 0 | 10 (14) | 0 | 13 (7.9) |
Contributing to ePAS4 | 13 | 53 | 98 | 164 |
ePAS4 = extended primary analysis set 4; NA = not applicable; NR = not reported; NTRK = neurotrophic tyrosine kinase receptor.
aAs of a data cut-off date of July 15, 2019. Data listed is for all participants in the trial, not limited to those contributing to the integrated analysis sets.
bThe ePAS4 dataset only contains NTRK fusion–positive patients.
Source: Note to clinical reviewer (2020),22 Clinical Summary Report for LOXO-TRK-14001,61 Clinical Summary Report for LOXO-TRK-15003,62 and Clinical Summary Report for LOXO-TRK-15002.63
Exposure to Study Treatments
The exposure to study treatment was not reported for the patients included in the pooled analysis.
Efficacy
Only those efficacy outcomes and analyses of subgroups identified in the review protocol are reported here. As noted earlier, the results of the ePAS4 dataset (July 15, 2019, data cut-off) were submitted to CADTH for reconsideration, and therefore they are discussed here. Results from the sponsor’s primary pooled analysis (PAS [n = 55]; July 17, 2017, data cut-off) used for the FDA submission, the original CADTH submission (integrated dataset [n = 122]; July 30, 2018, data cut-off), and the newest ePAS5 dataset (July 2020 data cut-off) are also presented, where available, for comparison.
Overall Response Rates
ePAS4 and ePAS5 Datasets
The primary efficacy end point of the pooled analysis was the ORR. The ORR from the PAS (n = 55; July 17, 2017, data cut-off) was 75% (95% CI, 61% to 85%); 20% of patients achieved a CR, 5% achieved a pathological CR, and 49% achieved a PR (Table 14).22 At the time of the data cut-off date of July 15, 2019, for ePAS4 (n = 164), the ORR by IRC assessment was 73% (95% CI, 65% to 79%); 19% of patients achieved a CR, 5% achieved a pathological CR, and 49% achieved a PR (Table 15). The DCR (defined as CR, pathological CR, PR, and stable disease lasting ≥ 16 weeks) was 84% (95% CI, 77% to 89%). At the time of the data cut-off of July 2020 for the ePAS5 (n = 192), the ORR was 72% (95% CI, 65% to 79%); 23% and 7% patients achieved CR and pathological CR, respectively. In the original submission, the ORR as of the July 30, 2018, data cut-off date was 81% (95% CI, 72% to 88%); 17% of patients achieved a CR and 63% achieved a PR (Appendix 3).
Table 14: IRC-Assessed ORR in the PAS, ePAS4, and ePAS5 From Larotrectinib Trials (LOXO-TRK-14001, LOXO-TRK-15003, and LOXO-TRK-15002)
Response rate | PAS N = 55 | ePAS4 N = 164 | ePAS5 N = 192 |
|---|---|---|---|
Overall response ratea | |||
n (%) | 41 (75) | 119 (73) | 139 (72) |
95% CI | 61 to 85 | 65 to 79 | 65 to 79 |
Best response, n (%) | |||
Complete response | 11 (20) | 31 (19) | — (23) |
Pathological complete responseb | 3 (5) | 8 (5) | — (7) |
Partial response | 27 (49) | 80 (49) | — |
Stable disease | 7 (13) | 25 (15) | — |
Progressive disease | 5 (9) | 13 (8) | — |
Not evaluable | 2 (4) | 7 (4) | — |
Disease control ratec | |||
n (%) | 45 (82) | 137 (84) | — |
95% CI | 69 to 91 | 77 to 89 | — |
CI = confidence interval; ePAS4 = extended primary analysis set 4; ePAS5 = extended primary analysis set 5; IRC = independent review committee; ORR = overall response rate; PAS = primary analysis set.
aOverall response rate is the sum of confirmed complete response, pathological complete response, and partial response.
bPatients on larotrectinib therapy who underwent surgical resection with no viable tumour cells and negative margins on a post-surgical pathology report were considered a complete response by surgery/pathology, and their pre-surgical best response was reclassified as pathological complete response after surgery following Response Evaluation Criteria in Solid Tumours Version 1.1; previously referred to as surgical complete response.
cDisease control rate is the proportion of patients with best overall response of complete, surgical complete, or partial response, or stable disease lasting 16 weeks or more following initiation of larotrectinib.
Source: Note to clinical reviewer (2020) and updated ePAS5 data.22,27
Subgroup Analyses
Subgroup analyses of ePAS4 (July 15, 2019, data cut-off date) are summarized in this section.22 The ranges of ORRs across the different subgroups were tumour type: 0% (95% CI to NE) to 100% (95% CI, 40% to 100%) (Table 15); age: 91% (95% CI, 80% to 97%) in pediatrics and 63% (95% CI, 54% to 72%) in adults (Table 16); baseline ECOG status: 33% (95% CI, 1% to 92%) in patients with an ECOG status of 3 to 83% (95% CI, 72% to 90%) in patients with an ECOG status of 0 (Table 17); number of prior systemic treatment regimens: 59% (95% CI, 41% to 75%) in patients who have received 2 prior systemic treatments to 86% (95% CI, 71% to 95%) in patients who have received 0 prior systemic treatments (Table 18); baseline disease status: 67% (95% CI, 58% to 75%) in patients with metastatic cancer at baseline to 88% (95% CI, 74% to 96%) in patients with locally advanced metastatic cancer at baseline (Table 19); an NTRK gene involved in gene fusion: 50% (95% CI, 7% to 93%) for patients with NTRK2 gene fusion to 80% (95% CI, 71% to 88%) for patients with NTRK3 gene fusion (Table 20); and NTRK gene fusion for the 3 most common fusion partners: 62% (95% CI, 32% to 86%) in patients with LMNA-NTRK1 gene fusion to 85% (95% CI, 75% to 92%) in patients with ETV6-NTRK3 gene fusion (Table 21).
Across the different tumour types, ORR varied between the 3 datasets at 3 different cut-off points (July 17, 2017, July 15, 2019, and July 2020 for PAS, ePAS4, and ePAS5, respectively). For tumours found in more than 10 patients, the differences in ORR estimates were most noticeable for STS and thyroid cancer.
Table 15: IRC-Assessed ORR by Tumour Type in the PAS, ePAS4 and ePAS5 From Larotrectinib Trials (LOXO-TRK-14001, LOXO-TRK-15003, and LOXO-TRK-15002)
Tumour type | PAS N = 55 | ePAS4 N = 164 | ePAS5 N = 192 | |||
|---|---|---|---|---|---|---|
Overall response rate, % (95% CI) | n | % (95% CI) | n | % (95% CI) | n | % (95% CI) |
Overall | 55 | 75 (61 to 85) | 164 | 73 (65 to 79) | 192 | 72 (65 to 79) |
STS | 11 | 91 (59 to 100) | 36 | 81 (64 to 92) | 48 | 69 (54 to 81) |
IFS | 7 | 100 (59 to 100) | 32 | 97 (84 to 100) | 40 | 93 (80 to 98) |
Thyroid | 5 | 100 (48 to 100) | 27 | 56 (35 to 75) | 28 | 64 (44 to 81) |
Salivary gland | 12 | 83 (52 to 98) | 21 | 86 (64 to 97) | 22 | 86 (65 to 97) |
Lung | 4 | 75 (19 to 99) | 13 | 77 (46 to 95) | 15 | 87 (60 to 98) |
Colon | 4 | 25 (1 to 81) | 8 | 38 (9 to 76) | 8 | 38 (9 to 76) |
Melanoma | 4 | 50 (7 to 93) | 7 | 43 (10 to 82) | 7 | 43 (10 to 82) |
Breast | 1 | 0 (NC) | 5 | 60 (15 to 95) | 7 | 71 (29 to 96) |
Non-secretory | — | — | 3 | 67 (9 to 99) | — | — |
Secretory | — | — | 2 | 50 (1 to 99) | — | — |
GIST | 3 | 100 (29 to 100) | 4 | 100 (40 to 100) | 4 | 100 (40 to 100) |
Bone sarcoma | 0 | — | 2 | 50 (1 to 99) | 2 | 50 (1 to 99) |
Cholangiosarcoma | 2 | 0 (NC) | 2 | 0 (NC) | 2 | 0 (NC) |
Pancreas | 1 | 0 (NC) | 2 | 0 (NC) | 2 | 0 (NC) |
Appendix | 1 | 0 (NC) | 1 | 0 (NC) | 1 | 0 (NC) |
Cancer of unknown primary | 0 | — | 1 | 100 (3 to 100) | 1 | 100 (3 to 100) |
Congenital mesoblastic nephroma | 0 | — | 1 | 100 (3 to 100) | — | — |
Hepatic | 0 | — | 1 | 0 (NC) | 1 | 0 (NC) |
Prostate | 0 | — | 1 | 0 (NC) | 1 | 0 (NC) |
CI = confidence interval; ePAS4 = extended primary analysis set 4; ePAS5 = extended primary analysis set 5; GIST = gastrointestinal stromal tumour; IFS = infantile fibrosarcoma; IRC = independent review committee; NC = not calculated; ORR = overall response rate; PAS = primary analysis set; STS = soft tissue sarcoma.
Source: Note to clinical reviewer (2020) and updated ePAS5 data.22,27
Table 16: IRC-Assessed ORR by Pediatric or Adult Patients in ePAS4 From Larotrectinib Trials (LOXO-TRK-14001, LOXO-TRK-15003, and LOXO-TRK-15002)a
Response | Pediatric population N = 55 | Adult population N = 109 |
|---|---|---|
ORR, n | 50 | 69 |
ORR, % (95% CI)b | 91 (80 to 97) | 63 (54 to 72) |
CR, n (%) | 13 (24) | 18 (17) |
Pathological CR,c n (%) | 7 (13) | 1 (< 1) |
PR, n (%) | 30 (55) | 50 (46) |
Stable disease, n (%) | 4 (7) | 21 (30) |
Progressive disease, n (%) | 1 (2) | 12 (11) |
CI = confidence interval; CR = complete response; ePAS4 = extended primary analysis set 4; IRC = independent review committee; ORR = overall response rate; PR = partial response.
aPatients younger than 18 years of age were considered pediatric patients and those 18 years or older were considered adults.
bOverall response rate is the sum of confirmed CR, pathological CR, and PR.
cPatients on larotrectinib therapy who underwent surgical resection with no viable tumour cells and negative margins on post-surgical pathology report were considered to have achieved a CR by surgery/pathology, and their pre-surgical best response was reclassified as a pathological CR after surgery following Response Evaluation Criteria in Solid Tumours Version 1.1; previously referred to as surgical CR.
Source: Note to clinical reviewer (2020).22
Table 17: IRC-Assessed ORR by ECOG PS in ePAS4 From Larotrectinib Trials (LOXO-TRK-14001, LOXO-TRK-15003, and LOXO-TRK-15002)
Baseline ECOG PS | Number of patients | Number of patients with CR, pathological CR, or PR | ORR, % (95% CI)a |
|---|---|---|---|
Overall | 164 | 119 | 73 (65 to 79) |
0 | 80 | 66 | 83 (72 to 90) |
1 | 62 | 40 | 65 (51 to 76) |
2 | 19 | 12 | 63 (38 to 84) |
3 | 3 | 1 | 33 (1 to 91) |
CI = confidence interval; CR = complete response; ECOG PS = Eastern Cooperative Oncology Group performance status; ePAS4 = extended primary analysis set 4; IRC = independent review committee; ORR = overall response rate; PR = partial response.
a95% CI was calculated using the Clopper-Pearson method.
Source: Note to clinical reviewer (2020).22
Table 18: IRC-Assessed ORR by Number of Prior Systemic Regimens in ePAS4 From Larotrectinib Trials (LOXO-TRK-14001, LOXO-TRK-15003, and LOXO-TRK-15002)
Number of prior systemic treatment regimens | Number of patients | Number of patients with CR, pathological CR, or PR | ORR, % (95% CI)a |
|---|---|---|---|
Overall | 164 | 119 | 73 (65 to 79) |
0 | 36 | 31 | 86 (71 to 95) |
1 | 50 | 33 | 66 (51 to 79) |
2 | 34 | 20 | 59 (41 to 75) |
3 or more | 44 | 35 | 80 (65 to 90) |
CI = confidence interval; CR = complete response; ePAS4 = extended primary analysis set 4; IRC = independent review committee; ORR = overall response rate; PR = partial response.
a95% CI was calculated using the Clopper-Pearson method.
Source: Note to clinical Reviewer (2020).22
Table 19: IRC-Assessed ORR by Baseline Disease Status in ePAS4 From Larotrectinib Trials (LOXO-TRK-14001, LOXO-TRK-15003, and LOXO-TRK-15002)
Baseline disease status | Number of patients | Number of patients with CR, pathological CR, or PR | ORR, % (95% CI)a |
|---|---|---|---|
Overall | 164 | 119 | 73 (65 to 79) |
Metastatic | 122 | 82 | 67 (58 to 75) |
Locally advanced | 42 | 37 | 88 (74 to 96) |
CI = confidence interval; CR = complete response; ePAS4 = extended primary analysis set 4; IRC = independent review committee; ORR = overall response rate; PR = partial response.
a95% CI was calculated using the Clopper-Pearson method.
Source: Note to clinical reviewer (2020).22
Table 20: IRC-Assessed ORR by NTRK Gene Involved in NTRK Gene Fusion in ePAS4 From Larotrectinib Trials (LOXO-TRK-14001, LOXO-TRK-15003, and LOXO-TRK-15002)
NTRK fusion | Number of patients | Number of patients with CR, pathological CR, or PR | ORR, % (95% CI)a |
|---|---|---|---|
Overall | 164 | 119 | 73 (65 to 79) |
NTRK3 | 92 | 74 | 80 (71 to 88) |
NTRK1 | 68 | 43 | 63 (51 to 75) |
NTRK2 | 4 | 2 | 50 (7 to 93) |
CI = confidence interval; CR = complete response; ePAS4 = extended primary analysis set 4; IRC = independent review committee; ORR = overall response rate; NTRK = neurotrophic tyrosine kinase receptor; PR = partial response.
a95% CI was calculated using the Clopper-Pearson method.
Source: Note to clinical reviewer (2020).22
Table 21: IRC-Assessed ORR by NTRK Gene Fusion (3 Most Common Fusion Partners) in ePAS4 From Larotrectinib Trials (LOXO-TRK-14001, LOXO-TRK-15003, and LOXO-TRK-15002)
NTRK fusion | Number of patients | Number of patients with CR, pathological CR, or PR | ORR, % (95% CI)a |
|---|---|---|---|
Overall | 164 | 119 | 73 (65 to 79) |
ETV6-NTRK3 | 80 | 68 | 85 (75 to 92) |
TPM3-NTRK1 | 30 | 22 | 73 (54 to 88) |
LMNA-NTRK1 | 13 | 8 | 62 (32 to 86) |
CI = confidence interval; CR = complete response; ePAS4 = extended primary analysis set 4; IRC = independent review committee; ORR = overall response rate; NTRK = neurotrophic tyrosine kinase receptor; PR = partial response.
a95% CI was calculated using the Clopper-Pearson method.
Source: Note to clinical reviewer (2020).22
SAS3
At the July 15, 2019 data cut-off date for SAS3 (n = 24), which included patients with primary CNS tumours, the ORR by investigator assessment was 21% (95% CI, 7% to 42%); 8% of patients achieved a CR and 13% achieved a confirmed PR (Table 22).22 With the new data cut-off date of July 2020 (n = 33), the ORR was 24% (95% CI, 11% to 42%); 9% and 15% of patients achieved a CR and PR, respectively. In the original 2019 submission, among patients with primary CNS tumours (n = 18), the ORR was estimated to be 36% (95% CI, 13% to 65%); with CR in 14%, PR in 21%, and stable disease in 64% of patients (Appendix 3).
Table 22: Investigator-Assessed ORR in SAS3 From Larotrectinib Trials (LOXO-TRK-14001, LOXO-TRK-15003, and LOXO-TRK-15002)
Response, n (%) | SAS3 (n = 24) | SAS3 with new cut-off (n = 33) |
|---|---|---|
Overall response rate, n | 5 | — |
Overall response rate, % (95% CI)a | 21 (7 to 42) | 24 (11 to 42) |
Complete response, n (%) | 2 (8) | — (9) |
Partial response, n (%) | 3 (13) | — (15) |
Partial response (pending confirmation), n (%) | 2 (8) | — (6) |
Stable disease, n (%) | 10 (42) | — (52) |
Stable disease (pending confirmation), n (%) | 5 (21) | — |
Progressive disease, n (%) | 2 (8) | — |
DCR,b % | 63 | 82 |
CI = confidence interval; DCR = disease control rate; ORR = overall response rate.
aThe best overall response was derived from responses assessed at specified time points according to RANO or Response Evaluation Criteria in Solid Tumours Version 1.1 and includes only confirmed responses.
bDCR is defined as the proportion of patients with best ORR of confirmed or pathological complete response, partial response, or stable disease lasting 16 weeks or more following initiation of larotrectinib.
Source: Note to clinical reviewer (2020) and updated ePAS5 data.22,27
Time to Tumour Response
ePAS4
As of the data cut-off date for the ePAS4 dataset (July 15, 2019), the median TTR was 1.84 months (minimum = 0.92 months; maximum = 14.55 months) (Table 23, Figure 3).22 The percentage of patients experiencing a time to response of 2 months or less was 81% (96 of 119). The TTR was not assessed in the original 2019 submission.
Table 23: TTR in ePAS4 From Larotrectinib Trials (LOXO-TRK-14001, LOXO-TRK-15003, and LOXO-TRK-15002)
TTR | ePAS4 N = 164 |
|---|---|
Patients with best response of confirmed CR, pathological CR, or PR,a,b n | 119 |
Median (IQR), months | 1.84 (1.74 to 1.94) |
Range, months | 0.92 to 14.55 |
Time to response,c n (%) | |
2 months or less | 96 (81) |
2 to 4 months | 14 (12) |
> 4 to 6 months | 5 (4) |
> 6 to 9 months | 2 (2) |
> 9 months | 2 (2) |
CR = complete response; ePAS4 = extended primary analysis set 4; IQR = interquartile range; IRC = independent review committee; PR = partial response; TTR = time to tumour response.
aBased on IRC assessment.
bBest overall response classification based on radiologist and clinician assessments.
cTime to response is defined as the number of months between the date of the first dose of larotrectinib and the first documentation of objective response (CR, pathological CR, or PR, whichever occurred earlier) that was subsequently confirmed.
Source: Note to clinical reviewer (2020).22
Figure 3: Swimmer Plot of Time to Response and Overall Treatment Duration for ePAS4 (Database Cut-Off: July 15, 2019)
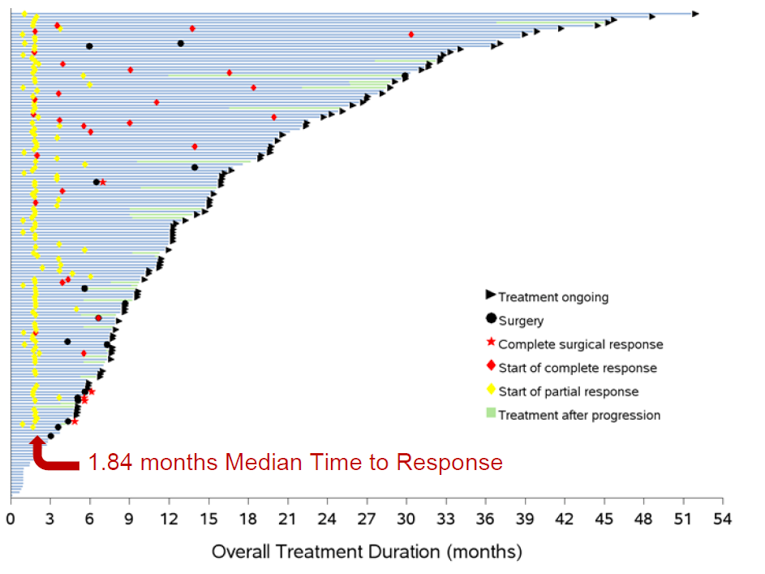
ePAS4 = extended primary analysis set 4.
Source: Note to clinical reviewer (2020).22
Figure 4: Swimmer Plot of Time to Response and Overall Treatment Duration for ePAS5 (Database Cut-Off: July 2020)
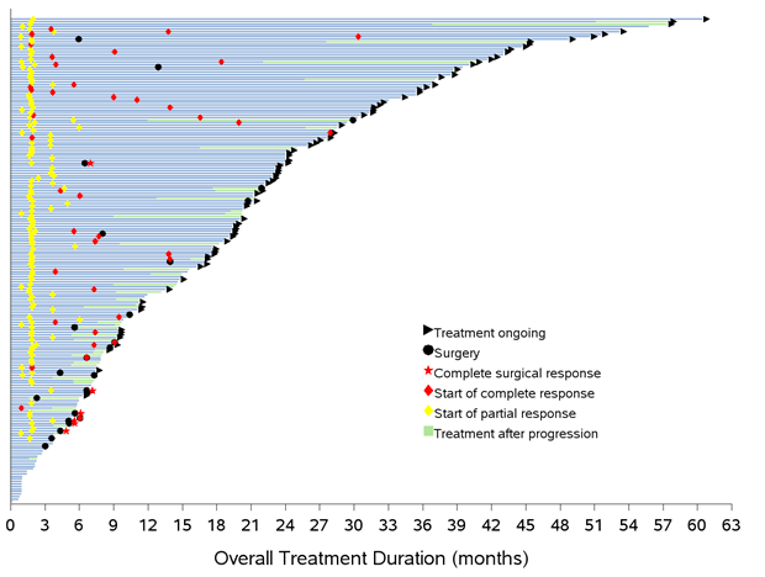
ePAS5 = extended primary analysis set 5.
Source: Updated ePAS5 data.27
SAS3
The median TTR in patients with primary CNS tumours was 1.82 months (range = 0.99 to 3.75) (Figure 5).22 The majority of patients experienced a response in less than 2 months (67%). At the time of data cut-off, 5 patients had a confirmed response; of these, 4 (80%) did not have disease progression at the time of data analysis.
Figure 5: Swimmer Plot of Time to Response and Overall Treatment Duration for SAS3 (Database Cut-Off: July 15, 2019)
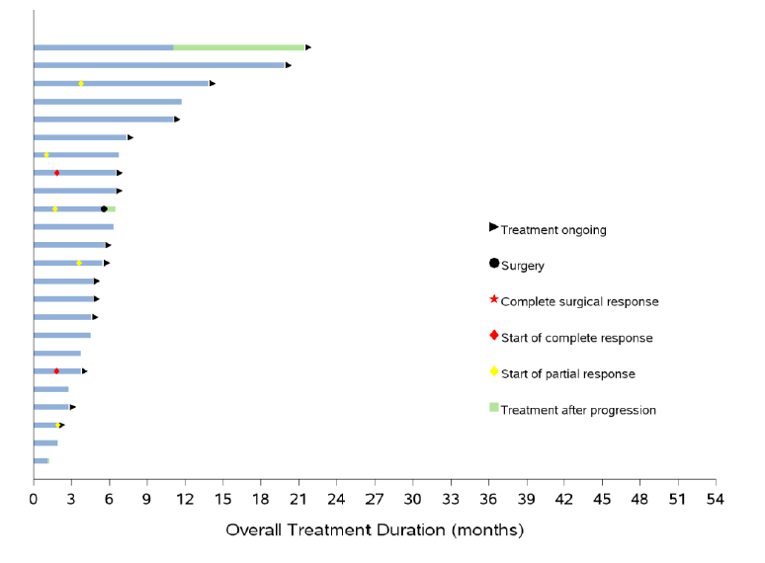
SAS3 = safety analysis set 3.
Source: Note to clinical reviewer (2020).22
DOR
ePAS4 and ePAS5
As of the data cut-off date for ePAS4 (July 15, 2019), after a median follow-up of 15.7 months (IQR = 6.6 months to 24.8 months), the median DOR per IRC assessment was NE (95% CI, 27.6 months to NE) (Table 24, Figure 6). Ninety patients (76%) had an ongoing response during this period. The percentage of participants with responses lasting longer than 24 months was 18% (21 of 119). At the time of the July 2020 data cut-off for ePAS5 (n = 192), the DOR was 34.5 months (95% CI, 27.6 to 54.7) with a median follow-up of 20.3 months (IQR = data NA), 79% and 66% patients had a DOR of 12 and 24 months, respectively.
The PAS (n = 55) was also evaluated for the DOR as of the July 15, 2019, data cut-off (Table 25).22 After a median follow-up of 28.2 months, the median DOR was 32.9 months (95% CI, 14.8 months to NE). A DOR of 24 months or more was seen in 62% (95% CI, 46% to 78%) of patients. In the original CADTH submission, the median DOR had not been reached as of the July 30, 2018, data cut-off date (integrated dataset). At that time point, 88% and 75% patients had an ongoing response at 6 months and 12 months from the start of response, respectively (Appendix 3).
Table 24: IRC-Assessed DOR in the PAS, ePAS4, and ePAS5 From Larotrectinib Trials (LOXO-TRK 14001, LOXO-TRK-15003, and LOXO-TRK-15002)
DOR | PAS N = 55 | ePAS4 N = 164 | ePAS5 N = 192 |
|---|---|---|---|
Patients with best response of confirmed CR, pathological CR, or PRa,b | 41 | 119 | 139 |
Response status,b,c n (%) | |||
Disease progression | 16 (39) | 29 (24) | — |
Censored | 25 (61) | 90 (76) | 93 (67) |
Median (95% CI),d,e months | 32.0 (14.8 to NE) | NE (27.6 to NE) | 34.5 (27.6 to 54.7) |
Range, months | 1.6f to 50.6f | 0.0f to 50.6f | 1.6 to 58.5 |
Duration of response, n (%) | |||
6 months or less | 9 (22) | 39 (33) | — |
6 to 12 months | 6 (15) | 31 (26) | — |
> 12 to 18 months | 4 (10) | 156 (13) | — |
> 18 to 24 months | 2 (5) | 13 (11) | — |
> 24 months | 20 (49) | 21 (18) | — |
CI = confidence interval; CR = complete response; DOR = duration of response; ePAS4 = extended primary analysis set 4; ePAS5 = extended primary analysis set 5; IRC = independent review committee; NE = not estimable; PAS = primary analysis set; PR = partial response.
aBased on IRC assessment.
bBest overall response classification based on radiologist and clinician assessments.
cStatus as of the patient's last disease assessment on or before visit cut-off.
dEstimate based on Kaplan-Meier method.
e95% CI was calculated using the Greenwood formula.
fCensored observation.
Source: Note to clinical reviewer (2020) and updated ePAS5 data.22
Figure 6: Kaplan-Meier Plot of DOR Based on IRC Assessment in ePAS4 (Subset of Patients With Confirmed Response; n = 119; Database Cut-Off: July 15, 2019)
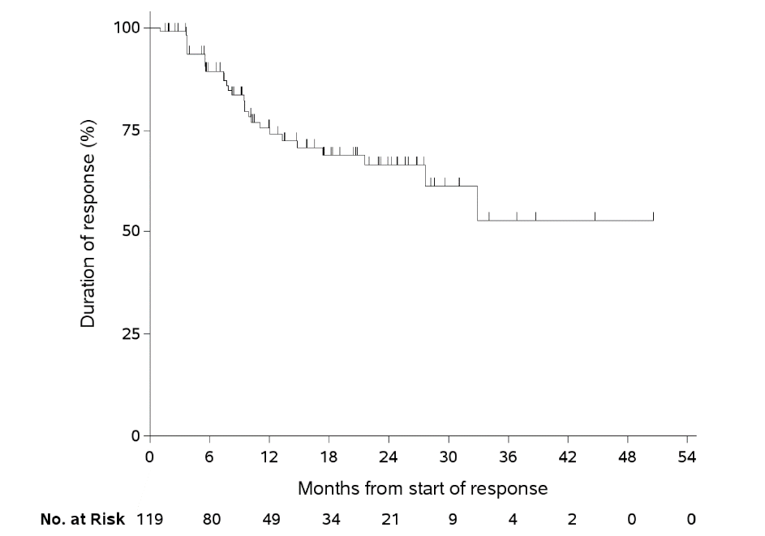
DOR = duration of response; ePAS4 = extended primary analysis set 4; IRC = independent review committee; No. = number.
Source: Note to clinical reviewer (2020).22
SAS3
At the time of the data cut-off, the median DOR had not been reached (95% CI, 3.8 months to NE), with a median duration of follow-up of 5.3 months (IQR = 3.6 to 10.1 months) (Figure 5).22
Progression-Free Survival
ePAS4 and ePAS5
As of the data cut-off date for ePAS4 (July 15, 2019), after a median follow-up of 14.0 months (IQR = 7.9 months to 26.6 months), the median PFS per IRC assessment was 33.4 months (95% CI, 19.3 months to NE) (Table 25, Figure 7).22 The percentage of patients with progressive disease was 34%; however, 60% were alive without documented disease progression, 3% had a surgical resection of their tumour without CR, and no evaluable post-baseline disease assessment was available for 3%. At 2 years or more, 58% (95% CI, 48% to 67%) of all patients remained progression-free. As of the data cut-off for ePAS5 (July 2020), after a median follow-up of 22.1 months (IQR = data not available), the median PFS per IRC assessment was 33.4 months (95% CI, 22.5 to 43.5), with 12- and 24-month PFS rates of 67% and 57%, respectively (Figure 7).
The PAS patient dataset (n = 55) was also evaluated for PFS as of the July 15, 2019, data cut-off (Table 25).22 After a median follow-up of 30.3 months, the median PFS was 29.4 months (95% CI, 10.9 months to NE). At 2 years or more, 52% (95% CI, 38% to 66%) of all patients remained progression-free. In the original submission, the median PFS as of the July 30, 2018, data cut-off date (integrated dataset) was 28.3 months (95% CI, 9.9 to NE) (Appendix 3).
Table 25: IRC-Assessed PFS in the PAS, ePAS4, and ePAS5 From Larotrectinib Trials (LOXO-TRK 14001, LOXO-TRK-15003, and LOXO-TRK-15002)
PFS | PAS N = 55 | ePAS4 N = 164 | ePAS5 N = 192 |
|---|---|---|---|
Progression status,a,b,c n (%) | |||
Progressed | 27 (49) | 55 (34) | — |
Censored | 28 (51) | 109 (66) | — |
Reason progressed, n (%) | |||
Died without disease progression beforehand | 3 (5) | 10 (6) | — |
Progressed | 24 (44) | 45 (27) | — |
Reason censored, n (%) | — | ||
Alive without documented disease progression | 25 (45) | 99 (60) | — |
Surgical resection of tumour without pathological CR | 2 (4) | 5 (3) | — |
No evaluable post-baseline disease assessments | 1 (2) | 5 (3) | — |
Duration of follow-up (months), median (IQR) | 30.3 (27.7 to 38.6) | 14 (7.9 to 26.6) | 22.1 (NR) |
Duration of PFS, months | |||
Median (95% CI)d,e | 29.4 (10.9 to NE) | 33.4 (19.3 to NE) | 33.4 (22.5 to 43.5) |
Range | 0.03f to 51.6f | 0.03f to 51.6f | 0.03f to 60.4f |
Duration of PFS, n (%) | |||
6 months or less | 17 (31) | 51 (31) | — |
6 to 12 months | 9 (16) | 48 (29) | — |
> 12 to 18 months | 4 (7) | 20 (12) | — |
> 18 to 24 months | 1 (2) | 17 (10) | — |
> 24 months | 24 (44) | 21 (18) | — |
Rate of PFS, % (95% CI) | |||
6 months or more | 77 (65 to 88) | 82 (76 to 88) | — |
12 months or more | 60 (47 to 74) | 66 (58 to 74) | — |
18 months or more | 54 (40 to 68) | 61 (52 to 70) | — |
24 months or more | 52 (38 to 66) | 58 (48 to 67) | — |
CI = confidence interval; CR = complete response; ePAS4 = extended primary analysis set 4; ePAS5 = extended primary analysis set 5; IRC = independent review committee; PAS = primary analysis set; PFS = progression-free survival.
aBased on IRC assessment.
bPFS classification based on radiologist and clinician assessments.
cStatus as of the patient's last disease assessment on or before visit cut-off.
dEstimate based on Kaplan-Meier method.
e95% CI was calculated using the Greenwood formula.
fCensored observation.
Source: Note to clinical reviewer (2020) and updated ePAS5 data.22
Figure 7: Kaplan-Meier Plot of PFS Based on IRC Assessment in ePAS4 (n = 164; Database Cut-Off: July 15, 2019)
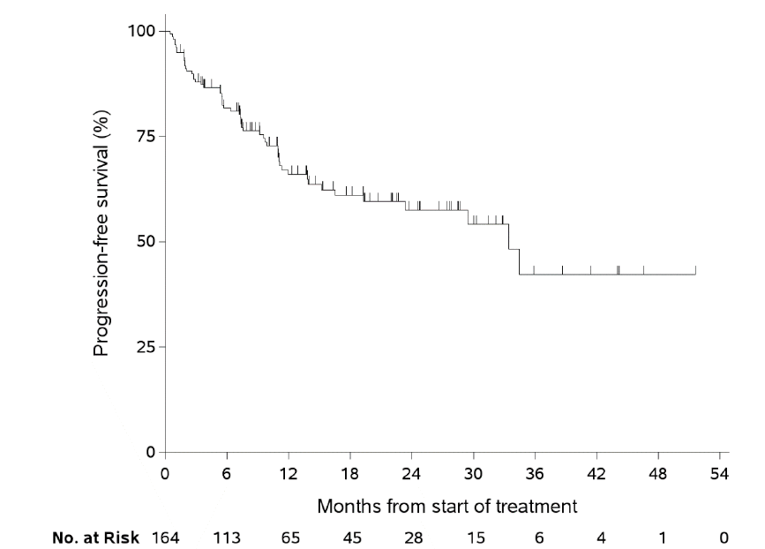
ePAS4 = extended primary analysis set 4; IRC = independent review committee; No. = number; PFS = progression-free survival.
Source: Note to clinical reviewer (2020).22
Figure 8: Kaplan-Meier Plot of PFS Based on IRC Assessment in ePAS5 (n = 192; Database Cut-Off July 2020)
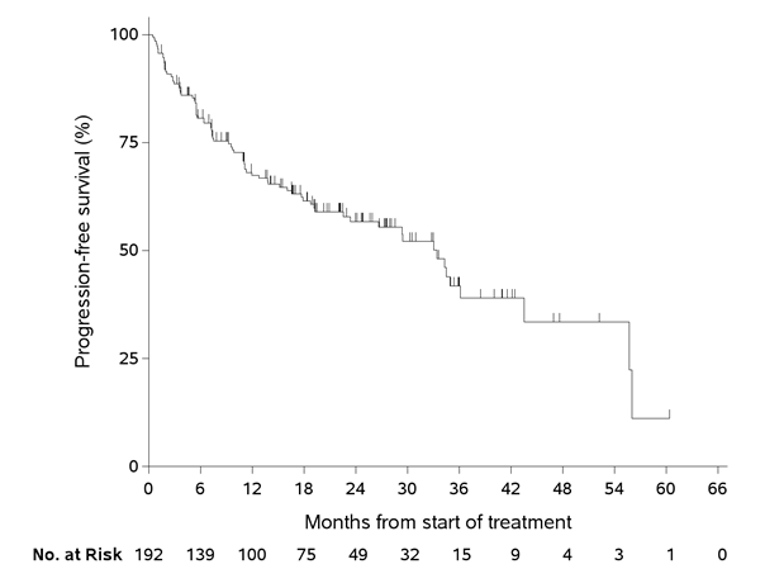
ePAS5 = extended primary analysis set 5; IRC = independent review committee; No. = number; PFS = progression-free survival;
Source: Updated ePAS5 data.22
SAS3
At the time of the data cut-off, 58% of patients had not progressed, and the median PFS was 11.0 months (95% CI, 5.4 to NE), with a median duration of follow-up of 5.6 months (IQR = 3.6 to 13.1) (Figure 9).22 With the new data cut-off of July 2020 (n = 33,), the median PFS was 18.3 months (95% CI, 6.7 to NE) after a median follow-up of 16.5 months; the PFS rates at 12 and 24 months were 56% and 42%. respectively (data not presented).
Figure 9: Kaplan-Meier Plot of PFS Based on Investigator Assessment in SAS3 (n = 164; Database Cut-Off: July 15, 2019)
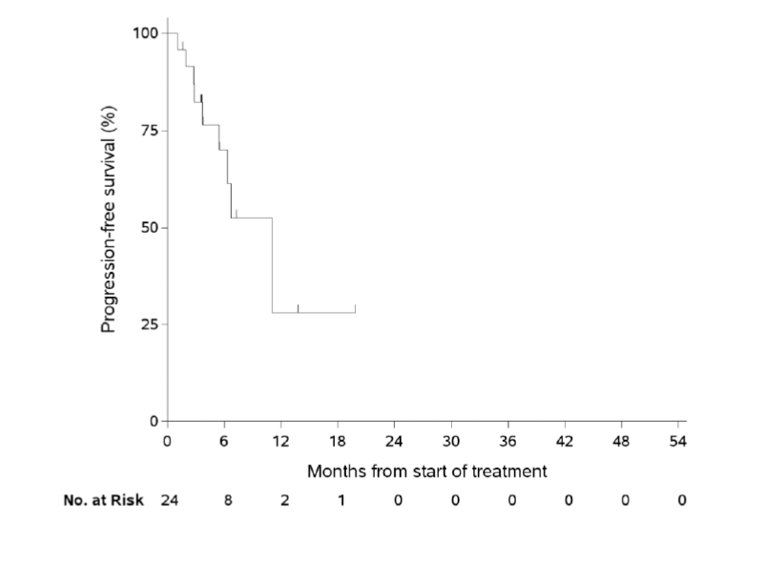
No. = number; PFS = progression-free survival; SAS3 = supplementary analysis set 3.
Note: Tick marks represent censored patients.
Source: Note to clinical reviewer (2020).22
Overall Survival
ePAS4 and ePAS5
As of the data cut-off date for ePAS4 (July 15, 2019), after a median follow-up of 15.8 months (IQR = 9.3 months to 28.8 months), the median OS was NE (95% CI, 44.4 months to NE) and 85% of patients were alive (Table 26, Figure 10).22 At 2 and 2 years of follow-up, the probability of survival was 90% and 82%, respectively. As of the data cut-off for ePAS5 (July 2020), after a median follow-up of 24.0 months (IQR = data not available), the median OS per IRC assessment was NE (95% CI, NE to NE), with 12- and 24-month OS rates of 89% and 82%, respectively (Figure 11).
The PAS (n = 55) was also evaluated for OS as of the July 15, 2019, data cut-off (Table 26).22 After a median follow-up of 32.5 months, the median OS was NE (95% CI, 44.4 months to NE). At 12 months or more, 90% of patients were alive, and at 24 months or more, 82% of patients were alive. The OS results were not available from the integrated analysis (original submission); However, in the analysis of the ePAS (February 19, 2018, data cut-off), which was used for the Health Canada submission, the median OS had not been reached after a median follow-up of 14.8 months (Appendix 3).
Table 26: IRC-Assessed OS in the PAS, ePAS4, and ePAS5 From Larotrectinib Trials (LOXO-TRK 14001, LOXO-TRK-15003, and LOXO-TRK-15002)
Overall survival | PAS N = 55 | ePAS4 N = 164 | ePAS5 N = 192 |
|---|---|---|---|
Status,a n (%) | |||
Dead | 13 (24) | 25 (15) | — |
Alive | 42 (76) | 139 (85) | — |
Duration of follow-up,b months | |||
Median | 32.5 | 15.8 | 24.0 |
Interquartile range | 28.8 to 38.6 | 9.3 to 28.8 | —- |
Duration of overall survival, months | |||
Median (95% CI)b,c | NE (44.4 to NE) | NE (44.4 to NE) | NE (NE to NE) |
Range | 1.0d to 51.6d | 0.5d to 51.6d | 0.5 to 62.0 |
Rate of overall survival, % (95% CI) | |||
6 months or more | 90 (83 to 98) | 94 (90 to 97) | — |
12 months or more | 90 (83 to 98) | 90 (85 to 95) | — |
18 months or more | 82 (71 to 93) | 84 (77 to 91) | — |
24 months or more | 82 (71 to 93) | 82 (75 to 90) | — |
CI = confidence interval; ePAS4 = extended primary analysis set 4; ePAS5 = extended primary analysis set 5; IRC = independent review committee; NE = not estimable; OS = overall survival; PAS = primary analysis set.
aStatus as of the patient's last disease assessment on or before visit cut-off.
bEstimate based on Kaplan-Meier method.
c95% CI was calculated using the Greenwood formula.
dCensored observation.
Source: Note to clinical reviewer (2020) and updated ePAS5 data.22
Figure 10: Kaplan-Meier Plot of Overall Survival Based on the ePAS4 (n = 164; Database Cut-Off: July 15, 2019)
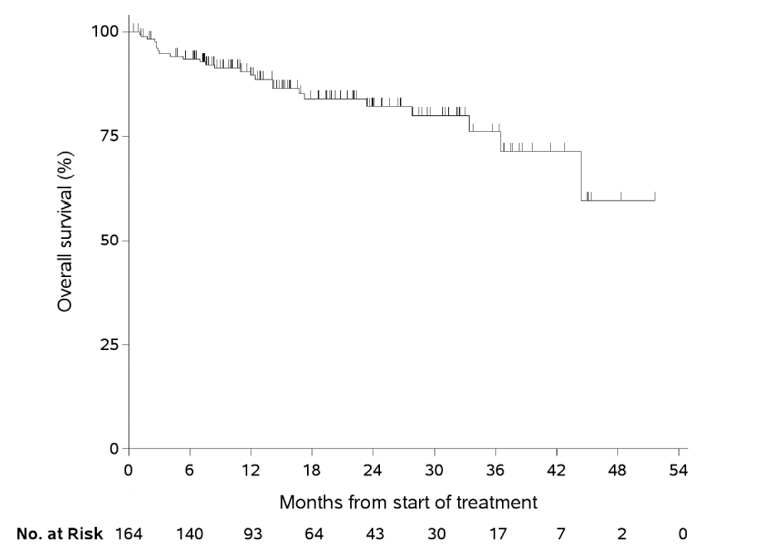
ePAS4 = extended primary analysis set 4; No. = number.
Source: Note to clinical reviewer (2020).22
Figure 11: Kaplan-Meier Plot of Overall Survival Based in ePAS5 (n = 192; Database Cut-Off: July 2020)
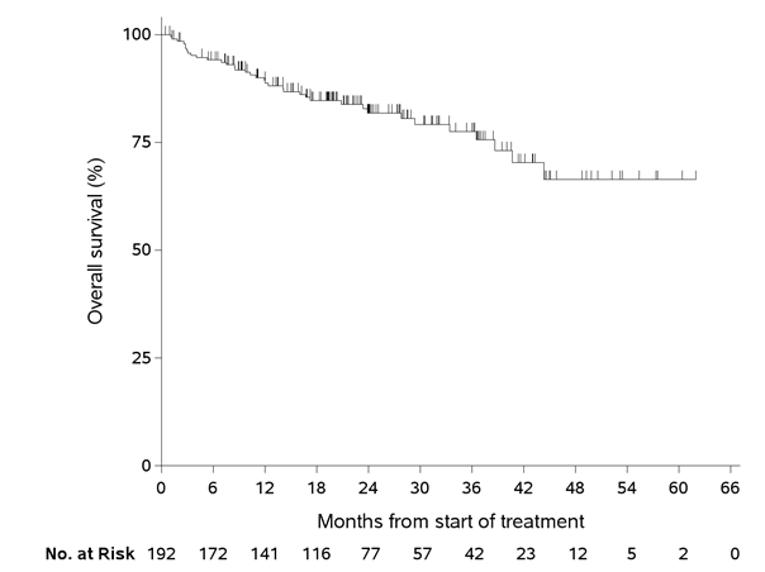
ePAS5 = extended primary analysis set 5; No. = number.
Source: Updated ePAS5 data.27
SAS3
At the time of the data cut-off, 96% of patients were still alive and the median OS was NE (95% CI, 9.4 months to NE), with a median follow-up duration of 6 months (Figure 12).22 The estimated 12-month OS rate was 88% (95% CI, 65 to 100%). With the new data cut-off of July 2020 (n = 33), the median OS was NE (95% CI, 16.9 to NE) after a median follow-up of 16.5 months; the OS rates at 12 and 24 months were 85% and 58%, respectively (data not presented).
Figure 12: Kaplan-Meier Plot of Overall Survival Based on Investigator Assessment in SAS3 (Database Cut-Off: July 15, 2019)
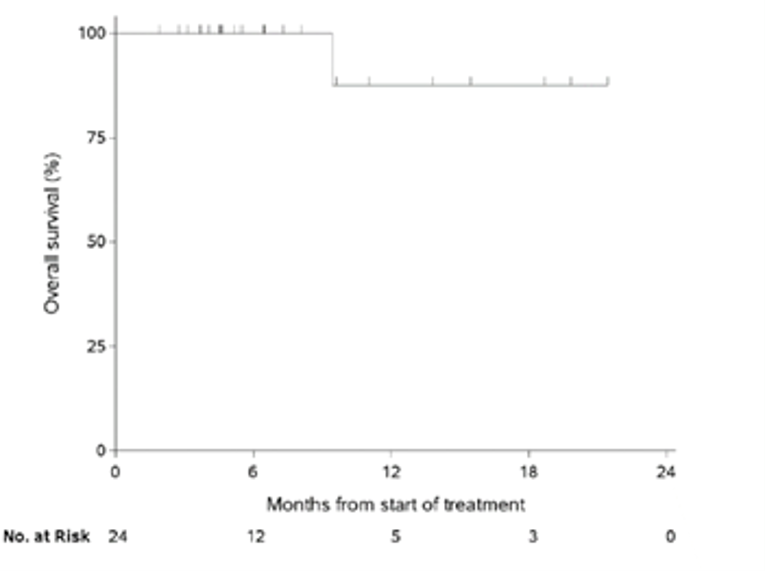
No. = number; SAS3 = supplementary analysis set 3.
Source: Note to clinical reviewer (2020).22
Health-Related Quality of Life
As previously described in the Analysis Populations section, the HRQoL analyses dataset (July 15, 2019, data cut-off) included patients with non-CNS primary solid tumours, NTRK gene fusion, and measurable disease from the LOXO-TRK-15003 and LOXO-TRK-15002 trials.60 Analyses of HRQoL outcomes were not pre-specified in the sponsor-submitted statistical analysis plan for the pooled analyses, and it was not clear which analyses or subgroups were pre-specified (if any); however, analyses were performed and presented as part of conference preceedings.59,60 The analysis included 126 patients who had received larotrectinib and completed a baseline and at least 1 post-baseline questionnaire (74 adults, 24 children ≥ 2 years old, and 28 infants < 2 years old). As of the data cut-off, 126 patients were included in the analyses as they had received larotrectinib and completed questionnaires at baseline and at least 1 post-baseline follow-up visit (74 adult patients for EORTC QLQ-C30, 24 patients ≥ 2 years of age completed by the patient or their parent/caregiver for PedsQL and 28 infants < 2 years of age completed by their parent/caregiver for PedsQL).
The numbers and proportions of patients with above norm/norm and Below Norm HRQoL scores for the EORTC QLQC-30 GHS and PedsQL total score at baseline and at best response are displayed in Table 27.60 Of the 52 adult patients with an EORTC QLQ-C30 GHS at norm/above norm at baseline, 98% remained in this category at the best response, and of the 22 patients at below norm at baseline, 9% remained in this category and 91% improved to norm/above norm. The GHS is rated on a 7-point Likert-type scale, which is then converted to a standardized score ranging from 0 to 100, with higher scores representing better QoL.67 The mean EORTC QLQ-C30 GHS for the US general population (63.9)24 minus 10 points (the MID) was used to construct the norm/above norm (≥ 53.9) and below norm (< 53.9) score categories for adults.25 Of the 9 pediatric patients 2 years of age or older with a PedsQL total score at norm/above norm at baseline, 100% remained in this category at the best response, and of the 15 patients at below norm at baseline, 33% remained in this category and 67% improved to norm/above norm. The PedsQL total score is the sum of all 23 items over the number of items answered on all the component scales; higher scores indicate better HRQoL.69 The average score for the combined self and proxy-reported PedsQL questionnaire for healthy US children (85.0)26 minus 4.5 points (the MID) was used to construct the norm/above norm (≥ 80.5) and below norm (< 80.5) score categories for children 2 years of age and older. The sponsor identified that the MID for the PedsQL total score for children younger than 2 years of age was 7.2 points.
Table 27: Adults and Children With Norm/Above Norm and Below Norm HRQoL Scores at Baseline and on Treatment — HRQoL Analysis Set
HRQoL scores | Baseline | Best response | ||
|---|---|---|---|---|
Patients in category at baseline, n (%) | Category remained the same, n (%) | Category improved, n (%) | Category worsened, n (%) | |
EORTC QLQ-C30 GHS (n = 74) | ||||
Norm/above norm | 52 (70) | 51 (98) | NA | 1 (2) |
Below norm | 22 (30) | 2 (9) | 20 (91) | NA |
PedsQL total score for children ≥ 2 years of age (n = 24) | ||||
Norm/above norm | 9 (38) | 9 (100) | NA | 0 |
Below norm | 15 (63) | 5 (33) | 10 (67) | NA |
EORTC QLQ-C30 GHS = European Organisation for Research and Treatment of Cancer Quality of Life Questionnaire Core 30 global health score; HRQoL = health-related quality of life; PedsQL = Pediatric Quality of Life Inventory.
Source: Note to clinical reviewer (2020).22
The analysis results for the best change from baseline in HRQoL scores is summarized in Table 28. The majority of adult patients (59%), children 2 years of age and older (79%), and children younger than 2 years of age (57%) had improvements in the best post-baseline score at or above the sponsor-identified (and literature-supported) MID. Of the patients evaluable for a sustained improvement (i.e., with a baseline and at least 2 post-baseline assessments; magnitude not defined), the improvement was sustained for at least 2 consecutive cycles for 47% of adult patients, 75% of children 2 years of age and older, and 43% of children younger than 2 years of age, and the improvement was sustained until the end of assessments in 30% to 50%, and 29%, respectively.
Table 28: Best Change From Baseline in HRQoL Scores — HRQoL Analysis Set
Change from baseline | EORTC QLQ-C30 GHS | PedsQL total score (children ≥ 2 years of age) | PedsQL total score (children < 2 years of age) |
|---|---|---|---|
Patients with baseline and ≥ 1 post-baseline assessment, n | 74 | 24 | 28 |
Best change in total score from baseline, mean (SD) | 17.5 (20.0) | 20.7 (17.2) | 12.0 (13.8) |
Patients with best post-baseline score above baseline score,a n (%) | 51 (69) | 21 (88) | 23 (82) |
Patients with best post-baseline score at or above the sponsor-identified MIDb improvement, n (%) | 44 (59) | 19 (79) | 16 (57) |
Patients evaluable for a sustained improvement,a,c n | 64 | 24 | 28 |
Patients with sustained improvements lasting ≥ 2 consecutive cycles, n (%) | 30 (47) | 18 (75) | 12 (43) |
Patients with sustained improvements lasting until the end of assessments, n (%) | 19 (30) | 12 (50) | 8 (29) |
EORTC QLQ-C30 GHS = European Organisation for Research and Treatment of Cancer Quality of Life Questionnaire Core 30 global health score; HRQoL = health-related quality of life; MID = minimally important difference; PedsQL = Pediatric Quality of Life Inventory; SD = standard deviation.
aMinimum magnitude of change not defined.
bEORTC QLQ-C30 GHS sponsor-identified MID = 10 points; PedsQL total score for children 2 years of age and older sponsor-identified MID = 4.5 points; PedsQL total score for children younger than 2 years of age sponsor-identified MID = 7.2 points.
cWith a baseline and at least 2 post-baseline assessments.
Source: Note to clinical reviewer (2020).22
EORTC QLQ-C30 Results
The best changes from baseline (magnitude not defined) in EORTC QLQ-C30 GHS are summarized in Table 28.60 The mean of best changes in total score from baseline was 17.5 (SD = 20.0) points. Of the 74 adult patients who completed an EORTC QLQ-C30 questionnaire, 69% had an improvement from baseline scores, with 59% reporting a best post-baseline score that reached or exceeded the sponsor-identified MID of 10 points. Among patients evaluable for a sustained improvement (i.e., those with a baseline and at least 2 post-baseline assessments), 47% had a sponsor-identified improvement in an EORTC QLQ-C30 GHS score that lasted for at least 2 consecutive cycles and 30% had a sponsor-identified improvement that was sustained until the end of assessments. Sustained improvements (magnitude not defined) occurred by 2 months of treatment in 69% of adult patients, and the median duration of sustained improvement was 12.0 months (range = 1.7 to 20.3 months).
PedsQL Total Score Results
The best changes from baseline in PedsQL total score are summarized in Table 28.60 The mean of best changes in total score from baseline was 20.7 points (SD = 17.2) in patients 2 years of age or older and 12.0 points (SD = 13.8) in patients younger than 2 years of age. Of the 24 patients 2 years of age or older and the 28 patients younger than 2 years of age who completed PedsQL questionnaires, 88% and 82%, respectively, had an improvement from baseline scores, with 79% and 57%, respectively, reporting a best post-baseline score that reached or exceeded the sponsor-identified (and literature-supported) MID of 4.5 points. Among patients evaluable for a sustained improvement (i.e., with a baseline and at least 2 post-baseline assessments; magnitude not defined), 75% and 43%, respectively, had an improvement in PedsQL total score that lasted for at least 2 consecutive cycles, and 50% and 29%, respectively, had an improvement that was sustained until the end of assessments. Sustained improvements occurred by 2 months of treatment in 75% of patients 2 years of age and older and in 61% of patients younger than 2 years of age, and the median durations of sustained improvement were NE (range = 1.1 to 20.3 months) and NE (range = 0.9 to 16.7 months), respectively.
Harms
A summary of reported AEs in the TRK fusion cancer labelled-dose safety set and the overall labelled-dose safety set (descriptions provided in the Analysis Populations section) as of the July 15, 2019, data cut-off is presented in Table 29.22 Most AEs occurring in either safety set were grade 1 or 2.
In the TRK fusion cancer labelled-dose safety set (n = 196), the most common AEs (regardless of grade) were increased ALT (32%), cough (31%), fatigue (30%), constipation (29%), diarrhea (28%), increased AST (27%), dizziness (26%), pyrexia (24%), anemia (23%), vomiting (23%), and nausea (22%).22 Grade 3 or 4 AEs occurred in 96 patients (49%); however, grade 3 or 4 AEs related to treatment occurred in only 27 patients (14%). The most common grade 3 or 4 AEs were anemia (8%), decreased neutrophil count (8%), and decreased lymphocyte count (5%). Larotrectinib treatment was interrupted or the dosage was modified in 79 patients (40%); however, only 37 patients (19%) had a treatment interruption or modification attributable to treatment. Permanent discontinuation of larotrectinib for TEAEs, regardless of attribution, occurred in 5% of patients receiving the recommended dose. Results were consistent in the newly submitted overall NTRK fusion cancers safety set (N = 260).
In the overall labelled-dose safety set (n = 238), the most common AEs (regardless of grade) were fatigue (31%), cough (29%), increased ALT (29%), constipation (26%), diarrhea (26%), dizziness (26%), increased AST (25%), anemia (24%), nausea (24%), vomiting (24%), and pyrexia (24%).22 Grade 3 or 4 AEs occurred in 120 patients (50%); however, grade 3 or 4 AEs related to treatment occurred in only 35 patients (15%). The most common grade 3 or 4 AEs were anemia (9%), decreased neutrophil count (7%), and decreased lymphocyte count (5%). Larotrectinib treatment was interrupted or the dosage was modified in 97 patients (41%); however, only 49 patients (21%) had a treatment interruption or modification attributable to treatment. Permanent discontinuation of larotrectinib for (TEAEs), regardless of attribution, occurred in 8% of patients. Results were consistent in the newly submitted overall safety set (N = 331).
Table 29: Summary of AEs in the TRK Fusion Cancer Labelled-Dose Safety Set, Overall NTRK Fusion Cancers Safety Set, Overall Labelled-Dose Safety Set, and Overall Safety Set
Adverse event, n (%) | TRK fusion cancer labelled-dose safety seta (N = 196) | Overall NTRK fusion cancers safety set (N = 260) | Overall labelled-dose safety setb (N = 238) | Overall safety set (N = 331) | ||||
|---|---|---|---|---|---|---|---|---|
Grade 3 | Grade 4 | Total | Grade 3 or 4 | Grade 3 | Grade 4 | Total | Grade 3 or 4 | |
Increase ALT | 4 (2) | 2 (1) | 63 (32) | 8 (3) | 6 (3) | 2 (1) | 68 (29) | 10 (3) |
Cough | 1 (1) | 0 | 60 (31) | — | 1 (< 1) | 0 | 69 (29) | — |
Fatigue | 2 (1) | 0 | 58 (30) | 0 (0) | 5 (2) | 0 | 74 (31) | 1 (0) |
Constipation | 0 | 0 | 56 (29) | — | 0 | 0 | 63 (26) | — |
Diarrhea | 3 (2) | 0 | 54 (28) | — | 4 (2) | 0 | 62 (26) | — |
Increased AST | 2 (1) | 1 (1) | 52 (27) | 4 (2) | 3 (1) | 0 | 60 (25) | 4 (1) |
Dizziness | 2 (1) | 0 | 50 (26) | 1 (0) | 3 (1) | 0 | 62 (26) | 1 (0) |
Pyrexia | 4 (2) | 0 | 48 (24) | — | 4 (2) | 0 | 56 (24) | — |
Vomiting | 1 (1) | 0 | 46 (23) | — | 2 (1) | 0 | 57 (24) | — |
Anemia | 15 (18) | 0 | 45 (23) | 2 (1) | 21 (9) | 0 | 58 (24) | 6 (2) |
Nausea | 1 (1) | 0 | 43 (22) | 1 (0) | 2 (1) | 0 | 57 (24) | 2 (1) |
Myalgia | 2 (1) | 0 | 35 (18) | 1 (0) | 3 (1) | 0 | 45 (19) | 2 (1) |
Headache | 1 (1) | 0 | 33 (17) | 1 (0) | 1 (< 1) | 0 | 37 (16) | 1 (0) |
Arthralgia | 1 (1) | 0 | 32 (16) | 1 (0) | 1 (< 1) | 0 | 41 (17) | 1 (0) |
Peripheral edema | 1 (1) | 0 | 31 (16) | — | 1 (< 1) | 0 | 38 (16) | — |
URTI | 0 | 0 | 31 (16) | — | 0 | 0 | 32 (13) | — |
Increase weight | 6 (3) | 0 | 30 (15) | 5 (2) | 6 (3) | 0 | 32 (13) | 6 (2) |
Decreased neutrophil count | 13 (7) | 2 (1) | 29 (15) | 16 (6) | 14 (6) | 2 (1) | 32 (13) | 16 (5) |
Pain in extremity | 1 (1) | 0 | 29 (15) | — | 1 (< 1) | 0 | 33 (14) | — |
Dyspnea | 4 (2) | 0 | 28 (14) | — | 6 (3) | 0 | 39 (16) | — |
Decreased lymphocyte count | 7 (4) | 2 (1) | 26 (13) | 2 (1) | 9 (4) | 2 (1) | 33 (14) | 3 (1) |
Decreased leukocyte count | 1 (1) | 0 | 25 (13) | — | 1 (< 1) | 0 | 26 (11) | — |
Abdominal pain | 3 (2) | 0 | 24 (12) | 1 (0) | 4 (2) | 0 | 30 (13) | 1 (0) |
Nasopharyngitis | 0 | 0 | 24 (12) | — | 0 | 0 | 26 (11) | — |
Back pain | 2 (1) | 0 | 23 (12) | — | 2 (1) | 0 | 30 (13) | — |
UTI | 4 (2) | 0 | 23 (12) | — | 4 (2) | 0 | 27 (11) | — |
Nasal congestion | 0 | 0 | 22 (11) | — | 0 | 0 | 23 (10) | — |
Dry skin | 0 | 0 | 19 (10) | — | 0 | 0 | 21 (9) | — |
ALT = alanine aminotransferase; AST = aspartate aminotransferase; NRTK = neurotrophic tyrosine receptor kinase; TRK = tropomyosin receptor kinase; URTI = upper respiratory tract infection; UTI = urinary tract infection.
aPatients with TRK fusion cancer who received at least 1 dose of larotrectinib at the labelled or recommended dose.
bPatients (with or without TRK fusion cancer) who received at least 1 dose of larotrectinib at the labelled or recommended dose.
Source: Note to clinical reviewer (2020)22 and updated ePAS5 data.27
Critical Appraisal
Internal Validity
Heterogeneity in Design Elements of Studies Included in the Pooled Analysis
Interpretation of pooled analysis results remains difficult in the presence of between-study heterogeneity due to several factors:
Different phased studies: Given the rare nature of NTRK fusion–positive solid tumours and methodological challenges, the sponsor rationalized that the conduct of a randomized trial was not feasible.72 The submitted data were therefore pooled from 3 single-arm trials: a phase I adult trial (LOXO-TRK 14001), a phase I/II pediatric trial (LOXO-TRK-15003 [SCOUT]), and a phase II basket trial (LOXO-TRK-15002 [NAVIGATE]) in adults and adolescents. The phase II part of the SCOUT trial, investigating long-term safety and efficacy of larotrectinib in pediatric patients, is ongoing and results are yet to be published. The objectives of the 3 included trials differed: LOXO-TRK-14001 – safety; SCOUT phase I – safety; SCOUT phase II – ORR; and NAVIGATE – ORR.
Different primary outcomes: The primary objective of the dose escalation phases of the LOXO-TRK 14001 and SCOUT studies was to determine the safety and tolerability of larotrectinib, while the primary objective of the NAVIGATE trial was to determine the efficacy of larotrectinib by measuring the best ORR.
Different requirements for outcome measurement: In the LOXO-TRK 14001 and SCOUT trials, the ORR was assessed by the investigator using RECIST 1.1 or RANO criteria, as appropriate to tumour type; whereas in the NAVIGATE trial, the ORR was determined by an independent radiology review committee using RECIST 1.1 or RANO criteria.
Different eligibility criteria: As mentioned earlier in this section, LOXO-TRK 14001 included adult patients, SCOUT included pediatric patients, and NAVIGATE enrolled adults and adolescent patients. Additionally, the LOXO-TRK-15002 trial included patients with an ECOG status of 3, while LOXO-TRK 14001 included patients with an ECOG status of 0 to 3, and SCOUT did not specify ECOG status as part of its inclusion criteria. In addition, the presence of confirmed NTRK fusion was mandated before enrolment in the NAVIGATE trial, while an NTRK-positive status was not a requirement for eligibility in the LOXO-TRK 14001 and SCOUT trials. Fusions of TRK genes were identified prospectively in the 2 latter trials. These sources of heterogeneity in the patient selection criteria may introduce bias to the results of the pooled analysis.
Given the heterogeneities across studies, findings from the pooled analysis are associated with methodological limitations, even though there may be a rationale (rarity of NTRK fusion–positive cancer) for pooling data. The sponsor submitted 3 additional analyses to address concerns about the inherent heterogeneity of the baskets, described in the Other Relevant Evidence section, which should be consulted in this regard.
Uncertainty Around the Pooled Analysis Results
The following limitations should be considered when interpreting the pooled analysis results:
The pooled analyses were performed as post hoc decisions for the included trials. While a statistical analysis plan was provided for the pooled analyses, the trials contributing to the pooled sets were not designed to provide statistical power for the post hoc pooled analyses. As previously stated, the objectives of the 3 included trials differed: LOXO-TRK-14001– safety; SCOUT phase I – safety; SCOUT phase II – ORR; and NAVIGATE – ORR. As a result, not all the trials that contributed to the pooled datasets were designed to investigate efficacy (i.e., ORR) as the primary objective of the trial. It is also unclear if the pooled analysis has sufficient power to detect a clinically meaningful effect for the primary and secondary outcomes. Nonetheless, a small proportion of the total patients in ePAS4 were obtained from phase I portions of Study 14001 and NAVIGATE (29 of 164 patients or 17.7%); the majority (135 patients) came from the phase II studies. The sponsor provided a separate sensitivity analysis showing that the inclusion or exclusion of phase I study data did not meaningfully affect the ORR. The ORR was 73% (95% CI, 65 to 79%) including phase I data, and 70% (95% CI, 61 to 77%) excluding phase I data.
The estimates of response outcomes were pooled. Due to the small sample size, there is uncertainty regarding the magnitude of the treatment effect of larotrectinib in any 1 histologic subtype of solid tumours with an activating NTRK rearrangement. The clinical experts consulted for this review agreed that the pooled ORR estimate for treatment effect may be generalizable to all of the subgroups. However, the pooled treatment effect varied widely across tumour types. The reported point estimates for the ORR across tumour types ranged from 100% in GIST, CMN, and cancers of unknown primary origin down to 0% in appendix, pancreas, hepatic, and prostate cancers, and cholangiocarcinoma. Additionally, unbalanced and small sample sizes for each tumour type resulted in significant uncertainty in the subgroup results by tumour type, which was reflected in the wide confidence intervals around the point estimates. Further, because these subgroups were descriptive in nature, any interpretation would be inconclusive for comparative purposes. In the aforementioned subgroup analysis, 1 patient was enrolled in each of the cancers of unknown primary origin, CMN, appendix, hepatic, and prostate tumour subgroups.
Pooling data on survival outcomes (i.e., PFS and OS) can be even more problematic if there is variability in the PFS or OS across tumour types. This is because traditional survival analysis methods such as Kaplan-Meier curves rely on the assumption that a single survival distribution can be used to estimate the survival of all study participants.
The efficacy analyses for SAS3 used investigator-assessed outcomes, which is particularly problematic given the small sample sizes in this dataset and the open-label design of the trial.
All 3 larotrectinib trials are ongoing. The LOXO-TRK-14001 trial stopped enrolment in 2017; however, SCOUT and NAVIGATE are still enrolling patients. The results of the pooled analysis are therefore subject to change as more data become available.
The HRQoL analyses were not pre-specified as part of the sponsor-provided statistical analysis plan, limiting the ability to interpret the results including what decisions were made post hoc.
It was not clear whether the subgroup analyses provided in the results were pre-specified or if the subgroups were determined after the analyses were run.
The analyses considered the patient’s HRQoL results at their best response, not at their last reported response. The differences between the 2 could be significant; for example, patients may respond well at a given time point or study visit, but the benefits may not continue in subsequent visits or at their last reported response. Without any information on when the best change was determined, it is unclear if the best change was, in fact, a transient improvement in HRQoL.
The analyses using norm/above norm and below norm categories had several limitations. First, norm/above norm could be almost 10 points lower than the population normal to begin with. And patients could experience a clinically relevant decline in HRQoL as long as they did not fall below the norm. Second, patients who were close to the threshold (a score of 53.9) only required a small change to move above or below the norm, even though that would not be considered clinically relevant as the estimated MID was 10 points. Although a sensitivity analysis conducted using a higher threshold (58.9 for adults and 82.75 for children) showed similar results, the aforementioned limitations still remained.
Last, the HRQoL results were presented descriptively, not analyzed statistically, which limits the interpretability of the results.
External Validity
Potential limitations to the external validity of the pooled analysis include:
The larotrectinib trials included patients with NTRK-positive solid tumours regardless of their tumour type. However, not all solid tumour types were represented in the studies.
The pooled analysis excluded patients with primary CNS tumours; however, these patients were included in another dataset.
The eligibility criteria for the 3 larotrectinib trials did not restrict the number of previous lines of systematic therapy.
Table 30: Assessment of Generalizability of Evidence for Larotrectinib
Domain | Factor | Evidence | CADTH assessment of generalizability |
|---|---|---|---|
Population | Histological tumour type | The larotrectinib trials included patients with NTRK-positive solid tumours regardless of their tumour type. The following tumour types were recorded in the study:
| Although some variation was observed in response rates within the subgroup analysis by tumour type, from a histology-agnostic, biomarker-driven perspective, the overall pooled analysis results are generalizable to all patients in the pooled analysis. Nonetheless, some of these tumour types were under-represented in the study population, resulting in wide confidence intervals, reducing confidence in their generalizability. |
Co-mutations | The larotrectinib trials included in the submitted pooled analysis focused on the presence of documented NTRK gene fusions (determined by local testing). | The results are generalizable to cancers with NTRK1, NTRK2, and NTRK3 gene fusions. | |
Line of therapy | The eligibility criteria for the 3 larotrectinib trials did not restrict the number of previous lines of systematic therapy. In ePAS4 (n = 164), there were 36 patients (22%) who received no previous lines of therapy; 84 patients (51%) received 1 to 2 previous lines of therapy, and 44 patients (27%) received 3 or more lines of therapy. | There is no clinical rationale to suggest that the trial results would not be applicable to Canadian practice. | |
Population | Primary CNS tumours | The pooled analysis excluded patients with primary CNS tumours. However, a separate analysis was conducted to evaluate the efficacy of larotrectinib in 24 patients with CNS tumours (SAS3 dataset) who had been enrolled in the included larotrectinib trials. In patients with primary CNS tumours, the ORR was 21% (95% CI, 7% to 42%), compared with 73% (95% CI, 65% to 79%%) in the pooled analysis (ePAS4). | Yes, in the opinion of the CADTH methods team, the study results are applicable to NTRK-positive patients with primary CNS tumours. |
Performance status | The inclusion criteria across the 3 pooled trials required that patients have:
| The trial results are generalizable to patients with an ECOG PS of 0, 1, or 2 (and their respective performance status equivalence for the pediatric population). While larotrectinib is a tolerable therapy, there are insufficient data to support generalizability to patients with poorer performance status and the number of patients with an ECOG PS of 3 in the pooled analysis is too small to make conclusions about the generalizability. | |
Intervention | Dosing schedule | The pooled analysis of data from 3 larotrectinib trials used data from patients who received the recommended dose of:
| No other dosing schedules are used in Canada. |
Comparator | Post-progression larotrectinib therapy | A total of eligible 164 patients from the 3 aforementioned trials with NTRK gene fusions were included in ePAS4; of those, 84 patients (51.2%) had discontinued treatment as of the July 15, 2019, data cut-off. | There is insufficient evidence to support the continued use of larotrectinib beyond disease progression. In Canadian practice, patients would discontinue larotrectinib therapy after progression. |
Outcomes | Appropriateness of primary and secondary outcomes | The primary end point of the pooled analysis ORR was determined by an IRC. Key secondary end points included DOR, PFS and safety. Two of the larotrectinib trials included HRQoL as an exploratory outcome. | The primary and secondary outcomes were appropriate for a basket trial design. |
Setting | Countries participating in the trial |
| While there may be small differences in practice patterns, the clinical experts consulted for this review do not feel these differences would be sufficient to expect the results would not be generalizable to the Canadian patient population. |
BSA = body surface area; CI = confidence interval; CNS = central nervous system; DOR = duration of response; ECOC PS = Eastern Cooperative Oncology Group performance status; ePAS4 = extended primary analysis set 4; GIST = gastrointestinal stromal tumours; HRQoL = health-related quality of life; IRC = independent review committee; NTRK = neurotrophic tyrosine receptor kinase; ORR = overall response rate; PFS = progression-free survival.
Other Relevant Evidence
The sponsor included 3 additional analyses in this submission to address concerns about inherent heterogeneity across tumour type and patients. These include a BHM evaluating ORR across tumour types, a permutation analysis of ORR of all possible subsets across study and tumour type, and an intra-patient comparison of GMI.
Three main sources of heterogeneity are of concern: the heterogeneity of the effects and background prognosis by tumour location or type; the heterogeneity of effects and background prognosis by tumour histology; and the inherent heterogeneity of the effects of treatment between patients, which is uncontrolled given the lack of a control arm. Controlled and randomized trials stratified by histology and tumour location for an outcome of OS, rather than a surrogate such as ORR, could potentially reduce issues of heterogeneity of study participants across studies or prognosis by tumour histology or location. However, the rarity of NTRK fusion cancers makes such an approach difficult and it was not deemed possible for the sponsor’s subject patient population.
Three alternative analyses were submitted by the sponsor to addresses these sources of heterogeneity using the available data. The submitted analyses include the BHM73 and the permutation analysis,74 which attempt to quantify and account for the heterogeneity in ORR across tumour locations and studies, and possibly account for other differences in histology and the intra-person GMI analysis.75,76 This analysis attempts to mitigate for the lack of control — and therefore heterogeneity — between participants due to histology and location, as well as many other factors, by using individual times to progression under previous treatment to compare to their PFS under their later treatment with larotrectinib.
The populations for the 3 analyses were not the same across all subanalyses and are presented for each analysis separately.
The presentation of these analyses can be found in the note to clinical reviewer, section 5.10, pages 67 through 79.22
Bayesian Hierarchical Modelling
Populations and Methods
The primary analysis used ePAS4, which included 164 participants over the 3 clinical trials. The data used in the analysis are presented in Table 31. Two sensitivity analyses were performed on ePAS4, with the primary CNS added along with a subset of the data removing all tumour histology subgroups with 3 or fewer participants, and combining both breast tumour types into 1.
Table 31: Overall Response Rate Results (ePAS4)
Tumour type | Responder (Xj) | Number of patients (Nj) |
|---|---|---|
Soft tissue sarcoma | 29 | 36 |
Infantile fibrosarcoma | 31 | 32 |
Thyroid | 15 | 27 |
Salivary gland | 18 | 21 |
Lung | 10 | 13 |
Colon | 3 | 8 |
Melanoma | 3 | 7 |
Breast | ||
Non-secretory | 2 | 3 |
Secretory | 1 | 2 |
Gastrointestinal stromal tumour | 4 | 4 |
Bone sarcomaa | 1 | 2 |
Cholangiocarcinomaa | 0 | 2 |
Pancreasa | 0 | 2 |
Congenital mesoblastic nephromaa | 1 | 1 |
Unknown primary cancera | 1 | 1 |
Appendixa | 0 | 1 |
Hepatica | 0 | 1 |
Prostatea | 0 | 1 |
ePAS4 = extended primary analysis set 4.
Note: Responders are anyone classified as having either a complete response or partial response according to the Response Evaluation Criteria for Solid Tumours Version 1.1. A complete response is defined as no radiological evidence of disease, negative surgical margins, and no viable tumour cells. A partial response criteria is defined as a minimum decrease from baseline in the sum of target lesion diameters of at least 30%.
aRemoved groups.
Source: Note to clinical reviewer (2020).22
Interventions
Larotrectinib
Outcomes
ORR
Points of Statistical Analysis Critical for Bayesian Hierarchical Modelling
The outcome of the model was the number of responders out of the number of the total participants per tumour type, as presented in Table 31. Responders are anyone classified as having either a CR or PR according to RECIST 1.1. A CR is defined as no radiological evidence of disease, negative surgical margins, and no viable tumour cells. A PR is defined as a minimum decrease from baseline in the sum of target lesion diameters of at least 30%. This gives a single parameter, Pj, for each tumour type (j), which is then logit-transformed and assumed to come from a normal with mean (µ) and SD (σ). This is the assumed distribution of the transformed parameter logit (Pj), called the prior. Hyper-priors are placed on µ, again normal with a mean of −0.85, corresponding to 0.3 on the ORR scale, with a variance of 10 and a uniform value (0,5) for σ. These are based on priors suggested by Cunanan et al. (2019).77 The same analysis was also performed on a subset of ePAS4; all model specifications remain the same.
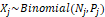
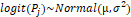

All reported estimates for parameters are medians taken over the samples from the posterior. The median of the posterior of  is referred to as the pooled estimate and is given on the ORR scale. This is the median of the posterior of µ, transformed, which is the centre of the logit distribution (Pj) and serves to shrink the tumour type Pj toward a common centre value. The measure of the heterogeneity of the logit (Pj) over the tumour types is given by σ, and this is reported in the results as the measure of heterogeneity across the tumour types. The reported estimates for this are medians. All credible intervals are 95% wide between the 2.5 percentile and the 97.5 percentile of the posterior samples. The reported posterior probabilities of exceeding a given ORR level are the proportion of the samples from the posterior that exceed the given ORR value. The results for each of the tumour types is the median for the specific Pj posterior sample. The posterior predictive distribution is simply the posterior distribution for µ because there are no fixed effects or other terms in the model. This gives predictions for a new tumour type that are considered exchangeable, coming from the same posterior distribution as the currently evaluable tumour types used to build the model.
Markov chain Monte Carlo sampling was used to generate draws from the posterior, the distribution generated by combining the prior and likelihood. A total of 55,000 iterations of 2-chains were run, using 5,000 burn-ins and a thinning of 2. Convergence was assessed via twice the binomial log-likelihood with zero responder correction. Exact zero values are not used in the log-likelihood, as this would cause it to fail, and the models are stated to have converged. The analysis also corrects for zero responders in the group by setting any exact zero number of responders or expected number of responders to 0.1, which is needed due to the logit transformation.
Results
Complete ePAS4 Data
The posterior median of σ, which is the measure of the heterogeneity of the logit (Pj), was 1.55 (95% credible interval, 0.70 to 3.35). The sponsor reported that this value demonstrates the heterogeneity of the data. The pooled P estimate, the median of the posterior of µ, transformed to be on the ORR scale (expit(μ)) is 0.624 (95% CI, 0.331 to 0.812). Table 2 from the submitted technical report73 is reproduced in Table 32, which includes the results from this model for each of the tumour types.
The posterior predictive ORR for a new tumour type based on this model is presented in Figure 13. The results suggest that a new tumour type with the same posterior distribution as the currently evaluable types would be predicted to have a 0.629 probability of having a 50% or higher ORR, and a 0.793 probability of having a 30% or higher ORR.
Sensitivity Analysis
Two sensitivity analysis were performed. One was performed on a combined dataset including patients from ePAS4 and patients from the primary CNS cancer dataset using the same BHM. The primary CNS tumours were treated as a single tumour type. The response rate for primary CNS tumours was estimated to be 23.0% (95% CI, 9.7 to 41.8). Estimated response rates per tumour type were reported to be similar to the main model in principle, with negligible corrections for tumour types with high observed response rates and differences of 4% to 5% for tumour types with low numbers of patients studied and no responses observed. The pooled mean response from the combined model was estimated to be 58.2% (95% CI, 30.9 to 78.5). An estimate of the heterogeneity is not provided for this analysis.
The second sensitivity analysis removed tumour types with only 1 or 2 patients studied. Therefore, an identical BHM as the main model was simulated, but the tumour types “bone sarcoma,” “cholangiocarcinoma,” “pancreas,” “CMN,” and “unknown primary cancer” were excluded. All breast cancer tumour types were combined into a single type for this analysis, resulting in a pooled estimate of ORR of 74.8% (95% CI, 51.2 to 89.7), and a reduced estimate of heterogeneity of 1.23.
Table 32: Bayesian Hierarchical Model Results for Each Tumour Type
Tumour type | Predicted response rate | 5% Prediction interval limit | 95% Prediction interval limit | Probability that response rate exceeds: | ||
|---|---|---|---|---|---|---|
50% | 30% | 10% | ||||
Soft tissue sarcoma | 79.8 | 65.5 | 90.4 | 100 | 100 | 100 |
Infantile fibrosarcoma | 94.2 | 82.4 | 99.1 | 100 | 100 | 100 |
Thyroid | 56.4 | 38.1 | 73.2 | 75 | 100 | 100 |
Salivary gland | 84.0 | 65.5 | 95.0 | 100 | 100 | 100 |
Lung | 75.7 | 51.1 | 92.1 | 98 | 100 | 100 |
Colon | 42.4 | 14.7 | 73.1 | 33 | 78 | 99 |
Melanoma | 47.4 | 17.2 | 78.2 | 44 | 85 | 100 |
Breast-non-secretory | 66.5 | 22.4 | 94.7 | 76 | 94 | 100 |
Breast-secretory | 57.2 | 11.0 | 92.7 | 61 | 85 | 98 |
Gastrointestinal stromal tumour | 87.2 | 50.8 | 99.5 | 98 | 100 | 100 |
Bone sarcoma | 57.0 | 10.8 | 92.9 | 60 | 84 | 98 |
Cholangiocarcinoma | 28.9 | 0.9 | 78.0 | 23 | 48 | 80 |
Pancreas | 28.8 | 0.9 | 77.9 | 23 | 48 | 80 |
Congenital mesoblastic nephroma | 76.3 | 19.8 | 99.2 | 82 | 94 | 99 |
Unknown primary cancer | 76.5 | 20.1 | 99.2 | 83 | 94 | 99 |
Appendix | 39.8 | 1.3 | 88.4 | 38 | 62 | 86 |
Hepatic | 39.7 | 1.4 | 88.8 | 38 | 62 | 86 |
Prostate | 39.6 | 1.3 | 88.2 | 38 | 62 | 86 |
Total | 62.4 | 33.1 | 81.2 | N/A | N/A | N/A |
Note: The report presents these are prediction intervals, but they are not based on the provided code; instead, they are standard 95% credible intervals (the 2.5 and 97.5 percentiles of the posterior draws for the given parameter).
Source: Sponsor-submitted Bayesian hierarchical model for overall response rate of Vitrakvi (larotrectinib) for NTRK fusion cancer.73
Figure 13: Predicted Density for Response Rate in a Newly Studied Tumour Type (ePAS4 BHM)
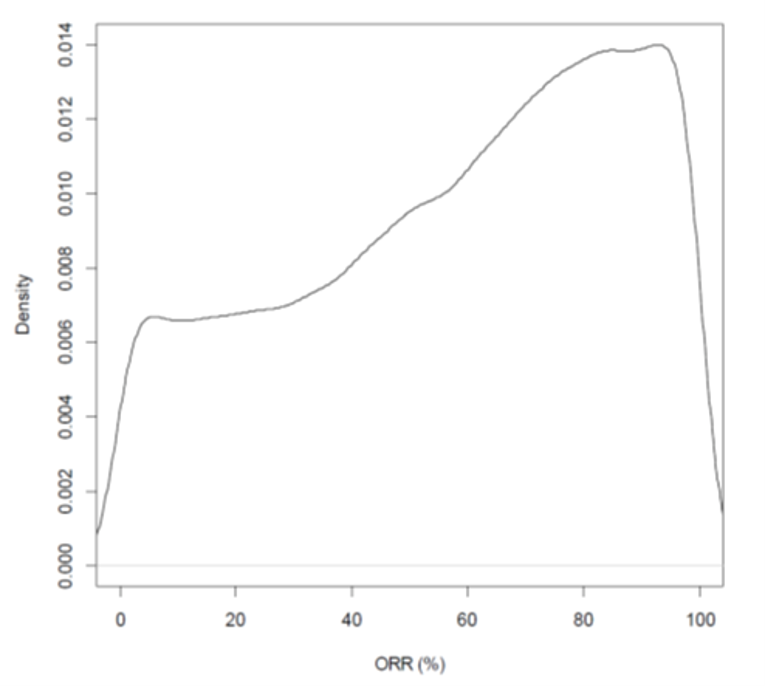
BHM = Bayesian hierarchical model; ePAS = extended primary analysis set 4; ORR = overall response rate.
Source: Sponsor-submitted Bayesian hierarchical model for ORR of Vitrakvi (larotrectinib) for NTRK fusion cancer.73
Critical Appraisal
The large variance for the hyper-prior on σ makes the hyper-prior relatively non-informative. Given these specifications of the likelihood and priors the posterior should be proper. The model appears to have converged. Adequate mixing was supported by R-hat.
The results provide evidence of heterogeneity in the ORR across tumour types. Further, the BHM analysis should not be interpreted as accounting for heterogeneity as it simply allows for non-identical effects and enforces (assumes) exchangeability. Instead, the BHM allows for an investigation of heterogeneity. This is specifically considered a weakness in the National Institute for Health and Care Excellence (NICE) report, “Modelling approaches for histology-independent cancer drugs to inform NICE appraisals.”78 As currently presented without further analysis, the results appear to provide evidence for heterogeneity and against a single and simple pooled analysis across all tumour types.
The sponsor appears to have misinterpreted the results as accounting for rather than investigating heterogeneity. This is most evident in the presentation of the results for a “new tumour type.” Although it is possible to interpret these results in the manner presented by the sponsor (as 62.9% of all new tumour types), this interpretation is inconsistent with interpretation used by NICE,79 which used the same analysis for extended primary analysis set 2 data. Whether all new tumour types will be exchangeable with those currently under evaluation is not known. Even if they are exchangeable, whether this would result in the same posterior distribution is also not known. This is simply the optimal posterior prediction for a single new tumour type, provided it is exchangeable with the tumour types that are currently evaluable.
Sensitivity to prior and hyper-prior settings was not investigated. Changes in the priors can have a direct result on the estimated parameters and σ in particular. Given that this is the primary result of the analysis, rather than the pooled estimate results or even the results from the tumour types, and that an increase in hyper-prior variance can result in meaningful changes to the estimated heterogeneity parameter (σ), the sponsor’s conclusions are not strongly supported. Changing the variance of the hyper-prior for σ to a lower variance will reduce the median posterior estimate of σ, and therefore the heterogeneity as well. This, in addition to the uninvestigated assumption of exchangeability and ORRs for all tumour types, i.e., that they all come from the same normal distribution, make the results of this analysis challenging to interpret.
Other limitations of the analysis include the failure to fully investigate the causes of heterogeneity. For example, the BHM may provide evidence for heterogeneity in a mixed-effects model that includes age and life expectancy in addition to a random effect for tumour type, such as that presented in section 4.6.1.3 of the NICE (extended primary analysis set 2) report.79 The sponsor applied the BHM only to the surrogate outcome of ORR rather than PFS or OS. As is clearly pointed out in the NICE appraisal,78 because the ORR cannot be uniformly considered a surrogate for OS across all tumour types, this analysis does not address the greater issue of heterogeneity in OS or PFS across tumour types.
Summary
The primary use of the BHM as presented is to investigate heterogeneity, not account for it. As currently presented without further analysis to investigate the sources of heterogeneity, the results appear to provide evidence for heterogeneity and against a single and simple pooled analysis across all tumour types. However, the failure to investigate the assumption of exchangeability and the impact of the prior assumptions on the resulting estimates make it impossible to support any conclusions drawn for this analysis.
Permutation Analysis
Populations and Methods
The permutation analysis used 188 participants, including 164 participants from ePAS4 and 24 participants from SAS3. The analysis was performed on 3 different sets: ePAS (the 73-participant subset of ePAS4), the 164 participants from ePAS4 and the combined ePAS4, and the 188 participants of SAS3. The 188 participants for the combined set used in the primary analysis are presented in Table 33, and 21 tumour type/study subgroups are considered.
Table 33: Frequency Statistics for Tumour Type, Stratified by Study (ePAS4 + SAS3)
Study IDa | Total |
|---|---|
N (Total all studies) | 188 (100%) |
Study 20288 | 13 (6.9%) |
Cancer of unknown primary | 1 (0.5%) |
GIST | 2 (1.1%) |
Lung | 1 (0.5%) |
Salivary gland | 3 (1.6%) |
Soft tissue sarcoma | 2 (1.1%) |
Thyroid | 4 (2.1%) |
Study 20289 | 105 (55.9%) |
Cohort 1: NSC Lung | 12 (6.4%) |
Cohort 2: Thyroid | 22 (11.7%) |
Cohort 3: Sarcoma | 18 (9.6%) |
Cohort 4: Colorectal | 8 (4.3%) |
Cohort 5: Salivary | 18 (9.6%) |
Cohort 6: Biliary | 2 (1.1%) |
Cohort 7: Primary CNSb | 7 (3.7%) |
Cohort 8: All other solid tumours | 15 (8.0%) |
Cohort 9: Lab certification not confirmed | 3 (1.6%) |
Study 20290 | 70 (37.2%) |
Bone sarcoma | 1 (0.5%) |
CMN | 1 (0.5%) |
IFS | 32 (17.0%) |
Melanoma | 1 (0.5%) |
Primary CNSa | 17 (9.0%) |
Soft tissue sarcoma | 18 (9.6%) |
CMN = cellular congenital mesoblastic nephroma; CNS = central nervous system; ePAS4 = extended primary analysis set; GIST = gastrointestinal stromal tumour; ID = identifier; IFS = infantile fibrosarcoma; NSC = non–small cell; SAS3 = safety analysis set 3.
aStudy 20288 is the former LOXO-14001 study; Study 20289 is the former LOXO-15002 study; Study 20290 is the former LOXO-15003 study.
bPrimary CNS is in SAS3 and not included in the pooled analysis for ePAS4.
Source: Note to clinical reviewer (2020).22 The table is regenerated by the CADTH Review Team.
Interventions
Larotrectinib
Outcomes
ORR
Points of Statistical Analysis Critical for Permutation Analysis
The permutation analysis is the combination of all possible subsets of the 21 tumour/studies as described in Table 34. Because the combination is not weighted by sample type, the larger group dominates the smaller group when larger groups are combined with smaller groups. This results in a distribution of ORR estimates over all the subsets. This analysis was performed using all 188 participants (the combined ePAS4 and SAS3) and 21 groups, 164 participants in ePAS4, and the 73 participants of ePAS separately. The 21 sets in the 188-subject group resulted in 2,097,151 groups and ORR estimates.
The ORR estimates were calculated in combined groups by combining individual-level data and taking the proportion of responders over the number of patients in the combined group. The mean ORR was then calculated by taking the mean of all the estimated ORRs over all 2,097,151 groups, and the SD was calculated in the same way for the estimated ORR over all 2,097,151 groups. Percentiles were calculated by finding the estimated ORR value for which a given proportion (0.05 or 5%) of the 2,097,151 groups had an equal number of or fewer ORR estimates.
Results
Figure 14 illustrates the distribution of ORR estimates over the 2,097,151 groups of 188 subjects and 21 groups of the combined ePAS4 and SAS3 datasets. The summary statistics from the distribution presented in Table 34 suggest distribution is skewed, with a longer tail to 0 centred at 0.65. As can be seen in Figure 14, the ePAS4 + SAS3 ORR mean estimate is near the centre of the distribution of the estimated ORRs over the 2,097,151 groups and the ORR estimate ePAS4 alone is above the mode at 72.56%. In comparison, the ORR estimate for the ePAS was 75.34%, which would be in the upper tail of the ORR distribution.
Figure 14: Histogram of ORR for All Combinations of the 21 Cohorts (ePAS4 + SAS3)
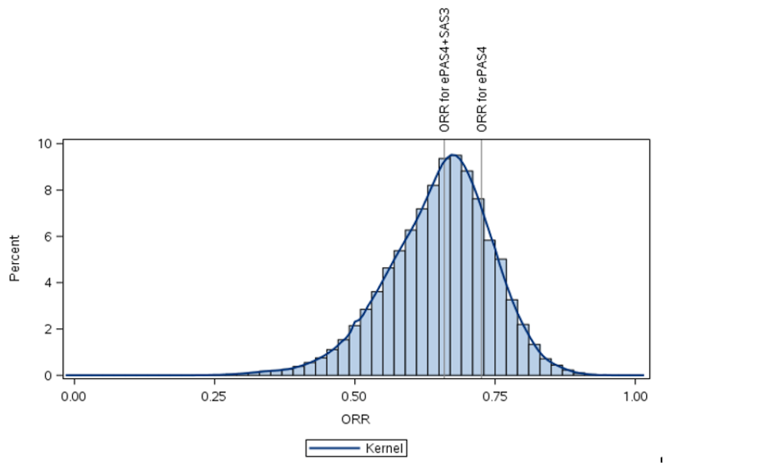
ePAS4 = extended primary analysis set 4; ORR = overall response rate; SAS3 = safety analysis set 3.
Source: Sponsor-submitted permutation analysis of all possible combinations of subsets of cohorts across clinical studies.74
Table 34: Descriptive Statistics of All Combinations of the 21 Cohorts for ORR (ePAS4 + SAS3)
n | Mean | SD | Min | P5 | P25 | Median | P75 | P95 | Max | |
|---|---|---|---|---|---|---|---|---|---|---|
ORR | 2,097,151 | 0.65080 | 0.09327 | 0.0000 | 0.48718 | 0.59375 | 0.65957 | 0.71429 | 0.79032 | 1.0000 |
ePAS4 = extended primary analysis set 4; Min = minimum; Max = maximum; ORR = overall response rate expressed as a proportion of patients with a complete response pathological complete response, or partial response; P5 = fifth percentile; P25 = 25th percentile; P75 = 75th percentile; P95 = 95th percentile; SAS3 = safety analysis set 3; SD = standard deviation.
Source: Sponsor-submitted permutation analysis of all possible combinations of subsets of cohorts across clinical studies.74
Critical Appraisal
Although the results suggest that only 5% or less of the permutation distribution over the subgroups would result in an ORR estimate of 50% or less, this is not evidence of low heterogeneity or that how the groups are combined does not affect the estimated ORR. Combining any large subgroup with a high ORR and a small subgroup with a low ORR will result in only a minor reduction in the larger group’s ORR. This analysis does not provide evidence that the ORR in the combined group is superior in any way to the estimate in the smaller subgroup. Further, there is no evidence to support the assertion that the average ORR estimate resulting from the permutation analysis is more valid or generalizable than the estimate of ORR calculated using the combined ePAS4 data. Further, it is unclear if the permutation analysis methodology is endorsed by any health technology assessment or regulatory agencies. The NICE appraisals document78 does not include permutation analysis as a recommended approach. Moreover, the permutation analysis does not provide evidence that the ORR is homogeneous across tumour types or studies. However, it does provide evidence that if the ORR is in fact homogeneous, then the ORR estimate combining all individuals in the ePAS4 data is likely more accurate than the ORRs estimated separately by tumour type. However, as it is not known if the estimated treatment effects are homogeneous by tumour type, the most appropriate methodology for estimating the ORR remains unclear. This analysis does not investigate nor adjust for homogeneity of treatment effect across subgroups, and therefore does not appear to mitigate issues with heterogeneity, nor does it investigate heterogeneity in ORRs. The permutation analysis considers only ORR as a surrogate for the clinical outcomes of PFS or OS.
Summary
The permutation analysis does not appear to address or investigate heterogeneity and it does not add to the evidence to support or refute a combined analysis or totality view of the results across or ignoring tumour type. It does provide evidence that if the ORR is homogenous then combining all tumour types will likely produce a superior estimate compared with the ORRs estimated separately by individual tumour type. However, it is not known if the effects are homogenous.
Intra-Person Growth Modulation Index Analysis
Populations and Methods
The analysis set included 122 patients from ePAS4, which included 164 patients. Patients with TRK fusion cancer enrolled in 1 of the 3 larotrectinib clinical trials who had been treated with larotrectinib and followed up for at least 6 months (or discontinued early) and had at least 1 prior line of systemic therapy in the advanced setting were included. No outline by tumour type is provided in the documentation for the included participants; however, numbers by tumour type can be seen in Table 35.
The GMI is the ratio of PFS in the current treatment to that of the most recent prior treatment. It can be thought of as the current PFS in the time scale of the previous PFS, and therefore can be considered a continuous time-to-event measure, for which each subject has its own time scale — the overall GMI time scale. The first paper to suggest the use of this measure, Von Hoff (1998),80 proposed that a GMI of 1.33 “represents a 33% improvement and is considered excellent and unexpected for the second in line, new treatment.” This is often used as a cut-off, as it was in this analysis.
Intervention and Comparators
The analysis involved larotrectinib and all previous first-line therapies.
Outcomes
The GMI was calculated as the ratio of the PFS on larotrectinib and the time to progression or TTPF on the most recent prior therapy before time to larotrectinib.
Points of Statistical Analysis Critical for Growth Modulation Index
The GMI was calculated as a ratio of PFS with larotrectinib to the time to progression or TTPF on the most recent prior line of therapy (GMI = PFS/TTPF) based on the following definitions:
PFS was defined as the time from the start of larotrectinib treatment to progression, as determined by an IRC using RECIST 1.1, clinical progression, or death by any cause. Participants who had not yet progressed were censored at the time of last visit.
The TTPF was defined as the time from the start of the last prior treatment to radiological progression (as defined by RECIST 1.1), clinical progression, or treatment end date (due to stable disease, AE, or patient and/or physician decision).
The GMI was calculated in 2 ways. The first method used time to last visit as the PFS for any participants that had not yet progressed on larotrectinib at the individual level as PSF/TTPF. The second was the Kaplan-Meier method. The methodology for the Kaplan-Meier estimation is not clear from the submission documents as no reference was provided. It is unclear if the method outlined in Kovalchik and Mietlowski (2011)81 or a different approach was used. Regardless, the concept is the same as standard Kaplan-Meier analyses, in which the GMI is treated as a continuous time to event and the event is observed if progression or death occurred in period 2 before the close of the data and is otherwise censored at the last visit. This approach assumes the censoring is independent of progression or death in the second period. Medians and proportions were calculated on the individual GMI values in the standard manner. Median values based on the Kaplan-Meier method are obtained from the survival curves and are the time point at which 50% of the participants have had an event.
Breakdowns of the results by the alternative Kaplan-Meier method were also included to compare participants by previous numbers of therapies received, adult versus pediatric patients, and those with metastatic cancer. These were performed by making separate Kaplan-Meier curves for period 1 and period 2, rather than using the Kaplan-Meier methods directly for the GMI. These are then compared with a hazard ratio. It is unclear how the hazard ratios were calculated, as this is not described in the submission materials.
Results
In the complete dataset (N = 122), the median over the individual GMI (using censoring time) was 3.35 (range = 0.00 to 337). In total 84 patients (69%) had a GMI of at least 1.33, whereas 78 (64%) had a GMI of at least 2 and 47 (39%) had a GMI of at least 5. A total of 76 patients (62%) had not progressed and were censored for PFS at the date of data cut-off. A breakdown by participants’ characteristics can be seen in Table 35, which shows that all included tumour types had more than 40% of participants with an individual GMI (using censoring time) of greater than 1.33.
Using the censoring time for individuals that have yet to die or progress underestimates the GMI for participants that are censored. The Kaplan-Meier method was therefore also employed, as illustrated in Figure 15 (Figure 5.28 of the note to clinical reviewers). The Kaplan-Meier estimated median GMI was 7.55 (95% CI, 5.70 to 88.00), meaning that the lower tail of the 95% CI is more than the desired cut-off of 1.33 for clinical relevance.
Using alternative Kaplan-Meier methods, survival curves were made separately for TTPF on previous treatment and PSF on larotrectinib. Hazard ratios comparing the periods were provided with 95% CI. Survival curves and hazard ratios are provided in Figure 16. All hazard ratios are less than 0.3, meaning larotrectinib was associated with a hazard that was reduced by at least 70%, and all 95% CIs do not cover 0.
Additional data were added by the sponsor to the analysis presented in Table 36 and Figure 17. These results include 18 more patients (from 122 in the previous analysis to 140) as well as extended follow-up for those patients in the original analysis. This extended analysis with more data produced the same conclusions as the previous analysis. The inclusion criteria for the analysis also appears to be more inclusive as the footnote in Table 36 suggests all patients with prior therapy were included, rather than also requiring 6 months of follow-up. As Table 36 shows, 67% of adults and 83% of children had a GMI of at least 1.33, which represents a slight improvement from the previous data in both groups. Figure 17 supports these findings, with hazard ratios of 0.288 (95% CI, 0.20 to 0.413) for adults comparing TTPF in the previous period to PFS on current treatment and 0.095 (95% CI, 0.052 to 0.178) in children. This suggests greater activity in children and high activity on average.
Figure 15: Kaplan-Meier Estimate of GMI (N = 122)
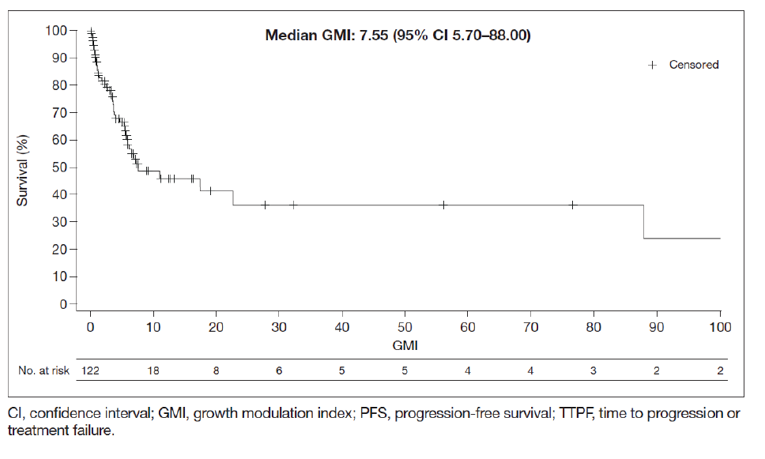
CI = confidence interval; GMI = Growth Modulation Index.
Source: Sponsor-submitted Growth Modulation Index of larotrectinib versus prior systemic treatments for TRK fusion cancer patients.75
Table 35: Growth Modulation Index by Patient Subgroup
Subgroup, n (%) | GMI (N=122) | ||
|---|---|---|---|
< 1 | 1 to 1.33 | ≥ 1.33 | |
Age group | |||
Pediatric (n = 39) | 4 (10) | 3 (8) | 32 (82) |
Adult (n = 83) | 28 (34) | 3 (4) | 52 (63) |
ECOG PS | |||
0 (n = 59) | 12 (20) | 5 (8) | 42 (71) |
1 (n = 43) | 16 (37) | 1 (2) | 26 (60) |
2 (n = 17) | 2 (12) | 0 | 15 (88) |
3 (n = 3) | 2 (67) | 0 | 1 (33) |
NTRK gene | |||
NTRK1 (n = 57) | 14 (25) | 4 (7) | 39 (68) |
NTRK2 (n = 3) | 1 (33) | 0 | 2 (67) |
NTRK3 (n = 62) | 17 (27) | 2 (3) | 43 (69) |
Lines of prior therapy | |||
1 (n = 47) | 13 (28) | 3 (6) | 31 (66) |
2 (n = 32) | 9 (28) | 3 (9) | 20 (63) |
3 (n = 43) | 10 (23) | 0 | 33 (77) |
Objective response status | |||
Non-responders (n = 37) | 20 (54) | 2 (5) | 15 (41) |
Responders (n = 85) | 12 (14) | 4 (5) | 69 (81) |
Tumour typea | |||
STS (n = 26) | 6 (23) | 1 (4) | 19 (73) |
IFS (n = 22) | 2 (9) | 2 (9) | 18 (82) |
Thyroid (n = 21) | 7 (33) | 1 (5) | 13 (62) |
Lung (n = 12) | 3 (25) | 0 | 9 (75) |
Salivary gland (n = 10) | 2 (20) | 0 | 8 (80) |
Melanoma (n = 7) | 4 (57) | 0 | 3 (43) |
Colon (n = 7) | 2 (29) | 2 (29) | 3 (43) |
ECOG PS = Eastern Cooperative Oncology Group performance status; GMI = Growth Modulation Index; IFS = infantile fibrosarcoma; NRTK = neurotrophic tyrosine receptor kinase; STS = soft tissue sarcoma.
aOnly tumours reported in at least 7 patients are listed.
Source: Sponsor-submitted Growth Modulation Index of larotrectinib vs. prior systemic treatments for TRK fusion cancer patients.75
Figure 16: Kaplan-Meier Plot of PFS on Larotrectinib (IRC) and TTPF on the Previous Line of Therapy (Investigator) for the Complete Dataset, Adult and Pediatric Patients, and Metastatic Patients
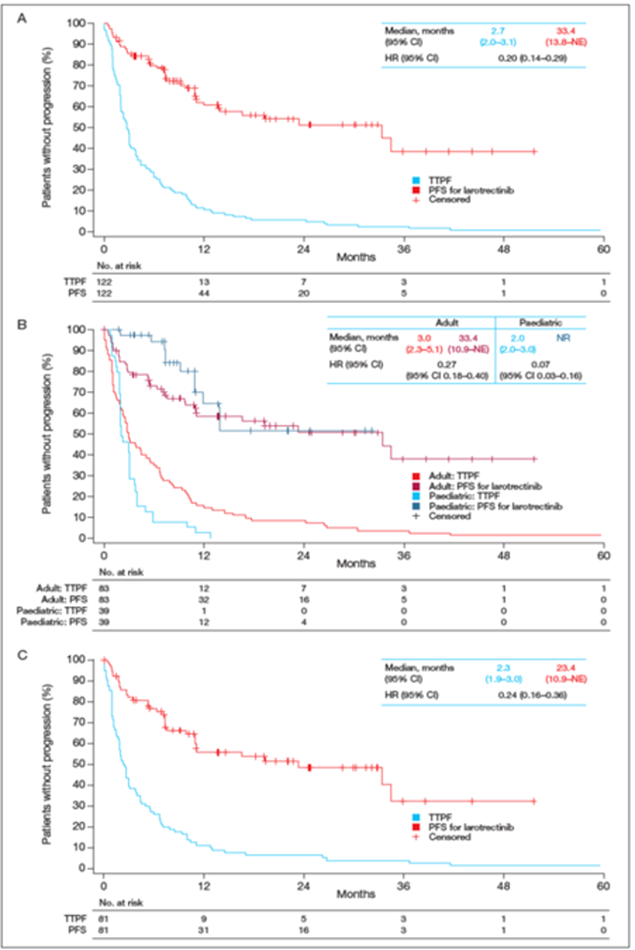
Note: (A) the complete dataset (N = 122), (B) adult (n = 83) and pediatric patients (n = 39), and (C) metastatic patients (n = 81).
CI = confidence interval; HR = hazard ratio; IRC = independent review committee; NE = not estimable; NR = not reported; PFS = progression-free survival; TTPS = time to progression or treatment failure.
Source: Sponsor-submitted Growth Modulation Index of larotrectinib versus prior systemic treatments for TRK fusion cancer patients.75
Table 36: Summary of Growth Modulation Index by Age Groups (ePAS5)
Growth Modulation Index | Adult N=91 (100%) | Pediatric N=49 (100%) | Total N=140 (100%) |
|---|---|---|---|
n | 91 | 49 | 140 |
Mean | 19.656 | 5.956 | 14.861 |
SD | 81.333 | 5.361 | 65.848 |
Min | 0.00 | 0.00 | 0.00 |
Median | 3.272 | 4.667 3.639 | 3.639 |
Max | 673.00 | 22.22 | 673.00 |
GMI category | |||
< 1 26 | 26 (28.6%) | 4 (8.2%) | 30 (21.4%) |
1 to < 1.33 | 4 (4.4%) | 3 (6.1%) | 7 (5.0%) |
≥ 1.33 | 61 (67.0%) | 42 (85.7%) | 103 (73.6%) |
ePAS5 = extended primary analysis set 5; GMI = Growth Modulation Index.
Note: All patients with at least 1 prior therapy were included in this analysis.
Source: Updated ePAS5 data.27
Figure 17: Kaplan-Meier Plot of PFS on Larotrectinib (IRC) and TTPF on the Previous Line of Therapy by Age Group (ePAS5)
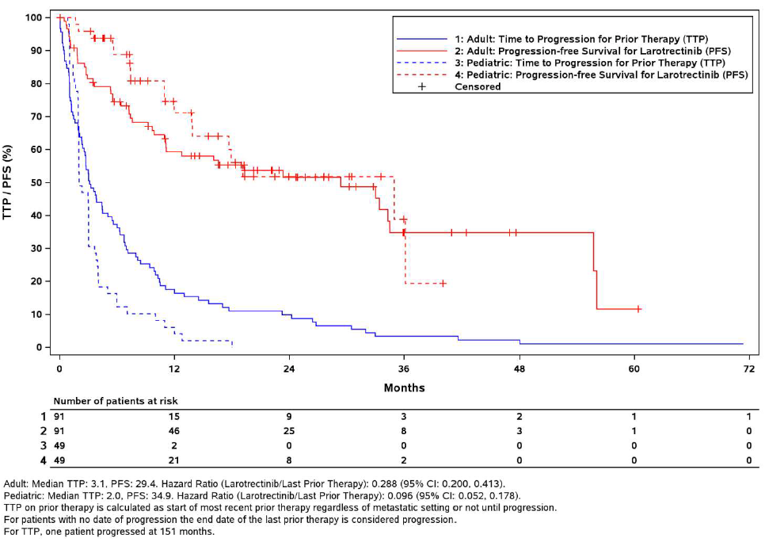
ePAS5 = extended primary analysis set 5; IRC = independent review committee; PFS = progression-free survival; TTP = time to progression on previous therapy; TTPF = time to treatment failure.
Source: Updated ePAS5 data.27
Critical Appraisal
The analysis shows an improvement in PFS under larotrectinib in comparison to TTPF under previous treatment; this is evidence that on average (or by median) over the tumour types, participants show greater improvement with larotrectinib even at a later stage of their disease progression. This would answer many of the concerns about heterogeneity if the assumptions underlying these findings were directly addressed and there was an investigation of all tumour types. Two underlying assumptions of the GMI analysis are required to make this approach meaningful: participant characteristics with regard to all sources of heterogeneity of interest are consistent between periods 1 and 2; and measurements compared in the ratio are comparable, i.e., progression was assessed and defined in the same manner in both periods and all other reasons for an event are the same. However, neither condition is true. Even if all other limitations are ignored, the individual-level median of greater than 3 and the Kaplan-Meier method median of greater than 7 are compelling only if the PFS in period 2 and the TTPF in period 1 are comparable. The greatest limitation of this analysis is the lack of information. It is unclear if PFS under larotrectinib is comparable to TTPF under period 1 treatment. As it is stated that participants who “discontinued early” were included in this analysis, it is unclear if the PFS is cut off at discontinuation as it would be in TTPF for treatment failure. Given that this is not mentioned, it appears that it is not the case, PFS and TTPF are therefore not comparable, and a GMI calculated in this way may be biased upward. It is also not clear if participants are comparable in any meaningful way, other than age and disease progression, which would have clearly increased relative to the prior treatment period.
Due to these shortcomings, additional information was provided by the sponsor, indicating that 23 of 122 patients in ePAS4 had a PFS date after the last larotrectinib dose date and confirming that the TTPF in the first period (which ended at treatment’s end) and the PFS used in the second period were not the same. The sponsor also conducted a more conservative sensitivity analysis using the date of progression on prior systemic therapy or, if missing, the date of larotrectinib initiation for the TTPF. The sponsor claims this analysis yielded largely unchanged GMI results, with a reduction of less than 3% in the ratio of patients with a GMI of at least 1.33.
No actual statistical analysis was performed on individual GMI values. No confidence intervals are provided for the medians, only minimum-maximum ranges, and it is unclear if the median is meaningfully greater than 1 or even 1.33. Due to censoring, the individual GMI values should not be used for rigorous statistical testing. Although the percentages of participants with a GMI level less than 1, between 1 and 1.33, and greater than 1.33 within subgroups of interest are presented, they are not accompanied by any statistical inference, measure of uncertainty, or confidence intervals. Looking only at the estimated proportions that were reported among the groups with at least 7 patients, several tumour types (STS, IFS, lung, and salivary) have at least 75% of patients with a GMI of 1.33 or greater, but 3 other groups did not, suggesting variation among the groups. Results for smaller groups were not reported in this way.
Under the assumption that censoring is random or only administrative, results produced by the Kaplan-Meier method with the GMI as the event time and the indicator of event or censoring in period 2 would be valid. Given an estimated survival-time median greater than 7 and a lower confidence limit of 5.7, this is the most compelling evidence in this analysis, but it still relies on the 2 problematic assumptions described previously. This does not address differences in GMI by tumour type, between adults and children, or over the number of therapies. Instead of running similar Kaplan-Meier methods directly on the GMI within subgroups for this purpose, the alternative Kaplan-Meier method is used. Survival curves are instead fit for each period and a hazard ratio is presented to compare the periods. It is unclear how these hazard ratios are estimated and if the inference for them (the presented CI) is valid given the correlation within subject. Without inference, large variation in GMI is evident across the tumour types. Importantly, the tumour types showing the lowest ORRs in previous analyses are not included here, presumably because they do not meet the inclusion criteria.
Summary
The results show a longer PFS with larotrectinib relative to the TTPF with the last prior treatment; however, this observation relies on 2 key assumptions, 1 of which appears to be invalid based on the information provided about the calculation of the GMI. There is no formal investigation of differences in the GMI by tumour type or other patient characteristics, and the presented summary statistics suggest large variations in the GMI. It is unclear how some of the presented results were obtained or if inferences made with them are valid given the intra-person nature of the analysis. Without further investigation and information this does not add to the evidence in support of a combined analysis or totality view of the data. However, if the GMI can be considered a reliable comparison tool, it appears to support the case that larotrectinib may be beneficial in many of the tumour types when other treatments have failed, and that this is the case across many patient characteristics, mitigating many of the concerns about patient heterogeneity, other than tumour type.
Overview of Other Relevant Evidence
The BHM analysis, although appropriately performed, is presented as a means of accounting for, rather than investigating heterogeneity in, ORR across tumour types. The BHM clearly identifies heterogeneity across tumour types, and no further analysis is presented to show that this heterogeneity can be explained by participant-level characteristics outside of tumour type, i.e., subject-level characteristics that are controlled for in the GMI analysis. The BHM analysis does not provide evidence to support the combined analysis of the data and a histology or location-free approval across all tumour types. This analysis also considers ORR and not PS or OS and therefore may not answer the more relevant question of the effect on survival, as ORR may not be a reasonable surrogate for PFS or OS across all tumour types, participants, or treatments. The permutation analysis does not appear to support or reject the pooling of all data in a single analysis, as the presented distribution across all subgroups may be a mere artifact of smaller groups having lower ORRs and larger groups having higher ORRs. The intra-patient GMI analysis provides the most compelling evidence that larotrectinib is effective across a number of patient types. If the assumptions underlying this analysis are valid, concerns about between-patient heterogeneity due to the lack of controls may be mitigated. However, this does not directly address concerns about heterogeneity across tumour types. A further analysis with appropriate inferences across tumour types would directly address this issue, although all tumour types with any data should then be included. Larotrectinib is not as active in smaller groups defined by particular tumour types, and none of the 3 alternative analyses provide evidence to mitigate this concern.
Discussion
Summary of Available Evidence
This CADTH review included 3 open-label, single-arm trials of larotrectinib in adult and pediatric patients with advanced or metastatic solid tumours: LOXO-TRK 14001, LOXO-TRK-15003 (SCOUT), and LOXO-TRK-15002 (NAVIGATE). All 3 trials are ongoing; however, the reimbursement submission for larotrectinib is based on pooled analyses of efficacy and safety data from NTRK fusion cancer patients enrolled in these 3 trials. The following datasets, with a data cut-off on July 15, 2019, were the primary pooled patient populations considered in this resubmission: ePAS4 (n = 164), SAS3 (n = 24), patients included in the HRQoL analyses (n = 126; 74 adults, 24 children ≥ 2 years old, and 28 infants < 2 years old), those in the TRK fusion cancer labelled-dose safety analysis set (n = 196), and patients in the overall labelled-dose safety analysis set (n = 238). Additionally, the newest data cut-off of July 2020 was used for the following datasets: ePAS5 (N = 192), SAS3 (n = 33), NTRK fusion cancer safety set (N = 260), and overall safety set (N = 331). These datasets represent a larger sample size with longer follow-up times compared to the original CADTH submission, which consisted of the integrated dataset (n = 122), with a data cut-off date of July 30, 2018. In addition, the PAS (n = 55; July 17, 2017, data cut-off), which was used as the primary pooled analysis in the sponsor’s submission to the FDA, was reported in results to compare the change in the magnitude of effect over time.
Adults and pediatrics enrolled across the 3 larotrectinib studies were included in ePAS4 if they met the following criteria22: documented NTRK gene fusion as determined by local testing, non-CNS primary tumour with 1 or more measurable lesions at baseline that could be assessed according to RECIST 1.1, and administration of 1 or more doses of larotrectinib. Patients in ePAS4 must also have had an IRC-assessed response. The SAS3 population consisted of patients with primary CNS tumours.82 These patients were excluded from the overall analysis sets and analyzed separately. Responses for patients in the SAS3 dataset were assessed by the investigator and were evaluated using either RANO criteria or RECIST 1.1. Patients were treated with larotrectinib 100 mg orally twice daily in individuals with a BSA of at least 1 m2, or 100 mg/m2 orally twice daily for children with a BSA of less than 1 m2.25 The primary end point of the pooled analysis was ORR (IRC-assessed in ePAS4, investigator-assessed in SAS3).22 The ORR results were presented for the following subgroups: tumour type, age (pediatrics versus adults), baseline ECOG performance status, number of prior systemic regimens, baseline disease status (metastatic versus locally advanced), NTRK involved in gene fusion, and NTRK gene fusion for the 3 most common fusion partners. Secondary end points include ORR based on local investigator assessment, as well as the following (both investigator- and IRC-assessed): TTR, TTBR, DOR, DCR, PFS, and OS.57 Analyses of HRQoL outcomes were not pre-specified in the sponsor-submitted statistical analysis plan for the pooled analyses, and it was not clear which analyses or subgroups were pre-specified (if any).59,60 Safety was assessed based on the incidence and severity of all AEs and SAEs.57 Approximately 45% of the patients discontinued treatment, and in 24% of those cases it was due to disease progression.
The key limitations of the pooled analyses include the following. First, data were pooled from the same 3 trials in the original submission and therefore had the same issues contributing to between-study heterogeneity (e.g., different phases of studies, different primary outcomes, and different eligibility criteria). While the rationale to pool data was based on practical constraints of low prevalence of NTRK positivity in cancer, the limitations associated with pooling heterogeneous trial data are nonetheless valid. Second, there were uncertainties around the pooled analysis results. Although populations of various tumour histologies were pooled, some of the tumour types were under-represented. Therefore, the generalizability of findings across different tumour types remains uncertain. Finally, the pooled analyses were performed as post hoc decisions for the included trials, some analyses (e.g., HRQoL analyses) were not pre-specified in the protocol, and the absence of key information on some of the post hoc analyses (e.g., HRQoL analyses) limited their usefulness.
Interpretation of Results
Efficacy
The primary outcome in the pooled analysis was the IRC-assessed ORR. In ePAS4, the ORR was 73% (95% CI, 65% to 79%) as of the July 15, 2019, data cut-off and 72% (95% CI, 65% to 79%) as of the July 2020 cut-off, which were numerically lower than the 81% ORR (95% CI, 72% to 88%) from the integrated dataset (which had a July 30, 2018, data cut-off date) that was used in the original CADTH submission in 2019 and were similar to the 75% ORR (95% CI, 61% to 85%) from the PAS (with a July 17, 2017, data cut-off) that was used in the FDA submission in 2017. Results from SAS3 indicated the ORR was much lower among patients with primary CNS tumours, at 21% (95%CI, 7 to 42), although these results were based on only 24 patients. With the new data cut-off date of July 2020 (n = 33), the ORR was 24% (95% CI, 11% to 42%). The clinicians consulted by CADTH for this review considered the ORR a clinically relevant outcome and an appropriate assessment of response in a patient population with heterogeneous primary tumours. Among the 119 patients who achieved an overall best response in ePAS4, the median TTR was 1.84 months (first quartile: 1.74; third quartile: 1.94 months), with 81% experiencing a TTR of 2 months or less. Almost half of these patients achieved PR (49%), 19% achieved a CR and 15% a stable disease state. The median TTR in patients with primary CNS tumours was similar at 1.82 months (range = 0.99 months to 3.75 months).
The results of the pooled analysis suggested that larotrectinib was associated with an improved ORR across the subgroups, based on baseline disease characteristics (metastatic cancer status versus locally advanced), age (pediatrics versus adults), number of prior treatment regimens, NTRK gene fusion, and NTRK gene fusion for the 3 most common fusion partners. However, these subgroup analyses were descriptive in nature, with varying ranges of ORRs and sample sizes across subgroups, making any interpretation inconclusive for comparative purposes. Across tumour types, the point estimates of the ORR ranged widely, and the CIs reflected a high degree of uncertainty around the point estimate of the ORR for many tumour types. The sample sizes of the tumour subgroups ranged from a single patient (appendix, unknown primary cancer, CMN, hepatic, and prostate), to 36 patients (STS). In light of the small sample sizes and the wide CIs, no meaningful conclusions can be drawn about the efficacy of larotrectinib in different types of solid tumours. As an example, the ORR for thyroid cancer decreased from 100% with 5 patients using the PAS to 56% with 27 patients using ePAS4, whereas the ORR improved from 25% to 38% in the case of colon cancer when 4 additional patients were included. It is therefore not methodologically meaningful to evaluate the ORR (and by extension the effectiveness) of larotrectinib on different cancer types separately. Despite these limitations, the clinical experts agreed that the ORR observed with larotrectinib across a wide range of tumours was consistent, and not previously seen with available therapies. This is particularly meaningful within the population of patients for whom there are no effective systemic treatment options, and/or for whom prognosis is poor.
Among other end points in ePAS4, the DCR was 84% (95% CI, 77% to 89%), the median DOR was NE (95% CI, 27.6 months to NE), the median PFS was 33.4 months (95% CI, 19.3 months to NE; median follow-up of 14.0 months), the median OS was NE (95% CI, 44.4 months to NE; median follow-up of 15.8 months), and 85% of patients were alive as of the July 15, 2019, data cut-off. Results were similar in the newest dataset, ePAS5, with the exception that the estimated DOR was 34.5 months (95% CI, 27.6 to 54.7) after a median follow-up of 20.3 months. In the original submission, data using the integrated dataset showed a shorter median PFS of 28.3 months (95% CI, 9.9 to NE) and median OS that had not been reached after a median follow-up of 14.8 months. Recognizing the limited follow-up and events for the PFS and OS data, and the lack of comparative data, the clinical experts concluded that a median PFS of 33.4 months and a median OS (which has not yet been reached) were clinically meaningful in a pre-treated population with advanced solid tumours. These efficacy data are consistent with the high ORR and long DOR observed with larotrectinib in this setting. However, caution must be used in interpreting the PFS and OS results. For the pooled analysis, 3 heterogenous populations of patients were combined within a single Kaplan-Meier curve to determine survival outcomes; conventional survival analyses rely on the assumption that a single survival distribution can be used to estimate the survival of all study participants. As such, the pooled Kaplan-Meier curves for PFS and OS are methodologically difficult to interpret.
Results in SAS3 consistently showed a lower PFS (median of 11.0 months at a median follow-up of 5.6 months), compared to that in ePAS4. The median OS was NE after a median follow-up of 6 months in the population of primary CNS tumours; 96% of patients were still alive at the time of the data cut-off. Results were largely similar with the new SAS3, with 33 patients.
Overall, clinical judgment should be used to interpret these results, given the lack of any comparator group.
Quality of Life
HRQoL was an exploratory objective in the NAVIGATE and SCOUT studies as measured by the EORTC QLQ C-30, PedsQL, EQ-5D-5L, and Wong-Baker FACES Scale for pain. In the pooled dataset, the HRQoL analyses included patients with non-CNS primary solid tumours with an NTRK gene fusion and measurable disease from the 2 aforementioned trials, and only included the GHS subscale of EORTC QLQ C-30 and the total score of PedsQL. However, because analyses of HRQoL outcomes were not pre-specified in the sponsor-submitted statistical analysis plan for the pooled analyses, and it was not clear which analyses or subgroups were pre-specified (if any), the results were interpreted with caution. The analyses of HRQoL measures were also associated with several limitations.
Results of the HRQoL analyses showed that more than 90% of adult patients maintained or improved to the norm/above norm state at the best response, regardless of their baseline state. In pediatric patients 2 years of age and older, 100% remained at norm/above norm at the best response, whereas 67% improved to this state from a below norm state at baseline. Recognizing that the HRQoL data are limited to small numbers of patients (a total of 126 patients; 74 adults, 24 children ≥ 2 years old, and 28 infants < 2 years old), the use of larotrectinib appears to be associated with an improved HRQoL from their baseline state, at least descriptively. The best response in both adults and pediatric patients coincided within the estimated MIDs (10 points for EORTC QLQ C-30 GHS and 4.5 points for PedsQL total score). The mean of best change from baseline was: 17.5 points (SD = 20.0) in EORTC QLQ C-30 GHS among adults, 20.7 points (SD = 17.2) and 12.0 points (SD = 13.8) in PedsQL total scores among children older and younger than 2 years, respectively. Of the patients for whom HRQoL data were available post-baseline, 59% of adults, 79% of children 2 years of age and older and 57% of patients younger than 2 years of age reported a best post-baseline score that reached or exceeded the estimated MIDs of the respective instruments. However, these analyses considered the patient’s HRQoL results at their best response, not at their last reported response. As there could be significant difference between them, it is unclear whether the best change was, in fact, a transient improvement in HRQoL. Furthermore, the data comparing the proportion of patients who remained in the norm/above norm or below norm category, or in those who improved from Below Norm to Norm/above norm from baseline until follow-up, are difficult to interpret. This is because patients could move from Below Norm to Norm/above norm without actually exceeding the estimated MIDs for the respective instruments (10 for EORTC QLQ C-30 GHS and 4.5 points for PedsQL total score), particularly if their baseline values were closer to the chosen cut-off (53.9 for EORTC QLQ C-30 GHS in adults and 80.5 for PedsQL in children ≥ 2 years of age). Additionally, patients could experience a clinically relevant decline in HRQoL and still be in the norm/above norm category as long as they did not fall below the norm (e.g., if they started with a high baseline HRQoL level, dropped to a level that exceeded the respective MIDs after treatment, and were still above the norm). At baseline it appeared that more pediatric patients (63%) were experiencing poor (below norm) QoL, compared to 30% of adults. However, among both adult and pediatric patients the majority of patients who were below norm at baseline improved on study (and no child had worsening QoL measures).
Among patients evaluable for a sustained improvement (i.e., with a baseline and at least 2 post-baseline assessments), the number of patients dropped with continuation of treatment. Data showed 47% of adults, 75% of children 2 years of age and older, and 43% of children younger than 2 sustained improvements for at least 2 consecutive cycles, which was reduced to 30% of adults, 50% of children 2 or older, and 29% children younger than 2 by the end of assessment.
Given these issues, and because no statistical comparison was made between baseline and post-baseline levels of HRQoL, the maintenance and/or improvement in HRQoL is unclear. As HRQoL was not assessed in previous pooled analyses, the usefulness of the HRQoL data is limited.
Harms
The majority of the reported AEs in the pooled analysis were grade 1 or 2, most commonly reported as increased ALT and AST, cough, constipation, dizziness, fatigue, nausea, vomiting, pyrexia, anemia, and constipation. Treatment-related grade 3 or 4 AEs occurred in 15% or less of patients, which represents an increase in the incidence in comparison to the original CADTH submission, in which treatment-related grade 3 or 4 AEs occurred in less than 5% of patients. The most common grade 3 or 4 AEs included anemia, increase in liver enzyme (ALT and AST) levels, and decreased neutrophil count. Larotrectinib treatment interruptions or dosage modifications attributable to treatment occurred in 19% of patients in the TRK fusion cancer labelled-dose safety set (n = 196) and in 15% of patients in the overall labelled-dose safety set (n = 238), whereas permanent discontinuation of larotrectinib for TEAEs, regardless of attribution, occurred in 5% of patients and 8% of patients, respectively, in the 2 safety sets. Results were consistent between the newly submitted overall NTRK fusion cancers safety set (N = 260) and the overall safety set (N = 331).
Despite the increase in grade 3 or 4 AEs demonstrated in the larger sample size and longer follow-up times compared to the original CADTH submission, the clinical experts consulted by CADTH agreed that the safety and tolerability of larotrectinib were acceptable. Additionally, the availability of a liquid formulation facilitates dosing in young children as well as adults, which was noted as a positive factor, considering most treatment alternatives involve invasive surgery or IV therapy.
Other Considerations
Tumour-Agnostic Indication in Solid Cancers Harbouring NTRK Gene Fusion
In the original submission to CADTH, the heterogeneity of the patient population with NTRK fusion cancers was acknowledged and was considered to be a challenge in this review. The experts and pERC noted that there appeared to be some heterogeneity in ORR between different NTRK fusion histologic subgroups, and that the ORR was likely driven by the predominant histologic types (STS, IFS, thyroid, salivary gland, and lung). Based on the data provided and numbers of other rare cancer types, the clinical experts consulted by CADTH reported that it was challenging to confidently arrive at efficacy conclusions for the under-represented subgroups (colon, melanoma, pancreas, and cholangiocarcinoma).
In response to pERC’s concerns, the sponsor provided 3 alternative methodologies to evaluate ORR and PFS: a permutation analysis, a BHM, and an intra-patient comparison using the GMI.
Although some assumptions were required, the intra-patient GMI analysis essentially used each patient as their own control for PFS (on larotrectinib versus prior therapy). If the underlying assumptions are valid, then the results may mitigate concerns about between-patient heterogeneity due to the lack of controls and supporting evidence for the activity of larotrectinib. However, this analysis does not directly address concerns about potential heterogeneity of response in different tumour types. Although the BHM analysis attempted to account for responses in different tumour types, it provided evidence against, rather than supporting, a combined analysis of the data and histology or location-free approval across all tumour types. Finally, the permutation analysis does not appear to supply evidence in either direction and did not suggest that ORRs in different tumour types can or should be combined.
NTRK as Oncogenic Drivers
Fusion of NTRK genes was present in several tumour types, including some rare cancers; with NTRK-positive cases observed more often in some cancer types than in others. Fusion was generally found to be mutually exclusive of other oncogenic drivers, and when co-occurrence was noted, it was primarily seen in colorectal cancer and with MSI, both of which are known to impose a high mutation burden.
Overall, RWE data from 4 studies with thousands of samples show NTRK fusions act as oncogenic drivers across various cancer types. The single histologic type that may be an outlier in this regard is CRC, which frequently shows high tumour mutational burden and MSI. Evidence also shows that NTRK fusions are oncogenic drivers that persist over time and do not tend to be subclonal. These tumours typically lack other molecular oncogenic drivers. The clinical experts were not aware of examples in which an NTRK fusion is lost over time. In fact, in the open study, for patients who responded to larotrectinib and chose to discontinue therapy but later relapsed, the tumours tended to respond again to re-treatment with larotrectinib (suggesting persistence of the driver fusion). The evidence that NTRK gene fusions are typically mutually exclusive of other oncogenic drivers is convincing.
Natural History of NTRK Fusion–Positive Cancers
The clinical experts agreed that the activity of larotrectinib would be expected to behave as other current histology-specific targeted drugs (such as those that target ALK or EGFR). This is based on the evidence available (the data that demonstrate that patients with NTRK fusion–positive cancers do not have better outcomes compared to patients without the mutation), the high response rates observed with larotrectinib in the presence of NTRK gene fusion, and clinical opinion, which recognizes that these ORRs surpass expected response rates with alternative systemic therapies in advanced disease.
Conclusions
The clinical data supporting the efficacy of larotrectinib in a histology-agnostic patient population with NTRK fusion–positive cancer is derived from a pooled analysis of 3 open-label, single-arm trials, including a phase I trial, a phase I/II trial, and a phase II basket trial. The current CADTH resubmission is based on a larger sample size than that of the previous submission, with longer patient follow-up. Additionally, alternative methods for evaluating ORR and PFS, and observational data submitted by the sponsor were considered in this submission. In total, 164 adults and pediatric patients with NTRK-positive cancer of different histologies were included in the most recent pooled analysis.
Results showed that, among patients with a non-CNS tumour, larotrectinib treatment was associated with a 73% improvement in ORR; half of the responders had a PR, 19% patients achieved CR, and the median time to response was less than 2 months. Across different tumour types, the ORR varied widely, with a similarly wide range of uncertainty. Combined with the differences in sample sizes across the different tumour types, some of which had fewer than 10 patients, these factors limit the generalizability of the findings of the mixed cancer population. The ORR also varied between adults and pediatric patients, as well as by patient baseline state, and previous treatment history. Effects on other outcomes important for clinicians and patients, including PFS, OS, DOR, and HRQoL, remain uncertain or inconclusive among patients with primary CNS or non-CNS tumours, due to the lack of accrual of sufficient events and multiple methodological limitations. Among patients with primary CNS tumours, of which the majority were children, the ORR was 21%, other measures of effect varied widely, and small sample sizes and consequently low event numbers added to the uncertainty. Overall, these results and methodological limitations remained mostly unchanged compared to the previous review. While the rarity of NTRK fusion creates practical and ethical challenges to conducting a randomized controlled trial, the lack of comparative evidence and the methodological limitations mean the results should be interpreted based on clinical judgment.
Three additional analyses were submitted in response to concerns raised in the previous submission regarding the inherent heterogeneity across tumour types as well as patients included in the aforementioned trials and the lack of a comparator group. Results from the intra-patient GMI analysis mitigated concerns regarding between-patient heterogeneity due to the lack of controls. However, none of the alternative analyses supported a conclusion of uniform effectiveness of larotrectinib across tumour types. Four RWE studies with thousands of cancer samples supported the oncogenicity and mutual exclusivity of NTRK fusion in certain cancers, but found no increase or reduction in PFS or overall OS among NTRK-positive cancer patients.
References
1.Kheder Ed S, Hong DS. Emerging targeted therapy for tumors with NTRK fusion proteins. Clin Cancer Res. 2018;24(23):5807-5814. PubMed
2.Arevalo JC, Conde B, Hempstead BL, Chao MV, Martin-Zanca D, Perez P. TrkA immunoglobulin-like ligand binding domains inhibit spontaneous activation of the receptor. Mol Cell Biol. 2000;20(16):5908–5916. PubMed
3.Canadian Cancer Statistics Advisory Committee. Canadian cancer statistics 2019. Toronto (ON): Canadian Cancer Society; 2019: https://www.cancer.ca/~/media/cancer.ca/CW/cancer%20information/cancer%20101/Canadian%20cancer%20statistics/Canadian-Cancer-Statistics-2019-EN.pdf?la=en. Accessed 2021 Feb 1.
4.Canadian Cancer Society. Childhood cancer statistics. 2021; https://www.cancer.ca/en/cancer-information/cancer-101/childhood-cancer-statistics/?region = on. Accessed 2021 Mar 19.
5.Vaishnavi A, Le AT, Doebele RC. TRKing down an old oncogene in a new era of targeted therapy. Cancer Discov. 2015;5(1):25-34. PubMed
6.Farago AF, Le LP, Zheng Z, et al. Durable clinical response to entrectinib in NTRK1-rearranged non-small cell lung cancer. J Thorac Oncol. 2015;10(12):1670-1674. PubMed
7.Vaishnavi A, Capelletti M, Le AT, et al. Oncogenic and drug-sensitive NTRK1 rearrangements in lung cancer. Nat Med. 2013;19(11):1469-1472. PubMed
8.Pagani F, Randon G, Guarini V, et al. The landscape of actionable gene fusions in colorectal cancer. Int J Mol Sci. 2019;20(21):5319. PubMed
9.Pietrantonio F, Di Nicolantonio F, Schrock AB, et al. ALK, ROS1, and NTRK rearrangements in metastatic colorectal cancer. J Natl Cancer Inst. 2017;109(12). PubMed
10.Gatalica Z, Xiu J, Swensen J, Vranic S. Molecular characterization of cancers with NTRK gene fusions. Mod Pathol. 2019;32(1):147-153. PubMed
11.Farago AF, Azzoli CG. Beyond ALK and ROS1: RET, NTRK, EGFR and BRAF gene rearrangements in non-small cell lung cancer. Transl Lung Cancer Res. 2017;6(5):550-559. PubMed
12.Bourgeois JM, Knezevich SR, Mathers JA, Sorensen PH. Molecular detection of the ETV6-NTRK3 gene fusion differentiates congenital fibrosarcoma from other childhood spindle cell tumors. Am J Surg Pathol. 2000;24(7):937-946. PubMed
13.Tognon C, Knezevich SR, Huntsman D, et al. Expression of the ETV6-NTRK3 gene fusion as a primary event in human secretory breast carcinoma. Cancer Cell. 2002;2(5):367-376. PubMed
14.Bishop JA, Yonescu R, Batista D, Begum S, Eisele DW, Westra WH. Utility of mammaglobin immunohistochemistry as a proxy marker for the ETV6-NTRK3 translocation in the diagnosis of salivary mammary analogue secretory carcinoma. Hum Pathol. 2013;44(10):1982-1988. PubMed
15.Ricarte-Filho JC, Li S, Garcia-Rendueles ME, et al. Identification of kinase fusion oncogenes in post-Chernobyl radiation-induced thyroid cancers. J Clin Invest. 2013;123(11):4935-4944. PubMed
16.Prasad ML, Vyas M, Horne MJ, et al. NTRK fusion oncogenes in pediatric papillary thyroid carcinoma in northeast United States. Cancer. 2016;122(7):1097-1107. PubMed
17.Stransky N, Cerami E, S. S, Kim JL, Lengauer C. The landscape of kinase fusions in cancer. Nat Commun. 2014;5:4846. PubMed
18.Solomon JP, Linkov I, Rosado A, et al. NTRK fusion detection across multiple assays and 33,997 cases: diagnostic implications and pitfalls. Mod Pathol. 2020;33(1):38-46. PubMed
19.Bebb DG, Banerji S, Blais N, et al. Canadian consensus for biomarker testing and treatment of TRK fusion cancer in adults. Curr. 2021;28(1):523-548. PubMed
20.Perreault S, Chami R, Deyell RJ, et al. Canadian consensus for biomarker testing and treatment of TRK fusion cancer in pediatric patients. Curr Oncol. 2021;28(1):346-366. PubMed
21.Vitrakvi (larotrectinib): 25 mg and 100 mg capsules, 20 mg/mL oral solution [product monograph]. Mississauga (ON): Bayer Inc; 2019 Jul 4.
22.Drug Reimbursement Review sponsor submission: Vitrakvi (larotrectinib) for treatment of adult and pediatric patients with solid tumours that have NTRK gene fusion, 25 mg and 100 mg capsules, 20 mg/mL solution [internal sponsor's package]. Mississauga (ON): Bayer Inc; 2020 Nov 13.
23.pan-Canadian Oncology Drug Review final clinical guidance report: larotrectinib (Vitrakvi) for neurotrophic tyrosine receptor kinase (NTRK) positive solid tumours. Ottawa (ON): CADTH 2019: https://cadth.ca/sites/default/files/pcodr/Reviews2019/10159LarotrectinibNTRK%2BSolidTumours_fnCGR_REDACT_Post_31Oct2019_final.pdf. Accessed 2021 Feb 1.
24.Varni JW, Seid M, Kurtin PS. PedsQL™ 4.0: reliability and validity of the Pediatric Quality of Life Inventory version 4.0 generic core scales in healthy and patient populations. Med Care. 2001;39(8):800-812. PubMed
25.Hong DS, DuBois SG, Kummar S, et al. Larotrectinib in patients with TRK fusion-positive solid tumours: a pooled analysis of three phase 1/2 clinical trials. Lancet Oncol. 2020;21(4):531-540. PubMed
26.pan-Canadian Oncology Drug Review manufacturer submission: Vitrakvi (larotrectinib), 25 mg and 100 mg capsules, and 20 mg/mL solution. Mississauga (ON): Bayer Inc.; 2019 Feb 22.
27.Bayer Inc. additional information regarding Vitrakvi (larotrectinib) DRR review: efficacy and safety data update: ePAS5 data [internal sponsor's report]. Mississauga (ON): Bayer Inc.; 2021 Feb 23.
28.Rosen EY, Schram AM, Young RJ, et al. Larotrectinib demonstrates CNS efficacy in TRK fusion-positive solid tumors. JCO Precis Oncol. 2019;3. PubMed
29.Hetchman JF, Benayed R, Hyman DM, et al. Pan-TRK immunohistochemistry is an efficient and reliable screen for the detection of NTRK fusions. Am J Surg Pathol. 2017;41(11):1547-1551. PubMed
30.Bazhenova L, Jiao X, Lokker A, et al. Cancers with NTRK gene fusions: molecularcharacteristics and prognosis. Clin Cancer Res. 2020;26(12 Suppl 1).
31.Drilon A, Laetsch TW, Kummar S, et al. Efficacy of larotrectinib in TRK fusion-positive cancers in adults and children. N Engl J Med. 2018;378(8):731-739. PubMed
32.Rosen EY, Goldman DA, Hechtman JF, et al. TRK fusions are enriched in cancers with uncommon histologies and the absence of canonical driver mutations. Clin Cancer Res. 2020;26(7):1624-1632. PubMed
33.Shaw AT, Yeap BY, Mino-Kenudson M, et al. Clinical features and outcome of patients with non-small-cell lung cancer who harbor EML4-ALK. J Clin Oncol. 2009;27(26):4247-4253. PubMed
34.Wang R, Hu H, Pan Y, et al. RET fusions define a unique molecular and clinicopathologic subtype of non-small-cell lung cancer. J Clin Oncol. 2012;30(35):4352-4359. PubMed
35.Bergethon K, Shaw AT, Ou SH, et al. ROS1 rearrangements define a unique molecular class of lung cancers. J Clin Oncol. 2012;30(8):863-870. PubMed
36.Center for Drug Evaluation Research. Multi-disciplinary review(s). Vitrakvi (larotrectinib) capsules. Company: BAYER HLTHCARE. Application No.: 210861 & 211710. Approval date: 11/26/2018 (FDA drug approval package). Silver Spring (MD): U. S. Food and Drug Administration (FDA); 2018: https://www.accessdata.fda.gov/drugsatfda_docs/nda/2018/210861Orig1s000_21171Orig1s000TOC.cfm. Accessed 2021 Mar 19.
37.Penault-Llorca F, Rudzinski ER, Sepulveda AR. Testing algorithm for identification of patients with TRK fusion cancer. J Clin Pathol. 2019;72(7):460-467. PubMed
38.Orbach D, Rey A, Cecchetto G, et al. Infantile fibrosarcoma: management based on the European experience. J Clin Oncol. 2010;28(2):318-323. PubMed
39.Ferrari A, De Salvo GL, Brennan B, et al. Synovial sarcoma in children and adolescents: the European Pediatric Soft Tissue Sarcoma Study Group prospective trial (EpSSG NRSTS 2005). 2015;26(3):567-572.
40.Lassaletta A, Scheinemann K, Zelcer SM, et al. Phase II weekly vinblastine for chemotherapy-naïve children with progressive low-grade glioma: a Canadian Pediatric Brain Tumor Consortium Study. J Clin Oncol. 2016;34(29):3537-3543. PubMed
41.Guerreiro Stucklin AS, Ryall S, Kukuoka K, et al. Alterations in ALK/ROS1/NTRK/MET drive a group of infantile hemispheric gliomas. Nat Commun. 2019;10(1):4343. PubMed
42.Clark MA, Fisher C, Judson I, Thomas JM. Soft-tissue sarcomas in adults. N Engl J Med. 2005;353(7):701-711. PubMed
43.Hemming M, Heinrich M, Bauer S, George S. Translational insights into gastrointestinal stromal tumor and current clinical advances. Ann Oncol. 2018;29(10):2037-2045. PubMed
44.Wu Y-L, Planchard D, Lu S, et al. Pan-Asian adapted clinical practice guidelines for the management of patients with metastatic non-small-cell lung cancer: a CSCO–ESMO initiative endorsed by JSMO, KSMO, MOS, SSO and TOS. Ann Oncol. 2019;30(2):171-210. PubMed
45.McGowan J, Sampson M, Salzwedel DM, Cogo E, Foerster V, Lefebvre C. PRESS Peer Review of Electronic Search Strategies: 2015 guideline statement. J Clin Epidemiol. 2016;75:40-46. PubMed
46.Grey matters: a practical tool for searching health-related grey literature. Ottawa (ON): CADTH; 2019: https://www.cadth.ca/grey-matters. Accessed 2020 Dec 1.
47.Doebele RC, Davis LE, Vaishnavi A, et al. An oncogenic NTRK fusion in a patient with soft-tissue sarcoma with response to the tropomyosin-related kinase inhibitor LOXO-101. Cancer Discov. 2015;5(10):1049-1057. PubMed
48.Hyman DM, Laetsch TW, Kummar S, et al. The efficacy of larotrectinib (LOXO-101), a selective tropomyosin receptor kinase (TRK) inhibitor, in adult and pediatric TRK fusion cancers. J Clin Oncol. 2017;35(Suppl 18):LBA2501.
49.Lassen UN, Albert CM, Kummar S, et al. Larotrectinib efficacy and safety in TRK fusion cancer: An expanded clinical dataset showing consistency in an age and tumor agnostic approach. Ann Oncol. 2018;29(Suppl 8):viii133.
50.Hong DS, Bauer TM, Lee JJ, et al. Larotrectinib in adult patients with solid tumours: a multi-centre, open-label, phase I dose-escalation study. Ann Oncol. 2019;30(2):325-331. PubMed
51.DuBois SG, Laetsch TW, Federman N, et al. The use of neoadjuvant larotrectinib in the management of children with locally advanced TRK fusion sarcomas. Cancer. 2018;124(21):4241-4247. PubMed
52.Halalsheh H, McCarville MB, Neel M, Reynolds M, Cox MC, Pappo AS. Dramatic bone remodeling following larotrectinib administration for bone metastasis in a patient with TRK fusion congenital mesoblastic nephroma. Pediatr Blood Cancer. 2018;65(10):e27271. PubMed
53.Laetsch TW, DuBois SG, Mascarenhas L, et al. Larotrectinib for paediatric solid tumours harbouring NTRK gene fusions: phase 1 results from a multicentre, open-label, phase 1/2 study. Lancet Oncol. 2018;19(5):705-714. PubMed
54.Bielack SS, Cox MC, Nathrath M, et al. Rapid, complete and sustained tumour response to the TRK inhibitor larotrectinib in an infant with recurrent, chemotherapy-refractory infantile fibrosarcoma carrying the characteristic ETV6-NTRK3 gene fusion. Ann Oncol. 2019;30(Suppl 8):viii31-viii35.
55.Nagasubramanian R, Wei J, Gordon P, Rastatter JC, Cox MC, Pappo A. Infantile fibrosarcoma with NTRK3-ETV6 fusion successfully treated with the tropomyosin-related kinase inhibitor LOXO-101. Pediatr Blood Cancer. 2016;63(8):1468-1470. PubMed
56.Ronsley R, Rassekh SR, Shen Y, et al. Application of genomics to identify therapeutic targets in recurrent pediatric papillary thyroid carcinoma. Cold Spring Harb Mol Case Stud. 2018;4(2):a002568. PubMed
57.Statistical analysis plan for integrated summary of efficacy and safety [internal sponsor's report]. In: Drug Reimbursement Review sponsor submission: Vitrakvi (larotrectinib) for treatment of adult and pediatric patients with solid tumours that have NTRK gene fusion, 25 mg and 100 mg capsules, 20 mg/mL solution. Mississauga (ON): Bayer Inc; 2020 Nov 13.
58.Committee for Medical Products for Human Use. Assessment report: Vitrakvi (larotrectinib). (European public assessment report). Amsterdam (NL): European Medicines Agency; 2019: https://www.ema.europa.eu/en/documents/assessment-report/vitrakvi-epar-public-assessment-report_en.pdf. Accessed 2021 Feb 1.
59.Kummar S, van Tilburg CM, Albert CM, et al. Quality of life of adults and children with TRK fusion cancer treated with larotrectinib compared to the general population [poster] [internal sponsor's report]. Presented at the ASCO Virtual Annual Meeting, May 29-31, 2020. In: Drug Reimbursement Review sponsor submission: Vitrakvi (larotrectinib) for treatment of adult and pediatric patients with solid tumours that have NTRK gene fusion, 25 mg and 100 mg capsules, 20 mg/mL solution. Mississauga (ON): Bayer Inc.; 2020 Nov 13.
60.Kummar S, van Tilburg CM, Albert CM, et al. Quality of life of adults and children with TRK fusion cancer treated with larotrectinib compared to the general population. J Clin Oncol. 2020;38(Suppl 15):3614.
61.Interim Clinical Study Report: LOXO-TRK-14001. A phase 1 study of the oral TRK inhibitor LOXO-101 in adult patients with solid tumors [internal sponsor's report]. San Francisco (CA): Loxo Oncology, Inc; 2017 Sep 25.
62.Interim Clinical Study: LOXO-TRK-15003. A phase 1/2 study of the oral TRK inhibitor LOXO-101 in pediatric patients with advanced solid or primary central nervous system tumors [internal sponsor's report]. Stamford (CT): Loxo Oncology, Inc; 2017 Dec 13.
63.Interim Clinical Study Report: LOXO-TRK-15002. A phase II basket study of the oral TRK inhibitor larotrectinib in subjects with NTRK fusion-positive tumors [internal sponsor's report]. Stamford (CT): Loxo Oncology, Inc; 2018 Jan 18.
64.Cocks K, King MT, Velikova G, et al. Evidence-based guidelines for interpreting change scores for the European Organisation for the Research and Treatment of Cancer Quality of Life Questionnaire Core 30. Eur J Cancer. 2012;48(11):1713-1721. PubMed
65.Osoba D, Rodrigues G, Myles J, Zee B, Pater J. Interpreting the significance of changes in health-related quality-of-life scores. J Clin Oncol. 1998;16(1):139-144. PubMed
66.EQRTC. EORTC Quality of life: FAQs. 2021; https://qol.eortc.org/faq/. Accessed 2021 Mar 19.
67.EORTC QLC-C30 scoring manual. Brussels (BE): EORTC; 2001: https://www.eortc.org/app/uploads/sites/2/2018/02/SCmanual.pdf. Accessed 2021 Mar 19.
68.Varni JW. The PedsQL Measurement Model for the Pediatric Quality of Life Inventory. 2021; http://www.pedsql.org/. Accessed 2021 Mar 19.
69.Varni JW, Burwinkle TM, Katz ER, Meeske K, Dickinson P. The PedsQL in pediatric cancer: reliability and validity of the Pediatric Quality of Life Inventory Generic Core Scales, Multidimensional Fatigue Scale, and Cancer Module. Cancer. 2002;94(7):2090-2106. PubMed
70.Snyder CF, Blackford AL, Sussman J, et al. Identifying changes in scores on the EORTC-QLQ-C30 representing a change in patients' supportive care needs. Qual Life Res. 2015;24(5):1207-1216. PubMed
71.Varni JW, Burwinkle TM, Seid M. The PedsQL as a pediatric patient-reported outcome: reliability and validity of the PedsQL Measurement Model in 25,000 children. Expert Rev Pharmacoecon Outcomes Res. 2005;5(6):705-719. PubMed
72.Chu Y, Yuan Y. A Bayesian basket trial design using a calibrated Bayesian hierarchical model. Clin Trials. 2018;15(2):149-158. PubMed
73.Statistical report: Bayesian hierarchical model for ORR of Vitrakvi (larotrectinib) for NTRK fusion cancer (ePAS4 analysis set) [internal sponsor's report]. In: Drug Reimbursement Review sponsor submission: Vitrakvi (larotrectinib) for treatment of adult and pediatric patients with solid tumours that have NTRK gene fusion, 25 mg and 100 mg capsules, 20 mg/mL solution. Mississauga (ON): Bayer Inc; 2020 Nov 13.
74.Vitrakvi (larotrectinib) - permutation analysis of all possible combinations of subsets of cohorts across clinical studies (ePAS4) [internal sponsor's report] In: Drug Reimbursement Review sponsor submission: Vitrakvi (larotrectinib) for treatment of adult and pediatric patients with solid tumours that have NTRK gene fusion, 25 mg and 100 mg capsules, 20 mg/mL solution. 2020 Nov 13.
75.Italiano A, Hong DS, Briggs A, et al. Growth modulation index (GMI) of larotrectinib versus prior systemic treatments for TRK fusion cancer patients [poster] [internal sponsor's report]. In: Drug Reimbursement Review sponsor submission: Vitrakvi (larotrectinib) for treatment of adult and pediatric patients with solid tumours that have NTRK gene fusion, 25 mg and 100 mg capsules, 20 mg/mL solution. Mississauga (ON): Bayer Inc; 2020 Nov 13.
76.Italiano A, Hong DS, Briggs A, et al. Growth modulation index (GMI) of larotrectinib versus prior systemic treatments for TRK fusion cancer patients [abstract]. Ann Oncol. 2020;31(Suppl 4):S473-S474. https://www.annalsofoncology.org/action/showPdf?pii=S0923-7534%2820%2940652-0. Accessed 2021 Feb 8.
77.Cunanan KM, Iasonos A, Shen R, Gönen M. Variance prior specification for a basket trial design using Bayesian hierarchical modeling. Clin Trials. 2018;16(2):142-153. PubMed
78.Murphy P, Glynn D, Dias S, et al. Modelling approaches for histology-independent cancer drugs to inform NICE appraisals. York (GB): Centre for Reviews and Dissemination, Centre for Health Economics, University of York; 2020.
79.Larotrectinib for treating NTRK fusion-positive solid tumours (Technology appraisal guidance TA630). London (GB): National Institute for Health and Care Excellence; 2020: https://www.nice.org.uk/guidance/ta630/resources/larotrectinib-for-treating-ntrk-fusionpositive-solid-tumours-pdf-82609071004357. Accessed 2021 Feb 8.
80.Von Hoff DD. There are no bad anticancer agents, only bad clinical trial designs--twenty-first Richard and Hinda Rosenthal Foundation Award Lecture. Clin Cancer Res. 1998;4(5):1079-1086. PubMed
81.Kovalchik S, Mietlowski W. Statistical methods for a phase II oncology trial with a growth modulation index (GMI) endpoint. Contemp Clin Trials. 2011;32(1):99-107. PubMed
82.Pharmacoeconomic evaluation [internal sponsor's report]. In: Drug Reimbursement Review sponsor submission: Vitrakvi (larotrectinib) for treatment of adult and pediatric patients with solid tumours that have NTRK gene fusion, 25 mg and 100 mg capsules, 20 mg/mL solution. Mississauga (ON): Bayer Inc; 2020 Nov 13.
83.Larotrectinib efficacy and safety in TRK fusion cancer: an expanded clinical dataset showing consistency in an age and tumor agnostic approach [slides]. In: pan-Canadian Oncology Drug Review manufacturer submission: Vitrakvi (larotrectinib), 25 mg and 100 mg capsules, and 20 mg/mL solution. Mississauga (ON): Bayer Inc.; 2019 Feb 22.
84.Activity of larotrectinib in TRK fusion cancer patients with brain metastases or primary central nervous system tumors [slides]. In: pan-Canadian Oncology Drug Review manufacturer submission: Vitrakvi (larotrectinib), 25 mg and 100 mg capsules, and 20 mg/mL solution. Mississauga (ON): Bayer Inc.; 2019 Feb 22.
85.Bayer’s feedback on pERC initial recommendation on larotrectinib (Vitrakvi) for Neurotrophic Tyrosine Receptor Kinase (NTRK) locally advanced or metastatic solid tumours [additional sponsor's information]. In: pan-Canadian Oncology Drug Review manufacturer submission: Vitrakvi (larotrectinib), 25 mg and 100 mg capsules, and 20 mg/mL solution Mississauga (ON): Bayer Inc; 2019 Feb 22.
86.Bayer Inc. response to pCODR checkpoint meeting questions on larotrectinib for the treatment of patients with locally advanced or metastatic TRK fusion cancer [additional sponsor's information]. Mississauga (ON): Bayer Inc.; 2019 Jun 5.
87.Texier M, Rotolo F, Ducreux M, Bouché O, Pignon J-P, Michiels S. Evaluation of treatment effect with paired failure times in a single-arm phase II trial in oncology. Comput Math Methods Med. 2018;2018:1672176. PubMed
88.Hobbs BP, Landin R. Bayesian basket trial design with exchangeability monitoring. Stat Med. 2018;37(25):3557-3572. PubMed
89.Belin L, Kamal M, Mauborgne C, et al. Randomized phase II trial comparing molecularly targeted therapy based on tumor molecular profiling versus conventional therapy in patients with refractory cancer: cross-over analysis from the SHIVA trial. Ann Oncol. 2017;28(3):590-596. PubMed
90.Penel N, Demetri G, Blay J, et al. Growth modulation index as metric of clinical benefit assessment among advanced soft tissue sarcoma patients receiving trabectedin as a salvage therapy. Ann Oncol. 2012;24(2):537-542. PubMed
91.Von Hoff DD, Stephenson Jr JJ, Rosen P, et al. Pilot study using molecular profiling of patients’ tumors to find potential targets and select treatments for their refractory cancers. J Clin Oncol. 2010;28(33):4877-4883. PubMed
92.Mick R, Crowley JJ, Carroll RJ. Phase II clinical trial design for noncytotoxic anticancer agents for which time to disease progression is the primary endpoint. Control Clin Trials. 2000;21(4):343-359. PubMed
93.Cousin S, Blay J, Bertucci F, et al. Correlation between overall survival and growth modulation index in pre-treated sarcoma patients: a study from the French Sarcoma Group. Ann Oncol. 2013;24(10):2681-2685. PubMed
94.Buyse M, Quinaux E, Hendlisz A, Golfinopoulos V, Tournigand C, Mick R. Progression-free survival ratio as end point for phase II trials in advanced solid tumors. J Clin Oncol. 2011;29(15):e451-e452. PubMed
95.pCODR Expert Review Committee (pERC) final recommendation: larotrectinib (Vitrakvi). Ottawa (ON): CADTH; 2019: https://www.cadth.ca/larotrectinib-neurotrophic-tyrosine-receptor-kinase-ntrk-locally-advanced-or-metastatic-solid. Accessed 2021 Mar 17.
96.Bazhenova L, Lokker A, Snider J, al. e. VOYAGER-1 analysis: co-occurrence of NTRK fusions with other genomic biomarkers. TRK fusion cancer: patient characteristics and survival analysis in the real-world setting [internal sponsor's report]. In: Drug Reimbursement Review sponsor submission: Vitrakvi (larotrectinib) for treatment of adult and pediatric patients with solid tumours that have NTRK gene fusion, 25 mg and 100 mg capsules, 20 mg/mL solution. Mississauga (ON): Bayer Inc; 2020 Nov 13.
97.Observational Study Report: (VOYAGER-2). NTRK gene fusion-positive cancers: frequency, molecular characteristics, and survival analysis using a genomics England research database [internal sponsor's report]. Leverkusen (DE): Bayer AG; 2020 Oct 16.
98.MDACC study: Cancers with NTRK gene fusions [internal sponsor's report]. In: Drug Reimbursement Review sponsor submission: Vitrakvi (larotrectinib) for treatment of adult and pediatric patients with solid tumours that have NTRK gene fusion, 25 mg and 100 mg capsules, 20 mg/mL solution. Mississauga (ON): Bayer Inc; 2020 Nov 13.
99.Giesinger JM, Kieffer JM, Fayers PM, et al. Replication and validation of higher order models demonstrated that a summary score for the EORTC QLQ-C30 is robust. J Clin Epidemiol. 2016;69:79-88. PubMed
100.Davda J, Kibet H, Achieng E, Atundo L, Komen T. Assessing the acceptability, reliability, and validity of the EORTC Quality of Life Questionnaire (QLQ-C30) in Kenyan cancer patients: a cross-sectional study. J Patient Rep Outcomes. 2021;5(1):4. PubMed
101.Luo N, Fones CS, Lim SE, Xie F, Thumboo J, Li SC. The European Organization for Research and Treatment of Cancer Quality of Life Questionnaire (EORTC QLQ-c30): validation of English version in Singapore. Qual Life Res. 2005;14(4):1181-1186. PubMed
102.Bedard G, Zeng L, Zhang L, et al. Minimal important differences in the EORTC QLQ-C30 in patients with advanced cancer. Asia Pac J Clin Oncol. 2014;10(2):109-117. PubMed
Appendix 1: Literature Search Strategy
Clinical Literature Search
Overview
Interface: Ovid
Databases:
MEDLINE All (1946-present)
Embase (1974-present)
Note: Subject headings and search fields have been customized for each database. Duplicates between databases were removed in Ovid
Date of search: December 10, 2020
Alerts: Weekly search updates until project completion
Study types: No filters were applied to limit retrieval by study type
Limits:
Publication date limit: None
Language limit: None
Conference abstracts: Excluded
Syntax | Description |
|---|---|
/ | At the end of a phrase, searches the phrase as a subject heading |
MeSH | Medical Subject Heading |
exp | Explode a subject heading |
* | Before a word, indicates that the marked subject heading is a primary topic; or, after a word, a truncation symbol (wildcard) to retrieve plurals or varying endings |
# | Truncation symbol for 1 character |
adj# | Requires terms to be adjacent to each other within # number of words (in any order) |
.ti | Title |
.ab | Abstract |
.hw | Heading word; usually includes subject headings and controlled vocabulary |
.kf | Author keyword heading word (MEDLINE) |
.kw .ot | Author keyword (Embase) Original title |
.pt .dq | Publication type Candidate term word (Embase) |
.nm | Name of substance word |
.rn | Registry number |
medall | Ovid database code: MEDLINE All, 1946 to present, updated daily |
oemezd | Ovid database code; Embase, 1974 to present, updated daily |
Multi-Database Strategy
Search strategy:
(Vitrakvi* or larotrectinib* or arry470 or arry-470 or loxo101 or loxo-101 or PF9462I9HX or RDF76R62ID).ti,ab,kf,ot,hw,nm,rn.
1 use medall
*larotrectinib/ or (Vitrakvi* or larotrectinib* or arry470 or arry-470 or loxo101 or loxo-101).ti,ab,kw,dq.
3 use oemezd
4 not (conference review or conference abstract).pt.
2 or 5
remove duplicates from 6
Clinical Trials Registries
ClinicalTrials.gov
Produced by the US National Library of Medicine. Targeted search used to capture registered clinical trials.
Search terms: Vitrakvi/larotrectinib
WHO ICTRP
International Clinical Trials Registry Platform, produced by the World Health Organization. Targeted search used to capture registered clinical trials.
Search terms: Vitrakvi/larotrectinib
Health Canada’s Clinical Trials Database
Produced by Health Canada. Targeted search used to capture registered clinical trials.
Search terms: Vitrakvi/larotrectinib
EU Clinical Trials Register
European Union Clinical Trials Register, produced by the European Union. Targeted search used to capture registered clinical trials.
Search terms: Vitrakvi/larotrectinib
Canadian Cancer Trials
Produced by the Canadian Partnership Against Cancer Corporation. Targeted search used to capture registered clinical trials.
Search terms: Vitrakvi/larotrectinib
Grey Literature
Search dates: November 30, 2020 – December 11, 2020
Keywords: Vitrakvi/larotrectinib, neurotrophic tyrosine receptor kinase (NTRK)
Limits: Publication years: none
Updated: Search updated prior to the completion of stakeholder feedback period
Relevant websites from the following sections of the CADTH grey literature checklist Grey Matters: A Practical Tool For Searching Health-Related Grey Literature (https://www.cadth.ca/grey-matters) were searched:
Health Technology Assessment Agencies
Health Economics
Clinical Practice Guidelines
Drug and Device Regulatory Approvals
Advisories and Warnings
Drug Class Reviews
Clinical Trials Registries
Databases (free)
Internet Search
Open Access Journals
Appendix 2: Excluded Studies
No studies were identified from the literature search as meeting the protocol-specified inclusion criteria for the systematic review.
Appendix 3: Summary of Original CADTH pCODR Report for Larotrectinib for NTRK-Positive Solid Tumours
Note that this appendix has not been copy-edited.
Aim
In the original CADTH pCODR clinical report for larotrectinib for NTRK-positive solid tumours, the same 3 clinical which provided pooled data for the basis of this resubmission were reviewed and critically appraised; LOXO-TRK-14001, LOXO-TRK-15002, and LOXO-TRK-15003.23 Sponsor’s submission to Health Canada was based on an early data cut-off (the ePAS dataset; 19-February-2018 data cut-off) with a smaller number of patients (n = 73). The original submission to CADTH was based on the integrated dataset (July 30, 2018, data cut-off) with 122 patients that consisted of patients from the ePAS plus 49 larotrectinib-treated patients with NTRK gene fusions from supplementary datasets. The purpose of this appendix is to provide a summary of the results, the critical appraisal, and the conclusions from the original report.
Study Characteristics
The original CADTH pCODR review included the 3 ongoing, open-label, single-arm trials of larotrectinib in adult and pediatric patients with advanced or metastatic solid tumours: phase I adult dose-escalation and expansion trial (study LOXO-TRK-14001), phase I/II pediatric trial (study LOXO-TRK-15003; SCOUT trial), and phase II basket trial in adults and adolescents (study LOXO-TRK-15002; NAVIGATE trial).
Pooled Analyses
The CADTH pCODR submission for larotrectinib is based on a pooled analysis of efficacy and safety data from the 3 trials (LOXO-TRK-14001, LOXO-TRK-15003, and LOXO-TRK-14001). The pooled analyses included adult and pediatric patients who were enrolled across the 3 larotrectinib studies if they met the following criteria:
documented NTRK gene fusion as determined by local testing;
non-CNS primary tumour with 1 or more measurable lesions at baseline that could be assessed according to RECIST, version 1.1; and
received 1 or more doses of larotrectinib.
Pooled analyses were performed using multiple datasets that were created at 3 data cut-off dates:
Primary dataset (July 17, 2017, data cut-off) included the first 55 patients across the 3 studies (8 patients form LOXO-TRK-14001, 12 patients from SCOUT, and 35 patients from NAVIGATE) who met the inclusion criteria for the pooled analysis. This dataset comprised the FDA submission and was initially published on February 22, 2018.
Extended primary dataset (19-February-2018 data cut-off) included an additional 18 patients (9 patients from SCOUT, and 9 patients from NAVIGATE) who met inclusion criteria for the pooled analysis. A total of 73 patients with NTRK gene fusions were analyzed at this data cut-off date. The results of the extended primary analysis were submitted to Health Canada for regulatory review.
Supplementary dataset (July 30, 2018, data cut-off): included an additional 49 patients across the 3 studies (2 patients form LOXO-TRK-14001, 16 patients from SCOUT, and 31 patients from NAVIGATE).
Integrated dataset (July 30, 2018, data cut-off) consists of 122 patients from the Extended primary and supplementary datasets, combined; i.e., larotrectinib-treated patients with NTRK gene fusions, who had their outcomes assessed by the investigator.
Safety dataset (July 30, 2018, data cut-off) encompasses the entire larotrectinib safety database (n = 207), which includes 122 patients with NTRK gene fusion cancer and 70 patients without confirmed NTRK gene fusions.
The original CADTH pCODR review was mainly focused on the latest provided dataset that consisted of 122 larotrectinib-treated patients with NTRK gene fusions, who had their outcomes assessed by the investigator (Integrated dataset; July 30, 2018, data cut-off). The reported pooled OS analysis was based on the 19-February-2018 data cut-off (extended primary analysis set; n = 73), as the OS results were not available from the integrated analysis. A summary of the efficacy and safety results from the integrated pooled analysis are presented in Table 38.
Results
Efficacy
ORR: As of the July 30, 2018, data cut-off date, ORR was 81% (95% CI, 72% to 88%); 17% of patients achieved a CR and 63% achieved a PR. The median time to response was 1.8 months. At the data cut-off, 84% of responding patients (73% of all patients) remained on treatment or had undergone surgery with curative intent.21,83
ORR was consistent across all subgroups based on baseline disease characteristics (ECOG status and metastatic cancer status), and number of prior treatment regimens. However, the subgroup analyses of ORR also indicated that ORR results varied across patient age groups, tumour types, and NTRK gene fusion or major NTRK isoforms (See section 6; Tables 6.5, 6.6, and 6.7).21 The submitted pooled efficacy analysis excluded adult and pediatric patients who had primary CNS tumours. However, the efficacy of larotrectinib in patients with CNS tumours was analyzed separately. In the subgroup of patients with primary CNS tumours (n = 18), ORR was estimated to be 36% (95% CI, 13% to 65%); with CR in 14% to PR in 21% to and stable disease in 64% of the patients.84
DOR: As of the July 30, 2018, data cut-off date, the median duration of response had not been reached. The percentage of patients with an ongoing response was 88% at 6 months, and 75% at 12 months from the start of response.21,83
PFS: At the July 30, 2018, data cut-off date, after a 19.6-month median duration of follow-up, the median PFS was 28.3 months (95% CI, 9.9 to NE). In their report, the sponsor acknowledged that this estimate was “not statistically stable due to a low number of progression events, as evidenced by the wide confidence interval.”21
In the feedback received from the sponsor on the initial pERC recommendation, progression-free survival ratio (PFSr), defined as the ratio at the PFS under line +2 (PFS2) divided by the PFS at line +1 (PFS1), was considered as a “direct intra-patient evaluation of treatment benefit.” Based on the sponsor’s feedback, a PFS2/PFS1 ratio >1.3 would be indicative of a clinically meaningful treatment effect.80 It was reported in the feedback document that, although PFS was ongoing for many patients treated with larotrectinib in the ePAS (n = 73), 65% of these patients had attained a PFSr ≥ 1.3.85
OS: The OS results are not available from the integrated analysis. In an earlier analysis performed at the 19-February-2018 data cut-off (ePAS; n = 73), 86% of patients were alive and 14% had died. After a median follow-up of 14.8 months, the median OS had not been reached. At 12 months, the probability of survival was estimated to be 90%.21
Quality of Life
HRQoL and health utilities were exploratory end points in the LOXO-TRK-15003 and LOXO-TRK-15002 trials. PROs were not measured in the LOXO-TRK 14001 trial.
As of 30-July 2018 data cut-off date, 57 patients had completed questionnaires at baseline and at least 1 post-baseline follow-up visit: 40 adult patients for EORTC QLQ-C30/EQ-5D-5L and 17 pediatric patients ≥2 years of age for PedsQL.59
As of 30-July 2018 data cut-off date, 57 patients had completed questionnaires at baseline and at least 1 post-baseline follow-up visit: 40 adult patients for EORTC QLQ-C30/EQ-5D-5L and 17 pediatric patients ≥2 years of age for PedsQL EORTC QLQ-C30: Of the 40 adult patients who completed EORTC QLQ-C30 questionnaire, 70% had an improvement in GHSs, with 60% reporting improvements that reached or exceeded the sponsor-identified MID of 10 points. Among evaluable patients, 41% had an improvement in EORTC QLQ-C30 GHS that lasted for at least 2 consecutive cycles. EORTC QLQ-C30 global health score improvements were reported for all tumour types.59
EQ-5D-5L: Of the 40 adult patients who completed EQ-5D-5L questionnaire, 73% had and improvement in VAS health score, with 60% reporting a post-baseline score that reached or exceeded the sponsor-identified MID of 10 points. Among evaluable patients, 51% had an improvement in VAS health score that lasted for at least 2 consecutive cycles.59
PedsQL-Core: Of the 17 pediatric patients who completed PedsQL-Core questionnaire, 88% had improvement in PedsQL total scores, with 76% reporting a best post-baseline score that reached or exceeded the sponsor-identified MID of 4.5 points. Among evaluable patients, 65% reported improvements that lasted for at least 2 consecutive cycles. PedQL total score improvements were observed across tumour types.59
Harms Outcomes
As of the July 30, 2018, data cut-off date, a total of 207 patients were included in the safety analysis dataset. The majority of the reported AEs were grade 1 or 2. Treatment-related grade 3 or 4 AEs occurred in less than 5% of patients. The most common grade 3/4 AEs included anemia, increase in liver enzyme (ALT and AST) levels, and nausea. Eleven out of the 122 patients (9%) in the integrated analysis set required dose reductions due to AEs, and all maintained tumour regression on a reduced dose.21,83 Two patients discontinued larotrectinib due to an AE.86
Table 38: Highlights of Key Outcomes From the Pooled Analysis in the Original CADTH pCODR Submission of the NTRK trials (LOXO-TRK-14001, 15002, and 15003)
Highlight | Integrated analysis (N = 122)a |
|---|---|
Efficacy | |
Primary efficacy end point | |
ORR, % (95% CI) | 81 (72 to 88) |
Key secondary efficacy end points, months | |
TTR, median | 1.8 |
DOR, median (range) | NE (NE to NE) |
PFS, median (95% CI) | 28.3 (9.9 to NE) |
OS, median (95% CI) | NE (NE to NE) |
12-month OS rate, % (95% CI) | 90 (NA to NA)b |
Safety end points | |
Treatment-related grade 3/4 AEs | < 5%c |
Dose reductions due to AEs | 11 (9%)a |
Withdrawal due to AEs | 2 (< 2%)a |
AEs = adverse events; CI = confidence interval; DOR = duration of response; HRQoL = health-related quality of life; MID = minimally important difference; NA= not available; NE= not estimable; ORR = overall response rate; OS = overall survival; PFS = progression-free survival; TTR = time to response.
aJuly 30, 2018, data cut-off (Integrated dataset; n = 122)
b19-February-2018 data cut-off (ePAS; n = 73)
cJuly 30, 2018, data cut-off (Safety dataset; n = 207)
Source: Original CADTH pCODR clinical report.23
Summary of Critical Appraisal
Limitations of the Submitted Pooled Analysis:
Focus on Molecular Profiling
NTRK gene fusions can occur in various tumour types with different natural histories. The primary objective of the included single-arm trials and that of the submitted integrated analysis was not to determine the effect of the drug separately in each tumour type. The treatment effect was rather estimated irrespective of histological tumour type. In other words, an assumption was made by the investigators that the presence of a NTRK gene fusion was sufficient to evaluate the effect of larotrectinib in all relevant tumour types.
Scarcity of Historical Data
The sponsor acknowledged that there was no literature that demonstrated the impact of NTRK gene fusion proteins on patients’ outcomes across tumour types.21 An independent literature search that was conducted by the CADTH pCODR review team was also unable to find studies with acceptable methodological quality that investigated the effects of current standard of care in NTRK-positive solid tumours. NTRK gene fusions are rare and the natural history of the disease has not been well characterized to date.
In addition, there was a lack of data on comparative efficacy and safety for tumour types that have relevant comparators available. VOYAGER-1 is a retrospective cohort study that uses secondary data to study the patient characteristics and clinical outcomes in cancer patients with NTRK gene fusion and those in cancer patients without NTRK mutations who received current standard of care in a real-world setting. However, as the study was ongoing at the time of the original submission, outcome results were not currently available.21
Heterogeneity in Design Elements of Studies Included in the Pooled Analysis
Interpretation of pooled analysis results remained difficult in the presence of between-study heterogeneity:
Different phased studies: Given the rare nature of NTRK fusion–positive solid tumours and methodological challenges, the sponsor rationalized that the conduct of a randomized trial was not feasible.21,36 Therefore, the submitted data were pooled from 3 single-arm trials: a phase I adult trial (LOXO-TRK 14001), a phase I/II pediatric trial (LOXO-TRK-15003), and a phase II basket trial (LOXO-TRK-15002) in adults and adolescents. The phase II part of the LOXO-TRK-15002, investigating long-term safety and efficacy of larotrectinib in pediatric patients was ongoing and results were yet to be published at the time of the original submission.
Different primary outcomes: The primary objective of the dose-escalation phases of the LOXO-TRK 14001 and SCOUT studies was to determine the safety and tolerability of larotrectinib, while the primary objective of the NAVIGATE trial was to determine the efficacy of larotrectinib by measuring the BOR rate. The dose-expansion cohorts included in the LOXO-TRK 14001 and LOXO-TRK-15003 phase I trials were powered to detect a 30% or larger improvements in ORR, as their secondary study objective.
Different requirements for outcome measurement: In the LOXO-TRK-14001 and LOXO-TRK-15003 trials, ORR was assessed by the investigator using RECIST v1.1 or RANO criteria, as appropriate to tumour type; whereas in the LOXO-TRK-15002, ORR was determined by an independent radiology review committee using RECIST v1.1 or RANO criteria.
Different eligibility criteria: As mentioned earlier in this section LOXO-TRK 14001 included adult patients, LOXO-TRK-15003 ncluded pediatric and LOXO-TRK-15002 enrolled adults and adolescent patients. In addition, the presence of a confirmed NTRK fusion was mandated before enrolment in the NAVIGATE trial; while NTRK-positive status was not a requirement for eligibility in the LOXO-TRK 14001 and LOXO-TRK-15002 trials. TRK gene fusions were rather identified prospectively in the 2 latter trials. These sources of heterogeneity in the patient selection criteria may introduce bias to the results of the pooled analysis.
Uncertainty Around the Pooled Analysis Results
The following limitations were considered when interpreting the pooled analysis results:
Pooled estimates of response versus survival outcomes: Due to the small sample size, there was uncertainty regarding the magnitude of the treatment effect of larotrectinib in any 1 histologic subtype of solid tumours with an activating NTRK rearrangement. The CGP agreed that the pooled ORR estimate for treatment effect was generalizable to all of the subgroups. However, pooling data across tumour types may lead to inflated type I error if the treatment effect is heterogenous across different tumour types.72 Subgroup analyses of data from the 3 larotrectinib trial (integrated analysis; n = 122) indicated that ORR results varied across tumour types. The reported ORR benefit ranged from 100% in thyroid cancer, gastrointestinal stromal tumour (GIST), and cellular congenital mesoblastic nephroma (CMN) down to 0% in appendix, pancreas and breast cancers, and cholangiocarcinoma (see Table 6.6 for more details). Additionally, imbalanced and small sample sizes for each tumour type could lead to inefficient tumour subgroup analyses, due to lack of statistical power. In the above-mentioned subgroup analysis, there was 1 patient enrolled in each of appendix, breast CMN and pancreas tumour subgroups.
Pooling data on survival outcomes (i.e., PFS and OS) could be even more problematic, if there is a variability in the PFS or OS across different tumour types. This is because traditional survival analysis methods such as Kaplan-Meier (KM) curves rely on the assumption that a single survival distribution can be used to estimate the survival of all study participants.
Novel methodological approaches have been proposed to improve the design and analysis of single-arm basket trials and account for potential heterogeneity of response rates across various tumour types. Limited information was available on the use of such methodology in the current review but was deemed non-disclosable by the sponsor.72,87-89
Ongoing nature of the included trials: All 3 larotrectinib trials were ongoing. The LOXO-TRK-14001 trial has stopped enrolment in 2017; however, NAVIGATE and SCOUT are still enrolling patients. Therefore, the results of the pooled analysis are subject to change as more data becomes available.
Risk of selection and immortal time biases: In the NAVIGATE trial, patients who did not have any radiological disease assessments after the initiation of larotrectinib would be replaced by new patients who had a documented disease assessment.31 It was not clear if the same criterion was used in the LOXO-TRK 14001 and SCOUT trials. Detailed patient disposition data are not available for the pooled analysis. However, based on the CONSORT flow diagram for the ePAS (n = 73; 19-February-2018 data cut-off), of the first 105 consecutively enrolled and treated patients (across all 3 trials, 20 patients were excluded from efficacy analysis due to insufficient follow-up to allow IRC assessment; 6 patients were excluded because they did not have a RECIST measurable disease at enrolment; and 6 additional patients were excluded due to primary CNS tumours).21 It was however not clear how many of these patients were replaced. Exclusion of patients with no disease assessment may have introduced bias by selecting patients who had a better compliance. In addition, patients must have survived until the first disease assessment visit to have a radiological disease assessment (immortal time bias).
Uncertainty around HRQoL data: In addition to the uncertainty in determining the magnitude of effect using pooled data from such a heterogenous population, the number of patients with available HRQoL data was low. The methods team therefore agreed that the HRQoL results are exploratory and should be interpreted with caution.
The Use of PFS Ratio (PFSr) as an Indicator of Clinical Efficacy
PFSr, also referred to in the literature as the GMI,90-92 is defined as the ratio of PFS on the last line of therapy (larotrectinib, in the case of the original CADTH pCODR review) to the PFS on the most recent prior line of therapy.
In the feedback received from the sponsor on the initial pERC recommendation, 65% of the larotrectinib-treated patients in the ePAS dataset were reported to have a PFSr equal to or greater than 1.3 (a threshold proposed by Von Hoff et al.91 as a sign of drug activity). The sponsor suggested that the PFSr comparison would help address pERC’s concerns of heterogeneity of tumour type.21
The methods team acknowledged that PFSr provides an intra-patient drug activity comparison between 2 consecutive lines of therapy in order to eliminate heterogeneity (between-patient variability). However, the following methodological limitations should be considered when interpreting the PFSr results reported for the pooled analysis of the larotrectinib trials:
The analysis of PFSr was not specified as a clinical end point in the included larotrectinib study protocols but was added as an exploratory, post hoc analysis to support the primary clinical efficacy findings.
All patients included in the larotrectinib trials (and in the pooled analyses) received their prior lines of therapy before enrolment in the study. As a result, data on PFS1 was most likely collected retrospectively. No information was provided in the study reports on the data collection procedures and missing data. It is not clear if the timing and frequency of disease assessment were consistent between larotrectinib therapy and the previous line of treatment; and if data on PFS1 was available for all enrolled patients. Overall, the risks of ascertainment and attrition biases could not be ruled out.
The methods team was unable to identify any studies that validated PFSr with other measures of clinical benefit (e.g., OS) in studies of drugs targeting NTRK gene fusions. Another methodological issue inherent to PFSr is that the use of this indicator to assess clinical benefit is dependent on the correlation between PFS1 and PFS2. For example, a patient with a good response to both larotrectinib and their previous line of therapy would attain a lower PFSr.93,94
Factors Limiting the External Validity of the Pooled Analysis
Other potential limitations of the pooled analysis included:
The larotrectinib trials included patients with NTRK-positive solid tumours regardless of their tumour type. However, not all solid tumour types were represented in the studies.
The pooled analysis excluded patients with primary CNS tumours.
The eligibility criteria for the 3 larotrectinib trials did not restrict the number of previous lines of systematic therapy.
Conclusion of Original CADTH pCODR Report
The original CADTH pCODR report concluded that from a histology-agnostic, biomarker-driven perspective, larotrectinib offers a clinical benefit in good performance status adult and pediatric patients with advanced solid tumours that harbour an NTRK gene fusion. The CGP acknowledged the various limitations associated with the available evidence and agree that the observed ORR are unprecedented across the wide spectrum of included tumour histologies.
In the absence of comparative evidence to understand the incremental magnitude of benefit associated with larotrectinib across the variety of tumour settings, the CGP agreed that there was likely more certainty of benefit among populations for whom the burden of illness and/or need for effective therapeutic agents is high. The CGP further acknowledged that this approach is supported by input from Registered Clinicians. Based on this, the CGP made the following 2 site-specific conclusions on the net clinical benefit of larotrectinib.
The intent of the 2 site-specific conclusions made by the CGP was not to contradict the CGP’s opinion supporting a tumour agnostic effect. It was a consequence of the limitations raised by the methods team with respect to absence of comparative evidence to analyze the incremental magnitude of benefit with larotrectinib among tumours where treatments were available; hence, the CGP offered site-specific conclusions based on unmet need and lack of alternative options for selected tumour types, prioritizing tumour types listed in Table 39. The CGP further noted that the reasons supporting the pERC initial recommendation limiting larotrectinib for NTRK gene fusions observed only in salivary gland tumours, STSs and pediatric patients with CMN or infantile fibrosarcoma remained unclear to the CGP.
The CGP conclusions also reiterated that it would be reasonable to provide reimbursement for larotrectinib for the treatment to all patients with NTRK fusion cancers who have either failed upfront therapy, have locally advanced disease not amenable to resection or have no alternative therapy with an acceptable toxicity profile.
Site-Specific Conclusions
The CGP concluded that there is a net clinical benefit to larotrectinib in the treatment of the following patient populations (see 40 below) based on the results of a pooled analysis which demonstrated a large and clinically significant benefit in ORR, a safe and tolerable toxicity profile and meaningful improvements in HRQoL in most patients. Given the poor prognosis of these patient populations and the lack of effective treatment options, the CGP agreed that patients will derive a meaningful net clinical benefit from treatment.
Furthermore, the CGP concluded that there is a net clinical benefit with the use of larotrectinib for pediatric patients with NTRK fusions, across all cancer types, who have metastatic or locally advanced disease, which is not amenable to surgical resection, or in whom no satisfactory alterative therapy is available. This was based on unprecedented response rates documented in the pediatric phase I/II trial of larotrectinib monotherapy, with minimal toxicity. It was also clear from parent / patient advocacy group and registered clinician input that the use of larotrectinib in the treatment of NTRK fusion pediatric cancers was fully supported and offers a true breakthrough in care.
Within the pediatric population, the CGP recommendation was for all NTRK driven advanced (relapsed/refractory or no alternative therapy) pediatric cancers specifically because there is a lack of available alternative options for these patients. Pediatric cancers overall have low mutation burden, and typically do not respond to immunotherapy agents. Similarly, there are few other targeted therapies with proven efficacy in pediatric cancer overall, but specifically NTRK fusion cancers typically lack other actionable molecular targets in pediatrics. Alternative conventional chemotherapy regimens are limited, and ineffective, in these patient groups. Access to larotrectinib may help avoid recurrent, invasive radical neck dissections and repeated exposure to radioactive iodine for young children with thyroid cancer, as it may also help avoid limb amputations in children with IFS or sarcoma. It may provide a treatment option to children with HGGs who are unable to received high-dose cranial radiation due to their young age.
Overall, there are no alternative commercially available NTRK inhibitors in Canada. Larotrectinib provides a safe, tolerable, and effective therapy for young patients without other therapy options. The possibility to benefit from larotrectinib is accessible even to very young patients due to its availability in a liquid formulation.
Table 39: Tumour Types Identified by the CGP Which Have a Net Clinical Benefit
Rationale | Included tumour types | Recommended systemic treatment approach in advanced disease |
|---|---|---|
Pediatric patients with NTRK-positive advanced solid cancers |
| Larotrectinib therapy should be considered as part of first-line therapy |
Adult patients with an NTRK-positive advanced solid cancers who have an unfavourable prognosis and limited therapy options |
| Larotrectinib therapy should be considered as part of first-line therapy |
| Larotrectinib therapy should be considered as part of first-line therapy | |
GIST – wild type (adult and pediatric) | Larotrectinib therapy should be considered as part of first-line therapy |
CMN = cellular congenital mesoblastic nephroma; GIST = gastrointestinal stromal tumour; HCC = hepatocellular carcinoma; IFS = infantile fibrosarcoma; MASC = mammary analogue secretory carcinoma; NTRK = neurotrophic tyrosine kinase receptor; SBC = secretory breast carcinoma; STS = soft tissue sarcoma.
Source: Original CADTH pCODR clinical report.23
The CGP concluded that there may be a net clinical benefit to larotrectinib in the treatment of the following patient populations (see Table 40) based on the results of a pooled analysis which demonstrated a large and clinically significant benefit in ORR, a safe and tolerable toxicity profile and meaningful improvements in QoL in most patients. However, the panel was unable to determine the magnitude of this clinical benefit given the availability of alternative treatment options for whom comparative evidence was unavailable.
Among the population of patients with cancers which have an alternative treatment option, the CGP reiterated that there may be a net clinical benefit. As an example, despite the availability of active agents, there is no known agent with an 80% response rate in lung cancer. The CGP agreed that patients should be permitted to access this highly active therapy given the lack of curable or highly effective options, including chemotherapy, immunotherapy, chemo-immuno-combinations. In addition, all other targeted therapies in lung cancer targeting EGFR, ALK and ROS1 have lower response rates and have demonstrated major activity and are superior to chemotherapy. Despite small numbers, a greater signal was seen in advanced lung cancer patients with TRK fusions.
Table 40: Tumour Types Identified by the CGP Which May Have a Net Clinical Benefit
Rationale | Included tumour types | Recommended systemic treatment approach in advanced disease |
|---|---|---|
Adult patients with an NTRK-positive advanced solid cancers, have relatively better prognosis and/or better alternative systemic therapy options |
| Larotrectinib therapy should be reserved as a second-line therapy and beyond until evidence supporting superiority over current first-line therapy is available |
| Larotrectinib therapy should be reserved as a second-line therapy and beyond until evidence supporting superiority over current first-line therapy is available |
CRC = colorectal cancer; GIST = gastrointestinal stromal tumour; MSI-H = microsatellite instability–high; MSS = microsatellite stable; NTRK = neurotrophic tyrosine kinase receptor SCC = squamous cell carcinoma; WT = wild-type.
Data Source: Original CADTH pCODR clinical report.23
In making these conclusions the CGP also considered:
the need for implementation of validated testing for NTRK gene fusions in at-risk patient groups.
The panel further recommends that careful consideration was to be given to reimbursement criteria so that patients who could potentially benefit from larotrectinib are not excluded. Specifically, the panel concluded that it was reasonable to provide reimbursement for larotrectinib for the treatment of all patients with NTRK fusion cancers who have either failed upfront therapy, have locally advanced disease not amenable to resection or have no alternative therapy with an acceptable toxicity profile, which may occur in the upfront setting.
Appendix 4: Summary of Real-World Evidence
Note that this appendix has not been copy-edited.
Aim
The purpose of this appendix is to summarize the RWE submitted by the sponsor in response to a number of key objections outlined in the pCODR Final Recommendation for larotrectinib (October 31, 2019). In the original submission for larotrectinib, pERC raised several uncertainties associated with the oncogenicity and natural history of larotrectinib, that were not addressed with any submitted evidence. In response, the sponsor submitted several real-world studies using genetic analysis that were used as supportive evidence for the above issues, which are discussed below.
NTRK Gene Fusion Is an Oncogenic Driver
Based on the statement below, pERC indicated that there was a lack of evidence as to whether or not the NTRK gene fusion is an oncogenic driver in all tumour types.
“pERC agreed that the limitations associated with the trial which had an impact on the interpretability of the results and the uncertainty as to whether or not the NTRK gene fusion is an oncogenic driver, could not be overcome.”95
TRK fusion proteins result from chromosomal rearrangements of human genes NTRK1, NTRK2, and NTRK3, which are involved in neuronal homeostasis during embryonic development. In normal cells, signalling for cellular function such as cell division/growth involves ligand activation of cellular machineries that carry out downstream cellular functions. The fusion of NTRK with another gene (a 5’ partner gene) results in ligand-independent, constitutive activation of TRK receptor signalling, making NTRK gene fusions oncogenic drivers. The sponsor submitted a number of pre-clinical studies, that showed the introduction of NTRK gene fusion as single gene constructs into normal or non-transformed cells have transformational activity, including tumourigenic capacity, demonstrating that TRK-fusion proteins can be considered oncogenic drivers.22 However, these pre-clinical studies will not be focused here, as these were done in cell culture and animal models. However, a pan-cancer analysis by Stransky et al. will be described below, as supporting evidence for the oncogenic driver function of TRK-fusion proteins.
Analysis From TCGA
Study overview: In 2014, Stransky et al.17 conducted a pan-cancer analysis of the transcriptomes of nearly 7,000 tumours from The Cancer Genome Atlas (TCGA) that was specifically targeted at kinase gene fusion events. The study was aimed to identify recurrent, potentially oncogenic fusions involving kinases. The investigators developed heuristics for reliably detecting gene fusion events in RNA-seq data, the details of which will not be focused here. Briefly, RNA-seq data from 20 solid tumour types in TCGA (6,893 samples) was analyzed and clinical data from all available tumour types were pulled. Fusions between any 2 genes were identified, false-positive and non-functional fusions were filtered out, and recurrent kinase fusions in normal samples were excluded from further analysis. Finally, all recurrent kinase fusions (n ≥ 2) were reviewed manually to identify putative oncogenic mutations with distinctive characteristics of functional kinase fusions (criteria for selection not described here).
Results: Overall, across 20 solid tumour types that were surveyed for recurrent gene fusion, the following pattern was observed (Figure 18). A total of 3.0% of the analyzed samples had recurrent kinase fusions (data not presented). Of the different recurrent kinase fusions, NTRK fusion was detected at a low frequency across multiple cancer types, including thyroid cancer, glioblastoma multiform (GBM), lung adenocarcinoma, skin cutaneous melanoma (SCM), brain low-grade glioma, colon adenocarcinoma, head and neck, squamous cell carcinoma, sarcoma, and breast invasive carcinoma (BIC). Notably, the role of NTRK fusion (specifically NTRK3) was known in certain cancer types, such as SCM, colon adenocarcinoma, and BIC (yellow coloured). For the rest, the role of 1 or more kinase genes in the particular cancer were unknown prior to this study, or the association of NTRK fusion in those cancers were first identified in this study. The analysis also showed that while kinase fusions (including NTRK fusion) were relatively rare, certain cancers had a high frequency of recurrent kinase fusions, most notably, thyroid cancer (63/498, 13%); whereas sarcoma had a very low frequency (1/103, 0.97%). Based on this analysis, the sponsor argued that NTRK fusion drives tumourigenesis in a small fraction of multiple cancers, regardless of tissue type.
Figure 18: Pattern of Recurrent Kinase Fusions in Solid Tumours
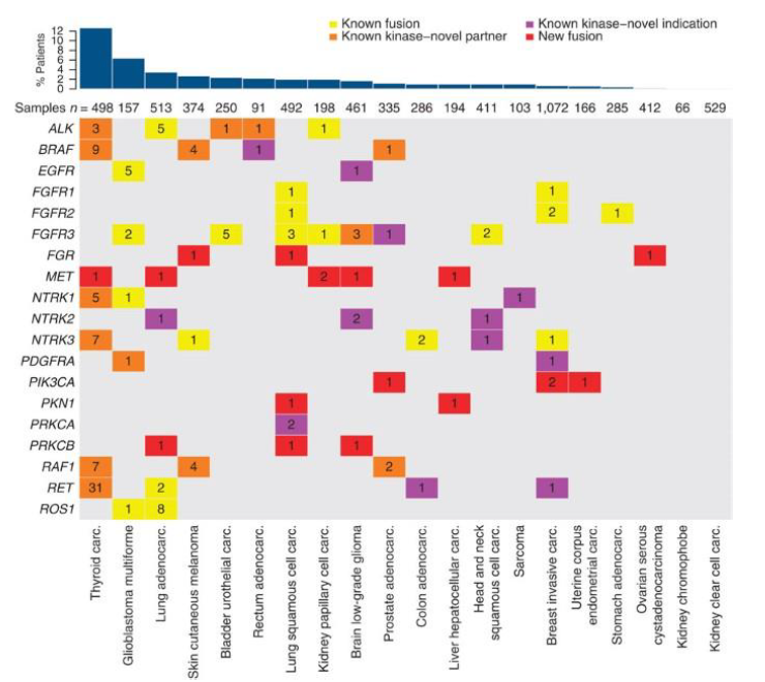
Source: Stransky N et al. The landscape of kinase fusions in cancer. Nat Commun. 2014;5:4846. Available from: https://doi.org/10.1038/ncomms5846 Used under Creative Commons licence (CC BY 4.0) (Attribution 4.0 International). CADTH doesn’t own this work and permission should be sought from the copyright owner.17
Lack of Natural History Evidence on Patients With NTRK Fusions
Based on the following statement, pERC indicated that there was a lack of natural history evidence on outcomes with available therapies in patients with NTRK fusion: “pERC first noted a lack of historical evidence to determine prognostic impact of the gene fusion.”95
In response, the sponsor included new natural history evidence of patients with TRK fusion cancer, that was previously unavailable at the time of the original submission, using data from 4 of the largest global oncology databases:
MSK Cancer Center study (~26,000 tumours)
VOYAGER-1 (Flatiron Health Foundation Medicine Clinico-Genomic database; sample of 15,971 patients)
VOYAGER-2 (Genomics England database; 15,223 patients)
Stransky et al. study (TCGA database; ~7,000 patients)
The sponsor used results from the 4 databases to demonstrate that NTRK fusion is mutually exclusive of other mutations in cancer, and that there is no prognostic benefit or deterioration associated with NTRK fusion. The following discussion will address each of these issues separately, using supporting results from the 4 databases.
NTRK Fusion Is Mutually Exclusive of Other Mutation Types
1. The TCGA study
The pan-cancer analysis by Stransky et al.17 described previously also assessed whether mutations in various kinases were mutually exclusive of each other across the different cancer types. Results are described below.
Results: This analysis was done in thyroid cancer, due to highest observed frequency of recurrent kinase fusions (63/498, 13%). As illustrated in Figure 19, all fusion events including ALK, BRAF, MET, NTRK1/3, RAF1 and RET were mutually exclusive in the 63 patients with thyroid cancer, since there was no overlap between the different mutations within the same individual/sample. The novelty of the gene fusion is denoted by different colours. The yellow and orange bars for NTRK fusions indicate that the role of these kinase fusions have been described previously in thyroid cancer; or at least 1 of the partner gene is novel.
Figure 19: Mutual Exclusivity of Fusions in Thyroid Cancer
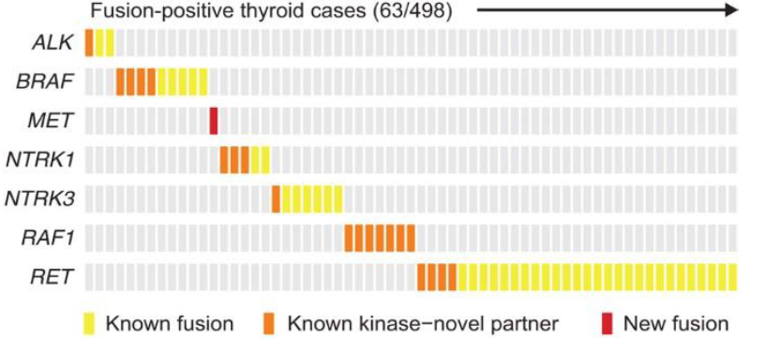
Source: Stransky N et al. The landscape of kinase fusions in cancer. Nat Commun. 2014;5:4846. Available from: https://doi.org/10.1038/ncomms5846 Used under Creative Commons licence (CC BY 4.0) (Attribution 4.0 International). CADTH doesn’t own this work and permission should be sought from the copyright owner.17
2. MSKCC Study
Study overview: In this prospective study, Rosen et al.32 investigated the demographic, clinical and genomic characteristics of TRK fusion–positive cancers using the Memorial Sloan Kettering (MSK) database, a screening program involving more than 26,000 prospectively sequenced pediatric and adult patients. Patients harbouring TRK fusions were identified on the basis of 2 sequencing methods: DNA-based hybrid-capture NGS or targeted RNA sequencing using anchored multiplex polymerase chain reaction technology (details not provided). All potential TRK-positive cases were manually reviewed to cross-check diagnostic accuracy with the sequencing methods, by ensuring a fusion transcript resulted from the fused TRK gene. Those who were identified as having TRK fusion by 1 method but not both were considered TRK-negative. In certain cases where the 2 methods above could not produce a definitive result, a third screening process was implemented, using pan-TRK immunohistochemistry. Patients with qualifying TRK fusion had their demographic, pathologic, and clinical data extracted from electronic medical record. Pathologic review was done by expert pathologists, and all surgical, radiologic, and medical therapies for disease as determined by treating physician were captured. analysis. Tumour mutation burden (TMB) was calculated and compared in all patients. Additionally, Wilcoxon Rank Sum and Fisher’s Exact test were used to determine the association between TRK fusion with TMB and any oncogenic driver, respectively. Notably, statistical comparison was made by excluding high levels of MSI colorectal patients as they were known to be enriched with TRK fusion.
Results: Overall, the prevalence of TRK fusions during the study period was 0.28% to representing 17 distinct tumour types.32 The tumour types enriched with TRK fusions included salivary (predominantly secretory carcinoma), thyroid, and sarcoma (prevalence 1%-5%). Other common tumour types with infrequent TRK fusions included colon, lung, melanoma, pancreas, breast cancer and glioma (prevalence < 1%). Of the TRK-positive cases, 45% had early and 55% had late-stage disease. Results support findings of the Stransky et al. study described above, demonstrating the presence of TRK fusion in certain types of cancer, albeit at a low prevalence.
Figure 1 (d) of Rosen et al.32 shows the co-mutational patterns in the TRK fusion–positive cases in which broader genomic profiling was available (65 out of 76 patients TRK fusion–positive cases) and TRK fusion–negative cases prospectively sequenced during the same period (25,989 cases). While 31.4% of TRK fusion–negative cases had co-mutations in select canonical MAPK pathway oncogenes, only 1.5% (representing 1 patient) co-mutation was observed in TRK fusion–positive cases. The difference was statistically significant (P < 0.001).
It should be noted that an earlier study by Hechtman et al.29 reported similar findings using the same MSK database, although the sample size was smaller (with 23 NTRK-positive cases). Therefore, this study will not be summarized in detail here. Nonetheless, the Hechtman et al. study also found that the occurrence of an NTRK gene fusion is mutually exclusive of other common driver mutations; 21 of the 23 NTRK-positive cases were negative for KRAS, NRAS, BRAF and other non-NTRK activating fusions (data not presented).29
Figure 1 (e) of Rosen et al.32 shows the comparison of TMB between TRK fusion–positive and negative cases. TMB refers to the number of somatic gene mutations present in a tumour; the higher the TMB, the more mutation present in the given tumour type. From the figure, it can be seen that TRK fusion–positive cancers had a statistically significantly lower TMB than TRK fusion–negative cancers (P < 0.001), indicating the presence of a TRK fusion was significantly associated with depletion of other oncogenic drivers. Exception to this finding was colorectal cancer (CRC) where TRK fusions co-occurred with high MSI (third bar on the right), a known feature of CRC. Nonetheless, excluding these MSI-H CRC cases, the TMB was lower in TRK fusion–positive cases than in TRK fusion–negative cases.
The authors further conducted longitudinal profiling of TRK fusions from 17 patients who had more than 1 tumour sample was available. Results showed TRK fusions were present in all sampled timepoints in 82% (14/17) of cases and persistent over time (data not presented). Based on this, the sponsor concluded that there is a persistence of NTRK gene fusion over time and that NTRK gene fusions are true drivers rather than passenger mutations.
3. VOYAGER-1 (Flatiron Health Foundation Medicine Clinico-Genomic Database)
Study overview: VOYAGER-1 was a retrospective natural history study, sponsor funded, that was aimed to evaluate the co-occurrence of NTRK gene fusion with other genomic biomarkers and overall survival (OS) of patients with NTRK fusion versus NTRK wild-type cancer in the real-world setting.30 The study included de-identified data from adult cancer patients from the Flatiron Health-Foundation Medicine Clinico-Genomic Database (CGDB) who had comprehensive genomic profiling (CGP) done in more than 280 cancer clinics across ~800 sites in the US. The de-identified CGDB was generated by linking the Flatiron Health electronic health record (EHR)-derived database with genomic data from the Foundation Medicine database.30 The CGDB included real-world clinical data, including data on clinical and demographic characteristics and treatment patterns, as well as genomic data, including data on tumour genomic properties and mutations, variant interpretations and therapy options. The presence of NTRK gene fusions and co-occurrence of the following biomarkers were determined: TMB, MSI, and functional alterations in ALK, BRAF, ERBB2, EGFR, ROS1 and KRAS genes.
Patients in the VOYAGER-1 study were stratified into 2 cohorts: cohort 1, consisting of patients with NTRK-positive cancer, and cohort 2, consisting of patients without any known NTRK gene alteration or likely functional significance, herein referred to as NTRK wild-type non-matched cohort. A subgroup of the cohort 2 patients were then matched with cohort 1 patients (4:1) based on following baseline patient characteristics, herein referred to as NTRK wild-type matched cohort: age, albumin, documented antineoplastic use, closest documented ECOG performance status, setting, and year of CGP report.
Results: A total of 15,971 samples were evaluable, out of 33,429 patients in the CGDB whose tumour type matched at least 1 patient with an NTRK gene fusion. There were 18 distinct tumour sites within this sample set. The NTRK-positive cohort 1 contained 29 patients, which was compared to a cohort of 12,456 patients with no NTRK gene alterations, i.e., cohort 2. Baseline characteristics such as demographics, clinical history, prior treatment will not be summarized here as these factors are not related to the issue of co-occurrence pattern.
Table 41 shows the co-occurring biomarkers in patients with and without NTRK gene fusions. Compared to cohort 2 or 3, patients in cohort 1 had lower percentage of co-occurring mutations in BRAF, EGFR, or KRAS, and no ALK rearrangements, ERBB2 amplifications, or ROS1 alterations. While high TMB and MSI was reported more in the NTRK-positive cohort proportionally, a separate analysis done by tumour site indicated most of these were found in patients with CRC, which tends to harbour NTRK fusion more often (data not presented).
Table 41: Co-occurring Biomarkers in Patients With and Without NTRK Gene Fusions
Co-occurring biomarkers,a n (%) | Cohort 1: NTRK fusion (n = 29) | Cohort 2 (non-matched): NTRK wild-type (n = 12,349) | Cohort 2 (matched): NTRK wild-type (n = 107) |
|---|---|---|---|
TMB status | |||
High (≥ 20 mut/mB) | 6 (20.7) | 654 (5.3) | 3 (2.8) |
Medium (< 20, ≥ 5.5 mut/mB) | 3 (10.3) | 3223 (26.1) | 16 (15.0) |
MSI-highb | 3/17 (17.6) | 93/7902 (1.2) | 1/59 (1.7) |
ALK rearrangement | 0 | 159 (1.3) | 3 (2.8) |
BRAF alteration | 1 (3.5) | 812 (6.6) | 8 (7.5) |
ERBB2 amplification | 0 | 468 (3.8) | 2 (1.9) |
EGFR alteration | 1 (3.5) | 956 (7.7) | 6 (5.6) |
ROS1 alteration | 0 | 90 (0.7) | 0 |
KRAS alteration | 3 (10.3)c | 4811 (39.0) | 25 (23.4) |
MSI – microsatellite instability; NTRK – neurotrophic tyrosine receptor kinase; TMB – tumour mutation burden.
aVariants of “known” or “likely” functional status were included, “ambiguous” and “unknown” were excluded.
bMSI status missing for 12 patients in Cohort 1, 4447 patients in Cohort 2 (non-matched), and 48 patients in Cohort 2 (matched).
cOne patient was subsequently reclassified as NTRK rearrangement rather than fusion.
Source: Bazhenova et al. VOYAGER-1 study96
Findings from the VOYAGER-1 study suggest that NTRK fusion in cancer patients is rare, and co-occurrence of NTRK fusion with other mutations in ALK, BRAF, ERBB2, EGFR, ROS1, or KRAS was uncommon. These results also indirectly point toward the oncogenicity of NTRK fusion since the presence of the gene fusion itself was the primary oncogenic driver in most cases.
4. VOYAGER-2 (Genomics England database)
Study overview: VOYAGER-2 was another retrospective natural history study, funded by the sponsor, and conducted much like the same way as VOYAGER-1, with a similar goal of identifying a research cohort of NTRK-positive and negative patients in the Genomics England database, to compare OS between matched cohorts, as well as to describe the co-occurrence of tumour-related genomic aberrations in selected biomarkers between matched cohorts.
In total, 15,223 cancer patients were included in the Genomics England database who had a whole genome sequence available for their tumour and diagnosed within the study time frame. Of these, 38 (0.25%) patients were NTRK-positive, 18 of which were matched to 72 non-NTRK gene fusion patients (a 1:4 ratio), based on tumour type (ICD-10), disease, histology, stage at diagnosis, sex, age at diagnosis, year of diagnosis and Charlson Comorbidity Index score. Details on matching process will not be focused here.
Results: Table 42 shows the co-occurring genomic aberrations of biomarkers in patients with and without NTRK gene fusions. Within this matched cohort, no NTRK-positive patients had a co-occurrence of the specified biomarkers, compared to NTRK-negative patients who had a co-occurrence of aberrations in BRAF, ERBB2, and KRAS. TMB high and MSI-high were both seen at a higher proportion in NTRK-positive patients compared to NTRK-negative patients. However, the authors reported the same analysis by cancer type, which showed that with the exception of CRC, TMB and MSI-high were much lower in NTRK-positive patients than NTRK-negative patients (data not presented). This suggests the results observed for TMB and MSI-high was entirely driven by patients with CRC.
The authors conducted an additional analysis with a randomized cohort, which supported findings of the main analysis, showing that the co-occurrence of the specified biomarkers remained rare in the NTRK-positive group (data not presented).
Table 42: Co-occurrence of Genomic Aberrations in Patients With and Without NTRK Gene Fusions
Co-occurring biomarkers, n (%) | NTRK fusion–positive (n = 18) | Non-NTRK gene fusion (n = 72) |
|---|---|---|
TMB status | ||
High (≥20 mut/mB) | 8 (44.4) | 13 (18.1) |
Medium (<20, ≥5 mut/mB) | 0 (0) | 5 (6.9) |
Low (<5 mut/mB) | 10 (55.6) | 54 (75) |
MSI-high (≥6) | 7 (38.9) | 12 (16.7) |
MSI-L/MSS (<6) | 11 (61.1) | 60 (83.3) |
ALK | 0 | 0 |
BRAF | 0 | 12 (16.7) |
ERBB2/HER2 | 0 | 1 (1.4) |
EGFR | 0 | 0 |
ROS1 | 0 | 0 |
KRAS | 0 | 12 (16.7) |
MSI – microsatellite instability; NTRK – neurotrophic tyrosine receptor kinase; TMB – tumour mutation burden.
Source: VOYAGER-2 study97
In conclusion, results from the VOYAGER-2 study showed that the co-occurrence of genomic aberrations in specified biomarkers was rare among NTRK-positive patients, a finding that was consistent with VOYAGER-1.
Evidence from all 4 of the submitted studies suggest the co-occurrence of NTRK fusions with other oncogenic mutations are rare, which also supports the notion that NTRK fusions appear to be an oncogenic driver, that render tumour growth independent of other genetic aberrations.
Natural History and Prognostic Value of TRK Fusion Cancer
In the original submission, pERC noted that there was a lack of historical evidence on outcomes with available therapies in patients with the NTRK fusion. In response, the sponsor submitted a number of additional analyses that were aimed at assessing the prognostic outcome of NTRK-positive cancers using some of the databases described above:
VOYAGER-1
VOYAGER-2
MD Anderson Cancer Center study
MSKCC study
1. VOYAGER-1 study
Study overview: An overview of the VOYAGER-1 study has been provided in the section above. One of the co-primary objectives of the study was to evaluate the OS in patients with and without NTRK fusion cancer, from the date of their CGP report. Cohort 1 consisted of 29 patients with NTRK-positive cancer, and cohort 2 included 12,456 patients with no NTRK alteration and with a tumour type seen in cohort 1 (NTRK wild-type). As well, a subgroup consisting of 107 cohort 2 patients was matched with 27 cohort 1 patients based on baseline patient characteristics (cohort 2, NTRK wild-type matched). A total of 55% and 66% of the cohort 1 and NTRK wild-type matched cohort 2 patients received at least 1 antineoplastic therapy, respectively. None of the patients with NTRK fusion received any TRK-specific therapy.
Results: The median OS in the NTRK fusion and matched wild-type cohort was similar, 12.5 and 16.5 months, respectively; with a HR of 1.44 (95% CI, 0.61 to 3.37) which was not significant (P =0.64), K-M plot showed non-proportional hazard (Figure 20). While the point estimate suggests a higher OS in NTRK-positive cancer patients, the lower end of the 95% is below 1.0, which does not indicate a potential survival benefit.
Figure 20: Kaplan-Meier Plot for OS Analysis
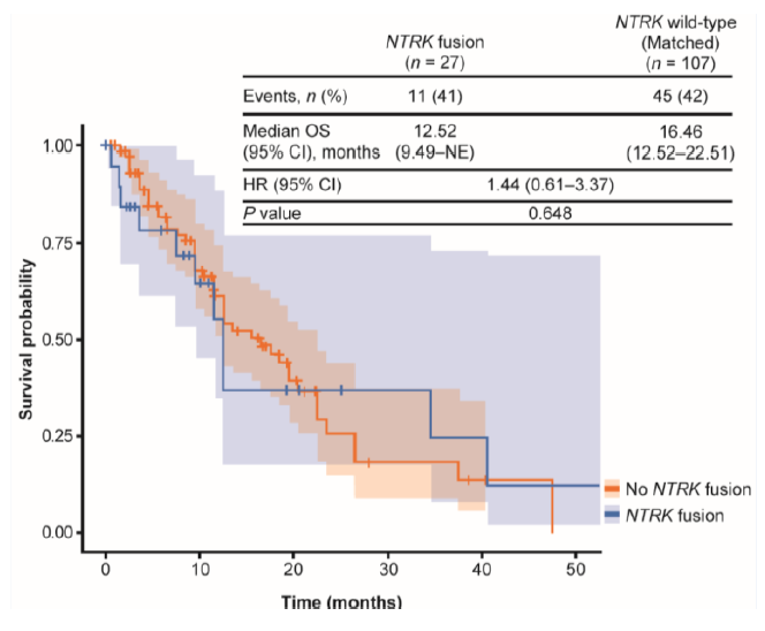
CI = confidence interval; HR = hazard ratio; NE = not evaluable; NTRK = neurotrophic tyrosine receptor kinase; OS = overall survival.
Source: Bazhenova et al. VOYAGER-1 study96
2. VOYAGER-2 study
Study overview: An overview of the VOYAGER-1 study has been provided previously in the section. One of the co-primary objectives of the study was to compare OS from the date of initial diagnosis between NTRK-positive and matched NTRK-negative patients. Clinical information for patients were available from Cancer Analysis System and/or Genomics England clinical tables, information on death was obtained from Office of National Statistics, and censoring was done based on end of the study time period or last record of activity in the database. OS was described as the median and proportion of patients alive at 1 year after diagnosis, and estimated by K-M product limit methods. Finally, a Cox proportional hazards model was used to assess the relationship between NTRK fusion status and survival.
Results: A total of 18 NTRK-positive patients were matched to 72 non-NTRK fusion patients. During the 4-year follow-up period, 8 deaths occurred in total; 2 in the NTRK-positive group and 6 in the NTRK-negative group. The median follow-up was roughly similar in the 2 groups, with 2.01 years and 2.28 years in the NTRK-positive and negative group, respectively. Figure 21 shows the K-M plot demonstrating the survival curve of both groups. The 1-year survival rate was high in both groups, 94% and 96% in the NTRK-positive and negative group, respectively. Thereafter, the NTRK-positive group had a larger drop in survival at 2 years compared to NTRK-negative patients. Due to the low number of events, the median survival could not be calculated. The estimated HR for OS was 1.47 (95% CI, 0.39 to 5.57, P=0.57). While the point estimate suggests a survival benefit in NTRK-positive patients, the lower end of the 95% is below 1.0, which indicates no potential survival benefit.
Figure 21: Kaplan-Meier Plot of Survival Outcomes for NTRK-Positive and NTRK-Negative Patients
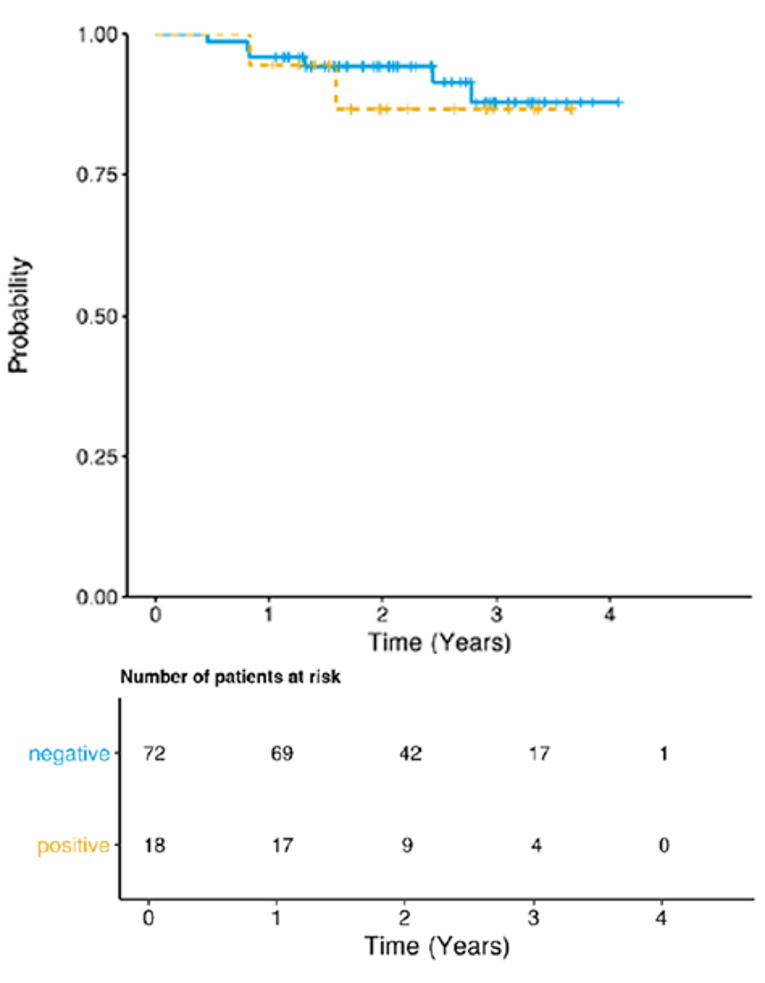
Source: Observational Study Report: VOYAGER-2 study97
Analyses from the VOYAGER-1 and 2 studies were submitted to provide evidence of the NRTK fusion as a prognostic factor, but the small numbers of patients and events during the follow-up period preclude any definitive conclusions. The sponsor indicated that NTRK fusion does not at least confer any survival benefits; however, this interpretation was based on non-significant point estimates. Based on the CI, NTRK fusion could theoretically confer a survival benefit based on the uncertainty in the estimate.
3. MDACC study
Study overview: The MD Anderson Cancer Center (MDACC) database is reportedly 1 of the largest single-centre oncology databases in North America, which identified patients with NTRK fusions for 2 of the larotrectinib trials (LOXO-TRK-14001 and 15002 [NAVIGATE]). MDACC conducted a retrospective study, funded by the sponsor, to identify patients with NTRK fusions and compare their PFS and OS with a matched cohort from the TCGA whose NTRK status was unknown, but presumably NTRK-negative. A total of 78 NTRK-positive patients were identified in the MDACC database by molecular profiling, of which, 72 patients had sufficient follow-up for the end points of interest, including 34 TRK inhibitor treated patients; the rest were untreated. From the TCGA database, 2,538 patients were initially identified with a reported pathological stage. Overall, 25 MDACC patients were matched with 407 TCGA patients on the basis of histology, stage, and gender.
PFS was defined as the duration from initial diagnosis of primary tumour to first of death, progression on initial therapy or start of TRK inhibitor therapy. Right-censoring occurred at the start of TRK inhibitor therapy for those NTRK-positive patients that received a TRK inhibitor in order to exclude the impact of the TRK inhibitor on progression.
Results: For OS, there was only 1 recorded death in the 2 cohorts, therefore no comparative analysis was conducted. Figure 22 shows the K-M curve comparing the 2 cohorts for PFS; which showed no evidence of association between PFS and NTRK fusion status (P=0.61). The estimated adjusted (pathological stage and age at diagnosis) HR for PFS between the MDACC cohort compared to the TCGA cohort was 1.73 (95% CI, 0.78 to 3.83, P=0.17). Given the lower end of the 95% CI, wan below 1.0, the PFS for NTRK fusion–positive cases could theoretically be lower compared to the mix population.
Figure 22: PFS Comparison of MDACC NTRK-Positive Cohort With Matched TCGA Fusion Status Unknown Cohort
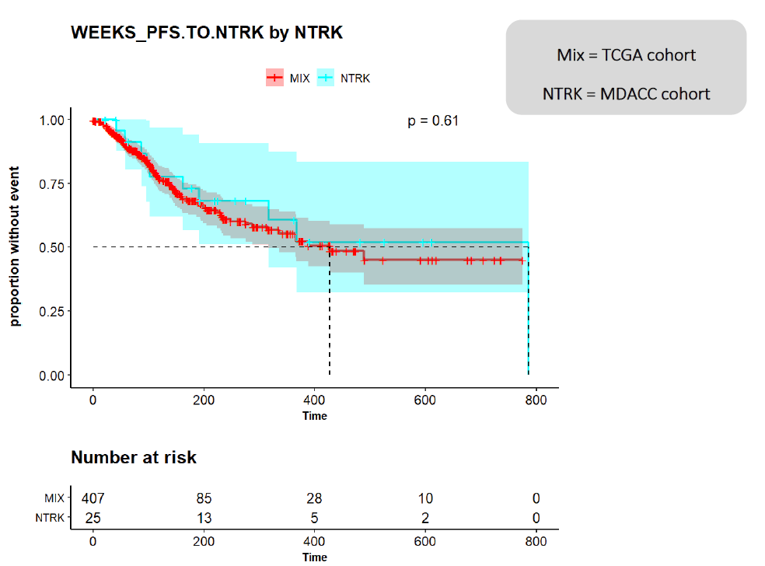
Source: MDACC study98
Results from the MDACC study were concordant with the VOYAGER studies in that the point estimate suggest that NTRK fusion did not confer any survival benefit. However, the 95% confidence intervals suggest the possibility of a survival benefit as well as a lower risk of mortality. The non-significant results may be a result of the low number of patients, and therefore, events.
4. MSKCC Study
Study overview: A brief overview of the study has been provided previously. Using the MSK database, 76 NTRK-positive cancer patients were identified out of 26,312 prospectively screened patients. Of these, 67% (51/76) developed advanced or recurrent disease during the study period and received systemic therapy (median of 3 prior lines of systemic therapy). K-M method was used to estimate recurrence-free survival (RFS), PFS, and OS in these patients. OS was defined as death from any cause from original diagnosis, with patients alive at the time of data lock censored at the last date confirmed alive. For RFS, patients were included in the analysis if they were treated with curative intent (n = 39). Of these 39 patients, recurrence was documented on imaging in 27 patients. RFS was defined as first recurrence or death from any cause from the start of remission. Patients were censored at last follow-up if they were alive without radiologic or pathologic documentation of recurrence. For PFS, patients were included in the analysis if they developed advanced disease or de novo metastatic disease (n = 51). PFS was defined from date of first-line therapy for advanced disease (time 0) until radiologic progression (n = 37), changing therapies to start a clinical trial (n = 2), or changing medical therapies for other reasons (n = 4). Patients were censored at last follow-up if they were alive and progression-free at the time of data cut.
ORR was calculated by treatment, defined as those who achieved CR or PR. BOR was a broader outcome measure, recorded based on the opinion of the treating oncologist, for patients who received therapy for active disease.
Results: In this study, 35 (69%) patients received chemotherapy, 12 (24%) received immunotherapy, and 38 (75%) received TRK inhibitors for their advanced disease. TRK inhibitors included both larotrectinib and entrectinib. Results are given in Rosen et al.32 Among patients with NTRK-positive cancer, the ORR across all classes of therapy excluding TRK inhibitors, was 46.7%. Including TRK inhibitors, the ORR increased to 67.6% to similar to chemotherapy, 62.5%. However, the sponsor noted that the ORR and the corresponding naive comparison was biased toward chemotherapy, for the following reasons. Firstly, best response was based without consideration for how many lines of therapy the patient had received. Patients on chemotherapy might receive multiple prior therapies; however, they would still be considered as PR if they respond to chemotherapy after failing on multiple therapies. In contrast, patients on TRK inhibitors had a single opportunity for response since this was given as a later line of therapy. Secondly, the ORR only accounted for patients with known BOR. However, approximately 31% of patients receiving chemotherapy had unknown response, compared to approximately 10% in those receiving TRK inhibitors. Therefore, the uncertainty in the chemotherapy ORR estimate was, in fact, higher. Both of these suggest an overestimation of the ORR for chemotherapy. The sponsor reported an ORR of 42.9% (15/35) and 60.5% (23/38) for chemotherapy and TRK inhibitors, respectively, when unknown response was taken into account.
OS, PFS, and RFS were evaluated for all NTRK-positive patients; however, results were only provided for first-line therapy, including those who received TRK inhibitor therapy (Figure 2 of Rosen et al.32). Median follow-up time in survivors was 3.1 years (range: 0.1-22.5 years). Among the 39 patients presented with limited stage disease initially managed with curative intent, the median RFS was 3.5 years (95% CI, 2.4 to 4.9). Among the 51 patients who developed recurrent or advanced disease, the median PFS on first-line therapy was 9.1 months (95% CI, 4.8 to 13.1). Across all 76 patients, the median OS from the time of initial diagnosis was 19.8 years (95% CI, 9.1 to NR). Even though the analyses were not done by treatment types, the sponsor reported that the median PFS on first-line therapy, excluding TRK inhibitors, administered for advanced disease was 9.6 months. It should be noted that PFS and OS are usually expected to decrease with each subsequent line of therapy.
Based on the above, the authors concluded that there was no clear evidence that NTRK-positive cancers had an unusually favourable prognosis, although a formal statistical comparison was not feasible. Notably, no formal comparison was done to NTRK-negative patients.
Summary
In the original submission of larotrectinib, pERC raised uncertainties with respect to the oncogenicity and natural history of NTRK fusion, along with other issues. In response, the sponsor submitted a number of RWE studies, to support the notions that NTRK fusion is a primary oncogenic driver in several tumour types, its occurrence is mutually exclusive of other types of genetic alterations, and its presence is not associated with a prognostic benefit or worsening to patients. Evidence was primarily based on 4 large database studies, each with thousands of samples of different tumour types, including NTRK-positive tumours. Based on the evidence, NTRK fusion was present in several tumour types, including some rare cancers; with NTRK-positive cases observed more in some cancer types than others. NTRK fusion was generally found to be mutually exclusive of other oncogenic drivers, and when co-occurrence was noted, it was primarily seen in colorectal cancer and with MSI, both of which are known to have high mutation burden. As well, patients with NTRK fusion cancers showed at least similar survival rates as non-NTRK fusion cancers, if not better. The clinical experts consulted for this review agreed with the findings. Considering the totality of evidence, it appears that NTRK fusion is an oncogenic driver, that is reported in several cancer types at varying frequency; does not generally occur with other oncogenes; and have inconclusive evidence on survival.
Appendix 5: Description and Appraisal of Outcome Measures
Note that this appendix has not been copy-edited.
Aim
To describe the following outcome measures and review their measurement properties (validity, reliability, responsiveness to change, and MID):
EORTC QLQ C-30
PedsQL 4.0 Generic Core Scale
Findings
Table 43: Summary of Outcome Measures and Their Measurement Properties
Outcome measure | Type | Conclusions about measurement properties | MID |
|---|---|---|---|
EORTC QLQ-C30 | Cancer-specific measure of HRQoL 30-item questionnaire, consisting of 4 scales; 4-item response scale: Function Scale, Symptoms Scale, Single-Item Symptom Scale, 7-item Likert scale: Global QoL Scale/GHS | Validity: Construct validity assessed through convergent and discriminative approach Reliability: Internal consistency assessed using the Cronbach alpha Responsiveness: No relevant studies found | 10 points change for the individual items and scale scores.65,70 |
PedsQL 4.0 Generic Core Scale | Generic HRQoL scale 23-item questionnaire, consisting of 4 scales, 7-item Likert scale: physical, emotional, social, and school functioning Summary scores: Total score | Validity: Construct validity assessed through discriminative approach and intercorrelations between total score and various subscales Reliability: Internal consistency assessed using the Cronbach alpha Responsiveness: Responsive to clinical change over time. | Child self-report: 4.4-point change71 Parent proxy-report: 4.5-point change71 |
EORTC QLQ-C30 = European Organization for Research and Treatment of Cancer Quality of Life Questionnaire Core 30; GHS = Global Health Score; HRQoL = health-related quality of life; EQ-5D-5L = European Quality of Life 5-Dimensions 5-Levels; MID = minimal important difference; PedsQL-Core = Pediatric Quality of Life-Core Module
Studies assessing the psychometric properties of the above instruments are only summarized if the assessment was done for the English version, and in a sample of mixed (≥ 1 type) cancer patients.
EORTC QLQ-C30
Description
The European Organization for Research and Treatment of Cancer (EORTC) Quality of Life Questionnaire Core 30, or EORTC QLQ-C30, is 1 of the most commonly used patient-reported outcomes (PRO) measures in oncology clinical trials.99 It is a multidimensional, cancer-specific, evaluative measure of HRQoL. It was designed specifically for the purpose of assessing changes in participants’ HRQoL in clinical trials, in response to treatment.66 The core questionnaire of the EORTC QLQ-C30 consists of 30 questions that are scored to create 5 multi-item functional scales, 3 multi-item symptom scales, 6 single-item symptom scales, and a 2-item quality of life (QoL) scale, as outlined in Table 44. Version 3.0 of the questionnaire, used in the 3 included trials in this report, is the most current version and has been in use since December of 1997.67 It is available in 90 different languages and is intended for use in adult populations only. Notably, the global QoL scale is also known as the GHS, which was reported in the 3 trials and pooled analysis above.100
Table 44: Scales of EORTC QLQ-C30
EORTC QLQ-C30 | Functional Scales (15 Questions) | Symptom Scales (7 Questions) | Single-Item Symptom Scales (6 Questions) | Global Quality of Life (2 Questions) |
|---|---|---|---|---|
Questions | Physical function (5) Role function (2) Cognitive function (2) Emotional function (4) Social function (2) | Fatigue (3) Pain (2) Nausea and vomiting (2) | Dyspnea (1) Insomnia (1) Appetite loss (1) Constipation (1) Diarrhea (1) Financial impact (1) | Global Quality of Life (2) |
Scoring
The EORTC QLQ-C30 uses a 1-week recall period in assessing function and symptoms. Most questions have 4 response options (“not at all,” “a little,” “quite a bit,” “very much”), with scores on these items ranging from 1 to 4.67 For the 2 items that form the global quality of life scale, however, the response format is a 7-point Likert-type scale, with anchors between 1 (very poor) and 7 (excellent).67
Raw scores for each scale are computed as the average of the items that contribute to a particular scale. This scaling approach is based upon the assumption that it is appropriate to provide equal weighting to each item that comprises a scale. There is also an assumption that, for each item, the interval between response options is equal (for example, the difference in score between “not at all” and “a little” is the same as “a little” and “quite a bit,” at a value of 1 unit). Each raw scale score is converted to a standardized score that ranges from 0 to 100 using a linear transformation, with a higher score reflecting better function on the function scales, higher symptoms on the symptom scales, and better quality of life (i.e., higher scores simply reflect higher levels of response on that scale). Thus, a decline in score on the symptom scale would reflect an improvement, whereas an increase in score on the function and quality of life scale would reflect an improvement. According to the EORTC QLQ-C30’s scoring algorithm, if there are missing items for a scale (i.e., the participant did not provide a response), the score for the scale can still be computed if there are responses for at least one-half of the items. In calculating the scale score, the missing items are simply ignored — an approach that assumes that the missing items have values equal to the average of those items for what the respondent completed.67
Psychometric Properties
Validity: One cross-sectional study aimed to validate the EORTC QLQ-30 in a convenience sample of 57 cancer patients in Singapore.101 Most patients had breast and colorectal cancer, but leukemia, lung cancer, lymphoma, germ cell tumour, and other cancers were also reported. Construct validity was assessed by cross-sectional correlational evidence and discriminative evidence. First, convergent validity was assessed using spearman’s correlations between QLQ-30 and Short Form-36 (SF-36) scales, hypothesizing moderate to strong correlation (defined as correlation coefficient of 0.35–0.5, and >0.5, respectively) between scales of these 2 instruments measuring similar dimensions of HRQoL. Results showed moderate to strong correlations between QLC-30 and SF-36 scales, ranging from 0.35 to 0.67 across the assessed scales. Next, known-groups approach was used to compare 6 QLQ-30 scale scores between patients reporting mild and severe symptoms, as well as by stage of disease and presence of comorbid conditions. With the exception of emotional functioning, the remaining 5 scales showed better scores in patients with mild symptoms than those with severe symptoms (P<0.05 for all other comparisons). Patients in early stages of cancer (or with no comorbid conditions) generally had better QLQ-30 scores than those in advanced disease stages (or with comorbid conditions); however, none of these differences was statistically significant.101
A recent cross-sectional study in Kenya was conducted to evaluate the psychometric properties of the EORTC QLQ-C30, using the English or Kiswahili version in 100 patients with cancer.100 Most patients had breast cancer, followed by prostate, Kaposi sarcoma, lung, and other cancers. Construct validity was assessed by examining the inter-scale correlations among the subscales of EORTC QLQ-C 30. The inter-scale correlations were weak to strong; absolute magnitude ranged from 0.07 to 0.73. Notably, with the exception of cognitive functioning, Emotional Functioning, Nausea and Vomiting, Dyspnea, Appetite Loss, Constipation, and diarrhea, the GHS correlated moderately with the remaining subscales (r ≥ 0.30). Cross-cultural validity was evaluated but not reported here as not relevant.100
Reliability: The Singaporean cross-sectional study above also assessed internal consistency reliability by calculating a Cronbach alpha for all QLQ-C30 scales. The Cronbach alpha was ≥ 0.70 for 6 of the 9 assessed QLQ-30 scales; cognitive functioning, physical functioning, and nausea and vomiting had a Cronbach alpha ranging from 0.19 to 0.68.101
The Kenyan study described above assessed the internal consistency of each scale of the questionnaire using Cronbach alpha coefficients. With the exception of the Cognitive Function scale, all of the scales had a Cronbach α ≥ 0.70.100
Studies evaluating the responsiveness of the instrument was not found.
MID
For use in clinical trials, scores on the EORTC QLQ-C30 can be compared between different groups of patients or within a group of patients over time. One study conducted in breast cancer and small-cell lung cancer patients in 1998 estimated a clinically relevant change in score on any scale of the EORTC QLQ-C30 to be 10 points.65 The estimate was based on a study that used an anchor-based approach to estimating the MID in which patients who reported “a little” change (for better or worse) on the subjective significance questionnaire had corresponding changes on a function or symptom scale of the EORTC QLQ-C30 of approximately 5 to 10 points. Participants who reported a “moderate” change had corresponding changes in the EORTC QLQ-C30 of about 10 to 20, and those who reported being “very much” changed had corresponding changes of more than 20.65
More recently in 2015, a Canadian study estimated the MIDs of EORTC QLQ C-30 scales using data from 193 newly diagnosed breast and colorectal cancer patients.70 The Supportive Care Needs Survey-Short Form-34 (SCNS-SF34) was used as an anchor; mean changes in EORTC QLQ C-30 scales associated with improvement, worsening, and no-change in supportive care based on the SCNS-SF34 was then calculated. MIDs were assessed for the following scales: Physical function, role function, emotional function, global health/QoL (i.e., GHS), pain, and fatigue. For improvement, MIDs associated with a statistically significantly improved supportive care needs ranged from 10 to 32 points. For worsening, MIDs associated with a statistically significant worsening of supportive care needs ranged from 9 to 21 points. The range for unchanged supportive care needs was from 1-point worsening to 16-point improvement in EORTC QLQ C-30 score.70 Based on this, the authors suggested a 10-point change in EORTC QLQ C-30 score represented changes in supportive care needs, and therefore should be considered for clinical use.70
In 2014, another Canadian study estimated the MID for EORTC QLQ-C30 in 369 patients with advanced cancer, who completed the questionnaire at baseline and 1 month post-radiation.102 Most common cancer type was breast cancer, followed by lung, prostate, gastrointestinal, renal cell, and others. MID was estimated using both anchor and distribution-based methods for improvement and deterioration. Two anchors of overall health and overall QoL were used, both taken directly from the EORTC QLQ-C30 (questions 29 and 30) where patients rated their overall health and QoL themselves. Improvement and deterioration were categorized as an increase or decrease by 2 units to account for the natural fluctuation of patient scoring. With these 2 anchors, the estimated MIDs across all EORTC QLQ C-30 scales ranged from 9.1 units to 23.5 units for improvement, and from 7.2 units to 13.5 units for deterioration. Distribution-based estimates were closest to 0.5 SD.102 Notably, this study used the global score as an anchor, without providing an MID for this scale, which was the scale used in the NAVIGATE trial, thereby the MIDs from this study are not applicable to this review.
PedsQL
Description
The Pediatric Quality of Life Inventory (PedsQL) is a modular instrument designed to measure HRQoL in children and adolescents aged 2–18 years.68 The PedsQL 4.0 Generic Core Scale, used in the SCOUT and NAVIGATE trial, is a multi-dimensional scale, that can be completed by child self-report or parent proxy-report, and can be applied to both healthy and patient populations. The generic core scale has 23 items consisting of the following dimensions: Physical Functioning (8 items), Emotional Functioning (5 items), Social Functioning (5 items), and school functioning (5 items). Items of these scales are then combined differently to create the following summary scores: Total Scale score (all 23 items), Physical Health Summary score (8 items), and Psychosocial Health Summary score (15 items).68 The developers of the instrument indicated there are several disease-specific modules available for PedsQL, including asthma, rheumatology, diabetes, cancer, and cardiac conditions. In addition, the availability of the generic PedsQL Multi-dimensional Fatigue Scale, Pediatric Pain Questionnaire, Family Impact Module, and Healthcare Satisfaction Module were also noted.69 However, the PedsQL Generic Core Scales will only be focused here as this was measured in the form of the total score in the SCOUT and NAVIGATE trial.
Scoring
For children (and parents of children) ages 8–18 years, the items of the 4 dimensions in the PedsQL are each rated on a 5-point Likert scale; 0 = never a problem, 1 = almost never a problem, 2 = sometimes a problem, 3 = often a problem, 4 = almost always a problem. Items are then reverse-scored and linearly transformed to a 0–100 scale (0 = 100, 1 = 75, 2 = 50, 3 = 25, 4 = 0), higher scores indicate better HRQoL. Scales are then scored by averaging the items divided by the number of items answered, to account for missing data. For younger children (ages 5–7 years), the response scale is reworded and simplified to a 3-point scale, with each response choice anchored to a happy-to-sad faces scale. For children younger than 5 years, only parent proxy report is used with age-appropriate items. The scale scores are not computed if 50% of the items in the scale are missing, in which case, imputing the mean of the completed items is recommended to calculate a scale score. The Physical Health Summary score consists of the same 8 items as the physical functioning subscale, while the psychosocial health summary score consists of the remaining 15 subscales. The Total Scale score is computed as the sum of all the items over the number of items answered on all the scales.69
Psychometric Properties
Validity: The PedsQL 4.0 Generic Core Scales was validated by the developers, by administering the questionnaire to 339 families of children ages 2–18 years (220 child self-reports; 337 parent proxy-reports).69 The sample included children with the following cancer types: acute lymphocytic leukemia, brain tumour, non-Hodgkin lymphoma, Hodgkin lymphoma, Wilms’ tumour, and other cancers. In addition, 157 and 730 families of healthy children ages 2–18 years were administered (self or parent administered) the PedsQL 4.0 Generic Core Scales Acute Version and Standard Version, respectively, with a recall period of 1 week and 1 month. Construct validity was assessed using the known-groups method, by comparing the Generic Core Scales scores between healthy children and children with cancer. As hypothesized, healthy children reported higher PedsQL 4.0 scores (better HRQoL) for all subscales and the total score than pediatric patients with cancer, irrespective of self-report or parent proxy-report, age groups, or whether on or off-treatment. However, the Acute version was used for this comparison, not the standard version, therefore, the results may not be generalizable in the context of this review. Construct validity was further evaluated by the intercorrelations among the Total Scale score with the PedsQL Multi-dimensional Fatigue Total Scale and subscale scores. Consistent with the hypothesis, high scores in the Fatigue Total Scale score and different subscales correlated with higher scores in the Generic Core Total Scale Scores (i.e., better overall HRQoL), with moderate (0.30–0.49) to strong (≥ 0.50) effect sizes. Parent/child intercorrelations were then computed for the total score, summary scores, and the subscale scores to examine cross-informant variance, hypothesizing moderate (0.30–0.49) to strong (≥ 0.50) effect sizes. Both child self-report and parent proxy-report showed moderate to strong correlations (range 0.3–0.56, P< 0.01 for all).69
Reliability: In the study above, internal consistency reliability was determined by calculating Cronbach α, although the Acute version was used for this comparison, not the standard version. Both child self-report scales and parent proxy-report scales ranged between 0.66 to 0.93, with the Generic Core Scales Total score approached or exceeded the reliability criterion of 0.90.69
The developers of the PedsQL published a review article a few years after conducting the validation study above, in which published studies on the psychometric properties of the PedsQL 4.0 Generic Core Scales and disease-specific modules from 25,000 children and adolescents were summarized, with evidence from more than 75 publications across 60 languages.71 However, details were provided in an aggregate manner, without any information on the individual studies, therefore, it is unclear whether validity and reliability was assessed for the English version in a population of mixed cancer. Nonetheless, aggregate results for the total score showed reliability (Cronbach α > 0.7) among cancer patients of all age groups (2–4 years, 5–7 years, 8–12 years, 13–18 years), using both child self-report and parent proxy-report. Similarly, the scale was reported to be sensitive to disease severity and responsive to treatment, with cancer patients having lower total score (worse HRQoL) than healthy children over times.71
MID
The authors developing the PedsQL 4.0 estimated the MID of the Total Scale score using a distribution-based method. Using 1 standard error of the mean as benchmark, a 4.4 and 4.5-point change in the PedsQL 4.0 total score was estimated as an MID for child self-report and parent proxy-report, respectively.71
Appendix 6: Summary of NTRK Gene Fusion Testing in Canada (Submitted to CADTH by Bayer Inc.)
Note that this appendix has not been copy-edited.
Bayer is providing this summary of key information on NTRK gene fusion testing as per the correspondence received from CADTH on June 3, 2021 as it relates to the VITRAKVI (larotrectinib) request for reconsideration and the implementation questions raised by PAG. Bayer provided a significant amount of information on this topic in the VITRAKVI resubmission and refers the reader to the specific sections within the submission below. Bayer appreciates the opportunity to provide this summary given how central this topic is to the file and the request for reconsideration.
1. Key considerations and recommendations for NTRK gene fusion testing in Canada and related Bayer support
NTRK gene fusion testing can be conducted through a number of different methods for screening and detection purposes.1 Each has its own strengths and limitations and all methods are commonly performed in labs across Canada.1 The most common approaches for NTRK gene fusion detection currently are NGS, FISH and IHC.1
New biomarkers require a period of time to become established and integrated into regular testing protocols when first introduced. Bayer acknowledges that this is an important implementation consideration, however the absence of wide-spread NTRK testing across Canada at the present time should not be used as a reason to restrict the recommendation for VITRAKVI given that it is possible to develop a cost-efficient approach to testing as further described below.
VITRAKVI is only effective against tumours with an NTRK gene fusion, hence confirmation of NTRK status is critical to determine who will derive benefit, however its rarity requires that testing be done in an efficient manner. To this end and in order to support the development of an efficient diagnostic NTRK gene fusion testing infrastructure in Canada, Bayer has supported three key initiatives2: a) CANTRK Ring Study (Canadian NTRK Assays Validation Project), b) FastTRK testing program, and c) Canadian consensus for biomarker testing and treatment of TRK fusion cancer.
A.) CANTRK Ring Study: An ongoing, Bayer-sponsored initiative involving 18 labs across 7 provinces to validate IHC and NGS testing platforms and to implement a cost-effective testing strategy.3 The participating institutions and investigators in CADTH-participating jurisdictions are listed in Table A6-1 below. Bayer initiated this work recognizing that NTRK gene fusion testing would need be established in Canada in order to identify patients eligible for VITRAKVI.
Table A6-1: CANTRK Ring Study Primary Investigators and Institutions in CADTH-Participating Jurisdictions
Institution | Province | IHC Lead(s) | Molecular Lead(s) |
|---|---|---|---|
Ottawa | ON | Dr. Bibiana Purgina | Dr. Bryan Lo |
McMaster/ Hamilton Health Sciences Centre | ON | Dr. JC Cutz | Dr. McCready/ Dr. Grafodatskaya |
University Health Network | ON | Dr. Carol Cheung/ Dr. Ming Tsao | Dr. Tracy Stockley |
SickKids | ON | Dr. Rose Chami | Dr. Cynthia Hawkins |
Kingston | ON | Dr. David Berman | Dr. Harriet Feilotter |
William Osler Health System | ON | Dr. Brandon Sheffield | |
BCC | BC | Dr. Diana Ionescu | Dr. Stephen Yip |
Cross Centre Institute | AB | Dr Gilbert Bigras | Dr. Iyare Izevbaye |
Calgary | AB | Dr. Martin Hyrcza | Dr. Doug Demetrick / Dr. Adrian Box |
Nova Scotia Health Authority | NS | Dr. Xu | Dr Weei-Yuan Huang/ Dr. Wenda Greer |
Shared Health Manitoba | MB | Dr. Paul Park | Dr. Beth Spriggs |
Saskatoon | SK | Dr. Emina Torlakovic | Dr. John Decoteau |
B.) FastTRK: A complimentary, Canadian clinical testing program for the diagnosis of NTRK gene fusions sponsored by Bayer (pan-TRK IHC followed by confirmatory NGS or NGS upfront for near-pathognomonic TRK fusion cancer types and CNS tumours). Further details on how testing is conducted and guidance on which patients should be tested can be found at www.fasttrk.ca. As of March 2021, 10 patients (having lung, sarcoma, CNS, salivary, and colorectal tumours) have been identified as being NTRK gene fusion positive through FastTRK, representing 0.7% of all samples tested (1,439 total submitted samples; 1,276 pan-TRK IHC and 173 NGS tests conducted) and collectively spanning more than 20 tumour types. We note that these rates are consistent with the NTRK epidemiology data reported in the literature submitted by Bayer for a pan-tumour agnostic context. Bayer submits that FastTRK provides proof-of-concept that efficient NTRK testing can be conducted in Canada and more detailed program statistics and associated costs can be provided to CADTH or jurisdictions upon request. Bayer has committed to supporting FastTRK at least until the end of 2022. In addition, Canadian NTRK positive patients have also been identified using local testing infrastructures outside of Bayer’s FastTRK program.
C.) Canadian Consensus for Biomarker Testing and Treatment of TRK Fusion Cancer: Multiple, peer-reviewed publications recommending approaches to NTRK gene fusion testing are found in the recent literature4,5 and discussed in more detail in Bayer’s resubmission.6 Bayer supported the development of Canadian-specific, national diagnostic and treatment guideline algorithms for adult and pediatric populations in 2020 involving 29 Canadian experts that were published as Canadian guidelines in 2021.7,8 (Note: the pre-publication manuscripts were included in the VITRAKVI resubmission). These guidelines highlight opportunities to test for NTRK gene fusions in well-characterized enriched sub-populations (based on mutual exclusivity or co-occurrence with other molecular markers already tested). Importantly, this approach helps to manage implementation considerations and concerns around excessive volume and costs associated with an (not-recommended) approach of broad, non-selective NTRK testing. The Canadian experts developed algorithms for several tumour histologies: non-small cell lung cancer (NSCLC), colorectal carcinoma, sarcoma (non-infantile fibrosarcoma [IFS]), thyroid carcinoma, salivary gland tumours, pediatrics (thyroid, IFS), central nervous system cancer / glioma and tumour-agnostic. These algorithms are also detailed in Bayer’s VITRAKVI resubmission.9
2. Current Situation and Future Implementation of a Cost-Efficient NTRK Gene Fusion Testing Infrastructure in Canada
A key consideration when assessing the implementation of testing is that NTRK gene fusion testing is already commonly in place in Canada for some tumour types. Further, the rarity of a given tumour type along with the existence of identified enrichment strategies to guide testing are two additional key considerations.7,8 Consequently, five categories of tumour types can be identified based on these three considerations, as summarized in Table A6-2 below. Bayer submits that NTRK gene fusion testing has limited-to-no impact on the current testing infrastructure for Categories 1-4 based on these key considerations. The impact of implementing testing for Category 5 (common cancers without current NTRK testing and no enrichment strategy) is more significant and requires further discussion, including input from pathologists and lab directors at the implementation stage.
Table A6-2: Tumour Type Categories for NTRK Gene Fusion Testing: Current Situation and Impact of Testing
Category | Description | Representative Tumour Typesa | Current Situation | Impact of NTRK Testing on Current Infrastructure |
|---|---|---|---|---|
1 | Common cancer / NTRK testing already commonly reimbursed | Lung – NSCLC | RNA-seq (panel NGS with NTRK coverage) reimbursed at diagnosis for locally advanced or metastatic patients in multiple jurisdictions | None |
2 | Rare cancers / NTRK testing already commonly reimbursed | Adult soft-tissue sarcoma (STS GIST and non-GIST) | RNA-seq (panel NGS with NTRK coverage) reimbursed for locally advanced or metastatic patients in multiple jurisdictions AND rare cancers | None to very limited due to small patient populations |
Pediatric soft-tissue sarcomab (including IFS) | ||||
3 | Rare cancers / No NTRK testing currently reimbursed | Salivary Gland Cancers (SGC)c | No NTRK testing (pan-TRK IHC or RNA-seq) BUT rare cancers (small patient populations to test)7,8 | Limited due to small patient populations |
Pediatric primary CNS tumoursb,d | ||||
Adult gliomad | ||||
4 | Common cancers but small population to test due to enrichment / NTRK testing not currently reimbursed | RAI-R Differentiated Thyroid Cancere | No NTRK testing (pan-TRK IHC or RNA-seq) BUT enrichment strategies based on clinical characteristics or exclusionary testing based on status of other reimbursed biomarkers7,8 | Limited due to small patient populations |
MSI-H/MMRd/BRAF wt CRCe | ||||
5 | Common cancers / No NTRK testing currently reimbursed / No existing enrichment strategy | All cancer types not included in category 1-4e | None | Requires further discussion including input from pathologists and lab directors |
Key: CNS – Central Nervous System; CRC – Colorectal cancer; GIST – gastrointestinal stromal tumour; IHC – Immunohistochemistry; NGS – Next Generation Sequencing; FISH – Fluoresence In Situ Hybridization; MSI-H – microsatellite instability-high; MMRd – mismatch repair deficiency; NTRK – neurotrophic tyrosine receptor kinase; NSCLC: Non-small cell lung cancer; RAI-R: radioactive iodine-refractory; tumour; RNA-Seq – RNA-Next Generation Sequencing; STS – Soft tissue sarcoma
aLocally advanced, unresectable, metastatic
bPediatric patients can also access NGS testing through PROFYLE and other similar programs10
cCanadian guideline recommends pan-TRK IHC followed by confirmatory NGS for SGC (non-secretory) and NGS upfront for SGC (secretory).7
dCanadian guidelines recommend NGS upfront for pediatric/adult CNS tumours7,8
eCanadian guidelines recommend pan-TRK IHC followed by confirmatory NGS7
Table A6-3 below provides an estimated number of patients per year by category across the CADTH-participating jurisdictions that would be tested for NTRK gene fusions. The estimates provided in Bayer’s resubmission align with those in the CADTH economic re-analysis (which Bayer assumes includes all jurisdictions including Quebec).
Bayer highlights that approximately 70% of NTRK gene fusion-positive patients are expected within categories 1-4, with the remaining population in category 5. Again, Bayer acknowledges and appreciates the implementation challenges associated with NTRK gene fusion testing in category 5 in particular. Bayer wants to work with pCPA and the jurisdictions to address these challenges and ensure implementation of efficient diagnostic testing. The Bayer initiatives discussed above (CANTRK Ring Study, FastTRK testing program, Canadian consensus guidelines) were launched with the intent of supporting efficient testing and we welcome discussion on how these initiatives could be applied and adapted to address the testing challenges identified by PAG.
Table A6-3: Tumour Type Categories for NTRK Gene Fusion Testing: Estimated Number of Annual Patients
Category | Description | Representative Tumour Typesa | Number of patients to test per year | |
|---|---|---|---|---|
Bayer resubmission (Canada excluding Quebec) | CADTH Re-analysis | |||
1 | Common cancer / NTRK testing already commonly reimbursed | Lung – NSCLC | 5,068 | 6336 |
2 | Rare cancers / NTRK testing already commonly reimbursed | Adult soft-tissue sarcoma (STS GIST and non-GIST) | 337 (+6 IFS) | 290 |
Pediatric soft-tissue sarcoma (including IFS) | 130 (+ 7 IFS) | |||
3 | Rare cancers / No NTRK testing currently reimbursed | Salivary Gland Cancers (SGC) | 171 | 213 |
Pediatric primary CNS tumoursa | <2008 | Not calculated | ||
Adult glioma | 943 | 1181 | ||
4 | Common cancers but small population to test due to enrichment / NTRK testing not currently reimbursed | RAI-R Differentiated Thyroid Cancer | 239 | 403 |
MSI-H/MMRd/BRAF wt CRC | 371 | 464 | ||
5 | Common cancers / No NTRK testing currently reimbursed / No existing enrichment strategy | All cancer types not included in category 1-4 | 13,402 | >14,000 |
Key: CNS – Central Nervous System; CRC – Colorectal cancer; GIST – gastrointestinal stromal tumour; IHC – Immunohistochemistry; NGS – Next Generation Sequencing; FISH – Fluoresence In Situ Hybridization; MSI-H – microsatellite instability-high; MMRd – mismatch repair deficiency; NTRK – neurotrophic tyrosine receptor kinase; NSCLC: Non-small cell lung cancer; RAI-R: radioactive iodine-refractory; tumour; RNA-Seq – RNA-Next Generation Sequencing; STS – Soft tissue sarcoma
aAdded based on Canadian guideline provided in Bayer’s resubmission8
Appendix 6: References (Provided by Bayer Inc.)
1.VITRAKVI resubmission, Note to Clinical Reviewer, Section 6 (Efficient Diagnostic Testing for TRK Fusion Cancer) and Appendix VIII
2.VITRAKVI resubmission, Note to Clinical Reviewer, Section 6 (Efficient Diagnostic Testing for TRK Fusion Cancer - Development of an efficient diagnostic testing infrastructure in Canada)
3.CANTRK: A Canadian Multi-Centre NTRK Gene Fusion Testing Validation in Solid Tumors Project S. Martins-Filho. Presented at Association for Molecular Pathology (AMP) 2020 Annual Meeting & Expo
4.Penault-Llorca F, Rudzinski ER, Sepulveda AR. Testing algorithm for identification of patients with TRK fusion cancer. J Clin Pathol. 2019;72(7):460-467 PubMed
5.Solomon JP, Hechtman JF. Detection of NTRK Fusions: Merits and Limitations of Current Diagnostic Platforms. Cancer Res. 2019;79(13):3163-3168 PubMed
6.VITRAKVI resubmission: Note to Clinical Reviewer, Section 6 (Efficient Diagnostic Testing for TRK Fusion Cancer)
7.Bebb DG, Banerji S, Blais N et al. Curr. Oncol. 2021, 28, 523–548; 10.3390/curroncol28010053PubMed
8.Perreault S, Chami R, Deyell RJ et al. Curr. Oncol. 2021, 28, 346–366; 10.3390/curroncol28010038PubMed
9.VITRAKVI resubmission, Note to Clinical Reviewer, Section 6 (Efficient Diagnostic Testing for TRK Fusion Cancer - Development of an efficient diagnostic testing infrastructure in Canada) & Section 7 (Unmet need, VITRAKVI place in therapy and Diagnostic Testing Algorithm by key Tumour Histology)
10.VITRAKVI resubmission, Note to Clinical Reviewer Document, Section 8.2, item 3
Pharmacoeconomic Review
Abbreviations
AE
adverse event
CBCN
Canadian Breast Cancer Network
CCC
Colorectal Cancer Canada
CCSN
Canadian Cancer Survivor Network
CI
confidence interval
CNS
central nervous system
FISH
fluorescence in situ hybridization
GIST
gastrointestinal stromal tumour
ICER
incremental cost-effectiveness ratio
IFS
infantile fibrosarcoma
IHC
immunohistochemistry
MASC
mammary analogue secretory carcinoma
NGS
next-generation sequencing
NSCLC
non–small cell lung cancer
NTRK
neurotrophic tropomyosin receptor kinase
OS
overall survival
PFS
progression-free survival
QALY
quality-adjusted life-year
SCFC
Sarcoma Cancer Foundation of Canada
STS
soft tissue sarcoma
Executive Summary
The executive summary comprises 2 tables (Table 1: Submitted for Review and Table 2: Summary of Economic Evaluation) and a conclusion.
Item | Description |
|---|---|
Drug product | Larotrectinib (Vitrakvi), 25 mg and 100 mg capsules and 20 mg/mL oral solution |
Submitted price | Larotrectinib, 25 mg capsule, $52.34 Larotrectinib, 100 mg capsule, $209.35 Larotrectinib, 20 mg/mL oral solution, 100 mL bottle, $4,187.00 |
Indication | For the treatment of adult and pediatric patients with solid tumours that:
|
Health Canada approval status | NOC/c |
Health Canada review pathway | Advanced consideration under NOC/c |
NOC date | July 10, 2019 |
Reimbursement request | As per indication |
Sponsor | Bayer Inc. |
Submission history | Previously reviewed: Yes Indication: NTRK locally advanced or metastatic solid tumours Recommendation date: October 31, 2019 Recommendation: Do not reimburse |
NOC = Notice of Compliance; NOC/c = Notice of Compliance with conditions; NTRK = neurotrophic tyrosine receptor kinase.
Table 2: Summary of Economic Evaluation
Component | Description |
|---|---|
Type of economic evaluation | Cost-utility analysis Partitioned survival model |
Target population | Adult and pediatric patients with locally advanced or metastatic solid tumours harbouring a NTRK gene fusion The patient population modelled matches the reimbursement request |
Treatment | Larotrectinib |
Comparators | Comparators for each tumour site analyzed (representing best supportive care):
|
Perspective | Canadian publicly funded health care payer |
Outcome | QALYs |
Time horizon | 10 years |
Key data source | Larotrectinib clinical trials: LOXO-TRK-14001; LOXO-TRK-15002 (NAVIGATE); LOXO-TRK-15003 (SCOUT) Naive comparison based on literature-based estimates for comparator PFS and OS; 1 trial selected per comparator |
Submitted results for base case |
|
Key limitations |
|
CADTH reanalysis results |
|
CNS = central nervous system; GIST = gastrointestinal stromal tumour; ICER = incremental cost-effectiveness ratio; IFS = infantile fibrosarcoma; QALY = quality-adjusted life-year; NGS = next-generation sequencing; NSCLC = non–small cell lung cancer; NTRK = neurotrophic tyrosine receptor kinase; OS = overall survival; PFS = progression-free survival; QALY = quality-adjusted life-year; STS = soft tissue sarcoma.
Conclusions
CADTH undertook reanalyses to address several key limitations of the sponsor’s model. CADTH’s reanalysis included: a more plausible extrapolation for long-term progression-free survival (PFS) and overall survival (OS); increased uncertainty in the PFS and OS consistent with the small sample sizes for each patient subtype; an assumption of no expected treatment benefit in patient subtypes with observational data representing 5 or fewer patients (all of which were not modelled by the sponsor); and the incorporation of the incremental costs of testing using next-generation sequencing (NGS) to identify eligible patients. These corrections increased the incremental cost-effectiveness ratios (ICERs) of larotrectinib compared to best supportive care across individual clinical indications and, in the combined analysis, compared relative to the sponsor’s submitted analysis.
In the CADTH reanalysis, incorporating the costs of identifying treatment-eligible patients with neurotrophic tropomyosin receptor kinase (NTRK) fusion mutations resulted in an overall ICER for larotrectinib of $929,434 per quality-adjusted life-year (QALY) gained compared to best supportive care across all tumour types (pooled analysis). However, the pooled analysis masks heterogeneity in the cost-effectiveness across each indication. Across tumour sites, the ICER of larotrectinib, when patient identification costs were included, varied from $183,055 per QALY in adult patients with a non–gastrointestinal stromal tumours (GIST) or soft tissue sarcoma (STS) and $203,383 per QALY in pediatric patients with infantile fibrosarcoma (IFS) to $818,375 per QALY in patients with non–small cell lung cancer (NSCLC). For patients with melanoma, larotrectinib is both clinically and economically dominated, meaning that the alternative treatment costs less and provides, on average, greater clinical benefit than does larotrectinib. In some tumour sites with small sample sizes (≤ 5 patients), such as appendix (n = 1), bone sarcoma (n = 2), breast cancer (n = 5), unknown primary cancers (n = 1), cholangiocarcinoma (n = 2), hepatic (n = 1), pancreas (n = 2), prostate (n = 1), and GIST STS (n = 4), whether larotrectinib provides any net clinical benefit is highly uncertain due to the lack of available evidence to estimate patient outcomes. The CADTH reanalysis therefore assumes no expectation of clinical benefit compared to best supportive care for these cancer types.
In some tumour sites, patients were more likely to expect clinically meaningful positive health benefits with larotrectinib. However, in some tumour sites. uncertainty in the comparative clinical effectiveness due to small sample sizes resulted in significant probabilities of a negative clinical benefit resulting from the potential for harm. For example, the probability of a negative net clinical benefit was 60% in patients with melanoma, 40% in patients with thyroid cancer, and 25% in pediatric patients with STS.
Among patients with known NTRK fusion mutation, the price reduction required to achieve an ICER of $50,000 per QALY gained ranges across indications from 50% to 60% in adult (non-GIST) STS cancers to 90% to 95% in thyroid cancers. In some cancer types, such as melanoma, no price reduction will make larotrectinib cost-effective because the major driver of outcomes is uncertainty in clinical benefit. In settings where NGS testing is not routinely performed, the costs of patient identification dominate the costs of larotrectinib treatment, resulting in a situation in which no reduction in drug costs will make larotrectinib cost-effective. For the specific indications of IFS, a price reduction of 60% to 70% could achieve an ICER of $50,000 per QALY gained.
Limitations stemming from the excessive complexity of the sponsor’s model made it impossible for CADTH to validate calculations in the model, and further limitations beyond those identified may exist; therefore, the true ICER for larotrectinib may be underestimated.
Stakeholder Input Relevant to the Economic Review
This section is a summary of the feedback received from the patient groups, registered clinicians, and drug plans that participated in the CADTH review process.
Five patient group submissions were received for this review, including Lung Cancer Canada, the Canadian Breast Cancer Network (CBCN), Colorectal Cancer Canada (CCC), the Sarcoma Cancer Foundation of Canada (SCFC), and the Canadian Cancer Survivor Network (CCSN). All participating organizations are prominent national patient advocacy groups in their respective cancer areas. Patient input was gathered by each organization, using environmental scans, interviews, online surveys, and literature reviews to identify common issues and experiences, and conferences. Patients responding to calls for input were those living with metastatic breast cancer (CBCN), general sarcoma cancer (SCFC), various metastasized cancers (CCC), and general cancer from at least 6 different sites (CCSN). The CBCN submission collected data from 180 Canadians, and Canadian experiences were shared in other groups’ surveys and interviews. The patient group submissions from CBCN included no reported cases of patients with NTRK mutations, whereas the SCFC, Lung Cancer Canada, CCC, and the CCSN incorporated inputs from 3, 3, 9, and 14 patients with the gene fusion, respectively. Though the type of cancer varied across patients, in most cases patients were diagnosed at an advanced stage or had an aggressive or rare form of cancer. Most patients had suboptimal success with conventional therapies and longed for a targeted approach with better safety and efficacy profiles compared with conventional therapy. Patients received treatments that included (systemic) chemotherapy, radiation therapy, immunotherapy, and/or oral adjuvant/adjunct therapies, depending on the underlying cancer, with chemotherapy being the most common form of treatment. Chemotherapy was reported as ineffective in halting tumour growth, and/or progression and was associated with various, often unmanageable, side effects. Patients noted that minimizing and managing the side effects of chemotherapy treatment was an urgent need, and they valued PFS, OS, and minimal toxicity as important outcomes. Few patients had experience with larotrectinib, having received it through special access programs or clinical trials. Overall, patients reported a reduction in tumour size, spread, and a general stabilization in cancer progression. After a treatment duration of between a few months and a few years, the tumour histology of most patients showed a complete or partial remission in (nearly) all cancer sites, with few cases of recurrence reported. Larotrectinib was considered a relatively well-tolerated treatment with few side effects and, in all cases, patients described larotrectinib treatment as vastly better treatment than current alternatives. Last, patients noted the importance of a testing platform for NTRK fusion mutations to allow for early identification of patients who might benefit from larotrectinib.
Ten joint clinician group inputs were received for this review, comprised primarily of oncologists (56 total) and other clinicians from cancer groups for the various cancers that might harbour an NTRK gene fusion. All clinician groups indicated that patients with advanced stages of cancer almost always failed on multiple therapies and had limited effective therapeutic options left, with the following cancers considered particularly nonresponsive to current therapies: advanced NSCLC, advanced colorectal cancer, gastrointestinal cancer, and some skin cancers. Tumours with little or no available treatment options include thyroid cancer, salivary gland tumours, and mammary analogue secretory carcinoma (MASC) of salivary glands. For some cancer types, treatment options were based on low-quality evidence and were associated with significant toxicity and low efficacy (e.g., lenvatinib and sorafenib for advanced thyroid cancer). Pediatric patients with metastatic tumours were associated with minimal treatment options and an unmet need for effective and low-toxicity therapy. All clinicians agreed that larotrectinib should be used as monotherapy after other treatment options had been exhausted, although some noted that larotrectinib could be prioritized in certain circumstances, such as for first-line therapy in NTRK-positive NSCLC, gastrointestinal cancer, or advanced thyroid cancer. In addition, in cases with poor prognoses and an absence of treatment alternatives, such as salivary gland tumours and advanced radioactive-iodine refractory thyroid cancers, larotrectinib may be used early in the treatment scheme.
The drug plans submitting input for this review noted that larotrectinib, available in a capsule or as an oral solution, may be associated with less chair time but require additional pharmacy resources to dispense. Oral administration would be more easily implemented for patients in rural and urban settings but may have limited accessibility because oral medications are not funded through the same mechanism as IV cancer medications and therefore require additional pharmacare applications, co-payments, and/or deductibles. The drug plans noted that NTRK fusion testing is not routinely available in all provinces, and is a barrier to implementation that would require resources and coordination to overcome. Finally, additional health care resources (e.g., clinic visits) would be required to monitor adverse effects and tolerability with larotrectinib.
Several of these concerns were addressed in the sponsor’s model:
PFS and OS across different cancer types were modelled.
The cost of NTRK testing was included, but only for immunohistochemistry (IHC).
Administration costs of comparative therapies were included.
In addition, CADTH addressed some of these concerns as follows:
CADTH provided a more specific analysis for each tumour type rather than grouping cancers together.
Costs of NGS testing to identify eligible patients were included.
CADTH was unable to address the following concern raised from stakeholder input:
There was insufficient data to provide an analyses for the following tumour types: appendix, bone sarcoma, secretory breast cancer, cancer of unknown primary, cholangiocarcinoma, hepatic, pancreas, prostate, and adult GIST STS.
Economic Review
Economic Evaluation
Summary of Sponsor’s Economic Evaluation
Overview
The current review is for larotrectinib (Vitrakvi) for locally advanced or metastatic adult and pediatric populations with NTRK fusions (or “NTRK fusion cancers”). Larotrectinib is taken orally, with an adult dosage of 100 mg twice per day and a pediatric dosage of 100 mg/m2 twice per day (up to a maximum of the adult dose) in continuous 28-day cycles. The cost per 28-day cycle, based on the recommended dosing, is $11,724 for adult patients and $8,207 for pediatric patients. The submitted price represents a 34.7% reduction in the price specified in the original submission.1
In contrast to the sponsor’s previous submission for larotrectinib, this resubmission provided stratified analyses by additional tumour types, the clinical data used to inform the pharmacoeconomic analysis was more mature, and the analysis included clinical data on patients with additional tumour types.
The clinical trial evidence present data on 188 patients with NTRK fusion cancers with primary solid tumours at 18 tumour sites. Model-based analyses were presented for 7 adult primary tumour sites, with 1 model combining pediatric tumour types, and a “pooled analysis” aggregating data across almost all tumour sites included in the trial data (Table 10). For 2 tumour sites (NSCLC and thyroid cancer), active treatment comparators were considered in addition to a best supportive care alternative.
The sponsor’s base-case analysis was performed from the public payer perspective. Costs and benefits were discounted at 1.5%. The sponsor’s analysis was performed using a 10-year time horizon. The sponsor presented health economic analyses with and without testing costs representing scenarios in which the mutation is known and in which it is not yet known and must be identified through testing.
Model Structure
The sponsor’s analyses used a 3-health-state partitioned survival model (schematic presented in Figure 1). This type of model does not require the explicit calculation of transition probabilities but can otherwise be considered conceptually similar to a Markov model with time-varying transition probabilities. The probability of death within the model is determined solely by the survival curve for OS and therefore is not influenced by changes to the PFS curve. The PFS and OS curves for larotrectinib are based on data from the larotrectinib clinical trials. The PFS and OS curves for the comparator arms were derived using estimates from the literature. The fraction of patients in each health state at any point in time were informed directly by the survival curve analysis. Aligned with the dosing schedule for larotrectinib, the model’s cycle length was 7 days. In the sponsor’s analysis, patients in the larotrectinib arm received treatment until disease progression.
Across each specific tumour type, comparators represented current best supportive care for individuals with locally advanced or metastatic cancer who have exhausted all prior therapeutic options (Table 11 of Appendix 3). The set of comparators for each tumour type was informed by a panel of Canadian oncology experts (the CANTRK Working Group) organized by the sponsor. For 2 tumour types, secondary analyses were performed by evaluating the use of larotrectinib at an earlier stage, and larotrectinib was therefore compared against active comparators. Because the sponsor indicated that the Health Canada product monograph states that larotrectinib should only be used when a patient has no satisfactory treatment options, the comparison against active comparators was presented as an exploratory scenario analysis.
For the pooled analysis, the sponsor considered a weighted combination of the discounted costs and discounted survival outcomes associated with best supportive care options across 11 cancer sites (NSCLC, central nervous system [CNS]/glioma, adult [non-GIST] STS, adult GIST STS, pediatric STS, thyroid, colorectal, salivary gland, cholangiocarcinoma, melanoma, secretory breast, and pancreatic cancer) to create a single comparator arm. Weights were determined partially on the distribution of tumour types in the larotrectinib trial with several modifications: costs and outcomes of best supportive care in patients with appendix cancer were represented by those of colorectal cancer; costs and outcomes of best supportive care in patients with bone sarcoma were represented by those of non-GIST STS; costs and outcomes of best supportive care in pediatric patients with IFS were represented by those of pediatric STS; and the outcomes of 3 patients (1 each of hepatic cancer, prostate cancer, and cancers of unknown primary) were assumed to be represented by a weighted average of the other cancer types (Table 10).
Model Inputs
There is no single specific diagnostic test that can detect NTRK fusion cancers. Detection methods include NGS, DNA and/or RNA sequencing, fluorescence in situ hybridization (FISH), IHC, and reverse transcriptase–polymerase chain reaction (RT-PCR). In the sponsor’s analysis, patients with advanced stage or metastatic disease who are potentially eligible for larotrectinib therapy and can supply a tumour sample are tested via NGS, FISH, and IHC. NGS and FISH screening tests can simultaneously test for the presence of multiple genomic alterations in a single tumour tissue sample. IHC screens for a single genetic abnormality at a time, and patients who test positive for NTRK gene fusions with IHC require a confirmatory NGS test before initiating treatment. Table 12 summarizes the sponsor’s assumptions regarding the status quo and incremental testing protocol for each tumour site (Appendix 3). The sponsor also presented analysis that excludes all diagnostic testing representing the cost-effectiveness in patients with known NTRK fusion cancers.
Data from the larotrectinib trials were used to inform PFS and OS. For each tumour-specific model, the sponsor stratified the 18 tumour types into 3 groups based on the relative PFS of each group compared to the overall PFS across all tumour sites. Specifically, log-normal survival curves were fit to each of the tumour site’s PFS data. These were then compared to the progression rate of the overall PFS curve:
patients with tumour types that progressed at a rate at least 1.5 times faster were classified as “below average”
patients with tumour types that progressed at a rate at least 1.5 times slower were classified as “above average”
patients with remaining tumour types were considered “average.”
Kaplan-Meier curves for PFS and OS in all 3 groups in the sponsor’s report are presented in Figure 3 of Appendix 3. Once classified, parametric models for the tumour-specific analysis were fit to 1 of 3 classes:
Below average: appendix (n = 1), bone sarcoma (n = 2), unknown primary cancer (n = 1), cholangiocarcinoma (n = 2), colorectal (n = 8), hepatic (n = 1), melanoma (n = 7), pancreas (n = 2), CNS/glioma (n = 24), prostate (n = 1), non-GIST STS (n = 17)
Average: breast (n = 5) and thyroid (n = 27)
Above average: GIST (n = 4), lung (n = 13), salivary gland (n = 21), IFS (n = 32), pediatric STS (n = 20).
As the sponsor’s clinical trial data did not include a comparator arm; therefore, the model-based analysis used a naive literature-based comparator. For the comparator arms, PFS and OS for each tumour site and treatment comparator were modelled independently based on parametric fits to published and digitized Kaplan-Meier survival data (Table 13).
In general, assumptions made around survival curves directly affect the results of any cancer model. The survival curves in depicts the difference in PFS between larotrectinib and its comparator and in OS between larotrectinib and its comparator Figure 2 outlines the sponsor’s assumptions regarding long-term PFS and OS gains for larotrectinib and its relevant comparator for each tumour type. The difference between best supportive care and larotrectinib in terms of OS and PFS gain is highlighted by the solid grey shaded area for the duration of the larotrectinib trial and by the hashed grey area for the extrapolation period. The solid green line represents the survival curve for larotrectinib, with the dashed green lines representing the 80th percentile. The black line represents the Kaplan-Meier curve used for the best supportive care comparators. The grey line represents the survival curve fitted to the Kaplan-Meier data and the dashed grey lines represent the 80th percentile.
Figure 2 to Figure 9 depict the difference in PFS between larotrectinib and its comparator and in OS between larotrectinib and its comparator.
The rates of occurrence of grade 3 and 4 adverse events (AEs) for patients in the larotrectinib arms were estimated from the larotrectinib trial (stratified by adult versus pediatric) (Table 14 in Appendix 3). For the comparator arms, AE rates were specific to each tumour type and treatment was based on the literature. The rates of AEs included in both the larotrectinib and comparator arms were notably less than in the sponsor’s previous submission.1 In the new submission, the sponsor included AEs only if they occurred in more than 5% of the population in the pooled analysis. For example, the sponsor identified that neutropenia occurs in 42% of non-GIST STS patients receiving best supportive care (doxorubicin + ifosfamide),2 but because non-GIST STS patients represent 10.3% of the larotrectinib trial population, this AE did not meet the criteria for inclusion in either the pooled or tumour-stratified analysis.
Utilities for adult and pediatric patients in the larotrectinib arms were assumed to be the same and are based on EuroQol 5-Dimensions (EQ-5D) patient surveys taken from the larotrectinib trial. For the comparator arms, the sponsor’s analysis used health state–specific utilities based on literature estimates (Table 15 in Appendix 3). Utility decrements for specific AEs were estimated from the literature.
The sponsor’s analysis used 2 phase-of-care approach studies from the Ontario Cancer Registry to estimate cancer-specific health care costs based on cancer diagnoses between 1997 and 2007. Patients in both the progression-free and progressed states were assigned non-treatment cancer costs consistent with the “continuing phase,” which, as measured in the source paper, is after the costs of initial diagnosis and initial treatment but includes surveillance and active follow-up (Table 16 of Appendix 3). When patients progressed to the dead state, they imposed a 1-time cost to account for the increase in health care costs attributable to the terminal phase of care. Non-cancer health care costs were excluded from the sponsor’s analysis. The sponsor’s report indicates that these cost inputs were adjusted to 2018 Canadian dollars.
The cost of therapies used in the best supportive care arms were sourced from the Ontario formulary, internal sponsor documents, and pCODR reports. Administration costs for IV drugs were based on a time-in-motion study at Princess Margaret Hospital in Toronto. The sponsor’s report indicates that these cost inputs were adjusted to 2019 Canadian dollars. The sponsor’s analysis did not include drug wastage. The costs of AEs were estimated using the Ontario Case Costing Initiative. The sponsor’s analysis assumes testing costs of $66 for IHC ($50 for technical component plus $15.67 in professional fees), $1,040 for NGS ($1,000 for technical component plus $40 in professional fees), and $300 for FISH.
Summary of Sponsor’s Economic Evaluation Results
The sponsor presented probabilistic analyses for its pooled and tumour-specific analysis using 1,000 iterations.
Base-Case Results
The sponsor’s analysis indicates that larotrectinib increases survival, quality-adjusted survival, and costs, primarily due to drug costs. In patients with a known NTRK fusion cancer, the sponsor’s pooled analysis indicates incremental costs of $502,281 per patient, an increase in life expectancy of 3.12 years, and an increase in quality-adjusted life expectancy of 2.89 years. The majority of health gains occur outside the period for which there is observable data and therefore are wholly dependent on assumptions made in the extrapolation of the PFS and OS survival curves.
The sponsor calculated that the ICER of larotrectinib compared to best supportive care in the pooled analysis is $173,729 per QALY gained. Incorporating the additional costs of case detection, the sponsor estimated additional costs of $27,510, leading to an ICER of $182,090 per QALY gained (Table 3).
In the sponsor’s tumour-stratified analyses, the sponsor assumed the same PFS and OS curves for NSCLC, salivary gland (MASC), and pediatric cancers (STS and IFS), resulting in a common life expectancy across these indications of approximately 7.5 years and a quality-adjusted life expectancy of 5.85 QALYs. Similarly, common PFS and OS survival curves were assumed for CNS/glioma, colorectal, melanoma, and adult non-GIST STS, leading to a common life expectancy across these indications of approximately 4.3 years and quality-adjusted life expectancy of 3.32 QALYs. Variation in the PFS and OS curves of the comparators lead to variability in the incremental life expectancy and incremental QALYs across tumour sites. Across the tumour sites for which the sponsor included economic analysis, the ICERs range from $115,396 per QALY gained (in colorectal cancer, compared to best supportive care) to $299,184 per QALY gained (in thyroid cancer, compared to best supportive care) for patients known to have NTRK fusion mutations. In patients who need to be tested to evaluate whether they have an NTRK fusion cancer, the ICER of testing and treatment varies across tumour site in the sponsor’s analysis from $116,248 per QALY gained (in colorectal cancer, compared to best supportive care) to $300,249 per QALY gained (in thyroid cancer, compared to best supportive care) (Table 4).
The sponsor’s sensitivity analysis indicated that its pooled analysis results are sensitive to parameters describing the PFS and OS curves of patients on larotrectinib. Other variables, including utility values for specific health states, model time horizon, start ages of the population, and AE rates and costs, did not significantly alter outcomes in the sponsor’s analysis.
The sponsor did not report the proportion of the benefit accrued in the extrapolated period, nor did it present sensitivity analysis on its extrapolation assumptions in the report. In the pooled analysis, 36% of patients receiving larotrectinib were alive at the end of the 10-year analysis horizon. Across the larotrectinib survival models used for the tumour-specific analysis, 15.3% of the larotrectinib patients were alive at the end of the 10-year analysis horizon for tumour sites assumed to have below-average larotrectinib survival (CNS/glioma, colorectal, melanoma, and adult non-GIST STS) and 62.4% of the larotrectinib patients were alive at the end of the 10-year analysis horizon for tumour sites assumed to have above-average larotrectinib survival (NSCLC, salivary gland [MASC], and pediatric cancers [STS and IFS]). Across specific tumour comparator arms, the majority of sites had less than 1% of the population remaining at the end of 10 years, with the exception of 4% of melanoma patients, 18% of pediatric STS and IFS patients, and 15.8% of thyroid cancer patients receiving best supportive care.
Table 3: Summary of Sponsor’s Pooled-Indication Economic Evaluation Results
Drug | Total costs ($) | Incremental costs ($) | Total LYs | Incremental LYs | Total QALYs | Incremental QALYs | ICER vs. reference ($ per QALY) |
|---|---|---|---|---|---|---|---|
Patients with a known NTRK fusion mutation | |||||||
Best supportive care | 61,599 | — | 2.81 | — | 1.73 | — | — |
Larotrectinib | 563,879 | 502,281 | 5.93 | 3.12 | 4.62 | 2.89 | 173,729 |
Including testing costs to identify eligible patients | |||||||
Best supportive care | 61,501 | — | 2.78 | — | 1.71 | — | — |
Larotrectinib | 591,292 | 529,791 | 5.92 | 3.14 | 4.62 | 2.91 | 182,090 |
ICER = incremental cost-effectiveness ratio; LY = life-year; NTRK = neurotrophic tropomyosin receptor kinase; QALY = quality-adjusted life-year; vs. = versus.
Source: Sponsor’s pharmacoeconomic submission.3
Table 4: Summary of Sponsor’s Tumour-Specific Economic Evaluation Results With and Without Costs of Identification
Tumour site (comparator) | Cost ($) larotrec-tinib | Cost ($) comparator | Incremental costs ($) | QALY larotrec-tinib | QALY comparator | Incremental QALY | ICER vs. comparator ($ per QALY) | Average cost of testing per NTRK patient identified | ICER vs. comparator ($ per QALY) with testing costs |
|---|---|---|---|---|---|---|---|---|---|
Appendix (vs. BSC) | Sponsor did not include an analysis | ||||||||
Bone sarcoma (vs. BSC) | Sponsor did not include an analysis | ||||||||
Breast (vs. BSC) | Sponsor did not include an analysis | ||||||||
Cancer of unknown primary origin (vs. BSC) | Sponsor did not include an analysis | ||||||||
Cholangiocarcinoma (vs. BSC) | Sponsor did not include an analysis | ||||||||
CNS/glioma (vs. BSC) | 342,669 | 48,299 | 294,370 | 3.32 | 0.88 | 2.44 | 120,879 | $94,545 | 159,703 |
Colorectal (vs. BSC) | 360,276 | 33,094 | 327,182 | 3.31 | 0.48 | 2.84 | 115,396 | $2,415 | 116,248 |
Hepatic (vs. BSC) | Sponsor did not include an analysis | ||||||||
IFS (vs. BSC) | Sponsor did not include a specific analysis (see analysis combined with pediatric STS) | ||||||||
NSCLC (vs. BSC) | 758,663 | 54,355 | 704,308 | 5.86 | 0.58 | 5.27 | 133,462 | $50,087 | 142,953 |
NSCLC (vs. nivolumab) | 760,309 | 143,807 | 616,501 | 5.88 | 1.30 | 4.58 | 134,537 | $50,087 | 145,467 |
NSCLC (vs. pembrolizumab) | 769,374 | 261,914 | 507,460 | 5.89 | 1.80 | 4.08 | 124,249 | $50,087 | 136,513 |
Melanoma (vs. BSC) | 343,682 | 23,746 | 319,936 | 3.32 | 1.67 | 1.65 | 193,702 | $49,231 | 223,508 |
Pancreas (vs. BSC) | Sponsor did not include an analysis | ||||||||
Prostate (vs. BSC) | Sponsor did not include an analysis | ||||||||
Salivary gland (MASC) (vs. BSC) | 757,367 | 53,197 | 704,170 | 5.85 | 0.97 | 4.88 | 144,260 | $33,684 | 151,161 |
STS, adult (GIST) (vs. BSC) | Sponsor did not include an analysis | ||||||||
STS, adult (non-GIST) (vs. BSC) | 362,036 | 84,046 | 277,990 | 3.32 | 1.20 | 2.12 | 131,443 | $8,960 | 135,680 |
STS pediatric (vs. BSC) | Sponsor did not include a specific analysis (see analysis combined with IFS) | ||||||||
STS pediatric and IFS (vs. BSC) | 492,032 | 81,341 | 410,691 | 5.85 | 2.75 | 3.11 | 132,136 | $0 | 132,136 |
Thyroid (vs. BSC) | 586,625 | 47,267 | 539,358 | 4.64 | 2.83 | 1.80 | 299,184 | $1,920 | 300,249 |
Thyroid (vs. lenvatinib) | 585,639 | 235,389 | 350,249 | 4.63 | 2.71 | 1.93 | 181,861 | $1,920 | 182,858 |
BSC = best supportive care; GIST = gastrointestinal stromal tumour; ICER = incremental cost-effectiveness ratio; IFS = infantile fibrosarcoma; MASC = mammary analogue secretory carcinoma; NTRK = neurotrophic tropomyosin receptor kinase; NSCLC = non–small cell lung cancer; QALY = quality-adjusted life-year; STS = soft tissue sarcoma; vs. = versus.
Note: ICERs with testing costs were calculated by CADTH by adding average testing costs to the incremental costs and recalculating the ICER.
Source: Sponsor’s pharmacoeconomic submission.3
CADTH Appraisal of the Sponsor’s Economic Evaluation
CADTH identified several key limitations in the sponsor’s analysis that have notable implications on the economic analysis.
Appropriateness of a pooled analysis: Pooled analysis is not generally appropriate for the modelling of clinical effectiveness or cost-effectiveness. Larotrectinib’s PFS and OS curves are affected by the tumour-type distribution in the clinical trial, which is not representative of the patient population eligible for larotrectinib treatment. Individuals with poorer-prognosis tumour types leave the at-risk population earlier due to faster rates of progression or death, and the remaining population disproportionately represents patients with better initial prognosis. A pooled analysis does not represent the heterogeneity in response, PFS, or OS observed in the stratified Kaplan-Meier survival curves.
Economic analysis requires stratified analysis across possible indications. The calculation of incremental cost and incremental effectiveness requires the cost and effectiveness of the comparator to be explicitly considered as an alternative. Averaging across comparators that vary in their own costs and effectiveness masks the patient populations, settings, or conditions under which the new treatment may or may not be cost-effective. The decision-relevant information is the population and indication-specific ICER compared to the appropriate comparators for that population and indication. Averaging in a situation in which the average identifies that a novel therapy is “not cost-effective” with respect to contributing to a negative reimbursement recommendation may harm (via restricted access) the individuals with the indication for whom the therapy is cost-effective.
CADTH reports both the pooled analysis and stratified analysis by tumour types.
Economic analyses provided for 8 cancer subtypes when reimbursement is sought for at least 18 cancer subtypes: Clinical trial data indicates a large number of cancer sites affected with NTRK fusion cancers, and the sponsor has submitted economic analyses for 8 tumour types for which the sample size is greater than 5 patients. Substantial uncertainty exists about clinical- and cost-effectiveness in tumour types with small sample sizes and for which health economic analysis was not performed. Further, the sponsor’s submission includes references to “other” types of NTRK fusion cancers, including kidney and renal cancers, that are not included in the clinical trial population and not incorporated into the economic analysis.
The sponsor chose not to submit economic analyses for several tumour indications, and the sponsor assumed costs and benefits based on other cancer types without justification. For example, it was assumed that patients with appendix cancer could be represented by outcomes in colorectal cancer and that bone sarcoma outcomes could be represented by those of non-GIST STS. Further, the sponsor assumed that the incremental costs and outcomes of larotrectinib treatment in patients with cancer of unknown primary, hepatic, and prostate cancer incremental costs and outcomes can be estimated using a weighted average of all other cancers included in its analysis. No justification was provided for these assumptions other than the lack of larotrectinib effectiveness or safety data to support an analysis of these tumour types, including appendix cancer (n = 1), bone sarcoma (n = 2), unknown primary cancers (n = 1), hepatic cancer (n = 1), and prostate cancer (n = 1). In each of these cases, the sponsor assumes substantial health benefits in each of these cancer types compared to best supportive care without evidence of outcomes in patients with these cancer subtypes. Further, when combining the costs and benefits across all tumour types, the sponsor used weights informed primarily by the composition of the trial rather than a population representative of those who would be expected to receive treatment if larotrectinib were funded.
For tumour types with 5 or fewer patients with larotrectinib efficacy data, and for which the sponsor did not provide tumour-specific analyses, CADTH assumes no incremental gain, but full incremental cost of treatment, due to the absence of any clinical evidence to suggest otherwise in the pooled analysis.
Aggregation of disparate tumour types with very small sample sizes into groups based on their initial rate of PFS: There is no statistical justification for combining small cohorts of heterogeneous cancers with very different prognoses (e.g., NSCLC, pediatric STS, and salivary gland cancer). Combining tumour types with very different prognoses under best supportive care may artificially increase the estimated incremental benefit for poor-prognosis cancers. In 1 example, the sponsor combined IFS and pediatric STS into a single analysis of pediatric indications.
CADTH used the data directly from the relevant tumour type along with the appropriate uncertainty associated with small sample numbers. CADTH reanalysis assumes progression rates for larotrectinib are equal to that of the best supportive care comparator for each tumour type after the period for which observational data are available. Compared to the sponsor’s analysis, CADTH reanalysis assumes greater uncertainty in the extrapolation region.
Aggregation of disparate tumour types with very different prevalence of NTRK fusion cancer: NTRK fusion mutations are characteristic of IFS occurring in more than 90% of patients. In contrast, NTRK fusion mutations are rare in other forms (approximately 1%) of pediatric STS. This will greatly affect the cost-effectiveness of larotrectinib in these populations when the costs of case finding are included.
The appropriate cost of testing was applied separately to each tumour type, based on tumour-specific prevalence of NTRK fusion mutations.
Representation of uncertainty in PFS and OS in the observed period: Parametric survival models selected by the sponsor underestimated the uncertainty in the data’s observed period as represented by the confidence intervals of the Kaplan-Meier curves. The confidence intervals of the Kaplan-Meier curves presented in the sponsor’s report were significantly wider than the confidence intervals around the observed data used in the sponsor’s model.
CADTH assumed greater uncertainty in the observed period consistent with the small sample sizes in the data and uncertainty represented in the sponsor’s Kaplan-Meier survival analysis.
Extrapolation of PFS and OS past the observed period: The sponsor extrapolated directly to the end of the 10-year analysis horizon using the parametric survival curves selected to fit the data in the observed period. The sponsor did not incorporate any treatment-waning effect or increased uncertainty in the extrapolation period. Resulting extrapolations imply substantial confidence about a tremendous clinical benefit in the future. For example, using the sponsor’s probabilistic analysis, NSCLC patients treated with larotrectinib have a PFS of 34% (80% confidence interval [CI], 20% to 46%) and an OS of 69% (80% CI, 65% to 72%) at 8 years. Given the small sample size and maturity of data, this level of confidence is not plausible.
CADTH treated the observed period differently from the unobserved period post-trial data cut-off. Using a threshold of fewer than 5 remaining patients at risk to define the beginning of the unobserved period, CADTH assumed that PFS and OS followed the rates predicted by the comparator arm.
Diagnostic testing strategy for the identification of patients with NTRK fusion cancers: According to the CADTH clinical experts consulted for this review, IHC for the detection of NTRK fusions is in development and the technology is not yet available in all provinces. Limitations of IHC for NTRK screening include the inability to discriminate between expression of the wild-type and fusion protein and subjective interpretation due to heterogeneity in normal tissue expression requiring strict controls and standardized antibodies not yet widely available.4 The demonstrated sensitivity of IHC varies significantly across studies, including 1 study demonstrating a sensitivity of 75% for known NTRK gene fusions, with particularly low sensitivity in NTRK3 fusions (55%)5 and other studies reporting 95% to 97% sensitivity.6,7 Further, a study of 4,108 NTRK gene fusion-negative tumours identified a specificity of 96% that varied substantially across tumour types,8,9 presumably due to variation in the rates of wild-type protein expression. A small recent study, evaluating IHC in 66 fusion-positive cases and 317 fusion-negative cases, identified an overall sensitivity of 87.9% (79% in NTRK3 fusions) and specificity ranging from 20.8% in gliomas and 52% in salivary gland tumours to 74% in sarcomas, and 100% in colon, lung, thyroid, and appendix cancers and cholangiocarcinoma.10 Until IHC testing has been reliably validated for clinical use, it is not appropriate to consider IHC screening a “base-case” screening technology. Given currently available technologies, NTRK gene fusion testing would occur via NGS.
CADTH used NGS as the base-case testing strategy for identifying patients with NTRK gene fusion cancers.
Sponsor’s model is unnecessarily complex and coded in a manner that makes comprehensive validation impossible: The sponsor used a large number (589,941) of IFERROR statements. Such statements lead to situations in which the parameter value is overwritten with an alternative value without alerting the user to the automatized overwriting. The systematic use of IFERROR statements makes thorough auditing of the sponsor’s model impossible, as it remains unclear whether the model is running inappropriately by overriding errors. Best programming practices are such that any errors alert the user to a specific error.
The sponsor used a large number (69,442) of CHOOSE statements, which often lead to complex nested or sequences of formulas that mask model inputs. In some cases, despite the appearance of user variable control, the sponsor overrode user inputs using CHOOSE functions with hard-coded values.
In cases where simple calculations are required, there was a significant amount of complexity that impeded the ability to validate. There is no justification for the level of complexity used to derive many of the model’s inputs. Important information within the analysis is repeated several times, making it unclear which data are being used to generate results. Likewise, some data used in the analysis are “hidden” from the user, requiring the user to hunt down relevant information.
The sponsor’s report indicates that the model implements a half-cycle correction for rewards other than treatment cost, but there is no evidence of this in the submitted model.
Due to the unnecessary complexity, a full and robust validation could not be performed by CADTH and CADTH cannot be confident in the results produced by the sponsor.
CADTH also identified the following limitations with the sponsor’s analysis, although they are not considered key limitations.
Completeness of non-treatment health care costs: The sponsor’s analysis does not include age-specific non-cancer health care costs. Because the treatment is predicted to increase life expectancy, this omission biases the health economic analysis toward the intervention by reducing the incremental cost.
CADTH included non-cancer health care costs consistent with the average age of patients with each cancer type.
Inclusion criteria for AEs resulted in underestimation of the impact of AEs in the tumour-specific analysis: The sponsor only included AEs in the larotrectinib and comparator arms if they occurred in more than 5% of the population in the pooled analysis. For example, the sponsor identified that neutropenia occurs in 42% of non-GIST STS patients receiving best supportive care (doxorubicin + ifosfamide),2 but because non-GIST STS represents 10.3% of the larotrectinib trial population, the AEs did not meet the criteria for inclusion in either the pooled or tumour-stratified analysis. This approach underestimated the costs and disutilities of AEs in the comparator arm, in some cases by substantial amounts (e.g., in non-GIST STS the average cost of AEs increased from $7,222 in the sponsor’s analysis to $14,965 and the average disutility of −0.068 in the sponsor’s analysis to −0.179) (Table 14).
CADTH was unable to fix this error.
Weights used in the sponsor’s combination of costs and QALYs do not represent the relative distribution of eligible NTRK fusion cancers across tumour sites based on tumour incidence and NTRK fusion mutation prevalence: The sponsor’s analysis used weights partially informed by the distribution of tumour types in the larotrectinib trial with several modifications as previously noted. These weights differ substantially from the relative incidence of the population expected to receive treatment if larotrectinib were funded, based on the incidence of each cancer type and the prevalence of NTRK fusion cancers within that tumour type.
CADTH assumed more appropriate Canadian weights where possible. A comparison of the weights used in the sponsor’s analysis and the CADTH reanalysis is presented in Figure 4.
Time horizon for analysis: Across the larotrectinib survival models used for the tumour-specific analysis, 15.3% of the larotrectinib patients were alive at the end of the 10-year analysis horizon for tumour sites assumed to have below-average larotrectinib survival (CNS/glioma, colorectal, melanoma, and adult non-GIST STS) and 62.4% of the larotrectinib patients were alive at the end of the 10-year analysis horizon for tumour sites assumed to have above-average larotrectinib survival (NSCLC, salivary gland [MASC], and pediatric cancers [STS and IFS]). At the end of the 10-year analysis horizon for the pooled analysis, and for the tumour-specific analysis of tumour sites assumed to have average larotrectinib survival (breast and thyroid), 36% of patients receiving larotrectinib were alive. CADTH guidelines require a lifetime horizon to be considered.
CADTH chose more appropriate extrapolations of OS and, when appropriate to achieve a lifetime horizon, ran a longer time horizon.
Appropriateness or representativeness of the comparator survival curves: The single clinical trials informing the Kaplan-Meier curves for each of the comparator arms may not be representative data for those treatment alternatives (Table 13). Further, no trial selected to represent a comparator arm had any information about NTRK status. It is possible that the subset of patients affected by NTRK fusion have different PFS or OS rates compared with the other patients in these trials.
CADTH was unable to address this limitation, and highlights the significant uncertainty this adds to the analysis.
Inflation adjustment was inconsistent and not completed. The sponsor’s report indicates that costs were adjusted for inflation to 2018 for some costs and to 2019 for others. The table reporting the consumer price index in the model does not appear to be connected to any calculations. A review of the primary sources indicated that the non–treatment-related health care costs used were not adjusted for inflation and were the costs as reported in 2009 and 2012 Canadian dollars. Inflation adjustment results in a 16.5% increase in costs presented in 2009 dollars and a 9.6% increase in costs presented in 2012 dollars.
CADTH corrected the inflation adjustment for non-treatment cancer costs to 2018 Canadian dollars.
CADTH Reanalyses of the Economic Evaluation
Base-Case Results
The CADTH reanalysis addressed the limitations of the submitted model and report as outlined above. Details of these changes with specific tables of input values are presented in Appendix 4.
Table 5: CADTH Revisions to the Submitted Economic Evaluation
Stepped analysis | Sponsor’s value or assumption | CADTH value or assumption |
|---|---|---|
Corrections to sponsor’s base case | ||
None | — | — |
Changes to derive the CADTH reanalysis | ||
1. Analysis horizon | The sponsor used a 10-year analysis horizon. | Consistent with health economic guidelines, CADTH assumed a lifetime horizon for each analysis. |
2. Larotrectinib survival curve analysis | The sponsor classified disparate tumour types with very small sample sizes into groups based on their initial rate of PFS. The clinical or statistical appropriateness was not justified. The sponsor fit parametric curves to each of these classified groups (above average, average, and below-average PFS), selecting the parametric model based on quality of fit measured by AIC. The sponsor extrapolated larotrectinib-fitted PFS and OS for the duration of the model-based horizon (10 years) without considering a treatment-waning effect or increased uncertainty in the extrapolation period. | CADTH reanalysis of the larotrectinib survival curves divided the curves for each tumour site into an “observed” period (until there were 5 or fewer patients at risk) and an “extrapolation” period. Due to small sample sizes for each individual indication, in the observed period, CADTH assumed a constant hazard rate using a single point estimate on the larotrectinib curves (the point at which approximately 50% of the original population remained at risk). In the extrapolation period, PFS and OS followed the rate used in the sponsor’s comparator survival curves. Effects of these assumptions are presented for all tumour sites in Appendix 4. Parameters for survival curves in the reanalysis are presented in Table 18. |
3. Aggregation of IFS with other pediatric STS | The sponsor presented 1 analysis combining both pediatric indications. | Due to the differences in these populations, CADTH reanalysis stratified this group further. Each on their own had among the larger sample sizes included in the larotrectinib trial (32 IFS patients and 20 pediatric STS patients). This raises awareness to an important limitation that is not resolved by the separation of these analyses: the comparator arm of the pediatric STS analysis is represented by data in patients aged less than 2 years with IFS. |
4. Testing protocol | The sponsor assumed that incremental testing would largely be completed with low-cost IHC screening followed up with higher-cost confirmation using NGS (details in Table 12). Further, the sponsor’s calculations for the incremental cost of test per NTRK fusion cancer detected were unclear. In some cases, CADTH attempts to reproduce these calculations resulted in values that were similar to the sponsor’s calculations and in other instances they were quite different. | CADTH clinical experts described IHC for the detection of NTRK fusion cancers as in development. As a result, in the CADTH base case, the testing technology is NGS, resulting in higher costs per case detected (Table 21). CADTH considered using IHC testing in a scenario analysis as this technology may be fully developed, validated for each tumour type, and available in the next 1 to 2 years. For this scenario analysis, CADTH used the testing cost per case presented in Table 21. |
5. Uncertainty in the PFS curve of salivary gland NTRK fusion cancers treated with cisplatin + vinorelbine | The sponsor’s source study for PFS and OS in salivary gland NTRK fusion cancers treated with cisplatin + vinorelbine did not present a Kaplan-Meier curve for PFS. The sponsor fit an exponential distribution using median survival. Assumptions specific to the standard error of the exponential rate parameter are not stated. The sponsor’s assumption for the standard error resulted in very little uncertainty in the PFS curve. This level of uncertainty was not consistent with the phase II trial given the age of the trial (1993 to 1997 recruitment), the sample size of the trial (n = 36), and the uncertainty as to whether any patients in the trial had NTRK fusion cancers. The standard error in the sponsor’s base case appears not to have been selected empirically or based on the source study sample size; it appears to be set such that the 95% confidence intervals will occur at values ± 20% the base-case value. | The standard error on the sponsor’s base-case rate estimate was multiplied by 5 to increase the range of PFS curves to approximately align with the range of uncertainty represented in the comparator arms of other indications. |
6. Uncertainty in the OS survival curve for IFS and pediatric STS | The source study for PFS and OS in pediatric STS and IFS fusion cancers treated with best supportive care presents a retrospective case review of advanced pediatric nonrhabdomyosarcoma STS patients treated with a combination of surgery and chemotherapy between 1983 and 2003 (n = 25), with a median follow-up of 2.7 years.11 The median patient age was 16.7 years. No patients with IFS were included in the case review. | The sponsor’s assumption for the standard error resulted in very little uncertainty in the OS curve. The sponsor’s fitted exponential and log-normal parametric curves led to similar mean survival curves, but the uncertainty in the parameters of the log-normal curve represented greater overall uncertainty in OS. CADTH used the log-normal curve provided by the sponsor in the reanalysis. This level of uncertainty was more consistent with the age of the data (1983 to 2003), the size of the cohort report (n = 25), and the application of this data to younger patients with IFS not represented in the study population. |
7. Inflation adjustment for non-cancer-related health care costs | The sponsor’s report indicated adjusting non-treatment-related cancer costs for inflation to 2018 dollars. The sponsor’s non-treatment-related cost input assumptions are presented in Table 16. A review of the primary sources indicated that the costs used were not adjusted for inflation and were directly the costs as reported in 2009 CA$ and 2012 CA$. | CADTH adjusted the non-treatment-related cancer costs. Inflation adjustment results in a 16.5% increase in costs presented in 2009 CA$ and a 9.6% increase in costs presented in 2012 CA$. |
8. Age-specific non–cancer-related health care costs | The sponsor’s analysis included non-treatment-related cancer costs based on Canadian data; however, these were the net costs of matched controls without cancer. Non-cancer health care costs were not included in the sponsor’s analysis. The sponsor’s non–treatment-related cost input assumptions are presented in Table 16. | Age-specific costs (in 2018 CA$) based on the sponsor’s reported average patient age by indication were retrieved from CIHI data and added to the incremental continuing care costs (averaged across gender and inflated to 2018 dollars). Updated costs are presented in Appendix 3. |
9. Weights used in the combination of the tumour-specific analyses into the pooled analysis | The sponsor’s analysis used weights largely informed by the distribution of tumour types in the larotrectinib trial with several modifications. | CADTH reanalysis used the relative incidence of the population expected to receive treatment if larotrectinib were funded. A comparison of the weights used in the sponsor’s analysis and the CADTH reanalysis is presented in Figure 4. |
AIC = Akaike information criterion; IFS = infantile fibrosarcoma; IHC = immunohistochemistry; NGS = next-generation sequencing; NTRK = neurotrophic tyrosine receptor kinase; OS = overall survival; PFS = progression-free survival; STS: soft tissue sarcoma.
Base-Case Results
CADTH reanalysis was performed evaluating the cost-effectiveness of larotrectinib compared to best supportive care for patients with each NTRK fusion cancer stratified by primary solid tumour site. Specifically, detailed analyses were performed for CNS/glioma, colorectal cancer, IFS, NSCLC, melanoma, salivary gland cancer, adult non-GIST STS, pediatric STS, and thyroid cancer. Detailed results are not available for other tumour sites because insufficient information was available about the effectiveness of larotrectinib in patients with the tumour type to estimate PFS and OS curves (all of these tumour sites except breast cancer have fewer than 5 patients), few observed events and high rates of censoring (e.g., for breast cancer), and in some cases no information was provided by the sponsor to inform outcomes of best supportive care in these tumour types. CADTH performed stratified reanalysis on all tumour types for which the sponsor provided a stratified analysis.
Detailed results for each tumour subtype, including price reductions and detailed cost and QALY breakdown, are presented in Appendix 4.
Tumour-Specific Analysis Summary
In the CADTH reanalysis, the identified incremental QALYs from larotrectinib treatment compared to best supportive care ranged from −0.54 QALYs (melanoma) to 1.67 QALYs (IFS) (Table 6). The 4 tumour types with the largest incremental health gains were IFS (1.67 QALYs), pediatric STS (1.51 QALYs), salivary gland cancer (1.44 QALYs), and non-GIST adult STS (1.31 QALYs). Average estimated health gains were positive but smaller in NSCLC (0.84 QALYs), CNS/glioma (0.54 QALYs), colorectal cancer (0.30 QALYs), and thyroid cancer (0.14 QALYs). CADTH reanalysis identified high uncertainty in whether larotrectinib was clinically superior to best supportive care in many tumour types. The proportion of simulations in which best supportive care resulted in greater health gains exceeded 15% for most tumour types, including melanoma (a 59.5% chance that larotrectinib results in a negative net clinical benefit), thyroid (39.6%), pediatric STS (25.5%), IFS (18.2%), and CNS/glioma (15.5%) (Figure 15). In part, this uncertainty is driven by uncertainty in the PFS and OS of best supportive care due to small sample-size estimates in the literature of patients who may not (and in many cases, are unlikely to) have NTRK fusion mutations. Substantial uncertainty remains regarding PFS and OS following larotrectinib treatment for these tumour types in the absence of randomized comparative data and due to the relatively small sample sizes for each tumour type.
CADTH reanalysis indicates that treatment of melanoma with larotrectinib is dominated, meaning that it costs more and provides fewer expected health gains compared to an alternative. Among tumour types for which the average health gain was positive, the ICER of larotrectinib compared to best supportive care ranged from $111,395 per QALY gained (adult [non-GIST] STS) to $414,521 per QALY gained (thyroid cancer) (Table 6). Driven largely by uncertainty in effectiveness, the uncertainty in the ICERs is very high. Across all indications, the probabilistic analysis indicated that the probability that larotrectinib is cost-effective at a willingness-to-pay threshold of $50,000 per QALY gained is less than 1%. Across the modelled tumour sites, the price reduction required to achieve an ICER of $50,000 per QALY gained ranges from 50% to 60% (adult [non-GIST] STS) to between 90% and 95% (thyroid) (Table 7).
Incorporating the cost of case identification using NGS testing increases the incremental costs compared to the analysis in which NTRK fusion status is assumed to be known. As a result, the ICERs all increase (Table 6). There continues to be a wide range across tumour sites: from $183,055 per QALY gained (adult non-GIST STS) to $818,375 per QALY gained (NSCLC). This analysis reveals the importance of the cost of case finding in the overall cost-effectiveness of larotrectinib and, specifically in the case of NSCLC, in which NTRK fusion mutations are extremely rare (affecting 0.2% of NSCLC patients). In IFS, in which NTRK fusion mutations are characteristic, there is little change to the ICER after incorporating the costs of testing. Across the modelled tumour sites, incorporating the cost of case finding means the price reduction required to achieve an ICER of $50,000 per QALY gained is greater than 95% in several indications; this level of health economic value cannot be achieved at any price for CNS/glioma, NSCLC, and salivary gland tumours due to the high costs of case finding (Table 7).
Pooled Analysis
In this section we also present the CADTH “pooled” analysis. In this analysis, for the aggregation of multiple indications into a single health economic analysis, and for indications that were not modelled, the expected health gain compared to the next-best alternative (in this case, best supportive care) is equal to 0 but the cost of treatment is still incurred. Uncertainty around the incremental cost and incremental QALY estimates for these indications reflect the magnitude of uncertainty in the modelled populations. The overall incremental cost and overall incremental QALYs are then calculated using a weighted average across tumour sites, with the weights determined by the relative incidence of patients with NTRK fusion cancers each year (Table 41).
In the pooled analysis, the overall average incremental cost is $178,582 (95% CI, $144,275 to $215,855) and the average incremental health gains are 0.28 QALYs (95% CI, −0.89 to 1.22 QALYs) (Table 6). Overall, there is a 26.1% probability that larotrectinib is clinically dominated, meaning that it has a lower average QALYs than best supportive care. Overall, the ICER of larotrectinib compared to best supportive care averaged across indications in patients known to have NTRK fusion cancers is $426,077 (95% CI, 151,302 to dominated). The relatively high ICER and very high uncertainty are driven by 3 main factors. First is the uncertainty in the comparative PFS and OS of larotrectinib in tumour types with very few patients and the necessity to assume, without clinical evidence, no expected health gain. Second is the low comparative PFS and OS in modelled tumour types with relatively superior prognosis alternatives. Third is the inclusion of all tumour indications in the overall average, including those estimated to have a negative net clinical benefit. Overall, in patients with a known NTRK fusion cancer, a price reduction of greater than 90% is required to achieve an ICER of $50,000 per QALY gained (Table 42).
Averaging across all tumour types, the incremental cost of identifying a patient with an NTRK fusion cancer is $210,256 (95% CI, $178,716 to $245,294). Incorporating the costs of case finding using NGS testing results in an increase of the ICER of larotrectinib compared to best supportive care to $929,434 (95% CI, $318,579 to dominated). After incorporating the costs of identifying patients with NTRK fusion cancers, no larotrectinib price reduction can achieve an ICER of $50,000 per QALY gained (Table 42).
Scenario Analysis
A scenario analysis reporting the cost-effectiveness of larotrectinib in patients, including the costs of patient identification through IHC screening with NGS confirmation for each tumour subtype, is presented in Table 43 of Appendix 4. CADTH did not perform any analyses comparing larotrectinib to earlier lines of therapy as the Health Canada product monograph states that larotrectinib should only be used when a patient has no satisfactory treatment options.
Table 6: Summary of CADTH Reanalysis for the Incremental Costs, Quality-Adjusted Life-Years, and Cost-Effectiveness of Larotrectinib in Patients Known (and Not Known) to Have an NTRK Fusion Cancer
Tumour site | Incremental cost (95% CI) | Incremental cost of testing (95% CI) | Incremental QALY (95% CI) | Probability larotrectinib is clinically dominated | Median ICER (95% CI) | Median ICER including testing (95% CI) |
|---|---|---|---|---|---|---|
Appendix (vs. BSC) | $28,266 ($13,329 to $65,130) | $220,050 ($120,848 to $402,177) | 0.01 (−0.60 to 0.59) | 49.2% | $3,880,780 ($35,159 to dominated) | $35,940,282 ($356,797 to dominated) |
Bone sarcoma (vs. BSC) | $145,146 ($52,837 to $344,151) | $474,576 ($210,495 to $1,016,123) | −0.01 (−2.23 to 2.27) | 51.3% | Dominated ($44,770 to dominated) | Dominated ($231,604 to dominated) |
Breast (vs. BSC) | $172,361 ($36,733 to $304,406) | $787,569 ($472,275 to $1,311,302) | 0.00 (−2.60 to 2.50) | 49.7% | $10,481,443 ($41,554 to dominated) | $74,650,428 ($357,389 to dominated) |
Cancer of unknown primary origin (vs. BSC) | $171,185 ($35,076 to $304,720) | $480,438 ($208,329 to $1,091,001) | 0.01 (−2.43 to 2.46) | 50.1% | Dominated ($45,518 to dominated) | Dominated ($219,993 to dominated) |
Cholangiocarcinoma (vs. BSC) | $110,262 ($40,234 to $237,879) | $338,636 ($162,257 to $687,243) | 0.02 (−2.44 to 2.54) | 49.1% | $4,618,873 ($31,078 to dominated) | $20,860,391 ($149,782 to dominated) |
CNS/glioma (vs. BSC) | $101,821 ($54,083 to $156,438) | $101,821 ($54,083 to $156,438) | 0.54 (−1.02 to 1.56) | 15.8% | $160,396 ($73,864 to dominated) | $332,589 ($144,717 to dominated) |
Colorectal (vs. BSC) | $62,997 ($34,685 to $91,499) | $19,953 ($15,358 to $26,046) | 0.30 (−0.40 to 0.81) | 13.8% | $192,472 ($87,793 to dominated) | $252,967 ($116,784 to dominated) |
Hepatic (vs. BSC) | $174,405 ($35,165 to $314,302) | $477,531 ($208,194 to $1,070,688) | 0.01 (−2.42 to 2.49) | 49.7% | $13,360,113 ($45,463 to dominated) | $44,554,812 ($217,971 to dominated) |
IFS (vs. BSC) | $348,834 ($137,557 to 596,264) | $1,149 ($1,094 to $1,223) | 1.67 (−2.10 to 5.24) | 18.2% | $202,830 ($96,960 to dominated) | $203,383 ($97,258 to dominated) |
NSCLC (vs. BSC) | $147,012 ($99,820 to $197,377) | $573,518 ($310,394 to $1,035,915) | 0.84 (0.00 to 1.41) | 2.5% | $164,685 ($110,558 to $22,694,043) | $818,375 ($424,576 to $164,401,271) |
Melanoma (vs. BSC) | $137,175 ($77,701 to $211,951) | $351,331 ($234,917 to $521,669) | −0.54 (−4.04 to 1.34) | 59.5% | Dominated ($121,287 to dominated) | Dominated ($372,273 to dominated) |
Pancreas (vs. BSC) | $171,469 ($36,852 to $307,917) | $350,429 ($233,257 to $514,926) | 0.02 (−2.43 to 2.51) | 49.1% | $8,146,741 ($43,698 to dominated) | $27,086,645 ($193,445 to dominated) |
Prostate (vs. BSC) | $171,873 ($34,692 to $304,340) | $482,903 ($210,360 to $1,090,908) | −0.01 (−2.47 to 2.47) | 50.6% | Dominated ($42,747 to dominated) | Dominated ($216,247 to dominated) |
Salivary gland (MASC) (vs. BSC) | $386,026 ($291,971 to 491,507) | $321,337 ($143,640 to $702,064) | 1.44 (−0.78 to 2.53) | 5.7% | $237,880 ($159,487 to dominated) | $438,812 ($259,611 to dominated) |
STS, adult (GIST) (vs. BSC) | $109,513 ($40,338 to $226,925) | $220,117 ($138,090 to $349,703) | 0.00 (−2.45 to 2.42) | 49.4% | $6,678,954 ($32,724 to dominated) | $16,898,983 ($124,275 to dominated) |
STS, adult (non-GIST) (vs. BSC) | $166,008 ($62,688 to $271,374) | $109,775 ($69,790 to $173,410) | 1.31 (−1.72 to 2.88) | 10.6% | $111,395 ($57,088 to dominated) | $183,055 ($100,055 to dominated) |
STS pediatric (vs. BSC) | $279,784 ($66,734 to $528,610) | $109,786 ($69,325 to $171,433) | 1.15 (−2.53 to 4.72) | 25.5% | $234,720 ($85,031 to dominated) | $323,821 ($113,854 to dominated) |
Thyroid (vs. BSC) | $267,747 ($167,892 to 393,091) | $17,645 ($13,513 to $23,367) | 0.14 (−5.97 to 3.98) | 39.6% | $414,521 ($86,433 to dominated) | $444,455 ($91,552 to dominated) |
Pooled analysisa | $178,582 ($144,275 to $215,855) | $210,256 ($178,716 to $245,294) | 0.28 (−0.89 to 1.22) | 26.1% | $426,077 ($151,302 to dominated) | $929,434 ($318,579 to dominated) |
BSC = best supportive care; CNS = central nervous system; GIST = gastrointestinal stromal tumour; ICER = incremental cost-effectiveness ratio; IFS = infantile fibrosarcoma; MASC = mammary analogue secretory carcinoma; NSCLC = non–small cell lung cancer; QALY = quality-adjusted life-year; STS = soft tissue sarcoma; vs. = versus.
aThe pooled analysis was derived by weighting the results by cancer incidence as calculated in Table 45.
Table 7: Summary of CADTH Price Reduction Analysis for Each Indication and Overall
Tumour site | Price reduction required to achieve median ICER < $50,000 per QALY gained | |
|---|---|---|
Patients with known mutation | Including testing to identify eligible patients | |
Appendix (vs. BSC) | Cannot be achieved | Cannot be achieved |
Bone sarcoma (vs. BSC) | Cannot be achieved | Cannot be achieved |
Breast (vs. BSC) | Cannot be achieved | Cannot be achieved |
Cancer of unknown primary (vs. BSC) | Cannot be achieved | Cannot be achieved |
Cholangiocarcinoma (vs. BSC) | Cannot be achieved | Cannot be achieved |
CNS/glioma (vs. BSC) | 70% to 80% | Cannot be achieved |
Colorectal (vs. BSC) | 70% to 80% | > 95% |
Hepatic (vs. BSC) | Cannot be achieved | Cannot be achieved |
IFS (vs. BSC) | 60% to 70% | 60% to 70% |
NSCLC (vs. BSC) | 60% to 70% | Cannot be achieved |
Melanoma (vs. BSC) | Cannot be achieved | Cannot be achieved |
Pancreas (vs. BSC) | Cannot be achieved | Cannot be achieved |
Prostate (vs. BSC) | Cannot be achieved | Cannot be achieved |
Salivary gland (MASC) (vs. BSC) | 80% to 90% | Cannot be achieved |
STS, adult (GIST) (vs. BSC) | Cannot be achieved | Cannot be achieved |
STS, adult (non-GIST) (vs. BSC) | 50% to 60% | > 95% |
STS pediatric (vs. BSC) | 60% to 70% | > 95% |
Thyroid (vs. BSC) | 90% to 95% | > 95% |
Pooled analysis | > 90% | Cannot be achieved with reduction in drug cost alone |
BSC = best supportive care; CNS = central nervous system; GIST = gastrointestinal stromal tumour; ICER = incremental cost-effectiveness ratio; IFS = infantile fibrosarcoma; MASC = mammary analogue secretory carcinoma; NSCLC = non–small cell lung cancer; QALY = quality-adjusted life-year; STS = soft tissue sarcoma; vs. = versus.
Overall Conclusions
Based on the available evidence and analysis performed by CADTH, the ICER of larotrectinib compared to current last-line therapy (best supportive care) exceeds $400,000 per QALY gained in patients with known NTRK fusion cancers and $900,000 per QALY gained when the costs of identifying patients with NTRK fusion mutations are incorporated.
CADTH undertook reanalyses to address several key limitations of the sponsor’s model. CADTH’s reanalyses included a more plausible extrapolation for long-term PFS and OS, increased uncertainty in the PFS and OS consistent with the small sample sizes for each patient subtype, an assumption of no expected treatment benefit in patient subtypes with observational data representing 5 or fewer patients (none of which were modelled by the sponsor), and the incremental costs of testing using NGS to identify eligible patients. These corrections increased the ICERs of larotrectinib compared to best supportive care across individual clinical indications, and in the combined analysis compared to the sponsor’s submitted analysis. CADTH was unable to address limitations stemming from the excessive complexity of the sponsor’s model. As such, CADTH was unable to validate the calculations in the model. It is possible that further limitations beyond those identified could exist and these could result in an underestimate of the true ICER for larotrectinib.
Pooled analysis across tumour sites masks heterogeneity in the comparative effectiveness, relative efficiency of screening to identify patients with NTRK fusion mutations, and comparative health economics across indications. Across tumour sites, the ICER of larotrectinib patient identification and treatment varied from $183,055 per QALY gained in adult patients with non-GIST STS and $203,383 per QALY gained in pediatric patients with IFS to $818,375 per QALY gained in patients with NSCLC and to extremely high values and situations in which larotrectinib is both clinically and economically dominated, meaning that the alternative treatment costs less and provides, on average, greater clinical benefit than larotrectinib. In part due to differences in prognoses with best supportive care, patients with some tumour sites were more likely to expect clinically meaningful positive health benefits with larotrectinib. However, in some tumour sites, uncertainty in the comparative clinical effectiveness due to small sample sizes resulted in significant probabilities of a negative clinical benefit associated with harms. For example, the chance of a negative net clinical benefit was 60% in patients with melanoma, 40% in patients with thyroid cancer, and 25% in pediatric patients with STS.
A main factor affecting the variation in incremental costs across indications is the cost of identifying patients with the mutation due to varying prevalence across tumour sites. Currently NTRK fusion testing is not routine for any specific cancer type outside of research purposes. Although testing for NTRK gene fusion by IHC continues to be an area of research, patients require NGS testing to identify their mutation status. The incremental cost of identifying patients with thyroid cancer or secretory breast cancer in which NTRK gene fusion is relatively frequent is approximately $20,000. However, for many tumour types, NTRK fusions are rare, affecting less than 1% of patients, leading to incremental costs of detecting a single larotrectinib-eligible patient that are higher than the incremental costs of treatment itself (e.g., $573,518 per NSCLC patient identified to have an NTRK fusion mutation).
Among patients with known NTRK fusion mutation, the price reduction required to achieve an ICER of $50,000 per QALY gained across indications ranges from 50% to 60% in STS, adult (non-GIST) cancers to between 90% and 95% in thyroid cancers. In some cancer types, such as melanoma, no price reduction will make larotrectinib cost-effective because the major driver of outcomes is uncertainty in the clinical benefit. In a setting where NGS testing is not routinely performed, the costs of patient identification dominate the costs of larotrectinib treatment, resulting in a situation in which no reduction in drug cost will make larotrectinib cost-effective. For the specific indication of IFS, a price reduction of 60% to 70% could achieve an ICER of $50,000 per QALY gained.
References
1.pan-Canadian Oncology Drug Review (pCODR) final economic guidance report: larotrectinib (vitrakvi) for neurotrophic tyrosine receptor kinase (NTRK) positive solid tumours. Ottawa (ON): CADTH; 2019: https://cadth.ca/sites/default/files/pcodr/Reviews2019/10159LarotrectinibNTRK%2BSolidTumours_fnEGR_NOREDACT-ABBREV_Post_31Oct2019_final.pdf. Accessed 2021 Jan 19.
2.Judson I, Verweij J, Gelderblom H, et al. Doxorubicin alone versus intensified doxorubicin plus ifosfamide for first-line treatment of advanced or metastatic soft-tissue sarcoma: a randomised controlled phase 3 trial. Lancet Oncol. 2014;15(4):415-423. PubMed
3.Pharmacoeconomic evaluation [internal sponsor's report]. In: Drug Reimbursement Review sponsor submission: Vitrakvi (larotrectinib) for treatment of adult and pediatric patients with solid tumours that have NTRK gene fusion, 25 mg and 100 mg capsules, 20 mg/mL solution. Mississauga (ON): Bayer Inc; 2020 Nov 13.
4.Wong D, Yip S, Sorensen PH. Methods for identifying patients with tropomyosin receptor kinase (TRK) fusion cancer. Pathol Oncol Res. 2020;26(3):1385-1399. PubMed
5.Gatalica Z, Xiu J, Swensen J, Vranic S. Molecular characterization of cancers with NTRK gene fusions. Mod Pathol. 2019;32(1):147-153. PubMed
6.Rudzinski E, Lockwood CM, Stohr BA, et al. Pan-Trk immunohistochemistry identifies NTRK rearrangements in pediatric mesenchymal tumours. Am J Surg Pathol. 2018;42(7):927-935. PubMed
7.Hechtman JF, Benayed R, Hyman DH, et al. Pan-Trk immunohistochemistry is an efficient and reliable screen for the detection of NTRK fusions. Am J Surg Pathol. 2017;41(11):1547-1551. PubMed
8.Feng J, Ebata K, Hansen F, et al. TRK wild-type and fusion protein expression in solid tumours: characterization by immunohistochemistry and in situ hybridization. Ann Oncol. 2018;29(Suppl 6):vi27.
9.Hsiao S, Zehir A, Sireci A, Aisner D. Detection of tumor NTRK gene fusions to identify patients who may benefit from tyrosine kinase (TRK) inhibitor therapy. J Mol Diagn. 2019;21(4):553-571. PubMed
10.Solomon P, Linkov I, Rosado A, et al. NTRK fusion detection across multiple assays and 33,997 cases: diagnostic implications and pitfalls. Mod Pathol. 2020;33(1):38-46. PubMed
11.Nathan PC, Tsokos M, Long L, et al. Adjuvant chemotherapy for the treatment of advanced pediatric nonrhabdomyosarcoma soft tissue sarcoma: the National Cancer Institute experience. Pediatr Blood Cancer. 2005;44(5):449-454. PubMed
12.DeltaPA. Ottawa (ON): IQVIA; 2021: https://www.iqvia.com/. Accessed 2021 Jan 12.
13.Interim Clinical Study Report: LOXO-TRK-14001. A phase 1 study of the oral TRK inhibitor LOXO-101 in adult patients with solid tumors [internal sponsor's report]. San Francisco (CA): Loxo Oncology, Inc; 2017 Sep 25.
14.Interim Clinical Study Report: LOXO-TRK-15003. A phase 1/2 study of the oral TRK inhibitor LOXO-101 in pediatric patients with advanced solid or primary central nervous system tumors [internal sponsor's report]. Stamford (CT): Loxo Oncology, Inc; 2017 Dec 13.
15.Capecitabine: 150 mg and 500 mg tablets [product monograph]. Kirkland (QC): Accord Healthcare Inc; 2019 Nov 6: https://pdf.hres.ca/dpd_pm/00053877.PDF. Accessed 2021 Jan 19.
16.Carboplatin: 10 mg / mL (50 mg, 150 mg, 450 mg, 600 mg per vial) injection [product monograph]. Kirkland (QC): Pfizer Canada ULC; 2019 Dec 16: https://pdf.hres.ca/dpd_pm/00054389.PDF. Accessed 2021 Jan 19.
17.Cisplatin: 1 mg/mL (10 mg, 50 mg, 100 mg per vial) injection [product monograph]. Toronto (ON): Teva Canada Limited; 2016 Oct 31: https://pdf.hres.ca/dpd_pm/00036984.PDF. Accessed 2021 Jan 19.
18.Docetaxel: 10 mg/mL injection (for intravenous infusion) [product monograph]. Kirkland (QC): Pfizer Canada Inc; 2018 Jun 1: https://pdf.hres.ca/dpd_pm/00045702.PDF. Accessed 2021 Jan 19.
19.Doxorubicin hydrochloride: 2 mg/mL injection (10 mg (5 mL), 50 mg (25 mL) and 200 mg (100 mL) vials) injection [product monograph]. Toronto (ON): Teva Canada Limited; 2019 Oct 17: https://pdf.hres.ca/dpd_pm/00053606.PDF. Accessed 2021 Jan 19.
20.Gemcitabine (gemcitabine hydrochloride): 1g and 2g per vial injection [product monograph]. Kirkland (QC): Accord Healthcare Inc; 2020 Mar 24: https://pdf.hres.ca/dpd_pm/00055544.PDF. Accessed 2021 Jan 19.
21.Ifosfamide: 1g / vial and 3g / vial injection [product monograph]. Toronto (ON): Fresenius Kabi Canada Ltd; 2018 Oct 10: https://pdf.hres.ca/dpd_pm/00047800.PDF. Accessed 2021 Jan 19.
22.Lenvima (lenvatinib mesylate): 4mg and 10mg capsules [product monograph]. Mississauga (ON): Esai Limited; 2018 Dec 19: https://pdf.hres.ca/dpd_pm/00048812.PDF. Accessed 2021 Jan 19.
23.Optivo (nivolumab): intravenous infusion, 10 mg /mL, 40 mg and 100 mg single-use vials injection [product monograph]. Montreal (QC): Bristol-Myers Squibb Canada Co; 2021 Feb 11: https://pdf.hres.ca/dpd_pm/00059979.PDF. Accessed 2021 Jan 19.
24.Keytruda (pembrolizumab): 50 mg powder for solution for infusion, 100 mg/4 mL vial solution fo infusion [product monograph]. Kirkland (QC): Merck Canada Inc; 2021 Feb 5: https://pdf.hres.ca/dpd_pm/00059873.PDF. Accessed 2021 Jan 19.
25.Pemetrexed (pemetrexed disodium): 100 mg, 500 mg per vial injection [product monograph]. Toronto (ON): Teva Canada Limited; 2016 Dec 1: https://pdf.hres.ca/dpd_pm/00037290.PDF. Accessed 2021 Jan 19.
26.Stivarga (regorafenib): 40 mg tablets [product monograph]. Mississauga (ON): Bayer Inc; 2020 Mar 9: https://pdf.hres.ca/dpd_pm/00055344.PDF. Accessed 2021 Jan 19.
27.Topotecan (topotecan hydrochloride): 1 mg per vial, 4 mg per vial injection [product monograph]. Montreal (QC): Pharmascience Inc; 2016 May 4: https://pdf.hres.ca/dpd_pm/00034898.PDF. Accessed 2021 Jan 19.
28.Vinorelbine (vinorelbine tartrate): 10 mg/mL solution for injection [product monograph]. Etobicoke (ON): Mylan Pharmaceuticals ULC; 2014 Jun 23: https://pdf.hres.ca/dpd_pm/00025568.PDF. Accessed 2021 Jan 19.
29.CeeNU (lomustine): 10, 40 and 100 mg capsules [product monograph]. Montreal (QC): Bristol-Myers Squibb Canada; 2016 Feb 17: https://pdf.hres.ca/dpd_pm/00033792.PDF. Accessed 2021 Jan 19.
30.Paclitaxel: 6 mg/mL solution for injection [product monograph]. Kirkland (QC): Pfizer Canada ULC; 2020 May 6: https://pdf.hres.ca/dpd_pm/00056371.PDF. Accessed 2021 Jan 19.
31.Etoposide: 20 mg/mL (100 mg/5 mL, 200 mg/10 mL, 400 mg/25 mL, 1 g/50 mL) injection [product monograph]. Boucherville (QC): Sandoz Canada Inc; 2015 May 21: https://pdf.hres.ca/dpd_pm/00030580.PDF. Accessed 2021 Jan 19.
32.Vincristine sulfate: 1 mg/mL injection [product monograph]. Scarborough (ON): Teva Canada Limited; 2014 Mar 27: https://pdf.hres.ca/dpd_pm/00024686.PDF. Accessed 2021 Jan 19.
33.Fluorouracil: 50 mg/mL (5 g/100 mL) injection [product monograph]. Kirkland (QC): Pfizer Canada ULC; 2019 Aug 7: https://pdf.hres.ca/dpd_pm/00052606.PDF. Accessed 2021 Jan 19.
34.Leucovorin calcium: 10 mg/mL injection [product monograph]. Kirkland (QC): Pfizer Canada Inc; 2018 Jun 21: https://pdf.hres.ca/dpd_pm/00046041.PDF. Accessed 2021 Jan 19.
35.Eloxatin (oxalipatin): 50 mg/vial and 100 mg/vial lyophilized powder for injection, 5 mg/mL solution fo injection [product monograph]. Laval (QC): sanofi-aventis Canada Inc; 2015 Mar 13: https://pdf.hres.ca/dpd_pm/00029755.PDF. Accessed 2021 Jan 19.
36.pan-Canadian Oncology Drug Review (pCODR) final economic guidance report: nivolumab (Opdivo) for metastatic melanoma. Ottawa (ON): CADTH; 2016: https://cadth.ca/sites/default/files/pcodr/nivolumab_opdivo_mm_fn_egr.pdf. Accessed 2021 Jan 19.
37.CADTH Drug Reimbursement Review: pharmacoeconomic report for pembrolizumab (Keytruda). Ottawa (ON): CADTH; 2020: https://cadth.ca/sites/default/files/pcodr/Reviews2020/10216PembrolizumabHNSCC_fnEGR_REDACTABBREV_EC22Dec2020_final.pdf. Accessed 2021 Feb 9.
38.Exceptional Access Program (EAP). Toronto (ON): Ontario Ministry of Health; Ontario Ministry of Long-Term Care; 2021: https://www.health.gov.on.ca/en/pro/programs/drugs/odbf/odbf_except_access.aspx. Accessed 2021 Jan 19.
39.MFOLFOX6 regimen: folinic acid (leucovorin)-fluorouracil-oxaliplatin. Toronto (ON): Cancer Care Ontario; 2019: https://www.cancercareontario.ca/sites/ccocancercare/files/mFOLFOX6_GI_REC_NADJ.pdf. Accessed 2021 Jan 19.
40.Eribulin for treating locally advanced or metastatic breast cancer after 2 or more chemotherapy regimens (NICE Technology appraisal guidance TA423). London (GB): National Institute for Health and Care Excellence; 2016: https://www.nice.org.uk/guidance/ta423/resources/eribulin-for-treating-locally-advanced-or-metastatic-breast-cancer-after-2-or-more-chemotherapy-regimens-pdf-82604662012357. Accessed 2021 Feb 9.
41.Valle J, Wasan H, Palmer D, et al. Cisplatin plus gemcitabine versus gemcitabine for biliary tract cancer. NEJM. 2010;362(14):1273-1281. PubMed
42.Batchelor TT, Mulholland P, Neyns B, et al. Phase III randomized trial comparing the efficacy of cediranib as monotherapy, and in combination with lomustine, versus lomustine alone in patients with recurrent glioblastoma. J Clin Oncol. 2013;31(26):3212-3218. PubMed
43.Grothey A, Van Cutsem E, Sobrero A, et al. Regorafenib monotherapy for previously treated metastatic colorectal cancer (CORRECT): an international, multicentre, randomised, placebo-controlled, phase 3 trial. Lancet. 2013;381(9863):303-312. PubMed
44.Ghandi L, Rodriguez-Abreu D, Gadgeel S, et al. Pembrolizumab plus chemotherapy in metastatic non-small-cell lung cancer. N Engl J Med. 2018;378(22):2078-2092. PubMed
45.Borghaei H, Paz-Ares L, Horn L, et al. Nivolumab versus docetaxel in advanced nonsquamous non-small-cell lung cancer. N Engl J Med. 2015;373(17):1627-1639. PubMed
46.Thatcher N, Chang A, Parikh P, et al. Gefitinib plus best supportive care in previously treated patients with refractory advanced non-small-cell lung cancer: results from a randomised, placebo-controlled, multicentre study (Iressa Survival Evaluation in Lung Cancer). Lancet. 2005;366(9496):1527-1537. PubMed
47.Airoldi M, Pedani F, Succo G, et al. Phase II randomized trial comparing vinorelbine versus vinorelbine plus cisplatin in patients with recurrent salivary gland malignancies. Cancer. 2001;91(3):541-547. PubMed
48.Larkin J, Minor D, D'angelo S, et al. Overall survival in patients with advanced melanoma who received nivolumab versus investigator's choice chemotherapy in CheckMate 037: a randomized, controlled, open-label phase III trial. J Clin Oncol. 2018;36(4):383-390. PubMed
49.Hurwitz H, Van Cutsem E, Bendell J, et al. Ruxolitinib + capecitabine in advanced/metastatic pancreatic cancer after disease progression/intolerance to first-line therapy: JANUS 1 and 2 randomized phase III studies. Invest New Drugs. 2018;36(4):683-695. PubMed
50.Schlumberger M, Tahara M, Wirth LJ, et al. Lenvatinib versus placebo in radioiodine-refractory thyroid cancer. N Engl J Med. 2015;372(7):621-630. PubMed
51.Brose MS, Nutting CM, Jarzab B, et al. Sorafenib in radioactive iodine-refractory, locally advanced or metastatic differentiated thyroid cancer: a randomised, double-blind, phase 3 trial. Lancet. 2014;384(9940):319-328. PubMed
52.Demetri GDR, P., Kang YK, Blay JY, et al. Efficacy and safety of regorafenib for advanced gastrointestinal stromal tumours after failure of imatinib and sunitinib (GRID): an international, multicentre, randomised, placebo-controlled, phase 3 trial. Lancet. 2013;381(9863):295-302. PubMed
53.Laetsch TW, DuBois SG, Mascarenhas L, et al. Larotrectinib for pediatric solid tumours harbouring NTRK gene fusions: phase 1 results from a multicentre, open-label, phase 1/2 study. Lancel Oncol. 2018;19(5):705-714. PubMed
54.Canadian Institute for Health Information. National health expenditure trends. 2021; https://www.cihi.ca/en/national-health-expenditure-trends. Accessed 2021 Feb 9.
55.Statistics Canada. Consumer price index, monthly, not seasonally adjusted: table 18-10-0004-01 (formerly CANSIM 326-0020). 2021; https://www150.statcan.gc.ca/t1/tbl1/en/cv.action?pid=1810000401. Accessed 2021 Feb 20.
56.De Oliveira C, Bremner K, Liu N, et al. Costs of cancer care in children and adolescents in Ontario, Canada. Pediatr Blood Cancer. 2017;64(11):e26628. PubMed
57.de Oliveira C, Pataky R, Bremner K, et al. Phase-specific and lifetime costs of cancer care in Ontario, Canada. BMC Cancer. 2016;16:809. PubMed
58.Brenner D, Weir H, Demers A, et al. Projected estimates of cancer in Canada in 2020. CMAJ. 2020:E199-E205. PubMed
59.BC Cancer. Gastrointestinal cancer: appendix. 2013; http://www.bccancer.bc.ca/health-professionals/clinical-resources/cancer-management-guidelines/gastrointestinal/appendix. Accessed 2021 Feb 9.
60.Medical News Today. What is appendix cancer? 2021; https://www.medicalnewstoday.com/articles/323955. Accessed 2021 Feb 9.
61.Canadian Cancer Society. Bone cancer. 2021; https://www.cancer.ca/en/cancer-information/cancer-type/bone/statistics/?region = on. Accessed 2021 Feb 10.
62.Canadian Cancer Statistics Advisory Committee. Canadian cancer statistics: a 2018 special report on cancer incidence by stage. Toronto (ON): Canadian Cancer Society; 2018: https://www.cancer.ca/~/media/cancer.ca/CW/cancer%20information/cancer%20101/Canadian%20cancer%20statistics/Canadian-Cancer-Statistics-2018-EN.pdf?la=en2018. Accessed 2021 Feb 9.
63.Canadian Cancer Society. Cancer of unknown primary. 2021; https://www.cancer.ca/en/cancer-information/cancer-type/cancer-of-unknown-primary/statistics/?region = on. Accessed 2021 Feb 9.
64.Statistics Canada. Population estimates on July 1st, by age and sex: table 17-10-0005-01 (formerly CANSIM 051-0001). 2021; https://www150.statcan.gc.ca/t1/tbl1/en/tv.action?pid=1710000501. Accessed 2021 Feb 9.
65.Banales J, Cardinale V, Carpino G, et al. Cholangiocarcinoma: current knowledge and future perspectives consensus statement from the European Network for the Study of Cholangiocarcinoma (ENS-CCA). Nat Rev Gastroenterol Hepatol. 2016;13(5):261-280. PubMed
66.Gastrointestinal stromal tumours (GIST). Edmonton (AB): Alberta Health Services; 2016: https://www.albertahealthservices.ca/assets/info/hp/cancer/if-hp-cancer-guide-sar002-gist.pdf. Accessed 2021 Feb 9.
67.Canadian Cancer Society. Soft tissue sarcoma. 2021; https://www.cancer.ca/en/cancer-information/cancer-type/soft-tissue-sarcoma/statistics/?region = on. Accessed 2021 Feb 9.
68.Canadian Cancer Society's Advisory Committee on Cancer Statistics. Canadian Cancer statistics 2017: special topic: pancreatic cancer. Toronto (ON): Canadian Cancer Society; 2017: https://www.cancer.ca/~/media/cancer.ca/CW/cancer%20information/cancer%20101/Canadian%20cancer%20statistics/Canadian-Cancer-Statistics-2017-EN.pdf2017. Accessed 2021 Feb 10.
69.Budget Impact Analysis of larotrectinib (Vitrakvi) in locally advanced or metastatic TRK fusion cancer [internal sponsor's report]. In: Drug Reimbursement Review sponsor submission: Vitrakvi (larotrectinib) for treatment of adult and pediatric patients with solid tumours that have NTRK gene fusion, 25 mg and 100 mg capsules, 20 mg/mL solution Mississauga (ON): Bayer Inc; 2020 Nov 13.
Appendix 1: Cost Comparison Table
Table 8: CADTH Cost Comparison Table for the Treatment of Solid Tumours With NTRK Gene Fusion
Treatment | Strength/ concentration | Form (vial size if single use) | Price | Recommended dosagea | Daily cost | 28-day cost |
|---|---|---|---|---|---|---|
Larotrectinib (Vitrakvi) | 25 mg 100 mg 20 mg/mL | Capsule Capsule Oral sol. | $52.3375b $209.3500b $41.8700b | Adults: 100 mg twice daily | $418.70 | $11,724 |
Pediatrics: 100 mg/m2 twice daily | $293.09 | $8,207 | ||||
Non–small cell lung | ||||||
Carboplatin | 10 mg/mL | IV infusion 5 mL 15 mL 45 mL 60 mL | $106.1200 $318.3495 $909.5580 $1,174.8600 | 400 mg/m2 every 4 weeks | $60.91 | $1,705 |
Cisplatin | 1 mg/mL | IV infusion 50 mL 100 mL | $323.0000 $646.0000 | 50 to 75 mg/m2 every 3 to 4 weeks | $23.07 to $46.14 | $646 to $1,292 |
Docetaxel | 10 mg/mL | IV infusion | $121.2750 | 75 to 100 mg/m2 every 3 weeks | $82.29 to $109.73 | $2,304 to $3,072 |
Nivolumab | 10 mg/mL | IV infusion 4 mL 10 mL | $782.2200c $1,955.5600c | 480 mg every 4 weeks | $335.24 | $9,387 |
Pembrolizumab | 25 mg/mL | IV infusion 4 mL | $4,400.0000d | 200 mg every 3 weeks | $419.05 | $11,733 |
Pemetrexed | 100 mg 500 mg | Powder for IV infusion | $429.0000 $2,145.0000 | 500 mg/m2 every 3 weeks | $204.29 | $5,720 |
Topotecan | 4 mg | Powder for IV infusion | $567.0000 | 1.5 mg/m2 daily 5 times per 3 weeks | $135.00 | $3,780 |
Thyroid | ||||||
Cisplatin | 1 mg/mL | IV infusion 50 mL 100 mL | $323.0000 $646.0000 | 50 to 75 mg/m2 every 3 to 4 weeks | $23.07 to $46.14 | $646 to $1,292 |
Doxorubicin | 2 mg/mL | IV infusion 5 mL 25 mL 100 mL | $50.4500 $252.2500 $973.0000 | 60 to 75 mg/m2 every 3 weeks | $28.83 to $36.04 | $807 to $1,009 |
Lenvatinib | 24 mg | Daily dose pack (capsules) | $228.5694e | 24 mg daily | $228.57 | $6,400 |
Adult soft tissue sarcoma (GIST and non-GIST) | ||||||
Doxorubicin | 2 mg/mL | IV infusion 5 mL 25 mL 100 mL | $50.4500 $252.2500 $973.0000 | 60 to 75 mg/m2 every 3 weeks | $28.83 to $36.04 | $807 to $1,009 |
Ifosfamide | 1 g 3 g | Powder for IV infusion | $129.1700 $395.5599 | 2,000 to 2,400 mg/m2 daily 5 times per 3 or 4 weeks | $18.45 to $31.14 | $517 to $872 |
Regorafenib | 40 mg | Tablet | $72.6200 | 160 mg daily for 3 weeks out of every 4 | $217.86 | $6,100 |
Infantile fibrosarcomaf | ||||||
Cyclophosphamide | 500 mg 1,000 mg | Powder for IV infusion | $91.3100 $165.5200 | Initiation: 900 mg/m2 twice per 3 weeks | $15.76 | $441 |
Subsequent: 1,200 mg/m2 per 3 weeks | $15.76 | $441 | ||||
Doxorubicin | 2 mg/mL | IV infusion 5 mL 25 mL 100 mL | $50.4500 $252.2500 $973.0000 | Initiation: 35 mg/m2 twice per 3 weeks | $14.41 | $404 |
Subsequent: 50 mg/m2 per 3 weeks | $19.22 | $538 | ||||
Etoposide | 20 mg/mL | IV infusion | $15.0000 | Initiation/subsequent: 100 mg/m2 5 times per 3 weeks | $12.50 | $350 |
Ifosfamide | 1 g 3 g | Powder for IV infusion | $129.1700 $395.5599 | Initiation/subsequent: 1,800 mg/m2 5 times per 3 weeks | $61.51 | $1,722 |
Vincristine | 1 mg/mL | IV infusion | $30.6000 | Initiation/subsequent: 2 mg/m2 per 3 weeks | $2.04 | $57 |
Cyclophosphamide + doxorubicin + vincristine and ifosfamide + etoposideg | $77.01 | $2,156 | ||||
Colorectal and appendixh | ||||||
Fluorouracil | 50 mg/mL | IV infusion | $1.6090 | 2,800 mg/m2 every 2 weeks | $14.82 | $415 |
Leucovorin | 10 mg/mL | IV infusion | $13.7880 | 400 mg/m2 every 2 weeks | $74.85 | $2,096 |
Oxalipatin | 5 mg/mL | IV infusion 10 mL 20 mL 40 mL | $466.3450 $932.6900 $1,865.3800 | 85 mg/m2 every 2 weeks | $133.24 | $3,731 |
MFOLFOX 6 (leucovorin-fluorouracil-oxaliplatin) | $222.91 | $6,241 | ||||
Salivary | ||||||
Cisplatin | 1 mg/mL | IV infusion 50 mL 100 mL | $323.0000 $646.0000 | 50 to 75 mg/m2 every 3 to 4 weeks | $23.07 to $46.14 | $646 to $1,292 |
Vinorelbine | 10 mg/mL | IV infusion 1 mL 5 mL | $80.0000 $400.0000 | 30 mg/m2 weekly | $68.57 | $1,920 |
CNS Glioma | ||||||
Lomustine | 10 mg 40 mg 100 mg | Capsule | $7.8900 $13.6025 $22.4550 | 130 mg/m2 every 6 weeks | $1.58 | $44 |
Melanoma | ||||||
Carboplatin | 10 mg/mL | IV infusion 5 mL 15 mL 45 mL 60 mL | $106.1200 $318.3495 $909.5580 $1,174.8600 | 400 mg/m2 every 4 weeks | $60.91 | $1,705 |
Paclitaxel | 6 mg/mL | IV infusion | $60.0000 | 175 mg/m2 every 3 weeks | $158.33 | $4,433 |
Breast | ||||||
Docetaxel | 10 mg/mL | IV infusion | $121.2750 | 75 to 100 mg/m2 every 3 weeks | $82.29 to $109.73 | $2,304 to $3,072 |
Doxorubicin | 2 mg/mL | IV infusion 5 mL 25 mL 100 mL | $50.4500 $252.2500 $973.0000 | 60 to 75 mg/m2 every 3 weeks | $28.83 to $36.04 | $807 to $1,009 |
Gemcitabine | 1 g 2 g | Powder for IV infusion | $270.0000 $540.0000 | 1,250 mg/m2 twice per 3 weeks | $77.14 | $2,160 |
Paclitaxel | 6 mg/mL | IV infusion | $60.0000 | 175 mg/m2 every 3 weeks | $158.33 | $4,433 |
Vinorelbine | 10 mg/mL | IV infusion 1 mL 5 mL | $80.0000 $400.0000 | 30 mg/m2 weekly | $68.57 | $1,920 |
Cholangiocarcinoma | ||||||
Cisplatin | 1 mg/mL | IV infusion 50 mL 100 mL | $323.0000 $646.0000 | 50 to 75 mg/m2 every 3 to 4 weeks | $23.07 to $46.14 | $646 to $1,292 |
Gemcitabine | 1 g 2 g | Powder for IV infusion | $270.0000 $540.0000 | 1,250 mg/m2 twice per 3 weeks | $77.14 | $2,160 |
Pancreas | ||||||
Capecitabine | 150 mg 500 mg | Tablet | $0.4575 $1.5250 | 2,500 mg/m2 daily for 14 days then 7 days rest | $9.76 | $205 |
CNS = central nervous system; IE = ifosfamide, etoposide; sol = solution; VAC = vinorelbine + doxorubicin + cyclophosphamide.
Note: All prices are from the IQVIA Delta PA database (accessed January 2021),12 unless otherwise indicated, and do not include dispensing fees. Prices are per the smallest dispensable unit. For all comparators for which the recommended dosage is based on body surface area (BSA) a value of 1.9 m2 was used from the LOXO-TRK-14001 trial.13 The exceptions are the pediatric dose of larotrectinib and the doses for infantile fibrosarcoma, for which a value of 0.7 m2 from the LOXO-TRK-15003 (SCOUT)14 trial was used. Vial sharing was only assumed for those drugs in which the product monograph specifically stated it was possible.
CADTH notes that some jurisdictions may use a lower cost version of docetaxel.
aRecommended dosages are based on the respective product monographs of each comparator, unless otherwise indicated.15-35
bSponsor’s submitted price.3
cPrice based on the 2016 CADTH submission for nivolumab for metastatic melanoma.36
dPrice based on the 2020 CADTH submission for pembrolizumab for head and neck squamous cell carcinoma.37
eOntario Exceptional Access program formulary (accessed February 2021).38
fDoses for infantile fibrosarcoma are based on Nathan et al. (2005).11 Each cycle was 21 days.
gThe combined regimen cost was calculated as a weighted average based on the regimen in Nathan et al. (2005),11 which consisted of alternating cycles of VAC then IE for 5 cycles followed by 4 cycles of VAC and 9 cycles of IE.
hDoses for colorectal and appendix cancer are based on Cancer Care Ontario guidance for the MFOLFOX6 regimen.39 Each cycle was 14 days.
Note this appendix has not been copy-edited.
The comparators presented in the following table have been deemed to be appropriate based on feedback from clinical expert(s). Comparators may be recommended (appropriate) practice or actual practice. Existing Product Listing Agreements are not reflected in the table and as such, the table may not represent the actual costs to public drug plans.
Appendix 2: Submission Quality
Note this appendix has not been copy-edited.
Description | Yes/No | Comments |
|---|---|---|
Population is relevant, with no critical intervention missing, and no relevant outcome missing | No | Models provided for only 8 of 18 indications the sponsor is requesting reimbursement for. |
Model has been adequately programmed and has sufficient face validity | No | Model complexity interfered with the ability of CADTH to confidently audit model computations. Model extensively used IFERROR and CHOOSE functions masking model parameters driving the analysis. |
Model structure is adequate for decision problem | No | Partitioned survival model assumes independence of the PFS and OS. |
Data incorporation into the model has been done adequately (e.g., parameters for probabilistic analysis) | No | Sponsor classified larotrectinib response into 3 categories—above average, average, and below average—to represent the PFS and OS for 8 separate clinical indications for which they provided model-based analysis. |
Parameter and structural uncertainty were adequately assessed; analyses were adequate to inform the decision problem | No | Sponsor’s analysis extrapolated beyond the observed period without assuming any waning efficacy. Resulting curves predict unlikely long-term outcomes with high degrees of confidence. |
The submission was well organized and complete; the information was easy to locate (clear and transparent reporting; technical documentation available in enough details) | No | Information was distributed, unnecessarily, across multiple sheets making validation of intermediate calculations difficult; formulas referenced material on hidden sheets; numerous IFERROR statements throughout the model over-writes apparent model inputs; survival inputs for different treatment arms are presented, without label, in different units. |
Appendix 3: Additional Information on the Submitted Economic Evaluation
Note this appendix has not been copy-edited.
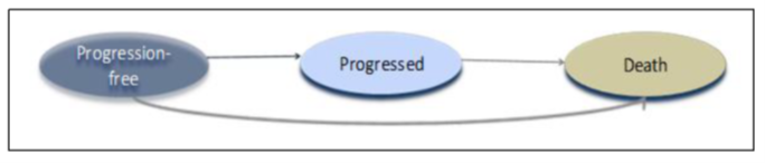
Figure 2 outlines the sponsor’s assumptions regarding long-term PFS and OS gains for larotrectinib and its’ relevant comparator for each tumour type. The difference between BSC and larotrectinib in terms of OS and PFS gain is highlighted by the solid grey shaded area for the period the larotrectinib trial lasted and by the hashed grey area for the extrapolation period. The solid green line represents the survival curve for larotrectinib with the dashed green lines representing the 80th percentile. The black line represents the Kaplan-Meier curve used for the best supportive care comparators. The grey line represents the survival curve fitted to the KM data and the dashed grey lines represent the 80th percentile.
Figure 2: Sponsor’s Assumptions About Gains in PFS and OS for Larotrectinib and BSC — CNS and Glioma
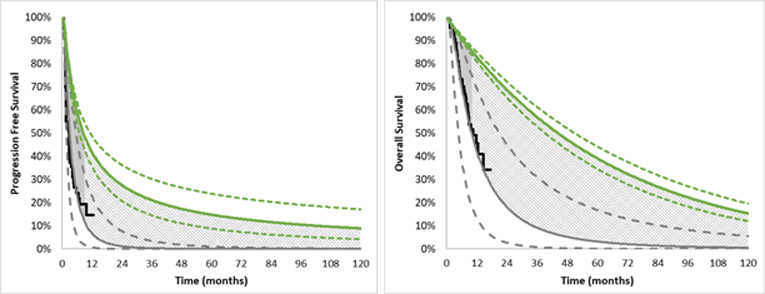
CNS = central nervous system; OS = overall survival; PFS = progression-free survival.
Source: Sponsor’s pharmacoeconomic submission.3
Figure 3: Sponsor’s Assumptions About Gains in PFS and OS for Larotrectinib and BSC — Colorectal
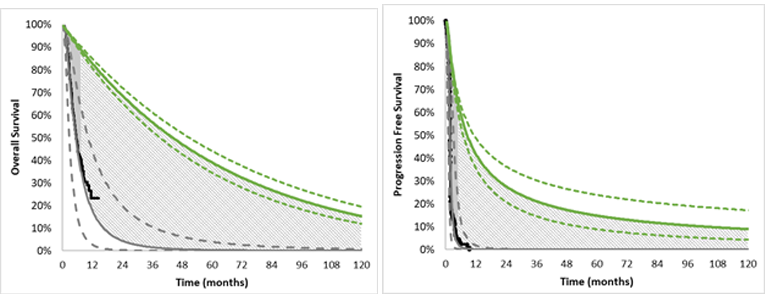
OS = overall survival; PFS = progression-free survival.
Source: Sponsor’s pharmacoeconomic submission.3
Figure 4: Sponsor’s Assumptions About Gains in PFS and OS for Larotrectinib and BSC — NSCLC
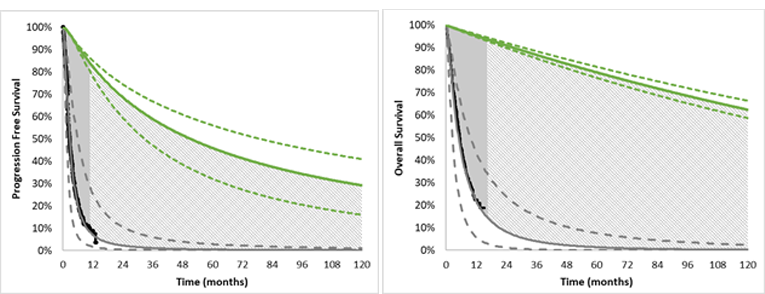
NSCLS = non–small cell lung cancer; OS = overall survival; PFS = progression-free survival.
Source: Sponsor’s pharmacoeconomic submission.3
Figure 5: Sponsor’s Assumptions About Gains in PFS and OS for Larotrectinib and BSC — Melanoma
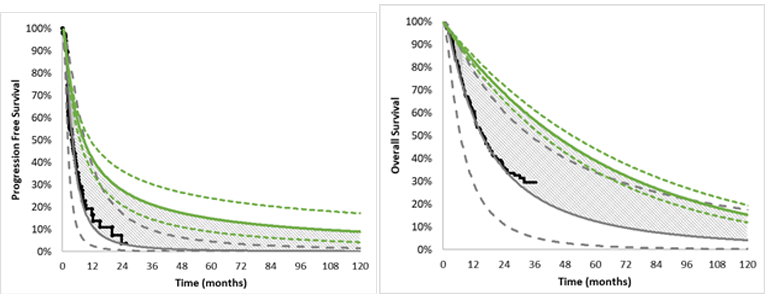
OS = overall survival; PFS = progression-free survival.
Source: Sponsor’s pharmacoeconomic submission.3
Figure 6: Sponsor’s Assumptions About Gains in PFS and OS for Larotrectinib and BSC — Salivary (MASC)
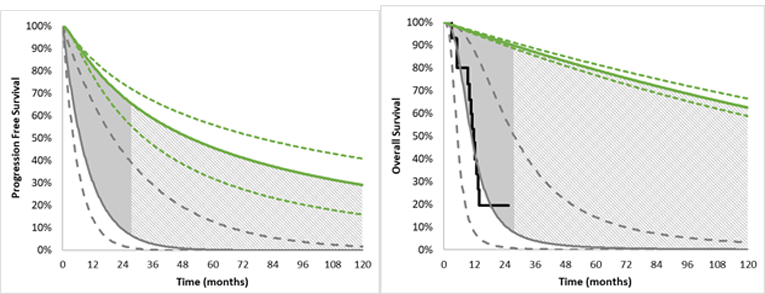
MASC = mammary analogue secretory carcinoma. OS = overall survival; PFS = progression-free survival.
Source: Sponsor’s pharmacoeconomic submission.3
Figure 7: Sponsor’s Assumptions About Gains in PFS and OS for Larotrectinib and BSC — Adult Non-GIST Soft Tissue Sarcoma
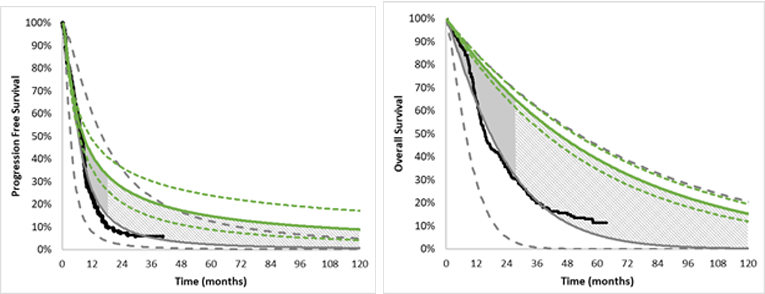
GIST = gastrointestinal stromal tumour; OS = overall survival; PFS = progression-free survival.
Source: Sponsor’s pharmacoeconomic submission.3
Figure 8: Sponsor’s Assumptions About Gains in PFS and OS for Larotrectinib and BSC — Pediatric Soft Tissue Sarcoma
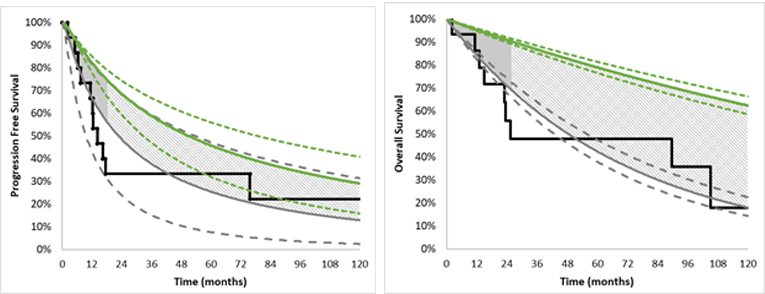
OS = overall survival; PFS = progression-free survival.
Source: Sponsor’s pharmacoeconomic submission.3
Figure 9: Sponsor’s Assumptions About Gains in PFS and OS for Larotrectinib and BSC — RAI-R Follicular and Papillary Thyroid
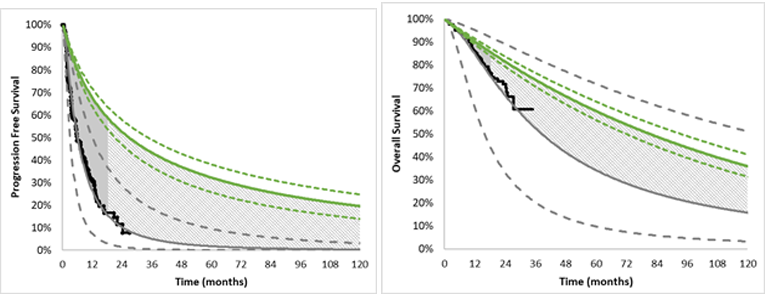
OS = overall survival; PFS = progression-free survival; RAI-R = radioactive-iodine resistant.
Source: Sponsor’s pharmacoeconomic submission.3
Table 10 below highlights what tumour sites received a tumour-specific analysis along with information on sample sizes for each tumour site within the larotrectinib clinical trials.
Table 10: Breakdown of Tumour Analyses Used in the Sponsor’s Submission
Tumour site | Clinical trial patients (N) | Included in the “pooled” analysis comparator arm | Tumour-specific analysis provided |
|---|---|---|---|
Appendix | 1 | Assumed to be represented by microsatellite instability-high colorectal cancer comparator arm | N |
Bone sarcoma | 2 | Assumed to be represented by non-GIST adult STS comparator arm | N |
Breast (secretory only) | 5 | Y | N |
Cancer of unknown primary | 1 | Assumed to be represented by a weighted average of other cancer types | N |
Cholangiocarcinoma (Biliary duct cancer) | 2 | Y | N |
CNS / Glioma | 24 | Y | Y |
Colorectal (Microsatellite instability-high only) | 8 | Y | Y |
Hepatic | 1 | Assumed to be represented by a weighted average of other cancer types | N |
Infantile fibrosarcoma (IFS) | 32 | Assumed to be represented by pediatric STS comparator arm | Y (combined with pediatric STS) |
Lung (NSCLC) | 13 | Y | Y |
Melanoma | 7 | Y | Y |
Pancreas | 2 | Y | N |
Prostate | 1 | Assumed to be represented by a weighted average of other cancer types | N |
Salivary (Mammary analogue secretory carcinoma [MASC]) | 21 | Y | Y |
STS, Adult (GIST) | 4 | Y | N |
STS, Adult (non-GIST) | 17 | Y | Y |
STS pediatrics | 20 | Y | Y (combined with IFS) |
Radioactive-iodine resistant (RAI-R) follicular and papillary thyroid (Thyroid) | 27 | Y | Y |
Total patients | 188 | ||
Table 11: Comparator Treatment Regimens in the Sponsor’s Analysis
Tumour Site | Comparator |
|---|---|
Appendix | Assumed to be represented by colorectal cancer comparator arm |
Bone sarcoma | Assumed to be represented by non-GIST adult STS comparator arm |
Breast (secretory only) | Investigator’s choice chemotherapy:
|
Cancer of unknown primary | Assumed to be represented by a weighted average of other cancer types |
Cholangiocarcinoma |
|
CNS / Glioma |
|
Colorectal (Microsatellite instability-high only) |
|
Hepatic | Assumed to be represented by a weighted average of other cancer types |
Infantile fibrosarcoma (IFS) | Assumed to be represented by pediatric STS comparator arm |
Lung (NSCLC) |
|
Lung (NSCLC) [Active comparator scenario analysis] |
|
Lung (NSCLC) [Active comparator scenario analysis] | Pembrolizumab (200 mg in combination with carboplatin AUC 5 mg/mL/min and pemetrexed every 3 weeks) |
Melanoma | Investigator’s choice chemotherapy
|
Pancreas |
|
Prostate | Assumed to be represented by a weighted average of other cancer types |
Salivary (Mammary analogue secretory carcinoma [MASC]) | Cisplatin (80 mg/m2 on day 1) + vinorelbine (25 mg/m2 on days 1 and 8) |
STS, Adult (GIST) | Regorafenib (160 mg taken once daily for 3 weeks followed by 1 week off therapy) |
STS, Adult (non-GIST) | Intensified doxorubicin (75 mg/m2; 25 mg/m2 per day, days 1–3) plus ifosfamide (10 g/m2 over 4 days with mesna and pegfilgrastim) every 3 weeks |
STS pediatrics | VAC:
|
Thyroid cancer |
|
Thyroid cancer [Active comparator scenario analysis] |
|
Table 12: Summary of Sponsor’s Assumptions Around Testing Protocols Presented in the Health Economic Report, the Submitted Model, or the Budget Impact Analysis
Tumour site | Status quo testing assumptions | Incremental testing assumptions | Incremental testing cost per case detected |
|---|---|---|---|
Appendix | None | 100% with IHC 6% of IHC followed up with confirmatory NGS | $2,880 |
Bone sarcoma | None | 100% with IHC 6% of IHC followed up with confirmatory NGS | $8,960 |
Breast (secretory only) | None | 100% with IHC 6% of IHC followed up with confirmatory NGS | $49,231 |
Cancer of unknown primary | Represented by a weighted average of all other cancer types | ||
Cholangiocarcinoma (Biliary duct cancer) | None | 100% with IHC 6% of IHC followed up with confirmatory NGS | $49,231 |
CNS / Glioma | 10% with NGS | Remaining 90% screened with NGS | $94,545 |
Colorectal (Microsatellite instability-high only) | None | 100% with IHC 6% of IHC followed up with confirmatory NGS | $2,415 |
Hepatic | Represented by a weighted average of all other cancer types | ||
Infantile fibrosarcoma (IFS) | 100% with NGS | $0 | |
Lung (NSCLC) | 10% with NGS | Remaining 90% with IHC 6% of IHC followed up with confirmatory NGS | $50,087 |
Melanoma | None | 100% with IHC 6% of IHC followed up with confirmatory NGS | $49,231 |
Pancreas | None | 100% with IHC 6% of IHC followed up with confirmatory NGS | $49,231 |
Prostate | Represented by a weighted average of all other cancer types | ||
Salivary (Mammary analogue secretory carcinoma [MASC]) | None | 100% screened using IHC 6% of IHC followed up with confirmatory NGS | $33,684 |
STS, Adult (GIST) | 10% with NGS; 20% with FISH | Remaining 70% with IHC 6% of IHC followed up with confirmatory NGS | $8,960 |
STS, Adult (non-GIST) | 10% with NGS; 20% with FISH | Remaining 70% with IHC 6% of IHC followed up with confirmatory NGS | $8,960 |
STS pediatrics | 10% with NGS; 20% with FISH | Remaining 70% with IHC 6% of IHC followed up with confirmatory NGS | $0 |
Radioactive-iodine resistant (RAI-R) follicular and papillary thyroid (Thyroid) | 10% with NGS | Remaining 90% with IHC 6% of IHC followed up with confirmatory NGS | $1,920 |
Table 13: Source Studies to Inform Comparator Treatment Regimen Effectiveness in the Sponsor’s Analysis
Tumour type | Study population description for estimation of PFS and OS curves | Key features of PFS and OS |
|---|---|---|
Breast Cancer Investigator choice | Investigator choice (comparator) arm of a NICE review of eribulin for treating locally advanced or metastatic breast cancer after 2 or more chemotherapy regimens.40 This report did not report the NTRK status of trial participants. | ICC arm (primarily gemcitabine and vinorelbine) (unknown sample size based on reference information provided): Median PFS: 10.1 months Median OS: 2.1 months |
Cholangiocarcinoma Best supportive care (cisplatin plus gemcitabine) | International phase II/III randomized control trial comparing cisplatin plus gemcitabine to gemcitabine alone in patients with locally advanced or metastatic biliary tract cancer (n = 410).41 This report did not report the NTRK status of trial participants. | cisplatin plus gemcitabine (N = 204) Median PFS: 8 months Median OS: 11.7 months |
CNS/Glioma Best supportive care (lomustine) | Randomized phase III placebo-controlled partially blinded trial comparing cediranib monotherapy or cediranib combined with lomustine to lomustine alone.42 This report did not report the NTRK status of trial participants, but did report VEGF, sVEGFR2, and basic fibroblast growth factor (bFGF). | Lomustine alone (n = 66) Median PFS: 82 days Median OS: 9.8 months |
Colorectal cancer Best supportive care (No active treatment) | Placebo arm of a randomized control phase III trial comparing regorafenib to placebo in previously treated metastatic colorectal cancer.43 The study included patients with known KRAS mutation (62% of placebo arm) and BRAF mutation (2% of placebo arm). This study did not report the NTRK status of trial participants. | Placebo (n = 255):
|
NSCLC Pembrolizumab plus platinum | Pembrolizumab arm of a randomized double-blind phase III trial comparing pembrolizumab plus chemotherapy to chemotherapy alone in metastatic nonsquamous NSCLC without sensitizing EGFR or ALK mutations and who had received no previous treatment for metastatic disease.44 This study did not report the NTRK status of trial participants. | Pembrolizumab plus chemotherapy (n = 410):
Chemotherapy alone (n = 206):
|
NSCLC Nivolumab | Nivolumab arm of a randomized, open-label, international phase III trial comparing nivolumab to docetaxel in patients with stage IIIb or IV nonsquamous non–small-cell lung cancer (NSCLC) progressed after platinum-based doublet chemotherapy.45 This study included patients with known EGFR, ALK, and KRAS mutations but did not report the NTRK status of participants. | Nivolumab (n = 292):
Docetaxel (n = 290)
|
NSCLC Best supportive care (No active treatment) | Placebo arm (n = 563) of a randomized, placebo-controlled, multi-centre study of gefitinib in patients with locally advanced or metastatic NSCLC who progressed after platinum-based chemotherapy.46 This study did not report the NTRK status of trial participants. | Placebo (n = 563)
|
Salivary | Cisplatin on day 1 plus vinorelbine on days 1 and 8 every 3 weeks arm of a phase II randomized controlled trial (n = 16) in patients with recurrent salivary gland tumours.47 This study did not report the NTRK status of trial participants. | Cisplatin on day 1 plus vinorelbine on days 1 and 8 every 3 weeks (n = 16) PFS: No KM curve provided for PFS Median time for survival in the stable disease group was 9.5 months Median OS: 10 months (3 to not reached) 1 year overall survival: 6/16 (37.5%) |
Melanoma (ICC) | Investigator’s choice chemotherapy (ICC) arm of a randomized open-label phase III trial comparing nivolumab to ICC (either dacarbazine or carboplatin plus paclitaxel) in patients with advanced melanoma who experienced disease progression while receiving ipilimumab.48 The study included patients with BRAF mutations (22%). This study did not report the NTRK status of trial participants. | Investigator’s choice chemotherapy (either dacarbazine or carboplatin plus paclitaxel) (n = 133) Median PFS: 3.7 months (2.3 to 5.3) Median OS: 14.4 months (11.7 to 18.2) |
Pancreas Best supportive care (capecitabine) | Multi-centre randomized controlled trial comparing ruxolitinib plus capecitabine to capecitabine alone in patients with locally advanced or metastatic pancreatic cancer with 1 prior chemotherapy regimen (n = 407 across JANUS-1 and JANUS-2).49 This study did not report the NTRK status of trial participants. | capecitabine alone (n = 160, JANUS-1)
|
Thyroid Lenvatinib | Lenvatinib arm of a phase III randomized double-blind placebo-controlled multi-centre trial of progressive radioactive iodine (131I)-refractory thyroid cancer.50 Exploratory biomarker analysis was performed for BRAF and RAS mutations, but the study did not report the NTRK status of trial participants. | Lenvatinib (n = 261)
6 months 90.7% (86.4 to 93.7%) 12 months 81.6% (76.2 to 85.8%) 18 months 72.3% (65.7 to 77.9%) Placebo (n = 131)
6 months 85.3% (78.0 to 90.4%) 12 months 70.0% (57.1 to 79.7%) 18 months 63.0% (44.3% to 76.9%) |
Thyroid Best supportive care (No active treatment) | Placebo arm of a randomized, placebo-controlled, multi-centre study of sorafenib in patients with radioactive iodine (131I)-refractory locally advanced or metastatic differentiated thyroid cancer.51 Exploratory biomarker analysis was performed for BRAF, NRAS, HRAS, and KRAS. This study did not report the NTRK status of trial participants. | Placebo (n = 210)
|
Adult STS (GIST) Best supportive care (Regorafenib) | Multi-centre international randomized control trial of regorafenib vs. placebo with 2:1 randomization.52 This study reported KIT exon 11 and exon 9 mutations, but not NTRK mutation status. This study did not report the NTRK status of trial participants. | Randomized control of regorafenib arm (n = 133) Median PFS: 4.8 months (4.1-5.8) Median OS: Not reached |
Adult STS (non-GIST) Best supportive care (Doxorubicin + ifosfamide) | Multi-centre international randomized phase III randomized control trial comparing doxorubicin + ifosfamide to doxorubicin alone as first-line treatment for advanced or metastatic STS (n = 455).2 This study did not report the NTRK status of trial participants. | Doxorubicin + ifosfamide (n = 277) - Median PFS: 7.4 months, 95% CI 6.6–8.3 - Median OS: 14.3 months (12.5–16.5) |
Pediatric STS and IFS Best supportive care (‘VAC’: Vincristine, actinomycin D (dactinomycin) and cyclophosphamide) | Retrospective case review of advanced pediatric nonrhabdomyosarcoma soft tissue sarcoma patients treated with a combination of surgery and chemotherapy between 1983 and 2003 (n = 25) with median follow-up of 2.7 years.11 Median patient age of 16.7 years. No patients with IFS were in the case review. Treatment regimen was mixed due to changing recommendations over the long horizon. This study did not report the NTRK status of patients. | Best supportive care (mixed treatments) (n = 25)
|
Table 14: Adverse Event Rates, Average Cost of AEs per Treated Patient, and Average Disutility per Treated Patient
Tumour site | Treatment regimen | AE rates (included in the sponsor’s analysis) |
|---|---|---|
All sites; Adult | Larotrectinib | Anemia: 7.65%3 Neutropenia: 7.65% |
All sites; pediatric | Larotrectinib | Nausea: 4.17%53 Neutropenia: 4.17%% |
Appendix | Assumed to be represented by colorectal cancer comparator arm | |
Bone sarcoma | Assumed to be represented by non-GIST adult STS comparator arm | |
Breast (secretory only) | ICC (vinorelbine, gemcitabine, docetaxel, paclitaxel, doxorubicin) | None |
Cancer of unknown primary | Assumed to be represented by a weighted average of other cancer types | |
Cholangiocarcinoma (Biliary duct cancer) | Gemcitabine + cisplatin | Leukopenia: 15.66%41 Thrombocytopenia:8.59% |
CNS / Glioma | Lomustine | None |
Colorectal (Microsatellite instability-high only) | 5- fluorouracil + oxaliplatin + leucovorin | None |
Hepatic | Assumed to be represented by a weighted average of other cancer types | |
Infantile fibrosarcoma (IFS) | Assumed to be represented by pediatric STS comparator arm | |
Lung (NSCLC) | Docetaxel + pemetrexed + topotecan | None |
Melanoma | Carboplatin + paclitaxel | None |
Pancreas | Capecitabine + leucovorin | None |
Prostate | Assumed to be represented by a weighted average of other cancer types | |
Salivary (Mammary analogue secretory carcinoma [MASC]) | Cisplatin + vinorelbine | Leukopenia:12.5%47 |
STS, Adult (GIST) | Regorafenib | None |
STS, Adult (non-GIST) | Doxorubicin + ifosfamide | Leukopenia: 43%2 Thrombocytopenia:33% |
STS pediatrics | VAC (vincristine, dactinomycin, and cyclophosphamide) | None |
Radioactive-iodine resistant (RAI-R) follicular and papillary thyroid (Thyroid) | Doxorubicin + cisplatin | None |
Table 15: Utility Inputs in the Sponsor’s Health Economic Submission
Tumour site | Treatment regimen | Progression-free | Progressed |
|---|---|---|---|
All sites; Adult | Larotrectinib | || | || |
All sites; pediatric | Larotrectinib | || | || |
Appendix | Assumed to be represented by colorectal cancer comparator arm | ||
Bone sarcoma | Assumed to be represented by non-GIST adult STS comparator arm | ||
Breast (secretory only) | ICC (vinorelbine, gemcitabine, docetaxel, paclitaxel, doxorubicin) | 0.707 | 0.496 |
Cancer of unknown primary | Assumed to be represented by a weighted average of other cancer types | ||
Cholangiocarcinoma (Biliary duct cancer) | Gemcitabine + cisplatin | 0.689 | 0.547 |
CNS / Glioma | Lomustine | 0.60 | 0.60 |
Colorectal (Microsatellite instability-high only) | 5- fluorouracil + oxaliplatin + leucovorin | 0.73 | 0.59 |
Hepatic | Assumed to be represented by a weighted average of other cancer types | ||
Infantile fibrosarcoma (IFS) | Assumed to be represented by pediatric STS comparator arm | ||
Lung (NSCLC) | Docetaxel + pemetrexed + topotecan | 0.707 | 0.64 |
Melanoma | Carboplatin + paclitaxel | 0.750 | 0.69 |
Pancreas | Capecitabine + leucovorin | 0.671 | 0.60 |
Prostate | Assumed to be represented by a weighted average of other cancer types | ||
Salivary (Mammary analogue secretory carcinoma [MASC]) | Cisplatin + vinorelbine | 0.746 | 0.60 |
STS, Adult (GIST) | Regorafenib | 0.767 | 0.647 |
STS, Adult (non-GIST) | Doxorubicin + ifosfamide | 0.653 | 0.473 |
STS pediatrics | VAC (vincristine, dactinomycin, and cyclophosphamide) | 0.678 | 0.425 |
Radioactive-iodine resistant (RAI-R) follicular and papillary thyroid (Thyroid) | Doxorubicin + cisplatin | 0.718 | 0.637 |
Table 16: Cost of Non-Treatment Cancer Care Inputs Included in the Sponsor’s Health Economic Submission (2009 Dollars)a
Tumour site | Weekly cost | Annualized cost (4) | Transition to death, 1-time cost |
|---|---|---|---|
All sites; Adult | $129.18 | $6,717 | $33,385 |
All sites; pediatric | $129.18 | $6,717 | $33,385 |
Appendix | Assumed to be represented by colorectal cancer comparator arm | ||
Bone sarcoma | Assumed to be represented by non-GIST adult STS comparator arm | ||
Breast (secretory only) | $130 | $6,760 | $11,852 |
Cancer of unknown primary | Assumed to be represented by a weighted average of other cancer types | ||
Cholangiocarcinoma (Biliary duct cancer) | $129.18 | $6,717 | $36,797 |
CNS / Glioma | $158 | $8,216 | $36,797 |
Colorectal (Microsatellite instability-high only) | $104 | $5,408 | $26,367 |
Hepatic | Assumed to be represented by a weighted average of other cancer types | ||
Infantile fibrosarcoma (IFS) | Assumed to be represented by pediatric STS comparator arm | ||
Lung (NSCLC) | $113 | $5,876 | $31,561 |
Melanoma | $76 | $3,952 | $13,366 |
Pancreas | $145 | $7,540 | $46,221 |
Prostate | Assumed to be represented by a weighted average of other cancer types | ||
Salivary (Mammary analogue secretory carcinoma [MASC]) | $152 | $7,904 | $36,797 |
STS, adult (GIST) | $58 | $3,016 | $50,135 |
STS, Adult (non-GIST) | $152 | $7,904 | $36,797 |
STS pediatrics | $152 | $7,904 | $36,797 |
Radioactive-iodine resistant (RAI-R) follicular and papillary thyroid (Thyroid) | $65 | $3,380 | $27,692 |
aThe sponsor reported that these costs were presented in 2018 dollars, but inspection of the source material revealed that these costs are consistent with uninflated (2009) values.
Figure 10: Sponsor’s PFS Kaplan-Meier Curves Stratified Into “Above Average,” “Average,” and “Below Average” PFS Groups
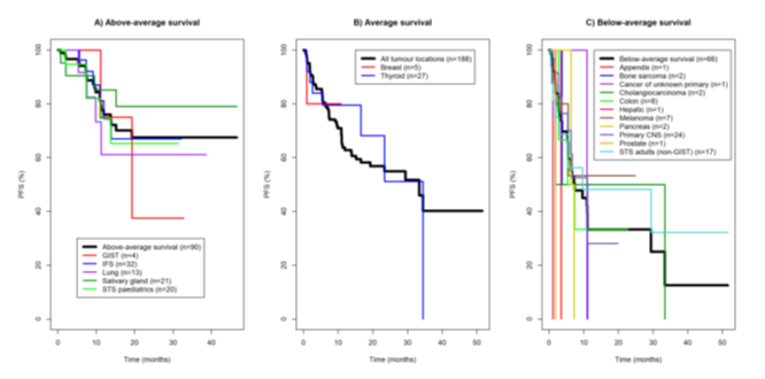
PFS = progression-free survival.
Source: Sponsor’s pharmacoeconomic submission.3
Figure 11: Sponsor’s OS Kaplan-Meier Curves Stratified Into “Above Average,” “Average,” and “Below Average” PFS Groups
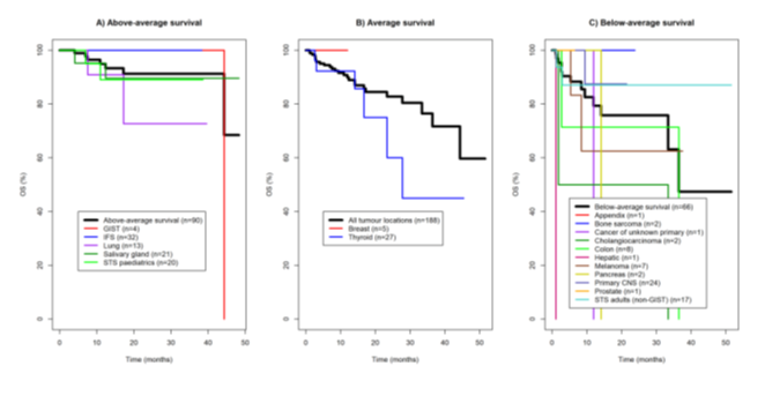
OS = overall survival; PFS = progression-free survival.
Source: Sponsor’s pharmacoeconomic submission.3
Figure 12: Summary of the Weights Used in the Sponsor’s Pooling of Costs and Outcomes (Black Bars) Primarily Informed by the Distribution of Trial Participants and the Relative Incidence Of NTRK Fusion Cancers Across Cancer Types (Grey Bars)
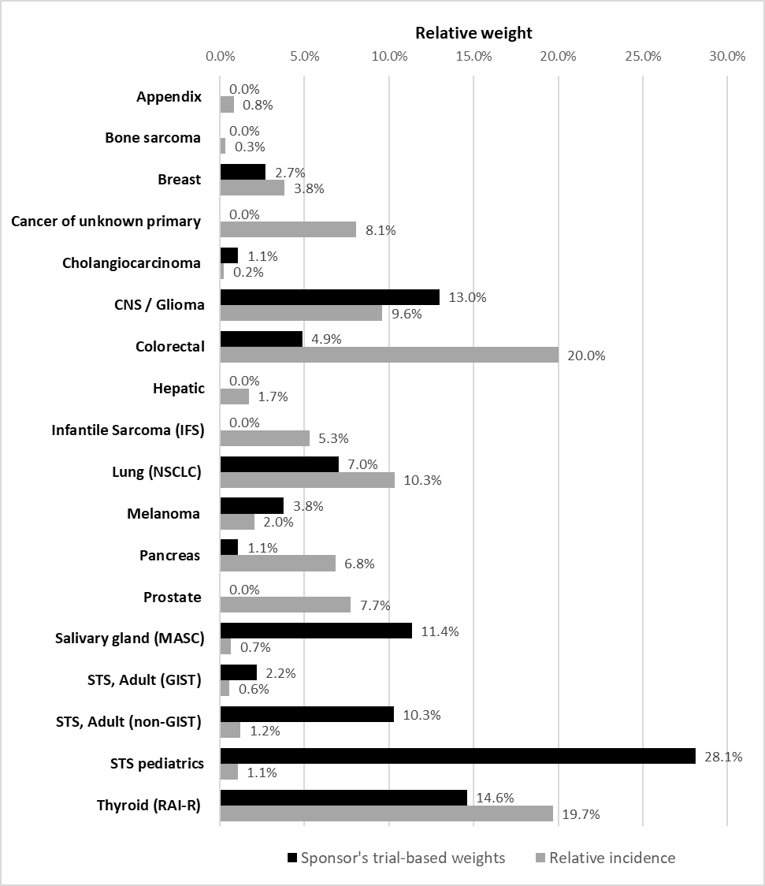
Table 17: Health Gains (PFS And OS) for Larotrectinib and Best Supportive Care Comparators in the Sponsor’s Analysis During the Observed and Extrapolated Period of the Analysis
Tumour site (comparator) | PFS larotrec-tinib | PFS comparator | Incr.PFS | % of gain occurring in ‘observed’ period | % of gain occurring in ‘extra-polated’ period | OS larotrec-tinib | OS comparator | Incr. OS | % of gain occurring in ‘observed’ period | % of gain occurring in ‘extra-polated’ period |
|---|---|---|---|---|---|---|---|---|---|---|
Appendix (vs. BSC) | Sponsor did not include an analysis | |||||||||
Bone sarcoma (vs. BSC) | Sponsor did not include an analysis | |||||||||
Breast (vs. BSC) | Sponsor did not include an analysis | |||||||||
Cancer of unknown primary (vs. BSC) | Sponsor did not include an analysis | |||||||||
Cholangiocarcinoma (vs. BSC) | Sponsor did not include an analysis | |||||||||
CNS / Glioma (vs. BSC) | 2.13 | 0.43 | 1.70 | 12% | 88% | 4.31 | 1.47 | 2.84 | 4% | 96% |
Colorectal (vs. BSC) | 2.11 | 0.20 | 1.91 | 10% | 90% | 4.31 | 0.76 | 3.55 | 4% | 96% |
Hepatic (vs. BSC) | Sponsor did not include an analysis | |||||||||
IFS (vs. BSC) | Sponsor did not include a specific analysis (see analysis combined with pediatric STS below) | |||||||||
NSCLC (vs. BSC) | 4.84 | 0.44 | 4.40 | 12% | 88% | 7.50 | 0.87 | 6.63 | 11% | 89% |
Melanoma (vs. BSC) | 2.09 | 0.67 | 1.42 | 3% | 97% | 4.32 | 2.37 | 1.95 | 2% | 98% |
Pancreas (vs. BSC) | Sponsor did not include an analysis | |||||||||
Prostate (vs. BSC) | Sponsor did not include an analysis | |||||||||
Salivary gland (MASC) (vs. BSC) | 4.83 | 0.76 | 4.07 | 26% | 76% | 7.48 | 1.46 | 6.02 | 17% | 83% |
STS, Adult (GIST) (vs. BSC) | Sponsor did not include an analysis | |||||||||
STS, Adult (non-GIST) (vs. BSC) | 2.13 | 0.98 | 1.15 | 13% | 87% | 4.31 | 2.32 | 1.99 | 18% | 82% |
STS pediatric (vs. BSC) | Sponsor did not include a specific analysis (see analysis combined with IFS below) | |||||||||
STS pediatric and IFS (vs. BSC) | 4.81 | 3.17 | 1.64 | 11% | 89% | 7.49 | 4.58 | 2.91 | 8% | 92% |
Thyroid (vs. BSC) | 3.70 | 1.01 | 2.69 | 17% | 83% | 5.94 | 4.30 | 1.64 | 3% | 97% |
Note: The ‘observed’ period is defined as the time at which there were at least 5 patients remaining in the observational dataset
Appendix 4: Additional Details on the CADTH Reanalyses and Sensitivity Analyses of the Economic Evaluation
Note this appendix has not been copy-edited.
Supplemental Material Associated With Inputs Used in the CADTH Reanalysis
CADTH Larotrectinib Survival Curves
CADTH reanalysis sought to more fully represent the uncertainty in the PFS and OS due to small sample sizes, population heterogeneity, and high rates of censoring in the sponsor’s clinical trial data. Using the Kaplan-Meier curves provided for each tumour site in the sponsor’s report, Beta distributions were fit to the probability of survival (PFS or OS) at a single point on the survival curve. The point was determined to be approximately the point at which 50% of the original population was no longer at risk, either due to an event or due to censoring. The estimated points on the curve and corresponding beta distributions are presented in Figure 5. This point estimate was used to fit a constant hazard rate model over the observed period. The end of the ‘observed’ period for the clinical data was determined to be when there were fewer than 5 patients remaining “at-risk.” After this point, progression was assumed to occur using the rates determined by the comparator treatment curves. Larotrectinib PFS and OS used in the CADTH reanalysis are presented in Figure 5. PFS and OS survival gain in the average case are illustrated with grey shading with solid grey shading representing gains that occur in the observed period of the clinical trial and hashed grey shading representing gains occurring in the extrapolated period of the analysis.
CADTH Comparator Arm Survival Curves
CADTH made 2 changes to the assumptions selected by the sponsor related to the survival curves for the comparator arms. First, for the PFS curve of salivary gland NTRK fusion cancers treated with cisplatin + vinorelbine, the sponsor’s standard error was multiplied by 5 to increase the range of PFS curves to approximately align with range of uncertainty represented in the comparator arms of other indications. This level of uncertainty was more consistent with the source data which was an older phase II trial (1993 to 1997 recruitment), the sample size of the trial (n = 36), and the uncertainty as to whether any patients in the trial had NTRK fusion cancers. Second, rather than the sponsor’s choice of an exponential distribution to represent OS in pediatric STS and IFS, CADTH used the sponsor’s log-normal distribution. The exponential distribution had very little uncertainty given the provided standard error, which did not appear to be based on empirical estimation. Using the log-normal distribution led to similar mean survival curves, but the uncertainty in the parameters of the log-normal curve represented greater overall uncertainty in OS. This level of uncertainty was more consistent with the age of the data (1979 to 2005), the size of the cohort report (n = 56), heterogeneity in the treatments provided to patients over time in this dataset, and the application of this data to older patients with other types of pediatric soft tissue sarcomas (not IFS).
Figure 13 to Figure 21 outline the sponsor’s assumptions regarding long-term PFS and OS gains for larotrectinib and its’ relevant comparator for each tumour type. The difference between BSC and larotrectinib in terms of OS and PFS gain is highlighted by the solid grey shaded area for the period the larotrectinib trial lasted and by the hashed grey area for the extrapolation period. The solid green line represents the survival curve for larotrectinib with the dashed green lines representing the 80th percentile. The black line represents the Kaplan-Meier curve used for the best supportive care comparators. The grey line represents the survival curve fitted to the KM data and the dashed grey lines represent the 80th percentile.
Figure 13: CADTH Fitted Progression-Free and Overall Survival Comparing Larotrectinib (Green Line) and Best Supportive Care (Grey Line) — CNS and Glioma
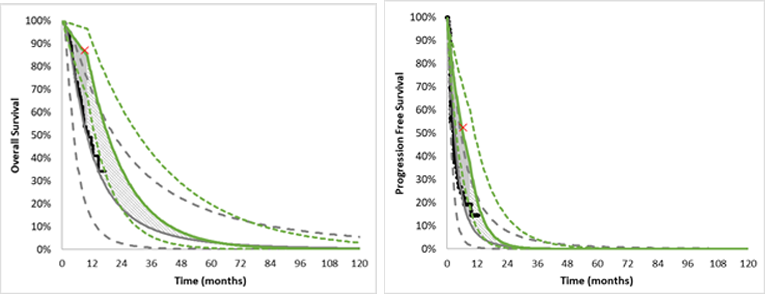
Figure 14: CADTH Fitted Progression-Free and Overall Survival Comparing Larotrectinib (Green Line) and Best Supportive Care (Grey Line) — Colorectal
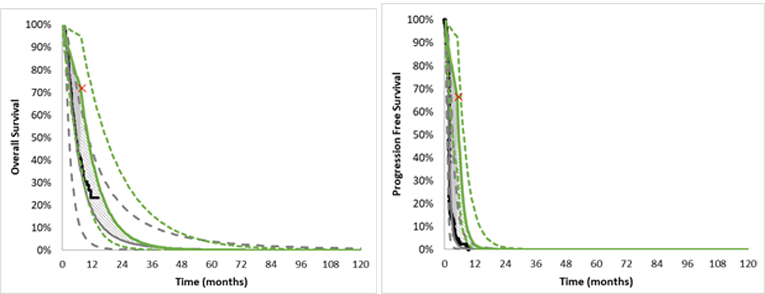
Figure 15: CADTH Fitted Progression-Free and Overall Survival Comparing Larotrectinib (Green Line) and Best Supportive Care (Grey Line) — IFS
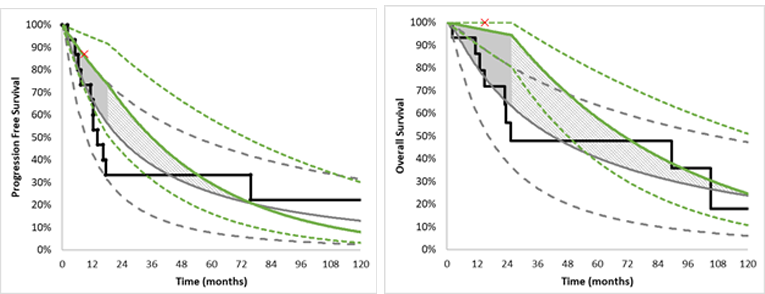
IFS = infantile fibrosarcoma.
Figure 16: CADTH Fitted Progression-Free and Overall Survival Comparing Larotrectinib (Green Line) and Best Supportive Care (Grey Line) — NSCLC
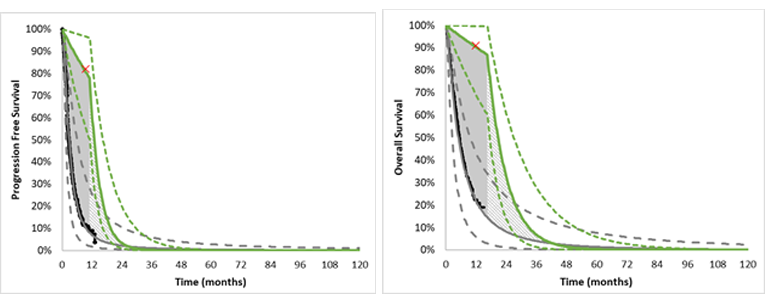
NSCLC = non–small cell lung cancer.
Figure 17: CADTH Fitted Progression-Free and Overall Survival Comparing Larotrectinib (Green Line) and Best Supportive Care (Grey Line) — Melanoma
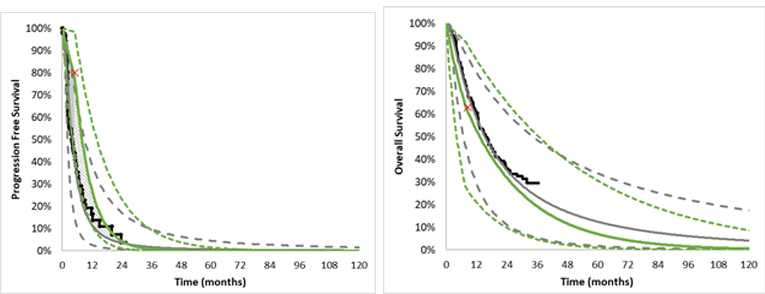
Figure 18: CADTH Fitted Progression-Free and Overall Survival Comparing Larotrectinib (Green Line) and Best Supportive Care (Grey Line) — Salivary (MASC)
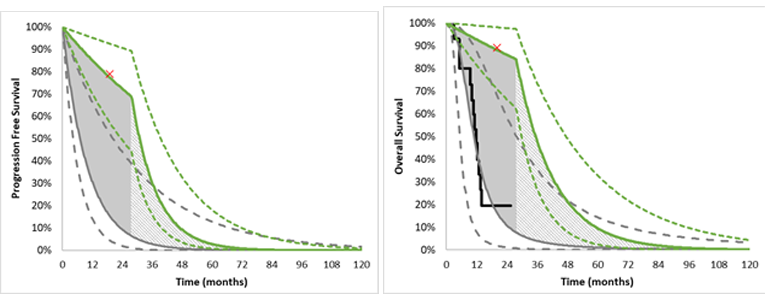
MASC = mammary analogue secretory carcinoma.
Figure 19: CADTH Fitted Progression-Free and Overall Survival Comparing Larotrectinib (Green Line) and Best Supportive Care (Grey Line) — Adult Non-GIST Soft Tissue Sarcoma
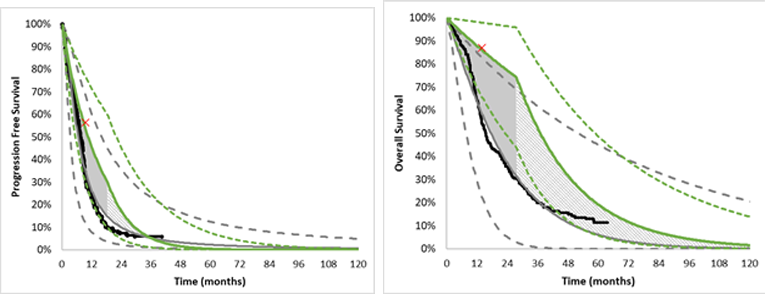
GIST = gastrointestinal stromal tumour.
Figure 20: CADTH Fitted Progression-Free and Overall Survival Comparing Larotrectinib (Green Line) and Best Supportive Care (Grey Line) — Pediatric Soft Tissue Sarcoma
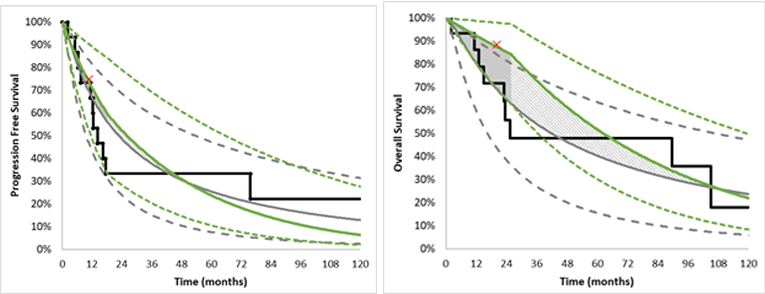
Figure 21: CADTH Fitted Progression-Free and Overall Survival Comparing Larotrectinib (Green Line) and Best Supportive Care (Grey Line) — RAI-R Follicular and Papillary Thyroid
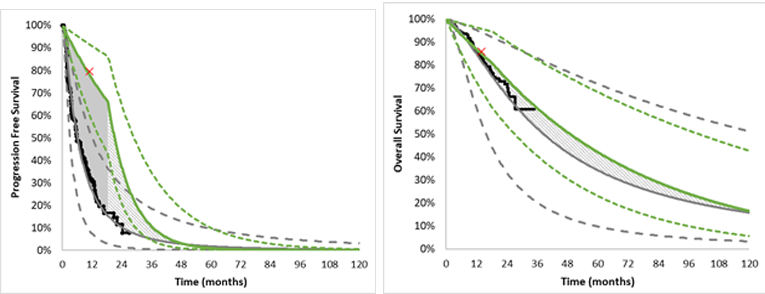
RAI-R = radioactive-iodine resistant.
Table 18: Survival Curve Parameters — Exponential Rate Parameters Presented in Weekly Rates
Tumour site | Critical point used to characterize curve in the ‘Observed period’ | Beta distribution | Exponential rate (lower, upper) for the observed period | ‘Observed period’ (weeks) | Exponential rate (SE) for the extrapolation period |
|---|---|---|---|---|---|
Progression-free survival | |||||
CNS/glioma | 52.5% at 26 weeks | (12.6 to 11.4) | 0.02478 (0.0128 to 0.0427) | 40 | 0.04586 (0.0229 to 0.0573) |
Colorectal | 66.5% at 22 weeks | (5.32 to 2.68) | 0.01854 (0.0036 to 0.0505) | 22 | 0.11556 (0.0578 to 0.1445) |
IFS | 87% at 36 weeks | (27.84 to 4.16) | 0.003868 (0.00110 to 0.00852) | 80 | 0.00505 (0.00632 to 0.002527) |
NSCLC | 82% at 38 weeks | (10.66 to 2.34) | 0.00522 (0.00083 to 0.01434) | 48 | 0.05564 (0.02782 to 0.06954) |
Melanoma | 80% at 20 weeks | (5.6 to 1.4) | 0.01116 (0.00075 to 0.03880) | 22 | 0.0350 (0.0175 to 0.04377) |
Salivary gland | 79% at 120 weeks | (16.6 to 4.4) | 0.0031 (0.00094 to 0.00679) | 120 | 0.02277 (0.01139 to 0.0285) |
STS (non-GIST) | 56.5% at 38 weeks | (9.6 to 7.4) | 0.0150 (0.0064 to 0.0290) | 80 | 0.0228 (0.01143 to 0.02857) |
Pediatric STS | 75% at 44 weeks | (15 to 5) | 0.00654 (0.0022 to 0.0138) | 80 | 0.00505 (0.00632 to 0.002527) |
Thyroid | 79.5% at 44 weeks | (21.47 to 5.54) | 0.00521 (0.00185 to 0.01061) | 80 | 0.02393 (0.01196 to 0.02991) |
Overall survival | |||||
CNS/glioma | 87% at 37 weeks | (20.88 to 3.12) | 0.00376 (0.0008 to 0.0092) | 44 | 0.01466 (0.0073 to 0.0220) |
Colorectal | 72% at 32 weeks | (5.76 to 2.24) | 0.01027 (0.0016 to 0.0297) | 32 | 0.02897 (0.0145 to 0.0435) |
IFS | 100% at 60 weeks | (31.5 to 1.0) | 0.000521 (0.0000134 to 0.001952) | 112 | 0.00329 (0.00164 to 0.00494) |
NSCLC | 91% at 48 weeks | (11.83 to 1.17) | 0.00196 (0.00008 to 0.0071) | 72 | 0.0302 (0.0151 to 0.0453) |
Melanoma | 63% at 34 weeks | (4.41 to 2.59) | 0.0136 (0.00257 to 0.0380) | 34 | 0.00968 (0.00484 to 0.01452) |
Salivary gland | 89% at 80 weeks | (18.7 to 2.3) | 0.00146 (0.00022 to 0.00395) | 120 | 0.0156 (0.0078 to 0.0234) |
STS (non-GIST) | 87% at 56 weeks | (14.8 to 2.2) | 0.002487 (0.00036 to 0.00689) | 120 | 0.00964 (0.00482 to 0.0145) |
Pediatric STS | 88.5% at 80 weeks | (17.7 to 2.3) | 0.001527 (0.000233 to 0.00415) | 112 | 0.00329 (0.00164 to 0.00494) |
Thyroid | 86% at 56 weeks | (23.22 to 3.78) | 0.00269 (0.0007 to 0.0061) | 80 | 0.0036 (0.0018 to 0.0054) |
Table 19: Health Gains (PFS and OS) for Larotrectinib and Best Supportive Care Comparators in the CADTH Reanalysis During the Observed and Extrapolated Period of the Analysis
Tumour site (comparator) | PFS larotrec-tinib | PFS compar-ator | Incr. PFS | % of gain occurring in ‘observed’ period | % of gain occurring in ‘extra-polated’ period | OS larotrec-tinib | OS compar-ator | Incr. OS | % of gain occurring ‘observed’ period | % of gain occurring in ‘extra-polated’ period |
|---|---|---|---|---|---|---|---|---|---|---|
Appendix (vs. BSC) | No observed data | |||||||||
Bone sarcoma (vs. BSC) | No observed data | |||||||||
Breast (vs. BSC) | No observed data | |||||||||
Cancer of unknown primary (vs. BSC) | No observed data | |||||||||
Cholangiocarcinoma (vs. BSC) | No observed data | |||||||||
CNS / Glioma (vs. BSC) | 0.66 | 0.43 | 0.23 | 62% | 38% | 1.46 | 0.92 | 0.54 | 23% | 77% |
Colorectal (vs. BSC) | 0.46 | 0.20 | 0.26 | 62% | 38% | 1.03 | 0.76 | 0.27 | 30% | 70% |
Hepatic (vs. BSC) | No observed data | |||||||||
IFS (vs. BSC) | 4.12 | 3.98 | 0.14 | 100%** | 0% | 7.25 | 6.97 | 0.28 | 69% | 31% |
NSCLC (vs. BSC) | 1.10 | 0.44 | 0.66 | 73% | 27% | 1.87 | 0.89 | 0.98 | 67% | 33% |
Melanoma (vs. BSC) | 0.84 | 0.69 | 0.15 | 29% | 71% | 1.84 | 2.75 | −0.91 | NA | NA |
Pancreas (vs. BSC) | No observed data | |||||||||
Prostate (vs. BSC) | No observed data | |||||||||
Salivary gland (MASC) (vs. BSC) | 2.51 | 0.83 | 1.68 | 69% | 31% | 3.15 | 1.56 | 1.59 | 54% | 46% |
STS, adult (GIST) (vs. BSC) | No observed data | |||||||||
STS, adult (non-GIST) (vs. BSC) | 1.18 | 1.00 | 0.18 | 100%** | 0% | 3.49 | 2.58 | 0.91 | 38% | 62% |
STS pediatric (vs. BSC) | 3.48 | 3.98 | −0.5* | NA | NA | 6.62 | 6.97 | −0.35* | NA | NA |
Thyroid (vs. BSC) | 1.81 | 1.03 | 0.78 | 66% | 34% | 5.53 | 6.23 | −0.7* | NA | NA |
Note: The ‘observed’ period is defined as the time at which there were at least 5 patients remaining in the observational dataset
*In PFS and OS for pediatric STS and OS for Thyroid cancer, positive health gains occur when quality of life, not only duration of life, is also accounted for.
**Uncertainty in extrapolated outcomes results in a net effect of no health gain in the extrapolation period.
Non-Treatment Age-Specific Health Care Costs
CADTH estimated age-specific non-cancer health care costs in 2018 dollars from CIHI data and used the average patient age for each tumour site as specified in the sponsor’s analysis.54 Further, upon review of the primary sources it appeared that the non-treatment related health care costs used in the sponsor’s analysis were not adjusted for inflation and were precisely the costs as reported in 2009 and 2012 dollars. Inflation adjustment results in a 16.5% increase in costs presented in 2009 dollars and a 9.6% increase in costs presented in 2012 dollars.55 Non-treatment health care costs used in the CADTH reanalysis are presented in Table 20.
Table 20: Non-Treatment Age-Specific Health Care Costs and Incremental Costs of Death Used in the CADTH Reanalysis (2018 CA$)56,57
Tumour type | Age (using sponsor’s assumptions) | Non-treatment health care costs * (Annual) | 7-day cycle cost | Incremental terminal costs (1-time) less continuing costs | |
|---|---|---|---|---|---|
NSCLC | 52 | 3,641 | 10,509 | 202 | 40,428 |
Salivary* | 54 | 3,641 | 10,441 | 201 | 25,400 |
Melanoma | 49 | 3,123 | 7,714 | 148 | 18,703 |
Colorectal | 69 | 6,989 | 13,280 | 255 | 37,722 |
Thyroid | 56 | 4,288 | 8,238 | 158 | 36,566 |
Breast | 44 | 2,816 | 10,673 | 205 | 16,630 |
CNS/glioma | 17 | 2,212 | 11,797 | 227 | 82,290 |
Pediatric STS | 7 | 1,717 | 20,119 | 387 | 12,488 |
IFS | 2 | 1,998 | 20,399 | 392 | 12,768 |
Adult STS (non-GIST)* | 40 | 2,816 | 9,616 | 185 | 24,575 |
*Including age-specific non-cancer health care expenses and non-treatment related cancer care expenses.
Estimating the Average Cost of Detecting Each NTRK Fusion Cancer
Using the sponsor’s estimates for the prevalence of NTRK fusion cancer in each cancer type as the mean value, CADTH applied a beta distribution to the NTRK fusion prevalence in each cancer type. CADTH calculated the number needed of patients with that cancer subtype as 1/prevalence. The cost per case detected is then the number needed to test using NGS to find 1 NTRK fusion cancer multiplied by the cost of NGS testing ($1,040, using the sponsor’s estimate) (Table 19). For a scenario analysis using IHC screening, CADTH assumed an average sensitivity of 85% and specificity of 97% recognizing a wide range of values in the literature.
Table 21: NTRK Testing Costs by Tumour Site
Tumour site | NTRK fusion prevalence | Number needed to test using universal NGS to find 1 NTRK fusion cancer | Cost per case detected, universal NGS testing | Cost per case detected, IHC screening followed by NGS confirmation |
|---|---|---|---|---|
Appendix | 0.52% (0.26% to 0.87%) | 192 (115 to 386) | $200,000 ($119,661 to $400,931) | $22,994 ($14,161 to $45,088) |
Bone sarcoma | 0.26% (0.10% to 0.50%) | 385 (201 to 1,010) | $400,000 ($209,267 to $1,049,880) | $44,985 ($24,013 to $116,443) |
Breast | 0.14% (0.08% to 0.22%) | 714 (461 to 1,252) | $742,857 ($479,889 to $1,302,298) | $82,684 ($53,769 to $144,197) |
Cancer of unknown primary | 0.26% (0.10% to 0.50%) | 385 (201 to 1,010) | $400,000 ($209,267 to $1,049,880) | $44,985 ($24,013 to $116,443) |
Cholangiocarcinoma | 0.35% (0.15% to 0.63%) | 286 (158 to 670) | $297,143 ($163,957 to $696,517) | $33,676 ($19,031 to $77,589) |
CNS / Glioma | 1.00% (0.60% to 1.50%) | 100 (67 to 167) | $104,000 ($69,358 to $173,368) | NA |
Colorectal (MSI-High only) | 5.30% (4.00% to 6.77%) | 18.9 (14.8 to 25.0) | $19,623 ($15,365 to $26,000) | $3,161 ($2,693 to $3,862) |
Hepatic | 0.26% (0.10% to 0.50%) | 385 (201 to 1,010) | $400,000 ($209,267 to $1,049,880) | $44,985 ($24,013 to $116,443) |
Infantile sarcoma (IFS) | 90.60% (85% to 95%) | 1.1 (1.1 to 1.2) | $1,148 ($1,095 to $1,224) | $1,130 ($1,124 to $1,138) |
Lung (NSCLC) | 0.20% (0.10% to 0.34%) | 500 (298 to 1,007) | $520,000 ($310,230 to $1,047,108) | $58,180 ($35,115 to $116,138) |
Melanoma | 0.31% (0.20% to 0.44%) | 323 (225 to 502) | $335,484 ($233,797 to $522,106) | $37,891 ($26,710 to $58,411) |
Pancreas | 0.31% (0.20% to 0.44%) | 323 (225 to 502) | $335,484 ($233,810 to $522,063) | $37,891 ($26,712 to $58,407) |
Prostate | 0.26% (0.10% to 0.50%) | 385 (201 to 1,010) | $400,000 ($209,267 to $1,049,880) | $44,985 ($24,013 to $116,443) |
Salivary gland (MASC) | 0.38% (0.15% to 0.72%) | 263 (140 to 670) | $273,684 ($145,208 to $696,921) | $31,096 ($16,970 to $77,633) |
STS to adult (GIST) | 0.50% (0.30% to 0.75%) | 200 (133 to 334) | $208,000 ($138,612 to $346,921) | $23,874 ($16,244 to $39,149) |
STS to adult (non-GIST) | 1.00% (0.60% to 1.50%) | 100 (67 to 167) | $104,000 ($69,355 to $173,379) | $12,439 ($8,629 to $20,067) |
STS pediatric | 1.00% (0.60% to 1.50%) | 100 (67 to 167) | $104,000 ($69,355 to $173,379) | $12,439 ($8,629 to $20,067) |
Thyroid | 6.00% (4.50% to 7.70%) | 16.7 (13.0 to 22.2) | $17,333 ($13,511 to $23,111) | $2,909 ($2,489 to $3,544) |
abb = abbreviation.
Estimating the Average Number of People Each Year Who Will Be Identified as an NTRK Fusion Cancer
Primarily using incidence estimates from the sponsor’s report and estimates from the Canadian Cancer Society, CADTH estimated the incident number of patients overall and the fraction of patients who are Stage III/IV at diagnosis. To incorporate uncertainty into this estimate, the annual incidence was estimated using a normal random variable using the base case estimate for the mean and a standard error that was 10% of the mean for all sites except NSCLC and Prostate cancer for which a standard error of 5% of the mean was used. Consistent with the sponsor’s estimate, CADTH assumed that a proportion of patients are eligible for drug treatment (65% of patients with NSCLC and 90% of patients with other cancers), and a proportion of the patients have viable tissue for biomarker testing (90% of NCSLC and 100% of patients with other cancers). CADTH assumed all patients have access to public insurance. Ultimately, this led to a number of NTRK fusion cancers identified each year by tumour type (Table 21).
Calculation of an ICER Aggerating Over Multiple Indications
Using the reanalysis, CADTH calculated an overall ICER considering all possible indications. Using bootstrapped simulations of the number of patients of each type each year, described in the previous section, the number of patients of each cancer type was determined and was used to calculate the relative prevalence of each cancer type (the weight for a weighted sum). The weights derived using this prevalence-based approach were different than the weights the sponsor used in their analysis based on the trial patient frequencies (Figure 4). For cancer sites not modelled by the sponsor in stratified analyses, CADTH estimated the incremental cost using larotrectinib treatment costs applied to PFS under best supportive care for Appendix (represented by colorectal), Bone sarcoma (represented by non-GIST STS), Cholangiocarcinoma, and GIST STS. The average treatment cost for breast cancer, cancer of unknown primary, hepatic cancer, pancreatic cancer, and prostate cancer was estimated as a simple average of the treatment costs across the other cancer types. In an effort to represent the uncertainty in these cases, a simple average of the variances observed across other cancer types was used. For the benefits, the mean incremental QALYs was set to zero for all cancers with efficacy data for less than 5 patients. Uncertainty in the incremental QALYs was Normally distributed with a mean of zero and a standard error representative of the uncertainty in the cancers for which there is more efficacy data. The weighted average incremental cost and average incremental QALYs were then calculated leading to an overall ICER, overall CEAC, and overall price reduction sensitivity analysis.
Table 22: NTRK Cancer Incidence Rates by Tumour Site
Tumour site | Canadian patients per year | Stage III/IV | Number patients tested annually | NTRK fusion cancers identified annually |
|---|---|---|---|---|
Appendix | 21060 | 189 (153 to 226) | 1.0 (0.5 to 1.7) | |
Bone sarcoma | 18761 | 187 | 168 (135 to 202) | 0.4 (0.2 to 0.9) |
Breast cancer | 21,60658 | 3,73862 | 3,362 (2,693 to 4,019) | 4.7 (2.6 to 7.7) |
Cancer of unknown primary | 4,24763 | 4,247 | 3,829 (3,101 to 4,584) | 9.9 (3.5 to 19.6) |
Cholangiocarcinoma | 10341 | 93 (75 to 111) | 0.3 (0.1 to 0.6) | |
CNS / Glioma | 2,34058 | 1,3103 | 1,181 (947 to 1,414) | 11.8 (6.8 to 18.2) |
Colorectal | 1,04958 | 5153 | 464 (374 to 557) | 24.6 (17.3 to 33.2) |
Hepatic | 2,41858 | 91162 | 820 (659 to 979) | 2.1 (0.8 to 4.2) |
Infantile fibrosarcoma | 83 | 83 | 7 (6 to 9) | 6.5 (5.2 to 7.8) |
Lung (NSCLC) | 16,35758 | 10,8293 | 6,336 (5,717 to 6,959) | 12.6 (6.2 to 21.4) |
Melanoma | 6,24058 | 91362 | 821 (657 to 982) | 2.5 (1.6 to 3.8) |
Pancreas | 4,68058 | 3,02062 | 2,716 (2,178 to 3,250) | 8.4 (5.2 to 12.6) |
Prostate | 18,17458 | 4,07162 | 3,662 (3,311 to 4,026) | 9.4 (3.5 to 18.1) |
Salivary | 3663 | 2373 | 213 (171 to 254) | 0.8 (0.3 to 1.6) |
STS to Adult (GIST) | 1573 | 141 (113 to 169) | 0.7 (0.4 to 1.1) | |
STS to Adult (non-GIST) | 28467 | 1663 | 149 (119 to 178) | 1.5 (0.9 to 2.3) |
STS pediatrics | 24868 | 1453 | 130 (105 to 156) | 1.3 (0.8 to 2.0) |
Thyroid cancer | 44758 | 4473 | 403 (324 to 482) | 24.2 (16.7 to 33.0) |
Combined | 79,232 | 31,214 | 24,686 (23,319 to 26,083) | 122.9 (104.3 to 143.9) |
Detailed Results of CADTH Base Case
CNS/glioma
CADTH reanalysis indicated that, compared to lomustine (best supportive care), the median ICER of larotrectinib in patients known to have an NTRK fusion CNS/glioma cancer is $160,396 (95% CI, $73,864 to Dominated) (Table 23). Larotrectinib increases patient treatment costs by $94,818 per patient and there is a 15.8% probability that larotrectinib is clinically dominated (has a lower average quality-adjusted life-years than best supportive care). Achieving a median ICER less than $50,000 per QALY gained in patients with a known mutation requires a price reduction of 70 to 80% (Table 24). The risk sharing agreement proposed in the sponsor’s report is approximately equal to a one-third reduction in cost for this tumour site using the projected survival curves in the reanalysis.
Testing for NTRK fusion cancers is not routine in patients with CNS/glioma. Incorporating evaluation for NTRK gene fusion to NGS at an incremental cost of $1,040 per patient would result in an incremental cost per identified patient of $104,000 (95% CI, $69,358 to $173,368), using an estimated mutation frequency of 1.00% (95% CI, 0.60% to 1.50%) and requiring testing of approximately 100 (95% CI, 67 to 167) individuals to identify an CNS/glioma patient with NTRK fusion. Incorporating the costs of identifying patients, the median ICER of larotrectinib is $332,589 per QALY gained (95% CI, $144,717 to dominated) (Table 23). A median ICER less than $50,000 per QALY gained cannot be achieved with price reductions alone if testing costs are included.
Consistent with assumptions in the sponsor’s model, CADTH did not perform a scenario analysis using IHC screening in CNS/glioma cancer.
Table 23: Reanalysis for the Cost-Effectiveness of Larotrectinib in Patients With CNS/Glioma NTRK Fusion Cancers
Model output | Larotrectinib with known mutation | Lomustine (best supportive care) |
|---|---|---|
Life-years | ||
Pre-progression | 0.66 (0.45 to 0.93) | 0.43 (0.17 to 0.91) |
Post-progression | 1.28 (0.77 to 2.10) | 1.11 (0.00 to 3.62) |
Overall survival | 1.94 (1.41 to 2.88) | 1.53 (0.42 to 4.01) |
QALYs | ||
Pre-progression | 0.54 (0.36 to 0.76) | 0.26 (0.10 to 0.55) |
Post-progression | 0.95 (0.56 to 1.57) | 0.66 (0.00 to 2.20) |
AEs | −0.02 (−0.03 to −0.02) | — |
Overall survival | 1.46 (1.07 to 2.17) | 0.92 (0.25 to 2.41) |
Costs | ||
Diagnostic | $110,082 ($69,190 to $175,910) | — |
Drug | $95,495 ($64,691 to $134,295) | $677 ($263 to $1,440) |
Adverse Events | $992 ($798 to $1,190) | — |
Health Services | $24,686 ($14,588 to $39,833) | $17,886($1,692 to $54,003) |
End of life | $79,989 ($63,856 to $95,441)* | $80,778($64,705 to $97,625) |
Total Costs | $311,244 ($253,331 to $392,352) | $99,341($77,071 to $130,269) |
Incremental | ||
Costs | $101,821 ($54,083 to $156,438) | |
Costs (including case finding) | $211,903 ($147,863 to $295,072) | |
LY | 0.41 (−2.13 to 1.89) | |
QALY | 0.54 (−1.02 to 1.56) | |
NMB at $50,000/QALY gained | -$184,743 (-$272,375 to -$118,711) | |
Percent of simulations larotrectinib is clinically dominated | 15.8% | |
ICER ($/QALY gained) | $160,396 ($73,864 to dominated) | |
ICER ($/QALY gained) included testing costs | $332,589 ($144,717 to dominated) | |
*The average cost of death from CNS for patients in the larotrectinib arm was assumed to be $82,290 consistent with the assumption for the lomustine arm (Table 20)
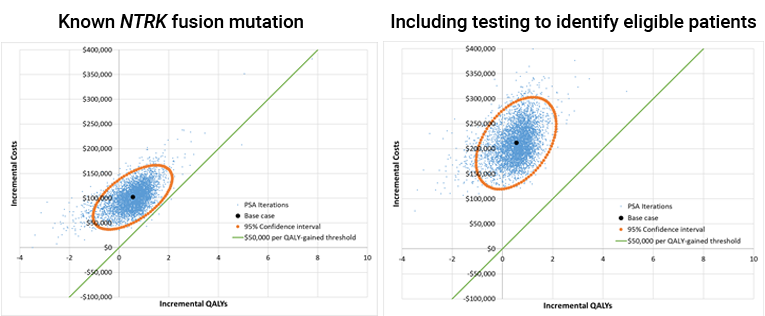
Table 24: CADTH Price Reduction Analyses for CNS/Glioma
Price reduction | ICER for larotrectinib vs. lomustine | |
|---|---|---|
Patients with known mutation | Including testing to identify eligible patients | |
No price reduction | $160,396 ($73,864 to clinically dominated) | $331,243 ($143,948 to clinically dominated) |
10% | $145,522 ($66,609 to clinically dominated) | $321,034 ($138,736 to clinically dominated) |
20% | $130,851 ($59,512 to clinically dominated) | $305,653 ($129,763 to clinically dominated) |
30% | $116,323 ($52,685 to clinically dominated) | $288,791 ($124,323 to clinically dominated) |
40% | $101,796 ($45,735 to clinically dominated) | $273,259 ($115,892 to clinically dominated) |
50% | $87,803 ($38,334 to clinically dominated) | $259,664 ($109,396 to clinically dominated) |
60% | $72,879 ($29,234 to clinically dominated) | $248,593 ($100,468 to clinically dominated) |
70% | $58,549 ($18,243 to clinically dominated) | $231,238 ($94,923 to clinically dominated) |
80% | $44,435 ($3,729 to clinically dominated) | $218,077 ($86,666 to clinically dominated) |
90% | $30,790 (Cost saving to clinically dominated) | $201,937 ($80,072 to clinically dominated) |
95% | $23,914 (Cost saving to clinically dominated) | $194,220 ($75,616 to clinically dominated) |
ICER = incremental cost-effectiveness ratio; vs. = versus.
Colorectal (MSI-High)
CADTH reanalysis indicated that, compared to 5- fluorouracil + oxaliplatin + leucovorin (best supportive care), the median ICER of larotrectinib in patients known to have a colorectal NTRK fusion cancer is $192,472 (95% CI, $87,793 to dominated) (Table 25). Larotrectinib increases patient treatment costs by $63,860 per patient and there is a 13.8% probability that larotrectinib is clinically dominated (has a lower average quality-adjusted life-years than best supportive care). Achieving a median ICER less than $50,000 per QALY gained in patients with a known mutation requires a price reduction of approximately 70% (Table 24). The risk sharing agreement proposed in the sponsor’s report is approximately equal to a one-half reduction in cost for this tumour site using the projected survival curves in the reanalysis.
Clinical experts noted that 48% of all colorectal cancer patients currently receive genetic testing to inform treatment decisions in Ontario, although the current panel does not evaluate NTRK fusion mutation, and this rate of testing varies substantially across Canada. Incorporating evaluation for NTRK gene fusion to NGS at an incremental cost of $1,040 per patient would result in an incremental cost per identified patient of $19,623 (95% CI, $15,365 to $26,000), using an estimated mutation frequency of 5.30% (95% CI, 4.00% to 6.77%) in MSI-high patients, requiring testing of approximately 18.9 (95% CI, 14.8 to 25.0) individuals to identify a colorectal cancer patient with NTRK fusion. Incorporating the costs of identifying patients, the median ICER of larotrectinib is $252,967 per QALY gained (95% CI, $116,784 to dominated) (Table 25). Achieving a median ICER less than $50,000 per QALY gained with NGS screening when the cost of screening is $1,040 per patient requires a price reduction of greater than 95%.
In sensitivity analysis, CADTH explored the ICER using IHC screening followed by NGS confirmatory testing. If this technology is clinical validated and becomes widely available, using an IHC test with a sensitivity of 85% and specificity of 97% results in an incremental cost per identified patient of $3,161 (95% CI, $2,699, $3,844). In this case, the median ICER of larotrectinib in patients with colorectal NTRK fusion cancers is $201,802 per QALY gained (95% CI, $92,495 to dominated) (Table 42). The comparative effectiveness of larotrectinib remains highly uncertain in this analysis and there continues to be a 13.8% probability that larotrectinib has a lower average quality-adjusted life-years than best supportive care.
Table 25: CADTH Reanalysis Results for Patients With Colorectal NTRK Fusion Cancers
Model output | Larotrectinib including NGS testing | 5- fluorouracil + oxaliplatin + leucovorin |
|---|---|---|
Life-years | ||
Pre-progression | 0.46 (0.32 to 0.61) | 0.20 (0.09 to 0.46) |
Post-progression | 0.57 (0.19 to 1.02) | 0.56 (0.01 to 1.64) |
Overall survival | 1.03 (0.65 to 1.53) | 0.76 (0.23 to 1.86) |
QALYs | ||
Pre-progression | 0.38 (0.25 to 0.50) | 0.14 (0.07 to 0.33) |
Post-progression | 0.42 (0.14 to 0.75) | 0.33 (0.01 to 0.97) |
AEs | −0.02 (−0.03 to −0.02) | — |
Overall survival | 0.77 (0.49 to 1.16) | 0.47 (0.16 to 1.11) |
Costs | ||
Diagnostic | $19,939 ($15,170 to $26,086) | — |
Drug | $66,657 ($45,372 to $88,021) | $2,797 ($1,233 to $6,543) |
Adverse Events | $992 ($798 to $1,190) | — |
Health Services | $13,036 ($6,569 to $21,432) | $9,781 ($1,043 to $27,787) |
End of life | $32,464 ($25,938 to $39,011) | $37,574 ($30,000 to $45,100) |
Total Costs | $133,087 ($108,953 to $160,435) | $50,152 ($38,923 to $66,357) |
Incremental | ||
Costs (excluding diagnostic) | $62,997 ($34,685 to $91,499) | |
Costs (including diagnostic) | $82,936 ($54,033 to $112,959) | |
LY | 0.27 (−0.86 to 1.02) | |
QALY | 0.30 (−0.40 to 0.81) | |
NMB at $50,000/QALY gained | –$68,009 (–$97,036 to –$41,618) | |
% of simulations larotrectinib is clinically dominated | 13.8% | |
ICER ($/QALY gained) | $192,472 ($87,793 to dominated) | |
ICER (including diagnostic costs) | $252,967 ($116,784 to dominated) | |
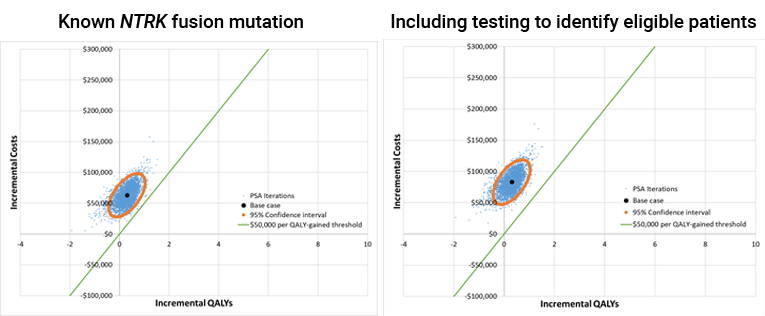
Table 26: CADTH Price Reduction Analyses for Colorectal NTRK Fusion Cancers
Price reduction | ICER for larotrectinib vs. 5- fluorouracil + oxaliplatin + leucovorin | |
|---|---|---|
Patients with known mutation | Including testing to identify eligible patients | |
No price reduction | $192,472 ($87,793 to dominated) | $252,394 ($116,157 to dominated) |
10% | $172,079 ($78,984 to dominated) | $233,252 ($107,305 to dominated) |
20% | $152,312 ($70,093 to dominated) | $212,875 ($99,562 to dominated) |
30% | $132,209 ($61,108 to dominated) | $192,490 ($90,170 to dominated) |
40% | $111,934 ($51,514 to dominated) | $172,527 ($80,246 to dominated) |
50% | $92,132 ($41,106 to dominated) | $151,400 ($72,090 to dominated) |
60% | $72,371 ($30,308 to dominated) | $132,135 ($62,644 to dominated) |
70% | $52,617 ($16,367 to dominated) | $112,099 ($53,307 to dominated) |
80% | $33,142 (Cost saving to dominated) | $92,722 ($42,987 to dominated) |
90% | $15,491 (Cost saving to clinically dominated) | $72,645 ($31,192 to dominated) |
95% | $6,827 (Cost saving to clinically dominated) | $63,242 ($25,606 to dominated) |
ICER = incremental cost-effectiveness ratio; vs. = versus.
Infantile Fibrosarcoma (IFS)
NTRK fusion mutations are characteristic of IFS with an estimated mutation frequency of 90.6% (95% CI, 85 to 95%), requiring testing of approximately 1.1 individuals to identify an IFS patient with NTRK fusion cancer. There is a 18.2% probability that larotrectinib is clinically dominated (has a lower average quality-adjusted life-years than VAC (best supportive care)). Larotrectinib increases patient treatment costs by $376,733 per patient compared to best supportive care. Fully incorporating the costs of identifying patients, the median ICER of larotrectinib is $203,383 per QALY gained (95% CI, $97,258 to dominated) (Table 27, Figure 8). Achieving a median ICER less than $50,000 per QALY gained with NGS screening when the cost of screening is $1,040 per patient requires a price reduction of 60% to 70% (Table 28). The risk sharing agreement proposed in the sponsor’s report represents a less than 10% reduction in cost for this tumour site using the projected survival curves in the reanalysis.
CADTH reanalysis continues the sponsor’s assumption that the PFS, OS, costs, and quality-adjusted life-years associated with best supportive care in patients with IFS are represented by those of pediatric STS despite uncertainty in the clinical appropriateness of this strategy.
Table 27: CADTH Reanalysis Results for Patients With IFS NTRK Fusion Cancer
Model output | Larotrectinib including NGS testing | VAC (best supportive care) |
|---|---|---|
Life-years | ||
Pre-progression | 4.12 (2.69 to 6.39) | 3.98 (1.31 to 8.15) |
Post-progression | 3.14 (1.84 to 4.95) | 2.99 (0.00 to 10.09) |
Overall survival | 7.25 (5.34 to 10.61) | 6.97 (2.14 to 13.78) |
QALYs | ||
Pre-progression | 3.33 (2.18 to 5.18) | 2.70 (0.89 to 5.53) |
Post-progression | 2.32 (1.35 to 3.69) | 1.27 (0.00 to 4.34) |
AEs | −0.02 (−0.03 to −0.02) | — |
Overall survival | 5.63 (4.14 to 8.25) | 3.97 (1.40 to 7.25) |
Costs | ||
Diagnostic | $1,149 ($1,094 to $1,222) | — |
Drug | $397,548 ($262,591 to $594,799) | $20,815 ($6,875 to $42,638) |
Adverse Events | $992 ($798 to $1,190) | — |
Health Services | $92,722 ($54,943 to $149,199) | $140,182 ($25,395 to $377,700) |
End of life | $29,094 ($22,889 to $35,308) | $10,526 ($7,073 to $13,642) |
Total Costs | $521,505 ($370,030 to $750,825) | $171,522 ($65,590 to $313,028) |
Incremental | ||
Costs (excluding diagnostic costs) | $348,834 ($137,557 to $596,264) | |
Costs (including diagnostic costs) | $349,982 ($138,744 to $597,379) | |
LY | 0.29 (−6.88 to 6.00) | |
QALY | 1.67 (−2.10 to 5.24) | |
NMB at $50,000/QALY gained | –$266,657 (–$397,451 to –$152,257) | |
% of simulations larotrectinib is clinically dominated | 18.2% | |
ICER ($/QALY gained) excluding diagnostic costs | $202,830 ($96,960 to dominated) | |
ICER ($/QALY gained) including diagnostic costs | $203,383 ($97,258 to dominated) | |
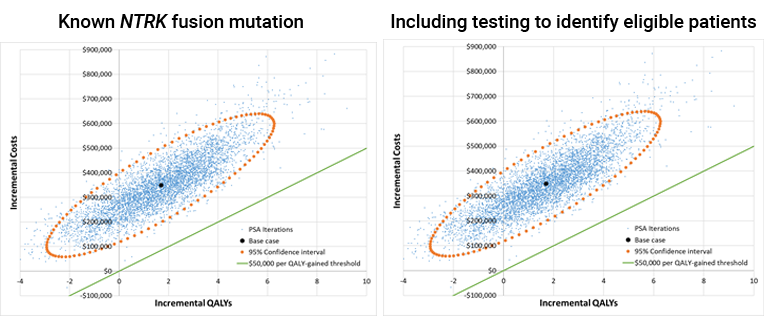
Table 28: CADTH Price Reduction Analyses for IFS
Price reduction | ICER for larotrectinib vs. VAC | |
|---|---|---|
Patients with known mutation | Including testing to identify eligible patients | |
No price reduction | $202,830 ($96,960 to dominated) | $203,410 ($97,265 to dominated) |
10% | $179,832 ($88,054 to dominated) | $180,622 ($88,673 to dominated) |
20% | $157,336 ($79,286 to dominated) | $157,982 ($79,585 to dominated) |
30% | $134,270 ($69,888 to dominated) | $135,070 ($70,094 to dominated) |
40% | $111,197 ($60,839 to dominated) | $111,774 ($61,168 to dominated) |
50% | $88,494 ($50,529 to dominated) | $89,182 ($50,889 to dominated) |
60% | $65,998 ($35,645 to dominated) | $66,576 ($36,502 to dominated) |
70% | $45,275 (Cost saving to dominated) | $45,762 (Cost saving to dominated) |
80% | $28,148 (Cost saving to clinically dominated) | $28,636 (Cost saving to clinically dominated) |
90% | $11,699 (Cost saving to clinically dominated) | $12,195 (Cost saving to clinically dominated) |
95% | $3,788 (Cost saving to clinically dominated) | $4,232 (Cost saving to clinically dominated) |
ICER = incremental cost-effectiveness ratio; vs. = versus.
Non–Small Cell Lung Cancer (NSCLC)
CADTH reanalysis indicated that, compared to docetaxel + pemetrexed + topotecan (best supportive care), the median ICER of larotrectinib in patients known to have an NSCLC NTRK fusion cancer is $164,685 (95% CI, $110,558, $22,694,043) (Table 29). Larotrectinib increases patient treatment costs by $139,378 per patient compared to best supportive care and there is a 2.5% probability that larotrectinib is clinically dominated (has a lower average quality-adjusted life-years than best supportive care). Achieving a median ICER less than $50,000 per QALY gained in patients with a known mutation requires a price reduction of 60% to 70% (Table 30). The risk sharing agreement proposed in the sponsor’s report is approximately equal to a 20% reduction in cost for this tumour site using the projected survival curves in the reanalysis.
Clinical experts noted that 78% of all NSCLC patients currently receive genetic testing to inform treatment decisions in Ontario, although the current panel does not evaluate NTRK fusion mutation. Incorporating evaluation for NTRK gene fusion to NGS at an incremental cost of $1,040 per patient would result in an incremental cost per identified patient of $520,000 (95% CI, $310,230 to $1,047,108), using an estimated mutation frequency of 0.20%% (95% CI, 0.10%, 0.34%) and requiring testing of approximately 500 (95% CI, 298 to 1,007) individuals to identify an NSCLC patient with NTRK fusion. Incorporating the costs of identifying patients, the median ICER of larotrectinib is $818,375 per QALY gained (95% CI, $424,576, $164,401,271) (Table 29). Achieving a median ICER less than $50,000 per QALY gained with NGS screening when the cost of screening is $1,040 per patient cannot be achieved with larotrectinib price reductions.
In sensitivity analysis, CADTH explored the ICER using IHC screening followed by NGS confirmatory testing. If this technology is clinical validated and becomes widely available, using an IHC test with a sensitivity of 85% and specificity of 97% results in an incremental cost per identified patient of $63,596 (95% CI, $35,379, $114,288). In this case, the median ICER of larotrectinib in patients with NTRK fusion NSCLC cancers is $237,404 per QALY gained (95% CI, $156,222, $33,728,203) (Table 42).
The comparative effectiveness of larotrectinib remains highly uncertain in this analysis and there continues to be a 2.5% probability that larotrectinib has a lower average quality-adjusted life-years than best supportive care.
Table 29: CADTH Reanalysis Results for Patients With NSCLC NTRK Fusion Cancers
Model output | Larotrectinib including NGS testing | Docetaxel + pemetrexed + topotecan (best supportive care) |
|---|---|---|
Life-years | ||
Pre-progression | 1.10 (0.84 to 1.39) | 0.44 (0.17 to 0.99) |
Post-progression | 0.77 (0.36 to 1.18) | 0.45 (0.00 to 1.66) |
Overall survival | 1.87 (1.44 to 2.39) | 0.89 (0.29 to 2.10) |
QALYs | ||
Pre-progression | 0.89 (0.68 to 1.13) | 0.31 (0.12 to 0.71) |
Post-progression | 0.57 (0.26 to 0.88) | 0.29 (0.00 to 1.08) |
AEs | −0.02 (−0.03 to −0.02) | 0.00 (0.00 to 0.00) |
Overall survival | 1.44 (1.11 to 1.85) | 0.60 (0.20 to 1.39) |
Costs | ||
Diagnostic | $573,918 ($311,210 to $1,052,644) | — |
Drug | $157,772 ($120,794 to $199,354) | $18,394 ($6,809 to $42,630) |
Adverse Events | $992 ($798 to $1,190) | — |
Health Services | $23,764 ($14,747 to $34,525) | $9,141 ($1,515 to $27,993) |
End of life | $32,074 ($25,573 to $38,498) | $40,054 ($31,885 to $48,118) |
Total Costs | $788,520 ($519,719 to $1,272,150) | $67,589 ($49,901 to $97,910) |
Incremental | ||
Costs (excluding diagnostic costs) | $147,012 ($99,820 to $197,377) | |
Costs (including diagnostic costs) | $720,930 ($447,773 to $1,204,417) | |
LY | 0.98 (−0.30 to 1.78) | |
QALY | 0.84 (0.00 to 1.41) | |
NMB at $50,000/QALY gained | –$679,051 (–$1,161,797 to –$409,301) | |
Percent of simulations larotrectinib is clinically dominated | 2.5% | |
ICER ($/QALY gained) excluding diagnostic costs | $164,685 ($110,558 to $22,694,043) | |
ICER ($/QALY gained) including diagnostic costs | $818,375 ($424,576 to $164,401,271) | |
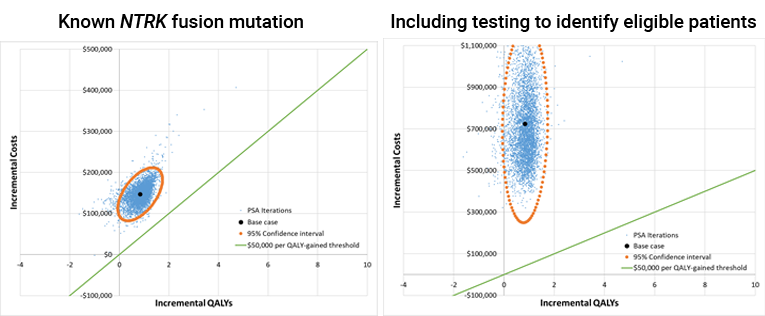
Table 30: CADTH Price Reduction Analyses for NSCLC
Price reduction | ICER for larotrectinib vs. docetaxel + pemetrexed + topotecan | |
|---|---|---|
Patients with known mutation | Including testing to identify eligible patients | |
No price reduction | $164,685 ($110,558 to $22,694,043) | $810,923 ($416,386 to $173,744,995) |
10% | $147,131 ($98,596 to $19,808,590) | $790,407 ($409,838 to $158,515,596) |
20% | $129,628 ($86,546 to $16,923,137) | $765,108 ($390,298 to $111,693,684) |
30% | $111,937 ($74,312 to $14,037,684) | $749,726 ($380,931 to $156,550,174) |
40% | $94,091 ($61,892 to $11,152,231) | $736,257 ($368,417 to $141,851,769) |
50% | $77,029 ($47,936 to $8,266,778) | $718,889 ($349,755 to $187,709,140) |
60% | $59,973 ($31,576 to $5,381,324) | $693,948 ($334,208 to $129,549,139) |
70% | $42,804 ($9,805 to $2,906,725) | $677,597 ($327,328 to $155,551,465) |
80% | $25,892 (Cost saving to $1,316,441) | $668,210 ($313,463 to $111,328,525) |
90% | $8,344 (Cost saving to $204,466) | $649,632 ($295,568 to $94,759,858) |
95% | Cost saving (Cost saving to $43,676) | $635,048 ($292,634 to $101,842,214) |
ICER = incremental cost-effectiveness ratio; vs. = versus.
Melanoma
CADTH reanalysis indicated that, compared to carboplatin + paclitaxel (best supportive care), larotrectinib increases costs and decreases quality-adjusted life-years (this outcome is referred to as dominated because it both costs more and provides less benefit than the alternative). Specifically, there is a 59.5% probability that larotrectinib is clinically dominated (has a lower average quality-adjusted life-years than best supportive care). Larotrectinib increases average patient treatment costs by $119,095 per patient (Table 31).
Clinical experts noted that 44% of all melanoma patients currently receive genetic testing to inform treatment decisions in Ontario, although the current panel does not evaluate NTRK fusion mutation, and this rate of testing varies substantially across Canada. Incorporating evaluation for NTRK gene fusion to NGS at an incremental cost of $1,040 per patient would result in an incremental cost per identified patient of $335,484 (95% CI, $233,797, $522,106), using an estimated mutation frequency of 0.31%% (95% CI, 0.20%, 0.44%) and requiring testing of approximately 323 (95% CI, 225 to 502) individuals to identify a melanoma patient with NTRK fusion. Incorporating the costs of identifying patients, increases the incremental cost of the larotrectinib arm.
Even using a lower cost test (e.g., using IHC to screen melanoma patients), larotrectinib continues to be dominated by best supportive care in patients with melanoma. There is no price reduction that would lead to larotrectinib being cost-effective because the average health benefit from larotrectinib in this patient population is negative in 59.5% of simulations (Table 31, Figure 10).
Table 31: CADTH Reanalysis Results for Patients With Melanoma NTRK Fusion Cancers
Model output | Larotrectinib including NGS testing | Carboplatin + paclitaxel (best supportive care) |
|---|---|---|
Life-years | ||
Pre-progression | 0.84 (0.52 to 1.25) | 0.69 (0.37 to 1.81) |
Post-progression | 1.00 (0.11 to 2.15) | 2.06 (0.08 to 6.11) |
Overall survival | 1.84 (0.89 to 3.22) | 2.75 (0.73 to 6.73) |
QALYs | ||
Pre-progression | 0.68 (0.42 to 1.01) | 0.52 (0.10 to 1.45) |
Post-progression | 0.74 (0.08 to 1.59) | 1.43 (0.03 to 4.95) |
AEs | −0.02 (−0.03 to −0.02) | 0.00 (0.00 to 0.00) |
Overall survival | 1.40 (0.69 to 2.46) | 1.95 (0.42 to 5.41) |
Costs | ||
Diagnostic | $350,027 ($233,765 to $523,713) | — |
Drug | $121,396 ($74,254 to $179,989) | $2,301 ($1,148 to $6,064) |
Adverse Events | $992 ($798 to $1,190) | — |
Health Services | $24,015 ($9,903 to $44,561) | $21,043 ($3,069 to $61,226) |
End of life | $32,040 ($25,517 to $38,430) | $17,923 ($14,199 to $21,587) |
Total Costs | $528,469 ($395,270 to $715,571) | $41,268 ($24,997 to $70,988) |
Incremental | ||
Costs (excluding diagnostic costs) | $137,175 ($77,701 to $211,951) | |
Costs (including diagnostic costs) | $487,202 ($352,487 to $673,744) | |
LY | −0.91 (−4.88 to 1.54) | |
QALY | −0.54 (−4.04 to 1.34) | |
NMB at $50,000/QALY gained | –$514,405 (-–$740,250 to –$357,628) | |
Percent of simulations larotrectinib is clinically dominated | 59.5% | |
ICER ($/QALY gained) excluding diagnostic costs | Dominated ($121,287 to dominated) | |
ICER ($/QALY gained) including diagnostic costs | Dominated ($372,273 to dominated) | |
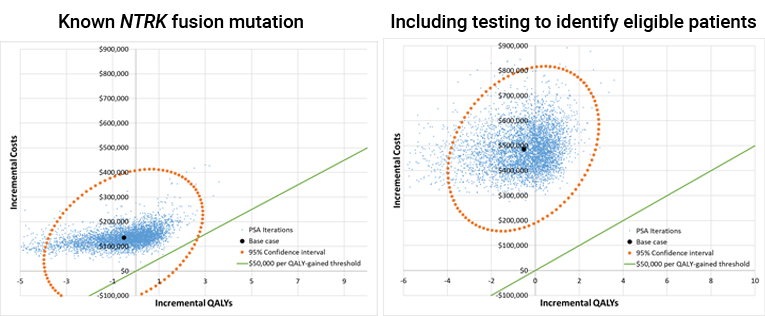
Table 32: CADTH Price Reduction Analyses for Melanoma
Price reduction | ICER for larotrectinib vs. carboplatin + paclitaxel | |
|---|---|---|
Patients with known mutation | Including testing to identify eligible patients | |
No price reduction | Dominated ($121,287 to dominated) | Dominated ($376,292 to dominated) |
10% | Dominated ($111,275 to dominated) | Dominated ($360,679 to dominated) |
20% | Dominated ($101,701 to dominated) | Dominated ($354,999 to dominated) |
30% | Dominated ($91,816 to dominated) | Dominated ($342,355 to dominated) |
40% | Dominated ($82,651 to dominated) | Dominated ($338,676 to dominated) |
50% | Dominated ($72,446 to dominated) | Dominated ($317,375 to dominated) |
60% | Dominated ($62,929 to dominated) | Dominated ($310,619 to dominated) |
70% | Dominated ($52,364 to dominated) | Dominated ($302,991 to dominated) |
80% | Dominated ($41,698, to dominated) | Dominated ($290,284 to dominated) |
90% | Dominated ($30,821 to dominated) | Dominated ($277,259 to dominated) |
95% | Dominated ($24,765 to dominated) | Dominated ($270,811 to dominated) |
ICER = incremental cost-effectiveness ratio; vs. = versus.
Salivary (MASC)
CADTH reanalysis indicated that, compared to cisplatin + vinorelbine (best supportive care), the median ICER of larotrectinib in patients known to have a salivary gland NTRK fusion cancer is $237,880 (95% CI, 159,487 to dominated) (Table 33). Larotrectinib increases patient treatment costs by $355,805 per patient and there is a 5.7% probability that larotrectinib is clinically dominated (has a lower average quality-adjusted life-years than best supportive care). Achieving a median ICER less than $50,000 per QALY gained in patients with a known mutation requires a price reduction 80 to 90% (Table 34). The risk sharing agreement proposed in the sponsor’s report represents a less than 10% reduction in cost for this tumour site using the projected survival curves in the reanalysis.
Genetic testing for NTRK fusion cancers is not routine in patients with salivary gland cancer. Incorporating evaluation for NTRK gene fusion to NGS at an incremental cost of $1,040 per patient would result in an incremental cost per identified patient of $273,684 (95% CI, $145,208 to $696,921), using an estimated mutation frequency of 0.38% (95% CI, 0.15% to 0.72%) and requiring testing of approximately 263 (95% CI, 140 to 670) individuals to identify a salivary gland cancer patient with NTRK fusion. Incorporating the costs of identifying patients, the median ICER of larotrectinib is $438,812 per QALY gained (95% CI, $259,611 to dominated) (Table 33). A median ICER less than $50,000 per QALY gained cannot be achieved with price reductions alone if testing costs are included.
In sensitivity analysis, CADTH explored using IHC screening followed by NGS confirmatory testing. If this technology is clinical validated and becomes widely available, using an IHC test with a sensitivity of 85% and specificity of 97% results in an incremental cost per identified patient of $36,061 (95% CI, $17,121 to $75,961). In this case, the median ICER of larotrectinib in patients with salivary gland NTRK fusion cancers is $259,753 per QALY gained (95% CI, $173,699 to dominated) (Table 42). The comparative effectiveness of larotrectinib remains highly uncertain in this analysis and there continues to be a 5.7% probability that larotrectinib has a lower average quality-adjusted life-years than best supportive care.
Table 33: CADTH Reanalysis Results for Patients With Salivary Gland NTRK Fusion Cancers
Model output | Larotrectinib including NGS testing | Cisplatin + vinorelbine (best supportive care) |
|---|---|---|
Life-years | ||
Pre-progression | 2.51 (1.91 to 3.17) | 0.83 (0.38 to 1.92) |
Post-progression | 0.64 (−0.07 to 1.45) | 0.74 (0.00 to 4.03) |
Overall survival | 3.15 (2.49 to 4.09) | 1.56 (0.41 to 5.03) |
QALYs | ||
Pre-progression | 2.03 (1.54 to 2.57) | 0.61 (0.27 to 1.44) |
Post-progression | 0.48 (−0.05 to 1.07) | 0.44 (0.00 to 2.41) |
AEs | −0.02 (−0.03 to −0.02) | −0.01 (−0.01 to −0.01) |
Overall survival | 2.49 (1.98 to 3.21) | 1.05 (0.29 to 3.22) |
Costs | ||
Diagnostic | $329,275 ($143,794 to $718,207) | — |
Drug | $360,408 ($274,402 to $456,283) | $4,603 ($3,931 to $5,319) |
Adverse Events | $992 ($798 to $1,190) | $1,427 ($1,147 to $1,720) |
Health Services | $40,369 ($24,454 to $61,262) | $16,145 ($3,590 to $63,718) |
End of life | $31,438 ($25,118 to $37,747) | $25,005 ($19,880 to $30,159) |
Total Costs | $762,481 ($551,090 to $1,169,435) | $47,180 ($33,564 to $82,584) |
Incremental | ||
Costs (excluding diagnostic) | $386,026 ($291,971 to $491,507) | |
Costs (including diagnostic) | $715,301 ($499,977 to $1,122,613) | |
LY | 1.59 (−1.86 to 3.16) | |
QALY | 1.44 (−0.78 to 2.53) | |
NMB at $50,000/QALY gained | -$643,425 (-$1,058,127 to -$429,617) | |
% of simulations larotrectinib is clinically dominated | 5.7% | |
ICER ($/QALY gained) excluding diagnostic costs | $237,880 ($159,487 to dominated) | |
ICER ($/QALY gained) including diagnostic costs | $438,812 ($259,611 to dominated) | |
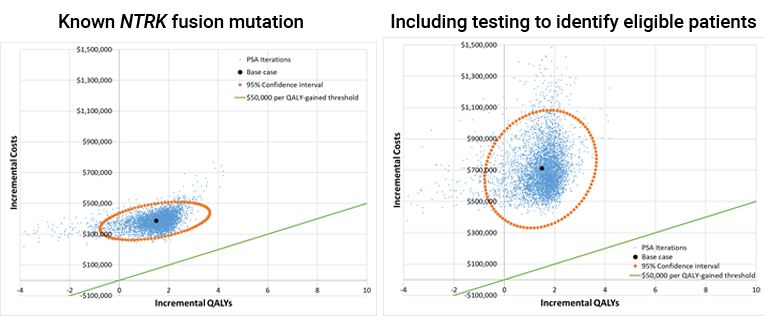
Table 34: CADTH Price Reduction Analyses for Salivary Gland Tumours
Price reduction | ICER for larotrectinib vs. cisplatin + vinorelbine | |
|---|---|---|
Patients with known mutation | Including testing to identify eligible patients | |
No price reduction | $237,880 ($159,487 to dominated) | $435,813 ($255,019 to dominated) |
10% | $215,853 ($145,185 to dominated) | $412,038 ($241,999 to dominated) |
20% | $193,745 ($131,008 to dominated) | $387,463 ($227,354 to dominated) |
30% | $171,776 ($116,748 to dominated) | $370,065 ($208,795 to dominated) |
40% | $149,713 ($102,469 to dominated) | $344,997 ($195,431 to dominated) |
50% | $127,512 ($87,853 to dominated) | $326,221 ($176,974 to dominated) |
60% | $105,658 ($73,609 to dominated) | $303,447 ($163,498 to dominated) |
70% | $83,748 ($59,224 to dominated) | $279,374 ($143,286 to dominated) |
80% | $61,932 ($44,477 to dominated) | $256,021 ($127,175 to dominated) |
90% | $39,966 ($29,415 to dominated) | $231,911 ($111,152 to dominated) |
95% | $29,039 ($20,988 to dominated) | $222,641 ($104,883 to dominated) |
ICER = incremental cost-effectiveness ratio; vs. = versus.
Adult Non-GIST Soft Tissue Sarcoma
CADTH reanalysis indicated that, compared to doxorubicin + ifosfamide (best supportive care), the median ICER of larotrectinib in patients known to have an adult non-GIST NTRK fusion STS is $111,395 (95% CI, $57,088 to dominated) (Table 35). Larotrectinib increases patient treatment costs by $144,855 per patient and there is a 10.6% probability that larotrectinib is clinically dominated (has a lower average quality-adjusted life-years than best supportive care). Achieving a median ICER less than $50,000 per QALY gained in patients with a known mutation requires a price reduction of 50% to 60% (Table 36). The risk sharing agreement proposed in the submission is approximately equal to a 20% reduction in cost for this tumour site using the projected survival curves in the reanalysis.
Genetic testing for NTRK fusion cancers is not routine in patients with adult non-GIST STS. Incorporating evaluation for NTRK gene fusion to NGS at an incremental cost of $1,040 per patient would result in an incremental cost per identified patient of $104,000 (95% CI, $69,355 to $173,379), using an estimated mutation frequency of 1.00% (95% CI, 0.60%, 1.50%) and requiring testing of approximately 100 (95% CI, 67 to 167) individuals to identify an adult non-GIST STS patient with NTRK fusion. Incorporating the costs of identifying patients, the median ICER of larotrectinib is $183,055 per QALY gained (95% CI, $100,055 to dominated) (Table 35). Achieving a median ICER less than $50,000 per QALY gained with NGS screening when the cost of screening is $1,040 per patient requires a price reduction of greater than 95%.
In sensitivity analysis, CADTH explored the ICER using IHC screening followed by NGS confirmatory testing. If this technology is clinical validated and becomes widely available, using an IHC test with a sensitivity of 85% and specificity of 97% results in an incremental cost per identified patient of $13,030 (95% CI, $8,676, $19,846). In this case, the median ICER of larotrectinib in patients with NTRK fusion adult non-GIST STS is $119,985 per QALY gained (95% CI, $62,991 to dominated) (Table 42). The comparative effectiveness of larotrectinib remains highly uncertain in this analysis and there continues to be a 10.6% probability that larotrectinib has a lower average quality-adjusted life-years than best supportive care.
Table 35: CADTH Reanalysis Results for Patients With Known Mutation Status
Model output | Larotrectinib including NGS testing | Doxorubicin + ifosfamide (best supportive care) |
|---|---|---|
Life-years | ||
Pre-progression | 1.18 (0.69 to 1.80) | 1.00 (0.35 to 2.50) |
Post-progression | 2.31 (1.09 to 3.68) | 1.58 (0.00 to 7.58) |
Overall survival | 3.49 (2.30 to 4.88) | 2.58 (0.64 to 8.68) |
QALYs | ||
Pre-progression | 0.96 (0.55 to 1.46) | 0.65 (0.23 to 1.63) |
Post-progression | 1.71 (0.81 to 2.73) | 0.75 (0.00 to 3.58) |
AEs | −0.02 (−0.03 to −0.02) | −0.07 (−0.08 to −0.05) |
Overall survival | 2.64 (1.77 to 3.69) | 1.33 (0.33 to 4.35) |
Costs | ||
Diagnostic | $110,496 ($69,659 to $175,357) | — |
Drug | $170,076 ($98,508 to $259,281) | $25,221 ($8,887 to $62,896) |
Adverse Events | $992 ($798 to $1,190) | $7,231 ($5,799 to $8,643) |
Health Services | $44,511 ($21,583 to $72,540) | $24,689 ($3,113 to $98,464) |
End of life | $31,266 ($24,849 to $37,592) | $23,696 ($18,084 to $28,868) |
Total Costs | $357,340 ($267,170 to $468,142) | $80,837 ($49,548 to $154,848) |
Incremental | ||
Costs (excluding diagnostic) | $166,008 ($62,688 to $271,374) | |
Costs (including diagnostic) | $276,504 ($162,120 to $397,221) | |
LY | 0.91 (−5.31 to 3.49) | |
QALY | 1.31 (−1.72 to 2.88) | |
NMB at $50,000/QALY gained | –$211,021 (–$335,442 to –$109,842) | |
Percent of simulations larotrectinib is clinically dominated | 10.6% | |
ICER ($/QALY gained) excluding diagnostic costs | $111,395 ($57,088 to dominated) | |
ICER (%/QALY gained) including diagnostic costs) | $183,055 ($100,055 to dominated) | |
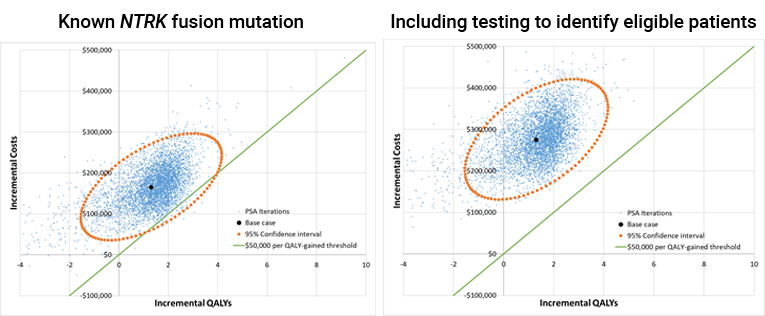
Table 36: CADTH Price Reduction Analyses for Adult Non-GIST STS
Price reduction | ICER for larotrectinib vs. doxorubicin + ifosfamide | |
|---|---|---|
Patients with known mutation | Including testing to identify eligible patients | |
No price reduction | $111,395 ($57,088 to dominated) | $183,401 ($99,949 to dominated) |
10% | $100,343 ($51,847 to dominated) | $171,669 ($93,392 to dominated) |
20% | $89,295 ($46,412 to dominated) | $161,006 ($90,293 to dominated) |
30% | $78,223 ($40,748 to dominated) | $149,576 ($82,342 to dominated) |
40% | $67,175 ($34,911 to dominated) | $138,829 ($77,694 to dominated) |
50% | $56,265 ($28,490 to dominated) | $128,498 ($71,326 to dominated) |
60% | $45,510 ($19,930 to dominated) | $117,336 ($64,726 to dominated) |
70% | $34,628 ($6,258 to dominated) | $105,145 ($58,999 to dominated) |
80% | $24,425 (Cost saving to clinically dominated) | $95,310 ($53,434 to dominated) |
90% | $14,409 (Cost saving to clinically dominated) | $83,636 ($45,047 to dominated) |
95% | $9,295 (Cost saving to clinically dominated) | $78,523 ($41,509 to dominated) |
ICER = incremental cost-effectiveness ratio; vs. = versus.
Pediatric Soft Tissue Sarcoma
CADTH reanalysis indicated that, compared to VAC (best supportive care), the median ICER of larotrectinib in patients known to have an NTRK fusion pediatric STS is $234,720 (95% CI, $85,031 to dominated) (Table 37). Larotrectinib increases patient treatment costs by $315,535 per patient and there is a 25.5% probability that larotrectinib is clinically dominated (has a lower average quality-adjusted life-years than best supportive care). Achieving a median ICER less than $50,000 per QALY gained in patients with a known mutation requires a price reduction of 60% to 70% (Table 38).
The risk sharing agreement proposed in the submission represents a less than 10% reduction in cost for this tumour site using the projected survival curves in the reanalysis.
Genetic testing for NTRK fusion cancers is not routine in patients with pediatric STS. Incorporating evaluation for NTRK gene fusion to NGS at an incremental cost of $1,040 per patient would result in an incremental cost per identified patient of $104,000 (95% CI, $69,355 to $173,379), using an estimated mutation frequency of 1.00% (95% CI, 0.6% to 1.5%) and requiring testing of approximately 100 (95% CI, 67 to 167) individuals to identify a pediatric STS patient with NTRK fusion. Incorporating the costs of identifying patients, the median ICER of larotrectinib is $323,821 per QALY gained (95% CI, $113,854 to dominated) (Table 37). Achieving a median ICER less than $50,000 per QALY gained with NGS screening when the cost of screening is $1,040 per patient requires a price reduction of greater than 95%.
In sensitivity analysis, CADTH explored the ICER using IHC screening followed by NGS confirmatory testing. If this technology is clinical validated and becomes widely available, using an IHC test with a sensitivity of 85% and specificity of 97% results in an incremental cost per identified patient of $13,030 (95% CI, $8,676 to $19,846). In this case, the median ICER of larotrectinib in patients with NTRK fusion pediatric STS cancers is $244,792 per QALY gained (95% CI, $88,918 to dominated) . The comparative effectiveness of larotrectinib remains highly uncertain in this analysis and there continues to be a 25.5% probability that larotrectinib has a lower average quality-adjusted life-years than best supportive care.
Table 37: CADTH Reanalysis Results for Patients With Pediatric STS NTRK Fusion Cancers
Model output | Larotrectinib including NGS testing | VAC (best supportive care) |
|---|---|---|
Life-years | ||
Pre-progression | 3.48 (2.03, 5.64) | 3.98 (1.31, 8.15) |
Post-progression | 3.13 (1.28, 5.41) | 2.99 (0.00, 10.09) |
Overall survival | 6.62 (4.58, 10.01) | 6.97 (2.14, 13.78) |
QALYs | ||
Pre-progression | 2.82 (1.64, 4.59) | 2.70 (0.89, 5.53) |
Post-progression | 2.32 (0.95, 3.99) | 1.27 (0.00, 4.34) |
AEs | −0.02 (−0.03, −0.02) | 0.00 (0.00, 0.00) |
Overall survival | 5.12 (3.56, 7.79) | 3.97 (1.40, 7.25) |
Costs | ||
Diagnostic | $109,702 ($70,000, $174,328) | — |
Drug | $336,350 ($198,603, $525,219) | $20,815 ($6,875, $42,638) |
Adverse Events | $992 ($798, $1,190) | — |
Health Services | $84,544 ($40,961, $144,457) | $140,182 ($25,395, $377,700) |
End of life | $29,421 ($23,239, $35,658) | $10,526 ($7,073, $13,642) |
Total Costs | $561,009 ($402,741, $788,889) | $171,522 ($65,590, $313,028) |
Incremental | ||
Costs (excluding diagnostic) | $279,784 ($66,734, $528,610) | |
Costs (including diagnostic) | $389,487 ($170,422, $653,099) | |
LY | −0.35 (−7.48, 5.51) | |
QALY | 1.15 (−2.53, 4.72) | |
NMB at $50,000/QALY gained | –$331,922 (–$488,131, –$194,574) | |
% of simulations larotrectinib is clinically dominated | 25.5% | |
ICER ($/QALY gained) excluding diagnostic | $234,720 ($85,031 to dominated) | |
ICER ($/QALY gained) including diagnostic | $323,821 ($113,854 to dominated) | |
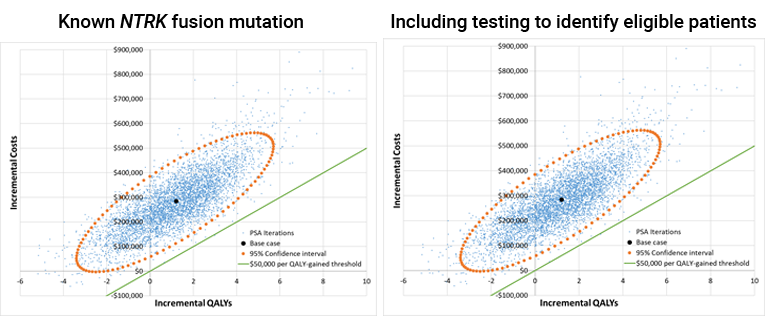
Table 38: CADTH Price Reduction Analyses for Pediatric STS
Price reduction | ICER for larotrectinib vs. VAC | |
|---|---|---|
Patients with known mutation | Including testing to identify eligible patients | |
No price reduction | $234,720 ($85,031 to dominated) | $323,106 ($113,731 to dominated) |
10% | $207,120 ($76,915 to dominated) | $298,242 ($104,682 to dominated) |
20% | $178,461 ($68,920 to dominated) | $271,326 ($96,634 to dominated) |
30% | $150,624 ($60,797 to dominated) | $245,159 ($88,480 to dominated) |
40% | $123,581 ($51,825 to dominated) | $214,543 ($79,877 to dominated) |
50% | $95,874 ($40,865 to dominated) | $187,330 ($72,142 to dominated) |
60% | $68,939 ($22,061 to dominated) | $158,031 ($62,836 to dominated) |
70% | $46,002 (Cost saving to dominated) | $130,841 ($53,989 to dominated) |
80% | $27,874 (Cost saving to clinically dominated) | $104,551 ($43,147 to dominated) |
90% | $12,489 (Cost saving to clinically dominated) | $77,842 ($23,269 to dominated) |
95% | $5,159 (Cost saving to clinically dominated) | $65,189 ($3,334 to dominated) |
ICER = incremental cost-effectiveness ratio; vs. = versus.
Radioactive-Iodine Resistant (RAI-R) Follicular and Papillary Thyroid
CADTH reanalysis indicated that, compared to doxorubicin + cisplatin (best supportive care), the median ICER of larotrectinib in patients known to have an NTRK fusion thyroid cancer is $414,521 (95% CI, $86,433 to dominated) (Table 39). Larotrectinib increases patient treatment costs by $248,710 per patient and there is a 39.6% probability that larotrectinib is clinically dominated (has a lower average quality-adjusted life-years than best supportive care). Achieving a median ICER less than $50,000 per QALY gained in patients with a known mutation requires a price reduction of 90% to 95% (Table 40). The risk sharing agreement proposed in the submission represents approximately a 12% reduction in cost for this tumour site using the projected survival curves in the reanalysis.
Genetic testing for NTRK fusion cancers is not routine in patients with follicular and papillary thyroid cancer. Incorporating evaluation for NTRK gene fusion to NGS at an incremental cost of $1,040 per patient would result in an incremental cost per identified patient of $17,333 (95% CI, $13,511 to $23,111), using an estimated mutation frequency of 6.00% (95% CI, 4.5% to 7.7%) and requiring testing of approximately 16.7 (95% CI, 13.0 to 22.2) individuals to identify a thyroid cancer patient with NTRK fusion. Incorporating the costs of identifying patients, the median ICER of larotrectinib is $444,455 per QALY gained (95% CI, $91,552 to dominated) (Table 39). Achieving a median ICER less than $50,000 per QALY gained with NGS screening when the cost of screening is $1,040 per patient requires a price reduction of greater than 95%.
In sensitivity analysis, CADTH explored the ICER using IHC screening followed by NGS confirmatory testing. If this technology is clinical validated and becomes widely available, using an IHC test with a sensitivity of 85% and specificity of 97% results in an incremental cost per identified patient of $2,941 (95% CI, $2,495 to $3,528). In this case, the median ICER of larotrectinib in patients with thyroid NTRK fusion cancers is $421,216 per QALY gained (95% CI, $87,159 to dominated) (Table 42). The comparative effectiveness of larotrectinib remains highly uncertain in this analysis and there continues to be a 39.6% probability that larotrectinib has a lower average quality-adjusted life-years than best supportive care.
Table 39: CADTH Reanalysis Results for Patients With Thyroid NTRK Fusion Cancers
Model output | Larotrectinib including NGS testing | Doxorubicin + cisplatin (best supportive care) |
|---|---|---|
Life-years | ||
Pre-progression | 1.81 (1.35 to 2.41) | 1.03 (0.33 to 2.43) |
Post-progression | 3.72 (2.11 to 6.33) | 5.20 (0.41 to 14.52) |
Overall survival | 5.53 (3.77 to 8.57) | 6.23 (1.67 to 15.57) |
QALYs | ||
Pre-progression | 1.47 (1.09 to 1.96) | 0.74 (0.23 to 1.79) |
Post-progression | 2.75 (1.55 to 4.68) | 3.31 (0.27 to 9.42) |
AEs | −0.02 (−0.03 to −0.02) | — |
Overall survival | 4.20 (2.89 to 6.46) | 4.05 (1.10 to 10.14) |
Costs | ||
Diagnostic | $17,619 ($13,437 to $23,174) | — |
Drug | $260,747 ($194,600 to $347,001) | $12,037 ($3,836 to $28,396) |
Adverse Events | $992 ($798 to $1,190) | — |
Health Services | $70,739 ($42,481 to $115,473) | $51,088 ($5,840 to $141,003) |
End of life | $30,073 ($23,637 to $36,392) | $31,679 ($19,190 to $40,453) |
Total Costs | $380,170 ($302,298 to $498,189) | $94,804 ($57,399 to $162,431) |
Incremental | ||
Costs (excluding diagnostic) | $267,747 ($167,892 to $393,091) | |
Costs (including diagnostic) | $285,366 ($185,694 to $411,623) | |
LY | −0.70 (−10.10 to 4.90) | |
QALY | 0.14 (−5.97 to 3.98) | |
NMB at $50,000/QALY gained | –$278,144 (–$529,483 to –$138,414) | |
Percent of simulations larotrectinib is clinically dominated | 39.6% | |
ICER ($/QALY gained) excluding diagnostic costs | $414,521 ($86,433 to dominated) | |
ICER ($/QALY gained) including diagnostic costs | $444,455 ($91,552 to dominated) | |
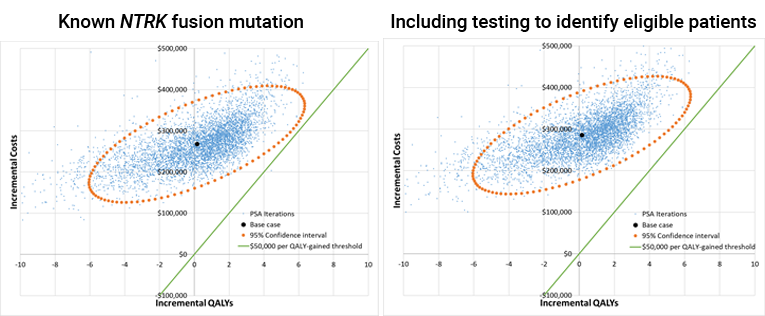
Table 40: CADTH Price Reduction Analyses for Thyroid Cancer
Price reduction | ICER for larotrectinib vs. doxorubicin + cisplatin | |
|---|---|---|
Patients with known mutation | Including testing to identify eligible patients | |
No price reduction | $414,521 ($86,433 to dominated) | $444,552 ($91,368 to dominated) |
10% | $375,251 ($79,039 to dominated) | $403,949 ($84,251 to dominated) |
20% | $333,655 ($71,797 to dominated) | $363,764 ($76,839 to dominated) |
30% | $291,850 ($64,561 to dominated) | $321,157 ($69,126 to dominated) |
40% | $252,354 ($56,914 to dominated) | $280,324 ($62,193 to dominated) |
50% | $214,801 ($49,818 to dominated) | $241,943 ($54,615 to dominated) |
60% | $173,945 ($42,167 to dominated) | $202,066 ($47,238 to dominated) |
70% | $134,986 ($34,669 to dominated) | $163,225 ($39,766 to dominated) |
80% | $95,235 ($26,882 to dominated) | $121,738 ($32,003 to dominated) |
90% | $56,792 ($17,946 to dominated) | $83,148 ($24,091 to dominated) |
95% | $37,711 ($10,671 to dominated) | $63,286 ($19,994 to dominated) |
ICER = incremental cost-effectiveness ratio; vs. = versus.
Supplemental Results Associated With the Overall Cost-Effectiveness Considering All Possible Indications (Pooled Analysis)
Figure 31: CADTH Probabilistic Results for the Treatment of NTRK Fusion Cancers Combining Patients With All Indications (Pooled Analysis)
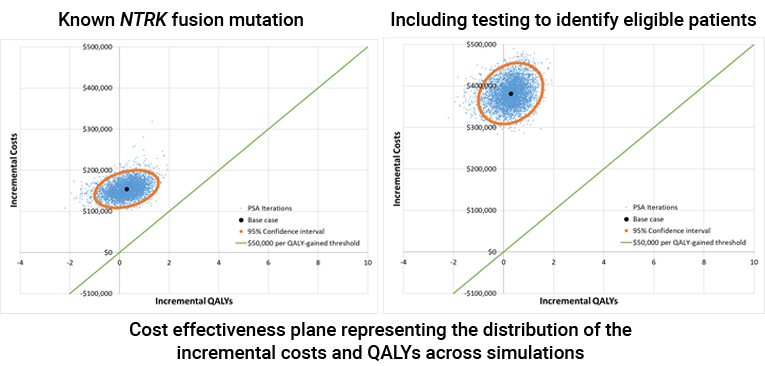
Table 41: Detailed CADTH Price Reduction Analyses for Larotrectinib Including All Possible Indications
Price reduction | ICER for larotrectinib vs. best supportive care ($/QALY) | |
|---|---|---|
Patients with known mutation | Including testing to identify eligible patients | |
No price reduction | $426,077 ($151,302 to dominated) | $929,433 ($318,579 to dominated) |
10% | $385,433 ($137,548 to dominated) | $887,382 ($304,107 to dominated) |
20% | $344,747 ($124,101 to dominated) | $846,169 ($289,768 to dominated) |
30% | $304,232 ($110,205 to dominated) | $804,374 ($275,362 to dominated) |
40% | $264,293 ($96,121 to dominated) | $763,136 ($261,098 to dominated) |
50% | $223,892 ($82,300 to dominated) | $723,113 ($246,816 to dominated) |
60% | $183,495 ($68,370 to dominated) | $681,861 ($232,719 to dominated) |
70% | $142,140 ($54,148 to dominated) | $641,258 ($218,769 to dominated) |
80% | $101,389 ($39,751 to dominated) | $599,538 ($204,217 to dominated) |
90% | $60,223 ($23,287 to dominated) | $558,578 ($190,241 to dominated) |
95% | $39,608 ($11,599 to dominated) | $539,458 ($183,151 to dominated) |
ICER = incremental cost-effectiveness ratio; vs. = versus.
Scenario Analyses
The following table presents the scenario analysis evaluating the cost-effectiveness of larotrectinib treatment when patient identification can be done using IHC screening followed by NGS confirmation.
Table 42: Sensitivity Analysis for the Cost-Effectiveness of Larotrectinib in Patients With Various Tumour Sites Including the Costs of Diagnostic Testing Using an IHC Screen Followed by NGS Confirmation Testing
Tumour site | Total incremental costs vs BSC (95% CI)a | Diagnostic costs (95% CI) | Incremental QALYs vs BSC (95% CI) | ICER for larotrectinib vs BSC including testing costs (95% CI) |
|---|---|---|---|---|
Colorectal | $66,192 ($37,801 to $94,691) | $3,195 ($2,699 to $3,844) | 0.30 (−0.40 to 0.81) | $201,802 ($92,495 to dominated) |
NSCLC | $210,608 ($150,957 to $282,071) | $63,596 ($35,379 to $114,288) | 0.84 (0.00 to 1.41) | $237,404 ($156,222 to $33,728,203) |
Salivary gland | $422,086 ($323,705 to $536,266) | $36,061 ($17,121 to $75,961) | 1.44 (−0.78 to 2.53) | $259,753 ($173,699 to dominated) |
Adult non-GIST STS | $179,038 ($75,473 to $284,114) | $13,030 ($8,676 to $19,846) | 1.31 (−1.72 to 2.88) | $119,985 ($62,991 to dominated) |
Pediatric STS | $292,814 ($79,484 to $540,966) | $13,030 ($8,676 to $19,846) | 1.15 (−2.53 to 4.72) | $244,792 ($88,918 to dominated) |
Thyroid | $270,688 ($170,782 to $395,686) | $2,941 ($2,495 to $3,528) | 0.14 (−5.97 to 3.98) | $421,216 ($87,159 to dominated) |
Appendix 5: Submitted Budget Impact Analysis and CADTH Appraisal
Table 43: Key Take-Aways of the Budget Impact Analysis
Key Take-Aways of the Budget Impact Analysis |
|---|
|
Summary of Sponsor’s Budget Impact Analysis
The submitted budget impact analysis (BIA) assessed the impact to public payers in Canada of the introduction of larotrectinib for the treatment of adult and pediatric patients with locally advanced or metastatic solid tumours harbouring an NTRK gene fusion. The analysis was undertaken from the perspective of the Canadian public drug plans using an epidemiologic-based approach for different categories of cancers: NSCLC, thyroid cancer, sarcomas IFS, GIST and non-GIST), colorectal cancer, CNS tumours, and “other,” which includes biliary cancer, melanoma, secretory breast cancer, appendix cancer, and pancreatic cancer. A 3-year time horizon was used, from 2021 to 2023 with 2020 as a base year, and included drug acquisition costs, with testing for NTRK and drug administration costs included in scenario analyses. The sponsor’s derivation of the eligible population size can be found in Figure 16.
Comparators for this analysis were specific to the various cancers included in this analysis and can be found in Table 8. The new drug scenario included larotrectinib as a comparator, with the market share increasing from || to || over the time horizon of the BIA. Key inputs to the BIA are documented in Table 43.
Figure 32: Sponsor’s Estimation of the Size of the Eligible Population
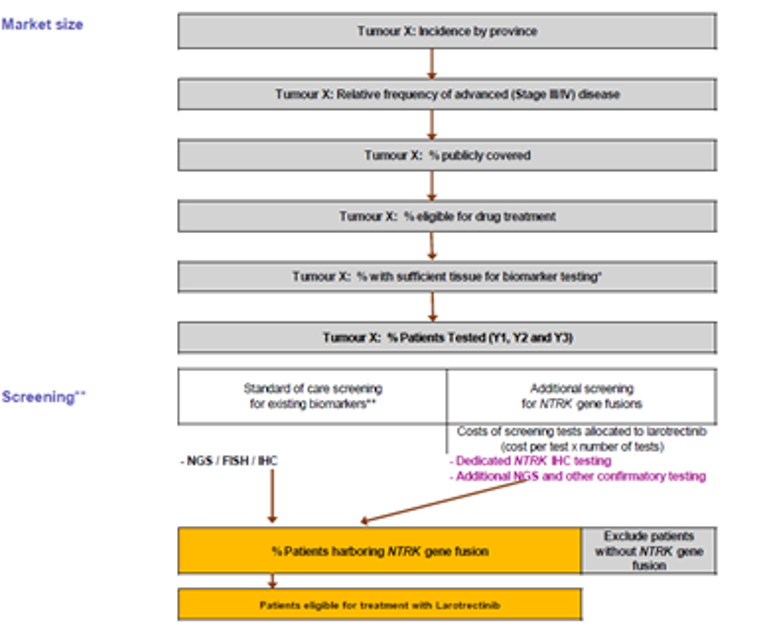
Source: Sponsor’s budget impact submission.69
Table 44: Summary of Key Model Parameters
Parameter | Sponsor’s estimate (reported as Year 1 / Year 2 / Year 3 if appropriate) |
|---|---|
Target Population (all cancers) | |
Incident patients | 69,951 / 70,700 / 71,446 |
Patients with advanced disease (stage III/IV) | 32,313 / 32,653 / 32,993 |
Patients publicly covered (80%) | 25,850 / 26,123 / 26,394 |
Patients eligible for drug treatment (65% of patients with NSCLC and 90% of other cancers) | 21,099 / 21,321 / 21,543 |
Patients with sufficient tissue for biomarker testing (90% of patients with NSCLC and 100% of other cancers) | 20,536 / 20,752 / 20,968 |
NTRK gene fusion tested patients (65% to 100%, varies by tumour type) | 14,010 / 15,177 / 16,363 |
NTRK frequency69 NSCLC Thyroid IFS Soft tissue sarcoma CRC Salivary CNS Other | 0.2% 6.0% 90.6% 1.0% 5.3% 0.4% 1.0% 0.3% |
NTRK gene fusion-positive patients (eligible for larotrectinib) | 75 / 80 / 84 |
Market Uptake (3 years) | |
Uptake (reference scenario) Larotrectinib BSC (cancer-specific) | 0% / 0% / 0% 100% / 100% / 100% |
Uptake (new drug scenario) Larotrectinib BSC (cancer-specific) | ||% / ||% / ||% ||% / ||% / ||% |
Cost of treatment (per patient) | |
Cost of treatment in the first year of treatment Larotrectinib BSC (NSCLC) BSC (thyroid) BSC (Sarcomas) BSC (CRC) BSC (CNS) BSC (Salivary) BSC (Other) | $140,808 to $152,930 $31,054 $9,876 $20,493 $8,194 $1,589 $12,722 $14,850 |
BSC = best supportive care; CNS = central nervous system; CRC = colorectal cancer; IFS = infantile fibrosarcoma; NSCLC = non–small cell lung cancer.
Summary of the Sponsor’s BIA Results
The estimated budget impact of funding larotrectinib for the treatment of adult and pediatric patients with locally advanced or metastatic solid tumours harbouring an NTRK gene fusion was $6,186,110 in year 1, $13,167,851 in year 2, and $17,276,702 in year 3 for a 3-year total of $36,630,663.
CADTH Appraisal of the Sponsor’s BIA
CADTH identified several key limitations to the sponsor’s analysis that have notable implications on the results of the BIA:
Overly complex and inaccurate modelling approach: The BIA model submitted by the sponsor included 6 different epidemiological estimates for population size corresponding to different categories of cancers along with drug acquisition costs for larotrectinib and comparators assessed separately. Despite this thoroughness, the model did not distinguish between types of adult STS (GIST versus non-GIST), and included an ‘Other’ category with at least 5 different cancers, for which the full list of cancers considered was not explicitly stated. As a result, the model provided obscured these distinctions making it difficult for CADTH to validate and edit.
Given the ambiguity of the sponsor’s model and the ability to derive accurate treatment and comparator costs directly from the pharmacoeconomic model, CADTH undertook a reanalysis of the estimated budgetary impact using the incidence of each cancer and the costs of treatment derived from the pharmacoeconomic model. This approach ensured that changes made to the CADTH pharmacoeconomic analysis, such as changes to cancer incidence and time spent on treatment, are reflected in the BIA as well.
Market shares for larotrectinib underestimated: Clinical experts consulted by CADTH felt that the sponsor’s market share assumptions for larotrectinib of |% in year 1, |% in year 2, and |% in year 3 were underestimated. Given that the sponsor included only those with advanced disease status, who were publicly covered, were eligible for drug treatment, had sufficient tissue for testing, and tested positive, the clinical experts felt that all or almost all of these patients would receive larotrectinib.
CADTH assumed 100% market share of larotrectinib in all 3 years as part of a scenario analysis.
CADTH Reanalyses of the BIA
CADTH undertook a complete reanalysis of the estimated budgetary impact using the incidence of each cancer and the costs of treatment derived from the pharmacoeconomic model (Table 45). CADTH’s reanalysis incorporated the sponsor’s original market share assumptions and testing eligibility estimates.
Table 45: Summary of Key Model Parameters to Derive Population Size in CADTH Reanalysis
Tumour site | Canadian patients per year | Stage III/IV | % eligible for testing69 | NTRK fusion prevalence69 | Eligible and NTRK positive |
|---|---|---|---|---|---|
Appendix | 21060 | 90% | 0.52% | 1.0 | |
Bone sarcoma | 18761 | 187 | 90% | 0.26% | 0.4 |
Breast | 21,60658 | 3,73862 | 90% | 0.14% | 4.7 |
Cancer of unknown primary | 4,24763 | 4,247 | 90% | 0.26% | 9.9 |
Cholangiocarcinoma | 10341 | 90% | 0.35% | 0.3 | |
CNS / Glioma | 2,34058 | 1,31069 | 90% | 1.00% | 11.8 |
Colorectal (MSI-High only) | 1,04958 | 51569 | 90% | 5.30% | 24.6 |
Hepatic | 2,41858 | 91162 | 90% | 0.26% | 2.1 |
Infantile sarcoma | 869 | 869 | 90% | 90.6% | 6.5 |
Lung (NSCLC) | 16,35758 | 10,82969 | 58.5% | 0.20% | 12.7 |
Melanoma | 6,24058 | 91362 | 90% | 0.31% | 2.5 |
Pancreas | 4,68058 | 3,02062 | 90% | 0.31% | 8.4 |
Prostate | 18,17458 | 4,07162 | 90% | 0.26% | 9.5 |
Salivary gland (MASC) | 36669 | 23769 | 90% | 0.38% | 0.8 |
STS, adult (GIST) | 15769 | 90% | 0.50% | 0.7 | |
STS, adult (non-GIST) | 28467 | 16669 | 90% | 1.00% | 1.5 |
STS pediatrics | 24868 | 14569 | 90% | 1.00% | 1.3 |
Thyroid (RAI-R) | 44758 | 44769 | 90% | 6.00% | 24.2 |
BSC = best supportive care; CNS = central nervous system; GIST = gastrointestinal stromal tumour; MASC = mammary analogue secretory carcinoma; MSI = microsatellite instable; NSCLC = non–small cell lung cancer; RAI-R = radioactive-iodine resistant; STS = soft tissue sarcoma.
Table 46: Summary of Cost Parameters per Patient Derived From Sponsor’s Pharmacoeconomic Model and Used in CADTH Reanalysis
Tumour Site | Year 1 | Year 2 | Year 3 |
|---|---|---|---|
Appendix and colorectal Larotrectinib BSC | $94,753 $2,436 | $13,506 $5 | $2,890 $1 |
Bone sarcoma and adult STS (non-GIST) Larotrectinib BSC | $100,488 $14,884 | $44,541 $4,146 | $14,654 $1,844 |
Breast Larotrectinib BSC | $118,035 $11,638 | $85,629 $0 | $68,568 $0 |
Cancer of unknown primary Larotrectinib BSC | $118,035 $8,429 | $85,629 $1,974 | $68,568 $1,012 |
Cholangiocarcinoma Larotrectinib BSC | $118,035 $0 | $85,629 $0 | $68,568 $0 |
CNS/glioma Larotrectinib BSC | $80,492 $563 | $11,730 $49 | $1,080 $11 |
Hepatic Larotrectinib BSC | $118,035 $8,429 | $85,629 $1,974 | $68,568 $1,012 |
Infantile sarcoma Larotrectinib BSC | $89,025 $4,343 | $72,343 $2,983 | $56,144 $2,245 |
Lung (NSCLC) Larotrectinib BSC | $125,190 $13,934 | $28,577 $1,645 | $1,583 $641 |
Melanoma Larotrectinib BSC | $94,114 $1,440 | $17,985 $215 | $2,911 $81 |
Pancreas Larotrectinib BSC | $118,035 $533 | $85,629 $11 | $68,568 $3 |
Prostate Larotrectinib BSC | $118,035 $8,429 | $85,629 $1,974 | $68,568 $1,012 |
Salivary gland (MASC) Larotrectinib BSC | $132,934 $4,599 | $113,134 $0 | $77,709 $0 |
STS, adult (GIST) Larotrectinib BSC | $118,035 $44,214 | $85,629 $11,660 | $68,568 $5,235 |
STS pediatrics Larotrectinib BSC | $83,426 $4,343 | $59,837 $2,983 | $45,468 $2,245 |
Thyroid (RAI-R) Larotrectinib BSC | $126,213 $6,651 | $88,075 $1,968 | $30,303 $851 |
BSC = best supportive care; CNS = central nervous system; GIST = gastrointestinal stromal tumour; MASC = mammary analogue secretory carcinoma; NSCLC = non–small cell lung cancer; RAI-R = radioactive-iodine resistant; STS = soft tissue sarcoma.
A detailed breakdown of the CADTH reanalysis is presented in Table 47. Based on the CADTH reanalysis the estimated budget impact from funding larotrectinib was $7,625,391in year 1, $12,509,402in year 2, $15,600,348in year 3, for a 3-year total of $35,735,142. A scenario analysis was performed where larotrectinib was assumed to take 100% of the market share in all years which resulted in an increased 3-year budget impact of $55,181,005.
Table 47: Detailed Breakdown of the CADTH Reanalyses of the BIA
Stepped analysis | Scenario | Year 1 | Year 2 | Year 3 | Three-year total |
|---|---|---|---|---|---|
Submitted base case | Reference | $950,532 | $1,247,144 | $1,384,632 | $3,582,307 |
New drug | $7,136,642 | $14,414,995 | $18,661,334 | $40,212,971 | |
Budget impact | $6,186,110 | $13,167,851 | $17,276,702 | $36,630,663 | |
CADTH reanalysis | Reference | $748,803 | $900,754 | $976,498 | $2,626,055 |
New drug | $8,374,194 | $13,410,156 | $16,576,846 | $38,361,197 | |
Budget impact | $7,625,391 | $12,509,402 | $15,600,348 | $35,735,142 | |
CADTH scenario analysis 1: 100% larotrectinib market share | Reference | $748,803 | $900,754 | $976,498 | $2,626,055 |
New drug | $13,457,788 | $20,267,043 | $24,082,229 | $57,807,060 | |
Budget impact | $12,708,986 | $19,366,289 | $23,105,731 | $55,181,005 |
BIA = budget impact analysis.
ISSN: 2563-6596
Disclaimer: The information in this document is intended to help Canadian health care decision-makers, health care professionals, health systems leaders, and policy-makers make well-informed decisions and thereby improve the quality of health care services. While patients and others may access this document, the document is made available for informational purposes only and no representations or warranties are made with respect to its fitness for any particular purpose. The information in this document should not be used as a substitute for professional medical advice or as a substitute for the application of clinical judgment in respect of the care of a particular patient or other professional judgment in any decision-making process. The Canadian Agency for Drugs and Technologies in Health (CADTH) does not endorse any information, drugs, therapies, treatments, products, processes, or services.
While care has been taken to ensure that the information prepared by CADTH in this document is accurate, complete, and up-to-date as at the applicable date the material was first published by CADTH, CADTH does not make any guarantees to that effect. CADTH does not guarantee and is not responsible for the quality, currency, propriety, accuracy, or reasonableness of any statements, information, or conclusions contained in any third-party materials used in preparing this document. The views and opinions of third parties published in this document do not necessarily state or reflect those of CADTH.
CADTH is not responsible for any errors, omissions, injury, loss, or damage arising from or relating to the use (or misuse) of any information, statements, or conclusions contained in or implied by the contents of this document or any of the source materials.
This document may contain links to third-party websites. CADTH does not have control over the content of such sites. Use of third-party sites is governed by the third-party website owners’ own terms and conditions set out for such sites. CADTH does not make any guarantee with respect to any information contained on such third-party sites and CADTH is not responsible for any injury, loss, or damage suffered as a result of using such third-party sites. CADTH has no responsibility for the collection, use, and disclosure of personal information by third-party sites.
Subject to the aforementioned limitations, the views expressed herein are those of CADTH and do not necessarily represent the views of Canada’s federal, provincial, or territorial governments or any third party supplier of information.
This document is prepared and intended for use in the context of the Canadian health care system. The use of this document outside of Canada is done so at the user’s own risk.
This disclaimer and any questions or matters of any nature arising from or relating to the content or use (or misuse) of this document will be governed by and interpreted in accordance with the laws of the Province of Ontario and the laws of Canada applicable therein, and all proceedings shall be subject to the exclusive jurisdiction of the courts of the Province of Ontario, Canada.
The copyright and other intellectual property rights in this document are owned by CADTH and its licensors. These rights are protected by the Canadian Copyright Act and other national and international laws and agreements. Users are permitted to make copies of this document for non-commercial purposes only, provided it is not modified when reproduced and appropriate credit is given to CADTH and its licensors.
About CADTH: CADTH is an independent, not-for-profit organization responsible for providing Canada’s health care decision-makers with objective evidence to help make informed decisions about the optimal use of drugs, medical devices, diagnostics, and procedures in our health care system.
Funding: CADTH receives funding from Canada’s federal, provincial, and territorial governments, with the exception of Quebec.