CADTH Health Technology Review
Utilization Patterns of Disease-Modifying Antirheumatic Drugs for the Treatment of Rheumatoid Arthritis: Rationale for Improving the Harmonization of Coverage Criteria
Utilization Review
Authors: Mina Tadrous, Mirhad Lončar, Peter Dyrda
Abbreviations
bDMARDs
biologic disease-modifying antirheumatic drugs
CIHI
Canadian Institute for Health Information
csDMARDs
conventional synthetic disease-modifying antirheumatic drugs
FY
fiscal year (April 1–March 31)
LEF
leflunomide
MTX
methotrexate
NPDUIS
National Prescription Drug Utilization Information System
RA
rheumatoid arthritis
RD
rheumatic disease
SSZ
sulfasalazine
Key Messages
Utilization patterns of csDMARDs were highly comparable between drug plans overall (in decreasing order: methotrexate, hydroxychloroquine, sulfasalazine, leflunomide, and azathioprine). The proportion of csDMARDs were comparable (e.g., approximately 30% of csDMARD use for methotrexate), although differences in coverage criteria may have resulted in variances in the use of leflunomide. Differences in adjudication of coverage criteria may have resulted in a modest variance in the number of csDMARDs used prior to initiating bDMARDs (i.e., allowing for an “early escape” to bDMARDs for some jurisdictions such as Manitoba and the Atlantic provinces).
The mean time to initiate bDMARD therapy (range of 664 to 792 days) revealed a divergence between jurisdictions into 2 groupings whereby Manitoba, Saskatchewan, and the Atlantic provinces drug plans (mean time of 664 to 681 days) saw the initiation of bDMARDs approximately 4 months faster versus other jurisdictions (British Columbia, Alberta, and Ontario, with a mean time of 748 to 792 days), possibly due to their coverage criteria not requiring 3 lines of csDMARDs therapy. Despite differences in the time to initiate bDMARDs, there was no notable difference in the persistence of bDMARDs 6 months after the initiation for any drug plan (61% to 76% range for patients 67 years of age and older).
Utilization patterns of bDMARDs was highly comparable between drug plans (i.e., highest use with adalimumab, etanercept, and infliximab), although British Columbia and Manitoba were the only jurisdictions that saw decreasing costs per patient of bDMARDs over time, likely due to a higher uptake of biosimilars or other managed formulary strategies such as tiering.
Executive Summary
Background/Issue: Rheumatoid arthritis (RA) is a chronic and debilitating disease associated with significant comorbidities and higher risk of mortality for Canadians, with a prevalence of approximately 1.2% of adults living with RA. The first line of treatment for RA is usually conventional synthetic disease-modifying antirheumatic drugs (csDMARDs), but for patients with inadequate response to csDMARDs, the next phase of therapy is typically biologic disease-modifying antirheumatic drugs (bDMARDs). The use of these medications in the treatment of RA is likely to differ across public drug plans because of variations in prescribing patterns and coverage criteria.
Objective: This analysis examined utilization patterns of csDMARDs and bDMARDs for the treatment of RA across public drug plans in Canada over the past several years to identify the rationale for improving coverage criteria harmonization.
Approach: Claims data related to the treatment of RA were extracted for all provincial drug plans (except Quebec) and Yukon from 2015 to 2020 and a descriptive analysis was performed to assess the utilization patterns of csDMARDs, the time to initiate bDMARDs, and the utilization patterns of bDMARDs. The proportion and number of csDMARDs used, the mean time from the initiation of csDMARDs to the initiation of bDMARDs, the persistence of utilization of bDMARDs 6 months after initiation, the changes in proportion and cost per patient of bDMARDs, and the uptake of biosimilars were assessed.
Implications for Policy-Makers: These findings provide a rationale for the harmonization of coverage criteria and reimbursement processes for public drug plans; coverage criteria for csDMARDs can be harmonized to include 3 lines of therapy for all jurisdictions. This could provide modest cost savings to some jurisdictions without impacting health outcomes. Costs per patient for bDMARDs can be reduced through greater uptake of biosimilars and implementation of formulary management strategies such as tiering frameworks (e.g., as in Manitoba).
Background
Disease and Treatments
Rheumatic disease (RD) encompasses more than 200 different disorders that span from types of arthritis (e.g., rheumatoid, osteo, psoriatic) to osteoporosis and on to connective tissue disease.1 Rheumatoid arthritis (RA) is a subset of RD and is the more common chronic inflammatory joint disease, as well as a leading cause of disability.1 Approximately 374,000 (1.2%) Canadians aged 16 years and older are currently diagnosed with RA and 23,000 were newly diagnosed in 2016 to 2017.2 The prevalence and incidence of diagnosed RA increases with age and is higher among females.2 RA is a chronic and debilitating disease associated with significant comorbidities and higher risk of mortality for Canadians.3 Early diagnosis and treatment of RA can avert or slow the progression of damage, with the treatment target of remission or a state of low disease activity within months of diagnosis.4 Strategies for the treatment of RA have changed greatly over the past 2 decades; the early and consistent reduction of inflammation has been key, along with targeting specific molecular mechanisms in the pathogenesis of the disorder and taking a targeted approach (i.e., treat to target) given the diverse and dynamic nature of the disease.5
The first line of treatment for RA is typically conventional synthetic disease-modifying antirheumatic drugs (csDMARDs) such as methotrexate (MTX), sulfasalazine (SSZ), hydroxychloroquine, leflunomide (LEF), and azathioprine. These drugs can be used in consecutive lines of monotherapy or combination therapy, the most common initial treatment (i.e., “anchor treatment”) being methotrexate as a monotherapy.6 For patients with inadequate response to csDMARDs, the next phase of therapy is typically biologic disease-modifying antirheumatic drugs (bDMARDs) such as abatacept, adalimumab, certolizumab pegol, etanercept, golimumab, infliximab, rituximab, and tocilizumab. There have been multiple large-scale randomized controlled trials that have assessed optimal treatment strategies for moderate to severe RA, such as the BeSt study. This study examined 4 treatment strategies (sequential monotherapy, step-up to combination therapy, initial combination therapy of MTX-SSZ-prednisone, and an initial combination of MTX-infliximab), and found no statistical difference in functional ability at the end of the first year of treatment.7 The TEAR study examined strategies of oral triple therapy versus etanercept-MTX in RA and also found no statistical difference in functional ability between strategies from weeks 48 to 102,8 which meant that oral triple therapy was cost-effective in the majority of scenarios.9 A published Health Technology Assessment by CADTH concluded that triple-csDMARD therapy appears to be more effective than double-csDMARD therapy and is comparable to bDMARD-MTX in disease response.10 However, it should be noted that these studies demonstrated statistically significant improvements in radiographic outcomes (i.e., structural damage) for combination therapy versus monotherapy treatment, particularly when combined with a bDMARD.7,8 It is unclear, though, what impact improvements in radiographic outcomes would have on cost-effectiveness.11 A CADTH review of international treatment guidelines from the past decade for RA found support for the use of csDMARDs as first-line therapy before switching to or adding bDMARDs; these guidelines were also in favour of combination therapy with other csDMARDs when monotherapy was deemed ineffective or not well-tolerated.12
Factors Influencing csDMARD and bDMARD Use in Rheumatoid Arthritis
The use of csDMARDs and bDMARDs in the treatment of RA is likely to differ across public drug plans because of variations in prescribing patterns and coverage criteria. Prescribing patterns are a function of patient, prescriber, and regional characteristics — all of which vary within and between geographies. Coverage criteria for accessing bDMARDs vary across public drug programs and between public and private insurers; this likely impacts utilization based on requirements for reimbursement.
Prescribing Patterns in Rheumatoid Arthritis in Canada
Two studies published in 2019 sought to measure the impact of prescribing behaviours on bDMARDs for RA in Ontario.13,14 Most notably, 1 study examined the impact of prescribing behaviours on the time to initiate the first bDMARD therapy for a cohort of 17,672 RA patients aged 67 years and older with coverage through public drug plans. Longer time to treatment initiation with the first bDMARD was associated with older age, male sex, and further distance to the nearest rheumatologist. Prescriptions for bDMARDs were predominately by rheumatologists (82%); physicians having more recently graduated from medical school had a higher propensity to prescribe bDMARDs, while physicians practising in rural areas were less likely to prescribe bDMARDs.13
Coverage Criteria for Rheumatoid Arthritis With Public Drug Plans
A recent CADTH assessment of coverage criteria for bDMARDs across Canadian public drug plans found that reimbursement was largely comparable in the medications covered, process, dosing regimens, and prior therapy requirements. The major difference was the number of lines of prior therapy with csDMARDs required before accessing a bDMARD. In most cases, public drug plans required a failure to respond to at least 2 to 3 lines of monotherapy or combination therapy with csDMARDs before coverage with bDMARDs. Some public drug plans such as British Columbia, Ontario, and Newfoundland and Labrador offered the shortest route to bDMARDs by providing an option to access bDMARDs after 1 line of combination triple therapy. Conversely, Alberta, Saskatchewan, or Manitoba did not require the use of a triple-combination therapy, although Alberta did require trials of 3 lines of therapy (compared to 2 lines of monotherapy for Saskatchewan and 2 lines of monotherapy or combination therapy in Manitoba). Maritime drug plans required 2 lines of therapy, which included 1 line of triple-combination therapy.15 For complete details on the criteria for each public drug plan, see Table 5 from the aforementioned CADTH report, linked for convenience.
Policy Issue
Drug expenditures for bDMARDs in RA are significant for public drug plans. These expenditures are driven by incidence of disease, the utilization patterns of bDMARDs, and the time to first bDMARD after loss of response or intolerance to csDMARDs. Although the incidence has been documented, the utilization patterns of bDMARDs and time to first bDMARD across public drug plans is not well- understood. The utilization patterns and time to first bDMARDs across regions is a function of prescribing patterns (i.e., patient, prescriber, and regional characteristics) and coverage criteria. Understanding these utilization aspects (i.e., patterns and time to first bDMARDs) could identify insights that can aid in the development of potential formulary management strategies for RA. The key policy question was whether there were differences in utilization patterns in csDMARDs and bDMARDs in the treatment of RA, and could these differences justify improved harmonization across drug plans?
Research Objectives
Objective 1: Utilization Patterns of csDMARDs
Which csDMARDs, and how many, are used to treat RA across public drug plans?
Objective 2: Time to Initiate bDMARDs
What is the mean time to initiate bDMARD therapy after beginning csDMARDs across public drug plans?
What is the retention (i.e., persistence) on the first bDMARD after 6 months of initiation across public drug plans?
Objective 3: Utilization Patterns of bDMARDs
What are the utilization patterns of bDMARDs used to treat RA across public drug plans?
How have utilization patterns of bDMARDs changed over the past several years across public drug plans?
Methods
Claims data related to the treatment of RA were extracted from the National Prescription Drug Utilization Information System (NPDUIS) database for all provincial drug plans (except Quebec) and Yukon between April 1, 2015 and March 31, 2020. A descriptive analysis was performed to answer all research questions. Full details of the data sources and analytical methods can be found in Appendix 1. The study was divided into 3 research objectives: utilization patterns of csDMARDs, time to initiate bDMARDs, and utilization patterns of bDMARDs:
Objective 1. Utilization Patterns of csDMARDs
The number of patients (publicly insured new RA for those aged 67 years and older) with claim(s) for csDMARDs before initiation of treatment with bDMARDs in fiscal year (FY) 2018–2019 was counted for each public drug plan to calculate the proportion of utilization of the different csDMARDs. Each patient (publicly insured new RA for those aged 67 years and older) was then categorized as to having 1, 2, or 3-plus csDMARD claims before initiation of treatment with bDMARDs in FY 2018-2019 to capture the number of lines of therapy with csDMARDs before bDMARDs.
Objective 2. Time to Initiate bDMARDs
“Time to initiate bDMARDs” was defined as the mean number of days’ supply of csDMARDs for patients (publicly insured new RA for those aged 67 years and older) before initiating bDMARDs in FY 2018–2019, starting from the first csDMARD claim within the study time-period and ending with the first bDMARD claim within the study time-period. Therefore, the time to initiate bDMARDs encompassed the total time treated with csDMARDs. To assess persistence with bDMARD therapy after initiation, the mean number of patients (publicly insured new RA for those aged 67 years and older) with continuous use (i.e., claim of bDMARD after 6 months from initiation) were calculated across public drug plans.
Objective 3. Utilization Patterns of bDMARDs
The number of patients (publicly insured new RA of all ages) with claims for bDMARDs in FY 2018–2019 was counted for each public drug plan to calculate the proportion of utilization of the different bDMARDs, as well as the change in proportions from FY 2015–2016 versus FY 2018–2019. The mean cost of bDMARDs per patient was calculated for bDMARD users across all public drug plans from FY 2015–2016 to FY 2019–2020 by calculating the quotient of the total program paid costs by the total number of patients (publicly insured new RA of all ages). Biosimilar uptake was calculated for etanercept and infliximab by comparing the proportion of originator versus biosimilar claimants in FY 2018–2019 versus FY 2019–2020 for all public drug plans.
Findings
Objective 1: Utilization Patterns of csDMARDs
Which csDMARDs, and how many, are used to treat RA across public drug plans?
The utilization patterns of csDMARDs were consistent across public drug plans, with variability in the use of SSZ and LEF, particularly in Manitoba (higher SSZ use) and Saskatchewan (higher LEF use; Figure 1). The number of unique csDMARDs reimbursed was consistent for British Columbia, Alberta, Saskatchewan, and Ontario. Manitoba and Atlantic public drug plans had a higher proportion of 1 unique csDMARD (greater than 40%) and a lower proportion of 2 and 3-plus unique csDMARDs compared to other plans (Figure 2).
Figure 1: Previous csDMARDs Reimbursed for Publicly Insured RA New Users 67 Years or Older Before Initiating bDMARDs in FY 2018–2019
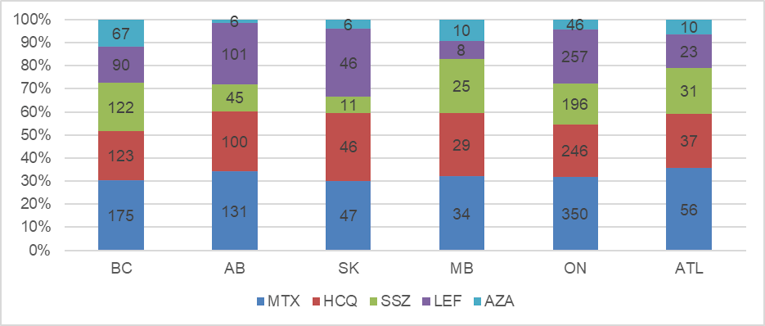
Note: Numbers that follow in parentheses represent sample size count of users. AB = Alberta (n = 162); ATL = Atlantic provinces (n = 86); AZA = azathioprine; BC = British Columbia (n = 235); bDMARD = biologic disease-modifying antirheumatic drug; csDMARD = conventional synthetic disease-modifying antirheumatic drug; FY = fiscal year; HCQ = hydroxychloroquine; LEF = leflunomide; MB = Manitoba (57); MTX = methotrexate; ON = Ontario (503); RA = rheumatoid arthritis; SK = Saskatchewan (n = 65); SSZ = sulfasalazine.
Figure 2: Number of Unique csDMARDs Reimbursed for Publicly Insured RA New Users 67 years and Older Before Initiating bDMARDs in FY 2018–2019
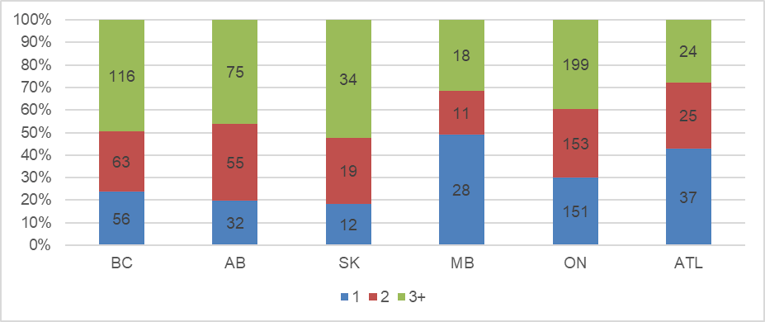
Note: Numbers that follow in parentheses represent sample size count of users. AB = Alberta (n = 162); ATL = Atlantic provinces (n = 86); BC = British Columbia (n = 235); bDMARD = biologic disease-modifying antirheumatic drug; csDMARD = conventional synthetic disease-modifying antirheumatic drug; FY = fiscal year; MB = Manitoba (57); ON = Ontario (503); RA = rheumatoid arthritis; SK = Saskatchewan (n = 65).
Objective 2: Time to Initiate bDMARDs
What is the mean time to initiate bDMARD therapy after beginning csDMARDs across public drug plans?
Time to initiate treatment with the first bDMARD was longest in Alberta, at 792 days, with Ontario and British Columbia closely behind, at approximately 750 days. The time to first bDMARD was lower for Saskatchewan, Manitoba, and the Atlantic provinces, at 681, 668, and 664 days, respectively. The widest variance between public drug plans was between Alberta and the Atlantic provinces, at 131 days (Figure 3). When assessing time to initiate bDMARD by jurisdiction stratified by the number of unique csDMARDs used before initiating bDMARDs, there was an inverse relationship between 1 unique versus 3-plus unique csDMARDs, whereby jurisdictions with a longer time to bDMARD after 1 unique csDMARD therapy were correlated with a relatively shorter time to bDMARD for 3-plus lines of csDMARD therapy, and vice versa (Appendix 2).
Figure 3: Average Time (in Days) to Initiate Biologic Therapy From First csDMARD Claim for Publicly Insured RA New Users 67 Years and Older in FY 2018–2019
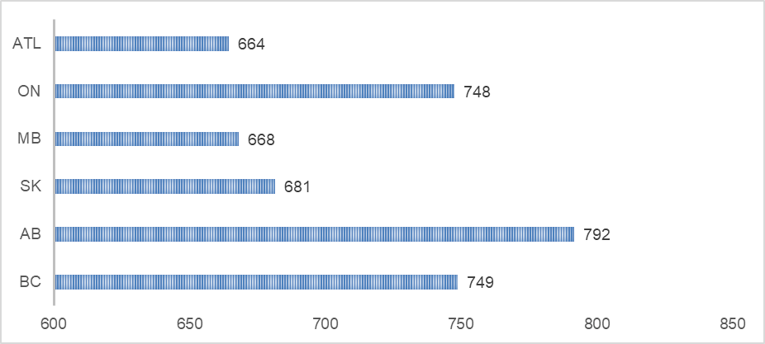
Note: Numbers that follow in parentheses represent sample size count of users. AB = Alberta (n = 162); ATL = Atlantic provinces (n = 86); BC = British Columbia (235); csDMARD = conventional synthetic disease-modifying antirheumatic drug; FY = fiscal year; MB = Manitoba (n = 57); ON = Ontario (n = 503); RA = rheumatoid arthritis; SK = Saskatchewan (n = 65).
What is the retention (i.e., persistence) on the first bDMARD after 6 months of initiation across public drug plans?
Despite variation in time to first bDMARDs between some public drug plans, there was little variation in the retention (i.e., persistence of therapy) of patients who continued bDMARDs treatment 6 months after initiation for either the All Ages or Aged 67 Years and Older age groups. Ontario had the lowest proportion for the All Ages group and among the lowest for the Aged 67 Years and Older age group, whereas the Atlantic provinces public drug plans had among the highest proportion in both age groups (Figure 4). Persistence was comparable across individual bDMARDs and across public drug plans as well, apart from rituximab in British Columba (note that rituximab is used mostly as a second line bDMARD outside of British Columbia; Appendix 3).
Figure 4: Proportion of all RA New Users With Previous csDMARD Reimbursement Treated With bDMARDs Who Have Continued Use After 6 months in FY 2018–2019
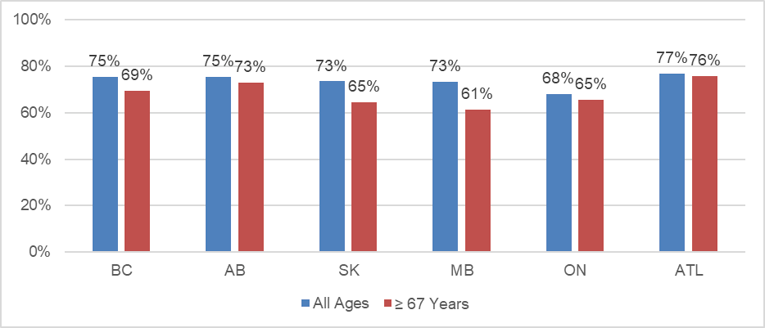
Note: Numbers that follow in parentheses represent sample size count of users. AB = Alberta (n = 438 for All Ages; n = 162 for ≥ 67 Years); ATL = Atlantic provinces (n = 212 for All Ages; n = 86 for ≥ 67 Years); BC = British Columbia (n = 1,021 for All Ages; n = 235 for ≥ 67 Years); bDMARD = biologic disease-modifying antirheumatic drug; csDMARD = conventional synthetic disease-modifying antirheumatic drug; FY = fiscal year; MB = Manitoba (n = 281 for All Ages; n = 57 for ≥ 67 Years); ON = Ontario (n = 1,464 for All Ages; n = 503 for ≥ 67 Years); RA = rheumatoid arthritis; SK = Saskatchewan (n = 305 for All Ages; n = 65 for ≥ 67 Years).
Objective 3: Utilization Patterns of bDMARDs
What are the utilization patterns of bDMARDs used to treat RA across public drug plans?
The utilization patterns of bDMARDs for new users of all age groups in FY 2018–2019 was consistent across public drug plans. There were marginal variations between public drug plans, such as a higher use of infliximab in Alberta, Ontario, and Atlantic; adalimumab in Alberta, Manitoba, and Atlantic; rituximab in British Columbia, Saskatchewan, and Manitoba; and golimumab in Saskatchewan and the Atlantic provinces. Utilization of abatacept, etanercept, tocilizumab, and certolizumab pegol was consistent across public drug plans (Figure 5).
Figure 5: Proportion of All New RA Users Treated With bDMARDs in FY 2018–2019
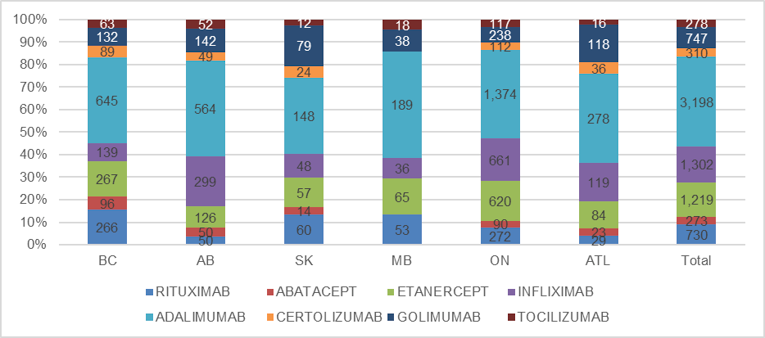
Note: Numbers that follow in parentheses represent sample size count of users. AB = Alberta (n = 1,332); ATL = Atlantic provinces (n = 703); BC = British Columbia (1,697); bDMARD = biologic disease-modifying antirheumatic drug; FY = fiscal year; MB = Manitoba (n = 399); ON = Ontario (n = 3,484); RA = rheumatoid arthritis; SK = Saskatchewan (n = 442).
How have utilization patterns of bDMARDs changed over the past several years across public drug plans?
Change in utilization from FY 2015–2016 to FY 2018–2019 for new users (all age groups) was variable across public drug plans. Utilization of infliximab and etanercept mostly increased, whereas the use of adalimumab, rituximab, golimumab, and certolizumab pegol mostly decreased over time (Figure 6).
Figure 6: Change in all RA New Users Treated With bDMARDs From FY 2015–2016 to FY 2018–2019
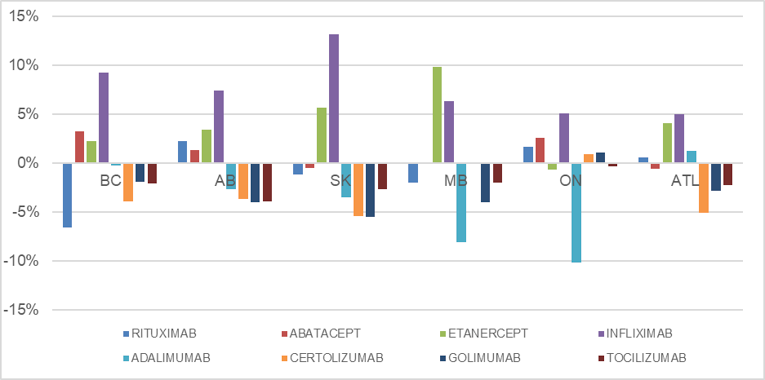
Note: Numbers that follow in parentheses represent sample size count of users. AB = Alberta (n = 1,332); ATL = Atlantic provinces (n = 703); BC = British Columbia (1,697); bDMARD = biologic disease-modifying antirheumatic drug; FY = fiscal year; MB = Manitoba (n = 399); ON = Ontario (n = 3,484); RA = rheumatoid arthritis; SK = Saskatchewan (n = 442).
The cost of bDMARDs per patient from FY 2015–2016 to FY 2019–2020 converged over time for public drug plans, whereby Manitoba and British Columbia had decreases in cost of bDMARDs per patient, while all other plans had increases. The most marked increases for the cost of bDMARDs per patient were for Prince Edward Island and Yukon, while growth for Alberta and Saskatchewan became highest among all public drug plans by FY 2019–2020 (Figure 7).
Figure 7: Cost of bDMARDs Per Patient for All RA Active Beneficiaries Treated From FY 2015–2016 to FY 2019–2020
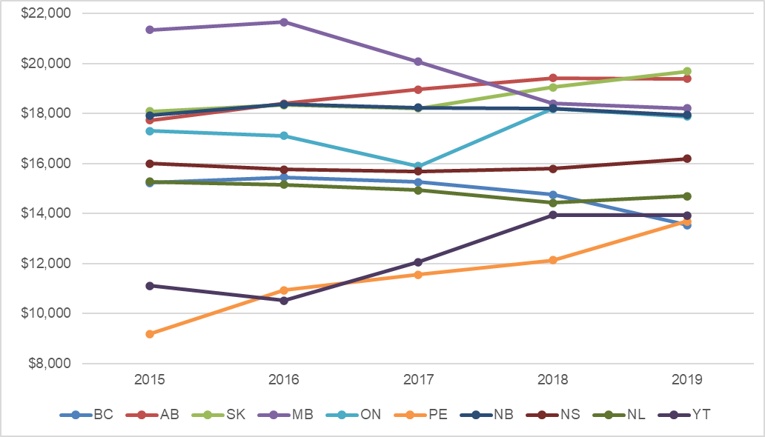
AB = Alberta; ATL = Atlantic provinces; BC = British Columbia; bDMARD = biologic disease-modifying antirheumatic drug; FY = fiscal year;MB = Manitoba; NB = New Brunswick; NL = Newfoundland and Labrador; NS = Nova Scotia; ON = Ontario; PE = Prince Edward Island; RA = rheumatoid arthritis; SK = Saskatchewan; YT = Yukon (Territory).
When assessing the changes in expenditures and active beneficiaries over time, public drug plans that had a decreasing cost of bDMARDs per patient had a lower rate of growth in expenditure versus beneficiaries, which was inverse for public drug plans with an increasing cost of bDMARDs per patient (Appendix 4). When isolating expenditures for biosimilar uptake for infliximab and etanercept from FY 2018–2019 to FY 2019–2020, British Columbia and Yukon demonstrated the most marked increase, whereas other public drug plans showed modest uptake (Figure 8).
Figure 8: Proportion of Biosimilar Versus Originator bDMARDs Utilization for Infliximab and Etanercept for All RA Active Beneficiaries in FY 2018–2019 and FY 2019–2020
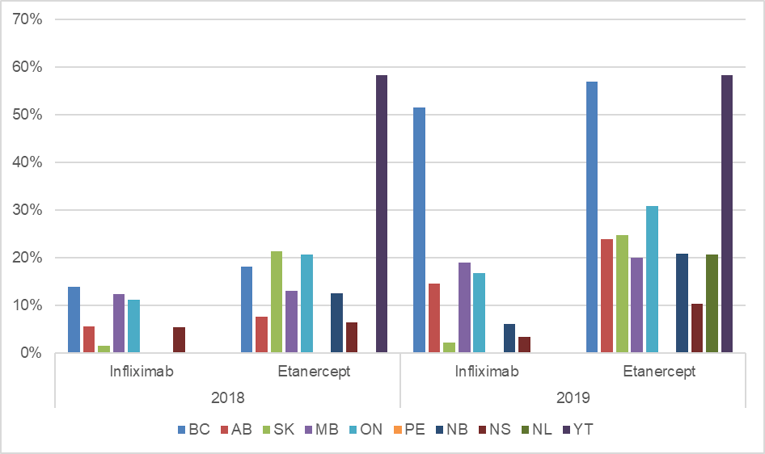
AB = Alberta; ATL = Atlantic provinces; BC = British Columbia; bDMARD = biologic disease-modifying antirheumatic drug; FY = fiscal year;MB = Manitoba; NB = New Brunswick; NL = Newfoundland and Labrador; NS = Nova Scotia; ON = Ontario; PE = Prince Edward Island; RA = rheumatoid arthritis; SK = Saskatchewan; YT = Yukon (Territory).
Limitations
Key limitations for this study include the gaps of claims data, capturing the appropriate diagnosis and treatment of RA, and small sample sizes for new users.
Gaps in claims data include the uncertainty around the number of prescriptions that were written but not dispensed, dispensed but did not have costs accepted by the public drug programs, or dispensed but not administered to the patient. The goal was to assess utilization trends in RA; however, the NPDUIS database did not distinguish claims by prescriber or by specific indications of RD (e.g., psoriatic arthritis versus ankylosing spondylitis versus RA). Therefore, these analyses should be considered trends in RD versus RA. Furthermore, the exclusion drug list does not have any csDMARDs that would highlight Crohn disease. Given the use of bDMARDs (such as infliximab and adalimumab) in Crohn disease, it is possible that there may have been Crohn disease data within the dataset. Moreover, despite measures taken to isolate utilization data specific to RA patients, there would still be usage from non-RA conditions captured within the analysis. Lastly, cell suppression and small patient populations of new users, especially for smaller public drug plans such as Atlantic Canada, required pooling of data. Sampling bias is also a consideration when assessing trends from smaller public drug plans such as those of Manitoba, Saskatchewan, and Atlantic Canada.
Discussion and Implications for Policy-Making
Utilization patterns of csDMARDs: The utilization patterns of csDMARDs between public drug plans was highly comparable (i.e., similar proportion of csDMARDs used), although variance in proportions between public drug plans was evident between SSZ and LEF. It is likely that these variances are due to local prescribing patterns, although it can be hypothesized that the higher utilization of LEF in Saskatchewan was probably because of its requirement within coverage criteria for accessing bDMARDs. Interestingly, there seemed to be 2 distinct groupings regarding the number of unique csDMARDs reimbursed for users: British Columbia, Alberta, Saskatchewan, and Ontario had similar proportions that differed from Manitoba and the Atlantic provinces (which had a comparatively higher amount of only 1 csDMARD used). This could indicate that the adjudication of patients who are intolerant to multiple csDMARDs in these public drug plans allows for an “early escape” toward bDMARDs compared to other jurisdictions. It is unlikely that this trend is explained by coverage criteria, given that Manitoba and the Atlantic provinces’ public drug plans require a trial of 3 csDMARDs before accessing bDMARDs.
Time to initiate bDMARDs: The mean time to initiate bDMARD analysis revealed a potential divergence between British Columbia, Alberta, and Ontario compared to Manitoba, Saskatchewan, and the Atlantic provinces, whereby the former group demonstrated approximately a 4-month delay to bDMARD versus the latter group. Local prescribing patterns could be a factor in this difference; however, it seems counter-intuitive that the jurisdictions with more rural regions had a shorter time to bDMARD because the literature suggests that rural regions see longer delays to bDMARDs.13 These differences may be explained by coverage criteria in the number of lines of therapy (either monotherapy or combination therapy) that are required to trial before accessing bDMARDs. Coverage criteria requires 3 lines of csDMARDs in Alberta and has a pathway for 3 lines of therapy in British Columbia and Ontario (and these 2 are the only jurisdictions that allow 1 line of therapy if it is the O’Dell protocol of MTX-SSZ-hydroxychloroquine). However, the public drug plans for Manitoba, Saskatchewan, and the Atlantic provinces require 2 lines of csDMARDs before the use of bDMARDs.
Despite differences in time to initiate bDMARDs among public drug plans, there did not appear to be differences in the persistence of new users to bDMARDs after 6 months. A faster time to first bDMARD could have been the result of a “treat to target” approach by prescribers looking to treat with bDMARDs earlier to improve longer-term health outcomes.16 However, a benefit of earlier bDMARD treatment was not evident within this analysis in Manitoba, Saskatchewan, or the Atlantic provinces, which could be because the outcome of persistence on therapy is not reflective of disease activity, or any early benefit of such a strategy becomes noninferior to a delayed treatment with bDMARDs at the 6-month mark, as evidenced in several studies.7,8
Utilization patterns of bDMARDs: The utilization patterns of bDMARDs for new users was comparable across public drug plans. Manitoba and British Columbia have observed decreased costs of bDMARDs per patient over time, which is likely due to an increased uptake of biosimilars (especially in British Columbia) and reduction in the use of brand name adalimumab (especially in Manitoba). Manitoba also implemented a tiered biologics strategy that may have impacted prescribing behaviours and led to savings. Conversely, public drug plans for Saskatchewan and Alberta saw increases in cost of bDMARDs per patient, likely driven by increases in the utilization of infliximab and etanercept, with low adoption of biosimilar usage (particularly for infliximab). The Atlantic provinces public drug plans demonstrated the lowest cost per patient, likely a function by modest growth in costs and users over time. It is important to note that each public drug plan has different inclusion criteria for beneficiaries and thus the cost per patient could also be impacted by the differences in patient populations covered (i.e., potential for a higher proportion of seniors in the Atlantic provinces compared to Manitoba). Future adoption of biosimilars for new therapies may play a large role in decreasing the cost per patient, as therapies with biosimilar options will encompass most medications used for RA.
Conclusions and Implications for Policy- and Decision-Making
This analysis sought to examine the utilization patterns of csDMARDs and bDMARDs in the treatment of RA across public drug plans in Canada. Findings revealed several trends including: utilization of csDMARDs is comparable across drug plans with the exception of LEF; the adjudication of coverage criteria for csDMARDs may differ between jurisdictions, where some jurisdictions see an “early escape” to bDMARDs; the coverage criteria for csDMARDs (i.e., requiring 2 versus 3 lines of therapy) could impact the time to initiate bDMARDs by up to 4 months; the time to first bDMARD was not associated with differences in persistence after 6 months; and the decreasing cost per patient of bDMARDs for RA was associated with higher uptake of biosimilars and a tiering policy. These findings provide a rationale for the improved harmonization of coverage criteria and reimbursement processes for public drug plans, which could provide modest cost savings without impacting health outcomes. If all jurisdictions harmonized coverage criteria for the trials of csDMARDs to access bDMARDs to align with those of Alberta, Ontario, or British Columbia, it is possible that the time to initiate bDMARDs would increase for the other jurisdictions and could result in savings. To test this hypothesis, a budget impact assessment will be published by CADTH. Although time to the initiation of bDMARDs is also a function of prescribing behaviours and the overall health system, which are not likely changed by the amendment of coverage criteria, harmonization may have other benefits including the benefit of patients maintaining portability of coverage. Public drug plans could also manage the cost per patient of bDMARDs by implementing formulary management strategies as observed in British Columbia and Manitoba, which include greater uptake of biosimilars and a tiered biologics strategy.
References
1.Horizon 2020 Framework Programme: EULAR’s position and recommendations. Brussels: EULAR; 2011: https://www.eular.org/myUploadData/files/EU_Horizon_2020_EULAR_position_paper.pdf. Accessed 2021 May 1.
2.Public Health Agency of Canada (PHAC). Rheumatoid Arthritis in Canada. 2020: https://www.canada.ca/en/public-health/services/publications/diseases-conditions/rheumatoid-arthritis.html. Accessed 2021 Jun 21.
3.Widdifield J, Bernatsky S, Bombardier C, Paterson M. Rheumatoid Arthritis Surveillance in Ontario: Monitoring the Burden, Quality of Care and Patient Outcomes through Linkage of Administrative Health Data. Healthc Q. 2015;18(3):7-10. PubMed
4.Aletaha D, Smolen JS. Diagnosis and Management of Rheumatoid Arthritis: A Review. JAMA. 2018;320(13):1360-1372. PubMed
5.Klareskog L, Irinel Catrina A, Paget S. Rheumatoid arthritis. The Lancet. 2009;373(9664):659-672. PubMed
6.Padjen I, Crnogaj MR, Anić B. Conventional disease-modifying agents in rheumatoid arthritis - a review of their current use and role in treatment algorithms. Reumatologia. 2020;58(6):390-400. PubMed
7.Allaart CF, Breedveld FC, Dijkmans BA. Treatment of recent-onset rheumatoid arthritis: lessons from the BeSt study. J Rheumatol Suppl. 2007;80:25-33. PubMed
8.Moreland LW, O'Dell JR, Paulus HE, et al. A randomized comparative effectiveness study of oral triple therapy versus etanercept plus methotrexate in early aggressive rheumatoid arthritis: the treatment of Early Aggressive Rheumatoid Arthritis Trial. Arthritis Rheum. 2012;64(9):2824-2835. PubMed
9.Jalal H, O'Dell JR, Bridges SL, Jr., et al. Cost-Effectiveness of Triple Therapy Versus Etanercept Plus Methotrexate in Early Aggressive Rheumatoid Arthritis. Arthritis Care Res (Hoboken). 2016;68(12):1751-1757. PubMed
10.Drugs for the Management of Rheumatoid Arthritis. Ottawa: CADTH; 2018: https://www.cadth.ca/drugs-management-rheumatoid-arthritis. Accessed 2021 Apr 25.
11.Government of the Northwest Territories (GNWT). Extended Health Benefits for Specified Disease Conditions Program. 2019: https://www.hss.gov.nt.ca/en/services/supplementary-health-benefits/extended-health-benefits-specified-disease-conditions. Accessed 16 April 2020.
12.Conventional Disease-Modifying Antirheumatic Drugs for the Treatment of Rheumatoid Arthritis. Ottawa: CADTH; 2021: https://www.cadth.ca/conventional-disease-modifying-antirheumatic-drugs-treatment-rheumatoid-arthritis. Accessed 2021 May 19.
13.Tatangelo M, Tomlinson G, Paterson JM, et al. Association of Patient, Prescriber, and Region With the Initiation of First Prescription of Biologic Disease-Modifying Antirheumatic Drug Among Older Patients With Rheumatoid Arthritis and Identical Health Insurance Coverage. JAMA Netw Open. 2019;2(12):e1917053. PubMed
14.Movahedi M, Joshi R, Rampakakis E, et al. Impact of residential area on the management of rheumatoid arthritis patients initiating their first biologic DMARD: Results from the Ontario Best Practices Research Initiative (OBRI). Medicine. 2019;98(20):e15517. PubMed
15.Reimbursement Criteria for Biologics in Rheumatoid Arthritis: A Policy Scan. Ottawa: CADTH; 2020: https://www.cadth.ca/reimbursement-criteria-biologics-rheumatoid-arthritis-policy-scan. Accessed 2021 May 10.
16.Smolen JS, Breedveld FC, Burmester GR, et al. Treating rheumatoid arthritis to target: 2014 update of the recommendations of an international task force. Ann Rheum Dis. 2016;75(1):3-15. PubMed
Appendix 1: Details of Methodology
Note that this appendix has not been copy-edited.
Data Sources
A request was made to the Canadian Institute for Health Information (CIHI) to extract claims data related to the treatment of RA from the National Prescription Drug Utilization Information System (NPDUIS) database for all public drug plans (except Quebec) and Yukon (Table 1) between April 1, 2015 and March 31, 2020, with an additional period used as a lead-in from April 1, 2013 to March 31, 2015. A lead-in period was used to ensure a look-back period for 67 year old patients to ensure no claims were made prior in order to ensure that these were new users. It should be noted that drug claims from drug programs for income assistance recipients in Nova Scotia and Alberta are not submitted to NPDUIS.
The following datasets were requested from CIHI in December 2020:
Number of claimants of RA bDMARDs through public drug plans from fiscal year (FY) 2015–2016 through to FY 2018–2019.
Number of bDMARD-naive claimants (all ages) of an RA bDMARD and their previous claims of csDMARDs through public drug plans from FY2015–2016 to FY2018–2019 (lead-in period beginning FY 2013–2014).
Number of senior (ages 67 years and older) bDMARD-naive claimants of an RA bDMARD and their previous claims of csDMARDs through public drug plans from FY 2015–2016 to FY 2018–2019 (lead-in period beginning FY 2013–2014).
For dataset #1, the number of active beneficiaries and costs (drug cost accepted, total cost accepted, and total program paid cost) for RA bDMARDs were collected and stratified by chemical name, jurisdiction, age group (younger than 65 and 65 years and older), FY, and quarterly. For datasets #2 and #3, the number of beneficiaries, costs (drug cost accepted, total cost accepted, and total program paid cost) and days’ supply for new RA bDMARD users and continued RA bDMARD users (new users who continued treatment 6 months after initiation) was collected for 2 age groups (younger than 65 years and 65 years and older) for a 3-month period (Table 2).
Data for patients with claims for csDMARDs and bDMARDs used to treat RA were included in the NPDUIS database search (Table 3). To exclude data from non-RA patients, only individuals who had at least 1 RA biologic drug claim and had no claims in any of the drugs in the exclusion list from 2015 to 2020 were included (Table 4). The exclusion drugs were intended to account for patients with Crohn disease, ulcerative colitis, psoriatic arthritis, plaque psoriasis, and ankylosing spondylitis.
Analytical Methods
Cell suppression was in accordance with CIHI privacy policy, where values with less than 5 beneficiaries (but greater than 0) were suppressed within a category. To minimize the impact of cell suppression, Atlantic public drug plans were pooled and Yukon was excluded in the calculations for datasets #2 and #3. Note that Atlantic public drug plans include those of New Brunswick, Nova Scotia, Prince Edward Island, and Newfoundland and Labrador. All public drug plans were included in the calculations from dataset #1.
A descriptive analysis was performed for all populations (total, new users only, and new users of ages 67 and older). A population of new users of bDMARDs were assessed from FY 2015–2016 to FY 2018–2019 to control for patient characteristics such as disease duration. A patient population of ages 67 and older were used to capture a homogenous patient population between public drug plans given that eligibility for public drug plans vary. The majority of RA patients who are seniors are reimbursed by public drug plans across Canada. To avoid a gap in data for patients transitioning from private insurance to public insurance when eligible for a senior’s public drug plan (ages 65-plus), users 67 years or older were selected to account for this and for a 2-year look-back period to capture csDMARD use.
Table 1: Provincial Public Drug Plans and Programs With Claims Data Contained Within the NPDUIS Database Within the Requested Time-Period (April 1, 2015 to March 31, 2020)
Jurisdiction | Plan/program description |
Alberta | Non-group |
Seniors | |
Palliative care | |
British Columbia | Fair PharmaCare |
Permanent residents of licensed residential care facilities | |
Recipients of British Columbia income assistance | |
Cystic fibrosis | |
Children in the at-home programs | |
No-Charge Psychiatric Medication Program | |
BC Palliative Care drug plan | |
Smoking cessation | |
Manitoba | Employment and Income Assistance Program |
Palliative care | |
Pharmacare | |
Personal home care/nursing homes | |
New Brunswick | Seniors Nursing home residents Social Development clients Individuals in licensed residential facilities Children in care of the Minister of Social Development and Children With Disabilities Multiple sclerosis HIV/AIDS Cystic fibrosis Organ transplant recipients Growth hormone deficiency |
New Brunswick Drug Plan | |
Medical Abortion Plan | |
Newfoundland and Labrador | Foundation Plan |
65Plus Plan | |
Access Plan | |
Select Needs (for cystic fibrosis) | |
Select Needs/growth hormone plan | |
Assurance Plan | |
Nova Scotia | Diabetes assistance program |
Palliative Care Drug Program | |
Under 65 Long-Term Care Pharmacare | |
Drug Assistance for Cancer Patients | |
Seniors’ Pharmacare Program | |
Family Pharmacare Program | |
Ontario | Ontario Drug Benefit Program |
Prince Edward Island | Diabetes Drug Program |
Generic Drug Program | |
Opioid Replacement Therapy Program | |
Immunization Program | |
Family Health Benefit Drug Program | |
High Cost Drug Program | |
Nursing homes | |
Seniors’ Drug cost assistance program | |
Catastrophic Drug Program | |
Children in care financial assistance | |
Sexually Transmitted Disease Drug Program | |
PEI Smoking Cessation Program | |
Saskatchewan | Universal health care program |
Yukon | Chronic disease program |
Children’s Drug and Optical Plan | |
Pharmacare |
Table 2: Data Elements and Definitions
Data element | Claims information |
Fiscal year | The fiscal year during which the biologic drug claim was dispensed. |
Fiscal quarter | The quarter in the aforementioned fiscal year during which the biologic drug claim was dispensed. |
Jurisdiction | The provincial or territorial jurisdiction responsible for financing the claim. |
Chemical | Subgroups classified by WHO at the fifth level of the anatomic therapeutic chemical code classification system, 2020 version. Each unique code represents a distinct chemical or biologic entity within the respective drug class. |
Type of biologic | Reference biologic: Products assigned with Schedule D (biologic products) as reported by HC-DPD and submitted as new drug submission/active ingredient(s) to Health Canada, as reported by the HC-NOC database. Biosimilar: Products assigned with Schedule D (biologic products) and identified as biosimilar to a reference biologic product in the product monograph, as reported by the HC-DPD. |
Number of active beneficiaries | The total number of people with claims where at least part of the claim was accepted by the public plan or program, either toward a deductible (if applicable) or for payment, for the requested drugs. |
Age group | The standardized age of the beneficiary at the time of the claim (i.e., the service date), calculated using the birth year and an assumed birthday of April 1 and grouped into: 64 and under, 65-plus. |
Number of new RA biologic users | Number of individuals who had at least 1 RA biologic drug claim and had no claims for any RA biologic drug in the 365 days before their first claim for an RA biologic drug. If a beneficiary is a new user multiple times within the study period, only the first instance will be included. |
Number of new RA biologic users with continued use | Number of new RA biologic users (as previously defined) who had a claim in the 3-month period 6 months after a new start (i.e., in the 180 to 270 days after the new start). |
Total prescription cost accepted | The total dollar amount of a prescription accepted by the plan or program as eligible for either toward a deductible or for reimbursement, as it relates to the quantity accepted. This amount includes the drug cost, as well as the associated professional fees and markup, if applicable. |
Drug cost accepted | The amount from the total prescription cost accepted that relates to the drug ingredient cost accepted by the plan or program. This field includes any applicable wholesale upcharge or shipping cost that constitutes a cost to the pharmacy. Pharmacy drug cost markup and dispensing fees are not included in this field. |
Total program paid | The amount from the total prescription cost accepted that is paid by the plan or program. This amount includes the drug cost, as well as associated professional fees and markup, if applicable. |
csDMARDs used before new RA biologic use | The use of selected cDMARDs (at the chemical level) in the 730 days before the first claim for an RA biologic drug among new RA biologic users. |
Number of unique csDMARDs used before new RA biologic use | The number of unique cDMARDs used in the 730 days before the first claim for an RA biologic drug among new RA biologic drug users (1, 2, or 3-plus). |
Days’ supply | Defined as the total number of days’ supply dispensed, as indicated by the dispensing pharmacy. |
HC = Health Canada; csDMARD = conventional synthetic disease-modifying antirheumatic drug; DPD = Drug Product Database; NOC = Notice of Compliance; RA = rheumatoid arthritis.
Table 3: Drugs Included in the NPDUIS Database Search
Chemical name | Brand name(s) |
csDMARDs | |
Azathioprine | Imuran |
Cyclosporine | Neoral |
Hydroxychloroquine | Plaquenil |
Leflunomide | Arava |
Methotrexate | Multiple options |
Minocycline | Minocin |
Sulfasalazine | Salazopyrin |
Gold compounds | Multiple options |
bDMARDs | |
Abatacept | Orencia |
Adalimumab | Humira |
Certolizumab pegol | Cimzia |
Etanercept | Enbrel (originator) Brenzys (biosimilar) Erelzi (biosimilar) |
Golimumab | Simponi |
Infliximab | Remicade (originator) Inflectra (biosimilar) Renflexis (biosimilar) |
Rituximab | Rituxan (originator) Truxima (biosimilar) Riximyo (biosimilar) Ruxience (biosimilar) |
Sarilumab | Kevzara |
Tocilizumab | Actemra |
bDMARD = biologic disease-modifying antirheumatic drug; csDMARD = conventional synthetic disease-modifying antirheumatic drug; NPDUIS = National Prescription Drug Utilization Information System.
Table 4: Drugs Excluded in the NPDUIS Database Search
Chemical name | ATC code | Rationale for exclusion |
Mesalazine | A07EC02 | To help exclude patients with ulcerative colitis |
Apremilast | L04AA32 | To help exclude patients with psoriatic arthritis |
Antipsoriatics (D05) | D05 | To help exclude patients with plaque psoriasis |
Calcitriol ointment (Silkis) | D05AX03 | To help exclude patients with plaque psoriasis |
Natalizumab | L04AA23 | To help exclude patients with Crohn disease |
Ustekinumab | L04AC05 | To help exclude patients with Crohn disease and ulcerative colitis, psoriatic arthritis, and plaque psoriasis |
Vedolizumab | L04AA33 | To help exclude patients with Crohn disease and ulcerative colitis |
Brodalumab | L04AC12 | To help exclude patients with psoriatic arthritis |
Ixekizumab | L04AC13 | To help exclude patients with psoriatic arthritis and ankylosing spondylitis |
Secukinumab | L04AC10 | To help exclude patients with psoriatic arthritis and ankylosing spondylitis |
NPDUIS = National Prescription Drug Utilization Information System.
Appendix 2: Time to Initiate Biologic Therapy for RA New Users (Age 67 Years and Older) Stratified by Number of Unique Reimbursed csDMARDs in FY 2018–2019
Note that this appendix has not been copy-edited.
Table 5: Users, Supply, and Treatment Length for Unique csDMARDs Reimbursed for New RA Biologic Users (Aged 67 and Older) by Jurisdiction for FY 2018–2019
Public payer | BC | AB | SK | MB | ON | ATL | |
1 | Number of users | 56 | 32 | 12 | 28 | 151 | 37 |
Days’ supply | 18,453 | 8,853 | 4,596 | 8,046 | 60,753 | 11,898 | |
Average treatment length per user | 330 | 277 | 383 | 287 | 402 | 322 | |
2 | Number of users | 63 | 55 | 19 | 11 | 153 | 25 |
Days’ supply | 41,328 | 40,773 | 10,622 | 8,342 | 122,750 | 21,340 | |
Average treatment length per user | 656 | 741 | 559 | 758 | 802 | 854 | |
3+ | Number of users | 116 | 75 | 34 | 18 | 199 | 24 |
Days’ Supply | 116,200 | 78,639 | 29,077 | 21,697 | 192,571 | 23,897 | |
Average treatment length per user | 1,022 | 1,049 | 855 | 1,205 | 968 | 996 |
AB = Alberta; ATL = Atlantic provinces; BC = British Columbia; csDMARD = conventional synthetic disease-modifying antirheumatic drug; FY = fiscal year; MB = Manitoba; ON = Ontario; RD = rheumatic disease; SK = Saskatchewan.
Appendix 3: RA New Users of bDMARDs With Continued Use by Treatment
Note that this appendix has not been copy-edited.
Table 6: Proportion of RA New Users — Continued Use After 6 Months in FY 2018–2019, By Treatment
Public Payer | BC | AB | SK | MB | ON | ATL | Average | |
Rituxumab | All Ages | 59% | 30% | 35% | 30% | 27% | 41% | 37% |
> 67 Years | 48% | 20% | 35% | MV | 31% | MV | 34% | |
Abatacept | All Ages | 76% | 64% | 93% | MV | 69% | 74% | 75% |
> 67 Years | 69% | 71% | 100% | MV | 61% | 67% | 74% | |
Etanercept | All Ages | 69% | 76% | 74% | 71% | 67% | 83% | 73% |
> 67 Years | 75% | 80% | 64% | 60% | 69% | 88% | 72% | |
Infliximab | All Ages | 82% | 83% | 94% | 92% | 82% | 76% | 85% |
> 67 Years | 79% | 78% | MV | MV | 78% | 73% | 77% | |
Adalimumab | All Ages | 79% | 80% | 81% | 87% | 72% | 80% | 80% |
> 67 Years | 73% | 77% | 75% | 77% | 72% | 85% | 76% | |
Certolizumab | All Ages | 81% | 84% | 67% | MV | 60% | 67% | 72% |
> 67 Years | 63% | 70% | MV | MV | 74% | 50% | 64% | |
Golimumab | All Ages | 85% | 84% | 75% | 74% | 68% | 81% | 78% |
> 67 Years | 63% | 78% | 62% | MV | 63% | 80% | 69% | |
Tocilizumab | All Ages | 81% | 63% | 67% | 61% | 74% | 75% | 70% |
> 67 Years | 80% | 75% | MV | MV | 70% | MV | 75% | |
AB = Alberta; ATL = Atlantic provinces; BC = British Columbia; csDMARD = conventional synthetic disease-modifying antirheumatic drug; FY = fiscal year; MB = Manitoba; MV = Missing values (due to cell suppression); ON = Ontario; RA = rheumatic arthritis; SK = Saskatchewan.
Appendix 4: Total Program Paid Costs and Active Beneficiaries for RA Biologics for all Users by Jurisdiction and FY
Note that this appendix has not been copy-edited.
Table 7: Annual Expenditures Per FY for RA Biologics by Jurisdiction
Public plan (FYs 2015 to 2019) | |||||
Annual expenditure (program paid costs) | |||||
2015 | 2016 | 2017 | 2018 | 2019 | |
BC | $141,960,520 | $158,425,075 | $166,364,229 | $172,576,923 | $171,886,770 |
AB | $108,163,746 | $123,563,193 | $136,929,538 | $152,421,801 | $163,733,152 |
SK | $43,712,813 | $47,668,517 | $53,247,107 | $60,031,246 | $65,820,466 |
MB | $52,522,402 | $56,998,401 | $56,299,838 | $55,280,171 | $57,711,800 |
ON | $217,590,298 | $237,275,459 | $253,255,229 | $323,301,636 | $310,754,655 |
PEI | $2,673,200 | $3,576,010 | $3,801,225 | $4,255,064 | $4,529,384 |
NB | $13,493,993 | $15,684,482 | $17,050,869 | $19,826,584 | $21,410,326 |
NS | $21,307,900 | $22,500,717 | $23,058,860 | $24,691,021 | $26,054,687 |
NL | $8,630,498 | $9,667,431 | $10,030,263 | $10,224,949 | $10,577,718 |
YT | $544,359 | $525,598 | $578,526 | $933,859 | $807,503 |
Total | $610,599,730 | $675,884,884 | $720,615,686 | $823,543,254 | $833,286,462 |
Total % YoY Growth | NC | 11% | 7% | 14% | 1% |
Active beneficiaries | |||||
BC | 9,325 | 10,251 | 10,905 | 11,704 | 12,701 |
AB | 6,102 | 6,715 | 7,219 | 7,850 | 8,443 |
SK | 2,416 | 2,600 | 2,926 | 3,152 | 3,344 |
MB | 2,460 | 2,632 | 2,804 | 3,004 | 3,169 |
ON | 12,577 | 13,869 | 15,937 | 17,776 | 17,384 |
PEI | 291 | 327 | 329 | 351 | 331 |
NB | 753 | 854 | 935 | 1,089 | 1,194 |
NS | 1,332 | 1,428 | 1,470 | 1,564 | 1,610 |
NL | 565 | 638 | 672 | 709 | 720 |
YT | 49 | 50 | 48 | 67 | 58 |
Total | 35,870 | 39,364 | 43,245 | 47,266 | 48,954 |
Total % YoY Growth | NC | 10% | 10% | 9% | 4% |
AB = Alberta; ATL = Atlantic; BC = British Columbia; FY = fiscal year; MB = Manitoba; NC = not computed; NB = New Brunswick; NL = Newfoundland and Labrador; NS = Nova Scotia; ON = Ontario; PE = Prince Edward Island; RA = rheumatic disease; SK = Saskatchewan; YoY= year-over-year; YT = Yukon (Territory).
Acknowledgements: Jeff Proulx, Emma Marshall-Catlin, Kathy Lee, Jacob Karsh, Christine Perras, Tarry Ahuja
ISSN: 2563-6596
Disclaimer: The information in this document is intended to help Canadian health care decision-makers, health care professionals, health systems leaders, and policy-makers make well-informed decisions and thereby improve the quality of health care services. While patients and others may access this document, the document is made available for informational purposes only and no representations or warranties are made with respect to its fitness for any particular purpose. The information in this document should not be used as a substitute for professional medical advice or as a substitute for the application of clinical judgment in respect of the care of a particular patient or other professional judgment in any decision-making process. The Canadian Agency for Drugs and Technologies in Health (CADTH) does not endorse any information, drugs, therapies, treatments, products, processes, or services.
While care has been taken to ensure that the information prepared by CADTH in this document is accurate, complete, and up-to-date as at the applicable date the material was first published by CADTH, CADTH does not make any guarantees to that effect. CADTH does not guarantee and is not responsible for the quality, currency, propriety, accuracy, or reasonableness of any statements, information, or conclusions contained in any third-party materials used in preparing this document. The views and opinions of third parties published in this document do not necessarily state or reflect those of CADTH.
CADTH is not responsible for any errors, omissions, injury, loss, or damage arising from or relating to the use (or misuse) of any information, statements, or conclusions contained in or implied by the contents of this document or any of the source materials.
This document may contain links to third-party websites. CADTH does not have control over the content of such sites. Use of third-party sites is governed by the third-party website owners’ own terms and conditions set out for such sites. CADTH does not make any guarantee with respect to any information contained on such third-party sites and CADTH is not responsible for any injury, loss, or damage suffered as a result of using such third-party sites. CADTH has no responsibility for the collection, use, and disclosure of personal information by third-party sites.
Subject to the aforementioned limitations, the views expressed herein are those of CADTH and do not necessarily represent the views of Canada’s federal, provincial, or territorial governments or any third party supplier of information.
This document is prepared and intended for use in the context of the Canadian health care system. The use of this document outside of Canada is done so at the user’s own risk.
This disclaimer and any questions or matters of any nature arising from or relating to the content or use (or misuse) of this document will be governed by and interpreted in accordance with the laws of the Province of Ontario and the laws of Canada applicable therein, and all proceedings shall be subject to the exclusive jurisdiction of the courts of the Province of Ontario, Canada.
The copyright and other intellectual property rights in this document are owned by CADTH and its licensors. These rights are protected by the Canadian Copyright Act and other national and international laws and agreements. Users are permitted to make copies of this document for non-commercial purposes only, provided it is not modified when reproduced and appropriate credit is given to CADTH and its licensors.
About CADTH: CADTH is an independent, not-for-profit organization responsible for providing Canada’s health care decision-makers with objective evidence to help make informed decisions about the optimal use of drugs, medical devices, diagnostics, and procedures in our health care system.
Funding: CADTH receives funding from Canada’s federal, provincial, and territorial governments, with the exception of Quebec.