CADTH Health Technology Review
Hub-and-Spoke Models of Care for Chronic Pain
Technology Review
Authors: Angela M. Barbara, Danielle MacDougall
Abbreviations
BPI
Brief Pain Inventory
CPAQ 20
Chronic Pain Acceptance Questionnaire 20
DASS-21
Depression Anxiety Stress Scale 21
ECHO
Extension for Community Healthcare Outcomes
SD
standard deviation
SE
standard error
UHN
University Health Network
Key Messages
Four reports describing the potential clinical benefits of hub-and-spoke models of care for chronic pain were included in this report:
The single arm pre- and post- study of the Manage Your Pain Program described its impact on pain, depression, anxiety, and health-related quality of life.
The retrospective cohort study of the Army and Navy Extension of Community Healthcare Outcomes Pain described pharmacotherapy use.
The single-arm pre- and post-study of the Extension of Community Healthcare Outcomes Pain in the University Health Network described pain, depression, and pharmacotherapy and health care use.
The comparative pre- and post-study of the Extension of Community Healthcare Outcomes Pain in community health care centres described pharmacotherapy and health care use.
While all of the referenced models included central specialized care by hubs and core services by spokes, and the use of videoconferencing to provide chronic care education, the models were tailored, and the evaluation methods were heterogeneous.
No reports were identified that described the potential harms or the potential cost implications of hub-and-spoke models for the delivery of care for chronic pain.
Background
Chronic pain is generally defined as pain lasting for 3 months or longer, or persisting beyond the time needed for normal tissue healing.1-3 It can affect the sufferer’s quality of life and can lead to substantial physical and psychological morbidity.4 One in 5 Canadians lives with chronic pain, and it is one of the most common reasons that Canadians seek medical attention. The economic burden is substantial4 — in 2019, between $15.1 billion and $17.2 billion in estimated annual direct costs was associated with managing chronic pain in Canada.5,6
Because chronic pain is difficult to cure, the goal of treatment is to control pain, maintain function, maximize coping, and prevent disability, and often involves a multidisciplinary pain management plan.1 CADTH conducted an Environmental Scan in 2021 to compile information on the models of care for chronic pain and chronic non-pain-related medical conditions being used in Canada and in other countries.7 One of the 3 priority models of care of interest in the Environmental Scan is the focus of the current report.
The hub-and-spoke model in health care settings is a method of network organization that involves the establishment of a centralized campus or “hub,” which provides the more specialized or intensive therapies, complemented by satellite campuses or “spokes,” which offer basic services or routine follow-up at sites distributed across different geographic locations.8,9 Figure 1 presents a simplified diagram of a traditional hub-and-spoke model.7 Observational evidence for a hub-and-spoke model aimed at expanding the treatment of opioid use disorders in 1 US state found that this model of care was well received by patients and health care providers, and resulted in substantial increases in treatment capacity.10 Other benefits may include consistency across services, increased efficiencies, better quality of care, expansion of care, and improved agility.8,9 Whereas risks have also been identified, such as congestion at hubs, overextension of spokes, and staff dissatisfaction at spokes; with proper planning and action, it may be possible to minimize or eliminate these risks.8,9
Figure 1: Simplified Diagram of a Hub-and-Spoke Model
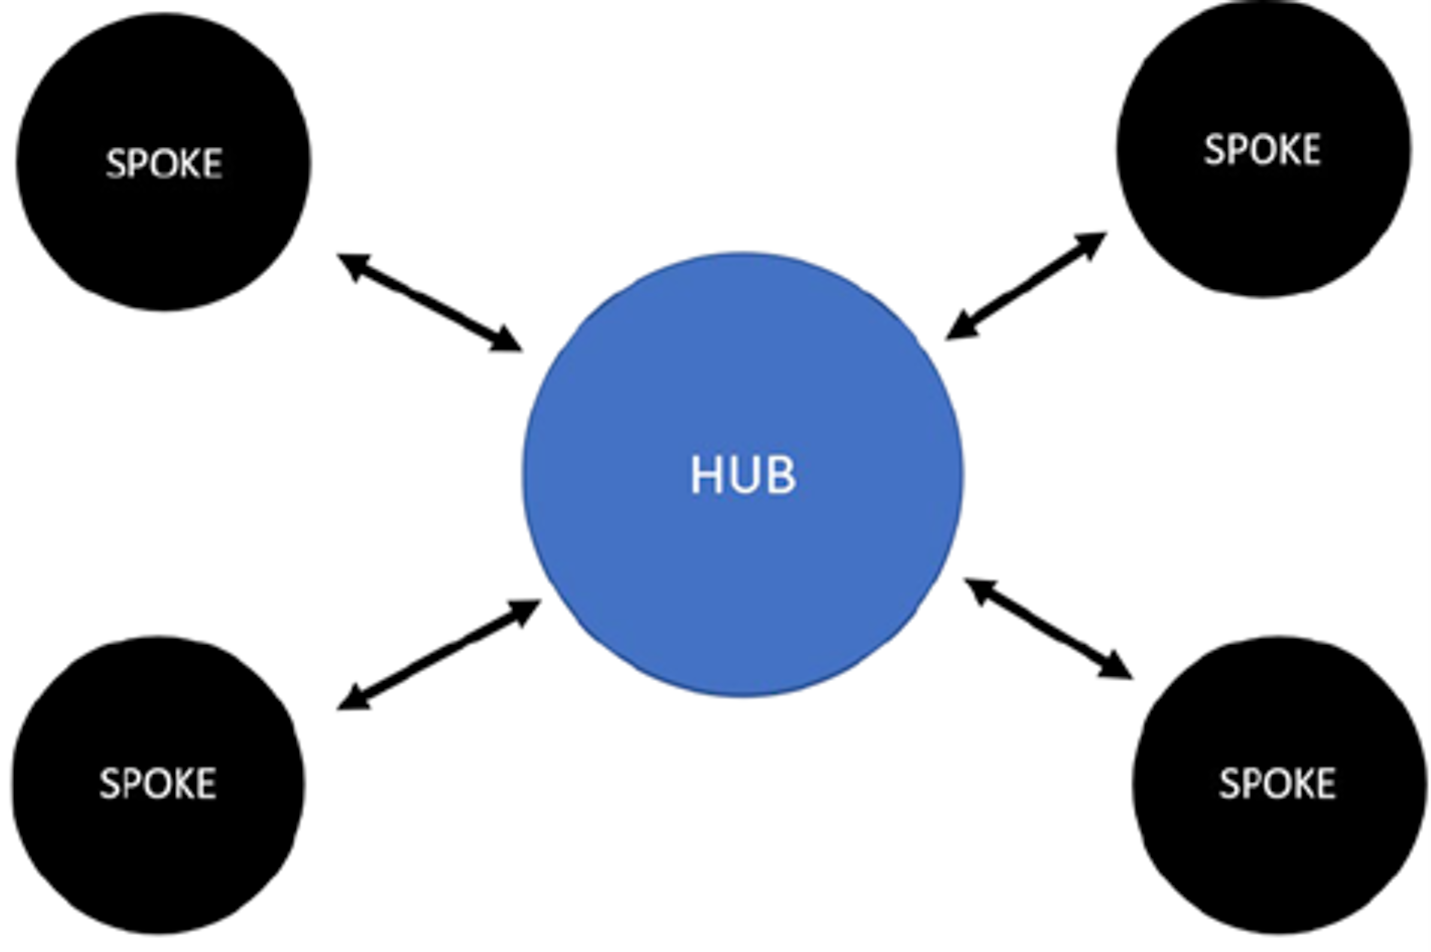
Source: Brett K, MacDougall D. Models of care for chronic pain. (CADTH Environmental Scan). Ottawa (ON): CADTH; 2021: https://www.cadth.ca/sites/default/files/es/ES0350%20_to%20Publishing%20Final.pdf. Accessed 2022 Mar 22.7
The CADTH Environmental Scan identified 1 hub-and-spoke model for chronic pain in Canada and 5 hub-and-spoke models for other chronic medical conditions (pediatric patients with complex conditions, those with spinal disorders in rural settings, and those with cancer and opioid use disorder) in Canada, the UK, and the US.7 The Environmental Scan also summarized the main categories of patient-related outcomes associated with models of care delivery for patients with chronic pain: pain, psychosocial (mental health), function (disability), and health care use.7 The current report aims to describe the literature on the potential clinical benefits and harms of using hub-and-spoke models for the management of chronic pain.
A potential benefit of the hub-and-spoke model is more efficient delivery of health care services.8,9 This model centralizes advanced medical technologies and skill sets at the hub and routes all patients needing these services to the hub; the premise is that this may eliminate costly duplication of services, increase return on investment, and bolster economies of scale.8,9 Compared with other models of care, evidence from hub-and-spoke models in the delivery of treatment for non-chronic pain conditions (e.g., stroke, dental, opioid addiction) have suggested that the cost of care delivered by hub-and-spoke models is reduced, benefiting patients, insurers, and society at large.8,9,11 Another aim of this report is to describe the potential cost implications of using hub-and-spoke models for the management of chronic pain.
Objectives
The key objectives of this CADTH report are to:
identify and summarize literature on the potential benefits and harms of hub-and-spoke models of care for chronic pain
identify and summarize literature on the potential cost implications of hub-and-spoke models of care for chronic pain.
The focus of this report is to summarize what literature exists on the clinical benefits, harms, and cost implications of hub-and-spoke models of care for chronic pain. Because chronic cancer pain and chronic non-cancer pain are distinct entities, as evidenced by unique clinical practice guidelines for each, this report focuses exclusively on chronic non-cancer pain.12,13 This report does not include a formal critical appraisal of the literature, nor is it a formal program evaluation. Thus, making conclusions or recommendations about the value of hub-and-spoke models of care for chronic pain is outside the scope of this report.
Research Questions
What literature describes the potential clinical benefits and harms of providing care using hub-and-spoke models for the management of people with chronic non-cancer pain?
What literature describes the potential cost implications of providing care using hub-and-spoke models for the management of people with chronic non-cancer pain?
Methods
Literature Search Methods
A limited literature search was conducted by an information specialist on key resources including MEDLINE, PsycInfo, the Cumulative Index to Nursing and Allied Health Literature, the Cochrane Database of Systematic Reviews, the International Health Technology Assessment Database, the websites of Canadian and major international health technology agencies, as well as a focused internet search. The search strategy comprised both controlled vocabulary, such as the National Library of Medicine’s MeSH (Medical Subject Headings), and keywords. The main search concepts were models of care and hub and spoke. No filters were applied to limit the retrieval by study type. Where possible, retrieval was limited to the human population. The search was also limited to English-language documents published between January 1, 2010, and March 14, 2022. The publication date range was selected to align with the previously completed Environmental Scan.7
Selection Criteria
One reviewer screened citations and selected studies. In the first level of screening, titles and abstracts were reviewed and potentially relevant articles were retrieved and assessed for inclusion. The final selection of full-text articles was based on the inclusion criteria presented in Table 1.
Chronic non-cancer pain and other disorders or diseases (e.g., mental health conditions, multiple sclerosis, stroke) frequently occur together.14,15 Reports were included if the population contained people with chronic non-cancer pain, regardless of the presence of other disorders or diseases. However, publications were excluded if the target population was people with the associated disorders or diseases only and there was no specific mention of addressing chronic pain jointly.
Criteria | Description |
|---|---|
Population | People (of any age) with chronic non-cancer pain in outpatient settings of publicly funded health care facilities |
Intervention | Care provided using hub-and-spoke models of care |
Type of information | Q1: Descriptions of potential clinical benefits (e.g., pain, physical function, sleep, social function, emotional and psychological functioning [e.g., anxiety, depression], health-related quality of life, changes in use of pharmacotherapy [e.g., opioids]) and harms (e.g., hospitalizations, substance use, adverse events) Q2: Descriptions of potential cost implications (e.g., budget impact, cost savings, economic benefits to individuals or health systems) |
Study designs | No restrictions on study design or type of report |
Search time frame | 2010 and onwards |
Synthesis Approach
Information from the relevant reports was extracted into tables and organized by objective by 1 reviewer. The information was then used to structure and inform the current report. Narrative summaries of the literature were presented separately for each hub-and-spoke model. Data were extracted on the model components and implementation; evaluation methods; and findings that related to potential clinical benefits and harms, and potential costs. The limitations of each study were also described, as reported by the study’s authors. No formal critical appraisal (e.g., risk of bias assessment) of the included studies was conducted.
Summary of Evidence
Quantity of Research Available
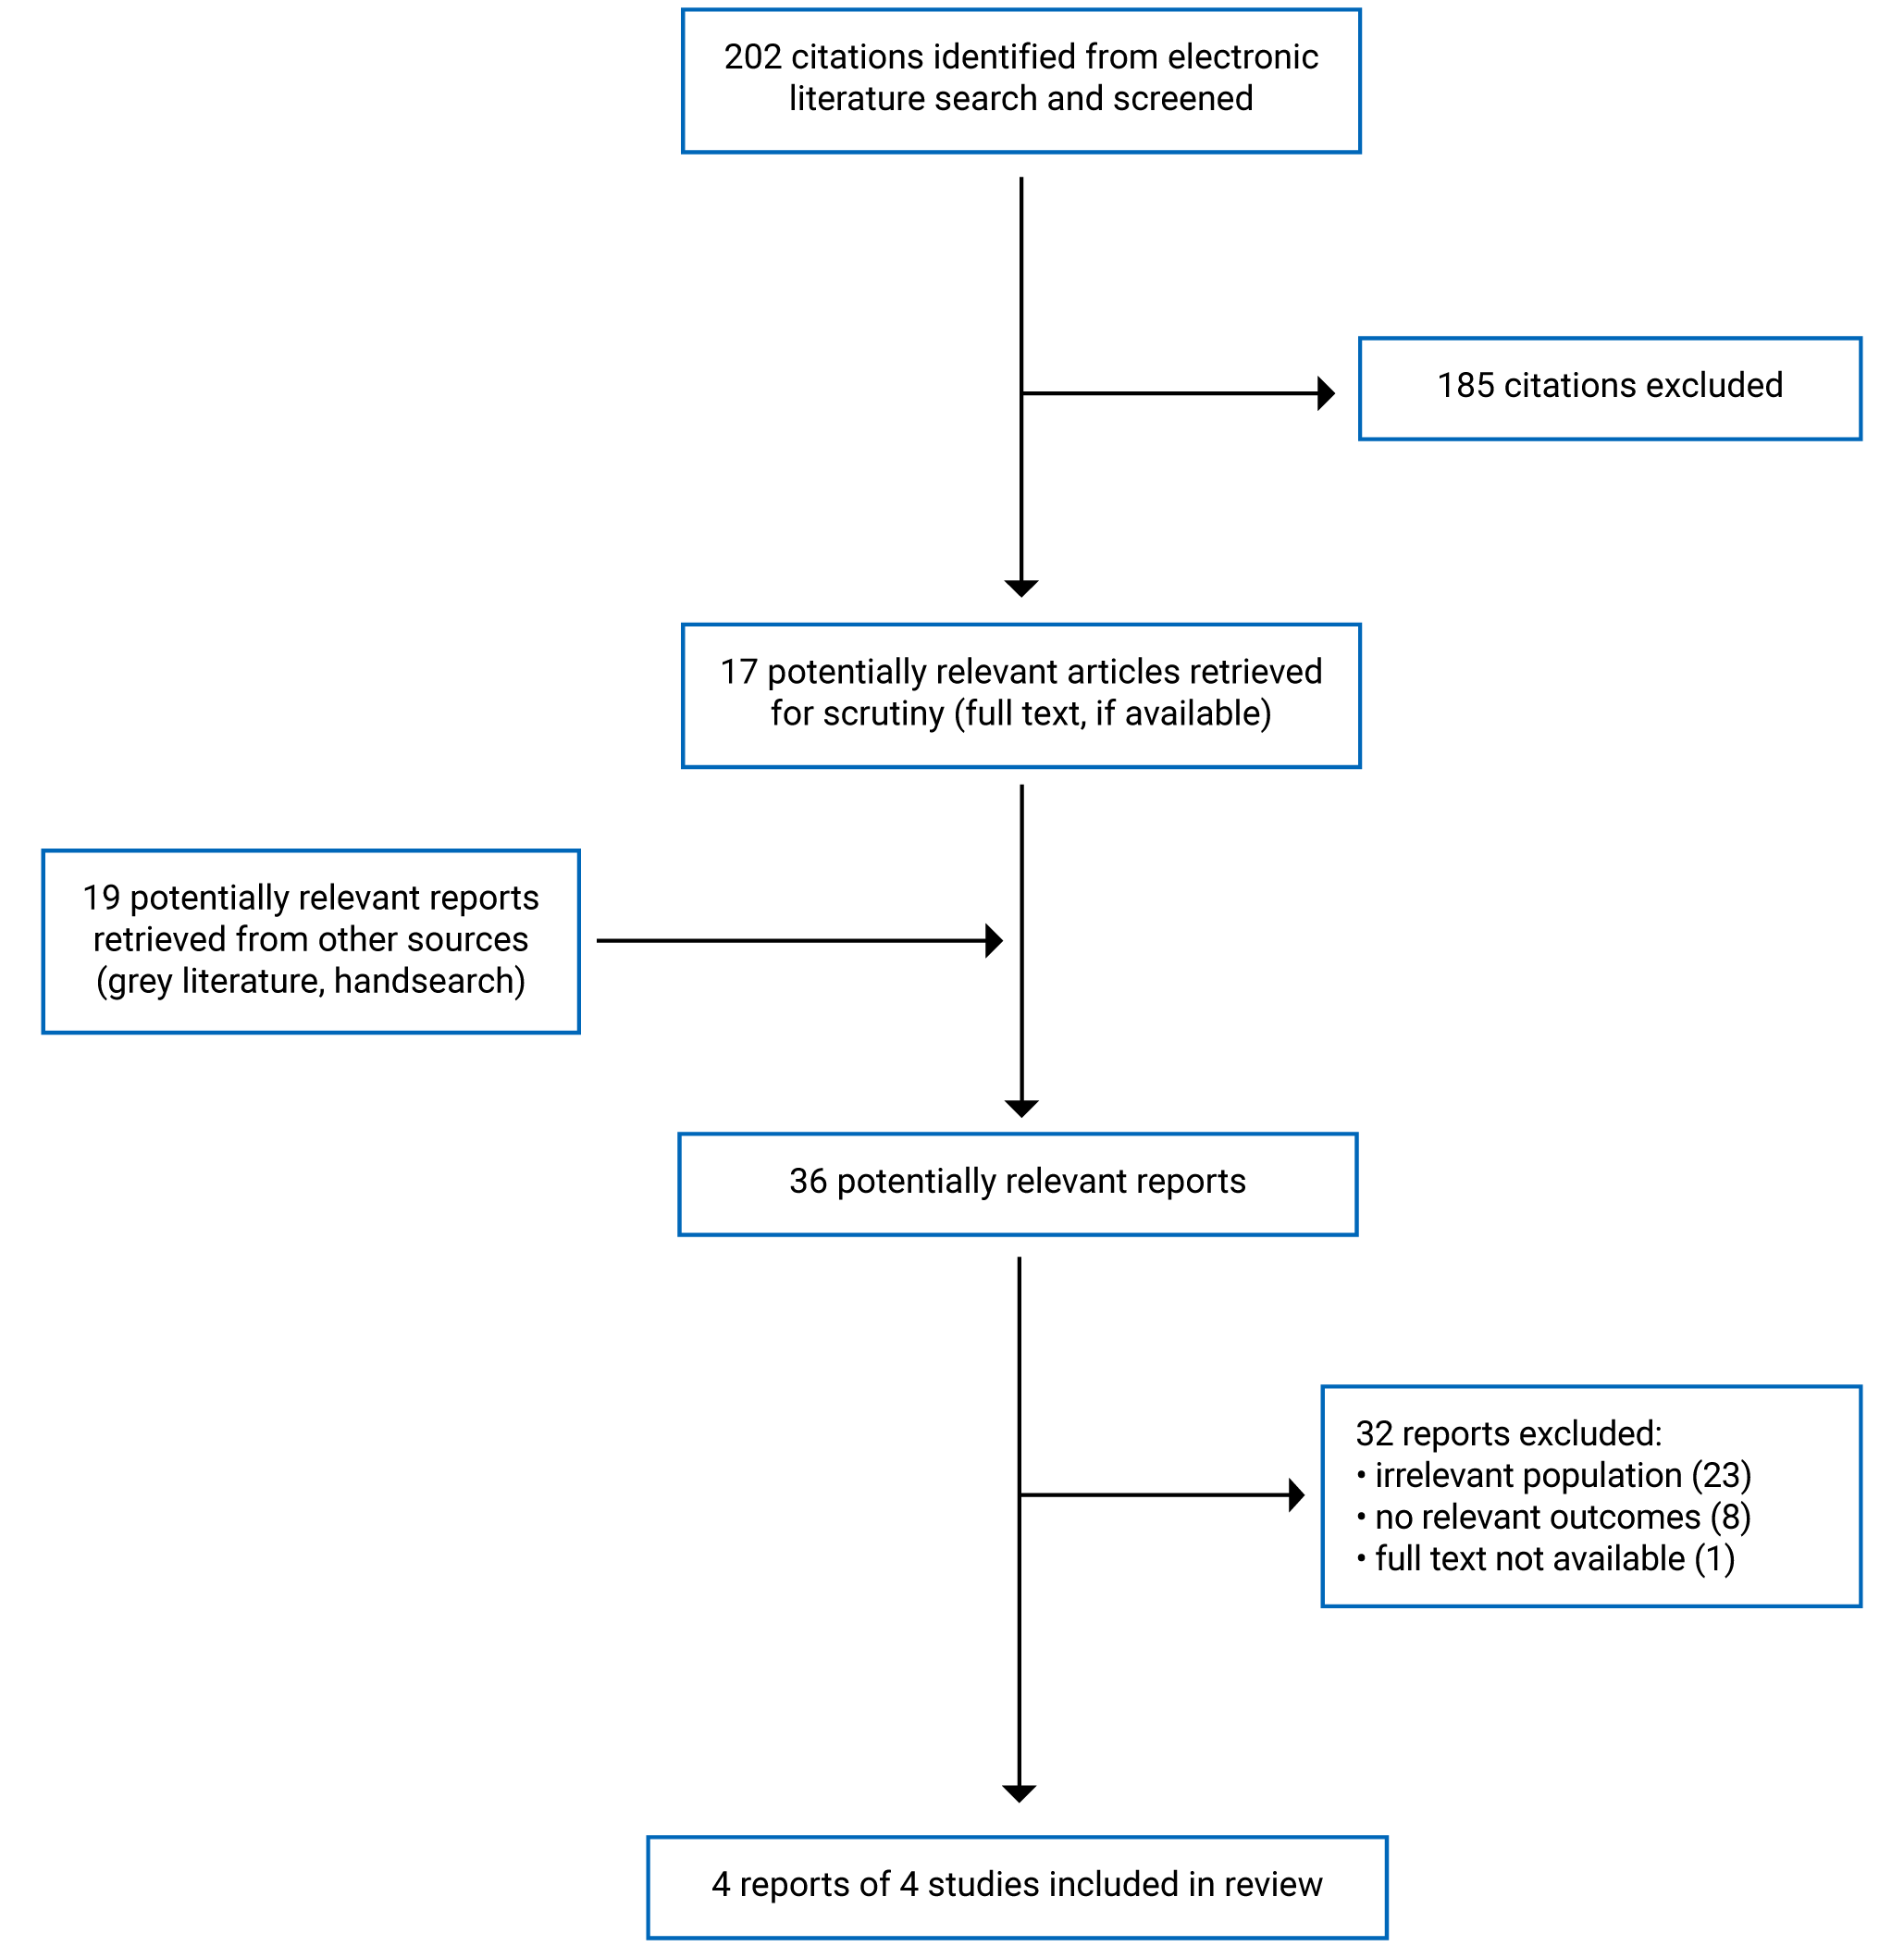
A total of 202 citations were identified in the literature search. Following screening of titles and abstracts, 185 citations were excluded and 17 potentially relevant reports were retrieved for full-text review. An additional 19 potentially relevant reports were retrieved from the grey literature search for full-text review. Of the 36 potentially relevant reports, 32 were excluded and 4 met the inclusion criteria and were included in this report. These comprised 4 non-randomized studies (3 pre- and post-studies, and 1 retrospective cohort study). Figure 2 presents the PRISMA flow chart16 of the study selection. A list of excluded reports is presented in Appendix 1.
Two guideline documents were identified that made general recommendations regarding the implementation of hub-and-spoke models for chronic pain. However, these guidelines were not included in this report due to the lack of further information regarding the hub-and-spoke model to be implemented, evidence to support the recommendation, and patient outcomes. These guideline documents are listed in Appendix 2.
Descriptions of Studies and Hub-And-Spoke Models
Four reports of 4 studies describing and evaluating hub-and-spoke models of care for chronic non-cancer pain14,17-19 were included in this report. Three of the 4 models17-19 were Extension of Community Healthcare Outcomes (ECHO) projects. ECHO is a virtual capacity building model of medical education and mentoring that uses a hub-and-spoke design to create knowledge networks by connecting specialists at academic medical centres (hubs) with front-line primary care providers (spokes) using videoconference technology.17-19
In the following sections, each report depicting each hub-and-spoke model is presented. The model components and implementation, evaluation methods, and relevant findings are described narratively and summarized in individual tables. The limitations of each study as reported by the report’s authors are also described.
Manage Your Pain Program
The Manage Your Pain Program was developed as a modified hub-and-spoke model in Queensland, Australia.14 The multisite telehealth group model was created in response to the barriers that individuals living in rural and remote communities faced in accessing specialist services for chronic pain management. Information about the evaluation of the Manage Your Pain Program was reported in a peer-reviewed publication.14 Characteristics of both the model and evaluation are presented in Table 2.
A metropolitan specialist pain management service served as the hub and regional or rural health services were the spokes. The Manage Your Pain Program was delivered to patients in a weekly 2-hour session for 4 weeks (8 hours of intervention) by the specialist allied health professionals in their specific discipline (physiotherapy, psychology, occupational therapy, and pharmacy) at the hub site using videoconferencing. Patients in rural or remote areas attended sessions at the nearest health facility (spoke site) to their homes. Potential spoke sites needed to have both the necessary telehealth equipment and a local health professional (rural allied health or nursing staff member) available to support patients to actively engage in the program. During the 10-month evaluation period (September 2016 to June 2017), 5 programs were delivered at 7 spokes.14
The Manage Your Pain Program was evaluated by authors using a pre- and post-design without a comparison group. Patients were recruited from outpatient referrals for the management of chronic pain. The sample consisted of 21 patients, with a mean age of 58 (standard deviation [SD] = 13) years (52% female). On program commencement, mean pain level was 4.95 (SD = 2.27) on an 11-level pain scale where 0 meant “no pain” and 10 meant “pain as bad as you can imagine.” Seventy-one percent of patients experienced chronic pain in several body locations. Forty-eight percent of patients had previously used group education or group therapy.14
Table 2: Characteristics of the Manage Your Pain Program14
Characteristic | Description |
|---|---|
Report type | Peer-reviewed publication |
Country | Australia |
Funding source | Health Practitioner Research Grant Scheme 2016 to 2017 |
Study design | Pre- and post-design (single arm) without comparison group |
Main objectives |
|
Model components | Hub: Gold Coast Interdisciplinary Persistent Pain Centre (Robina, Queensland) Spokes: Rural patient and interdisciplinary health services (Queensland) |
Population characteristics | Included population: Adults living in rural or remote southwestern Queensland, have persistent pain for ≥ 6 months, as determined by a medical professional, and recruited from outpatient referrals Sample size: 21 Age: Mean = 57.95 years (SD = 13.00); range = 29 to 83 years Percent female: 52 |
Outcomes |
|
Follow-up | 10 months |
BPI = Brief Pain Inventory; CPAQ20 = Chronic Pain Acceptance Questionnaire 20; DASS-21 = Depression Anxiety Stress Scale 21; PROMIS = Patient-Reported Outcomes Measurement Information System; PSEQ = Pain Self-Efficacy Questionnaire; SD = standard deviation.
Paper-based, self-administered questionnaires were completed before and after completion of the program.14 Pain was assessed using 4 validated instruments. The Chronic Pain Acceptance Questionnaire 20 (CPAQ 20)20 contains 2 subscales (pain willingness and activity engagement), which are totalled separately and combined for an overall score, with a higher result indicating a higher level of pain acceptance. The mean pre- and post-intervention CPAQ 20 total scores were 55.85 (SD = 27.24) and 63.50 (SD = 22.82), respectively (P = 0.01). In the individual analysis of the CPAQ 20 scale parameters, 60% (12 out of 21) participants showed some improvement and 5% (1 out of 21) showed reliable improvement; whereas no participants were reported to have reliable deterioration.14
The Brief Pain Inventory (BPI)21 measures both the intensity of pain and interference of pain in a participant’s life. It is scored on an 11-point (0 to 10) scale where higher scores indicate higher levels of intensity or interference. The mean pre- and post-intervention scores on the interference scale were 5.46 (SD = 2.84) and 4.89 (SD = 2.74), respectively (P = 0.17). Corresponding scores on the intensity scale were 5.33 (SD = 2.20) and 5.17 (SD = 2.37), respectively (P = 0.62). There were no significant changes in BPI interference scores at the group levels; but, at the individual level, 14% (3 out of 21) of patients made reliable improvement on the BPI interference scores. The authors reported that these individual-level changes were consistent with a clinically meaningful reliable change (clinical meaningful differences within the cohort).14
The Pain Self-Efficacy Questionnaire (PSEQ)22 is a 10-item inventory tool that targets a participant’s beliefs about their ability to accomplish a range of activities despite their pain. The tool uses a range from 0 to 60, with higher scores indicating stronger self-efficacy beliefs. The mean pre- and post-intervention Pain Self-Efficacy Questionnaire scores were 36.33 (SD = 12.54) and 37.38 (SD = 11.56), respectively (P = 0.52).14
The Patient Impression of Change Scale (PICS)23 quantifies a participant’s improvement or deterioration over time to determine the effect of an intervention. There is 1 question on pain and 1 question on mood, each measuring the current pain or mood compared to a previous time point using a 7-point scale (1, meaning very much improved, to 7, meaning very much worse). Results indicated that 50% of participants reported improved pain (minimally or much improved), 21% reported a worsening in pain, and 29% reported no change. Sixty-one percent of patients reported improved mood (minimally, much, or very much improved), 16% reported a decline in mood, and no change was reported by 23% of patients.
The Depression Anxiety Stress Scale 21 (DASS-21)24 was used to measure depression and anxiety. This tool measures along the axis of depression, anxiety, and stress (degree of severity of symptoms) as compared to the normal rates of the population.14 The recommended cut-off scores for conventional severity labels are as follows: normal = 0 to 9 for depression, 0 to 7 for anxiety, and 0 to 14 for stress; mild = 10 to13 for depression, 8 to 9 for anxiety, and 15 to 18 for stress; moderate = 14 to 20 for depression, 10 to 14 for anxiety, and 19 to 25 for stress; severe = 21 to 27 for depression, 15 to 19 for anxiety, and 26 to 33 for stress; and extremely severe = 28 and over for depression, 20 and over for anxiety, and 34 and over for stress.25 The mean DASS-21 depression scores pre- and post-intervention were 15.05 (SD = 12.69) and 16.00 (SD = 11.90), respectively (P = 0.73).14 Corresponding mean DASS-21 anxiety scores were 11.05 (SD = 10.31) and 12.95 (SD = 12.02), respectively (P = 0.50). Corresponding mean DASS-21 stress scores were 16.00 (SD = 10.31) and 16.67 (SD = 11.19), respectively (P = 0.80).
Health-related quality of life was measured using the Patient-Reported Outcomes Measurement Information System short form,26,27 which includes 10 self-reported global health items. The Patient-Reported Outcomes Measurement Information System was also used to predict EQ-5D scores,28 which range from −0.10 to 1.0, with greater scores indicating better overall health-related quality of life. The mean pre- and post-intervention EQ-5D scores were 0.58 (SD = 0.09) and 0.56 (SD = 0.09), respectively (P = 0.23).14 A summary of the findings of the study is presented in Table 3.
Table 3: Summary of Findings for the Manage Your Pain Program14
Evaluation method | Outcome | Findings |
|---|---|---|
Pre- and post-design, patient questionnaires | Pain | Mean scores (SD) on CPAQ total scale in 21 participants:
Mean scores (SD) on BPI intensity scale in 21 participants:
Mean scores (SD) on BPI interference scale in 21 participants:
Mean scores (SD) on PSEQ in 21 participants:
Responses to “How is your pain?” on PISC at post-intervention:
|
Depression | Mean scores (SD) on the DASS-21 scale in 21 participants:
Responses to “How is your mood?” on PISC at post-intervention:
| |
Anxiety | Mean scores (SD) on DASS-21 scale in 21 participants:
| |
Health-related quality of life | Mean scores (SD) on EQ-5D in 21 participants:
|
BPI = Brief Pain Inventory; CPAQ = Chronic Pain Acceptance Questionnaire; DASS-21 = Depression Anxiety Stress Scale 21; PISC = Patient Impression of Change Scale; PSEQ = Pain Self-Efficacy Questionnaire; SD = standard deviation.
The authors of the report on the Manage Your Pain Program14 noted some key limitations of their study. The study included fewer than 25 patients. According to the authors, the size of the sample was influenced by the available population from the rural health service during the study period. Because the focus of the evaluation was on exploring the feasibility of implementing the model, rather than the model’s effectiveness on pain management and other patient outcomes, the authors noted that limited demographic information was collected about the patients in the study. The outcomes were assessed following the intervention, and the authors noted that without long-term monitoring, it is unknown whether the benefits observed in the study will be maintained. Other limitations that were noted by the authors of the report included the lack of validation of the program in a face-to-face format, the lack of explicit implementation framework for the program, the dichotomization of some continuous outcomes, and the lack of outcomes related to patient and service costs.
Army and Navy ECHO Pain
An evaluation of the US Army and Navy ECHO Pain tele-mentoring model was reported in a peer-review publication.17 ECHO Pain was developed in response to the crisis of chronic pain and unintentional opioid deaths in both civilian and military populations. Characteristics of both the model and evaluation are presented in Table 4. This hub-and-spoke model used secure, audio-visual networks to connect pain medicine specialists (hubs) with remote primary care providers (spokes). The US Army used Project ECHO tele-mentoring clinics and the US Navy used Project ECHO Pain clinics, both with their own hubs and remote spokes. Expert teams at the hub used multi-point videoconferencing to conduct virtual learning sessions. Spoke attendees included physicians, advanced practice clinicians, and care teams. Sessions ran for 2 hours weekly (96 total hours annually). Onset of participation in ECHO Pain was staggered over 4 years to accommodate training for the large number of hubs and spokes. Each session consisted of a short, evidence-based didactic followed by case discussions intended to reduce variations in care. Key components of the program were education in the neurophysiology of persistent pain and the development of active self-management strategies.17
A retrospective cohort study was conducted to evaluate the Army and Navy ECHO Pain intervention. Between 2012 and 2014, integrative and interdisciplinary pain teams were fully staffed at 5 US Army and 2 US Navy hub sites. Forty-seven remote Army and 33 remote Navy spoke locations were chosen based on primary care physician interest and volume of chronic care patients. Using data from the Military Health System Data Repository, prescription counts for 99 intervention clinics (in which primary care physicians voluntarily participated in ECHO Pain and had data before and after the ECHO intervention) were compared to 1,283 clinics whose primary care physicians did not participate in ECHO Pain. There were 52,941 patients (55% female) in the ECHO group and 1,187,945 (40% female) in the comparator group. The age of patients ranged from 18 to 64 years, with approximately one-third between the ages of 25 and 34 years old in both groups. Forty-eight percent of providers in ECHO Pain attended 1 to 3 ECHO clinics, 32% attended 4 to 19 clinics, and 20% participated in more than 20 clinics.17
Table 4: Characteristics of the US Army and Navy ECHO17
Characteristic | Description |
|---|---|
Report type | Peer-reviewed publication |
Country | US |
Funding source | US Defense Health Agency |
Study design | Retrospective cohort study with comparison group (clinics whose primary care physicians did not participate in ECHO Pain) |
Model objectives |
|
Model components | Hubs: Pain medicine specialists at military treatment facilities (US and Germany) Spokes: Remote primary care providers at military clinics (US and worldwide) |
Population characteristics | Included population: Patients were active-duty military personnel, dependents of active-duty personnel, members of the National Guard or Reserve, and military retirees Primary care physicians for ECHO Pain were either active duty or civilian clinicians working at Army or Navy military medical treatment facilities Sample size: 99 ECHO Pain clinics with 52,431 patients (intervention); 1,283 non-ECHO clinics with 1,187,945 patients (comparison) Age: 18 to 64 years Percent female: 54.6 (intervention); 39.9 (comparison) |
Outcomes | Pharmacotherapy use (prescriptions) |
Follow-up | 1 year |
ECHO = Extension for Community Healthcare Outcomes.
Study outcomes included prescription counts of opioids and benzodiazepines for adult patients enrolled with the Army and Navy clinics for fiscal years 2013 to 2016 and the morphine milligram equivalents dose and co-prescribing of opioids and benzodiazepines. Each outcome was analyzed as a time series of clinic averages per patient. All analyses were adjusted for age, sex, beneficiary status (i.e., military care plan), and baseline data. The following outcomes declined in both comparison clinics and ECHO Pain: annual opioid prescriptions per patient (−6.4% versus −22.5%, P < 0.001), annual percent of patients using opioids (−8.0% versus −20.1%, P < 0.001), average morphine milligram equivalents prescribed per patient per year (−10.6% versus −27.5%, P < 0.001), and days of co-prescribed opioid and benzodiazepine per patient using opioids per year (−9.6% versus 68.9%, P < 0.001; unadjusted estimates).
Clinicians who volunteered to participate in ECHO Pain had lower rates of opioid prescribing, opioid and benzodiazepine co-prescribing, and average morphine milligram equivalents at baseline. The authors postulate that this difference reflected clinicians who were early adopters of best practices for pain management and who may have provided care for patients living with chronic pain that was more resistant to management. While the ECHO Pain and comparison groups had declines in opioid prescribing, those in ECHO Pain had steeper declines than the comparison group. The authors surmise that ECHO Pain providers may have had more initial interest in learning about patients with complex chronic pain and developed self-efficacy in managing these patients by participating in ECHO Pain. The authors concluded that these observations indicated a more judicial use of opioid pharmacotherapy and more engaged management of patients receiving opioid prescriptions following use of the Project ECHO as a model for care.17 A summary of the findings of the observational cohort study is presented in Table 5.
The study limitations identified by the authors related to self-selection and data analysis. Because the study did not randomize the assignment of clinicians and patients into matched group, the authors noted that baseline demographics for the comparison group were skewed toward males and those on active duty. The authors also reported that because health care providers volunteered to participate, and because their patients had highly complex chronic pain and used high doses of opioid analgesics, this may have skewed the results. Another limitation reported by the study authors was that the database used for the study was a de-identified, aggregated file from the Military Health System Database, and clinician ECHO Pain participation data were provided by the US Army and Navy. Data were provided on individuals clinics, but not on individual providers or patients.17 Therefore, data on pharmacotherapy use could not be analyzed at the individual clinician or patient level. Additionally, the authors were unable to specify the reasons opioids were used in each patient, to qualify how each patient’s opioid use (e.g., dose) may have changed or to address patient-level causes for reduction in prescriptions.17
Table 5: Summary of Findings for the US Army and Navy ECHO17
Evaluation method | Outcome | Findings |
|---|---|---|
Retrospective cohort with comparison group | Pharmacotherapy use | Annual change in mean number of opioid analgesic prescriptions per patient (from baseline), adjusted for sex, age, and baseline values:
Annual change in percent opioid users (from baseline), adjusted for sex, age, and baseline values:
Annual change in mean morphine milligram equivalents per patient (from baseline), adjusted for sex, age, and baseline values:
Annual change in days of co-prescribing opioids and benzodiazepines per patient (from baseline), unadjusted:
|
ECHO = Extension for Community Health care Outcomes.
University Health Network ECHO Ontario
An evaluation of the University Health Network (UHN) ECHO project was reported in the 2017-18 annual report of the ECHO Ontario Superhub.18 Project ECHO at UHN launched ECHO Chronic Pain and Opioid Stewardship in June 2014.18 UHN is a network of hospitals and academic centres in Toronto, Ontario, that includes the Princess Margaret Cancer Centre, Toronto General Hospital, Toronto Western Hospital, Toronto Rehabilitation Institutes, and Michener Institute. The ECHO project linked an expert interprofessional team (the hub) with primary care providers across Ontario (the spokes) via weekly videoconferencing sessions. Characteristics of both the model and evaluation are presented in Table 6.
Medical chart reviews were conducted in northern and southern Ontario to examine the impact of Project ECHO UHN for patients with chronic pain. Twelve clinicians from 6 clinics consented to participate and 24 charts were reviewed. Patient characteristics were not reported. Data about pharmacotherapy use (e.g., opioids and benzodiazepines) and health care practice were collected 1 year before the clinician attended their first ECHO session and 1 year after they attended their first ECHO session. Another method used to evaluate the UHN ECHO project was the completion of questionnaires by ECHO participants at different time points: Time 1 and Time 2 (no further description was provided in the annual report). The number of participants completing the questionnaires and their demographic information were not reported. Pain severity was assessed using BPI,21 and depression severity was assessed using the Patient Health Questionnaire29 (no further information about this tool was provided).
Table 6: Characteristics of the UHN ECHO Ontario18
Characteristic | Description |
|---|---|
Report type | 2017-2018 annual report |
Country | Canada |
Funding source | Ontario Ministry of Health and Long-Term Care |
Study design | Pre- and post-design without comparison group (for medical chart review; study design NR for patient questionnaires) |
Model objectives |
|
Model components | Hubs: Chronic Pain and Opioid Stewardship Program, UHN (Toronto) Spokes: Primary care providers across different health care organizations (Ontario) |
Population characteristics | Included population: Patients with chronic pain Sample size: 24 for chart review, NR for patient questionnaires Age: NR Percent female: NR |
Outcomes |
|
Follow-up | 1 year for chart review, NR for patient questionnaires |
BPI = Brief Pain Inventory; ECHO = Extension for Community Healthcare Outcomes; NR = not reported; PHQ-9 = Patient Health Questionnaire 9; UHN = University Health Network.
Based on the chart reviews, the authors reported 33% tapered opioids (decreased dose or eliminated altogether), a 25% reduction in dangerous polypharmacy (benzodiazepines plus opioids, central nervous system depressants plus opioids), a 25% increase in discussion about pain interference with patients’ functional status, a 25% increase in recommendations to stay active, and 21% reduction in number of visits to health care providers.
Based on the surveys, the mean BPI scores for patients in ECHO were 6.4 at Time 1 and 6.2 at Time 2. The mean depression severity scores for patients in ECHO were 14.5 at Time 1 and 13.5 at Time 2. A summary of the findings are presented in Table 7.
Table 7: Summary of Findings for the UHN ECHO Ontario18
Evaluation method | Outcome | Findings |
|---|---|---|
Study design NR, patient questionnaires | Pain | Mean scores (SD) on BPI (number of patients NR)
|
Depression | Mean scores (SD) on PHQ-9 (number of patients NR)
| |
Pre- and post-design, medical record review | Pharmacotherapy use | Findings based on 24 charts of patients with chronic pain reviewed by 12 clinicians from 6 clinics at 1 year after their first ECHO session compared to 1 year before their first ECHO session
|
Health care use and practice | Findings based on 24 charts of chronic pain patients reviewed by 12 clinicians from 6 clinics at 1 year after their first ECHO session compared to 1 year before their first ECHO session
|
BPI = Brief Pain Inventory; CNS = central nervous system; ECHO = Extension for Community Healthcare Outcomes; NR = not reported; SD = standard deviation; PHQ-9 = Patient Health Questionnaire 9; UHN = University Health Network.
aNo information regarding “Time 1” and “Time 2” was provided in the annual report.
This UHN ECHO project18 was reported in an annual report, and did not fully describe its methodology.18 The authors did not discuss any limitations of their report.
Project ECHO Pain in Community Health Centres
An evaluation of Project ECHO Pain was reported in a peer-review publication.19 Characteristics of both the model and evaluation are presented in Table 8. The Integrative Pain Centre of Arizona (the hub) used videoconference case-based learning to hold weekly learning sessions for 2 large, multisite federated community health care centres in Connecticut and Arizona (the spokes), that provided care for patients who were medically underserved (predominantly those from marginalized communities and people who fall below the federal poverty level). The sessions were led by a multidisciplinary pain specialist team from the hub and attendees from the spokes were primary care medical providers (including internists, family doctors, and family nurse practitioners) at community health care centres. By presenting actual cases from specialist practice and listening to brief didactics, the project aimed to provide participants with the skills needed to prevent, evaluate, and manage chronic pain. The goal was to created local content experts on chronic pain within the community primary care clinics, to help bridge the gap between specialty and primary care, and improve access and health outcomes for patients. ECHO sessions were coordinated and managed by staff from a research and innovation centre located in Middletown, Connecticut.19
A non-randomized study using a pre- and post-design with a comparison group was undertaken to explore the effect of Project ECHO Pain on patient outcomes.19 Twelve primary care providers (who attended the ECHO Pain sessions over 1 year, between January 2013 and December 2013) were compared to 11 matched control providers who did not participate in ECHO Pain. A medical record review was undertaken for all patients with chronic pain who received care from primary care providers in the intervention and the control groups for the 1-year period before starting ECHO (January 2012 through December 2012) and for the 1-year period following the intervention (January 2014 through December 2014).19
At baseline, 1,586 patients (61% female; mean age = 47.9; standard error [SE] = 1.42 years) with chronic pain were cared for by providers (159 patients per 97 providers) in the intervention group and 2,020 patients (63% female; mean age = 49.5) were seen by providers (202 patients per 93 providers) in the comparison group. At follow-up, there were 1,485 patients (149 patients per 73 providers) in the intervention group and 1,695 patients (170 patients per 86 providers) in the control group.19
Table 8: Characteristics of Project ECHO Pain CHC19
Characteristic | Description |
|---|---|
Report type | Peer-reviewed publication |
Country | US |
Funding source | Pfizer Independent Grants for Learning and Change; The MAYDAY Fund |
Study design | Pre- and post-design with comparison group (matched control primary care provider not participating in ECHO Pain) |
Model objectives |
|
Model components | Hub: Integrative Pain Centre of Arizona (Tucson, Arizona) Spokes: Community health care centres (Connecticut and Arizona) |
Population characteristics | Included population: Patients with chronic pain of participating primary care providers in Connecticut or Arizona Sample size: 12 providers with 1,485 patients (intervention); 11 providers with 1,695 patients (comparison) Age: Mean = 47.9 (SE = 1.42) years in the interventions group; mean = 49.5 (SE = 1.41) years in the comparison group at baseline Percent female: 63% in the intervention group; 61% in the comparison group at baseline |
Outcomes | Pharmacotherapy use (prescriptions) Health care use (referrals to specialists) |
Follow-up | 1 year |
CHC = community health centres; ECHO = Extension for Community Healthcare Outcomes; SE = standard error.
Electronic records data were reviewed to assess pharmacotherapy use, number of provider visits, and referrals to pain-related specialists.19 The mean percentages of patients with an opioid prescription pre- and post-intervention were 56.2% (SE = 6.2%) and 50.5% (SE = 6.2%), respectively, in the intervention group compared with 50.1% (SE = 6.1%) and 50.3% (SE = 6.2%), respectively, in the comparison group (P = 0.017). Conversely, the mean number of opioid prescriptions per participant pre- and post-intervention were 4.89 (SD = 0.81) and 5.0 (SD = 0.81), respectively, in the intervention group compared with 3.05 (SD = 0.80) and 3.97 (SD = 0.81), respectively, in the comparison group (P = 0.02). The mean number of provider visits per year pre- and post-intervention were 8.47 (SE = 0.56) and 8.38 (SE = 0.56), respectively, in the intervention group compared with 7.21 (SE = 0.55) and 7.02 (SE = 0.55), respectively, in the comparison group (P = 0.718).19
The mean percentages of patients with an onsite behavioural mental health visit pre- and post-intervention were 26.6% (SE = 0.56%) and 30.7% (SE = 4.3%), respectively, in the intervention group compared with 24.1% (SE = 4.2%) and 25.5% (SE = 4.3%), respectively, in the comparison group (P < 0.001). The mean number of referrals for physical therapy pre- and post-intervention were 20% (SE = 6%) and 22.2% (SE = 6%), respectively, in the intervention group compared with 35.3% (SE = 6%) and 25.3% (SE = 6%), respectively, in the comparison group (P < 0.001). The mean number of referrals for pain management pre- and post-intervention were 9.4% (SE = 2.2%) and 9.5% (SE = 2.2%), respectively, in the intervention group compared with 6.8% (SE = 2.1%) and 12.1% (SE = 2.2%), respectively, in the comparison group (P < 0.001). The mean number of referrals for physical medicine and rehabilitation pre- and post-intervention were 7.8% (SE = 1.5%) and 2.0% (SE = 1.5%), respectively, in the intervention group compared with 5.7% (SE = 1.5%) and 3.1% (SE = 1.5%), respectively, in the comparison group (P = 0.004). The mean number of referrals for surgery pre- and post-intervention were 26.0% (SE = 3.8%) and 22.1% (SE = 3.8%), respectively, in the intervention group compared with 23.5% (SE = 3.8%) and 25.3% (SE = 3.8%), respectively, in the comparison group (P = 0.007). The mean number of referrals for rheumatology pre- and post-intervention were 3.7% (SE = 0.7%) and 3.8% (SE = 0.7%), respectively, in the intervention group compared with 3.3% (SE = 0.7%) and 3.3% (SE = 0.7%), respectively, in the comparison group (P < 0.868). The authors reported that there were no statistically significant differences between groups in the change in referrals to other specialties, such as addiction medicine, chiropractic, and acupuncture (data not reported).19 A summary of the findings of the pre- and post- intervention is presented in Table 9.
The authors of this study19 identified the following limitations: the absence of data on the dosage of opioid prescriptions written by providers in the intervention group, the nonrandom assignment of providers to intervention groups, the significant commitment from the participating agencies to support consistent attendance of their providers in the intervention group (which may not be feasible in other practice settings), and the lack of cost data.19
Table 9: Summary of Findings for Project ECHO Pain CHC19
Evaluation method | Outcome | Findings |
|---|---|---|
Pre- and post-design with comparison group | Pharmacotherapy use | Mean (SE) % of patients treated with an opioid medication at baseline (1 year before ECHO) vs. follow-up (1 year after ECHO)
Mean (SD) number of opioid prescriptions per participant from baseline to follow-up
|
Health care use | Mean (SE) provider visits per year at baseline (1 year before ECHO) vs. follow-up (1 year after ECHO)
| |
Referrals to specialist services | Mean (SE) patients with behavioural mental health visit onsite, at baseline (1 year before ECHO) vs. follow-up (1 year after ECHO)
Mean (SE) referrals to physical therapy at baseline vs. follow-up
Mean (SE) referrals to pain management at baseline vs. follow-up
Mean (SE) referrals to physical medicine and rehabilitation at baseline vs. follow-up
Mean (SE) referrals to surgery (neurosurgery or orthopedic) at baseline vs. follow-up
Mean (SE) referrals to rheumatology at baseline vs. follow-up
|
CHC = community health centres; ECHO = Extension for Community Health care Outcomes; SD = standard deviation; SE = standard error; vs. = versus.
Limitations
The purpose of this CADTH report was to identify and describe the literature on the potential benefits, harms, and cost implications of hub-and-spoke models of care for chronic pain. This report was not a formal program evaluation, and no conclusions were formed. The literature was not critically appraised and the quality of the evidence from included reports is unknown.
Two models were implemented in the US17,19 and 1 in Australia,14 where health care systems differ from those in Canada; therefore, the applicability of their findings to the Canadian setting is unclear.18
No studies that described potential harms were identified. Two studies reported on health care use,18,19 but no studies were found that described other potential cost implications, such as budget impact, cost savings, or economic benefits to individuals or health systems. The traditional travel and service cost savings associated with the use of telehealth programs were assumed in the Manage Your Pain Program,14 but not assessed as part of any economic evaluation. The included models were supported by government or grant funding.14,17-19
Conclusions
This custom report was conducted to identify and describe the literature on the potential clinical benefits, harms, and cost implications of hub-and-spoke models of care for the management of people with chronic non-cancer pain. The report does not include a critical appraisal of the identified reports and is not intended to be a formal program evaluation of hub-and-spoke models of care for chronic pain. Four relevant documents describing the potential clinical benefits of hub-and-spoke models were included.14,17-19 The 4 models14,17-19 provided central specialized care at hubs and core services at spokes; and all used videoconferencing to provide education about chronic pain.14,17-19 All 4 reports described at least some positive results for their outcomes of interest (e.g., pain, depression, pharmacotherapy prescribing and use). No reports were identified that described the potential harms or cost implications of hub-and-spoke models for chronic pain.
References
1.Skelly AC, Chou R, Dettori JR, et al. Noninvasive nonpharmacological treatment for chronic pain: a systematic review update. (Comparative Effectiveness Review No. 227). Rockville (MD): Agency for Healthcare Research and Quality; 2020: https://www.ncbi.nlm.nih.gov/books/NBK556229/pdf/Bookshelf_NBK556229.pdf. Accessed 2022 Mar 21.
2.Classification of chronic pain. Descriptions of chronic pain syndromes and definitions of pain terms. Prepared by the International Association for the Study of Pain, Subcommittee on Taxonomy. Pain Suppl. 1986;3:S1-226. PubMed
3.Institute of Medicine. Relieving pain in America: a blueprint for transforming prevention, care, education, and research. Washington (DC): The National Academies Press; 2011: https://www.ncbi.nlm.nih.gov/books/NBK91497/. Accessed 2022 Apr 11.
4.The Canadian Pain Task Force. Chronic pain in Canada: laying a foundation for action. (Canadian Pain Task Force report: June 2019). Ottawa (ON): Health Canada; 2019: https://www.canada.ca/en/health-canada/corporate/about-health-canada/public-engagement/external-advisory-bodies/canadian-pain-task-force/report-2019.html. Accessed 2022 Mar 21.
5.Hogan ME TA, Katz J, Shah V, Krahn M. Incremental health care costs for chronic pain in Ontario, Canada: A population-based matched cohort study of adolescents and adults using administrative data. Pain. 2016;157(8):1626-1633. PubMed
6.The Canadian Pain Task Force. An action plan for pain in Canada. (Canadian Pain Task Force report: March 2021). Ottawa (ON): Health Canada; 2021: https://www.canada.ca/en/health-canada/corporate/about-health-canada/public-engagement/external-advisory-bodies/canadian-pain-task-force/report-2021.html. Accessed 2022 Apr 11.
7.Brett K, MacDougall D. Models of care for chronic pain. (CADTH Environmental scan). Ottawa (ON): CADTH; 2021: https://www.cadth.ca/sites/default/files/es/ES0350%20_to%20Publishing%20Final.pdf. Accessed 2022 Mar 22.
8.Elrod JK, Fortenberry JL, Jr. The hub-and-spoke organization design revisited: a lifeline for rural hospitals. BMC Health Serv Res. 2017;17(Suppl 4):795. PubMed
9.Elrod JK, Fortenberry JL, Jr. The hub-and-spoke organization design: an avenue for serving patients well. BMC Health Serv Res. 2017;17(Suppl 1):457. PubMed
10.Brooklyn JR, Sigmon SC. Vermont Hub-and-Spoke Model of Care for Opioid Use Disorder: Development, Implementation, and Impact. J Addict Med. 2017;11(4):286-292. PubMed
11.Mohlman MK, Tanzman B, Finison K, Pinette M, Jones C. Impact of medication-assisted treatment for opioid addiction on Medicaid expenditures and health services utilization rates in Vermont. J Subst Abuse Treat. 2016;67:9-14. PubMed
12.Busse JW, Craigie S, Juurlink DN, et al. Guideline for opioid therapy and chronic noncancer pain. CMAJ. 2017;189(18):E659-E666. PubMed
13.Sawhney M, Fletcher GG, Rice J, Watt-Watson J, Rawn T. Guidelines on management of pain in cancer and/or palliative care. (Program in evidence-based care evidence summary no.:18-4). Toronto (ON): Cancer Care Ontario; 2017: https://www.cancercareontario.ca/en/file/60576/download?token=u-u8pL3r. Accessed 2022 Apr 11.
14.Scriven H, Doherty DP, Ward EC. Evaluation of a multisite telehealth group model for persistent pain management for rural/remote participants. Rural Remote Health. 2019;19(1):4710. PubMed
15.Davis JA, Robinson RL, Le TK, Xie J. Incidence and impact of pain conditions and comorbid illnesses. J Pain Res. 2011;4:331-345. PubMed
16.Liberati A, Altman DG, Tetzlaff J, et al. The PRISMA statement for reporting systematic reviews and meta-analyses of studies that evaluate health care interventions: explanation and elaboration. J Clin Epidemiol. 2009;62(10):e1-e34. PubMed
17.Katzman JG, Qualls CR, Satterfield WA, et al. Army and navy ECHO pain telementoring improves clinician opioid prescribing for military patients: an observational cohort study. J Gen Intern Med. 2019;34(3):387-395. PubMed
18.Crawford A, Flannery J, Serhal E, Mostyn R. ECHO Ontario Annual Report 2017/18. Toronto (ON): ECHO Ontario; 2018: https://www.echoontario.ca/Echo/media/Images/Annual%20Reports/ECHOOntario_FY1718_AnnualReport_PDF_Fin.pdf?ext=.pdf. Accessed 2022 Mar 23.
19.Anderson D, Zlateva I, Davis B, et al. Improving pain care with Project ECHO in community health centers. Pain Med. 2017;18(10):1882-1889. PubMed
20.McCracken LM, Vowles KE, Eccleston C. Acceptance of chronic pain: component analysis and a revised assessment method. Pain. 2004;107(1-2):159-166. PubMed
21.Mendoza T, Mayne T, Rublee D, Cleeland C. Reliability and validity of a modified Brief Pain Inventory short form in patients with osteoarthritis. Eur J Pain. 2006;10(4):353-361. PubMed
22.Nicholas MK. The pain self-efficacy questionnaire: Taking pain into account. Eur J Pain. 2007;11(2):153-163. PubMed
23.Scott W, McCracken LM. Patients' impression of change following treatment for chronic pain: global, specific, a single dimension, or many? J Pain. 2015;16(6):518-526. PubMed
24.Henry JD, Crawford JR. The short‐form version of the Depression Anxiety Stress Scales (DASS‐21): Construct validity and normative data in a large non‐clinical sample. Br J Clin Psychol. 2005;44(2):227-239. PubMed
25.Gomez F. A guide to the depression, anxiety and stress scale (DASS 21). Mascot (AU): Central and Eastern Sydney Primary Health Networks; 2016. Accessed 2022 Apr 11.
26.Cella D, Riley W, Stone A, et al. The Patient-Reported Outcomes Measurement Information System (PROMIS) developed and tested its first wave of adult self-reported health outcome item banks: 2005–2008. J Clin Epidemiol. 2010;63(11):1179-1194. PubMed
27.Hays RD, Bjorner JB, Revicki DA, Spritzer KL, Cella D. Development of physical and mental health summary scores from the patient-reported outcomes measurement information system (PROMIS) global items. Qual Life Res. 2009;18(7):873-880. PubMed
28.Revicki DA, Kawata AK, Harnam N, Chen W-H, Hays RD, Cella D. Predicting EuroQol (EQ-5D) scores from the patient-reported outcomes measurement information system (PROMIS) global items and domain item banks in a United States sample. Qual Life Res. 2009;18(6):783-791. PubMed
29.Kroenke K, Spitzer RL, Williams JB. The Patient Health Questionnaire-2: validity of a two-item depression screener. Med Care. 2003:1284-1292. PubMed
30.Shelley BM, Katzman JG, Comerci Jr GD, et al. ECHO pain curriculum: balancing mandated continuing education with the needs of rural health care practitioners. J Contin Educ Health Prof. 2017;37(3):190-194. PubMed
Appendix 1: Excluded Publications
Table 10: List of Excluded Reports
Publication or grey literature | Description | Reason for exclusion |
|---|---|---|
Brooklyn et al. Vermont Hub-and-Spoke Model of care for opioid use disorder: Development, implementation, and impact. J Addict Med. 2017;11(4):286-92. | Development and impact of Vermont hub-and-spoke model for opioid use disorder | Not chronic pain |
Calabro et al. Innovation technology in neurorehabilitation: Introducing a hub and spoke model to avoid patient “migration” in Sicily. J Health Organ Manag. 2020;20:20. | Implementation of hub-and-spoke model for neurorehabilitation | Not chronic pain |
Carlin et al. Project ECHO telementoring intervention for managing chronic pain in primary care: Insights from a qualitative study. Pain Med. 2018;19(6):1140-6. | Qualitative study of hub-and-spoke model for chronic pain in primary care | No relevant outcomes |
Darfler et al. California State Targeted Response to the Opioid Crisis. 2019 | Evaluation of the California hub-and-spoke model for opioid use disorders | Not chronic pain |
Darfler et al. Preliminary results of the evaluation of the California Hub and Spoke Program. J Subst Abuse Treat. 2020;108:26-32. | Evaluation of the California hub-and-spoke model for opioid use disorders | Not chronic pain |
Elrod and Fortenberry. The hub-and-spoke organization design revisited: A lifeline for rural hospitals. BMC Health Serv Res. 2017;17(S4):795. | Discussion paper about hub-and-spoke modes for rural hospitals | Not chronic pain |
Elrod and Fortenberry. Peering beyond the walls of health care institutions: A catalyst for innovation. BMC Health Serv Res. 2017;17(S1):402. | Discussion paper about innovations for health care | Not chronic pain |
Elrod and Fortenberry. The hub-and-spoke organization design: An avenue for serving patients well. BMC Health Serv Res. 2017;17(S1):457. | Discussion paper about hub-and-spoke model | Not chronic pain |
Fry et al. “Even though I am alone, I feel that we are many” - An appreciative inquiry study of asynchronous, provider-to-provider teleconsultations in Turkana, Kenya. PLoS ONE. 2020;15(9):e0238806. | Appreciative inquiry study of telephone consultations service | Not chronic pain |
Furlan et al. valuation of an innovative tele-education intervention in chronic pain management for primary care clinicians practicing in underserved areas. Telemed Telecare. 2019;25(8):484-92. | Evaluation of hub-and-spoke model for chronic pain management in primary care | No relevant outcomes |
Gazda et al. Comparison of two medication therapy management practice models on return on investment. J Pharm Pract. 2017;30(3):282-5. | Retrospective cohort study of hub-and-spoke model vs. integrated practice model for medication therapy management by pharmacies | Not chronic pain |
Glynn et al. Bringing chronic-pain care to rural veterans: A telehealth pilot program description. Psychol Serv. 2021;18(3):310. | Description of hub-and-spoke model for chronic pain in veterans | Publication has delayed release (embargo) and is unavailable until August 2022 |
Gurung et al. Integrated models of ambulatory care: A scoping literature review to inform Community Health Hub development in the Southern Region. 2019 | Scoping review of models for ambulatory care | Not chronic pain |
James et al. Spread, scale-up, and sustainability of video consulting in health care: Systematic review and synthesis guided by the NASSS Framework. J Med Internet Res. 2021;23(1):e23775. | Systematic review of the spread and scale-up of video consultation services | Not chronic pain |
Kausar et al. A study on economic evaluation of an outreach health-care facility in Jhajjar District of Haryana: Service delivery model for increasing access to health care. Indian J Public Health. 2021;65(1):45-50. | Economic evaluation of hub-and-spoke model for outreach health care services | Not chronic pain |
Lesher et al. Development and evolution of a statewide outpatient consultation service: Leveraging telemedicine to improve access to specialty care. Population Health Management. 2020;23(1):20-28. | Implementation and evaluation of hub-and-spoke model for outpatient consultation services | Not chronic pain |
Lin et al. Process evaluation of a hub-and-spoke model to deliver coordinated care for children with medical complexity across Ontario: Facilitators, barriers and lessons learned. Healthc Policy. 2021;17(1):104-22. | Process evaluation of hub-and-spoke model for children with medical complexities | Not chronic pain |
Luscombe et al. 'Empowering clinicians in smaller sites': A qualitative study of clinician's experiences with a rural Virtual Paediatric Feeding Clinic. Aust J Rural Health. 2021;29(5):742-52. | Qualitative study with health care providers pilot hub-and-spoke model for Virtual Paediatric Feeding Clinic outreach service | Not chronic pain |
Major et al. It's about time: Rapid implementation of a hub-and-spoke care delivery model for tertiary-integrated complex care services in a Northern Ontario community. Healthc Q. 2018;21(2):35-40. | Implementation of a hub-and-spoke model for children with medical complexities | Not chronic pain |
McNab and Gillespie. Bridging the chronic care gap: HealthOne Mt Druitt, Australia. Int J Integr Care. 2015;15:e015. | Evaluation of hub-and-spoke model for older people with chronic and complex illness | Not chronic pain |
Miele et al. Implementation of the hub and spoke model for opioid use disorders in California: Rationale, design and anticipated impact. Subst Abuse Treat. 2020;108:20-5. | Implementation of the California hub-and-spoke model for opioid use disorders | Not chronic pain |
Medicaid IAP. Collaborative models for medication-assisted treatment: Key elements of Vermont’s Hub-and-Spoke System. 2019 | Description of Vermont hub-and-spoke model for opioid use disorder | Not chronic pain |
Mohlman et al. Impact of medication-assisted treatment for opioid addiction on Medicaid expenditures and health services utilization rates in Vermont. J Subst Abuse Treat. 2016;67:9-14. | Impact of Vermont hub-and-spoke model for opioid use disorder | Not chronic pain |
Parkhurst et al. Extending collaborative care to independent primary care practices: A chronic care model. Clin Pract Ped Psychol. 2022;10(1):32-43. | Development of hub-and-spoke model for pediatric mental health and primary care | Not chronic pain |
Schottenfeld et al. Pain and addiction in specialty and primary care: the bookends of a crisis. J Law Med Ethics. 2018;46(2):220-37. | Narrative review of pain and addiction in specialty and primary care | No relevant outcomes |
Serhal et al. Adapting the consolidated framework for implementation research to create organizational readiness and implementation tools for project ECHO. J Contin Educ Health Prof. 2018;38(2):145. | Development of checklist for organizations before implementing hub-and-spoke models | Not chronic pain |
Shelley et al. ECHO pain curriculum: balancing mandated continuing education with the needs of rural health care practitioners. J Contin Educ Health Prof. 2017;37(3):190-4. | Description of hub-and-spoke model for chronic pain and safe opioid management | No relevant outcomes |
Srivastava et al. Development of a hub and spoke model for quality improvement in rural and urban health care settings in India: a pilot study. BMJ Open Quality. 2020;9(3):e000908. | Development of hub-and-spoke model for quality improvement in health care settings | Not chronic care |
Solutions for Kids in Pain website | No relevant outcomes | |
TAPMI https://tapmipain.ca/ | Toronto Academic Pain Medicine website | No relevant outcomes |
IAP = Innovative Accelerator Program; SKIP = Solution for Kids in Pain; TAPMI = Toronto Academic Pain Medicine.
Note: This table has not been copy-edited.
Appendix 2: Reports of Potential Interest
Note that this appendix has not been copy-edited.
Guideline Documents (and Relevant Information)
Core standards for pain management services in the UK. Second ed. London (UK): Faculty of Pain Medicine of the Royal College of Anaesthetists; 2021: https://fpm.ac.uk/sites/fpm/files/documents/2021-07/FPM-Core-Standards-2021_1.pdf. Accessed 2022 Mar 22.
For specialist pain management services (tier 2 services) in larger geographical areas, a hub-and-spoke model may be a better use of resources than several isolated, smaller centres. [No supporting evidence or further information about hub-and-spoke models provided]
The Pain Management Best Practices Inter-Agency Task Force. Pain Management Best Practices Inter-Agency Task Force: updates, gaps, inconsistencies, and recommendations. Washington (DC): U.S. Department of Health and Human Services; 2019: https://www.hhs.gov/sites/default/files/pain-mgmt-best-practices-draft-final-report-05062019.pdf. Accessed 2022 Mar 30.
Access to psychological interventions: Recommendation 1a. “Increase access to evidence-based psychological interventions including alternative treatment delivery (e.g., telehealth, internet self-management, mobile applications, group sessions, telephone counseling) and hub-and-spoke models.” (p. 45) [No supporting evidence provided]
Provider education: “Chronic Pain and Headache Management TeleECHO (ECHO Pain), with Project ECHO, is a telehealth approach that supports clinicians’ education and training regarding treating patients with chronic pain and safe opioid management.30 The model is based on workplace learning, with cases selected by participants from their patient panels combined with short lectures by experts (referred to as a “hub-and-spoke model”).” (p. 66)
Acknowledgments: Allison Gates
ISSN: 2563-6596
Disclaimer: The information in this document is intended to help Canadian health care decision-makers, health care professionals, health systems leaders, and policy-makers make well-informed decisions and thereby improve the quality of health care services. While patients and others may access this document, the document is made available for informational purposes only and no representations or warranties are made with respect to its fitness for any particular purpose. The information in this document should not be used as a substitute for professional medical advice or as a substitute for the application of clinical judgment in respect of the care of a particular patient or other professional judgment in any decision-making process. The Canadian Agency for Drugs and Technologies in Health (CADTH) does not endorse any information, drugs, therapies, treatments, products, processes, or services.
While care has been taken to ensure that the information prepared by CADTH in this document is accurate, complete, and up-to-date as at the applicable date the material was first published by CADTH, CADTH does not make any guarantees to that effect. CADTH does not guarantee and is not responsible for the quality, currency, propriety, accuracy, or reasonableness of any statements, information, or conclusions contained in any third-party materials used in preparing this document. The views and opinions of third parties published in this document do not necessarily state or reflect those of CADTH.
CADTH is not responsible for any errors, omissions, injury, loss, or damage arising from or relating to the use (or misuse) of any information, statements, or conclusions contained in or implied by the contents of this document or any of the source materials.
This document may contain links to third-party websites. CADTH does not have control over the content of such sites. Use of third-party sites is governed by the third-party website owners’ own terms and conditions set out for such sites. CADTH does not make any guarantee with respect to any information contained on such third-party sites and CADTH is not responsible for any injury, loss, or damage suffered as a result of using such third-party sites. CADTH has no responsibility for the collection, use, and disclosure of personal information by third-party sites.
Subject to the aforementioned limitations, the views expressed herein are those of CADTH and do not necessarily represent the views of Canada’s federal, provincial, or territorial governments or any third party supplier of information.
This document is prepared and intended for use in the context of the Canadian health care system. The use of this document outside of Canada is done so at the user’s own risk.
This disclaimer and any questions or matters of any nature arising from or relating to the content or use (or misuse) of this document will be governed by and interpreted in accordance with the laws of the Province of Ontario and the laws of Canada applicable therein, and all proceedings shall be subject to the exclusive jurisdiction of the courts of the Province of Ontario, Canada.
The copyright and other intellectual property rights in this document are owned by CADTH and its licensors. These rights are protected by the Canadian Copyright Act and other national and international laws and agreements. Users are permitted to make copies of this document for non-commercial purposes only, provided it is not modified when reproduced and appropriate credit is given to CADTH and its licensors.
About CADTH: CADTH is an independent, not-for-profit organization responsible for providing Canada’s health care decision-makers with objective evidence to help make informed decisions about the optimal use of drugs, medical devices, diagnostics, and procedures in our health care system.
Funding: CADTH receives funding from Canada’s federal, provincial, and territorial governments, with the exception of Quebec.