Drugs, Health Technologies, Health Systems
Reimbursement Review
Mirikizumab (Omvoh)
Sponsor: Eli Lilly Canada Inc.
Therapeutic area: Crohn disease
This multi-part report includes:
Clinical Review
Pharmacoeconomic Review
Clinical Review
Abbreviations
AE
adverse event
ANCOVA
analysis of covariance
AP
abdominal pain
BF
biologic failure
BOCF
baseline observation carried forward
CCF
conventional care failure
CD
Crohn disease
CDA-AMC
Canada’s Drug Agency
CDAI
Crohn’s Disease Activity Index
CDHF
Canadian Digestive Health Foundation
CI
confidence interval
CMH
Cochran-Mantel-Haenszel
CrI
credible interval
CRP
C-reactive protein
EIM
extraintestinal manifestation
FACIT-Fatigue
Functional Assessment of Chronic Illness Therapy – Fatigue
FCP
fecal calprotectin
FE
fixed effect
FWER
family-wise type I error rate
GI
gastrointestinal
GRADE
Grading of Recommendations Assessment, Development, and Evaluation
HRQoL
health-related quality of life
IBD
inflammatory bowel disease
IBDQ
Inflammatory Bowel Disease Questionnaire
ICE
intercurrent event
IL
interleukin
ITC
indirect treatment comparison
ITT
intention to treat
LS
least squares
LTE
long-term extension
mBOCF
modified baseline observation carried forward
mITT
modified intention to treat
mNRI
modified nonresponder imputation
NMA
network meta-analysis
NRI
nonresponder imputation
OR
odds ratio
PAS
primary analysis set
PRO
patient-reported outcome
QoL
quality of life
RCT
randomized controlled trial
RE
random effect
SAE
serious adverse event
SC
subcutaneous
SD
standard deviation
SE
standard error
SES-CD
Simple Endoscopic Score for Crohn’s Disease
SF
stool frequency
SLR
systematic literature review
TEAE
treatment-emergent adverse event
TNF
tumour necrosis factor
Executive Summary
An overview of the submission details for the drug under review is provided in Table 1.
Table 1: Background Information on the Application Submitted for Review
Item | Description |
|---|---|
Drug product | Mirikizumab (Omvoh), 300 mg/15 mL, solution for IV infusion after dilution in a vial Mirikizumab (Omvoh), 100 mg/1 mL, 200 mg/2 mL, solution for SC injection in a prefilled pen or syringe |
Sponsor | Eli Lilly Canada Inc. |
Indication | For the treatment of adult patients with moderately to severely active CD who have had an inadequate response, loss of response, or intolerance to conventional therapy or a biologic treatment |
Reimbursement request | As per indication |
Health Canada approval status | NOC |
Health Canada review pathway | Standard |
NOC date | July 8, 2025 |
Recommended dose | Induction:
Maintenance:
|
CD = Crohn disease; NOC = Notice of Compliance; SC = subcutaneous.
Introduction
Crohn disease (CD) is an idiopathic form of inflammatory bowel disease (IBD). It is characterized by chronic relapsing and remitting transmural (i.e., affecting all tissue layers of the gut wall) inflammation that is usually segmental and asymmetric.1,2 Signs and symptoms associated with CD vary from patient to patient, but the hallmark symptoms include abdominal pain (AP), persistent diarrhea, and fatigue.3 Individuals also experience rectal bleeding, fever, bowel urgency, a sensation of incomplete bowel evacuation, constipation, loss of appetite, weight loss, anemia, and low energy.4 Repeated cycles of intestinal inflammation that persist even in periods of quiescence may lead to the development of strictures and complications of penetrating disease, such as fistulas and abscesses that may require surgery.5,6 Up to 75% of patients with CD may require surgery at some point in their lives.5 Furthermore, a substantial number may need repeat surgery, with the 5-year and 10-year risks of second surgery estimated at 24.2% and 35.0%, respectively.7 The chronic and progressive nature of the disease can have a debilitating effect on an individual’s social, educational, professional, and family activities.1 Furthermore, the psychological and emotional well-being of patients with CD is negatively affected.8
Canada has 1 of the highest prevalence and incidence rates of IBD in the world.9 The prevalence of IBD in 2023 was estimated to be 825 per 100,000, of which 410 per 100,000 represented people living with CD.10 The incidence of IBD was estimated to be 30 per 100,000 people in Canada in 2023, with an incidence of 12.2 per 100,000 for CD.11 Disease severity is commonly classified using the Crohn’s Disease Activity Index (CDAI) and Harvey-Bradshaw Index.12 A CDAI score of 220 to 450 is considered to represent moderate to severe CD.12 A diagnosis typically involves the presentation of signs and symptoms (e.g., right lower quadrant AP, chronic intermittent diarrhea, fatigue, weight loss), laboratory tests (e.g., for anemia, vitamin B12 or vitamin D deficiency, stool assessments, C-reactive protein [CRP]), endoscopic procedures (e.g., ileocolonoscopy), histologic or biochemical testing, and advanced imaging (MRI or CT scan).4,13,14 Symptoms can fluctuate over time and are often misdiagnosed as IBD.15 The initial laboratory investigations for CD, including blood tests and stool tests (fecal calprotectin [FCP]) are widely available and conducted across Canada. However, methods to establish a diagnosis of CD, including endoscopic and imaging techniques, may be available only at larger clinical centres and hospitals.16
Currently, there are no curative treatments for CD. Thus, management consists of induction and maintenance phases of therapies to achieve and maintain control of the symptoms that arise from an overly active intestinal immune system.15,17 However, treatment goals have evolved toward achieving endoscopic and mucosal healing.18 According to clinical experts consulted by Canada’s Drug Agency (CDA-AMC), the short- to intermediate-term goals of treatment for CD include induction of clinical response and remission, improved quality of life (QoL), reduction of corticosteroid use, and normalization of inflammatory biomarkers (e.g., FCP and CRP). The clinical experts stated that the long-term goals of treatment for CD include achievement of endoscopic remission, maintenance of corticosteroid-free remission, prevention of disease progression, mucosal and transmural healing, and reduction of CD-related hospitalizations and surgeries. The treatment of CD is individualized based on disease location, extent, phenotype, and severity.3 The major categories of pharmacotherapies used to treat CD include conventional therapies, biologic therapies, and oral small-molecule drugs. Conventional therapies include corticosteroids, 5-aminosalicylic acid, and immunomodulators. Although typically used as first-line treatment for mild to moderate CD, the use of conventional therapies is not recommended in CD treatment guidelines due to the limited efficacy of these. Biologic therapies for CD include tumour necrosis factor (TNF)-alpha antagonists, integrin inhibitors, interleukin (IL)-12/IL-23 inhibitors, and IL-23 inhibitors. The clinical experts consulted by CDA-AMC noted that biologic therapies are increasingly used as first, second, or later lines of therapy for moderately to severely active CD. Upadacitinib, a small-molecule therapy, was the first oral therapy to be approved for the treatment of CD in patients who have experienced inadequate response, loss of response, or intolerance to conventional therapies or biologics.19 Despite advancements in treatments for CD, the clinical experts consulted by CDA-AMC noted several unmet needs related to current treatments, such as patients’ inability to achieve or sustain clinical response and remission as well as primary nonresponse or secondary loss of response. The clinical experts also noted that treatment decisions and adherence are often affected by long-term safety concerns and tolerability issues related to administration. Other unmet needs highlighted by the clinical experts related to the inadequacy of existing treatments for CD in addressing symptoms (e.g., fatigue, pain, and those related to mental health) and the paucity of evidence for CD treatments among certain populations (e.g., those who are pregnant, pediatric, older, or have postoperative recurrence).
The objective of this report is to review and critically appraise the evidence submitted by the sponsor on the beneficial and harmful effects of mirikizumab 300 mg/15 mL solution for IV infusion after dilution in a vial — as well as 100 mg/1 mL and 200 mg/2 mL solution in a prefilled pen or syringe for SC injection — for the treatment of adult patients with moderately to severely active CD who have experienced an inadequate response, loss of response, or intolerance to conventional therapy or a biologic treatment.
Mirikizumab was previously reviewed by CDA-AMC. On November 16, 2023, a recommendation for reimbursement was issued for mirikizumab for the treatment of adult patients with moderately to severely active ulcerative colitis who have experienced an inadequate response, loss of response, or intolerance to conventional therapy, a biologic treatment, or a Janus kinase inhibitor.
Perspectives of Patient, Clinicians, and Drug Programs
The information in this section is a summary of the input provided by the patient and clinician groups who responded to our call for input and from the clinical experts consulted for the purpose of this review.
Patient Input
Three patient groups — the Canadian Digestive Health Foundation (CDHF), Crohn’s and Colitis Canada, and the Gastrointestinal Society — provided input for this submission. CDHF’s mission is to reduce suffering and improve QoL by empowering individuals to manage their digestive health with confidence and optimism. Information was gathered from CDHF’s experience with patients with IBD, through feedback on surveys, and from social media campaigns. The Gastrointestinal Society is committed to improving the lives of people with gastrointestinal (GI) and liver conditions, supporting research, advocating for appropriate patient access to health care, and promoting GI and liver health. Information for this submission was gathered primarily through interviews, which included a round table with gastroenterologists, patients, and patient groups, and through phone, email, or social media interactions with patients living with IBD. Several surveys conducted from 2015 to 2024 collected information about the unmet needs of individuals living with IBD, opinions on biologics and biosimilars, and the details of patient journeys. Crohn and Colitis Canada is a national, volunteer-based health charity focused on finding cures for CD and ulcerative colitis and improving the lives of children and adults affected by these diseases. Information for this submission was drawn from a Crohn’s and Colitis Canada 2023 report to understand the impact of IBD in Canada. In 2022, Crohn’s and Colitis Canada conducted an online survey to better understand patients’ unmet needs and priorities. Among the 1,706 respondents were patients with CD or ulcerative colitis and their caregivers; a subset of 687 respondents had moderate to severe CD. No respondents in either patient group had experience with mirikizumab.
The Gastrointestinal Society highlighted how CD affects a person in every aspect of life — physically, emotionally, and socially, whether at home, at school, or in the workplace. This patient advocacy group also highlighted the unique challenges faced by children and young adults, as the disease can influence their sense of self and identity. Patients noted several concerns, including unpredictable flares, hopelessness, no improvements with current treatments, mental health issues, mortality, and bowel urgency. The CDHF noted that 60% to 74% of patients with CD experience bowel urgency, with 25% to 50% of patients experiencing it at least once daily. This patient group highlighted that the burden of fecal urgency on patients’ lives is underestimated, with ramifications ranging from disrupted daily activities and social interactions to emotional distress, with resultant impairment in QoL.
Patient groups noted that treatment for CD can involve a combination of medications, including biosimilars, corticosteroids, amino salicylates, biologics, antibiotics, Janus kinase inhibitors, and immunomodulators. The CDHF and Gastrointestinal Society further noted that symptom management includes lifestyle adjustments and, in some cases, surgical interventions (i.e., bowel resection). Some benefits of these treatments include symptom control, remission maintenance, reduced dependence on corticosteroids, and the availability of different drug classes that allow for a more tailored treatment plan based on the patients’ needs. In the 2022 survey by Crohn’s and Colitis Canada, almost all respondents (93%) agreed they took systemic steroids only if needed, with more than 81% of respondents reporting side effects from taking them. More than half of the respondents agreed that using systemic steroids was a burden in managing their IBD. The CDHF underscored ongoing challenges with current treatments, including side effects, limited access due to high costs, insurance gaps, and logistical barriers. This patient advocacy group also emphasized the significant psychosocial impact and diminished QoL that many patients continue to face.
The Gastrointestinal Society noted that patients with IBD have difficulty obtaining remission or adequate symptom relief. Its 2020 survey indicated that 33% of the respondents did not believe their IBD was well-controlled by their current medications. In another 2024 survey, 29% of respondents believed their IBD was not well-controlled, 38% found it well-controlled, and 33% were unsure. At least 82% of respondents were at least somewhat concerned about running out of treatment options. In 1 survey, 63% of respondents reported symptom reduction on biologics, and 23% reported confirmed remission. The Gastrointestinal Society and CDHF patient groups highlighted that each person living with IBD has a different experience; a treatment that works for 1 person may not be tolerated by another.
The CDHF noted that important outcomes include providing treatment options to improve and control burdensome symptoms and reducing the feeling of bowel urgency. In addition, the Gastrointestinal Society noted that in terms of outcomes, access to medications that work, improved QoL, and sustained remission and/or treatment response are more important than relieving any single symptom. Further, Crohn’s and Colitis Canada noted that understanding the long-term risks of IBD medications and minimizing the use of steroids were important considerations. The organization also noted that respondents preferred to receive their treatment as pills (63%), self-injections at home (40%), or through IV (31%).
Clinician Input
Input From Clinical Experts Consulted for This Review
Both of the clinical experts consulted by CDA-AMC indicated that there are no curative treatments available for CD. They noted that despite advancements, several unmet needs remain. For example, with currently available treatments, patients may not achieve or sustain clinical response and remission, and they may face primary nonresponse or secondary loss of response as well as long-term safety concerns and tolerability issues related to administration. The clinical experts noted the inadequacy of existing treatments for CD in addressing symptoms as well as the paucity of evidence for treatments for CD among certain populations (e.g., patients who are pregnant, pediatric, older, or have postoperative recurrence).
The clinical experts consulted by CDA-AMC noted that mirikizumab would be most suitable for patients who are biologic-naive; these patients are less challenging to treat than patients with longer disease duration, those who have experienced biologic failure (BF), or those who have other challenging disease characteristics, such as perianal disease activity. However, the clinical experts indicated that they did not expect the introduction of mirikizumab to shift the treatment paradigm for moderately to severely active CD in clinical practice in Canada, considering the other available treatment options. The clinical experts agreed that although mirikizumab may represent an additional treatment option, it would not be used in a similar manner to, or ahead of, other available therapies for CD (e.g., anti-TNF drugs, vedolizumab, ustekinumab, risankizumab, and upadacitinib). They noted that mirikizumab has the same mechanism of action as other anti–IL-23 drugs for CD, such as risankizumab, which would be clinicians’ preferred first-line option. The clinical experts consulted by CDA-AMC indicated that response to mirikizumab in clinical practice would be determined by improvement in symptoms, elimination of corticosteroid dependence, normalization of biomarker levels, and improvement in endoscopic outcomes. The clinical experts consulted by CDA-AMC agreed that patients should discontinue treatment with mirikizumab if they did not show clinical and/or biochemical response by week 12 after the induction treatment period. The clinical experts consulted by CDA-AMC agreed that a patient who exhibits any clinical benefit during the induction period (e.g., a partial clinical response [significant improvement in symptoms and/or in CRP and/or FCP biomarkers]) may benefit from an additional 12 weeks of mirikizumab treatment. However, if patients do not show improvement by week 24, mirikizumab should be discontinued. They also agreed that treatment with mirikizumab should be discontinued for patients who exhibit continued dependence on corticosteroids or upon the occurrence of intolerable side effects. The experts noted that treatment with mirikizumab should be discontinued among patients who do not achieve clinical or biomarker remission by 24 weeks or who experience disease progression, indicated by a need for surgery or hospitalization. They indicated that treatment with mirikizumab should be prescribed and monitored by a specialist trained in the diagnosis and management of CD and/or IBD, which may include gastroenterologists, internal medicine specialists with a special interest in IBD, or general or colorectal surgeons. The clinical experts agreed that mirikizumab should be administered in settings with infrastructure and experience in the infusion of biologic therapies. These settings may include hospitals, specialty clinics, infusion centres, community clinics, and outpatient clinics.
Clinician Group Input
No clinician groups provided input for this submission.
Drug Program Input
Input was obtained from the drug programs that participate in the reimbursement review process. The following were identified as key factors that could potentially affect the implementation of a recommendation for mirikizumab:
relevant comparators
considerations for initiation of therapy
considerations for continuation or renewal of therapy
considerations for prescribing of therapy
care provision issues
system and economic issues.
The clinical experts consulted by CDA-AMC provided advice on the potential implementation issues raised by the drug programs. Please refer to Table 5 for more details.
Clinical Evidence
Systematic Review
Description of Studies
One pivotal, phase III, multicentre, randomized, double-blind, placebo- and active-controlled, treat-through, randomized controlled trial (RCT), the VIVID-1 study, evaluated the efficacy and safety of mirikizumab (n = 579) compared with placebo (n = 199) and ustekinumab (n = 287) in patients with moderately to severely active CD. Patients were required to have moderately to severely active CD, which was defined as an unweighted daily average stool frequency (SF) score of 4 or higher (i.e., loose and watery stools, defined as Bristol stool scale category 6 or 7), and/or an unweighted daily average AP score of 2 or higher at baseline. Moreover, patients were required to have a Simple Endoscopic Score for Crohn’s Disease (SES-CD) score of 7 or higher (in patients with ileal-colonic CD) or 4 or higher (in patients with isolated ileal disease) within 21 days before randomization. Patients were also required to have experienced a previous inadequate response to, loss of response to, or intolerance to at least 1 of corticosteroids, immunomodulators, or approved biologic therapies for CD. Randomization was stratified by having experienced BF, baseline corticosteroid use, baseline SES-CD total score, region, and a combined stratification factor using either a baseline SF score of 7 or more and/or a baseline AP score of 2.5 or more.
One pivotal RCT (the VIVID-1 study) was included in the systematic review. The VIVID-1 trial evaluated the efficacy and safety of mirikizumab in patients with moderately to severely active CD. Its coprimary objectives were to evaluate the superiority of the efficacy of mirikizumab compared to placebo as assessed by the following 2 composites: clinical response measured by patient reported outcome (PRO) (which pertains to 2 of the patient-reported items of the Crohn’s Disease Activity Index [CDAI], at least a 30% decrease in stool frequency and/or abdominal pain with neither score worse than baseline) (PRO clinical response) at week 12 plus endoscopic response at week 52 (defined as a 50% or greater reduction from baseline in SES-CD total score) (SES-CD endoscopic response) and PRO clinical response at week 12 plus clinical remission measured by CDAI score (CDAI clinical remission) at week 52. The major secondary objectives, which assessed the efficacy of mirikizumab compared with placebo and were of interest to the review, included the following single end points: endoscopic response assessed at week 12 and week 52; CDAI clinical remission at week 12 and week 52; SES-CD endoscopic remission at week 12; PRO clinical response at week 12; and change in Functional Assessment of Chronic Illness Therapy – Fatigue (FACIT-Fatigue) score from baseline to week 12. The major secondary objectives also included the following 3 composite end points: PRO clinical response at week 12 and PRO clinical remission at week 52; PRO clinical response at week 12 and endoscopic remission at week 52; and PRO clinical response at week 12, corticosteroid-free status from week 40 to week 52, and CDAI clinical remission at week 52. The major secondary end points comparing the efficacy of mirikizumab to ustekinumab were the 2 single end points of SES-CD endoscopic response at week 52 for superiority and CDAI clinical remission at week 52 as a noninferiority end point. The efficacy outcomes were analyzed among the primary analysis set (PAS).
The baseline characteristics were well-balanced between the treatment groups. The mean ages of patients receiving mirikizumab, placebo, and ustekinumab were 36.0 years (standard deviation [SD] = 13.22 years), 36.3 years (SD = 12.71 years), and 36.6 years (SD = 12.72 years), respectively. Most of the study patients were male (55.1% male, 44.9% female) and white (71.7%). Among patients in the PAS, 25.1% were Asian, 2.2% were Black, 0.6% were American Indian or Alaska Native, and 0.4% identified as having multiple races. Most patients were from Europe and regions outside Asia and the Americas (55.5%). The treatment arms were well-balanced in terms of disease location site, with most patients reporting that both the ileum and colon were the most affected (49.8%). Moreover, patients across the 3 treatment groups had similar mean SES-CD scores (i.e., 13.5 for mirikizumab compared with 13.1 for placebo compared with 13.9 for ustekinumab), AP scores (2.1 for all treatment groups), and SF scores (5.7 for the mirikizumab and ustekinumab groups compared with 5.8 for the placebo group). Corticosteroid use at baseline was similar across the 3 treatment groups. However, a smaller proportion of patients in the mirikizumab group reported the use of immunomodulators at baseline (25.2%) compared to the placebo group (29.1%) and the ustekinumab group (30.3%). Moreover, a smaller proportion of patients in the placebo group reported the use of oral amino salicylates at baseline (█████) compared to the mirikizumab group (█████) and the ustekinumab group (█████).
Efficacy Results
At the time of the data cut-off date (August 23, 2023), the predefined success criteria for superiority based on all coprimary and major secondary end points comparing mirikizumab and placebo were met. The predefined success criteria for noninferiority based on CDAI clinical remission at week 52 for mirikizumab compared with ustekinumab was met. However, the criteria for superiority based on SES-CD endoscopic response at week 52 for mirikizumab compared with ustekinumab was not met.
PRO Clinical Response at Week 12 and SES-CD Endoscopic Response at Week 52
The proportion of patients who achieved PRO clinical response at week 12 and SES-CD endoscopic response at week 52 favoured the mirikizumab group (38.0%) over the placebo group (9.0%) (common risk difference = 28.7%; 99.5% confidence interval [CI], 20.6 to 36.8; P < 0.000001). Results from the planned sensitivity and subgroup analyses of PRO clinical response at week 12 and SES-CD endoscopic response at week 52 showed that point estimates favoured mirikizumab, which was consistent with the results of the primary analysis.
The proportions of patients who achieved PRO clinical response at week 12 and SES-CD endoscopic response at week 52 were 38.0% in the mirikizumab group and 37.3% in the ustekinumab group (common risk difference = 0.9%; 99.5% CI, −8.9 to 10.7; P = 0.795057).
PRO Clinical Response at Week 12 and CDAI Clinical Remission at Week 52
The proportion of patients who achieved PRO clinical response at week 12 and CDAI clinical remission at week 52 favoured the mirikizumab group (45.4%) compared with the placebo group (19.6%) (common risk difference = 25.8%; 99.5% CI, 15.9 to 35.6; P < 0.000001). Results from the planned sensitivity and subgroup analyses of PRO clinical response at week 12 and CDAI clinical remission at week 52 showed that the point estimates favoured mirikizumab, which was consistent with the results of the primary analysis.
The proportions of patients who achieved PRO clinical response at week 12 and CDAI clinical remission at week 52 were 45.4% in the mirikizumab group and 40.8% in the ustekinumab group (common risk difference = 4.6%; 99.5% CI, −5.4 to 14.7; P = 0.193027).
PRO Clinical Response at Week 12 and Week 52
The proportion of patients who achieved PRO clinical response at week 12 favoured the mirikizumab group (70.6%) compared with the placebo group (51.8%) (common risk difference = 18.9%; 99.5% CI, 7.5 to 30.3; P = 0.000001). At week 52, the proportion of patients who achieved PRO clinical response continued to favour the mirikizumab group (█████) compared with the placebo group (█████) (common risk difference = ████ [█████ CI, ████ ██ ████; P ████████).
The proportions of patients who achieved PRO clinical response at week 12 were 70.6% in the mirikizumab group and █████ in the ustekinumab group (common risk difference = █████████ CI, █████ ██ ███; P ████████). At week 52, the proportions of patients who achieved PRO clinical response were █████ in the mirikizumab group compared with █████ in the ustekinumab group (common risk difference = ████████ CI, ████ ██ ████; P = ████████).
CDAI Clinical Remission at Week 12 and Week 52
At week 12, the proportion of patients who achieved CDAI clinical remission favoured the mirikizumab group (37.7%) over the placebo group (25.1%) (common risk difference = 12.4%; 99.5% CI, 2.2 to 22.7; P = 0.001431). At week 52, the proportions of patients who achieved CDAI clinical remission continued to favour the mirikizumab group (54.1%) over the placebo group (19.6%) (common risk difference = 34.6%; 99.5% CI, 24.7 to 44.4; P < 0.000001).
At week 12, the proportions of patients achieving CDAI clinical remission were 37.7% in the mirikizumab and █████ in the ustekinumab group (common risk difference = ████████ CI, ████ ██ ████; P = ████████).
CDAI clinical remission was assessed for noninferiority of mirikizumab compared with ustekinumab at week 52. At week 52, 54.1% of patients receiving mirikizumab achieved CDAI clinical remission compared with 48.4% of patients who received ustekinumab, and mirikizumab was noninferior to ustekinumab (common risk difference = 5.7%; 95% CI, −1.4 to 12.8; P for noninferiority < 0.0001; superiority = ████████).
CDAI Corticosteroid-Free Clinical Remission at Week 52
At week 52, the proportion of patients who achieved CDAI corticosteroid-free clinical remission was 51.8% in the mirikizumab group compared with █████ in the placebo group (common risk difference for mirikizumab versus placebo = █████ [█████ CI, ████ ██ ████; P ████████) and 45.6% in the ustekinumab group (common risk difference for mirikizumab versus ustekinumab = 6.3%; 99.5% CI, −3.8 to 16.4; P = 0.082319).
SES-CD Endoscopic Response at Week 12 and Week 52
At week 12, the proportion of patients who achieved SES-CD endoscopic response was 32.5% in the mirikizumab group compared with the 12.6% in the placebo group (common risk difference = 19.7%; 99.5% CI, 11.1 to 28.2; P < 0.000001) and █████ in the ustekinumab group (common risk difference = ████ [█████ CI, ████ ██ ███; P = ████████).
At week 52, the proportion of patients who achieved SES-CD endoscopic response continued to favour the mirikizumab group (48.4%) over the placebo group (9.0%) (common risk difference = 39.1%; 99.5% CI, 31.0 to 47.2; P < 0.000001).
At week 52, the proportions of patients who achieved SES-CD endoscopic response were 48.4% in the mirikizumab group and 46.3% in the ustekinumab group (common risk difference = 2.3%; 95% CI, −4.7 to 9.3; P = 0.513623).
SES-CD Endoscopic Remission at Week 12 and Week 52
At week 12, the proportion of patients who achieved SES-CD endoscopic remission favoured the mirikizumab group (10.9%) over the placebo group (4.0%) (common risk difference = 6.8%; 99.5% CI, 1.6 to 12.1; P = 0.003414). At week 52, the proportion of patients who achieved SES-CD endoscopic remission continued to favour the mirikizumab group (19.0%) compared to the placebo (████) (common risk difference = █████; █████ CI, ████ ██ ████; P ████████).
At week 12, the proportions of patients who achieved SES-CD endoscopic remission were 10.9% in the mirikizumab group and ████ in the ustekinumab group (common risk difference = ████;█████ CI, ████ ██ ███; P = ████████). At week 52, the proportions of patients who achieved SES-CD endoscopic remission were 19.0% in the mirikizumab group and 18.1% in the ustekinumab group (common risk difference = 0.9%; 99.5% CI, −6.9 to 8.7; P = 0.745430).
PRO Clinical Response at Week 12 and SES-CD Endoscopic Remission at Week 52
The proportions of patients who achieved PRO clinical response at week 12 and SES-CD endoscopic remission at week 52 were 15.9% in the mirikizumab group compared with 2.0% in the placebo group (common risk difference = 13.8%; 99.5% CI, 8.7 to 18.9; P < 0.000001) and █████ in the ustekinumab group (common risk difference = ████; █████ CI, ████ ██ ███; P = ████████).
PRO Clinical Response at Week 12 and Corticosteroid-Free Status From Week 40 to Week 52 and CDAI Clinical Remission at Week 52
The proportion of patients who achieved PRO clinical response at week 12, remained corticosteroid-free from week 40 to week 52, and achieved CDAI clinical remission was 43.7% in the mirikizumab group compared with 18.6% in the placebo group (common risk difference = █████ [█████ CI, ████ ██ ████; P ████████) and █████ in the ustekinumab group (common risk difference = ████ [█████ CI, ████ to ████; P = ████████).
Change From Baseline in the Irritable Bowel Disease Questionnaire at Week 12 and Week 52
At week 12, patients in the mirikizumab treatment group had a larger improvement in Irritable Bowel Disease Questionnaire (IBDQ) score from baseline (least squares [LS] mean change from baseline = 36.89; standard error [SE] = 1.245) compared to patients in the placebo group (LS mean change from baseline = 17.39; SE = 2.113) (LS mean difference for mirikizumab compared with placebo = 19.50; 95% CI, 14.71 to 24.29; P < 0.000001). At week 52, patients in the mirikizumab treatment group continued to have a larger improvement in IBDQ score from baseline (LS mean = 43.82; SE: 1.365) compared to patients in the placebo group (LS mean = 15.90; SE: 2.316) (LS mean difference for mirikizumab compared with placebo = 27.92; 95% CI, 22.67 to 33.18; P < 0.000001).
At week 12, improvements in IBDQ score from baseline were observed in the mirikizumab group (LS mean change from baseline = 36.89; SE: 1.245) and the ustekinumab group (LS mean change from baseline = █████; SE = █████) (LS mean difference for mirikizumab versus ustekinumab = −0.32; 95% CI, −4.52 to 3.88; P = 0.880867). At week 52, improvements from baseline were observed in the mirikizumab group (LS mean = 43.82; SE = 1.365) and the ustekinumab group (LS mean = █████; SE = █████) (LS mean difference for mirikizumab compared with ustekinumab = ████ [███ ███ █████ ██ ████; P = ████████).
Harms Results
During the overall treatment period, 78.6% of patients who received mirikizumab reported at least 1 treatment-emergent adverse event (TEAE); TEAEs were reported for 73.0% of patients who received placebo and 77.3% of patients who received ustekinumab. At least 1 serious adverse event (SAE) was reported in 10.3% of patients who received mirikizumab, 17.1% of patients who received placebo, and 10.7% of patients who received ustekinumab. During the overall treatment period, 5.1% of patients who received mirikizumab withdrew from treatment due to adverse events (AEs); withdrawals due to AEs were reported for 9.5% of patients who received placebo and 2.6% of patients who received ustekinumab. During the overall treatment period, 2 deaths were reported; of these, 1 pertained to a patient receiving placebo and 1 to a patient receiving ustekinumab.
According to the product monograph for mirikizumab and the clinical experts consulted by CDA-AMC, the notable harms defined for this review included infections, infusion- and injection-site reactions, hepatic events, depression, suicidal ideation, immediate and nonimmediate hypersensitivity reactions, cerebrocardiovascular events, and malignancies. During the overall treatment period, rates of infection were similar between the mirikizumab group (41.4%) and ustekinumab group (42.1%); however, the infection rate was lower for the placebo group (34.6%). Compared to placebo and ustekinumab, the following notable harms were observed: injection-site reactions (10.8% for the mirikizumab group compared to 6.5% for the placebo group and 5.8% for the ustekinumab group), hepatic events (6.2% for the mirikizumab group compared to 4.3% for the placebo group and 2.6% for the ustekinumab group), immediate hypersensitivity reactions (3.8% for the mirikizumab group compared to 2.4% for the placebo group and 2.3% for the ustekinumab group), and nonimmediate hypersensitivity reactions (7.9% for the mirikizumab group compared to 5.2% for the placebo group and 5.8% for the ustekinumab group). Suicidal ideation was reported for 2 patients receiving mirikizumab and for 0 patients in the placebo and ustekinumab groups. Rates of depression, cerebrocardiovascular events, and malignancies remained low and similar across the 3 treatment groups.
Critical Appraisal
Notable strengths of the VIVID-1 trial included its blinding of patients, study investigators, and study site personnel, as well as the use of a double-dummy design to maintain blinding of treatment throughout the study. The VIVID-1 trial was designed as a treat-through study in which patients remained on their assigned treatment beyond the initial induction phase without rerandomization. Moreover, there were no concerns with the randomization process, and the clinical experts consulted by CDA-AMC agreed that the stratification factors used for randomization were appropriate. The baseline characteristics were generally well-balanced across the 3 treatment groups, supporting the success of the randomization procedure. Although minor differences in certain characteristics were noted among the 3 treatment groups, the clinical experts consulted by CDA-AMC agreed that these would have little impact on the interpretation of the results. Clinical remission based on the CDAI at week 52 was assessed for noninferiority between the mirikizumab and ustekinumab groups according to a 10% noninferiority margin, which was selected based on statistical and clinical considerations and according to global regulatory guidance.20,21 The clinical experts consulted by CDA-AMC agreed that the use of a margin of 10% was adequate for performing a noninferiority analysis for a clinical trial in CD. The use of a PAS for the primary analyses deviates from the preferred approach of using the intention-to-treat (ITT) population for efficacy analyses. However, given the consistency of the results across the PAS and modified ITT populations and the minor differences in the sample sizes of the ITT and modified intention-to-treat (mITT) population, the use of the PAS was unlikely to introduce bias in the results. In the VIVID-1 trial, higher discontinuation rates in the placebo group were attributed to AEs, lack of efficacy, and patient withdrawal. To address intercurrent events (ICEs) that could lead to missing end point data for the coprimary and binary end points, the VIVID-1 trial implemented a composite strategy whereby ICEs defined for the study included discontinuation of study treatment before the time point of interest. The strategy to handle ICEs in the VIVID-1 trial was deemed appropriate by the CDA-AMC team, given that the use of nonresponder imputation (NRI) to handle missing data in primary analyses is generally considered to be acceptable by regulatory agencies.22,23
Similarly, the analysis for the LS mean change in IBDQ from baseline to week 52 imputed patients with missing data based on the modified baseline observation carried forward (mBOCF) approach, which was deemed appropriate by the CDA-AMC team. Of note, there remains potential for bias in the results if reasons for study discontinuation are not clearly related to lack of efficacy. Although most study discontinuations were attributed to lack of efficacy and AEs, there was a higher rate of study discontinuation due to withdrawal by patient among the placebo group compared with the mirikizumab and ustekinumab groups. However, although this imbalance may bias the results in favour of mirikizumab, the review team deemed that the potential for bias is small. After accounting for ICEs, the rates of data missing sporadically for reasons unrelated to ICE were low (i.e., less than 5%) for the coprimary end points, most major secondary end points, and the LS mean change in IBDQ. Data missing sporadically for reasons unrelated to ICE were imputed based on NRI. Although this approach relies on assumptions about the missing data that cannot be verified, the CDA-AMC review team considered it appropriate for most end points, given that the proportions of missing data were small. However, higher rates of missing data were noted for endoscopic response and remission as measured by the SES-CD at week 12 (████ for mirikizumab; █████ for placebo; and ████ for ustekinumab), which may increase the risk of bias when interpreting the results for those outcomes. However, the direction and magnitude of this risk is unknown. Of note, results of the sensitivity analyses performed for the coprimary end points, including a tipping-point analysis and the use of modified nonresponder imputation (mNRI) imputation, were consistent with those of the primary analysis. The clinical experts consulted by CDA-AMC indicated that the coprimary and major secondary outcomes measured in the VIVID-1 trial were relevant to clinical practice. These outcomes were included in a multiplicity-adjusted testing scheme. Patients who received placebo and were considered nonresponders at week 12 went on to receive treatment with mirikizumab until the end of the study; the CDA-AMC review teams determined that the treatment switch among nonresponders to mirikizumab at week 12 was not expected to significantly affect the interpretation of the results. The VIVID-1 trial measured several PROs, including CDAI clinical remission, PRO clinical response, and the IBDQ questionnaire. The data for these outcomes were collected from patient- and physician-reported questionnaires; these may be subject to performance bias if patients or physicians became unblinded. However, the double-blind study design mitigated the potential for bias to be introduced in the results. The subgroup analyses for coprimary and major secondary end points for prior therapy, baseline medication, and baseline demographic and disease characteristics showed results that were consistent overall with those of the primary analyses; however, these were not adjusted for multiplicity and should be interpreted as supportive evidence.
The use of an induction and maintenance treatment phase in the VIVID-1 trial was aligned with phases of treatment for CD administered in clinical practice. The clinical experts consulted by CDA-AMC agreed that the 12-week induction period used in the trial is comparable to the induction periods used in other trials for CD and reflects the expected time frame for observing a clinical response after treatment with mirikizumab in clinical practice. The VIVID-1 trial did not include rescue therapy for patients who were assigned to mirikizumab or ustekinumab, whereas patients who were classified as nonresponders to placebo at 12 weeks received treatment with mirikizumab for the remainder of the study. One clinical expert indicated that rescue therapy for CD-related flares could include either a short course of corticosteroid tapering or a dose escalation of existing biologic therapy. The clinical experts consulted by CDA-AMC did not cite major concerns with these differences in terms of the generalizability of the trial results to clinical practice in Canada. The clinical experts consulted by CDA-AMC agreed that the eligibility criteria of the VIVID-1 trial are aligned with those of other trials for CD therapies, although they noted that the criteria were not entirely reflective of patients in clinical practice. For instance, the clinical experts agreed that many patients in clinical practice would be excluded from the VIVID-1 trial, such as those who plan to get pregnant and those with an ostomy, a high risk of infection, or liver enzyme abnormalities. The clinical experts also indicated that patients with disease isolated to the ileum were underrepresented in the VIVID-1 trial compared to their representation in clinical practice in Canada and previous CD trials.24,25 The experts further noted that ileum-isolated disease was more difficult to treat and was expected to lead to poorer treatment outcomes (especially in terms of endoscopic response and endoscopic remission rates) compared to disease affecting other areas of the GI tract. The clinical experts consulted by CDA-AMC also agreed that the proportions of patients for whom anti-TNF drugs or 2 or more biologic therapies had failed were lower than what is more commonly seen in drug-exposed populations in clinical practice and what has been seen in previous CD trials.24,25 The clinical experts consulted by CDA-AMC also agreed that the patient population of the VIVID-1 trial appeared to have a lower endoscopic disease burden overall (as represented by a slightly lower mean SES-CD score of 13.1 [SD = 6.0] to 13.9 [SD = 6.6] across treatment groups in the VIVID- trial) compared to patient populations observed in previous CD trials24,25 and in clinical practice. The mean baseline SES-CD scores for evidence for risankizumab ranged from 14.0 (SD = 7.1) to 14.8 (SD = 7.8) in the ADVANCE and MOTIVATE trials, respectively. The baseline mean SES-CD scores for evidence from upadacitinib ranged from 13.6 (SD = 7.0) to 15.8 (SD = 7.6) across the U-EXCEL, U-EXCEED, and U-ENDURE trials. Based on these factors, the clinical experts consulted by CDA-AMC suggested that patients in the VIVID-1 trial may have had a more moderate severity of CD compared to patient populations with moderately to severely active CD in previous CD trials and clinical practice.
The VIVID-1 trial assessed the efficacy and safety of mirikizumab compared to placebo and ustekinumab. The latter has previously been used as an active comparator in other trials for CD. The sponsor noted that ustekinumab was the only available therapy with an IL-23 inhibition mechanism of action at the time of the initiation of the VIVID-1 trial. The dose of ustekinumab administered in the trial was aligned with the dose recommended in the Health Canada product monograph.26 Although the clinical experts consulted by CDA-AMC agreed that ustekinumab was part of the treatment landscape for CD in Canada, they indicated that ustekinumab is less commonly used to treat CD than are risankizumab, upadacitinib, and anti-TNF drugs. Because the VIVID-1 trial did not compare mirikizumab with other relevant comparators for CD, the stand-alone results of the trial may not provide a full assessment of the efficacy and safety of mirikizumab compared to existing treatments for CD in clinical practice in Canada. The VIVID-1 trial measured outcomes that were relevant to patients and clinicians. Notably, the clinical experts indicated that endoscopic response and remission were the most important outcomes related to the treatment of CD, citing that these provided the most reliable measures of disease activity and drug performance. The clinical experts consulted by CDA-AMC indicated that, although QoL measures related to CD are important for patients, these are not routinely measured in clinical practice. They agreed that improvements related to QoL (e.g., fatigue, depression, and fatigue) would naturally result from improvements in endoscopic outcomes. The clinical experts consulted by CDA-AMC also agreed that the incidence of injection-site reactions was an important safety outcome related to the administration of mirikizumab due to the frequency of the injections required for treatment and the resulting impact on overall patient experience.
GRADE Summary of Findings and Certainty of the Evidence
For the pivotal studies and RCTs identified in the sponsor’s systematic review, Grading of Recommendations Assessment, Development, and Evaluation (GRADE) was used to assess the certainty of the evidence for the outcomes considered most relevant to inform the expert committee deliberations, and a final certainty rating was determined as outlined by the GRADE Working Group.27,28
The selection of outcomes for GRADE assessment was based on the sponsor’s Summary of Clinical Evidence, consultation with clinical experts, and input received from patient and clinician groups and public drug plans. The following list of outcomes was finalized in consultation with expert committee members:
efficacy outcomes: PRO clinical response at week 12 and SES-CD endoscopic response at week 52; PRO clinical response at week 12 and CDAI clinical remission at week 52; PRO clinical response at week 12, corticosteroid-free status from week 40 to week 52, and CDAI clinical remission at week 52; PRO clinical response at week 12 and SES-CD endoscopic remission at week 52; CDAI clinical remission at week 12 and week 52; endoscopic response at week 52; and endoscopic remission at week 52
health-related quality of life (HRQoL): LS mean change in IBDQ total score from baseline to week 52
harms: SAEs up to week 52.
Table 2: Summary of Findings for Mirikizumab vs. Placebo for Patients With Moderately to Severely Active CD
Outcome and follow-up | Patients (studies), N | Relative effects (99.5% CI)a | Absolute effects (99.5% CI)a | Certainty | What happens | ||
|---|---|---|---|---|---|---|---|
Placebo | Mirikizumab | Difference | |||||
Clinical response and endoscopic response | |||||||
Proportion of patients achieving PRO clinical responseb at week 12 and by SES-CD endoscopic response at week 52c | 778 (1 RCT) | ██ █ ████ | 90 per 1,000 | 380 per 1,000 (323 per 1,000 to 437 per 1,000) | 287 more per 1,000 (206 more per 1,000 to 368 more per 1,000) | Highd | Mirikizumab results in a clinically important increase in the proportion of patients achieving PRO clinical response at week 12 and SES-CD endoscopic response at week 52 when compared with placebo. |
Clinical response and clinical remission | |||||||
Proportion of patients achieving PRO clinical responseb at week 12 and CDAI clinical remission at week 52e | 778 (1 RCT) | ██ █ ████ | 196 per 1,000 | 454 per 1,000 (396 per 1,000 to 512 per 1,000) | 258 more per 1,000 (159 more per 1,000 to 356 more per 1,000) | Highd | Mirikizumab results in a clinically important increase in the proportion of patients achieving PRO clinical response at week 12 and CDAI clinical remission at week 52 when compared with placebo. |
Clinical response and 12-week corticosteroid-free clinical remission | |||||||
Proportion of patients achieving PRO clinical responseb at week 12, corticosteroid-free status from week 40 to week 52, and CDAI clinical remission at week 52f | 778 (1 RCT) | ██ █ ████ | 186 per 1,000 | 437 per 1,000 (379 per 1,000 to 495 per 1,000) | 250 more per 1,000 (152 more per 1,000 to 347 more per 1,000) | Highd | Mirikizumab results in a clinically important increase in the proportion of patients achieving PRO clinical response at week 12, corticosteroid-free status from week 40 to week 52, and CDAI clinical remission at week 52 when compared with placebo. |
Clinical response and endoscopic remission | |||||||
Proportion of patients achieving PRO clinical responseb at week 12 and SES-CD endoscopic remissiong at week 52 | 778 (1 RCT) | ██ █ ████ | 20 per 1,000 | 159 per 1,000 (116 per 1,000 to 202 per 1,000) | 138 more per 1,000 (87 more per 1,000 to 189 more per 1,000) | Highd | Mirikizumab results in a clinically important increase in the proportion of patients achieving PRO clinical response at week 12 and SES-CD endoscopic remission at week 52 when compared with placebo. |
Clinical remission | |||||||
Proportion of patients achieving CDAI clinical remission e Follow-up: 12 weeks | 778 (1 RCT) | ██ █ ████ | 251 per 1,000 | 377 per 1,000 (320 per 1,000 to 433 per 1,000) | 124 more per 1,000 (22 more per 1,000 to 227 more per 1,000) | Moderateh | Mirikizumab likely results in little to no clinically important difference in the proportion of patients achieving CDAI clinical remission at week 12 when compared with placebo. |
Endoscopic response | |||||||
Proportion of patients achieving SES-CD endoscopic responseb Follow-up: 52 weeks | 778 (1 RCT) | ██ █ ████ | 90 per 1,000 | 484 per 1,000 (425 per 1,000 to 542 per 1,000) | 391 more per 1,000 (310 more per 1,000 to 472 more per 1,000) | Highi | Mirikizumab results in a clinically important increase in the proportion of patients achieving SES-CD endoscopic response at week 52 when compared with placebo. |
Endoscopic remission | |||||||
Proportion of patients achieving SES-CD endoscopic remissiong Follow-up: 52 weeks | 778 (1 RCT) | ██ █ ████ | ██ ███ | 190 per 1,000 (144 per 1,000 to 236 per 1,000) | ███ ███ | Highj | Mirikizumab results in a clinically important increase in the proportion of patients achieving SES-CD endoscopic remission at week 52 when compared with placebo. |
HRQoL (IBDQ) | |||||||
LS mean change from baseline to week 52 in IBDQ total score (range, 32 to 224, with higher scores indicating better HRQoL) Follow-up: 52 weeks | 774 (1 RCT) | ██ █ ████ | 15.90 | 43.82 (NR) | 27.92 more (95% CI, 22.67 more to 33.18 more) | Highk | Mirikizumab results in a clinically important increase in LS mean change from baseline to week 52 in IBDQ total score when compared with placebo. |
Harms | |||||||
Proportion of patients with SAEs Follow-up: 52 weeks | 841 (1 RCT) | ██ █ ████ | 171 per 1,000 | 103 per 1,000 (NR) | 63.8 less per 1,000 (95% CI, 125.2 less per 1,000 to 2.5 less per 1,000) | Lowl | Mirikizumab may result in little to no difference in the proportion of patients with SAEs when compared with placebo. |
AP = abdominal pain; CD = Crohn disease; CDAI = Crohn’s Disease Activity Index; CDA-AMC = Canada’s Drug Agency; CI = confidence interval; HRQoL = health-related quality of life; IBDQ = Inflammatory Bowel Disease Questionnaire; LS = least squares; MID = minimally important difference; NR = not reported; PRO = patient-reported outcome; RCT = randomized controlled trial; SAE = serious adverse event; SES-CD = Simple Endoscopic Score for Crohn’s Disease; SF = stool frequency; vs. = versus.
Notes: Study limitations (which refer to internal validity or risk of bias), indirectness, imprecision of effects, and publication bias were considered when assessing the certainty of the evidence. All serious concerns in these domains that led to the rating down of the level of certainty are documented in the table footnotes.
The following outcomes were not adjusted for multiplicity and should be considered as supportive evidence: SES-CD endoscopic response at week 52; SES-CD endoscopic remission at week 52; and LS mean change from baseline to week 52 in IBDQ total score.
aUnless otherwise specified.
bPRO clinical response is defined as at least a 30% decrease in SF and/or AP with neither score worse than baseline.
cEndoscopic response was defined as a 50% or greater reduction from baseline in SES-CD total score.
dThere is no established between-group MID for this outcome; however, the clinical experts consulted by CDA-AMC considered that a 7% difference between groups in this outcome could be considered a threshold of clinical importance.
eClinical remission is defined as a CDAI score less than 150.
fCorticosteroid-free remission was defined as achieving corticosteroid-free status from week 40 to week 52 and CDAI clinical remission at week 52 in patients who used corticosteroids at baseline.
gAn endoscopic remission SES-CD score of less than or equal to 4 was defined as an SES-CD total score of 4 or less, at least a 2-point reduction from baseline, and no segmental subscore > 1.
hThe level of evidence was rated down 1 level for serious imprecision. There is no established between-group MID for this outcome; however, the clinical experts consulted by CDA-AMC considered that a 15% difference between groups could be considered a threshold of clinical importance. Based on this threshold, the point estimate and lower bound of the 99.5% CI for the between-group difference suggested no clinically important difference between mirikizumab vs. placebo, while the upper bound of the 99.5% CI suggested a clinically important difference between the 2 groups.
iThere is no established between-group MID for this outcome; however, the clinical experts consulted by CDA-AMC considered that a 10% difference between groups in this outcome could be considered a threshold of clinical importance.
jThere is no established between-group MID for this outcome; however, the clinical experts consulted by CDA-AMC considered that a 7% difference between groups in this outcome could be considered a threshold of clinical importance.
kAn MID of 16 points for change in IBDQ total score was identified from published literature.
lThe level of evidence was rated down 2 levels for serious imprecision and serious indirectness. There is no established between-group MID for the proportion of patients with SAEs at 52 weeks; however, the clinical experts consulted by CDA-AMC considered that a 10% difference between groups for this outcome could be considered a threshold of clinical importance. The point estimate and upper bound of the 95% CI for the between-group difference suggested no clinically important difference between the 2 groups, while the lower bound of the 95% CI suggested a clinically important difference for mirikizumab vs. placebo based on a 10% threshold. Additionally, there was indirectness related to the inclusion of worsening of CD and other CD-related events (e.g., flares, exacerbation, aggravation) as an SAE, which complicates interpretation of the result.
Sources: Clinical Study Report for the VIVID-1 study (I6T-MC-AMAM).29 Details included in the table are from the sponsor’s Summary of Clinical Evidence16
Table 3: Summary of Findings for Mirikizumab vs. Ustekinumab for Patients With Moderately to Severely Active CD
Outcome and follow-up | Patients (studies), N | Relative effect (99.5% CI)a | Absolute effects (99.5% CI)a | Certainty | What happens | ||
|---|---|---|---|---|---|---|---|
Ustekinumab | Mirikizumab | Difference | |||||
Clinical response and endoscopic response | |||||||
Proportion of patients achieving PRO clinical responseb at week 12 and SES-CD endoscopic responsec at week 52 | 866 (1 RCT) | ██ █ ████ | 373 per 1,000 | 380 per 1,000 (323 per 1,000 to 437 per 1,000) | 9 more per 1,000 (89 less per 1,000 to 107 more per 1,000) | Lowd | Mirikizumab may result in little to no clinically important difference in the proportion of patients achieving PRO clinical response at week 12 and SES-CD endoscopic response at week 52 when compared with ustekinumab. |
Clinical response and clinical remission | |||||||
Proportion of patients achieving PRO clinical responseb at week 12 and CDAI clinical remissione at week 52 | 866 (1 RCT) | ██ █ ████ | 408 per 1,000 | 454 per 1,000 (396 per 1,000 to 512 per 1,000) | 46 more per 1,000 (54 less per 1,000 to 147 more per 1,000) | Moderatef | Mirikizumab likely results in little to no clinically important difference in the proportion of patients achieving PRO clinical response at week 12 and CDAI clinical remission at week 52 when compared with ustekinumab. |
Clinical response and corticosteroid-free clinical remission | |||||||
Proportion of patients achieving PRO clinical responseb at week 12, corticosteroid-free status from week 40 to week 52, and CDAI clinical remissiong at week 52 | 866 (1 RCT) | ██ █ ████ | ███ ███ | 437 per 1,000 (379 per 1,000 to 495 per 1,000) | ██ ████ | Moderatef | Mirikizumab likely results little to no clinically important difference in the proportion of patients achieving PRO clinical response at week 12, corticosteroid-free status from week 40 to week 52, and CDAI clinical remission at week 52 when compared with ustekinumab. |
Clinical response and endoscopic remission | |||||||
Proportion of patients achieving PRO clinical responseb at week 12 and SES-CD endoscopic remissionh at week 52 | 866 (1 RCT) | ██ █ ████ | ███ ███ | 159 per 1,000 (116 per 1,000 to 202 per 1,000) | ██ ████ | Moderatef | Mirikizumab likely results in little to no clinically important difference in the proportion of patients achieving PRO clinical response at week 12 and SES-CD endoscopic remission at week 52 when compared with ustekinumab. |
Clinical remission | |||||||
Proportion of patients achieving CDAI clinical remissione Follow-up: 12 weeks | 866 (1 RCT) | ██ █ ████ | ███ ███ | 377 per 1,000 (320 per 1,000 to 433 per 1,000) | ██ ████ | Highi | Mirikizumab results in little to no clinically important difference in the proportion of patients achieving CDAI clinical remission at week 12 when compared with ustekinumab. |
Proportion of patients achieving CDAI clinical remissione (noninferiority) Follow-up: 52 weeks | 866 (1 RCT) | ██ █ ███ █ | 484 per 1,000 | 541 per 1,000 (95% CI, 500 per 1,000 to 581 per 1,000) | 57 more per 1,000 (95% CI, 14 less per 1,000 to 128 more per 1,000) | Moderatej | Mirikizumab likely results in little to no clinically important difference in the proportion of patients achieving CDAI clinical remission at week 52 when compared with ustekinumab. |
Endoscopic response | |||||||
Proportion of patients achieving SES-CD endoscopic responsec Follow-up: 52 weeks | 866 (1 RCT) | ██ █ ████ | 463 per 1,000 | 484 per 1,000 (95% CI, 443 per 1,000 to 524 per 1,000) | 23 per 1,000 (95% CI, 47 less per 1,000 to 93 more per 1,000) | Highk | Mirikizumab results in little to no clinically important difference in the proportion of patients achieving SES-CD endoscopic response at week 52 when compared with ustekinumab. |
Endoscopic remission | |||||||
Proportion of patients achieving SES-CD endoscopic remissionh Follow-up: 52 weeks | 866 (1 RCT) | ██ █ ████ | 181 per 1,000 | 190 per 1,000 (144 per 1,000 to 236 per 1,000) | 9 more per 1,000 (69 less per 1,000 to 87 more per 1,000) | Lowl | Mirikizumab may result in little to no clinically important difference in the proportion of patients achieving SES-CD endoscopic remission at week 52 when compared with ustekinumab. |
HRQoL (IBDQ) | |||||||
LS mean change from baseline to week 52 in IBDQ total score (range, 32 to 224, with higher scores indicating better HRQoL) Follow-up: 52weeks | 863 (1 RCT) | ██ █ ████ | ██ █ █ | 43.82 (NR) | ██ ████ | Highm | Mirikizumab results in little to no clinically important difference in LS mean change from baseline to week 52 in IBDQ total score when compared with ustekinumab. |
Harms | |||||||
Proportion of patients with SAEs Follow-up: 52 weeks | 939 (1 RCT) | ██ ████ █ | 107 per 1,000 | 103 per 1,000 (NR) | 3.6 less per 1,000 (95% CI, 45.5 less per 1,000 to 38.2 more per 1,000) | Moderaten | Mirikizumab likely results in little to no clinically important difference in the proportion of patients with SAEs when compared with ustekinumab. |
AP = abdominal pain; CD = Crohn disease; CDAI = Crohn’s Disease Activity Index; CI = confidence interval; HRQoL = health-related quality of life; IBDQ = Inflammatory Bowel Disease Questionnaire; LS = least squares; MID = minimally important difference; NR = not reported; PRO = patient-reported outcome; RCT = randomized controlled trial; SAE = serious adverse event; SES-CD = Simple Endoscopic Score for Crohn’s Disease; SF = stool frequency; vs. = versus.
Notes: Study limitations (which refer to internal validity or risk of bias), inconsistency across studies, indirectness, imprecision of effects, and publication bias were considered when assessing the certainty of the evidence. All serious concerns in these domains that led to the rating down of the level of certainty are documented in the table footnotes. For mirikizumab compared with ustekinumab, only CDAI clinical remission at week 52 and endoscopic response at week 52 were included in the multiple testing procedure. The remaining outcomes were not adjusted for multiplicity and should be considered as supportive evidence.
aUnless otherwise specified.
bPRO clinical response was defined as at least a 30% decrease in SF and/or AP, with neither score worse than baseline.
cEndoscopic response was defined as a ≥ 50% reduction from baseline in the SES-CD total score.
dThe level of evidence was rated down 2 levels for very serious imprecision. There is no established between-group MID for this outcome; however, the clinical experts consulted by CDA-AMC considered that a 7% difference between groups could be considered a threshold of clinical importance. Based on this threshold, the point estimate suggested no clinically important difference between mirikizumab and ustekinumab. However, the upper bound of the 99.5% CI for the between-group difference suggested a clinically important difference in favour of mirikizumab, whereas the lower bound suggested a clinically important difference in favour of ustekinumab.
eClinical remission is defined as a CDAI score of less than 150.
fThe level of evidence was rated down 1 level for serious imprecision. There is no established between-group MID for this outcome; however, the clinical experts consulted by CDA-AMC considered that a 7% difference between groups could be considered a threshold of clinical importance. Based on this threshold, the point estimate and lower bound of the 99.5% CI for the between-group difference suggested no clinically important difference between mirikizumab vs. ustekinumab, while the upper bound of the 99.5% CI suggested a clinically important difference between the 2 groups.
gCorticosteroid-free remission was defined as achieving corticosteroid-free status from week 40 to week 52 and CDAI clinical remission at week 52 in patients who used corticosteroids at baseline.
hEndoscopic remission SES-CD ≤ 4 was defined as an SES-CD total score ≤ 4 and at least a 2-point reduction from baseline, and no segmental subscore > 1.
iThere is no established between-group MID for this outcome; however, the clinical experts consulted by CDA-AMC considered that a 15% difference between groups could be considered a threshold of clinical importance.
jThis evidence was rated down 1 level for serious imprecision. As this outcome was assessed for noninferiority, the threshold of clinical importance was selected to align with the noninferiority margin of 10%. Based on this threshold, the point estimate and lower bound of the 95% CI of the between-group difference suggested no clinically important difference between the mirikizumab and ustekinumab groups, whereas the upper bound of the 95% CI suggested a clinically important difference between the 2 groups.
kThere is no established between-group MID for this outcome; however, the clinical experts consulted by CDA-AMC considered that a 10% difference between groups could be considered a threshold of clinical importance.
lThe level of evidence was rated down 2 levels for very serious imprecision. There is no established between-group MID for this outcome; however, the clinical experts consulted by CDA-AMC considered that a 7% difference between groups could be considered a threshold of clinical importance. Based on this threshold, the point estimate suggested no clinically important difference between mirikizumab and ustekinumab. However, the upper bound of the 99.5% CI for the between-group difference suggested a clinically important difference in favour of mirikizumab, whereas the lower bound suggested a clinically important difference in favour of ustekinumab.
mAn MID of 16 points for change in IBDQ total score was identified from published literature.
nThe level of evidence was rated down 1 level for serious indirectness. There is no established between-group MID for the proportion of patients with SAEs at 52 weeks; however, the clinical experts consulted by CDA-AMC considered that a 10% difference between groups for this outcome could be considered a threshold of clinical importance. There was indirectness related to the inclusion of worsening of CD and other CD-related events (e.g., flares, exacerbation, aggravation) as an SAE; this complicates the interpretation of the result.
Sources: Clinical Study Report for the VIVID-1 trial (I6T-MC-AMAM).29 Details included in the table are from the sponsor’s Summary of Clinical Evidence.16
Long-Term Extension Studies
Description of Studies
One ongoing, phase III, multicentre, open-label, long-term extension (LTE) study (the VIVID-2 study) was submitted. The VIVID-2 study evaluated the long-term efficacy and safety of mirikizumab in patients with CD. Patients were separated into 2 treatment groups — endoscopic responders and endoscopic nonresponders — according to their response in the VIVID-1 trial. Endoscopic responders were defined as participants who achieved a greater than or equal to 50% reduction from baseline in SES-CD score, irrespective of their prior treatment groups, at week 52 of the VIVID-1 trial.
Endoscopic responders continued the same subcutaneous (SC) mirikizumab dosing as in the VIVID-1 trial (i.e., 300 mg every 4 weeks), while endoscopic nonresponders received reinduction with IV mirikizumab (900 mg every 4 weeks for 3 doses) at the start of the VIVID-2 study followed by 300 mg SC every 4 weeks. The interim analysis did not include patients who entered the VIVID-2 trial after August 1, 2023. This was to ensure that all patients in this interim analysis could have completed 1 year of treatment in the VIVID-2 trial. Analyses were based on the data cut-off date of August 2, 2024.
The coprimary end points were endoscopic response (defined as a ≥ 50% reduction from baseline in SES-CD total score) at week 104 (i.e., week 52 of the VIVID-2 study) and CDAI clinical remission (CDAI score ˂ 150) at week 104. The secondary end points included endoscopic remission based on SES-CD total score at week 104, PRO clinical response based on SF and AP at week 104, and QoL as measured by IBDQ at week 104.
Eligible patients included those who had completed week 52 of the VIVID-1 trial, including the endoscopy for evaluation of responder or nonresponder status, and who — in the opinion of the investigator — would derive clinical benefit from treatment with mirikizumab. Patients were excluded from the LTE if any of the following occurred:
They had previously reported an SAE while on mirikizumab.
They developed conditions before the LTE that would disqualify them from treatment with mirikizumab.
They had previously discontinued the study drug, or had a temporary interruption of the study drug, such that in the opinion of the investigator or sponsor, restarting mirikizumab would present unacceptable risk.
They had a significant uncontrolled neuropsychiatric disorder or had been assessed as being at risk of suicide.
They had been diagnosed with a serious infection or had an unstable or uncontrolled illness.
Efficacy outcomes were assessed in the overall population of patients with a baseline SES-CD score of greater than or equal to 7 (or ≥ 4 for isolated ileal disease). Safety was assessed from the first dose in the VIVID-2 study to the cut-off date of August 2, 2024. Discontinuations or missing data were handled using mNRI. Sporadically missing data and data from patients who discontinued treatment due to extraordinary circumstances (such as issues related to study treatment supplies or site termination) were imputed by multiple imputation. Patients who discontinued for other reasons were treated as nonresponders.
For patients in the endoscopic responder group, the mean age was 37 years (SD = 12.89 years), the mean duration of CD was 7.8 years (SD = 8.00 years), the mean CDAI score was 319 (SD = 81.80), and the mean SES-CD score was 15 (SD = 6.53). For patients in the endoscopic nonresponder group, the mean age was 38 years (SD = 13.96 years), the mean CDAI score was 328 (SD = 87.64), the mean duration of CD was 9.8 years (SD = 8.43 years), and the mean SES-CD score was 12 (SD = 5.85). In both groups, most patients were males (> 55%) and were █████ ███████.
Efficacy Results
The summarized efficacy data include only patients with a baseline SES-CD score of 7 or higher (or ≥ 4 for isolated ileal disease) who were randomized to mirikizumab in the VIVID-1 trial.
Coprimary End Points
Endoscopic response at week 104 (week 52 of the VIVID-2 study): Among endoscopic responders (n = 251) at week 52 of the VIVID-1 trial who continued to receive mirikizumab SC, 81.8% maintained endoscopic response at week 104.
Among endoscopic nonresponders (n = 179) who received reinduction with mirikizumab, 30.9% gained endoscopic response at week 104.
CDAI remission at week 104 (week 52 of the VIVID-2 study): Among mirikizumab endoscopic responders (n = 251) at week 52 of the VIVID-1 trial, 79.0% maintained clinical remission at week 104. In addition, 78.3% of endoscopic responders (n = 179) who were also in clinical remission at week 52 of the VIVID-1 trial maintained both clinical remission and endoscopic response at week 104. In addition, 86.5% of endoscopic responders who were in corticosteroid-free clinical remission at week 52 maintained this outcome at week 104.
Among mirikizumab endoscopic nonresponders (n = 179) at week 52 of the VIVID-1 trial, clinical remission was maintained by 86.9% of patients who were in CDAI remission. Of the 67 patients who were not in clinical remission at the end of the VIVID-1 trial, 55.8% gained CDAI remission at week 104.
Secondary End Points
Endoscopic remission: At week 104, among patients in the endoscopic responder group, endoscopic remission was maintained by 72.5% of patients who were in endoscopic remission (n = 137). Endoscopic remission was gained by 33.3% of patients who had not been in endoscopic remission (n = 112) at week 52 of the VIVID-1 trial.
At week 104, among patients who were in the endoscopic nonresponder group, endoscopic remission was gained by 12.1% of patients who were not in endoscopic remission (n = 174) at week 52 of the VIVID-1 trial.
PRO clinical remission: At week 104, PRO clinical remission was achieved by ███ of patients who were endoscopic responders at week 52 of the VIVID-1 trial. Information about PRO clinical remission for patients who were endoscopic nonresponders at week 52 of the VIVID-1 trial was not provided by the sponsor.
HRQoL: At week 104, IBDQ remission was achieved by ███ of patients who were in endoscopic response at week 52 of the VIVID-1 trial. In addition, IBDQ response was achieved by ███ of patients who were in endoscopic response at week 52 of the VIVID-1 trial.
Information on IBDQ remission and response for patients who were considered as endoscopic nonresponders at week 52 of the VIVID-1 trial was not provided by the sponsor.
Harms Results
Adverse Events
In the endoscopic responder group, 171 patients (64.0%) reported 1 or more TEAEs. In the endoscopic nonresponder group, 130 patients (65.0%) reported 1 or more TEAEs. The most common TEAEs (reported in ≥ 5% of patients) in both groups were COVID-19 (█████ in both groups) and upper respiratory tract infection (endoscopic responder = ████; endoscopic nonresponder = ████). Nasopharyngitis was reported in ██ ██████ patients in the endoscopic responder group.
Serious AEs
A total of 18 patients in both groups reported at least 1 SAE. No particular AE accounted for the majority of SAEs.
Withdrawal Due to AEs
███ ██████ patients in the endoscopic responder group discontinued treatment due to AEs. Reasons for discontinuations were █████ ███████████ █████ █████ and ████████ ███████ █████ ██████.
███ ██████ patients in the endoscopic nonresponder group discontinued treatment due to AEs. Reasons for discontinuations were ██ █████ █████, █████████ ████ █████ █████, █████ ██████ ██████ █████ █████, ██████████ ███████ █████ █████, ████████ █████████ █████ █████, ████████████████ ████████ █████ █████, ██████████ ███████████ █████ ██████ and ████ █████ ██████.
AEs of Special Interest
Infections occurred in ██ ███████ patients and ██ ███████ patients in the endoscopic responder and endoscopic nonresponder groups, respectively. Other commonly reported AEs of special interest included hepatic TEAEs (endoscopic responders = 5.3%; endoscopic nonresponders = 3.0%), immediate hypersensitivity events (i.e., those occurring on the day of study drug administration) (endoscopic responders = 2.3%; endoscopic nonresponders = 4.0%), and nonimmediate hypersensitivity events (endoscopic responders = ████, endoscopic nonresponders = ████).
Deaths
Two deaths occurred. Both were considered not related to the study drug.
Critical Appraisal
The single-group design (i.e., no comparator group) does not permit inherent causal interpretations of the effects of longer-term mirikizumab treatment. The open-label nature of the study may increase the risk of bias in the evaluation of subjective efficacy and harms outcomes. It may also influence patient and clinician behaviours during the trial, such as the use of concomitant medications. The impact of permitted concomitant medications for CD on efficacy outcomes is unknown because no information about these was reported. The sample sizes in both groups were reduced from the original VIVID-1 study population, given that only patients who had not discontinued before week 52 and who were expected by the investigator to potentially derive benefit from further treatment were included.
Among the patients who were considered endoscopic responders at the end of the VIVID-1 trial — and among those who continued to receive mirikizumab SC during the LTE — the rate of discontinuation from the study was generally low and mainly due to AEs or patient request. The use of multiple imputation for sporadically missing data for patients who discontinued treatment due to extraordinary circumstances (such as study treatment supply issues or site termination) may be appropriate, given that these reasons would likely be unrelated to patient outcomes. The use of NRI for the remainder of discontinuations may be considered conservative in a single-arm design. While most patients maintained endoscopic response, remission, and clinical remission at week 52 of the VIVID-2 study, long-term sustainability and/or durability has yet to be determined because the study is ongoing.
In general, because the LTE enrolled patients from the pivotal study, the eligibility concerns raised in the pivotal study remain valid for the LTE population. Patients were not allowed any rescue therapy. Patients who completed the VIVID-1 study and who were expected by the investigator to benefit from further treatment were included; this may have led to a more selective population compared to baseline. Endoscopic response, clinical remission, and HRQoL were considered important outcomes; these were measured and reported. One of the clinical experts consulted by CDA-AMC indicated that re-treatment with mirikizumab would be considered only under certain circumstances, such as incomplete induction (i.e., missed doses), partial response suggesting that reinduction may be needed to achieve further improvement, or clear reasons for prior failure of induction, such as Clostridioides difficile infection or pre-existing strictures. The other clinical expert noted that re-treatment with mirikizumab would not be considered and that they would likely pivot to another mechanism of action or even another anti–IL-23. The harms results were generally aligned with the pivotal study, with no new AEs identified. There were fewer patients who reported injection-site reactions in the LTE compared to the pivotal study.
Indirect Comparisons
Description of Studies
A direct comparison of the efficacy and safety of mirikizumab versus ustekinumab was included in the pivotal study (i.e., the VIVID-1 study). In the absence of RCTs providing a direct comparison of all other treatments of interest in the clinical setting in Canada, the sponsor submitted an indirect treatment comparison (ITC) in the form of a network meta-analysis (NMA). The NMA was conducted to compare the efficacy and safety of mirikizumab with all potentially relevant comparators of interest (including adalimumab, infliximab, ustekinumab, vedolizumab, upadacitinib, and risankizumab) for the treatment of moderately to severely active CD.
Efficacy Results
For patients with moderately to severely active CD who experienced either conventional care failure (CCF) or BF in both the induction and maintenance treatment periods, the evidence from the NMA was insufficient to determine whether mirikizumab differs in efficacy compared to relevant comparators for enhanced clinical response, clinical remission (defined as a CDAI score of < 150), endoscopic response, and endoscopic remission. No HRQoL outcomes were assessed in the NMA.
Harms Results
Evidence from the NMA was insufficient to determine whether mirikizumab differs in safety from relevant comparators during the induction phase. No analysis was done to inform comparative safety in the maintenance phase.
Critical Appraisal
Overall, the sponsor’s NMA was conducted according to accepted methodological guidance. A key limitation of the NMA was the considerable clinical and methodological heterogeneity across the included studies, such as differences in study design; differences in baseline demographic and disease characteristics; potential differences in conventional care (i.e., standard care for CD can evolve over the time); potential differences in the concomitant medications used in the trials; and different follow-up times at which outcomes were assessed. These sources of heterogeneity suggest that the assumption of similarity across the included studies may not hold true for the NMA, increasing the likelihood of bias and the uncertainty about the validity of the results for determining the comparative efficacy of mirikizumab with all relevant comparators.
Although a variety of approaches were used to reduce the level of heterogeneity in some of these analyses, these may introduce other limitations. The exclusion of relevant studies was done to reduce heterogeneity in the network; however, this approach involved subjective decisions, which may be a source of bias in the analysis. The stratification of analyses by populations of patients with CCF and BF experience was relevant; however, it limited the generalizability of the results of either analysis to the overall indicated population in Canada. There was limited ability to assess for potential clinical heterogeneity within these groups, and the report did not confirm whether randomization was stratified for these subgroups to ensure prognostic balance was upheld. The baseline risk adjustment for heterogeneity in placebo response was considered appropriately across all analyses and applied for most of the induction analyses. This adjustment could not be extended to maintenance analyses (e.g., the models did not converge) where between-trial heterogeneity was potentially greater due to variations in study design.
Other potential limitations included sparsity in the evidence networks and the fact that most of the connections between treatment nodes were informed by only 1 trial. There were relatively few closed loops between nodes, inherently limiting the ability to comprehensively examine the consistency assumption. Comparative effect estimates were often accompanied by wide credible intervals (CrIs), demonstrating an additional source of uncertainty in the findings.
Studies Addressing Gaps in the Evidence From the Systematic Review
No studies addressing gaps were submitted by the sponsor.
Conclusions
The evidence base for this review included 1 phase III, double-blind, placebo- and active-controlled RCT (the VIVID-1 study); 1 LTE study (the VIVID-2 study); and 1 sponsor-submitted NMA.
The VIVID-1 trial evaluated the efficacy and safety of mirikizumab in patients with moderately to severely active CD compared with placebo and ustekinumab. The outcomes evaluated were considered important to patients and clinicians. These included clinical outcomes, endoscopic outcomes, HRQoL, and safety.
In the comparison of mirikizumab versus placebo, the coprimary and all major secondary end points yielded statistically significant results in favour of mirikizumab. The GRADE assessments demonstrated high levels of certainty and clinically meaningful improvements in favour of mirikizumab except for 1 major secondary outcome (CDAI clinical remission at week 12, which was rated as moderate in certainty due to serious imprecision and suggested little to no difference between mirikizumab and placebo).
In the comparison of mirikizumab versus ustekinumab, the GRADE assessments demonstrated little to no clinically important differences between groups, with high to moderate levels of certainty. Two exceptions were the composite outcome of PRO clinical response at week 12 and SES-CD endoscopic response at week 52 and the single outcome of SES-CD endoscopic remission at week 52, which were rated as low-certainty evidence due to very serious imprecision. Mirikizumab was noninferior to ustekinumab in the major secondary outcome of CDAI clinical remission at week 52. Superiority over ustekinumab in week 52 endoscopic response was not achieved.
Overall, no new safety concerns were observed with mirikizumab in the VIVID-1 trial. Mirikizumab may result in little to no difference in the incidence of SAEs compared to placebo, and it likely results in little to no difference when compared with ustekinumab.
The VIVID-2 study is an ongoing, phase III, multicentre, open-label LTE study evaluating the long-term efficacy and safety of mirikizumab in patients with moderately to severely active CD. The outcomes evaluated in the LTE aligned with those of the pivotal study. While most patients maintained endoscopic response, endoscopic remission, and clinical remission at week 52 of the VIVID-2 study, longer-term sustainability and/or durability have yet to be determined because the study is ongoing. Among the patients considered to be endoscopic nonresponders, 30.9% gained endoscopic response and 12.1% gained endoscopic remission during the LTE. Causal conclusions about longer-term efficacy were limited by the noncomparative nature of the study.
Evidence from the NMA was insufficient to conclude whether treatment with mirikizumab differs from treatment with relevant comparators. Due to the significant limitations associated with the NMA (e.g., risk of bias, important clinical and methodological heterogeneity, and imprecision), no definite conclusion can be drawn regarding the comparable efficacy and safety of mirikizumab versus available comparators in the treatment of patients with moderately to severely active CD who have had prior CCF or BF.
Introduction
The objective of this report is to review and critically appraise the evidence submitted by the sponsor on the beneficial and harmful effects of mirikizumab 300 mg/15 mL solution for IV infusion after dilution in a vial or 100 mg/1 mL or 200 mg/2 mL solution in a prefilled pen or syringe for SC injection for the treatment of adult patients with moderately to severely active CD who have experienced an inadequate response, loss of response, or intolerance to conventional therapy or a biologic treatment.
Disease Background
The contents within this section have been informed by materials submitted by the sponsor and clinical expert input. The following have been summarized and validated by the review team.
CD is an idiopathic form of IBD. It is characterized by chronic relapsing and remitting transmural (i.e., affecting all tissue layers of the gut wall) inflammation that is usually segmental and asymmetric.1,2 Although any part of the GI tract can be affected, the terminal ileum and colon are the most common sites involved.2 Signs and symptoms associated with CD vary from patient to patient, but the hallmark symptoms include AP, persistent diarrhea, and fatigue.3 Individuals also experience rectal bleeding, fever, bowel urgency, a sensation of incomplete bowel evacuation, constipation, loss of appetite, weight loss, anemia, and low energy.4
CD ultimately results in the loss of intestinal function over time, accompanied by increasing disability.6 Repeated cycles of intestinal inflammation may cause the intestine to become narrower (called strictures), which makes it harder for food to pass through. In severe cases, tunnels (called fistulas) may form between different parts of the intestine or other organs, which may cause pockets of infection (abscesses), which may require surgery for treatment.5,6 Up to 75% of patients with CD may require surgery at some point in their lives.5 Furthermore, a substantial number of patients may need repeat surgery, with the 5-year and 10-year risks of second surgery estimated at 24.2% and 35.0%, respectively.7 The chronic and progressive nature of the disease can have a debilitating effect on an individual’s social, educational, professional, and family activities.1 Furthermore, the psychological and emotional well-being of patients with CD is negatively affected.8
Canada has 1 of the highest prevalence and incidence rates of IBD in the world.9 In 2018, the prevalence of IBD in Canada was roughly 0.7% of the population and was projected to increase steadily toward 1% of the population over the next decade.9,10 The prevalence of IBD in 2023 was estimated to be 825 per 100,000, of which 410 per 100,000 represented people living with CD.10 The incidence of IBD in Canada was estimated to be 30 per 100,000 people in Canada in 2023, with an incidence of 12.2 per 100,000 for CD.11
Disease severity is commonly classified using the CDAI and the Harvey-Bradshaw Index.12 A CDAI score of 220 to 450 is considered to represent moderately to severely active CD.12 Diagnosis of CD remains complex and requires a multifaceted approach. A diagnosis typically involves the presentation of signs and symptoms (e.g., right lower quadrant AP, chronic intermittent diarrhea, fatigue, weight loss), laboratory tests (e.g., for anemia, vitamin B12 or vitamin D deficiency, stool assessments, CRP), endoscopic procedures (ileocolonoscopy), histologic or biochemical testing, and advanced imaging (MRI or CT scans).4,13,14 Diagnostic delays are common among patients with CD. Symptoms can fluctuate over time and are often misdiagnosed as IBD.15 The initial laboratory investigations for CD, including blood tests and stool tests (FCP), are widely available and conducted across Canada. However, methods to establish a diagnosis of CD, including endoscopic and imaging techniques, may be available only at larger clinical centres and hospitals.16
Standards of Therapy
The contents within this section have been informed by materials submitted by the sponsor and clinical expert input. The following have been summarized and validated by the review team.
Currently, there are no curative treatments for CD. Thus, management consists of induction and maintenance phases of therapies to achieve and maintain control of the symptoms that arise from an overly active intestinal immune system.15,17 However, treatment goals have evolved toward achieving endoscopic and mucosal healing due to evidence demonstrating that patients with CD who achieve such healing experience improved long-term outcomes and fewer complications.18 In light of evolving treatment goals for CD, the Selecting Therapeutic Targets in Inflammatory Bowel Disease guidelines were established in 2015 to achieve international consensus on appropriate treatment targets for treat-to-target strategies for CD in clinical practice.30 According to clinical experts consulted by CDA-AMC, the short- to intermediate-term goals of treatment for CD include induction of clinical response and remission, improvement of QoL, reduction of corticosteroid use, and normalization of inflammatory biomarkers (e.g., FCP and CRP). Furthermore, the clinical experts stated that the long-term goals of treatment for CD include achievement of endoscopic remission, maintenance of corticosteroid-free remission, prevention of disease progression, mucosal and transmural healing, and reduction of CD-related hospitalizations and surgeries. Of note, the clinical experts consulted by CDA-AMC emphasized that the benefit of a treatment for CD is best characterized by the degree of improvement in endoscopic outcomes. These goals are aligned with those outlined by the guidelines.30
The treatment of CD is individualized based on disease location, extent, phenotype, and severity.3 The major categories of pharmacotherapies used to treat CD include conventional therapies, biologic therapies, and oral small-molecule drugs. Conventional therapies include corticosteroids (e.g., prednisone), 5-aminosalicylic acid, and immunomodulators (e.g., azathioprine, cyclosporine, methotrexate, and 6-mercaptopurine). Although typically used as first-line treatment for mild to moderate CD, conventional therapies are not recommended in the treatment guidelines for CD due to limited efficacy. The clinical experts consulted by the CDA-AMC review team indicated that patients with CD will initiate treatment with corticosteroids, whereas immunomodulators (i.e., purine antimetabolites or methotrexate) have been superseded in clinical practice. Biologic therapies for CD include TNF-alpha antagonists (e.g., infliximab and adalimumab), integrin inhibitors (e.g., vedolizumab), IL-12/IL-23 inhibitors (e.g., ustekinumab), and IL-23 inhibitors (e.g., risankizumab). The clinical experts consulted by CDA-AMC noted a recent shift in the treatment paradigm for CD whereby biologic therapies are increasingly used as first, second, or later lines of therapy for moderately to severely active CD; this shift is attributed to evidence from phase III RCTs demonstrating that biologic therapies achieve endoscopic end points. Where a response to induction therapy has been achieved with 1 biologic drug, it is generally recommended that the same drug be used for maintenance therapy.31
The clinical experts consulted by CDA-AMC indicated that the preferred first-line treatment for moderately to severely active CD would be risankizumab. However, they noted that the preferred first-line drug for patients with significant extraintestinal manifestations (EIMs) would be an anti-TNF drug or upadacitinib, whereas the preferred first-line treatment for patients with perianal fistulas would be an anti-TNF drug. They also noted that risankizumab, upadacitinib, or an anti-TNF drug would be used as second-line therapy for moderately to severely active CD. The clinical experts consulted by CDA-AMC agreed that ustekinumab is not frequently used in clinical practice due to having been largely superseded by anti–IL-23 drugs (i.e., risankizumab), particularly among patients with previous exposure to anti-TNF drugs. Similarly, they agreed that vedolizumab is less effective as a treatment for CD and is not often used for this indication in clinical practice.
Despite advancements in treatments for CD, the clinical experts consulted by CDA-AMC noted several unmet needs related to currently available treatments. For instance, they noted that a significant proportion of patients receiving current therapies are unable to achieve or sustain clinical response and remission. One clinical expert added that patients often experience primary nonresponse or secondary loss of response to current biologic treatments, particularly anti-TNF therapies. They also noted that treatment decisions and adherence are often affected by long-term safety concerns (e.g., infections, malignancies) and tolerability issues related to administration (e.g., injection-site reactions and infusion burden). One clinical expert noted that symptoms such as fatigue, pain, and those related to mental health are not adequately addressed by existing treatments for CD. Lastly, 1 clinical expert noted a paucity of evidence for treatments for CD among certain populations, including people who are pregnant, pediatric, older, or have postoperative recurrence.
Drug Under Review
Mirikizumab belongs to the class of IL-23 inhibitors. It is a humanized immunoglobulin G4 monoclonal antibody that binds with high affinity and specificity to the p19 subunit of human IL-23 cytokine and inhibits its interaction with the IL-23 receptor.32 IL-23 is a naturally occurring cytokine that affects the differentiation, expansion, and survival of T-cell subsets (e.g., T helper 17 cells and T cytotoxic 17 cells) and innate immune cell subsets, which represent sources of effector cytokines that drive inflammatory disease.32
The approved Health Canada indication for mirikizumab is for the treatment of adult patients with moderately to severely active CD who experienced an inadequate response, loss of response, or intolerance to conventional therapy or a biologic treatment. The Notice of Compliance date is July 8, 2025. The reimbursement request aligns with the approved Health Canada indication.
The recommended dose for mirikizumab is as per the approved product monograph.32 The recommended induction dosage regimen is 900 mg infused through IV for at least 90 minutes at weeks 0, 4, and 8. Only the 300 mg/15 mL vial should be used for induction dosing. The recommended maintenance dosing regimen is 300 mg (given as 2 consecutive SC injections of 100 mg and 200 mg in any order) every 4 weeks starting at week 12 upon completion of induction dosing. Consideration should be given to discontinuing treatment in patients who have shown no evidence of therapeutic benefit by week 24.
Mirikizumab was previously reviewed by CDA-AMC for the treatment of adult patients with moderately to severely active ulcerative colitis who experienced an inadequate response, loss of response, or intolerance to conventional therapy, a biologic treatment, or a Janus kinase inhibitor. A recommendation to reimburse with clinical criteria and/or conditions was issued in November 2023.33
Mirikizumab has been approved by the European Medicines Agency34 for the treatment of adult patients with moderately to severely active CD who have experienced an inadequate response, loss of response, or intolerance to conventional therapy or a biologic treatment. Mirikizumab is being reviewed by the FDA35 and the National Institute for Health and Care Excellence.36
The key characteristics of mirikizumab are summarized in Table 4 along with those of other treatments available for CD.
Table 4: Key Characteristics of Mirikizumab, Vedolizumab, Adalimumab, Infliximab, Ustekinumab, Upadacitinib, and Risankizumab
Characteristic | Mirikizumab | Vedolizumab | Adalimumab | Infliximab | Ustekinumab | Upadacitinib | Risankizumab |
|---|---|---|---|---|---|---|---|
Mechanism of action | IgG4 monoclonal antibody binds with high affinity and specificity to the p19 subunit of human IL-23 cytokine and inhibits its interaction with the IL-23 receptor | IgG1 monoclonal antibody that binds to the human alpha 4 beta 7 integrin, acting as a gut-selective, anti-inflammatory biologic | Anti–TNF-alpha human IgG1 monoclonal antibody that binds to and blocks TNF-alpha and its interaction with p55 and p75 cell-surface TNF-alpha receptors | Anti–TNF-alpha IgG1 kappa monoclonal antibody that neutralizes the biological activity of TNF-alpha by binding specifically to its receptors | Human IgG1 monoclonal antibody that neutralizes cellular responses mediated by IL-12 and IL-23 | Selective JAK inhibitor that demonstrates activity against JAK1, JAK2, JAK3, and tyrosine kinase 2 | Humanized IgG1 monoclonal antibody that binds to the p19 subunit of human IL-23 cytokine and inhibits IL-23 signalling in cell-based assays, including the release of the proinflammatory cytokine, IL-17 |
Indicationa | Treatment of adult patients with moderately to severely active CD who have experienced an inadequate response, loss of response, or intolerance to conventional therapy or a biologic treatment | Treatment of patients with moderately to severely active CD who have experienced an inadequate response to, loss of response to, or intolerance to immunomodulators or a TNF-alpha antagonist; or who have experienced an inadequate response to, intolerance to, or demonstrated dependence on a CS | To reduce signs and symptoms and induce and maintain clinical remission in adults with moderately to severely active CD who have experienced an inadequate response to conventional therapy To reduce signs and symptoms and induce clinical remission in adults with moderately to severely active CD who have stopped responding or are intolerant to infliximab | Reduction of signs and symptoms, induction and maintenance of clinical remission and mucosal healing, and reduction of CS use in adults with moderately to severely active CD who have experienced an inadequate response to a CS and/or amino salicylate Adults with fistulizing CD who have not responded to conventional treatment | Treatment of patients with moderately to severely active CD who have experienced an inadequate response to, loss of response to, or intolerance to conventional therapy (i.e., CS or immunomodulators) or 1 or more TNF-alpha antagonists, or who were CS-dependent | Treatment of patients with moderately to severely active CD who have not responded to prior treatment (i.e., experienced an inadequate response to, loss of response to, or intolerance to at least 1 conventional and/or biologic therapy) | Treatment of patients with moderately to severely active CD who have experienced an inadequate response to, intolerance to, or demonstrated dependence on corticosteroids; or who have experienced an inadequate response to, intolerance of, or loss of response to immunomodulators or biologic therapies |
Route of administration | IV (induction) and SC (maintenance) | IV (induction) and SC (maintenance) | SC | IV | IV (induction) and SC (maintenance) | Oral | IV (induction) and SC (maintenance) |
Recommended dose | Adults with moderate to severe CD:
| Adults with moderate to severe CD:
| Adults with CD:
| Adults with moderate to severe CD:
Adults with fistulizing CD:
| Adults with CD:
| Adults with moderate to severe CD:
| Adults with moderate to severe CD:
|
Serious adverse effects or safety issues | Infections; not to be administered in patients with active tuberculosis, hepatic enzyme elevation, or hypersensitivity reactions (including anaphylaxis) | Contraindicated for patients with active, severe infections or opportunistic infections, infusion reactions, and hypersensitivity | Serious infections; malignancies, particularly lymphoma; administration-site reactions | Serious infections; malignancies; infusion-related and serious allergic reactions | Infections and reactivation of latent infections; administration-site reactions; malignancy | Active tuberculosis; invasive fungal infections; bacterial, viral (including herpes zoster), and other opportunistic infections; malignancies; thrombosis; major adverse cardiovascular events | Infections, hepatotoxicity, injection-site reactions, and hypersensitivity reactions |
CD = Crohn disease; CS = corticosteroid; IgG1 = immunoglobulin G1; IgG4 = immunoglobulin G4; IL = interleukin; JAK = Janus kinase; JAK1 = Janus kinase 1; JAK2 = Janus kinase 2; JAK3 = Janus kinase 3; q.2.w. = every 2 weeks; q.4.w. = every 4 weeks; q.8.w. = every 8 weeks; q.12.w. = every 12 weeks; SC = subcutaneous; TNF = tumour necrosis factor.
aHealth Canada–approved indication.
Sources: Product monographs for mirikizumab (Omvoh),32 risankizumab (Skyrizi),37 vedolizumab (Entyvio),38 infliximab (Remicade and Inflectra),39 adalimumab (Humira),40 ustekinumab (Stelara),41 and upadacitinib (Rinvoq).42
Perspectives of Patients, Clinicians, and Drug Programs
The full patient and clinician group submissions received are available in the consolidated patient and clinician group input document for this review on the project website.
Patient Group Input
This section was prepared by the review team based on the input provided by patient groups.
Three patient groups, the CDHF, Crohn’s and Colitis Canada, and Gastrointestinal Society, provided their input for this submission. CDHF’s mission is to reduce suffering and improve QoL by empowering individuals to manage their digestive health with confidence and optimism. Information was gathered from CDHF’s experience with patients with IBD as well as through feedback on surveys and social media campaigns. The Gastrointestinal Society is committed to improving the lives of people with GI and liver conditions, supporting research, advocating for appropriate patient access to health care, and promoting GI and liver health. Information for this submission was gathered primarily through interviews, which included a round table with gastroenterologists, patients, and patient groups as well as phone, email, or social media interactions with patients living with IBD. Several surveys were conducted between 2015 and 2024. In addition, information was collected regarding the patient journeys and unmet needs of individuals living with IBD as well as opinions on biologics and biosimilars. Crohn and Colitis Canada is a national, volunteer-based health charity focused on finding cures for CD and ulcerative colitis. It aims to improve the lives of children and adults affected by these diseases. Information about the impact of IBD in Canada for this submission was drawn from a 2023 report by Crohn’s and Colitis Canada. The organization conducted an online survey in 2022 to better understand patients’ unmet needs and priority concerns and received feedback from 1,706 patients in Canada with CD and ulcerative colitis and from patients with moderate to severe CD and their caregivers (n = 687). No respondent from either patient group had experience with mirikizumab.
The Gastrointestinal Society highlighted how CD affects a person in every aspect of life — physically, emotionally, and socially — whether at home, school, or work. This patient advocacy group also highlighted the unique challenges faced by children and young adults, given that the disease can influence their sense of self and identity. Patients noted several concerns, including unpredictable flares, hopelessness, no improvements with current treatments, mental health issues, mortality, and bowel urgency. The CDHF noted that 60% to 74% of patients with CD experience bowel urgency, with 25% to 50% of patients experiencing it at least once daily. This patient group highlighted that the burden of fecal urgency on patients’ lives is underestimated, with ramifications including disruptions in daily activities and social interactions as well as emotional distress and resultant impairment in QoL.
Patient groups noted that the treatment of CD includes a combination of medications, such as biosimilars, corticosteroids, amino salicylates, biologics, antibiotics, Janus kinase inhibitors, and immunomodulators. The CDHF and Gastrointestinal Society further noted that symptom management includes lifestyle adjustments and, in some cases, surgical interventions (i.e., bowel resection). Some benefits of these treatments include symptom control, remission maintenance, reduced dependence on corticosteroids, and the availability of different drug classes that allow for a more tailored treatment plan based on the patients’ needs. In the 2022 survey by Crohn’s and Colitis Canada, almost all respondents (93%) agreed they took systemic steroids only if needed, with more than 81% of respondents reporting side effects from taking these. More than half of the respondents agreed that using systemic steroids was a burden for managing their IBD. The CDHF underscored ongoing challenges with current treatments, including side effects, limited access due to high costs, insurance gaps, and logistical barriers. This patient advocacy group also emphasized the significant psychosocial impacts and diminished QoL that many patients continue to face.
The Gastrointestinal Society noted that patients with IBD have difficulty obtaining remission or adequate symptom relief. Their 2020 survey indicated that 33% of respondents did not believe their IBD was well-controlled by their current medications. In another 2024 survey, 29% of respondents believed their IBD was not well-controlled, 38% found it well-controlled, and 33% were unsure. At least 82% of respondents were at least somewhat concerned about running out of treatment options. In 1 survey, 63% of respondents reported symptom reduction on biologics, while 23% reported confirmed remission. The Gastrointestinal Society and CDHF patient groups highlighted that each person living with IBD had a different experience, and a treatment that worked for 1 person may not be tolerated by another.
The CDHF noted that 2 important outcomes for patients include having access to treatment options that can improve and control burdensome symptoms and reducing the feeling of bowel urgency. In addition, the Gastrointestinal Society noted that in terms of outcomes, access to medications that work, improved QoL, and sustained remission and/or treatment response are more important than relieving any single symptom. Furthermore, Crohn’s and Colitis Canada noted that understanding the long-term risks of IBD medications and minimizing the use of steroids were considered important. The organization also noted that respondents had various preferences on receiving their treatment, whether as pills (63%), self-injections at home (40%), or through IV (31%).
Clinician Input
Input From Clinical Experts Consulted for This Review
All CDA-AMC review teams include at least 1 clinical specialist with expertise regarding the diagnosis and management of the condition for which the drug is indicated. Clinical experts are a critical part of the review team and are involved in all phases of the review process (e.g., providing guidance on the development of the review protocol, assisting in the critical appraisal of clinical evidence, interpreting the clinical relevance of the results, and providing guidance on the potential place in therapy). The following input was provided by 2 clinical specialists with expertise in the diagnosis and management of CD.
Unmet Needs
At the time of this review, both clinical experts consulted by CDA-AMC stated that there are no curative treatments available for CD; all therapies remain focused on controlling, rather than eradicating, disease activity. In addition, the clinical experts noted that despite advancements in treatments for CD, a significant proportion of patients receiving current therapies do not achieve or sustain clinical response and remission. One clinical expert added that patients often experience primary nonresponse or secondary loss of response to current biologic treatments, particularly anti-TNF therapies. Both clinical experts indicated that endoscopic remission and mucosal and transmural healing are not achieved by most patients. One clinical expert indicated that there is a need for earlier detection and intervention, given that delays in diagnosis can lead to patients presenting with complications, such as strictures or fistulas. They also noted that treatment decisions and adherence are often affected by long-term safety concerns (e.g., infections or malignancy) and tolerability issues related to administration (e.g., injection-site reactions and infusion burden). One clinical expert noted that the EIMs of CD (such as arthritis or dermatologic or ocular symptoms) are often undertreated; in addition, symptoms such as fatigue, pain, and those related to mental health are not adequately addressed by treatments for CD. Lastly, 1 clinical expert noted a paucity of evidence for treatments for CD among certain populations, including people who are pregnant, pediatric, older, or have postoperative recurrence.
Place in Therapy
Mirikizumab, an anti–IL-23 drug, targets the underlying disease process of CD. Treatment with mirikizumab was administered as a monotherapy in the pivotal VIVID-1 trial. Although 1 expert noted that anti–IL-23 drugs are ideal to combine with other therapies due to an excellent safety profile, the clinical experts agreed that there is a lack of data to support the use of mirikizumab in combination with other advanced therapies for CD. The clinical experts consulted by CDA-AMC noted that mirikizumab would be most suitable for patients who are biologic-naive; these patients are less challenging to treat than patients with longer disease duration, multiple prior BFs, or other challenging disease characteristics, such as perianal disease activity. However, the clinical experts indicated that they did not expect the introduction of mirikizumab to shift the treatment paradigm for moderately to severely active CD in clinical practice in Canada, considering the other available treatment options. They noted that mirikizumab has the same mechanism of action as other anti–IL-23 drugs for CD, such as risankizumab, which would be many clinicians’ preferred first-line option. They noted that risankizumab demonstrated superiority to ustekinumab for relevant outcomes in CD (e.g., clinical and endoscopic response),43 whereas mirikizumab did not demonstrate superiority in these outcomes when compared to ustekinumab. The experts highlighted that mirikizumab has a more frequent dosing schedule than other biologic therapies for CD, which may negatively affect treatment adherence and QoL. Although the clinical experts agreed that mirikizumab may represent an additional treatment option for CD, they indicated that it would not be used in a similar manner to — or ahead of — other available therapies for CD (e.g., anti-TNF drugs, vedolizumab, ustekinumab, risankizumab, and upadacitinib). The clinical experts noted that the preferred first-line drug for patients with significant EIMs would be an anti-TNF drug or upadacitinib; the preferred first-line treatment for patients with perianal fistulas would be an anti-TNF drug. One clinical expert suggested that risankizumab would be the preferred treatment option for patients who have not responded to an anti-TNF drug and have no perianal fistulas or EIMs, while upadacitinib would be preferred for patients who have not responded to an anti-TNF-drug and have perianal fistulas or EIMs. The clinical experts noted that upadacitinib is a convenient option due to its oral administration.
Patient Population
The clinical experts consulted by CDA-AMC agreed that mirikizumab would be best suited for patients with moderately to severely active CD without perianal disease or significant EIMs. In this patient population, mirikizumab would be considered alongside other available therapies, including anti-TNF drugs, vedolizumab, ustekinumab, risankizumab, and upadacitinib. They also noted that factors for selecting treatment would include disease phenotype, mode and route of administration, and the length of intervals between doses for treatments administered by SC injection. One clinical expert noted that a patient preference for SC injection would be important for choosing treatment with mirikizumab, although this would not be a distinguishing factor as most treatments for advanced CD allow for self-injection.
Although the clinical experts consulted by CDA-AMC agreed that the eligibility criteria of the VIVID-1 trial are aligned with those in other trials for CD therapies, they agreed that the criteria were not entirely reflective of patients in clinical practice. For instance, they noted that many patients in clinical practice would be excluded from the VIVID-1 trial, such as those who want to get pregnant as well as those with ostomies, a higher risk of infection, or liver enzyme abnormalities. The clinical experts also indicated that patients with disease isolated to the ileum were underrepresented in the VIVID-1 trial compared to what was observed in clinical practice in Canada.
Assessing the Response Treatment
One clinical expert consulted by CDA-AMC indicated that response to mirikizumab in clinical practice would be determined by improvement in symptoms, elimination of corticosteroid dependence, normalization of biomarker levels, and improvement in endoscopic outcomes. The clinical expert noted that symptoms should be monitored on an ongoing basis, at a minimum every 3 months in the first year of therapy. The clinical experts also indicated that biomarkers (e.g., CRP, FCP) should be monitored every 3 months during the first year of therapy and assessments for endoscopic improvements should be performed 9 months to 12 months following therapy initiation. Lastly, they suggested that cross-sectional imaging could complement these assessments. The clinical experts consulted by CDA-AMC indicated that reduction in symptoms and improvement in biomarker levels should be assessed within the first 8 weeks to 12 weeks of treatment initiation. They also noted that normalization of symptoms and biomarkers should be achieved by 26 weeks, while endoscopic remission should be achieved after 8 weeks to 12 months.
Discontinuing Treatment
The clinical experts consulted by CDA-AMC agreed that patients should discontinue treatment with mirikizumab if they did not show clinical and/or biochemical response by week 12 after the induction treatment period. Although the clinical experts consulted by CDA-AMC agreed that a patient who exhibits any clinical benefit during the induction period (e.g., a partial clinical response, with significant improvement in symptoms and/or CRP and/or FCP) may benefit from an additional 12 weeks of mirikizumab treatment. However, if patients do not show improvement by week 24, mirikizumab should be discontinued. They also agreed that treatment with mirikizumab should be discontinued for patients who exhibit continued dependence on corticosteroids or upon the occurrence of intolerable side effects. One clinical expert added that treatment with mirikizumab should be discontinued among patients who fail to achieve clinical or biomarker remission by 24 weeks. The other clinical expert noted that treatment with mirikizumab should be discontinued among patients who experience disease progression, indicated by a need for surgery or hospitalization.
Prescribing Considerations
The clinical experts consulted by CDA-AMC indicated that treatment with mirikizumab should be prescribed and monitored by a specialist who is trained in the diagnosis and management of CD and/or IBD. Although they noted that these specialists would ideally be gastroenterologists, they can also be internal medicine specialists with a special interest in IBD or general or colorectal surgeons in areas where there may not be a gastroenterologist. The clinical experts consulted by CDA-AMC agreed that mirikizumab should be administered in settings with appropriate infrastructure and experience in the infusion of biologic therapies. These settings may include hospitals, specialty clinics, infusion centres, community clinics, and outpatient clinics. One clinical expert noted that health care professionals should train patients to properly self-inject mirikizumab.
Clinician Group Input
No clinician groups provided input for this submission.
Drug Program Input
The drug programs provide input on each drug being reviewed through the reimbursement review processes by identifying issues that may impact their ability to implement a recommendation. The implementation questions and corresponding responses from the clinical experts consulted by for this review are summarized in Table 5.
Table 5: Summary of Drug Plan Input and Clinical Expert Response
Drug program implementation questions | Clinical expert response |
|---|---|
Relevant comparators | |
The pivotal trial (the VIVID-1 study) compared mirikizumab with placebo and ustekinumab. Mirikizumab was found to be noninferior to ustekinumab for clinical remission at week 52. Ustekinumab for CD is funded in most (but not all) jurisdictions Risankizumab is a more relevant comparator. It received a positive CDEC recommendation and is funded in most (but not all) jurisdictions. | This was a comment from the drug programs to inform CDEC deliberations. |
Considerations for initiation of therapy | |
There is variability in the criteria for advanced therapies for CD between jurisdictions (i.e., in the definitions of what constitutes moderately to severely active CD, conventional therapy, inadequate response, loss of response, or intolerance to therapy). | This was a comment from the drug programs to inform CDEC deliberations. |
Alignment with the initiation criteria for advanced therapies for CD should be considered when appropriate. For example, eligibility should be based on the criteria used by each of the public drug plans for other biologic (or advanced) therapies for the treatment of adult patients with moderately to severely active CD. | This was a comment from the drug programs to inform CDEC deliberations. |
Considerations for continuation or renewal of therapy | |
The VIVID-1 trial measured clinical response at week 12; however, the product monograph notes that consideration should be given to discontinuing treatment in patients who have shown no evidence of therapeutic benefit by week 24. What would be an appropriate time frame for assessment of response to treatment? | The clinical experts consulted by CDA-AMC agree that treatment with mirikizumab should be discontinued if no clinical and/or biochemical response is observed by week 12. They also agreed that a patient who exhibits any clinical benefit (e.g., partial clinical response, with significant improvement in symptoms and/or CRP/FCP) may benefit from an additional 12 weeks of mirikizumab treatment. However, treatment should be discontinued if the patient does not improve by week 24. |
Alignment with renewal criteria for advanced therapies for CD should be considered when appropriate. | This was a comment from the drug programs to inform CDEC deliberations. |
Considerations for prescribing of therapy | |
The recommended induction dosage is 900 mg IV at week 0, week 4, and week 8. The recommended maintenance dosage is 300 mg SC (given as 2 consecutive injections of 100 mg and 200 mg) every 4 weeks starting at week 12, upon completion of induction dosing. Is there a potential for dose escalation with mirikizumab? | One clinical expert consulted by CDA-AMC indicated that some patients with CD may benefit from dose escalation of treatment. However, both experts consulted by CDA-AMC agree that there is a lack of data to support dose escalation of mirikizumab for the treatment of CD. |
Is there any evidence to support the use of mirikizumab in combination with other advanced therapies for CD? | The clinical experts consulted by CDA-AMC agreed that there is a lack of data to support the use of mirikizumab in combination with other advanced therapies for CD. However, 1 expert noted that anti–IL-23 drugs would potentially be ideal to combine with other therapies due to their excellent safety profile. |
Alignment with prescribing criteria for advanced therapies for CD should be considered when appropriate. | This was a comment from the drug programs to inform CDEC deliberations. |
Care provision issues | |
Mirikizumab requires IV induction (for 3 doses) administered by a health care professional in a hospital or infusion clinic setting. | This was a comment from the drug programs to inform CDEC deliberations. |
System and economic issues | |
The sponsor’s BIA indicates that the incremental budget impact of funding mirikizumab will be $5.7 million in year 1, $15.1 million in year 2, and $17.7 million in year 3, for a 3‑year incremental budget impact of $38.6 million. | This was a comment from the drug programs to inform CDEC deliberations. |
Ustekinumab (biosimilars) and risankizumab also have confidential negotiated prices. | This was a comment from the drug programs to inform CDEC deliberations. |
BIA = budget impact analysis; CD = Crohn disease; CDA-AMC = Canada’s Drug Agency; CDEC = Canadian Drug Expert Committee; CRP = C-reactive protein; FCP = fecal calprotectin; SC = subcutaneous.
Clinical Evidence
The objective of this Clinical Review Report is to review and critically appraise the clinical evidence submitted by the sponsor on the beneficial and harmful effects of mirikizumab 300 mg/15 mL solution for IV infusion after dilution in a vial or 100 mg/1 mL or 200 mg/2 mL solution in a prefilled pen or syringe for SC injection for the treatment of adult patients with moderately to severely active CD who have experienced an inadequate response, loss of response, or intolerance to a conventional therapy or biologic treatment. The focus will be on comparing mirikizumab to relevant comparators and identifying gaps in the current evidence.
A summary of the clinical evidence included by the sponsor in the review of mirikizumab is presented in 3 sections, with our critical appraisal of the evidence included at the end of each. The first section, the systematic review, includes pivotal studies and RCTs that were selected according to the sponsor’s systematic review protocol. Our assessment of the certainty of the evidence in this first section using the GRADE approach follows the critical appraisal of the evidence. The second section includes sponsor-submitted LTE studies. The third section includes indirect evidence from the sponsor. No additional studies that were considered to address important gaps in the systematic review evidence were submitted by the sponsor.
Included Studies
Clinical evidence from the following is included in the review and appraised in this document:
1 pivotal study identified in the systematic review
1 LTE
1 ITC.
Systematic Review
The contents of this section have been informed by materials submitted by the sponsor. The following has been summarized and validated by the review team.
Description of Study
Characteristics of the included study are summarized in Table 6.
Table 6: Details of Studies Included in the Systematic Review
Detail | VIVID-1 study |
|---|---|
Designs and populations | |
Study design | Phase III, multicentre, randomized, double-blind, placebo- and active-controlled treat-through study |
Locations | 328 sites in total, 324 of which randomized adults and 4 of which randomized adolescents (as part of the terminated adolescent addendum)a in Argentina, Australia, Austria, Belgium, Brazil, Canada (10 sites), China, Croatia, Czech Republic, Denmark, France, Germany, Hungary, India, Israel, Italy, Japan, Latvia, Lithuania, Mexico, the Netherlands, Poland, Romania, Russian Federation, Serbia, Slovakia, South Korea, Spain, Switzerland, Turkey, Ukraine, UK, and US. |
Patient enrolment dates | Start date: July 23, 2019 (first patient visit) End date: August 23, 2023 (last patient visit) |
Randomized (N) | Randomized: 1,152 PAS: 1,065
|
Inclusion criteria |
|
Exclusion criteria |
|
Drugs | |
Intervention | Mirikizumab:
|
Comparators | Ustekinumab:
Placebo:
|
Study duration | |
Screening phase | Up to 5 weeks |
Run-in phase | Not applicable |
Treatment phase | 52 weeks |
Follow-up phase |
|
Outcomes | |
Primary end point | Coprimary end points comparing mirikizumab vs. placebo:
|
Secondary and exploratory end points | Major secondary end points Mirikizumab vs. placebo Single end points Proportion of patients achieving:
Change from baseline in:
Composite end points Proportion of patients achieving PRO clinical response at week 12 and each of the following results individually:
Mirikizumab vs. ustekinumab Proportion of patients achieving:
Other secondary end points comparing mirikizumab vs. placebo Proportion of patients achieving:
Proportion of patients achieving PRO clinical response at week 12 and each of the following results individually:
Change from baseline to week 12 and week 52 in each of the following:
Proportion of patients in the mITT population achieving:
Proportion of patients in the not-BF and BF subgroups achieving:
Proportion of patients in the not-BF and BF subgroups achieving PRO clinical response at week 12 and each of the following results individually at week 52:
Proportion of patients who had:
Proportion of patients achieving PRO clinical response at week 12 and each of the following results individually, evaluated at week 24 and week 52:
Other secondary end points comparing mirikizumab vs. ustekinumab Proportion of patients achieving:
Proportion of patients in the not-BF and BF subgroups achieving:
Other secondary end points
|
Publication status | |
Publications | Ferrante M, D'Haens G, Jairath V, et al. Efficacy and safety of mirikizumab in patients with moderately-to-severely active CD: a phase III, multicentre, randomized, double-blind, placebo-controlled and active-controlled, treat-through study. The Lancet. 2024;404(10470):2423 to 2436. doi:10.1016/S0140-6736(24)01762-8 ClinicalTrials.gov identifier: NCT03926130 EudraCT Number: 2018 to 004614 to 18 |
AP = abdominal pain; BF = biologic failure; CD = Crohn disease; CDAI = Crohn’s Disease Activity Index; CRP = C-reactive protein; EIM = extraintestinal manifestation; FACIT-Fatigue = Functional Assessment of Chronic Illness Therapy – Fatigue; FCP = fecal calprotectin; GI = gastrointestinal; IBD = inflammatory bowel disease; IBDQ = Inflammatory Bowel Disease Questionnaire; IL = interleukin; mITT = modified intention to treat; NRS = numeric rating scale; PAS = primary analysis set; PRO = patient-reported outcome; q.4.w. = every 4 weeks; q.8.w. = every 8 weeks; SC = subcutaneous; SES-CD = Simple Endoscopic Score for Crohn’s Disease; SF = stool frequency; SF-36 = Short Form (36) Health Survey; TNF = tumour necrosis factor; UC = ulcerative colitis; vs. = versus; WPAI:CD = Work Productivity and Activity Impairment Questionnaire: Crohn’s Disease.
aOnly data pertaining to randomized adults were included and discussed in the VIVID-1 trial.
Sources: VIVID-1 study (I6T-MC-AMAM) Clinical Study Report.29 Details included in the table are from the sponsor’s Summary of Clinical Evidence.16
One pivotal RCT (the VIVID-1 study) was included in the systematic review. The VIVID-1 trial was a phase III, multicentre, double-blind, placebo- and active-controlled (ustekinumab), treat-through RCT to evaluate the efficacy and safety of mirikizumab in patients with moderately to severely active CD. The coprimary objectives of the VIVID-1 trial were to evaluate the superiority of the efficacy of mirikizumab compared to placebo as assessed by the following 2 composites: clinical response measured by patient-reported outcome (PRO) (which pertains to 2 of the patient-reported items of the Crohn’s Disease Activity Index [CDAI], at least a 30% decrease in stool frequency and/or abdominal pain with neither score worse than baseline) (PRO clinical response) at week 12 plus endoscopic response at week 52 (defined as a 50% or greater reduction from baseline in SES-CD total score) (SES-CD endoscopic response) and PRO clinical response at week 12 plus clinical remission measured by CDAI score (CDAI clinical remission) at week 52. The major secondary objectives of the VIVID-1 trial that are of interest to the review included the single end points of endoscopic response (assessed at week 12 and week 52); CDAI clinical remission at week 12 and week 52; SES-CD endoscopic remission at week 12; PRO clinical response at week 12; and change in FACIT – Fatigue score from baseline to week 12. The objectives also included 3 composite end points: PRO clinical response at week 12 and PRO clinical remission at week 52; PRO clinical response at week 12 and endoscopic remission at week 52; and PRO clinical response at week 12, corticosteroid-free status (from week 40 to week 52), and CDAI clinical remission at week 52. The major secondary end points comparing the efficacy of mirikizumab to ustekinumab were the 2 single end points of SES-CD endoscopic response at week 52 for superiority and CDAI clinical remission at week 52 as a noninferiority end point.
The VIVID-1 trial enrolled patients with moderate to severely active CD who experienced an inadequate response, loss of response, or intolerance to corticosteroids, immunomodulators, or approved biologic therapy for CD. Patients were enrolled across 328 sites in 34 countries. Of these, 324 sites randomized adults and 4 sites randomized adolescents (as part of the terminated adolescent addendum). Ten of the 328 sites were in Canada. A total of 1,152 patients were randomized in a 6:3:2 ratio to receive mirikizumab or placebo or ustekinumab during the induction phase, during which randomization was stratified by failure of biological therapies (yes or no), baseline corticosteroid use (yes or no), baseline SES-CD total score (less than 12 versus 12 or higher), region (North America versus Europe versus rest of world), and a combined stratification factor using either a baseline SF score of 7 or more and/or an AP score of 2.5 or more (yes or no). Patients, study investigators, and study site personnel were blinded to treatment allocation.
The VIVID-1 trial consisted of a screening phase, an induction treatment phase, and a maintenance treatment phase (Figure 1). During the screening phase, patients provided their signed informed consent for study eligibility and were screened for eligibility; screening activities could be performed on more than 1 day, as long as all activities were completed within 5 weeks from the baseline visit (week 2). During the induction treatment phase, patients were randomized to receive double-blinded treatment with mirikizumab, placebo, or ustekinumab. The induction treatment phase lasted 12 weeks. Patients receiving mirikizumab or placebo received treatment at weeks 0, 4, and 8; patients receiving ustekinumab received a single dose of treatment at week 0, followed by placebo at weeks 4 and 8. The maintenance treatment phase began at week 12 and lasted for 40 weeks, resulting in an overall double-blind treatment period lasting 52 weeks (visits 2 to 17). During the maintenance treatment phase, patients assigned to receive mirikizumab or ustekinumab as induction therapy continued to receive their interventions at the doses indicated for maintenance. Patients in the placebo group who were responders at week 12 (defined as patients who achieved at least a 30% decrease in SF and/or AP, with neither score worse than baseline) continued on placebo during the maintenance treatment phase. Those who were considered nonresponders at week 12 started blinded mirikizumab induction therapy followed by blinded mirikizumab maintenance therapy for the remainder of the study. Patients who completed the study through visit 17 were given the option to enrol in the VIVID-2 LTE study, if they were eligible. Patients who did not meet the enrolment criteria for the VIVID-2 study or who chose not to enrol in it returned for 2 posttreatment follow-up visits in the VIVID-1 trial.
The primary database lock for the analysis of the VIVID-1 trial was performed on October 4, 2023, after all patients had completed the week 52 visit or early termination visit. The primary database lock corresponded to a data cut-off date of August 23, 2023, and was the final analysis for the primary efficacy objective of the study. The planned primary objective of the study was the basis of this review. An updated final database lock is expected to occur after all patients complete the study, including the posttreatment follow-up period for patients who remained in the study at the time of the primary database lock. There are no planned alpha adjustments for these updated final analyses. The VIVID-1 trial was funded by Eli Lilly Canada Inc.
Figure 1: Study Design for the VIVID-1 Study
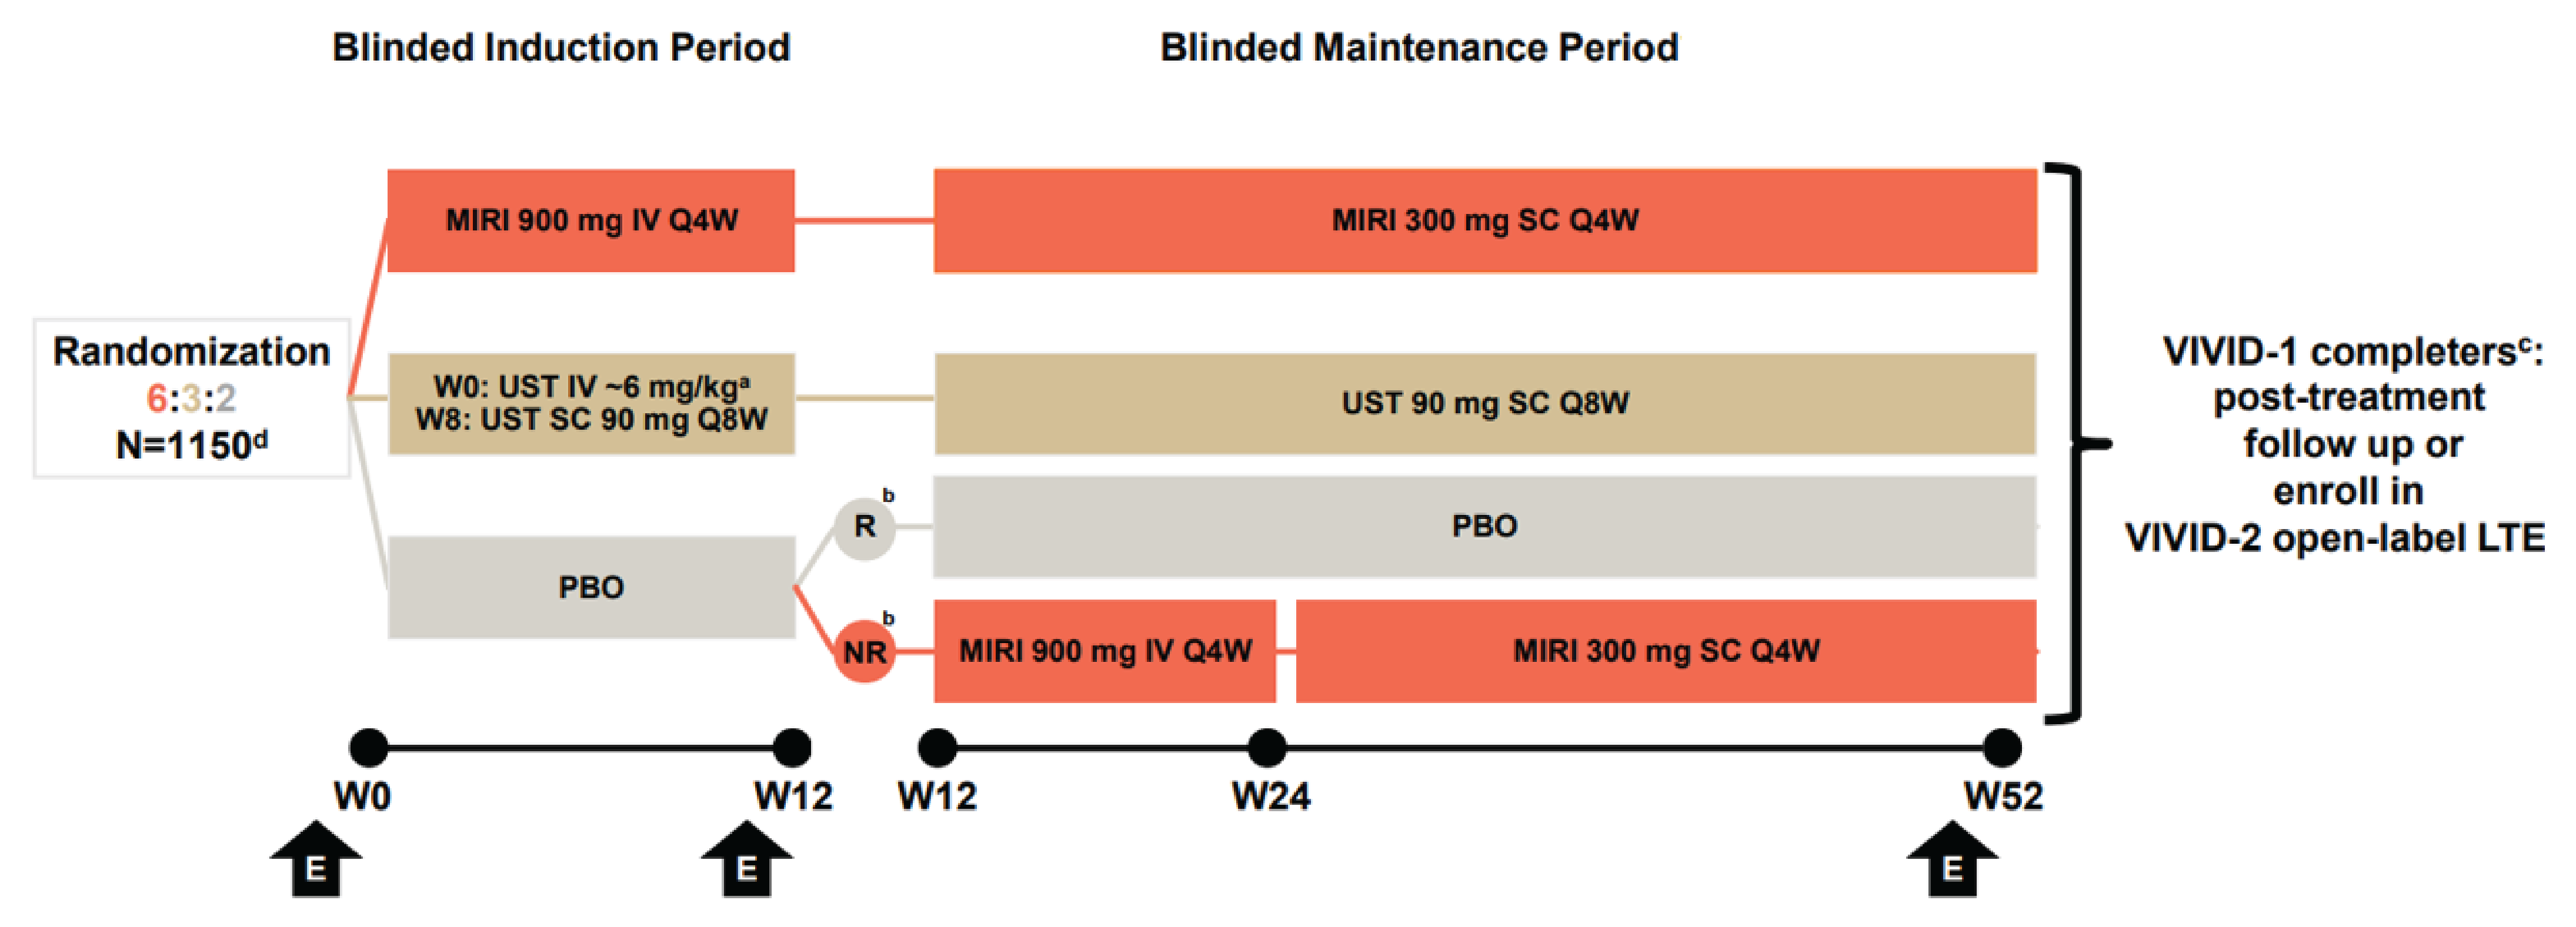
E = endoscopy; ITT = intention to treat; LTE = long-term extension; MIRI = mirikizumab; NR = nonresponder; PBO = placebo; PRO = patient-reported outcome; Q4W = every 4 weeks; Q8W = every 8 weeks; R = responder; SC = subcutaneous; UST = ustekinumab; W0 = week 0; W8 = week 8; W12 = week 12; W24 = week 24; W52 = week 52.
aSingle dose.
bResponders as measured by PROs at week 12 of the VIVID-1 trial were defined as those who achieved ≥ 30% decrease in loose stool frequency and/or abdominal pain, with neither score worse than baseline.
cThe primary completion date was estimated to be August 16, 2023.
dA total of 1,152 patients were randomized to receive treatment (i.e., the ITT population). Of these, 1,150 patients received at least 1 dose (i.e., the safety population).
Sources: Data on file from Eli Lilly Canada Inc.44 Details included in the table are from the sponsor’s Summary of Clinical Evidence.16
Populations
Inclusion and Exclusion Criteria
Patients who were eligible to participate in the VIVID-1 trial were required to be 18 years to 80 years of age and to have received a confirmed diagnosis of CD or fistulizing CD at least 3 months before study enrolment. Patients were required to have moderately to severely active CD, which was defined as an unweighted daily average SF score of 4 or higher (i.e., loose and watery stools, defined as Bristol stool scale category 6 or 7) and/or an unweighted daily average AP score of 2 or higher at baseline. Moreover, within 21 days before randomization, patients with ileal-colonic CD were required to have an SES-CD score of 7 or higher, while those with isolated ileal disease were required to have an SES-CD score of 4 or higher. Patients were also required to have experienced a previous inadequate response, loss of response, or intolerance to at least 1 corticosteroid, immunomodulator (i.e., azathioprine, 6-mercaptopurine, methotrexate, or a combination of thiopurine and allopurinol), or approved biologic therapy for CD (e.g., anti-TNF antibody or anti-integrin antibody).
Patients were ineligible to participate in the VIVID-1 trial if they had a current diagnosis of ulcerative colitis or unclassified IBD. Moreover, patients were excluded from the trial if they had discontinued an anti–IL-12 or IL-23 p40 antibody due to primary nonresponse, secondary loss of response, or intolerance, or if they had received more than the IV induction dose and 1 SC dose. Patients were also excluded from the trial if they had (or were suspected to have) an abscess or if they had undergone a bowel resection within the past 6 months or intra-abdominal surgery within 3 months of baseline. In addition, patients were excluded if they had a current infection, a history of cancer of the GI tract, or complications of CD (e.g., symptomatic strictures, stenosis, or short bowel syndrome) that could possibly confound the assessment of treatment effect.
Interventions
During the induction treatment period of the VIVID-1 trial (i.e., weeks 0 to 12), patients were randomized to receive either mirikizumab at a dose of 900 mg IV every 4 weeks (weeks 0, 4, and 8), ustekinumab at a dose of approximately 6 mg/kg IV at week 0 followed by 90 mg SC at week 8, or placebo every 4 weeks. During the maintenance treatment period (i.e., weeks 12 to 52), patients who had received mirikizumab or ustekinumab as induction treatment continued to receive the same intervention administered at maintenance doses (i.e., mirikizumab was administered at 300 mg SC every 4 weeks, while ustekinumab was administered at 90 mg SC every 8 weeks). Patients who had received placebo during the induction treatment period and were considered responders at week 12 (defined as achieving at least a 30% decrease in SF, AP, or both, with neither score worse than baseline) continued to receive placebo every 4 weeks during the maintenance treatment phase. Patients who had received placebo during the induction treatment period and were considered nonresponders at week 12 received blinded mirikizumab, administered as 900 mg IV every 4 weeks for the first 3 doses, followed by blinded mirikizumab, administered as 300 mg SC every 4 weeks. To maintain blinding of treatment in the study, a double-dummy design was maintained throughout to mask differences in treatment and in the frequency of treatment administration.29 Namely, patients in either the mirikizumab or ustekinumab groups received placebo to match the other active group. Participants in the placebo group received both of the double-dummy placebo administrations.
The study intervention could be permanently discontinued or temporarily withheld during the study. Possible reasons for permanent discontinuation included patient request, disease worsening (requiring treatment with surgery or a prohibited medication), safety considerations (e.g., malignancy, infection, or pregnancy), a hepatic event or liver test abnormality, unblinding, and treatment noncompliance. Patients who discontinued the study drug prematurely completed AE and other follow-up procedures, including the early termination and posttreatment follow-up visits. Reasons for temporary discontinuation of the drug included (but were not limited to) the development of a clinically important intestinal or extraintestinal infection, a requirement for major surgery, and laboratory abnormalities that could lead the investigator to temporarily discontinue the study drug until resolution of abnormalities.
The VIVID-1 trial allowed prior and concomitant therapies, provided that specific criteria were met based on drug class. Oral aminosalicylic acids were permitted if the prescribed dose was stable for at least 2 weeks before the screening endoscopy and remained stable throughout the study (unless medication was discontinued due to a toxicity related to the medication). Oral corticosteroids (i.e., prednisone administered at 30 mg/day or less or equivalent, or budesonide administered at 9 mg/day or less) were allowed if the prescribed dose was stable for at least 2 weeks before the screening endoscopy and remained stable until week 12. At week 12, patients who had received corticosteroids and achieved PRO clinical response initiated corticosteroid tapering, as outlined in the study protocol. Patients who achieved clinical response after week 12 initiated the corticosteroid taper at the visit at which clinical response was noted to be achieved. Treatment with immunomodulators was permitted if the prescribed dose was stable for at least 8 weeks before the screening endoscopy and remained stable throughout the study, unless medication was discontinued due to toxicity related to the medication. Treatment with antibiotics for CD was allowed to continue if the prescribed dose was stable for 4 weeks before baseline or if treatment was stopped at least 3 weeks before the screening endoscopy. The study did not include rescue therapy for patients who were assigned to an active study drug (i.e., mirikizumab or ustekinumab). Patients who received placebo and were considered nonresponders at week 12 received mirikizumab.
Outcomes
Efficacy
A list of efficacy end points assessed in this Clinical Review Report is provided in Table 7, followed by descriptions of the outcome measures. Summarized end points are based on the outcomes included in the sponsor’s Summary of Clinical Evidence16 as well as any outcomes identified as important to this review, according to the clinical experts consulted for this review and the input from patient and clinician groups and public drug plans. Using the same considerations, we selected end points that were considered most relevant to inform the expert committee deliberations and finalized this list of end points in consultation with members of the expert committee. All summarized efficacy end points were assessed using GRADE. Select notable harms outcomes considered important for informing the expert committee deliberations were also assessed using GRADE.
The clinical experts noted that in assessing a drug’s value for treating patients with CD, while the analyses predominantly looked at historically symptomatic or clinical end points, the focus has shifted to including more objective markers of disease activity, with the most critical outcomes being endoscopic outcomes (i.e., endoscopic response and endoscopic remission). According to the clinical experts, other measures — such as fatigue, depression, and work productivity — are still relevant, but tend to improve naturally as patients achieve disease remission. Because of this, clinical practice prioritizes improving endoscopic outcomes first, with the understanding that improvements in HRQoL will follow.
There were 2 coprimary end points in the VIVID-1 trial, both comparing mirikizumab against placebo. In total, 12 major secondary outcomes in the VIVID-1 trial were adjusted for multiple testing; 10 outcomes were compared between mirikizumab and placebo (7 singular outcomes and 3 composite outcomes); and 2 were compared between mirikizumab and ustekinumab (2 singular end points).
Mirikizumab Versus Placebo
The outcomes selected for GRADE for the comparison against placebo included the 2 coprimary end points, 4 select major secondary end points, 1 other secondary end point, and 1 additional end point (refer to Table 7). The clinical experts consulted by CDA-AMC agreed that the selection of outcomes for GRADE was appropriate to assess a drug’s performance in the target patient population. In addition, 4 major secondary end points, 1 other secondary end point, and 1 additional end point — which were considered by the clinical experts to be complementary to the key outcomes included in GRADE — were reported in the main section of the report (refer to Table 7). Furthermore, 2 major secondary end points — the composite end point of PRO clinical remission at week 12 and week 52 and the single end point of change from baseline in FACIT-Fatigue score at week 12 — are reported in the appendix of this report (refer to Table 34 and Table 35). The experts noted that these 2 end points would not guide their treatment decision beyond the results captured in the GRADE assessment. However, recognizing that fatigue is a symptom mentioned by patient groups and these end points were major secondary end points in the VIVID-1 trial and were adjusted for multiple comparisons, both end points have been reported in the appendix of this Clinical Review Report.
Mirikizumab Versus Ustekinumab
The outcomes selected for GRADE for the comparison against ustekinumab included 2 major secondary outcomes, 3 other secondary outcomes, and 4 additional end points (refer to Table 7).
Table 7: VIVID-1 Study Outcomes Summarized in the Systematic Review Section
Outcome measure | Time point | Mirikizumab vs. placebo | Mirikizumab vs. ustekinumab | Included in GRADE assessment |
|---|---|---|---|---|
Proportion of patients achieving PRO clinical response at week 12 and SES-CD endoscopic response at week 52 | Week 52 | Coprimary end pointa | Additional end pointb | Yes |
Proportion of patients achieving PRO clinical response at week 12 and CDAI clinical remission at week 52 | Week 52 | Coprimary end pointa | Additional end pointb | Yes |
PRO clinical response | Week 12 | Major secondary end pointa | Other secondary end point | No |
Week 52 | Other secondary end pointb | Other secondary end point | ||
CDAI clinical remission | Week 12 | Major secondary end pointa | Other secondary end point | Yes |
Week 52 | Major secondary end pointa | Major secondary end point (noninferiority)a | Yes (vs. ustekinumab) No (vs. placebo) | |
Corticosteroid-free CDAI clinical remission | Week 52 | Additional end pointb | Other secondary end point | No |
SES-CD endoscopic response | Week 12 | Major secondary end pointa | Other secondary end point | No |
Week 52 | Major secondary end pointa | Major secondary end pointa | Yes | |
SES-CD endoscopic remission | Week 12 | Major secondary end pointa | Additional end pointb | No |
Week 52 | Additional end pointb | Other secondary end point | Yes | |
Proportion of patients achieving PRO clinical response at week 12 and SES-CD endoscopic remission at week 52 | Composite outcome | Major secondary end pointa | Additional end pointb | Yes |
Proportion of patients achieving PRO clinical response at week 12 and corticosteroid-free status from week 40 to week 52 and CDAI clinical remission at week 52 | Composite outcome | Major secondary end pointa | Additional end pointb | Yes |
Change from baseline in IBDQ | Week 12 | Other secondary end point | Additional end pointb | No |
Week 52 | Yes |
CDAI = Crohn’s Disease Activity Index; GRADE = Grading of Recommendations Assessment, Development, and Evaluation; IBDQ = Inflammatory Bowel Disease Questionnaire; PRO = patient-reported outcome; SES-CD = Simple Endoscopic Score for Crohn’s Disease; vs. = versus.
aStatistical testing for these end points was adjusted for multiple comparisons (e.g., hierarchal testing).
bAlthough this outcome was not formally defined as an end point of the VIVID-1 study for this comparison, outcome data were available for this comparison.
Sources: VIVID-1 study (I6T-MC-AMAM) Clinical Study Report.29 Details included in the table are from the sponsor’s Summary of Clinical Evidence.16
Efficacy End Points
PRO clinical response at week 12 and SES-CD endoscopic response at week 52: The composite outcome of the proportion of patients achieving PRO clinical response at week 12 and SES-CD endoscopic response at week 52 was measured for mirikizumab compared with placebo as a coprimary end point in the VIVID-1 trial.
Although this composite outcome was not formally defined as a secondary end point for mirikizumab compared with ustekinumab, data for this outcome were available for this comparison.
PRO clinical response was defined as at least a 30% decrease in SF (Bristol stool scale category 6 or 7) and/or AP (based on the 0 to 3 scale of the CDAI), with neither score being worse than baseline. SES-CD endoscopic response was defined as at least a 50% reduction from baseline in SES-CD total score. This composite outcome was considered important by the clinical experts consulted by CDA-AMC and based on input from patient groups.
PRO clinical response at week 12 and CDAI clinical remission at week 52: The composite outcome of the proportion of patients achieving PRO clinical response at week 12 and CDAI clinical remission at week 52 was measured for mirikizumab compared with placebo as a coprimary end point in the VIVID-1 trial.
Although this composite outcome was not formally defined as a secondary end point for mirikizumab compared with ustekinumab, data for this outcome were available for this comparison.
The definition of PRO clinical response was previously discussed in this section. CDAI clinical remission was defined as an unweighted daily average SF of 3 or less (number of liquid or very soft stools, defined as Bristol stool scale category 6 or 745) and an unweighted daily average AP of 1 or less (with AP measured on a 4-point scale where 0 = none, 1 = mild, 2 = moderate, and 3 = severe), with neither being worse than at baseline. This composite outcome was considered important by the clinical experts consulted by CDA-AMC and based on input from patient groups.
PRO clinical response at week 12 and week 52: The proportion of patients achieving PRO clinical response at week 12 was measured as a major secondary end point for mirikizumab compared with placebo in the VIVID-1 trial, whereas the outcome measured at week 52 was designated as another secondary end point for this comparison.
This outcome was measured at week 12 and week 52 as other secondary end points for mirikizumab compared with ustekinumab.
This outcome was considered important by the clinical experts consulted by CDA-AMC and based on input from patient groups.
CDAI clinical remission at week 12 and week 52: The proportions of patients achieving clinical remission assessed using the CDAI scores as single end points at both week 12 and week 52 were defined as major secondary end points for mirikizumab compared with placebo in the VIVID-1 trial.
CDAI clinical remission was measured at week 52 as a major secondary end point to assess the noninferiority of mirikizumab compared with ustekinumab. It was also measured at week 12 as another secondary end point for mirikizumab compared with ustekinumab.
This outcome was considered important by the clinical experts consulted by CDA-AMC and based on input from patient groups.
SES-CD endoscopic response at week 12 and week 52: The proportion of patients achieving endoscopic response, assessed using the SES-CD as a single end point at both week 12 and week 52, was defined as a major secondary end point for mirikizumab compared with placebo in the VIVID-1 trial.
This outcome was also measured at week 52 as a major secondary end point for mirikizumab compared with ustekinumab, and at week 12 as another secondary end point for this comparison.
This outcome was considered important by clinical experts consulted by CDA-AMC and based on input from patient groups.
SES-CD endoscopic remission at week 12 and week 52: The proportion of patients achieving SES-CD endoscopic remission at week 12 was a major secondary end point for mirikizumab compared with placebo in the VIVID-1 trial. Although SES-CD endoscopic remission at week 52 was not formally defined as a secondary end point for this comparison, data were also available for this outcome at this time point.
This outcome was measured at week 52 as another secondary end point for mirikizumab compared with ustekinumab in the VIVID-1 trial. Although SES-CD endoscopic remission at week 12 was not formally defined as a secondary end point for this comparison, data were also available for this outcome at this time point.
Endoscopic remission was defined as an SES-CD total score of 4 or less and at least a 2-point reduction from baseline, with no subscore being more than 1. This outcome was considered important by clinical experts consulted by CDA-AMC and based on input from patient groups.
PRO clinical response at week 12 and SES-CD endoscopic remission at week 52: The composite outcome of the proportion of patients achieving PRO clinical response at week 12 and SES-CD endoscopic remission at week 52 was a major secondary end point for mirikizumab compared with placebo in the VIVID-1 trial.
Although this composite outcome was not formally defined as a secondary end point for mirikizumab compared with ustekinumab, data for this outcome were available for this comparison.
This outcome was considered important by the clinical experts consulted by CDA-AMC and based on input from patient groups.
PRO clinical response at week 12 and 12-week (week 40 to week 52) corticosteroid-free status and CDAI clinical remission at week 52: The composite outcome of the proportion of patients achieving PRO clinical response at week 12 and achieving clinical remission by CDAI at week 52 while remaining corticosteroid-free from week 40 to week 52 was a major secondary end point for mirikizumab compared with placebo in the VIVID-1 trial.
Although this composite outcome was not formally defined as a secondary end point for mirikizumab compared with ustekinumab, data for this outcome were available for this comparison.
This outcome was considered important by the clinical experts consulted by CDA-AMC and based on input from patient groups.
Corticosteroid-free CDAI clinical remission at week 52: The composite outcome of the proportion of patients achieving clinical remission by CDAI at week 52 while remaining corticosteroid-free from week 40 to week 52 was a designated other secondary end point for mirikizumab compared with ustekinumab in the VIVID-1 trial.
Although this composite outcome was not formally defined as a secondary end point for mirikizumab compared with ustekinumab, data for this outcome were available for this comparison.
This outcome was considered important by the clinical experts consulted by CDA-AMC and based on input from patient groups.
Change from baseline in IBDQ at week 12 and week 52: The change in IBDQ score from baseline at week 12 and week 52 was measured as another secondary end point for mirikizumab compared with placebo in the VIVID-1 trial.
The change in IBDQ score from baseline at week 12 and week 52 was also reported for mirikizumab compared with ustekinumab, although it was not formally defined as a secondary outcome of the trial.
The IBDQ is a 32-item, disease-specific QoL measure that has been psychometrically validated in patients with CD. It consists of 4 domains: bowel symptoms, systemic symptoms, emotional function, and social function. The IBDQ is completed by patients, with scores ranging from 32 to 224; a higher score indicates a better QoL.46,47 This outcome was considered to be important based on input from patient groups.
Harms
The harm outcomes assessed were AEs, SAEs, withdrawal due to AEs, deaths, and notable harms. According to the product monograph for mirikizumab and clinical experts consulted by CDA-AMC, the notable harms defined for this review included infections, infusion- and injection-site reactions, hepatic events, depression, suicidal ideation, immediate and nonimmediate hypersensitivity reactions, cerebrocardiovascular events, and malignancies.
The proportion of patients with SAEs was determined by the clinical experts to be a relevant safety indicator and was included in the GRADE assessment.
Table 8: Summary of Outcome Measures and Their Measurement Properties
Outcome measure | Type | Conclusions about measurement properties | MID |
|---|---|---|---|
CDAI | The CDAI is a disease-specific index used to assess the severity of CD.48,49 It consists of 8 items, each of which is independently weighted, including stool frequency (weight = 2), abdominal pain (weight = 5), general well-being (weight = 7), sum of 6 findings (weight = 20), antidiarrheal use (weight = 30), hematocrit (weight = 6), and body weight (weight = 1). The overall CDAI score is based on the sum of the weighted value of each item and ranges from 0 to 600, where a score of 150 is defined as the threshold between remission and active disease.48,49 Scores ranging from 150 to 219 indicate mild to moderate CD; scores ranging from 220 to 450 indicate moderate to severe CD; and scores higher than 450 indicate very severe CD. Item scores are derived using patient diaries, which are based on the 7 days preceding each visit. | Construct validity: The items included in the CDAI were selected by gastroenterologists and are based on accepted features of CD.48 Criterion validity: The CDAI does not demonstrate any significant correlation between the overall score and objective measurements, such as mucosal healing. However, due to the multifaceted nature of CD, the lack of correlation may not be indicative of a lack of criterion validity.48 Predictability is another component of criterion validity. One study demonstrated that CDAI scores increased 2 months preceding exacerbations of CD and decreased 1 month following exacerbations of CD, demonstrating criterion validity.48 Test-retest reliability: the index provided good to very good test-retest reliability, evaluated based on 2 successive visits for 32 patients.48,50 The CDAI was subsequently re-evaluated and rederived using data collected from 1,058 patients and demonstrated little difference compared to the original formulation; therefore, the original version was recommended.51 | No information regarding an MID for the CDAI in patients with CD was identified. The FDA23 and EMA52 have suggested that a change of 100 points in the CDAI is considered a more meaningful response (i.e., an enhanced clinical response).49 |
SES-CD | The SES-CD was designed to assess 4 endoscopic items, including the size of ulcers, ulcerated surface, affected surface, and the presence of narrowing.53 Each item is scored from 0 to 3, with the total score ranging from 0 to 56. Higher scores indicate more severe disease. | Construct validity: Daperno et al. (2004)53 validated the SES-CD against the CDEIS in 70 patients with CD and found a strong correlation between the 2 instruments (multiple correlation coefficient = 0.920; 95% CI, 0.8740 to 0.9497). After the construction of the SES-CD, Daperno et al. (2004)53 validated it against the CDEIS in a sample of 121 patients with CD. The Pearson and Spearman rank correlation coefficients between the SES-CD and CDEIS were 0.887 (95% CI, 0.8418 to 0.9199) and 0.910 (95% CI, 0.8734 to 0.9364), respectively. In a review, estimates of correlation between the SES-CD and CDAI ranged from 0.15 to 0.92.53 Intra- and interrater reliability: Khanna et al. (2016)54 found in 50 patients with CS that the ICC for intrarater agreement for SES-CD was 0.91 (95% CI, 0.89 to 0.95). The corresponding ICC for inter-rater agreement was 0.83 (95% CI, 0.75 to 0.88). | No information regarding an MID for the SES-CD in patients with CD was identified. |
IBDQ | The IBDQ is a 32-item, patient-completed questionnaire consisting of 4 domains: bowel symptoms, systemic symptoms, emotional function, and social function.46,47 Responses are rated on a 7-point Likert scale where 7 = not a problem at all and 1 = a very severe problem. The IBDQ total score is calculated as the sum of all questions, and it ranges from 32 to 224, with higher scores indicating better HRQoL. IBDQ response is defined as a ≥ 16‑point improvement from baseline in IBDQ score. IBDQ remission is defined as a total score of ≥ 170. | This questionnaire has been validated in a variety of settings, countries, and languages.55,56 Discriminant validity: A review55 of 9 validation studies on the IBDQ in patients with IBD reported that the IBDQ was able to differentiate between patients with disease remission and patients with disease relapse. Responsiveness: 6 studies evaluated the IBDQ for sensitivity to change; all found that changes in HRQoL correlated to changes in clinical activity in patients with CD.55 | In the study by Gregor et al.,57 an increase of at least 16 points in the IBDQ total score or 0.5 points or more per question in patients with CD was considered a clinically meaningful improvement. |
CD = Crohn disease; CDAI = Crohn’s Disease Activity Index; CDEIS = Crohn’s disease Endoscopic Index of Severity; CI = confidence interval; CS = corticosteroid; EMA = European Medicines Agency; HRQoL = health-related quality of life; IBD = inflammatory bowel disease; IBDQ = Inflammatory Bowel Disease Questionnaire; ICC = intraclass correlation coefficient; MID = minimally important difference; SES-CD = Simple Endoscopic Score for Crohn’s Disease.
Statistical Analysis
Sample Size and Power Calculation
The VIVID-1 trial planned to screen approximately 3,000 patients to achieve a total of approximately 1,100 patients randomized for treatment. Based on a 6:3:2 randomization ratio, approximately 600 patients would be randomized to mirikizumab, 300 patients to ustekinumab, and 200 patients to placebo.58
Approximately 90% of randomized patients were expected to meet the criteria for inclusion in the PAS, which consisted of all randomized patients who had a baseline SES-CD score of 7 or higher (or 4 or higher for patients with isolated ileal disease) and had received at least 1 dose of study intervention. Thus, a sample size of 990 patients would provide at least 90% power to demonstrate that mirikizumab would be superior to placebo for the coprimary end points. This estimated power was based on a 2-sided chi-square test with alpha equal to 0.005 and the assumption that the treatment response rates for the coprimary end points were 33% for mirikizumab and 10% for placebo.58
The sample size based on the PAS would also provide greater than 90% power to demonstrate that mirikizumab would be superior to ustekinumab for endoscopic response at week 52. This calculation was based on a 2-sided chi-square test with alpha equal to 0.045 and the assumption of a difference of at least 16% between mirikizumab and ustekinumab in endoscopic response at week 52.58
Noninferiority Analysis
At the time of this report, the sponsor indicated that there was no universally established value for a clinically unimportant difference between 2 given treatments based on CDAI remission. The sponsor indicated that the selection of the noninferiority margin was based on statistical and clinical considerations according to global regulatory guidance.20,21 Evidence from 2 induction studies (the UNITI1 and UNITI2 studies) and 1 maintenance study (the IM-UNITI study) of ustekinumab was used to inform the noninferiority margin, with the sponsor applying assumptions to mimic a treat-through design. The sponsor determined that the expected treatment effect on CDAI clinical remission for ustekinumab 6 mg/kg followed by 90 mg every 8 weeks versus placebo at week 52 in a treat-through study would be 26.9% (95% CI, 19.5 to 34.6). Based on the fixed 95% by 95% margin method, a 10% noninferiority margin represented clinical judgment about the amount of active control effect that must be retained. Based on the assumption that the VIVID-1 trial would have similar proportions of patients with and without BF to those observed in the UNITI program, and that the constancy assumption holds, the proposed noninferiority margin was expected to preserve 50% of the expected ustekinumab effect in CDAI remission at week 52 in a treat-through study. Therefore, if the lower bound of the 97.5% CI for the difference between mirikizumab and ustekinumab was greater than −10%, a loss of more than half of the benefit expected for ustekinumab for CDAI remission at week 52 would be ruled out.
Given that the VIVID-1 trial includes a placebo group, the assay sensitivity and constancy assumption were checked by comparing ustekinumab to placebo for CDAI response at week 8 and the CDAI remission rate at week 52 among CDAI responders at week 8 for ustekinumab. In addition, the level of a 2-sided CI that excludes an 8% noninferiority margin and a 5% noninferiority margin was provided. To assess the noninferiority of mirikizumab to ustekinumab, the lower bound of the 2-sided 95% or 95.5% CI of the estimated common risk difference in proportions between mirikizumab and ustekinumab response was compared to the noninferiority margin.
Estimands
The study estimands for the coprimary and major secondary end points incorporated the strategies used to handle the following ICEs: study intervention discontinuation (including patients who started taking prohibited treatments); specified changes in concomitant CD medications; and patients receiving placebo who switched to mirikizumab at week 12. For binary end points, unless otherwise specified, the composite strategy was used: patients who discontinued the study intervention or had specified changes in concomitant medications were considered to be nonresponders. For the 2 major secondary binary end points (endoscopic response at week 52 and CDAI clinical remission at week 52), a hybrid strategy was used to accommodate the additional ICE of nonresponders in the placebo group switching to mirikizumab at week 12. For this ICE, a hypothetical strategy was used to impute measurements after 12 weeks as nonresponse. The rationale for this assumption was that if the patient had continued to receive placebo, a nonresponse would have been observed for the end point of interest. For continuous end points, a hybrid strategy was used in which values for patients who discontinued the study intervention or had specified changes in concomitant medications returned to baseline. Patients switching to mirikizumab at week 12 had data imputed using a baseline observation carried forward (BOCF) approach. The rationale provided was that measurements after switching were not considered to be missing at random.
Statistical Test or Model
The analysis of the coprimary end points was based on the PAS. For the assessment of the coprimary end points and other binary efficacy end points, unadjusted proportions for each treatment group, along with corresponding 2-sided asymptotic CIs, were reported. For the primary analysis, the estimated common risk difference and its corresponding 2-sided CI was reported and adjusted for the following stratification factors: BF status, baseline SES-CD total score, and either baseline SF equal to or greater than 7 and/or baseline AP score equal to or greater than 2.5. The CIs were calculated using the Mantel-Haenszel-Sato method.59 The Cochran-Mantel-Haenszel (CMH) test was used to compare the treatment groups while adjusting for the mentioned stratification factors. The CMH-adjusted odds ratio (OR) was reported along with the corresponding 2-sided asymptotic CIs and P value. The CMH chi-square P value and the relative risk along with its 2-sided CI was provided.
Comparisons of continuous efficacy outcome variables were made using analysis of covariance (ANCOVA), with the following parameters used in the model: study intervention, BF status, baseline SES-CD total score, either baseline SF equal to or greater than 7 and/or baseline AP equal to or greater than 2.5, and baseline score in the model. Type III sums of squares for LS means were used for statistical comparison of between-study comparison groups. Moreover, the LS mean difference, SE, P value, and 2-sided CI were reported. To handle longitudinal repeated data, the ANCOVA model was applied to analyze selected time points 1 at a time.
Multiple Testing Procedure
The testing of primary and major secondary hypotheses was conducted according to a prespecified graphical scheme (Figure 2), which was implemented to control the family-wise type I error rate (FWER) at a 2-sided alpha level of 0.05. Two groups, including the coprimary and major secondary hypotheses, were used within the framework: group 1 included the coprimary end points and all major secondary end points that involved comparisons with placebo, while group 2 included all major secondary end points that involved comparisons with ustekinumab. Within each group, the graphical scheme controlled the FWER at a prespecified level. For group 1, a FWER of 0.005 was used. If all comparisons in group 1 were rejected, testing would proceed to group 2 with a FWER of 0.05. If 1 or more hypotheses in group 1 failed to be rejected and the coprimary end point criteria were met, then testing would proceed to group 2 with a FWER at 0.045. There were no adjustments for multiple comparisons for any other analyses outside the coprimary and major secondary end points.
Figure 2: Summary of the Multiple Testing Procedure in the VIVID-1 Study
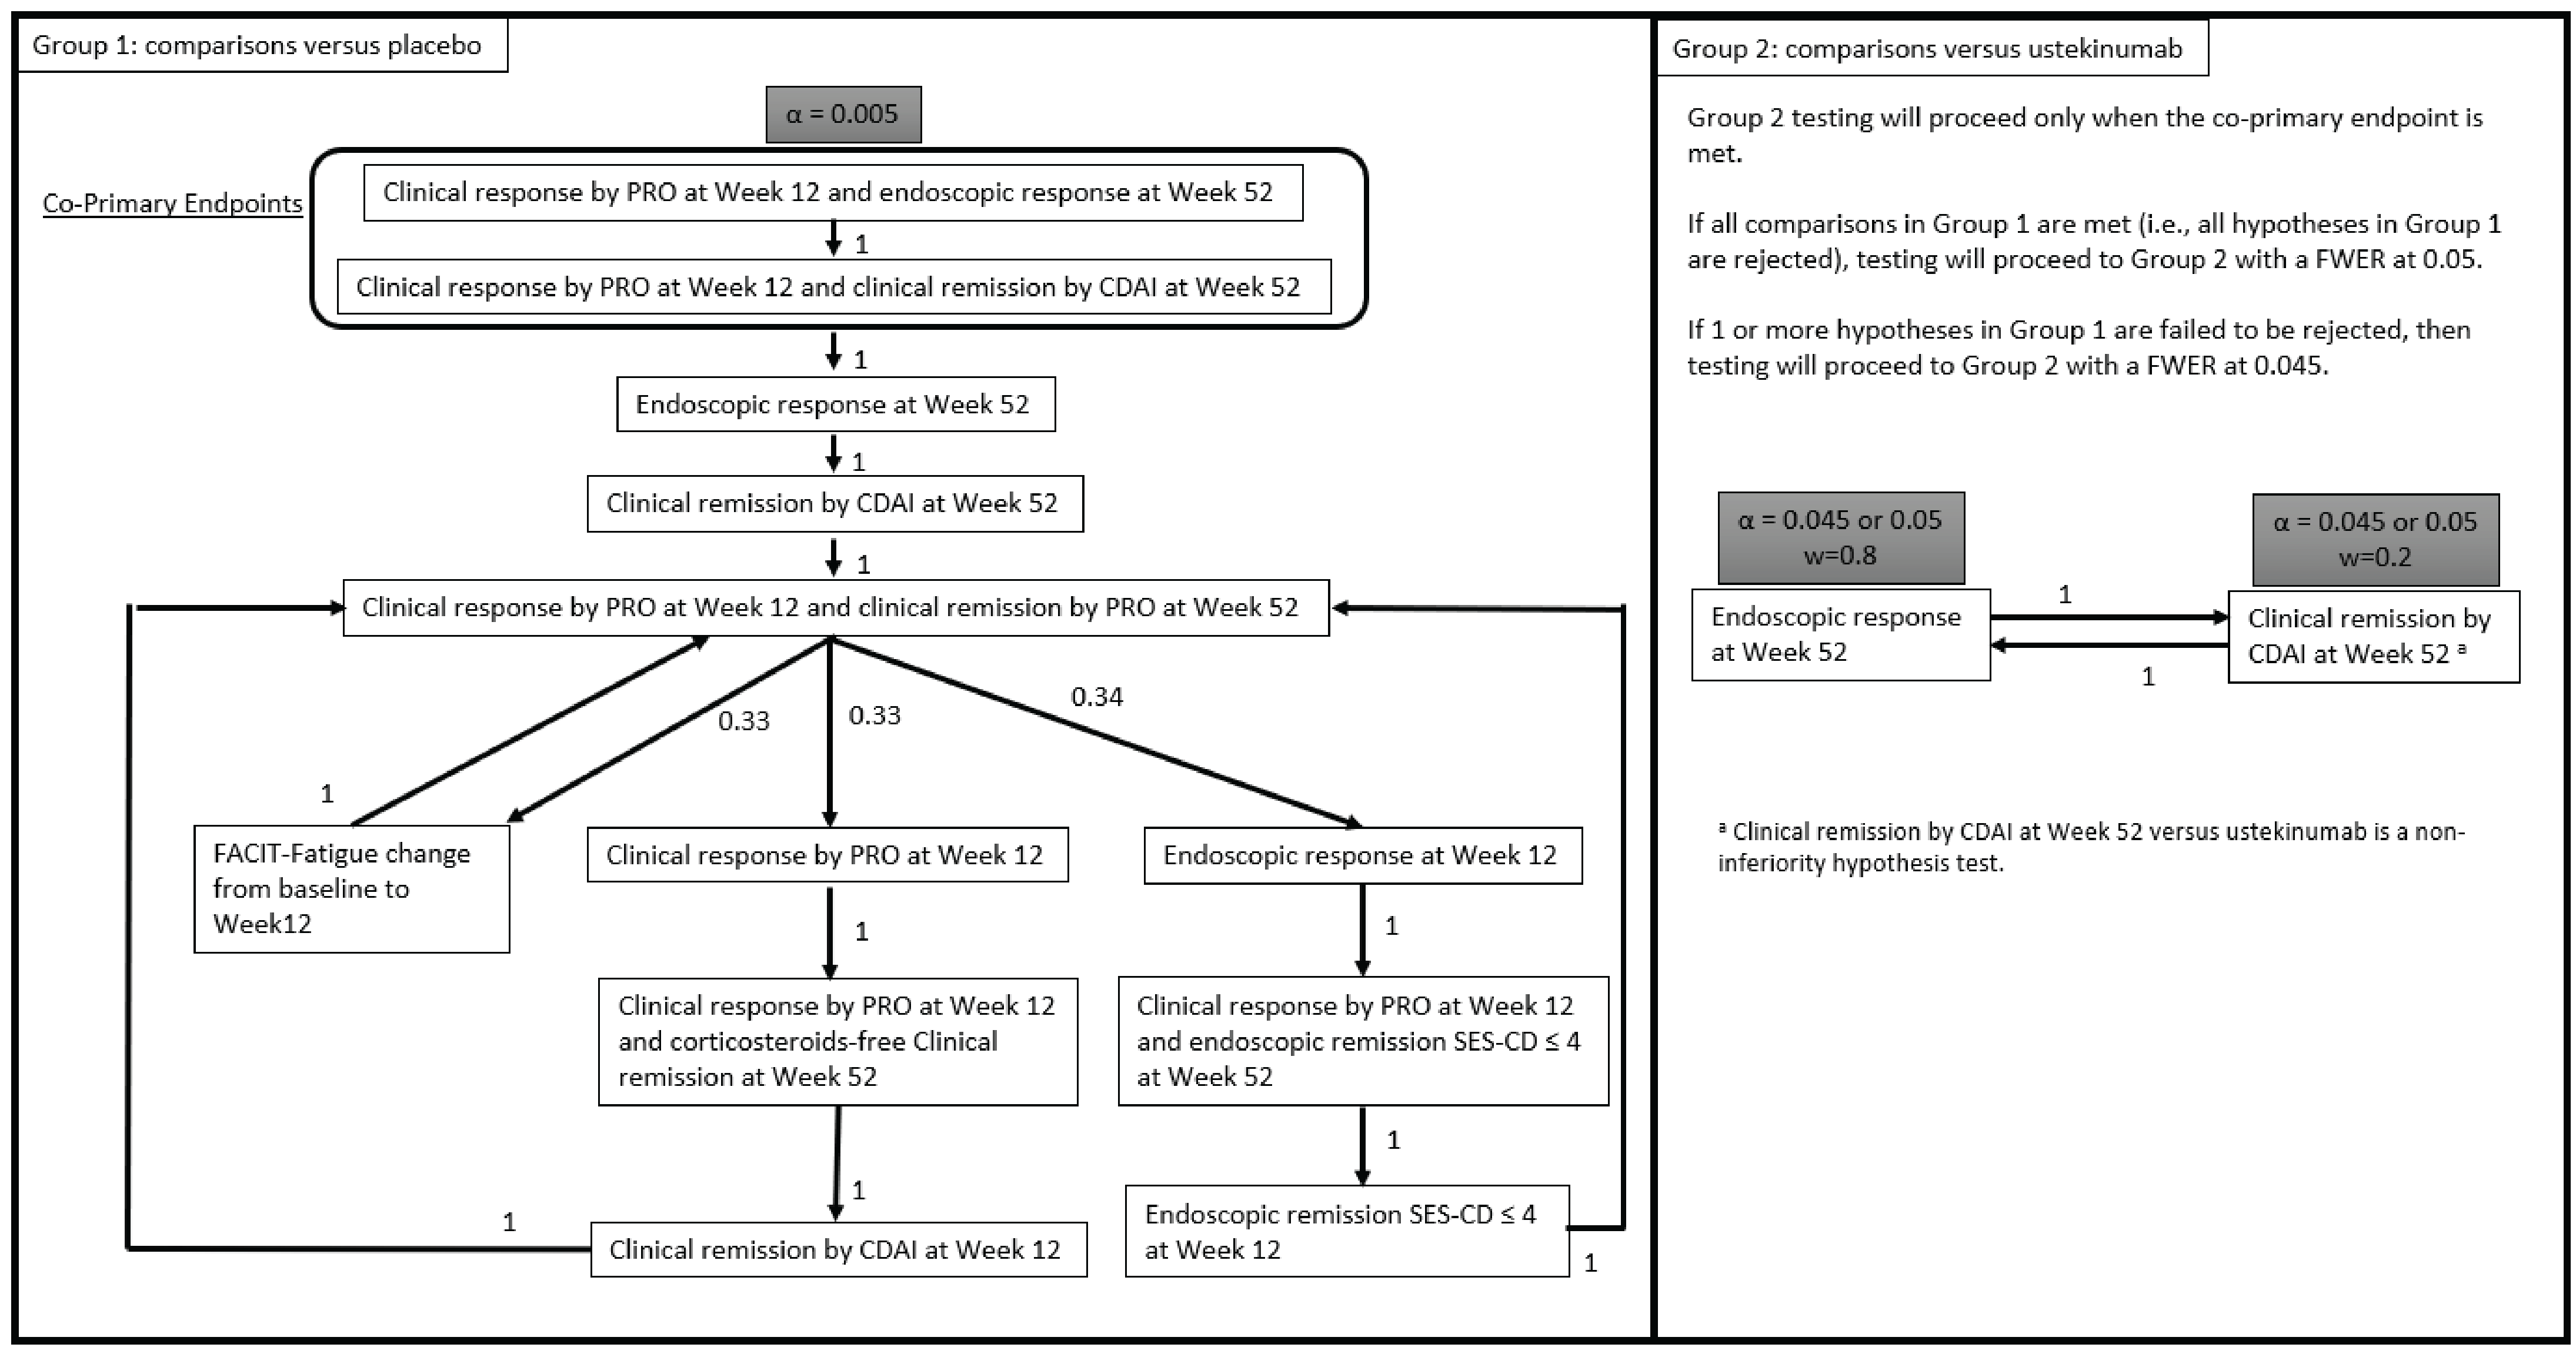
CDAI = Crohn’s Disease Activity Index; FACIT-Fatigue = Functional Assessment of Chronic Illness Therapy – Fatigue; FWER = family-wise type I error rate; PRO = patient-reported outcome; SES-CD = Simple Endoscopic Score for Crohn’s Disease.
Source: AMAM Statistical Analysis Plan.58
Missing Data Imputation Methods
The study protocol for the VIVID-1 trial identified ICEs for which data may have been imputed depending on the estimand of interest. Patients may have also had sporadically missing data for reasons other than ICEs.
For the analysis of the coprimary end points and other binary end points of the trial, patients who completed study treatment up to the time point of interest, but for whom data were sporadically missing, were imputed using NRI.
For the analysis of continuous variables in the VIVID-1 trial, missing data were handled using the ANCOVA with modified BOCF (mBOCF) approach. After handling ICEs using the BOCF approach, patients with sporadically missing observations had the last nonmissing observation carried forward to the corresponding visit.
To test the effects of different methods for handling missing data, sensitivity analyses were conducted for the coprimary and major secondary end points (described in the Sensitivity Analyses section).
Subgroup Analyses
Subgroup analyses were conducted in the VIVID-1 trial for the coprimary end points and most major secondary end points in the PAS.58 The subgroups analyzed included:
demographic characteristics
prior CD therapy (including BF population and not-BF population)
baseline CD therapies
baseline disease characteristics
other baseline PROs
treatment-emergent antimirikizumab antibody status.
For each subgroup analysis, the proportion of responders by intervention, risk difference between interventions, and corresponding 95% CIs were reported. P values were based on the Fisher exact test and were not adjusted for multiplicity. Moreover, risk differences were not adjusted for covariates.
Sensitivity Analyses
In the VIVID-1 trial, sensitivity and supplementary analyses were conducted to test the robustness of the results for the coprimary end points of the trial. Sensitivity analyses were conducted for the coprimary and select major secondary end points in the following analysis populations using the same approach as used for the PAS:
mITT population
population after exclusion of patients affected by the “Russia-Ukraine crisis” [from original source] (from the PAS).
In addition, missing data in the analysis of the coprimary end points were imputed using mNRI as a sensitivity analysis. Namely, missing data for reasons including the COVID-19 pandemic, the “Russia-Ukraine crisis” [from original source], and treatment discontinuation due to loss to follow-up or pregnancy were imputed using multiple imputation, whereas data missing due to treatment discontinuation for other reasons, such as AEs or lack of efficacy, were imputed using NRI. Measurements after ICEs of specified changes in concomitant medications for CD and treatment switch to mirikizumab were also handled by NRI. Sporadically missing data were imputed by multiple imputation. Moreover, sensitivity analyses were conducted for major secondary end points, with all missing data in the placebo arm imputed under the assumption of missing at random. For the mirikizumab arm, sporadically missing data were imputed under a missing-at-random assumption, and the measurements after ICEs were set to missing and imputed under the assumption that patients behaved similarly to those in the placebo arm.
A tipping-point analysis was also conducted as a sensitivity analysis for the coprimary end points. Each analysis considered the most extreme case: one in which all sporadically missing data for patients randomized to mirikizumab were imputed using the worst possible outcomes, and all sporadically missing data for patients randomized to placebo who continued to receive placebo during the maintenance phase were imputed using the best possible outcomes. The differences between mirikizumab and placebo were analyzed for each imputed dataset using the CMH test. A tipping-point analysis for patients in the placebo group who switched to mirikizumab at week 12 was also conducted as a sensitivity analysis for 2 major secondary end points: endoscopic response at week 52 and CDAI clinical remission at week 52.
An additional sensitivity analysis was performed for the coprimary end point of PRO clinical response at week 12 and endoscopic response at week 52, where endoscopic response was defined as at least a 50% reduction from baseline in SES-CD score.
Table 9: Statistical Analysis of Efficacy End Points in the VIVID-1 Study
End point | Statistical model | Adjustment factors | Handling of missing data | Sensitivity analyses |
|---|---|---|---|---|
PRO clinical response at week 12 and SES-CD endoscopic response at week 52 | CMH analysis | BF status (yes vs. no), baseline SES-CD total score (< 12, ≥ 12), and baseline SF ≥ 7 and/or baseline AP ≥ 2.5 (yes or unknown vs. no) | NRI |
|
PRO clinical response at week 12 and CDAI clinical remission at week 52 | CMH analysis | BF status (yes vs. no), baseline SES-CD total score (< 12, ≥ 12), and baseline SF ≥ 7 and/or baseline AP ≥ 2.5 (yes or unknown vs. no) | NRI |
|
PRO clinical response at week 12 and week 52 | CMH analysis | BF status (yes vs. no), baseline SES-CD total score (< 12, ≥ 12), and baseline SF ≥ 7 and/or baseline AP ≥ 2.5 (yes or unknown vs. no) | NRI |
|
CDAI clinical remission at week 12 and week 52 | CMH analysis | BF status (yes vs. no), baseline SES-CD total score (< 12, ≥ 12), and baseline SF ≥ 7 and/or baseline AP ≥ 2.5 (yes or unknown vs. no) | NRI |
|
Corticosteroid-free CDAI clinical remission at week 52 | CMH analysis | BF status (yes vs. no), baseline SES-CD total score (< 12, ≥ 12), and baseline SF ≥ 7 and/or baseline AP ≥ 2.5 (yes or unknown vs. no) | NRI | NR |
SES-CD endoscopic response at week 12 and week 52 | CMH analysis | BF status (yes vs. no), baseline SES-CD total score (< 12, ≥ 12), and baseline SF ≥ 7 and/or baseline AP ≥ 2.5 (yes or unknown vs. no) | NRI |
|
SES-CD endoscopic remission at week 12 at week 52 | CMH analysis | BF status (yes vs. no), baseline SES-CD total score (< 12, ≥ 12), and baseline SF ≥ 7 and/or baseline AP ≥ 2.5 (yes or unknown vs. no) | NRI |
|
PRO clinical response at week 12 and SES-CD endoscopic remission at week 52 | CMH analysis | BF status (yes vs. no), baseline SES-CD total score (< 12, ≥ 12), and baseline SF ≥ 7 and/or baseline AP ≥ 2.5 (yes or unknown vs. no) | NRI | Population after exclusion of patients affected by the “Russia-Ukraine crisis” [from original source] from the PASa,b |
PRO clinical response at week 12 and corticosteroid-free CDAI clinical remission at week 52 | CMH analysis | BF status (yes vs. no), baseline SES-CD total score (< 12, ≥ 12), and baseline SF ≥ 7 and/or baseline AP ≥ 2.5 (yes or unknown vs. no) | NRI | Population after exclusion of patients affected by the “Russia-Ukraine crisis” [from original source] from the PASa,b |
LS mean change in IBDQ score from baseline to week 12 and 52 | ANCOVA | BF status (yes vs. no), baseline SES-CD total score (< 12, ≥ 12), and baseline SF ≥ 7 and/or baseline AP ≥ 2.5 (yes or unknown vs. no) | mBOCF | NR |
ANCOVA = analysis of covariance; AP = abdominal pain; BF = biologic failure; CDAI = Crohn’s Disease Activity Index; CMH = Cochran-Mantel-Haenszel; IBDQ = Inflammatory Bowel Disease Questionnaire; LS = least squares; mBOCF = modified baseline observation carried forward; mITT = modified intention to treat; mNRI = modified nonresponder imputation; NR = not reported; NRI = nonresponder imputation; PAS = primary analysis set; PRO = patient-reported outcome; SES-CD = Simple Endoscopic Score for Crohn’s Disease; SF = stool frequency; vs. = versus.
aConducted for mirikizumab vs. placebo.
bConducted for mirikizumab vs. ustekinumab.
Sources: VIVID-1 study (I6T-MC-AMAM) Statistical Analysis Plan.58 Details included in the table are from the sponsor’s Summary of Clinical Evidence.16
Analysis Populations
A summary of the analysis populations in the VIVID-1 trial is presented in Table 10.
Table 10: Analysis Populations in the VIVID-1 Study
Population | Definition | Application |
|---|---|---|
Screening population | All patients who signed the informed consent | Used for disposition analysis |
PAS | All randomized patients who had a baseline SES-CD score of ≥ 7 (or ≥ 4 for isolated ileal disease) and who received at least 1 dose of any study intervention, regardless of treatment adherence or protocol deviations | Used for efficacy, biomarkers, health outcomes, disposition, and demographics |
Population of not-BF patients in the PAS | All patients in the PAS for whom any biologic medication had not failed, regardless of prior biologic exposure | Used for efficacy-related analysis |
Population of BF patients in the PAS | All patients in the PAS for whom at least 1 biologic medication had failed | Used for efficacy-related analysis |
mITT population | All randomized patients who received at least 1 dose of any study intervention, regardless of treatment adherence or protocol deviations | Used for sensitivity analysis for the coprimary end points, disposition, and demographics |
ITT population | All randomized patients, even if the patient did not take the assigned study intervention, did not receive the correct study intervention, or otherwise did not follow the protocol | Used for disposition, demographics |
Safety population | Same as mITT population | Safety analysis for the induction period and for the treatment regimen period (induction period and maintenance period) was conducted on this population |
BF = biologic failure; ITT = intention to treat; mITT = modified intention to treat; PAS = primary analysis set; SES-CD = Simple Endoscopic Score for Crohn’s Disease.
Sources: VIVID-1 study (I6T-MC-AMAM) Clinical Study Report.29 Details included in the table are from the sponsor’s Summary of Clinical Evidence.16
Results
Patient Disposition
At the time of the data cut-off date (August 23, 2023), the induction and maintenance treatment periods were complete, and the posttreatment follow-up period was still ongoing. A total of 2,665 patients were screened and of these, 1,152 patients comprising the ITT population were randomized to receive mirikizumab (n = 631), placebo (n = 212), or ustekinumab (n = 309). Of these, 1,065 patients took at least 1 dose of study treatment and had a baseline SES-CD score of 7 or greater (or 4 or greater for isolated ileal disease); these patients comprised the PAS.
Of these 1,065 patients, 1,010 patients (94.8%) completed the induction treatment period and went on to receive maintenance treatment. Among those who received maintenance treatment, 551 patients were assigned to the mirikizumab group (95.2%), 183 patients were assigned to the placebo group (92.0%), and 276 patients were assigned to the ustekinumab group (96.2%). Treatment discontinuations during the induction period occurred more frequently in the placebo group (14 patients [7.0%]) than in the mirikizumab group (16 patients [2.8%]) or ustekinumab group (10 patients [3.5%]). AEs were the main reason for treatment discontinuation during the induction period and were more frequent among patients receiving placebo (8 patients [4.0%]) compared to those receiving mirikizumab (10 patients [1.7%]) or ustekinumab (1 patient [0.3%]).
Of the 199 patients in the PAS who received placebo during the induction period, 103 patients were classified as responders at week 12 and continued to receive placebo during the maintenance phase, whereas the remaining 80 nonresponders at week 12 switched to mirikizumab during the maintenance phase. A total of 874 patients completed the maintenance treatment period: 72 patients who received placebo (69.9%), 67 placebo nonresponders who switched to mirikizumab (83.8%), 489 patients who received mirikizumab during both the induction and maintenance periods (88.7%), and 246 patients who received ustekinumab (89.1%). Study discontinuations during the maintenance period were more frequent among patients who continued placebo (31 patients [30.1%]) than among placebo nonresponders who switched to mirikizumab (13 patients [16.3%]), those who received mirikizumab for induction and maintenance (62 patients [11.3%]), and those who received ustekinumab (30 patients [10.9%]). The main cause of study discontinuation during the maintenance period was lack of efficacy, which was noted to be higher among patients who received placebo (10 patients [9.7%]).
Table 11: Summary of Patient Disposition From the VIVID-1 Study (PAS) (August 23, 2023, Data Cut-Off Date)
Patient Disposition | Patients receiving placebo during inductiona (N = 199) | Mirikizumab (N = 579) | Ustekinumab (N = 287) | |
|---|---|---|---|---|
Responders who continued placebo during maintenance (N = 103) | Nonresponders who switched to mirikizumab during maintenance (N = 80) | |||
Screened, N | 2,665 | |||
Excluded during screening period, n (%) | 1,513 | |||
Randomized, N | 212 | 631 | 309 | |
Included in PASb | 199 | 579 | 287 | |
Induction treatment period | ||||
Completed induction treatment period and entering maintenance period, n (%) | 183 (92.0%) | 551 (95.2%) | 276 (96.2%) | |
Discontinued from study during induction treatment period, n (%) | 14 (7.0%) | 16 (2.8%) | 10 (3.5%) | |
Adverse events | 8 (4.0%) | 10 (1.7%) | 1 (0.3%) | |
Lack of efficacy | 2 (1.0%) | 1 (0.2%) | 1 (0.3%) | |
Lost to follow-up | 0 (0.0%) | 2 (0.3%) | 0 (0.0%) | |
Protocol deviation | 1 (0.5%) | 0 (0.0%) | 2 (0.7%) | |
Withdrawal by patient | 3 (1.5%) | 3 (0.5%) | 5 (1.7%) | |
Other | 0 (0.0%) | 0 (0.0%) | 1 (0.3%) | |
Discontinued from study after completing induction treatment period, but before maintenance treatment period, n (%) | 2 (1.0%) | 12 (1.9%) | 1 (0.3%) | |
Adverse events | 1 (0.5%) | 3 (0.5%) | 0 (0.0%) | |
Lack of efficacy | 0 (0.0%) | 4 (0.7%) | 0 (0.0%) | |
Pregnancy | 0 (0.0%) | 1 (0.2%) | 0 (0.0%) | |
Withdrawal by patient | 1 (0.5%) | 3 (0.5%) | 1 (0.3%) | |
Other | 0 (0.0%) | 1 (0.2%) | 0 (0.0%) | |
Maintenance treatment period | ||||
Entered maintenance period | 103 (100%) | 80 (100%) | 551 (100%) | 276 (100%) |
Completed maintenance period, n (%) | 72 (69.9%) | 67 (83.8%) | 489 (88.7%) | 246 (89.1%) |
Discontinued from study during maintenance, n (%) | 31 (30.1%) | 13 (16.3%) | 62 (11.3%) | 30 (10.9%) |
Adverse events | 9 (8.7%) | 4 (5.0%) | 17 (3.1%) | 6 (2.2%) |
Death | 0 (0%) | 1 (1.3%) | 0 (0%) | 1 (0.4%) |
Lack of efficacy | 10 (9.7%) | 6 (7.5%) | 13 (2.4%) | 10 (3.6%) |
Lost to follow-up | 0 (0%) | 0 (0%) | 3 (0.5%) | 0 (0%) |
Physician decision | 2 (1.9%) | 0 (0%) | 1 (0.2%) | 0 (0%) |
Pregnancy | 1 (1.0%) | 0 (0%) | 3 (0.5%) | 1 (0.4%) |
Protocol deviation | 0 (0%) | 1 (1.3%) | 1 (0.2%) | 1 (0.4%) |
Withdrawal by patient | 9 (8.7%) | 0 (0%) | 22 (4.0%) | 9 (3.3%) |
Other | 0 (0%) | 1 (1.3%) | 2 (0.4%) | 2 (0.7%) |
ITT, N | 127 | 85 | 631 | 309 |
mITT | 126 | 85 | 630 | 309 |
PAS, N | 119 | 80 | 579 | 287 |
Safety, N | 211c | 630 | 309 | |
ITT = intention to treat; mITT = modified intention to treat; PAS = primary analysis set.
aPatients who received placebo as induction therapy and were classified as responders at week 12 continued to receive placebo during the maintenance treatment period (n = 103). Patients who received placebo as induction therapy and were classified as nonresponders at week 12 went on to receive mirikizumab during the maintenance treatment phase (n = 80). Before the maintenance treatment period, 16 patients discontinued the study.
bThe PAS comprises patients who took at least 1 dose of study treatment and had a baseline SES-CD score of 7 or greater (4 or greater for isolated ileal disease).
cFor patients who were randomized to placebo, only the exposure period to placebo was included for safety outcomes.
Sources: VIVID-1 study (I6T-MC-AMAM) Clinical Study Report.29 Details included in the table are from the sponsor’s Summary of Clinical Evidence.16
Baseline Characteristics
The baseline characteristics outlined in Table 12 were summarized for the PAS and are limited to those that are most relevant to this review or that were felt to affect the outcomes or interpretation of the study results. The baseline characteristics were well-balanced between the treatment groups. The mean ages of the patients receiving mirikizumab, placebo, and ustekinumab were 36.0 years (SD = 13.22 years), 36.3 years (SD = 12.71 years), and 36.6 years (SD = 12.72 years), respectively. Most of the study patients were male (55.1%; female: 44.9%) and white (71.7%). In the PAS, 25.1% of patients were Asian, 2.2% of patients were Black, 0.6% of patients were American Indian or Alaska Native, and 0.4% of patients identified as having multiple races. Most patients were from Europe and regions outside Asia and the Americas (55.5%).
The treatment arms were well-balanced in terms of the site of disease location, with most patients (49.8%) reporting that both the ileum and colon were the most affected disease sites. Moreover, across the 3 treatment groups, patients had similar mean SES-CD scores (13.5 for mirikizumab, 13.1 for placebo, and 13.9 for ustekinumab), AP scores (2.1 for all treatment groups), and SF scores (5.7 for the mirikizumab and ustekinumab groups versus 5.8 for the placebo group). Corticosteroid use at baseline was similar across the 3 treatment groups. However, a lower proportion of patients in the mirikizumab group (25.2%) reported the use of immunomodulators at baseline compared to the placebo group (29.1%) and ustekinumab group (30.3%). Moreover, a lower proportion of patients in the placebo group reported the use of oral amino salicylates at baseline (█████) compared to the mirikizumab (█████) and ustekinumab (█████) groups.
Table 12: Baseline Demographic and Disease Characteristics in the VIVID-1 Study (PAS) (August 23, 2023, Data Cut-Off Date)
Characteristic | Mirikizumab (n = 579) | Placebo (n = 199) | Ustekinumab (n = 287) | Total (n = 1,065) |
|---|---|---|---|---|
Baseline demographic characteristics | ||||
Sex, n (%) | ||||
Female | 247 (42.7) | 81 (40.7) | 150 (52.3) | 478 (44.9) |
Male | 332 (57.3) | 118 (59.3) | 137 (47.7) | 587 (55.1) |
Mean (SD) age, years | 36.0 (13.22) | 36.3 (12.71) | 36.6 (12.72) | 36.2 (12.98) |
Age categories, n (%) | ||||
< 65 years | 559 (96.5) | 196 (98.5) | 279 (97.2) | 1,034 (97.1) |
≥ 65 years | 20 (3.5) | 3 (1.5) | 8 (2.8) | 31 (2.9) |
Race, n (%) | ||||
American Indian or Alaska Native | 2 (0.4) | 2 (1.0) | 2 (0.7) | 6 (0.6) |
Asian | 148 (25.9) | 42 (21.8) | 74 (25.9) | 264 (25.1) |
Black or African American | 10 (1.8) | 5 (2.6) | 8 (2.8) | 23 (2.2) |
White | 408 (71.5) | 144 (74.6) | 201 (70.3) | 753 (71.7) |
Multiple | 3 (0.5) | 0 | 1 (0.3) | 4 (0.4) |
Geographic region, n (%) | ||||
Asia | 153 (26.4) | 46 (23.1) | 75 (26.1) | 274 (25.7) |
North America | 77 (13.3) | 27 (13.6) | 37 (12.9) | 141 (13.2) |
Central or South America | 30 (5.2) | 9 (4.5) | 20 (7.0) | 59 (5.5) |
Europe and rest of world | 319 (55.1) | 117 (58.8) | 155 (54.0) | 591 (55.5) |
Mean (SD) weight, kg | 68.0 (18.3) | 69.6 (19.0) | 66.9 (17.6) | 668.0 (18.3) |
Mean (SD) BMI, kg/m2 | 23.2 (5.4) | 23.8 (5.8) | 23.3 (5.5) | 23.4 (5.5) |
Baseline disease characteristics | ||||
Mean (SD) duration of CD, years | 7.4 (8.2) | 7.8 (7.4) | 7.2 (7.7) | 7.4 (7.9) |
≥ 5 years CD duration, n (%) | 274 (47.4) | 107 (53.8) | 144 (50.2) | 525 (49.3) |
Disease location, n (%) | ||||
Ileum only | 65 (11.2) | 19 (9.5) | 29 (10.1) | 113 (10.6) |
Colon only | 225 (38.9) | 77 (38.7) | 120 (41.8) | 422 (39.6) |
Ileum and colon | 289 (49.9) | 103 (51.8) | 138 (48.1) | 530 (49.8) |
Prior surgical bowel resection, yes, n (%) | 89 (15.4) | 33 (16.6) | 29 (10.1) | 151 (14.2) |
CDAI score, mean (SD) | 323.1 (85.8) | 318.9 (86.2) | 318.5 (93.2) | 321.1 (87.9) |
CDAI ≥ 300, n (%) | 340 (59.4) | 110 (56.4) | 157 (55.1) | 607 (57.7) |
SES-CD score, mean (SD) | 13.5 (6.6) | 13.1 (6.0) | 13.9 (6.6) | 13.5 (6.5) |
SES-CD ≥ 12, n (%) | 288 (49.7) | 97 (48.7) | 145 (50.5) | 530 (49.8) |
AP score, mean (SD) | 2.1 (0.6) | 2.1 (0.6) | 2.1 (0.6) | 2.1 (0.6) |
Average AP ≥ 2, n (%) | 452 (78.3) | 151 (75.9) | 206 (71.8) | 809 (76.1) |
SF score, mean (SD) | 5.7 (3.0) | 5.8 (3.2) | 5.7 (2.9) | 5.7 (3.0) |
Average SF ≥ 7, n (%) | 130 (22.6) | 55 (276) | 77 (26.8) | 262 (24.7) |
Median (range) CRP, mg/L | 8.5 (2.9 to 25.0) | 7.6 (0.1 to 207) | 8.9 (0.1 to 314) | 8.3 (0.1 to 314) |
Median (range) FCP, mcg/g | 1,315 (15 to 31,689) | 1,161 (15 to 21,164) | 1,489 (15 to 31,680) | 1,315 (15 to 31,680) |
Baseline medication use | ||||
Oral amino salicylates use at baseline | ███ ██████ | ██ ███ | ███ ███ | ███ ███ |
Corticosteroid use at baseline | 177 (30.6) | 58 (29.1) | 90 (31.4) | 325 (30.5) |
Budesonide use | 63 (10.9) | 23 (11.6) | 27 (9.4) | 113 (10.6) |
Immunomodulator use at baseline | 146 (25.2) | 58 (29.1) | 87 (30.3) | 291 (27.3) |
Methotrexate use | █████ | █████ | █████ | ██ █████ |
Thiopurine use | ███ ███ | ██ ███ | ██ ███ | ███ ████ |
AP = abdominal pain; BMI = body mass index; CD = Crohn disease; CDAI = Crohn’s Disease Activity Index; CRP = C-reactive protein; FCP = fecal calprotectin; PAS = primary analysis set; SD = standard deviation; SES-CD = Simple Endoscopic Score for Crohn’s Disease; SF = stool frequency.
aIncludes responses from US sites only.
Source: VIVID-1 study (I6T-MC-AMAM) Clinical Study Report.29
Failure of Prior Therapy
A summary of failure of prior therapy from the VIVID-1 trial in the PAS is provided in Table 13. The 3 treatment groups were similar in terms of failure of prior treatment with immunomodulators, biologics, anti-TNF drugs, and anti-integrin drugs. About half of patients in the trial had experienced failure with prior biologic treatments (48.5%). However, a higher proportion of patients in the ustekinumab group reported failure with prior corticosteroids (52.3%) compared with patients receiving mirikizumab (45.3%) and placebo (47.3%). Moreover, a lower proportion of patients in the ustekinumab group reported prior failure with immunomodulators (41.8%) compared with patients receiving mirikizumab (49.9%) and placebo (50.8%).
Table 13: Summary of Failure of Prior Therapy for CD Among Patients in the VIVID-1 Study (PAS) (August 23, 2023, Data Cut-Off Date)
Prior therapy | Mirikizumab (N = 579) | Placebo (N = 199) | Ustekinumab (N = 287) |
|---|---|---|---|
Prior corticosteroid failure | 262 (45.3) | 94 (47.2) | 150 (52.3) |
Prior immunomodulator failure | 289 (49.9) | 101 (50.8) | 120 (41.8) |
Prior failure of biologic treatment | 281 (48.5) | 97 (48.7) | 139 (48.4) |
Number of failed biologic treatments | |||
1 | 175 (30.2) | 66 (33.2) | 91 (31.7) |
2 | 82 (14.2) | 25 (12.6) | 42 (14.6) |
> 2 | 24 (4.1) | 6 (3.0) | 6 (2.1) |
Prior anti-TNF failure | 265 (45.8) | 89 (44.7) | 133 (46.3) |
Prior anti-integrin failure | 68 (11.7) | 24 (12.1) | 31 (10.8) |
Prior ustekinumab use | 4 (0.7) | 2 (1.0) | 1 (0.3) |
No prior failure of biologic treatment | 298 (51.5) | 102 (51.3) | 148 (51.6) |
Exposure, but no failure | 36 (6.2) | 12 (6.0) | 12 (4.2) |
Not exposed | 262 (45.3) | 90 (45.2) | 136 (47.4) |
CD = Crohn disease; PAS = primary analysis set; TNF = tumour necrosis factor.
Source: VIVID-1 study (I6T-MC-AMAM) Clinical Study Report.29
Exposure to Study Treatments
A summary of patient exposure to treatment in the VIVID-1 trial is provided in Table 14. The mean length of exposure to treatment during the induction treatment period was similar across the 3 treatment groups. The mean length of exposure to treatment during the overall treatment regimen period (i.e., the induction treatment period and maintenance treatment period) was similar for the mirikizumab and ustekinumab treatment groups, but shorter for the placebo group.
Table 14: Summary of Patient Exposure From the VIVID-1 Study (Safety Population) (August 23, 2023, Data Cut-Off Date)
Exposure durations | Mirikizumab (N = 630) | Placebo (N = 211) | Ustekinumab (N = 309) |
|---|---|---|---|
Induction period | |||
Mean weeks of exposure (SD) | █████ █ | █████ █ | █████ █ |
Total participant-yearsa | ██████ | ██████ | ██████ |
Treatment regimen period | |||
Mean weeks of exposure (SD) | █████ █ | █████ █ | █████ █ |
Total participant-yearsa | 593.56 | 119.51 | 293.30 |
All-active treatment period | |||
Mean weeks of exposure (SD) | █████ █ | █████ █ | █████ █ |
Total participant-yearsa | ██████ | ██████ | ██████ |
SD = standard deviation.
aTotal participant-years is calculated as the sum of the duration of exposure in days for all patients in each treatment group divided by 365.25.
Sources: VIVID-1 study (I6T-MC-AMAM) Clinical Study Report.29 Details included in the table are from the sponsor’s Summary of Clinical Evidence.16
Concomitant Medications
A summary of concomitant medications used in the PAS of the VIVID-1 trial is provided in Table 15. The use of concomitant medications across categories was consistent across the 3 treatment groups. Around ████ of patients reported receiving neither corticosteroids nor immunomodulators as concomitant medication in the trial (█████).
Table 15: Concomitant Medications Among Patients in the VIVID-1 Study (PAS) (August 23, 2023, Data Cut-Off Date)
Concomitant medications | Mirikizumab (N = 579) | Placebo (N = 199) | Ustekinumab (N = 287) |
|---|---|---|---|
Corticosteroid use only, n (%) | ███ ██████ | ██ ██████ | ██ ██████ |
Immunomodulator use only, n (%) | ███ ██████ | ██ ██████ | ██ ██████ |
Neither, n (%) | ███ ██████ | ██ ██████ | ██ ██████ |
Both, n (%) | ███ ██████ | ██ ██████ | ██ ██████ |
PAS = primary analysis set.
Source: VIVID-1 study (I6T-MC-AMAM) Clinical Study Report.29
Efficacy
Mirikizumab Versus Placebo
A summary of results for end points comparing mirikizumab and placebo is provided in Table 16. At the time of the data cut-off date (August 23, 2023), the predefined success criteria for superiority based on all coprimary and major secondary end points comparing mirikizumab and placebo were met.
PRO Clinical Response at Week 12 and SES-CD Endoscopic Response at Week 52
The proportion of patients who achieved PRO clinical response at week 12 and SES-CD endoscopic response at week 52 favoured the mirikizumab group (38.0%) over the placebo group (9.0%) (common risk difference = 28.7%; 99.5% CI, 20.6 to 36.8; P < 0.000001).
Results from the planned sensitivity analyses of PRO clinical response at week 12 and SES-CD endoscopic response at week 52 were consistent with the results of the primary analysis. █████ ████████ ████████ ███ ███ ██ ████ ███████ ████ ███████████ █████ ██████ ███ ████ ██ ██████ █ █████ ███████████ ███ ███████ █████ ████████ █████ ███ ████ ███████ ████ ███████ ████ ███████████ █████ ██████ ███ ████ ██ ██████ █ █████ ███████████ ███ ████ ██████████ ███████ ████ ███████████ █████ ██████ ███ ████ ██ ██████ █ █████ ███████████ █████████ ██ ████████ ████████ ██ ███ ██████████████ ██████ ███████ ████ ███████████ █████ ██████ ███ ████ ██ ██████ █ █████ ███████████ ███ ███ ██████████ ██ ██████████ ████████ ██ ██ █████ ███ █████████ ████ ████████ ██ ██████ █████ ███████ ████ ███████████ █████ ██████ ███ ████ ██ ██████ █ █████ ███████████.
████████ ████████ ██ ████████ ████████ ██ ███ ██ ████ ██ ███ ██████████ ████████ ██ ██████ ██ ████ ██ ██████ ████ █████ █████████ ███████ ███████████ ██████ ███ █████████████ ██████████ █████████ █████ ██████████ ██ █████ █████████ ███████ ██ ██████████ ████████ █████ ████ ███████████ ██ █████████ ██ ███ █████ ████████ ███ ████ ████████ ████████ ████████ ████ ███ ███████ █████████ ████████████ ███ ████████ ████ █ ████████ ██ ██ ██ ████ ████ █ ████ ███████ ████ ███████████ █████ ████ ███ ████ ██ ███████ ████████ ████ █████ ███████ ███████ ████ ███████████ █████ ████ ███ ████ ██ ███████ ████████ ████ █ ████████ ██████ █████ █████ ██ ████ ████ ██ ███████ ████ ███████████ █████ ████ ███ ████ ██ ███████ ███ ████████ ████ █ ████████ ██████ █████ █████ ██ ██ ██ ████ ███████ ████ ███████████ █████ ████ ███ ████ ██ ███████. Details of key subgroup analyses for this composite end point are presented in the appendix (Table 36).
PRO Clinical Response at Week 12 and CDAI Clinical Remission at Week 52
The proportion of patients who achieved PRO clinical response at week 12 and CDAI clinical remission at week 52 favoured the mirikizumab group (45.4%) over the placebo group (19.6%) (common risk difference = 25.8%; 99.5% CI, 15.9 to 35.6; P < 0.000001).
Results from the planned sensitivity analyses of PRO clinical response at week 12 and CDAI clinical remission at week 52 were consistent with the results of the primary analysis. █████ ████████ ████████ ███ ███ ██ ████ ███████ ████ ███████████ █████ ██████ ███ ████ ██ ██████ █ █████ ███████████ ███ ████ ██████████ ███████ ████ ███████████ █████ ██████ ███ ████ ██ ██████ █ █████ ███████████ ███ ███████ █████ ████████ █████ ███ ████ ███████ ████ ███████ ████ ███████████ █████ ██████ ███ ████ ██ ██████ █ █████ ███████████ ███ ███ █████████ ██ ████████ ███.
████████ ████████ ██ ████████ ████████ ██ ███ ██ ████ ██ ███ ████████ █████████ ██ ████ ██ ████ ██ ██████ ████ █████ █████████ ███████ ███████████ ██████ ███ █████████████ ██████████ █████████ █████ ██████████ ██ █████ █████████ ███████ ██ ██████████ ████████ █████ ████ ███████████ ██ █████████ ██ ███ █████ ████████ ███ ████ █████████ ████████ ████ ███ ███████ █████████ ████████████ ███ ████████ ████ █ ████████ ██ ██ ██ ████ ████ █ ████ ███████ ████ ███████████ █████ ████ ███ ████ ██ ███████ ████████ ████ █████ ███████ ███████ ████ ███████████ █████ ████ ███ █████ ██ ███████ ████████ ████ █ ████████ ██████ █████ █████ ██ ████ ████ ██ ███████ ████ ███████████ █████ ████ ███ ███ ██ ███████ ███ ████████ ████ █ ████████ ██████ █████ █████ ██ ██ ██ ████ ███████ ████ ███████████ █████ ████ ███ ████ ██ ███████. Full details of the subgroup analyses for this composite end point are presented in the appendix (Table 37).
PRO Clinical Response at Week 12 and Week 52
The proportion of patients who achieved PRO clinical response at week 12 favoured the mirikizumab group (70.6%) over the placebo group (51.8%) (common risk difference = 18.9%; 99.5% CI, 7.5 to 30.3; P = 0.000001). At week 52, the proportion of patients who achieved PRO clinical response continued to favour the mirikizumab group (█████) compared with the placebo group (█████) (common risk difference = █████████ CI, ████ ██ ████; P ████████).
CDAI Clinical Remission at Week 12 and Week 52
At week 12, the proportion of patients who achieved CDAI clinical remission favoured the mirikizumab group (37.7%) over the placebo group (25.1%) (common risk difference = 12.4%; 99.5% CI, 2.2 to 22.7; P = 0.001431). At week 52, the proportion of patients who achieved CDAI clinical remission continued to favour the mirikizumab group (54.1%) over the placebo group (19.6%) (common risk difference = 34.6%; 99.5% CI, 24.7 to 44.4; P < 0.000001).
CDAI Corticosteroid-Free Clinical Remission at Week 52
At week 52, the proportion of patients who achieved CDAI corticosteroid-free clinical remission favoured the mirikizumab group (51.8%) over the placebo group (█████) (common risk difference = █████████ CI, ████ ██ ████; P ████████).
SES-CD Endoscopic Response at Week 12 and Week 52
At week 12, the proportion of patients who achieved SES-CD endoscopic response favoured the mirikizumab group (32.5%) over the placebo group (12.6%) (common risk difference = 19.7%; 99.5% CI, 11.1 to 28.2; P < 0.000001). At week 52, the proportion of patients who achieved SES-CD endoscopic response continued to favour the mirikizumab group (48.4%) over the placebo group (9.0%) (common risk difference = 39.1%; 99.5% CI, 31.0 to 47.2; P < 0.000001).
SES-CD Endoscopic Remission at Week 12 and Week 52
At week 12, the proportion of patients who achieved SES-CD endoscopic remission favoured the mirikizumab group (10.9%) over the placebo group (4.0%) (common risk difference = 6.8%; 99.5% CI, 1.6 to 12.1; P = 0.003414). At week 52, the proportion of patients who achieved SES-CD endoscopic remission continued to favour the mirikizumab group (19.0%) over the placebo group (████) (common risk difference = ██████████ CI, ████ ██ ████; P ████████).
PRO Clinical Response at Week 12 and SES-CD Endoscopic Remission at Week 52
The proportion of patients who achieved PRO clinical response at week 12 and SES-CD endoscopic remission at week 52 favoured the mirikizumab group (15.9%) over the placebo group (2.0%) (common risk difference = 13.8%; 99.5% CI, 8.7 to 18.9; P < 0.000001).
PRO Clinical Response at Week 12 and Corticosteroid-Free Status From Week 40 to Week 52 and CDAI Clinical Remission at Week 52
The proportion of patients who achieved PRO clinical response at week 12, remained corticosteroid-free from week 40 to week 52, and achieved CDAI clinical remission favoured the mirikizumab group (43.7%) over the placebo group (18.6%) (common risk difference = 25.0%; 99.5% CI, 15.2 to 34.7; P < 0.000001).
Change From Baseline in IBDQ at Week 12 and Week 52
At week 12, patients in the mirikizumab treatment group had a larger improvement in IBDQ score from baseline (LS mean change from baseline = 36.89 [SE = 1.24]) compared to patients in the placebo group (LS mean change from baseline = 17.39 [SE = 2.11]). The LS mean difference for mirikizumab compared with placebo was 19.50 (95% CI, 14.71 to 24.29; P < 0.000001). At week 52, patients in the mirikizumab treatment group continued to have a larger improvement in IBDQ score from baseline (LS mean = 43.82 [SE = 1.36]) compared to patients in the placebo group (LS mean = 15.90 [SE = 2.32]). The LS mean difference for mirikizumab compared with placebo was 27.92 (95% CI, 22.67 to 33.18; P < 0.000001).
Table 16: Summary of End Points Comparing Mirikizumab and Placebo From the VIVID-1 Study (PAS) (August 23, 2023, Data Cut-Off Date)
Variable | Mirikizumaba N = 579 | Placebo N = 199 |
|---|---|---|
PRO clinical responseb at week 12 and SES-CD endoscopic response at week 52 | ||
Response, n (%) | 220 (38.0) | 18 (9.0) |
Common risk difference versus placebo (99.5% CI) | 28.7 (20.6 to 36.8) | |
P value | < 0.000001 | |
PRO clinical responseb at week 12 and CDAI clinical remission at week 52 | ||
Response, n (%) | 263 (45.4) | 39 (19.6) |
Common risk difference versus placebo (99.5% CI) | 25.8 (15.9 to 35.6) | |
P value | < 0.000001 | |
PRO clinical responseb | ||
PRO clinical responseb at week 12 | ||
Response, n (%) | 409 (70.6) | 103 (51.8) |
Common risk difference versus placebo (99.5% CI) | 18.9 (7.5 to 30.3) | |
P value | 0.000001 | |
PRO clinical responseb at week 52c | ||
Response, n (%) | ████ ██ | █████ ██ |
Common risk difference versus placebo (█████ ██) | ████ ██ | |
P value | ████ ██ | |
CDAI clinical remission | ||
CDAI clinical remission at week 12 | ||
Response, n (%) | 218 (37.7) | 50 (25.1) |
Common risk difference versus placebo (99.5% CI) | 12.4 (2.2 to 22.7) | |
P value | 0.001431 | |
CDAI clinical remission at week 52 | ||
Response, n (%) | 313 (54.1) | 39 (19.6) |
Common risk difference versus placebo (99.5% CI) | 34.6 (24.7 to 44.4) | |
P value | < 0.000001 | |
SES-CD endoscopic response | ||
SES-CD endoscopic response at week 12 | ||
Response, n (%) | 188 (32.5) | 25 (12.6) |
Common risk difference versus placebo (99.5% CI) | 19.7 (11.1 to 28.2) | |
P value | < 0.000001 | |
SES-CD endoscopic response at week 52 | ||
Response, n (%) | 280 (48.4) | 18 (9.0) |
Common risk difference versus placebo (99.5% CI) | 39.1 (31.0 to 47.2) | |
P value | < 0.000001 | |
SES-CD endoscopic remission | ||
SES-CD endoscopic remission at week 12 | ||
Response, n (%) | 63 (10.9) | 8 (4.0) |
Common risk difference versus placebo (99.5% CI) | 6.8 (1.6 to 12.1) | |
P value | 0.003414 | |
SES-CD endoscopic remission at week 52c | ||
Response, n (%) | 110 (19.0) | █████ ██ |
Common risk difference versus placebo (█████ ██) | █████ ██ | |
P value | █████ ██ | |
Corticosteroid-free CDAI clinical remission at week 52c | ||
Response, n (%) | 300 (51.8) | █████ ██ |
Common risk difference versus placebo (█████ ██) | █████ ██ | |
P value | █████ ██ | |
PRO clinical responseb at week 12, corticosteroid-free status from week 40 to week 52, and CDAI clinical remission at week 52 | ||
Response, n (%) | 253 (43.7) | 37 (18.6) |
Common risk difference versus placebo (99.5% CI) | 25.0 (15.2 to 34.7) | |
P value | < 0.000001 | |
PRO clinical responseb at week 12 and SES-CD endoscopic remission at week 52 | ||
Response, n (%) | 92 (15.9) | 4 (2.0) |
Common risk difference versus placebo (99.5% CI) | 13.8 (8.7 to 18.9) | |
P value | < 0.000001 | |
Change from baseline in IBDQc | ||
Change from baseline in IBDQ at week 12 | ||
Number of patients included in the analysis, N | 576 | 198 |
LS mean change from baseline to week 12, points (SE) | 36.89 (1.24) | 17.39 (2.11) |
LS mean difference versus placebo, points (95% CI) | 19.50 (14.71 to 24.29) | |
P value | < 0.000001 | |
Change from baseline in IBDQ at week 52 | ||
Number of patients included in the analysis, N | 576 | 198 |
LS mean change from baseline to week 52, points (SE) | 43.82 (1.36) | 15.90 (2.32) |
LS mean difference versus placebo, points (95% CI) | 27.92 (22.67 to 33.18) | |
P value | < 0.000001 | |
AP = abdominal pain; BF = biologic failure; CDAI = Crohn’s Disease Activity Index; CI = confidence interval; IBDQ = Inflammatory Bowel Disease Questionnaire; LS = least squares; PAS = primary analysis set; PRO = patient-reported outcome; SC = subcutaneous; SE = standard error; SES-CD = Simple Endoscopic Score for Crohn’s Disease; SF = stool frequency.
Note: Common risk difference and CMH test were adjusted by BF status (yes or no), baseline SES-CD total score (< 12 or ≥ 12), and baseline SF greater than or equal to 7 and/or baseline AP greater than or equal to 2.5 (yes or unknown versus no) for binary end points.
aMirikizumab dose regimen is 900 mg IV every 4 weeks for 3 doses, then 300 mg SC every 4 weeks.
bPRO clinical response is defined as at least a 30% decrease in SF and/or AP, with neither score worse than baseline.
cEnd point was not adjusted for multiplicity.
Source: VIVID-1 study (I6T-MC-AMAM) Clinical Study Report.29
Mirikizumab Versus Ustekinumab
A summary of results for end points comparing mirikizumab and ustekinumab is provided in Table 17. At the time of the data cut-off date (August 23, 2023), the predefined success criteria for noninferiority based on CDAI clinical remission at week 52 were met. However, the criteria for superiority based on SES-CD endoscopic response at week 52 were not met.
PRO Clinical Response at Week 12 and SES-CD Endoscopic Response at Week 52
The proportion of patients who achieved PRO clinical response at week 12 and SES-CD endoscopic response at week 52 was 38.0% in the mirikizumab group compared with 37.3% in the ustekinumab group (common risk difference = 0.9%; 99.5% CI, −8.9 to 10.7; P = 0.795057).
PRO Clinical Response at Week 12 and CDAI Clinical Remission at Week 52
The proportion of patients who achieved PRO clinical response at week 12 and CDAI clinical remission at week 52 was 45.4% in the mirikizumab group compared with 40.8% the ustekinumab group (common risk difference = 4.6%; 99.5% CI, −5.4 to 14.7; P = 0.193027).
PRO Clinical Response at Week 12 and Week 52
The proportions of patients who achieved PRO clinical response at week 12 were 70.6% in the mirikizumab group and █████ in the ustekinumab group (common risk difference = −1.6%; 99.5% CI, −10.8 to 7.6; P = 0.624392). At week 52, the proportions of patients who achieved PRO clinical response were █████ the mirikizumab group and █████ in the ustekinumab group (common risk difference = ████████ CI, ████ ██ ████; P = ████████).
CDAI Clinical Remission at Week 12 and Week 52
At week 12, the proportions of patients achieving CDAI clinical remission were 37.7% in the mirikizumab group and █████ in the ustekinumab group (common risk difference = █████████ CI, ████ ██ ████; P = ████████).
CDAI clinical remission was assessed for noninferiority of mirikizumab compared with ustekinumab at week 52. At week 52, 54.1% of patients receiving mirikizumab achieved CDAI clinical remission compared with 48.4% of patients who received ustekinumab. At week 52, mirikizumab was noninferior to ustekinumab (common risk difference = 5.7%; 95% CI, −1.4 to 12.8; P value for noninferiority < 0.0001; superiority = ████████).
Subgroup analyses for CDAI clinical remission at week 52 showed that the point estimate generally favoured mirikizumab, except for the following subgroups: ████████ ████ █████ ███████ ███████ ████ ███████████ █████ ████ ███ █████ ██ ██████ ████████ ████ ████████ ███ ██ ███ ████ ██ ████ ███████ ████ ███████████ ████ ████ ███ █████ ██ ███████ ████████ ████ ████████ ███ ██ ██ ████ ██ ████ ███████ ████ ███████████ ████ ████ ███ █████ ██ ██████ ███ ████████ ████ ████████ ██████ █████ █████ ██ ████ ████ ██ ███████ ████ ███████████ ████ ████ ███ █████ ██ ██████. Full details of the subgroup analyses for this end point are presented in the appendix.
Corticosteroid-Free CDAI Clinical Remission at Week 52
At week 52, the proportions of patients who achieved corticosteroid-free CDAI clinical remission were 51.8% in the mirikizumab group and 45.6% in the ustekinumab group (common risk difference = 6.3%; 99.5% CI, −3.8 to 16.4; P = 0.082319).
SES-CD Endoscopic Response at Week 12 and Week 52
At week 12, the proportions of patients who achieved SES-CD endoscopic response were 32.5% in the mirikizumab group and █████ in the ustekinumab group (common risk difference = █████████ CI, ████ ██ ███; P = ████████). At week 52, the proportions of patients who achieved SES-CD endoscopic response were 48.4% in the mirikizumab group and 46.3% in the ustekinumab group (common risk difference = 2.3%; 95% CI, −4.7 to 9.3; P = 0.513623).
Subgroup analyses for SES-CD endoscopic response at week 52 showed that the point estimate generally favoured mirikizumab, except for the following subgroups: ████████ ███ █████ ███ ████████ ███████ ███████ ████ ███████████ █████ ████ ███ █████ ██ █████ ████████ ████ ██ █████ ████████ ███████ ███████ ████ ███████████ █████ ████ ███ █████ ██ ██████ ████████ ████ █████ █████████████ ███████ ███████ ████ ███████████ █████ ████ ███ █████ ██ ███████ ████████ ████ █ ████████ ██ ██ ███████ █ ██ ████ █████ ███████ ████ ███████████ █████ ████ ███ █████ ██ ██████ ████████ ████ █████ ███████ ███████ ████ ███████████ ██████ ████ ███ █████ ██ ██████ ████████ ████ ████████ ███ ██ ███ ████ ██ ████ ███████ ████ ███████████ ████ ████ ███ █████ ██ ███████ ████████ ████ ████████ ███ ██ ██ ████ ██ ████ ███████ ████ ███████████ ████ ████ ███ █████ ██ ██████ ███ ████████ ████ ████████ ██████ █████ █████ ██ ████ ████ ██ ███████ ████ ███████████ ████ ████ ███ █████ ██ ██████. Full details of the subgroup analyses for this end point are presented in the appendix.
SES-CD Endoscopic Remission at Week 12 and Week 52
At week 12, the proportions of patients who achieved SES-CD endoscopic remission were 10.9% in the mirikizumab group and ████ in the ustekinumab group (common risk difference = █████████ CI, ████ ██ ███; P = ████████). At week 52, the proportions of patients who achieved SES-CD endoscopic remission were 19.0% in the mirikizumab group and 18.1% in the ustekinumab group (common risk difference = 0.9%; 99.5% CI, −6.9 to 8.7; P = 0.745430).
PRO Clinical Response at Week 12 and SES-CD Endoscopic Remission at Week 52
The proportions of patients who achieved PRO clinical response at week 12 and SES-CD endoscopic remission at week 52 were 15.9% in the mirikizumab group and █████ in the ustekinumab group (common risk difference = █████████ CI, ████ ██ █████ P ████████).
PRO Clinical Response at Week 12 and Corticosteroid-Free Status from Week 40 to Week 52 and CDAI Clinical Remission at Week 52
The proportion of patients who achieved PRO clinical response at week 12, remained corticosteroid-free from week 40 to week 52, and achieved CDAI clinical remission was 43.7% in the mirikizumab group compared with █████ in the ustekinumab group (common risk difference = █████████ CI, ████ to ████; P = ████████).
Change From Baseline in IBDQ at Week 12 and Week 52
At week 12, improvements from baseline in IBDQ scores were observed for the mirikizumab group (LS mean change from baseline = 36.89 [SE = 1.245]) and the ustekinumab groups (LS mean change from baseline = █████ [SE = █████]). The LS mean difference for mirikizumab compared with ustekinumab was −0.32 (95% CI, −4.52 to 3.88; P = 0.880867). At week 52, improvements from baseline were observed for the mirikizumab group (LS mean = 43.82 [SE = 1.365]) and the ustekinumab groups (LS mean = █████ [SE = █████]). The LS mean difference for mirikizumab compared with ustekinumab was ████ ████ ███ █████ ██ ██████ █ █████ █ ████████).
Table 17: Summary of End Points Comparing Mirikizumab and Ustekinumab From the VIVID-1 Study (PAS) (August 23, 2023, Data Cut-Off Date)
Variable | Mirikizumaba (N = 579) | Ustekinumabb (N = 287) |
|---|---|---|
PRO clinical responsec at week 12 and SES-CD endoscopic response at week 52d | ||
Response, n (%) | 220 (38.0) | 107 (37.3) |
Common risk difference vs. ustekinumab (99.5% CI) | 0.9 (−8.9 to 10.7) | |
P value | 0.795057 | |
PRO clinical responsec at week 12 and CDAI clinical remission at week 52d | ||
Response, n (%) | 263 (45.4) | 117 (40.8) |
Common risk difference vs. ustekinumab (99.5% CI) | 4.6 (−5.4 to 14.7) | |
P value | 0.193027 | |
PRO clinical responsec,d | ||
PRO clinical response at week 12 | ||
PRO clinical response at week 12 | 409 (70.6) | ███ ██████ |
Common risk difference vs. ustekinumab (99.5% CI) | ████ ██████ ██ ████ | |
P value | ████████ | |
PRO clinical response at week 52 | ||
PRO clinical response at week 52 | ███ ██████ | ███ ██████ |
Common risk difference vs. ustekinumab (99.5% CI) | ███ █████ ██ █████ | |
P value | ███ █████ ██ █████ | |
CDAI clinical remission | ||
CDAI clinical remission at week 12d | ||
CDAI clinical remission at week 12, n (%) | 218 (37.7) | ███ █████ |
Common risk difference vs. ustekinumab (99.5% CI) | ███ █████ ██ █████ | |
P value | ███ █████ ██ █████ | |
CDAI clinical remission at week 52 (noninferiority) | ||
CDAI clinical remission at week 52, n (%) | 313 (54.1) | 139 (48.4) |
Common risk difference vs. ustekinumab (95% CI)e,f | 5.7 (–1.4 to 12.8) | |
P value (noninferiority) | < 0.0001 | |
Corticosteroid-free CDAI clinical remissiond | ||
Corticosteroid-free CDAI clinical remission at week 52 | 300 (51.8%) | 131 (45.6%) |
Common risk difference vs. ustekinumab (99.5% CI) | 6.3 (–3.8 to 16.4) | |
P value | 0.082319 | |
SES-CD endoscopic response | ||
Endoscopic response at week 12d | ||
Endoscopic response at week 12 | 188 (32.5) | ███ █████ |
Common risk difference vs. ustekinumab (███ █████ ██ █████) | ███ █████ ██ █████ | |
P value | ███ █████ ██ █████ | |
Endoscopic response at week 52 | ||
Endoscopic response at week 52 | 280 (48.4) | 133 (46.3) |
Common risk difference vs. ustekinumab (95% CI) | 2.3 (−4.7 to 9.3) | |
P value | 0.513623 | |
SES-CD endoscopic remissiond | ||
Endoscopic remission at week 12 | ||
Endoscopic remission at week 12 | 63 (10.9) | ███ ████ |
Common risk difference vs. ustekinumab (███ █████ ██ █████) | ███ █████ ██ █████ | |
P value | ███ █████ ██ █████ | |
Endoscopic remission at week 52 | ||
Endoscopic remission at week 52 | 110 (19.0) | 52 (18.1) |
Common risk difference vs. ustekinumab (99.5% CI) | 0.9 (−6.9 to 8.7) | |
P value | 0.745430 | |
PRO clinical responsec at week 12, corticosteroid-free status from week 40 to week 52, and CDAI clinical remission at week 52d | ||
Response, n (%) | 253 (43.7) | ███ ████ |
Common risk difference vs. ustekinumab (███ █████ ██ █████) | ███ █████ ██ █████ | |
P value | ███ █████ ██ █████ | |
PRO clinical responsec at week 12 and SES-CD endoscopic remission at week 52d | ||
Response, n (%) | 92 (15.9) | ███ ███ |
Common risk difference vs. ustekinumab (███ █████ ██ █████) | ███ █████ ██ █████ | |
P value | ███ █████ ██ █████ | |
Change from baseline in IBDQd | ||
Change from baseline in IBDQ at week 12 | ||
LS mean change from baseline to week 12 (SE) | 36.89 (1.245) | ███ █████ |
LS mean difference vs. ustekinumab (99.5% CI) | −0.32 (−4.52 to 3.88) | |
P value | 0.880867 | |
Change from baseline in IBDQ at week 52 | ||
LS mean change from baseline to week 52 (SE) | 43.82 (1.365) | ███ ████ |
LS mean difference vs. ustekinumab (99.5% CI) | ███ █████ ██ █████ | |
P value | ███ █████ ██ █████ | |
AP = abdominal pain; BF = biologic failure; CDAI = Crohn’s Disease Activity Index; CI = confidence interval; CMH = Cochran-Mantel-Haenszel; IBDQ = Inflammatory Bowel Disease Questionnaire; LS = least squares; PAS = primary analysis set; PRO = patient-reported outcome; q.4.w. = every 4 weeks; q.8.w. = every 8 weeks; SC = subcutaneous; SE = standard error; SES-CD = Simple Endoscopic Score for Crohn’s Disease; SF = stool frequency; vs. = versus.
Note: Common risk difference and CMH test were adjusted by BF status (yes or no), baseline SES-CD total score (< 12 or ≥ 12), and baseline SF ≥ 7 and/or baseline ≥ 2.5 (yes or unknown vs. no).
aThe mirikizumab dose regimen is 900 mg IV every 4 weeks for 3 doses, then 300 mg SC every 4 weeks.
b6 mg/kg IV for 1 dose, then 90 mg SC every 8 weeks starting at week 8.
cPRO clinical response is defined as at least a 30% decrease in SF and/or AP, with neither score worse than baseline.
dThe end point was not adjusted for multiplicity.
eThe P value for noninferiority is derived from the common risk difference with a margin of 10%. The 1-sided P value was multiplied by 2 to be interpretable at standard alpha levels.
fP value versus ustekinumab (superiority) ███ █████ ██ █████.
Source: VIVID-1 study (I6T-MC-AMAM) Clinical Study Report.29
Harms
The key harms results for the safety population are summarized in Table 18.
Treatment-Related AEs
During the induction treatment period, █████ of patients who received mirikizumab reported at least 1 TEAE, whereas TEAEs were reported for █████ of patients who received placebo and █████ of patients who received ustekinumab. During the overall treatment period, 78.6% of patients who received mirikizumab reported at least 1 TEAE, whereas TEAEs were reported for 73.0% of patients who received placebo and 77.3% of patients who received ustekinumab. For both treatment periods, the most commonly reported TEAE among patients receiving mirikizumab was COVID-19, whereas the most common TEAEs among patients receiving placebo and ustekinumab were CD and COVID-19, respectively.
Serious AEs
During the induction treatment period, ████ of patients who received mirikizumab reported at least 1 SAE, whereas SAEs were reported for ████ of patients who received placebo and ████ of patients who received ustekinumab. During the overall treatment period, 10.3% of patients who received mirikizumab reported at least 1 SAE, whereas SAEs were reported for 17.1% of patients who received placebo and 10.7% of patients who received ustekinumab. For both treatment periods, the most commonly reported SAEs among patients in all treatment arms were related to GI disorders.
Table 18: Summary of Harms Results From the VIVID-1 Study (Safety Population) (August 23, 2023, Data Cut-Off Date)
Harms | Induction period | Treatment period | ||||
|---|---|---|---|---|---|---|
Mirikizumab (N = 630) n (%) | Placebo (N = 211) n (%) | Ustekinumab (N = 309) n (%) | Mirikizumab (N = 630) n (%) | Placeboa (N = 211) n (%) | Ustekinumab (N = 309) n (%) | |
TEAEs occurring in > 5% of patients, n (%) | ||||||
Patients with ≥ 1 TEAE | ██ █ | ██ █ | ██ █ | 495 (78.6) | 154 (73.0) | 239 (77.3) |
COVID-19 | ██ █ | ██ █ | ██ █ | 104 (16.5) | 29 (13.7) | 47 (15.2) |
Nasopharyngitis | ██ █ | ██ █ | ██ █ | 36 (5.7) | 9 (4.3) | 19 (6.1) |
Upper respiratory tract infection | ██ █ | ██ █ | ██ █ | 38 (6.0) | 9 (4.3) | 22 (7.1) |
Arthralgia | ██ █ | ██ █ | ██ █ | 41 (6.5) | 11 (5.2) | 8 (2.6) |
Headache | ██ █ | ██ █ | ██ █ | 41 (6.5) | 9 (4.3) | 15 (4.9) |
Anemia | ██ █ | ██ █ | ██ █ | 42 (6.7) | 14 (6.6) | 15 (4.9) |
Abdominal pain | ██ █ | ██ █ | ██ █ | 28 (4.4) | 13 (6.2) | 10 (3.2) |
CD | ██ █ | ██ █ | ██ █ | 26 (4.1) | 33 (15.6) | 19 (6.1) |
Pyrexia | ██ █ | ██ █ | ██ █ | 25 (4.0) | 8 (3.8) | 8 (2.6) |
Diarrhea | ██ █ | ██ █ | ██ █ | 35 (5.6) | 10 (4.7) | 12 (3.9) |
SAEs by system organ classes in ≥ 1% of patients, n (%) | ||||||
Patients with ≥ 1 SAE | ██ █ | ██ █ | ██ █ | 65 (10.3) | 36 (17.1) | 33 (10.7) |
GI disorder | ██ █ | ██ █ | ██ █ | 34 (5.4) | 22 (10.4) | 16 (5.2) |
CD | ██ █ | ██ █ | ██ █ | 12 (1.9) | 11 (5.2) | 9 (2.9) |
Intestinal obstruction | ██ █ | ██ █ | ██ █ | 3 (0.5) | 1 (0.5) | 0 (0) |
AP | ██ █ | ██ █ | ██ █ | 2 (0.3) | 1 (0.5) | 0 (0) |
Diarrhea | ██ █ | ██ █ | ██ █ | 2 (0.3) | 0 (0) | 0 (0) |
Small intestinal obstruction | ██ █ | ██ █ | ██ █ | 4 (0.6) | 1 (0.5) | 1 (0.3) |
Infections and infestations | ██ █ | ██ █ | ██ █ | 14 (2.2) | 6 (2.8) | 9 (2.9) |
Patients who stopped treatment due to AEs, n (%) | ||||||
Stopped study treatment due to AE (including death) | ██ █ | ██ █ | ██ █ | 32 (5.1)b | 20 (9.5)b | 8 (2.6) |
Infusion-related hypersensitivity reaction | ██ █ | ██ █ | ██ █ | 3 (0.5) | 0 (0) | 0 (0) |
Abdominal abscess | ██ █ | ██ █ | ██ █ | 2 (0.3) | 0 (0) | 0 (0) |
CD | ██ █ | ██ █ | ██ █ | 5 (0.8) | 12 (5.7) | 3 (1.0) |
AP | ██ █ | ██ █ | ██ █ | 1 (0.2) | 0 (0) | 0 (0) |
Headache | ██ █ | ██ █ | ██ █ | 1 (0.2) | 0 (0) | 0 (0) |
Deaths, n (%)c | ||||||
Patients who died | ██ █ | ██ █ | ██ █ | 0 (0) | 1 (0.5) | 1 (0.3) |
Cardiac arrest | ██ █ | ██ █ | ██ █ | 0 (0) | 1 (0.5) | 0 (0) |
Sepsis | ██ █ | ██ █ | ██ █ | 0 (0) | 0 (0) | 1 (0.3) |
AEs of special interest, n (%) | ||||||
Infection | ██ █ | ██ █ | ██ █ | 261 (41.4) | 73 (34.6) | 130 (42.1) |
Serious infection | ██ █ | ██ █ | ██ █ | 14 (2.2) | 6 (2.8) | 9 (2.9) |
Opportunistic infectiond | ██ █ | ██ █ | ██ █ | 7 (1.1) | 0 (0.0) | 1 (0.3) |
Infusion-site reactione | ██ █ | ██ █ | ██ █ | NA | NA | NA |
Injection-site reactione | ██ █ | ██ █ | ██ █ | 65 (10.8) | 7 (6.5) | 17 (5.8) |
Hepatic eventd | ██ █ | ██ █ | ██ █ | 39 (6.2) | 9 (4.3) | 8 (2.6) |
Depressiond | ██ █ | ██ █ | ██ █ | 5 (0.8) | 0 (0.0) | 2 (0.6) |
Suicidal ideation | ██ █ | ██ █ | ██ █ | 2 (0.3) | 0 (0.0) | 0 (0.0) |
Immediate hypersensitivity reaction | ██ █ | ██ █ | ██ █ | 24 (3.8) | 5 (2.4) | 7 (2.3) |
Nonimmediate hypersensitivity reaction | ██ █ | ██ █ | ██ █ | 50 (7.9) | 11 (5.2) | 18 (5.8) |
Cerebrocardiovascular event | ██ █ | ██ █ | ██ █ | 3 (0.5) | 2 (0.9) | 2 (0.6) |
MACE | ██ █ | ██ █ | ██ █ | 0 (0.0) | 2 (0.9) | 2 (0.6) |
Malignancy | ██ █ | ██ █ | ██ █ | 2 (0.3) | 1 (0.5) | 0 (0.0) |
NMSC | ██ █ | ██ █ | ██ █ | 1 (0.2) | 1 (0.5) | 0 (0.0) |
Malignancy excluding NMSC | ██ █ | ██ █ | ██ █ | 1 (0.2) | 0 (0.0) | 0 (0.0) |
AE = adverse event; AP = abdominal pain; CD = Crohn disease; GI = gastrointestinal; MACE = major adverse cardiovascular event; NA = not applicable; NMSC = nonmelanoma skin cancer; SAE = serious adverse event; TEAE = treatment-emergent adverse event.
aFor patients who were randomized to placebo, only the exposure period to placebo is included.
bTwo patients in the placebo group and 2 patients in the mirikizumab group reported AEs during the induction period, but did not discontinue until the maintenance period.
cThe death of 1 patient who was a placebo nonresponder and switched to mirikizumab after week 12 is not presented in this table. The reported term for the cause of death was CD (adjudicated term: noncardiovascular death).
dNarrow terms.
eHigh-level terms.
Source: VIVID-1 study (I6T-MC-AMAM) Clinical Study Report.29
Withdrawals Due to AEs
During the induction treatment period, ████ of patients who received mirikizumab withdrew from treatment due to AEs, whereas withdrawals due to AEs were reported for ████ of patients who received placebo and ████ of patients who received ustekinumab. During the overall treatment period, 5.1% of patients who received mirikizumab withdrew from treatment due to AEs, whereas withdrawals due to AEs were reported for 9.5% of patients who received placebo and 2.6% of patients who received ustekinumab.
Mortality
One death of a patient receiving placebo was reported during the induction treatment period. During the overall treatment period, 2 deaths were reported; these pertained to 1 patient receiving placebo and 1 patient receiving ustekinumab. No deaths were reported among patients who received mirikizumab during either treatment period.
Notable Harms
During the induction treatment period, ███ ████ ██ █████████ ███ ██████ █████ ███ ███████████ █████ ███████ ████████ ██ ███ ███████ ███████ ███ ███████████ ███████ ███████ ██████████ ███ ████ ██ █████████████ ████████████████ █████████ ███ ██████ █████ ███ ███████████ █████ ██████ ████████ ██ ███ ███████ ██████ ███ ███████████ ██████ ██████. Suicidal ideation was reported for 1 patient receiving mirikizumab. During the induction treatment period, rates of infusion- and injection-site reactions, hepatic events, depression, immediate hypersensitivity reactions, cerebrocardiovascular events, and malignancies were low and similar across the 3 treatment groups.
During the overall treatment regimen period, rates of infection were similar between the mirikizumab group (41.4%) and ustekinumab group (42.1%), but lower for the placebo group (34.6%). Compared to placebo and ustekinumab, mirikizumab was associated with higher rates of injection-site reactions (10.8% for the mirikizumab group versus 6.5% for the placebo group and 5.8% for the ustekinumab group), hepatic events (6.2% for the mirikizumab group versus 4.3% for the placebo group and 2.6% for the ustekinumab group), immediate hypersensitivity reactions (3.8% for the mirikizumab group versus 2.4% for the placebo group and 2.3% for the ustekinumab group), and nonimmediate hypersensitivity reactions (7.9% for the mirikizumab group versus 5.2% for the placebo group and 5.8% for the ustekinumab group). Suicidal ideation was reported for 2 patients receiving mirikizumab and 0 patients in the placebo and ustekinumab groups. Rates of depression, cerebrocardiovascular events, and malignancies remained low and similar across the 3 treatment groups.
Critical Appraisal
Internal Validity
Notable strengths of the VIVID-1 trial included its blinding of patients, study investigators, and study site personnel as well as its use of a double-dummy design to maintain blinding of treatment throughout the study. The VIVID-1 trial was designed as a treat-through study in which patients remained on their assigned treatment beyond the initial induction phase without rerandomization. This approach allowed for the evaluation of efficacy during both the induction and maintenance phases within the same treatment group. Moreover, there were no concerns with the randomization process, and the clinical experts consulted by CDA-AMC agreed that the stratification factors used for randomization were appropriate. The baseline characteristics were generally well-balanced across the 3 treatment groups, supporting the success of the randomization procedure. Notably, the groups were well-balanced in terms of disease duration, disease location, and mean SES-CD, SF, and AP scores, which were deemed key drivers of efficacy by the clinical experts consulted by CDA-AMC. Although minor differences were noted for sex distribution, mean CDAI score, prior immunomodulator use, and prior and baseline corticosteroid use among the 3 treatment groups, the clinical experts consulted by CDA-AMC agreed that these would have little impact on the interpretation of the results. The treatment groups were also well-balanced in terms of the other categories of treatments administered as prior and baseline medications.
CDAI clinical remission at week 52 was assessed for noninferiority between the mirikizumab and ustekinumab groups according to a 10% noninferiority margin, which was selected based on statistical and clinical considerations in accordance with global regulatory guidance.20,21 The clinical experts consulted by CDA-AMC agreed that the use of a margin of 10% was adequate for performing a noninferiority analysis for a clinical trial in CD. Of note, the clinical experts consulted by CDA-AMC suggested that there may be variability among clinicians in determining the difference between groups that is considered clinically important. They attributed this variation to differing opinions on the magnitude of change required to influence treatment decisions, with estimates likely falling between 10% and 15%. The CDA-AMC review team notes that even more conservative margins than 10% would have been met.
The PAS for efficacy outcomes of the VIVID-1 trial consisted of all randomized patients who had a baseline SES-CD score of 7 or higher (or 4 or higher for patients with isolated ileal disease) and received at least 1 dose of study intervention; this group comprised 1,050 patients. The use of the PAS for the primary analyses is a deviation from the preferred approach of using the ITT population for efficacy analyses. Although the trial reported the patient disposition and baseline characteristics for the 1,152 patients who comprised the ITT population, no analyses were conducted for this population. However, the difference in the sample sizes of the ITT and PAS was largely attributed to exclusions based on the trial’s eligibility criteria, which were not expected to introduce bias.60 Moreover, the trial conducted sensitivity analyses for the coprimary end points based on the mITT population (defined as all randomized patients who received at least 1 dose of any study intervention, regardless of treatment adherence or protocol deviations); this group consisted of 1,150 patients. The results for these end points were consistent between the PAS and mITT population sets. Given the consistency of the results across the PAS and mITT populations and minor differences in the sample sizes of the ITT and mITT populations, the use of the PAS was unlikely to introduce bias in the results.
In the VIVID-1 trial, the treatment discontinuation rates at the end of the induction and maintenance phases were both higher for placebo (induction: 7.0%; maintenance: 30.1% for placebo responders and 16.3% to placebo nonresponders) compared with mirikizumab (induction: 2.8%; maintenance: 11.3%) and ustekinumab (induction: 3.5%; maintenance: 10.9%). These higher discontinuation rates in the placebo group were attributed to AEs, lack of efficacy, and patient withdrawal. To address ICEs that may lead to missing end point data for the coprimary and binary end points, the VIVID-1 trial implemented a composite strategy in which ICEs defined for the study included discontinuation of study treatment before the time point of interest. Patients who discontinued study treatment were categorized as nonresponders and were not considered missing for the estimand of interest. The strategy to handle ICEs in the VIVID-1 trial was deemed appropriate by the CDA-AMC team, as the use of NRI to handle missing data in primary analyses is generally considered acceptable by regulatory agencies.22,23 Similarly, the analysis of LS mean change in IBDQ score from baseline to week 52 used an mBOCF imputation approach. For the ICEs of study intervention discontinuation and specified changes in concomitant medication for CD, values after the occurrence of the ICE were set to the patient’s baseline value. Hence, these patients were not considered missing from the perspective of the estimand of interest. The last nonmissing observation was carried forward to the corresponding visit for patients with sporadically missing observations before any ICEs.
Of note, there remains potential for bias in the results if reasons for study discontinuation are not clearly related to lack of efficacy. Although most study discontinuations were attributed to lack of efficacy and AEs, there was a higher rate of study discontinuation due to withdrawal by patient among the placebo group compared with the mirikizumab and ustekinumab groups. However, although this imbalance may bias results in favour of mirikizumab, the review team deemed that the potential for bias is small. High attrition rates were also noted in the analyses of the observed change in IBDQ score from baseline to week 52; at week 52, ███ of patients in the PAS set were included in the analysis for observed change in IBDQ score from baseline (█████ of patients in the placebo group, █████ patients in the mirikizumab group, and █████ of patients in the ustekinumab group). In particular, a larger attrition rate was noted for the placebo group; this was attributed to a higher treatment discontinuation rate, with the most common underlying reasons being AEs, lack of efficacy, and withdrawal by patient. However, after accounting for ICEs, the rates of patients with imputed values due to data that were sporadically missing for reasons other than ICEs were low across treatment groups for LS mean change in IBDQ score. For reasons similar to those outlined for the use of NRI for binary end points, the review team deemed the use of the mBOCF approach appropriate for LS mean change in IBDQ score.
After accounting for ICEs, the rates of sporadically missing data due to reasons unrelated to ICE were low (i.e., less than 5%) for the coprimary end points, most major secondary end points, and LS mean change in IBDQ score. Sporadically missing data due to reasons unrelated to ICEs were imputed based on NRI. Although this approach relies on unverifiable assumptions about the missing data, the CDA-AMC review team considered it appropriate for most end points, given that the proportions of missing data were small. However, higher rates of missing data were noted for endoscopic response and remission as measured by the SES-CD at week 12 (████ for mirikizumab; █████ for placebo; and ████ for ustekinumab); this may increase the risk of bias when interpreting the results for those outcomes. However, the direction and magnitude of this risk is unknown. Of note, the results of sensitivity analyses performed for the coprimary end points, including a tipping-point analysis and the use of mNRI imputation, were consistent with those of the primary analysis.
The clinical experts consulted by CDA-AMC indicated that the coprimary and major secondary outcomes measured in the VIVID-1 trial were relevant to clinical practice. The coprimary and major secondary outcomes were included in a multiplicity-adjusted testing scheme; all were met during the primary analysis. Of note, some of the outcomes discussed in this review were not included in the multiplicity-adjusted testing scheme; thus, these should be interpreted as supporting evidence. Patients who received placebo and were considered nonresponders at week 12 went on to receive treatment with mirikizumab until the end of the study. However, these patients were imputed as nonresponders for all visits after week 12. The rationale underlying this assumption was that these patients would not have experienced a response had they continued treatment with placebo, which was determined to be likely appropriate by the CDA-AMC review team. Moreover, among patients who were initially randomized to placebo, only the exposure period to placebo was considered during the safety analyses. Thus, the treatment switch among nonresponders to mirikizumab at week 12 is not expected to significantly affect the interpretation of the results.
The VIVID-1 trial measured several PROs: CDAI clinical remission, PRO clinical response, and the results of the IBDQ questionnaire. Data for these outcomes were collected from patient- and physician-reported questionnaires, which may be subject to performance bias if patients or physicians became unblinded. Such unblinding could result from obvious efficacy in the treatment groups or lack of efficacy in the placebo group. However, the double-blind study design mitigated the potential for bias to be introduced in the results. The IBDQ questionnaire was considered a key HRQoL outcome of interest by the review team and has been validated in patients with CD. For the IBDQ score, a change of 16 points is conventionally considered a minimal important difference (MID). Of note, this MID is described as a within-group change, which may affect the interpretation of the results. However, the review team determined that this limitation was minor, given the results for LS mean change in IBDQ score in the trial. Namely, according to this MID, mirikizumab resulted in a clinically important improvement in the LS mean change in IBDQ total score from baseline to week 52 compared with placebo. Moreover, although within-group changes for both the mirikizumab and ustekinumab groups showed improvement, the difference between the 2 groups was deemed to be small.
To test for consistency of results across different subgroups, subgroup analyses based on prior therapy, baseline medication, and baseline demographic and disease characteristics were performed for the coprimary end points comparing mirikizumab and placebo and for the major secondary end points comparing mirikizumab and ustekinumab. These analyses showed results that were consistent overall with those of the primary analyses; however, the results were not adjusted for multiplicity and should be interpreted as supportive evidence.
External Validity
The use of an induction and maintenance treatment phase in the VIVID-1 trial aligns with the phases of treatment for CD in clinical practice. The clinical experts consulted by CDA-AMC agreed that the 12-week induction period used in the trial is comparable to other trials for CD and reflects the expected time frame for observing a clinical response after treatment with mirikizumab in clinical practice. The VIVID-1 trial did not include rescue therapy for patients who were assigned to mirikizumab or ustekinumab. However, patients who were classified as nonresponders to placebo at 12 weeks received treatment with mirikizumab for the remainder of the study. The clinical experts consulted by CDA-AMC noted that this criterion differed from clinical practice. One clinical expert indicated that rescue therapy for CD-related flares could include either a short course of corticosteroid tapering or a dose escalation of existing biologic therapy. Nonetheless, the clinical experts consulted by CDA-AMC did not cite major concerns with these differences in terms of the generalizability of the trial results to clinical practice in Canada. One clinical expert attributed the lack of rescue therapy for patients receiving active treatment in the VIVID-1 trial to its treat-through design, which was aimed at ensuring patients remained within their designated treatment groups for as long as possible to avoid disrupting the study’s ability to compare treatment effects. The clinical experts noted that even nonresponders at week 12 could improve by week 24 simply by continuing their current therapy; this is why some trial designs aim to minimize early rescue therapy.
The clinical experts consulted by CDA-AMC agreed that the eligibility criteria of the VIVID-1 trial are aligned with those of other trials for CD therapies, although they noted that the criteria were not entirely reflective of patients in clinical practice. One expert noted that the patient population enrolled in the VIVID-1 trial would represent approximately 30% of the patients treated in clinical practice. For instance, the clinical experts agreed that there are many patients in clinical practice who would be excluded from the VIVID-1 trial, such as those who want to get pregnant and those with an ostomy, high risk of infection, or liver enzyme abnormalities. The clinical experts also indicated that patients with disease isolated to the ileum were underrepresented in the VIVID-1 trial compared to their representation in clinical practice in Canada and previous CD trials.24,25 One clinical expert added that the proportion of patients with ileum-only disease in clinical practice in Canada would be approximately double that observed in the trial. The experts further noted that ileum-isolated disease was more difficult to treat and was expected to lead to poorer treatment outcomes (especially in terms of endoscopic response and endoscopic remission rates) compared to disease affecting other areas of the GI tract. The clinical experts consulted by CDA-AMC also agreed that the proportions of patients for whom anti-TNF drugs or 2 or more biologic therapies had failed were lower than what is more commonly seen in populations previously exposed to drugs in clinical practice and previous CD trials.24,25 The clinical experts further indicated that the failure of 1 or more lines of prior biologic treatment negatively affects treatment efficacy outcomes. One clinical expert noted that this observation holds true especially for clinical and endoscopic remission rates. The clinical experts consulted by CDA-AMC also agreed that the patient population of the VIVID-1 trial appears to have had a lower endoscopic disease burden overall (as represented by a slightly lower mean SES-CD score of 13.1 [SD = 6.0] to 13.9 [SD = 6.6] across treatment groups in the VIVID-1 study) compared to the patient populations observed in previous CD trials24,25 and in clinical practice. The baseline SES-CD scores for evidence for risankizumab ranged from a mean of 14.0 (SD = 7.1) to 14.8 (SD = 7.8) for the ADVANCE and MOTIVATE trials, respectively. The baseline SES-CD scores for evidence for upadacitinib ranged from a mean of 13.6 (SD = 7.0) to 15.8 (SD = 7.6) across the U-EXCEL, U-EXCEED, and U-ENDURE trials. Based on these factors, the clinical experts consulted by CDA-AMC suggested that patients in the VIVID-1 trial may have had a more moderate severity of CD compared to patient populations with moderately to severely active CD in previous CD trials and clinical practice.
The clinical experts also noted that there was a higher proportion of patients in the VIVID-1 trial with baseline oral amino salicylate use compared to what would be observed in clinical practice in Canada. One clinical expert attributed this discrepancy to the fact that most patients in the trial were based in Europe and the rest of the world, notably eastern Europe. The expert noted that amino salicylates are commonly used in clinical practice in eastern Europe, but less so in clinical practice in Canada. However, despite the higher use of oral amino salicylates in the trial, the clinical experts consulted by CDA-AMC did not express major concerns about applying the trial results to clinical practice in Canada.
The VIVID-1 trial assessed the efficacy and safety of mirikizumab compared to placebo and ustekinumab. The latter has been used as an active comparator in other trials for CD. The sponsor noted that ustekinumab was the only available therapy with an IL-23 inhibition mechanism of action when the VIVID-1 trial began. The dose of ustekinumab administered in the trial was aligned with the dose recommended in the Health Canada product monograph.26 The clinical experts consulted by CDA-AMC agreed that ustekinumab was part of the treatment landscape for CD in Canada. However, they indicated that ustekinumab is less commonly used to treat CD than are risankizumab, upadacitinib, and anti-TNF drugs. They noted that this recent shift in the treatment landscape could be attributed to the results of the SEQUENCE trial, which, according to the clinical experts, showed superiority of risankizumab compared with ustekinumab among patients with moderately to severely active CD with prior exposure to anti-TNF drugs.43 The CDA-AMC review team notes that it did not review or assess the SEQUENCE trial43 (an open-label, phase IIIb trial) as part of this submission. Further, during the 2023 CDA-AMC review of risankizumab for CD, the Canadian Drug Expert Committee reviewed part 1 of the SEQUENCE trial only (i.e., preliminary data from a 24-week interim lock analysis) and concluded that, based on these results, no definitive conclusions could be drawn regarding the relative efficacy of risankizumab compared to ustekinumab. As the VIVID-1 trial did not compare mirikizumab with other relevant comparators for CD, the stand-alone results of the trial may not provide a full assessment of the efficacy and safety of mirikizumab compared to existing treatments for CD in clinical practice in Canada.
The VIVID-1 trial measured outcomes that were relevant to patients and clinicians. Input from patient groups indicated that important outcomes included sustained remission and treatment response, improved disease control, and reductions in side effects, flares, and symptoms. The coprimary and secondary outcomes assessed in the VIVID-1 trial included outcomes that were considered to be important by the clinical experts consulted by CDA-AMC, including clinical response, clinical remission, endoscopic response, and endoscopic remission. Notably, the clinical experts indicated that endoscopic response and remission were the most important outcomes related to the treatment of CD, stating that these provided the most reliable measures of disease activity and drug performance. The clinical experts indicated that although QoL measures related to CD are important for patients, they are not routinely measured in clinical practice. The experts agreed that improvements related to QoL (e.g., fatigue and depression) would naturally follow from improvements in endoscopic outcomes. The clinical experts consulted by CDA-AMC also agreed that the incidence of injection-site reactions was an important safety outcome related to the administration of mirikizumab due to the frequency of injections required for treatment and the impact of these on the overall patient experience.
GRADE Summary of Findings and Certainty of the Evidence
Methods for Assessing the Certainty of the Evidence
For pivotal studies and RCTs identified in the sponsor’s systematic review, GRADE was used to assess the certainty of the evidence for outcomes considered most relevant to inform expert committee deliberations, and a final certainty rating was determined as outlined by the GRADE Working Group.27,28
High certainty: We are very confident that the true effect lies close to that of the estimate of the effect.
Moderate certainty: We are moderately confident in the effect estimate — The true effect is likely to be close to the estimate of the effect, but there is a possibility that it is substantially different. We use the word “likely” for evidence of moderate certainty (e.g., “X intervention likely results in Y outcome”).
Low certainty: Our confidence in the effect estimate is limited — The true effect may be substantially different from the estimate of the effect. We use the word “may” for evidence of low certainty (e.g., “X intervention may result in Y outcome”).
Very low certainty: We have very little confidence in the effect estimate — The true effect is likely to be substantially different from the estimate of effect. We describe evidence of very low certainty as “very uncertain.”
Following the GRADE approach, evidence from RCTs started as high-certainty evidence and could be rated down for concerns related to study limitations (which refers to internal validity or risk of bias), indirectness, imprecision of effects, and publication bias.
When possible, certainty was rated in the context of the presence of an important (nontrivial) treatment effect; if this was not possible, certainty was rated in the context of the presence of any treatment effect (i.e., the clinical importance is unclear). In all cases, the target of the certainty of evidence assessment was based on the point estimate and its location relative to the threshold for a clinically important effect (when a threshold was available) or to the null.
Results of GRADE Assessments
Mirikizumab Versus Placebo
Table 2 presents the GRADE summary of findings for mirikizumab versus placebo.
Mirikizumab Versus Ustekinumab
Table 3 presents the GRADE summary of findings for mirikizumab versus ustekinumab.
LTE Studies
The contents of this section have been informed by materials submitted by the sponsor. The following has been summarized and validated by the review team.
Description of Studies
One ongoing, phase III, multicentre, open-label LTE study (the VIVID-2 study) was submitted. This study reports efficacy and safety results through 104 weeks for adults with CD who were randomized to mirikizumab in the VIVID-1 trial and then continued to receive SC mirikizumab in the VIVID-2 trial. Patients were separated into 2 treatment groups — endoscopic responders and endoscopic nonresponders — according to their response in the VIVID-1 trial. Endoscopic responders were defined as participants who achieved at least a 50% reduction from baseline in the SES-CD score at week 52 of the VIVID-1 trial irrespective of their prior treatment group. The study design of the VIVID-2 study is depicted in Figure 3.
Endoscopic responders continued the same SC mirikizumab dosage as in the VIVID-1 trial (i.e., 300 mg every 4 weeks), while endoscopic nonresponders received reinduction treatment with IV mirikizumab (900 mg every 4 weeks for 3 doses) at the start of the VIVID-2 trial followed by 300 mg SC dosing every 4 weeks. Eligible patients from the phase II SERENITY trial who, in the opinion of the investigator, could derive clinical benefit from continued treatment with mirikizumab, also entered the LTE. A total of 106 patients (12.2%) entered from the SERENITY study. However, the summarized efficacy data include patients who were randomized to mirikizumab in the VIVID-1 trial. As the analyzed outcomes did not include patients from the SERENITY study, and given that these results were not submitted to CDA-AMC, the study is not further mentioned in this report.
The interim analysis did not include patients who entered VIVID-2 after August 1, 2023 to ensure that all patients in this interim analysis could have completed 1 year of treatment in the VIVID-2 trial. The analyses were based on the data cut-off date of August 2, 2024.
The coprimary end points are endoscopic response (i.e., a ≥ 50% reduction from baseline in SES-CD total score) at week 104 (week 52 of the VIVID-2 trial) and CDAI clinical remission (i.e., CDAI score ˂ 150) at week 104. The secondary end points include endoscopic remission based on the SES-CD total score at week 104, PRO clinical response based on SF and AP at week 104, and QoL as measured by IBDQ at week 104.
Figure 3: Study Design of the VIVID-2 Study
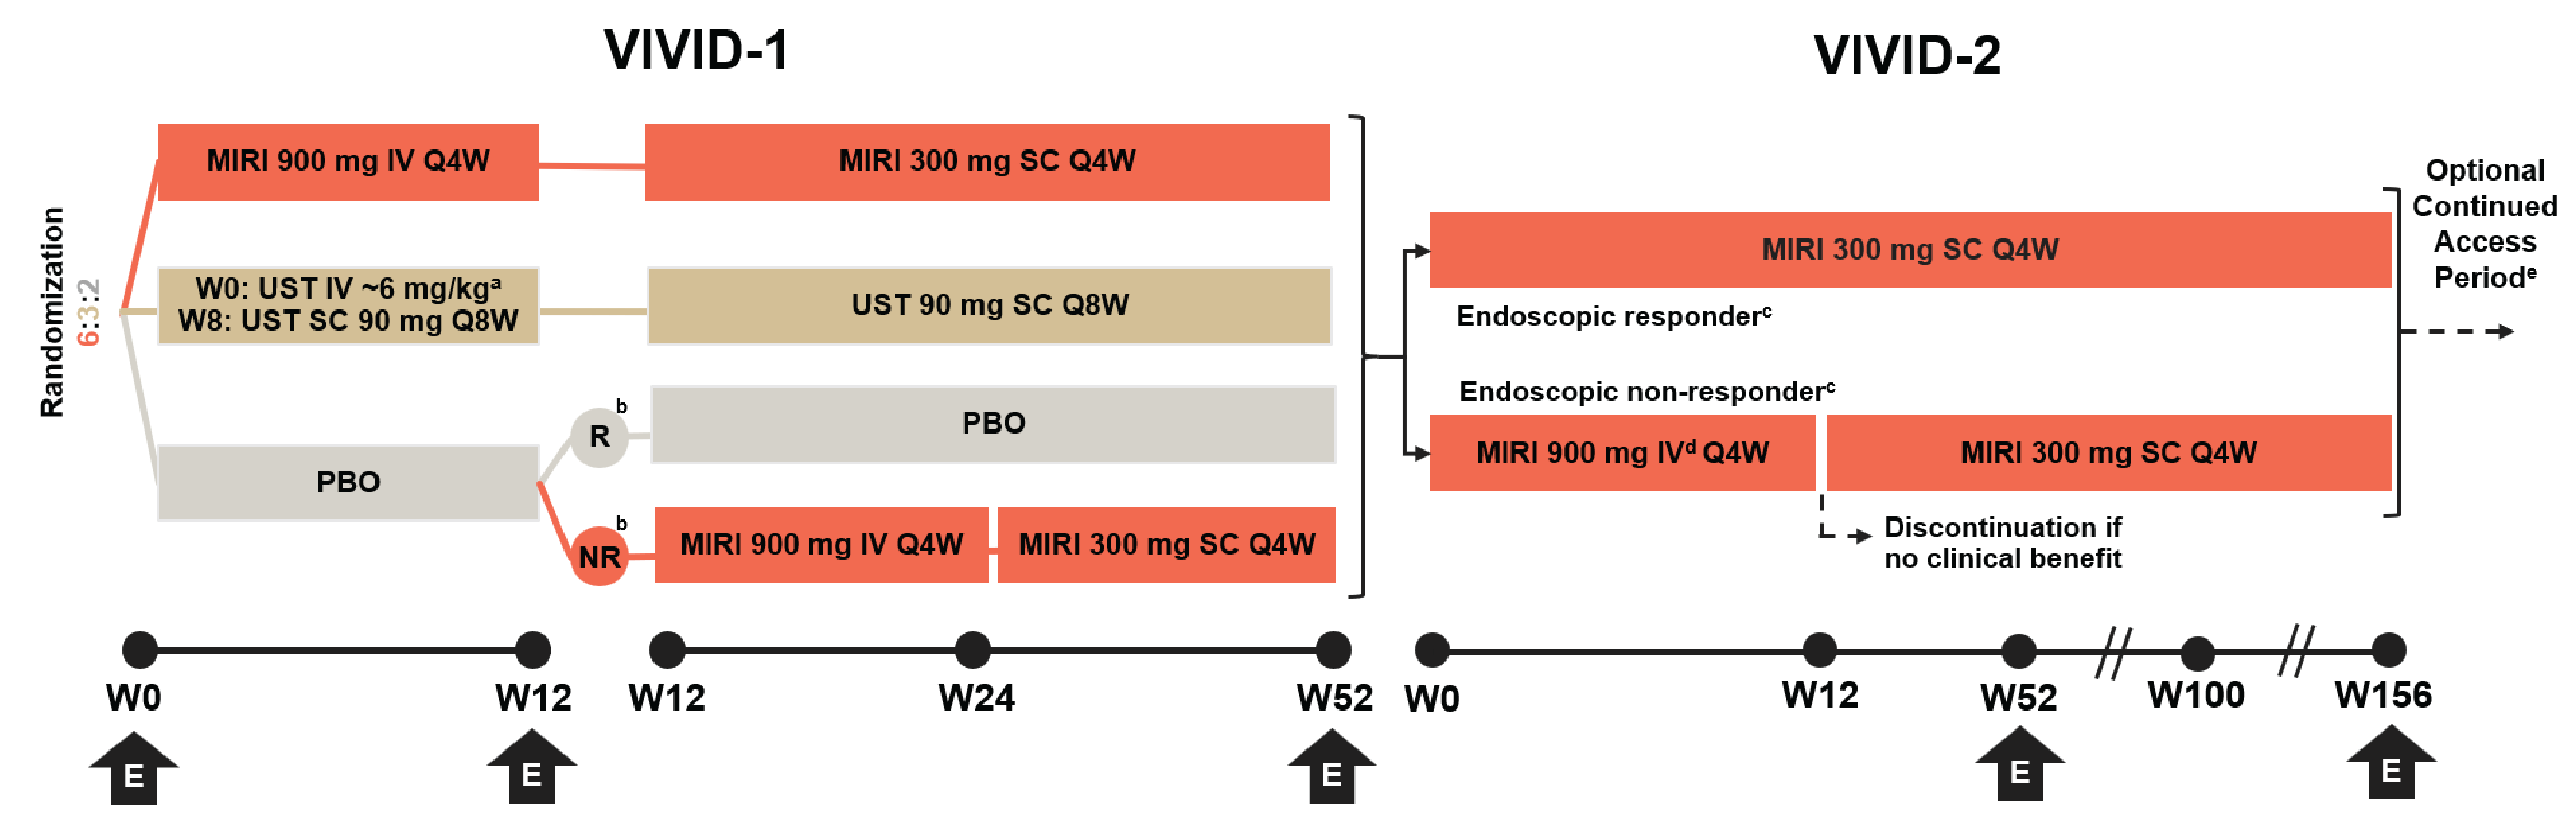
E = endoscopy; MIRI = mirikizumab; NR = nonresponder; PBO = placebo; Q4W = every 4 weeks; Q8W = every 8 weeks; R = responder; SC = subcutaneous; SES-CD = Simple Endoscopic Score for Crohn’s Disease; UST = ustekinumab; W0 = week 0; W12 = week 12; W24 = week 24; W52 = week 52; W100 = week 100; W156 = week 156.
aSingle dose.
bResponders (as measured by PROs) at week 12 of the VIVID-1 trial were defined as those who achieved ≥ 30% decrease in loose stool frequency and/or abdominal pain, with neither score worse than baseline.
c Endoscopic responder and endoscopic nonresponder status were based on the results of the VIVID-1 trial week 52 endoscopy (with response defined as a ≥ 50% reduction from baseline in SES-CD total score).
dMIRI 900 mg IV induction for 3 doses, then continue with MIRI 300 mg SC every 4 weeks. Discontinuation from trial if no clinical benefit observed by investigator at week 12.
ePatients eligible for the continued access period continue MIRI 300 mg SC every 4 weeks. Patients not eligible for the continued access period move to posttreatment follow-up.
Source: Sponsor’s Summary of Clinical Evidence.16
Populations
Eligible patients included those who completed week 52 of the VIVID-1 trial, including the endoscopy for evaluation of responder or nonresponder status, and who — in the opinion of the investigator — would derive clinical benefit from treatment with mirikizumab.
Patients were excluded from the LTE if any of the following occurred:
They reported an SAE while on mirikizumab.
They developed conditions before the LTE that would disqualify them from treatment with mirikizumab.
They had previously discontinued the study drug or had a temporary interruption of the study drug such that, in the opinion of the investigator or sponsor, restarting mirikizumab would present unacceptable risk.
They had a significant uncontrolled neuropsychiatric disorder or were assessed as being at risk of suicide.
They had been diagnosed with a serious infection or had an unstable or uncontrolled illness.
Interventions
The study treatment consisted of IV mirikizumab (900 mg every 4 weeks during the induction phase) and SC mirikizumab (300 mg every 4 weeks during the maintenance phase). Endoscopic responders at week 52 of the VIVID-1 trial received the maintenance dosage only.
Outcomes
The coprimary end points are endoscopic response (i.e., a ≥ 50% reduction from baseline in SES-CD total score) at week 104 (week 52 of VIVID-2) and CDAI clinical remission (i.e., CDAI score ˂ 150) at week 104. The secondary end points include endoscopic remission based on SES-CD total score at week 104, PRO clinical response based on SF and AP at week 104, and QoL as measured by IBDQ (i.e., IBDQ response and remission) at week 104. IBDQ response was defined as a 16-point or greater improvement from baseline in IBDQ score. IBDQ remission was defined as a score of 170 or greater.
Statistical Analysis
The analysis populations are described in Table 19. Efficacy outcomes were assessed in the PAS, which consisted of patients in the mITT population with a baseline SES-CD score of greater than or equal to 7 (or ≥ 4 for isolated ileal disease). Safety was assessed from the first dose in the VIVID-2 trial to the cut-off date (August 2, 2024).
Continuous data were summarized in terms of mean, SD, median, and minimum and maximum values. Categorical data were summarized as frequency counts and percentages.
Discontinuations and missing data were handled using mNRI and observed case approaches. mNRI used the following hybrid imputation method:
Sporadically missing data and data from patients who discontinued treatment due to extraordinary circumstances (such as study treatment supply issues or site termination) were imputed using multiple imputation.
Patients who discontinued for other reasons were treated as nonresponders.
For the efficacy outcomes, the results of the mNRI method are reported.
Table 19: Analysis Populations of the VIVID-2 Study
Population | Definition |
|---|---|
mITT population | All enrolled patients who took at least 1 dose of a study intervention, even if they did not take the assigned intervention, did not receive the correct intervention, or otherwise did not follow the protocol |
PAS | All patients from the mITT population who had a baseline SES-CD score of ≥ 7 (or ≥ 4 for isolated ileal disease) |
Safety population | Same as mITT |
mITT = modified intention to treat; PAS = primary analysis set; SES-CD = Simple Endoscopic Score for Crohn’s Disease.
Source: Sponsor’s Summary of Clinical Evidence.16
Results
Patient Disposition
The PAS for those randomized to the mirikizumab group contained 430 patients, of whom 251 patients were endoscopic responders and 179 patients were endoscopic nonresponders (Table 20). Seventeen patients (6.8%) in the endoscopic responder group discontinued from the LTE study. These discontinuations were mainly due to withdrawal by patient (47.1%) and AEs (17.6%). Twenty-four patients (13.0%) in the endoscopic nonresponder group discontinued from the LTE. These discontinuations were mainly due to AEs (33.3%), withdrawal by patient (25.0%), and lack of efficacy (25.0%).
Table 20: Patient Disposition in the VIVID-2 Study (Primary Analysis Seta)
Patient disposition | Endoscopic responders | Endoscopic nonrespondersa,b |
|---|---|---|
Entered LTE, N | 251 | 179 |
Completed study, N (%) | 234 (93.0) | 155 (87.0) |
Discontinued study, n (%) | 17 (6.8) | 24 (13.0) |
Reason for discontinuation | ||
AE | 3 (17.6) | 8 (33.3) |
Lack of efficacy | 0 | 6 (25.0) |
Withdrawal by patient | 8 (47.1) | 6 (25.0) |
Physician decision | 2 (11.8) | 1 (4.2) |
Pregnancy | 2 (11.8) | 0 |
Terminated by the sponsor | 1 (5.9) | 0 |
Lost to follow-up | 0 | 1 (4.2) |
Death | 0 | 1 (4.2) |
Protocol deviation | 0 | 1 (4.2) |
Other | 1 (5.9) | 0 |
AE = adverse event; mITT = modified intention to treat; SC = subcutaneous; SES-CD = Simple Endoscopic Score for Crohn’s Disease.
Note: Endoscopic responders continued the same SC mirikizumab dosage as in the VIVID-1 trial (i.e., 300 mg every 4 weeks), while endoscopic nonresponders received reinduction treatment with IV mirikizumab (900 mg every 4 weeks for 3 doses) at the start of the VIVID-2 study followed by 300 mg SC every 4 weeks.
aAll patients from the mITT population who have a baseline SES-CD ≥ 7 (or ≥ 4 for isolated ileal disease).
bMirikizumab 900 mg IV induction for 3 doses, followed by SC mirikizumab after a 12-week evaluation showing clinical benefit, per the investigator. Patients are to be discontinued from trial at week 12 if no clinical benefit, per investigator.
Source: Sponsor’s Summary of Clinical Evidence.16
Baseline Characteristics
Patients’ baseline characteristics summarized in Table 21 for the PAS. In both groups, most patients (> 55%) were male and were █████ ███████ ████ ████. For patients in the endoscopic responder group, the mean age was 37 years (SD = 12.89 years), the mean duration of CD was 7.8 years (SD = 8.00 years), the mean CDAI score was 319 (SD = 81.80), and the mean SES-CD score was 15 (SD = 6.53). For patients in the endoscopic nonresponder group, the mean age was 38 years (SD = 13.96 years), the mean CDAI score was 328 (SD = 87.64), the mean duration of CD was 9.8 years (SD = 8.43 years), and the mean SES-CD score was 12 (SD = 5.85).
Exposure to Study Treatments
A summary of patient exposure to treatment in the VIVID-2 LTE study is provided in Table 22. During the induction period, the mean weeks of exposure was █████ in the endoscopic nonresponder group. During the all-active treatment period (i.e., the induction treatment period and treatment regimen period), the mean exposures were ████ weeks in the continued endoscopic responder group and ████ weeks in the endoscopic nonresponder group.
Table 21: Baseline Disease Characteristics in the VIVID-2 Study (Primary Analysis Seta)
Characteristic | Endoscopic responder (N = 251) | Endoscopic nonresponder (N = 179) | |
|---|---|---|---|
Age (years), mean (SD) | 37 (12.89) | 38 (13.96) | |
Male, n (%) | 143 (57.0) | 112 (63.0) | |
Weight (kg), mean (SD) | 72 (17.39) | 71 (19.02) | |
BMI, mean (SD) | 25 (5.22) | 24 (5.55) | |
BMI category, n (%) | |||
Underweight (< 18.5 kg/m2) | 22 (8.8) | 21 (12.0) | |
Normal weight (≥ 18.5 kg/m2 and < 25 kg/m2) | 114 (45.0) | 89 (50.0) | |
Overweight (≥ 25 kg/m2and < 30 kg/m2) | 79 (31.0) | 39 (22.0) | |
Obese (≥ 30 kg/m2) | 36 (14.0) | 30 (17.0) | |
Race,b n (%) | |||
█████ ███████ ███ | █████ ███████ █ | █████ ███████ | |
Black or African American | 4 (1.6.0) | 3 (1.70) | |
Asian | 58 (23.0) | 50 (28.0) | |
American Indian or Alaska Native | 1 (0.4) | 1 (0.6) | |
Multiple | 1 (0.4) | 0 | |
Geographic region, n (%) | |||
Europe | 139 (55) | 94 (53) | |
North America | 34 (14) | 23 (13) | |
Other | 78 (31) | 62 (35) | |
Duration of CD (years), mean (SD) | 7.8 (8.00) | 9.8 (8.43) | |
CDAI, mean (SD) | 319 (81.80) | 328 (87.64) | |
SF average, mean (SD) | 5.6 (2.94) | 5.7 (2.97) | |
AP average, mean (SD) | 2.1 (0.59) | 2.2 (0.57) | |
SES-CD total score, mean (SD) | 15 (6.53) | 12 (5.85) | |
CRP (mg/L), median (range) | 9.4 (0.1 to 130) | 7.5 (0.1 to 152) | |
Fecal calprotectin (mcg/g), median (range) | 1,427 (15 to 31,680) | 1,196 (15 to 16,940) | |
Disease location, n (%) | |||
Colonic | 104 (41.0) | 70 (39.0) | |
Ileal | 18 (7.2) | 27 (15.0) | |
Ileal-colonic | 129 (51.0) | 82 (46.0) | |
AP = abdominal pain; BMI = body mass index; CD = Crohn disease; CDAI = Crohn’s Disease Activity Index; CRP = C-reactive protein; mITT = modified intention to treat; SC = subcutaneous; SD = standard deviation; SES-CD = Simple Endoscopic Score for Crohn’s Disease; SF = stool frequency.
Note: Endoscopic responders continued the same SC mirikizumab dosage as in the VIVID-1 trial (i.e., 300 mg every 4 weeks), while endoscopic nonresponders received reinduction treatment with IV mirikizumab (900 mg every 4 weeks for 3 doses) at the start of the VIVID-2 study followed by 300 mg SC every 4 weeks.
aAll patients from the mITT population who had a baseline SES-CD ≥ 7 (or ≥ 4 for isolated ileal disease). Patients were analyzed according to the treatment to which they were assigned and the intervention received previously.
bNumber of patients with nonmissing data used as denominator. Race data were missing for 4 patients in the endoscopic responder group and for 1 patient in the endoscopic nonresponder group.
Source: Sponsor’s Summary of Clinical Evidence.16
Patients who took permitted concomitant medications for CD other than oral corticosteroids (i.e., oral 5-aminosalicyclic acid, immunomodulators, antibiotics specific to CD treatment, antidiarrheals, baby Aspirin, or nonlive vaccines) were recommended to keep doses stable unless modifications were required due to AEs or for appropriate medical management. For patients on corticosteroids for CD, use was to remain stable until week 12 unless modifications were needed for medical reasons. No information about the use of concomitant medications was provided by the sponsor.
Table 22: Summary of Patient Exposure in the VIVID-2 Study (Up to Week 52)
Exposure durations | Endoscopic responders (N = 266) | Endoscopic nonresponders (N = 199) |
|---|---|---|
Induction period | ||
Mean weeks of exposure (SD) | ████ ██████ | ████ ██████ |
Treatment regimen period | ||
Mean weeks of exposure (SD) | ████ ██████ | ████ ███████ |
All-active treatment period | ||
Mean weeks of exposure (SD) | ████ ██████ | ████ ███████ |
NA = not applicable; SD = standard deviation.
Notes: Results are based on analyses of patients who reached the 1-year point in the VIVID-2 trial and include data for that 1-year time frame only.
Endoscopic responders continued the same SC mirikizumab dosage as in the VIVID-1 trial (i.e., 300 mg every 4 weeks), while endoscopic nonresponders received reinduction treatment with IV mirikizumab (900 mg every 4 weeks for 3 doses) at the start of the VIVID-2 trial, followed by 300 mg SC every 4 weeks.
Source: Additional information provided by sponsor upon request (May 1, 2025).61
Efficacy
The summarized efficacy data include only patients with a baseline SES-CD score of 7 or higher (or 4 or higher for isolated ileal disease) who were randomized to mirikizumab in the VIVID-1 trial.
Coprimary End Points
Endoscopic Response at Week 104 (Week 52 of the VIVID-2 Study)
Among endoscopic responders (n = 251) at week 52 of the VIVID-1 trial who continued to receive mirikizumab SC, 81.8% maintained endoscopic response at week 104.
Among endoscopic nonresponders (n = 179) who received reinduction with mirikizumab, 30.9% gained endoscopic response at week 104.
CDAI Remission at Week 104 (Week 52 of VIVID-2)
Among patients who were mirikizumab endoscopic responders at week 52 of the VIVID-1 trial (n = 251), 79.0% maintained clinical remission at week 104. In addition, 78.3% of endoscopic responders (n = 179) who were also in clinical remission at week 52 of the VIVID-1 trial maintained both clinical remission and endoscopic response at week 104. In addition, 86.5% of endoscopic responders who were in corticosteroid-free clinical remission at week 52 maintained this outcome at week 104.
Among mirikizumab endoscopic nonresponders (n = 179) at week 52 of the VIVID-1 trial, 86.9% of patients who were in CDAI remission maintained their remission. Of the 67 patients who were not in clinical remission at the end of the VIVID-1 trial, 55.8% gained CDAI remission at week 104.
Secondary End Points
Endoscopic Remission
At week 104, among patients who were in the endoscopic responder group, 72.5% of those who were in endoscopic remission at week 52 (n = 137) maintained remission, and 33.3% of those who were not in endoscopic remission at week 52 (n = 112) achieved endoscopic remission.
At week 104, 12.1% of patients in the endoscopic nonresponder group who were not in endoscopic remission at week 52 (n = 174) achieved endoscopic remission.
PRO Clinical Remission
At week 104, PRO clinical remission was achieved by ███ of patients who were endoscopic responders at week 52 of the VIVID-1 trial. Information about PRO clinical remission for patients who were endoscopic nonresponders at week 52 of the VIVID-1 trial was not provided by the sponsor.
Health-Related Quality of Life
At week 104, IBDQ remission was achieved by ███ of patients who were in endoscopic response at week 52 of the VIVID-1 trial. In addition, IBDQ response was achieved by ███ of patients who were in endoscopic response at week 52 of the VIVID-1 trial.
Information about IBDQ remission and response for patients considered as endoscopic nonresponders at week 52 of the VIVID-1 trial was not provided by the sponsor.
Harms
Refer to Table 23 for harms data.
Adverse Events
In the endoscopic responder group, 171 patients (64.0%) reported 1 or more TEAEs. In the endoscopic nonresponder group, 130 patients (65.0%) reported 1 or more TEAEs. The most common TEAEs (reported in ≥ 5% of patients) in both groups were COVID-19 (█████ in both groups) and upper respiratory tract infection (endoscopic responders = ████; endoscopic nonresponders = ████). Nasopharyngitis was reported in ██ ██████ patients in the endoscopic responder group.
Serious AEs
A total of 18 patients each in both groups reported 1 or more SAEs. No particular AE accounted for the majority of SAEs.
Withdrawal Due to AEs
███ ██████ patients in the endoscopic nonresponder group discontinued treatment due to AEs. Reasons for discontinuations were ██ █████ █████, ██ █████ █████, █████ ██████ ██████ █████ █████, ██████████ ███████ █████ █████, ████████ █████████ █████ █████, ████████████████ ████████ █████ █████, ██████████ ███████████ █████ █████, and ████ █████ ██████.
███ ██████ patients in the endoscopic responder group discontinued treatment due to AEs. Reasons for discontinuations were █████ ███████████ █████ █████ ███ ████████ ███████ █████ █████.
Table 23: Summary of Harms Results From the VIVID-2 Study (Safety Population)
AEs | Endoscopic responder (N = 266) | Endoscopic nonresponder (N = 199) |
|---|---|---|
Most common AEs (occurring in ≥ 5% of patients), n (%) | ||
≥ 1 TEAE | 171 (64.0) | 130 (65.0) |
COVID-19 | ██ ██████ | ██ ██████ |
Nasopharyngitis | ██ █████ | ██ █████ |
Upper respiratory tract infection | ██ █████ | ██ █████ |
SAEs,a n (%) | ||
Patients with ≥ 1 SAE | 18 (6.8) | 18 (9.0) |
Patients who stopped treatment due to AEs, n (%) | ||
Patients who discontinued treatment | 2 (0.8)b | 10 (5.0)c |
Deaths, n (%) | ||
Patients who died | 0 | 2 (1.0)d |
AEs of special interest, n (%) | ||
Infections | ██ █████ | ██ ██████ |
Serious infection | 4 (1.5) | 3 (1.5) |
Opportunistic infectione | 2 (0.8)j | 2 (1.0)k |
Injection-site reaction | 7 (2.6) | 4 (2.0) |
CCV event (adjudicated and confirmed) | █████ | █████ |
Major adverse cardiovascular event | 1 (0.4)l | 2 (1.0)m |
Malignancy (nonmelanoma skin cancer) | 0 | 1 (0.5) |
Hepatic TEAEsf | 14 (5.3) | 6 (3.0) |
Hypersensitivity, immediatee,g | 6 (2.3) | 8 (4.0) |
Hypersensitivity, nonimmediatee,h | █████ | █████ |
Depressioni | 2 (0.8) | 1 (0.5) |
AE = adverse event; CCV = cerebrocardiovascular; CD = Crohn disease; SAE = serious adverse event; SC = subcutaneous; TEAE = treatment-emergent adverse event.
Note: Endoscopic responders continued the same SC mirikizumab dosage as in the VIVID-1 trial (i.e., 300 mg every 4 weeks), while endoscopic nonresponders received reinduction treatment with IV mirikizumab (900 mg every 4 weeks for 3 doses) at the start of the VIVID-2 trial, followed by 300 mg SC every 4 weeks.
aIn the endoscopic responder group, ██████ patients reported ███████ █████████████ patient each reported █████████████ █████████ █████ ███████ ██████████████ ████ ██████████ ███████████ █████████ ████ ████████ █████████ █████████ ████████████ ██████ ██████ █████████ ██████ ████████ █████ █████ █████ ████████████ █████████ █████████ ████████ █████ ██████ ███████████████ █████████ █████████ ████████ ████████ ███████ █████ █████████· In the endoscopic nonresponder group, ██████ patients reported ██████████ █████████████████ patient each reported ███ ████████ ██████████ ███████ ███████ █████████ ██████ ██████████████ ████ ██████████ █████ █████████ █████ █████ ██████ ███████ █████ ██████████ ███████████ ████████ ████████ ███████████ ████████ ███████████ ███████████████ █████ ██████████ █████████ ████████████████ ███████████ █████ █████ ███ █████████ █████████████.
bReasons for discontinuation due to AEs: ██████ patient each reported █████ ███████████ and ████████ ███████
cReasons for discontinuation due to AEs: ██████ patients reported ███████ patient each reported █████████ █████ █████ ██████ ███████ ██████████ ████████ ████████ ██████████ ████████████████ █████████ ██████████ ████████████ ███ █████.
dThe investigator considered the death to be unrelated to the study drug. Patient death was due to COVID-19 pneumonia.
eNarrow.
fReporting ≥ 1 narrow-scope TEAE.
gOccurring on the day of study drug administration.
hEvents included in the nonimmediate search are those with dates after the initial study drug administration (i.e., not including any date on which the study drug was administered).
IExcluding suicide and self-injury.
jTwo herpes zoster events.
kOne pulmonary tuberculosis event and 1 herpes zoster event.
lOne stroke after a COVID-19 infection.
mOne myocardial infarction (in a participant with known coronary artery disease) and 1 stroke (in a participant who was a current smoker with arteriosclerosis, hypertension, hypercholesterolemia, and alcohol use).
Source: Sponsor’s Summary of Clinical Evidence.16
AEs of Special Interest
Infections occurred in ██ ███████ patients and ██ ███████ patients in the endoscopic responder and endoscopic nonresponder groups, respectively. Other commonly reported AEs of special interest included hepatic TEAEs (endoscopic responders = 5.3%; endoscopic nonresponders = 3.0%) and hypersensitivity events occurring on the day of study drug administration (i.e., immediate events) (endoscopic responders, 2.3%; endoscopic nonresponders, 4.0%) or at other times (i.e., nonimmediate events) (endoscopic responders,████; endoscopic nonresponders, ████).
Deaths
Two deaths occurred during the study in the IV-to-SC group.
Critical Appraisal
Internal Validity
The single-group design without a comparator group does not permit inherent causal interpretations of the effect of longer-term mirikizumab treatment. The open-label nature of the study may increase the risk of bias in the evaluation of subjective efficacy and harms outcomes. It may also influence patient and clinician behaviour during the trial, such as regarding the use of concomitant medications. The impact of permitted concomitant medications for CD on efficacy outcomes is unknown because no information about concomitant medications was reported. The sample sizes in both groups were reduced from the original VIVID-1 study population, given that only patients who had not discontinued before week 52 and were expected by the investigator to potentially derive benefit from further treatment were included.
Among the patients considered to be endoscopic responders at the end of the VIVID-1 trial — and among those who continued to receive mirikizumab SC during the LTE — discontinuation from the study was generally low and mainly due to AEs or patient request. The use of multiple imputations for sporadically missing data for patients who discontinued treatment due to extraordinary circumstances (e.g., study treatment supply issues or site termination) may be appropriate, given that these reasons would likely be unrelated to patient outcomes. The use of NRI for the remainder of discontinuations may be considered conservative in a single-arm design. While most patients maintained endoscopic response, remission, and clinical remission at week 52 of the VIVID-2 trial, long-term sustainability and/or durability have yet to be determined as the study is ongoing.
External Validity
In general, as the LTE study enrolled patients from the VIVID-1 trial, the eligibility concerns raised in the VIVID-1 trial remain valid for the LTE population. Patients were not allowed any rescue therapy. Patients who completed the VIVID-1 trial and were expected by the investigator to benefit from further treatment were included; this inclusion may have led to a more selective population compared to that observed at baseline. Endoscopic response, clinical remission, and HRQoL were considered important outcomes; these were measured and reported. One of the clinical experts consulted by CDA-AMC indicated that re-treatment with mirikizumab would be considered only under certain circumstances, such as incomplete induction (missed doses), partial response (suggesting that reinduction may be needed to achieve further improvement), or clear reasons for prior failure of induction (such as Clostridioides difficile infection or pre-existing strictures). The other clinical expert noted that re-treatment with mirikizumab would not be considered, and that they would likely pivot to another mechanism of action or even another anti–IL-23.
Indirect Evidence
The contents of this section have been informed by materials submitted by the sponsor. The following has been summarized and validated by the review team.
Objectives for the Summary of Indirect Evidence
In the absence of direct evidence comparing mirikizumab with all treatments of interest available in the Canadian setting, the sponsor submitted an ITC in the form of a NMA. This NMA was conducted to compare the efficacy and safety of mirikizumab with all potential comparators of interest for the treatment of moderately to severely active CD.
Description of the ITC
ITC Design
Objectives
The NMA was conducted to compare the efficacy and safety of mirikizumab with all potential comparators of interest (including adalimumab, infliximab, ustekinumab, vedolizumab, upadacitinib, and risankizumab) for the treatment of moderately to severely active CD.
Study Selection Methods
A systematic literature review (SLR) was performed to inform the NMA. The literature search was first conducted in March 2020. The ongoing SLR updates the evidence base at regular 6-month intervals. The analyses described in this report are based on the SLR update of January 2024. The details of the study selection criteria, selection process, data extraction methods, and quality assessment for the NMA are presented in Table 24.
Feasibility Assessment
The NMA feasibility assessment was conducted to investigate the comparability of the evidence identified in the SLR. Heterogeneity with respect to patient characteristics, study design, interventions, and outcomes were assessed during a similarity assessment. A total of 26 studies were considered for inclusion in the base-case NMAs for this submission (22 for the induction phase and 14 for the maintenance phase). Following the feasibility assessment, 7 studies were excluded from the NMA, either partially (e.g., induction but not maintenance) or entirely. Three induction studies were excluded due to heterogeneity in effect modifiers. Five maintenance studies were excluded due to differences in rerandomization criteria, timing of outcome assessment, or insufficient data to recalculate outcomes from a treat-through trial to mimic the rerandomized design.
ITC Analysis Methods
A summary of the methods used for the NMAs is provided in Table 25.
Pagebreak
Table 24: Study Selection Criteria and Methods for ITCs Submitted by the Sponsor
Characteristics | Indirect comparison |
|---|---|
Population |
|
Intervention | Mirikizumab |
Comparators |
|
Outcomes | Efficacy outcomes:
Safety outcomes:
|
Study designs | RCTs conducted for the induction period, maintenance period, or induction and maintenance periods (i.e., treat-through design) |
Publication characteristics | 1990 to January 2024 Pooled analyses, SLRs, and meta-analyses English language only |
Exclusion criteria | Any trial whose induction time point assessments are not comparable with those of other induction studies. When trial outcomes are measured significantly earlier compared to other studies, it is not possible to differentiate the effect of the induction treatment from the effect of maintenance treatment (in trials with very short maintenance periods). Trials whose rerandomization criteria were not comparable with those of other maintenance trials or that did not report response outcomes. |
Databases searched | Main databases searched:
|
Selection process | All identified articles were screened independently by 2 reviewers, who consolidated their decisions and resolved any discrepancies. A third reviewer was consulted if the 2 reviewers did not reach agreement on individual studies, and a decision was made. |
Data extraction process | 1 researcher extracted the data, and the second independently reviewed all the extracted data for each variable. |
Quality assessment | A critical appraisal of the quality of clinical trials included in the review was performed by a single researcher using the minimum criteria specified in the NICE user guide for company evidence submission template. A second researcher conducted a randomized quality check of this step. A risk of bias assessment was not conducted for conference proceedings, as there were insufficient methodological data to assess the study quality. |
BF = biologic failure; CCF = conventional care failure; CD = Crohn disease; CDAI = Crohn’s Disease Activity Index; ITC = indirect treatment comparison; NICE = National Institute for Health and Care Excellence; NMA = network meta-analysis; RCT = randomized controlled trial; SAE = serious adverse event; SC = subcutaneous; SES-CD = Simple Endoscopic Score for Crohn’s Disease; SLR = systematic literature review; PO = orally; q.d. = once daily; q.2.w. = every 2 weeks; q.8.w. = every 8 weeks.
Source: NMA report.62 Details included in the table are from the sponsor’s Summary of Clinical Evidence.16
Table 25: NMA Analysis Methods
Methods | Description |
|---|---|
Analysis methods | Bayesian framework using MCMC sampling. The NMA considered both FE and RE models. |
Adjustment of treat-through trials to mimic the rerandomized design | There were design differences in the studies included in the networks (i.e., treat-through or rerandomized studies) that would violate the similarity and homogeneity assumptions of the maintenance-phase NMAs. To address this, adjustments were made to the treat-through trial results (including the VIVID-1 study) to mimic what would have occurred in a rerandomized trial. For 1 trial (the SEAVUE study), the recalculated data were clinically implausible; therefore, the study was excluded from the base-case network. |
Estimation of infliximab induction enhanced clinical response | Enhanced clinical response was not reported in the infliximab studies. Data transformations were applied that reweighted the CDAI-70 to estimate CDAI-100. This method assumed that the ratio of CDAI-70 to CDAI-100 responses in other trials could be applied to the infliximab trial. |
Baseline risk adjustment | NMAs were performed with and without baseline risk adjustment (i.e., placebo response adjustment) using a meta-regression model with baseline risk as a covariate to explore whether the potential heterogeneity in placebo response across studies had an impact on relative efficacy estimates. |
Priors | Noninformative (i.e., vague or flat) priors were used for treatment effects, study-specific intercepts, between-trial SD, and the extra parameter (beta) for the baseline risk-adjusted model. |
Assessment of model fit and model selection | Final model selection was informed by the model fit statistics, diagnostic plots, significance of the baseline risk meta-regression coefficient (i.e., whether the CrI includes 0), consideration of the heterogeneity parameter tau, and interpretability of results (e.g., whether the associated CrI for treatment effects is logical and interpretable versus highly uncertain). In case of comparable DICs and equivalent model convergence and performance, preference was given to RE or adjusted models, given the presence of heterogeneity in the network. Note: An FE model was used for all efficacy outcomes; an RE model was used for all safety outcomes |
Assessment of statistical heterogeneity | Between-study heterogeneity was assessed by evaluating the posterior distribution for between-study SD (tau) and its CrI. |
Assessment of consistency |
|
Assessment of convergence |
|
Outcomes |
|
Follow-up time points | Induction analyses: varies from 4 weeks to 12 weeks Maintenance analyses: varies from 52 weeks to 64 weeks |
Construction of nodes | Not reported |
Sensitivity analyses | Including only treat-through trials (i.e., the VIVID 1 and SEAVUE studies were conducted for treat-through design for combined induction and maintenance periods) |
Subgroup analysis | Not reported |
Methods for pairwise meta-analysis | Not reported |
CDAI = Crohn’s Disease Activity Index; CDAI-70 = at least a 70 point reduction from baseline CDAI score; CDAI-100 = at least a 100 point reduction from baseline CDAI score; CrI = credible interval; DIC = deviance information criterion; FE = fixed effect; MCMC = Monte Carlo Markov chain; NMA = network meta-analysis; RE = random effect; SD = standard deviation; SES-CD = Simple Endoscopic Score for Crohn’s Disease; UME = unrelated mean effects.
Note: The details of the assessment of homogeneity for the NMA are presented in Table 26.
Sources: NMA report.62 Details included in the table are from the sponsor’s Summary of Clinical Evidence.16
Table 26: Assessment of Homogeneity
Characteristics | Description and handling of potential sources of heterogeneity |
|---|---|
Baseline characteristics |
|
Treatment history |
|
Trial eligibility criteria | Not reported |
Dosing of comparators | Some variations in the treatment dosage and regimens |
Placebo response | Placebo response varied across studies. Baseline risk adjustment was applied where possible. |
Definitions of end points |
|
Timing of end point evaluation |
|
Withdrawal frequency | Not reported |
Clinical trial setting | Most included studies were double-blinded. Several were open-label, multinational trials; a few were single-centre trials. |
Study design |
|
ADA = adalimumab; BF = biologic failure; CCF = conventional care failure; CDAI = Crohn’s Disease Activity Index; NMA = network meta-analysis; SES-CD = Simple Endoscopic Score for Crohn’s Disease; TNF = tumour necrosis factor; vs. = versus.
Sources: NMA report.62 Details included in the table are from the sponsor’s Summary of Clinical Evidence.16
Results of the NMA
Summary of Included Studies
A total of 26 studies were considered for inclusion in the base-case NMAs for this submission. During the induction study period, 15 studies reported data for at least 1 efficacy outcome for the population of patients with CCF, and 15 studies reported data for at least 1 efficacy outcome for the population of patients with BF. Further, 19 studies reported data for at least 1 safety outcome for the overall population (regardless of prior biologic exposure). For the maintenance study period, 10 and 8 studies reported data for at least 1 efficacy outcome for the populations of patients with CCF and BF, respectively.
Risk of Bias Assessment
Details around randomization methods and allocation concealment were often not reported in the publications; this led to an unclear risk of bias. Patient groups were dissimilar in 3 studies, while similarity of patient groups was unclear in 7 studies. Most studies included were double-blinded. Several were open-label studies; these were considered to have a high risk of bias due to the subjective nature of the studies’ primary end points. Drop-outs were consistent between treatment arms in most studies. An ITT analysis was included in roughly half of the studies.
Evidence Networks
Evidence networks for the NMA are presented in the sponsor’s NMA report.62 Briefly, all evidence networks were sparsely connected for each comparison. Most of the connections between treatment nodes were informed by 1 trial for each comparison. There were a few closed loops; these were often (though not always) formed by arms of the same study.
Results for Efficacy
The primary analysis (base-case analysis) NMA results are reported for the induction and maintenance periods, respectively. A sensitivity analysis was conducted for the treat-through study design, including both the induction and maintenance periods.
The NMA results are presented in Table 27 to Table 32. An OR greater than 1 indicates that the result favours mirikizumab.
Induction Period
Enhanced clinical response (decrease in CDAI score of ≥ 100):
Population of patients with CCF during the induction period: The sponsor determined that the fixed-effects (FE) model was associated with an improved fit relative to other models; the model with baseline risk adjustment was selected. Based on the FE model, all estimates (ORs) versus active comparators had wide 95% CrIs that included the null value. One exception was that when mirikizumab was compared with vedolizumab, the OR was 2.16 (95% Crl, 1.21 to 3.74). No NMA was done for the comparison of mirikizumab with upadacitinib (Table 27). Based on the random-effects (RE) model, similar results were reported, with much wider 95% Crls that included the null value for all comparisons.
Population of patients with BF during the induction period: The sponsor determined that the FE model was associated with an improved fit relative to other models; the model with baseline risk adjustment was selected. Based on both the FE and RE models, all ORs versus active comparators had wide 95% CrIs that included the null value. No NMA was done for the comparison of mirikizumab with infliximab (Table 27).
Table 27: Enhanced Clinical Response NMA Results for Mirikizumab vs. Relevant Comparators — Induction Period
Comparisons | Induction period (MIRI vs. comparators, OR, 95% Crl)a | |||
|---|---|---|---|---|
Population of patients with CCF | Population of patients with BF | |||
Random-effects model | Fixed-effects model | Random-effects model | Fixed-effects model | |
Enhanced clinical response (decrease of ≥ 100 in CDAI score) | ||||
MIRI vs. ADA 160 mg and 80 mg | ████ ██ | 1.29 (0.77 to 2.14) | ████ ██ | 1.23 (0.67 to 2.24) |
MIRI vs. ADA 80 mg and 40 mg | ████ ██ | 1.85 (0.95 to 3.54) | ████ ██ | 0.88 (0.24 to 3.18) |
MIRI vs. IFX | ████ ██ | 0.73 (0.19 to 2.45) | ████ ██ | NA |
MIRI vs. RKZ | ████ ██ | 0.90 (0.57 to 1.40) | ████ ██ | 0.79 (0.48 to 1.33) |
MIRI vs. UPA | ████ ██ | NA | ████ ██ | 0.91 (0.52 to 1.60) |
MIRI vs. UST | ████ ██ | 1.11 (0.76 to 1.62) | ████ ██ | 1.18 (0.82 to 1.72) |
MIRI vs. VED | ████ ██ | 2.16 (1.21 to 3.74) | ████ ██ | 1.44 (0.84 to 2.49) |
MIRI vs. placebo | ████ ██ | 3.78 (2.34 to 5.88) | ████ ██ | 2.49 (1.69 to 3.70) |
ADA = adalimumab; BF = biologic failure; CCF = conventional care failure; Crl = credible interval; IFX = infliximab; MIRI = mirikizumab; NA = not applicable; OR = odds ratio; RKZ = risankizumab; UPA = upadacitinib; UST = ustekinumab; VED = vedolizumab; vs. = versus.
Note: Population of patients with CCF with baseline risk adjustment; population of patients with BF without baseline risk adjustment.
aAn OR of > 1 indicates that the result favours mirikizumab; an OR of < 1 indicates that the result favours the comparator.
Clinical remission (CDAI < 150):
Population of patients with CCF during the induction period: The sponsor determined that the FE model was associated with an improved fit relative to other models; the model with baseline risk adjustment was selected. Based on both the FE and RE models, all ORs versus active comparators had wide 95% CrIs that included the null value (Table 28).
Population of patients with BF during the induction period: The sponsor determined that the FE model was associated with an improved fit relative to other models; the model without baseline risk adjustment was selected. Based on both the FE and RE models, all ORs versus active comparators had wide 95% CrIs that included the null value. No NMA was conducted to compare mirikizumab with infliximab because no respective data for these drugs were available (Table 28).
Table 28: Clinical Remission (CDAI Score < 150) NMA Results for Mirikizumab vs. Relevant Comparators — Induction Period
Comparisons | Induction period (MIRI vs. comparators, OR, 95% Crl)a | |||
|---|---|---|---|---|
Population of patients with CCF | Population of patients with BF | |||
Random-effects model | Fixed-effects model | Random-effects model | Fixed-effects model | |
Clinical remission (CDAI score < 150) | ||||
MIRI vs. ADA 160 mg and 80 mg | ████ ██ | 0.99 (0.60 to 1.69) | ████ ██ | 0.50 (0.22 to 1.09) |
MIRI vs. ADA 80 mg and 40 mg | ████ ██ | 1.61 (0.79 to 3.52) | ████ ██ | 1.76 (0.29 to 15.7) |
MIRI vs. IFX | ████ ██ | 0.26 (0.01 to 4.54) | ████ ██ | N/A |
MIRI vs. RKZ | ████ ██ | 0.68 (0.38 to 1.29) | ████ ██ | 0.71 (0.40 to 1.23) |
MIRI vs. UPA | ████ ██ | 0.77 (0.26 to 2.55) | ████ ██ | 0.64 (0.36 to 1.10) |
MIRI vs. UST | ████ ██ | 0.99 (0.69 to 1.44) | ████ ██ | 0.94 (0.64 to 1.39) |
MIRI vs. VED | ████ ██ | 1.19 (0.40 to 4.34) | ████ ██ | 1.33 (0.68 to 2.65) |
MIRI vs. placebo | ████ ██ | 2.80 (1.74 to 4.85) | ████ ██ | 1.83 (1.19 to 2.81) |
ADA = adalimumab; BF = biologic failure; CCF = conventional care failure; Crl = credible interval; IFX = infliximab; MIRI = mirikizumab; NA = not applicable; OR = odds ratio; RKZ = risankizumab; UPA = upadacitinib; UST = ustekinumab; VED = vedolizumab; vs. = versus.
Note: Population of patients with CCF with baseline risk adjustment; population of patients with BF without baseline risk adjustment.
aAn OR > 1 indicates that the results favour mirikizumab; an OR < 1 indicates that the results favour the comparator.
Endoscopic response:
Population of patients with CCF during the induction period: The sponsor determined that the FE model was associated with an improved fit relative to other models. High heterogeneity was observed in the network; however, the size and sparsity of the networks resulted in uninterpretable CrIs for the adjusted and RE models. Therefore, the FE model without baseline risk adjustment was preferred. Based on both the FE and RE models, all ORs versus active comparators had wide 95% CrIs that included the null value. No NMA was conducted to compare mirikizumab with adalimumab, infliximab, or vedolizumab, given that no respective data for these drugs were available (Table 29).
Population of patients with BF during the induction period: The sponsor determined that the FE model was associated with an improved fit relative to other models; the model with baseline risk adjustment was selected. Based on both the FE and RE models, all ORs versus active comparators had wide 95% CrIs that included the null value. No NMA was conducted to compare mirikizumab with adalimumab, infliximab and vedolizumab (Table 29).
Table 29: Endoscopic Response NMA Results for Mirikizumab vs. Relevant Comparators — Induction Period
Comparisons | Induction period (MIRI vs. comparators, OR, 95% Crl)a | |||
|---|---|---|---|---|
Population of patients with CCF | Population of patients with BF | |||
Random-effects model | Fixed-effects model | Random-effects model | Fixed-effects model | |
Endoscopic response (SES-CD > 50% from baseline or 2-point SES-CD reduction if isolated ileal disease and baseline SES-CD of 4) | ||||
MIRI vs. ADA | ████ ██ | NA | ████ ██ | NA |
MIRI vs. IFX | ████ ██ | NA | ████ ██ | NA |
MIRI vs. RKZ | ████ ██ | 0.46 (0.18 to 1.17) | ████ ██ | 0.84 (0.49 to 1.51) |
MIRI vs. UPA | ████ ██ | 0.59 (0.25 to 1.36) | ████ ██ | 0.62 (0.29 to 1.17) |
MIRI vs. UST | ████ ██ | 0.82 (0.55 to 1.23) | ████ ██ | 1.36 (0.86 to 2.19) |
MIRI vs. VED | ████ ██ | NA | ████ ██ | NA |
MIRI vs. placebo | ████ ██ | 3.32 (1.96 to 5.89) | ████ ██ | 3.79 (2.55 to 5.65) |
ADA = adalimumab; BF = biologic failure; CCF = conventional care failure; Crl = credible interval; IFX = infliximab; MIRI = mirikizumab; NA = not applicable; OR = odds ratio; RKZ = risankizumab; SES-CD = Simple Endoscopic Score for Crohn’s Disease; UPA = upadacitinib; UST = ustekinumab; VED = vedolizumab; vs. = versus.
Note: Population of patients with CCF with baseline risk adjustment; population of patients with BF without baseline risk adjustment.
aAn OR of > 1 indicates that the results favour mirikizumab; an OR of < 1 indicates that the results favour the comparator.
Endoscopic remission:
Population of patients with CCF during the induction period: The sponsor determined that the FE model was associated with an improved fit relative to other models. High heterogeneity was observed in the network; however, the size and sparsity of the networks resulted in uninterpretable CrIs for the adjusted and RE models. Therefore, the FE model without baseline risk adjustment was preferred. Based on both the FE and RE models, all ORs versus active comparators had wide 95% CrIs that included the null value. No NMA was conducted to compare mirikizumab with adalimumab, infliximab, and vedolizumab because no respective data for these drugs was available (Table 30).
Population of patients with BF during the induction period: The sponsor determined that the FE model was associated with an improved fit relative to other models and selected the model without baseline risk adjustment because it was deemed potentially unnecessary. Based on both the FE and RE models, all ORs versus active comparators had wide 95% CrIs that included the null value. No NMA was conducted to compare mirikizumab with adalimumab, infliximab, and vedolizumab (Table 30).
Table 30: Endoscopic Remission NMA Results for Mirikizumab vs. Relevant Comparators — Induction Period
Comparisons | Induction period (MIRI vs. comparators, OR, 95% Crl)a | |||
|---|---|---|---|---|
Population of patients with CCF | Population of patients with BF | |||
Random-effects model | Fixed-effects model | Random-effects model | Fixed-effects model | |
Endoscopic remission (SES-CD ≤ 4 and at least a 2-point reduction vs. baseline, with no subscore > 1) | ||||
MIRI vs. ADA | ████ ██ | NA | ████ ██ | NA |
MIRI vs. IFX | ████ ██ | NA | ████ ██ | NA |
MIRI vs. RKZ | ████ ██ | 0.73 (0.27 to 2.00) | ████ ██ | 1.63 (0.39 to 11.4) |
MIRI vs. UPA | ████ ██ | NA | ████ ██ | 0.76 (0.13 to 6.22) |
MIRI vs. UST | ████ ██ | 0.87 (0.54 to 1.39) | ████ ██ | 1.18 (0.64 to 2.28) |
MIRI vs. VED | ████ ██ | NA | ████ ██ | NA |
MIRI vs. placebo | ████ ██ | 2.14 (1.14 to 4.32) | ████ ██ | 8.07 (2.33 to 54.5) |
ADA = adalimumab; BF = biologic failure; CCF = conventional care failure; Crl = credible interval; IFX = infliximab; MIRI = mirikizumab; NA = not applicable; OR = odds ratio; RKZ = risankizumab; SES-CD = Simple Endoscopic Score for Crohn’s Disease; UPA = upadacitinib; UST = ustekinumab; VED = vedolizumab; vs. = versus.
Note: Population of patients with CCF with baseline risk adjustment; population of patients with BF without baseline risk adjustment.
aAn OR of > 1 indicates that the results favour mirikizumab; an OR of < 1 indicates that the results favour the comparator.
Maintenance Period
Clinical remission (CDAI score < 150)
Population of patients with CCF during the maintenance period: The sponsor determined that the FE model was associated with an improved fit relative to other models. High heterogeneity was observed in the network. There were convergence issues for the unadjusted RE model, and CrIs were wide and uninterpretable. Therefore, the FE model without baseline risk adjustment was preferred. Based on both the FE and RE models, all ORs versus active comparators had wide CrIs that included the null value (Table 31).
Population of patients with BF during the maintenance period: The sponsor determined that the FE model was associated with an improved fit relative to other models. There were convergence issues for the unadjusted RE model, and CrIs were wide and uninterpretable. Therefore, the FE model without baseline risk adjustment was selected. Based on both the FE and RE models, all ORs had wide 95% CrIs that included the null value. No NMA was conducted to compare mirikizumab with infliximab (Table 31).
Table 31: Clinical Remission (CDAI < 150) NMA Results for Mirikizumab vs. Relevant Comparators — Maintenance Period
Comparisons | Maintenance period (MIRI vs. comparators, OR, 95% Crl)a | |||
|---|---|---|---|---|
Population of patients with CCF | Population of patients with BF | |||
Random-effects model | Fixed-effects model | Random-effects model | Fixed-effects model | |
Clinical remission | ||||
MIRI vs. ADA 40 mg q.2.w. | ████ ██ | 0.62 (0.19 to 1.98) | ████ ██ | 0.70 (0.18 to 2.53) |
MIRI vs. ADA 40 mg q.w. | ████ ██ | 0.48 (0.15 to 1.48) | ████ ██ | 0.60 (0.15 to 2.20) |
MIRI vs. IFX | ████ ██ | 1.15 (0.37 to 3.50) | ████ ██ | NA |
MIRI vs. RKZ 180 mg | ████ ██ | 1.51 (0.4 2 to 5.33) | ████ ██ | 1.64 (0.54 to 4.95) |
MIRI vs. RKZ 360 mg | ████ ██ | 2.29 (0.63 to 8.29) | ████ ██ | 1.68 (0.56 to 5.07) |
MIRI vs. UPA 15 mg | ████ ██ | 1.11 (0.31 to 4.08) | ████ ██ | 0.75 (0.23 to 2.40) |
MIRI vs. UPA 30 mg | ████ ██ | 0.76 (0.20 to 2.77) | ████ ██ | 0.47 (0.15 to 1.45) |
MIRI vs. UST 90 mg q.12.w. | ████ ██ | 1.73 (0.72 to 4.09) | ████ ██ | 1.63 (0.63 to 4.16) |
MIRI vs. UST 90 mg q.8.w. | ████ ██ | 1.37 (0.78 to 2.37) | ████ ██ | 1.46 (0.85 to 2.50) |
MIRI vs. VED 108 mg q.2.w. | ████ ██ | 1.83 (0.62 to 5.19) | ████ ██ | 1.34 (0.41 to 4.26) |
MIRI vs. VED 300 mg q.4.w. | ████ ██ | 1.55 (0.50 to 4.66) | ████ ██ | 1.01 (0.28 to 3.59) |
MIRI vs. VED 300 mg q.8.w. | ████ ██ | 1.23 (0.40 to 3.68) | ████ ██ | 0.92 (0.26 to 3.25) |
MIRI vs. placebo | ████ ██ | 2.90 (1.20 to 6.88) | ████ ██ | 2.91 (1.10 to 7.47) |
ADA = adalimumab; BF = biologic failure; CCF = conventional care failure; Crl = credible interval; IFX = infliximab; MIRI = mirikizumab; NA = not applicable; OR = odds ratio; q.w. = once weekly; q.2.w. = every 2 weeks; q.4.w. = every 4 weeks; q.8.w. = every 8 weeks; q.12.w. = every 12 weeks; RKZ = risankizumab; UPA = upadacitinib; UST = ustekinumab; VED = vedolizumab; vs. = versus.
Note: Population of patients with CCF with baseline risk adjustment; population of patients with BF without baseline risk adjustment.
aAn OR of > 1 indicates that the results favour mirikizumab; an OR of < 1 indicates that the results favour the comparator.
Combination of Induction and Maintenance Period (Treat-Through Design)
The treat-through design for the combined induction and maintenance periods was analyzed as a sensitivity analysis. The sensitivity analysis compared mirikizumab with adalimumab and ustekinumab for the CCF population only. In all cases, the FE model without baseline risk adjustment was preferred.
Based on both the FE and RE models, all ORs had wide 95% CrIs that included the null value, in terms of enhanced clinical response (i.e., a decrease in CDAI score of ≥ 100), clinical remission, endoscopic response, and endoscopic remission (Table 32). The results are similar to those of the base-case analysis.
Table 32: NMA Results for Mirikizumab vs. Relevant Comparators for Treat-Through Design-Only Analysis for Combined Induction and Maintenance Periods
Comparisons | Combined induction and maintenance periods (MIRI vs. comparators, OR, 95% Crl)a | |||
|---|---|---|---|---|
Population of patients with CCF | Population of patients with BF | |||
Random-effects model | Fixed-effects model | Random-effects model | Fixed-effects model | |
Enhanced clinical response | ||||
MIRI vs. ADA | ████ ██ | 1.60 (0.86 to 2.96) | ████ ██ | NA |
MIRI vs. UST | ████ ██ | 1.20 (0.77 to 1.85) | ████ ██ | NA |
Clinical remission | ||||
MIRI vs. ADA | ████ ██ | 1.03 (0.77 to 2.15) | ████ ██ | NA |
MIRI vs. UST | ████ ██ | 1.00 (0.76 to 1.56) | ████ ██ | NA |
Endoscopic response | ||||
MIRI vs. ADA | ████ ██ | 1.18 (0.66 to 2.12) | ████ ██ | NA |
MIRI vs. UST | ████ ██ | 0.96 (0.64 to 1.41) | ████ ██ | NA |
Endoscopic remission | ||||
MIRI vs. ADA | ████ ██ | 0.77 (0.42 to 1.42) | ████ ██ | NA |
MIRI vs. UST | ████ ██ | 0.85 (0.57 to 1.29) | ████ ██ | NA |
ADA = adalimumab; BF = biologic failure; CCF = conventional care failure; Crl = credible interval; IFX = infliximab; MIRI = mirikizumab; NA = not applicable; OR = odds ratio; RKZ = risankizumab; TT = treat through; UPA = upadacitinib; UST = ustekinumab; VED = vedolizumab; vs. = versus.
Note: The TT trial analysis applied only to the population of patients with CCF.
aAn OR of > 1 indicates that the results favour mirikizumab; an OR of < 1 indicates that the results favour the comparator.
Harms Results
Harm outcomes, including SAEs and all-cause discontinuation, were assessed for the mixed population (CCF and BF) in the induction period only (Table 33). An OR of less than 1 indicates that the result favours mirikizumab.
SAEs (Induction)
The sponsor determined that the RE model was associated with an improved fit relative to other models. The RE model without baseline risk adjustment was preferred. Based on both the FE and RE models, all ORs had wide 95% CrIs that included the null value. No NMA was conducted to compare mirikizumab with infliximab. The evidence was insufficient to show a difference versus any comparator (Table 33).
All-Cause Discontinuation (Induction)
The sponsor determined that the RE model was associated with an improved fit relative to other models. The RE model without baseline risk adjustment was preferred. Based on the FE model, all ORs versus active comparators had wide 95% CrIs that included the null value, with 1 exception: the comparison of mirikizumab with vedolizumab, for which the OR was 0.44 (95% Crl, 0.20 to 0.95). Based on the RE model, similar results were reported with wider 95% CrIs that included the null value. No NMA was conducted to compare mirikizumab with infliximab (Table 33).
Table 33: Harms — NMA Results for Mirikizumab vs. Relevant Comparators (Overall Mixed Population With CCF and BF)
Comparisons | Mixed population (CCF and BF) (MIRI vs. comparators, OR, 95% Crl)a | |||
|---|---|---|---|---|
Induction period | Maintenance period | |||
Random-effects model | Fixed-effects model | Random-effects model | Fixed-effects model | |
Serious adverse events | ||||
MIRI vs. ADA 160 mg and 80 mg | 2.07 (0.55 to 8.43) | ████ ██ | ████ ██ | ████ ██ |
MIRI vs. ADA 80 mg and 40 mg | 1.61 (0.34 to 8.43) | ████ ██ | ████ ██ | ████ ██ |
MIRI vs. IFX | NA | ████ ██ | ████ ██ | ████ ██ |
MIRI vs. RKZ | 2.36 (0.92 to 6.67) | ████ ██ | ████ ██ | ████ ██ |
MIRI vs. UPA | 0.87 (0.31 to 2.46) | ████ ██ | ████ ██ | ████ ██ |
MIRI vs. UST | 1.22 (0.55 to 2.76) | ████ ██ | ████ ██ | ████ ██ |
MIRI vs. VED | 0.83 (0.31 to 2.30) | ████ ██ | ████ ██ | ████ ██ |
MIRI vs. placebo | 0.83 (0.38 to 1.90) | ████ ██ | ████ ██ | ████ ██ |
All-cause discontinuation | ||||
MIRI vs. ADA 160 mg and 80 mg | 1.11 (0.27 to 4.99) | ████ ██ | ████ ██ | ████ ██ |
MIRI vs. ADA 80 mg and 40 mg | 0.47 (0.08 to 2.62) | ████ ██ | ████ ██ | ████ ██ |
MIRI vs. IFX | NA | ████ ██ | ████ ██ | ████ ██ |
MIRI vs. RKZ | 1.63 (0.52 to 5.74) | ████ ██ | ████ ██ | ████ ██ |
MIRI vs. UPA | 0.61 (0.91 to 2.01) | ████ ██ | ████ ██ | ████ ██ |
MIRI vs. UST | 0.77 (0.29 to 2.01) | ████ ██ | ████ ██ | ████ ██ |
MIRI vs. VED | 0.45 (0.14 to 1.49) | ████ ██ | ████ ██ | ████ ██ |
MIRI vs. placebo | 0.39 (0.15 to 0.99) | ████ ██ | ████ ██ | ████ ██ |
ADA = adalimumab; BF = biologic failure; CCF = conventional care failure; Crl = credible interval; IFX = infliximab; MIRI = mirikizumab; NA = not applicable; OR = odds ratio; RKZ = risankizumab; UPA = upadacitinib; UST = ustekinumab; VED = vedolizumab; vs. = versus.
Note: NMAs of safety outcomes were performed only for the induction period.
aFor harms outcomes (i.e., MIRI vs. comparators), an OR of < 1 indicates that the results favour MIRI; an OR of > 1 indicates that the result favours the comparator.
Critical Appraisal
The NMAs were conducted according to accepted methodological guidance. An SLR was used as the basis for selecting relevant studies. The SLR searched multiple databases and grey literature sources, and it conducted study selection and data extraction using accepted methods. The risk of bias assessments occurred at the level of the study, which ignores the fact that bias concerns may vary by effect estimate. Therefore, the appraisal may not be considered universally applicable across all end points analyzed. Risk of bias concerns were reported for some included studies, which may result in bias within the network. No sensitivity analysis was reported to understand the impact of these studies on the results. In some cases, this may not have been possible because only 1 study was available per comparator. There was no assessment of the risk of publication bias; therefore, its presence or absence cannot be confirmed.
Following a comprehensive feasibility assessment, 4 efficacy end points (enhanced clinical response, clinical remission, endoscopic response, and endoscopic remission) and 2 safety end points (all-cause discontinuations and SAEs) were selected for the NMA because these were most often reported across the eligible studies. A number of studies with noncomparable time points, noncomparable rerandomization criteria, and differences in effect modifiers were excluded from the networks. While this reduced the level of heterogeneity, the decisions to exclude studies involved subjectivity, and the exclusion of relevant evidence may be a source of bias in the analysis. Safety end points could be analyzed only in the induction phase; however, the clinical experts consulted by the review team indicated that long-term harms would be of greater interest. The sponsor indicated that the NMAs of safety outcomes were performed for the end of the induction period only due to heterogeneity in the definition of the “placebo” safety population within maintenance trials as well as to different trial designs for the maintenance phase. Thus, the sponsor indicated that no sound and reliable conclusion could be drawn from any maintenance-period analyses of safety outcomes.
One of the key limitations of the NMA was the significant heterogeneity in study-level patient demographic and disease characteristics across the studies, such as prior lines of treatment, disease severity (based on baseline CDAI and SES-CD scores), and site of disease (ileum or colon). The sponsor indicated that, regarding prior lines of treatment, studies limited to populations of patients with BF reported 90% to 100% prior anti-TNF use. In contrast, mixed-population studies showed lower percentages because these included patients with CCF, who were analyzed separately. Regarding disease severity, the range of average CDAI scores for induction studies was 262 to 338, which aligns with moderate severity (i.e., 220 to 450). For the maintenance studies, most studies that reported CDAI scores reported these from the start of induction. However, those taken from the start of the maintenance period were unsurprisingly lower (i.e., 88 to 137). Therefore, there is some uncertainty in this aspect. The studies included in the NMA were published from 1997 to 2023. Definitions of the populations (i.e., patients with CCF and BF) have changed over time, and the sponsor noted substantial differences across studies. Over the past 25 years, the standard of care in CD has evolved constantly; therefore, the numbers and types of prior treatments to which patients are exposed are likely to have changed. The use of concomitant medications (e.g., corticosteroids, immunosuppressants) was also heterogeneous across the studies. Not all studies reported the information necessary for a comprehensive heterogeneity assessment. The significant heterogeneity of these effect modifiers may threaten the transitivity assumption that is required to draw valid conclusions from the NMA. Additionally, the timings of outcome assessments varied substantially, and the definitions of the efficacy end points of interest were not always consistent across the clinical trials identified. Different trial designs (both treat-through and rerandomized designs) were combined in the maintenance analyses, during which adjustments were applied to treat-through studies (i.e., the VIVID-1 study) to allow for comparison. This approach relies on assumptions that cannot be tested and raises interpretation challenges. The approach resulted in clinically implausible outcome values for 1 study; that study was excluded from the base case.
The stratification of analyses by populations of patients with CCF and BF for efficacy analyses represents a methodologically sound approach to reduce heterogeneity. However, this stratification limits the generalizability of the results of either analysis to the overall indicated population, particularly in the Canadian treatment context. Furthermore, the interpretation of the stratified NMA results for these populations faces some limitations. The baseline characteristics within subgroups were not fully known, challenging comprehensive assessments of comparability. The report does not confirm whether randomization was consistently stratified by failure status across all trials. This raises concerns about potential confounding, given that the effect estimates might not arise from fully randomized groups.
The baseline risk adjustment for heterogeneity in placebo response was considered appropriately across all analyses and applied for most of the induction analyses. This adjustment was not (or could not be) extended to maintenance analyses, in which between-trial heterogeneity was potentially greater due to variations in study design. The maintenance stage included patients in the placebo group who previously responded to varied treatments that might have different carry-over effects. The sponsor mentioned that the adjusted models had poor fit and often produced uninterpretable results (i.e., very wide CrIs); therefore, selection of an unadjusted model was required. The study design issue (i.e., treat-through versus rerandomized studies), smaller networks, smaller sample sizes, and 1 study per comparator likely contributed to the poor fit and the uncertainty in effect estimates.
All evidence networks were sparsely connected for each comparison. Several of the connections between treatment nodes were informed by 1 trial. There were relatively few closed loops between nodes, and some were formed by arms of the same trial, which would be inherently consistent. Therefore, the ability to comprehensively test the consistency assumption was limited. Due to the sparsity of the networks, there were not always sufficient sample data to inform the between-study SD in treatment effects. Therefore, the RE and adjusted models sometimes resulted in uninterpretable results (such as implausibly wide CrIs). Although the FE results were used as the base-case analysis, the sparsity of data still resulted in wide CrIs for many comparisons, adding uncertainty to the results.
Summary
In terms of enhanced clinical response, clinical remission (i.e., CDAI score < 150), endoscopic response, endoscopic remission, SAEs, and all-cause discontinuation, the findings of the NMA were not sufficient to show a difference when comparing mirikizumab with other relevant comparator treatments (i.e., the 95% CrIs included the null). The considerable limitations (such as risk of bias, likely violations of underlying assumptions, and imprecision) do not permit the analysis to draw a definitive conclusion about the efficacy and safety of mirikizumab versus relevant comparators.
Studies Addressing Gaps in the Systematic Review Evidence
No studies addressing gaps were submitted by the sponsor.
Discussion
Summary of Available Evidence
One pivotal trial (the VIVID-1 study) was included in the sponsor-submitted systematic review. The VIVID-1 trial was a phase III, multicentre, randomized, double-blind, placebo- and active-controlled, treat-through RCT to evaluate the efficacy and safety of mirikizumab in patients with moderately to severely active CD. The VIVID-1 trial enrolled patients with moderate to severely active CD who experienced an inadequate response to, loss of response to, or intolerance to corticosteroids, immunomodulators, or approved biologic therapies for CD. The coprimary objectives of the study were to evaluate the superiority of the efficacy of mirikizumab compared to placebo as assessed by the composites of PRO clinical response at week 12 and endoscopic response at week 52 and of PRO clinical response at week 12 and CDAI clinical remission at week 52. A major secondary objectives of the VIVID-1 study was to evaluate the efficacy of mirikizumab compared to ustekinumab (assessed in terms of SES-CD endoscopic response at week 52 for superiority, and CDAI clinical remission at week 52 for noninferiority). The mean ages of patients receiving mirikizumab, placebo, and ustekinumab were 36.0 years (SD = 13.22 years), 36.3 years (SD = 12.71 years), and 36.6 years (SD = 12.72 years), respectively. Most of the study patients were male (55.1%; female = 44.9%) and white (71.7%). In the PAS set, 25.1% of patients were Asian, 2.2% of patients were Black, 0.6% of patients were American Indian or Alaska Native, and 0.4% of patients identified as having multiple races. Moreover, patients across the 3 treatment groups had similar mean SES-CD scores (13.5 for mirikizumab compared with 13.1 for placebo and 13.9 for ustekinumab), AP scores (2.1 for all treatment groups), and SF scores (5.7 for the mirikizumab and ustekinumab groups versus 5.8 for the placebo group).
One ongoing, phase III, multicentre, open-label LTE study (the VIVID-2 study) was submitted, which evaluated the long-term efficacy and safety of mirikizumab after an additional 52 weeks of treatment with mirikizumab (i.e., 52 weeks of treatment after week 52 of the VIVID-1 study). A total of 430 patients entered from the VIVID-1 study. Of these, 251 patients continued mirikizumab SC and 179 patients received reinduction with IV mirikizumab followed by mirikizumab SC if they achieved endoscopic response during reinduction. The coprimary end points were endoscopic response at week 52 and CDAI clinical remission at week 52. For patients in the mirikizumab SC group of the VIVID-2 trial, the mean duration of CD was 7.8 years, the mean CDAI score was 319, and the mean SES-CD score was 15. For patients in the mirikizumab IV-to-SC group of the VIVID-2 trial, the mean CDAI score was 328, the mean duration of CD was 9.8 years, and the mean SES-CD score was 12. In both groups, most patients were male and white.
A sponsor-conducted NMA was submitted to compare the efficacy and safety of mirikizumab with all potentially relevant comparators of interest (adalimumab, infliximab, risankizumab, upadacitinib, ustekinumab, and vedolizumab) for the treatment of moderately to severely active CD.
Interpretation of Results
Efficacy
Mirikizumab Versus Placebo
In the VIVID-1 trial comparison between mirikizumab and placebo, the coprimary and all major secondary end points yielded statistically significant results in favour of mirikizumab. A GRADE assessment (refer to Table 2) was conducted to assess the 2 coprimary end points, 4 major secondary end points, 1 other secondary end point, and 1 additional end point. All assessed outcomes had evidence demonstrating high levels of certainty except for 1 major secondary outcome: CDAI clinical remission at week 12, which was rated as moderate certainty due to serious imprecision because the 95% CI included the potential for little to no difference or clinically important benefit. All end points assessed with GRADE resulted in clinically meaningful improvements in favour of mirikizumab except for CDAI clinical remission at week 12, which suggested little to no difference between mirikizumab and placebo.
The 4 major secondary end points that were not selected for the GRADE assessment but were presented in the main section of this report (refer to Table 16) demonstrated results that were consistent overall with those included in the GRADE assessment. In the absence of an established threshold, the clinical experts consulted by CDA-AMC chose a threshold for the difference between groups of 20% for PRO clinical response; this threshold was exceeded at week 52 and very close to being met at week 12. The thresholds selected by the clinical experts for CDAI clinical remission at week 52, SES-CD endoscopic response at week 12, and endoscopic remission at week 12 were consistent with those applied in the GRADE assessment, in which these outcomes were assessed at week 12, week 52, and week 52, respectively. Note that CDAI clinical remission at week 12 showed little to no between-group difference in the GRADE evaluation (Table 2); however, when the same threshold was applied to the week 52 assessment, the results indicated that mirikizumab demonstrated a clinically meaningful improvement over placebo. For SES-CD endoscopic remission at week 12, there was serious imprecision (i.e., based on a 7% threshold, the point estimate suggests clinically important benefit; however, the 99.5% CI includes the potential for little to no clinically important difference).
The other secondary outcome, LS mean change from baseline in IBDQ at week 12, which was not included in the GRADE assessment but is shown in Table 16, suggested results that are consistent with those included in the GRADE assessment for IBDQ at week 52. A change of 16 points in IBDQ total score is conventionally considered to be a within-group threshold among patients with CD.57 The 16-point threshold has been applied for this assessment in the absence of an estimate for the between-group threshold; this did not affect the interpretation, given that the effect estimate was rated as having high certainty.
The additional end point, corticosteroid-free CDAI clinical remission at week 52 — which was not assessed with GRADE, but is shown in Table 16 — was supportive of the results observed in the coprimary and major secondary end points. In the absence of a threshold, the CDA-AMC review team judged that the point estimate and both the lower and upper boundaries of the 99.5% CI for the between-group comparison suggested a possibility of benefit.
Mirikizumab Versus Ustekinumab
A GRADE assessment (refer to Table 3) was conducted to assess the 2 major secondary outcomes, 2 other secondary end points, and 5 additional end points. It demonstrated high to moderate levels of certainty except with respect to 1 additional end point (PRO clinical response at week 12 and SES-CD endoscopic response at week 52) and 1 other secondary end point (SES-CD endoscopic remission at week 52). These outcomes were rated as low certainty due to very serious imprecision. All end points assessed with GRADE resulted in little to no clinically important difference between mirikizumab and ustekinumab. Evidence from the VIVID-1 trial demonstrated that mirikizumab was noninferior to ustekinumab in the major secondary outcome of CDAI clinical remission at week 52. Superiority of mirikizumab over ustekinumab in week 52 for endoscopic response was not achieved. High-certainty evidence demonstrated that mirikizumab results in little to no difference in terms of the other major secondary outcome of SES-CD endoscopic response at week 52.
The 4 other secondary end points (PRO clinical response at week 12 and week 52, corticosteroid-free CDAI remission at week 52, and SES-CD endoscopic response at week 12) that were not selected for the GRADE assessment but are presented in the main section of this report (refer to Table 17) demonstrated results that were consistent overall with those included in the GRADE assessment (i.e., little to no difference between mirikizumab and ustekinumab). The thresholds for the between-group differences for these outcomes were the same as those selected for the comparisons versus placebo (as discussed earlier). In the absence of a threshold for corticosteroid-free CDAI remission at week 52, the CDA-AMC review team judged that the point estimate and both the lower and upper boundaries of the 99.5% CI suggested little to no difference between the groups.
The 2 additional end points, SES-CD endoscopic remission at week 12 and LS mean change from baseline in IBDQ score at week 12, were also not included in the GRADE assessment, but are shown in Table 17. The results were consistent with those included in the GRADE assessment (i.e., little to no difference between mirikizumab and ustekinumab). The thresholds used for these outcomes were the same as those shown in the GRADE table, where these outcomes were assessed at week 52. Of note, although within-group changes for both the mirikizumab and ustekinumab groups showed improvement in IBDQ scores, the difference between the 2 groups was deemed to be small.
Miscellaneous Outcomes
A summary of miscellaneous outcomes is presented in Table 34 and Table 35. A psychometric analysis based on data from the VIVID-1 trial suggested an improvement of 6 points to 9 points in the FACIT-Fatigue score to be a meaningful improvement for within-group changes among patients with moderately to severely active CD.65 Similarly, a psychometric analysis based on data from the ADVANCE and ACHIEVE trials suggested an improvement of 7 points to 10 points to be a meaningful improvement for within-group changes among patients with moderate to severe CD.66 The CDA-AMC review team critically appraised this outcome according to the identified thresholds. In the absence of thresholds for between-group differences, the literature-based, within-group thresholds were applied to our assessment. The limitations of this approach are acknowledged. According to thresholds ranging from 6 points to 10 points, mirikizumab resulted in little to no difference in LS mean change in FACIT-Fatigue score from baseline to week 12 and week 52 compared with placebo and ustekinumab. Of note, although within-group changes for mirikizumab showed improvement in FACIT-Fatigue at week 12 and week 52, the differences between groups were deemed to be small. For the LS mean change in FACIT-Fatigue score from baseline to week 52 for mirikizumab versus placebo, uncertainty was observed due to serious imprecision as the upper 99.5% CI crossed the 6-point threshold (i.e., possible clinically important benefit).
The major secondary composite outcome of PRO clinical response at week 12 and PRO clinical remission at week 52 demonstrated results that were consistent with those of the other major secondary outcomes in the GRADE table: clinically meaningful improvements in favour of mirikizumab versus placebo and little to no difference versus ustekinumab, based on the 7% to 10% between-group difference threshold selected by the clinical experts consulted for this review. There was uncertainty due to imprecision for the comparison against ustekinumab, given that the upper bound of the 99.5% CI included the possibility of clinically important benefit of mirikizumab over ustekinumab.
Overall Comments
This review highlighted a few caveats pertaining to the generalizability of the results of the VIVID-1 trial to clinical practice in Canada. The clinical experts consulted by CDA-AMC agreed that patients in the VIVID-1 trial may have more moderate disease compared to what would be observed among patients with moderately to severely active CD in clinical practice in Canada. The clinical experts consulted by CDA-AMC noted that this discrepancy was attributed to the VIVID-1 trial population having a slightly lower endoscopic burden, as reflected by a lower mean SES-CD score and smaller proportions of patients with ileum-only disease, prior exposure to anti-TNF drugs, or the prior failure of 2 or more biologic therapies. The clinical experts consulted by CDA-AMC indicated that patients with ileum-only disease, prior exposure to biologic therapies, and higher endoscopic burden were expected to experience poorer treatment outcomes in clinical practice settings.
The clinical experts consulted by CDA-AMC agreed that ustekinumab was part of the Canadian treatment landscape for CD and is a relevant comparator. However, they indicated that ustekinumab is less commonly used to treat CD, with options such as risankizumab and upadacitinib being preferred by clinicians. The results of this review found that mirikizumab and ustekinumab were similarly effective in terms of the major secondary outcomes (clinical remission and endoscopic response at week 52) and may result in little to no difference in endoscopic remission at week 52. The clinical experts consulted by CDA-AMC noted that compared to risankizumab, mirikizumab requires longer infusion times during induction and more frequent injections during maintenance. In light of these results, the clinical experts consulted by CDA-AMC suggested that mirikizumab would not be used before ustekinumab or other IL-23 drugs for the treatment of moderately to severely active CD. The sponsor provided context, noting that some patients and clinicians may feel uneasy with longer intervals between injections. As such, a dosing frequency of every 4 weeks may be preferred over every 8 weeks and may be considered a reasonable time frame to help reassure patients. The sponsor noted that multiple factors influence treatment selection in the patient target population (e.g., the clinician’s assessment, the patient’s disease characteristics, and the clinical merits of the therapy). A single factor, such as the route of administration and/or length of intervals between doses (for treatments administered by SC injection) may not play a primary role in the selection of therapies in all cases.
As the VIVID-1 trial did not compare mirikizumab with other relevant comparators for CD, the stand-alone results of the trial do not provide a full assessment of the efficacy and safety of mirikizumab compared to existing treatments for CD in clinical practice in Canada.
Most patients who were considered endoscopic responders at week 52 of the VIVID-1 trial maintained endoscopic response, clinical remission, and endoscopic remission at week 52 of the VIVID-2 trial. Of the patients considered to be endoscopic nonresponders, few gained endoscopic response, clinical remission, and endoscopic remission. As is often the case with LTE studies, causal conclusions from the VIVID-2 trial were limited because there was no comparator group. One of the clinical experts consulted by CDA-AMC indicated that re-treatment with mirikizumab would be considered only under certain circumstances, such as incomplete induction (missed doses), partial response (suggesting that reinduction may be needed to achieve further improvement), or clear reasons for prior failure of induction, such as Clostridioides difficile infection or pre-existing strictures. The other clinical expert noted that re-treatment with mirikizumab would not be considered and that they would likely pivot to another mechanism of action or even another anti–IL-23 drug. Regarding HRQoL, patients considered to be endoscopic responders achieved a greater than 70% IBDQ remission and response by week 52 of the VIVID-2 trial. Information about IBDQ remission and response for patients considered to be endoscopic nonresponders was not provided by the sponsor.
Evidence from the sponsor-submitted NMA was uncertain about the comparative efficacy of mirikizumab compared to all evaluated comparators. The wide 95% Crls included the null value, which suggested that the treatment effects of mirikizumab versus other comparators were associated with considerable variability and imprecision. Considering the significant limitations associated with the NMA (such as risk of bias, imprecision, and heterogeneity across the included studies that is likely to violate underlying assumptions), the evidence base does not adequately allow for an accurate estimate of the comparative effectiveness of mirikizumab versus all relevant comparators in the treatment of moderately to severely active CD.
Harms
Compared with the safety profile observed in ulcerative colitis,67 no new safety signals were identified for mirikizumab in the VIVID-1 trial. The safety results of the VIVID-1 trial indicated that there appeared to be no notable differences between mirikizumab and placebo in terms of TEAEs, SAEs, or withdrawals due to AEs. When compared with ustekinumab, mirikizumab was associated with similar rates of TEAEs, SAEs, and withdrawals due to AEs. During the overall treatment period, the rates of infection were similar between the mirikizumab and ustekinumab groups, but lower for the placebo group. The clinical experts consulted by CDA-AMC agreed that the safety profile of mirikizumab in the VIVID-1 trial is consistent with those of other anti–IL-23 drugs used to treat CD. Of note, CD incidence was reported as an AE in the VIVID-1 trial. Although fewer TEAEs and SAEs were observed for the mirikizumab group compared with the placebo group in the trial, these differences were driven largely by an increase in CD incidence among the placebo group. The clinical experts consulted by CDA-AMC indicated that this increase in CD incidence is likely attributable to disease activity and lack of disease control associated with treatment with placebo. Thus, this poses interpretational difficulties in terms of the difference in rates of AEs between the mirikizumab and placebo groups. Although mirikizumab was shown to demonstrate similar rates of harms compared with ustekinumab, the VIVID-1 trial did not compare mirikizumab to other relevant comparators for moderately to severely active CD in Canada. Thus, based on the stand-alone results of this trial, the safety profile of mirikizumab compared with relevant comparators for moderately to severely active CD in clinical practice in Canada is uncertain.
The patient groups that provided input for this review indicated that reducing treatment-related AEs was an important outcome for patients with CD. The clinical experts consulted by CDA-AMC regarded anti–IL-23 drugs, including mirikizumab, as having excellent safety profiles compared to other drug classes for CD treatments. The clinical experts considered injection-site reactions to be an important harm in clinical practice because these relate to the patient experience. Of note, a slightly higher rate of injection-site reactions was observed among the mirikizumab group (10.8%) compared with the ustekinumab group in the VIVID-1 trial (5.8%). The clinical experts consulted by CDA-AMC noted that, compared to other IL-23 drugs indicated for CD treatment (e.g., risankizumab), the administration of mirikizumab requires longer infusion times during induction and more frequent injections during maintenance. They further noted that the formulation of mirikizumab used in the VIVID-1 trial is not citrate-free, which may contribute to pain and injection-site reactions. However, the sponsor noted that a citrate-free SC formulation of mirikizumab is available and was under review by Health Canada at the time of this reimbursement review.
The harms results of the LTE mainly aligned with those of the pivotal study, with no new AEs identified. Fewer patients reported injection-site reactions in the LTE compared with the pivotal study.
Evidence from the NMA was uncertain regarding the comparative safety of mirikizumab versus all evaluated comparators. The wide 95% Crls included the null value, indicating substantial variability and imprecision in the comparative safety estimates for mirikizumab versus other comparators. Considering the significant limitations associated with the NMA (such as risk of bias, heterogeneity across the included studies, and imprecision), the evidence base does not adequately allow for an accurate estimate of the comparative safety of mirikizumab versus all relevant comparators in the treatment of moderately to severely active CD. The safety analysis included only the induction phase; however, the clinical experts consulted by the review team indicated that it may be more relevant to evaluate harms after a longer treatment period.
Conclusion
The evidence base for this review included 1 phase III, double-blind, placebo- and active-controlled RCT (the VIVID-1 study); 1 LTE study (VIVID-2); and 1 sponsor-submitted NMA.
The VIVID-1 trial evaluated the efficacy and safety of mirikizumab compared with placebo and ustekinumab in patients with moderately to severely active CD. The outcomes evaluated in the VIVID-1 trial were considered important to patients and clinicians, including clinical outcomes, endoscopic outcomes, HRQoL, and safety.
In the comparison of mirikizumab and placebo, the coprimary and all major secondary end points yielded statistically significant results in favour of mirikizumab. The GRADE assessments demonstrated high levels of certainty and clinically meaningful improvements in favour of mirikizumab except for 1 major secondary outcome: CDAI clinical remission at week 12, which was rated as moderate certainty (due to serious imprecision) and suggested little to no difference between mirikizumab and placebo.
In the comparison of mirikizumab and ustekinumab, the GRADE assessments demonstrated little to no clinically important differences between groups with high to moderate levels of certainty except for the composite outcome of PRO clinical response at week 12 and SES-CD endoscopic response by the SES-CD at week 52, as well as the single outcome of SES-CD endoscopic remission at week 52; these were rated as low certainty due to very serious imprecision. Mirikizumab was noninferior to ustekinumab in the major secondary outcome of CDAI clinical remission at week 52. Superiority of mirikizumab over ustekinumab in week 52 endoscopic response was not achieved.
Overall, no new safety concerns were observed with mirikizumab in the VIVID-1 trial. Mirikizumab may result in little to no difference in the incidence of SAEs compared to placebo or to ustekinumab.
The VIVID-2 trial is an ongoing, phase III, multicentre, open-label LTE study evaluating the long-term efficacy and safety of mirikizumab in patients with moderately to severely active CD. The outcomes evaluated in the LTE aligned with those of the pivotal study. While most patients maintained endoscopic response, endoscopic remission, and clinical remission at week 52 of the VIVID-2 trial, longer-term sustainability and/or durability have yet to be determined because the study is ongoing. Among patients considered endoscopic nonresponders, 30.9% gained endoscopic response and 12.1% gained endoscopic remission during the LTE. Causal conclusions about longer-term efficacy were limited by the noncomparative nature of the study.
Evidence from the NMA was insufficient to conclude whether treatment with mirikizumab differs from treatment with relevant comparators. Due to the significant limitations associated with the NMA (e.g., risk of bias, important clinical and methodological heterogeneity, and imprecision), no definite conclusion can be drawn regarding the comparable efficacy and safety of mirikizumab versus available comparators in the treatment of patients with moderately to severely active CD who have had prior CCF or BF.
References
1.Roda G, Chien Ng S, Kotze PG, et al. Crohn's disease. Nat Rev Dis Primers. 2020;6(1):22. doi: 10.1038/s41572-020-0156-2 PubMed
2.Torres A, Niederman MS, Chastre J, et al. International ERS/ESICM/ESCMID/ALAT guidelines for the management of hospital-acquired pneumonia and ventilator-associated pneumonia: Guidelines for the management of hospital-acquired pneumonia (HAP)/ventilator-associated pneumonia (VAP) of the European Respiratory Society (ERS), European Society of Intensive Care Medicine (ESICM), European Society of Clinical Microbiology and Infectious Diseases (ESCMID) and Asociacion Latinoamericana del Torax (ALAT). Eur Respir J. 2017;50(3). doi: 10.1183/13993003.00582-2017 PubMed
3.Lichtenstein GR, Loftus EV, Isaacs KL, Regueiro MD, Gerson LB, Sands BE. ACG Clinical Guideline: Management of Crohn's Disease in Adults. Am J Gastroenterol. 2018;113(4):481-517. doi: 10.1038/ajg.2018.27 PubMed
4.Veauthier B, Hornecker JR. Crohn's Disease: Diagnosis and Management [sponsor supplied reference]. Am Fam Physician. 2018;98(11):661-669. Accessed December 1. https://www.aafp.org/pubs/afp/issues/2018/1201/p661.html
5.Cockburn E, Kamal S, Chan A, et al. Crohn's disease: an update. Clin Med (Lond). 2023;23(6):549-557. doi: 10.7861/clinmed.2023-0493 PubMed
6.Torres J, Mehandru S, Colombel JF, Peyrin-Biroulet L. Crohn's disease. Lancet. 2017;389(10080):1741-1755. doi: 10.1016/S0140-6736(16)31711-1 PubMed
7.Frolkis AD, Lipton DS, Fiest KM, et al. Cumulative incidence of second intestinal resection in Crohn's disease: a systematic review and meta-analysis of population-based studies. Am J Gastroenterol. 2014;109(11):1739-48. doi: 10.1038/ajg.2014.297 PubMed
8.Popov J, Farbod Y, Chauhan U, et al. Patients' Experiences and Challenges in Living with Inflammatory Bowel Disease: A Qualitative Approach. Clin Exp Gastroenterol. 2021;14:123-131. doi: 10.2147/CEG.S303688 PubMed
9.Benchimol EI, Bernstein CN, Bitton A, et al. The Impact of Inflammatory Bowel Disease in Canada 2018: A Scientific Report from the Canadian Gastro-Intestinal Epidemiology Consortium to Crohn's and Colitis Canada. J Can Assoc Gastroenterol. 2019;2(Suppl 1):S1-S5. doi: 10.1093/jcag/gwy052 PubMed
10.Coward S, Benchimol EI, Kuenzig ME, et al. The 2023 Impact of Inflammatory Bowel Disease in Canada: Epidemiology of IBD. J Can Assoc Gastroenterol. 2023;6(Suppl 2):S9-S15. doi: 10.1093/jcag/gwad004 PubMed
11.Crohn's and Colitis Canada. Impact of Inflammatory Bowel Disease in Canada. 2023. Accessed April 24, 2025. https://crohnsandcolitis.ca/Crohns_and_Colitis/documents/reports/2023-IBD-Report-English-LR.pdf?ext=.pdf
12.Hashash J, Regueriro M. Post TW, ed. Medical management of moderate to severe Crohn disease in adults. UpToDate; 2025. Accessed January 30, 2025. http://www.uptodate.com
13.Gomollon F, Dignass A, Annese V, et al. 3rd European Evidence-based Consensus on the Diagnosis and Management of Crohn's Disease 2016: Part 1: Diagnosis and Medical Management. J Crohns Colitis. 2017;11(1):3-25. doi: 10.1093/ecco-jcc/jjw168 PubMed
14.Hashash J. Post TW, ed. Clinical manifestations, diagnosis, and prognosis of Crohn disease in adults. UpToDate; 2024. Accessed February 19, 2025. http://www.uptodate.com
15.Cushing K, Higgins PDR. Management of Crohn Disease: A Review. JAMA. 2021;325(1):69-80. doi: 10.1001/jama.2020.18936 PubMed
16.Eli Lilly Canada Inc. Sponsor's Summary of Clinical Evidence: Mirikizumab (Omvoh): to be indicated for the treatment of adult patients with moderately to severely active Crohn’s disease who have had an inadequate response, loss of response, or were intolerant to either conventional therapy or a biologic treatment [internal sponsor's report]. In: Drug Reimbursement Review sponsor submission: OMVOH (mirikizumab), 100 mg / mL solution for subcutaneous injection; 200 mg / 2 mL solution for subcutaneous injection; 20 mg / mL solution for intravenous infusion. March 4, 2025.
17.Chateau T, Peyrin-Biroulet L. Evolving therapeutic goals in Crohn's disease management. United European Gastroenterol J. 2020;8(2):133-139. doi: 10.1177/2050640619887316 PubMed
18.Le Berre C, Ricciuto A, Peyrin-Biroulet L, Turner D. Evolving Short- and Long-Term Goals of Management of Inflammatory Bowel Diseases: Getting It Right, Making It Last. Gastroenterology. 2022;162(5):1424-1438. doi: 10.1053/j.gastro.2021.09.076 PubMed
19.AbbVie Corporation. Rinvoq (upadacitinib): 15 mg, 30 mg, 45 mg for oral use [product monograph]. 2023. Updated April 30, 2025.
20.U.S. Food & Drug Administration. Non-inferiority clinical trials to establish effectiveness: guidance for industry. 2016. Accessed November 23, 2019. https://www.ema.europa.eu/docs/en_GB/document_library/Scientific_guideline/2009/09/WC500003636.pdf
21.European Medicines Agency. Guideline on the choice of non-inferiority margin. EMEA/CPMP/EWP/2158/99. 2005. Accessed March 8, 2019. https://www.ema.europa.eu/docs/en_GB/document_library/Scientific_guideline/2009/09/WC500003636.pdf
22.European Medicines Agency. Development of new medicinal products for the treatment of ulcerative colitis - Scientific guideline. 2018. Accessed May 22, 2025. https://www.ema.europa.eu/en/documents/scientific-guideline/guideline-development-new-medicinal-products-treatment-ulcerative-colitis-revision-1_en.pdf
23.U.S. Food & Drug Administration. GUIDANCE DOCUMENT: Crohn’s Disease: Developing Drugs for Treatment. 2022. Accessed May 22, 2025. https://www.fda.gov/regulatory-information/search-fda-guidance-documents/crohns-disease-developing-drugs-treatment
24.Loftus EV, Jr., Panes J, Lacerda AP, et al. Upadacitinib Induction and Maintenance Therapy for Crohn's Disease. N Engl J Med. 2023;388(21):1966-1980. doi: 10.1056/NEJMoa2212728 PubMed
25.D'Haens G, Panaccione R, Baert F, et al. Risankizumab as induction therapy for Crohn's disease: results from the phase 3 ADVANCE and MOTIVATE induction trials. Lancet. 2022;399(10340):2015-2030. doi: 10.1016/S0140-6736(22)00467-6 PubMed
26.Janssen Inc. Stelara (ustekinumab): 45 mg/0.5 mL SC, 90 mg/1.0 mL SC, 130 mg/26 mL (5 mg/mL) IV [product monograph]. 2008. Updated August 14, 2024.
27.Balshem H, Helfand M, Schunemann HJ, et al. GRADE guidelines: 3. Rating the quality of evidence. J Clin Epidemiol. 2011;64(4):401-6. doi: 10.1016/j.jclinepi.2010.07.015 PubMed
28.Santesso N, Glenton C, Dahm P, et al. GRADE guidelines 26: informative statements to communicate the findings of systematic reviews of interventions. J Clin Epidemiol. 2020;119:126-135. doi: 10.1016/j.jclinepi.2019.10.014 PubMed
29.Eli Lilly Canada Inc. Clinical Study Report: I6T-MC-AMAM (VIVID-1). A Phase 3, Multicenter, Randomized, Double-Blind, Placebo- and Active Controlled, Treat-Through Study to Evaluate the Efficacy and Safety of Mirikizumab in Patients with Moderately to Severely Active Crohn's Disease [internal sponsor's report]. February 2, 2024.
30.Peyrin-Biroulet L, Sandborn W, Sands BE, et al. Selecting Therapeutic Targets in Inflammatory Bowel Disease (STRIDE): Determining Therapeutic Goals for Treat-to-Target. Am J Gastroenterol. 2015;110(9):1324-38. doi: 10.1038/ajg.2015.233 PubMed
31.Gordon H, Minozzi S, Kopylov U, et al. ECCO Guidelines on Therapeutics in Crohn's Disease: Medical Treatment. J Crohns Colitis. 2024;18(10):1531-1555. doi: 10.1093/ecco-jcc/jjae091 PubMed
32.Eli Lilly Canada Inc. OMVOH™ [product monograph] [sponsor supplied reference]. 2025.
33.CADTH Reimbursement Recommendation: Mirikizumab (Omvoh). Can J Health Technol. 2023;3(12). doi:10.51731/cjht.2023.795
34.European Medicines Agency. European Public Assessment Report (EPAR): Omvoh (Mirikizumab). Accessed March 5, 2025. https://www.ema.europa.eu/en/medicines/human/EPAR/omvoh#topics
35.U.S. Food & Drug Administration. Supplement Approval: BLA 761279/S-002. January 15, 2025. Accessed March 5, 2025. https://www.accessdata.fda.gov/drugsatfda_docs/appletter/2025/761279Orig1s002ltr.pdf
36.National Institute for Health and Care Excellence. Mirikizumab for treating moderately to severely active Crohn's disease. (NICE technology appraisal TA11267). Accessed March 5, 2025. https://www.nice.org.uk/guidance/indevelopment/gid-ta11267
37.AbbVie Corporation. SKYRIZI® [product monograph] [sponsor supplied reference]. 2024.
38.Takeda Canada Inc. ENTYVIO® [product monograph] [sponsor supplied reference]. 2020.
39.Janssen Inc. REMICADE® [product monograph] [sponsor supplied reference]. 2024.
40.AbbVie Corporation. HUMIRA® [product monograph] [sponsor supplied reference]. 2022.
41.Janssen Inc. STELARA® [product monograph] [sponsor supplied reference]. 2024.
42.AbbVie Corporation. RINVOQ® [product monograph] [sponsor supplied reference]. 2024.
43.Peyrin-Biroulet L, Chapman JC, Colombel JF, et al. Risankizumab versus Ustekinumab for Moderate-to-Severe Crohn's Disease. N Engl J Med. 2024;391(3):213-223. doi: 10.1056/NEJMoa2314585 PubMed
44.Eli Lilly Canada Inc. VIVID-1 Study. Data on File [sponsor supplied reference].
45.Lewis SJ, Heaton KW. Stool form scale as a useful guide to intestinal transit time. Scand J Gastroenterol. 1997;32(9):920-4. doi: 10.3109/00365529709011203 PubMed
46.Guyatt G, Mitchell A, Irvine EJ, et al. A new measure of health status for clinical trials in inflammatory bowel disease. Gastroenterology. 1989;96(3):804-10. doi: 10.1016/S0016-5085(89)80080-0 PubMed
47.Irvine EJ. Development and subsequent refinement of the inflammatory bowel disease questionnaire: a quality-of-life instrument for adult patients with inflammatory bowel disease. J Pediatr Gastroenterol Nutr. 1999;28(4):S23-7. doi: 10.1097/00005176-199904001-00003 PubMed
48.Yoshida EM. The Crohn's Disease Activity Index, its derivatives and the Inflammatory Bowel Disease Questionnaire: a review of instruments to assess Crohn's disease. Can J Gastroenterol. 1999;13(1):65-73. doi: 10.1155/1999/506915 PubMed
49.Sandborn WJ, Feagan BG, Hanauer SB, et al. A review of activity indices and efficacy endpoints for clinical trials of medical therapy in adults with Crohn's disease. Gastroenterology. 2002;122(2):512-30. doi: 10.1053/gast.2002.31072 PubMed
50.Best WR, Becktel JM, Singleton JW, Kern F, Jr. Development of a Crohn's disease activity index. National Cooperative Crohn's Disease Study. Gastroenterology. 1976;70(3):439-44. PubMed
51.Feagan BG, Rochon J, Fedorak RN, et al. Methotrexate for the treatment of Crohn's disease. The North American Crohn's Study Group Investigators. N Engl J Med. 1995;332(5):292-7. doi: 10.1056/NEJM199502023320503 PubMed
52.European Medicines Agency. Guideline on the development of new medicinal products for the treatment of Crohn’s Disease. 2018. Accessed June 4, 2025. https://www.ema.europa.eu/en/documents/scientific-guideline/guideline-development-new-medicinal-products-treatment-crohns-disease-revision-2_en.pdf
53.Daperno M, D'Haens G, Van Assche G, et al. Development and validation of a new, simplified endoscopic activity score for Crohn's disease: the SES-CD. Gastrointest Endosc. 2004;60(4):505-12. doi: 10.1016/s0016-5107(04)01878-4 PubMed
54.Khanna R, Nelson SA, Feagan BG, et al. Endoscopic scoring indices for evaluation of disease activity in Crohn's disease. Cochrane Database Syst Rev. 2016;2016(8):CD010642. doi: 10.1002/14651858.CD010642.pub2 PubMed
55.Pallis AG, Mouzas IA, Vlachonikolis IG. The inflammatory bowel disease questionnaire: a review of its national validation studies. Inflamm Bowel Dis. 2004;10(3):261-9. doi: 10.1097/00054725-200405000-00014 PubMed
56.Chen XL, Zhong LH, Wen Y, et al. Inflammatory bowel disease-specific health-related quality of life instruments: a systematic review of measurement properties. Health Qual Life Outcomes. 2017;15(1):177. doi: 10.1186/s12955-017-0753-2 PubMed
57.Gregor JC, McDonald JW, Klar N, et al. An evaluation of utility measurement in Crohn's disease. Inflamm Bowel Dis. 1997;3(4):265-76. doi: 10.1097/00054725-199712000-00004 PubMed
58.Eli Lilly Canada Inc. I6T-MC-AMAM (VIVID-1) Statistical Analysis Plan [sponsor supplied reference].
59.Sato T. On the variance estimator for the Mantel-Haenszel risk difference [sponsor supplied reference]. Biometrics. 1989;45(4):1323-1324.
60.Fergusson D, Aaron SD, Guyatt G, Hebert P. Post-randomisation exclusions: the intention to treat principle and excluding patients from analysis. BMJ. 2002;325(7365):652-4. doi: 10.1136/bmj.325.7365.652 PubMed
61.Eli Lilly Canada Inc. Eli Lilly Canada response to Canada's Drug Agency request for additional information regarding Omvoh (mirikizumab) on May 1, 2025 [internal additional sponsor's information]. May 6, 2025.
62.Ho M, Pierce P, Petersohn S, Kroep S. Network Meta-Analysis for Moderately to Severely Active Crohn’s Disease (2017-6144) Report [internal sponsor's report]. OPEN Health; July 4, 2024.
63.Daly C, Downing BC, Welton NJ. A Practical Guide to Inconsistency Checks in Bayesian Network Meta-Analysis: NICE Guidelines Technical Support Unit [sponsor supplied reference]. 2021.
64.Targan SR, Hanauer SB, van Deventer SJ, et al. A short-term study of chimeric monoclonal antibody cA2 to tumor necrosis factor alpha for Crohn's disease. Crohn's Disease cA2 Study Group. N Engl J Med. 1997;337(15):1029-35. doi: 10.1056/NEJM199710093371502 PubMed
65.Regueiro M, Su S, Vadhariya A, et al. Psychometric evaluation of the Functional Assessment of chronic illness therapy-fatigue (FACIT-Fatigue) in adults with moderately to severely active Crohn's disease. Qual Life Res. 2025;34(2):509-521. doi: 10.1007/s11136-024-03829-3 PubMed
66.Loftus EV, Jr., Ananthakrishnan AN, Lee WJ, et al. Content Validity and Psychometric Evaluation of the Functional Assessment of Chronic Illness Therapy-Fatigue (FACIT-Fatigue) in Patients with Crohn's Disease and Ulcerative Colitis. Pharmacoecon Open. 2023;7(5):823-840. doi: 10.1007/s41669-023-00419-w PubMed
67.D'Haens G, Dubinsky M, Kobayashi T, et al. Mirikizumab as Induction and Maintenance Therapy for Ulcerative Colitis. N Engl J Med. 2023;388(26):2444-2455. doi: 10.1056/NEJMoa2207940 PubMed
68.Eli Lilly Canada Inc. Drug Reimbursement Review sponsor submission: Mirikizumab (OMVOH™), 300 mg/15 mL, solution for infusion after dilution in a vial, intravenous infusion (IV); Mirikizumab (OMVOH™), 100 mg/1 mL, 200 mg/2 mL, solution for injection in a prefilled pen or syringe, subcutaneous injection (SC). March 4, 2025.
Appendix 1: Detailed Outcome Data
Please note that this appendix has not been copy-edited.
Details of PRO Clinical Response at Week 12 and PRO Clinical Remission at Week 52
Outcome Definition and Overview of Statistical Analysis
The composite outcome of the proportion of patients achieving PRO clinical response PRO at week 12 and PRO clinical remission at week 52 was measured for mirikizumab compared with placebo, as a major secondary end point in the VIVID-1 trial. Although this composite outcome was not formally defined as a secondary end point for mirikizumab compared with ustekinumab, data for this outcome was available for this comparison.
Methods for statistical analysis for PRO clinical response at week 12 and PRO clinical remission at week 52 were similar to what was performed for the coprimary end points and other binary efficacy end points. The CMH test was used to compare the treatment groups for this outcome while adjusting for the following stratification factors: biologic-failed status, baseline SES-CD total score, and either baseline SF equal to or greater than 7 and/or baseline AP score equal to or greater than 2.5. For this outcome, data for patients who completed study treatment up to the point of interest but were deemed to have sporadically missing data were imputed using NRI.
Results
Table 34: PRO Clinical Response at Week 12 and PRO Clinical Remission at Week 52 for Mirikizumab Compared With Placebo and Ustekinumab
Variable | Mirikizumaba N = 579 | Placebo N = 199 | Ustekinumabb N = 287 |
|---|---|---|---|
Response, n (%) | 263 (45.4) | 39 (19.6) | (████ █) |
Common Risk Difference for Mirikizumab vs. Placebo (99.5% CI); P value | 25.7 (15.9 to 35.6); P < 0.000001 | ||
Common Risk Difference for Mirikizumab vs. Ustekinumab (99.5% CI); P valuec | ████ ██████ ██ ████████ | ||
AP = abdominal pain; CDAI = Crohn’s Disease Activity Index; CI = confidence interval; PRO = patient-reported outcome; SF = stool frequency; vs. = versus.
aMirikizumab dose regimen is 900 mg IV every 4 weeks for 3 doses, then 300 mg SC every 4 weeks.
b6 mg/kg IV for 1 dose, then 90 mg SC every 8 weeks starting at week 8.
cEnd point was not adjusted for multiplicity.
Source: I6T-MC-AMAM (the VIVID-1 study) Clinical Study Report29
Details of FACIT-Fatigue Scores at Week 12 and Week 52
Outcome Definition and Statistical Analysis
The change in FACIT-Fatigue score from baseline at week 12 was measured as a major secondary end point for mirikizumab compared with placebo in the VIVID-1 trial. Data for change in FACIT-FATIGUE score from baseline at week 52 was also available for mirikizumab compared with placebo. Although this outcome was not formally defined as a secondary end point for mirikizumab compared with ustekinumab, data for this outcome was available for this comparison at week 12 and week 52. The FACIT-Fatigue is a 13-item instrument developed to measure fatigue in patients with chronic illness. It has been validated for use in patients with IBD. The total score of the FACIT-Fatigue ranges from 0 to 52 based on a rating of 4-point Likert scale, where higher scores reflect better outcome.
To assess change in FACIT-Fatigue score from baseline, comparisons were made using ANCOVA, with the following parameters used in the model: study intervention, biologic-failed status, baseline SES-CD total score, either baseline SF equal to or greater than 7 and/or baseline AP equal to or greater than 2.5, and baseline score in the model. Missing data were handled using the ANCOVA with mBOCF approach. After handling ICEs using the BOCF approach, patients with sporadically missing observations had the last nonmissing observation carried forward to the corresponding visit.
Results
Table 35: Change From Baseline in FACIT-Fatigue Scores for Mirikizumab Compared With Placebo and Ustekinumab
Variable | Mirikizumaba N = 579 | Placebo N = 199 | Ustekinumabb N = 287 |
|---|---|---|---|
FACIT-Fatigue at baseline | |||
Number of patients included in the analysis, N | ███ | ███ | ███ |
Baseline Score, Mean (SD) | ███ | ███ | ███ |
Change from baseline in FACIT-Fatigue at week 12 | |||
Number of patients included in the analysis, N | ███ | ███ | ███ |
LS mean change from baseline to week 12, points (SE) | 5.86 (0.358) | 2.64 (0.606) | ███ |
LS mean difference mirikizumab vs. placebo, points (99.5% CI); P value | 3.22 (1.24 to 5.19); P = 0.000005 | ||
LS mean difference for mirikizumab vs. ustekinumab, points (99.5% CI); P valuec | ████ ██████ ██ █████ | ||
Change from baseline in FACIT-Fatigue at week 52 | |||
Number of patients included in the analysis, N | ███ | ███ | ███ |
LS mean change from baseline to week 52, points (SE) | 7.47 (0.361) | 3.08 (0.613) | ███ |
LS mean Difference Mirikizumab vs. placebo, points (99.5% CI); P valuec | 4.39 █████ ██ P < 0.000001 | ||
LS mean Difference for Mirikizumab vs. ustekinumab, points (99.5% CI); P valuec | ████ ██████ ██ ██████ | ||
CI = confidence interval; FACIT-Fatigue = Functional Assessment of Chronic Illness Therapy – Fatigue; LS = least squares; SD = standard deviation; SE = standard error; vs. = versus.
aMirikizumab dose regimen is 900 mg IV every 4 weeks for 3 doses, then 300 mg SC every 4 weeks.
b6 mg/kg IV for 1 dose, then 90 mg SC every 8 weeks starting at week 8.
cEnd point was not adjusted for multiplicity.
Source: I6T-MC-AMAM (the VIVID-1 study) Clinical Study Report.29
Details of Key Subgroup Analyses
Mirikizumab Versus Placebo
Table 36: Key Subgroup Analyses for PRO Clinical Response at Week 12 and SES-CD Endoscopic Response at Week 52 (Mirikizumab vs. Placebo)
Subgroup | Common risk difference for mirikizumab vs. placebo ████ ███ |
|---|---|
Duration of CD | |
< 1 year | 37.5 █████ ██ █████ |
≥ 1 to < 5 years | 30.6 █████ ██ █████ |
≥ 5 years | 25.9 █████ ██ █████ |
Site of disease location | |
Ileal | 11.0 █████ ██ █████ |
Colonic | 30.9 █████ ██ █████ |
Ileal-Colonic | 31.3 █████ ██ █████ |
Prior therapy | |
Prior biologic exposure: Ever used | ████ █████ ██ █████ |
Prior biologic exposure: Never used | ████ █████ ██ █████ |
Prior failure of biologic: Ever | 30.5 █████ ██ █████ |
Prior failure of biologic: Never | 27.5 █████ ██ █████ |
Inadequate response or loss of response to a biologic: Ever | ████ █████ ██ █████ |
Inadequate response or loss of response to a biologic: Never | ████ █████ ██ █████ |
Prior anti-TNF failure: Ever | 31.0 █████ ██ █████ |
Prior anti-TNF failure: Never | 27.3 █████ ██ █████ |
Prior anti-integrin failure: Ever | 33.8 █████ ██ █████ |
Prior anti-integrin failure: Never | 28.3 █████ ██ █████ |
Baseline FCP | |
FCP ≤ 250 mcg | 11.5 █████ ██ █████ |
FCP > 250 mcg | 32.5 █████ ██ █████ |
Baseline CRP | |
CRP ≤ 10 mg/L | 25.9 █████ ██ █████ |
CRP > 10 mg/mL | 32.6 █████ ██ █████ |
Baseline SES-CD score | |
SES-CD total score < 12 | 20.3 █████ ██ █████ |
SES-CD total score ≥ 12 | 37.6 █████ ██ █████ |
AP = abdominal pain; CD = Crohn disease; CDAI = Crohn’s Disease Activity Index; CI = confidence interval; CRP = C-reactive protein; FCP = fecal calprotectin; PRO = patient-reported outcome; SES-CD = Simple Endoscopic Score for Crohn’s Disease; SF = stool frequency; TNF = tumour necrosis factor; vs. = versus.
Source: I6T-MC-AMAM (the VIVID-1 study) Clinical Study Report.68
Table 37: Key Subgroup Analyses for PRO Clinical Response at Week 12 and CDAI Clinical Remission at Week 52 (Mirikizumab vs. Placebo)
Subgroup | Common risk difference for mirikizumab vs. placebo ████ ███ |
|---|---|
Duration of CD | |
< 1 year | 13.2 █████ ██ █████ |
≥ 1 to < 5 years | 30.1 █████ ██ █████ |
≥ 5 years | 25.5 █████ ██ █████ |
Site of disease location | |
Ileal | 10.6 ██████ ██ █████ |
Colonic | 32.3 █████ ██ █████ |
Ileal-Colonic | 24.1 █████ ██ █████ |
Prior therapy | |
Prior biologic exposure: Ever used | ████ █████ ██ █████ |
Prior biologic exposure: Never used | ████ █████ ██ █████ |
Prior failure of biologic: Ever | 31.0 █████ ██ █████ |
Prior failure of biologic: Never | 20.8 █████ ██ █████ |
Inadequate response or loss of response to a biologic: Ever | ████ █████ ██ █████ |
Inadequate response or loss of response to a biologic: Never | ████ ████ ██ █████ |
Prior anti-TNF failure: Ever | 30.3 █████ ██ █████ |
Prior anti-TNF failure: Never | 22.3 █████ ██ █████ |
Prior anti-integrin failure: Ever | 33.1 █████ ██ █████ |
Prior anti-integrin failure: Never | 24.8 █████ ██ █████ |
Baseline FCP | |
FCP ≤ 250 mcg | 3.0 ██████ ██ █████ |
FCP > 250 mcg | 33.9 █████ ██ █████ |
Baseline CRP | |
CRP ≤ 10 mg/L | 18.6 ████ ██ █████ |
CRP > 10 mg/mL | 35.4 █████ ██ █████ |
Baseline SES-CD score | |
SES-CD total score < 12 | 16.5 ████ ██ █████ |
SES-CD total score ≥ 12 | 35.3 █████ ██ █████ |
AP = abdominal pain; CD = Crohn disease; CDAI = Crohn’s Disease Activity Index; CI = confidence interval; CRP = C-reactive protein; FCP = fecal calprotectin; PRO = patient-reported outcome; SES-CD = Simple Endoscopic Score for Crohn’s Disease; SF = stool frequency; TNF = tumour necrosis factor; vs. = versus.
Source: I6T-MC-AMAM (the VIVID-1 study) Clinical Study Report.68
Mirikizumab Versus Ustekinumab
Table 38: Key Subgroup Analyses for CDAI Clinical Remission at Week 52 (Mirikizumab vs. Ustekinumab) [Redacted]
█████ ██ █████ | █████ ██ █████████ █████ |
|---|---|
██ ███████ ███████ ███████ █████ | |
█████ ██ █████ | █████ ██ █████ |
█████ ██ ██████████ ██ ██████ | █████ ██ █████ |
█████ ██ █████ | █████ ██ █████ |
██ ███████ ███████ ███████ ███████ ███████ ███████ █ | |
█████ ██ █████ | █████ ██ █████ |
█████ ██ ██████████ ██ ██████ | █████ ██ █████ |
█████ ██ █████ | █████ ██ █████ |
Source: I6T-MC-AMAM (the VIVID-1 study) Clinical Study Report29
Table 39: Key Subgroup Analyses for SES-CD Endoscopic Response at Week 52 (Mirikizumab vs. Ustekinumab) [Redacted]
█████ ██ █████ | █████ ██ █████████ ████████ ██ █ |
|---|---|
██ ███████ ███████ ███████ ███████ ███████ ███████ ███████ █████ | |
█████ ██ █████ | █████ ██ █████ |
█████ ██ ██████████ ██ ██████ | █████ ██ █████ |
█████ ██ █████ | █████ ██ █████ |
██ ███████ ███████ ███████ ███████ ███████ ███████ ██ | |
█████ ██ █████ | █████ ██ █████ |
█████ ██ ██████████ ██ ██████ | █████ ██ █████ |
█████ ██ █████ | █████ ██ █████ |
vs. = versus.
Source: I6T-MC-AMAM (the VIVID-1 study) Clinical Study Report.29
Pharmacoeconomic Review
Abbreviations
BIA
budget impact analysis
BF
biologic treatment failure
CCF
conventional care treatment failure
CD
Crohn disease
CDA-AMC
Canada’s Drug Agency
NMA
network meta-analysis
QALY
quality-adjusted life-year
Economic Review
The objective of the economic review is to review and critically appraise the pharmacoeconomic evidence submitted by the sponsor on the cost-effectiveness and budget impact of mirikizumab compared to other biologics for the treatment of adult patients with moderately to severely active Crohn disease (CD) who have had an inadequate response, loss of response, or intolerance to either conventional therapy or a biologic treatment. Specifically, the population evaluated in the submitted model consisted of 2 distinct subgroups: patients who had experienced conventional care treatment failure (CCF) and patients who had experienced biologic treatment failure (BF).
Item | Description |
|---|---|
Drug product | Mirikizumab (Omvoh) 300 mg/15 mL, solution for IV infusion after dilution in a vial Mirikizumab (Omvoh), 100 mg/1 mL, 200 mg/2 mL, solution for SC injection in a prefilled pen or syringe |
Indication | For the treatment of adult patients with moderately to severely active Crohn’s disease who have had an inadequate response, loss of response, or were intolerant to either conventional therapy or a biologic treatment |
Submitted price | $2,536.14 per carton containing one 100 mg/1 mL and one 200 mg/2 mL prefilled pen or prefilled syringe for SC injection $2,536.14 per 300 mg/15 mL vial for IV infusion |
Health Canada approval status | NOC |
Health Canada review pathway | Standard |
NOC date | July 8, 2025 |
Reimbursement request | Per indication |
Sponsor | Eli Lilly Canada Inc. |
Submission history | Previously reviewed: Yes Indication: For the treatment of adult patients with moderately to severely active ulcerative colitis who have had an inadequate response with, lost response to, or were intolerant to either conventional therapy, a biologic treatment, or a JAK inhibitor Recommendation date: November 16, 2023 Recommendation: Reimburse with clinical criteria and/or conditions |
JAK = Janus kinase; NOC = Notice of Compliance; SC = subcutaneous.
Pagebreak
Key Messages
Mirikizumab is available as a solution for injection (100 mg/mL and 200 mg/2 mL) and as a solution for infusion (20 mg/mL).1 At the submitted price of $2,536.14 per 300 mg (either as a single vial for infusion or as a carton of prefilled syringes or prefilled pens), the annual cost of mirikizumab is expected to be $50,773 per patient in the first year of treatment and $33,083 per patient in subsequent years, based on the Health Canada–recommended dosage.
Clinical efficacy in the economic analysis was derived from a sponsor-submitted network meta-analysis (NMA), with the efficacy of mirikizumab informed by the VIVID-1 trial. The indirect evidence submitted by the sponsor was insufficient to show a difference between mirikizumab and relevant comparators. Due to the significant limitations associated with the NMA (e.g., risk of bias, important clinical and methodological heterogeneity, and imprecision), no definite conclusion can be drawn regarding the efficacy and safety of mirikizumab versus existing comparators for the treatment of patients with moderately to severely active CD who have had prior CCF or BF (refer to the Clinical Review Report by Canada’s Drug Agency [CDA-AMC]).
CDA-AMC estimates that the budget impact of reimbursing mirikizumab for the treatment of adult patients with moderately to severely active CD who have had an inadequate response, loss of response, or intolerance to either conventional therapy or a biologic treatment will be approximately $50.3 million over the first 3 years of reimbursement compared to the amount currently spent on biologics, with an estimated expenditure of $120 million on mirikizumab over this period. The actual budget impact of reimbursing mirikizumab will depend on the number of people eligible for treatment and the uptake of mirikizumab.
Given that the sponsor-submitted indirect evidence suggests that there may be no difference between mirikizumab versus other biologics currently available for the treatment of adult patients with moderately to severely active CD who have had prior CCF or BF, there is insufficient evidence to suggest that mirikizumab should be priced higher than any other biologics for moderately to severely active CD. Thus, to ensure cost-effectiveness, mirikizumab should be priced no higher than the lowest-cost biologic that is funded for the treatment of adult patients with moderately to severely active CD.
Summary of the Submitted Economic Evaluation
In the sponsor’s base case for the CCF subgroup, mirikizumab was associated with an incremental cost of $123,456 and 0.01 incremental quality-adjusted life-years (QALYs) relative to infliximab biosimilars. This resulted in an incremental cost-effectiveness ratio of $39,929,117 per QALY gained. In the sponsor’s base case for the subgroup of patients who have experienced BF, mirikizumab was associated with an incremental cost of $45,035 and 0.03 incremental QALYs relative to upadacitinib. This resulted in an incremental cost-effectiveness ratio of $1,412,737 per QALY gained. Additional information about the sponsor’s submission is summarized in Appendix 3.
CDA-AMC identified several key issues with the sponsor’s analysis (refer to Table 2; full details are provided in Appendix 4).
Table 2: Key Issues With the Sponsor’s Economic Submission
Issue | What evidence is there to inform this issue? | How was this issue addressed by CDA-AMC? | Did CDA-AMC explore uncertainty in a scenario analysis? |
|---|---|---|---|
The comparative effectiveness and safety of mirikizumab relative to other available biologics is uncertain. | There is limited head-to-head evidence comparing mirikizumab to other biologics available for the treatment of patients with moderately to severely active CD who have had an inadequate response, loss of response, or intolerance to either conventional therapy or a biologic treatment, with the exception of ustekinumab. The results of the sponsor’s submitted NMA suggest that no definite conclusions can be drawn regarding the comparative efficacy of mirikizumab vs. existing comparators. | This issue could not be addressed. Given limitations with the sponsor’s NMA, it is uncertain whether mirikizumab provides a clinical benefit beyond that of any of the currently available biologics for the treatment of patients with moderately to severely active CD who have had an inadequate response, loss of response, or intolerance to either conventional therapy or a biologic treatment. | No scenario analysis was conducted because of the lack of more robust clinical data. |
Data were unavailable for certain comparators in the CCF and BF subgroups. | The NMA did not include clinical remission, nonremission response, or enhanced clinical response evidence for infliximab IV or infliximab IV or SC as comparators in the BF subgroup. Similarly, data on enhanced clinical response and nonremission response were unavailable for upadacitinib as a comparator in the CCF subgroup. The clinical expert feedback obtained by CDA-AMC highlighted that the comparators would be the same for both subgroups; this resulted in uncertainty. | This issue could not be addressed. | No scenario analysis was conducted. |
BF = biologic treatment failure; CCF = conventional care treatment failure; CDA-AMC = Canada’s Drug Agency; CD = Crohn disease; NMA = network meta-analysis; SC = subcutaneous; vs. = versus.
Note: Full details regarding the issues identified by CDA-AMC are provided in Appendix 3.
CDA-AMC Assessment of Cost-Effectiveness
Based on the CDA-AMC clinical review of the VIVID trials, the available evidence suggests that treatment with mirikizumab likely results in little to no difference in composite clinical and endoscopic outcomes when compared to ustekinumab. Owing to the limitations of the NMA relating to heterogeneity across studies and imprecision in the treatment-effect estimates, no definitive conclusions could be drawn regarding the efficacy and safety of mirikizumab compared to other biologics for the treatment of patients with moderately to severely active CD who have had an inadequate response, loss of response, or intolerance to either conventional therapy or a biologic treatment. As such, no reanalyses were performed.
Summary of the Budget Impact Analysis
The sponsor submitted a budget impact analysis (BIA) to estimate the 3-year (2026 to 2028) budget impact of reimbursing mirikizumab for the treatment of adult patients with moderately to severely active CD who have had an inadequate response, loss of response, or intolerance to either conventional therapy or a biologic treatment. The sponsor assumed that the payers would be CDA-AMC–participating public drug plans and derived the size of the eligible population using an epidemiologic approach. The price of mirikizumab was aligned with the price included in the sponsor’s economic evaluation, while the prices of comparators were based on the publicly available list prices. Additional information pertaining to the sponsor’s submission is provided in Appendix 5.
CDA-AMC identified a number of issues with the sponsor’s estimated budget impact and made changes to model parameters and assumptions in consultation with clinical experts to derive the CDA-AMC base case (Appendix 5). CDA-AMC estimated that 63,408 patients would be eligible for treatment with mirikizumab over a 3-year period (year 1 = 20,609; year 2 = 21,131; year 3 = 21,667). The estimated incremental budget impact of reimbursing mirikizumab is predicted to be approximately $50.3 million over the first 3 years, with an expected expenditure of $120 million. The actual budget impact of reimbursing mirikizumab will depend on the number of people eligible for treatment and the uptake of mirikizumab.
Conclusion
Based on a clinical review of the VIVID trials, CDA-AMC found that mirikizumab likely results in little to no difference in composite clinical and endoscopic outcomes compared to ustekinumab. Evidence from the sponsor-submitted NMA was insufficient to show a difference in the efficacy of mirikizumab compared with currently available treatments. Given the uncertainty in the comparative clinical evidence, there is insufficient evidence to suggest that mirikizumab should be priced higher than other biologics available for the treatment of adult patients with moderately to severely active CD who have had an inadequate response, loss of response, or intolerance to either conventional therapy or a biologic treatment.
The budget impact of reimbursing mirikizumab to the public drug plans in the first 3 years is estimated to be approximately $50.3 million. The 3-year expenditure on mirikizumab (i.e., not accounting for current expenditure on comparators) is estimated to be $120 million. The actual budget impact of reimbursing mirikizumab will depend on the number of people eligible for treatment and the uptake of mirikizumab.
References
1.Eli Lilly Canada Inc. OMVOH (mirikizumab): 100 mg / mL solution for subcutaneous injection; 200 mg / 2 mL solution for subcutaneous injection; 20 mg / mL solution for intravenous infusion [product monograph]. July 20, 2023. Updated March 1, 2025.
2.Ontario Ministry of Health. Ontario drug benefit formulary/comparative drug index. Accessed March 1, 2025. https://www.formulary.health.gov.on.ca/formulary/
3.Eli Lilly Canada Inc. Pharmacoeconomic evaluation [internal sponsor's report]. In: Drug Reimbursement Review sponsor submission: OMVOH (mirikizumab), 100 mg / mL solution for subcutaneous injection; 200 mg / 2 mL solution for subcutaneous injection; 20 mg / mL solution for intravenous infusion. March 4, 2025.
4.Ontario Ministry of Health. Exceptional Access Program (EAP). Accessed March 1, 2025. http://www.health.gov.on.ca/en/pro/programs/drugs/odbf/odbf_except_access.aspx
5.Government of Saskatchewan. Saskatchewan Drug Plan: search formulary. 2024. Accessed March 1, 2025. http://formulary.drugplan.ehealthsask.ca/SearchFormulary
6.Royal College of Physicians. National clinical audit of biological therapies. UK Inflammatory Bowel Disease (IBD) audit. 2016. Accessed July 6, 2020. http://ukclinicalpharmacy.org/wp-content/uploads/2017/07/National-clinical-audit-IBD-2016.pdf
7.IQVIA. DeltaPA [sponsor supplied reference]. https://www.iqvia.com/locations/canada/library/fact-sheets/iqvia-deltapa
8.Tam VC, Ko YJ, Mittmann N, et al. Cost-effectiveness of systemic therapies for metastatic pancreatic cancer. Curr Oncol. 2013;20(2):e90-e106. doi: 10.3747/co.20.1223 PubMed
9.Ontario Ministry of Health. Schedule of Benefits Physician Services Under the Health Insurance Act [sponsor supplied reference]. 2024. https://www.ontario.ca/files/2024-08/moh-schedule-benefit-2024-08-30.pdf
10.Government of Canada. Registered Nurse (R.N.) in Canada | Wages - Job Bank [sponsor supplied reference]. 2024. https://www.jobbank.gc.ca/marketreport/wages-occupation/993/CA
11.Hale I. Add to cart? [sponsor supplied reference]. Can Fam Physician. 2015;61(11):937-9. https://www.ncbi.nlm.nih.gov/pubmed/26564649 PubMed
12.Lagerquist O, Poseluzny D, Werstiuk G, et al. The cost of transfusing a unit of red blood cells: a costing model for Canadian hospital use. ISBT Science Series. 2017;12(3):375-380. doi: 10.1111/voxs.12355
13.CADTH. Canadian Medical Imaging Inventory: Private Imaging Facilities in Canada: MRI and CT [sponsor supplied reference]. 2022. https://www.cda-amc.ca/sites/default/files/attachments/2022-06/CMII-MRI-CT-Final_3.pdf
14.Palimaka S, Blackhouse G, Goeree R. Capsule Endoscopy in the Assessment of Obscure Gastrointestinal Bleeding: An Economic Analysis [sponsor supplied reference]. Ont Health Technol Assess Ser. 2015;15(2):1-32. https://www.ncbi.nlm.nih.gov/pubmed/26355732 PubMed
15.Coward S, Heitman SJ, Clement F, et al. Ulcerative colitis-associated hospitalization costs: a population-based study. Can J Gastroenterol Hepatol. 2015;29(7):357-62. doi: 10.1155/2015/627370 PubMed
16.Ontario Drug Benefit Formulary/Comparative Drug Index [sponsor supplied reference]. https://www.formulary.health.gov.on.ca/formulary/
17.Government of Ontario. Enteral feeding and ostomy [sponsor supplied reference]. https://www.ontario.ca/page/enteral-feeding-and-ostomy
18.Fenu E, Lukyanov V, Acs A, et al. Cost Effectiveness of Subcutaneous Vedolizumab for Maintenance Treatment of Ulcerative Colitis in Canada. Pharmacoecon Open. 2022;6(4):519-537. doi: 10.1007/s41669-022-00331-9 PubMed
19.Costa S, Scott DW, Steidl C, Peacock SJ, Regier DA. Real-world costing analysis for diffuse large B-cell lymphoma in British Columbia. Curr Oncol. 2019;26(2):108-113. doi: 10.3747/co.26.4565 PubMed
20.Guanella R, Ducruet T, Johri M, et al. Economic burden and cost determinants of deep vein thrombosis during 2 years following diagnosis: a prospective evaluation. J Thromb Haemost. 2011;9(12):2397-405. doi: 10.1111/j.1538-7836.2011.04516.x PubMed
21.CDA-AMC. Reimbursement review: guselkumab. 2025. Accessed May 30 2025. https://www.cda-amc.ca/guselkumab-2
22.Statistics Canada. Population Estimates [sponsor supplied reference]. Accessed November 2024. https://www150.statcan.gc.ca/t1/tbl1/en/tv.action?pid=1710000901
23.Benchimol EI, Bernstein CN, Bitton A, et al. The Impact of Inflammatory Bowel Disease in Canada 2018: A Scientific Report from the Canadian Gastro-Intestinal Epidemiology Consortium to Crohn's and Colitis Canada. J Can Assoc Gastroenterol. 2019;2(Suppl 1):S1-S5. doi: 10.1093/jcag/gwy052 PubMed
24.Coward S, Benchimol EI, Kuenzig ME, et al. The 2023 Impact of Inflammatory Bowel Disease in Canada: Epidemiology of IBD. J Can Assoc Gastroenterol. 2023;6(Suppl 2):S9-S15. doi: 10.1093/jcag/gwad004 PubMed
25.Crohn's and Colitis Canada. 2023 Impact of Inflammatory Bowel Disease in Canada - Key Report Findings. 2023. Accessed January 8, 2025. https://crohnsandcolitis.ca/Crohns_and_Colitis/documents/reports/2023-IBD-InfoBrochure-ENG-v1.pdf
26.CADTH Reimbursement Review: Upadacitinib (Rinvoq). Can J Health Technol. 2024;4(3). doi:10.51731/cjht.2024.856
27.Sutherland, et al. The Conference Board of Canada: Understanding the Gap. A Pan-Canadian Analysis of Prescription Drug Insurance Coverage [sponsor supplied reference]. 2017.
28.Coward S, Benchimol EI, Bernstein CN, et al. Forecasting the Incidence and Prevalence of Inflammatory Bowel Disease: A Canadian Nationwide Analysis. Am J Gastroenterol. 2024;119(8):1563-1570. doi: 10.14309/ajg.0000000000002687 PubMed
29.Sutherland G, Dihn T. Understanding the gap: a pan-Canadian analysis of prescription drug insurance coverage. The Conference Board of Canada; 2017. Accessed May 1, 2025. https://www.conferenceboard.ca/e-library/abstract.aspx?did=9326
Appendix 1: Cost Comparison Table
Please note that this appendix has not been copy-edited.
The comparators presented in the following table have been deemed to be appropriate based on feedback from clinical experts and CDA-AMC–participating public drug plans. Comparators may be recommended (appropriate) practice or actual practice. Existing Product Listing Agreements are not reflected in the table and as such, the table may not represent the actual costs to public drug plans
Table 3: Cost Comparison for CD
Treatment | Strength and/or concentration | Form | Price ($) | Recommended dosage | Daily cost ($) | Annual cost ($) |
|---|---|---|---|---|---|---|
Mirikizumab (Omvoh) | 100 mg/ mL 200 mg/ 2 mL | Pen or prefilled syringe for SC injection | 2,536.1400a | Induction: 900 mg at week 0, 4, and 8 by IV infusion Maintenance: 300 mg every 4 weeks starting at week 12 by SC injection | Year 1: 138.87 Year 2+: 90.58 | Year 1: 50,773 Year 2+: 33,083 |
300 mg/ 15 mL | Vial for IV infusion | |||||
TNF-alpha inhibitors | ||||||
Adalimumab (Humira) | 40 mg/ 0.8 mL 20 mg/ 0.2 mL | Pen or prefilled syringe for SC injection | 794.1000b 397.0500b | Induction: 160 mg at week 0, followed by 80 mg at week 2 by SC infusion Maintenance: 40 mg every other week beginning at week 4 | Year 1: 65.42 Year 2+: 56.72 | Year 1: 23,894 Year 2+: 20,718 |
Adalimumab (biosimilar) | 20 mg/ 0.2 mL 40 mg/ 0.4 mL 40 mg/ 0.8 mL 80 mg/ 0.8 mL | Pen or prefilled syringe for SC injection | 235.6350 471.2700 471.2700 942.5400 | Year 1: 38.82 Year 2+: 33.66 | Year 1: 14,180 Year 2+: 12,295 | |
Infliximab (Remicade) | 100 mg | Vial for IV infusion | 987.5600b | Induction: 5 mg/kg at Weeks 0, 2, and 6 Maintenance: 5 mg/kg every 8 weeks thereafter | Year 1: 84.06 Year 2+: 70.54 | Year 1: 30,703 Year 2+: 25,765 |
Infliximab biosimilar (Inflectra) | 100 mg | Vial Powder for IV infusion | 525.0000 | Year 1: 44.69 Year 2+: 37.50 | Year 1: 16,322 Year 2+: 13,697 | |
Infliximab biosimilars (Renflexis or Avsola) | 100 mg | Vial Powder for IV infusion | 493.0000 | Year 1: 41.96 Year 2+: 35.21 | Year 1: 15,327 Year 2+: 12,862 | |
IL-23 Inhibitors | ||||||
Risankizumab (Skyrizi) | 360 mg/ 2.4 mL | Vial for SC Injection | 4,593.1400b | Induction: 600 mg by IV infusion at Weeks 0, 4, and 8 Maintenance: 360 mg administered by SC injection at week 12, and every 8 weeks thereafter | Year 1: 113.18 Year 2+: 82.02 | Year 1: 41,338 Year 2+: 29,958 |
600 mg/ 10 mL | IV injection | |||||
JAK inhibitor | ||||||
Upadacitinib (Rinvoq) | 15 mg 30 mg 45 mg | Extended-release tablet | 51.6810 76.9600 101.8100 | Induction: 45 mg once daily for 12 weeks Maintenance: 15 mg or 30 mg once daily based on patient presentation | Year 1: 63.21 to 82.67 Year 2+: 51.68 to 76.96 | Year 1: 23,087 to 30,197 Year 2+: 18,876 to 28,110 |
IL 12/23 inhibitors | ||||||
Ustekinumab (Stelara) | 45 mg/ 0.5 mL 90 mg/ 1.0 mL | Prefilled syringe or vial for SC injection | 4,593.1400 4,593.1400 | Induction: 6 mg/kg IV at week 0 Maintenance: 90 mg SC every 8 weeks thereafter | Year 1: 92.22 Year 2+: 82.02 | Year 1: 33,685 Year 2+: 29,958 |
130 mg/ 26 mL | Vial for IV infusion | 2,080.0000c | ||||
Ustekinumab (biosimilar [Wezlana]) | 45 mg/ 0.5 mL 90 mg/ 1.0 mL | Prefilled syringe or vial for SC injection | 2,755.8840 2,755.8840 | Year 1: 55.33 Year 2+: 49.21 | Year 1: 20,211 Year 2+: 17,975 | |
130 mg/ 26 mL | Vial for IV infusion | 1,248.0000 | ||||
Alpha4Beta7 integrin antagonists | ||||||
Vedolizumab (Entyvio) | 300 mg | Vial for IV infusion | 3,711.2500b | Induction: 300 mg by IV infusion at Weeks 0, 2, and 6 Maintenance: 300 mg by IV infusion every 8 weeks thereafter | Year 1: 78.97 Year 2+: 66.27 | Year 1: 28,845 Year 2+: 24,206 |
108 mg/ 68 mL | Prefilled syringe or vial for SC injection | 927.8050b | Induction: 300 mg by IV infusion at Weeks 0, 2, and 6 Maintenance: 108 mg SC every 2 weeks thereafter | Year 1: 85.51 Year 2+: 66.27 | Year 1: 29,773 Year 2+: 24,206 | |
JAK = Janus kinas; IL = interleukin; SC = subcutaneous; TNF = tumour necrosis factor.
Notes: All prices are from the Ontario Drug Benefit Formulary (accessed March 2025),2 unless otherwise indicated, and do not include dispensing fees. Recommended dosing as per respective product monograph. Assumes 365.25 days and an average patient weight of 69 kg.
aSponsor-submitted price.3 Mirikizumab comes in a carton containing 1 100 mg/ mL prefilled pen or syringe and 1 200 mg/ mL prefilled pen or syringe.
bOntario Exceptional Access Program.4
cSaskatchewan Drug Plan formulary.5
Appendix 2: Input Relevant to the Economic Review
Please note that this appendix has not been copy-edited.
This section is a summary of the input received from the patient groups, clinician groups, and drug plans that participated in the CDA-AMC review process.
Patient input was received from the Canadian Digestive Health Foundations, Gastrointestinal Society, and Crohn and Colitis Canada. Input was collected from patients living in Canada with irritable bowel disease, including some with CD, through a series of surveys. Patients reported that CD significantly affects all aspects of life — physical, emotional, and social well-being. Despite the availability of various treatments, both conventional and biologic, an unmet need persists, given that many patients struggle to achieve remission or adequate symptom relief. Patient input noted the need for greater access to treatment options, with a preference for therapies that are easy to administer, noninvasive, have minimal side effects, and enhance daily functioning. None of the respondents had prior experience with mirikizumab for CD.
Clinician group input was not received for this review.
Input from CDA-AMC-participating drug plans noted that while VIVD-1 compared mirikizumab with placebo and ustekinumab, risankizumab is a more relevant comparator. The plans questioned what the appropriate time frame for assessment of response to treatment would be and recommended the initiation criteria align between jurisdictions. The drug plans questioned if there is a potential for dose escalation in mirikizumab. Lastly, the plans noted that the submitted economic analysis and BIA only considered public list prices of comparators.
Appendix 3: Summary of the Sponsor’s Submission
Please note that this appendix has not been copy-edited.
Summary of the Sponsor’s Economic Evaluation
For the pharmaceutical reviews program, clinical and economic information is submitted to CDA-AMC by the sponsor. The CDA-AMC health economics team reviews the submitted economic information and appraises the information in collaboration with clinical experts and the clinical review team to evaluate key assumptions, influential parameters, and the overall rigour of the economic submission. Based on what the team learns through this process, adjustments may be made to the sponsor’s model to produce the CDA-AMC base case. The CDA-AMC base case represents the team’s current understanding of the clinical condition, clinical evidence currently available, and best interpretation of the economic evidence based on the information provided.
For the review of mirikizumab, the sponsor provided a cost-utility analysis and a BIA. The sponsor’s economic submission is summarized in Table 4.
Table 4: Key Components of the Sponsor’s Economic Evaluation
Component | Description |
|---|---|
Treatment information | |
Drug under review | Mirikizumab (Omvoh), IV solution (20 mg/mL) and subcutaneous (SC) solution (100 mg/mL, 200 mg/2 mL) |
Submitted price of drug under review | $2,536.14 per carton containing one 100 mg / 1 mL and one 200 mg / 2 mL prefilled pens or prefilled syringes for SC injection $2,536.14 per 300 mg / 15 mL vial for IV infusion |
Regimen | Induction: 900 mg IV at week 0, 4, and 8 Maintenance: 300 mg SC every 4 weeks |
Cost of drug under review | Induction: $22,825 per patient (8 weeks) Maintenance: $33,083 per patient per year |
Model information | |
Type of economic evaluation | Cost-utility analysis Decision tree + Markov model |
Treatment | Mirikizumab |
Included comparator |
|
Perspective | Publicly funded health care payer perspective |
Time horizon | Lifetime (64 years) |
Cycle length | Decision tree: Not applicable Markov model: 2 weeks |
Modelled populations | Adult patients with moderately to severely active CD who have had an inadequate response, loss of response, or were intolerant to either conventional therapy (CCF subgroup) or a biologic treatment (BF subgroup) |
Characteristics of modelled population | Derived from the VIVID-1 clinical trial CCF subgroup: mean age of 36.6 years, 54.6% male, mean weight of 69.3 kg BF subgroup: mean age of 35.8 years, 55.7% male, mean weight of 66.6 kg |
Model health states | Decision Tree:
|
Data sources | |
Comparative efficacy |
|
Natural history and/or clinical pathway |
|
Health-related utilities and disutilities |
|
Costs included in the model |
|
Summary of the submitted results | |
Base-case results |
|
AE = adverse event; BF = biologic treatment failure; CCF = conventional care treatment failure; CD = Crohn disease; CIHI = Canadian Institute for Health Information; ER = emergency department; IBD = irritable bowel disease; ICER = incremental cost-effectiveness ratio; QALY = quality-adjusted life-year.
Model Structure
The sponsor submitted a model composed of a decision tree (representing the induction phase; Figure 1) and Markov model (representing the maintenance phase and surgery; Figure 2).3 Extended induction was not considered for any treatment in the model. Patients entered the decision tree and were distributed across 4 health states (“remission,” “response without remission,” “no response,” and “death.” At the end of the decision tree, patients entered the Markov model in the corresponding health state. Patients who respond to treatment and achieve remission during induction is defined as a decrease in CDAI of at least 100 points from baseline. Remission is defined as a CDAI of less than 150. Patients that do not achieve a response were modelled to switch to best supportive care (BSC).3
The Markov model included 5 health states (“remission,” “mild,” “moderate to severe,” “surgery,” and “death”). At the end of the induction phase, patients that achieve remission start maintenance in the “remission” health state, and patients who achieved response without remission start maintenance in the “mild” or “moderate to severe” health states. This distribution is derived from the VIVID-1 trial and literature.3 Patients who experienced a loss of response on advanced therapy were modelled to receive BSC. Patients transition between disease severity health states according to the assigned transition probabilities. Patients in the “moderate to severe” health state could remain, transition to “remission” or “mild,” or could transition to surgery. While patients are at risk of surgery and death in each cycle, patients may only transition to the “surgery” health state from the “moderate to severe” health state. Patients spend 1 cycle (2 weeks) in surgery and then transition to any of the other states. At any point, patients could experience death.
Figure 1: Model Structure (Decision Tree)
![Patients entered the decision tree and were then distributed across 4 health states (i.e., remission [CDAI < 150], response without remission [CDAI > 150], no response, or death). At the end of the decision tree (i.e., completion of the induction phase), patients entered the Markov model in the corresponding health state.](https://canjhealthtechnol.ca/index.php/cjht/article/download/SR0880r/version/1339/3028/11645/SR0880-Pharmacoeconomic_Review-fig01.png)
CDAI = Crohn Disease Activity Index; nr-response = nonremission response
Source: Sponsor’s pharmacoeconomic submission.3
Figure 2: Model Structure (Markov Model)
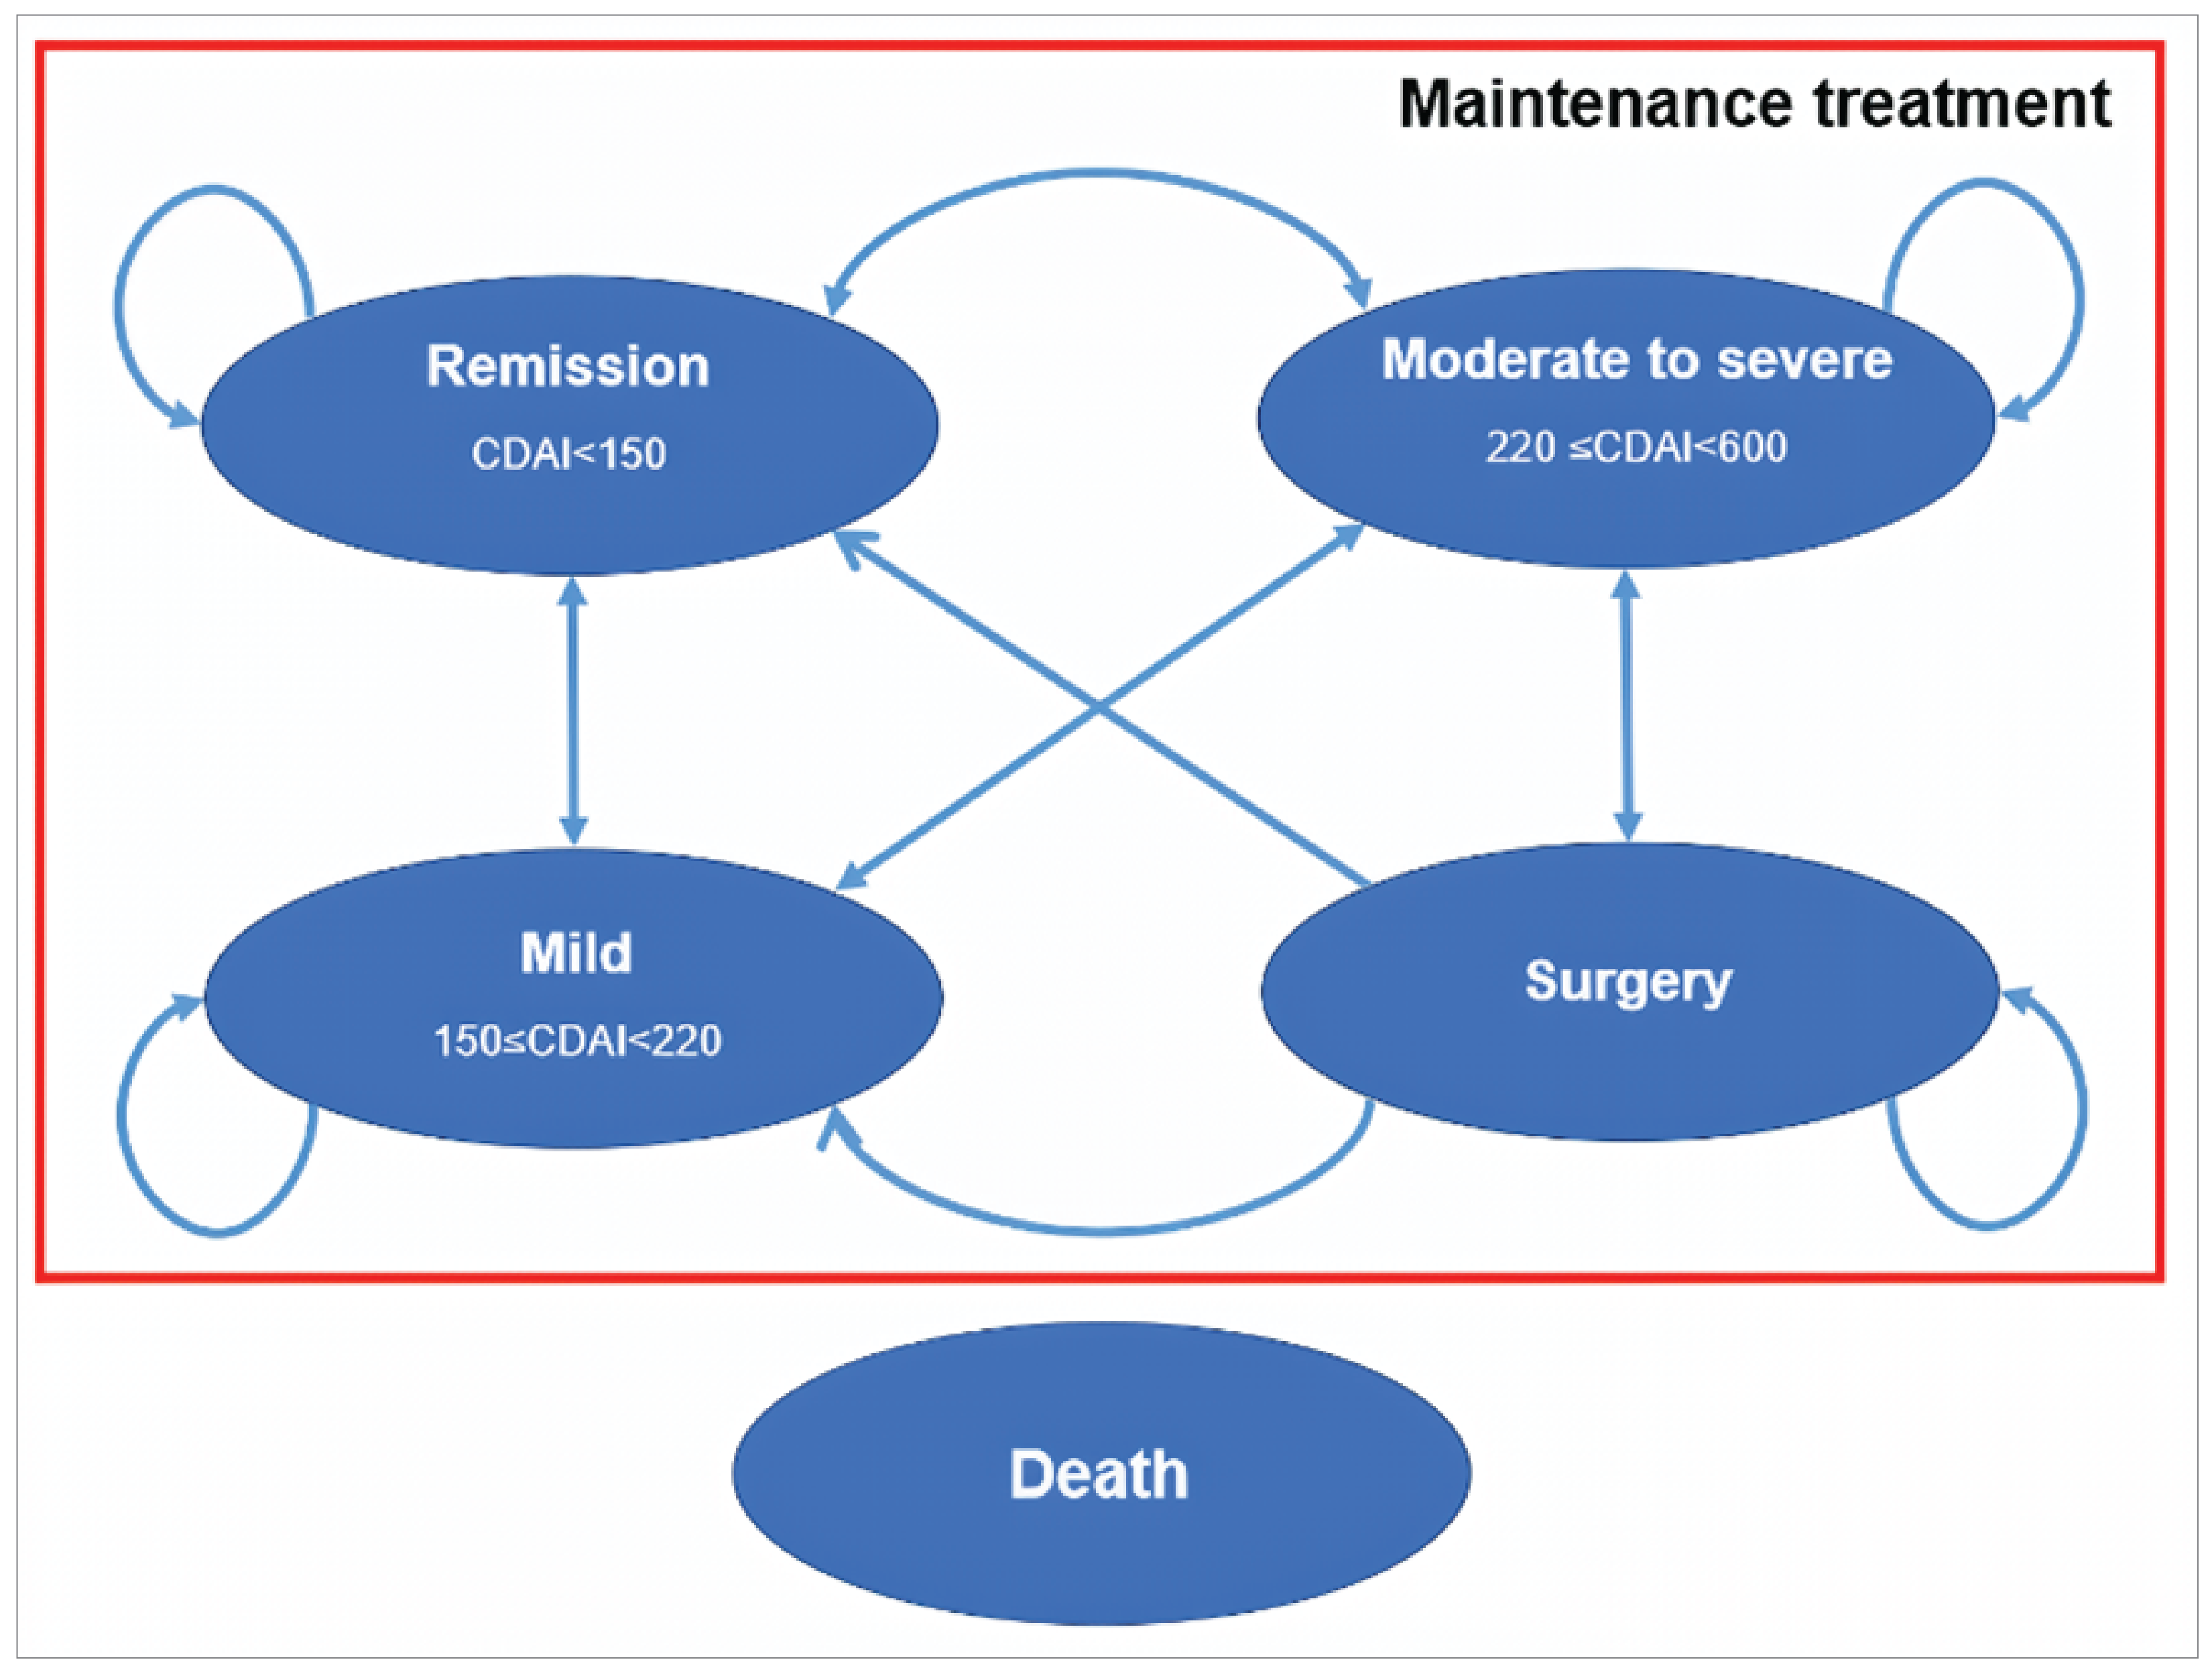
CDAI = Crohn Disease Activity Index.
Source: Sponsor’s pharmacoeconomic submission.3
Appendix 4: Additional Details of the CDA-AMC Reanalyses
Please note that this appendix has not been copy-edited.
Clinical Data in the Economic Model
The CDA-AMC clinical review of the VIVID trials found that mirikizumab likely results in little to no difference in composite clinical and endoscopic outcomes when compared to ustekinumab. However, given the absence of head-to-head evidence comparing mirikizumab to most comparators, the sponsor submitted an NMA to inform comparative effectiveness for various parameters in the economic model including clinical remission and clinical response. Owing to the limitations of the NMA relating to heterogeneity across studies and imprecision in the treatment-effect estimates (refer to the Clinical Review Report), no definitive conclusions can be drawn on meaningful differences in the relative efficacy of mirikizumab compared with other biologics for the treatment of patients with moderately to severely active CD who have had an inadequate response, loss of response, or were intolerant to either conventional therapy or a biologic treatment.
Key Issues of the Submitted Economic Evaluation
CDA-AMC identified the following key issues with the sponsor’s analysis:
The comparative clinical efficacy and safety of mirikizumab relative to other biologics available for the treatment of moderately to severely active CD is uncertain. The results of the VIVID-1 trial suggest that, compared to placebo, mirikizumab demonstrated statistically significant clinically important improvements in both co-primary end points and all major secondary end points. However, when compared to ustekinumab, mirikizumab likely demonstrated little to no difference in composite clinical and endoscopic outcomes. There is a lack of head-to-head evidence comparing mirikizumab to other advanced biologics currently available for the treatment of moderately to severely active CD in patients who have had an inadequate response, loss of response, or were intolerant to either conventional therapy or a biologic treatment. In the absence of head-to-head evidence for most comparators, the sponsor conducted an NMA to inform comparative efficacy within the economic model. Evidence from the NMA was insufficient to show a difference between mirikizumab and relevant comparators due to the significant limitations associated with the NMA. Therefore, no definite conclusion can be drawn on the comparable efficacy and safety of mirikizumab versus existing comparators
Due to the lack of direct comparative evidence for mirikizumab and most comparators, along with limitations with the sponsor’s submitted NMA, it is uncertain if mirikizumab provides a net benefit beyond that of any of the currently available treatments of adult patients with moderately to severely active CD who have had an inadequate response, loss of response, or were intolerant to either conventional therapy or a biologic treatment.
Missing comparators in the CCF and BF subgroups. In the sponsor-submitted model, infliximab (IV and IV/SC) could not be included as a comparator in the BF subgroup and upadacitinib was not included as a comparator in the CCF subgroup due to missing data from the NMA. The NMA did not investigate comparative clinical remission, nonremission response or enhanced clinical response evidence for infliximab IV or infliximab IV/SC as comparators in the BF subgroup. Similarly, data on enhanced clinical response and nonremission response was unavailable for upadacitinib as a comparator in the CCF subgroup. Clinical expert feedback obtained by CDA-AMC highlighted that comparators would be the same for both subgroups, resulting in uncertainty.
CDA-AMC was unable to address this limitation.
Issues for Consideration
Guselkumab is currently under review at CDA-AMC for the treatment of adult patients with moderately to severely active CD.21 The cost-effectiveness of mirikizumab compared to guselkumab for this patient population is unknown.
The sponsor’s analysis relies on publicly accessible list prices and do not reflect existing confidential prices negotiated by public drug plans. Given many comparators have successfully undergone price negotiations for the treatment of moderately to severely active CD, it is likely that current unit costs paid by the public drugs plans are lower than the public list price.
Appendix 5: Budget Impact Analysis
Please note that this appendix has not been copy-edited.
Summary of the Submitted BIA
The sponsor submitted a BIA that estimated the expected incremental budgetary impact of reimbursing mirikizumab for the treatment of adult patients with moderately to severely active CD who have had an inadequate response, loss of response, or were intolerant to either conventional therapy or a biologic treatment.
The BIA was conducted from the perspective of public drug plan payers over a 3-year time horizon (2026 to 2028), with 2025 as the base year. The sponsor’s estimate reflects the aggregated results from the jurisdictional provincial budgets (excluding Quebec) as well as the Non-Insured Health Benefits Program. The sponsor estimated the eligible population using an epidemiological approach. The sponsor’s base case included drug acquisition costs. The market uptake for mirikizumab was estimated using Eli Lilly internal forecast estimates. The key inputs to the BIA are documented in Table 5.
The sponsor estimated the 3-year incremental budgetary impact associated with reimbursing mirikizumab would be $55,859,007 (year 1 = $10,966,336; year 2 = $24,088,178; year 3 = $20,804,493).
Parameter | Sponsor’s estimate (reported as year 1 / year 2 / year 3 if appropriate) | |
|---|---|---|
Target population | ||
Estimated population of Canada in 2024 | 32,256,74922 | |
% of adults | 82%22 | |
Prevalence of CD | ||
% of patients with moderate to severe disease | 40.4%26 | |
% of patients for whom conventional therapy failed | 70%26 | |
% eligible for public coverage | 39%27 | |
Number of patients eligible for drug under review | 22,879 / 23,459 / 24,054 | |
Market shares (reference scenario) | ||
Mirikizumab | ███% / ███% / ███% | |
Risankizumab | ███% / ███% / ███% | |
Upadacitinib | ███% / ███% / ███% | |
Vedolizumab | ███% / ███% / ███% | |
Ustekinumab | ███% / ███% / ███% | |
Infliximab | ███% / ███% / ███% | |
Adalimumab | ███% / ███% / ███% | |
Market shares (new drug scenario) | ||
Mirikizumab | ███% / ███% / ███% | |
Risankizumab | ███% / ███% / ███% | |
Upadacitinib | ███% / ███% / ███% | |
Vedolizumab | ███% / ███% / ███% | |
Ustekinumab | ███% / ███% / ███% | |
Infliximab | ███% / ███% / ███% | |
Adalimumab | ███% / ███% / ███% | |
Cost of treatment (per patient per year) | ||
Year 1 | Year 2+ | |
Mirikizumab | $50,813 | $33,060 |
Risankizumab | $41,420 | $29,937 |
Upadacitinib | $30,178 | $28,090 |
Vedolizumab | $31,739 | $25,576 |
Ustekinumab | $19,939 | $19,130 |
Infliximab | $21,196 | $17,267 |
Adalimumab | $14,962 | $12,618 |
CD = Crohn disease.
Key Issues of the Submitted BIA
CDA-AMC identified several key issues to the sponsor’s analysis that have notable implications on the results of the BIA:
The parameters used to estimate the total eligible population are uncertain. The sponsor estimated that the prevalence of CD in Canada is 0.728%. This value was estimated by forecasting the prevalence of CD in Canada with population growth from the Benchimol study.23 However, as of 2024, the Coward (2024) study found that the nationwide prevalence of CD in Canada was closer to 0.513%.28 Additionally, the sponsor assumed that all patients that were diagnosed with moderate to severe disease would have tried conventional therapy and that of that population, 70% would not have achieved adequate control. The sponsor did not estimate the percentage of patients that would have not been adequately controlled with biologics. Feedback obtained from clinical experts consulted by CDA-AMC noted that this likely underestimated the percentage of patients eligible, given that patients for whom conventional therapy has failed may not obtained better results with biologics. Lastly, the sponsor assumed that 39% of patients would be eligible for public coverage. CDA-AMC notes that the sponsor may have underestimated the proportion of patients eligible for public drug coverage by assuming nobody over the age of 65 would be treated. The rationale for the exclusion of patients aged 65 and older was due to all patients from the VIVID-1 trial falling within the 18 to 64 years old cohort, however, the trial inclusion criteria was for adults aged 18 to 80 years old. This underestimates the total number of eligible patients. Published literature estimates that the proportion of patients eligible for public drug coverage aged 65 and old in Canada to be 98.8%.29
To address the limitations within the sponsor’s eligible patient estimation, CDA-AMC conducted a reanalysis with a prevalence of 0.513% and to include patients aged 65 and older.
The market uptake of mirikizumab is overestimated. In the submitted BIA, the sponsor assumed that mirikizumab would capture ███%, ███%, and ███% of the market over a 3-year time horizon. The sponsor further assumed that mirikizumab would capture majority of its market shares from risankizumab, infliximab, and adalimumab. Clinical expert feedback obtained by CDA-AMC noted that the forecasted market uptake by mirikizumab is likely overestimated and does not align with clinical expectations. The clinical experts indicated that they did not expect the introduction of mirikizumab to shift the treatment paradigm for moderately to severely active CD in clinical practice in Canada considering the other available treatment options. They noted that mirikizumab has the same mechanism of action as other anti-IL23 drugs for CD, such as risankizumab, which would be the preferred first-line option by clinicians. The experts additionally noted that mirikizumab is associated with increased injection frequency with little to no demonstrated difference in terms of comparative efficacy.
The market uptake of mirikizumab is also uncertain due to sponsor’s approach of combining the CCF and BF subgroups and not distinguishing the market uptake between these groups, which are anticipated to be different in clinical practice in Canada. Clinical expert feedback highlighted that patients for whom conventional therapy has previously failed would be more likely to be treated with mirikizumab than patients for whom biologic treatments have previously failed because these patients are less challenging to treat than those with longer disease duration or multiple prior failures of biologic treatments.
CDA-AMC conducted a scenario analysis using a market capture of 0.5%, 1%, and 1.5% for mirikizumab in years 1, 2, and 3, respectively, based on clinical expert feedback.
The market share estimates do not align with clinical expectations. In the sponsor’s submitted BIA, market share estimates were informed by internal market research and did not differentiate between the 2 subgroups (CCF and BF). CDA-AMC obtained clinical expert feedback suggests that the proposed market share estimates in the reference and new drug scenario are likely to be higher for risankizumab and lower for infliximab, and that assuming the same market capture from both subgroups does not align with clinical expectations.
Due to the model structure and lack of distinction between subgroups in the BIA model, CDA-AMC was unable to address this limitation.
The price of drugs paid by public drug plans is uncertain. Both the sponsor’s and CDA-AMC’s analyses are based on publicly available list prices for all comparators. The actual costs paid by public drug plans are unknown.
CDA-AMC was unable to address this limitation.
CDA-AMC Reanalyses of the BIA
CDA-AMC revised the sponsor’s submitted analyses by making changes in model parameter values and assumptions, in consultation with clinical experts, as outlined in Table 5.
Table 6: Revisions to the Submitted BIA
Stepped analysis | Sponsor’s value or assumption | CDA-AMC value or assumption |
|---|---|---|
1. Prevalence of CD | 0.728% | 0.513% |
2. Proportion of adult population aged 65 years and older | 0% | Canadian average: 19% |
CDA-AMC base case | ― | Reanalysis 1 + 2 |
BIA = budget impact analysis; CD = Crohn disease; CDA-AMC = Canada’s Drug Agency.
The results of the CDA-AMC step-wise reanalysis are presented in summary format in Table 7 and a more detailed breakdown is presented in Table 8. In the CDA-AMC base case, the 3-year budget impact of reimbursing mirikizumab for the treatment of adult patients with moderately to severely active CD who have had an inadequate response, loss of response, or were intolerant to either conventional therapy or a biologic treatment was $50,317,214 (year 1 = $9,878,374; year 2 = $21,698,371; year 3 = $18,740,869).
Table 7: Summary of the Stepped Analysis of the CDA-AMC Base Case
Stepped analysis | 3-year total ($) |
|---|---|
Submitted base case | 55,859,007 |
CDA-AMC reanalysis 1 | 39,337,957 |
CDA-AMC reanalysis 2 | 71,449,303 |
CDA-AMC base case (reanalysis 1 + 2): | 50,317,214 |
CDA-AMC = Canada’s Drug Agency.
Note: The CDA-AMC reanalysis is based on publicly available prices of the comparator treatments
CDA-AMC used the CDA-AMC base case to conduct scenario analyses to explore uncertainty in the estimated budget impact of reimbursing mirikizumab. The results are provided in Table 8.
Market uptake of mirikizumab was decreased to 0.5%, 1% and 1.5% in years 1, 2, and 3, respectively, to align with clinical expectations.
Table 8: Disaggregated Summary of the BIA
Stepped analysis | Scenario | Year 0 (current situation) ($) | Year 1 ($) | Year 2 ($) | Year 3 ($) | 3-year total ($) |
|---|---|---|---|---|---|---|
Submitted base case | Reference total | 395,178,387 | 407,368,980 | 422,076,335 | 456,040,096 | 1,285,485,411 |
Mirikizumab | 0 | 0 | 0 | 0 | 0 | |
All other comparators | 395,178,387 | 407,368,980 | 422,076,335 | 456,040,096 | 1,285,485,411 | |
New drug total | 395,178,387 | 418,335,316 | 446,164,513 | 476,844,589 | 1,341,344,418 | |
Mirikizumab | 0 | 23,250,945 | 55,053,870 | 54,929,362 | 133,234,176 | |
All other comparators | 395,178,387 | 395,084,372 | 391,110,642 | 421,915,227 | 1,208,110,241 | |
Budget Impact | 0 | 10,966,336 | 24,088,178 | 20,804,493 | 55,859,007 | |
CDA-AMC base case | Reference total | 355,973,981 | 366,953,999 | 380,201,838 | 410,796,132 | 1,157,951,970 |
Mirikizumab | 0 | 0 | 0 | 0 | 0 | |
All other comparators | 355,973,981 | 366,953,999 | 380,201,838 | 410,796,132 | 1,157,951,970 | |
New drug total | 355,973,981 | 376,832,373 | 401,900,210 | 429,536,601 | 1,208,269,184 | |
Mirikizumab | 0 | 20,944,236 | 49,591,940 | 49,479,792 | 120,015,968 | |
All other comparators | 355,973,981 | 355,888,137 | 352,308,270 | 380,056,809 | 1,088,253,216 | |
Budget Impact | 0 | 9,878,374 | 21,698,371 | 18,740,469 | 50,317,214 | |
CDA-AMC scenario analyses | ||||||
Scenario 1: Market uptake of mirikizumab | Reference total | 355,973,981 | 366,953,999 | 380,201,838 | 410,796,132 | 1,157,951,970 |
New drug total | 355,973,981 | 369,423,592 | 383,980,498 | 415,948,711 | 1,169,352,802 | |
Budget Impact | 0 | 2,469,594 | 3,778,660 | 5,152,579 | 11,400,832 | |
BIA = budget impact analysis; CDA-AMC = Canada’s Drug Agency.
Note: The CDA-AMC reanalysis is based on the publicly available prices of the comparator treatments.
ISSN: 2563-6596
Canada’s Drug Agency (CDA-AMC) is a pan-Canadian health organization. Created and funded by Canada’s federal, provincial, and territorial governments, we’re responsible for driving better coordination, alignment, and public value within Canada’s drug and health technology landscape. We provide Canada’s health system leaders with independent evidence and advice so they can make informed drug, health technology, and health system decisions, and we collaborate with national and international partners to enhance our collective impact.
Disclaimer: CDA-AMC has taken care to ensure that the information in this document was accurate, complete, and up to date when it was published, but does not make any guarantee to that effect. Your use of this information is subject to this disclaimer and the Terms of Use at cda-amc.ca.
The information in this document is made available for informational and educational purposes only and should not be used as a substitute for professional medical advice, the application of clinical judgment in respect of the care of a particular patient, or other professional judgments in any decision-making process. You assume full responsibility for the use of the information and rely on it at your own risk.
CDA-AMC does not endorse any information, drugs, therapies, treatments, products, processes, or services. The views and opinions of third parties published in this document do not necessarily reflect those of CDA-AMC. The copyright and other intellectual property rights in this document are owned by the Canadian Agency for Drugs and Technologies in Health (operating as CDA-AMC) and its licensors.
Questions or requests for information about this report can be directed to Requests@cda-amc.ca.