Drugs, Health Technologies, Health Systems
Reimbursement Review
Pasireotide (Signifor LAR)
Sponsor: Recordati Rare Diseases Canada Inc.
Therapeutic area: Acromegaly, adults
This multi-part report includes:
Clinical Review
Pharmacoeconomic Review
Clinical Review
Abbreviations
AcroQoL
Acromegaly Quality of Life Questionnaire
AE
adverse event
ALT
alanine aminotransferase
ANCOVA
analysis of covariance
AST
aspartate aminotransferase
ATG
autogel
CDA-AMC
Canada's Drug Agency
CI
confidence interval
CMH
Cochran-Mantel-Haenszel
CSEM
Canadian Society of Endocrinology and Metabolism
FAS
full analysis set
GGT
gamma-glutamyl transferase
GH
growth hormone
GRADE
Grading of Recommendations Assessment, Development and Evaluation
IGF-1
insulin-like growth factor 1
ITC
indirect treatment comparison
ITT
intention-to-treat
LAR
long-acting release
LOCF
last observation carried forward
mGH
mean growth hormone
MID
minimal important difference
NICE
National Institute for Health and Care Excellence
OGTT
oral glucose tolerance test
OR
odds ratio
RCT
randomized controlled trial
SAE
serious adverse event
SD
standard deviation
SOC
system organ class
SSA
somatostatin analogue
SSTR
somatostatin receptor
ULN
upper limit of normal
Executive Summary
An overview of the submission details for the drug under review is provided in Table 1.
Table 1: Background Information of Application Submitted for Review
Item | Description |
|---|---|
Drug product | Pasireotide for injectable suspension (Signifor LAR), 40 mg and 60 mg vial; deep intramuscular injection |
Sponsor | Recordati Rare Diseases Canada Inc. |
Indication | For the treatment of adult patients with acromegaly for whom surgery is not an option or has not been curative. |
Reimbursement request | For the treatment of acromegaly in adult patients for whom surgery is not an option or has not been curative and who are inadequately controlled on treatment with a first-generation somatostatin analogue. |
Health Canada approval status | NOC |
Health Canada review pathway | Standard |
NOC date | May 21, 2020 |
Recommended dose | The recommended initial dose of pasireotide for the treatment of acromegaly is 40 mg administered by deep intramuscular injection every 4 weeks. The dose may be increased to a maximum of 60 mg for patients whose GH and/or IGF-1 levels are not fully controlled after 3 months of treatment with pasireotide at 40 mg and who tolerate this dose. Management of suspected adverse reactions or over-response to treatment (age- and sex-adjusted IGF-1 < LLN) may require dose reduction. The dose may be decreased, either temporarily or permanently, by 20 mg decrements. Efficacy should be monitored closely because there are limited data regarding the use of the 20 mg dose. |
GH = growth hormone; IGF-1 = insulin-like growth factor 1; LAR = long-acting release; LLN = lower limit of normal; NOC = Notice of Compliance.
Introduction
Acromegaly is a rare, chronic endocrine disorder caused by excessive growth hormone (GH) secretion, often due to a benign pituitary adenoma, resulting in elevated insulin-like growth factor 1 (IGF-1) levels that stimulate cell proliferation and inhibit cell death.1,2 This hormonal imbalance leads to structural tissue changes and various comorbidities. Although rare, acromegaly has a prevalence of 60 cases per million in Canada, affecting women slightly more than men. In 2024, the Acromegaly Consensus Group introduced guidelines for diagnosis, highlighting that IGF-1 levels greater than 1.3 times the age-adjusted upper limit of normal (ULN) confirm the condition in patients with symptoms, with additional tests such as oral glucose tolerance tests (OGTTs) recommended for ambiguous cases, especially considering factors such as body mass index, diet, and genetic background.3
According to the clinical experts, acromegaly is typically managed through multimodal treatment, including surgery (first line), pharmacotherapy (second line), and adjunctive radiation therapy. The clinical experts noted that small and noninvasive tumours tend to have a high initial remission of more than 80%, albeit with a significant risk of recurrence. There are 2 categories of medical therapy: drugs that reduce GH secretion (dopamine agonists [rarely effective], and somatostatin analogues [SSAs], both first- and second-generation) and GH receptor antagonists such as pegvisomant. The clinical experts added that radiation therapy is used if there is an inoperable tumour and that repeat surgery is an option but is seldom effective. The clinical experts noted that a major unmet need is that 50% of patients do not respond to SSAs, which leads to combination therapy, which can be expensive, depending on the patients’ access to public and/or private reimbursement, and increases the risk of side effects.
The objective of this clinical review report is to review and critically appraise the clinical evidence submitted by the sponsor on the beneficial and harmful effects of pasireotide 40 mg or 60 mg injectable suspension every 4 weeks in the treatment of acromegaly in adult patients for whom surgery is not an option. The focus will be placed on comparing pasireotide to relevant comparators and identifying gaps in the current evidence.
Perspectives of Patients, Clinicians, and Drug Programs
The information in this section is a summary of input provided by the patient and clinician groups who responded to our call for input and from clinical expert(s) consulted for the purpose of this review.
Patient Input
Two patient groups, Acromegaly Canada and the Canadian Association for Rare Disorders, provided input on pasireotide for patients with acromegaly for whom surgery is ineffective or unavailable. Another group, Acromegaly Community (a US-based support network that has members who live in Canada), also helped to collect the data from patients with acromegaly. Feedback was gathered via interviews with 6 patients and a survey of 26 participants (64% were people in Canada and 36% identified as living in the US), revealing that most patients face severe symptoms, such as hand and foot enlargement, facial feature changes, joint pain, and various comorbidities (diabetes, sleep apnea, hypertension). Although SSAs were seen as generally effective, side effects such as injection site pain and gastrointestinal discomfort were common. Among 6 users of pasireotide (5 patients in US and 1 in Canada), satisfaction was high, with reports of mild to moderate side effects, contrasting with other treatments that were rated less effective or only moderately effective. Patients reported that important outcomes from their point of view include shrinkage of tumours, relief of acromegaly symptoms (such as limb growth, joint pain), and reduced anxiety.
Clinician Input
Input From Clinical Experts Consulted for This Review
The clinical experts noted that a major unmet need is that 50% of patients do not respond to first-generation SSAs, which leads to combination therapy, which has increased risk of side effects and modest efficacy. The clinical experts noted that they expect pasireotide would be used in patients who do not respond to SSA therapy and who do not have dysglycemia. It may also be used in combination with pegvisomant in patients with acromegaly that remains unresponsive. The clinical experts also noted that pasireotide could be used first line in centres where somatostatin receptor staining is available, to identify patients who express the target somatostatin receptors for pasireotide and not those for first-generation SSA therapy.
As noted, the clinical experts believed that the patients most likely to benefit from pasireotide are those who have adequate results from somatostatin receptor staining, who have not responded to first-generation SSAs, whose tumours are densely granulated on pathology, and who have a normal glucose profile. The clinical experts believed that those least suitable are patients with uncontrolled hyperglycemia.
The clinical experts noted that biochemical response (serum GH and IGF-1) is a key method for assessing response, as are radiological response tumour stability or shrinkage, symptoms, and quality of life.
Clinician Group Input
The Canadian Society of Endocrinology and Metabolism (CSEM), comprising 15 physicians, highlighted that the primary goals in acromegaly treatment are normalizing GH and IGF-1 levels, reducing tumour size, and managing symptoms and comorbidities. Treatments include surgery, medical therapies, and radiotherapy, with first-generation SSAs such as octreotide and lanreotide, as initial pharmacotherapy. However, they reported that more than 40% of patients do not experience full biochemical control (defined as normalization of GH and IGF-1 levels) with SSAs, and access to pegvisomant, a second-line GH receptor antagonist, is limited. The CSEM group noted that pegvisomant, while controlling IGF-1, does not affect GH, and its daily injections pose adherence challenges. They emphasize that achieving control of both GH and IGF-1 is crucial for reducing acromegaly’s overall burden. Their experience in using pasireotide is proposed as a promising alternative for patients in whom acromegaly is uncontrolled by SSAs or pegvisomant, with the potential to lessen treatment burden and improve quality of life.
Drug Program Input
The drug programs inquired which specialists primarily treat patients with acromegaly. The clinical experts responded that many specialties may initially diagnose acromegaly, but the diagnosis is then confirmed by a specialist endocrinologist. The clinical experts responded that the primary treatment is removal of the tumour by neurosurgery, followed by medical treatment and lifelong follow-up by an endocrinologist.
The drug programs also asked about considerations for initiation, renewal, discontinuation, and prescription of therapy if pasireotide were reimbursed. This included questions about prior treatments before initiating pasireotide, which outcomes should be considered for assessing renewal or discontinuation of reimbursement (e.g., IGF-1, GH, and/or the Acromegaly Quality of Life Questionnaire [AcroQoL]), and whether combination treatment could be considered. The clinical experts responded that it is reasonable for patients to have had surgery and have not experienced a response to treatment on a first-generation SSA (minimum 6-month trial) before initiating pasireotide. The clinical experts noted that, in addition to biochemical control of IGF-1 and GH, tumour growth and symptoms were important parameters used in assessing whether to renew or discontinue pasireotide. The clinical experts added that cabergoline could be added to pasireotide if there was no response to pasireotide monotherapy.
Last, the drug plans asked whether off-label use in pediatric patients would be anticipated, considering the approved Health Canada indication is for adults. The clinical experts noted that acromegaly is rare in pediatric patients, but it could be considered in certain circumstances based on the judgment of the treating clinician.
Clinical Evidence
Systematic Review
Description of Studies
Two multicentre, sponsor-funded, phase III, randomized controlled trials (RCTs), studies C2305 and C2402, were included in this review.4,5 Study C2305 was a blinded study of pasireotide long-acting release (LAR) versus octreotide LAR in patients with active acromegaly who had not received previous medical treatment over a 12-month treatment period. In Study C2402, patients were randomly allocated to receive either pasireotide LAR 40 mg or pasireotide LAR 60 mg every 4 weeks (in double-blind fashion) or to continue on the maximum indicated dose of octreotide LAR 30 mg or lanreotide autogel (ATG) 120 mg every 4 weeks as before randomization (in an open-label, active control arm). The treatment course was 24 weeks. The primary outcome of each study was the proportion of patients with a reduction of GH level to less than 2.5 mcg/L and normalization of IGF-1 to within normal limits (age- and sex-related). Secondary outcomes assessed normalization of IGF-1, change from baseline in AcroQoL, and symptoms.
Across both studies, patients were approximately 45 years of age, and there were slightly more females than males (52% in Study C2305 and 55% in Study C2402). The majority of patients were white in each study (Study C2305: 60%; Study C2402: 81%). Patients had been diagnosed with acromegaly for approximately 20 months in Study C2305 and for approximately 72 weeks in Study C2402.
Efficacy Results
Proportion of Patients With a Reduction of GH Level to Less Than 2.5 mcg/L and Normalization of IGF-1
Study C2305: The proportion of patients who experienced a response (i.e., patients with GH < 2.5 mcg/L and normalized IGF-1) at month 12 was 31.3% (95% confidence interval [CI], 24.5 to 38.7) in the pasireotide arm and 19.2% (95% CI, 13.8 to 25.7) in the octreotide arm, with an odds ratio (OR) of 1.942 (95% CI, 1.190 to 3.168) in favour of pasireotide.
When analyzed by stratum, the response rates were slightly higher for patients who were postsurgery relative to patients with de novo (newly diagnosed or not yet treated) acromegaly for both pasireotide and octreotide. OR indicated a treatment effect in favour for pasireotide for patients who were postsurgery (2.337; 95% CI, 1.140 to 4.790), while the difference between the treatments was less marked for patients with de novo acromegaly (1.654; 95% CI, 0.846 to 3.234).
The results of the analysis of the primary efficacy end point for the per-protocol set and for the set in which patients with missing values were considered as patients who did not experience a response were consistent with the primary efficacy analysis.
Study C2402: In the pasireotide LAR 40 mg arm, 10 patients (15.4%) experienced biochemical control at 24 weeks compared with none in the active control arm (OR = 16.63; 95% CI, 3.32 to not calculable). In the pasireotide LAR 60 mg arm, 13 patients (20.0%) experienced biochemical control at 24 weeks (OR = 23.03; 95% CI, 4.72 to not calculable).
Patients With Normalization of IGF-1
Study C2305: The proportion of patients with normalized IGF-1 was 38.6% (95% CI, 31.4% to 46.3%) in the pasireotide arm, and 23.6% (95% CI, 17.7% to 30.5%) in the octreotide arm, with an OR of 2.087 (95% CI, 1.316 to 3.308) in favour of pasireotide. By stratum, the response rates for patients postsurgery were 50.7% for pasireotide and 26.9% for octreotide; for patients with de novo acromegaly, the response rates were 30.5% for pasireotide and 21.2% for octreotide.
Study C2402: The proportion of patients who experienced normalization of IGF-1 at week 24 (key secondary efficacy end point) was higher in both the pasireotide 40 mg (24.6%; 95% CI, 14.77% to 36.87%) and the 60 mg (26.2%; 95% CI, 16.03% to 38.54%) groups compared to the active control arm (0 experienced a response), for an OR of 30.12 (95% CI, 6.28% to not calculable; P < 0.0001) in the pasireotide 40 mg group and 32.66 (95% CI, 6.84% to not calculable; P < 0.0001) in the pasireotide 60 mg group.
Acromegaly Quality of Life
Study C2305: The AcroQoL scale ranges from 22 (worst) to 110 (best). From a baseline mean of 58.4 (standard deviation [SD] = 19.97) in the pasireotide group (n = 173) and 55.6 (SD = 19.79) in the octreotide group (n = 178), the AcroQoL total score mean change from baseline to 12 months was 7.0 (SD = 14.54) in the pasireotide group (n = 133) and 4.9 (SD = 15.50) in the octreotide group (n = 146).
Study C2402: At baseline, mean (SD) AcroQoL scores were ████ ███████ in the pasireotide 40 mg group (n = 62), ████ ███████ in the pasireotide 60 mg group (n = 60), and ████ ███████ in the active control group. At week 24, the mean (SD) change from baseline in AcroQoL total score was ███ ██████) in the pasireotide 40 mg group (n = 57), ███ ██████) in the pasireotide 60 mg group (n = 55), and ███ ██████) in the active control group (n = 62).
Symptoms of Acromegaly
Study C2305: The symptoms scale used by the sponsor ranged from 0 (absent) to 4 (severe). From a mean baseline of 0.9 (SD = 1.05) in the pasireotide group (n = 175) and 1.0 (SD = 1.14) in the octreotide group (n = 181), after 12 months, the mean change from baseline in headache scores was −0.3 (SD = 1.17) in the pasireotide group (n = 138) and −0.4 (SD = 0.94) in the octreotide group (n = 149). From a mean baseline of 1.0 (SD = 1.05) in the pasireotide group (n = 174) and 1.3 (SD = 1.26) in the octreotide group (n = 178), after 12 months, the mean change from baseline in osteoarthralgia scores was −0.4 (SD = 1.07) in the pasireotide group (n = 137) and −0.6 (SD = 1.20) in the octreotide group (n = 146).
Study C2402: From a mean (SD) baseline of ███ (█████ in the pasireotide 40 mg group (n = 65), ███ (████) in the pasireotide 60 mg group (n = 64), and ███ ██████ in the active control group (n = 67), after 24 weeks, the mean (SD) change from baseline in headache scores was ████ ██████ in the pasireotide 40 mg group (n = 59), ████ ██████ in the pasireotide 60 mg group (n = 58), and ████ ██████ in the active control group (n = 65). From a mean (SD) baseline of ███ ██████ in the pasireotide 40 mg group (N = 63), ███ ██████ in the pasireotide 60 mg group (n = 64) and ███ ██████ in the active control group (n = 67), after 24 weeks, the mean (SD) change from baseline in osteoarthralgia scores was ████ ██████ in the pasireotide 40 mg group (n = 59), ████ ██████ in pasireotide 60 mg (n = 58), and ████ ██████ in the active control group (n = 65).
Harms Results
Adverse Events
Study C2305: Most patients experienced at least 1 adverse event (AE) during the core phase of the study. The most frequent event in both treatment groups was diarrhea (39.3% versus 45.0% for pasireotide versus octreotide). AEs that were more frequent (at least 5% difference) in the pasireotide than the octreotide group were all related to glucose metabolism: hyperglycemia, diabetes mellitus, blood glucose increased, and type 2 diabetes mellitus. AEs that were more frequent (at least 5% difference) in the octreotide group were diarrhea, cholelithiasis, headache, and nausea.
The incidence of grade 3 or 4 AEs was slightly higher in the pasireotide group ███████ than in the octreotide group ████████. This difference was mainly due to a higher proportion of grade 3 or 4 hyperglycemia-related AEs (e.g., hyperglycemia, diabetes mellitus) in the pasireotide group.
Study C2402: The most frequently reported AEs in all 3 treatment groups, with at least a 10% difference between pasireotide LAR 40 mg and pasireotide LAR 60 mg versus active control, were hyperglycemia (33.3% difference, 30.6% versus 13.6%), diabetes mellitus (20.6% difference, 25.8% versus 7.6%), and diarrhea (15.9% difference, 19.4% versus 4.5%). Overall, grade 3 or grade 4 AEs were reported more frequently in the pasireotide LAR 40 mg and pasireotide LAR 60 mg groups compared to active control. This difference was mainly due to grade 3 or 4 hyperglycemia-related AEs (e.g., hyperglycemia, diabetes mellitus) in both pasireotide LAR groups. Four patients in the pasireotide 40 mg group had a first-degree atrioventricular block. In addition, 1 patient in the pasireotide 60 mg group had atrioventricular block. These events were all grade 1. For 3 of the 5 patients, atrioventricular block was present before start of treatment.
Serious Adverse Events
Study C2305: Overall, there were 35 patients (19.7%) in the pasireotide group and 27 patients (15.0%) in the octreotide group who reported a serious AE (SAE). The most frequent SAE was cholelithiasis (in 4 patients [2.2%] on pasireotide and 3 [1.7%] on octreotide).
Study C2402: Few patients overall had SAEs: 6 patients (9.5%) in the pasireotide LAR 40 mg group, 2 patients (3.2%) in the pasireotide LAR 60 mg group, and 3 (4.5%) in the active control group. There was no specific SAE that occurred in more than 1 patient.
Withdrawals Due to Adverse Events
Study C2305: AEs leading to discontinuation were slightly more frequent in the pasireotide group (9.0%) than in the octreotide group (5.0%). Apart from diabetes mellitus and hyperglycemia, each was reported for no more than 1 patient in each group.
Study C2402: Seven patients (3 in the pasireotide LAR 40 mg group and 4 in the pasireotide LAR 60 mg group) had AEs that led to discontinuation. Six of the 7 patients discontinued due to a hyperglycemia-related event.
Mortality
Study C2305: There was 1 death in the octreotide group, and no deaths in the pasireotide group. The death was due to a myocardial infarction.
Study C2402: There were no deaths in Study C2402.
Notable Harms
Study C2305: In the core phase, the only category of AEs of special interest that occurred with a higher frequency in the pasireotide group (at least 5% difference) was hyperglycemia-related AEs (57.3% versus 21.7% for pasireotide versus octreotide).
In the octreotide group, the following categories of AEs of special interest occurred with a higher frequency (at least 5% difference, octreotide versus pasireotide): diarrhea-related AEs (45.0% versus 39.3%), gallbladder- and biliary-related AEs, (█████ ███ ███████ and nausea-related AEs ██████ ███ ███████.
Study C2402: The most frequent category of AEs of special interest in all treatment groups was hyperglycemia-related AEs: 66.7% and 61.3% in the pasireotide LAR 40 mg and 60 mg groups and 30.3% in the active control group. Hyperglycemia-related events that were severe (grade 3) were reported only in the pasireotide LAR group (none were grade 4). Gallbladder- and biliary-related AEs were also common and equally frequent on all 3 treatments, █████ ██ ███████ and the most frequent was cholelithiasis. None of these events were SAEs. Apart from hyperglycemia-related AEs, the only other AE category with a higher incidence reported on pasireotide LAR than active control was diarrhea-related events (15.9% and 19.4% on pasireotide LAR 40 mg and 60 mg versus 4.5% on active control). In addition to the patient with an AE of liver injury, 4 patients had AEs related to the category “liver safety”: 2 patients in the pasireotide LAR 40 mg group (grade 1 alanine aminotransferase [ALT] increased, grade 2 “liver function test abnormal”), 1 patient in the pasireotide LAR 60 mg group (ALT and gamma-glutamyl transferase [GGT] increased, both grade 1), and 1 patient in the active control (aspartate aminotransferase [AST] and GGT increased, both grade 1). The event “liver function test abnormal” and the ALT elevations resolved without intervention.
Critical Appraisal
The open-label design of Study C2402 may bias assessment of outcomes, particularly patient-reported outcomes like AcroQoL, and symptoms. Although the AcroQoL instrument is validated, the symptom scales used in both studies were not, and minimal important differences (MIDs) were not available for any of these outcomes, limiting the review team’s ability to assess clinical relevance of the findings. There were a relatively large number of withdrawals from Study C2305, and more withdrawals in the pasireotide group than in the octreotide group (20% versus 14%). As a result, there was a large amount of data missing from patient-reported outcomes, limiting confidence in these analyses. With respect to external validity, Study C2402 was designed so that patients enrolled in the active control group were all patients who continued on therapies that were already failing to control their acromegaly, which may have biased results when compared to the same patients who were randomized to pasireotide.
The clinical experts noted that the dose of octreotide used in the included trials was lower (20 mg or 30 mg) than the dose typically used in Canada (40 mg), which may bias efficacy results in favour of pasireotide and harms results against pasireotide. Although pasireotide is likely going to be used second-line, there are no studies that directly compare the 2 drugs.
GRADE Summary of Findings and Certainty of the Evidence
Following the Grading of Recommendations Assessment, Development and Evaluation (GRADE) approach, evidence from RCTs started as high-certainty evidence and could be rated down for concerns related to study limitations (which refers to internal validity or risk of bias), inconsistency across studies, indirectness, imprecision of effects, and publication bias. When possible, certainty was rated in the context of the presence of an important (nontrivial) treatment effect; if this was not possible, certainty was rated in the context of the presence of any treatment effect (i.e., the clinical importance is unclear). The target of the certainty-of-evidence assessment was based on the point estimate and where it was located relative to the threshold for a clinically important effect (when a threshold was available) or to the null. For the AcroQoL, a between-group mean difference with 95% CI was reported. However, no MID was available in the literature, so the null was used as the target of certainty.
For the GRADE assessments, findings from Study C2305 and Study C2402 were considered together and summarized narratively per outcome because these studies were similar in population, interventions, design, and outcome measures.
The selection of outcomes for GRADE assessment was based on the sponsor’s Summary of Clinical Evidence, consultation with clinical experts, and input received from patient and clinician groups and public drug plans. The following list of outcomes was finalized in consultation with expert committee members:
Proportion of patients with normalization of GH and IGF-1 (primary outcome of both included studies)
Proportion of patients with normalization of IGF-1
Change from baseline in AcroQoL
Change from baseline in symptoms (headache, osteoarthralgia)
Notable harms: hyperglycemia-related events.
Table 2: Summary of Findings for Pasireotide vs. Octreotide or Lanreotide for Patients With Acromegaly
Outcome and follow-up | Patients (studies), N | Effect | Certainty | What happens |
|---|---|---|---|---|
GH and/or IGF-1 response | ||||
Patients with a reduction of mean GH level to < 2.5 mcg/L and the normalization of IGF-1 to within normal limits (age- and sex-related) Follow-up indicated in parentheses | Study C2305: N = 358 Study C2402: N = 133 | Study C2305 (12 months):
Study C2402 (24 weeks):
| Lowa | Pasireotide may result in an improvement in the number of patients achieving GH and/or IGF-1 normalization compared to other SSAs. The clinical significance of this improvement is unknown. |
IGF-1 response | ||||
Patients with normalization of IGF-1 Follow-up indicated in parentheses | Study C2305: N = 358 Study C2402: N = 133 | Study C2305 (12 months):
Study C2402 (24 weeks):
| Moderateb | Pasireotide likely results in an improvement in the number of patients achieving IGF-1 normalization compared to other SSAs. The clinical significance of this improvement is unknown. |
Health-related quality of life: AcroQoL | ||||
AcroQoL total scores change from baseline, LS mean (SE) (22 item, 5-point Likert scale, with total scores ranging from 22 [worst] to 110 [best]) Follow-up indicated in parentheses | Study C2305
Study C2402
| Study C2305 (12 months):
Study C2402 (24 weeks):
| Lowc | Pasireotide may result in an improvement in AcroQoL compared to other SSAs. The clinical significance of this improvement is unknown. |
Acromegaly symptoms | ||||
Change from baseline in symptoms, mean (SD) (5-point symptom scale ranging from 0 [absent] to 4 [very severe]). Follow-up indicated in parentheses | Study C2305
Study C2402
Study C2305
Study C2402
| Osteoarthralgia Study C2305 (12 months)
Study C2402 (24 weeks)
Mean difference between groups = NR Headache Study C2305 (12 months)
Study C2402 (24 weeks)
| Very lowd | The evidence is very uncertain about the effects of pasireotide on headaches and on osteoarthralgia compared to other SSAs. |
Harms | ||||
Hyperglycemia-related AE Follow-up indicated in parentheses | Study C2305: N = 358 Study C2402: N = 129 | Study C2305 (12 months)
Study C2402 (24 weeks):
| High | Pasireotide results in an increased risk of hyperglycemia compared to other SSAs. |
AcroQoL = Acromegaly Quality of Life Questionnaire; AE = adverse event; CI = confidence interval; GH = growth hormone; IGF-1 = insulin-like growth factor-1; LS = least squares; NR = not reported; RD = risk difference; SSA = somatostatin analogue.
Note: Study limitations (which refers to internal validity or risk of bias), inconsistency across studies, indirectness, imprecision of effects, and publication bias were considered when assessing the certainty of the evidence. All serious concerns in these domains that led to rating down the level of certainty are documented in the table footnotes.
aRated down 2 levels: 1 level due to indirectness (unclear how GH impacts clinical outcomes, and the cut-off for GH has changed) and 1 level because the lower bound of the 95% CI did not exceed the MID identified by the clinical experts.
bRated down 1 level because the lower bound of the 95% CI did not exceed the MID in Study C2305.
cRated down 2 levels for crossing null.
dRated down 3 levels: 2 levels for lack of between-group point estimate with 95% CI and 1 level for lack of validity of the instrument.
Source: Details included in the table are from the sponsor’s Summary of Clinical Evidence and from the Clinical Study Reports for Studies C2305 and C2402.
Long-Term Extension Studies
No additional long-term extension studies are reported by the sponsor.
Indirect Comparisons
In the absence of direct evidence between pasireotide LAR and pegvisomant, the sponsor performed an indirect treatment comparison (ITC) using the Bucher ITC method. This ITC aimed to estimate the effectiveness of pasireotide LAR compared to pegvisomant monotherapy and pegvisomant in combination with SSAs. The only outcome assessed was IGF-1 normalization.
Efficacy Results
IGF-1 Normalization or Biochemical Response
There were no significant differences in IGF-1 normalization when comparing either dose of pasireotide LAR (40 mg or 60 mg combined), pegvisomant monotherapy (10 mg, 15 mg, or 20 mg combined), or combination therapy with SSAs. In the sensitivity analysis, no differences in terms of IGF-1 normalization that were observed in the comparison of pasireotide LAR (40 mg and 60 mg) and pegvisomant (20 mg/day monotherapy or combination therapy with SSAs).
Harms Results
No harms were assessed in the ITC.
Critical Appraisal
In this ITC report, the authors did not describe their methods for data extraction or conduct a quality assessment of the 3 included studies. The absence of a clear study selection process, a PRISMA flow chart, or a formal quality assessment introduces potential selection and reporting biases, which may affect the validity of the conclusions. Only 3 studies were included in this ITC report, with a small number of events. This limited sample size increased the imprecision of the estimates presented in the report.
There were several sources of heterogeneity across the studies, particularly in treatment doses and comparison types. Differences in baseline characteristics and clinical factors between studies were not addressed or adjusted for. For instance, patients in the C2402 and Trainer et al. (2009) studies had inadequate control of symptoms on SSAs, while the Trainer et al. (2000) study included a broader patient population with a mix of patients with acromegaly, regardless of their prior treatment exposure or response. Moreover, in the Trainer et al. (2000) trial, eligible patients at the second screening had serum IGF-1 concentrations at least 1.3 times the upper limit of the age-adjusted normal range, whereas the other studies did not conduct a second screening. These imbalances in study populations could influence the treatment effect.
The authors used the Bucher method for ITC analysis, which may not be suitable for the included studies and network structure. The Bucher method is designed for 2-arm trials with independent pairwise comparisons. However, the included studies (Study C2402, Trainer et al. [2000], Trainer et al. [2009]) had more than 2 arms, resulting in correlated estimates that the Bucher method cannot adequately address. Another limitation was the lack of adjustment for effect modifiers. Due to inconsistencies and imbalances in treatment effect modifiers, such as differences in study populations and drug dosages, the authors did not attempt to analytically address this potential bias. There was likely heterogeneity in IGF-1 normalization estimates across different dosages and treatment methods, particularly when comparing pasireotide with pegvisomant (15 mg daily) combined with an SSA (octreotide). Although the authors mentioned using the Bucher fixed-effects model, they did not justify this choice. Given the heterogeneity and imbalance in effect modifiers, a random-effects model would likely have been more appropriate for this ITC analysis.
A significant source of intransitivity in the report was the assumption that SSAs and placebo were equivalent, which impacted the comparability of outcomes. According to clinical experts consulted by Canada’s Drug Agency (CDA-AMC), SSAs were superior to placebo in several trials. Thus, the efficacy of SSAs cannot be considered equivalent to placebo. This assumption also prevented the authors from assessing several outcomes important to patients, including tumour volume reduction, acromegaly symptoms, patient quality of life, and safety outcomes. Due to the uncertainty in the evidence presented in the ITC report, definitive conclusions cannot be drawn from the results.
Studies Addressing Gaps in the Evidence From the Systematic Review
Description of Studies
Study C2413 was a prospective, phase IIIb, multicentre, open-label, single-arm study designed to evaluate the biochemical control of acromegaly using the latest, stricter criteria recommended, which had changed since Study C2305 and Study C2402 were conducted.6 The primary aim of Study C2413 was to assess the efficacy and safety of pasireotide LAR in patients with acromegaly that remained uncontrolled despite treatment with maximal approved doses of octreotide or lanreotide. In this study, adults with uncontrolled acromegaly (defined as mean GH [mGH] of 1 mcg/L or more and IGF-1 more than 1.3 times the ULN) who had received at least 3 months of maximal doses of long-acting octreotide or lanreotide were administered open-label pasireotide LAR 40 mg every 28 days. If biochemical control was not achieved by week 12, the dose could be increased to a maximum of 60 mg every 28 days; doses could also be reduced to as low as 10 mg every 28 days if necessary for tolerability. Patients who completed the 36-week treatment phase were eligible to continue to an extension phase (weeks 36 to 72), during which concomitant acromegaly medications were permitted. The primary end point was the proportion of patients achieving mGH less than 1 mcg/L and IGF-1 less than ULN at week 36, with additional assessments of biochemical control during the extension phase. Other outcomes of interest to this review that were assessed in Study C2413 included the AcroQoL, self-reported signs and symptoms of acromegaly, and harms.
Efficacy Results
By week 36, 14.6% of patients (18 of 123; 95% CI, 8.9% to 22.1%) experienced both mGH less than 1.0 mcg/L and IGF-1 levels lower than the ULN. Mean mGH and IGF-1 levels showed a progressive reduction from baseline through week 36 across all groups previously treated with first-generation SSAs.
At baseline during the core phase, the mean AcroQoL score was 58.6 (SD = 19.2; n = 123), which increased to 63.2 (SD = 4.6) (n = 110) by week 36. Among patients who progressed to the extension phase, the mean AcroQoL score was 64.0 (SD = 19.3; n = 88) at extension baseline, increasing to 65.1 (SD = 18.7; n = 74) by week 72.
No significant changes in acromegaly symptoms were observed during the study. In the core phase, the proportion of patients without specific symptoms at baseline compared to the proportion without the symptom after baseline was as follows: headache (41.5% versus 36.6%), fatigue (36.6% versus 26.0%), excessive sweating (43.1% versus 37.4%), joint pain (osteoarthralgia; 33.3% versus 26.8%), and tingling (paresthesia; 54.5% versus 47.2%). Similar proportions were seen in the extension phase.
Harms Results
Most patients (93.5%) experienced at least 1 treatment-emergent AE during the study, regardless of study drug relationship (Table 37). The majority of these AEs were grade 1 to 2. Metabolism and nutrition disorders were the most frequently reported system organ class (SOC) of AEs (████%). Other SOCs of AEs reported in more than 20% of all patients in all grades were infections and infestations (███████ gastrointestinal disorders ████████ investigations ████████ musculoskeletal and connective tissue disorders (███████ general disorders and administrative site conditions ████████ and nervous system disorders ████████.
Critical Appraisal
The open-label single-arm design of the trial is a key limitation to interpreting the results of the study. The absence of a comparator precludes conclusions as to whether any observed effect could be attributed to pasireotide. Further, the open-label study design could increase risk of bias in subjective outcomes (e.g., patient-reported outcomes such as health-related quality of life and symptoms), and some AEs may be influenced by patients’ expectations of treatment. However, the presence and extent of such bias could not be determined from the trial data alone. The study enrolled its target sample size based on the primary outcome. However, another key limitation of the study was that it was exploratory in nature, with no formal hypothesis testing planned.
Based on the views of clinicians consulted by the CDA-AMC review team, the population of patients enrolled in Study C2413 is representative of the patients they encounter in daily practice in Canada. Additionally, the included patients align with the approved indication specified in the Health Canada product monograph, although the population more closely aligned with the sponsor’s reimbursement request, since it enrolled patients with acromegaly that remained uncontrolled despite treatment with maximal approved doses of octreotide or lanreotide. Furthermore, from the clinical experts’ point of view, pasireotide would generally be considered for second-line treatment, typically prescribed after SSAs are found to be ineffective, which also aligns with this study’s patient population.
The dosage of pasireotide used in the trial also generally reflects the recommended dosage described in the product monograph. The primary end point was defined according to the latest definition of biochemical control from the Endocrine Society, reflecting the current standard for managing acromegaly. Other outcomes important to patients and clinicians were also assessed, including quality of life, signs and symptoms of acromegaly (e.g., osteoarthralgia, headache), and safety. Quality of life was measured using the score on the AcroQoL, which was validated in 2014. However, this measure does not have an established MID.
Conclusions
Evidence from 2 phase III RCTs (Study C2305 and Study C2402) suggest that, regardless of whether patients had tried prior medical therapy or had not experienced biochemical control on prior medical therapy, treatment with pasireotide likely results in an improvement in the number of patients who experience IGF-1 normalization, when compared to another SSA. Pasireotide may also increase the number of patients who experience GH and IGF-1 normalization compared to another SSA. However, the clinical relevance of improving GH in acromegaly is less clear than the relevance of improving IGF-1, according to the clinical experts. Pasireotide may improve health-related quality of life compared to other SSAs. However, the evidence is uncertain regarding whether pasireotide improves symptoms, and the clinical significance of any improvement in quality of life is unclear. Pasireotide increases the risk of hyperglycemia over other SSAs, and pasireotide is contraindicated in patients who have uncontrolled diabetes mellitus. A single-arm trial (Study C2413) was reviewed as supportive evidence on the use of pasireotide in patients with acromegaly that was uncontrolled on maximal approved doses of SSAs, based on the current definitions of biochemical control, which were updated since Study C2305 and Study C2402 were conducted. However, the exploratory nature of the trial and the absence of a comparator group limits the conclusions that can be drawn from this supportive evidence.
A sponsor-submitted ITC conducted using the Bucher method suggested there were no significant differences in IGF-1 normalization when comparing pasireotide with pegvisomant monotherapy or pegvisomant in combination with SSAs. However, no definitive conclusions can be drawn from the ITC due to methodological limitations (e.g., heterogeneity across studies, unsuitability of the Bucher method for indirectly comparing studies with more than 2 arms and the network structure, lack of adjustment for effect modifiers, and assumption that SSAs and placebo were equivalent).
Introduction
The objective of this report is to review and critically appraise the evidence submitted by the sponsor on the beneficial and harmful effects of pasireotide, 40 mg and 60 mg vial, administered by deep intramuscular injection, in the treatment of acromegaly in adult patients for whom surgery is not an option or has not been curative.
Disease Background
Contents within this section have been informed by materials submitted by the sponsor and clinical expert input. The following has been summarized and validated by the review team.
Acromegaly is a rare, chronic, and progressive endocrine disease characterized by excess GH secretion.1,2 The most common cause of excess GH secretion in acromegaly is a benign pituitary adenoma. The pituitary tumours responsible for acromegaly comprise a diverse family of neoplasms with different characteristics, leading to different clinical presentations and varied responses to treatment.7 Other, more rare causes include pituitary carcinomas, ectopic (i.e., extrapituitary) production of GH (due to pancreatic neuroendocrine tumours or lymphomas), and several familial syndromes.7 Chronic excess GH and IGF-1 circulation, as well as the presence of the pituitary adenoma itself, lead to structural and functional tissue changes as well as the development of secondary systemic illnesses and burdensome comorbidities.2 Excess circulating GH induces elevated IGF-1 production, predominantly in the liver, which in turn leads to inhibition of apoptosis and stimulation of cell proliferation.7
According to Acromegaly Canada, the prevalence of patients with acromegaly in Canada is 60 patients per million, with an incidence of 6 to 10 newly diagnosed patients per year.1,2,7-9 Although the incidence rate appears to be comparable between men and women, prevalence data indicate that women are slightly more affected by the disease than men.10-13
In 2024, the Acromegaly Consensus Group released guidelines for diagnosing acromegaly, emphasizing that an IGF-1 level more than 1.3 times the ULN for age confirms the condition in patients with typical symptoms. While random GH measurements after fasting can provide additional information, they are not required for diagnosis. For unclear cases, repeating IGF-1 tests or using an OGTT may be helpful for the diagnosis. Factors such as body mass index, diet, genetics, and metabolism can influence IGF-1 levels, so these should be considered during assessment.3
Standards of Therapy
Contents within this section have been informed by materials submitted by the sponsor and clinical expert input. The following has been summarized and validated by the review team.
According to the clinical experts consulted by the CDA-AMC, acromegaly is typically managed through multimodal treatment including surgery (first line), pharmacotherapy (second line), and adjunctive radiation therapy. The clinical experts noted that response to surgery varies depending on the size and invasiveness of the tumour as well as local surgical experience, adding that small and noninvasive tumours tend to have a high initial remission of more than 80%, albeit with a significant risk of recurrence. According to the clinical experts, medical therapy is either directed at the pituitary tumour, with the intention of reducing GH production, or directed at blocking the GH receptor activity. In the first category, the clinical experts included dopamine agonists, which they say are rarely effective (< 10% to 20%); first-generation SSAs (such as octreotide and lanreotide), which are effective in 40% to 50% cases; then second-generation SSAs, such as pasireotide; and then GH receptor antagonists such as pegvisomant, which is effective in about 50% to 60% of patients. The clinical experts added that radiation therapy is used if there is an inoperable tumour and that it can take several weeks to control GH. They added that repeat surgery is an option but is seldom effective, in their experience.
More than 40% of patients with acromegaly treated with first-generation SSAs do not experience GH and/or IGF-1 control.14 Pegvisomant is a second-line medical treatment for patients with acromegaly that is uncontrolled on first-generation SSAs.15 However, as a consequence of its mode of action, pegvisomant does not control GH levels, and 7% of patients treated with pegvisomant experience tumour growth.15-17 AEs associated with pegvisomant include headache (which occurs in more than 25% of patients), injection site reactions (which may result in adherence issues and nonoptimal biochemical control), and liver toxicity (which occurs in up to 10% of patients).8,15,18 The real-world effectiveness of pegvisomant is also considerably lower than clinical trial efficacy.17-20 Pegvisomant is administered daily by subcutaneous self-injections, which can lead to injection site reactions, adherence issues, and suboptimal treatment effectiveness.18,20-22 The discrepancy between clinical trial efficacy and real-world efficacy may also be explained by poor adherence to pegvisomant.21,22 There is therefore an unmet need for alternative treatment options that provide adequate biochemical control, reduce tumour volume and disease symptoms, and improve quality of life in patients with acromegaly that is uncontrolled on first-generation SSAs.
Drug Under Review
Key characteristics of pasireotide and other treatments available for acromegaly are summarized in Table 3. Pasireotide is indicated for the treatment of adult patients with acromegaly for whom surgery is not an option or has not been curative.23 The sponsor’s reimbursement request is for the treatment of acromegaly in adult patients for whom surgery is not an option or has not been curative and in whom acromegaly is inadequately controlled on treatment with a first-generation SSA. The recommended initial dose of pasireotide for the treatment of acromegaly is 40 mg administered by deep intramuscular injection every 4 weeks. The dose may be increased to a maximum of 60 mg for patients whose GH and/or IGF-1 levels are not controlled after 3 months of treatment with pasireotide 40 mg. Pasireotide is a second-generation cyclohexapeptide, injectable SSA. It exerts its pharmacological activity via binding to multiple somatostatin receptors (SSTRs). Pasireotide binds with high affinity to 4 of the 5 SSTRs: SSTR5, SSTR2, SSTR3, and SSTR1. Pasireotide underwent the standard review process at Health Canada and received a notice of compliance on May 21, 2020.23
Table 3: Key Characteristics of Pasireotide, Lanreotide ATG, Octreotide LAR, and Pegvisomant
Characteristic | Pasireotide | Lanreotide ATG | Octreotide LAR | Pegvisomant |
|---|---|---|---|---|
Mechanism of action | Novel cyclohexapeptide, injectable somatostatin analogue. Pasireotide binds with high affinity to 4 of the 5 SSTRs (SSTR5 greater than SSTR2 greater than SSTR3 greater than SSTR1). | Synthetic octapeptide analogue of natural somatostatin. A direct antitumour effect may result from the activation of somatostatin receptors on tumour cells, leading to modulation of intracellular signalling pathways. Somatostatin analogues may also produce an indirect antitumour effect through the inhibition of mitogenic growth factors such as insulin-like growth factor and inhibition of tumour angiogenesis through interaction with somatostatin receptors on endothelial cells and monocytes. | Synthetic octapeptide analogue of naturally occurring somatostatin with similar pharmacological effects but with a prolonged duration of action. It inhibits pathologically increased secretion of GH and of peptides and serotonin produced within the gastro-entero-pancreatic endocrine system. In normal, healthy people, octreotide has been shown to inhibit release of GH stimulated by arginine infusion, exercise, and insulin-induced hypoglycemia. | Analogue of human GH that has been structurally altered to act as a GH receptor antagonist. Pegvisomant selectively binds to GH receptors on cell surfaces, where it blocks the binding of endogenous GH and thus interferes with GH signal transduction. Pegvisomant is highly selective for the GH receptor and does not cross-react with other cytokine receptors, including prolactin. Inhibition of GH action results in decreased serum concentrations of IGF-1, as well as other GH-responsive serum proteins, including IGF binding protein-3, and the acid-labile subunit. |
Indicationa | For the treatment of adult patients with acromegaly for whom surgery is not an option or has not been curative. | For the long-term treatment of patients with acromegaly due to pituitary tumours who have had an inadequate response to, or cannot be treated with, surgery and/or radiotherapy. For the relief of symptoms associated with acromegaly. The goal of treatment in acromegaly is to reduce GH and age-adjusted IGF-1 levels and, where possible, to achieve normalization of their values. | For patients with acromegaly that is adequately controlled with octreotide acetate injection administered SC, including those in whom surgery, radiotherapy, or dopamine agonist treatment is inappropriate or ineffective, or in the interim period until radiotherapy becomes fully effective. | For the treatment of acromegaly in patients who have had an inadequate response to surgery and/or radiation therapy or for whom these therapies are not appropriate. The goal of treatment is to normalize serum IGF-1 levels and to improve clinical signs and symptoms. |
Route of administration | Intramuscular injection | Deep SC injection | Intramuscular (intragluteal) injection | SC injection |
Recommended dose | The recommended initial dose is 40 mg administered by deep intramuscular injection every 4 weeks. The dose may be increased to a maximum of 60 mg for patients whose GH and/or IGF-1d levels are not fully controlled after 3 months of treatment at 40 mg and who tolerate this dose. | Patients should begin treatment with 90 mg at 4-week intervals for 3 months. After 3 months dosage may be adapted as follows:
The starting dose in patients with moderate or severe hepatic or renal impairment should be 60 mg lanreotide ATG via SC route at 4-week intervals for 3 months, followed by dose adjustments as described previously. | Daily dosages of 100 to 300 mcg twice daily or 3 times daily. Dosage adjustment should be based on monthly assessment of GH levels, IGF 1, and/or somatomedin C concentrations, and clinical symptoms, as well as on tolerability. In most patients, the optimal dosage is 200 to 300 mcg per day. A maximum dose of 1,500 mcg should not be exceeded. | The recommended loading dose is 40 mg given SC, under the supervision of a health care provider. The recommended dosage range is between 10 to 30 mg SC once daily, and the maximum dose is 30 mg SC once daily.
|
Serious adverse effects or safety issues |
|
|
|
|
ATG = autogel; GH = growth hormone; IGF-1 = insulin-like growth factor 1; LAR = long-acting release; SC = subcutaneous; SSTR = somatostatin receptor.
aHealth Canada–approved indication.
Source: Pasireotide LAR (SIGNIFOR) monograph,23 Lanreotide ATG (SOMATULINE AUTOGEL) monograph,24 Pegvisomant (SOMAVERT) monograph.15
Perspectives of Patients, Clinicians, and Drug Programs
The full patient and clinician group submissions received are available in the consolidated patient and clinician group input document for this review on the CDA-AMC website.
Patient Group Input
This section was prepared by the review team based on the input provided by patient groups.
Two patient groups, Acromegaly Canada and the Canadian Association for Rare Disorders, submitted 1 joint input on the use of pasireotide for patients with acromegaly for whom surgery is either not an option or was not successful as a first-line treatment. Acromegaly Canada is a patient-led organization that advocates for better care, education, and support for those with acromegaly.
Another group, Acromegaly Community (a US-based support network that has members who live in Canada), helped to collect the data from patients with acromegaly. Information was collected through interviews and an online survey. Interviews were conducted with 3 patients in Canada and 3 in the US who had used pasireotide LAR. The survey was distributed via email and through social media groups.
The survey received 26 responses, with 25 participants being patients diagnosed with acromegaly and 1 participant being a patient advocate (support group member). Among the respondents,14 of 26 (54%) provided a state or province of residence. Among these, 64% were people in Canada and 36% identified as living in the US. One patient described acromegaly as “a disease that makes monsters out of people,” reflecting the profound physical changes caused by the condition. According to the survey, 80% of participants reported experiencing severe or very severe enlargement of the hands and/or feet. More than 60% reported significant changes in facial features, including enlargement of the jaw, brow, nose, or teeth. Participants also reported moderate joint pain, arthritis, carpal tunnel syndrome, and moderate to severe organ enlargement (liver, kidney, heart). Some participants noted comorbid conditions, such as diabetes or insulin resistance, sleep apnea or airway obstruction, moderate to severe hypertension, severe mood disorders, and excessive sweating.
Acromegaly is a condition that significantly affects patients’ mental health, social relationships, family dynamics, and work-related and financial circumstances. Many individuals with this condition report that explaining their diagnosis to others is challenging. Physical differences, such as changes in the size of their limbs, often lead to social discomfort and fear of judgment, which can make them hesitant to engage in social interactions. Additionally, chronic pain associated with acromegaly reduces their ability to work consistently, resulting in frequent absences and, in some cases, an inability to maintain employment, leading to financial strain. Furthermore, the physical and psychological aspects of the condition also impact their relationships with family members and overall social life, with many describing acromegaly as a pervasive influence on nearly every aspect of their lives. Many patient respondents underwent surgery and received SSAs, which were generally viewed by patients as effective treatments. Most patient found surgery had some or moderate effectiveness, and more than half of the interviewed patients considered SSAs effective or very effective. The second most common medications were dopamine agonists, such as cabergoline and bromocriptine, which were described as not as positive as SSAs. Only a few patients (12%) reported effectiveness as “much” or “very much” for dopamine agonists. A few patients who used pegvisomant also said their experience with its effectiveness was not positive, and only 18% reported that this drug was effective. Patient group input reported that important outcomes from their point of view include shrinkage of the tumour, improvement in acromegaly symptoms (such as limb growth, joint pain), and reduced anxiety.
More than half of the patients who had undergone treatments for acromegaly experienced moderate to severe side effects. Following surgery, most patients surveyed reported experiencing moderate to severe side effects. More than half of those treated with SSAs or dopamine agonists experienced significant AEs. While the survey did not provide detailed descriptions, nausea was commonly associated with dopamine agonists, and pain at the injection site was the primary concern reported for SSAs. In contrast, most individuals using pasireotide LAR experienced only mild or manageable side effects. The most frequently noted side effects of pasireotide LAR were gastrointestinal discomfort and elevated blood sugar levels. Despite these issues, patients generally emphasized that the benefits of using pasireotide LAR far outweighed its potential risks.
Among the 6 patients who had used pasireotide (5 in the US and 1 in Canada), all rated pasireotide LAR as effective or very effective in reducing and managing their symptoms, reporting only mild to moderate side effects, primarily gastrointestinal discomfort. Their experiences with other medications (including SSAs, dopamine agonists, and pegvisomant) were generally reported as less or moderately effective.
Clinician Input
Input From Clinical Experts Consulted for This Review
All CDA-AMC review teams include at least 1 clinical specialist with expertise regarding the diagnosis and management of the condition for which the drug is indicated. Clinical experts are a critical part of the review team and are involved in all phases of the review process (e.g., providing feedback on the review protocol submitted by the sponsor, assisting in the critical appraisal of clinical evidence, interpreting the clinical relevance of the results, and providing guidance on the potential place in therapy). The following input was provided by 2 clinical specialists with expertise in the diagnosis and management of acromegaly.
Unmet Needs
The clinical experts consulted by CDA-AMC on this review noted that only approximately half of patients experienced a response to first-generation SSA therapy, and those who do not experience a response must typically resort to combination therapy, which carries an increased risk of side effects and is only modestly effective, in their opinion. The clinical experts added that, to offset these limitations, physicians typically resort to smaller doses and less frequent dosing (off label) so that their patients will be able to afford and tolerate therapy. The clinical experts noted that a drug like pasireotide could fill this gap if it provided enhanced efficacy and a better tolerability profile and that it could avoid the need for combination therapy.
Place in Therapy
The clinical experts believed that pasireotide would be used in patients who do not experience a response to first-generation SSA therapy and who do not have dysglycemia. The clinical experts added that it may be used in conjunction with GH receptor antagonists such as pegvisomant in patients who do not experience a response. At centres where SSA-receptor staining is available, pasireotide would be used as a first-line drug in patients who express the target somatostatin receptors for pasireotide and do not express the receptors targeted by first-generation SSA therapy, according to the clinical experts.
Patient Population
The clinical experts believed that pasireotide was best suited for patients with adequate tumour somatostatin receptor staining, whose acromegaly has failed to respond to first-generation SSA therapy, whose tumours are densely granulated on pathology, and who have a normal glucose profile. In contrast, the clinical experts indicated that pasireotide was least suited for patients with uncontrolled hyperglycemia.
Assessing the Response to Treatment
The outcomes that would be used to assess response include biochemical outcomes (serum GH and IGF-1), radiological outcomes (tumour stability or shrinkage), and clinical outcomes (improvement in acromegaly symptoms and quality of life), according to the clinical experts. The clinical experts added that patients in whom acromegaly is not biochemically controlled exhibit more frequent symptoms and comorbidities, and insufficient biochemical control has been linked to increased mortality risk. The definitions of biochemical control have evolved, noted the clinical experts, with current criteria being more stringent (GH less than 1 mcg/L and while maintaining the criterion of age-normalized IGF-1 less than the ULN). The clinical experts also noted that significant tumour shrinkage is typically defined as a 10% to 25% reduction in volume or diameter.
Discontinuing Treatment
The clinical experts noted that lack of response, uncontrolled hyperglycemia, and other intolerable side effects such as gastrointestinal side effects or local injection site reactions would be indications for discontinuation of treatment. One clinical expert noted that, due to the risk of hyperglycemia, patients require blood glucose monitoring while on pasireotide. Patients who are on antidiabetic medications may need more frequent blood glucose monitoring and adjustments in their medication dosage to avoid hyperglycemia or hypoglycemia.
Prescribing Considerations
The clinical experts noted that only an expert specialist should diagnose and manage this condition. One of the clinical experts noted that patients receive community-based treatment from a multidisciplinary team, including an experienced endocrinologist who closely monitors for AEs, particularly hyperglycemia. The same clinical expert also noted that the introduction of more effective treatments may reduce the need for additional specialist visits and the monitoring requirements associated with less effective therapies.
Clinician Group Input
This section was prepared by the review team based on the input provided by clinician groups.
One clinician group (including 15 physicians), the CSEM, provided input for this review. According to the CSEM, clinical consensus states that normalization of both GH and IGF-1 serum levels is the primary goal of acromegaly treatment. Additional therapeutic aims include control of the growth and size of the pituitary tumour as well as prevention and management of acromegaly-associated symptoms and comorbidities. The CSEM clinicians reported that available treatments recommended for patients with acromegaly include surgery (tumour resection), medical pharmacotherapy, and radiotherapy. Medical therapy is recommended for the long-term treatment of acromegaly following inadequate response to surgery or in cases where surgery is not an appropriate treatment option. The clinician group noted that first-generation SSAs, octreotide and lanreotide, are currently the mainstay of first medical management. However, not all patients respond to treatment with first-generation SSAs. Pegvisomant is a second-line medical therapy for patients with acromegaly who are uncontrolled on first-generation SSAs. The clinician group mentioned that a significant proportion of patients are not experiencing control with current therapeutic options. In addition, the CSEM noted that a proportion of patients with acromegaly are either ineligible for or unwilling to undergo surgery. More than 40% of patients treated with SSAs do not experience full biochemical control, as widely reported. Clinician groups noted that many patients across Canada face limited access to pegvisomant. Pegvisomant, a GH receptor antagonist, effectively controls IGF-1 levels but does not impact GH levels. The clinicians emphasized that normalizing IGF-1 alone might not sufficiently reduce the mortality rates or the human and economic burdens associated with acromegaly. Additionally, pegvisomant requires daily subcutaneous self-injections, which may result in injection site reactions, difficulties with adherence, and reduced treatment effectiveness. Radiotherapy, often used as a treatment option, carries significant safety risks, including impaired quality of life, increased pain and discomfort, and heightened levels of anxiety and depression. Therefore, the clinician group concluded there is a need for alternative treatment options that provide full biochemical control, reduce tumour volume and disease symptoms, and improve quality of life in patients whose acromegaly remains uncontrolled on first-generation SSAs, while also reducing treatment burden. The CSEM clinicians indicate that pasireotide is expected to be used when surgery and medical management with first-generation SSAs fail to provide biochemical control. The clinician groups noted that the only other available treatment options in this setting are either continued use of first-generation SSAs or pegvisomant. Off-label use of combination SSA and cabergoline may also be considered in patients with co-prolactin-secreting tumours or in patients with mildly to moderately elevated IGF-1 levels. The clinicians anticipated that pasireotide would not be used in combination with ineffective first-generation SSAs or pegvisomant, but instead would replace ineffective first-generation SSAs (in jurisdictions that do not fund pegvisomant) or pegvisomant (for patients who have access to this drug).
Drug Program Input
The drug programs provide input on each drug being reviewed through the Reimbursement Review processes by identifying issues that may impact their ability to implement a recommendation. The implementation questions and corresponding responses from the clinical experts consulted by for this review are summarized in Table 4.
Table 4: Summary of Drug Plan Input and Clinical Expert Response
Drug program implementation questions | Clinical expert response |
|---|---|
Relevant comparators | |
Which specialists primarily diagnose and treat patients with acromegaly? | According to the clinical experts, patients with acromegaly present to and may be initially diagnosed by several specialties, including rheumatology (for joint disease), dental surgeon (jaw and teeth issues), cardiology (cardiac issues), or family medicine. The diagnosis is confirmed by a specialist endocrinologist. According to the clinical experts, the primary treatment is the removal of adenoma by neurosurgery, then medical treatment and lifelong follow-up by endocrinology. In patients not responding to medical therapy, radiation therapy may be administered by radiation oncology. |
Considerations for initiation of therapy | |
In the Study C2402: 60% to 77% of patients had previous surgery and few patients had previous radiation therapy. Questions:
| Radiotherapy is reserved for patients who have declined, have not experienced good results with surgery, or in whom surgery is not a suitable option are who are not suitable candidates for surgical and/or medical treatments due to their potential complications, such as pituitary dysfunction. As pasireotide is expected to be used when surgery and medical management with first-generation SSA fails to provide biochemical control, it is reasonable for patients to have surgery and a first-generation SSA that has failed before initiating pasireotide, noted the clinical experts. Also, the clinical experts added, radiation therapy may take several years to reach full effect, and medical therapy may be required during that time. According to the clinical experts, a 6-month trial of a first-generation SSA would be reasonable. According to the clinical experts, failure of normalization of GH and IGF-1 (random GH < 1 mcg/L and age-normalized IGF-1 < ULN) are currently recommended by the Pituitary Society, the Acromegaly Consensus Group, and the Endocrine Society. The clinical experts added that symptoms may improve only partially, due to long-term tissue changes, joint and soft tissue damage, comorbid conditions, and other issues after chronic exposure to excess of GH and IGF-1. Common contraindications to pituitary surgery for acromegaly, according to the clinical experts, are the following:
In the experience of the clinical experts, about 90% of patients have subsequent surgery for pituitary adenomas. |
Considerations for continuation or renewal of therapy | |
In Study C2402, the primary end point was the proportion of patients with GH < 2.5 mcg/L and normalized IGF-1 at week 24.
Questions:
| According to the clinical experts, assessment of treatment effectiveness may include tumour growth control, reduction in tumour size, and the prevention and management of symptoms and comorbidities associated with acromegaly, in addition to biochemical control. Although there is no consensus on the threshold for a clinically meaningful change in tumour volume, noted the clinical experts, clinical studies typically define significant tumour shrinkage as a reduction of 10% to 25% in tumour volume or diameter. The clinical experts added that, if pasireotide monotherapy proves to be ineffective, a combination therapy involving cabergoline and pasireotide may be considered. According to the clinical experts, 24 weeks is a reasonable time frame to assess the efficacy of pasireotide. Currently, according to the clinical experts, it seems that there is no established MCID for the AcroQoL. One clinical expert added that considering the AcroQoL as a measure for assessing the renewal of coverage for drugs for acromegaly could be beneficial, as it provides valuable insights into the patient’s quality of life, which is an important aspect of treatment effectiveness beyond biochemical control and tumour size reduction. This clinical expert added that including such patient-reported outcomes in coverage decisions could ensure a more holistic approach to patient care. The other clinical expert believed that measuring AcroQoL for renewal is not ideal as this is somewhat subjective and suggested using biochemical markers such as IGF-1. The expert added that an OGTT is not ideal in patients taking SSA therapy. According to 1 clinical expert, to assess suitability for renewal of coverage, biomarkers (IGF-1 and GH) and AcroQoL should be monitored every 6 to 12 months. |
Considerations for discontinuation of therapy | |
If a patient receives subsequent radiation therapy or surgery while on pasireotide, should coverage be discontinued? If normalization of GH and IGF-1 are used as parameters for renewal, what level of GH and/or IGF-1 would be considered a failure of treatment and at which point should pasireotide be discontinued? | According to the clinical experts, surgical or radiation treatment outcomes may be successful, partially successful, or unsuccessful. Therefore, the clinical experts added, coverage should continue at least until the patients experience biochemical remission without the need for medical therapy. Periodic assessment must be done and, once IGF-1 levels drop to low or below normal levels, drug therapy should be withheld and biochemical assessment should be done. According to the clinical experts, normalization of GH and IGF-1 is defined as follows: random GH < 1 mcg/L and age-normalized IGF-1 < ULN. However, the clinical experts added that assessment of treatment effectiveness may include tumour growth control, reduction in tumour size, and the prevention and management of symptoms and comorbidities associated with acromegaly, in addition to biochemical control. The clinical experts noted that, although there is no consensus on the threshold for a clinically meaningful change in tumour volume, clinical studies typically define significant tumour shrinkage as a reduction of 10% to 25% in tumour volume or diameter. The clinical experts added that, if pasireotide monotherapy proves to be ineffective, combination therapy involving cabergoline and pasireotide may be considered. The clinical experts also noted that patients should continue to receive pasireotide until they do not experience a clinical benefit from therapy or they are unable to tolerate the treatment. |
Considerations for prescribing of therapy | |
In the pivotal study, only 15% to 20% of patients had normalized IGF-1 and GH values at week 24. Would the next step in therapy be to add another drug to pasireotide, such as cabergoline or pegvisomant? | The clinical experts responded that yes, combination therapy may be considered. |
Generalizability | |
The Health Canada indication for pasireotide is for adult patients. Would off-label pediatric use be anticipated for this product? | The clinical experts noted that off-label use in pediatric patients could be considered in certain circumstances. However, this would depend on the clinical judgment of health care providers, who would weigh the potential benefits against the risks due to the lack of extensive data on the drug’s safety and efficacy in children. The clinical experts added that, due to the rarity of acromegaly in pediatrics, the chance of off-label pediatric use would be very low. |
AcroQoL = Acromegaly Quality of Life Questionnaire; MCID = minimal clinically important difference; GH = growth hormone; IGF-1 = insulin-like growth factor 1; LAR = long-acting release; OGTT = oral glucose tolerance test; SSA = somatostatin analogue; ULN = upper limit of normal.
Clinical Evidence
The objective of this clinical review report is to review and critically appraise the clinical evidence submitted by the sponsor on the beneficial and harmful effects of pasireotide 40 mg or 60 mg injectable suspension every 4 weeks in the treatment of acromegaly in adult patients for whom surgery is not an option. The focus will be placed on comparing pasireotide to relevant comparators and identifying gaps in the current evidence.
A summary of the clinical evidence included by the sponsor in the review of pasireotide is presented in 4 sections with CDA-AMC’s critical appraisal of the evidence at the end of each section. The first section, the systematic review, includes pivotal studies and RCTs that were selected according to the sponsor’s systematic review protocol. Our assessment of the certainty of the evidence in this first section using the GRADE approach follows the critical appraisal of the evidence. The second section normally includes sponsor-submitted long-term extension studies. However, these were moved to the appendix because they were deemed to add little to the body of evidence. The third section includes indirect evidence from the sponsor. The fourth section includes additional studies that were considered by the sponsor to address important gaps in the systematic review evidence.
Included Studies
Clinical evidence from the following are included in the review and appraised in this document:
two pivotal studies or RCTs identified in systematic review
one ITC
one additional study addressing gaps in the systematic review evidence.
Systematic Review
Contents within this section have been informed by materials submitted by the sponsor. The following have been summarized and validated by the review team.
Description of Studies
Characteristics of the included studies are summarized in Table 5.
Table 5: Details of Studies Included in the Systematic Review
Detail | Study C2305 | Study C2402 |
|---|---|---|
Designs and populations | ||
Study design | Phase III, multicentre, randomized, blinded study | Phase III, multicentre, randomized, parallel-group, 3-arm, double-blind study |
Locations | Patients were enrolled across 27 countries at 84 study centres, as follows: Germany (4), Spain (4), US (12), Colombia (1), Russia (4), Belgium (3), Hungary (1), Poland (1), Korea (4), Argentina (3), Greece (1), Sweden (2), Denmark (1), Norway (1), France (7), Canada (5), Taiwan (3), Italy (7), Mexico (2), Israel (2), China (2), Netherlands (2), UK (2), Türkiye (2), Brazil (6), Czech Republic (1), and Switzerland (1) | Patients were enrolled across 18 countries at 72 study centres as follows: Germany (7), Belgium (4), Brazil (9), Colombia (3), Israel (1), Italy (5), Norway (2), Poland (3), Spain (4), Türkiye (3), France (10), UK (2), Russia (4), Romania (1), Saudi Arabia (2), Argentina (1), US (7), and Canada (4) |
Patient enrolment dates | Start date: February 11, 2008 Data cut-off date for current analysis: December 29, 2011 (when all patients had completed at least 26 months [i.e., 26 cycles of 28 days] or discontinued) End date: October 8, 2012 | Start date: July 19, 2010 End date (core phase): January 22, 2013 |
Randomized (N) | Pasireotide LAR (n = 176) Octreotide LAR (n = 182) | Pasireotide LAR 40 mg (n = 65) Pasireotide LAR 60 mg (n = 65) Active control (octreotide LAR or lanreotide ATG; n = 68) |
Inclusion criteria | 1. Male or female patients of at least 18 years of age. 2. Patients with active acromegaly, demonstrated by 2.1. a lack of suppression of GH nadir to 5 mcg/L 2.2. elevated circulating IGF-1 concentration (age- and sex-adjusted). 3. Patients who have undergone 1 or more pituitary surgeries, but have not been treated medically, or patients with de novo acromegaly presenting a visible pituitary adenoma on MRI and who refuse pituitary surgery or for whom pituitary surgery is contraindicated. 4. Patients for whom written informed consent to participate in the study has been obtained before any study-related activity. 5. Patients previously submitted to surgery. | 1. Patients with written informed consent before any study-related activity. 2. Patients who had inadequately controlled acromegaly, as defined by a mean GH concentration of a 5-point profile over a 2hour period > 2.5 mcg/L and sex- and age-adjusted IGF-1 > 1.3 × ULN. 3. Patients who had been treated with maximum indicated doses of octreotide LAR or lanreotide ATG for at least 6 months before visit 1 (screening). The maximum indicated dose for octreotide LAR was 30 mg and for lanreotide ATG was120 mg. 4. Patients who had a diagnosis of pituitary micro- or macro-adenoma. Patients could have been previously submitted to surgery. 5. Patients who completed the 24-week treatment period in core according to the requirements of the core study protocol or corresponding amendments could enter extension. |
Exclusion criteria | 1. Patients who are being or were treated with octreotide, lanreotide, dopamine agonists, or GH antagonists, with the exception of a single dose of short-acting octreotide or short-acting dopamine agonists. In case of a single dose of short-acting octreotide, the dose should not be used to predict the response to the octreotide treatment. The single dose of short-acting octreotide or short-acting dopamine agonists should not be administered in the 3 days before randomization. 2. Patients with compression of the optic chiasm causing any visual field defect. 3. Patients who have received pituitary irradiation within the past 10 years before visit. 4. Patients with poorly controlled diabetes. | 1. Patients who had received pasireotide before enrolment. 2. Concomitant treatment with growth hormone receptor antagonist or dopamine agonists unless concomitant treatment was discontinued 8 weeks before visit 1 (screening) (8 weeks washout period). Such patients must have been treated with octreotide LAR 30 mg or lanreotide ATG 120 mg monotherapy continuously for a minimum of 6 months before starting combination therapy, and acromegaly should have been inadequately controlled on monotherapy. 3. Patients who had compression of the optic chiasm, causing acute, clinically significant visual field defects. 4. Patients who required a surgical intervention for relief of any sign or symptom associated with tumour compression. 5. Patients who had received pituitary irradiation within 10 years before visit 1 (screening). 6. Patients who had undergone major surgery/surgical therapy for any cause within 4 weeks before visit 1 (screening). 7. Patients who were hypothyroid but not adequately treated with a stable dose of thyroid hormone replacement therapy. |
Drugs | ||
Intervention | Pasireotide LAR 40 mg IM injection, once every 28 plus or minus 2 days for 24 weeks |
|
Comparator(s) | Octreotide LAR 20 mg IM depot injection, once every 28 plus or minus 2 days for 24 weeks |
OR
|
Study duration | ||
Screening phase | 4 weeks | 4 weeks |
Core phase | 12 months | 24 weeks |
Follow-up / Extension study phase | Safety follow-up — continued for at least 8 weeks following last treatment dose Extension study (blinded, optional) — up to month 26, unblinded thereafter | Safety follow-up — continued for at least 8 weeks following last treatment dose OR Extension study (optional) — up to month 26 |
Outcomes | ||
Primary end point | The primary objective was to compare the proportion of patients with a reduction of mean GH level to < 2.5 mcg/L and the normalization of IGF-1 to within normal limits (age- and sex-related) between the 2 treatment groups at 12 months (core). | The primary objective of the core study was to compare the proportion of patients achieving biochemical control (defined as mean GH levels < 2.5 mcg/L and normalization of sex- and age-adjusted IGF1) at 24 weeks with pasireotide LAR 40 mg and pasireotide LAR 60 mg separately vs. continued treatment with octreotide LAR 30 mg or lanreotide ATG 120 mg. |
Secondary and exploratory end points | Secondary (core):
Exploratory (core):
| Secondary (core):
Exploratory (core):
|
Publication status | ||
Publications | Colao A, Bronstein MD, Freda P, et al. Pasireotide vs. octreotide in acromegaly: a head-to-head superiority study. J Clin Endocrinol Metab. 2014;99(3):791-799. | Gadelha MR, Bronstein MD, Brue T, et al. Pasireotide vs. continued treatment with octreotide or lanreotide in patients with inadequately controlled acromegaly (PAOLA): a randomized, phase 3 trial. Lancet Diabetes Endocrinol. 2014;2(11):875-884. |
AcroQoL = Acromegaly Quality of Life Questionnaire; ATG = autogel; ECG = electrocardiogram; GH = growth hormone; IGF-1 = insulin-like growth factor 1; IM = intramuscular; LAR = long-acting release; OGTT = oral glucose tolerance test; SC = subcutaneous; ULN = upper limit of normal.
Source: Study C2305 Clinical Study Report,25 Study C2402 Clinical Study Report.26
Study C2305
Study C2305 (NCT00600886) was a phase III, multicentre, randomized, blinded study of pasireotide LAR versus octreotide LAR in patients with active acromegaly who had not received previous medical treatment. At least 330 patients were planned to be randomized into the study, stratified by the following 2 strata: patients who had undergone 1 or more pituitary surgeries but had not been treated medically, and patients with de novo acromegaly with a visible pituitary adenoma on MRI who refused pituitary surgery or for whom pituitary surgery was contraindicated.
Patients were randomized 1:1 to receive either pasireotide LAR 40 mg or octreotide LAR 20 mg intramuscular depot injections every 28 days, for a total of 12 injections during the core phase. Treatment in the core phase was blinded for all patients. A study month was defined as 28 days; therefore, the total duration of the core phase was 12 times 28 days (i.e., 12 study months).
Treatment could be discontinued before month 12 for lack of efficacy, unacceptable toxicity, protocol deviation, or withdrawal of consent, or other safety concerns. All patients had to have follow-up evaluations 28 days after the end of study (56 days after the last dose of study medication).
Patients who did not participate in the optional extension received the last (12th) injection at month 11.
Patients who completed the blinded core phase could continue in an optional extension. Per the original study protocol, patients in the pasireotide arm who responded to treatment (defined as mean GH level < 2.5 mcg/L and IGF-1 ≤ age- and sex-related ULN at month 12) or who were benefiting from the treatment according to the investigator could continue pasireotide in an unblinded manner in the extension. In addition, patients in the octreotide arm who did not respond could cross over to pasireotide in an unblinded manner in the extension.
The design of the extension was changed with Protocol Amendment 4 to include octreotide as a treatment option in the extension, and to extend blinding of study treatment from month 12 to month 26. Following Amendment 4, patients who did not respond to randomized treatment (either pasireotide or octreotide) during the core could cross over to the other treatment in the extension, and patients who responded during the core could continue the same treatment (either pasireotide or octreotide) in the extension, with blinding maintained up to month 26. This change was implemented after 34 patients had already entered the extension and had started treatment with pasireotide in an unblinded manner.
Patients who agreed to participate in the extension under Amendment 4 received a 13th injection of the same blinded study drug they were receiving in the core at the month 12 visit to bridge the gap between the month 12 assessment (which was used to determine whether a patient was considered not to have experienced a response and therefore should cross over) and the next scheduled injection. Following the bridging injection, patients received an additional 13 injections of either the same treatment as during the core or crossover treatment. The first injection of crossover treatment (either pasireotide LAR 40 mg or octreotide LAR 20 mg) was given at month 13. The blind was broken at month 26, at which time patients had received a total of 26 injections of treatment (12 injections in the core, 1 bridging injection, and 13 injections of either randomized or crossover treatment in the extension) in a blinded manner. After month 26, only patients on pasireotide were followed in the study.
For the 34 patients who completed the core phase and entered the extension before Protocol Amendment 4, the treatment was unblinded at month 12 per protocol, and these patients received pasireotide in an unblinded manner in the extension. Both those patients who continued pasireotide from the core and those who crossed over from octreotide received the first injection of pasireotide in an unblinded manner at month 12. Patients who responded to octreotide or did not respond to pasireotide could not enter the extension and were not followed after month 12.
All patients (both before and after Amendment 4) who received pasireotide in the extension could continue pasireotide until the medication became commercially available or until the pasireotide development program was discontinued. Patients who received octreotide in the extension (only allowed following Amendment 4) could continue octreotide until the end of the first year of the extension (month 26); thereafter, they were no longer followed in the study.
Study C2402
Study C2402 (NCT01137682) was a phase III, multicentre, randomized, double-blind, parallel-group, 3-arm study of pasireotide LAR 40 mg and pasireotide LAR 60 mg intramuscular injection versus open-label octreotide LAR 30 mg intramuscular injection or lanreotide ATG 120 mg subcutaneous injection in patients with inadequately controlled acromegaly. After a 4-week screening period during which inclusion and exclusion criteria were assessed, patients were randomly allocated to receive either pasireotide LAR 40 mg or pasireotide LAR 60 mg (in double-blind fashion) or to continue on their current treatment on the maximum indicated dose of octreotide LAR 30 mg or lanreotide ATG 120 mg as before randomization (in an open-label, active control arm). There was no indication of whether there was a washout period for those patients who switched from their existing active control to pasireotide. Patients were stratified according to previous treatment (octreotide LAR, lanreotide ATG) and GH levels at visit 1 (screening: > 2.5 mcg/L and ≤ 10 mcg/L; > 10 mcg/L). The total treatment duration with pasireotide LAR 40 mg or pasireotide LAR 60 mg or with octreotide LAR 30 mg or lanreotide ATG 120 mg was 24 weeks. The total study duration was 28 weeks, including the screening phase.
The purpose of the extension study was to collect additional efficacy and safety data on pasireotide LAR. According to the sponsor, at the end of the 24-week core phase, patients in the pasireotide LAR arms could continue in the extension on blinded, randomized treatment with pasireotide LAR 40 mg or 60 mg if acromegaly was controlled, or start open-label pasireotide LAR 60 mg if acromegaly was uncontrolled, per the investigator’s judgment. The definition of “control” was not reported. Therefore, it was unclear whether it remained the same as the enrolment criteria or not. Patients who did not experience biochemical control in the control arm could enter the extension and receive pasireotide LAR (starting dose 40 mg, with a dose increase to 60 mg for patients who did not experience biochemical control after 3 injections), whereas those who experienced control would not continue in the extension, and instead continued their previous treatment (octreotide LAR or lanreotide ATG), as prescribed.
Patients could continue in this extension study as long as they did not fulfill any of the study discontinuation criteria, until pasireotide LAR was commercially available for the treatment of acromegaly in each participating country (not applicable in Norway and the UK), until December 31, 2015 (applicable only in Norway and the UK), or until the entire pasireotide program was discontinued (whichever came first). If pasireotide was not available to patients in each respective country, the sponsor had a transition plan to ensure that all trial patients still had access to the study medication without any delay in their treatment.
Populations
Inclusion and Exclusion Criteria
Study C2305 enrolled patients with acromegaly, as defined by a lack of suppression of GH nadir of less than 1 mcg/L after an oral tolerance test with 75 g of glucose (not applicable for patients with diabetes) or a mean GH concentration of a 5-point profile within a 2-hour time period of more than 5 mcg/L and elevated circulating IGF-1 concentration (age- and sex-adjusted). Patients in Study C2305 were excluded based on previous treatment with octreotide, lanreotide, dopamine agonists, or GH antagonists, with the exception of a single dose of short-acting octreotide or short-acting dopamine agonists.
Study C2402 enrolled patients who had inadequately controlled acromegaly, defined as a mean GH concentration of a 5-point profile over a 2-hour period greater than 2.5 mcg/L and sex- and age-adjusted IGF-1 greater than 1.3 times ULN, and who had been treated with maximum indicated doses of octreotide LAR or lanreotide ATG for at least 6 months before visit 1 (screening). The maximum indicated dose for octreotide LAR was 30 mg and for lanreotide ATG was120 mg. Patients who required a surgical intervention for relief of any sign or symptom associated with tumour progression were excluded.
In both trials, eligible patients were excluded if they had received pituitary irradiation within the past 10 years before visit 1 or had compression of the optic chiasm, causing any visual field defect.
Interventions
Study C2305
For the core phase of the study, patients were randomized to 1 of the following 2 treatment arms in a ratio of 1:1:
Pasireotide LAR 40 mg intramuscular depot injection, blinded, once every 28 days (± 2 days) for 12 months
Octreotide LAR 20 mg intramuscular depot injection, blinded, once every 28 days (± 2 days) for 12 months
A patient’s dose could be increased 1 dose level during the core or the extension if central laboratory results showed mean GH level 2.5 mcg/L or higher and/or IGF-1 greater than ULN (age- and sex-related). The permitted dose increases were from 40 mg to 60 mg for pasireotide LAR and from 20 to 30 mg for octreotide LAR.
Patients were stratified as follows for the core phase:
Patients with prior pituitary surgery but no previous medical treatment for acromegaly
Patients with de novo disease who refused pituitary surgery or for whom pituitary surgery was contraindicated
The starting dose in the extension for patients who crossed over was pasireotide LAR 40 mg or octreotide LAR 20 mg. Patients who entered the extension without crossing over continued the same dose as they were receiving in the core.
In the extension, dose increases were permitted as follows:
For patients who switched treatment at month 13 (visit 2E), 1 dose increase (to pasireotide LAR 60 mg or octreotide LAR 30 mg) was permitted at month 7 (visit 6E) for patients whose month 16 (visit 5E) mean GH levels were 2.5 mcg/L or higher and/or IGF-1 was greater than ULN. If the dose had not been increased at month 17 (visit 6E) and the patient’s mean GH level was 2.5 mcg/L or greater and/or IGF-1 was greater than ULN at month 19 (visit 8E), the investigator could increase the dose at month 20 (visit 9E).
For patients continuing the same treatment in the extension who were not already treated with maximum dose (pasireotide LAR 60 mg or octreotide LAR 30 mg), a dose increase was permitted at any time when mean GH level was 2.5 mcg/L or higher and/or IGF-1 was greater than ULN.
All injections (pasireotide LAR and octreotide LAR) were administered by a clinical staff nurse of the investigator at each site.
Dosage decrease to pasireotide LAR 20 mg or octreotide LAR 10 mg every 4 weeks was permitted at any time in the event of tolerability issues.
For patients who were unable to tolerate the protocol-specified dosing scheme, dose adjustments and interruptions were permitted to keep the patient on the study drug.
Treatment could be terminated before 12 months for patients who did not respond to treatment, who experienced unacceptable toxicity, or who decided to discontinue the treatment for any reason.
Other investigational drugs, drugs known to affect GH or IGF-1 levels, or medications that might prolong the QT interval were prohibited during the study, and anticoagulants were avoided.
Study C2402
For the core phase, patients were randomized to 1 of the following 3 treatment arms in a ratio of 1:1:1:
Double-blind pasireotide LAR 40 mg intramuscular injection, once every 28 (plus or minus 2 days) for 24 weeks
Double-blind pasireotide LAR 60 mg intramuscular injection, once every 28 (plus or minus 2 days) for 24 weeks
Active, open-label control arm: Continuation on the same treatment that was received for at least 6 months before randomization with either octreotide LAR 30 mg intramuscular injection or lanreotide ATG 120 mg subcutaneous injection once every 28 (± 2 days) for 24 weeks.
For the extension phase, at week 24, patients randomized to the control arm could transition to the extension phase and start on the lowest pasireotide LAR dose if their acromegaly remained uncontrolled at the end of the core study. If acromegaly was controlled at week 24, they were not allowed to continue in the extension phase but could continue their treatment outside the study at the discretion of the investigator.
All injections (pasireotide LAR and active controls octreotide LAR and lanreotide ATG) were administered by a clinical staff nurse of the investigator at each site.
Pasireotide LAR 60 mg was administered as pasireotide LAR 20 mg plus pasireotide LAR 40 mg. Pasireotide LAR 40 mg was administered as pasireotide LAR 20 mg plus pasireotide LAR 20 mg to maintain blinding between the pasireotide LAR treatment arms.
For the active, open-label control arm, the same treatment with the maximum indicated dose of either octreotide LAR 30 mg intramuscular injection or lanreotide ATG 120 mg subcutaneous once every 28 (plus or minus 2 days) was continued for 24 weeks.
For patients who were unable to tolerate the protocol-specified dosing schedule in the pasireotide LAR treatment arms, dose adjustments were permitted to keep the patients on the study drug. Patients randomized to the pasireotide LAR treatment arms who did not tolerate the assigned 40 mg or 60 mg dose were permitted to decrease their dose by 20 mg. Patients received either a single 20 mg pasireotide LAR vial or a single 40 mg pasireotide LAR vial in double-blind fashion to maintain the blinded administration. Patients were returned to the 40 mg or 60 mg dose once the tolerability issue resolved. As octreotide LAR 30 mg and lanreotide ATG 120 mg were already used in their maximum indicated doses for at least 24 weeks before randomization, no further dose adjustments were expected. However, if patients did not tolerate the assigned dose (common terminology criteria for adverse events [CTCAE] grade ≥ 3 and assessed as study-drug-related), they were permitted to reduce the dose to the next available lower dose. Patients were returned to the initial dose once the tolerability issue resolved.
Other investigational drugs, drugs known to affect GH or IGF-1 levels, or medications that might prolong the QT interval were prohibited during the study, and anticoagulants were avoided.
Outcomes
A list of efficacy end points assessed in this clinical review report is provided in Table 6, followed by descriptions of the outcome measures. Summarized end points are based on outcomes included in the sponsor’s Summary of Clinical Evidence as well as any outcomes identified as important to this review according to the clinical expert(s) consulted for this review and input from patient and clinician groups and public drug plans. Using the same considerations, CDA-AMC selected end points that were considered most relevant to inform expert committee deliberations and finalized this list of end points in consultation with members of the expert committee. All summarized efficacy end points were assessed using GRADE. Selected notable harms outcomes considered important for informing expert committee deliberations were also assessed using GRADE.
The outcomes assessed using GRADE were determined in consultation with the clinical experts consulted by CDA-AMC on this review, as well as input from patients and the review team. The proportion of patients achieving biochemical control of acromegaly as well as the proportion of patients achieving normalization of IGF-1 were chosen as high-priority outcomes by the clinical experts and are both established as the key biomarkers in this condition. The clinical experts noted that these 2 biomarkers are what physicians use to monitor patient progress. Health-related quality of life, assessed using the AcroQoL, was also chosen as high priority by the clinical experts, acknowledging how important this outcome is to patients, and this was clearly echoed in patient input to CDA-AMC. Although 6 symptoms were reported in the included trials, fatigue and arthritis were identified as being the highest priority by clinical experts. Since arthritis was not specifically assessed in the trials, osteoarthralgia was used as a substitute.
Growth Hormone
In Study C2305, a patient’s 5-point mean GH level was assessed from a 2-hour profile after 1 hour at rest at the hospital and before the pasireotide LAR or control injection, if applicable. All GH 2-hour profiles before glucose intake were taken at the same time (morning at around 8 a.m.).
In Study C2402, the 5-point mean GH was assessed from a 2-hour profile after 1 hour at rest at the hospital at visit 1 (screening), visit 2 (baseline), visit 6 (week 12), and visit 10 (week 24, study completion). All GH assessments were based on such a profile. When no OGTT was required, scheduled time points for blood sampling at visit 2 (baseline) and visit 6 were 0, 30, 60, 90, and 120 minutes before drug administration. When an OGTT was required, the 5-point mean GH profile was done within a 2-hour time period before glucose intake. As a result, scheduled time points for blood sampling at visit 1 (screening) and visit 10 (study completion) were at 0, 30, 60, 90, and 120 minutes. Study drug or active control was administered at the end of the OGTT (at the earliest, 120 minutes after the end of the GH profile). All GH 2-hour profiles were taken at the same time in the morning. The samples for GH were analyzed by the central laboratory.
Insulin-Like Growth Factor 1
For Study C2305, a patient’s total IGF-1 levels were assessed. Sampling for IGF-1 was performed immediately before the pasireotide LAR or control injection, if applicable. If an OGTT measurement was performed, the IGF-1 sample was taken immediately before the glucose load and 2 hours before the pasireotide LAR or control injection. The GH and IGF-1 samples were analyzed by the central laboratory.
For Study C2402, total IGF-1 levels were assessed with 1 sample taken before drug administration at the same visits as GH. Blood sampling for IGF-1 was done before the administration of both study drug or active control and glucose, when applicable. This sample was taken together with the first sample of the GH profile. The samples for IGF-1 were analyzed by the central laboratory. All IGF-1 assessments are reported as standardized IGF-1, adjusted for sex and age. Assessment of blood secretion biomarkers, such as IGF-2 and insulin-like growth factor binding protein, were performed on sample remaining after IGF-1 assessment.
Symptoms of Acromegaly
In Study C2305, ring size and symptoms of acromegaly were collected monthly in the core and monthly for the first 6 months and every 3 months thereafter in the extension.
In Study C2402, ring size and symptoms were assessed at all visits (except visits 3 and 7).
In both studies, the investigator measured the patient’s ring size using the provided gauge (chosen and provided by the sponsor). Ring size was measured at the fourth digit of the nondominant hand. If a patient had a fourth digit size exceeding the highest size, the fifth digit of that hand was used for initial and follow-up investigation. The investigator also asked the patient to score the symptoms of acromegaly (headache, fatigue, perspiration, paresthesias, and osteoarthralgia) according to a 5-point scale (0 = absent, 1 = mild, 2 = moderate, 3 = severe, 4 = very severe). The measurement properties of the symptom scales are summarized in Table 7.
Quality of Life (AcroQoL)
In Study C2305, health-related quality of life information was collected monthly in the core and every 6 months in the extension.
In Study C2402, health-related quality of life was assessed at visits 2 (baseline), 4, 5, 6, 8, 9, and 10 using the AcroQoL. This self-administered questionnaire was provided in the country-specific languages. The questionnaire is unidimensional and contains 22 items divided into 2 scales: 1 that evaluates physical aspects (8 items) and another 1 that evaluates psychological aspects (14 items). The psychological scale is also divided into two 7-item subscales: 1 evaluates physical appearance and the other evaluates the impact of the disease on the personal relationships of the patient. For further information on assessment properties of this outcome, refer to Table 7.
Tumour Volume
MRI using gadolinium as contrast material: An MRI of the pituitary was performed during the screening period if possible, only after the patient’s eligibility for the study was confirmed and at visit 10 (study completion) in Study C2402 and at screening and months 6 and 12 in Study C2305. Patients with metal implants or claustrophobia did not have to perform an MRI. The MRIs were sent to a central reader for evaluation. To ensure consistency throughout all participating sites, the MRIs were performed and processed following the guidelines from the central reader facility, which were distributed to the sites before study start.
Table 6: Outcomes Summarized From the Studies Included in the Systematic Review
Outcome measure | Time point | Study C2305 | Study C2402 |
|---|---|---|---|
Proportion of patients achieving biochemical control (defined as mean GH levels < 2.5 mcg/L and normalization of sex- and age-adjusted IGF-1) | Study C2305: 12 months Study C2402: 24 weeks | Primarya | Primarya |
Proportion of patients achieving normalization of sex- and age-adjusted IGF-1 | Study C2305: 12 months Study C2402: 24 weeks | Key secondarya | Key secondarya |
Change from baseline in symptoms of acromegaly (headache, osteoarthralgia) | Study C2305: 12 months Study C2402: 24 weeks | Secondary | Secondary |
Change from baseline in acromegaly quality of life (AcroQoL) instrument | Study C2305: 12 months Study C2402: 24 weeks | Secondary | Secondary |
Change from baseline in tumour volume | Study C2305: 12 months Study C2402: 24 weeks | Secondary | Secondary |
AcroQoL = Acromegaly Quality of Life Questionnaire; GH = growth hormone; IGF-1 = insulin-like growth factor 1.
aStatistical testing for these end points was adjusted for multiple comparisons (e.g., hierarchical testing).
Source: Details included in the table are from the sponsor’s Summary of Clinical Evidence.
Table 7: Summary of Outcome Measures and Their Measurement Properties
Outcome measure | Type | Conclusions about measurement properties | MID |
|---|---|---|---|
AcroQoL27 | The questionnaire is unidimensional and contains 22 items divided into 2 scales: 1 evaluates physical aspects (8 items) and another evaluates psychological aspects (14 items). The psychological scale is also divided into 2 subscales: 1 evaluates physical appearance and another evaluates the impact of the disease on the personal relationships of the patient (7 items each). Each of the 22 items of the AcroQoL is answered on a 5-point Likert scale measuring either the frequency of occurrence (always, most of the time, sometimes, rarely, or never) or the degree of agreement with the items (completely agree, moderately agree, neither agree nor disagree, moderately disagree, completely disagree). A global score is obtained by adding the results of the 22 items using the following formula: ((♪𝓍♪ − 22) / (110 − 22)) × 100 where ♪𝓍♪ is the sum of the answers (between 1 and 5 for each answer) (from a minimum of 22 [worse] to 110 [best]) | Validity: The measurement properties (validity and reliability) of the resulting final questionnaire were tested and compared using standard procedures (Cronbach alpha and item-total correlation).27,28 Reliability: AcroQoL is a disease-specific questionnaire for acromegaly with good psychometric properties, which were measured initially in a descriptive study with a sample of 72 patients throughout Spain. The item-total correlation and the reliability and internal consistency evaluated by Cronbach alpha analysis of the different subscales of the 22-item questionnaire are expressed.28 Both the complete 22-item questionnaire and the 2 different scales of 8 and 14 items have a Cronbach alpha value > 0.8, which indicates high reliability and internal consistency.28 Responsiveness: A 6-month follow-up study was carried out to measure responsiveness to change. A sample of 95 patients with acromegaly was obtained, of which 36 (37.9%) were included in the group for responsiveness to change, and 59 (62.1%) in the reliability group. Responsiveness to change after medical or surgical treatment was measured in those patients with active acromegaly and compared with the results of the EQ-5D questionnaire. The results showed a statistically significant relationship between all the dimensions of AcroQoL and the VAS of the EQ-5D. Therefore, an improvement in the global score of AcroQoL is related to a global improvement in HRQoL.28 | An MID for acromegaly was not identified. However, other studies (Caron et al. [2016]) have used > 50% of the baseline standard deviation as a proxy.29 |
Acromegaly symptoms | Scored on a 5-point scale in Study C2402 and Study C2305 | Not available | No MID |
AcroQoL = Acromegaly Quality of Life Questionnaire; HRQoL = health-related quality of life; MID = minimal important difference; VAS = visual analogue scale.
Statistical Analysis
Sample Size and Power Calculation
Study C2305
In previous clinical studies with octreotide LAR in patients with newly diagnosed acromegalic (CSMS995B2401, CSMS995B2402), a 25% response rate (GH < 2.5 mcg/L and IGF-1 within the age- and sex-adjusted normal range) was observed, along with a 95% CI of 10.2% to 39.8%. In this study, patients who had not previously received medical treatment after first surgery were also eligible, and the response rate data in this stratum are not available from the previous studies. But the 2 strata are expected by the sponsor’s medical expert to show comparable response rates. Considering the relatively wider CI of the response rate from the previous study and the potential early withdrawal to dilute the treatment effect, a lower overall response rate for the octreotide group (20%) is assumed in both strata.
A phase II crossover study in acromegaly (CSOM230B2201) showed a 39% response rate across pasireotide subcutaneous dosages ranging from 200 mcg to 600 mcg twice daily. At the 600 mcg dose, the response rate was 36% across all time periods in this study. Therefore, a 35% response was assumed as the minimal response rate for the pasireotide LAR group. It was assumed that 75% and 25% of patients, respectively, would be enrolled in the strata of no previous treatment after first surgery and patients newly diagnosed with acromegaly. To detect an increase of 15% in response rate from 20% in octreotide LAR group to a 35% in pasireotide LAR group within each stratum (equivalently, OR equals 2.154), a sample size of 151 patients per group was considered adequate based on a 2-sided Cochran-Mantel-Haenszel (CMH) test at the 0.05 significance level with 80% power. Considering a possible 9% dropout rate in this study, a sample size of 330 (165 patients per group) was needed.
Study C2402
Response rate data (GH < 2.5 mcg/L and IGF-1 within the age- and sex-adjusted normal range) in this patient population were not available from previous studies with pasireotide. However, since patients recruited had inadequate control of acromegaly following prior treatment, the response rate was expected to be lower than in those patients who have had no previous medical treatment or those who have been newly diagnosed with acromegaly. The expected response rates and their difference (considered clinically significant) for this study were determined by a medical expert.
The sample size calculation was based on the primary efficacy variable (response as defined by GH < 2.5 mcg/L and IGF-1 within the age- and sex-adjusted normal range at 24 weeks). The assumptions for the sample size calculation were as follows:
Response rates at week 24 for pasireotide LAR groups (40 mg and 60 mg separately) were assumed to be 25%.
Response rate at week 24 for the active control group (continuing on same treatment) was assumed to be 5%.
The statistical null hypotheses of the primary efficacy variable were:
H1: The response rate in the pasireotide LAR 40 mg group was less than or equal to that in the active control group.
H2: The response rate in the pasireotide LAR 60 mg group was less than or equal to that in the active control group.
Each null hypothesis was tested against the 1-sided alternative that the response rate in the pasireotide LAR group was greater than that in the active control group.
Sample size was determined using simulation (software providing sample sizes for exact logistic regression testing of 2 comparisons [pasireotide arms separately versus active control], with the Bonferroni multiple test procedure not readily available). The simulation approach involved randomly generating data from a Bernoulli distribution according to the study assumptions (stated previously) for a large number of simulated trials (i.e., 20,000). Each simulated trial was analyzed using exact logistic regression. The power of the study was obtained by calculating the proportion of times at least 1 of the pasireotide LAR groups was significantly different from the active control group (applying the Bonferroni procedure). A sample size that guaranteed 90% power was chosen. The simulation was performed using SAS 9.2.
A sample size of 62 patients per treatment group (pasireotide LAR 60 mg, pasireotide LAR 40 mg, and active control [octreotide LAR 30 mg or lanreotide ATG 120 mg]) achieved 90% power to detect a difference of 20% in response rate between active control (5%) and pasireotide LAR (40 mg and 60 mg separately) (25%) with a family-wise error rate of 2.5% (1-sided).
The power calculation was based on the key secondary efficacy variable (IGF-1 within the age- and sexadjusted normal range at 24 weeks). The assumptions for the power calculation were as follows:
Response rates at week 24 for pasireotide LAR groups (40 mg and 60 mg separately) were assumed to be 30%.
Response rate at week 24 for the active control group (continuing on same treatment) was assumed to be 7%.
The statistical null hypotheses of the key secondary efficacy variable were:
H3: The response rate in the pasireotide LAR 40 mg group was less than or equal to that in the active control group.
H4: The response rate in the pasireotide LAR 60 mg group was less than or equal to that in the active control group.
Each null hypothesis was tested against the 1-sided alternative that the response rate in the pasireotide LAR group was greater than that in the active control group.
If a null hypothesis of the primary efficacy variable, H1 or H2, was rejected, then H3 or H4 were tested at the local significance level of 0.3 alpha / 2 = 0.00375 (at minimum).
A Fisher exact test, with a 0.00375 1-sided significance level, achieved 70% power to detect a difference of 23% in response rate between active control (7%) and pasireotide LAR (40 mg and 60 mg separately) (30%) when the sample size in each group was 62.
Statistical Test or Model
Study C2305
The primary objective was to compare the proportion of patients with a reduction of mean GH level to less than 2.5 mcg/L and normalization of IGF-1 to within normal limits (age- and sex-related) at month 12 between the 2 treatment groups. Thus, the primary variable was this reduction.
The null hypothesis was that there is no difference in the response rate between the 2 groups. The alternative hypothesis was that the response rates are different between pasireotide LAR and octreotide LAR. A 2-sided CMH test adjusting for randomization stratification factor was used to test the null hypothesis at the significance level of 0.05. The point estimate of OR along with 95% CI was provided for each randomization stratum as well as overall. In addition, the response rate was calculated along with the 95% exact (Clopper-Pearson) CI by randomization stratum and treatment group. The primary analysis was performed on the full analysis set (FAS) (Table 8).
If a patient had less than 3 samples for the assessment of 5-point mean GH from the 2-hour profile, the mean GH was considered as missing. If GH and IGF-1 measurements were taken more than 35 days after the date of injection, the values of GH (and mean GH) and/or IGF-1 at the corresponding visit were considered as missing. Only the data at or after month 6 were used to impute missing mean GH and/or IGF-1 based on last observation carried forward (LOCF) method for assessing the primary efficacy variable. Otherwise, patients were considered as not having experienced a response. When only 1 biochemical value (mean GH or IGF-1) was missing at month 12 and if the available biochemical value did not meet the response criteria set for the biochemical parameter, the patient was considered as not having experienced a response. On the other hand, if the available biochemical value met the response criteria, then both GH and IGF-1 were imputed using LOCF method from the same visit closest to month 12.
A patient who never received study drug was considered as not having experienced a response.
The primary analysis was repeated on the per-protocol set using LOCF described previously.
In addition, the primary analysis was repeated on the FAS, where a patient with missing value of mean GH or IGF-1 at month 12 or a patient who had withdrawn earlier from the study was considered as not having experienced a response.
Study C2402
The main analysis time point was when all patients had completed the week 24 visit or had discontinued early. The primary and key secondary end points were analyzed at that time point. All other secondary end points were analyzed either at week 24 or week 12.
The primary efficacy variable was the proportion of patients with a reduction of GH levels to less than 2.5 mcg/L and normalization of sex- and age-adjusted IGF-1 at 24 weeks.
The primary efficacy analysis was performed on the FAS.
The statistical null hypotheses of the primary efficacy variable were:
H1: The response rate in the pasireotide LAR 40 mg group was less than or equal to that in the active control group.
H2: The response rate in the pasireotide LAR 60 mg group was less than or equal to that in the active control group.
Each null hypothesis was tested against the 1-sided alternative that the response rate in the pasireotide LAR group was greater than that in the active control group.
An exact logistic regression model that adjusts for the randomization stratification factors (Hirji et al.) was used to test the null hypothesis. The exact 2-sided 95% and 97.5% CI for the common OR were calculated. A common OR greater than 1 indicated increased odds for the pasireotide LAR (40 mg or 60 mg) group compared to the active control group.
The procedure to control the family-wise type I error rate at significance level alpha for the multiple comparisons on the primary and key secondary efficacy variable is described after the key secondary end points are discussed.
If a patient had less than 3 samples for the assessment of the 5-point mean GH from the 2-hour profile, then the mean GH was considered as missing. In addition, if GH and IGF-1 measurements were taken after 35 days from the date of any injection of study drug, the values were considered as missing. A patient with missing values of mean GH or IGF-1 at 24 weeks or a patient who withdrew earlier from the study was considered as not having experienced a response.
The key secondary efficacy variable was the proportion of patients achieving normalization of sex- and age-adjusted IGF-1 at 24 weeks. The analysis method was described earlier (i.e., exact logistic regression was used to test the null hypotheses associated with the key secondary efficacy variable). The same rule for handling missing values, as specified in the analysis of the primary efficacy variable, was used.
Multiple Testing Procedure
Study C2305
The Simes test controls the type I error under positive dependence among test statistics. The Simes test was conducted after pasireotide LAR demonstrated superiority over octreotide LAR in the primary efficacy variable. This finding of superiority may imply a positive dependence of the effect of pasireotide LAR assessed by reduction of GH to less than 2.5 mcg/L alone and normalization of IGF-1 alone. In a phase II study (CSOM230B2201), 20 of 51 patients (39%) treated with pasireotide subcutaneous showed a clinically significant reduction (> 20%) in tumour volume compared to baseline at the end of the 16-week treatment period. In addition, pasireotide enhanced binding affinity to other receptor subtypes (human SSTR1, 3, and 5) compared to octreotide. Therefore, assuming the effects of pasireotide LAR compared with octreotide LAR using key secondary efficacy variables are nonnegatively dependent is more reasonable than assuming they are negatively dependent.
The following are the hypotheses for primary and key secondary efficacy end points:
H1: The proportions of patients with a mean GH less than 2.5 mcg/L and the normalization of IGF-1 at month 12 are the same between 2 treatment groups.
H2: The proportions of patients with a mean GH less than 2.5 mcg/L at month 12 are the same between 2 treatment groups.
H3: The proportions of patients with the normalization of IGF-1 at month 12 are the same between 2 treatment groups.
H4: The changes in tumour volume from baseline at 12 months for 2 treatment groups are the same.
Hypotheses H2, H3, and H4 will be tested only if the hypothesis H1 has been rejected.
Study 2402
A gatekeeping procedure was used that combined hierarchical (i.e., primary objective and key secondary objective) and simultaneous testing based on the Simes inequality. With this approach, strong control of the family-wise type I error rate at significance level alpha was ensured for the multiple comparisons, i.e., the 2 treatment arm comparisons: pasireotide LAR (40 mg and 60 mg separately) versus active control on the primary and key secondary efficacy variable (IGF-1 within the age- and sex-adjusted normal range at 24 weeks).
The 4 null hypotheses were tested using the gatekeeping procedure based on the graphical approach proposed by Bretz et al.30 In addition, the trimmed version of the weighted Simes test was applied to relax the condition of positive regression-dependent test statistics (Maurer et al.).31
No multiplicity adjustment was made to test the secondary end points. Nominal P values and CIs for these secondary end points were provided for exploratory purposes only and should be interpreted with caution.
Data Imputation Methods
For data imputation methods please refer to Table 8.
Subgroup Analyses
Study C2305
Subgroup analyses defined by race, ethnicity, and age group (< 65, ≥ 65) for the primary efficacy end point were performed on FAS using observed data if the number of patients in the subgroup was large enough.
Study C2402
Exploratory subgroup analyses, defined by randomization stratification factors, race, ethnicity, and age group (< 65, ≥ 65) for the primary efficacy end point were performed on the FAS using observed data if the number of patients in the subgroup was large enough. These analyses were performed only if the primary end point was met and were purely exploratory and intended to explore the uniformity of any treatment effects found overall.
Sensitivity Analyses
For sensitivity analyses, please refer to Table 8.
Secondary Outcomes of the Studies
Study C2305
Acromegaly symptoms: For each of the acromegaly symptoms (ring size, headache, fatigue, perspiration, paresthesias, and osteoarthralgia), the change from baseline scores was summarized at each visit. Change in severity from baseline to month 12 in headache, fatigue, perspiration, paresthesias, and osteoarthralgia was compared between the 2 treatment groups using a 2-sided Wilcoxon rank sum test. Shift tables from baseline to the most extreme postbaseline value were presented for acromegaly symptoms other than ring size. In addition, stacked histograms by visit and treatment were provided for acromegaly symptoms other than ring size.
Change of ring size at month 12 from baseline was compared between the 2 treatment groups using an analysis of covariance (ANCOVA) model, with treatment as the fixed effect and ring size at baseline, hand (left or right), finger (fourth or fifth), and randomization stratum as covariates.
AcroQoL: Health-related quality of life information was collected using the AcroQoL. Data were examined for any covariates that may have impacted symptom changes over time. Changes in scores for the questionnaire were examined from baseline to study end and between visits.
If more than 25% of answers were missing, results could not be considered valid. Thus, for AcroQoL, if more than 5 answers were missing for the total score, more than 2 for the physical score, more than 3 for the psychological score, or more than 1 for each psychological subscore, the results were not included in the corresponding total or subscore.
The change from baseline in total score and subscores at month 12 was analyzed using the ANCOVA model with treatment group as the fixed effect and baseline scores and randomization stratum as covariates.
Absolute and percent change from baseline were descriptively summarized by visit for each randomized treatment. Mean and standard error of percent change from baseline were also plotted by treatment.
Study C2402
Acromegaly symptoms: For each of the acromegaly symptoms (ring size, headache, fatigue, perspiration, paresthesia, and osteoarthralgia), the change from baseline scores was summarized at each visit. Change in severity from baseline at week 24 in headache, fatigue, perspiration, paresthesia, and osteoarthralgia were compared between the treatment groups using a 2-sided van Elteren test adjusting for the randomization stratification factors. Shift tables from baseline to the last postbaseline value were also presented for acromegaly symptoms except ring size.
The actual change in ring size at 24 weeks from baseline were compared between the treatment groups using an ANCOVA model with treatment group, ring size at baseline, hand (left or right), finger (fourth or fifth), and randomization stratum as covariates.
Acromegaly quality of life (AcroQoL): The change from baseline in the AcroQoL total score and subscores at week 24 were compared between the treatment groups using an ANCOVA model with treatment group, baseline scores, and randomization stratum as covariates. The changes in scores for the AcroQoL were examined from baseline to study end and between visits.
Table 8: Statistical Analysis of Efficacy End Points
End point | Statistical model | Adjustment factors | Handling of missing data | Sensitivity analyses |
|---|---|---|---|---|
Study C2305 | ||||
Primary end point (proportion of patients with a reduction of GH to < 2.5 mcg/L [based on a 5-point 2-hour profile] and normalized IGF-1 [i.e., LLN ≤ IGF-1 ≤ ULN, age- and sex-related] at month 12) | The null hypothesis was that there is no difference in the response rate between pasireotide LAR and octreotide LAR. The alternative hypothesis was that the response rates are different between the 2 groups. A 2-sided CMH test adjusting for randomization stratification factor was used to test the null hypothesis at the significance level of 0.05. In addition, the point estimate of odds ratio along with the 2-sided 95% CI was provided for each randomization stratum as well as overall. The response rate was also calculated with the 2-sided 95% exact (Clopper-Pearson) CI by randomization stratum and treatment group. | NR | If a patient had less than 3 samples for the assessment of 5-point mean GH from the 2-hour profile, the mean GH was considered to be missing. If GH and IGF-1 measurements were taken more than 35 days after the LAR injection, the GH (and mean GH) and/or IGF-1 at the corresponding visit were considered to be missing. | The primary analysis was also performed on the PP set. As a sensitivity analysis to the primary efficacy end point on the FAS, a patient with missing GH or IGF-1 at month 12, or who had discontinued before month 12, was considered as not having experienced a response. In addition, following a GCP audit conducted by Novartis at 2 sites in Mexico (730 and 731), additional sensitivity analyses, excluding the 22 patients from the 2 sites, were conducted. These changes were made before the month 26 database lock and unblinding of the study and are documented in the Reporting and Analysis Plan. |
Key secondary end points (proportion of patients with GH < 2.5 mcg/L, with normalization of IGF-1) | If the result of the primary analysis was statistically significantly favouring the pasireotide LAR treatment group, all key secondary efficacy variables were tested using the closed multiple testing method based on the weighted version of Simes test to control the overall type I error rate at 5%. The proportion of patients with a reduction of GH to < 2.5 mcg/L at month 12 and with normalization of IGF-1 at month 12 were analyzed using CMH test adjusting for randomization stratification factor. | NR | NR | NR |
Change from baseline in tumour volume at month 12 | Key secondary efficacy variables were to be tested using the closed multiple testing method based on the weighted version of Simes test to control the overall type I error rate at 5%. Change of tumour volume at month 12 from baseline was compared between the 2 treatment groups using ANCOVA model with treatment as the fixed effect and tumour volume at baseline and randomization stratum as covariates. | NR | NR | NR |
Study C2402 | ||||
Primary end point (proportion of patients with a reduction of mean GH levels to < 2.5 mcg/L and normalization of sex- and age-adjusted IGF-1 at 24 weeks) | An exact logistic regression model that adjusts for the randomization stratification factors was used to test the null hypothesis. The exact 2-sided 95% and 97.5% CIs for the common OR were calculated. A common OR > 1 indicates an increased odds for the pasireotide LAR (40 mg or 60 mg) group compared to the active control group. The procedure to control the family-wise type I error rate at significance level alpha for the multiple comparisons on the primary and key secondary efficacy variable is described after the key secondary end points are discussed. | NR | If a patient had less than 3 samples for the assessment of the 5-point mean GH from the 2-hour profile, then the mean GH was considered as missing. In addition, if GH and IGF-1 measurements were taken after 35 days from the date of any injection of study drug, the values were considered as missing. A patient with missing values of mean GH or IGF-1 at 24 weeks or a patient who withdrew earlier from the study was considered as not having experienced a response. | If the primary end point is met, a sensitivity analysis was added for the primary efficacy variable by imputing missing values of mean GH and IGF-1 at 12 and 24 weeks from any postrandomization visit using the LOCF method. Values at the screening and/or baseline visit were not carried forward (e.g., a patient with only values at the screening and/or baseline visit was considered as not having experienced a response). The same logistic regression stated earlier was used, but without stratification (i.e., no stratum included in the model), to compare treatment groups within each stratum. For each stratum, the odds ratio and corresponding exact 2-sided 95% CI and P values were presented as stated earlier. |
Key secondary end point (proportion of patients achieving normalization of sex- and age-adjusted IGF-1 at 24 weeks) | Same as primary end point | NR | Same as primary end point | NR |
Secondary end points (percentage change of tumour volume, acromegaly symptoms, AcroQoL) | ANCOVA | NR | NR | NR |
AcroQoL = Acromegaly Quality of Life; ANCOVA = analysis of covariance; CI = confidence interval; CMH = Cochran-Mantel-Haenszel; FAS = full analysis set; GH = growth hormone; IGF-1 = insulin-like growth factor 1; LAR = long-acting release; LLN = lower limit of normal; LOCF = last observation carried forward; NR = not reported; OR = odds ratio; PP = per protocol; ULN = upper limit of normal.
Source: Details included in the table are from the sponsor’s Summary of Clinical Evidence.32
Analysis Populations
Table 9: Analysis Populations of Study C2305 and Study C2402
Population | Definition | Application |
|---|---|---|
Study C2305 | ||
Full analysis set (FAS) | Consists of all patients randomized into the study. Patients will be analyzed according to the treatment they were assigned to at randomization. | Analyses of primary and all secondary efficacy end points |
Per-protocol set (PP) | Consists of a subset of the patients in the FAS who are more compliant with the protocol and is characterized by criteria such as the following:
| Analyses of primary efficacy end points |
Safety analysis set (SAS) | Consists of all patients who received any study medication with a valid postbaseline assessment. | Analyses of safety end points |
Pharmacokinetic (PK) analysis set | Consists of patients with at least 1 LAR injection and 1 postdose trough concentration data. | Analyses of pharmacokinetic data |
Crossover analysis set (CAS) | All patients whose first treatment in the extension was different from the first dose in the core. CAS was used for both efficacy and safety analyses. The results were presented by the type of crossover (crossed over to octreotide LAR or crossed over to pasireotide LAR). | Analyses of efficacy and safety end points |
Study C2402 | ||
FAS | Comprised all patients who were randomized. Following the intention-to-treat principle, patients were analyzed according to the study drug they were assigned to at randomization and actual stratum. | Analyses of primary and all secondary efficacy end points |
PP set | A subset of the patients in the FAS who received at least 1 dose of study treatment and did not have any major protocol deviations. | Analyses of primary efficacy end points |
SAS | All patients who received at least 1 dose of study medication with a valid postbaseline safety assessment. The statement that a patient had no AE constituted a valid safety assessment. Analysis was conducted according to the study treatment first received during the study. The safety set was used for all safety analyses. | Analyses of safety end points |
PK set | All patients who received at least 1 dose of pasireotide LAR and who had at least 1 evaluable postdose PK measurement. | Analyses of pharmacokinetic data |
CAS = crossover analysis set; FAS = full analysis set; LAR = long-acting release; PK = pharmacokinetic; PP = per-protocol; SAS = safety analysis set.
Source: Details included in the table are from the sponsor’s Summary of Clinical Evidence.32
Results
Patient Disposition
In Study C2305, in the core phase, 35 patients (19.9%) discontinued from the study in the pasireotide group, and 26 patients (14.3%) discontinued in the octreotide group. The most common reason for study discontinuation was AE in the pasireotide group (14 patients, 8.0%) and protocol deviation and unsatisfactory therapeutic effect in the octreotide group (8 patients, 4.4%). In Study C2402, 6 patients (9.3%) in the pasireotide 40 mg group, 8 patients (12.3%) in the pasireotide 60 mg group, and 3 patients (4.4%) in the active control group discontinued from the study. The most common reason for discontinuation was AE and withdrawal of consent in the pasireotide group (2 patients, 3.1%) and withdrawal of consent (2 patients, 2.9%) in the active control group.
Table 10: Summary of Patient Disposition From Studies Included in the Systematic Review
Patient disposition | Study C2305 | Study C2402 | |||
|---|---|---|---|---|---|
Pasireotide LAR (n = 176) | Octreotide LAR (n = 182) | Pasireotide LAR 40 mg (n = 65) | Pasireotide LAR 60 mg (n = 65) | Active control (n = 68) | |
Screened, N | NR | NR | NR | NR | NR |
Randomized, N (%) | 176 (100.0) | 182 (100.0) | 65 (100) | 65 (100) | 68 (100) |
Patients treated, completed month 12 (core phase) | 141 (80.1) | 156 (85.7) | NR | NR | NR |
Discontinued from core study, n (%) | 35 (19.9) | 26 (14.3) | 6 (9.3) | 8 (12.3) | 3 (4.4) |
Reason for discontinuation, n (%) | |||||
AE | 14 (8.0) | 6 (3.3) | 2 (3.1) | 4 (6.2) | 0 |
Protocol deviation | 7 (4.0) | 8 (4.4) | 0 | 1 (1.5) | 1 (1.5) |
Unsatisfactory therapeutic effect | 5 (2.8) | 8 (4.4) | NR | NR | NR |
Patient withdrew consent | 5 (2.8) | 3 (1.6) | 2 (3.1) | 2 (3.1) | 2 (2.9) |
Administrative problems | 2 (1.1) | 0 | 2 (3.1) | 1 (1.5) | 0 |
Abnormal laboratory value(s) | 1 (0.6) | 0 | NR | NR | NR |
Lost to follow-up | 1 (0.6) | 0 | NR | NR | NR |
Death | 0 | 1 (0.5) | NR | NR | NR |
Patients entered extension and continued the same treatment | |||||
n (%) | 74 | 46 | 57 (87.7) | 54 (83.1) | 62 (91.2) |
Completed study at month 26 | NA | 31 (67.4) | NR | NR | NR |
Continued beyond month 26a | 51 (68.9) | 5 (10.9) | NR | NR | NR |
Discontinued between month 12 and month 26 | 23 (31.1) | 10 (21.7) | NR | NR | NR |
Patient withdrew consent | 9 (12.2) | 2 (4.3) | NR | NR | 1 (1.5) |
Unsatisfactory therapeutic effect | 3 (4.1) | 3 (6.5) | NR | NR | NR |
Administrative problems | 3 (4.1) | 2 (4.3) | NR | NR | NR |
Lost to follow-up | 3 (4.1) | 1 (2.2) | NR | NR | NR |
AE | 2 (2.7) | 1 (2.2) | NR | NR | NR |
Abnormal laboratory value(s) | 2 (2.7) | 0 | NR | NR | NR |
Death | 1 (1.4) | 1 (2.2) | NR | NR | NR |
Patients entered extension and crossed over | Crossed over to pasireotide | Crossed over to octreotide | NR | NR | NR |
n (%) | 81 | 38 | NR | NR | NR |
Completed study at month 26 | NA | 25 (65.8) | NR | NR | NR |
Continued beyond month 26a | 50 (61.7) | 0 | NR | NR | NR |
Discontinued between month 12 and month 26 | 31 (38.3) | 13 (34.2) | NR | NR | NR |
AE | 12 (14.8) | 1 (2.6) | NR | NR | NR |
Patient withdrew consent | 8 (9.9) | 4 (10.5) | NR | NR | NR |
Unsatisfactory therapeutic effect | 7 (8.6) | 4 (10.5) | NR | NR | NR |
Administrative problems | 1 (1.2) | 4 (10.5) | NR | NR | NR |
Subjects condition no longer requires study drug | 2 (2.5) | 0 | NR | NR | NR |
Abnormal laboratory value(s) | 1 (1.2) | 0 | NR | NR | NR |
Full analysis set, N (%) | 176 (100.0)b | 182 (100.0)b | 65 (100.0) | 65 (100.0) | 68 (100.0) |
Per protocol set, N (%) | 161 (91.5)b | 171 (94.0)b | 54 (83.1) | 50 (76.9) | 66 (97.1) |
Safety analysis set, N (%) | 178 (101.1)b | 180 (98.9)b | 63 (96.9) | 62 (95.4) | 59 (86.8) |
Pharmacokinetic set, N (%) | 172 (97.7)b | 178 (97.8)b | 63 (96.9) | 62 (95.4) | NA |
Crossover analysis set, N (%) | 81 (100) | 38 (100) | NA | NA | NA |
AE = adverse event; LAR = long-acting release; NA = not applicable; NR = not reported.
Note: Percentage is based on the number of patients who entered the extension and continued the same treatment. This was captured as a protocol deviation. Death includes only those patients for whom death was reported as the primary reason for discontinuation of therapy.
aPatients who received octreotide in extension phase were not followed further in the study after month 26.
bUp to crossover.
Source: Study C230525 and C2402 Clinical Study Report.26
Baseline Characteristics
The baseline characteristics outlined in Table 11 are limited to those that are most relevant to this review or were felt to affect the outcomes or interpretation of the study results.
Across both studies, patients were approximately 45 years of age, and there were slightly more females than males (52% in Study C2305 and 55% in Study C2402). The majority of patients were white in each study (60% in Study C2305 and 81% in Study C2402). Patients had been diagnosed with acromegaly for approximately 20 months in Study C2305 and for approximately 72 weeks in Study C2402.
Table 11: Summary of Baseline Characteristics From Studies Included in the Systematic Review
Characteristic | Study C2305 | Study C2402 | |||
|---|---|---|---|---|---|
Pasireotide LAR (n = 176) | Octreotide LAR (n = 182) | Pasireotide LAR 40 mg (n = 65) | Pasireotide LAR 60 mg (n = 65) | Active control (n = 68) | |
Age (years) | |||||
Mean (SD) | 45.1 (12.37) | 45.6 (12.97) | 42.9 (14.05) | 45.8 (14.07) | 46.2 (13.11) |
Median (range) | 46.0 (18 to 80) | 45.0 (19 to 85) | 46.0 (18 to 80) | 45.0 (20 to 83) | 46.5 (18 to 74) |
Age category (years), n (%) | |||||
< 65 | 168 (95.5) | 167 (91.8) | 62 (95.4) | 57 (87.7) | 63 (92.6) |
≥ 65 | 8 (4.5) | 15 (8.2) | 3 (4.6) | 8 (12.3) | 5 (7.4) |
Sex, n (%) | |||||
Female | 91 (51.7) | 95 (52.2) | 38 (58.5) | 35 (53.8) | 38 (55.9) |
Male | 85 (48.3) | 87 (47.8) | 27 (41.5) | 30 (46.2) | 30 (44.1) |
Race, n (%)a | |||||
Asian | 39 (22.2) | 43 (23.6) | 3 (4.6) | 1 (1.5) | 0 |
Black | 3 (1.7) | 4 (2.2) | 3 (4.6) | 8 (12.3) | 4 (5.9) |
Caucasian | 105 (59.7) | 111 (61) | 53 (81.5) | 52 (80.0) | 56 (82.4) |
Native American | 6 (3.4) | 5 (2.7) | 2 (3.1) | 1 (1.5) | 1 (1.5) |
Other | 23 (13.1) | 19 (10.4) | 4 (6.2) | 3 (4.6) | 7 (10.3) |
BMI (kg/m2) | |||||
Mean (SD) | 28.8 (4.58) | 28.7 (5.17) | 29.1 (4.97) | 29.8 (6.20) | 29.5 (5.69) |
Median (range) | 28.1 (19.0 to 44.4) | 27.8 (19.5 to 55.8) | 28.4 (20 to 42.1) | 27.5 (21.8 to 49.9) | 28.2 (19.2 to 48) |
Time since diagnosis of acromegaly (months) | |||||
Mean (SD) | 20.1 (45.70) | 19.6 (41.52) | 66.4 (60.98) | 75.0 (65.46) | 80.1 (75.59) |
Median (range) | 5.6 (0.4 to 357.5) | 6.4 (0.4 to 377.1) | 50 (10.1 to 336.9) | 54.5 (7.9 to 356.6) | 53.8 (8.1 to 357.4) |
Months (%) | |||||
< 6 | 91 (51.7) | 87 (47.8) | NR | NR | NR |
≥ 6 to < 12 | 36 (20.5) | 45 (24.7) | 6 (9.2) | 3 (4.6) | 4 (5.9) |
≥ 12 to < 24 | 17 (9.7) | 18 (9.9) | 14 (21.5) | 6 (9.2) | 11 (16.2) |
≥ 24 to < 60 | 17 (9.7) | 15 (8.2) | 19 (29.2) | 26 (40.0) | 22 (32.4) |
≥ 60 | 15 (8.5) | 17 (9.3) | 26 (40.0) | 30 (46.2) | 31 (45.6) |
Patients with prior surgery, n (%) | 71 (40.3) | 80 (44.0) | NR | NR | NR |
Previous radiation | |||||
External beam radiation | NR | NR | 2 (3.1) | 2 (3.1) | 5 (7.4) |
Gamma-knife therapy | NR | NR | 0 | 1 (1.5) | 0 |
Time since previous surgery (months) | |||||
n (%) | 71 (40.3) | 80 (44.0) | 50 (76.9) | 41 (63.1) | 41 (60.2) |
Mean (SD) | 27.9 (50.22) | 29.2 (56.31) | 58.3 (64.85) | 73.9 (51.34) | 69.9 (66.26) |
Median (range) | 9.5 (1.6 to 328.8) | 6.2 (1.2 to 377.1) | 32 (3.5 to 336.9) | 66 (20.5 to 228.8) | 43.7 (5.1 to 239.7) |
Time since previous surgery, months (%) | |||||
< 3 | 13 (18.3) | 20 (25.0) | NR | NR | NR |
≥ 2 to < 6 | NR | NR | 1 (1.5) | 0 | 2 (2.9) |
≥ 3 to < 6 | 13 (18.3) | 18 (22.5) | NR | NR | NR |
≥ 6 to < 12 | 17 (23.9) | 17 (21.3) | 10 (15.4) | 0 | 2 (2.9) |
≥ 12 to < 24 | 9 (12.7) | 8 (10.0) | 10 (15.4) | 4 (6.2) | 7 (10.3) |
≥ 24 to < 60 | 8 (11.3) | 2 (2.5) | 14 (21.5) | 16 (24.6) | 14 (19.1) |
≥ 60 | 11 (15.5) | 15 (18.8) | 15 (23.1) | 21 (32.3) | 17 (25.0) |
BMI = body mass index; LAR = long-acting release; NR = not reported; SD = standard deviation.
aCategories listed are as reported in study.
Source: Study C2305 Clinical Study Report25 and Study C2402 Clinical Study Report — Table 11-2 and 11-3.26
Exposure to Study Treatments
Study C2305
Duration of exposure to study drug in the core phase was comparable between the treatment arms (Table 12). The mean duration of exposure was 300.8 days in the pasireotide group and 315.7 days in the octreotide group. The median number of injections was 12 in both groups, and more than 80% of patients had received more than 9 injections.
Two patients in the pasireotide group and 6 patients in the octreotide group mistakenly received a 13th injection in the core phase and did not enter the extension study.
Study C2402
The total treatment duration with pasireotide LAR 40 mg, pasireotide LAR 60 mg, octreotide LAR 30 mg, or lanreotide ATG 120 mg was 24 weeks. The total study duration was 28 weeks, including the screening phase. Patients in all treatment groups received intramuscular injections once every 28 plus or minus 2 days for 24 weeks, and more than 90% of patients received all 6 planned injections in the core phase. Note that 13 patients in the control arm were incorrectly reported as having more than 6 injections due to errors in reporting.
The median duration of exposure to study drug was 152.1 weeks (range: 12 to 304 weeks) in the pasireotide LAR 40 mg arm and 149.6 weeks (range: 4 to 295 weeks) in the pasireotide LAR 60 mg arm. More than half of patients in the pasireotide 40 mg group (60.3%) and in the pasireotide 60 mg group (59.7%) received more than 24 injections, with the median number of injections being 38.0 and 37.5 in the respective groups.
The median duration of exposure to study drug was 201.6 weeks (range: 16 to 268 weeks) in the crossover to pasireotide arm. More than half of patients in the crossover to pasireotide arm (67.7%) received more than 24 injections, with the median number of injections being 49.0.
Concomitant Medications and Co-Interventions
Study C2305
Use of concomitant medication and significant nondrug therapies before start of study drug was reported for 68.7% of all patients, as expected for this patient population.
After start of study drug and up to crossover, use of concomitant medication was reported for most patients (95.5% in the pasireotide group and 90.0% in the octreotide group). Use of concomitant medication was as expected and comparable between the treatment groups, with nonsteroidal anti-inflammatory drugs (e.g., paracetamol, ibuprofen) and antihypertensive medication (e.g., angiotensin-converting enzyme inhibitors, beta-blockers, angiotensin II receptor antagonists), statins, proton pump inhibitors, and glucocorticoids being most common. Use of glucose-lowering medication (e.g., metformin, insulin, and sulfonylureas such as glimepiride and gliclazide) was more common in the pasireotide group than the octreotide group.
After crossover, use of concomitant medication was reported for most patients (88.9% for crossover to pasireotide, and 97.4% for crossover to octreotide). Use of concomitant medication was comparable between the treatment groups except for antidiabetic medication.
Study C2402
Use of concomitant medication and significant nondrug therapies after the start of study drug was reported for 95.2% of patients in the pasireotide LAR 40 mg arm and 91.9% of patients in the pasireotide LAR 60 mg arm. The type of concomitant medications used was as expected for this patient population. Use of concomitant medication and significant nondrug therapies after start of study drug was reported for 98.4% of patients who crossed over to the pasireotide arm.
Table 12: Summary of Patient Exposure From Studies Included in the Systematic Review (Core Phase)
Exposure | Study C2305 | Study C2402 | |||
|---|---|---|---|---|---|
Pasireotide LAR (n = 178) | Octreotide LAR (n = 180) | Pasireotide LAR 40 mg (n = 65) | Pasireotide LAR 60 mg (n = 65) | Active control (n = 68) | |
Duration of exposure | |||||
N | 178 | 180 | 63 | 62 | 66 |
Duration of exposure, mean (SD) | Days: 300.8 (89.22) | Days: 315.7 (71.59) | Weeks: 23.67 (2.461) | Weeks: 23.28 (3.471) | Weeks: 24.45 (2.581) |
Median (range) | Days: 336.0 (28.0 to 372.0) | Days: 336.0 (28.0 to 391.0) | Weeks: 24 (11.9 to 28.0) | Weeks: 24 (4.0 to 26.0) | Weeks: 24 (8.1 to 29.9) |
Number of injections | |||||
Median (range) | 12 (1 to 13) | 12 (1 to 13) | 6 (3 to 6) | 6 (1 to 6) | 6 (2 to 8) |
1 injection | 9 (5.1%) | 6 (3.3%) | 0 | 1 (1.6) | 0 |
> 1 to ≤ 3 injections | 4 (2.2%) | 2 (1.1%) | 2 (3.2) | 2(3.2) | 1 (1.5) |
> 3 to ≤ 6 injections | 7 (3.9%) | 4 (2.2%) | 61 (96.8) | 59 (95.2) | 52 (78.8) |
> 6 to ≤ 9 injections | 12 (6.7%) | 7 (3.9%) | NR | NR | NR |
> 9 to ≤ 12 injections | 144 (80.9%) | 155 (86.1%) | NR | NR | NR |
> 12 to ≤ 15 injections | 2 (1.1%) | 6 (3.3%) | NR | NR | NR |
> 6 injections | NR | NR | 0 | 0 | 13 (19.7) |
LAR = long-acting release; NR = not reported; SD = standard deviation.
Efficacy Results
Proportion of Patients With a Reduction of GH Level to Less Than 2.5 mcg/L and Normalization of IGF-1
Study C2305: The proportion of patients who experienced a response (i.e., patients with GH < 2.5 mcg/L and normalized IGF-1) at month 12 was 31.3% (95% CI, 24.5% to 38.7%) in the pasireotide arm, and 19.2% (95% CI, 13.8% to 25.7%) in the octreotide arm, with an OR of 1.942 (95% CI, 1.190 to 3.168) in favour of pasireotide.
When analyzed by stratum, the response rates were slightly higher for patients who were postsurgery (2.337; 95% CI, 1.140 to 4.790), while the difference between the treatments was less marked for patients with de novo acromegaly (1.654; 95% CI, 0.846 to 3.234).
The results of the analysis of the primary efficacy end point for the per-protocol set and for the set in which patients with missing values were considered as not have experienced a response were consistent with the primary efficacy analysis.
Study C2402: In the pasireotide LAR 40 mg arm, 10 patients (15.4%) experienced biochemical control at 24 weeks compared with none in the active control arm (OR = 16.63; 95% CI, 3.32 to not calculable). In the pasireotide LAR 60mg arm, 13 patients (20.0%) experienced biochemical control at 24 weeks (OR = 23.03; 95% CI, 4.72 to not calculable).
Insulin-Like Growth Factor 1
Study C2305: The proportion of patients with normalized IGF-1 was 38.6% (95% CI, 31.4% to 46.3%) in the pasireotide arm and 23.6% (95% CI, 17.7% to 30.5%) in the octreotide arm, with an OR of 2.087 (95% CI, 1.316 to 3.308) in favour of pasireotide. By stratum, the response rate for patients postsurgery was 50.7% for pasireotide and 26.9% for octreotide; for patients with de novo acromegaly, the response rate was 30.5% for pasireotide and 21.2% for octreotide.
There were also 8 patients in the pasireotide arm and 3 patients in the octreotide arm who had an over-response, that is, their IGF-1 decreased to less than the lower limit of normal at month 12. These patients are not included in the number of patients who experienced normalization of IGF-1.
Study C2402: The proportion of patients who experienced normalization of IGF-1 at week 24 (key secondary efficacy variable) was higher in both the pasireotide 40 mg group, at 24.6% (95% CI, 14.77% to 36.87%), and the pasireotide 60 mg group, at 26.2% (95% CI, 16.03% to 38.54%) among those who experienced a response compared to the active control arm (zero experienced a response), for an OR of 30.12 (95% CI, 6.28 to not calculable; P < 0.0001) in the pasireotide 40 mg group and 32.66 (95% CI, 6.84 to not calculable; P < 0.0001) in the pasireotide 60 mg group.
Acromegaly Quality of Life
Study C2305: The AcroQoL scale ranges from 22 (worst) to 110 (best). From a baseline mean of 58.4 (SD = 19.97) in the pasireotide group (n = 173) and 55.6 (SD = 19.79) in the octreotide group (n = 178), the AcroQoL total score mean change from baseline to 12 months was 7.0 (SD = 14.54) in the pasireotide group (n = 133) and 4.9 (SD = 15.50) in the octreotide group (n = 146).
Study C2402: At baseline, mean AcroQoL scores were ████ ██████) in the pasireotide 40 mg group (n = 62), ████ ███████ in the pasireotide 60 mg group (n = 60), and ████ ██████) in the active control group. At week 24, the mean change from baseline in AcroQoL total score was ███ ██████) in the pasireotide 40 mg group (n = 57), ███ ███████ in the pasireotide 60 mg group (n = 55), and ███ ███████ in the active control group (n = 62).
Symptoms of Acromegaly
Study C2305: The symptoms scale used by the sponsor ranged from 0 (absent) to 4 (severe). From a mean baseline of 0.9 (SD = 1.05) in the pasireotide group (n = 175) and 1.0 (SD = 1.14) in the octreotide group (n = 181), after 12 months, the mean change from baseline in headache scores was −0.3 (SD = 1.17) in the pasireotide group (n = 138) and −0.4 (SD = 0.94) in the octreotide group (n = 149). From a mean baseline of 1.0 (SD = 1.05) in the pasireotide group (n = 174) and 1.3 (SD = 1.26) in the octreotide group (n = 178), after 12 months, the mean change from baseline in osteoarthralgia scores was −0.4 (SD = 1.07) in the pasireotide group (n = 137) and −0.6 (SD = 1.20) in the octreotide group (n = 146).
Study C2402: From a mean baseline of ████████) in the pasireotide 40 mg group (n = 65), ███ (████) in the pasireotide 60 mg group (n = 64), and ███ █████) in the active control group (n = 67), after 24 weeks, the mean change from baseline in headache scores was ████ ██████ in the pasireotide 40 mg group (N = 59). ████ █████) in the pasireotide 60 mg group (n = 58), and ████ █████) in the active control group (n = 65). From a mean baseline of ███ ██████ in the pasireotide 40 mg group (n = 63), ███ ██████ in the pasireotide 60 mg group (n = 64), and ███ ██████ in the active control group (n = 67), after 24 weeks, the mean change from baseline in osteoarthralgia scores was ███ ██████ in the pasireotide 40 mg group (n = 59), ███ █████) in pasireotide 60 mg (n = 58), and ████ ██████ in the active control group (n = 65).
Tumour Volume
Study C2305: From a mean baseline of 2,420.7 mm3 (SD = 4,159.21 mm3) in the pasireotide group and 2,259.2 (SD = 3,390.2 mm3) in the octreotide group, by month 12, mean tumour volume decreased by 987.1 mm3 (SD = 2,448.14 mm3) in the pasireotide group, and 801.2 mm3 (SD = 1,676.62 mm3) in the octreotide group. Similar decreases were observed with both treatments in both strata (patients postsurgery and patients with de novo acromegaly).
Study C2402: The proportion of patients in the FAS with a reduction of more than 25% in tumour volume at week 24 was 12 patients (18.5%) for pasireotide LAR 40 mg, 7 patients (10.8%) for pasireotide LAR 60 mg, and 1 patient (1.5%) for active control.
Table 13: Summary of Key Efficacy Results From Studies Included in the Systematic Review
Variable | Study C2305 | Study C2402 | |||
|---|---|---|---|---|---|
Pasireotide LAR | Octreotide LAR | Pasireotide LAR 40 mg (n = 65) | Pasireotide LAR 60 mg (n = 65) | Active control (n = 68) | |
Primary end point: Proportion of patients with a reduction of GH level to < 2.5 mcg/L and normalization of IGF-1 | |||||
Overall, n (%) | 55 of 176 (31.3) | 35 of 182 (19.2) | 10 of 65 (15.4) | 13 of 65 (20.0) | 0 of 68 |
95% CI for % | (24.5 to 38.7) | (13.8 to 25.7) | (7.63 to 26.48) | (11.10 to 31.77) | (0 to 5.28) |
OR vs. active control | 1.942 | 16.63 | 23.03 | ||
95% CI for OR | (1.190 to 3.168) | (3.32 to not calculable) | (4.72 to not calculable) | ||
P value | 0.007 | 0.0006 | < 0.0001 | ||
Key secondary end point: Patients with IGF-1 response | |||||
Overall, n (%) (95% CI) | 68 of 176 (38.6) | 43 of 182 (23.6) | 16 (24.6) | 17 (26.2) | 0 |
95% CI for % | (31.4 to 46.3) | (17.7 to 30.5) | (14.77 to 36.87) | (16.03 to 38.54) | (0 to 5.28) |
OR vs. active control | 2.087 | 30.12 | 32.66 | ||
95% CI for OR | (1.316 to 3.308) | (6.28 to not calculable) | (6.84 to not calculable) | ||
P value | 0.002 | < 0.0001 | < 0.0001 | ||
AcroQoL total scores | |||||
Baseline, mean (SD) | 58.4 (19.97) n = 173 | 55.6 (19.79) n = 178 | ████ ██ n = 62 | ████ ██ n = 60 | ████ n = 64 |
Change from baseline to month 12 or week 24, mean (SD) | 7.0 (14.54) n = 133 | 5.9 (15.50) n = 146 | ███████ n = 57 | ██████ n = 55 | ███ n = 62 |
Symptoms | |||||
Headache, mean (SD) | |||||
Baseline | 0.9 (1.05) n = 175 | 1.0 (1.14) n = 181 | ███████ n = 63 | ███ █████ n = 64 | ███ █ n = 67 |
Change from baseline to month 12 or week 24 | −0.3 (1.17) n = 138 | −0.4 (0.94) n = 149 | ████ ██ n = 59 | ████ ████ n = 58 | ███ █ n = 65 |
Osteoarthralgia, mean (SD) | |||||
Baseline | 1.0 (1.05) n = 174 | 1.3 (1.26) n = 178 | ███ ████ n = 63 | ███ █████ n = 64 | ███ █ n = 67 |
Change from baseline to month 12 or week 24 | −0.4 (1.07) n = 137 | −0.6 (1.20) n = 146 | ████ ███ n = 59 | ████ ████ n = 58 | ████ █ n = 65 |
AcroQoL = Acromegaly Quality of Life Questionnaire; CI = confidence interval; GH = growth hormone; IGF1 = insulin-like growth factor; LAR = long-acting release; OR = odds ratio; SD = standard deviation.
Source: Details included in the table are from the sponsor’s Summary of Clinical Evidence.32
Harms
Adverse Events
Study C2305
Most patients experienced at least 1 AE during the core phase of the study. The most frequent event in both treatment groups was diarrhea (39.3% versus 45.0% for pasireotide versus octreotide). AEs that were more frequent (at least 5% difference) in the pasireotide than the octreotide group were all related to glucose metabolism: hyperglycemia, diabetes mellitus, blood glucose increased, and type 2 diabetes mellitus. AEs that were more frequent (at least 5% difference) in the octreotide group were diarrhea, cholelithiasis, headache, and nausea.
The incidence of grade 3 or 4 AEs was slightly higher in the pasireotide group ███████ than the octreotide group ████████; this difference was mainly due to a higher proportion of grade 3 or 4 hyperglycemia-related AEs (e.g., hyperglycemia, diabetes mellitus) in the pasireotide group.
Study C2402
The majority of patients in all 3 treatment groups experienced at least 1 treatment- emergent AE during the study. Metabolism and nutrition disorders was the most frequent SOC in all 3 treatment groups and the SOC with the largest difference between pasireotide LAR and active control groups (63.5% and 62.9% for pasireotide LAR 40 mg and 60 mg versus 33.3% for active control). The difference was primarily due to a higher incidence of hyperglycemia-related AEs among patients on pasireotide LAR. Other SOCs where the incidence was at least 10% higher in at least 1 of the pasireotide LAR groups than active control were gastrointestinal disorders (33.3% and 27.4% versus 18.2%), and nervous system disorders (20.6% and 9.7% versus 10.6%).
The highest incidence of grade 3 and 4 AEs by SOC was reported for metabolism and nutrition disorders (11.1% and 14.5% versus 0%; primarily hyperglycemia-related AEs). These AEs were all grade 3, with the exception of 1 grade 4 event (grade 4 deep vein thrombosis).
The most frequently reported AEs in all 3 treatment groups, with at least a 10% difference between pasireotide LAR 40 mg and pasireotide LAR 60 mg versus active control groups, were hyperglycemia (33.3% and 30.6% versus 13.6%), diabetes mellitus (20.6% and 25.8% versus 7.6%), and diarrhea (15.9% and 19.4% versus 4.5%). Overall, grade 3 or 4 AEs were reported more frequently in the pasireotide LAR 40 mg and pasireotide LAR 60 mg groups compared to the active control group. This difference was mainly due to grade 3 or 4 hyperglycemia-related AEs (e.g., hyperglycemia, diabetes mellitus) in both pasireotide LAR groups. Four patients in the pasireotide 40 mg group had a first-degree atrioventricular block. In addition, 1 patient in the pasireotide 60 mg group had an atrioventricular block. These events were all grade 1. No dose adjustment was required for any these events. For 3 of the 5 patients, atrioventricular block was present before start of treatment.
Serious Adverse Events
Study C2305
The incidence of individual serious AEs (SAEs) was low, with the most frequent SAE being cholelithiasis (7 patients in total, 4 in the pasireotide group and 3 in the octreotide group). SAEs that occurred only in the pasireotide group (and in at least 2 patients) were diabetes mellitus (3 patients), acromegaly (2 patients), concomitant disease progression (2 patients), and nephrolithiasis (2 patients). Conversely, upper abdominal pain (2 patients) was the only SAE that occurred only in the octreotide group (and in at least 2 patients).
SAEs related to glucose metabolism and to study drug were reported for 5 patients in the pasireotide group (3 patients with diabetes mellitus, 1 patient with hyperglycemia, and 1 patient with diabetic hyperglycemic coma) and 1 patient in the octreotide group (hypoglycemia). Three of the 5 patients with glucose-metabolism-related SAEs in the pasireotide group discontinued the study drug.
Of the 2 patients with SAEs of concomitant disease progression (both in the pasireotide group), 1 was a patient with worsening of kidney stones (unrelated to the study drug), and the other a patient for whom worsening of diabetes mellitus was reported both as concomitant disease progression and as diabetes mellitus (suspected to be study drug–related).
Study C2402
Few patients overall had SAEs: 6 patients (9.5%) in the pasireotide LAR 40 mg group, 2 patients (3.2%) in the pasireotide LAR 60 mg group, and 3 (4.5%) in the active control group. SAEs that were suspected by the investigator to be related to study drug were reported only in the pasireotide groups (3 patients in total). In the pasireotide LAR 40 mg group, 1 patient had SAEs of anemia and hyperglycemia and 1 patient had an SAE of increased blood glucose. These SAEs were all grade 1 to 2 and were managed with additional therapy; neither patient required hospitalization or discontinuation of study drug.
In the pasireotide LAR 60 mg group, 1 patient was hospitalized due to grade 3 SAEs of abdominal abscess (considered unrelated to study drug) and hyperglycemia on the day that the last (sixth) injection of pasireotide LAR was administered. The SAEs resolved with treatment, and the patient was released from hospital.
Withdrawals Due to Adverse Events
Study C2305
AEs leading to discontinuation were slightly more frequent in the pasireotide group (9.0%) than in the octreotide group (5.0%) (Table 14). Apart from diabetes mellitus and hyperglycemia, each was reported for no more than 1 patient in each group. AEs leading to discontinuation after crossover were reported only for patients who crossed over to pasireotide (16.0%) (Table 14). Apart from 1 case of discontinuation due to alcohol abuse, these AEs were all related to glucose metabolism. Note that 14 patients discontinued due to AEs after crossing to pasireotide, whereas the number of patients with AEs leading to discontinuation was 13. The difference is because 1 patient discontinued treatment due to diabetes mellitus on the same day they started crossover pasireotide treatment. In addition, 1 patient was listed as having discontinued due to an AE after switching to octreotide, but this was not reported as an AE leading to discontinuation. In fact, the patient discontinued because they became pregnant. They then had a spontaneous abortion, which was reported as an SAE. As the reason for discontinuation was pregnancy, the event is not captured as an AE leading to discontinuation in Table 14.
Study C2402
Seven patients (3 in the pasireotide LAR 40 mg group and 4 in the pasireotide LAR 60 mg group) had AEs that led to discontinuation. Six of the 7 patients discontinued due to hyperglycemia-related events, all of which were considered related to study drug by the investigator. The remaining AE of colon cancer was an SAE (unrelated to study drug); none of the other AEs leading to discontinuation were serious. No AEs leading to discontinuation were reported in the active control group.
Mortality
Study C2305
There was 1 death in the octreotide group and no deaths in the pasireotide group. The death was due to a myocardial infarction and was considered unrelated to the study drug.
Study C2402
There were no deaths in Study C2402.
Notable Harms
Study C2305
In the core phase, the only AE category of special interest that occurred with a higher frequency in the pasireotide group (at least 5% difference) was hyperglycemia-related AEs (57.3% versus 21.7% for pasireotide versus octreotide).
In the octreotide group, the following AE categories of special interest occurred with a higher frequency (at least 5% difference, octreotide versus pasireotide): diarrhea-related AEs (45.0% versus 39.3%), gallbladder and biliary-related AEs ██████ ███ ███████ and nausea-related AEs (█████ ███ ███████ There were no clear differences between groups in bradycardia and QT-prolongation-related AEs.
Study C2402
The most frequent category in all treatment groups was hyperglycemia-related AEs: 66.7% and 61.3% in the pasireotide LAR 40 mg and 60 mg groups and 30.3% in the active control group. Hyperglycemia-related events that were severe (grade 3) were only reported in the pasireotide LAR groups, and none were grade 4. Gallbladder- and biliary-related AEs were also common and equally frequent on all 3 treatments (█████ ██ ███████; the most frequent was cholelithiasis. None of these events were SAEs. Apart from hyperglycemia-related AEs, the only other AE category with a clearly higher incidence reported in the pasireotide LAR groups than in the active control group was diarrhea-related events (15.9% and 19.4% on pasireotide LAR 40 mg and 60 mg versus 4.5% on active control). In addition to the patient with an AE of liver injury, 4 patients had AEs related to the category of “liver safety”: 2 patients in the pasireotide LAR 40 mg group (grade 1 ALT increased, grade 2 “liver function test abnormal”), 1 patient in the pasireotide LAR 60 mg group (ALT and GGT increased, both grade 1), and 1 patient in the active control (AST and GGT increased, both grade 1). The event “liver function test abnormal” and the ALT elevations resolved without intervention. There were no events of QT prolongation in the study, and 5 patients (7.9%) in the pasireotide 40 mg group, 2 (3.1%) patients in the pasireotide 60 mg group, and no patients in the active control group had bradycardia.
Table 14: Summary of Harms Results: Study C2305 (SAS), Core Phase
Preferred term, n (%) | Pasireotide LAR n = 178 | Octreotide LAR n = 180 | ||
|---|---|---|---|---|
All grades | Grade 3 or 4 | All grades | Grade 3 or 4 | |
Total | 168 (94.4) | 49 (27.5) | 163 (90.6) | 38 (21.1) |
AE occurring in 10% of patients in any group | ||||
Diarrhea | 70 (39.3) | 1 (0.6) | 81 (45.0) | 4 (2.2) |
Hyperglycemia | 51 (28.7) | 6 (3.4) | 15 (8.3) | 1 (0.6) |
Cholelithiasis | 46 (25.8) | 1 (0.6) | 64 (35.6) | 2 (1.1) |
Diabetes mellitus | 34 (19.1) | 9 (5.1) | 7 (3.9) | 0 |
Headache | 33 (18.5) | 2 (1.1) | 46 (25.6) | 5 (2.8) |
Abdominal pain | 32 (18.0) | 1 (0.6) | 40 (22.2) | 0 |
Alopecia | 32 (18.0) | 0 | 35 (19.4) | 0 |
Nasopharyngitis | 28 (15.7) | 0 | 28 (15.6) | 0 |
Nausea | 24 (13.5) | 1 (0.6) | 39 (21.7) | 0 |
Blood creatine phosphokinase increased | 23 (12.9) | 3(1.7) | 21 (11.7) | 4 (2.2) |
Abdominal distension | 21 (11.8) | 1 (0.6) | 21 (11.7) | 1 (0.6) |
Arthralgia | 17 (9.6) | 1 (0.6) | 22 (12.2) | 1 (0.6) |
Fatigue | 17 (9.6) | 1 (0.6) | 18 (10.0) | 0 |
Dizziness | 17 (9.6) | 0 | 19 (10.6) | 0 |
SAEs | ||||
Total | 35 (19.7) | 26 (14.6) | 27 (15.0) | 18 (10.0) |
Occurring in at least 2 patients in either group | ||||
Cholelithiasis | 4 (2.2) | 3 (1.7) | 3 (1.7) | 2 (1.1) |
Diabetes mellitus | 3 (1.7) | 3 (1.7) | 0 | 0 |
Acromegaly | 3 (1.7) | 2 (1.1) | 0 | 0 |
Cholecystitis | 2 (1.1) | 1 (0.6) | 1 (0.6) | 1 (0.6) |
Cholecystitis, acute | 2 (1.1) | 2 (1.1) | 1 (0.6) | 1 (0.6) |
Concomitant disease progression | 2 (1.1) | 2 (1.1) | 0 | 0 |
Nephrolithiasis | 2 (1.1) | 2 (1.1) | 0 | 0 |
Notable harms | ||||
Any category of AE of interest | 148 (83.1) | 27 (15.2) | 144 (80) | 19 (10.6) |
Hyperglycemia-related AEs | 102 (57.3) | 16 (9.0) | 39 (21.7) | 3 (1.7) |
Diarrhea-related AEs | 70 (39.3) | 1 (0.6) | 81 (45.0) | 4 (2.2) |
Gallbladder- and biliary-related AEs | ██ █ | ████ | ██ ██ | █████ |
Nausea-related AEs | ██ █ | ████ | ██ ██ | █████ |
Pancreatitis-related AEs | 28 (15.7) | 1 (0.6) | 28 (15.6) | 3 (1.7) |
Bradycardia-related AEs | 27 (15.2) | 0 | 24 (13.3) | 1 (0.6) |
Rhabdomyolysis-related AEs | 23 (12.9) | 3 (1.7) | 21 (11.7) | 4 (2.2) |
Liver safety–related AEs | 17 (9.6) | 2 (1.1) | 15 (8.3) | 2 (1.1) |
Low blood cell–related AEs | 16 (9.0) | 1 (0.6) | 15 (8.3) | 1 (0.6) |
Injection site reaction–related AEs | 13 (7.3) | 0 | 12 (6.7) | 0 |
QT prolongation–related AEs | 12 (6.7) | 2 (1.1) | 10 (5.6) | 1 (0.6) |
Hypothyroidism-related AEs | 11 (6.2) | 0 | 9 (5.0) | 0 |
Constipation-related AEs | 8 (4.5) | 0 | 17 (9.4) | 0 |
AE = adverse event; LAR = long-acting release; SAE = serious adverse event; SAS = safety analysis set.
Source: Study C2305 Clinical Study Report Table 12-7.25
Table 15: Summary of Harms Results: Study C2402 (SAS), Core Phase
Preferred term, n (%) | Study C2402 | |||||
|---|---|---|---|---|---|---|
Pasireotide LAR 40 mg (n = 63) | Pasireotide LAR 60 mg (n = 62) | Active control (n = 66) | ||||
All grades | Grade 3 or 4 | All grades | Grade 3 or 4 | All grades | Grade 3 or 4 | |
Total | 58 (92.1) | 11 (17.5) | 53 (85.5) | 12 (19.4) | 49 (74.2) | 5 (7.6) |
AE occurring in 10% of patients, any group | ||||||
Hyperglycemia | 21 (33.3) | 7 (11.1) | 19 (30.6) | 5 (8.1) | 9 (13.6) | 0 |
Diabetes mellitus | 13 (20.6) | 0 | 16 (25.8) | 2 (3.2) | 5 (7.6) | 0 |
Diarrhea | 10 (15.9) | 0 | 12 (19.4) | 0 | 3 (4.5) | 1 (1.5) |
Cholelithiasis | 6 (9.5) | 0 | 8 (12.9) | 0 | 9 (13.6) | 0 |
Nasopharyngitis | 4 (6.3) | 0 | 7 (11.3) | 0 | 2 (3.0) | 0 |
Headache | 9 (14.3) | 0 | 2 (3.2) | 0 | 3 (4.5) | 0 |
SAEs | ||||||
Total | 6 (9.5) | 2 (3.2) | 2 (3.2) | 2 (3.2) | 3 (4.5) | 2 (3.0) |
SAE reported in more than 1 patient | 0 | 0 | 0 | 0 | 0 | 0 |
Notable harms | ||||||
Hyperglycemia-related AEs | 42 (66.7) | 7 (11.1) | 38 (61.3) | 9 (14.5) | 20 (30.3) | 0 |
Diarrhea-related AEs | 10 (15.9) | 0 | 12 (19.4) | 0 | 3 (4.5) | 1 (1.5) |
Gallbladder- and biliary-related AEs | ████ | █████ | █████ | █████ | ██ █ | ███ |
Nausea-related AEs | 4 (6.3) | 0 | 4 (6.5) | 0 | 2 (3.0) | 1 (1.5) |
Bradycardia-related AEs | 5 (7.9) | 0 | 2 (3.2) | 0 | 0 | 0 |
Low blood cell–related AEs | 4 (6.3) | 0 | 2 (3.2) | 0 | 2 (3.0) | 0 |
Constipation-related AEs | 3 (4.8) | 0 | 1 (1.6) | 0 | 1 (1.5) | 0 |
Hypotension-related AEs | 0 | 0 | 1 (1.6) | 0 | 0 | 0 |
Injection site reaction–related AEs | 0 | 0 | 1 (1.6) | 0 | 2 (3.0) | 0 |
Liver safety–related AEs | 2 (3.2) | 0 | 1 (1.6) | 0 | 1 (1.5) | 0 |
Rhabdomyolysis-related AEs | 0 | 0 | 1 (1.6) | 0 | 0 | 0 |
Hypocortisolism-related AEs | 1 (1.6) | 0 | 0 | 0 | 0 | 0 |
Pancreatitis-related AEs | 2 (32) | 0 | 0 | 0 | 1 (1.5) | 0 |
AE = adverse event; LAR = long-acting release; SAE = serious adverse event; SAS = safety analysis set.
Source: Study C2402 Clinical Study Report.26
Critical Appraisal
Internal Validity
The open-label design of Study C2402 may bias assessment of health-related quality of life and symptoms in that study but should be less impactful for laboratory parameters. Study C2305 was a double-blind study and therefore not as susceptible to bias due to patient and clinician knowledge of their assigned treatment group. Even in a blinded study, however, there is potential for unblinding due to the clear imbalance in the well-known AEs of pasireotide, mainly hyperglycemia. That said, it is unclear whether any unblinding occurred and also unclear whether this might have biased results.
Although the procedure for randomization appeared to be adequate, there were some differences between groups with respect to baseline characteristics, mainly in Study C2402. For example, in Study C2402, there were differences between pasireotide and active control groups in the mean time since diagnosis of acromegaly (66.4 [SD = 60.98] months in the pasireotide group compared to 80.1 [SD = 75.59] months in the active control group), the number of patients who had previous surgery (50 patients [SD = 76.9%] in the pasireotide group versus 41 patients [SD = 60.2%] in the active control group), and the mean time since previous surgery (58.3 [SD = 64.85] months in the pasireotide group and 69.9 [SD = 66.26] months in the octreotide group). The clinical experts did not believe that these differences would bias results.
The AcroQoL instrument, used in both included studies, appears to be a validated instrument used to assess health-related quality of life in acromegaly. However, there does not appear to be an established MID for the AcroQoL. According to the sponsor, the instrument used to assess symptoms in the included studies has not been validated and there is no known MID. There is a validated symptom scale designed for acromegaly, known as ACRODAT. However, according to the clinical experts, this scale was developed more recently and would not have been available at the time the included studies were designed and executed. The lack of MID for each of these patient-reported outcomes makes it difficult to assess precision for these outcomes and determine whether results would be clinically meaningful.
There was a large number of patients who discontinued from Study C2305 and a larger number of withdrawals in the pasireotide group (20%) than in the octreotide group (14%). The difference in withdrawals can be accounted for by the difference in withdrawals due to AEs, affecting 8% of patients in the pasireotide group and 3% in the octreotide group. Although there were fewer withdrawals in Study C2402, there were also more patients who withdrew in the pasireotide group than in the active control group (9% versus 4%). A large number of withdrawals, such as occurred in Study C2305, may compromise the balance between treatment groups achieved through stratification. This potential for unbalanced groups is even greater when there is a difference in the number of withdrawals between groups, as was the case in Study C2305. A large number of withdrawals or a difference in the number of withdrawals between groups may have also biased key efficacy assessments, such as the primary outcome. A large number of withdrawals and a differential rate of withdrawals may bias assessment of harms as well, as patients in the pasireotide group have less exposure to the drug compared to patients in the octreotide group. In this specific case, the difference in mean exposure was 16 days; therefore, less exposure to pasireotide may have understated the harms associated with pasireotide compared to octreotide.
The difference in withdrawals resulted in a considerable amount of missing data for patient-reported outcomes such as symptoms and AcroQoL scores. For example, in Study C2305, data for over 20% of the original intention-to-treat (ITT) population were missing for headache, fatigue, and osteoarthralgia assessments reported at month 12. For AcroQoL, there was more missing data, with data reported for only 133 of 176 patients in the pasireotide group at month 12 (i.e., missing one-quarter of the ITT population). There was much less missing data in Study C2402, as less than 10% of the ITT population were missing for AcroQoL and for the symptoms outcomes.
An additional issue related to disposition is that the number of patients screened, and the number who were ineligible at screening, were not reported in either of the included studies. Knowledge of the number of patients who were ineligible at screening and the reasons for ineligibility helps to determine whether the populations in the included studies represent a highly selected, and perhaps less generalizable, population of patients with acromegaly.
Patients in Study C2402 were either randomized to 1 of 2 doses of pasireotide or continued on their current treatment (octreotide or lanreotide). Because patients whose current therapy was inadequately controlling their acromegaly were enrolled in the study, this means that patients in the active control group continued on treatment that they were not responding to. This could bias efficacy results in favour of pasireotide, as there is no reason to think that patients in the active control group would suddenly improve on a therapy that was already not controlling their acromegaly. Additionally, with respect to harms, patients in the active control group had already demonstrated that they could tolerate their SSA treatment and therefore represent a selected population that is less likely to exhibit tolerability issues during the study, in this case biasing results against pasireotide.
External Validity
The cut-off values that are used to indicate “normalization” for GH have changed over time, and this is a potential generalizability issue when trying to interpret findings from both of the included trials. The clinical experts did not think this represented a significant generalizability issue because they view IGF-1 as a more important biomarker than GH, and the cut-off for a normal IGF-1 has not changed. Otherwise, both with respect to demographic and disease characteristics, the clinical experts believed that the populations in both included studies were consistent with the patients they would expect to use the drug in Canada.
The clinical experts noted that the dose of octreotide used in both studies (20 mg in Study C2305; 30 mg in Study C2402) was lower than the 40 mg dose that would be used in clinical practice. They noted that the octreotide 20 mg dose may be the standard in other countries but not in Canada. Given that patients in Study C2402 had to be on a maximal dose of octreotide before being enrolled in the study, these patients may have been undertreated and then continued on the same, low dose of octreotide. Ultimately, this may have also biased efficacy results in favour of pasireotide and biased results for harms in favour of octreotide in both studies.
In the 2 included studies, the enrolled populations represent the patients most likely to be eligible for pasireotide in Canada. The study population in Study C2305 more closely addresses the indication (patients who had previous surgery or for whom surgery was not an option or had not been curative) and that in Study C2402 more closely addressed the reimbursement request for pasireotide (patients with inadequately controlled acromegaly despite treatment with lanreotide or octreotide).
GRADE Summary of Findings and Certainty of the Evidence
Methods for Assessing the Certainty of the Evidence
For pivotal studies and RCTs identified in the sponsor’s systematic review, GRADE was used to assess the certainty of the evidence for outcomes considered most relevant to inform expert committee deliberations, and a final certainty rating was determined as outlined by the GRADE Working Group.33,34
High certainty: We are very confident that the true effect lies close to that of the estimate of the effect.
Moderate certainty: We are moderately confident in the effect estimate — The true effect is likely to be close to the estimate of the effect, but there is a possibility that it is substantially different. We use the word “likely” for evidence of moderate certainty (e.g., “X intervention likely results in Y outcome”).
Low certainty: Our confidence in the effect estimate is limited — The true effect may be substantially different from the estimate of the effect. We use the word “may” for evidence of low certainty (e.g., “X intervention may result in Y outcome”).
Very low certainty: We have very little confidence in the effect estimate — The true effect is likely to be substantially different from the estimate of effect. We describe evidence of very low certainty as “very uncertain.”
Following the GRADE approach, evidence from RCTs started as high-certainty evidence and could be rated down for concerns related to study limitations (which refers to internal validity or risk of bias), inconsistency across studies, indirectness, imprecision of effects, and publication bias. When possible, certainty was rated in the context of the presence of an important (nontrivial) treatment effect; if this was not possible, certainty was rated in the context of the presence of any treatment effect (i.e., the clinical importance is unclear). Normally, the target of the certainty-of-evidence assessment was based on the point estimate and where it was located relative to the threshold for a clinically important effect (when a threshold was available) or to the null. However, in this review, these point estimates for risk difference (for those with GH and IGF-1 response and those with IGF-1 response) and for mean difference between groups (symptom scores) were not available from the sponsor. Therefore, reliable estimates of precision could not be made. For the AcroQoL, a between-group MD with 95% CI was reported. However, no MID was available in the literature, so the null was used as the target of certainty.
For the GRADE assessments, findings from Study C2305 and Study C2402 were considered together and summarized narratively per outcome because these studies were similar in population, interventions, design, and outcome measures.
The selection of outcomes for GRADE assessment was based on the sponsor’s Summary of Clinical Evidence, consultation with clinical experts, and input received from patient and clinician groups and public drug plans. The following list of outcomes was finalized in consultation with expert committee members:
patients with normalization of GH and IGF-1 (primary outcome of both included studies)
patients with normalization of IGF-1
change from baseline in AcroQoL
change from baseline in symptoms (headache, osteoarthralgia)
notable harms: hyperglycemia
Results of GRADE Assessments
The GRADE summary of findings for pasireotide versus other SSAs is presented in Table 2.
Long-Term Extension Studies
No additional long-term extension studies are reported by the sponsor, and long-term data for Study C2402 are presented in Systematic Review section.
Indirect Evidence
Contents within this section have been informed by materials submitted by the sponsor. The following have been summarized and validated by the review team.
Objectives for the Summary of Indirect Evidence
In the absence of direct evidence comparing pasireotide LAR and pegvisomant, the sponsor performed an ITC. The goal of this section is to summarize and critically evaluate the sponsor-submitted ITC, which used the Bucher ITC method to estimate the effectiveness of pasireotide LAR compared to pegvisomant monotherapy and pegvisomant in combination with SSAs.35
Description of Indirect Comparison(s)
The criteria and methods used for study selection in the ITC are outlined in Table 16. The ITC authors mentioned that the systematic searches were conducted according to the UK National Institute for Health and Care Excellence (NICE) standards. However, they did not clearly explain the details of how the systematic review was conducted or report its results or the criteria used to select the 3 included studies.
Table 16: Study Selection Criteria and Methods for ITCs Submitted by the Sponsor
Characteristics | Indirect comparison |
|---|---|
Population | Adult patients with acromegaly that is inadequately controlled |
Intervention | Pasireotide LAR is administered with a starting dosage of 40 mg and a high dosage of 60 mg once every 28 days. |
Comparators | Pegvisomant is administered once daily grouped into 3 different dosages (10 mg, 15 mg, and 20 mg). Octreotide LAR or lanreotide ATG (somatostatin analogue) Placebo |
Outcome | IGF-1 normalization |
Study designs | All studies included in the NMA were randomized control trials and registries. |
Publication characteristics | All studies included in the NMA were published. |
Exclusion criteria | No common comparators, heterogenous population, or any outcome not specified under the inclusion criteria. |
Databases searched | NR |
Selection process | NR |
Data extraction process | NR |
Quality assessment | NR |
IGF-1 = insulin-like growth factor 1; LAR = long-acting release; ATG = autogel; NMA = network meta-analysis; NR = not reported.
Source: Signifor ITC.35
ITC Design
Objectives
The purpose of this ITC was to evaluate how pasireotide compares to SSAs and pegvisomant in treating adult patients with acromegaly who cannot undergo surgery or for whom surgery was not successful. It specifically focused on patients whose condition is not adequately controlled with first-generation SSAs.
Study Selection Methods
A feasibility assessment was conducted using factors such as study design, eligibility criteria, baseline characteristics, and outcomes. This assessment found that no RCTs used a common comparator to evaluate the effectiveness and safety of pasireotide compared to other second-line treatments (such as pegvisomant monotherapy or combination regimens involving SSAs, pegvisomant, and dopamine agonists). Key outcomes of interest included GH control, IGF-1 normalization per study definition, tumour volume reduction, and safety. There was no description about methods used to conduct the databases searched, select studies, extract data, and assess the quality of studies.
ITC Analysis Methods
The Bucher fixed-effects model was used, due to the small number of studies. Details of the ITC analysis methods are summarized in Table 17. In Study C2402, no patients allocated to the active control arm presented normalized IGF-1 levels at the end of study. To estimate the OR for the comparison against both pasireotide groups, the event rate was artificially increased by adding 0.5 to all study arms. This assumption might influence findings of the analyses performed. Hence, a 1-way sensitivity analysis was conducted by the sponsor to assess the model’s calculation of the OR comparing the 2 different doses of pasireotide LAR to the active control group in Study C2402. For this, 1 was added to the ORs of all studies. The authors assumed equivalent follow-up lengths, based on evidence indicating a stable patient response by the end of each follow-up period, which is in line with the data reported in the 3 included studies. For example, the Trainer et al. (2000)19 study reported stable average serum IGF-1 levels after 2 weeks of pegvisomant treatment, while Study C2402 found similar mean standardized IGF-1 level at 12 and 24 weeks. The Trainer et al. (2009)36 study observed a significant reduction in mean serum IGF-1 levels by week 8, followed by a gradual decline until week 40.
The sponsor’s ITC report analyzed only IGF-1 normalization as an outcome. The reason provided by the sponsor was that pegvisomant does not affect GH levels, and there was no consistent measurement of tumour volume reduction among the studies. Furthermore, due to the assumption that the SSAs arm in Study C2402 and the placebo arm in the Trainer et al. (2000) study had similar efficacy in terms of IGF-1 normalization, it was not possible to compare the safety of pasireotide LAR and pegvisomant. This is because safety comparisons between an active treatment and a placebo cannot be considered equivalent, according to the authors of the ITC.
Table 17: ITC Analysis Methods
Methods | Description |
|---|---|
Analysis methods | Bucher fixed-effects model in accordance with NICE standards. The choice of the fixed-effects model vs. a random-effects model was based on the low number of studies identified. All analyses performed hereafter compared treatments using the odds ratio outcome framework. |
Priors | NR |
Assessment of model fit | NR |
Assessment of consistency | NR |
Assessment of convergence | NR |
Outcomes | IGF-1 normalization based on laboratory normal range |
Follow-up time points | The duration of the 3 studies included in the analysis ranged between 12 weeks and 40 weeks. For the development of the indirect comparison, it was assumed that patients had experienced stable response at the end of the respective follow-up periods. |
Construction of nodes | NR |
Sensitivity analyses | A 1-way sensitivity analysis was conducted to determine the impact in the model of calculating the OR for the comparison between either dose of pasireotide LAR and the active control group in Study C2402 by adding 1 to all study arms. |
Subgroup analysis | NR |
Methods for pairwise meta-analysis | NR |
ITC = indirect treatment comparison; IGF-1 = insulin-like growth factor 1; LAR = long-acting release; NR = not available; NICE = National Institute for Health and Care Excellence; OR = odds ratio.
Source: Signifor ITC.35
Results of ITC
Summary of Included Studies
A summary of the key characteristics of the 3 included trials is presented in Table 18. Among the 3 included studies, 2 studies (C2402 and Trainer et al. [2000]) had a double-blind randomized trial design, and the Trainer et al. (2009) study was an open-label randomized clinical trial. Patients included in C2402 and Trainer et al. (2009) studies were similar: patients whose acromegaly was inadequately controlled with SSA treatment. However, patients included in the Trainer et al. (2000) study were different: the study contains a mixed population (naive, medically naive, and previously medically treated). Follow-up duration for outcome assessment differed among the studies and was 24, 12, and 40 months in the C2402, Trainer et al. (2000), and Trainer et al. (2009) studies, respectively.
The C2402 study evaluated 2 doses of pasireotide LAR (40 mg and 60 mg), but these doses were treated as a single intervention (node) in the ITC analysis. Similarly, the Trainer et al. (2000)19 study compared 3 different doses of pegvisomant (10 mg, 15 mg, and 20 mg once daily), which were also treated as a single comparator in the network plot. To create a network for the ITC analysis, it was assumed that the SSAs and placebo study were similar. Figure 3 shows the network diagram used to assess the comparative efficacy of pasireotide LAR against its comparators. The report justified treating the SSA arm and placebo arm as equivalent because no patients in the Study C2402 SSA group experienced IGF-1 normalization after 24 weeks of treatment.
Figure 1: Network Diagram for the Bucher ITC
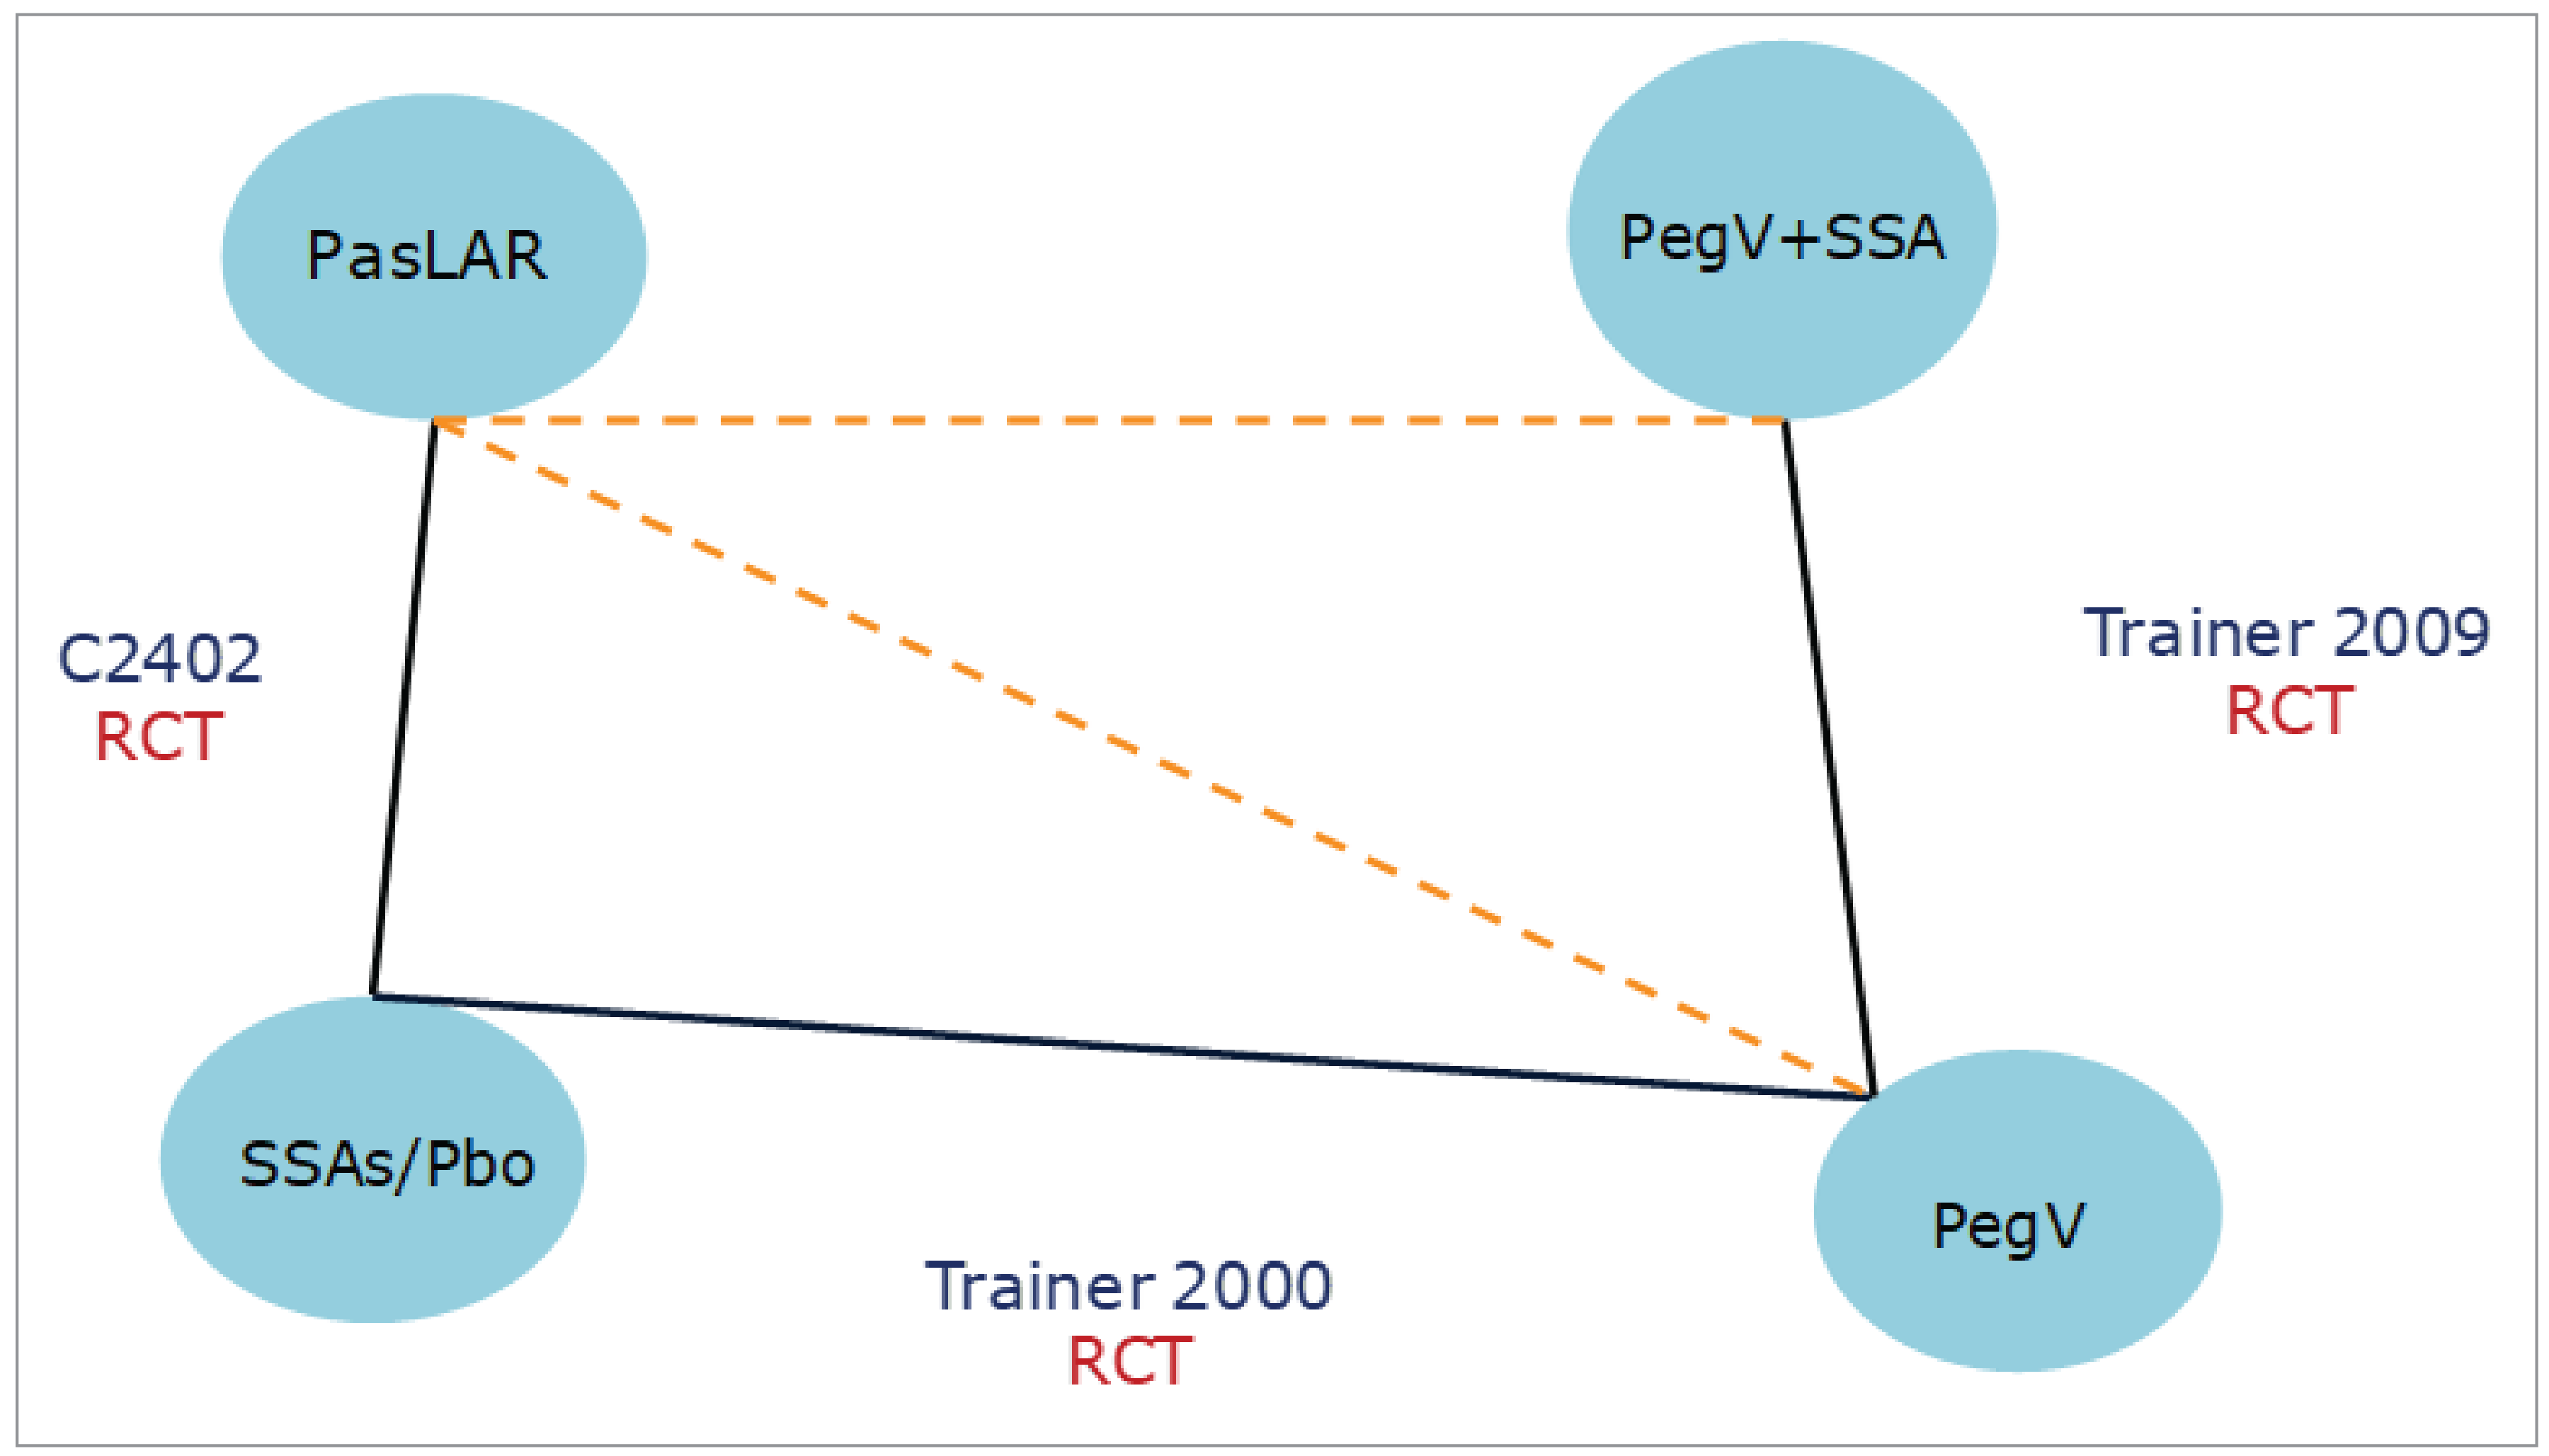
PasLAR = pasireotide long-acting release, Pbo = placebo; PegV = pegvisomant; SSA = somatostatin analogue.
Source: Signifor ITC.35
Table 18: Summary of Studies Included in the ITC
Study | C2402 | Trainer et al. (2000) | Trainer et al. (2009) | |||||||
|---|---|---|---|---|---|---|---|---|---|---|
Treatment arms (ITT) | Pasireotide LAR 40 mg every 4 weeks | Pasireotide LAR 60 mg every 4 weeks | SSAs | Pegvisomant 10 mg once daily | Pegvisomant 15 mg once daily | Pegvisomant 20 mg once daily | Placebo | Pegvisomant monotherapy | Pegvisomant + SSA | Octreotide LAR |
Number of patients | 65 | 65 | 68 | 26 | 26 | 28 | 32 | 25 | 26 | 27 |
Age (years), mean | 42.9 | 45.8 | 46.2 | 47.0 | 46.0 | 48.0 | 50.0 | 49.0 | 40.0 | 45.0 |
Male participants (%) | 41.5 | 46.2 | 44.1 | 58 | 54 | 54 | 59 | 60 | 65 | 44 |
Previous surgery (%) | 76.9 | 63.1 | 60.3 | 85 | 85 | 82 | 81 | NR | NR | NR |
Previous radiotherapy (%) | 3.1 | 4.6 | 7.4 | 42 | 62 | 66 | 58 | NR | NR | NR |
ITC = indirect treatment comparison; ITT = intention-to-treat; NR = not reported; SSA = somatostatin analogue.
Source: Signifor ITC.35
Table 19: Assessment of Homogeneity
Characteristics | Description and handling of potential effect modifiers |
|---|---|
Disease severity | NR |
Treatment history | NR |
Trial eligibility criteria | Trial eligibility criteria were similar in 2 studies:C2402 and Trainer et al. (2009). In both studies, patients whose acromegaly had inadequately responded to SSAs were included. However, the Trainer et al. (2000) study included all patients with acromegaly, regardless of any previous treatment. |
Dosing of comparators | The Trainer et al. (2000) study did not establish fixed doses for both treatment arms (pegvisomant monotherapy and pegvisomant + somatostatin analogues). To allow the indirect comparison against the results of the trial (pegvisomant 20 mg dose), the median pegvisomant doses reported in the paper (20 mg per day monotherapy group and 15 mg per day combination therapy group) were analyzed in this ITC. |
Placebo response | In the study by Trainer et al. (2000), after 12 weeks of treatment, 9% of patients allocated to the placebo group had normalized serum IGF-1 levels. Since Study C2402 compares pasireotide LAR with active controls, placebo responses are not reported. |
Definitions of end points | Response to treatment was consistently reported as an outcome in both studies. |
Timing of end point evaluation | Time point assessment in the Trainer et al. (2000)19 study was 12 weeks of treatment, while Study C2402 end points were assessed after 24 weeks of treatment. |
Withdrawal frequency | NR |
Clinical trial setting | NR |
Study design | All 3 studies included were published randomized controlled trials. |
IGF-1 = insulin-like growth factor 1; ITC = indirect treatment comparison; LAR = long-acting release; NR = not reported.
Source: Signifor ITC.35
Results for IGF-1 Normalization (Biochemical Response)
In the patient population, there were no significant differences in IGF-1 normalization when comparing either dose of pasireotide LAR (40 mg and 60 mg), pegvisomant monotherapy (10 mg, 15 mg, 20 mg), or combination therapy with SSAs. The point estimates of the ORs for IGF-1 normalization across these comparisons are presented in Table 20 and Table 21. In the sensitivity analysis by adding 1 to all study arms, no differences in terms of IGF-1 normalization were observed in the comparison between pasireotide LAR (40 mg and 60 mg) and pegvisomant (20 mg per day in monotherapy or combination therapy with SSAs).
Table 20: Data From Included Studies Used in the ITC Analysis
Study arms | Number of patientsa | IGF-1, n (%) | OR (95% CI) |
|---|---|---|---|
Pasireotide LAR 40 mg every 4 weeks | 65 | 16 (25) | Pasireotide 40 mg vs. SSAs: 45.7 (2.7 to 780.1)b |
Pasireotide LAR 60 mg every 4 weeks | 65 | 17 (26) | Pasireotide 60 mg vs. SSAs: 49.4 (2.9 to 841.2)b |
SSAs | 68 | 0 (0) | NR |
Trainer et al. (2000)19 | |||
Pegvisomant 10 mg | 26 | 10 (38) | Pegvisomant 10 mg vs. placebo: 6.04 (1.45 to 25.17) |
Pegvisomant 15 mg | 26 | 18 (69) | Pegvisomant 15 mg vs. placebo: 21.75 (5.09 to 92.94) |
Pegvisomant 20 mg | 28 | 23 (82) | Pegvisomant 20 mg vs. placebo: 44.67 (9.60 to 205.92) |
Placebo | 32 | 3 (9) | NR |
Trainer et al. (2009)36 | |||
Pegvisomant | 25 | 14 (56) | Pegvisomant 15 mg + SSA vs. pegvisomant 20 mg: 1.26 (0.41 to 3.84) |
Pegvisomant + SSA | 26 | 16 (62) | NR |
Octreotide LAR | 27 | NR | NR |
LAR = long-acting release; SSA = somatostatin analogue.
aORs reported for Study C2402 were calculated by adding 0.5 to all study arms, as described in the methodology section.
Source: Signifor ITC.35
Table 21: Results of the Indirect Comparison of Pasireotide Against Alternative Treatments for IGF-1 Normalization (Bucher Method)
Comparison | OR (95% CI) |
|---|---|
Alternative treatment vs. pasireotide LAR 40 mg every 4 weeks | |
Pegvisomant 10 mg/day | ██████████████ ██████ |
Pegvisomant 15 mg/day | ██████████████ ███████ |
Pegvisomant 20 mg/day | ██████████████ ███████ |
Alternative treatment vs. pasireotide LAR 60 mg every 4 weeks | |
Pegvisomant 10 mg/day | ██████████████ ██████ |
Pegvisomant 15 mg/day | ██████████████ ███████ |
Pegvisomant 20 mg/day | ██████████████ ███████ |
CI = confidence interval; IGF-1 = insulin-like growth factor 1; LAR = long-acting release; OR = odds ratio; SSA = somatostatin analogue.
Source: Signifor ITC.35
Harms
Harm outcomes were not evaluated in this ITC because placebo and SSAs were considered the same node in the network plot.
Critical Appraisal of ITC
In this ITC report, the authors did not describe their methods for data extraction or conduct a quality assessment of the 3 included studies. Details of a systematic literature search and strategy were not reported separately. The absence of a clear description of the information sources (i.e., databases searched), the study selection process (i.e., duplicate reviewers), a description of methods used to extract data (i.e., duplicate extraction or single reviewer extraction with check), and the study quality assessment method introduce potential selection and reporting biases, which may affect the validity of the conclusions. Only 3 studies were included in this ITC report, with a small number of events. This limited sample size increased the imprecision of the estimates presented in the report.
There were several sources of heterogeneity across the studies, particularly in treatment doses and comparison types. Differences in baseline characteristics and clinical factors between studies were not addressed or adjusted for. For instance, patients in the C2402 and Trainer et al. (2009) studies had acromegaly inadequately controlled on SSAs, while the Trainer et al. (2000) study included a broader patient population with a mix of patients with acromegaly, regardless of their prior treatment exposure or response. Moreover, in the Trainer et al. (2000) trial, eligible patients at the second screening had serum IGF-1 concentrations at least 1.3 times the upper limit of the age-adjusted normal range, whereas the other studies did not conduct a second screening. These imbalances in study populations could influence the treatment effect.
The authors used the Bucher method for ITC analysis, which may not be suitable for the included studies and network structure. The Bucher model is designed for 2-arm trials with independent pairwise comparisons. However, the included studies (Study C2402, Trainer et al. [2000], Trainer et al. [2009]) had more than 2 arms, resulting in correlated estimates that Bucher method cannot adequately address. Another limitation was the lack of adjustment for effect modifiers. Due to inconsistencies and imbalances in treatment effect modifiers, such as differences in study populations and drug dosages, the authors did not attempt to analytically address this potential bias. There was likely heterogeneity in IGF-1 normalization estimates across different dosages and treatment methods, particularly when comparing pasireotide with pegvisomant (15 mg/day) combined with SSA (octreotide). Although the authors mentioned using the Bucher fixed-effects model, they did not justify this choice. Given the heterogeneity and imbalance in effect modifiers, a random-effects model would likely have been more appropriate for this ITC analysis.
A significant source of intransitivity in the report was the assumption that SSAs and placebo were equivalent, which impacted the comparability of outcomes. According to clinical experts consulted by CDA-AMC, SSAs were superior to placebo in several trials. Thus, the efficacy of SSAs cannot be considered equivalent to placebo. This assumption also prevented the authors from assessing several outcomes important to patients, including tumour volume reduction, acromegaly symptoms, patient quality of life, and safety outcomes. Due to the uncertainty in the evidence presented in the ITC report, definitive conclusions cannot be drawn from the results.
Studies Addressing Gaps in the Systematic Review Evidence
Contents within this section have been informed by materials submitted by the sponsor. The following have been summarized and validated by the review team.
The sponsor submitted 1 additional study to address the gap in the systematic review evidence resulting from a recent change to the definition of biochemical control in acromegaly in the guidelines of the Pituitary Society, the Acromegaly Consensus Group, and the Endocrine Society (i.e., since Study C2305 and Study C2402 were conducted).6,37,38 The American Association of Clinical Endocrinologists guidelines published in 2011 originally recommended a cut-off level of GH less than 2 mcg/L and age-normalized IGF-1 less than ULN as the threshold for remission.39 These definitions of biochemical control informed response in Study C2402.4 However, updated and stricter criteria (GH less than 1 mcg/L, while maintaining the criterion agenormalized IGF-1 less than ULN) have since been recommended by the Endocrine Society.
Study C241337 is an observational study that provides evidence regarding the effect of pasireotide LAR on biochemical control in acromegaly based on more recent, strict criteria, as recommended by the Endocrine Society.40
Table 22: Summary of Gaps in the Systematic Review Evidence
Evidence gap identified by the sponsor | Studies that address gaps | ||
|---|---|---|---|
Study description | Summary of key results | ||
The definition of biochemical control in acromegaly has evolved over the past decade, reflecting the more sensitive assays available and better understanding of the pathophysiology of the disease. The American Association of Clinical Endocrinologists guidelines published in 2011 originally recommended a cut-off level of GH < 2 mcg/L and age-normalized IGF-1 < ULN as the threshold for remission. These definitions of biochemical control informed response in Study C2402.4 However, updated and stricter criteria (GH < 1 mcg/L while maintaining the criterion age-normalized IGF-1 less than ULN) have since been recommended by the Pituitary Society, the Acromegaly Consensus Group, and the Endocrine Society. The aim of Study C241337 was to assess the efficacy and safety of pasireotide LAR in patients with acromegaly that was uncontrolled on maximal approved doses of octreotide or lanreotide. This was the first prospective study of pasireotide LAR to assess biochemical control in patients with acromegaly using the updated criteria. | Study C241337 (NCT02354508) was a phase IIIb, single-arm, open-label study of pasireotide LAR. Patients were included if they had uncontrolled acromegaly (defined as GH of 1.0 mcg/L or higher and sex- and age-adjusted IGF 1 > 1.3 × ULN) after at least 3 months of treatment with 120 mg lanreotide, 40 mg octreotide, or 30 mg octreotide every 4 weeks in countries where 40 mg was not approved. Patients treated with 30 mg octreotide every 4 weeks were treated with 40 mg octreotide during a 3-month run-in period and were eligible for the study only if they did not experience biochemical control (defined as GH < 1 mcg/L and IGF-1 < ULN) at the end of the 3-month period. The study consisted of a core phase and an extension phase. |
| |
AcroQoL = Acromegaly Quality of Life Questionnaire; AE = adverse events; GH = growth hormone; IGF-1 = insulin-like growth factor 1; LAR = long-acting release; mGH = mean growth hormone level; ULN = upper limit of normal.
Source: Study C2413 Clinical Study Report41 and sponsor’s Summary of Clinical Evidence.32
Description of Studies
Study C2413 was a prospective, phase IIIb, multicentre, open-label, single-arm study designed to evaluate the biochemical control of acromegaly using the latest, stricter criteria recommended by the Endocrine Society.40 The primary aim of Study C2413 was to assess the efficacy and safety of pasireotide LAR in patients with acromegaly that remained uncontrolled despite treatment with maximal approved doses of octreotide or lanreotide. In this study, adults with uncontrolled acromegaly (defined as mGH of 1 mcg/L or higher and IGF-1 more than 1.3 times ULN) who had received at least 3 months of maximal doses of long-acting octreotide or lanreotide were administered open-label pasireotide LAR at 40 mg every 28 days. If biochemical control was not achieved by week 12, the dose could be increased to a maximum of 60 mg every 28 days; doses could also be reduced to as low as 10 mg every 28 days if necessary for tolerability. Patients who completed the 36-week treatment phase were eligible to continue to an extension phase (weeks 36 to 72), during which concomitant acromegaly medications were permitted. The primary end point was the proportion of patients achieving mGH less than 1 mcg/L and IGF-1 less than ULN at week 36, with additional assessments of biochemical control during the extension phase. Details of the study and other important outcomes are described in Table 23.
Table 23: Details of Studies Addressing Gaps in the Systematic Review Evidence
Detail | Study C2413 |
|---|---|
Designs and populations | |
Study design | Prospective, phase IIIb, multicentre, open-label, single-arm study |
Enrolled, N | 123 |
Study phases |
|
Key inclusion criteria |
|
Key exclusion criteria |
|
Drugs | |
Intervention | Patients received 40 mg of pasireotide every 28 days. If their condition remained uncontrolled at 16 and 28 weeks — defined as mGH levels greater than 1 mcg/L and IGF-1 levels greater than the ULN at weeks 12 and 24 — the dose could be increased to 60 mg. Patients who completed the 36-week core phase could enter an optional 36-week extension phase and continue with the same dose of pasireotide. |
Comparator | None |
Outcomes | |
Primary end point | Proportion of patients who experienced biochemical control (mGH less than 1 mcg/L and IGF-1 less than ULN) at week 36 |
Secondary end points |
|
Notes | |
Publications | Gadelha M, Bex M, Colao A, Pedroza García EM, Poiana C, Jimenez-Sanchez M, Yener S, Mukherjee R, Bartalotta A, Maamari R, and Raverot G. (2020) Evaluation of the Efficacy and Safety of Switching to Pasireotide in Patients With Acromegaly Inadequately Controlled With First-Generation Somatostatin Analogs. Front. Endocrinol. 10:931. https://doi.org/10.3389/fendo.2019.00931 https://www.clinicaltrials.gov/study/NCT02354508. |
HRQoL = health-related quality of life; IGF-1 = insulin-like growth factor 1; mGH = mean growth hormone; SSA = somatostatin analogues; ULN = upper limit of normal.
aUncontrolled acromegaly was defined as mGH ≥ 1 mcg/L from a 5-point profile over a 2-hour period and IGF-1 more than 1.3 times the age- and sex-adjusted ULN.
Source: Study C2413 Clinical Study Report41 and sponsor's Summary of Clinical Evidence.32
Populations
Study C2402 enrolled patients aged 18 years or more with uncontrolled acromegaly (evidenced by mGH 1 mcg/L or higher from a 5-point profile over a 2-hour period and IGF-1 more than 1.3 times the age- and sex-adjusted ULN) on first-generation SSAs. Patients must have received long-acting octreotide (30 or 40 mg every 28 days) or lanreotide ATG (120 mg every 28 days) for 3 months or more before screening. Patients were excluded if they had received concomitant treatment with other medications known to reduce GH or IGF-1 levels within 3 months of screening. Patients with poor glycemic control (hemoglobin A1C more than 8%), concomitant disease that could prolong the QT interval, or risk factors for torsades de pointes were excluded.
Interventions
All patients were initially treated with pasireotide LAR 40 mg every 4 weeks, which could be increased to a maximum dose of 60 mg at week 16 in patients not achieving biochemical control (defined as GH less than 1 mcg/L and IGF-1 less than ULN) at week 12 or at week 28 in patients not achieving biochemical control at week 24.
Outcomes
The primary end point of this study was the proportion of patients who experienced biochemical control at 36 weeks. Biochemical control was defined as an mGH level of 1.0 mcg/L or less and an IGF-1 level within the normal range, based on the 2014 Endocrine Society guidelines. IGF-1 and mGH levels were measured 20 and 4 weeks before starting the study drug and then at 12, 24, 36, 48, 60, and 72 weeks after patients began treatment with pasireotide.
Secondary outcomes included changes in mGH and IGF-1 levels over time, the proportion of patients achieving mGH levels less than 1 mcg/L and IGF-1 levels within normal limits, as well as health-related quality of life, symptoms, safety, and tolerance to the drug. Health-related quality of life was assessed using the AcroQoL.
Statistical Analysis
Sample size was calculated based on the primary end point. A sample size of 100 was selected to enable the estimation of the proportion of patients who experienced biochemical control with pasireotide at week 36 as 15%, with a precision of 7% for the associated asymptotic 2-sided 95% CI. Considering a dropout rate of 10%, the sample size required was 112. Efficacy analyses were performed using the FAS (all patients who received 1 or more doses of pasireotide) for the core study and for patients who continued beyond week 36 for the extension phase. Multiple imputation method was used to fill in missing data. Sensitivity analyses were then conducted with this imputed data to evaluate the reliability of the efficacy results. The imputation method used was as follows: if both the day and month were missing from a date, the date was replaced with June 30 (only for events occurring before the study drug start date, such as medical history). If only the day was missing, it was replaced with the 15th of that month. For dates known to fall within the trial period, if the imputed date was later than the trial completion date, the trial completion date was used; if it was earlier than the study drug start date, the study drug start date was applied. Safety analyses were performed for all patients who received 1 dose or more of pasireotide and had a postbaseline safety assessment. The trial was exploratory in nature, and no formal statistical hypothesis testing was planned.
Results
Patient Disposition
Patient disposition in Study C2413 is summarized in Table 24.
Baseline Characteristics
Key patient characteristics at the start of the main study are shown in Table 25. Between March 31, 2015, and April 12, 2017, a total of 175 patients were screened, and 123 were enrolled in the core study. Twenty patients were taking octreotide 30 mg every 4 weeks in countries where the 40 mg dose was approved, so they completed a 3-month prestudy phase. Among these, 3 patients (15%) experienced biochemical control after increasing to octreotide 40 mg so they were not enrolled in the core study. Before the study began, some patients had been on treatments for 3 to 6 months: 41 on lanreotide 120 mg every 4 weeks, 29 on octreotide 30 mg every 4 weeks, and 53 on octreotide 40 mg every 4 weeks.
Table 24: Patient Disposition in Study C2413
Patient disposition | All patients (N = 175) |
|---|---|
Screened, N (%) | 175 (100) |
Enrolled, N (%) | 123 (70.3) |
Discontinued from core study, n (%) | 10 (5.7) |
Reason for discontinuation, n (%) | |
AE | 4 (2.3) |
Unsatisfactory therapeutic effect | 3 (1.7) |
Patient withdrew consent | 4 (2.3) |
Completed 26-week core phase, n (%) | 113 (64.5) |
Patients entered extension phase, n (%) | 88 (50.2) |
Discontinued from extension phase, n (%) | 13 (7.4) |
Reason for discontinuation, n (%) | |
Unsatisfactory therapeutic effect | 6 (3.4) |
Patient withdrew consent | 1 (0.6) |
AE = adverse event.
Source: Study C2413 Clinical Study Report41 and sponsor’s Summary of Clinical Evidence.32
Most patients enrolled in the study (91.9%, or 113 out of 123) completed the 36-week core study, and 77.9% (88 patients) chose to continue to the extension phase. At the start of the study, 76.4% (94 patients) had mGH levels greater than 2.5 mcg/L. Additionally, many patients had either diabetes (42.3%, or 52 patients) or prediabetes (48.8%, or 60 patients), as shown in Table 25. Before starting the study, 25.2% of the patients were already taking medication for diabetes. After the study began, 62.6% of patients used additional diabetes medications, with the most common types being biguanides (52.0%, mainly metformin), dipeptidyl peptidase-4 (DPP-4) inhibitors (21.1%, mostly vildagliptin and sitagliptin), and sulfonylureas (18.7%, mainly gliclazide).
Table 25: Details of Baseline Characteristics of Study C2413 Addressing Gaps in the Systematic Review Evidence
Characteristics | All participants (N = 123) |
|---|---|
Age (years), median (range) | 43.0 (22.0 to 76.0) |
Sex, n (%) | |
Female | 62 (50.4) |
Male | 61 (49.6) |
GH concentration (mcg/L) | 10.2 (22.2) |
IGF-1 concentration (× ULN) | 2.7 (1.2) |
Treatment before enrolment, n (%) | |
Previous lanreotide 120 mg | 41 (33.3) |
Previous octreotide 30 mg | 29 (23.6) |
Previous octreotide 40 mg | 53 (43.1) |
Diabetes status, n (%) | |
Diabetesa | 52 (42.3) |
Prediabetesb | 60 (48.8) |
Screening mGH stratum, n (%) | |
1.0 mcg/L to 2.5 mcg/L | 28 (22.8) |
> 2.5 mcg/L | 94 (76.4) |
Missing | 1 (0.8) |
GH = growth hormone; IGF-1 = insulin-like growth factor 1; ULN = upper limit of normal.
aDefined as patients taking antidiabetic medication or with a past medical history of diabetes mellitus, hemoglobin A1C 6.5% or higher, fasting plasma glucose 126 mg/dL or higher or 2-hour plasma glucose during OGTT at screening visit 200 mg/dL or higher.
bDefined as patients with fasting plasma glucose between 100 and 126 mg/dL, hemoglobin A1C between 5.7 and 6.5%, or 2-hour plasma glucose during OGTT at screening visit between 140 and 200 mg/dL.
Source: Study C2413 Clinical Study Report41 and sponsor’s Summary of Clinical Evidence.32
Exposure to Study Treatments
Patients received pasireotide for a median duration of 36 weeks, with a mean dose of 50.0 mg (SD =7.2 mg) per month. Among those who initiated treatment with 40 mg every 4 weeks of pasireotide, 73.2% (n = 90) were titrated up to 60 mg at weeks 12 or 24.
Patients who completed both the core and extension phases received pasireotide for a median duration of 71.9 weeks (range 12 to 76 weeks), with an average dose of 52.5 mg (SD = 9.1 mg) per month. Among the 88 patients who entered the extension phase, 70 had their dose increased to 60 mg at some point during the study.
Efficacy
Biochemical Control
By week 36, 14.6% of patients (18 of 123; 95% CI, 8.9% to 22.1%) experienced both mGH less than 1.0 mcg/L and IGF-1 levels less than the ULN. Mean mGH and IGF-1 levels showed a progressive reduction from baseline through week 36 across all groups previously treated with first-generation SSAs.
Quality of Life
At baseline during the core phase, the mean AcroQoL score was 58.6 (SD =19.2; n = 123), which increased to 63.2 (SD =4.6; n = 110) by week 36. Among patients who progressed to the extension phase, the mean AcroQoL score was 64.0 (SD = 19.3; n = 88) at the extension baseline and 65.1 (SD = 18.7; n = 74) by week 72.
Self-Reported Signs and Symptoms of Acromegaly
No significant changes in acromegaly symptoms were observed during the study. In the core phase, the proportion of patients without specific symptoms at baseline compared to after baseline was as follows: headache (41.5% versus 36.6%), fatigue (36.6% versus 26.0%), excessive sweating (43.1% versus 37.4%), joint pain (osteoarthralgia; 33.3% versus 26.8%), and tingling (paresthesia; 54.5% versus 47.2%). Similar proportions were seen in the extension phase: headache (69.3% versus 46.6%), fatigue (56.8% versus 51.1%), excessive sweating (68.2% versus 54.5%), joint pain (52.3% versus 43.2%), and tingling (79.5% versus 67.0%).
Harms
Most patients (93.5%) experienced at least 1 treatment-emergent AE during the study, regardless of study drug relationship (Table 26). Most AEs were grade 1 to 2. Metabolism and nutrition disorders were the most frequently reported SOC of AEs (███████ Other SOCs of AEs reported in more than 20% of all patients (all grades) were infections and infestations (███████ gastrointestinal disorders (███████ investigations (███████ musculoskeletal and connective tissue disorders (███████ general disorders and administrative site conditions (███████ and nervous system disorders ████████.
Table 26: Adverse Events Regardless of Study Drug Relationship, by Preferred Term and Maximum Grade During the Overall Study Period
Category | Uptitrated to pasireotide LAR 60 mg N = 90 | Pasireotide LAR overall N = 123 | ||
|---|---|---|---|---|
All grades n (%) | Grade 3 or 4 n (%) | All grades n (%) | Grade 3 or 4 n (%) | |
Total | 85(92.4) | 19(20.7) | 115(93.5) | 29(23.6) |
Hyperglycemia | 39 (42.4) | 2 (2.2) | 56 (45.5) | 5 (4.1) |
Diabetes mellitus | 22 (23.9) | 3 (3.3) | 29 (23.6) | 5 (4.1) |
Diarrhea | 16 (17.4) | 0 | 22 (17.9) | 1 (0.8) |
Headache | 11 (12.0) | 0 | 14 (11.4) | 0 |
Abdominal pain | 11 (12.0) | 1 (1.1) | 13 (10.6) | 1 (0.8) |
Anemia | 11 (12.0) | 0 | 13 (10.6) | 0 |
Hypoglycemia | 10 (10.9) | 0 | 13 (10.6) | 0 |
Alopecia | 8 (8.7) | 0 | 11 (8.9) | 0 |
Cholelithiasis | 8 (8.7) | 0 | 11 (8.9) | 2 (1.6) |
Influenza | 7 (7.6) | 1 (1.1) | 11 (8.9) | 1 (0.8) |
Viral upper respiratory tract infection | 7 (7.6) | 0 | 11 (8.9) | 0 |
Sinus bradycardia | 8 (8.7) | 0 | 9 (7.3) | 0 |
Blood glucose increased | 7 (7.6) | 1 (1.1) | 8 (6.5) | 1 (0.8) |
Fatigue | 4 (4.3) | 0 | 8 (6.5) | 1 (0.8) |
Pain in extremity | 8 (8.7) | 0 | 8 (6.5) | 0 |
Upper respiratory tract infection | 7 (7.6) | 0 | 8 (6.5) | 0 |
Arthralgia | 6 (6.5) | 0 | 7 (5.7) | 0 |
Asthenia | 4 (4.3) | 0 | 7 (5.7) | 0 |
Hepatic steatosis | 7 (7.6) | 0 | 7 (5.7) | 0 |
Impaired fasting glucose | 7 (7.6) | 0 | 7 (5.7) | 0 |
Nausea | 5 (5.4) | 0 | 7 (5.7) | 0 |
Source: Study C2413 Clinical Study Report Table 12-4.41
Critical Appraisal
Internal Validity
The open-label single-arm design of the trial is a key limitation to interpreting the results of the study. The absence of a comparator precludes conclusions as to whether any observed effect could be attributed to pasireotide. Further, the open-label study design could increase risk of bias in subjective outcomes (e.g., patient-reported outcomes such as health-related quality of life and symptoms), and some AEs may be influenced by patients’ expectations of treatment. However, the presence and extent of such bias could not be determined from the trial data alone. The trial enrolled its target sample size based on the primary outcome. However, another key limitation was that the trial was exploratory in nature, with no formal hypothesis testing planned.
External Validity
Based on the views of clinicians consulted by the CDA-AMC review team, the population of patients enrolled in Study C2413 is representative of the patients they encounter in daily practice in Canada. Additionally, the included patients align with the approved indication specified in the Health Canada product monograph, although it more closely aligned with the sponsor’s reimbursement request since it enrolled patients with acromegaly that remained uncontrolled despite treatment with maximal approved dosages of octreotide or lanreotide. Furthermore, from the clinical experts’ point of view, pasireotide generally would be considered for second-line treatment, typically prescribed after SSAs are found to be ineffective, which also aligns with this study’s patient population.
The dosage of pasireotide used in the trial also generally reflects the recommended dosage described in the product monograph. The primary end point was defined according to the latest definition of biochemical control from the Endocrine Society, reflecting the current standard for managing acromegaly. Other outcomes important to patients and clinicians were also assessed, including quality of life, signs and symptoms of acromegaly (e.g., osteoarthralgia, headache), and safety. Quality of life was measured using the AcroQoL score, which was validated in 2014. However, this measure does not have an established MID.42
Discussion
Summary of Available Evidence
Two multicentre, sponsor-funded, phase III RCTs, C2305 and C2402, were included in this review. Study C2305 was a blinded study of pasireotide LAR versus octreotide LAR in patients with active acromegaly who had not received previous medical treatment, over a 12-month treatment period. In Study C2402, patients were randomly allocated to receive either pasireotide LAR 40 mg or 60 mg every 4 weeks (in double-blind fashion) or to continue on their current SSA on the maximum indicated dose of octreotide LAR 30 mg or lanreotide ATG 120 mg every 4 weeks as before randomization (in an open-label, active control arm), over a treatment course of 24 weeks. The primary outcome of each study was the proportion of patients with a reduction of GH level to less than 2.5 mcg/L and normalization of IGF-1 to within normal limits (age- and sexrelated). Secondary outcomes assessed were normalization of IGF-1 and change from baseline in AcroQoL and symptoms.
Across both studies, patients were approximately 45 years of age, and there were slightly more females than males (52% in Study C2305 and 55% in Study C2402). The majority of patients in each study were white (Study C2305: 60%; Study C2402: 81%). Patients had been diagnosed with acromegaly for approximately 20 months in Study C2305 and for approximately 72 weeks in Study C2402.
In the absence of direct evidence between pasireotide and pegvisomant, the sponsor performed an ITC using the Bucher ITC method to estimate the effectiveness of pasireotide LAR compared to pegvisomant monotherapy and pegvisomant in combination with SSAs in terms of IGF-1 normalization in adult patients with acromegaly who could not undergo surgery or for whom surgery was not successful. No other outcomes were assessed in the ITC.
An additional study, Study C2413, was submitted by the sponsor to address the gap in the systematic review evidence resulting from the change in the definition of biochemical control since Study C2305 and Study C2402 were conducted. Study C2413 was a prospective, phase IIIb, multicentre, open-label, single-arm study designed to evaluate the biochemical control of acromegaly using the latest, stricter criteria.40 This study was exploratory in nature, with the primary aim being to assess the efficacy and safety of pasireotide LAR in adult patients with acromegaly that remained uncontrolled despite treatment with maximal approved doses of octreotide or lanreotide. Patients were administered open-label pasireotide LAR at 40 mg every 28 days. The primary end point was the proportion of patients achieving mGH less than 1 mcg/L and IGF-1 less than ULN at week 36, with additional assessments of biochemical control during the extension phase. Other outcomes of interest that were assessed included health-related quality of life as measured by the AcroQoL, signs and symptoms of acromegaly, and safety.
Interpretation of Results
Efficacy
The clinical experts consulted on this review were both clear that biochemical parameters are the key outcome they use to monitor patient progress in clinical practice, and this view is supported by consensus guidelines.16 Further, the clinical experts also agreed that IGF-1 has emerged as the most important biochemical parameter, ahead of GH. One of the reasons for this, according to the clinical experts, is that IGF-1 seems to be a more reliable predictor of disease progression and is more directly involved in the pathophysiology of acromegaly. The IGF-1 assays have also improved to a point where it is considered a much more reliable predictor of disease than GH. The major limitation of IGF-1 is that there are many different assays for IGF-1, and that has resulted in the target for normalization of IGF-1 being 1.3 times the ULN, to account for this variability in response among the assays. Guidelines for acromegaly also support the importance of biochemical measures in assessing specific clinical outcomes, noting that improvements in glucose metabolism, obstructive sleep apnea, cardiovascular disease, and vertebral fractures are associated with improved biochemical parameters, although structural abnormalities are not.6 The guidelines also cite studies that indicate that the improved biochemical control seen with more advanced therapies also appears to have resulted in improved life expectancy in acromegaly, perhaps even to the point where patients with acromegaly can expect to live a lifespan similar to that of the general population.12,43 As a result, the fact that the primary outcomes of each included study focused on biochemical parameters was considered appropriate by the clinical experts, as these outcomes are important.
Of the 2 included trials, 1 more closely addressed the indication (Study C2305) and the other more closely addressed the reimbursement request for pasireotide (Study C2402). Study C2305 enrolled patients with acromegaly who either had previous surgery or for whom surgery was not an option, or had not been curative, and Study C2402 enrolled patients who had inadequately controlled acromegaly, despite being treated with an SSA (either lanreotide or octreotide). Notably, patients in Study C2402 were randomized either to continue on the treatment that was currently failing to control acromegaly adequately or to pasireotide (40 mg or 60 mg). The differences in the enrolled populations between these 2 studies were most evident when examining results in the active control group for GH and IGF-1 response and for IGF-1 response because there no patients experienced a response for either outcome in those who continued on octreotide or lanreotide at the dose that was currently failing. Responses for patients in the pasireotide group in Study C2402 were indeed larger than they were in the active control group. However, they were noticeably smaller than those reported in Study C2305 for both GH and IGF-1 response (15% versus 31% with a response) and for IGF-1 response (25% versus 39% with a response). This may suggest that, although pasireotide can elicit biochemical responses in patients currently treated with a failing SSA, those responses are likely not as consistent as they would be in patients who had not previously been treated with an SSA.
Symptoms and health-related quality of life are important to patients with acromegaly, based on their input. There was no indication from either of the included studies that health-related quality of life was improved to a clinically significant extent with pasireotide. Without any between-group differences, the impact on symptoms is unknown. The clinical experts did note that, as long as quality of life did not worsen during treatment, they would consider that to be a positive result. The clinical experts noted that biochemical control of acromegaly does not result in an immediate improvement in health-related quality of life or symptoms such as joint pain, as these improvements take much longer. Therefore, the clinical experts questioned the value of assessing health-related quality of life or symptoms over the relatively short follow-up of the included clinical trials (24 weeks and 12 months). Although the AcroQoL is a validated and well-established instrument used in clinical trials to assess drugs for acromegaly, the symptom scale used in the included trials has not been validated. The clinical experts noted that a validated symptom scale, ACRODAT, has recently become available. However, this scale would not have been available to the sponsor when the included trials were completed.
Longer-term data were available from extensions to Study C2305 and Study C2402. However, the interpretation of this data is complicated by the use of a crossover design, in which patients in each group were allowed to cross over to the other treatment. To further complicate interpretation of this data, the original design of Study C2305 allowed crossover only from octreotide to pasireotide. It was only after a protocol amendment that patients in either group were allowed to cross over to the other group.
Pegvisomant is another treatment for acromegaly and a relevant comparator. No direct comparative evidence between pasireotide and pegvisomant was identified; therefore, the sponsor submitted an ITC report using the Bucher method. The results of the ITC suggested no significant differences in IGF-1 normalization when comparing pasireotide with pegvisomant monotherapy or pegvisomant in combination with SSAs. However, the ITC had several methodological limitations, including insensitivity in intervention nodes. Using the Bucher method may have been inappropriate because of included studies and network structure. The Bucher model is designed for 2-arm trials with independent pairwise comparisons, and the included studies had more than 2 arms, resulting in correlated estimates that the Bucher method cannot adequately address. Additional methodological limitations included heterogeneity across studies, lack of adjustment for effect modifiers, and the assumption that SSAs and placebo were equivalent in terms of efficacy. Therefore, definitive conclusions could not be drawn regarding the comparative efficacy of pasireotide versus pegvisomant in terms of IGF-1 normalization based on this ITC. Other efficacy outcomes that are important to patients and clinicians were not assessed in the ITC, which represents a gap in the comparative evidence versus pegvisomant.
Study C2413 provided supportive evidence for the use of pasireotide based on the current definitions of biochemical control in acromegaly (i.e., experienced both mGH < 1.0 mcg/L and IGF-1 levels < ULN). However, the trial was exploratory in nature, with no formal hypothesis testing planned, and the absence of a comparator precludes definitive conclusions as to whether any observed effect could be attributed to pasireotide alone.
Harms
Hyperglycemia is the most noteworthy harm of special interest associated with pasireotide, according to the clinical experts consulted on this review. Hyperglycemia can occur with any of the SSAs; however, the risk was higher with pasireotide than either octreotide or lanreotide in the included comparative studies. The most likely explanation for this higher risk is that pasireotide has high affinity for the SST5 receptor subtype, which suppresses insulin release, relative to its affinity for SST2, which suppresses glucagon.44 The resulting imbalance between insulin and glucagon secretion results in hyperglycemia. The clinical experts noted that this side effect is most relevant in patients with uncontrolled diabetes mellitus. For patients who do not have diabetes, or patients who have well-controlled diabetes, the management of hyperglycemia is fairly straightforward in the opinion of the experts and would involve the use of oral antidiabetic medication. The product monograph for pasireotide states that it is contraindicated in patients with uncontrolled diabetes mellitus (hemoglobin A1C of 8% or greater while receiving oral antidiabetic medication).
The clinical experts also noted bradycardia and QT prolongation as potential safety issues associated with SSAs in general. There was no clear and consistent indication from the included studies that pasireotide had an increased (or decreased) risk of these cardiac safety issues compared to octreotide or lanreotide, and the product monograph lists a variety of cardiovascular conditions as contraindications to the use of pasireotide, including severe bradycardia and congenital long QT syndrome. There was no between-group difference in QT prolongation in either included study, and there was a relatively small number of patients (5, 7.9%) with bradycardia in Study C2402, compared to none in the active control group. However, none of these AEs were grade 3 or higher, and there was no difference between groups in Study C2305 for this AE of special interest.
In the Bucher ITC, the authors did not assess harms, because of the assumption that placebo was equal to SSAs. Therefore, the comparative safety of pasireotide versus pegvisomant remains a gap in the evidence.
In Study C2413, no new safety signals were identified, and the AEs observed were consistent with Study C2305 and Study C2402.
Conclusion
Evidence from 2 phase III RCTs (Study C2305 and Study C2402) suggest that, regardless of whether patients had tried prior medical therapy or had not experienced biochemical control on prior medical therapy, treatment with pasireotide likely results in an improvement in the number of patients who experience IGF-1 normalization, when compared to other SSAs. Pasireotide may also increase the number of patients who experience GH and IGF-1 normalization compared to other SSAs. However, the clinical relevance of improving GH in acromegaly is less clear than of improving IGF-1, according to the clinical experts. Pasireotide may improve health-related quality of life compared to SSAs. However, the evidence is uncertain regarding whether pasireotide improves symptoms, and the clinical significance of any improvement in quality of life is unclear. Pasireotide increases the risk of hyperglycemia over other SSAs, and pasireotide is contraindicated in patients who have uncontrolled diabetes mellitus. A single-arm trial (Study C2413) provided supportive evidence on the use of pasireotide in patients with acromegaly that was uncontrolled on maximal approved doses of SSAs, based on a current definition of biochemical control, which has been updated since Study C2305 and Study C2402 were conducted. However, the exploratory nature of the trial and the absence of a comparator group limits the conclusions that can be drawn from this supportive evidence.
A sponsor-submitted Bucher ITC suggested there were no significant differences in IGF-1 normalization when comparing pasireotide with pegvisomant monotherapy or pegvisomant in combination with SSAs. However, no definitive conclusions can be drawn from the analysis due to methodological limitations (e.g., heterogeneity across studies, unsuitability of a Bucher ITC for indirectly comparing studies with more than 2 arms and the network structure, lack of adjustment for effect modifiers, assumption that SSAs and placebo were equivalent).
References
1.AlDallal S. Acromegaly: a challenging condition to diagnose. Int J Gen Med. 2018;11:337-343. doi: 10.2147/ijgm.S169611 PubMed
2.Capatina C, Wass JA. 60 years of neuroendocrinology: Acromegaly. J Endocrinol. 2015;226(2):T141-60. doi: 10.1530/joe-15-0109 PubMed
3.Giustina A, Biermasz N, Casanueva FF, et al. Consensus on criteria for acromegaly diagnosis and remission. Pituitary. 2024;27(1):7-22. doi: 10.1007/s11102-023-01360-1 PubMed
4.Colao A, Bronstein MD, Freda P, et al. Pasireotide versus octreotide in acromegaly: a head-to-head superiority study. J Clin Endocrinol Metab. 2014;99(3):791-9. doi: 10.1210/jc.2013-2480 PubMed
5.Gadelha MR, Bronstein MD, Brue T, et al. Pasireotide versus continued treatment with octreotide or lanreotide in patients with inadequately controlled acromegaly (PAOLA): a randomised, phase 3 trial. Lancet Diabetes Endocrinol. 2014;2(11):875-84. doi: 10.1016/S2213-8587(14)70169-X PubMed
6.Fleseriu M, Biller BMK, Freda PU, et al. A Pituitary Society update to acromegaly management guidelines. Pituitary. 2021;24(1):1-13. doi: 10.1007/s11102-020-01091-7 PubMed
7.Akirov A, Asa SL, Amer L, Shimon I, Ezzat S. The Clinicopathological Spectrum of Acromegaly. J Clin Med. 2019;8(11):1962. doi: 10.3390/jcm8111962 PubMed
8.Chanson P, Salenave S. Acromegaly. Orphanet J Rare Dis. 2008;3:17. doi: 10.1186/1750-1172-3-17 PubMed
9.Melmed S. Medical progress: Acromegaly. N Engl J Med. 2006;355(24):2558-73. doi: 10.1056/NEJMra062453 PubMed
10.Broder MS, Chang E, Cherepanov D, Neary MP, Ludlam WH. Incidence and Prevalence of Acromegaly in the United States: A Claims-Based Analysis. Endocr Pract. 2016;22(11):1327-1335. doi: 10.4158/EP161397.OR PubMed
11.Caputo M, Ucciero A, Mele C, et al. Use of administrative health databases to estimate incidence and prevalence of acromegaly in Piedmont Region, Italy. J Endocrinol Invest. 2019;42(4):397-402. doi: 10.1007/s40618-018-0928-7 PubMed
12.Esposito D, Ragnarsson O, Granfeldt D, Marlow T, Johannsson G, Olsson DS. Decreasing mortality and changes in treatment patterns in patients with acromegaly from a nationwide study. Eur J Endocrinol. 2018;178(5):459-469. doi: 10.1530/EJE-18-0015 PubMed
13.Matsubayashi K, Kawakami K. Prevalence, incidence, comorbidities, and treatment patterns among Japanese patients with acromegaly: a descriptive study using a nationwide claims database. Endocr J. 2020;67(10):997-1006. doi: 10.1507/endocrj.EJ20-0129 PubMed
14.Carmichael JD, Bonert VS, Nuño M, Ly D, Melmed S. Acromegaly clinical trial methodology impact on reported biochemical efficacy rates of somatostatin receptor ligand treatments: a meta-analysis. J Clin Endocrinol Metab. 2014;99(5):1825-33. doi: 10.1210/jc.2013-3757 PubMed
15.Pfizer Canada ULC. Somavert (pegvisomant for injection): 10, 15, 20, 25 or 30 mg lyophilized powder per vial, for injection [product monograph]. October 17, 2005. Updated January 11, 2024. Accessed by sponsor, no date provided. https://pdf.hres.ca/dpd_pm/00074206.PDF
16.Giustina A, Barkhoudarian G, Beckers A, et al. Multidisciplinary management of acromegaly: A consensus. Rev Endocr Metab Disord. 2020;21(4):667-678. doi: 10.1007/s11154-020-09588-z PubMed
17.Leonart LP, Tonin FS, Ferreira VL, Fernandez-Llimos F, Pontarolo R. Effectiveness and safety of pegvisomant: a systematic review and meta-analysis of observational longitudinal studies. Endocrine. 2019;63(1):18-26. doi: 10.1007/s12020-018-1729-7 PubMed
18.van der Lely AJ, Hutson RK, Trainer PJ, et al. Long-term treatment of acromegaly with pegvisomant, a growth hormone receptor antagonist. Lancet. 2001;358(9295):1754-9. doi: 10.1016/s0140-6736(01)06844-1 PubMed
19.Trainer PJ, Drake WM, Katznelson L, et al. Treatment of acromegaly with the growth hormone-receptor antagonist pegvisomant. N Engl J Med. 2000;342(16):1171-7. doi: 10.1056/nejm200004203421604 PubMed
20.Cámara R, Venegas E, García-Arnés JA, et al. Treatment adherence to pegvisomant in patients with acromegaly in Spain: PEGASO study. Pituitary. 2019;22(2):137-145. doi: 10.1007/s11102-019-00943-1 PubMed
21.European Medicines Agency. Product information: Somavert (pegvisomant). (European public assessment report). 2021. Accessed by sponsor, no date provided. https://www.ema.europa.eu/en/documents/product-information/somavert-epar-product-information_en.pdf
22.Pharmacia. Prescribing information: Somavert (pegvisomant) for injection, for subcutaneous use. U.S. Food and Drug Administration; 2019. Accessed by sponsor, no date provided. https://www.accessdata.fda.gov/drugsatfda_docs/label/2019/021106s064lbl.pdf
23.Recordati Rare Diseases Canada Inc. Signifor LAR (pasireotide as pasireotide pamoate): 10 mg, 20 mg, 30 mg, 40 mg, and 60 mg pasireotide per vial, for injectable suspension [product monograph]. February 10, 2015. Updated May 19, 2020. Accessed by sponsor, no date provided. https://pdf.hres.ca/dpd_pm/00056343.PDF
24.Ipsen Biopharmaceuticals Canada Inc. Somatuline Autogel (lanreotide injection): 60 mg, 90 mg, 120 mg per syringe, extended release solution, deep subcutaneous injection [product monograph]. July 17, 2006. Updated August 8, 2023. Accessed by sponsor, no date provided. https://pdf.hres.ca/dpd_pm/00071957.PDF
25.Novartis Pharmaceuticals. Clinical Study Report: CSOM230C2305. A multicenter, randomized, blinded study to assess safety and efficacy of pasireotide LAR vs octreotide LAR in patients with active acromegaly [internal sponsor's report]. October 8, 2012.
26.Novartis Pharma AG. Clinical Study Report: CSOM230C2402. A phase III, multicenter, randomized, parallel-group study to assess the efficacy and safety of double-blind pasireotide LAR 40 mg and pasireotide LAR 60 mg versus open-label octreotide LAR or lanreotide ATG in patients with inadequately controlled acromegaly [internal sponsor's report]. September 23, 2013.
27.Webb SM, Badia X, Surinach NL, Spanish AcroQol Study Group. Validity and clinical applicability of the acromegaly quality of life questionnaire, AcroQoL: a 6-month prospective study. Eur J Endocrinol. 2006;155(2):269-77. doi: 10.1530/eje.1.02214 PubMed
28.Badia X, Webb SM, Prieto L, Lara N. Acromegaly Quality of Life Questionnaire (AcroQoL). Health Qual Life Outcomes. 2004;2:13. doi: 10.1186/1477-7525-2-13 PubMed
29.Norman GR, Sloan JA, Wyrwich KW. Interpretation of changes in health-related quality of life: the remarkable universality of half a standard deviation. Med Care. 2003;41(5):582-92. doi: 10.1097/01.MLR.0000062554.74615.4C PubMed
30.Bretz F, Maurer W, Brannath W, Posch M. A graphical approach to sequentially rejective multiple test procedures. Stat Med. 2009;28(4):586-604. doi: 10.1002/sim.3495 PubMed
31.Maurer W, Glimm E, Bretz F. Multiple and Repeated Testing of Primary, Coprimary, and Secondary Hypotheses. Stat Biopharm Res. 2011;3(2):336-352. doi: 10.1198/sbr.2010.10010
32.Recordati Rare Diseases Canada Inc. Sponsor summary of clinical evidence: Signifor LAR (pasireotide) for the treatment of adult patients with acromegaly for whom surgery is not an option or has not been curative and who are inadequately controlled on treatment with a first-generation somatostatin analogue (SSA) [internal sponsor's report]. In: Drug Reimbursement Review sponsor submission: Signifor LAR (pasireotide), 40 mg or 60 mg, vial, for injectable suspension. Recordati Rare Diseases Canada Inc.; October 2, 2024.
33.Balshem H, Helfand M, Schünemann HJ, et al. GRADE guidelines: 3. Rating the quality of evidence. J Clin Epidemiol. 2011;64(4):401-6. doi: 10.1016/j.jclinepi.2010.07.015 PubMed
34.Santesso N, Glenton C, Dahm P, et al. GRADE guidelines 26: informative statements to communicate the findings of systematic reviews of interventions. J Clin Epidemiol. 2020;119:126-135. doi: 10.1016/j.jclinepi.2019.10.014 PubMed
35.Recordati Rare Diseases Canada Inc. Signifor GVD – Signifor (Indirect Treatment Comparison) Section, version 2.0 [internal sponsor's report]. In: Drug Reimbursement Review sponsor submission: Signifor LAR (pasireotide), 40 mg or 60 mg, vial, for injectable suspension. September 2014.
36.Trainer PJ. ACROSTUDY: the first 5 years. Eur J Endocrinol. 2009;161 Suppl 1:S19-24. doi: 10.1530/EJE-09-0322 PubMed
37.Gadelha M, Bex M, Colao A, et al. Evaluation of the Efficacy and Safety of Switching to Pasireotide in Patients With Acromegaly Inadequately Controlled With First-Generation Somatostatin Analogs. Front Endocrinol (Lausanne). 2019;10:931. doi: 10.3389/fendo.2019.00931 PubMed
38.Melmed S, Bronstein MD, Chanson P, et al. A Consensus Statement on acromegaly therapeutic outcomes. Nat Rev Endocrinol. 2018;14(9):552-561. doi: 10.1038/s41574-018-0058-5 PubMed
39.Katznelson L, Atkinson JL, Cook DM, Ezzat SZ, Hamrahian AH, Miller KK. American Association of Clinical Endocrinologists medical guidelines for clinical practice for the diagnosis and treatment of acromegaly--2011 update. Endocr Pract. 2011;17 Suppl 4:1-44. doi: 10.4158/ep.17.s4.1 PubMed
40.Katznelson L, Laws ER, Jr., Melmed S, et al. Acromegaly: an endocrine society clinical practice guideline. J Clin Endocrinol Metab. 2014;99(11):3933-51. doi: 10.1210/jc.2014-2700 PubMed
41.Novartis Pharmaceuticals. Clinical Study Report: CSOM230C2413. A phase IIIb multicenter, open-label, single-arm study to evaluate the efficacy and safety of pasireotide in patients with acromegaly inadequately controlled with first-generation somatostatin analogues [internal sponsor's report]. November 5, 2018.
42.Oliveira BA, Araujo B, Dos Santos TM, et al. Health-related Quality of Life in Acromegaly Patients: Results from Generic and Disease-specific Questionnaires. Indian J Endocrinol Metab. 2020;24(5):402-405. doi: 10.4103/ijem.IJEM_401_20 PubMed
43.Bolfi F, Neves AF, Boguszewski CL, Nunes-Nogueira VS. Mortality in acromegaly decreased in the last decade: a systematic review and meta-analysis. Eur J Endocrinol. 2018;179(1):59-71. doi: 10.1530/EJE-18-0255 PubMed
44.Stormann S, Meyhofer SM, Groener JB, et al. Management of pasireotide-induced hyperglycemia in patients with acromegaly: An experts' consensus statement. Front Endocrinol (Lausanne). 2024;15:1348990. doi: 10.3389/fendo.2024.1348990 PubMed
Appendix 1: Detailed Outcome Data
Please note that this appendix has not been copy-edited.
The data reported in this section is from the extension/crossover phases of the 2 studies included in the systematic review section of this report. The outcomes reported mirror those reported in the systematic review section, over a large number of time points.
Study C2305
Patients With a Reduction of GH Level to < 2.5 mcg/L and Normalization of IGF-1 at Month 12
Table 27: Proportion of Patients With a Reduction of GH Level to Less Than 2.5 mcg/L and Normalization of IGF-1 by Visit and Treatment — Data up to Crossover (FAS)
Visit | Pasireotide LAR N = 176 | Octreotide LAR N = 182 | Between treatment | ||
|---|---|---|---|---|---|
n/N (%) | 95% exact Cl | n/N (%) | 95% exact Cl | Odds ratio (95% Cl) | |
Month 3 | 53 of 176 (30.1) | (23.4 to 37.5) | 39 of 182 (21.4) | (15.7 to 28.1) | 1.605 (0.992 to 2 596) |
Month 6 | 53 of 176 (30.1) | (23.4 to 37.5) | 36 of 182 (19.8) | (14.3 to 26.3) | 1.758 (1.082 to 2857) |
Month 9 | 49 of 176 (27.8) | (21.4 to 35.1) | 42 of 182 (23.1) | (172 to 29.9) | 1.291 (0.803 to 2.074) |
Month 12 | 51 of 176 (29.0) | (22.4 to 36.3) | 32 of 182 (17.6) | (12.3 to 23.9) | 1.939 (1.173 to 3 206) |
Month 16 | 37 of 147 (25.2) | (18.4 to 33.0) | 19 of 153 (12.4) | (7.6 to 18.7) | 2.425 (1.314 to 4.476) |
Month 19 | 34 of 147 (23.1) | (16.6 to 30.8) | 21 of 153 (13.7) | (8.7 to 20.2) | 1.891 (1.039 to 3.442) |
Month 22 | 37 of 147 (25.2) | (18.4 to 33.0) | 25 of 153 (16.3) | (10.9 to 23.2) | 1.733 (0.984 to 3.054) |
Month 25 | 36 of 147 (24.5) | (17.8 to 32.3) | 21 of 153 (13.7) | (8.7 to 20.2) | 2.058 (1.135 to 3 730) |
CI = confidence interval; FAS = full analysis set; GH = growth hormone; IGF-1 = insulin-like growth factor 1; LAR = long-acting release; OR = odds ratio
Notes: Odds ratios are adjusted for randomization stratification factor.
Denominator for time points up to Month 12 is the FAS. Denominator for time points after month 12 excludes patients who completed the core and did not enter the extension.
Patients who discontinued were considered as not having experienced a response for the time points after discontinuation, patients who crossed over were considered as not having experienced a response for all time points after crossover.GH assessment was based on mean of a 5-point 2-hour profile.
Sources: Study C2305 Clinical Study Report Table 11-11. 25
Figure 2: Mean Growth Hormone Levels by Visit and Treatment — Data up to Crossover (FAS)
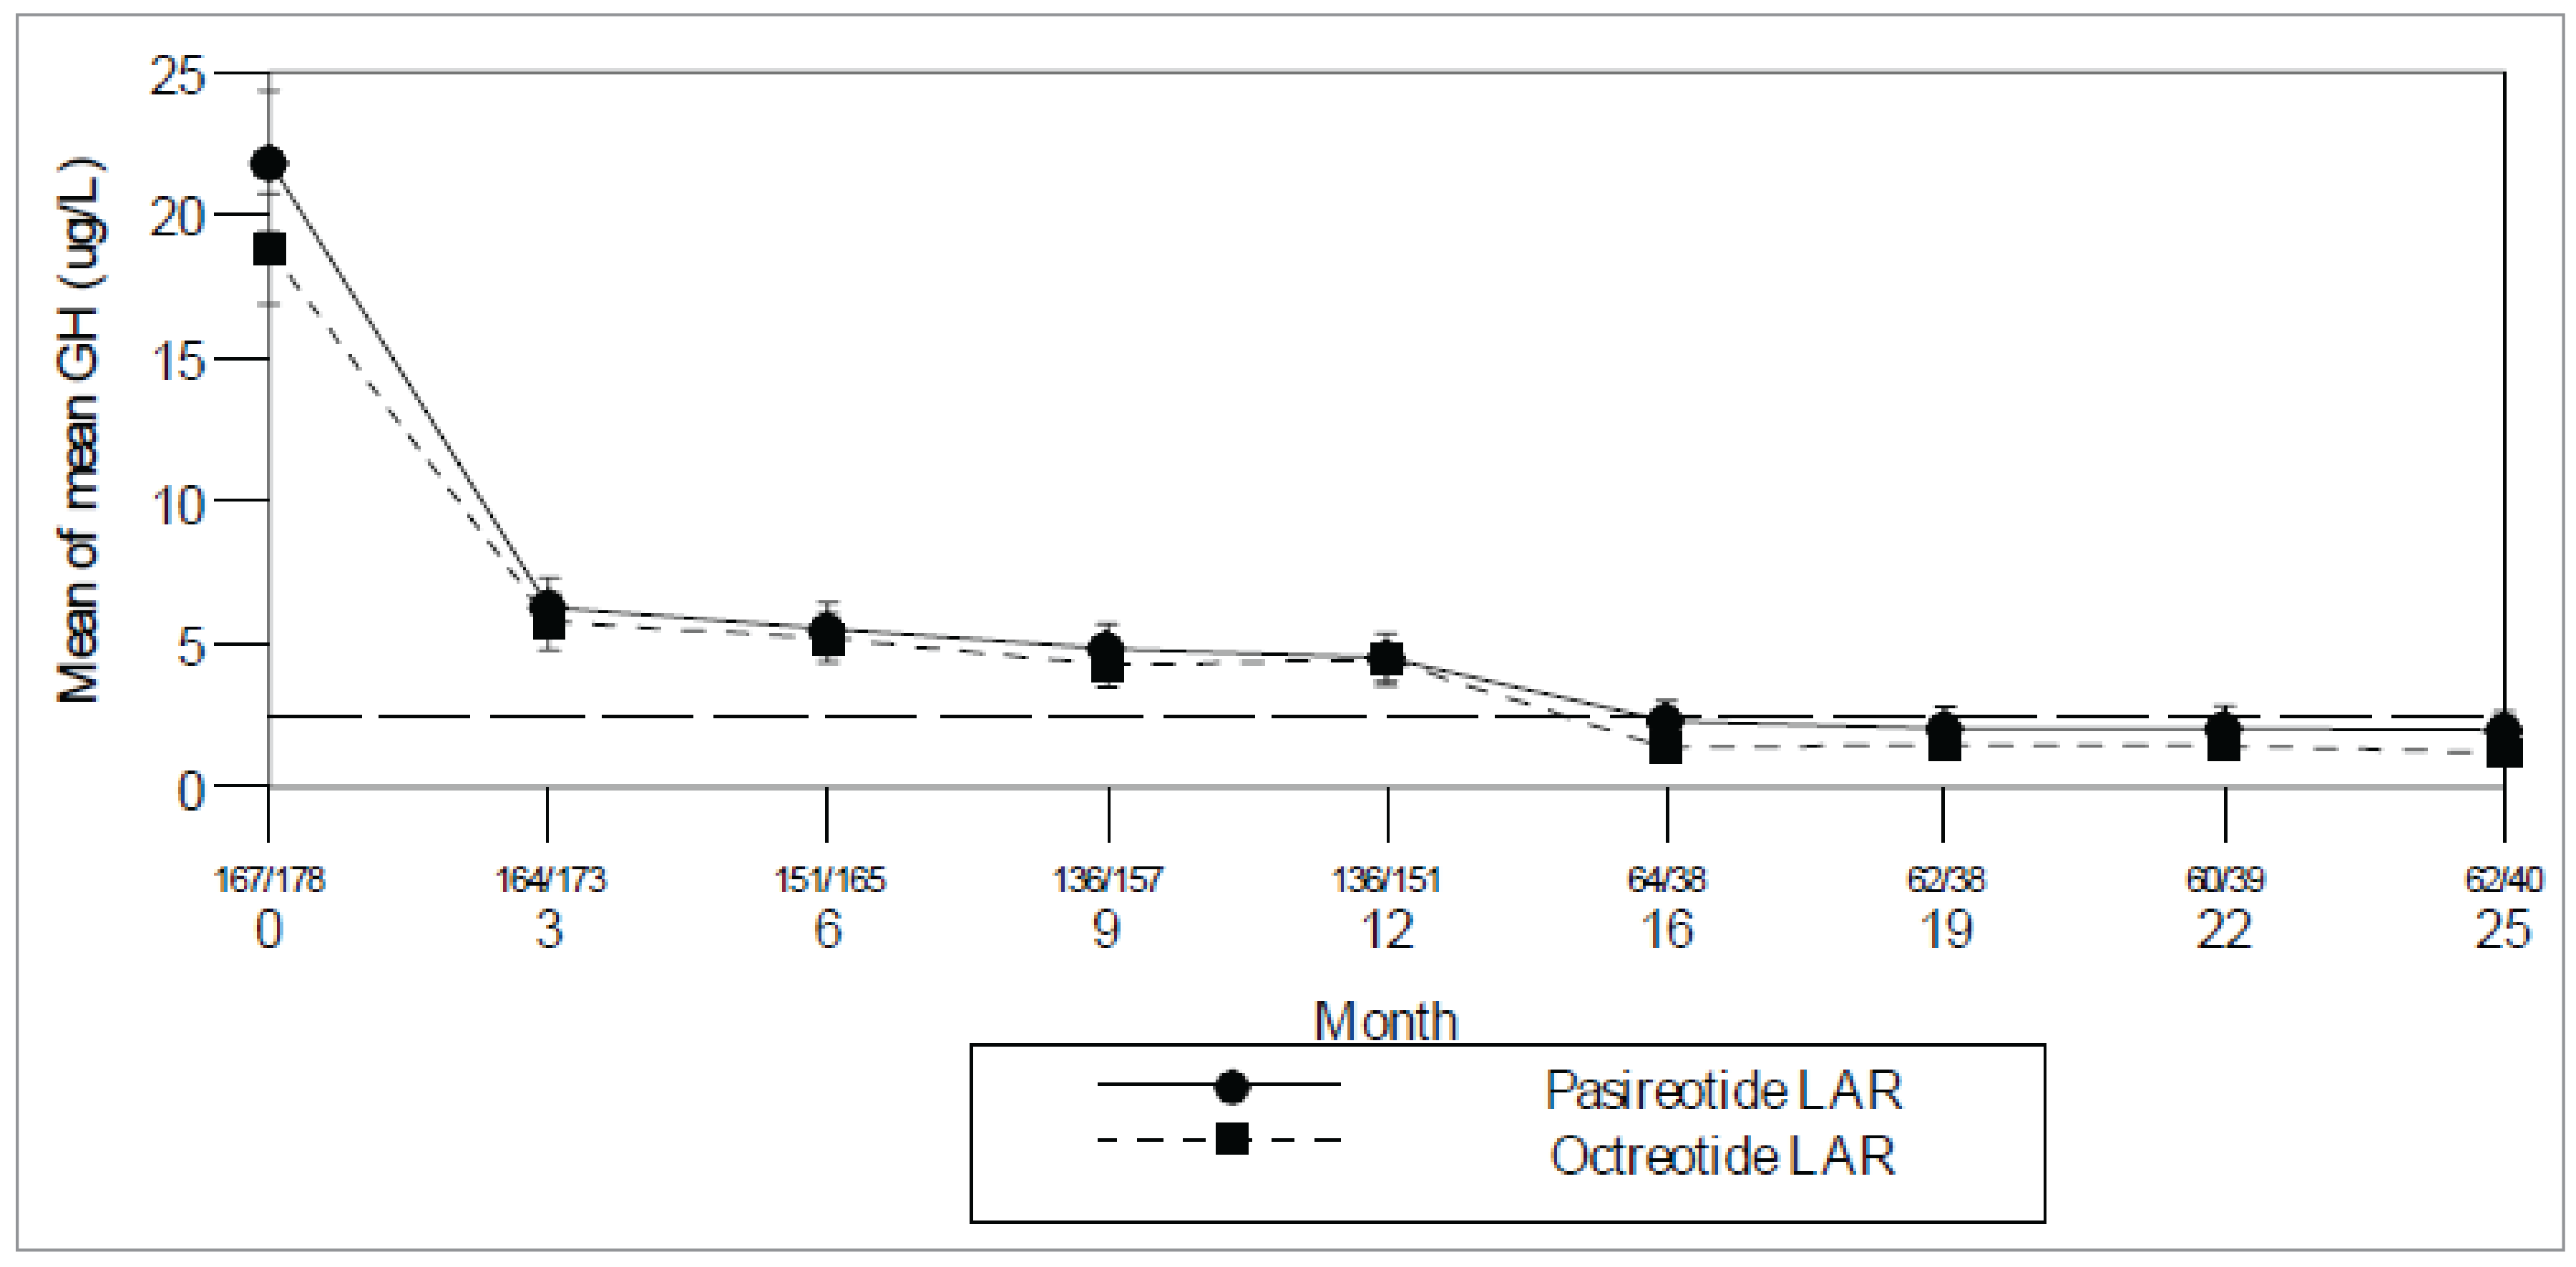
FAS = full analysis set; LAR = long-acting release; SE = standard error
Note: Numbers shown between the x-axis tick mark and the numeral indicating the month represent the numbers of patients in pasireotide/octreotide treatment group. This analysis includes scheduled visits only. Only patients with available data are included (at least 3 samples contributing to mean GH at each time point). ± standard errors are displayed. Reference line is 2.5 mcg/L. GH was based on mean of a 5-point 2-hour profile.
Source: Study C2305 Clinical Study Report Figure 14.2-4.125
As shown in Figure 3, mean GH decreased for patients who crossed over to pasireotide, whereas mean GH increased among those who crossed over to octreotide. Mean GH at extension baseline was slightly lower for patients who crossed over to pasireotide (5.9 mcg/L, n = 78) than for those who crossed over to octreotide (7.1 mcg/L, n = 33). After crossover to pasireotide, mean GH decreased to 2.5 mcg/L at month 12 (mean decrease 23.7%); GH levels remained less than 2.5 mcg/L at all subsequent visits. After crossover to octreotide, mean GH increased to 10.4 mcg/L at month 12 (mean increase 74.5%).
Figure 3: Mean Growth Hormone Levels by Visit and Treatment — After Crossover (CAS)
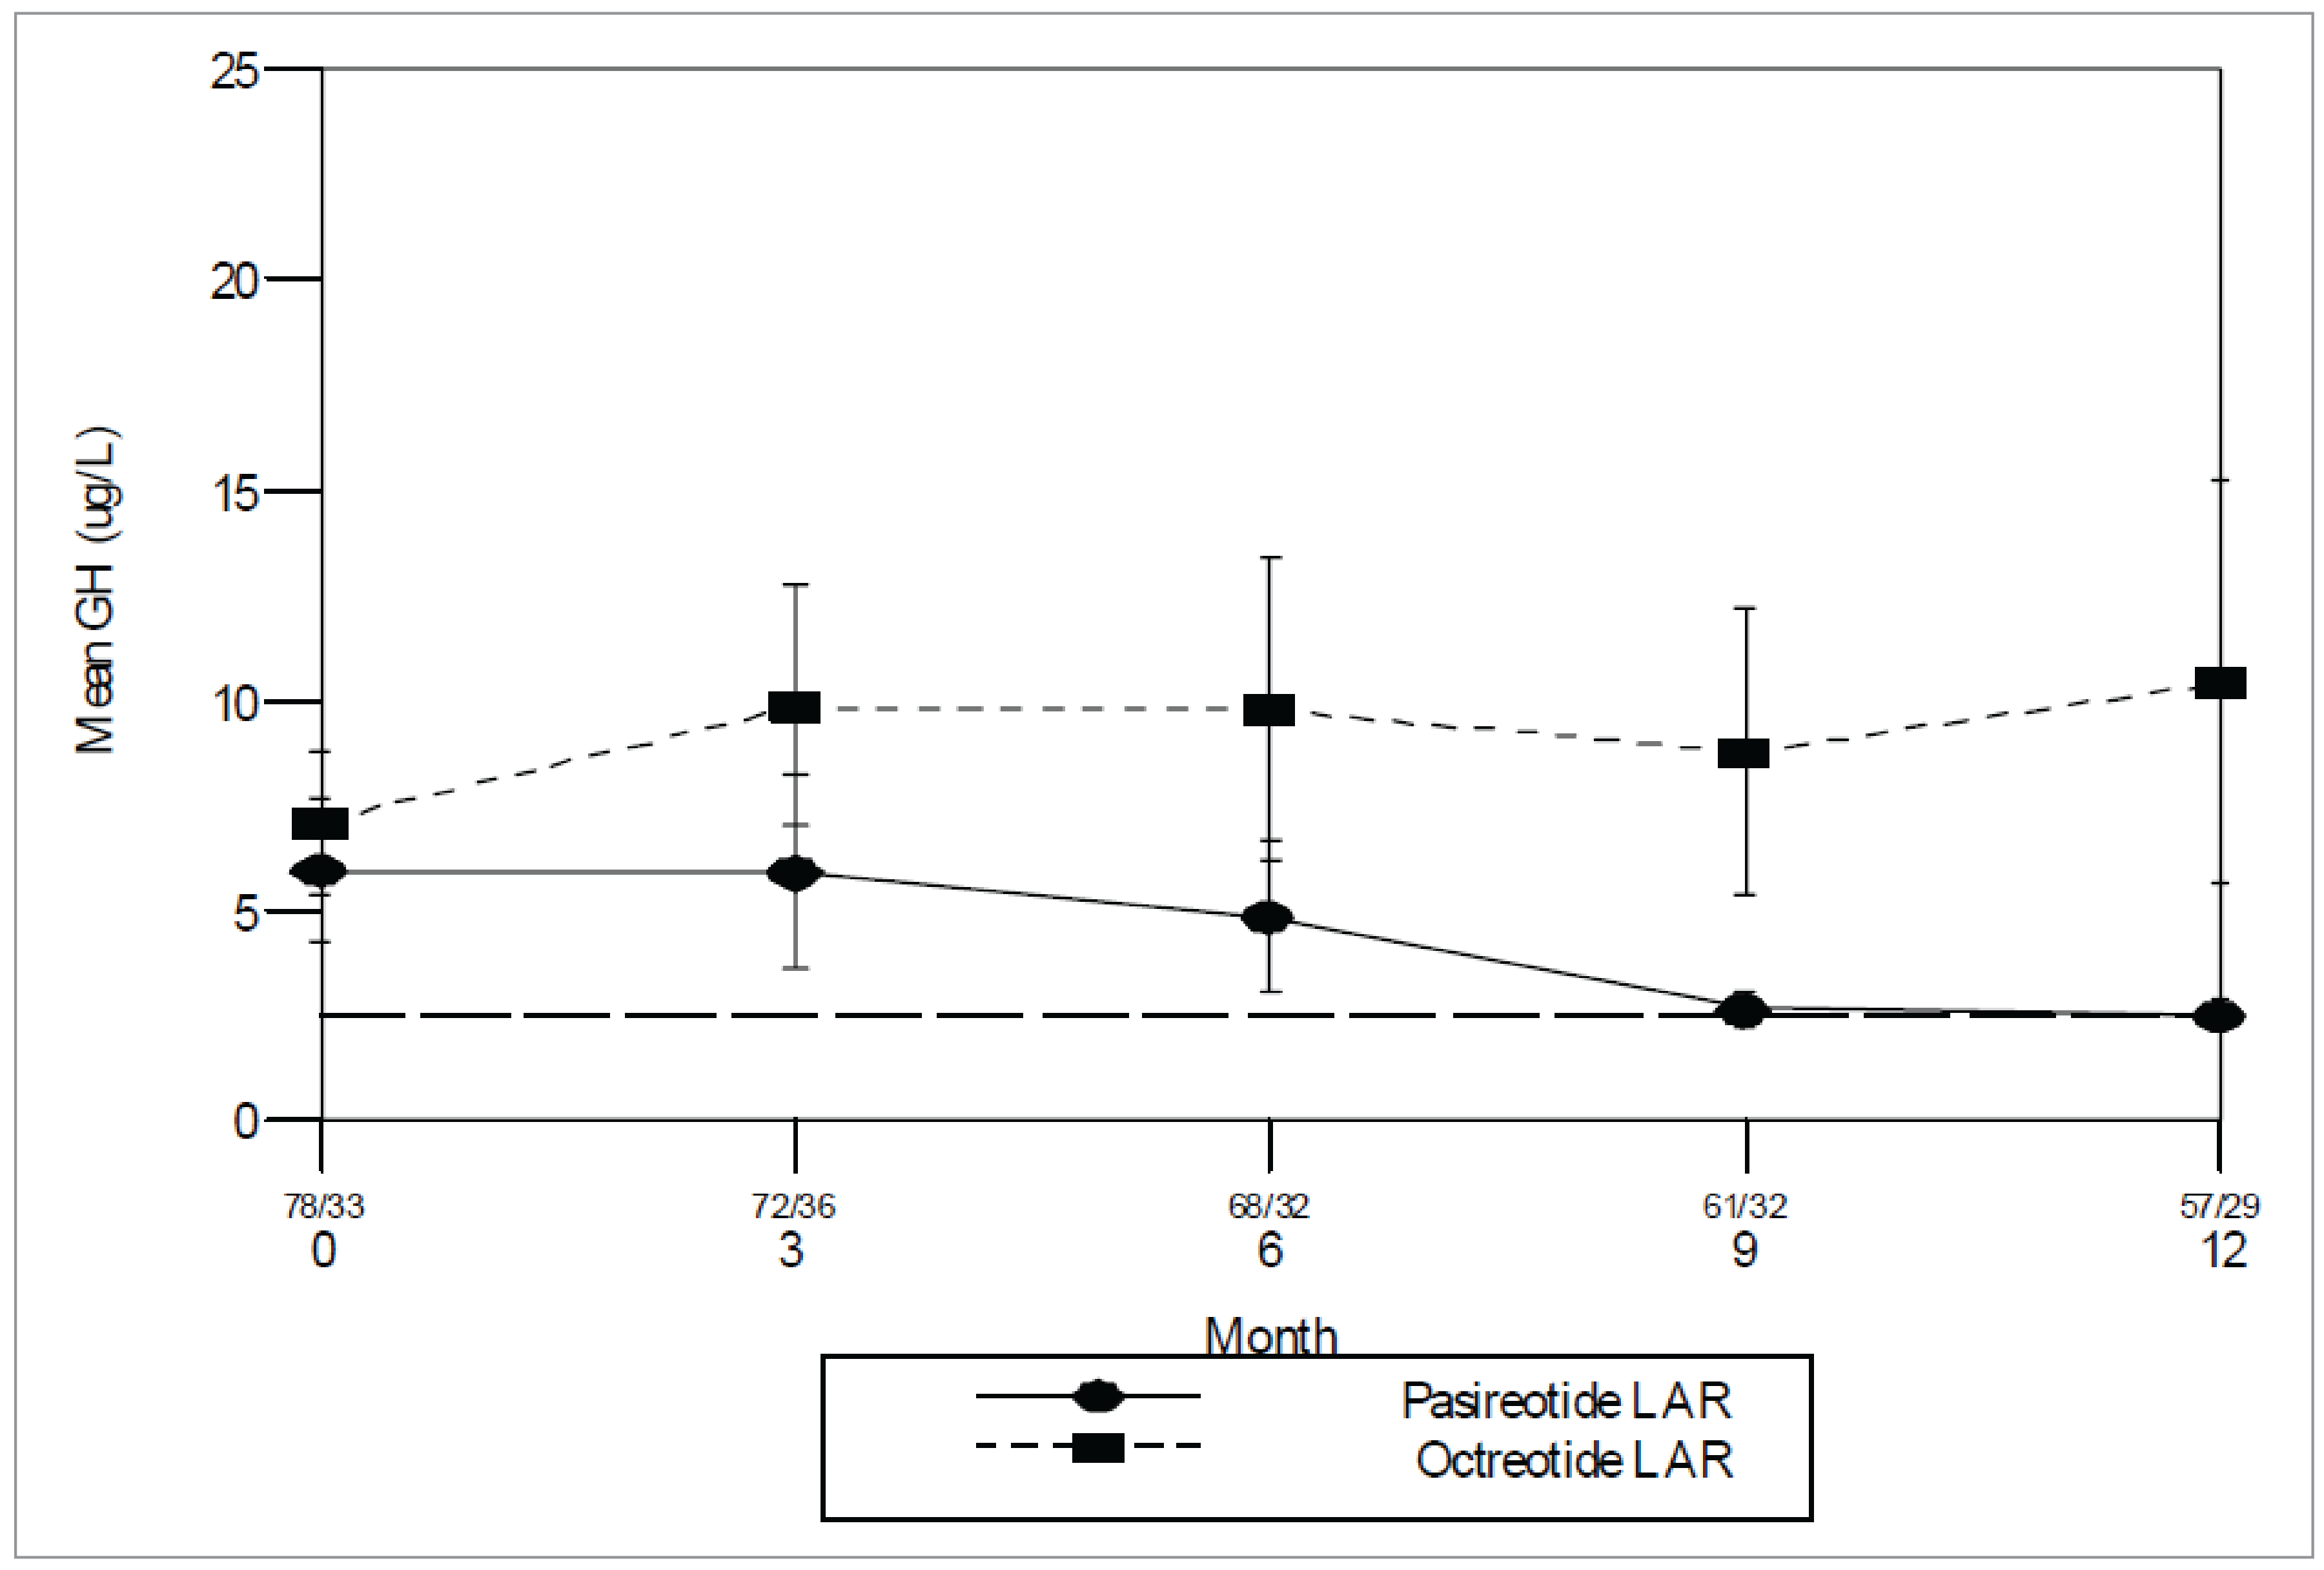
CAS = Crossover analysis set; LAR = long-acting release; SE = standard error
Notes: The numbers shown between the x-axis tick mark and the numeral for the month represent the numbers of patients in pasireotide/octreotide treatment group.
This analysis includes scheduled visits only. At least 3 samples contributed to a patient's GH value at each time point.
Reference line is 2.5 mcg/L
Source: Study C2305 Clinical Study Report Figure 11-62.5
Patients With IGF-1 Response Over Time
The proportion of patients whose IGF-1 normalized was higher in the pasireotide than the octreotide arm throughout the core and extension (Table 28). Odds ratios indicated a treatment effect in favour of pasireotide at all visits in the core and extension, with lower bound of 95% CIs greater than 1 at all time points except months 9 and 22.
Table 28: Proportion of Patients With Normalization of IGF-1 Levels by Visit and Treatment — Data up to Crossover (FAS)
Visit | Pasireotide LAR N = 176 | Octreotide LAR N = 182 | Between treatment | ||
|---|---|---|---|---|---|
n/N (%) | 95% exact CI | n/N (%) | 95% exact CI | OR (95% CI) | |
Month 3 | 62 of 176 (35.2) | (28.2 to 42.28) | 46 of 182 (25.3) | (19.1 to 322) | 1.640 (1.036 to 2.595) |
Month 6 | 63 of 176 (35.8) | (287 to 43.4) | 44 of 182 (24.2) | (18.1 to 31.1) | 1.764 (1.116 to 2.790) |
Month 9 | 60 of 176 (34.1) | (27.1 to 41.6) | 51 of 182 (28.0) | (21.6 to 35.1) | 1.328 (0.849 to 2.077) |
Month 12 | 63 of 176 (35.8) | (28.7 to 43.4) | 40 of 182 (22.0) | (16.2 to 28.7) | 2.018 (1.262 to 3.226) |
Month 16 | 44 of 147 (29.9) | (22.7 to 38.0) | 21 of 153 (13.7) | (8.7 to 20.2) | 2.795 (1.552 to 5.031) |
Month 19 | 37 of 147 (25.2) | (18.4 to 33.0) | 24 of 153 (15.7) | (10.3 to 22.4) | 1.803 (1.018 to 3.194) |
Month 22 | 38 of 147 (25.9) | (19.0 to 33.7) | 26 of 153 (17.0) | (11.4 to 23.9) | 1.709 (0.978 to 2.988) |
Month 25 | 38 of 147 (25.9) | (19.0 to 33.7) | 22 of 153 (14.4) | (9.2 to 21.0) | 2.092 (1.168 to 3.748) |
CI = confidence interval; FAS = full analysis set; LAR = long-acting release; OR = odds ratio
Notes: Odds ratios are adjusted for randomization stratification factor.
Denominator for time points up to Month 12 is the FAS.
Denominator for time points beyond month 12 excludes patients who did not enter the extension.
Patients who discontinued were considered as not having experienced a response for the time points after discontinuation, patients who crossed over were considered as not having experienced a response for all time points after crossover.
Sources: Study C2305 Clinical Study Report Table 11-13.25
The response rates for normalization of IGF-1 were higher for patients who crossed over to pasireotide (27.2% at month 12), compared to those who crossed over to octreotide (5.3% at month 12; Table 28).
Response rates for patients who crossed to pasireotide were stable for up to 2 years after crossover, with response rates ranging from 20.4% to 25.8% at month 15 through month 24 after crossover.
Table 29: Proportion of Patients With Normalization of IGF-1 Levels by Visit and Treatment — Data After Crossover (CAS)
Extension visit | Study C2305 | |||
|---|---|---|---|---|
Crossover to pasireotide LAR | Crossover to Octreotide LAR | |||
n (%) | 95% exact CI | n (%) | 95% exact CI | |
Month 3 | 16 of 81 (19.8) | (11.7 to 30.1) | 3 of 38 (7.9) | (1.7 to 21.4) |
Month 6 | 25 of 81 (30.9) | (21.1 to 42.1) | 3 of 38 (7.9) | (1.7 to 21.4) |
Month 9 | 24 of 81 (29.6) | (20.0 to 40.8) | 4 of 38 (10.5) | (2.9 to 24.8) |
Month 12 | 22 of 81 (27.2) | (17.9 to 38.2) | 2 of 38 (5.3) | (0.6 to 17.7) |
CAS = Crossover analysis set; CI = confidence interval; insulin-like growth; LAR = long-acting release.
Note: Months refer to months after crossover.
Source: Study C2305 Clinical Study Report Table 11-2025
Mean Standardized IGF-1 Values Over Time
Baseline mean standardized IGF-1 was comparable in the pasireotide and octreotide arms (mean 3.1 in both arms; Figure 4). By month 3, a marked reduction in IGF-1 levels was observed in both treatment arms (mean percent decrease from baseline was 49.5% for pasireotide and 45.1% for octreotide). At month 12, mean IGF-1 was 1.4 in the pasireotide arm, and 1.5 in the octreotide arm. The mean % decrease from baseline at month 12 was slightly larger in the pasireotide arm (55.2%) than the octreotide arm (45.4%).
After month 12, patients who did not experience a response at month 12 crossed over to the other treatment if they entered the extension. As expected, IGF-1 levels for patients who continued the same treatment were close to 1 at the first assessment in the extension (month 16) in both treatment arms, and remained stable thereafter in both treatment arms. At month 25, mean IGF-1 was 0.8 versus 0.9 for pasireotide versus octreotide, and the mean % decrease from baseline was 67.2% versus 61.2%, respectively.
The treatment effect was consistent across strata in both arms. Patients who were postsurgery had slightly lower baseline IGF-1 levels (mean 2.6 and 2.8 for pasireotide and octreotide, respectively) than patients with de novo acromegaly (mean 3.3 in both arms). Robust decreases in IGF-1 levels were observed in both treatment arms for both strata by month 3 in the core: mean percent decrease from baseline was 54.9% versus 40.0% (pasireotide versus octreotide) for patients who were postsurgery, and 46.0% versus 48.8% for patients with de novo acromegaly. Mean IGF-1 levels at month 12 were slightly lower for patients who were postsurgery (1.0 versus 1.5 for pasireotide versus octreotide) than for patients with de novo acromegaly (1.6 in both arms). A slight difference between the strata was also evident at month 25; mean IGF-1 for postsurgery patients was 0.7 for both pasireotide and octreotide, whereas for patients with de novo acromegaly mean IGF-1 was 0.9 versus 1.0 for pasireotide versus octreotide.
Figure 4: Mean Standardized IGF-1 Levels by Visit and Treatment — Data up to Crossover
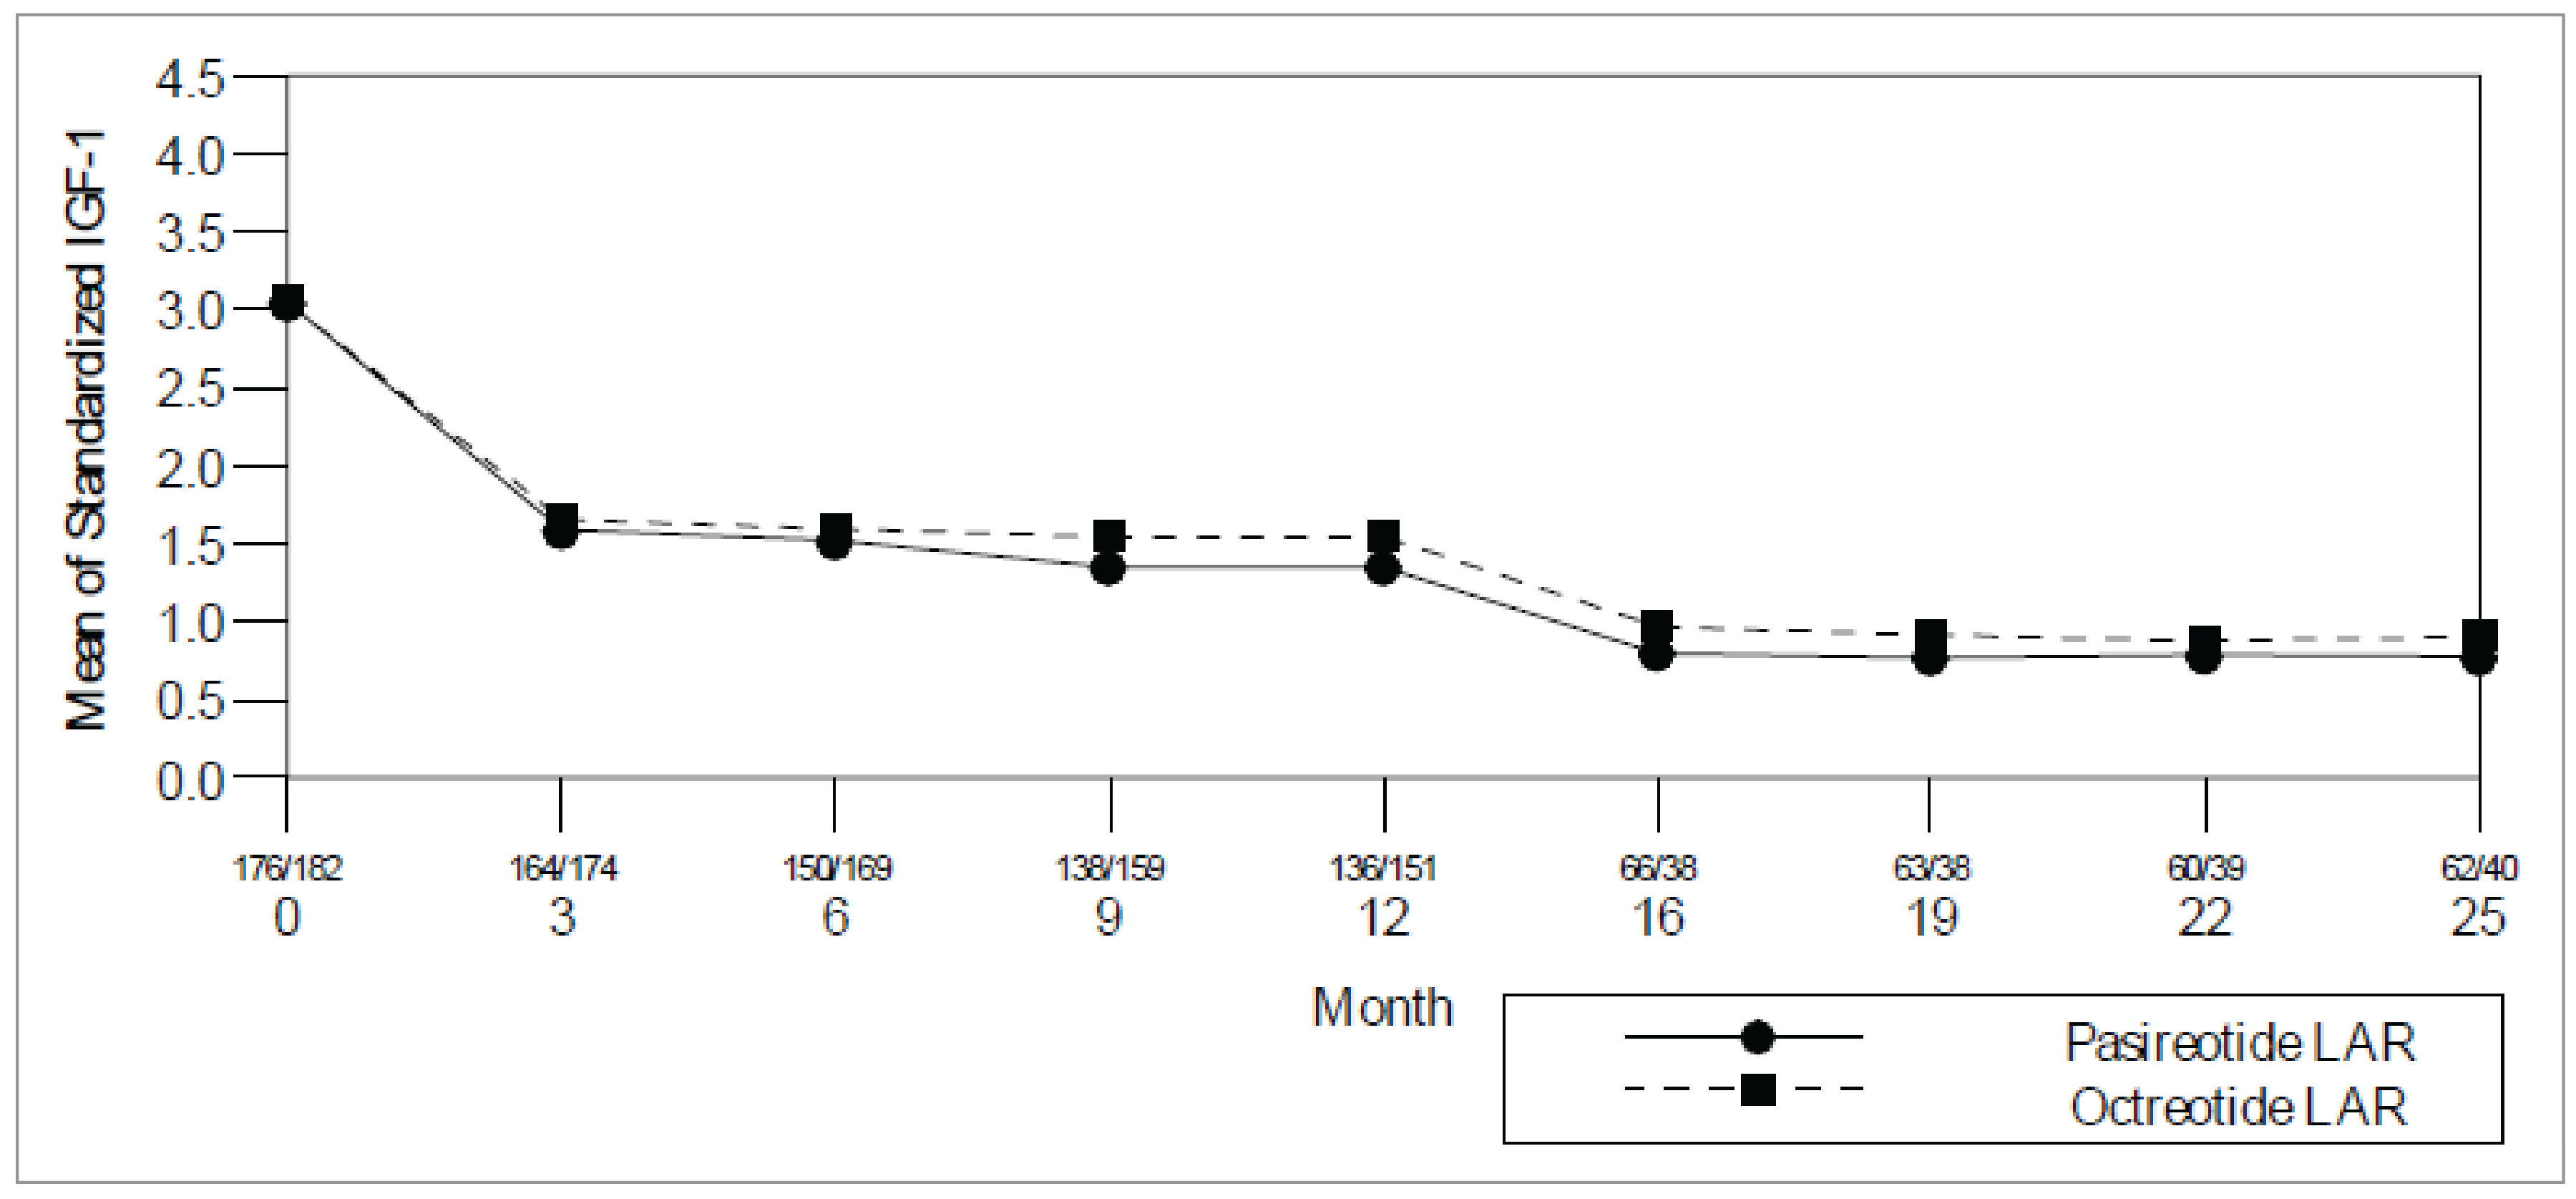
FAS = full analysis set; LAR = long-acting release; SE = standard error
Notes: Numbers shown between the x-axis tick mark and the numeral indicating the month represent the numbers of patients in pasireotide/octreotide treatment group. This analysis includes scheduled visits only, and only patients with data available at each time point are included. ± standard errors are displayed.
Standardized IGF-1 = IGF-1 value / ULN, where ULN is the upper limit of the normal range
Source: Study C2305 Clinical Study Report Figure 14.2-6.125
As shown in Figure 5 mean standardized IGF-1 decreased for patients who crossed over to pasireotide, but not for those who crossed over to octreotide. Mean IGF-1 at extension baseline was slightly lower for patients who crossed over to pasireotide (1.9, n = 78) than for those who crossed over to octreotide (2.1, n = 34). After crossover to pasireotide mean IGF-1 decreased to 1.1 at month 12 (mean decrease 39.9%); after month 12, mean IGF-1 remained ≤ 1 at all subsequent visits. After crossover to octreotide, mean IGF-1 remained nearly unchanged compared to baseline at all visits up to month 12; mean change from baseline was + 15.9% at month 12.
Figure 5: Mean Standardized IGF-1 Levels by Visit and Treatment — Data After Crossover (CAS)
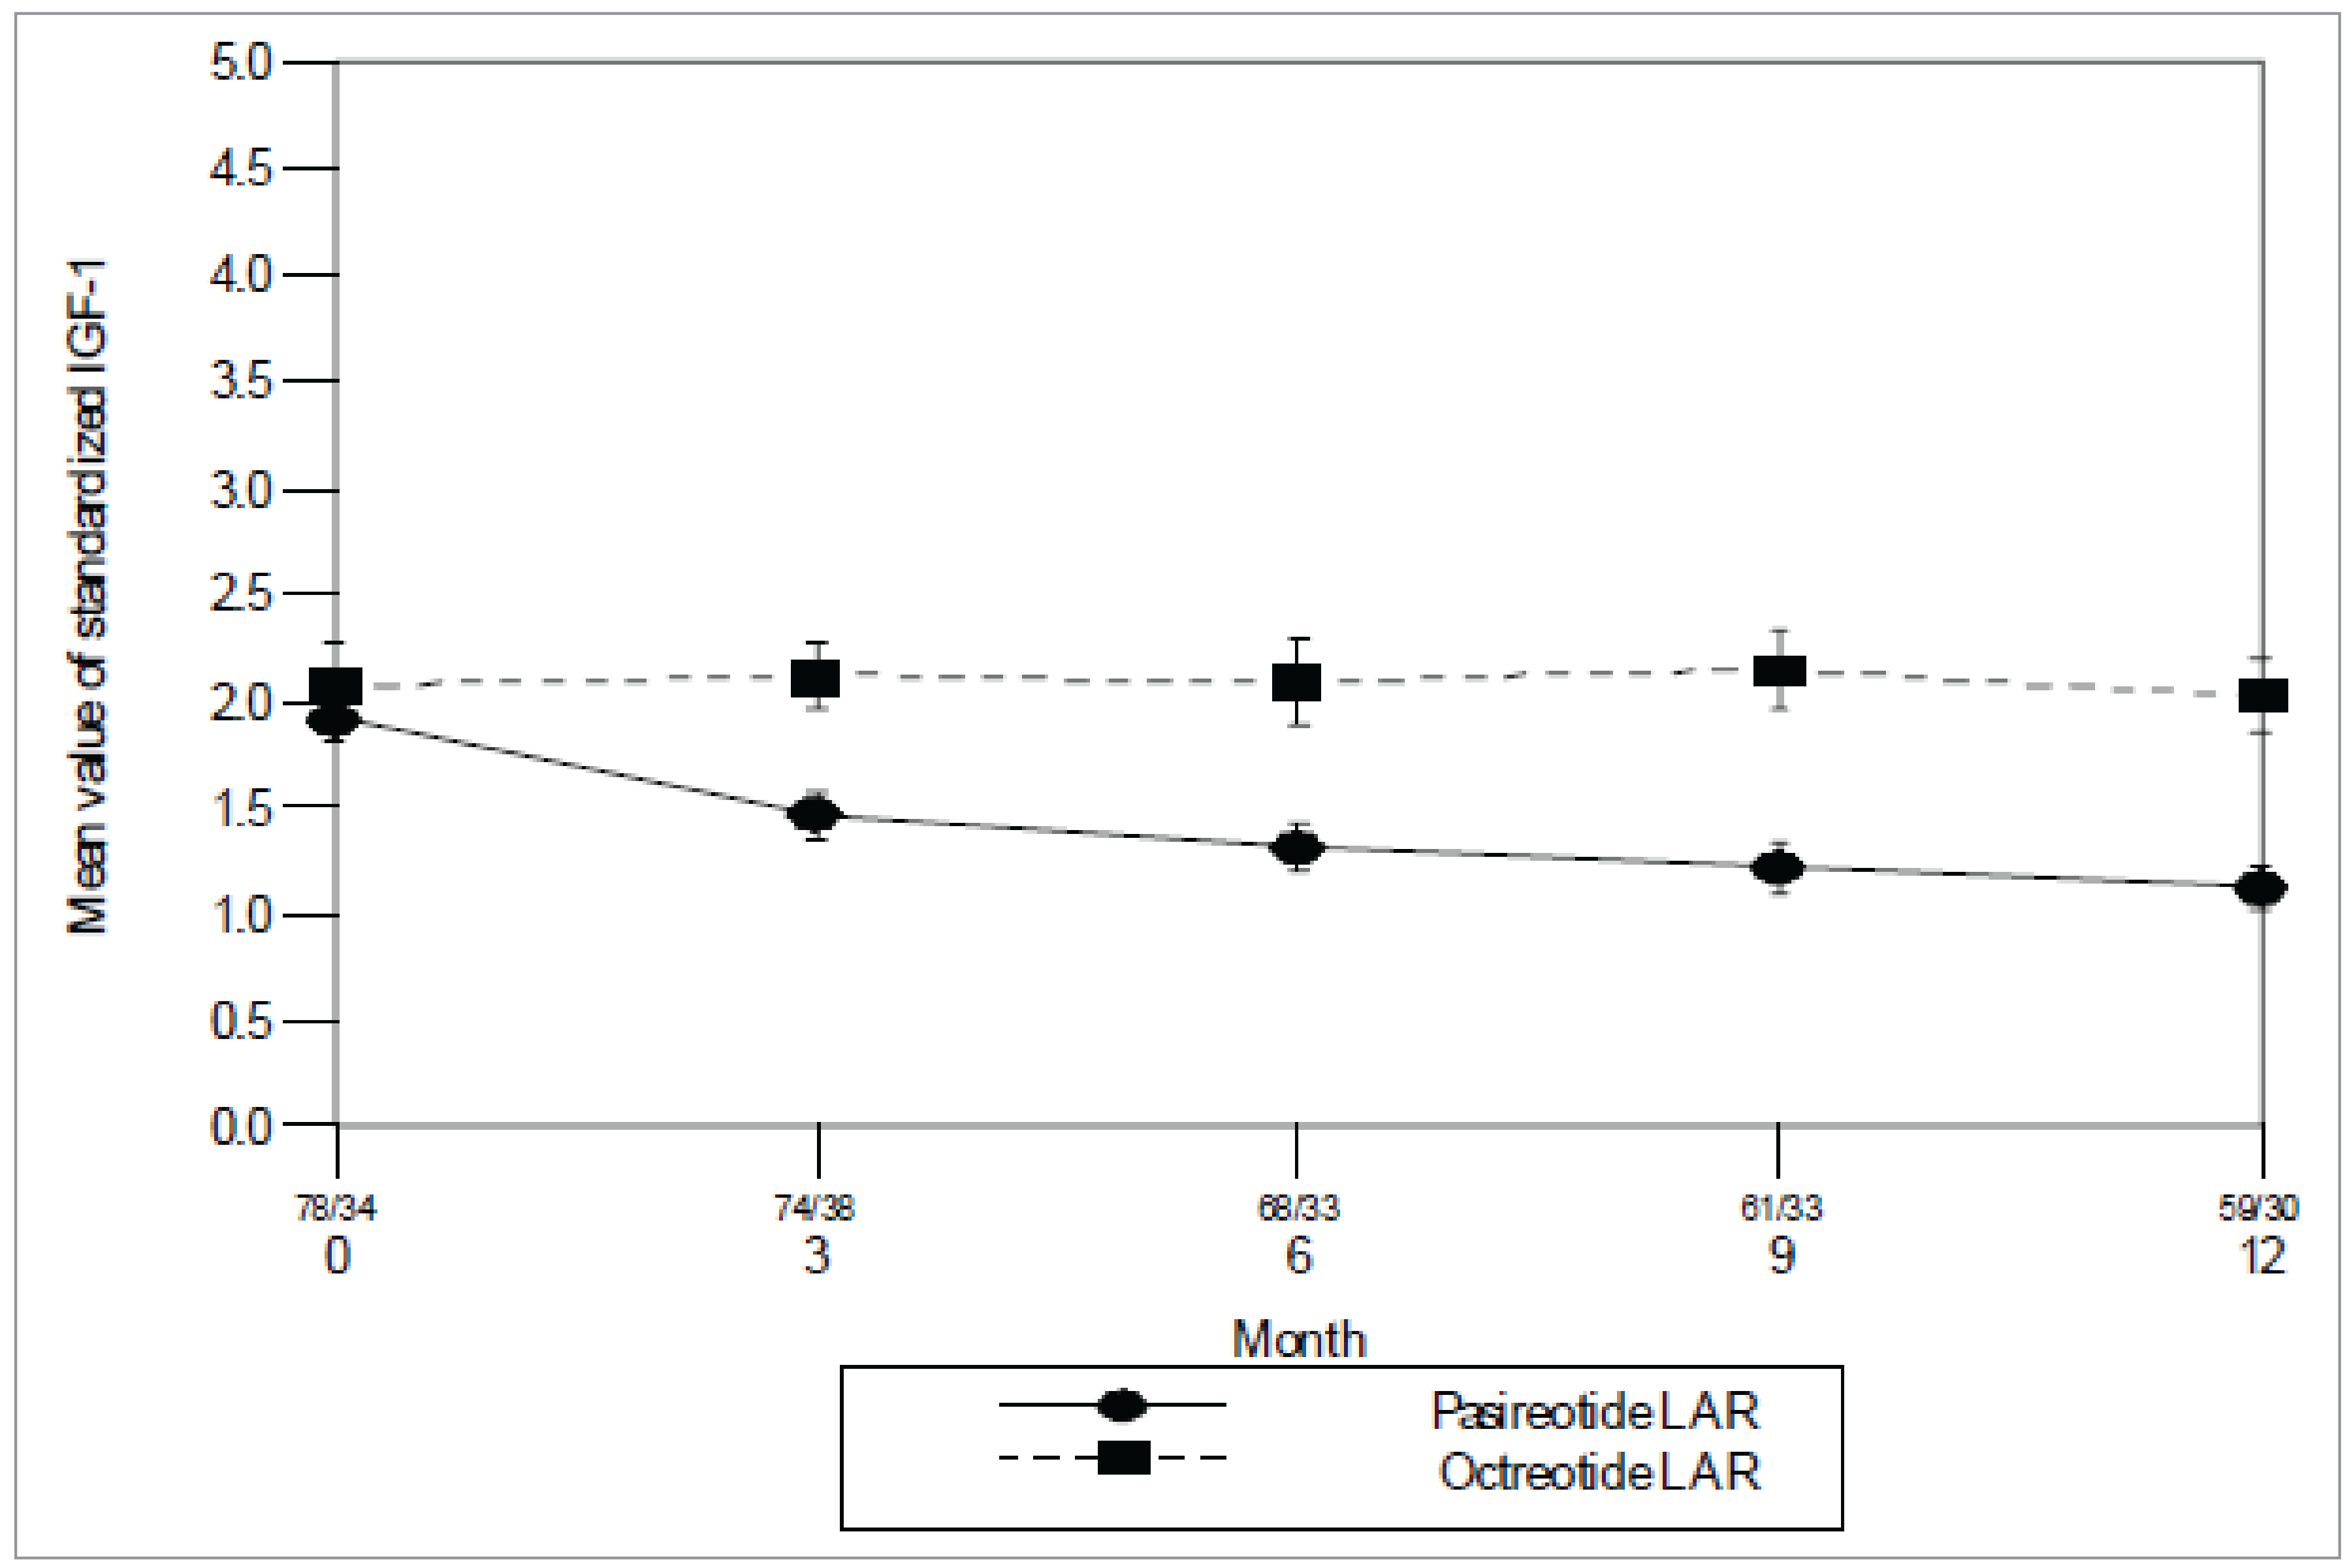
CAS = Crossover analysis set; LAR = long-acting release; SE = standard error
Notes: The numbers shown between the x-axis tick mark and the numeral for the month represent the numbers of patients in pasireotide/octreotide treatment group.
This analysis includes scheduled visits only.
Source: Study C2305 Clinical Study Report Figure 11-725
Tumour Volume
Tumour volume data collected beyond month 12 show that mean tumour volume continued to decrease for patients who continued the same treatment in the extension). Mean % decrease from baseline at month 25 was 51.8% (n = 54) for pasireotide and 55.0% (n = 34) for octreotide. Data after month 25 is primarily available for pasireotide, and shows that tumour volume continued to decrease among patients with data at those time points.
Reduction in tumour volume of at least 20%: The proportion of patients who experienced a clinically meaningful reduction of at least 20% in tumour volume using the up-to-crossover data were comparable in both treatment groups (74.7% for pasireotide versus 71.6% for octreotide). The median time to event was also comparable (25.0 weeks for pasireotide versus 24.3 weeks for octreotide). The probability estimates for event at 48 weeks was slightly higher for pasireotide (21.8%) than for octreotide (17.4%). Similar results were obtained in the postsurgery and de novo strata.
The mean % decrease in tumour volume from extension baseline was slightly higher in patients who crossed over to pasireotide than in patients who crossed over to octreotide (Table 29). At month 12 after crossover, the mean decrease in tumour volume was 24.7% for crossover to pasireotide and 17.9% for crossover to octreotide.
Further data are available after month 12 for patients who had crossed to pasireotide, showing that tumour volume continued to decrease for these patients. At month 24 after crossover, mean percent decrease in tumour volume was 35.8% for patients with data (n = 9), and at month 30, the mean % decrease in tumour volume was 50.6% (n = 6).
Table 30: Change From Extension Baseline in Tumour Volume by Visit and Treatment — Data After Crossover (CAS)
Extension visit | Crossover to pasireotide LAR | Crossover to octreotide LAR | ||
|---|---|---|---|---|
n | Tumour volume (mm3), mean (SD) | n | Tumour volume (mm3), mean (SD) | |
Extension baselinea | ||||
Extension baseline value | 73 | 1,420.9 (1,914.58) | 32 | 1,809.6 (2,579.25) |
Month 6 | ||||
Value at month 6 | 65 | 1,027.5 (1,282.42) | 31 | 1,794.9 (2,823.08) |
Change at month 6 | 60 | −241.3 (454.05) | 27 | −17.9 (803.21) |
% Change at month 6 | 59 | −18.1 (17.68) | 27 | −12.3 (24.11) |
Month 12 | ||||
Value at month 12 | 51 | 949.0 (1,169.49) | 30 | 1,610.4 (2,666.66) |
Change at month 12 | 47 | −368.5 (578.62) | 26 | −1.7 (846.13) |
% Change at month 12 | 46 | −24.7 (25.20) | 26 | −17.9 (27.80) |
CAS = Crossover analysis set; LAR = long-acting release; SD = standard deviation.
aThe extension baseline was defined as the last assessment before administration of the new treatment after crossover
Source: Study C2305 Clinical Study Report Table 11-21.25
The proportion of patients with a decrease or no change in tumour volume was higher among patients who crossed over to pasireotide (91.3%) than among those who crossed over to octreotide (73.1%).
Acromegaly Quality of Life
Total scores over time during the core are shown in Figure 6 Improvements in AcroQoL scores (total and individual subscores) were noted in both treatment arms, but the changes from baseline were larger in the pasireotide arm than the octreotide arm throughout the study period. At month 12, the % change from baseline in total AcroQoL score was + 28.4% for pasireotide and + 15.8% for octreotide. AcroQoL scores remained higher in the pasireotide than the octreotide arm throughout the extension for patients who continued the same treatment; at month 25, the % change from baseline was + 41.4% for pasireotide and + 12.1% for octreotide. The change from baseline was numerically higher in the pasireotide arm than in the octreotide arm for the total score (least square mean change of 7.2 for pasireotide versus 4.8 for octreotide) as well as the 4 subscores, with the largest difference between the 2 treatment arms seen for the psychological subscore (least square) mean change of 8.2 for pasireotide versus 4.9 for octreotide), and the largest change from baseline seen for the psychological/appearance subscore (least square mean change of 12.5 for pasireotide versus 9.3 for octreotide). The difference between pasireotide and octreotide was not statistically significant for the total score (P = 0.158) or for any of the subscores (P values ranged from 0.072 to 0.405).
Figure 6: Mean AcroQoL Total Scores by Visit and Treatment — Data up to Crossover (FAS)
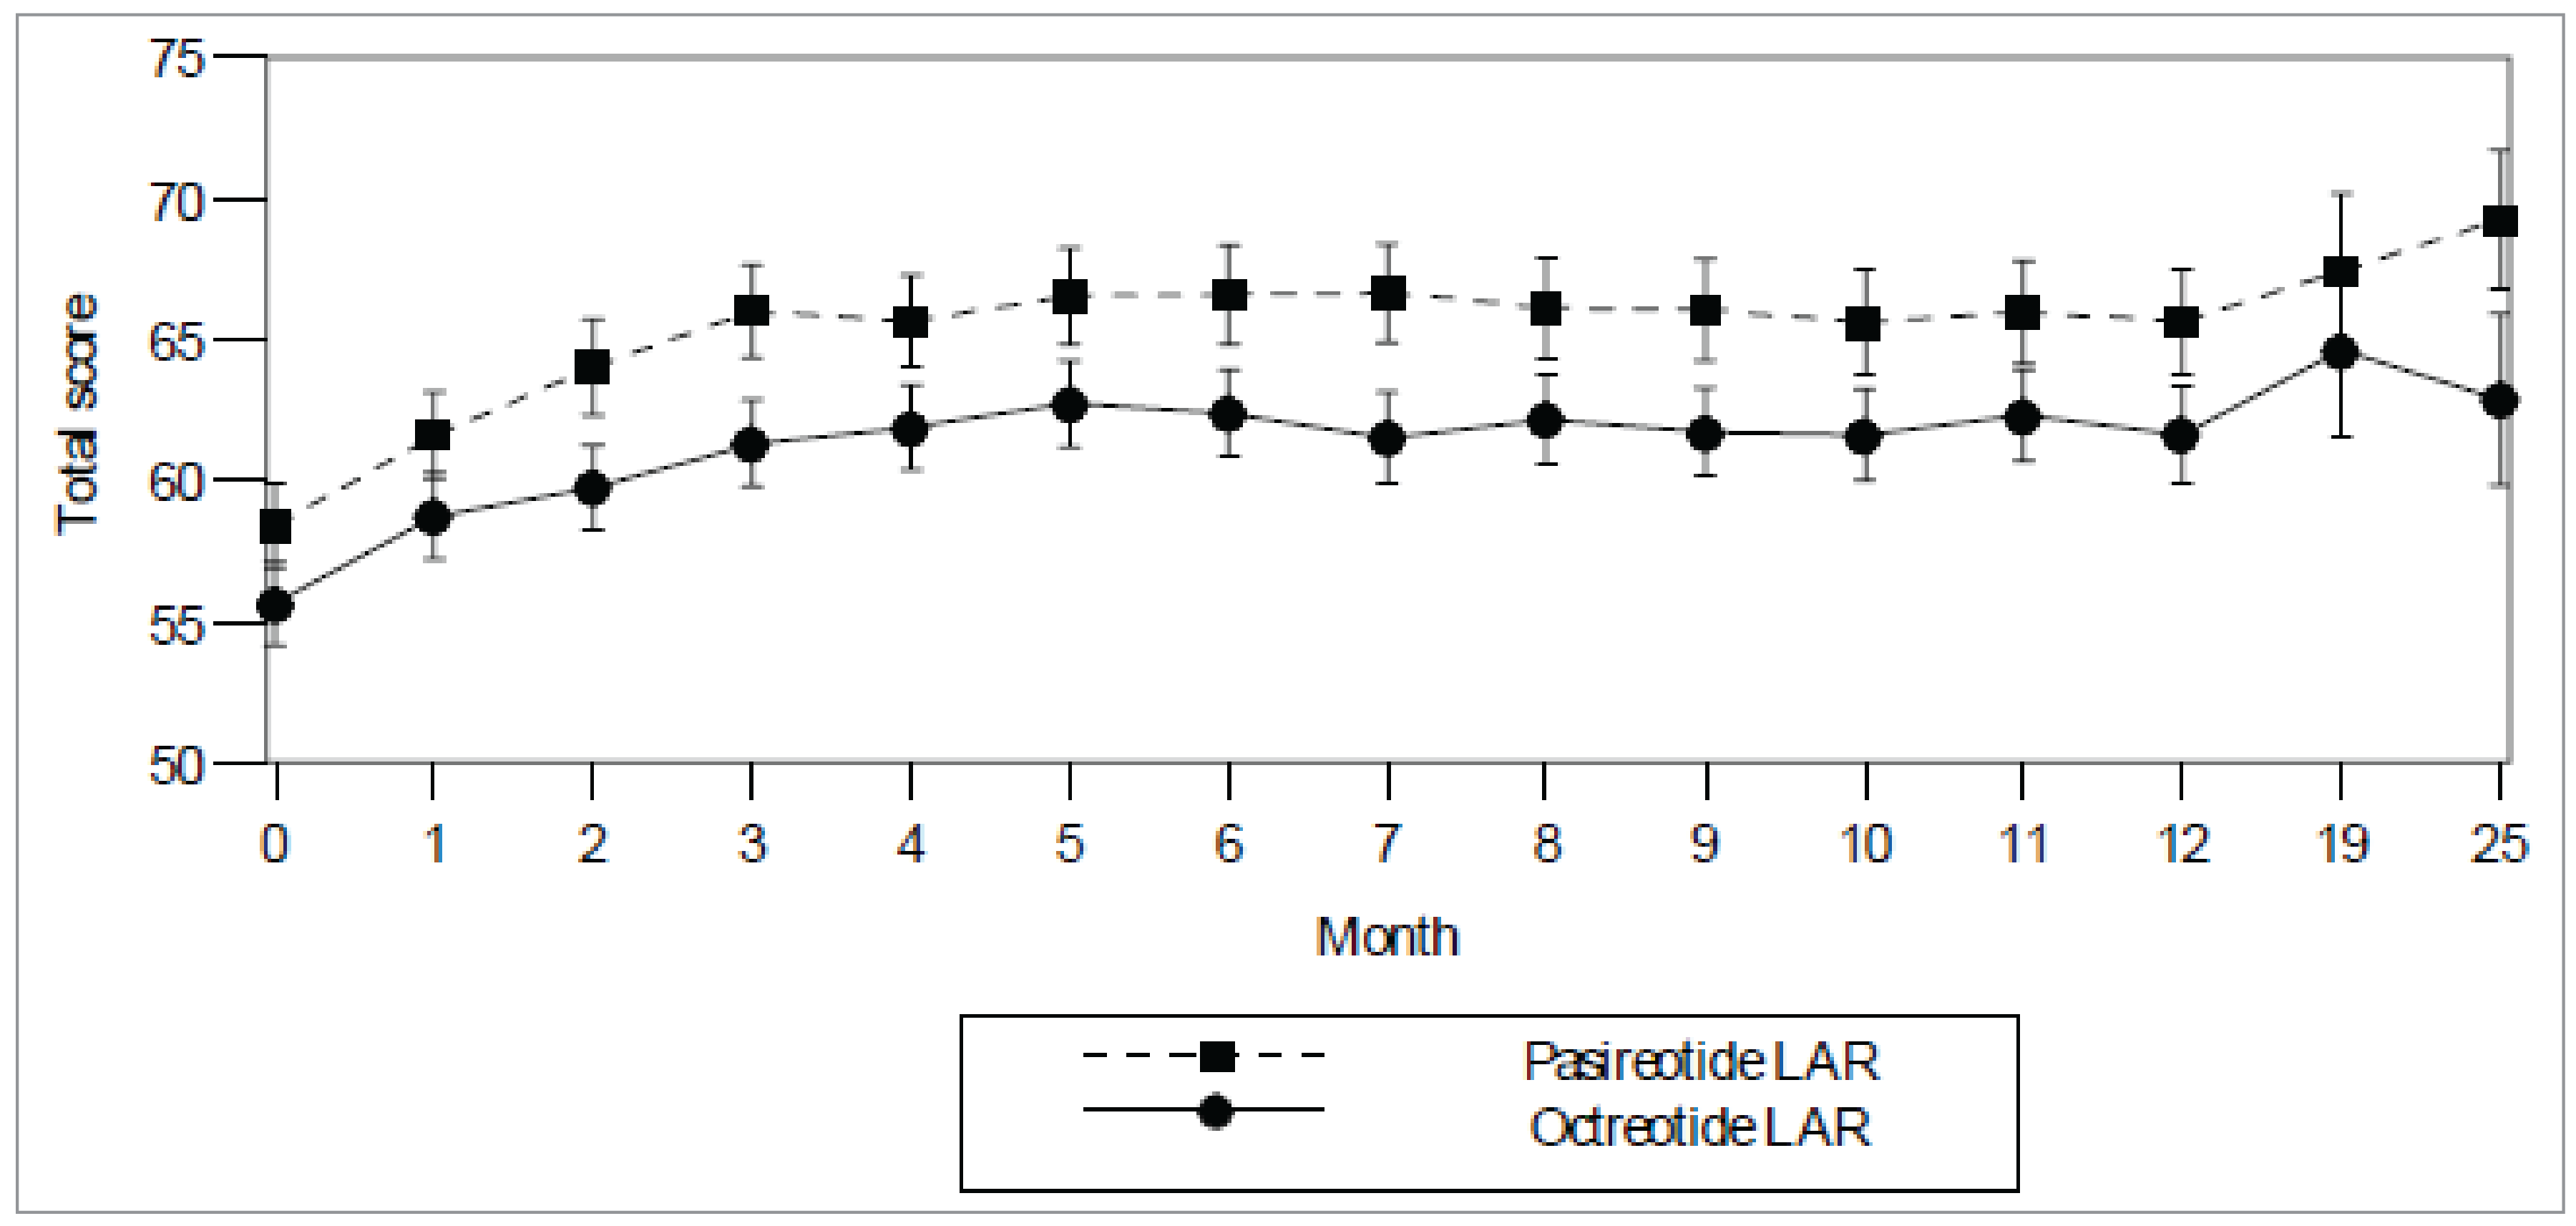
FAS = full analysis set; LAR = long-acting release
Source: Study C2305 Clinical Study Report Figure 14.2-16.125
Symptoms of Acromegaly, Ring Size, and Acromegaly Quality of Life
At extension baseline severity scores for acromegaly symptoms were comparable between the treatment groups (Table 30). After crossover, slight improvements compared to extension baseline in mean severity scores were seen for patients who crossed to pasireotide (Table 30). Summary statistics for decrease in ring size showed improvements for both crossover treatments, with no relevant difference between the groups. Mean AcroQoL total and subscores were comparable at extension baseline in both crossover groups. AcroQoL scores (total and individual subscores) remained relatively unchanged in both crossover groups
Table 31: Change From Baseline in Severity Scores of Acromegaly Symptoms at 12 Months by Treatment — Data After Crossover (CAS)
Acromegaly symptoms | Study C2305 | |||
|---|---|---|---|---|
Crossover to pasireotide LAR N = 81 | Crossover to Octreotide LAR N = 38 | |||
n | Mean (SD) | n | Mean (SD) | |
Headache | ||||
Extension baseline value | 81 | 0.6 (0.89) | 38 | 0.4 (0.60) |
Value at month 12 after crossover | 60 | 0.5 (0.83) | 32 | 0.7 (0.79) |
Change at month 12 after crossover | 60 | −0.3 (0.77) | 32 | 0.3 (0.88) |
Fatigue | ||||
Extension baseline value | 81 | 0.8 (1.07) | 38 | 0.7 (0.76) |
Value at month 12 after crossover | 60 | 0.8 (0.91) | 32 | 0.7 (0.68) |
Change at month 12 after crossover | 60 | −0.1 (0.93) | 32 | 0.0 (0.90) |
Perspiration | ||||
Extension baseline value | 81 | 0.5 (0.85) | 38 | 0.6 (0.86) |
Value at month 12 after crossover | 60 | 0.6 (0.98) | 32 | 0.5 (0.80) |
Change at month 12 after crossover | 60 | −0.0 (0.74) | 32 | −0.0 (0.82) |
Paresthesia | ||||
Extension baseline value | 81 | 0.4 (0.75) | 38 | 0.4 (0.54) |
Value at month 12 after crossover | 60 | 0.3 (0.56) | 32 | 0.4 (0.76) |
Change at month 12 after crossover | 60 | −0.1 (0.85) | 32 | 0.1 (0.83) |
Osteoarthralgia | ||||
Extension baseline value | 81 | 0.6 (0.91) | 38 | 0.6 (0.79) |
Value at month 12 after crossover | 60 | 0.5 (0.89) | 32 | 0.7 (0.86) |
Change at month 12 after crossover | 60 | −0.1 (0.60) | 32 | 0.1 (0.62) |
Acromegaly symptoms were scored from 0 (no symptom) to 4 (very severe).
Only patients who had a value at month 12 after crossover were included in the analysis.
Source: Study C2305 — Table 11-22.25
Study C2402
GH and Normalized IGF-1
The proportion of patients with biochemical control (reduction of GH level to < 2.5 mcg/L and normalized IGF-1) is presented for the pasireotide LAR 40 mg and pasireotide LAR 60 mg arms compared to the crossover to pasireotide arm (Table 31). At week 16, 11 patients (19.3% with 95% CI, 10.05, 31.91) in the pasireotide LAR 40 mg arm, 14 patients (25.9% with 95% CI, 14.96, 39.65) in pasireotide LAR 60 mg, and 12 patients (19.4% with 95% CI, 10.42, 31.37) in the crossover to pasireotide arm achieved biochemical control. At week 28, 10 patients (17.5% with 95% CI, 8.75, 29.91) in the pasireotide LAR 40 mg arm, 14 patients (25.9% with 95% CI, 14.96, 39.65) in pasireotide LAR 60 mg, and with 12 patients (19.4% with 95% CI, 10.42, 31.37) in the crossover to pasireotide arm experienced biochemical control.
A consistent suppression of GH and IGF-1 was observed throughout the extension phase as indicated by the proportion of patients achieving biochemical control that remained pretty much unchanged during the observation period. The decrease in the biochemical control frequency recorded toward the end of the extension phase can be explained by the gradual reduction in the number of patients remaining in the study. Of note, the patients who crossed over to pasireotide during the extension had a similar pattern: a similar proportion of patients experienced biochemical in a short period of time since starting the treatment with pasireotide LAR and they maintained the goal throughout the observation period.
Table 32: Proportion of Patients With Mean GH Less Than 2.5 mcg/L and Normalization of IGF-1 (Extension FAS)
Week | Study C2402 | ||
|---|---|---|---|
Pasireotide LAR 40 mg (N = 57) | Pasireotide LAR 60 mg (N = 54) | Crossover to Pasireotide (N = 62) | |
Week 16 | |||
N (%) | 11 (19.3) | 14 (25.9) | 12 (19.4) |
95% CI for % | [10.05 to 31.91] | [14.96 to 39.65] | [10.42 to 31.371] |
Week 28 | |||
N (%) | 10 (17.5) | 14 (25.9) | 12 (19.4) |
95% CI for % | [8.75 to 29.91] | [14.96 to 39.65] | [10.42 to 31.371] |
Week 40 | |||
N (%) | 12 (21.1) | 15 (27.8) | 11 (17.7) |
95% CI for % | [11.38 to 33.89] | [16.46 to 41.64] | [9.20 to 29.53] |
Week 52 | |||
N (%) | 12 (21.1) | 16 (29.6) | 13(21.0) |
95% CI for % | [11.38 to 33.89] | [17.98 to 3.361] | [11.66 to 33.18) |
Week 64 | |||
N (%) | 13 (22.8) | 11 (20.4) | 16 (25.8) |
95% CI for % | [12.74 to 3.994] | [10.63 to 3.353] | [15.53 to 38.50) |
Week 76 | |||
N (%) | 12 (21.1) | 16 (29.6) | 17 (27.4) |
95% CI for % | [1.88 to 3.889] | [17.98,3.361] | [16.85 to 40.23] |
Week 88 | |||
N (%) | 14 (24.6) | 17 (31.5) | 16 (25.8) |
95% CI for % | [14.13 to 37.76] | [19.52,45.55] | [15.53 to 38.50] |
Week 100 | |||
N (%) | 14 (24.6) | 13(24.1) | 20 (32.3) |
95% CI for % | [14.13 to 37.76] | [13.49 to 37.64] | [20.94 to 45.34] |
Week 112 | |||
N (%) | 14 (24.6) | 14 (25.9) | 16 (25.8) |
95% CI for % | [14.13 to 37.76] | [14.96 to 39.65] | [15.53 to 38.50] |
Week 124 | |||
N (%) | 12 (21.1) | 13 (24.1) | 16 (25.8) |
95% CI for % | [11.38 to 33.89] | [13.49 to 37.64] | [15.53 to 38.50] |
Week 136 | |||
N (%) | 9(15.8) | 13 (24.1) | 18 (29.0) |
95% CI for % | [7.48 to 27.87] | [13.49 to 37.64] | [118.20,41.95] |
Week 148 | |||
N (%) | 12 (21.1) | 11 (20.4) | 18 (29.0) |
95% CI for % | [11.38 to 33.89] | [10.63 to 3.55] | [118.20 to 41.95] |
Week 160 | |||
N (%) | 11 (19.3) | 11 (20.4) | 19 (30.6) |
95% CI for % | [10.05 to 31.91] | [10.63 to 33.53] | [19.56 to 43.65] |
Week 172 | |||
N (%) | 13 (22.8) | 11 (20.4) | 13 (21.0) |
95% CI for % | [12.74 to 35.84] | [10.63 to 33.53] | [11.66 to 33.18] |
Week 184 | |||
N (%) | 10 (17.5) | 11 (20.4) | 11 (17.7) |
95% CI for % | [8.75 to 29.91] | [10.63 to 33.53] | [9.20 to 29.53] |
Week 196 | |||
N (%) | 9 (15.8) | 11 (20.4) | 15 (24.2) |
95% CI for % | [7.48 to 27.87] | [10.63 to 33.53] | [14.22 to 36.74] |
Week 208 | |||
N (%) | 10 (17.5) | 10 (18.5) | 12 (19.4) |
95% CI for % | [8.75 to 29.91] | [9.25 to 31.43] | [10.42 to 31.37] |
Week 220 | |||
N (%) | 12 (21.1) | 6 (11.1) | 9 (14.5) |
95% CI for % | [11.38 to 33.89] | [4.19 to 22.63] | [6.86 to 25.78] |
Week 232 | |||
N (%) | 8 (14.0) | 8 (14.8) | 9 (14.5) |
95% CI for % | [6.26 to 25.79] | [6.62 to 27.12] | [6.86 to 25.78] |
Week 244 | |||
N (%) | 8 (14.0) | 4 (7.4) | 7 (11.3) |
95% CI for % | [6.26 to 25.79] | [2.06 to 17.89] | [4.66 to 21.89] |
Week 256 | |||
N (%) | 6 (10.5) | 4 (7.4) | 2 (3.2) |
95% CI for % | [3.96 to 21.52] | [2.06 to 17.89] | [0.39 to 11.17] |
Week 268 | |||
N (%) | 3 (5.3) | 3 (5.6) | 1 (1.6) |
95% CI for % | [1.10,14.62] | [1.16 to 15.39] | [0.04 to 8.66] |
FAS = Full analysis set; CI = confidence interval; IGF-1 = insulin-like growth factor 1; LAR = long-acting release; OR = odds ratio
Notes: Includes scheduled visits only.
The 95% CI for % is two-sided and calculated based on the Clopper-Pearson method.
For pasireotide arms, week 16, 28, and so on of the extension study corresponds to 40, 52 weeks, and so, respectively, after the start of treatment with pasireotide LAR.
For patients who cross over to pasireotide, week 16, 28, and so on, of the extension study corresponds to 12, 24 weeks, and so on, respectively, after the start of treatment with pasireotide LAR in the extension phase.
Source: Study C2402 Extension Clinical Study Report Table 11-326
Normalization of IGF-1
A consistent suppression of IGF-1 was observed throughout the extension phase as indicated by the proportion of patients achieving normal IGF-1 that remained largely unchanged during the observation period. The decrease in the normalization frequency recorded toward the end of the extension phase can be explained by the gradual reduction in the number of patients remaining in the study.
Of note, the patients who crossed over to pasireotide during the extension had a similar pattern: a similar proportion of patients experienced normal IGF-1 at week 16 since starting the treatment with pasireotide LAR and they maintained the goal throughout the observation period.
Table 33: Proportion of Patients With Normalization of IGF-1 at All Scheduled Visits of the Extension Phase by Treatment (Extension FAS)
Week | Study C2402 | ||
|---|---|---|---|
Pasireotide LAR 40 mg (N = 57) | Pasireotide LAR 60 mg (N = 54) | Crossover to Pasireotide (N = 62) | |
Week 16 | |||
N (%) | 19 (33.3) | 16 (29.6) | 16 (25.8) |
95% CI for % | [21.40 to 47.06] | [17.98 to 43.61] | [15.53 to 38.50] |
Week 28 | |||
N (%) | 17 (29.8) | 18 (33.3) | 14 (22.6) |
95% CI for % | [18.43 to 43.40] | [21.09 to 47.47] | [12.93 to 3.997] |
Week 40 | |||
N (%) | 21 (36.8) | 20 (37.0) | 15 (24.2) |
95% CI for % | [24.45 to 0.066] | [24.29 to 51.26] | [14.22 to 36.74] |
Week 52 | |||
N (%) | 16 (28.1) | 18 (33.3) | 16 (25.8) |
95% CI for % | [16.97 to 4.554] | [21.09 to 47.47] | [15.53 to 38 50] |
Week 64 | |||
N (%) | 19 (33.3) | 15 (27.8) | 18 (29.0) |
95% CI for % | [21.40 to 47.06] | [16.46 to 41.64] | [18.20 to 41.95] |
Week 76 | |||
N (%) | 15 (26.3) | 19 (35.2) | 18 (29.0) |
95% CI for % | [15.54 to 39.66] | [22.68 to 49.38] | [18.20 to 41.95] |
Week 88 | |||
N (%) | 16 (28.1) | 19 (35.2) | 16 (25.8) |
95% CI for % | [16.97 to 41.54] | [22.68 to 49.38] | [15.53 to 38 50] |
Week 100 | |||
N (%) | 18 (31.6) | 16 (29.6) | 20 (32.3) |
95% CI for % | [19.91 to 45.24] | [17.98 to 43.61] | [20.94 to 45.34] |
Week 112 | |||
N (%) | 18 (31.6) | 15 (27.8) | 19 (30.6) |
95% CI for % | [19.9 to 45.24] | [16.46 to 41.64] | [19.56 to 43 65] |
Week 124 | |||
N (%) | 14 (24.6) | 17 (3/.5) | 18 (29.0) |
95% CI for % | [14.13 to 37.76] | [19.52 to 45.55] | [18.20 to 41.95] |
Week 136 | |||
N (%) | 12 (211) | 14 (25.9) | 23 (37.1) |
95% CI for % | [11.38 to 33.89] | [14.96 to 9.965] | [25.16 to 50.31] |
Week 148 | |||
N (%) | 15 (26.3) | 12 (22.2) | 21 (33.9) |
95% CI for % | [15.54 to 39.66] | [12.04 to 35.60] | [22.33 to 47.01] |
Week 160 | |||
N (%) | 14 (24.6) | 14 (25.9) | 21 (33.9) |
95% CI for % | [14.13 to 37.76] | [14 96 to 39.65] | [22.33 to 47.01] |
Week 172 | |||
N (%) | 15 (26.3) | 12 (22.2) | 14 (22.6) |
95% CI for % | [15.54 to 39.66] | [12.04 to 35.60] | [12.93 to 34.97] |
Week 184 | |||
N (%) | 11 (19.3) | 12 (22.2) | 14 (22.6) |
95% CI for % | [10 05 to 31.91] | [12.04 to 35.60] | [12.93 to 34.97] |
Week 196 | |||
N (%) | 14 (24.6) | 12 (22.2) | 17 (27.4) |
95% CI for % | [14.13 to 37.76] | [12.04 to 35.60] | [16.85 to 40.23] |
Week 208 | |||
N (%) | 13 (22.8) | 12 (22.2) | 13 (21.0) |
95% CI for % | [12.74 to 35.84] | [12.04 to 35.60] | [11.66 to 33.18] |
Week 220 | |||
N (%) | 13 (22.8) | 6 (11.1) | 12 (19.4) |
95% CI for % | [12.74 to 35.84] | [4.19 to 22.63] | [10.42 to 31.37] |
Week 232 | |||
N (%) | 8 (140) | 8 (14.8) | 11 (17.7) |
95% CI for % | [6.26 to 25.79] | [662 to 27.12] | [9.20 to 29.53] |
Week 244 | |||
N (%) | 8 (14.0) | 5 (9.3) | 9 (14.5) |
95% CI for % | [6.26 to 25.79] | [3.08 to 20.30] | [6 86 to 25.78] |
Week 256 | |||
N (%) | 7 (12.3) | 4 (7.4) | 4 (6.5) |
95% CI for % | [5.08 to 23 68] | [2.06 to 17.89] | [1.79 to 15.70] |
Week 268 | |||
N (%) | 3 (5.3) | 3 (5.6) | 1 (1.6) |
95% CI for % | [1.10 to 1462] | [1.16 to 15.39] | [0.04 to 8.66] |
FAS = Full analysis set; CI = confidence interval; IGF-1 = insulin-like growth factor 1; LAR = long-acting release; OR = odds ratio
Notes: Includes scheduled visits only.
The 95% CI for % is two-sided and calculated based on the Clopper-Pearson method.
For pasireotide arms, week 16, 28, and so on, of the extension study corresponds to 40, 52 weeks, and so on, respectively, after the start of treatment with pasireotide LAR. For patients who cross over to pasireotide, week 16, 28, and so on, of the extension study corresponds to the start of therapy with pasireotide LAR.
Source: Study C2402 Extension Clinical Study Report Table 11-426
Table 34: Adverse Events (> 5% in Any All-Grade Column) Irrespective of Causality by Preferred Term — Data up to Crossover (SAS)
Preferred term, n (%) | Study C2305 | |||
|---|---|---|---|---|
Pasireotide LAR N = 178 | Octreotide LAR N = 180 | |||
All grades | Grade 3/4 | All grades | Grade 3/4 | |
Total | 172 (96.6) | 63 (35.4) | 165 (91.7) | 46 (25.6) |
Diarrhea | 71 (39.9) | 1 (0.6) | 81 (45.0) | 5 (2.8) |
Cholelithiasis | 58 (32.6) | 3 (1.7) | 71 (39.4) | 3 (1.7) |
Hyperglycemia | 55 (30.9) | 6 (3.4) | 18 (10.0) | 1 (0.6) |
Headache | 41 (23.0) | 2 (1.1) | 49 (27.2) | 5 (2.8) |
Diabetes mellitus | 39 (21.9) | 9 (5.1) | 8 (4.4) | 0 |
Alopecia | 34 (19.1) | 0 | 36 (20.0) | 0 |
Abdominal pain | 33 (18.5) | 1 (0.6) | 44 (24.4) | 0 |
Nasopharyngitis | 32 (18.0) | 0 | 29 (16.1) | 0 |
Nausea | 27 (15.2) | 1 (0.6) | 41 (22.8) | 0 |
Blood creatine phosphokinase increased | 25 (14.0) | 6 (3.4) | 24 (13.3) | 4 (2.2) |
Arthralgia | 22 (12.4) | 2 (1.1) | 25 (13.9) | 1 (0.6) |
Back pain | 22 (12.4) | 0 | 22 (12.2) | 2 (1.1) |
Abdominal distension | 21 (11.8) | 1 (0.6) | 22 (12.2) | 1 (0.6) |
Dizziness | 21 (11.8) | 0 | 20 (11.1) | 0 |
Fatigue | 20 (11.2) | 2 (1.1) | 21 (11.7) | 0 |
Vomiting | 19 (10.7) | 1 (0.6) | 15 (8.3) | 0 |
Hypertension | 18 (10.1) | 2(1.1) | 16 (8.9) | 4 (2.2) |
Blood glucose increased | 17 (9.6) | 0 | 6 (3.3) | 0 |
Influenza | 16 (9.0) | 1 (0.6) | 11 (6.1) | 0 |
Upper respiratory tract infection | 16 (9.0) | 0 | 7 (3.9) | 0 |
Alanine aminotransferase increased | 15 (8.4) | 0 | 10 (5.6) | 0 |
Anemia | 14 (7.9) | 0 | 10 (5.6) | 1 (0.6) |
Pain in extremity | 14 (7.9) | 1 (0.6) | 8 (4.4) | 0 |
Injection site pain | 13 (7.3) | 0 | 0 | 0 |
Sinus bradycardia | 13 (7.3) | 0 | 0 | 0 |
abdominal pain upper | 12 (6.7) | 0 | 2 (1.1) | 0 |
Aspartate aminotransferase increased | 12 (6.7) | 0 | 0 | 0 |
Type 2 diabetes mellitus | 12 (6.7) | 2(1.1) | 0 | 2(1.1) |
Flatulence | 11 (6.2) | 0 | 0 | 0 |
Glycated hemoglobin increased | 11 (6.2) | 0 | 1 (0.6) | 0 |
Hypoglycemia | 11 (6.2) | 0 | 1 (0.6) | 0 |
Bronchitis | 10 (5.6) | 0 | 1 (0.6) | 0 |
Constipation | 10 (5.6) | 0 | 0 | 0 |
Cough | 10 (5.6) | 0 | 0 | 0 |
Hepatic steatosis | 10 (5.6) | 1 (0.6) | 0 | 1 (0.6) |
Lipase increased | 10 (5.6) | 0 | 13 (7.2) | 3 (1.7) |
Urinary tract infection | 10 (5.6) | 1 (0.6) | 13 (7.2) | 0 |
Blood bilirubin increased | 9 (5.1) | 1 (0.6) | 5 (2.8) | 0 |
Electrocardiogram QT prolonged | 9 (5.1) | 0 | 10 (5.6) | 1 (0.6) |
Weight decreased | 9 (5.1) | 0 | 8 (4.4) | 0 |
Muscle spasms | 8 (4.5) | 0 | 10 (5.6) | 1 (0.6) |
Oropharyngeal pain | 8 (4.5) | 0 | 15 (8.3) | 0 |
Pyrexia | 8 (4.5) | 0 | 11 (6.1) | 0 |
Gamma-glutamyl transferase | 3 (1.7) | 2 (1.1) | 11 (6.1) | 2 (1.1) |
LAR = long-acting release; SAS = safety analysis set.
Notes: Data are included up to the crossover visit for patients who crossed over and up to data cut-off for those who continued on the same treatment.
Patients receiving octreotide were not followed after month 26.
Source: Study C2402 Extension Clinical Study Report26
Table 35: Adverse Events (> 5% in Any All-Grade Column) Irrespective of Causality by Preferred Term — After Crossover (CAS)
Preferred term, n (%) | Study C2305 | |||
|---|---|---|---|---|
Crossed over to Pasireotide LAR N = 81 | Crossed over to Octreotide LAR N = 38 | |||
All grades | Grade 3/4 | All grades | Grade 3/4 | |
Total | 77 (95.1) | 23 (28.4) | 34 (89.5) | 8 (21.1) |
Hyperglycemia | 25 (30.9) | 4 (4.9) | 5 (13.2) | 0 |
Diarrhea | 20 (24.7) | 0 | 7 (18.4) | 1 (2.6) |
Cholelithiasis | 19 (23.5) | 2 (2.5) | 6 (15.8) | 1 (2.6) |
Headache | 17 (21.0) | 0 | 5 (13.2) | 0 |
Diabetes mellitus | 15 (18.5) | 2 (2.5) | 3 (7_9) | 0 |
Nasopharyngitis | 13 (16.0) | 0 | 7 (18.4) | 0 |
Arthralgia | 10 (12.3) | 0 | 2 (5.3) | 0 |
Blood glucose increased | 8 (9.9) | 0 | 0 | 0 |
Hyperglycemia | 25 (30.9) | 4 (4.9) | 5 (13.2) | 0 |
Diarrhea | 20 (24.7) | 0 | 7 (18.4) | 1 (2.6) |
Cholelithiasis | 19 (23.5) | 2 (2.5) | 6 (15.8) | 1 (2.6) |
Headache | 17 (21.0) | 0 | 5 (13.2) | 0 |
Diabetes mellitus | 15 (18.5) | 2 (2.5) | 3 (7.9) | 0 |
Nasopharyngitis | 13 (16.0) | 0 | 7 (18.4) | 0 |
Arthralgia | 10 (12.3) | 0 | 2 (5.3) | 0 |
Blood glucose increased | 8 (9.9) | 0 | 0 | 0 |
Nausea | 8 (9.9) | 1 (1.2) | 3 (7.9) | 0 |
Blood creatine phosphokinase increased | 7 (8.6) | 0 | 6 (15.8) | 0 |
Dizziness | 7 (8.6) | 0 | 5 (13.2) | 0 |
Glycated hemoglobin increased | 7 (8.6) | 1 (1.2) | 0 | 0 |
Hypoglycemia | 7 (8.6) | 2 (2.5) | 2 (5.3) | 0 |
Muscle spasms | 7 (8.6) | 1 (1.2) | 1 (2.6) | 0 |
Anemia | 6 (7.4) | 0 | 1 (2.6) | 0 |
Back pain | 6 (7.4) | 0 | 3 (79) | 0 |
Fatigue | 6 (7.4) | 0 | 3 (7.9) | 0 |
Hepatic steatosis | 6 (7.4) | 0 | 3 (7.9) | 0 |
Hyperlipidemia | 6 (7.4) | 0 | 2 (5.3) | 0 |
Constipation | 5 (6.2) | 1 (1.2) | 1 (2.6) | 0 |
Glucose tolerance impaired | 5 (6.2) | 0 | 0 | 0 |
Hypertension | 5 (6.2) | 1 (1.2) | 3(7.9) | 1 (2.6) |
Urinary tract infection | 5 (6.2) | 0 | 0 | 0 |
Gallbladder polyp | 4 (4.9) | 0 | 2 (5.3) | 0 |
Influenza | 3 (3.7) | 0 | 3 (7.9) | 0 |
Lipase increased | 3 (3.7) | 0 | 2 (5.3) | 0 |
Vomiting | 3 (3.7) | 0 | 2 (5.3) | 0 |
Blood triglycerides increased | 2 (2.5) | 0 | 4 (10.5) | 1 (2.6) |
Colonic polyp | 2 (2.5) | 0 | 2 (5.3) | 0 |
Gastroesophageal reflux disease | 2 (2.5) | 0 | 2 (5.3) | 0 |
Upper respiratory tract infection | 2 (2.5) | 0 | 2 (5.3) | 0 |
Blood thyroid stimulating hormone decreased | 1 (1.2) | 0 | 2 (5.3) | 0 |
Cataract | 1 (1.2) | 0 | 2 (5.3) | 0 |
Hematuria | 1 (1.2) | 0 | 2 (5.3) | 0 |
Hypercholesterolemia | 1 (1.2) | 0 | 2 (5.3) | 0 |
Osteoarthritis | 1 (1.2) | 0 | 2 (5.3) | 0 |
Abdominal distension | 0 | 0 | 2 (5.3) | 0 |
Pyelocaliectasis | 0 | 0 | 2 (5.3) | 0 |
CAS = crossover analysis set; LAR = long-acting release
Note: Patients receiving octreotide were not followed after month 26.
Source: Study C2305 Clinical Study Report — Table 12-10.25
Pharmacoeconomic Review
Abbreviations
AcroQoL
Acromegaly Quality of Life Questionnaire
AE
adverse event
BIA
budget impact analysis
CDA-AMC
Canada’s Drug Agency
ICER
incremental cost-effectiveness ratio
IGF-1
insulin-like growth factor 1
ITC
indirect treatment comparison
LAR
long-acting release
LY
life-year
QALY
quality-adjusted life-year
SMR
standardized mortality ratio
SSA
somatostatin analogue
ULN
upper normal limit
WTP
willingness to pay
Executive Summary
The executive summary comprises 2 tables (Table 1 and Table 2) and a conclusion.
Item | Description |
|---|---|
Drug product | Pasireotide for injectable suspension (Signifor LAR), 40 mg and 60 mg vial; deep intramuscular injection |
Indication | For the treatment of adult patients with acromegaly for whom surgery is not an option or has not been curative. |
Health Canada approval status | NOC |
Health Canada review pathway | Standard |
NOC date | May 19, 2020 |
Reimbursement request | For the treatment of adult patients with acromegaly for whom surgery is not an option or has not been curative and who are inadequately controlled on treatment with another somatostatin analogue |
Sponsor | Recordati Rare Diseases Canada Inc. |
Submission history | Previously reviewed: Yes Indication: Cushing’s disease
|
NOC = Notice of Compliance.
Table 2: Summary of Economic Evaluation
Component | Description |
|---|---|
Type of economic evaluation | Cost-utility analysis Decision tree followed by a Markov model |
Target population | Adult patients with acromegaly for whom surgery is not an option or has not been curative and whose acromegaly is inadequately controlled on treatment with a first-generation somatostatin analogue |
Treatment | Pasireotide |
Dose regimen | Deep intramuscular injection, 40 mg every 4 weeks; dose may increase to 60 mg if acromegaly is inadequately controlled after 3 months of initial treatment |
Submitted prices |
|
Submitted treatment cost | $65,859 annually per patient |
Comparators |
|
Perspective | Canadian publicly funded health care payer |
Outcomes | QALYs, LYs |
Time horizon | Lifetime (100 years) |
Key data sources |
|
Submitted results |
|
Key limitations |
|
CDA-AMC reanalysis results |
|
AE = adverse event; CDA-AMC = Canada’s Drug Agency; ICER = incremental cost-effectiveness ratio; IGF-1 = insulin-like growth factor 1; ITC = indirect treatment comparison; LY = life-year; QALY = quality-adjusted life-year.
Conclusions
Evidence from the C24021 trial suggests that pasireotide likely leads to improvements in the number of patients who experience IGF-1 normalization for adult patients with acromegaly for whom surgery is not an option or has not been curative and whose acromegaly is inadequately controlled on treatment with first-generation somatostatin analogues (SSAs), when compared to lanreotide and octreotide. In the Canada’s Drug Agency (CDA-AMC) Clinical Review report, uncertainty remains regarding the magnitude of IGF-1 improvement. Given the lack of direct evidence between pasireotide and pegvisomant, the sponsor’s submitted an indirect treatment comparison (ITC) that suggested no differences in IGF-1 normalization, but this conclusion was associated with uncertainty due to methodological limitations, including heterogeneity across studies, lack of adjustment for effect modifiers, and the assumption that SSA and placebo are equivalent.
The CDA-AMC base-case results aligned with the sponsor’s submitted analysis, indicating that pasireotide is not cost-effective at a willingness-to-pay (WTP) threshold of $50,000 per quality-adjusted life-year (QALY) gained relative to octreotide. Results from the CDA-AMC base case suggest that the incremental cost-effectiveness ratio (ICER) for pasireotide versus octreotide is $215,757 per QALY gained (incremental costs = $434,636; incremental QALYs = 2.01). Pasireotide dominated lanreotide and pegvisomant (associated with lower total costs and more total QALYs). The majority of the incremental QALYs were gained beyond the observed trial period and is dependent on the assumption that IGF-1 normalization, achieved at 24 weeks in the C2402 trial, would be maintained over a patient’s lifetime. There is limited evidence on the long-term comparative efficacy of pasireotide. At the submitted price, pasireotide would require a price reduction of 71% (from $5,049 to $1,474 per vial, regardless of strength) to be considered cost-effective at a WTP threshold of $50,000 per QALY gained. All analyses reflect the publicly available list price for the comparators and, consistent with the sponsor’s base case, drug acquisition costs were the majority of the total cost (i.e., 78% for octreotide and lanreotide, 89% for pasireotide, and 90% for pegvisomant). Therefore, the model is expected to be highly sensitive to any confidentially negotiated price of the comparator treatments if these differ from public list prices.
Although the CDA-AMC reanalysis attempted to address some of the identified limitations of the sponsor’s economic submission, uncertainty still exists in the modelled relationship between IGF-1 normalization and the development of comorbidities. CDA-AMC conducted a scenario analysis removing the relationship between IGF-1 normalization and comorbidities, which resulted in a higher ICER than estimated in the CDA-AMC base-case reanalysis.
CDA-AMC was unable to address uncertainty related to the comparative efficacy of pegvisomant. The cost-effectiveness of pasireotide as a first-line treatment, which reflects part of the Health Canada indication, was not submitted by the sponsor. Therefore, the cost-effectiveness for the full Health Canada indication remains unknown.
Input Relevant to the Economic Review
This section is a summary of the feedback received from the patient groups, clinician groups, and drug plans that participated in the CDA-AMC review process.
Joint patient group input was received from Acromegaly Canada and Canadian Organization for Rare Disorders. Survey respondents with lived experience and focus group participants (3 of 6 participants were living in Canada) indicated that acromegaly symptoms negatively affect their daily life by causing enlarged hands and/or feet, severe or very severe changes in facial features, moderate joint pain, and enlarged organs. Patients reported a significant impact of acromegaly on all aspects of life, including physiological impact, psychological impact, emotional stress, and major impacts on work, school, family, and social life. Patients reported receiving multiple treatments, including surgery, first-generation SSAs (i.e., lanreotide and octreotide), dopamine agonists (i.e., cabergoline and bromocriptine), and a growth hormone receptor antagonist (i.e., pegvisomant). Regarding current available pharmacotherapies, more than half (52%) of patient respondents considered SSAs effective or very effective, 12% considered dopamine agonists effective, and 18% considered the growth hormone receptor antagonist effective. Available pharmacotherapies had similar distribution of side effects, and approximately 25% to 30% of respondents indicated that these effects were severe or very severe. Respondents emphasized a need for treatments that have a lower burden of administration (i.e., less frequent administration, ability to self-administer) and less pain to administer. Of the patients (n = 6) with experience with pasireotide, treatment improved symptoms with few or manageable side effects.
Clinician input was received from the Canadian Society of Endocrinology and Metabolism. The clinician group stated that initial acromegaly treatments include surgery and/or first-generation SSAs, with pegvisomant considered in patients who demonstrate suboptimal biochemical control while on first-generation SSAs. Radiotherapy may be further considered for patients who declined other treatments, in whom other treatments failed, or who are unfit for surgery and/or other medical treatments. Clinician groups stated that the primary goals of acromegaly treatment are to achieve biochemical control (i.e., normalization of growth hormone and IGF-1 serum levels), control the growth and size of pituitary tumours, and prevent and/or manage acromegaly-associated symptoms and comorbidities. The group highlighted that the evidence suggests that normalization of IGF-1 alone may not be sufficient to reduce the mortality, humanistic, and economic burden associated with acromegaly. Clinicians further stated that pasireotide is expected to be used when surgery and medical management with first-generation SSAs fails to provide biochemical control, although treatment would be deferred in individuals with uncontrolled hyperglycemia until acceptable glycemic control is achieved. Pasireotide is anticipated to be treated in the community with an experienced endocrinologist monitoring for adverse events (AEs) and, in particular, for hyperglycemia.
The drug plans noted variability in how existing comparators are funded. Drug plans further questioned whether pasireotide should be discontinued in patients who receive subsequent radiation therapy or surgery. Drug plans noted that provision of pasireotide in the first-line setting may translate to substantial budget impacts.
Several of these concerns were addressed in the sponsor’s model:
Quality of life was incorporated in the sponsor’s model using data from the Acromegaly Quality of Life Questionnaire (AcroQoL) and EQ-5D-3L questionnaire. The EQ-5D-3L is a scale that captures several relevant domains that are impacted by acromegaly, including usual activities and anxiety and/or depression. Disutilities were further applied for AEs.
Hyperglycemia was 1 of the AEs incorporated into the model.
In addition, CDA-AMC addressed some of these concerns as follows:
Modelling of subsequent treatments was revised to reflect current clinical management.
CDA-AMC was unable to address the following concerns raised from input relevant to the economic review:
The model was structured based on normalization of IGF-1 serum levels and incorporated a relationship between how normalization of IGF-1 levels would correspond to changes in the development of comorbidities. However, as noted in the clinician group input, normalization of IFG-1 alone may not be sufficient to reduce the mortality and humanistic burden associated with acromegaly. Therefore, the model structure may not fully capture the clinical impact of the condition.
Economic Review
Economic Evaluation
Summary of Sponsor’s Economic Evaluation
Overview
Pasireotide (Signifor LAR) is indicated for the treatment of adult patients with acromegaly for whom surgery is not an option or has not been curative,2 while the reimbursement request is for the treatment of acromegaly in adult patients for whom surgery is not an option or has not been curative and who are inadequately controlled on treatment with a first-generation SSA.3 CDA-AMC accepted a deviation request from the sponsor to focus the economic evaluation on the population in the reimbursement request.3 The sponsor’s cost-utility analysis compared pasireotide to lanreotide, octreotide, and pegvisomant.
Pasireotide is available in 40 and 60 mg vials for deep intramuscular injection. The recommended dosage is 40 mg every 4 weeks, and that may increase to a maximum of 60 mg for patients in whom growth hormone and/or IGF-1 levels are not fully controlled after 3 months of treatment with pasireotide 40 mg.2 At the submitted price of $5,048.76 for both the 40 mg and 60 mg vials, the sponsor estimated that the annual treatment cost would be $65,859 per patient.3 The annual costs for comparators may range from $17,183 to $28,691 (first year annual cost: $18,503 to $27,364) for lanreotide; $12,923 to $21,421 (first year annual cost: $13,791 to $20,335) for octreotide; and $49,499 to $148,489 (first year annual cost: $49,905 to $148,624) for pegvisomant.3
The analysis was conducted from a Canadian public health care payer perspective with a societal perspective considered in a scenario analysis. The clinical outcomes of interest were life-years (LYs) and QALYs. The sponsor adopted a lifetime time horizon (100 years). Future costs and benefits were discounted at an annual rate of 1.5%.
Model Structure
The sponsor submitted a hybrid model structure that consisted of a decision tree to model the initial response to treatment up to the first 6 months, followed by a 3-state Markov model representing patient’s long-term outcomes based on their line of treatment (Figure 1).4
Patients with uncontrolled acromegaly despite prior treatment with a first-generation SSAs entered the decision tree and were treated with pasireotide, lanreotide, octreotide, or pegvisomant. Response to treatment within the decision tree was evaluated based on IGF-1 levels, with the first assessment at 3 months and the second assessment at 6 months.4 Treatment response was categorized as full control, partial control, and no control. Full control was defined as IGF-1 levels at the upper normal limit (ULN) or lower, partial control as IGF-1 at least 50% lower than baseline values, and no control as neither full nor partial control.4 At each response assessment, patients deemed to have full control remained on treatment at the current dosage, patients with partial control had their dosage increased, while patients with no control switched to subsequent treatment.4 Patients could additionally transition to subsequent treatment due to AEs at both assessment time points.4
After the initial 6-month period, patients then entered the Markov model in either the second line or subsequent treatment health state, as applicable.4 The second-line treatment health state captured both patients experiencing full control at varying dosages (e.g., base dose, high dose, or high dose with additional drugs) and patients experiencing partial control (i.e., at high dose with additional drugs). Patients remained in their health states until death, which was the absorbing health state.4
Model Inputs
The baseline population characteristics used to inform the model were based on the randomized, open-label, active control C2402 trial (56.06% female, 43.94% male; mean age = 45.84 years).5
The primary measure of efficacy in the model was the probability of achieving control at the 3- and 6-month assessment time points. A post hoc analysis of the C2404 trial informed the probability of treatment response for pasireotide, octreotide, and lanreotide. The trial indicated that 24.62% and 26.15% of patients would experience full control with 40 mg and 60 mg of pasireotide, respectively, at the second assessment.5 The model assumed a constant rate of IGF-1 normalization, resulting in 13.18%, 12.98%, and 73.85% of patients on pasireotide experiencing full control, partial control, and no control, respectively, at the first assessment. The proportion of patients with partial control at 12 weeks was calculated as the difference between the 24-week and the calculated 12-week normalization proportions. The C2404 trial further reported that all patients in the control arm (i.e., octreotide and lanreotide) remained without disease control during the entire study duration.5 A sponsor-submitted ITC informed the efficacy (i.e., the proportion of patients on full or partial control) on pegvisomant.6 Subsequent treatment was assumed to consist of radiation and octreotide combination therapy only, with patients discontinuing radiation therapy after the first 10 years of the model time horizon. Of the patients discontinuing radiotherapy, 50% were assumed to have experienced remission.
Comorbidities (i.e., hypertension, arrhythmia, diabetes, cardiomyopathy, and sleep apnea) were distributed based on IGF-1 biochemical control.3 The majority were informed by clinical expert validation with the exception of arrhythmia, which was sourced from literature.7 The model assumed that, with greater IGF-1 biochemical control, the probability of comorbidities would be reduced. The sponsor assumed that patients who received subsequent treatment would have equal comorbidities rates as patients who experience partial control.3
Background mortality was informed by all-cause mortality data from Statistics Canada, with standardized mortality ratios (SMRs) of 1.0, 2.4, and 2.1 applied to the full control (base and high dose), no control, and subsequent treatment health states, respectively.8-10
Incidence rates for grade 3 or 4 AEs (i.e., hyperglycemia, cholelithiasis, diarrhea) were estimated using C2305 clinical trial data for pasireotide and octreotide,11 and literature for all other comparators.12,13 These would have impacts on both utilities and costs.
Two of the 4 health state utilities (full and no control) were derived from the AcroQoL and EQ-5D-3L questionnaire from the literature.14 The utility value for the partial control health state was assumed by the sponsor to be the average of the full and no control utilities. The utility value for the subsequent treatment health state was obtained from a study examining long-term radiotherapy on biochemical control and quality of life.15 The model incorporated utility decrements for AEs and comorbidities, which were sourced from the literature.16,17
Costs in the model included drug acquisition, drug administration, monitoring, comorbidities, AE management, and subsequent treatment. Drug acquisition costs for pasireotide were based on the sponsor’s submitted prices. First-generation SSA drug costs were obtained from the Ontario Drug Benefit Formulary,3 while the drug cost of pegvisomant was obtained from Ontario’s Exceptional Access Program.1 Administration costs from Ontario Schedule of Benefits for Physician Services were included for all subcutaneous injections.1 Patient monitoring costs (laboratory tests and procedures and physician visits) were estimated by the sponsor based on expert input, and costs were obtained from the Ontario Schedule of Benefits for Physician Services,1 the Ontario Schedule of Benefits for Laboratory Services,1 and British Colombia testing indications and appropriate use guidelines.18 Comorbidity and AE management costs reflected the costs of specialist care and were sourced from the Ontario Schedule of Benefits for Physician Services1 or literature, except for tumour growth, which incorporated costs of MRI, pain management, surgery, and specialist visits. Costs of radiotherapy included its administration, monitoring, and any associated secondary surgery costs. All costs were reported in 2024 Canadian dollars, and, when applicable, costs were inflated using the Bank of Canada’s inflation calculator.1
Summary of Sponsor’s Economic Evaluation Results
All analyses were run probabilistically (1,000 iterations). The deterministic and probabilistic results were similar, and the probabilistic findings are presented in this section. All results are based on publicly available list prices.
Base-Case Results
The sponsor’s probabilistic base case found that pasireotide was associated with an estimated cost of $954,864 and 10.89 QALYs over the lifetime time horizon.4 Based on a sequential analysis, pasireotide was associated with an ICER of $145,177 per QALY gained (incremental costs = $347,749; incremental QALYs = 2.40) compared to octreotide.4 Pasireotide had a 0% probability of being cost-effective at a WTP threshold of $50,000 per QALY gained. In the sponsor’s base case, only 2% of the incremental QALYs gains were observed during the trial period, while the majority of the incremental benefit was derived from the period beyond the observed trial data (i.e., extrapolated period).4 Pasireotide was not predicted to have a substantial impact on extending life compared to the existing comparators.4
Results were driven by the amount of time (i.e., LYs) patients spent in the full control–base dose and full control–high dose health states because the sponsor’s model predicted a large distribution of LYs for pasireotide associated with full control–base dose and full control–high dose, compared to no patients experiencing full or partial control for first-generation SSAs.4 For pegvisomant, results were primarily driven by drug acquisition costs, with minimal differences observed between expected QALYs (i.e., incremental QALYs = 0.34). The sponsor’s model estimated that pasireotide would generate 10.89 QALYs over a lifetime horizon. Of these, 4.47 QALYs were gained in the full control and partial control health states, while lanreotide and octreotide gained 8.49 QALYs. Of these, 8.41 QALYs were gained in the subsequent health state only (i.e., patients have not experienced control).4 The key cost driver was drug acquisition costs (Table 10), which represented 89% of total costs for pasireotide (84% for lanreotide and octreotide and 85% for pegvisomant), with drug acquisition costs for subsequent therapy representing the other major cost component.4
Table 3: Summary of the Sponsor’s Economic Evaluation Results
Drug | Total costs ($) | Total QALYs | Sequential ICER ($/QALY) |
|---|---|---|---|
Octreotide | 607,114 | 8.49 | Reference |
Pasireotide | 954,864 | 10.89 | 145,177 |
Dominated treatments | |||
Lanreotide | 607,276 | 8.49 | Dominated by pasireotide |
Pegvisomant | 1,454,528 | 10.55 | Dominated by pasireotide |
ICER = incremental cost-effectiveness ratio; QALY = quality-adjusted life-year.
Source: Sponsor’s pharmacoeconomic submission.3
Additional results from the sponsor’s submitted economic evaluation base case are presented in Appendix 3.
Sensitivity and Scenario Analysis Results
The sponsor presented several deterministic scenario analyses, including applying alternative efficacy assumptions from the C2305 trial;11 sourcing health state utility values from another published source;19 including cabergoline as an additional therapy component alongside a first-generation SSA for subsequent therapy; and assuming an alternative treatment distribution for subsequent therapies. For the majority of the scenarios, the results of the scenario analyses were largely aligned with the sponsor’s base case. However, exceptions to the this include the scenarios in which the efficacy assumptions were informed by the C2305 trial. Trial C2305 was a head-to-head trial exploring the effects of pasireotide and octreotide in a drug-naive patient population. Because a higher proportion of patients treated with octreotide were able to experience full control and lanreotide was assumed to have equal efficacy to octreotide, the resulting probabilistic ICERs were $26,481 per QALY gained for octreotide compared to lanreotide and $185,756 per QALY gained for pasireotide compared to lanreotide.
The sponsor conducted a scenario analysis from a societal perspective. This analysis included additional costs associated with lost productivity hours for a patient and caregiver based on a human capital approach. In this analysis, the ICER was $138,016 per QALY gained versus octreotide, while pegvisomant and lanreotide were dominated, which was similar to the sponsor’s base-case analysis using a health care payer perspective.
CDA-AMC Appraisal of the Sponsor’s Economic Evaluation
CDA-AMC identified several key limitations to the sponsor’s analysis that have notable implications for the economic analysis:
Comparative effectiveness of pasireotide is uncertain. Efficacy in the economic model is based on the proportion of patients who experienced normalization of IGF-1 serum levels. The efficacy of pasireotide versus other first-generation SSA (i.e., lanreotide and octreotide) was based on the C2402 trial. Evidence from the C2402 trial demonstrated that pasireotide likely results in an improvement in the number of patients who experience IGF-1 normalization when compared to other SSAs. However, the CDA-AMC Clinical Review noted uncertainty surrounding the clinical meaningfulness of this improvement. Patients enrolled in the active control group of C2402 continued treatment that had previously failed to achieve IGF-1 normalization. This may inflate the incremental improvement observed in the pasireotide arm. There are further issues of generalizability with the C2402 trial, as some patients in the active control arm were treated with 30 mg of octreotide. This is not reflective of clinical practice; clinical expert feedback received by CDA-AMC noted that patients could be prescribed a higher dose in Canada.
For the comparison against pegvisomant, because there was no direct head-to-head evidence available, the sponsor submitted an ITC to inform the comparative efficacy parameters. The sponsor’s submitted ITC suggested no differences in IGF-1 normalization. Appraisal of the sponsor’s ITC highlighted that it was limited due to significant heterogeneity in the patient population and treatment doses studied across the included trials; major methodological limitations (i.e., the Bucher method may be unsuitable for the included studies and network structure); and lack of adjustment for effect modifiers.
CDA-AMC was unable to address this limitation owing to the nature of the available clinical evidence.
Assumptions concerning dose escalation for pegvisomant were misaligned with clinical disease management and resulted in overestimation of drug costs. In the submitted model, the dose may be escalated at both the 3- and 6-month assessment time points if patients experience only partial control. Patients’ starting dose for pegvisomant was 10 mg per day, and, if dose escalation was required, the sponsor assumed an immediately escalation to 30 mg per day. However, according to the product monograph for pegvisomant, several strengths between 10 and 30 mg are available, including 15 mg, 20 mg, and 25 mg.20 Clinical experts consulted by CDA-AMC indicated that dosage escalation would entail gradual increases of the dose of pegvisomant to the next available strength to determine the dose at which patients would experience optimal control and would continue to tolerate the drug. Once IGF-1 normalization was achieved, patients would likely remain on the same dose until tumour progression, as tumour progression would result in a loss of efficacy. Additionally, clinical expert feedback suggested that some patients would be treated with 30 mg of pegvisomant daily; however, the proportion of patients requiring the maximum dose of pegvisomant remains unknown. The sponsor’s assumption that the dose would be escalated to the highest dose of pegvisomant (i.e., 30 mg) therefore does not reflect clinical practice. This is further not aligned with the clinical evidence for pegvisomant included in the sponsor’s submitted ITC that informed the comparative efficacy in the submitted model. The clinical trial of pegvisomant included in the sponsor’s submitted ITC reported patients receiving 10, 15, and 20 mg of pegvisomant only. No patients in that study received the 25 mg and 30 mg strengths of pegvisomant.13
In the CDA-AMC reanalysis, the dose for pegvisomant in patients who experience only partial control and require dose escalation was recalculated as a weighted average based on the proportion of patients who experienced IGF-1 normalization at the higher doses (e.g., 15 mg and 20 mg) based on the sponsor’s ITC (i.e., 51.83% of patients [28 of 54] received 15 mg, the remainder [48.17%] received 20 mg of pegvisomant [26 of 54]).
Lanreotide and pegvisomant administration costs are not reflective of clinical practice. The sponsor assumed that every administration of treatment would require a health care professional. According to clinical experts consulted by CDA-AMC, patients treated with pegvisomant and 30% to 40% of patients on lanreotide would self-administer the drug, without the assistance of a health care provider.
CDA-AMC revised the proportion of patients who require assistance from a health care provider to reflect clinical expert feedback obtained by CDA-AMC. Pegvisomant would have no administration cost, while 70% of patients on lanreotide would have treatment administered by a health care provider.
The impact of IGF-1 normalization on comorbidities is highly uncertain. The sponsor relied on published literature7,21,22 and clinical expert input to assign and validate the distribution of comorbidities. Of the literature sourced, these studies were not designed to demonstrate a causal relationship between IGF-1 normalization and comorbidities. While Colao et al. (2011)7 concluded that patients with acromegaly are more likely to have comorbidities compared to the general population, no conclusions were drawn regarding patients who experience IGF-1 normalization with the persistence of their comorbidities. Davi et al. (2008)21 conducted a study comparing rates of sleep apnea in patients with acromegaly and concluded that there was no significant difference between patients who experienced IGF-1 normalization and those who did not. Only the study by Carmichael et al. (2007)22 reported that higher observations of comorbidities (i.e., hypertension, diabetes, and sleep apnea) were present in patients who did not experience IGF-1 normalization, although these results reflect care at a single US institution for more than 2 decades. It remains unclear whether these findings are replicable. Furthermore, given it is based on a single institution over a long period of time, it remains unclear whether the reported outcomes remain generalizable to current disease management in Canada. Additionally, the development and resolution of comorbidities were not outcomes of the C2402 trial. While the C2402 trial reported the proportion of patients at baseline with diabetes and prediabetes, the trial did not report whether treatment with pasireotide reduced the proportion with diabetes and prediabetes by the end of the trial. No other comorbidities were captured in the clinical trial. Clinical expert input obtained by CDA-AMC suggested that, while a relationship between IGF-1 normalization and comorbidities is biologically plausible, uncertainty remains concerning the magnitude of the impact of pasireotide on comorbidities, given the absence of clinical evidence of improvements in comorbidities.
To explore the uncertainty in the effect of IGF-1 normalization on the development of comorbidities and the effect of pasireotide on improvement of comorbidities compared to other existing treatments, CDA-AMC conducted a scenario analysis in which all comorbidity distributions were set equal to the full control health state.
AE incidence rates and discontinuation do not reflect clinical evidence and expectations. Only grade 3 and 4 AEs were incorporated into the sponsor’s model, with the incidence rates extracted from C2305 trial (i.e., following crossover) for pasireotide and octreotide and from published literature for the other comparators.12,13 C2305 is a head-to-head trial between pasireotide and octreotide in a drug-naive patient population. Similarly, among the published literature that informed the comparative safety for lanreotide and pegvisomant (i.e., the LANTERN trial12 and the pegvisomant study conducted by Trainer et al. [2000]),13 both studies reflected a drug-naive population, as patients previously treated with first-generation SSAs were excluded from both trials. Thus, none of the 3 studies align with the population in the reimbursement request: adult patients with acromegaly for whom surgery is not an option or has not been curative and who are inadequately controlled on treatment with a first-generation SSA.
CDA-AMC used the C2402 trial to source the incidence rate of AEs for pasireotide, octreotide, and lanreotide, given that this study fully aligned with the population in the sponsor’s submitted reimbursement request.
The study by Trainer et al. (2000)13 only reported on the incidence of AEs of all grades for pegvisomant. To derive the number of grade 3 and 4 AEs expected for pegvisomant, the sponsor assumed that the ratio of grade 3 or 4 AEs to all-grade AEs reported in the C2305 trial would be similar to the ratio of grade 3 or 4 AEs to all-grade AEs expected for pegvisomant. The incidence rate of pegvisomant was adjusted based on the ratio of grade 3 and 4 AEs to all-grade AEs from the C2402 trial.
Subsequent treatments did not reflect clinical practice. Subsequent therapy was modelled as octreotide and radiotherapy in the submitted analysis. However, clinical expert feedback obtained by CDA-AMC indicated that access to radiotherapy is most suitable for patients who experience tumour growth. Patients who do not experience tumour growth but also do not experience biochemical control of IGF-1 would be administered octreotide and, if available, pegvisomant as combination therapy.
To address this limitation, CDA-AMC revised the distribution of subsequent therapy in its reanalysis. Based on clinical expert input, subsequent therapy was revised to reflect 90% of patients on radiotherapy, while the remaining patients would receive octreotide and pegvisomant combination therapy.
Because not all jurisdictions reimburse pegvisomant, CDA-AMC conducted a further scenario analysis. Rather than modelling combination therapy, it was assumed that this 10% of patients would receive the maximum dosage of octreotide only.
Additionally, the following key assumptions were made by the sponsor and have been appraised by CDA-AMC (refer to Table 4).
Table 4: Key Assumptions of the Submitted Economic Evaluation (Not Noted as Limitations to the Submission)
Sponsor’s key assumption | CDA-AMC comment |
|---|---|
The model population reflects the population in the reimbursement request: adult patients with acromegaly for whom surgery is not an option or has not been curative and who are inadequately controlled on treatment with another SSA. | Acceptable. According to clinical expert opinion sought by CDAAMC, pasireotide is not expected to be used in the first-line setting. |
The model was structured on normalization of IGF-1 serum levels. Patient response was defined by either normalization of IGF-1 levels or improvement compared to baseline. | Partially acceptable. Clinical expert feedback indicated that IGF-1 normalization is an appropriate outcome impacting clinical management decisions, although clinician group input did note that normalization of IGF-1 alone may not be sufficient to reduce the mortality, humanistic, and economic burden associated with acromegaly. |
Patients on subsequent therapy will receive radiotherapy for only the first 10 years of the model time horizon. | Uncertain. Literature indicates that 50% of patients will experience remission after 10 years of radiotherapy.23 The model assumes that all patients will discontinue radiotherapy after 10 years of treatment, with all maintaining the subsequent treatment utility value. This misaligns with the sponsor’s submitted report, which notes that 50% of patients experience control of the disease by this time point. |
Mortality was based on Statistics Canada data for the age- and sex-specific general population, with an SMR applied for patients in each health state. | Acceptable, according to clinical expert feedback elicited. |
Adverse event–related discontinuation was applied only to the first 6 months of treatment. | Acceptable, according to clinical expert feedback elicited. |
CDA-AMC = Canada’s Drug Agency; IGF-1 = insulin-life growth factor 1; SMR = standard mortality ratio; SSA = somatostatin analogue.
CDA-AMC Reanalyses of the Economic Evaluation
Base-Case Results
CDA-AMC undertook reanalyses that addressed the limitations within the sponsor’s model, as summarized in Table 5. The CDA-AMC base case was derived by making changes in model parameter values and assumptions in consultation with clinical experts. The following changes were applied: adjusting the pegvisomant dosage; adjusting the cost per administration for lanreotide and pegvisomant; employing AE incidence rates reported in the C2404 trial, which further informed the ratio of all-grade AEs to grade 3 and 4 AEs to calculate the incidence rate of grade 3 and 4 AEs for pegvisomant; and revising the distribution of subsequent treatments.
Table 5: CDA-AMC Revisions to the Submitted Economic Evaluation
Stepped analysis | Sponsor’s value or assumption | CDA-AMC value or assumption |
|---|---|---|
Corrections to sponsor’s base case | ||
1. Cycle 1 administration costs (all pharmacotherapies) | Excluded | Included |
2. The proportion of grade 3 or 4 AE events to all AEs | Calculation included only grade 3 or 4 AEs. | Calculation included all AEs, regardless of whether they were recorded as grade 3 or 4 events. |
3. Patients in the subsequent treatment health state on radiotherapy experience disease control after 10 years. | No impact on utilities. | 50% of patients have utilities return to full control health state. |
Changes to derive the CDA-AMC base case | ||
1. Pegvisomant dosage (high dose) | Full control–high dose: 30 mg | Full control–high dose: 17.41 mg |
2. Administration costs | Lanreotide: $54.25 per administration Pegvisomant: $54.25 per administration | Lanreotide: $38 per administration Pegvisomant: $0 per administration |
3. AE incidence rates | AE rates for pasireotide and octreotide were sourced from the C2305 trial, and rate for lanreotide was sourced from the Lantern trial. | AE rates for pasireotide, octreotide, and lanreotide were sourced from the C2402 study. The proportion of grade 3 or 4 AEs to all-grade AEs to inform the rates of grade 3 or 4 AEs for pegvisomant were also based on the C2402 study. |
4. Selection of subsequent treatments | All patients on octreotide and radiotherapy combination therapy | Radiotherapy only: 90% Pegvisomant and octreotide combination therapy: 10% |
CDA-AMC base case | ― | 1 + 2 + 3 + 4 |
AE = adverse event; CDA-AMC = Canada’s Drug Agency.
In the population in the reimbursement request (adult patients with acromegaly for whom surgery is not an option or has not been curative and who are inadequately controlled on treatment with another SSA), the CDA-AMC base-case reanalysis estimated that pasireotide was $434,636 more expensive and yielded 2.01 more QALYs when compared to octreotide. Similar to the sponsor’s base case, the majority of the incremental benefits (99%) in the CDA-AMC base case were derived from the period beyond the observed trial data. Based on a sequential analysis, pasireotide was associated with an ICER of $215,757 per QALY gained compared to octreotide. Pasireotide had a 0% probability of being cost-effective at a WTP threshold of $50,000 per QALY gained. A detailed breakdown is available on Table 11.
Table 6: Summary of the CDA-AMC Reanalysis Results
Drug | Total costs ($) | Total QALYs | Sequential ICER ($/QALY) |
|---|---|---|---|
Sponsor’s corrected base case (probabilistic) | |||
Octreotide | 605,704 | 9.94 | Reference |
Pasireotide | 953,605 | 11.96 | 172,661 |
Dominated treatments | |||
Lanreotide | 605,812 | 9.94 | Dominated by pasireotide |
Pegvisomant | 1,455,870 | 11.69 | Dominated by pasireotide |
CDA-AMC base case (probabilistic) | |||
Octreotide | 250,972 | 9.92 | Reference |
Pasireotide | 685,609 | 11.94 | 215,757 |
Dominated treatments | |||
Lanreotide | 250,983 | 9.92 | Dominated by pasireotide |
Pegvisomant | 722,528 | 11.68 | Dominated by pasireotide |
CDA-AMC = Canada’s Drug Agency; ICER = incremental cost-effectiveness ratio; QALY = quality-adjusted life-years.
Note: The CDA-AMC reanalyses were based on publicly available prices of the comparator and subsequent therapies.
Similar to the sponsor’s base-case results, the CDA-AMC reanalysis results were driven by the distribution assumed for subsequent treatments. After 6 months, patients treated with a first-generation SSA transition to the subsequent treatment health state. By assuming lower costs for subsequent treatments, the expected total cost of first-generation SSAs is expected to decrease compared to pasireotide. Of note, the reanalyses reflected the publicly available list price of the comparators and are consistent with the sponsor’s base case. Drug acquisition costs consisted of 89% of total cost for pasireotide (78% for octreotide; 78% for lanreotide; and 90% for pegvisomant). Thus, the model is expected to be highly sensitive to any confidentially negotiated price of the comparator treatments if these differ from the public list prices.
Scenario Analysis Results
CDA-AMC undertook price reduction analyses. To be considered cost-effective at a WTP threshold of $50,000 per QALY gained, the price of pasireotide would need to be reduced by 71%, corresponding to approximately $1,474 per vial (Table 7).
Scenario analyses conducted included setting the comorbidities distribution to be equal across all health states, based on the distribution reported for full control (i.e., to remove the differential impact of IGF-1 normalization on comorbidities), and removing pegvisomant (i.e., to reflect jurisdictions that do not publicly reimburse pegvisomant). Results of these scenario analyses are presented in Table 13. The scenario analyses were aligned with the findings from the CDA-AMC base-case reanalyses but, in all instances, resulted in a higher ICER.
Table 7: CDA-AMC Price Reduction Analyses
Analysis: price reduction | Unit drug cost ($) | ICER for pasireotide vs. octreotide ($/QALY) | |
|---|---|---|---|
Sponsor’s base case (corrected) | CDA-AMC reanalysis | ||
No price reduction | 5,048.76 | 172,661 | 215,757 |
10% | 4,544 | 149,249 | 192,339 |
20% | 4,039 | 125,836 | 168,921 |
30% | 3,534 | 84,046 | 145,504 |
40% | 3,029 | 79,011 | 122,086 |
50% | 2,524 | 55,599 | 98,668 |
60% | 2,020 | 32,186 | 75,250 |
70% | 1,515 | 8,774 | 51,832 |
80% | 1,010 | NA | 28,414 |
90% | 505 | NA | 4,996 |
CDA-AMC = Canada’s Drug Agency; ICER = incremental cost-effectiveness ratio; QALY = quality-adjusted life-year.
Issues for Consideration
Somatostatin receptor staining before therapy initiation: Both first- and second-generation SSAs require somatostatin receptors to be effective treatments. Thus, clinical expert input received by CDAAMC highlighted that, before initiation of pharmacotherapy, patients routinely receive somatostatin receptor staining to determine treatment eligibility. Clinical experts consulted note that such tests are conducted in specialty centres.
Confidential price for comparators: The sponsor’s and the CDA-AMC analyses are based on publicly available list prices for most comparators. Actual costs paid by public drug plans are unknown, and any potential confidential rebates are not reflected in the analyses.
Variable public coverage of pegvisomant: Public reimbursement of pegvisomant is jurisdiction-dependent. Currently, only Ontario and British Columbia are confirmed to provide public coverage of pegvisomant. Furthermore, coverage of pegvisomant may be with different budget holders. CDA-AMC conducted a scenario analysis removing pegvisomant from the economic model as both a comparator and as an available subsequent treatment option to better reflect jurisdictions that do not publicly reimburse pegvisomant.
Overall Conclusions
Evidence from the C24021 trial suggests that pasireotide likely leads to improvements in the number of patients who experience IGF-1 normalization for adult patients with acromegaly for whom surgery is not an option or has not been curative and whose acromegaly is inadequately controlled on treatment with first-generation SSA compared to lanreotide and octreotide. In the CDA-AMC Clinical Review report, there is uncertainty regarding the magnitude of IGF-1 improvement. Given the lack of direct evidence between pasireotide and pegvisomant, the sponsor submitted an ITC that suggested no differences in IGF-1 normalization, but this ITC was associated with uncertainty due to methodological limitations, including heterogeneity across studies, lack of adjustment for effect modifiers, and the assumption that SSA and placebo are equivalent.
The CDA-AMC base-case results aligned with the sponsor-submitted analysis, indicating that pasireotide is not cost-effective at a WTP threshold of $50,000 per QALY gained relative to octreotide. Results from the CDA-AMC base case suggest that the ICER for pasireotide versus octreotide is $215,757 per QALY gained (incremental costs = $434,636; incremental QALYs = 2.01). Pasireotide dominated lanreotide and pegvisomant (associated with lower total costs and higher total QALYs). The majority of the incremental QALYs were gained beyond the observed trial period and is dependent on the assumption that IGF-1 normalization, achieved at 24 weeks in the C2402 trial, would be maintained over a patient’s lifetime. There is limited evidence on the long-term comparative efficacy of pasireotide. At the submitted price, pasireotide would require a price reduction of 71% (from $5,048.76 to $1,474 per vial, regardless of strength) to be considered cost-effective at a WTP threshold of $50,000 per QALY gained. All analyses reflect the publicly available list price of the comparators and, consistent with the sponsor’s base case, drug acquisition costs were the majority of total cost (i.e., 78% for octreotide and lanreotide, 89% for pasireotide and 90% for pegvisomant). Therefore, the model is expected to be highly sensitive to any confidentially negotiated price of the comparator treatments if these differ from public list prices.
Although the CDA-AMC reanalysis attempted to address some of the identified limitations of the sponsor’s economic submission, uncertainty still exists in the modelled relationship between IGF-1 normalization and the development of comorbidities. CDA-AMC conducted a scenario analysis removing the relationship between IGF-1 normalization and comorbidities, which resulted in a higher ICER than estimated in the CDA-AMC base-case reanalysis.
CDA-AMC was unable to address uncertainty related to the comparative efficacy of pegvisomant. Therefore, the clinical and cost-effectiveness of pasireotide compared to pegvisomant is unknown. While pasireotide maintains the same unit cost, regardless of dose, pegvisomant unit cost increases at higher doses. At the publicly available list prices, the annual treatment cost of pasireotide is $65,859, while annual treatment costs for pegvisomant can range from $49,905 to $148,624. The cost-effectiveness of pasireotide as first-line treatment, which reflects part of the Health Canada indication, was not submitted by the sponsor, and, as a result, the cost-effectiveness for the full Health Canada indication remains unknown.
References
1.Ontario Ministry of Health, Ontario Ministry of Long-Term Care. Exceptional Access Program (EAP). 2024. Accessed November 2024. http://www.health.gov.on.ca/en/pro/programs/drugs/odbf/odbf_except_access.aspx
2.Recordati Rare Diseases Canada Inc. Signifor LAR (pasireotide as pasireotide pamoate): 10 mg, 20 mg, 30 mg, 40 mg, and 60 mg pasireotide per vial, for injectable suspension [product monograph]. February 10, 2015. Updated May 19, 2020. Accessed by sponsor, no date provided. https://pdf.hres.ca/dpd_pm/00056343.PDF
3.Recordati Rare Diseases Canada Inc. Drug Reimbursement Review sponsor submission: Signifor LAR (pasireotide), 40 mg or 60 mg, vial, for injectable suspension [internal sponsor's package]. October 2, 2024.
4.Recordati Rare Diseases Canada Inc. Pharmacoeconomic evaluation [internal sponsor's report]. In: Drug Reimbursement Review sponsor submission: Signifor LAR (pasireotide), 40 mg or 60 mg, vial, for injectable suspension. October 2, 2024.
5.Gadelha MR, Bronstein MD, Brue T, et al. Pasireotide versus continued treatment with octreotide or lanreotide in patients with inadequately controlled acromegaly (PAOLA): a randomised, phase 3 trial. Lancet Diabetes Endocrinol. 2014;2(11):875-84. doi: 10.1016/S2213-8587(14)70169-X PubMed
6.Recordati Rare Diseases Canada Inc. Signifor GVD – Signifor (Indirect Treatment Comparison) Section, version 2.0 [internal sponsor's report]. In: Drug Reimbursement Review sponsor submission: Signifor LAR (pasireotide), 40 mg or 60 mg, vial, for injectable suspension. September 2014.
7.Colao A, Pivonello R, Grasso LF, et al. Determinants of cardiac disease in newly diagnosed patients with acromegaly: results of a 10 year survey study. Eur J Endocrinol. 2011;165(5):713-21. doi: 10.1530/EJE-11-0408 PubMed
8.Statistics Canada. Table: 13-10-0114-01. Life expectancy and other elements of the life table, Canada, all provinces except Prince Edward Island. 2023. https://www150.statcan.gc.ca/t1/tbl1/en/tv.action?pid=1310011401
9.Bolfi F, Neves AF, Boguszewski CL, Nunes-Nogueira VS. Mortality in acromegaly decreased in the last decade: a systematic review and meta-analysis. Eur J Endocrinol. 2018;179(1):59-71. doi: 10.1530/EJE-18-0255 PubMed
10.Sherlock M, Reulen RC, Alonso AA, et al. ACTH deficiency, higher doses of hydrocortisone replacement, and radiotherapy are independent predictors of mortality in patients with acromegaly. J Clin Endocrinol Metab. 2009;94(11):4216-23. doi: 10.1210/jc.2009-1097 PubMed
11.Novartis Pharmaceuticals. Clinical Study Report: CSOM230C2305. A multicenter, randomized, blinded study to assess safety and efficacy of pasireotide LAR vs octreotide LAR in patients with active acromegaly [internal sponsor's report]. October 8, 2012.
12.An Z, Lei T, Duan L, et al. Efficacy and safety of lanreotide autogel compared with lanreotide 40 mg prolonged release in Chinese patients with active acromegaly: results from a phase 3, prospective, randomized, and open-label study (LANTERN). BMC Endocr Disord. 2020;20(1):57. doi: 10.1186/s12902-020-0524-7 PubMed
13.Trainer PJ, Drake WM, Katznelson L, et al. Treatment of acromegaly with the growth hormone-receptor antagonist pegvisomant. N Engl J Med. 2000;342(16):1171-7. doi: 10.1056/NEJM200004203421604 PubMed
14.Liu S, Adelman DT, Xu Y, et al. Patient-centered assessment on disease burden, quality of life, and treatment satisfaction associated with acromegaly. J Investig Med. 2018;66(3):653-660. doi: 10.1136/jim-2017-000570 PubMed
15.Gupta T, Chatterjee A. Modern Radiation Therapy for Pituitary Adenoma: Review of Techniques and Outcomes. Neurol India. 2020;68(Supplement):S113-S122. doi: 10.4103/0028-3886.287678 PubMed
16.Whittington MD, Munoz KA, Whalen JD, Ribeiro-Oliveira A, Campbell JD. Economic and clinical burden of comorbidities among patients with acromegaly. Growth Horm IGF Res. 2021;59:101389. doi: 10.1016/j.ghir.2021.101389 PubMed
17.Shiroiwa T, Noto S, Fukuda T. Japanese Population Norms of EQ-5D-5L and Health Utilities Index Mark 3: Disutility Catalog by Disease and Symptom in Community Settings. Value Health. 2021;24(8):1193-1202. doi: 10.1016/j.jval.2021.03.010 PubMed
18.BC Guidelines. Hormone Testing – Indications and Appropriate Use. 2022. Accessed by sponsor, no date provided. https://www2.gov.bc.ca/gov/content/health/practitioner-professional-resources/bc-guidelines/special-endocrine-testing
19.Rowles SV, Prieto L, Badia X, Shalet SM, Webb SM, Trainer PJ. Quality of life (QOL) in patients with acromegaly is severely impaired: use of a novel measure of QOL: acromegaly quality of life questionnaire. J Clin Endocrinol Metab. 2005;90(6):3337-41. doi: 10.1210/jc.2004-1565 PubMed
20.Pfizer Canada ULC. Somavert (pegvisomant for injection): 10, 15, 20, 25 or 30 mg lyophilized powder per vial, for injection [product monograph]. October 17, 2005. Updated December 30, 2021. Accessed by sponsor, no date provided. https://pdf.hres.ca/dpd_pm/00064145.PDF
21.Davi MV, Dalle Carbonare L, Giustina A, et al. Sleep apnoea syndrome is highly prevalent in acromegaly and only partially reversible after biochemical control of the disease. Eur J Endocrinol. 2008;159(5):533-40. doi: 10.1530/EJE-08-0442 PubMed
22.Carmichael JD, Broder MS, Cherepanov D, et al. The association between biochemical control and cardiovascular risk factors in acromegaly. BMC Endocr Disord. 2017;17(1):15. doi: 10.1186/s12902-017-0166-6 PubMed
23.Almeldin D, Fersht N, Kosmin M. Radiotherapy for Pituitary Tumors. Text. MDText.com, Inc.; 2000-. Updated August 4, 2023. Accessed by sponsor, no date provided. https://www.ncbi.nlm.nih.gov/books/NBK278955/
24.Ontario Ministry of Health, Ontario Ministry of Long-Term Care. Ontario drug benefit formulary/comparative drug index. 2024. Accessed November 2024. https://www.formulary.health.gov.on.ca/formulary/
25.Ipsen Biopharmaceuticals Canada Inc. Somatuline Autogel (lanreotide injection): 60 mg, 90 mg, 120 mg per syringe, extended release solution, deep subcutaneous injection [product monograph]. July 17, 2006. Updated August 8, 2023. Accessed by sponsor, no date provided. https://pdf.hres.ca/dpd_pm/00071957.PDF
26.Novartis Pharmaceuticals Canada Inc. Sandostatin (octreotide as acetate): 50 mcg/mL, 100 mcg/mL, or 200 mcg/mL, solution for subcutaneous injection or intravenous infusion; Sandostatin LAR (octreotide as acetate): 10 mg, 20 mg, or 30 mg, powder per vial, for intramuscular injection [product monograph]. June 6, 1989. Updated April 19, 2021. Accessed by sponsor, no date provided. https://pdf.hres.ca/dpd_pm/00060820.PDF
Appendix 1: Cost Comparison Table
Please note that this appendix has not been copy-edited.
The comparators presented in the following table have been deemed to be appropriate based on feedback from clinical expert(s) and drug plans. Comparators may be recommended (appropriate) practice or actual practice. Existing Product Listing Agreements are not reflected in the table and as such, the table may not represent the actual costs to public drug plans.
Table 8: CDA-AMC Cost Comparison Table for Acromegaly
Treatment | Strength / concentration | Form | Price | Recommended dosage | Daily cost ($) | Annual cost ($)a |
|---|---|---|---|---|---|---|
Pasireotide (Signifor LAR) | 40 mg 60 mg | Prefilled syringe for IM injection | $5,048.7600 $5,048.7600 | Initiation: 40 mg every 28-days for 3 months2 Maintenance: 40 to 60 mg every 28-days based upon GH and IGF-1 serum levels2 | $180.31 | $65,859 |
First-generation somatostatin analogues | ||||||
Lanreotide (Somatuline Autogel) | 60 mg 90 mg 120 mg | Prefilled syringe for SC injection | $1,317.2824 $1,757.1624 $2,199.4524 | Initiation: 90 mg every 28-days for 3 months25 Maintenance: 60 to 120 mg every 28-days based upon GH and IGF-1 serum levels25 | Year 1: $50.66 to $74.92 Year 2+: $47.05 to $78.55 | Year 1: $18,503 to $27,364 Year 2+: $17,183 to $28,691 |
Octreotide LAR (Sandostatin LAR) | 10 mg 20 mg 30 mg | Prefilled syringe for IM injection | $990.7024 $1,279.9424 $1,642.1424 | Initiation: 20 mg every 28-days for 3 months26 Maintenance: 10 to 30 mg every 28-days based upon GH and IGF-1 serum levels26 | Year 1: $37.76 to $55.67 Year 2+: $35.38 to $58.65 | Year 1: $13,791 to $20,335 Year 2: $12,923 to $21,421 |
GH receptor agonists | ||||||
Pegvisomant (Somavert) | 10 mg20 15 mg20 20 mg20 25 mg20 30 mg20 | Lyophilized powder for SC injection | $135.521 $203.271 $271.021 $338.781 $406.541 | Loading dose: 40 mg on day 120 Maintenance: 10 to 30 mg daily based on IGF-1 serum levels20 | Year 1: $136.63 to $406.91 Year 2+: $135.52 to $406.54 | Year 1: $49,905 to $148,624 Year 2+: $49,499 to $148,489 |
Note: All prices for lanreotide and octreotide are from the Ontario Drug Benefit Formulary (accessed October 2024) and pegvisomant from the Ontario Exceptional Access Program (EAP).
Appendix 2: Submission Quality
Please note that this appendix has not been copy-edited.
Description | Yes or No | Comments |
|---|---|---|
Population is relevant, with no critical intervention missing, and no relevant outcome missing | Yes | No comment. |
Model has been adequately programmed and has sufficient face validity | No | Refer to key limitations. Sponsor’s economic model was unable to demonstrate a higher risk of hyperglycemia for patients on pasireotide treatment, nor did it accurately portray Canadian clinical practice regarding subsequent treatments. |
Model structure is adequate for decision problem | No | There was no consideration for possible tumour growth and loss of treatment response in the full control health state. Time horizon was set to 100 years for an adult population, which is greater than the expected lifespan of the patients. |
Data incorporation into the model has been done adequately (e.g., parameters for probabilistic analysis) | No | Refer to corrections to sponsor’s model. |
Parameter and structural uncertainty were adequately assessed; analyses were adequate to inform the decision problem | No | For some model parameters, the sponsor arbitrarily incorporated uncertainty using a standard deviation equal to ± 10% of the mean value. (i.e., costs, dose, resource use, efficacy, utilities.), which likely does not reflect the true uncertainty around the model’s parameters. |
The submission was well organized and complete; the information was easy to locate (clear and transparent reporting; technical documentation available in enough details) | No | The sponsor’s submission had multiple labelling errors and misalignments between the pharmacoeconomic report and the submitted Excel model. |
Appendix 3: Additional Information on the Submitted Economic Evaluation
Please note that this appendix has not been copy-edited.

Detailed Results of the Sponsor’s Base Case
Table 10: Disaggregated Summary of the Sponsor’s Economic Evaluation Results (Deterministic)
Parameter | Pasireotide | Lanreotide | Octreotide | Pegvisomant |
|---|---|---|---|---|
Discounted LYs | ||||
Total | 24.95 | 23.90 | 23.90 | 24.81 |
Full control | 6.88 | 0.00 | 0.00 | 5.96 |
Partial control | 0.03 | 0.00 | 0.00 | 0.05 |
No control | 0.25 | 0.25 | 0.25 | 0.25 |
Subsequent treatment | 17.79 | 23.65 | 23.65 | 18.55 |
Discounted QALYs | ||||
Total | 10.89 | 8.49 | 8.49 | 10.55 |
Full control | 4.46 | 0.00 | 0.00 | 3.85 |
Partial control | 0.02 | 0.00 | 0.00 | 0.03 |
No control | 0.08 | 0.08 | 0.84 | 0.08 |
Subsequent treatment | 6.32 | 8.41 | 8.41 | 6.59 |
Discounted costs ($) | ||||
Total | $957,126 | $610,875 | $610,824 | $1,495,358 |
Acquisition | $850,406 | $510,712 | $510,679 | $1,270,594 |
Administration | $16,470 | $15,398 | $15,398 | $131,226 |
Monitoring | $41,378 | $34,891 | $34,891 | $44,205 |
Comorbidity | $48,737 | $49,744 | $49,744 | $48,877 |
Adverse event management | $136 | $131 | $112 | $456 |
LY = life-year; QALY = quality-adjusted life-year.
Source: Sponsor’s pharmacoeconomic submission3
Appendix 4: Additional Details on the CDA-AMC Reanalyses and Sensitivity Analyses of the Economic Evaluation
Please note that this appendix has not been copy-edited.
Detailed Results of CDA-AMC Base Case
Table 11: Summary of the Stepped Analysis of the CDA-AMC Base-Case Results
Stepped analysis | Drug | Total costs ($) | Total QALYs | Sequential ICER ($/QALY) |
|---|---|---|---|---|
Sponsor corrected base case (Probabilistic) | Octreotide | $605,704 | 9.94 | Reference |
Pasireotide | $953,605 | 11.96 | $176,661 | |
Dominated treatments | ||||
Lanreotide | $605,812 | 9.94 | Dominated by pasireotide | |
Pegvisomant | $1,455,879 | 11.69 | Dominated by pasireotide | |
1. CDA-AMC reanalysis 1 | Octreotide | $611,001 | 9.93 | Ref. |
Pasireotide | $957,303 | 11.96 | $170,731 | |
Dominated treatments | ||||
Lanreotide | $611,036 | 9.93 | Dominated by pasireotide | |
Pegvisomant | $1,148,897 | 11.69 | Dominated by pasireotide | |
2. CDA-AMC reanalysis 2 | Lanreotide | $610,983 | 9.93 | Reference |
Octreotide | $611,001 | 9.93 | $133,436 | |
Pasireotide | $957,303 | 11.96 | $170,731 | |
Dominated treatments | ||||
Pegvisomant | $1,376,022 | 11.69 | Dominated by pasireotide | |
3. CDA-AMC reanalysis 3 | Octreotide | $610,958 | 9.93 | Reference |
Pasireotide | $957,390 | 11.96 | $171,071 | |
Dominated treatments | ||||
Lanreotide | $610,990 | 9.93 | Dominated by pasireotide | |
Pegvisomant | $1,500,069 | 11.69 | Dominated by pasireotide | |
4. CDA-AMC reanalysis 4 | Octreotide | $250,196 | 9.94 | Reference |
Pasireotide | $685,985 | 11.96 | $214,940 | |
Dominated treatments | ||||
Lanreotide | $250,231 | 9.94 | Dominated by pasireotide | |
Pegvisomant | $1,217,161 | 11.69 | Dominated by pasireotide | |
CDA-AMC base case (deterministic) (Reanalysis 1 + 2 + 3 + 4) | Lanreotide | $250,175 | 9.94 | Reference |
Pasireotide | $686,103 | 11.96 | $215,306 | |
Dominated treatments | ||||
Octreotide | $250,196 | 9.94 | Dominated by lanreotide | |
Pegvisomant | $741,802 | 11.69 | Dominated by pasireotide | |
CDA-AMC base case (probabilistic) (Reanalysis 1 + 2 + 3 + 4) | Octreotide | $250,972 | 9.92 | Reference |
Pasireotide | $685,609 | 11.94 | $215,757 | |
Dominated treatments | ||||
Lanreotide | $250,983 | 9.92 | Dominated by pasireotide | |
Pegvisomant | $722,528 | 11.68 | Dominated by pasireotide | |
ICER = incremental cost-effectiveness ratio; QALY = quality-adjusted life-years.
Note: The CDA-AMC reanalysis is based on publicly available prices of the comparator treatments. The results of all steps are presented deterministically unless otherwise indicated, while the cumulative CDA-AMC base case is always presented both deterministically and probabilistically.
Table 12: Disaggregated Summary of the CDA-AMC Economic Evaluation Results
Parameter | Pasireotide | Octreotide | Lanreotide | Pegvisomant |
|---|---|---|---|---|
Discounted LYs | ||||
Total | 24.96 | 23.92 | 23.92 | 24.83 |
Full control | 6.89 | 0.00 | 0.00 | 5.99 |
Partial control | 0.03 | 0.00 | 0.00 | 0.05 |
No control | 0.25 | 0.25 | 0.25 | 0.25 |
Subsequent treatment | 17.79 | 23.67 | 23.67 | 18.54 |
Discounted QALYs | ||||
Total | 11.94 | 9.92 | 9.92 | 11.68 |
Full control | 4.44 | 0.00 | 0.00 | 3.86 |
Partial control | 0.02 | 0.00 | 0.00 | 0.03 |
No control | 0.08 | 0.08 | 0.08 | 0.08 |
Subsequent treatment | 7.40 | 9.84 | 9.84 | 7.71 |
Discounted costs ($) | ||||
Total | $685,609 | $250,972 | $250,983 | $722,528 |
Acquisition | $612,526 | $195,743 | $195,806 | $652,492 |
Administration | $6,211 | $1,709 | $1,656 | $1,200 |
Monitoring | $18,036 | $3,819 | $3,819 | $19,864 |
Comorbidity | $48,665 | $49,702 | $49,702 | $48,813 |
Adverse event management | $170 | $1 | $1 | $159 |
LY = life-year; QALY = quality-adjusted life-year.
Scenario Analyses
Table 13: Scenario Analyses Conducted on the CDA-AMC Base Case
Stepped analysis | Drug | Total costs ($) | Total QALYs | Sequential ICER ($/QALY) |
|---|---|---|---|---|
CDA-AMC scenario analysis 1: All comorbid distributions are set to full control distributions | Octreotide | $238,901 | 11.07 | Reference |
Pasireotide | $679,020 | 12.83 | $250,421 | |
Dominated treatments | ||||
Lanreotide | $238,994 | 11.07 | Dominated by pasireotide | |
Pegvisomant | $712,347 | 12.60 | Dominated by pasireotide | |
CDA-AMC scenario analysis 2: Removal of pegvisomant (i.e., jurisdictions that do not reimburse pegvisomant) | Octreotide | $139,491 | 9.96 | Reference |
Pasireotide | $601,986 | 12.00 | $226,569 | |
Dominated treatments | ||||
Lanreotide | $139,551 | 9.96 | Dominated by pasireotide | |
ICER = incremental cost-effectiveness ratio; QALY = quality-adjusted life-year.
Appendix 5: Submitted Budget Impact Analysis and CDA-AMC Appraisal
Please note that this appendix has not been copy-edited.
Table 14: Summary of Key Take-Aways
Key take-aways of the budget impact analysis |
|---|
|
Summary of Sponsor’s Budget Impact Analysis
In the submitted budget impact analysis (BIA), the sponsor assessed the budget impact of reimbursing pasireotide for the treatment of acromegaly in adult patients for whom surgery is not an option or has not been curative and who are inadequately controlled on treatment with a first-generation SSA. A scenario analysis was further submitted that reflected the Health Canada indication (i.e., acromegaly in adult patients for whom surgery is not an option or has not been curative). The BIA was conducted from the perspective of a Canadian public drug plan over a 3-year time horizon (fourth quarter of 2025 to third quarter of 2028).
An epidemiological approach was taken to determine the number of patients eligible for pasireotide using data from literature and assumptions informed by expert opinion. The sponsor compared a reference scenario where patients are treated with lanreotide, octreotide or pegvisomant (if publicly reimbursed) to a new drug scenario in which pasireotide would be reimbursed. Different market shares were assumed in the reference scenario depending on the provincial reimbursement status of pegvisomant. As such, the new drug scenario further assumed different market shares by jurisdiction but, in both instances, pasireotide was assumed to become the dominant therapy with the market share taken from pegvisomant in jurisdictions covering pegvisomant and displacing equally from lanreotide and octreotide in the remaining provinces that do not publicly fund pegvisomant. Drug costs were derived from the Ontario Drug Benefit and Ontario EAP. Key inputs to the BIA are documented in Table 15.
Key assumptions to the BIA include:
Treatment did not reflect stepwise titration. 70% of patients on pasireotide received 40 mg while the remainder received 60 mg. Given patients on lanreotide and octreotide would have already not experienced control with these drugs, they were assumed to be on its maximum dosage. All patients on pegvisomant were assumed to be on a dose of 30 mg daily.
Table 15: Summary of Key Model Parameters
Parameter | Sponsor’s estimate (reported as year 1 / year 2 / year 3 if appropriate) |
|---|---|
Target population | |
Statistics Canada population People aged 18 to 64 years People aged 65+ years Drug plan-eligible People aged 18 to 64 years People aged 65+ years Prevalence of Acromegaly Failed/Ineligible for surgery On Pharmacotherapy Failed First-line SSAs | 25,607,414 19,698,770 5,908,044 17,483,306 11,574,662 5,908,644 0.006% 50.0% 95.0% 40.0% |
Number of patients eligible for drug under review | 203 / 207 / 211 |
Market uptake (3 years) | |
Uptake (reference scenario - BC) Lanreotide Octreotide Pegvisomant | 0% / 0% / 0% 10% / 10% / 10% 90% / 90% / 90% |
Uptake (reference scenario – ON and NS) Lanreotide Octreotide Pegvisomant | 5% / 5% / 5% 5% / 5% / 5% 90% / 90% / 90% |
Uptake (reference scenario – Other Provinces) Lanreotide Octreotide Pegvisomant | 50% / 50% / 50% 50% / 50% / 50% 0% / 0% / 0% |
Uptake (new drug scenario - BC) Pasireotide Lanreotide Octreotide Pegvisomant | 30% / 40% / 50% 0% / 0% / 0% 10% / 10% / 10% 60% / 50% / 40% |
Uptake (new drug scenario – ON and NS) Pasireotide Lanreotide Octreotide Pegvisomant | 30% / 40% / 50% 5% / 5% / 5% 5% / 5% / 5% 60% / 50% / 40% |
Uptake (new drug scenario - Other provinces) Pasireotide Lanreotide Octreotide Pegvisomant | 40% / 55% / 70% 30% / 22.5% / 15% 30% / 22.5% / 15% 0% / 0% / 0% |
Cost of treatment (per patient, per annum) | |
Pasireotide Lanreotide Octreotide Pegvisomant [induction] Pegvisomant [maintenance] | $65,634 $28,593 $21,348 $542.08 $148,347 |
BC = British Columbia; NS = Nova Scotia; ON = Ontario; SSA = somatostatin Analogue.
Summary of the Sponsor’s BIA Results
The sponsor estimated that funding pasireotide for the treatment of acromegaly in adult patients for whom surgery is not an option or has not been curative and who are inadequately controlled on treatment with a first-generation somatostatin analogue would be cost savings with a cumulative savings of $7,413,782 across the 3-year time horizon (Year 1: $1,843,941; Year 2: $2,462,290; and Year 3: $3,107,551). The above budget impact results reflect the pan-Canadian aggregate (excluding Quebec) although whether pasireotide would results in budget savings for individual jurisdictions would depend on the reimbursement status of pegvisomant. Specifically, the reimbursement of pasireotide was observed to be budget savings to provinces that currently already fund pegvisomant; in all other provinces, reimbursement of pasireotide would result in an increase in budget expenditures.
The sponsor conducted a scenario analysis that explores the patient population according to the Health Canada indication. It was estimated that for the Health Canada indication population, the funding of pasireotide would result in cost savings of $11,412,228 over a 3-year time horizon (year 1: $2,851,364, year 2: $3,790,026, and year 3: $4,770,838).
CDA-AMC Appraisal of the Sponsor’s BIA
CDA-AMC identified several key limitations to the sponsor’s analysis that have notable implications on the results of the BIA:
Dosing of pegvisomant is uncertain but likely overestimated. The sponsor assumed that all patients on pegvisomant treatment would be administered 30 mg daily. As noted previously under the key limitations to the economic evaluation, this assumption is unreasonable as clinicians would titrate in a stepwise manner to the next available strength depending on IGF-1 response and tolerability.
In reanalysis, CDA-AMC adjusted the dosages of pegvisomant to align with the CDA-AMC revised base-case reanalysis values.
Market uptake of pasireotide is uncertain. The sponsor assumed that pasireotide would capture 40%, 55%, and 70% of the market shares in jurisdictions that do not provide coverage for pegvisomant and 30%, 40%, and 50% in jurisdictions that publicly reimburse pegvisomant in year 1, 2, and 3, respectively. Clinical expert input obtained by CDA-AMC was in disagreement with the sponsor’s, especially when it pertained to jurisdictions that do not cover pegvisomant. In these settings, it was noted that the patient population comprises individuals who have previously failed on a first-generation SSA and, as such, pasireotide would be the preferred treatment and, a higher market uptake would therefore be expected. The sponsor had assumed that pasireotide would displace pegvisomant in provinces that provide coverage while clinical expert input received by CDA-AMC noted it was more likely that pasireotide would displace first-generation SSA.
CDA-AMC conducted a reanalysis by adjusting market uptake of pasireotide to 80% across all 3 years for jurisdictions that do not cover pegvisomant to reflect clinical expert input received. In jurisdiction that publicly reimburse pegvisomant, given that pasireotide would be the preferred treatment compared to first-generation SSAs, pasireotide’s market capture would come from lanreotide (33%), octreotide (33%), and pegvisomant (33%), proportionally.
Proportion of patients on pegvisomant within the reference scenario is likely overestimated. The sponsor-submitted BIA assumes that pegvisomant is publicly covered in British Columbia, Ontario, and Nova Scotia. Clinical expert input received by CDA-AMC expressed that patients in Nova Scotia have difficulty accessing pegvisomant treatment, which was further validated from drug plan input received by CDA-AMC that noted that pegvisomant is available by exceptional access with coverage determined on a case-by-case basis. Additionally, the proportion of patients on pegvisomant (90%) were noted to be significantly higher than anticipated.
In reanalysis, CDA-AMC adjusted the market shares of pegvisomant. Specifically, for Ontario and British Columbia, market shares for and pegvisomant were adjusted to 50% and consequently, market shares for lanreotide and octreotide was redistributed (25% each) across each year of the model. Furthermore, the market shares for Nova Scotia were assumed to be more aligned with the provinces that do not provide public reimbursement of pegvisomant.
The costs of subsequent treatments were not considered. The costs of subsequent treatments were not accounted for in the sponsor’s submitted BIA model. Patients with acromegaly for whom surgery is not an option or has not been curative and have not previously experienced control on a first-generation SSA may go on to receive combination therapy of pegvisomant and SSA, or radiotherapy, as noted in the key limitation section of the economic evaluation. Subsequent treatments would be expected to have an impact on drug plan budgets although the direction and magnitude of impact is uncertain.
CDA-AMC was unable to address this limitation owing to the structure of the sponsor’s submitted BIA model.
Epidemiological approach to determine market size was inappropriate. Clinical expert feedback obtained by CDA-AMC indicated that SSAs (i.e., pasireotide, lanreotide and octreotide) would not be a suitable treatment in patients who do not express somatostatin receptors. Yet, there is no step within the sponsor’s epidemiological approach to remove such patients from the derivation of the target population derivation. Clinical expert inputs further indicated uncertainty with the following proportions: patients for whom surgery has not been curative or who are ineligible for surgery as well as patients did not experience control with first-generation SSAs. Clinician expert feedback noted that the proportion of patients who do not experience control or are ineligible for surgery was higher than expected and the proportion of patients who do not experience control with first-generation SSAs was lower than expected.
In CDA-AMC reanalysis, an additional step to the epidemiological filter was introduced by assuming 25% of patients would not express somatostatin receptors as per clinical expert feedback and would therefore not be eligible to receive treatment with pasireotide. To address the uncertainty regarding the proportion of patients for whom surgery has not been curative or who are ineligible for surgery as well as those who do not experience control with first-generation SSAs, CDA-AMC conducted scenario analyses to adjust the population assumptions from 50% to 30% and 40% to 50%, respectively.
CDA-AMC Reanalyses of the BIA
CDA-AMC base-case reanalyses revised pegvisomant dosing; adjusted the pasireotide market share in the new drug scenario and the comparator market shares in the reference scenario; and incorporated the proportion of patients who express somatostatin receptors as part of the epidemiological approach to derive the target population.
Table 16: CDA-AMC Revisions to the Submitted Budget Impact Analysis
Stepped analysis | Sponsor’s value or assumption | CDA-AMC value or assumption |
|---|---|---|
Changes to derive the CDA-AMC base case | ||
1. Pegvisomant dosing | 30 mg: 100% | 10 mg: 8.14% 15 mg: 47.61% 20 mg: 44.25%a |
2. a. Market uptake of Pasireotide (British Columbia and Ontario) | Pasireotide displaces pegvisomant only. | Pasireotide will displace first-generation SSAs (66.7%) and pegvisomant (33.3%) |
2. b. Market uptake of Pasireotide (Other jurisdictions, including NS) | Year 1: 40% Year 2: 55% Year 3: 70% | Year 1: 80% Year 2: 80% Year 3: 80% |
3. Reference Scenario Market Shares | BC (pegvisomant) Year 1: 90% Year 2: 90% Year 3: 90% Remainder is octreotide ON and NS (pegvisomant) Year 1: 90% Year 2: 90% Year 3: 90% Remainder is lanreotide and octreotide proportionally. | BC and ON (pegvisomant) Year 1: 50% Year 2: 50% Year 3: 50% Remainder is lanreotide and octreotide proportionally. NS (pegvisomant) Year 1: 0% Year 2: 0% Year 3: 0% Remainder is lanreotide and octreotide proportionally. |
4. Inclusion of proportion of patients expressing somatostatin receptors in the derivation of the target patient population | All patients, regardless of somatostatin receptors expression, included. | 75% of patients with acromegaly will have somatostatin receptors expression and would be eligible for pasireotide. |
CDA-AMC base case | Reanalysis 1 + 2a + 2b + 3 + 4 | |
aThe average dosage differs from the economic model due to the inclusion of 10 mg pegvisomant dose into the weighted average. Average dose of 16.81 mg daily based on the sponsor’s ITC
The results of the CDA-AMC stepwise reanalysis are presented in summary format in Table 17 and a more detailed breakdown is presented in Table 18. Cost savings from the sponsor’s base case originated from the displacement of pegvisomant market share from British Columbia, Ontario, and Nova Scotia that resulted in pan-Canadian budget savings. This was not observed in the CDA-AMC reanalysis given findings on budget savings derived from the budget impact model were sensitive to the magnitude to which pasireotide is expected to displace pegvisomant and drug acquisition cost of pegvisomant.
Based on CDA-AMC base-case reanalyses, the expected budget impact for funding pasireotide for the treatment of acromegaly in adult patients for whom surgery is not an option or has not been curative and who are inadequately controlled on treatment with a first-generation SSA is expected to be $2,780,068 in year 1, $3,048,402 in year 2, and $3,325,621 in year 3, with a 3-year budget impact of $9,154,091. An estimate of the budgetary impact of reimbursing pasireotide for its full Health Canada indication (i.e., for the treatment of adult patients with acromegaly for whom surgery is not an option or has not been curative) was not presented given clinical expert input received by CDA-AMC noted that it is unlikely that pasireotide would be used in the first-line setting.
Table 17: Summary of the CDA-AMC Reanalyses of the Budget Impact Analysis
Stepped analysis | Three-year total ($) |
|---|---|
Submitted base case | –$7,413,782 |
CDA-AMC reanalysis 1: Pegvisomant dosage | $3,330,760 |
CDA-AMC reanalysis 2a: Market uptake of pasireotide (British Columbia and Ontario) | $6,310,176 |
CDA-AMC reanalysis 2b: Market uptake of pasireotide (Other Jurisdictions, including NS) | –$3,021,660 |
CDA-AMC reanalysis 3: Reference scenario market shares | –$5,910,520 |
CDA-AMC reanalysis 4: Narrowed target population size by somatostatin receptors expression | –$5,582,248 |
CDA-AMC base case (1 + 2a + 2b + 3 + 4) | $9,154,091 |
Note: The submitted analysis is based on the publicly available prices of the comparator treatments.
CDA-AMC conducted the following scenario analyses to address remaining uncertainty, using the CDA-AMC base case. The results are provided in Table 18. These included:
Decreased the proportion of patients who for whom surgery has not been curative or who are ineligible for surgery from 50% to 40%.
Increased the proportion of patients who did not experience control with first-line pharmacotherapy from 40% to 50%.
Increased market displacement of first-generation SSAs by pasireotide in British Columbia and Ontario to 100%.
Table 18: Detailed Breakdown of the CDA-AMC Reanalyses of the BIA
Stepped analysis | Scenario | Year 0 (current situation) ($) | Year 1 ($) | Year 2 ($) | Year 3 ($) | Three-year total ($) |
|---|---|---|---|---|---|---|
Submitted base case | Reference | $18,652,654 | $18,978,596 | $19,364,410 | $19,750,223 | $58,093,229 |
New drug | $18,652,654 | $17,134,655 | $16,902,119 | $16,642,672 | $50,679,446 | |
Budget impact | $0 | –$1,843,941 | –$2,462,290 | –$3,107,551 | –$7,413,782 | |
CDA-AMC base case | Reference | $5,982,627 | $6,080,325 | $6,200,952 | $6,321,579 | $18,602,856 |
New drug | $5,982,627 | $8,860,393 | $9,249,354 | $9,647,200 | $27,756,947 | |
Budget impact | $0 | $2,780,068 | $3,048,402 | $3,325,621 | $9,154,091 | |
CDA-AMC scenario analysis 1: proportion of patients for whom surgery has not been curative or who are ineligible for surgery to 40% | Reference | $4,786,102 | $4,864,260 | $4,960,762 | $5,057,263 | $14,882,285 |
New drug | $4,786,102 | $7,088,314 | $7,399,483 | $7,717,760 | $22,205,557 | |
Budget impact | $0 | $2,224,054 | $2,438,722 | $2,660,497 | $7,323,272 | |
CDA-AMC scenario analysis 2: proportion of patients who do not experience control with first-line pharmacotherapy to 50% | Reference | $7,478,284 | $7,600,406 | $7,751,190 | $7,901,974 | $23,253,570 |
New drug | $7,478,284 | $11,075,491 | $11,561,692 | $12,059,000 | $34,696,183 | |
Budget impact | $0 | $3,475,085 | $3,810,502 | $4,157,026 | $11,442,613 | |
CDA-AMC scenario analysis 3: Market displacement of first-generation SSAs increased to 100% in BC and ON | Reference | $5,982,627 | $6,080,325 | $6,200,952 | $6,321,579 | $18,602,856 |
New drug | $5,982,627 | $9,409,925 | $9,997,292 | $10,601,158 | $30,008,375 | |
Budget impact | $0 | $3,329,600 | $3,796,340 | $4,279,579 | $11,405,519 |
BC = British Columbia; BIA = budget impact analysis; ON = Ontario.
ISSN: 2563-6596
Canada’s Drug Agency (CDA-AMC) is a pan-Canadian health organization. Created and funded by Canada’s federal, provincial, and territorial governments, we’re responsible for driving better coordination, alignment, and public value within Canada’s drug and health technology landscape. We provide Canada’s health system leaders with independent evidence and advice so they can make informed drug, health technology, and health system decisions, and we collaborate with national and international partners to enhance our collective impact.
Disclaimer: CDA-AMC has taken care to ensure that the information in this document was accurate, complete, and up to date when it was published, but does not make any guarantee to that effect. Your use of this information is subject to this disclaimer and the Terms of Use at cda-amc.ca.
The information in this document is made available for informational and educational purposes only and should not be used as a substitute for professional medical advice, the application of clinical judgment in respect of the care of a particular patient, or other professional judgments in any decision-making process. You assume full responsibility for the use of the information and rely on it at your own risk.
CDA-AMC does not endorse any information, drugs, therapies, treatments, products, processes, or services. The views and opinions of third parties published in this document do not necessarily reflect those of CDA-AMC. The copyright and other intellectual property rights in this document are owned by the Canadian Agency for Drugs and Technologies in Health (operating as CDA-AMC) and its licensors.
Questions or requests for information about this report can be directed to Requests@CDA-AMC.ca.