Drugs, Health Technologies, Health Systems
Reimbursement Review
Evolocumab (Repatha)
Requester: Amgen Canada Inc.
Therapeutic area: Primary hyperlipidemia
This multi-part report includes:
Clinical Review
Pharmacoeconomic Review
Clinical Review
Abbreviations
ACS
acute coronary syndrome
AE
adverse event
ApoB
apolipoprotein B
ASCVD
atherosclerotic cardiovascular disease
CCS
Canadian Cardiology Society
CDEC
Canadian Drug Expert Committee
CEC
clinical events committee
CI
confidence interval
CTT
Cholesterol Treatment Trialists
HDL-C
high-density-lipoprotein cholesterol
HeFH
heterozygous familial hypercholesterolemia
HR
hazard ratio
IQR
interquartile range
LDL-C
low-density-lipoprotein cholesterol
MI
myocardial infarction
NEC
not elsewhere classifiable
NSTE
non-ST-elevation
NSTEMI
non-ST-segment elevation myocardial infarction
OLE
open-label extension
PAD
peripheral artery disease
PCSK9
proprotein convertase subtilisin kexin type 9
Q1
first quartile
Q3
third quartile
SAE
serious adverse event
SD
standard deviation
STEMI
ST-segment elevation myocardial infarction
TEAE
treatment-emergent adverse event
Executive Summary
An overview of the submission details for the drug under review is provided in Table 1.
Table 1: Background Information of Application Submitted for Review
Item | Description |
|---|---|
Drug product | Evolocumab (Repatha)
|
Sponsor | Amgen Canada Inc. |
Indication | Evolocumab is indicated for the reduction of elevated LDL-C in adult patients with primary hyperlipidemia (including HeFH and ASCVD):
|
Reimbursement request | Patients with recent ACS, within the past 1 year, who have LDL-C ≥ 1.8 mmol/L despite taking moderate-to-high intensity statin therapy, with or without ezetimibe |
Health Canada approval status | NOC |
Health Canada review pathway | Standard |
NOC date | September 10, 2015 (initial approval) September 27, 2023 (latest revision) |
Recommended dose | The recommended dose for evolocumab is either 140 mg every 2 weeks or 420 mg once monthly; both doses are clinically equivalent. When switching dosage regimens, administer the first dose of the new regimen on the next scheduled date of the prior regimen. One prefilled syringea or prefilled autoinjector delivers the 140 mg every 2 week dose. One single-use automated mini-doser with a 3.5 mL prefilled cartridge delivers the 420 mg once monthly dose. Alternatively, 3 prefilled syringesa or 3 prefilled autoinjectors administered consecutively within 30 minutes delivers the 420 mg once monthly dose. |
ACS = acute coronary syndrome; ASCVD = atherosclerotic cardiovascular disease; HeFH = heterozygous familial hypercholesterolemia; LDL-C = low-density-lipoprotein cholesterol; NOC = Notice of Compliance.
aPrefilled syringe is not available in Canada.
Sources: Product monograph for evolocumab.1 Details included in the table are from the sponsor’s Summary of Clinical Evidence.2
Introduction
Hyperlipidemia refers to high levels of lipids in the blood, including cholesterol and triglycerides. High levels of cholesterol (also referred to as hypercholesterolemia),3 notably low-density-lipoprotein cholesterol (LDL-C), can cause atherosclerosis, defined as the buildup of fatty deposits in blood vessels leading to restriction in blood flow, which is a major cause of cardiovascular events, including heart attack, stroke, and lower-extremity and peripheral artery disease (PAD).4 Atherosclerotic cardiovascular disease (ASCVD), as defined in the 2021 Canadian Cardiovascular Society (CCS) Guidelines for the Management of Dyslipidemia for the Prevention of Cardiovascular Disease in Adults5 (hereafter referred to as the 2021 CCS dyslipidemia guidelines), comprises all clinical conditions of atherosclerotic origin, such as acute coronary syndrome (ACS), stroke, and PAD. After the first documented (index) case of ACS, a residual risk of a subsequent cardiovascular event remains.6 Secondary prevention refers to the treatment and management of known, clinically evident ASCVD and the prevention or delay of the onset of disease manifestations.5 The incidence rate for myocardial infarction (MI) was approximately 2.5 per 1,000 person-years from 2005 to 2016 in Ontario, whereas the incidence rate for unstable angina was 3.3 per 1,000 person-years in 2005 and 1.7 per 1,000 person-years in 2016.7 The 10-year prevalence rates for MI increased from 23.5 to 26.9 per 1,000 individuals and for unstable angina increased from 22.1 to 23.7 per 1,000 individuals between the periods of 2004 to 2013 and 2008 to 2017.7
ASCVD is a statin-indicated condition, according to the 2021 CCS dyslipidemia guidelines.5 For patients with ASCVD, the guidelines advise that proprotein convertase subtilisin kexin type 9 (PCSK9) inhibitors, with or without ezetimibe, be considered when the necessary reduction in LDL-C, apolipoprotein B (ApoB), or non–high-density-lipoprotein cholesterol (HDL-C) is substantial (i.e., LDL-C > 2.2 mmol/L or ApoB > 0.80 g/L or non-HDL-C > 2.9 mmol/L despite maximally tolerated statin dose) or for patients who have been shown to derive the largest benefit from the intensification of statin therapy with PCSK9 inhibitor therapy. This subset includes patients with recent ACS (i.e., occurring in the 52 weeks after hospitalization for the index ACS), as well as those with clinically evident ASCVD and any additional cardiovascular risk enhancers. If the necessary reduction in LDL-C, ApoB, or non-HDL-C is modest (i.e., LDL-C of 1.8 to 2.2 mmol/L or ApoB of 0.70 to 0.80 g/L or non-HDL-C 2.4 to 2.9 mmol/L despite maximally tolerated statin dose), then the guidelines advise that ezetimibe, with or without a PCSK9 inhibitor, be considered.5 According to the clinical experts consulted by Canada’s Drug Agency (CDA-AMC) for the purpose of this review, other lipid-lowering therapies, such as niacin, fibrates, bile acid sequestrants, mipomersen (not approved in Canada), and lomitapide (only used for homozygous familial hypercholesterolemia), are infrequently used in patients with ASCVD.
In 2016, evolocumab (Repatha) was first reviewed by the Canadian Drug Expert Committee (CDEC) for primary hyperlipidemia, including heterozygous familial hypercholesterolemia (HeFH) and clinical ASCVD. CDEC issued a recommendation that evolocumab be listed as an adjunct to diet and maximally tolerated statin therapy in adult patients with HeFH who require additional lowering of LDL-C if the prespecified clinical criteria and conditions are met. For the ASCVD component of the indication, CDEC issued a recommendation that evolocumab not be listed as an adjunct to diet and maximally tolerated statin therapy in adult patients with clinical ASCVD who require additional lowering of LDL-C.8 Detailed information on and reasons for the final recommendation made in 2016 by CDEC are publicly available on the CDA-AMC website.
In 2017, evolocumab was resubmitted and reviewed by CDEC for the ASCVD component of primary hyperlipidemia. CDEC issued a recommendation that evolocumab be reimbursed as an adjunct to diet and maximally tolerated statin therapy in adult patients for ASCVD who require additional lowering of LDL-C if the prespecified criterion and condition are met.9 However, funding is not yet in place, as negotiations concluded without an agreement in July 2019.10 Detailed information on the final recommendation made in 2017 by CDEC is publicly available on the CDA-AMC website.
The clinical experts indicated that most patients with ASCVD, who are therefore at high risk of cardiovascular events, are not meeting LDL-C (or non-HDL-C or ApoB) target levels with available treatment options. Moreover, the clinical experts indicated that nonadherence due to a real or perceived intolerance to high-intensity statins remains a challenge in clinical practice; they estimated 50% of patients discontinue their statin in the year after an ACS event. Thus, the unmet need identified by patients, clinician groups, and the clinical experts is for additional pharmacologic options that are effective in lowering LDL-C with minimal side effects in patients with primary hyperlipidemia (including ASCVD). More specifically, this unmet need is highlighted in patients who experienced recent ACS (in the previous year) and elevated LDL-C levels despite optimized statin therapy.
The objective of the present reassessment of evolocumab (ASCVD indication) is to review and critically appraise the new evidence submitted by the sponsor on the beneficial and harmful effects of evolocumab 140 mg/mL and 120 mg/mL subcutaneous injection in the treatment of primary hyperlipidemia, specifically in the requested reimbursement population of adult patients with ASCVD and recent ACS (in the previous year).
ACS comprises non-ST-segment elevation myocardial infarction (NSTEMI), ST-segment elevation myocardial infarction (STEMI), and unstable angina, with MI being the most common clinical presentation.11 The clinical experts were consulted on the definition of ACS in relation to clinical practice. Since the cardiac troponin assays evolved to become highly sensitive to micromolar elevated levels of circulating troponin, unstable angina has become an exceedingly infrequent diagnosis. Thus, only MI, including STEMI and NSTEMI, was considered relevant for the purpose of this review.
Patient, Clinician, and Drug Plan Perspectives
The information in this section is a summary of input provided by the patient and clinician groups who responded to CDA-AMC’s call for input and from clinical experts consulted for the purpose of this review.
Patient Input
No patient groups provided input on the present reassessment of evolocumab.
A summary of past patient input submitted by the Cardiac Health Foundation of Canada was prepared by the review team at CDA-AMC in the Clinical Review Report (Resubmission) on Evolocumab (Repatha) in December 2017, which is publicly available on the CDA-AMC website. The Cardiac Health Foundation of Canada is an organization that raises funds for and promotes programs and applied research on the rehabilitation and management of cardiovascular disease and provides education and resources on the prevention and management of cardiovascular disease in Canada. Patient input was gathered by the patient group through an online survey (N = 55) and 1 telephone interview; respondents were patients with atherosclerosis and their caregivers.
Among the survey respondents, experience with rosuvastatin, atorvastatin, ezetimibe, and bypass surgery were described with varying degrees of effectiveness. The survey respondents reported that the most common side effects associated with their current treatment were digestive-related, including gas, constipation, and upset stomach. According to the survey respondents, the most difficult-to-tolerate side effects associated with current medications were muscle pain, discomfort, and weakness.
The survey respondents identified the following unmet need: alternative treatment options to statins. More specifically, in the context of elevated cholesterol levels despite a maximally tolerated statin dose and adverse events (AEs) commonly associated with statin therapy (i.e., loss of muscle function and muscle weakness), patients expect evolocumab to lower cholesterol levels to target levels with minimal side effects. In particular, most patients indicated that a loss of muscle function is an AE they are not willing to tolerate.
Clinician Input
Input From Clinical Experts
The clinical experts indicated that most patients at high risk for cardiovascular events are not meeting LDL-C (or non–HDL-C or ApoB) target levels with available treatment options. Moreover, the clinical experts indicated that nonadherence due to a real or perceived intolerance to high-intensity statins, such as myalgias, is a challenge in clinical practice; they estimated that 50% of patients discontinue their statin in the year after an ACS event. The clinical experts further highlighted the lack of access to advanced therapies, including PCSK9 inhibitors, experienced by patients with ASCVD.
The clinical experts referenced the 2021 CCS dyslipidemia guidelines,5 which indicate that ezetimibe and PCSK9 inhibitors are second-line treatment options in the management of primary hyperlipidemia for secondary prevention. More specifically, the clinical experts indicated that ezetimibe and/or evolocumab would be used in addition to a maximally tolerated statin dose to meet LDL-C (or non-HDL-C or ApoB) target levels. For patients who are intolerant of or who have contraindications to statins, the clinical experts indicated that evolocumab would be an alternative therapy to statins, with or without ezetimibe.
The clinical experts referenced the 2021 CCS dyslipidemia guidelines5 to identify the patient population most in need of an intervention for the management of primary hyperlipidemia in secondary prevention, which is the subset of patients with ASCVD (at high cardiovascular risk) who have been shown to derive the largest benefit from the intensification of statin therapy with the addition of a PCSK9 inhibitor. This includes patients with recent ACS (occurring in the 52 weeks after hospitalization for the index ACS) and patients with additional cardiovascular risk enhancers.5 Additionally, the clinical experts indicated that all patients with ASCVD whose LDL-C (or non-HDL-C or ApoB) level remains above the threshold despite a maximally tolerated statin dose are suited for treatment with evolocumab.
The clinical experts indicated that although a specialist is not required to diagnose, treat, or monitor patients who receive evolocumab, administration should ideally be carried out in an outpatient clinic or hospital by a clinician who has experience with evolocumab. The clinical experts referenced the LDL-C, non-HDL-C, and ApoB thresholds in the 2021 CCS dyslipidemia guidelines5 as the treatment goal. According to the clinical experts, treatment response is based on the reduction in LDL-C (or non-HDL-C or ApoB) levels, assessed every 6 to 12 months in practice, depending on cardiovascular risk. When deciding to discontinue treatment with evolocumab, the clinicals experts would consider the side effects associated with treatment and competing risks from other diseases that limit life expectancy.
Clinician Group Input
A total of 9 clinician groups provided their input on the present reassessment of evolocumab: Canadian Dyslipidemia Guideline Committee; McMaster Lipid Clinic; British Columbia Lipid Specialists; Cambridge Cardiac Rehab Program; Western University, Division of Cardiology, Cardiac Rehabilitation and Secondary Prevention Program; University of British Columbia and Vancouver General Hospital and St. Paul’s Hospital Cardiac Intensive Care Unit; University of Toronto faculty and clinicians at St Michael’s Hospital; Division of Cardiology, University of Ottawa Heart Institute; and a group of primary care and specialist physicians who treat coronary artery disease and ACS across Canada.
The clinician groups identified the following limitations with currently available treatments (unmet needs) for patients with recent ACS: limited access to PCSK9 inhibitors due to cost, experience of side effects and/or intolerance to available drugs (which have an impact on adherence to treatment), and variable treatment response (e.g., treatment targets for LDL-C not met). The University of Ottawa Heart Institute highlighted that although the majority of patients with ASCVD experience a reduction in their LDL-C level to below 1.8 mmol/L with high-dose statin therapy, with or without ezetimibe, a subset of patients continues to have elevated lipid levels due to severe polygenic hypercholesterolemia and intolerance or contraindication to high-dose statin therapy. The clinician group further suggested that this subset of patients who are at high risk of recurrent cardiovascular events would benefit from additional lipid-lowering treatment in the form of a PCSK9 inhibitor.
The Canadian Dyslipidemia Guideline Committee, McMaster Lipid Clinic, and the group of primary care and specialist physicians across Canada referenced the 2021 CCS dyslipidemia guidelines5 to indicate that a PCSK9 inhibitor would be used as an add-on therapy after the initiation of maximally tolerated statin therapy, with or without ezetimibe, in patients with elevated LDL-C levels. More specifically, evolocumab would be used in the second line after a maximally tolerated statin dose or in the third line after statin and ezetimibe. The Canadian Dyslipidemia Guideline Committee also referenced the guidelines to identify candidates for evolocumab, comprising patients with either a recent ACS (i.e., occurring in the 52 weeks after hospitalization for the index ACS) or prior ASCVD with any of the following: diabetes or metabolic syndrome, polyvascular disease, symptomatic PAD, recurrent MI, MI in the previous 2 years, previous coronary artery bypass graft surgery, LDL-C level of 2.6 mmol/L or more, or HeFH. The clinician groups indicated that treatment response is assessed using the percent reduction in LDL-C (or non-HDL-C or ApoB) levels from pretreatment levels in practice.5
Drug Program Input
Input was obtained from the drug programs that participate in the CDA-AMC Reimbursement Review process. The following items were identified as key factors that could potentially impact the implementation of a recommendation for evolocumab:
relevant comparators
consideration for initiation of therapy
consideration for continuation or renewal of therapy
consideration for the prescribing of therapy
system and economic issues.
The clinical experts consulted by CDA-AMC provided advice on the potential implementation issues raised by the drug programs (Table 6).
Clinical Evidence
Systematic Review
Description of Studies
The FOURIER trial12 was a phase III, double-blind, placebo-controlled, randomized clinical trial (N = 27,564). The primary objective was to evaluate the effect of evolocumab, compared to placebo, on the risk of cardiovascular death, MI, stroke, hospitalization for unstable angina, or coronary revascularization, whichever occurs first, in patients with clinically evident ASCVD. The trial included patients with LDL-C of 1.8 mmol/L or more (or a non-HDL-C of 2.6 mmol/L or more) after at least 2 weeks of optimized statin therapy, with or without ezetimibe. Patients were randomized in a 1:1 ratio to receive either subcutaneous evolocumab (140 mg once every 2 weeks or 420 mg once every month, per patient preference) or matching placebo injection. Randomization was stratified by the final screening LDL-C level and by geographical region. Treatment continued until a minimum of 1,630 patients experienced an event, adjudicated by an independent, external clinical events committee (CEC) as qualifying for a key secondary end point event of cardiovascular death, MI, or stroke. The estimated study duration was 56 months from the date the first patient was randomized.
The Gencer et al.13 and Sabatine et al. (2018)14 studies were subgroup analyses of the FOURIER trial. The objective of the Gencer et al. study was to evaluate the risks of major adverse cardiovascular events as a function of time from the date of the qualifying MI and to evaluate the effect of evolocumab on cardiovascular outcomes in patients who experienced a recent MI (in the previous year). The objective of the Sabatine et al. (2018) study was to assess the efficacy of evolocumab in 3 subgroups in the FOURIER trial: timing from the most recent MI, number of prior MIs, and the presence of residual multivessel coronary artery disease. The subgroup of patients who experienced an MI in the previous year from the Gencer et al. study and the subgroup of patients who experienced an MI in the previous 2 years in the Sabatine et al. (2018) study were considered to be most relevant for the purpose of this review. Outcomes of clinical events (cardiovascular death, MI, stroke, hospitalization for unstable angina, or coronary revascularization) were assessed after a median follow-up of 26 months, and LDL-C (LDL-C < 1.8 mmol/L and change from baseline) was assessed at weeks 4 and 48.
In the Gencer et al. study, 2,821 patients were randomized to receive evolocumab and 2,890 patients were randomized to receive placebo in the subgroup of patients who experienced a recent MI (in the previous year). The mean age of patients was 59.7 years (standard deviation [SD] = 9.3 years) in the evolocumab group and 59.5 years (SD = 9.2 years) in the placebo group. The mean time from MI to enrolment was 5.379 months (SD = 2.965 months) in the evolocumab group and 5.355 months (SD = 2.911 months) in the placebo group. Almost all patients — 99.8% (n = 2,814) of the evolocumab group and 99.8% (n = 2,884) of the placebo group) — had at least 1 major cardiovascular risk factor or at least 2 minor cardiovascular risk factors. At baseline, the mean LDL-C was 2.453 mmol/L (SD = 0.647 mmol/L) in the evolocumab group and 2.467 mmol/L (SD = 0.647 mmol/L) in the placebo group. Almost all patients — 99.9% (n = 2,819) of the evolocumab group and 100.0% (n = 2,889) of the placebo group — were taking a statin at baseline. A total of 3.2% (n = 91) of patients in the evolocumab group and 3.3% (n = 95) of patients in the placebo group were taking ezetimibe at baseline.
In general, the baseline characteristics of patients who experienced an MI in the previous 2 years in the Sabatine et al. (2018) study were similar to the baseline characteristics of patients who experienced a recent MI (in the previous year) in the Gencer et al. study. In the Sabatine et al. (2018) study, 4,109 patients were randomized to receive evolocumab and 4,293 patients were randomized to receive placebo in the subgroup of patients who experienced an MI in the previous 2 years. The mean time from MI to enrolment was 9.191 months (SD = 6.441 months) in the evolocumab group and 9.366 months (SD = 6.544 months) in the placebo group.
Efficacy Results
Summaries of the key efficacy results from the Gencer et al. and Sabatine et al. (2018) studies are presented in Table 2 and Table 3, respectively.
Cardiovascular Death, MI, or Stroke15
Of the patients who experienced an MI in the previous year in the Gencer et al. study, the composite end point of cardiovascular death, MI, and stroke was met by 6.45% (n = 182) of patients taking evolocumab versus 8.58% (n = 248) of patients taking placebo (hazard ratio [HR] = 0.75; 95% confidence interval [CI], 0.62 to 0.91). Of the patients who were 1 year or more beyond their MI, this composite end point was met by 6.04% (n = 502) of patients taking evolocumab versus 7.04% (n = 584) of patients taking placebo (HR = 0.85; 95% CI, 0.76 to 0.96).
Of the patients who experienced an MI in the previous 2 years in the Sabatine et al. (2018) study, this composite end point was met by 6.45% (n = 265) of patients taking evolocumab versus 8.43% (n = 362) of patients taking placebo (HR = 0.76; 95% CI, 0.64 to 0.89). Of the patients who were 2 years or more beyond their MI, this composite end point was met by 5.97% (n = 419) of patients taking evolocumab versus 6.81% (n = 470) of patients taking placebo (HR = 0.87; 95% CI, 0.76 to 0.99). The absolute risk reduction was 2.9% (95% CI, 1.2% to 4.5%) in patients who experienced an MI in the previous 2 years and 1.0% (95% CI, –0.7% to 2.7%) in patients who were 2 years or more beyond their MI.14
Table 2: Summary of Key Efficacy Results From the Gencer et al. Study (Full Analysis Set)
Efficacy end point | Subgroup by timing of prior MI in the FOURIER trial | |||
|---|---|---|---|---|
Prior MI < 1 year | Prior MI ≥ 1 year | |||
Evolocumab (N = 2,821) | Placebo (N = 2,890) | Evolocumab (N = 8,308) | Placebo (N = 8,301) | |
Clinical event outcomes | ||||
Cardiovascular death, MI, or stroke | ||||
Number of patients with event, n (%) | 182 (6.45) | 248 (8.58) | 502 (6.04) | 584 (7.04) |
Hazard ratio (95% CI)a | 0.75 (0.62 to 0.91) | 0.85 (0.76 to 0.96) | ||
Nominal P value | 0.0028 | 0.0091 | ||
Interaction P valueb | 0.244 | |||
KM estimate at 36 months, % (95% CI) | 7.71 | 10.87 | 8.24 | 9.51 |
Absolute risk reduction, % (95% CI) | 3.16 (1.17 to 5.16) | 1.27 (–0.15 to 2.69) | ||
Cardiovascular death | ||||
Number of patients with event, n (%) | 50 (1.77) | 52 (1.80) | 156 (1.88) | 136 (1.64) |
Hazard ratio (95% CI)a | 1.00 (0.68 to 1.47) | 1.15 (0.91 to 1.44) | ||
Nominal P value | 0.9874 | 0.2426 | ||
Interaction P valueb | 0.5287 | |||
KM estimate at 36 months, % (95% CI) | 2.31 (1.56 to 3.06) | 2.50 (1.61 to 3.38) | 2.52 (2.02 to 3.02) | 2.20 (1.71 to 2.69) |
Absolute risk reduction, % (95% CI) | 0.19 (–0.97 to 1.34) | –0.32 (–1.02 to 0.38) | ||
MI (fatal or nonfatal) | ||||
Number of patients with event, n (%) | 127 (4.50) | 191 (6.61) | 296 (3.56) | 379 (4.57) |
Hazard ratio (95% CI)a | 0.67 (0.54 to 0.84) | 0.78 (0.67 to 0.91) | ||
Nominal P value | 0.0006 | 0.0011 | ||
Interaction P valueb | 0.2992 | |||
KM estimate at 36 months, % (95% CI) | 5.24 (4.26 to 6.21) | 8.04 (6.76 to 9.31) | 4.76 (3.95 to 5.56) | 6.37 (5.53 to 7.20) |
Absolute risk reduction, % (95% CI) | 2.80 (1.20 to 4.40) | 1.61 (0.46 to 2.77) | ||
Stroke (fatal or nonfatal) | ||||
Number of patients with event, n (%) | 30 (1.06) | 38 (1.31) | 110 (1.32) | 137 (1.65) |
Hazard ratio (95% CI)a | 0.81 (0.50 to 1.31) | 0.80 (0.62 to 1.03) | ||
Nominal P value | 0.3869 | 0.0799 | ||
Interaction P valueb | 0.9409 | |||
KM estimate at 36 months, % (95% CI) | 1.34 (0.80 to 1.88) | 1.88 (1.14 to 2.61) | 1.96 (1.39 to 2.52) | 2.15 (1.73 to 2.56) |
Absolute risk reduction, % (95% CI) | 0.54 (–0.37 to 1.45) | 0.19 (–0.51 to 0.89) | ||
Cardiovascular death, MI, hospitalization of unstable angina, stroke, or coronary revascularization | ||||
Number of patients with event, n (%) | 323 (11.45) | 408 (14.12) | 851 (10.24) | 921 (11.10) |
Hazard ratio (95% CI)a | 0.81 (0.70 to 0.93) | 0.92 (0.84 to 1.01) | ||
Nominal P value | 0.0039 | 0.0748 | ||
Interaction P valueb | 0.1277 | |||
KM estimate at 36 months, % (95% CI) | 13.49 | 17.19 | 13.33 | 14.38 |
Absolute risk reduction, % (95% CI) | 3.70 (1.29 to 6.10) | 1.05 (–0.58 to 2.69) | ||
Lipid parameter outcomes | ||||
Change from baseline in LDL-C | ||||
N | 2,821 | 2,889 | 8,308 | 8,301 |
Mean LDL-C at baseline, mmol/L (SD)c | 2.453 (0.647) | 2.467 (0.647) | 2.563 (0.784) | 2.545 (0.711) |
N | 2,585 | 2,639 | 7,657 | 7,610 |
Mean LDL-C at week 48, mmol/L (SD)c | 0.979 (0.781) | 2.477 (0.843) | 1.020 (0.897) | 2.480 (0.843) |
Mean percent change from baseline in LDL-C at week 48, % (SD)c | –59.90 (30.12) | 2.00 (27.41) | –60.60 (30.53) | –0.98 (25.70) |
CI = confidence interval; IQR = interquartile range; KM = Kaplan-Meier; LDL-C = low-density-lipoprotein cholesterol; MI = myocardial infarction; SD = standard deviation.
Notes: For patients in the subgroup who experienced an MI in the year before randomization, those whose most recent MI or stroke was in the 4 weeks before randomization were excluded from the FOURIER trial.
The median length of follow-up was 25.99 months (IQR, 21.72 to 30.42 months). Events occurring between the patient randomization date and the patient last confirmed survival status date, inclusive, were included. The censoring date of patients without an event was the patient last nonfatal potential end point collection date.
Multiplicity was not taken into account in subgroup analyses.
Time to hospitalization for unstable angina was not a prespecified end point in the FOURIER trial; an ad hoc analysis was performed to ensure that results were provided for each individual component of the primary end point.
aBased on a Cox model stratified by the randomization stratification factors collected with the Interactive Voice Response System.
bBased on a Cox model, adding subgroup and subgroup-by-treatment interaction.
cSummary statistics were based on observed data. When the calculated LDL-C was less than 40 mg/dL or triglycerides were greater than 400 mg/dL, the calculated LDL-C was replaced with ultracentrifugation LDL-C, if available.
Sources: Additional information received from the sponsor on December 21, 2023,15 and January 30, 2024.16 Details included in the table are from the sponsor’s Summary of Clinical Evidence.2
Table 3: Summary of Key Efficacy Results From the Sabatine et al. (2018) Study (Full Analysis Set)
Efficacy end point | Subgroup by timing of prior MI in the FOURIER trial | |||
|---|---|---|---|---|
Prior MI < 2 years | Prior MI ≥ 2 years | |||
Evolocumab (N = 4,109) | Placebo (N = 4,293) | Evolocumab (N = 7,020) | Placebo (N = 6,898) | |
Clinical event outcomes | ||||
Cardiovascular death, MI, or stroke | ||||
Number of patients with event, n (%) | 265 (6.45) | 362 (8.43) | 419 (5.97) | 470 (6.81) |
Hazard ratio (95% CI)a | 0.76 (0.64 to 0.89) | 0.87 (0.76 to 0.99) | ||
Nominal P value | 0.0005 | 0.0402 | ||
Interaction P valueb | 0.1762 | |||
KM estimate at 36 months, % (95% CI) | 7.91 | 10.76 | 8.30 | 9.29 |
Cardiovascular death, MI, hospitalization of unstable angina, stroke, or coronary revascularization | ||||
Number of patients with event, n (%) | 459 (11.17) | 589 (13.72) | 715 (10.19) | 740 (10.73) |
Hazard ratio (95% CI)a | 0.80 (0.71 to 0.91) | 0.95 (0.85 to 1.05) | ||
Nominal P value | 0.0004 | 0.2972 | ||
Interaction P valueb | 0.043 | |||
KM estimate at 36 months, % (95% CI) | 13.50 | 16.86 | 13.28 | 14.05 |
Lipid parameter outcomes | ||||
Change from baseline in LDL-C | ||||
N | 4,109 | 4,292 | 7,020 | 6,898 |
Mean LDL-C at baseline, mmol/L (SD)c | 2.476 (0.670) | 2.472 (0.639) | 2.570 (0.796) | 2.557 (0.727) |
N | 3,766 | 3,927 | 6,476 | 6,322 |
Mean LDL-C at week 48, mmol/L (SD)c | 0.994 (0.811) | 2.468 (0.822) | 1.019 (0.901) | 2.486 (0.856) |
Mean percent change from baseline in LDL-C at week 48, % (SD)c | –59.61 (31.05) | 1.28 (26.73) | –60.90 (30.05) | –1.14 (25.79) |
CI = confidence interval; IQR = interquartile range; KM = Kaplan-Meier; LDL-C = low-density lipoprotein cholesterol; MI = myocardial infarction; SD = standard deviation.
Notes: For patients in the subgroup who experienced an MI in the 2 years before randomization, those whose most recent MI or stroke was in the 4 weeks before randomization were excluded from the FOURIER trial.
The median length of follow-up was 25.99 months (IQR, 21.72 to 30.42 months). Events occurring between patient randomization date and the patient last confirmed survival status date, inclusive, were included. The censoring date of the patients without an event was the patient last nonfatal potential end point collection date.
Multiplicity was not taken into account in subgroup analyses.
aBased on a Cox model stratified by the randomization stratification factors collected with the Interactive Voice Response System.
bBased on a Cox model, adding subgroup and subgroup-by-treatment interaction.
cSummary statistics were based on observed data. When the calculated LDL-C was less than 40 mg/dL or triglycerides were greater than 400 mg/dL, the calculated LDL-C was replaced with ultracentrifugation LDL-C, if available.
Sources: Additional information received from the sponsor on December 21, 2023,15 and on January 30, 2024.16 Details included in the table are from the sponsor’s Summary of Clinical Evidence.2
Cardiovascular Death15
Of the patients who experienced an MI in the previous year, the end point of cardiovascular death was met by 1.77% (n = 50) of patients taking evolocumab versus 1.80% (n = 52) of patients taking placebo (HR = 1.00; 95% CI, 0.68 to 1.47). Of the patients who were 1 year or more beyond their MI, the end point was experienced by 1.88% (n = 156) of patients taking evolocumab versus 1.64% (n = 136) of patients taking placebo (HR = 1.15; 95% CI, 0.91 to 1.44).
This mortality end point was not assessed in the subgroup of patients who experienced an MI in the previous 2 years or in the subgroup of patients who were 2 years or more beyond their MI.
MI (Fatal or Nonfatal)15
Of the patients who experienced an MI in the previous year, the cardiovascular end point of MI (fatal or nonfatal) was met by 4.50% (n = 127) of patients taking evolocumab versus 6.61% (n = 191) of patients taking placebo (HR = 0.67; 95% CI, 0.54 to 0.84). Of the patients who were 1 year or more beyond their MI, this cardiovascular end point was met by 3.56% (n = 296) of patients taking evolocumab versus 4.57% (n = 379) of patients taking placebo (HR = 0.78; 95% CI, 0.67 to 0.91).
This cardiovascular end point was not assessed in the subgroup of patients who experienced an MI in the previous 2 years or in those who were 2 years or more beyond their MI.
Stroke (Fatal or Nonfatal)15
Of the patients who experienced an MI in the previous year, the cerebrovascular end point of stroke (fatal or nonfatal) was met by 1.06% (n = 30) of patients taking evolocumab versus 1.31% (n = 38) of patients taking placebo (HR = 0.81; 95% CI, 0.50 to 1.31). Of the patients who were 1 year or more beyond their MI, this cerebrovascular end point was met by 1.32% (n = 110) of patients taking evolocumab versus 1.65% (n = 137) of patients taking placebo (HR = 0.80; 95% CI, 0.62 to 1.03).
This cerebrovascular end point was not assessed in patients in the subgroup of patients who experienced an MI in the previous 2 years or in those who were 2 years or more beyond their MI.
Cardiovascular Death, MI, Hospitalization for Unstable Angina, Stroke, or Coronary Revascularization15
Of the patients who experienced an MI in the previous year, the composite end point of cardiovascular death, myocardial infarction, hospitalization for unstable angina, stroke, and coronary revascularization was met by 11.45% (n = 323) of patients taking evolocumab versus 14.12% (n = 408) of patients taking placebo (HR = 0.81; 95% CI, 0.70 to 0.93). Of the patients who were 1 year or more beyond their MI, this composite end point was met by 10.24% (n = 851) of patients taking evolocumab versus 11.10% (n = 921) of patients taking placebo (HR = 0.92; 95% CI, 0.84 to 1.01).
Of the patients who experienced an MI in the previous 2 years, this composite end point was met by 11.17% (n = 459) of patients taking evolocumab versus 13.72% (n = 589) of patients taking placebo (HR = 0.80; 95% CI, 0.71 to 0.91). Of the patients who were 2 years or more beyond their MI, this composite end point was met by 10.19% (n = 715) of patients taking evolocumab versus 10.73% (n = 740) of patients taking placebo (HR = 0.95; 95% CI, 0.85 to 1.05). The absolute risk reduction was 3.4% (95% CI, 1.4% to 5.3%) in patients who experienced an MI in the previous 2 years and 0.8% (95% CI, –1.1% to 2.7%) in patients who were 2 years or more beyond their MI.14
Change From Baseline in LDL-C16
Of the patients who experienced an MI in the previous year, the mean LDL-C was 2.453 mmol/L (SD = 0.647 mmol/L) in the evolocumab group and 2.467 mmol/L (SD = 0.647 mmol/L) in the placebo group at baseline. For patients who experienced an MI in the previous year, the mean percent change from baseline in LDL-C was –59.90% (SD = 30.12%) in the evolocumab group and 2.00% (SD = 27.41%) in the placebo group at week 48. Of the patients who were 1 year or more beyond their MI, the mean LDL-C was 2.563 mmol/L (SD = 0.784 mmol/L) in the evolocumab group and 2.545 mmol/L (SD = 0.711 mmol/L) in the placebo group at baseline. For patients who were 1 year or more beyond their MI, the mean percent change from baseline in LDL-C was –60.60% (SD = 30.53%) in the evolocumab group and –0.98% (SD = 25.70%) in the placebo group at week 48.
Of the patients who experienced an MI in the previous 2 years, the mean LDL-C level was 2.476 mmol/L (SD = 0.670 mmol/L) in the evolocumab group and 2.472 mmol/L (SD = 0.639 mmol/L) in the placebo group at baseline. For patients who experienced an MI in the previous 2 years, the mean percent change from baseline in LDL-C was –59.61% (SD = 31.05%) in the evolocumab group and 1.28% (SD = 26.73%) in the placebo group at week 48. For patients who were 2 years or more beyond their MI, the mean LDL-C was 2.570 mmol/L (SD = 0.796 mmol/L) in the evolocumab group and 2.557 mmol/L (SD = 0.727 mmol/L) in the placebo group at baseline. For patients who were2 years or more beyond their MI, the mean percent change from baseline in LDL-C was –60.90% (SD = 30.05%) in the evolocumab group and –1.14% (SD = 25.79%) in the placebo group at week 48.
Harms Results
Safety outcomes were not assessed by subgroups. A summary of harms results from the FOURIER trial is presented in Table 4.
Table 4: Summary of Harms Results From the FOURIER Trial (Safety Analysis Set)
Adverse events | Evolocumab (N = 13,769) | Placebo (N = 13,756) |
|---|---|---|
Treatment-emergent adverse events, n (%) | ||
Patients with ≥ 1 TEAE | 10,664 (77.4) | 10,644 (77.4) |
Patients with ≥ 1 SAE | 3,410 (24.8) | 3,404 (24.7) |
Patients who stopped treatment due to any TEAE | 608 (4.4) | 573 (4.2) |
Treatment-emergent adverse events of special interest, n (%)a | ||
Potential hypersensitivity events (narrow SMQ)b | 653 (4.7) | 574 (4.2) |
Potential hypersensitivity events (broad SMQ) | 1,043 (7.6) | 964 (7.0) |
Potential injection-site reaction events (narrow AMQ)c | 267 (1.9) | 207 (1.5) |
Potential injection-site reaction events (broad AMQ) | 280 (2.0) | 213 (1.5) |
Potential muscle events (narrow SMQ)d | 13 (< 0.1) | 15 (0.1) |
Potential muscle events (broad SMQ) | 1,381 (10.0) | 1,344 (9.8) |
Potential neurocognitive events (HLGT)e | 217 (1.6) | 202 (1.5) |
Potential demyelination events (broad SMQ) and peripheral neuropathy (narrow SMQ)f | 102 (0.7) | 143 (1.0) |
Potential hepatitis C infection (narrow SMQ)g | 9 (< 0.1) | 4 (< 0.1) |
Potential hepatitis C infection (broad SMQ) | 344 (2.5) | 316 (2.3) |
Transaminase elevations and potential hepatic disorders (narrow SMQ)h | 407 (3.0) | 370 (2.7) |
Transaminase elevations and potential hepatic disorders (broad SMQ) | 433 (3.1) | 384 (2.8) |
AMQ = Amgen MedDRA query; HLGT = high-level group term; SAE = serious adverse event; SMQ = standard MedDRA query; TEAE = treatment-emergent adverse event.
Notes: TEAEs are presented by preferred terms and coded by Medical Dictionary for Regulatory Activities (MeDRA) Version 9.1.
Deaths by any cause were adjudicated efficacy end points in the FOURIER trial. SAEs that did not meet the criteria of adjudicated end points and were subsequently reported as AEs, but later resulted in death, are included in the SAE section.
Standardized MedDRA Queries are validated, standard sets of MedDRA terms used to support signal detection and monitoring and represent a variety of safety topics of regulatory interest. Standardized MedDRA Queries include narrow and/or broad terms; narrow terms are highly likely to represent the condition of interest.17
aThese search strategies, SMQs and AMQs, were used to retrieve AEs potentially related to the condition under review when heterogenous medical presentations may be expected.
bTEAEs reported in more than 0.2% of patients in any treatment group by high-level term using a narrow search strategy for potential hypersensitivity events include dermatitis and eczema; rash, eruptions, and exanthemas; nasal congestion and inflammations; urticarias; and allergic conditions not elsewhere classifiable (NEC).
cTEAEs reported in more than 0.1% of patients in any treatment group by preferred term using a narrow search strategy for potential injection-site reaction events include injection-site pain, bruising, hematoma, erythema, and hemorrhage.
dTEAEs using a narrow search strategy for potential muscle events include rhabdomyolysis, myopathy, and a myoglobin blood increase.
eTEAEs by high-level group term for potential neurocognitive events include cognitive and attention disorders and disturbances, deliria (including confusion), dementia and amnestic conditions, disturbances in thinking and perception, and mental impairment disorders.
fTEAEs reported in 1 or more patients in any treatment group by high-level term using broad and narrow search strategies for potential demyelination events and peripheral neuropathy events, respectively, include peripheral neuropathies NEC, sensory abnormalities NEC, trigeminal disorders, acute and progressive multiple sclerosis, plasma cell neoplasms NEC, acute polyneuropathies, spinal cord and nerve root disorders NEC, chronic polyneuropathies, and optic nerve disorders NEC.
gTEAEs by preferred term using a narrow search strategy for potential hepatitis C infection include hepatitis C, chronic hepatitis, and a positive hepatitis C virus test.
hTEAEs reported in 0.1% or more of patients in any treatment group by high-level term using a narrow search strategy for potential transaminase elevations and hepatic disorders include liver function analyses, hepatocellular damage and hepatitis NEC, hepatic and hepatobiliary disorders NEC, and coagulation and bleeding analyses.
Sources: Clinical Study Report of the FOURIER trial.12 Details included in the table are from the sponsor’s Summary of Clinical Evidence.2
Treatment-Emergent Adverse Events
The proportion of patients with at least 1 treatment-emergent adverse event (TEAE) or at least 1 serious adverse event (SAE) was similar in the treatment groups. A total of 10,664 patients (77.4%) in the evolocumab group and 10,644 patients (77.4%) in the placebo group reported at least 1 TEAE, with the most common TEAE being diabetes mellitus, which was reported in 1,207 patients (8.8%) and 1,130 patients (8.2%), respectively. A total of 3,410 patients (24.8%) in the evolocumab group and 3,404 patients (24.7%) in the placebo group reported at least 1 SAE, with the most common SAE being unstable angina, which was reported in 233 patients (1.7%) and 278 (2.0%), respectively.
The proportion of patients who stopped treatment due to any TEAE was similar in the treatment groups. A total of 608 patients (4.4%) in the evolocumab group and 573 patients (4.2%) in the placebo group stopped treatment due to any TEAE, with the most common TEAE being myalgia, which was reported in 37 patients (0.3%) and 46 patients (0.3%), respectively.
TEAEs of Special Interest
The proportion of patients with TEAEs of special interest, including potential hypersensitivity, injection-site reaction, muscle events, neurocognitive events, demyelination events and peripheral neuropathy, hepatitis C infection, and transaminase elevations and hepatic disorder events, was similar in the treatment groups. A total of 13 patients (< 0.1%) in the evolocumab group and 15 patients (0.1%) in the placebo group had a potential muscle-related AE (according to a narrow search strategy that included rhabdomyolysis, myopathy, and a myoglobin blood increase). A total of 1,381 patients (10.0%) in the evolocumab group and 1,344 patients (9.8%) in the placebo group had a potential muscle-related AE (according to a broader search strategy).
Critical Appraisal
Internal Validity
The Gencer et al.13 and Sabatine et al. (2018)14 studies were based on subgroup analyses of the FOURIER trial.12 The subgroup analyses were based on the statistical methods from the FOURIER trial and the subgroups by timing of prior MI were prespecified; however, there was no clear hypothesis stated a priori. The P values on the test for interaction term (in general, greater than 0.05, with the exception of the primary end point in the subgroup analysis by timing of prior MI [< 2 years versus ≥ 2 years]) strongly suggest that chance cannot be excluded as a likely explanation for the differential subgroup effect. There is a lack of evidence from randomized controlled trials and large observational studies to support consistent and similar findings from the subgroup analyses. Nonetheless, the subgroup analyses results were generally consistent with the overall FOURIER trial results, with the exception of stroke, for which the HR was 0.79 (95% CI, 0.66 to 0.95);12 the corresponding subgroup analysis results included null values.
Sample-size calculation was based on the key secondary end point of the full analysis set in the FOURIER trial, but not in the subgroup analyses. Consequently, there is an increased likelihood of producing unreliable or inaccurate results and, in particular, on cardiovascular death and stroke, components of the composite end points for which the 95% CI results included null values. Nonetheless, the sample size of subgroups was considered relatively large. Multiplicity was not accounted for in the subgroup analyses; therefore, the interpretation of the subgroup analysis results is subject to an increased likelihood of type I error.
In consideration of the aforementioned conditions, which can lower the credibility and reliability of the subgroup analysis results, the available evidence should not be viewed as conclusive; however, it may be interpreted as likely indicative of a possible subgroup effect.
External Validity
Because the sponsor’s reimbursement request focused on patients with recent ACS (in the previous year), the clinical experts were consulted on the patient population included in the subgroup analyses, which did not include patients with unstable angina and recent (in the previous 4 weeks) MI or stroke. Although evidence from these patients is lacking, overall, no key concerns were identified for the generalizability of the subgroup analysis results to the patient population in the reimbursement request.
Of note, the estimated study duration was 56 months from the date the first patient was randomized; however, the median follow-up was 26 months. In the previous review of the FOURIER trial by CDA-AMC, the length of follow-up was deemed likely too short to assess the long-term harms associated with the use of evolocumab.18
Long-Term Extension Studies
Description of Studies
Patients who completed the FOURIER trial had the option to enrol in 1 of the two 5-year extension studies (one study was conducted in North America and Eastern Europe and the other study was conducted in Western Europe) with open-label evolocumab (N = 5,305 and N = 1,600, respectively).19,20 The primary objective of both studies was to describe the safety and tolerability of the long-term administration of evolocumab. An ad hoc subgroup analysis of the open-label extension (OLE) studies was also conducted in the subset of patients who experienced an MI before or during the parent trial. Comparisons were made between patients randomized to receive evolocumab versus placebo in the parent trial. All results reported herein are the integrated data from the 2 OLE studies.
The mean age of patients in the MI subgroup was 62.2 years (SD = 8.7 years) in the evolocumab group and 62.0 years (SD = 8.6 years) in the placebo group. Most of the participants were male in this subgroup (79.3% in the evolocumab group and 78.8% in the placebo group, respectively). At baseline, the mean LDL-C in the MI subgroup was 2.5 mmol/L (SD = 0.7 mmol/L) in both the evolocumab and placebo groups. These characteristics were similar in the overall FOURIER-OLE study population as well. Time since the most recent MI in the MI subgroup was 8.070 years (SD = 6.137 years) in the evolocumab group and 7.835 years (SD = 5.905 years) in the placebo group.
In the overall FOURIER-OLE study population, the mean time from MI to enrolment was 69.606 months (SD = 74.237 months) in the evolocumab group and 68.531 months (SD = 71.613 months) in the placebo group. Most of the participants were white (93.4% in the evolocumab group and 94.5% in the placebo group). Major and minor cardiovascular risk factors, as well as risk factor counts, were similar in the evolocumab and placebo groups in the overall OLE population. These baseline characteristics were not available for the MI subgroup population.
Efficacy Results
Change From Baseline in LDL-C
Among patients in the FOURIER-OLE studies, the median baseline reflexive LDL-C in the parent trial was 2.36 mmol/L (first quartile [Q1] and third quartile [Q3] = 2.06 mmol/L and 2.80 mmol/L, respectively); the baseline LDL-C level was similar for patients in the 2 randomized treatment groups from the parent trial.21,22 The observed mean percent reduction from baseline in LDL-C ranged from 53.4% to 67.2% during the 260-week OLE study period.21
In the subset of patients (n = 5,582) who experienced an MI before and/or during the parent FOURIER trial, the mean baseline LDL-C was 2.52 mmol/L (SD = 0.695 mmol/L), which was similar in patients randomized to receive evolocumab and those randomized to receive placebo in the parent trial.23 The mean LDL-C during the 260-week OLE study period in the MI subgroup of patients was 1.061 mmol/L (SD = 0.924 mmol/L). The mean percent reduction from baseline in LDL-C was approximately 57.7% at week 260 and was similar in patients who received evolocumab and those who received placebo in the parent trial.23
Time to Major Cardiovascular Events
During the OLE study period, 490 patients (14.6%) originally randomized to the evolocumab group in the parent study met the FOURIER primary outcome of cardiovascular death, MI, stroke, hospitalization for unstable angina, or coronary revascularization, compared to 551 patients (16.8%) originally randomized to the placebo group (HR = 0.85; 95% CI, 0.75 to 0.96). The HR for the key secondary composite outcome of cardiovascular death, MI, and stroke was 0.80 (95% CI, 0.68 to 0.93). Of note, the HR for the individual component of cardiovascular death was 0.77 (95% CI, 0.60 to 0.99).21
Among patients who had an MI before and/or during the parent FOURIER trial, 406 patients (14.42%) who were randomized to receive evolocumab in the parent trial met the FOURIER primary outcome of cardiovascular death, MI, stroke, hospitalization for unstable angina, or coronary revascularization, compared with 478 patients (17.28%) who were randomized to receive placebo (HR = 0.81; 95% CI, 0.71 to 0.93). The HR for the key secondary composite outcome of cardiovascular death, MI, and stroke was 0.77 (95% CI, 0.65 to 0.90); of note, the HR for the individual component of cardiovascular death was 0.68 (95% CI, 0.51 to 0.91). Event probabilities and, consequently, the difference in event probabilities between treatment groups from the parent trial were not available for the MI subgroup analysis.
Harms Results
In the integrated OLE safety analysis set, 2,894 patients (86.3%) randomized to evolocumab in the parent study and 2,830 patients (86.4%) randomized to placebo experienced at least 1 AE during the OLE studies. The most frequently reported AE was hypertension (15% of evolocumab-treated patients and 14.6% of placebo-treated patients). Other AEs reported by at least 5% of patients in either parent study treatment group include nasopharyngitis, bronchitis, arthralgia, diabetes mellitus, atrial fibrillation, back pain, upper respiratory tract infection, angina pectoris, and pneumonia.
Approximately 43% of patients experienced at least 1 SAE during the OLE studies (43.4% in patients randomized to evolocumab in the parent study and 42.7% in patients randomized to placebo). Acute MI, angina pectoris, pneumonia, atrial fibrillation, and cardiac failure were among the SAEs reported most frequently (in 2% to 3% of patients).24
Overall, approximately 8% of patients experienced an AE leading to the discontinuation of evolocumab during the OLE study (7.7% of patients who received evolocumab in the parent study and 8.0% of patients who received placebo in the parent study). The most frequently reported AEs leading to the discontinuation of evolocumab in the OLE studies were in the system organ class of neoplasms, benign, malignant and unspecified (including cysts and polyps) (2.0% to 2.1% of patients), followed by cardiac disorders (1.5% to 2.1% of patients). None of the reported AEs leading to discontinuation were reported in more than 1% of patients. The most commonly reported fatal AEs were in 3 system organ classes: cardiac disorders; neoplasms benign, malignant and unspecified (including cysts and polyps); and infections and infestations.24
Notable harms reported by at least 1% of patients in any treatment group in the OLE safety analysis set included potential injection-site reaction events, potential demyelination events (peripheral neuropathy, sensory abnormalities not elsewhere classifiable [NEC], and chronic polyneuropathies), and transaminase elevations and potential hepatic disorders (liver function analyses, hepatocellular damage, and hepatitis NEC). The numbers were similar in the evolocumab and placebo groups.
The safety profile of evolocumab in the MI subgroup was similar to that seen in the overall study population.
Critical Appraisal
Internal Validity
An open-label study design can influence the perception of improvement and/or harms by patients and clinicians, particularly for outcomes that are subjective in measurement and interpretation. However, because all fatal or nonfatal cardiovascular events or deaths were adjudicated by an external independent CEC, the assessment of the primary and key secondary end points in the FOURIER-OLE studies were not likely to have been affected by the open-label design.
Because the descriptive analyses used in the OLE studies and the ad hoc subgroup analysis of patients who experienced a prior MI, the available evidence should only be considered suggestive of a potential treatment effect, subject to uncertainty associated with the exploratory nature of the analyses.
External Validity
The baseline characteristics of all patients enrolled in the FOURIER-OLE studies were similar to those in the randomized treatment groups from the parent FOURIER trial. Although most patients were from study sites located in Europe (> 66%), the demographics of that population were generally similar to those in the patient population in Canada. In general, the baseline characteristics of patients in the MI subgroup were similar to those in the overall OLE patient population.
Because the sponsor’s reimbursement request is focused on the patient population with recent ACS (in the previous year), it should be noted that the MI subgroup included patients who had an MI before and/or during the parent FOURIER trial. The mean time from the most recent MI to enrolment in the overall OLE patient population was 69.606 months (SD = 74.237 months) in patients randomized to evolocumab in the parent trial and 68.531 months (SD = 71.613 months) in patients randomized to placebo in the parent trial. In the subset of patients who experienced a prior MI, the mean time from the most recent MI was 8.070 years (SD = 6.137 years) in patients who were randomized to evolocumab in the parent trial and 7.835 years (SD = 5.905 years) in patients who were randomized to placebo in the parent trial.
Indirect Comparisons
No evidence on indirect treatment comparisons was submitted by the sponsor.
Study Addressing Gap in the Evidence From the Systematic Review
Description of Study
The EVOPACS study25 was a phase III, double-blind, placebo-controlled, randomized trial (N = 308). The primary objective was to assess the effectiveness of evolocumab 420 mg once every month, compared to placebo, in the reduction of LDL-C at week 8 in patients receiving high-intensity statin treatment during the acute phase of ACS.
The mean age of patients was 60.5 years (SD = 12.0 years) in the evolocumab group and 61.0 years (SD = 10.7 years) in the placebo group. Most of the participants were male (83% in the evolocumab group and 80% in the placebo group). Although half the patients in both groups had history of smoking, there were more active smokers in the evolocumab group than in the placebo group (41% versus 30%). Most of the patients enrolled in this study were statin-naive (80% in the evolocumab group and 76% in the placebo group). In terms of index ACS events, 57% of patients in the evolocumab group and 70% in the placebo group had non-ST-elevation (NSTE)-ACS, and 43% in the evolocumab group and 30% in the placebo group had STEMI.
Efficacy Results
The mean change from baseline in LDL-C was –77.1% (SD = 15.8%) in the evolocumab group versus –35.4% (SD = 26.6%) in the placebo group at week 8 (least squares mean difference = –40.7%; 95% CI, –45.2% to –36.2%). The mean LDL-C level at week 8 was 0.79 mmol/L (SD = 0.46 mmol/L) in the evolocumab group and 2.06 mmol/L (SD = 0.63 mmol/L) in the placebo group. At week 8, the proportion of patients with LDL-C levels of less than 1.8 mmol/L was 95.7% in the evolocumab group compared to 37.6% in the placebo group.
Harms Results
A total of 78 of 155 patients (50.3%) in the evolocumab group and 77 of 152 patients (50.7%) in the placebo group experienced at least 1 AE during the study. Nonserious AEs, including prespecified AE categories, occurred in 73 patients (47.1%) in the evolocumab group and in 71 patients (46.7%) in the placebo group; for 2 patients (1.3%) (both in the placebo group), these AEs led to the discontinuation of the investigational product. The most common AE in the evolocumab and placebo groups was chest pain (8 [5.2%] versus 8 [5.3%]), followed by musculoskeletal pain (10 [6.5%] versus 5 [3.3%]), and nasopharyngitis (7 [4.5%] versus 4 [2.6%]).26
SAEs occurred in 12 patients (7.7%) in the evolocumab group and in 11 patients (7.2%) in the placebo group; 3 patients (1.0%) (2 [1.3%] in the evolocumab group and 1 [0.7%] in the placebo group) experienced SAEs leading to the discontinuation of the investigational product. Two patients (both in the evolocumab group) died during the study; neither death was considered to be related to the investigational product by the investigator or the Data Safety and Monitoring Board, and both were adjudicated as cardiovascular deaths.26
Key Take-Aways
Interpretation of the results from the EVOPACS study is limited by the small sample size and short (8-week) follow-up. The clinical experts consulted by CDA-AMC did not consider the exclusion of patients whose most recent MI or stroke was in the 4 weeks before randomization to be a major gap in the evidence. The clinical experts advised that patients with an index case of ACS are not likely to be initiated on evolocumab in the inpatient setting, as they are most likely to be statin-naive, which was the case in this study as well, where 80% and 76% of patients in the evolocumab and placebo arms, respectively, were statin-naive. As a result, these patients will first be stabilized on a statin before any add-on therapies are considered. Nonetheless, the clinical experts expect that patients with acute MI and who are stabilized will likely respond to treatment with evolocumab in a manner similar to that in patients with nonacute MI.
Although most of the baseline characteristics were similar in the 2 treatment groups, there was a slight imbalance in index ACS events (i.e., for NSTE-ACS, there were 57% and 70% of patients in the evolocumab group and placebo group, respectively; for STEMI, there were 43% and 30% of patients in the evolocumab group and placebo group, respectively). Further, because active smoking was a major risk factor for cardiovascular events in the FOURIER trial, it should be noted that there were more active smokers in the evolocumab group than in the placebo group (41% versus 30%).
Conclusion
Two subgroup analyses of patients who experienced a recent MI (< 1 year and < 2 years) in the FOURIER trial, described by Gencer et al. and Sabatine et al. (2018), informed the main body of evidence for this reassessment. New evidence from the subgroup analyses of the FOURIER trial was submitted to support the identification of a subgroup of patients who would most benefit from evolocumab, which was raised in the previous resubmission for the ASCVD component of primary hyperlipidemia. Evolocumab in addition to moderate-to-high intensity statin therapy, compared to placebo, demonstrated an absolute benefit that was likely clinically meaningful and may be amplified in the subset of patients who experienced a recent MI (i.e., in the previous year). Results from the prespecified subgroup analyses of clinical event outcomes, with the exception of stroke, were generally consistent with the overall FOURIER trial results. This possible subgroup effect on the key secondary composite end point appears to have been primarily driven by the reduction in risk of MI, but there was no difference in the risk of cardiovascular death and stroke over the median follow-up period of 26 months. A biological plausibility for the proposed subgroup effect and a greater absolute risk for cardiovascular events in patients with a recent MI than patients who were further along the trajectory of disease were noted. The ad hoc subgroup analysis of patients who experienced a prior MI in an integrated OLE analysis also informed this reassessment, which provided results on the clinical event outcomes, with the exception of coronary revascularization, that were generally consistent with the results reported in the overall population in the 5-year OLE of the FOURIER trial. Further, the ad hoc subgroup analysis of patients who experienced a prior MI may suggest a treatment benefit in patients who received evolocumab earlier than those who received delayed treatment as a result of randomization in the parent trial. Of note, this possible subgroup effect on the key secondary composite end point appears to have been driven by a reduction in the risk of cardiovascular death and MI, but there was no difference in the risk of stroke. Although no major concerns about generalizability were identified, the place in therapy of evolocumab in relation to ezetimibe that would be supported by the evidence is uncertain. The incidence of TEAEs reported in the FOURIER trial were similar in the 2 treatment groups, including muscle-related events, which are important to patients. However, it is important to note that the duration of follow-up in the parent trial is likely inadequate for assessing the long-term relative safety of evolocumab. No new safety signals were identified in the 5-year OLE studies of the FOURIER trial.
Introduction
The objective of the present reassessment of evolocumab (ASCVD indication) is to review and critically appraise the new evidence submitted by the sponsor on the beneficial and harmful effects of evolocumab 140 mg/mL and 120 mg/mL subcutaneous injection in the treatment of primary hyperlipidemia, specifically in the requested reimbursement population of adult patients with ASCVD and recent ACS (in the previous year).
Disease Background
The contents within this section have been informed by materials submitted by the sponsor and clinical expert input. The following has been summarized and validated by the CDA-AMC review team.
Hyperlipidemia refers to high levels of lipids in the blood, including cholesterol and triglycerides. High levels of cholesterol (also referred to as hypercholesterolemia3), notably LDL-C, can cause atherosclerosis, defined as the buildup of fatty deposits in blood vessels leading to a restriction in blood flow, which is a major cause of cardiovascular events, including heart attack, stroke, and lower-extremity and PAD. In other words, hyperlipidemia can increase an individual’s risk of developing cardiovascular disease involving the blood vessels that supply the heart (coronary artery disease), brain (cerebrovascular disease), and limbs (PAD). Other risk factors for cardiovascular disease include diabetes mellitus, high blood pressure, chronic kidney disease, cigarette smoking, and family history.4 ASCVD, as defined in the 2021 CCS dyslipidemia guidelines,5 comprises all clinical conditions of atherosclerotic origin, such as ACS, stroke, and PAD. ACS comprises NSTEMI, STEMI, and unstable angina, with MI being the most common clinical presentation.11 The clinical experts were consulted on the definition of ACS used in clinical practice. Because the cardiac troponin assays have evolved to become highly sensitive to micromolar elevations in levels of circulating troponin, unstable angina has become an exceedingly infrequent diagnosis. Therefore, only MI, including STEMI and NSTEMI, was considered most relevant for the purpose of this review.
The incidence rate for MI was approximately 2.5 per 1,000 person-years over the time period from 2005 to 2016 in Ontario, whereas the incidence rate for unstable angina was 3.3 per 1,000 person-years in 2005 and 1.7 per 1,000 person-years in 2016.7 The prevalence of MI and unstable angina were 28.6 (95% CI, 28.5 to 28.7) per 1,000 individuals and 24.6 (95% CI, 24.5 to 24.7) per 1,000 individuals, respectively, in Ontario for the period from 2004 to 2017.7 More specifically, the 10-year prevalence rates for MI increased from 23.5 to 26.9 per 1,000 individuals and for unstable angina increased from 22.1 to 23.7 per 1,000 individuals between the periods of 2004 to 2013 and 2008 to 2017.7
Standards of Therapy
The contents within this section have been informed by materials submitted by the sponsor and clinical expert input. The following has been summarized and validated by the CDA-AMC review team.
Following an index ACS, a residual risk of subsequent cardiovascular event remains.6 Secondary prevention refers to the treatment and management of known, clinically evident ASCVD and the prevention or delay of the onset of disease manifestations.5
The 2021 CCS dyslipidemia guidelines5 advise on statin-indicated conditions, including ASCVD. According to the guidelines, treatment with PCSK9 inhibitors, with or without ezetimibe, should be considered for patients with ASCVD when the necessary reduction in LDL-C, ApoB, or non-HDL-C is substantial (i.e., LDL-C > 2.2 mmol/L or ApoB > 0.80 g/L or non-HDL-C > 2.9 mmol/L despite a maximally tolerated statin dose), or for patients who have been shown to derive the largest benefit from the intensification of statin therapy with the addition of a PCSK9 inhibitor. This subset includes patients with recent ACS (i.e., occurring in the 52 weeks after hospitalization for the index ACS), as well as those with clinically evident ASCVD and any additional cardiovascular risk enhancers (diabetes mellitus or metabolic syndrome, polyvascular disease, symptomatic PAD, history of MI, MI in the past 2 years, previous coronary artery bypass graft surgery, an LDL-C level of 2.6 mmol/L or more or HeFH, or a lipoprotein[a] level of 60 mg/dL or more). If the necessary reduction in LDL-C, ApoB, or non-HDL-C is modest (i.e., LDL-C of 1.8 mmol/L to 2.2 mmol/L or ApoB of 0.70 g/L to 0.80 g/L or non-HDL-C 2.4 mmol/L to 2.9 mmol/L despite a maximally tolerated statin dose), then the guidelines advise that ezetimibe, with or without a PCSK9 inhibitor, be considered. Additionally, in patients with ASCVD and a triglyceride level of 1.5 mmol/L to 5.6 mmol/L despite receiving a maximally tolerated statin dose, the guidelines advise that treatment with icosapent ethyl be considered.5
The key limitation of statin therapy has been the risk of myalgia, which is commonly associated with suspected underlying statin intolerance.27 Other lipid-lowering therapies, such as niacin, fibrates, bile acid sequestrants, mipomersen (not approved in Canada), and lomitapide (only used for homozygous familial hypercholesterolemia), are infrequently used in patients with ASCVD, according to clinical expert input.
The clinical experts were consulted on the goal of treatment with a PCSK9 inhibitor and agreed that for patients with ASCVD who are at high cardiovascular risk, LDL-C, non-HDL-C, or ApoB should be reduced to levels below the thresholds referenced in the 2021 CCS dyslipidemia guidelines (i.e., LDL-C < 1.8 mmol/L or non-HDL-C < 2.4 mmol/L or ApoB < 0.7 g/L) for secondary prevention,5 thereby lowering the risk of clinical events and improving survival and quality of life.
Drug Under Review
The key characteristics of evolocumab, along with other treatments available for patients with primary hyperlipidemia (including ASCVD), are summarized in Table 5.
The indication for evolocumab under review is the reduction of elevated LDL-C in adult patients with primary hyperlipidemia (including HeFH and ASCVD) as an adjunct to diet and statin therapy, with or without other lipid-lowering therapies, in patients who require additional lowering of LDL-C and as an adjunct to diet, alone or in combination with nonstatin lipid-lowering therapies, and in patients for whom a statin is contraindicated.1 The Notice of Compliance dates are September 10, 2015 (initial approval) and September 27, 2023 (latest revision).
In contrast to the Health Canada–approved indication, the reimbursement request for the present reassessment is for patients with recent ACS (in the previous year) who have an LDL-C level of 1.8 mmol/L or more despite taking moderate-to-high intensity statin therapy, with or without ezetimibe. This patient population is consistent with the population of patients identified in the 2021 CCS dyslipidemia guidelines5 for secondary prevention who were shown to derive the largest benefit from the intensification of statin therapy with the addition of a PCSK9 inhibitor, which is patients with recent ACS (i.e., occurring in the 52 weeks after hospitalization for the index ACS).
For primary hyperlipidemia in adult patients (including HeFH and ASCVD), the recommended dose of evolocumab is either 140 mg every 2 weeks or 420 mg once monthly; both doses are clinically equivalent. When switching dosage regimens, administer the first dose of the new regimen on the next scheduled date of the prior regimen. One prefilled syringe or prefilled autoinjector delivers the 140 mg every 2 week dose. One single-use automated mini-doser with a 3.5 mL prefilled cartridge delivers the 420 mg once monthly dose. Alternatively, 3 prefilled syringes or 3 prefilled autoinjectors administered consecutively within 30 minutes deliver the 420 mg once monthly dose.1
Evolocumab is a fully human monoclonal immunoglobulin G2 that selectively binds to PCSK9 with high affinity to inhibit circulating PCSK9 from binding to the low-density-lipoprotein receptor on the surface of liver cells. This prevents the PCSK9-mediated degradation of low-density-lipoprotein receptors, thereby increasing the number of receptors available to clear low-density lipoprotein.1
Table 5: Key Characteristics of Evolocumab, Statins, and Ezetimibe Indicated for Primary Hyperlipidemia (Including ASCVD)
Characteristic | Evolocumab | Statins | Ezetimibe |
|---|---|---|---|
Mechanism of action | A fully human monoclonal IgG2 that selectively binds to circulating PCSK9 to inhibit the PCSK9-mediated degradation of LDLRs on the surface of liver cells. By increasing the number of LDLRs available to clear LDL, serum LDL-C level is lowered | A synthetic lipid-lowering drug that selectively inhibits HMG-CoA reductase (an enzyme involved in the early and rate-limiting step of the biosynthesis of cholesterol in the liver) and increases the number of LDLRs available to clear LDL | A lipid-lowering compound that selectively inhibits the intestinal absorption of cholesterol and related plant sterols by targeting the sterol transporter, NPC1L1 |
Indicationa | Primary hyperlipidemia (including HeFH and ASCVD) Evolocumab is indicated for the reduction of elevated LDL-C in adult patients with primary hyperlipidemia (including HeFH and ASCVD):
| Hyperlipidemia or hypercholesterolemia and mixed hyperlipidemia In general, statins are indicated in adults as an adjunct to diet for the reduction of elevated total-C, LDL-C, TG, ApoB, the total-C/HDL-C ratio, and for the increase of HDL-C in patients with hyperlipidemic and dyslipidemic conditions, such as primary hypercholesterolemia and mixed hyperlipidemia, when response to diet and exercise alone has been inadequate | Primary hypercholesterolemia Ezetimibe, administered alone or with an HMG-CoA reductase inhibitor (statin), is indicated for:
Ezetimibe, administered in combination with fenofibrate, is indicated for:
|
Route of administration | Subcutaneous injection | Oral | Oral |
Recommended dose | Evolocumab 140 mg every 2 weeks or evolocumab 420 mg once monthly | Examples of statin dose ranges are atorvastatin 10 mg to 80 mg once daily and rosuvastatin 5 mg to 40 mg once daily | Ezetimibe 10 mg once daily, alone, with a statin, or with fenofibrate |
Serious warnings and precautions | Hypersensitivity reactions (e.g., rash, urticaria, angioedema) | Hyperglycemia, elevated serum transaminases, myopathy and rhabdomyolysis, and myalgia, myositis, and myopathy | Drug-induced liver injury, including hepatitis, pancreatitis, myopathy and rhabdomyolysis, myalgia, anaphylaxis, and SCARs (including SJS, TEN, and DRESS) |
ApoB = apolipoprotein B; ASCVD = atherosclerotic cardiovascular disease; DRESS = drug reaction with eosinophilic and systemic symptoms; HDL-C = high-density-lipoprotein cholesterol; HeFH = heterozygous familial hypercholesterolemia; HMG-CoA = 3-hydroxy-3-methylglutaryl-coenzyme A; IgG2 = immunoglobulin G2; LDL = low-density lipoprotein; LDL-C = low-density-lipoprotein cholesterol; LDLR = low-density lipoprotein receptor; SCAR = severe cutaneous adverse reactions; SJS = Stevens-Johnson syndrome; TEN = toxic epidermal necrolysis; TG = triglyceride; total-C = total cholesterol.
aHealth Canada–approved indication.
Sources: Product monographs for evolocumab,1 statins,28-33 and ezetimibe.34
Submission History
Initial Submission for Primary Hyperlipidemia
In 2016, evolocumab was first reviewed by CDEC for primary hyperlipidemia, including HeFH and clinical ASCVD. CDEC issued a recommendation that evolocumab be listed as an adjunct to diet and maximally tolerated statin therapy in adult patients with HeFH who require additional lowering of LDL-C, if the prespecified clinical criteria and condition are met. For the ASCVD component of the indication, CDEC issued a recommendation that evolocumab not be listed as an adjunct to diet and maximally tolerated statin therapy in adult patients with clinical ASCVD who require additional lowering of LDL-C.8 Detailed information on and the reasons for the final recommendation made by CDEC in 2016 are publicly available on the CDA-AMC website.
Resubmission for the Atherosclerotic Cardiovascular Disease Component of Primary Hyperlipidemia
In 2017, evolocumab was resubmitted and reviewed by CDEC for the ASCVD component of primary hyperlipidemia. CDEC issued a recommendation that evolocumab be reimbursed as an adjunct to diet and maximally tolerated statin therapy in adult patients with ASCVD who require additional lowering of LDL-C, if the prespecified criterion and condition are met. The criterion was that patients meet the inclusion criteria for the FOURIER trial (i.e., established cardiovascular disease and a high risk for future events, LDL-C ≥ 1.8 mmol/L or non-HDL-C ≥ 2.6 mmol/L, and receipt of a maximally tolerated dose of statins). In the double-blind, placebo-controlled, randomized clinical trial that enrolled patients with ASCVD receiving optimized statin therapy (FOURIER, n = 27,564), the composite outcome of cardiovascular death, MI, stroke, unstable angina, and revascularization was met by 9.8% of patients taking evolocumab and 11.3% of patients taking placebo over a median follow-up period of 26 months (HR = 0.85; 95% CI, 0.79 to 0.92).9 However, funding is not yet in place, as negotiations concluded without an agreement in July 2019.10 Detailed information on the final recommendation made by CDEC in 2017 is publicly available on the CDA-AMC website.
Basis of Present Reassessment
The 2021 CCS dyslipidemia guidelines5 referenced the FOURIER35 and ODYSSEY36 trials, which have identified subsets of patients with established cardiovascular disease (at high cardiovascular risk) who have been shown to derive the largest benefit from intensification of statin therapy with the addition of a PCSK9 inhibitor in secondary prevention. This subset includes patients with recent ACS (i.e., occurring in the 52 weeks after hospitalization for the index ACS), as well as those with clinically evident ASCVD and any additional cardiovascular risk enhancers, including diabetes mellitus or metabolic syndrome, polyvascular disease, symptomatic PAD, history of MI, MI in the past 2 years, previous coronary artery bypass graft surgery, an LDL-C level of 2.6 mmol/L or more or HeFH, and a lipoprotein(a) level of 60 mg/dL or more.5
Hence, the focus of the present reassessment is on the revised requested reimbursement criteria: patients with recent ACS (in the previous year) who have an LDL-C level of 1.8 mmol/L or more despite taking moderate-to-high intensity statin therapy, with or without ezetimibe.
Patient, Clinician, and Drug Plan Perspectives
Patient Group Input
No patient groups provided input on the present reassessment of evolocumab.
A summary of past patient input submitted by the Cardiac Health Foundation of Canada was prepared by the CDA-AMC review team in the Clinical Review Report (Resubmission) on Evolocumab (Repatha) in December 2017, which is publicly available on the CDA-AMC website. The Cardiac Health Foundation of Canada is an organization that raises funds for and promotes programs and applied research on the rehabilitation and management of cardiovascular disease and provides education and resources on the prevention and management of cardiovascular disease in Canada. Patient input was gathered by the patient group through an online survey (N = 55) and 1 telephone interview; respondents were patients with atherosclerosis and their caregivers.
Among the survey respondents, experience with rosuvastatin, atorvastatin, ezetimibe, and bypass surgery were described with varying degrees of effectiveness. The survey respondents reported that the most common side effects associated with their current treatment were digestive-related, including gas, constipation, and upset stomach. According to the survey respondents, the most difficult-to-tolerate side effects associated with current medications were muscle pain, discomfort, and weakness.
The survey respondents identified the following unmet need: alternative treatment options to statins. More specifically, in the context of elevated cholesterol levels despite a maximally tolerated statin dose and AEs commonly associated with statin therapy (i.e., loss of muscle function and muscle weakness), patients expect evolocumab to lower cholesterol to target levels with minimal side effects. In particular, most patients indicated that a loss of muscle function is an AE they are not willing to tolerate.
Clinician Input
Input From Clinical Experts Consulted by CDA-AMC
All CDA-AMC review teams include at least 1 clinical specialist with expertise in the diagnosis and management of the condition for which the drug is indicated. Clinical experts are a critical part of the review team and are involved in all phases of the review process (e.g., assisting in the critical appraisal of clinical evidence, interpreting the clinical relevance of the results, and providing guidance on the potential place in therapy). The following input was provided by 2 clinical specialists with expertise in the diagnosis and management of primary hyperlipidemia.
Unmet Needs
The clinical experts indicated that the association between a reduction in cholesterol and prevention of or delay in the onset of ASCVD and disease manifestation is well established. Hence, the goal of treatment with a PCSK9 inhibitor is to reduce LDL-C (or non-HDL-C or ApoB) levels to below the thresholds referenced in the 2021 CCS dyslipidemia guidelines for secondary prevention (LDL-C < 1.8 mmol/L or non-HDL-C < 2.4 mmol/L or ApoB < 0.7 g/L) in patients with ASCVD who are at high cardiovascular risk.5 According to the clinical experts, long-term, this translates into a reduced risk of clinical events and improved survival and quality of life.
The clinical experts indicated that most patients at high risk for cardiovascular events are not meeting LDL-C (or non-HDL-C or ApoB) target levels with available treatment options. Moreover, the clinical experts indicated that nonadherence due to real or perceived intolerance to high-intensity statins, such as intolerance due to reported myalgias, is a challenge in clinical practice; they estimated that 50% of patients discontinue their statin in the year after an ACS event.
The clinical experts highlighted the lack of access to advanced therapies, including PCSK9 inhibitors, experienced by patients with ASCVD. According to the clinical experts, lack of access is multifactorial, and includes coverage for and access to clinicians with experience using advanced therapies.
Place in Therapy
The clinical experts referenced the 2021 CCS dyslipidemia guidelines5 to indicate that ezetimibe and PCSK9 inhibitors are second-line treatment options for the management of primary hyperlipidemia for secondary prevention. More specifically, the clinical experts indicated that ezetimibe and/or evolocumab would be used in addition to a maximally tolerated statin dose to meet LDL-C (or non-HDL-C or ApoB) target levels. According to clinical expert input, 2 weeks is an appropriate trial of a statin. The clinical experts advise that the guidelines be referred to for additional context on the place in therapy of evolocumab in relation to ezetimibe (this is described in detail in the Standards of Therapy section of this report). For patients who are intolerant of or have contraindications to statins, the clinical experts indicated that evolocumab would be an alternative therapy to statins, with or without ezetimibe.
Of note, the clinical experts do not anticipate that evolocumab will become first-line therapy for the management of primary hyperlipidemia. However, they do anticipate that there will be a substantial demand for evolocumab if it becomes widely available and is reimbursed by public drug plans for the indication under review.
Patient Population
The clinical experts referenced the 2021 CCS dyslipidemia guidelines5 to identify the patient population most in need of an intervention for the management of primary hyperlipidemia in secondary prevention, and identified the subset of patients with ASCVD (at high cardiovascular risk) who have been shown to derive the largest benefit from the intensification of statin therapy with the addition of a PCSK9 inhibitor. This includes patients with recent ACS (occurring in the 52 weeks after hospitalization for the index ACS) and patients with additional cardiovascular risk enhancers.5 These patients are identified based on medical history, with or without a clinical exam, and standard lipid tests. The clinical experts noted that the assessment of clinical risk in secondary prevention is heterogenous and, as such, there is considerable underdiagnosis of risk that would be considered an indication for the initiation of lipid-lowering therapy.
The clinical experts indicated that all patients with ASCVD whose LDL-C (or non-HDL-C or ApoB) remains above the threshold, despite a maximally tolerated statin dose, are suited for treatment with evolocumab. According to the clinical experts, patients with end-stage renal disease, hepatic disease, New York Heart Association class IV heart failure, congestive heart failure, and an expected survival of less than 6 months are least suitable for treatment with evolocumab.
Assessing Treatment Response
The clinical experts noted that improved survival or reduced risk of cardiovascular events cannot be assessed in an individual patient in practice; they are considered established by clinical trials. Thus, the clinical experts indicated that reduction in LDL-C (or non-HDL-C or ApoB) is used to determine treatment response in practice. The clinical experts explained that requiring a specific percent reduction in these lipid parameters is arbitrary. Instead, they referenced the lipid parameter thresholds in the 2021 CCS dyslipidemia guidelines5 as treatment goals. Based on clinical expert input, treatment response is assessed every 6 to 12 months, depending on cardiovascular risk. For example, patients with higher cardiovascular risk are advised to have an earlier follow-up to ensure that treatment goals will be met. Additionally, the clinical experts noted that in some patients, evolocumab would allow for the down-titration of a statin that is associated with AEs and a negative impact on quality of life.
Discontinuing Treatment
When deciding whether to discontinue treatment with evolocumab, the clinicals experts said they would consider the adverse effects associated with treatment and competing risks from other diseases that limit life expectancy.
Prescribing Considerations
The clinical experts indicated that although a specialist is not required for the diagnosis, treatment, and monitoring of patients receiving evolocumab, management should ideally be carried out in an outpatient clinic or hospital setting by a clinician who has experience with evolocumab.
Clinician Group Input
This section was prepared by the CDA-AMC review team based on the input provided by clinician groups. The full clinician group submissions received are available in the consolidated clinician group input document for this review on the project website publicly accessible here.
A total of 9 clinician groups provided input on the present reassessment of evolocumab: Canadian Dyslipidemia Guideline Committee; McMaster Lipid Clinic; British Columbia Lipid Specialists; Cambridge Cardiac Rehab Program; Western University, Division of Cardiology, Cardiac Rehabilitation and Secondary Prevention Program; University of British Columbia and Vancouver General Hospital and St. Paul’s Hospital Cardiac Intensive Care Unit; University of Toronto faculty and clinicians at St Michael’s Hospital; Division of Cardiology, University of Ottawa Heart Institute; and a group of primary care and specialist physicians who treat patients with coronary artery disease and ACS in Canada.
The clinician groups identified the following limitations with currently available treatments (unmet needs) in patients with recent ACS: limited access to PCSK9 inhibitors due to cost, experience of side effects from and/or intolerance to available drugs (which have an impact on adherence to treatment), and variable treatment response (e.g., treatment targets for LDL-C not met). The University of Ottawa Heart Institute emphasized that although the majority of patients with ASCVD experience a reduction in their LDL-C level to below 1.8 mmol/L with high-dose statin therapy, with or without ezetimibe, a subset of patients continues to have elevated lipid levels due to severe polygenic hypercholesterolemia and intolerance or contraindication to high-dose statin therapy. The clinician group further suggested that this subset of patients who are at high risk of recurrent cardiovascular events would benefit from additional lipid-lowering treatment in the form of a PCSK9 inhibitor.
The Canadian Dyslipidemia Guideline Committee, McMaster Lipid Clinic, and the group of primary care and specialist physicians in Canada referenced the 2021 CCS dyslipidemia guidelines5 to indicate that a PCSK9 inhibitor would be used as an add-on therapy after the initiation of maximally tolerated statin therapy, with or without ezetimibe, in patients with elevated LDL-C levels. More specifically, evolocumab would be used in the second line after a maximally tolerated dose of statin or in the third line after statin and ezetimibe. The Canadian Dyslipidemia Guideline Committee also referenced the guidelines to identify candidates for evolocumab, who comprise patients with either a recent ACS (i.e., occurring in the 52 weeks after hospitalization for the index ACS) or prior ASCVD with any of the following: diabetes or metabolic syndrome, polyvascular disease, symptomatic PAD, recurrent MI, MI in the past 2 years, previous coronary artery bypass graft surgery, LDL-C level of 2.6 mmol/L or more, or HeFH. The clinician groups indicated that treatment response is assessed based on the percent reduction in LDL-C (or non-HDL-C or ApoB) levels, compared to pretreatment levels in practice.5
Drug Program Input
The drug programs provide input on each drug being reviewed through the CDA-AMC Reimbursement Review processes by identifying issues that may impact their ability to implement a recommendation. The implementation questions and corresponding responses from the clinical experts consulted by CDA-AMC are summarized in Table 6.
Table 6: Summary of Drug Plan Input and Clinical Expert Response
Input from the drug plans | Clinical expert response |
|---|---|
Drug program implementation questions | |
Considerations for initiation of therapy | |
Can patients who are taking evolocumab and experience a waning of effect be switched to another monoclonal antibody (e.g., alirocumab) or inclisiran? | The clinical experts consider this to be an unlikely scenario; a waning of effect with PCSK9 inhibitors is typically not expected, and there are barriers to access to alirocumab and inclisiran (i.e., these drugs are currently not reimbursed by the public drug plans for the indication under review). The clinical experts indicated that it would be reasonable to consider switching from treatment with evolocumab to another monoclonal antibody or inclisiran if a patient taking evolocumab experiences a waning of effect; however, there is no evidence for switching therapies. |
Should evolocumab only be used as combination therapy with a maximally tolerated statin dose and ezetimibe? | The clinical experts indicated that evolocumab would be used in addition to a maximally tolerated statin dose, with or without ezetimibe. For patients who are intolerant or have contraindications to statins, the clinical experts indicated that evolocumab would be an alternative therapy to statins, with or without ezetimibe. The clinical experts advise referral to the 2021 CCS dyslipidemia guidelines5 for additional context on the place in therapy of evolocumab in relation to ezetimibe. The guidelines advise clinicians to consider a PCSK9 inhibitor, with or without ezetimibe, when the necessary reduction in LDL-C, ApoB, or non-HDL-C is substantiala or in patients shown to derive the largest benefit from the intensification of statin therapy with the addition of a PCSK9 inhibitor. This subset includes patients with recent ACS,b as well as those with clinically evident ASCVD and any additional cardiovascular risk enhancers.c If the necessary reduction in LDL-C, ApoB, or non-HDL-C is modest,d then the guidelines advise clinicians to consider ezetimibe, with or without a PCSK9 inhibitor.5 |
Considerations for continuation or renewal of therapy | |
For currently listed evolocumab, requests have been received from prescribers about patients whose elevated triglyceride levels preclude the calculation of LDL-C levels. If LDL-C cannot be obtained due to elevated triglyceride levels, is there an alternative marker(s) that can be used to assess the appropriateness of therapy (e.g., in patients with a non-HDL-C level < 2.4 mmol/L or an ApoB level < 0.7 g/L)? Is ApoB measurement accessible and considered in routine blood work in practice? | The clinical experts agreed with using non-HDL-C (< 2.4 mmol/L) and ApoB (< 0.7 g/L) levels as alternative markers to assess appropriateness of therapy with evolocumab in the setting of elevated triglyceride levels. The clinical experts noted that ApoB is a separate test that is publicly reimbursed by all provinces in Canada, and the non-HDL-C level is available in a standard lipid panel. The CDA-AMC review team noted that the 2021 CCS dyslipidemia guidelines5 advise that non-HDL-C or ApoB can be used in place of LDL-C as the preferred lipid parameter for the screening in patients with elevated triglyceride levels (> 1.5 mmol/L). |
Considerations for prescribing of therapy | |
What is the maximum dose of evolocumab for reimbursement? | The review team noted that the recommended dose of evolocumab SC for the indication under review is 140 mg every 2 weeks or 420 mg once monthly.1 This aligns with the dose schedules of intervention that were available to patients for selection in the FOURIER trial. The review team also noted that the product monograph1 comments on switching between dose schedules. This aligns with the FOURIER trial, in which dose adjustments were not permitted, but switching between dose schedules, per patient preference, was. |
Is there evidence that evinacumab or inclisiran can be used in combination to augment the effect of evolocumab? | The clinical experts indicated that evinacumab is approved by Health Canada for HoFH and, as such, would not generally be used for the indication under review. Regarding inclisiran, the clinical experts indicated that it would not be appropriate to combine drugs with the same mechanism of action and that there is no evidence on combining inclisiran with a PCSK9 inhibitor. |
Drug program implementation comments to inform CDEC deliberations | |
Relevant comparators | |
In the FOURIER trial, the comparator was matching placebo injection, and an inclusion criterion was to be on a stable, optimized lipid-lowering background therapy consisting of an effective statin dose (i.e., a high-to-moderate intensity statin), with or without ezetimibe. Statins and ezetimibe are open benefits. | Comment from the drug programs to inform CDEC deliberations. The clinical experts indicated that statins, ezetimibe, and PCSK9 inhibitors are relevant comparators for this review. Regarding PCSK9 inhibitors, the review team noted that funding is not yet in place for alirocumab, as negotiations concluded without an agreement in October 2019 for the indication of ASCVD.10 |
Considerations for initiation of therapy | |
Calculated LDL-C is accessible and considered in routine blood work in practice. | Comment from the drug programs to inform CDEC deliberations. |
Evolocumab is currently listed as a limited-use benefit for patients with heterozygous familial hypercholesterolemia who require additional lowering of LDL-C. | Comment from the drug programs to inform CDEC deliberations. |
Considerations for continuation or renewal of therapy | |
Consistency in renewal criteria with currently listed evolocumab and any other drugs reviewed by CDA-AMC in the same therapeutic space (e.g., alirocumab and inclisiran) is preferred. | Comment from the drug programs to inform CDEC deliberations. The clinical experts advised using a reduction in LDL-C (or non-HDL-C or ApoB) to assess treatment response every 6 to 12 months, depending on the patient’s cardiovascular risk. The clinical experts advised that the treatment goal in patients with ASCVD who are at high cardiovascular risk is to reduce LDL-C levels to below the thresholds referenced in the 2021 CCS dyslipidemia guidelines (i.e., LDL-C < 1.8 mmol/L or non-HDL-C < 2.4 mmol/L or ApoB < 0.7 g/L).5 |
Considerations for prescribing of therapy | |
Evolocumab can be administered at home with an autoinjector. | Comment from the drug programs to inform CDEC deliberations. |
There are no limitations on prescriber requirements for currently listed evolocumab (e.g., the prescriber is not required to be a cardiologist or in internal medicine). | Comment from the drug programs to inform CDEC deliberations. The clinical experts indicated that although a specialist is not required for the diagnosis, treatment, and monitoring of patients receiving evolocumab, management should ideally be carried out by a clinician who has experience with evolocumab. |
System and economic issues | |
Based on the budget impact analysis, there is a large potential budget impact because ACS is a common condition. | Comment from the drug programs to inform CDEC deliberations. |
ApoB = apolipoprotein B; ASCVD = atherosclerotic cardiovascular disease; CCS = Canadian Cardiovascular Society; CDEC = Canadian Drug Expert Committee; HDL-C = high-density lipoprotein cholesterol; HoFH = homozygous familial hyperlipidemia; LDL-C = low-density lipoprotein cholesterol; SC = subcutaneous.
aSubstantial refers to an LDL-C level greater than 2.2 mmol/L, an ApoB level greater than 0.80 g/L, or a non-HDL-C level greater than 2.9 mmol/L despite a maximally tolerated statin dose.
bRecent ACS is defined in the guidelines as occurring in the 52 weeks after hospitalization for the index ACS.
cCardiovascular risk enhancers, according to the guidelines, include diabetes mellitus or metabolic syndrome, polyvascular disease, symptomatic PAD, history of MI, MI in the past 2 years, previous coronary artery bypass graft surgery, an LDL-C level of 2.6 mmol/L or more or HeFH, and a lipoprotein(a) level of 60 mg/dL or more.
dModest refers to an LDL-C level of 1.8 to 2.2 mmol/L, an ApoB level of 0.70 to 0.80 g/L, or a non-HDL-C level of 2.4 mmol/L to 2.9 mmol/L despite a maximally tolerated statin dose.
Clinical Evidence
The objective of the Clinical Review Report in the present reassessment is to review and critically appraise the new clinical evidence submitted by the sponsor on the beneficial and harmful effects of evolocumab 140 mg/mL and 120 mg/mL subcutaneous injections in the treatment of primary hyperlipidemia in the subgroup of adult patients with ASCVD who have recent ACS (in the previous year). The focus will be placed on comparing evolocumab to relevant comparators and identifying gaps in the current evidence.
A summary of the clinical evidence included by the sponsor in the present reassessment of evolocumab is presented in 3 sections, with our critical appraisal of the evidence included at the end of each section. The first section, the Systematic Review, includes a pivotal study that was selected in accordance with the sponsor’s systematic review protocol. The second section includes sponsor-submitted long-term extension studies. The third section includes an additional study that was considered by the sponsor to address an important gap in the systematic review evidence.
Included Studies
The pivotal trial, the FOURIER trial, was previously reviewed and critically appraised by CDA-AMC in the December 2017 Clinical Review Report (Resubmission) on Evolocumab (Repatha), which is publicly available on the CDA-AMC website. In addition to the FOURIER trial, new clinical evidence from the following is included in the CADTH reassessment and appraised in this document:
2 subgroup analyses of the pivotal FOURIER study identified in the systematic review
2 long-term extension studies of the FOURIER trial
1 additional study addressing a gap in the systematic review evidence.
Systematic Review
The contents within this section have been informed by materials submitted by the sponsor. The following has been summarized and validated by the CDA-AMC review team.
Description of Studies
Characteristics of the included studies are summarized in Table 7.
The FOURIER Trial12
Detailed information on the FOURIER trial can be found in the December 2017 Clinical Review Report (Resubmission) on Evolocumab (Repatha), which is publicly available on the CDA-AMC website. The study design of the FOURIER trial is presented in Figure 1.
The FOURIER trial was a phase III, double-blind, placebo-controlled, randomized clinical trial (N = 27,564). The primary objective was to evaluate the effect of evolocumab, compared with placebo, on the risk of cardiovascular death, MI, stroke, hospitalization for unstable angina, and coronary revascularization, whichever occurs first, in patients with clinically evident ASCVD. Patients were enrolled between February 8, 2013, and June 5, 2015, at 1,242 clinical centres, 46 of which were located in Canada.2 Patients who were taking stable (i.e., for at least 4 weeks), optimized lipid-lowering therapy at screening with no planned or anticipated changes for the duration of the trial proceeded directly to the final screening visit. For patients who required a change in lipid-lowering therapy, their dose was titrated until their lipid levels were considered optimally managed; they then proceeded to the final screening visit. However, these patients could only be randomized after at least 4 weeks (i.e., stable) of optimized lipid-lowering therapy. All procedures up to randomization were designed to be completed no more than 15 weeks after patients provided informed consent.
Patients who met all of the inclusion criteria and none of the exclusion criteria were randomized in a 1:1 ratio to receive either subcutaneous evolocumab or matching placebo injection (with a dosing schedule reflecting patient preference) in addition to their stable, optimized, background lipid-lowering therapy (i.e., at least a statin, with or without ezetimibe). Treatment allocation was based on a computer-generated randomization schedule prepared by the sponsor before the start of the study, using the Interactive Voice or Web Response System. Randomization was stratified by the final screening LDL-C level (< 2.2 mmol/L versus ≥ 2.2 mmol/L) and by geographic region (Europe, North America, Latin America, and the Asia-Pacific).
Laboratory assessments were performed during screening, on day 1, and at weeks 4, 12, and 24, and every 24 weeks thereafter. Patients were to complete all planned visits, regardless of adherence to study drug. To maintain blinding of the treatment assignment, central laboratory results were not reported to the investigator until unblinding of the clinical database. A patient’s treatment assignment was only unblinded when required for further management of the patient. As this was an event-driven study, treatment continued until a minimum of 1,630 patients experienced an event adjudicated by an independent external committee as qualifying for a key secondary end point event of cardiovascular death, MI, or stroke. The estimated study duration was 56 months from the date the first patient was randomized. Patients who completed the trial had the option to enrol in an OLE study19,20 of the FOURIER trial.
Gencer et al. Study13
The aim of this study was to evaluate the risks of major adverse cardiovascular events as a function of time from the date of the qualifying MI and to evaluate the effect of evolocumab on cardiovascular outcomes in patients who experienced an MI in the previous year. Note that only the latter objective is considered relevant for the purpose of this review.
Sabatine et al. (2018) Study14
The aim of this study was to assess the efficacy of evolocumab in 3 subgroups in the FOURIER trial: timing from the most recent MI, number of prior MIs, and the presence of residual multivessel coronary artery disease. Note that only the subgroup by timing of prior MI is considered relevant for the purpose of this review.
Populations
Key inclusion and exclusion criteria used in the included studies are summarized in Table 7.
FOURIER Trial12
The trial included patients aged 40 to 85 years, inclusive, with a history of ASCVD, evidenced by a history of MI or nonhemorrhagic stroke, or symptomatic PAD, and additional characteristics that placed them at high cardiovascular risk. Other key inclusion criteria were a most recent fasting LDL-C level of 1.8 mmol/L or more (or a non-HDL-C level of 2.6 mmol/L or more) after at least 2 weeks of stable, optimized lipid-lowering therapy. Key exclusion criteria were the most recent MI or stroke occurring in the 4 weeks before randomization; NYHA class III or IV heart failure or a last known left ventricular ejection fraction of less than 30%; and a planned or expected cardiac surgery or revascularization in the 3 months after randomization.
Table 7: Details of the FOURIER Trial and the Gencer et al. and Sabatine et al. (2018) Studies
Detail | FOURIER | ||||
|---|---|---|---|---|---|
Designs and populations | |||||
Study design | Phase III, double-blind, placebo-controlled RCT | ||||
Locations | Patients were enrolled from 1,242 clinical centres across 49 countries in the Asia-Pacific, Europe, Latin America, and North America (including 46 clinical centres in Canada) | ||||
Patient enrolment dates | Start date: February 8, 2013 End date: June 5, 2015 | ||||
Patients randomized (N) or included in the subgroup analysis (N) | FOURIER trial 27,564 | Gencer et al. study 22,320 | Sabatine et al. (2018) study 22,351 | ||
Subgroup | NA | Prior MI < 1 year | Prior MI ≥ 1 year | Prior MI < 2 years | Prior MI ≥ 2 years |
Evolocumab group (n) | 13,784 | 2,821 | 8,308 | 4,109 | 7,020 |
Placebo group (n) | 13,780 | 2,890 | 8,301 | 4,293 | 6,898 |
Key inclusion criteria |
| ||||
Additional inclusion criteria for subgroup analysis |
| ||||
Key exclusion criteria |
| ||||
Study drug | |||||
Intervention | According to patient preference and supplied as a spring-based prefilled 1.0 mL autoinjector or pen:
| ||||
Comparator | According to patient preference:
| ||||
Study duration | |||||
Screening phase | Single visits (screening and final screening) | ||||
Run-in phase | Up to 15 weeks for patients requiring lipid therapy titration to optimize lipid-lowering therapy To ensure tolerance of SC injections, patients received a one-time placebo injection by autoinjector or pen before randomization | ||||
Treatment phase | Until 1,630 patients experienced key secondary end point event of cardiovascular death, MI, or stroke The estimated study duration was 56 months from the date the first patient was randomized, with a 26-month enrolment period | ||||
Follow-up phase | Option to enrol in OLE once completed | ||||
Outcomes | |||||
Primary end point | Time to cardiovascular death, MI, stroke, hospitalization for unstable angina, or coronary revascularization, whichever occurs first (including ischemic and hemorrhagic stroke) Time frame: Median follow-up of 26 months; KM estimates at 6, 12, 18, 24, 30, and 36 months | ||||
Secondary and exploratory end points | Key secondary end point: Time to cardiovascular death, MI, or stroke, whichever occurs first Other secondary end points:c
Time frame: Median follow-up of 26 months; KM estimates at 6, 12, 18, 24, 30, and 36 months Exploratory end points:
At each scheduled visit:
Safety end points:
| ||||
Publication status | |||||
Publications | Clinical Trial identifier: NCT0176463337 Sabatine et al. (2017)35 Sabatine et al. (2018)14 Gencer et al.13 | ||||
ALT = alanine aminotransferase; ApoA1 = apolipoprotein A1; ApoB = apolipoprotein B; AST = aspartate aminotransferase; ECG = electrocardiogram; eGFR = estimated glomerular filtration rate; HDL-C = high-density lipoprotein cholesterol; hsCRP = high-sensitivity C-reactive protein; KM = Kaplan-Meier; LDL-C = low-density-lipoprotein cholesterol; LLN = lower limit of normal; Lp(a) = lipoprotein (a); MI = myocardial infarction; NA = not applicable; NYHA = New York Heart Association; OLE = open-label extension; PAD = peripheral artery disease; RCT = randomized controlled trial; SC = subcutaneous; TEAE = treatment-emergent adverse event; TIA = transient ischemic attack; TSH = thyroid stimulating hormone; ULN = upper limit of normal; VLDL-C = very-low-density-lipoprotein cholesterol.
aMajor risk factors included type 1 or type 2 diabetes, age of 65 years or older, a qualifying MI or stroke in the 6 months before screening, current daily cigarette smoking, an additional prior MI or nonhemorrhagic stroke (excluding the qualifying diagnosis), or symptomatic PAD if enrolled with a history of MI or nonhemorrhagic stroke.
bMinor risk factors included a history of non-MI-related coronary revascularization, residual coronary artery disease with 40% or greater stenosis in 2 or more large vessels, HDL-C levels of less than 1.0 mmol/L for males and greater than 1.3 mmol/L for females, hsCRP greater than 2.0 mg/L, LDL-C level of 3.4 mmol/L or more or non-HDL-C level of 4.1 mmol/L or more, and metabolic syndrome as defined in the study protocol.
cTime to hospitalization for unstable angina was not a prespecified end point in the FOURIER trial; an ad hoc analysis was performed to ensure that results were provided for each individual component of the primary end point.
Sources: Clinical Study Report of the FOURIER trial,12 additional information received from the sponsor on January 30, 2024,16 Sabatine et al. (2018),14 and Gencer et al.13 Details included in the table are from the sponsor’s Summary of Clinical Evidence.2
Figure 1: Study Design of the FOURIER Trial
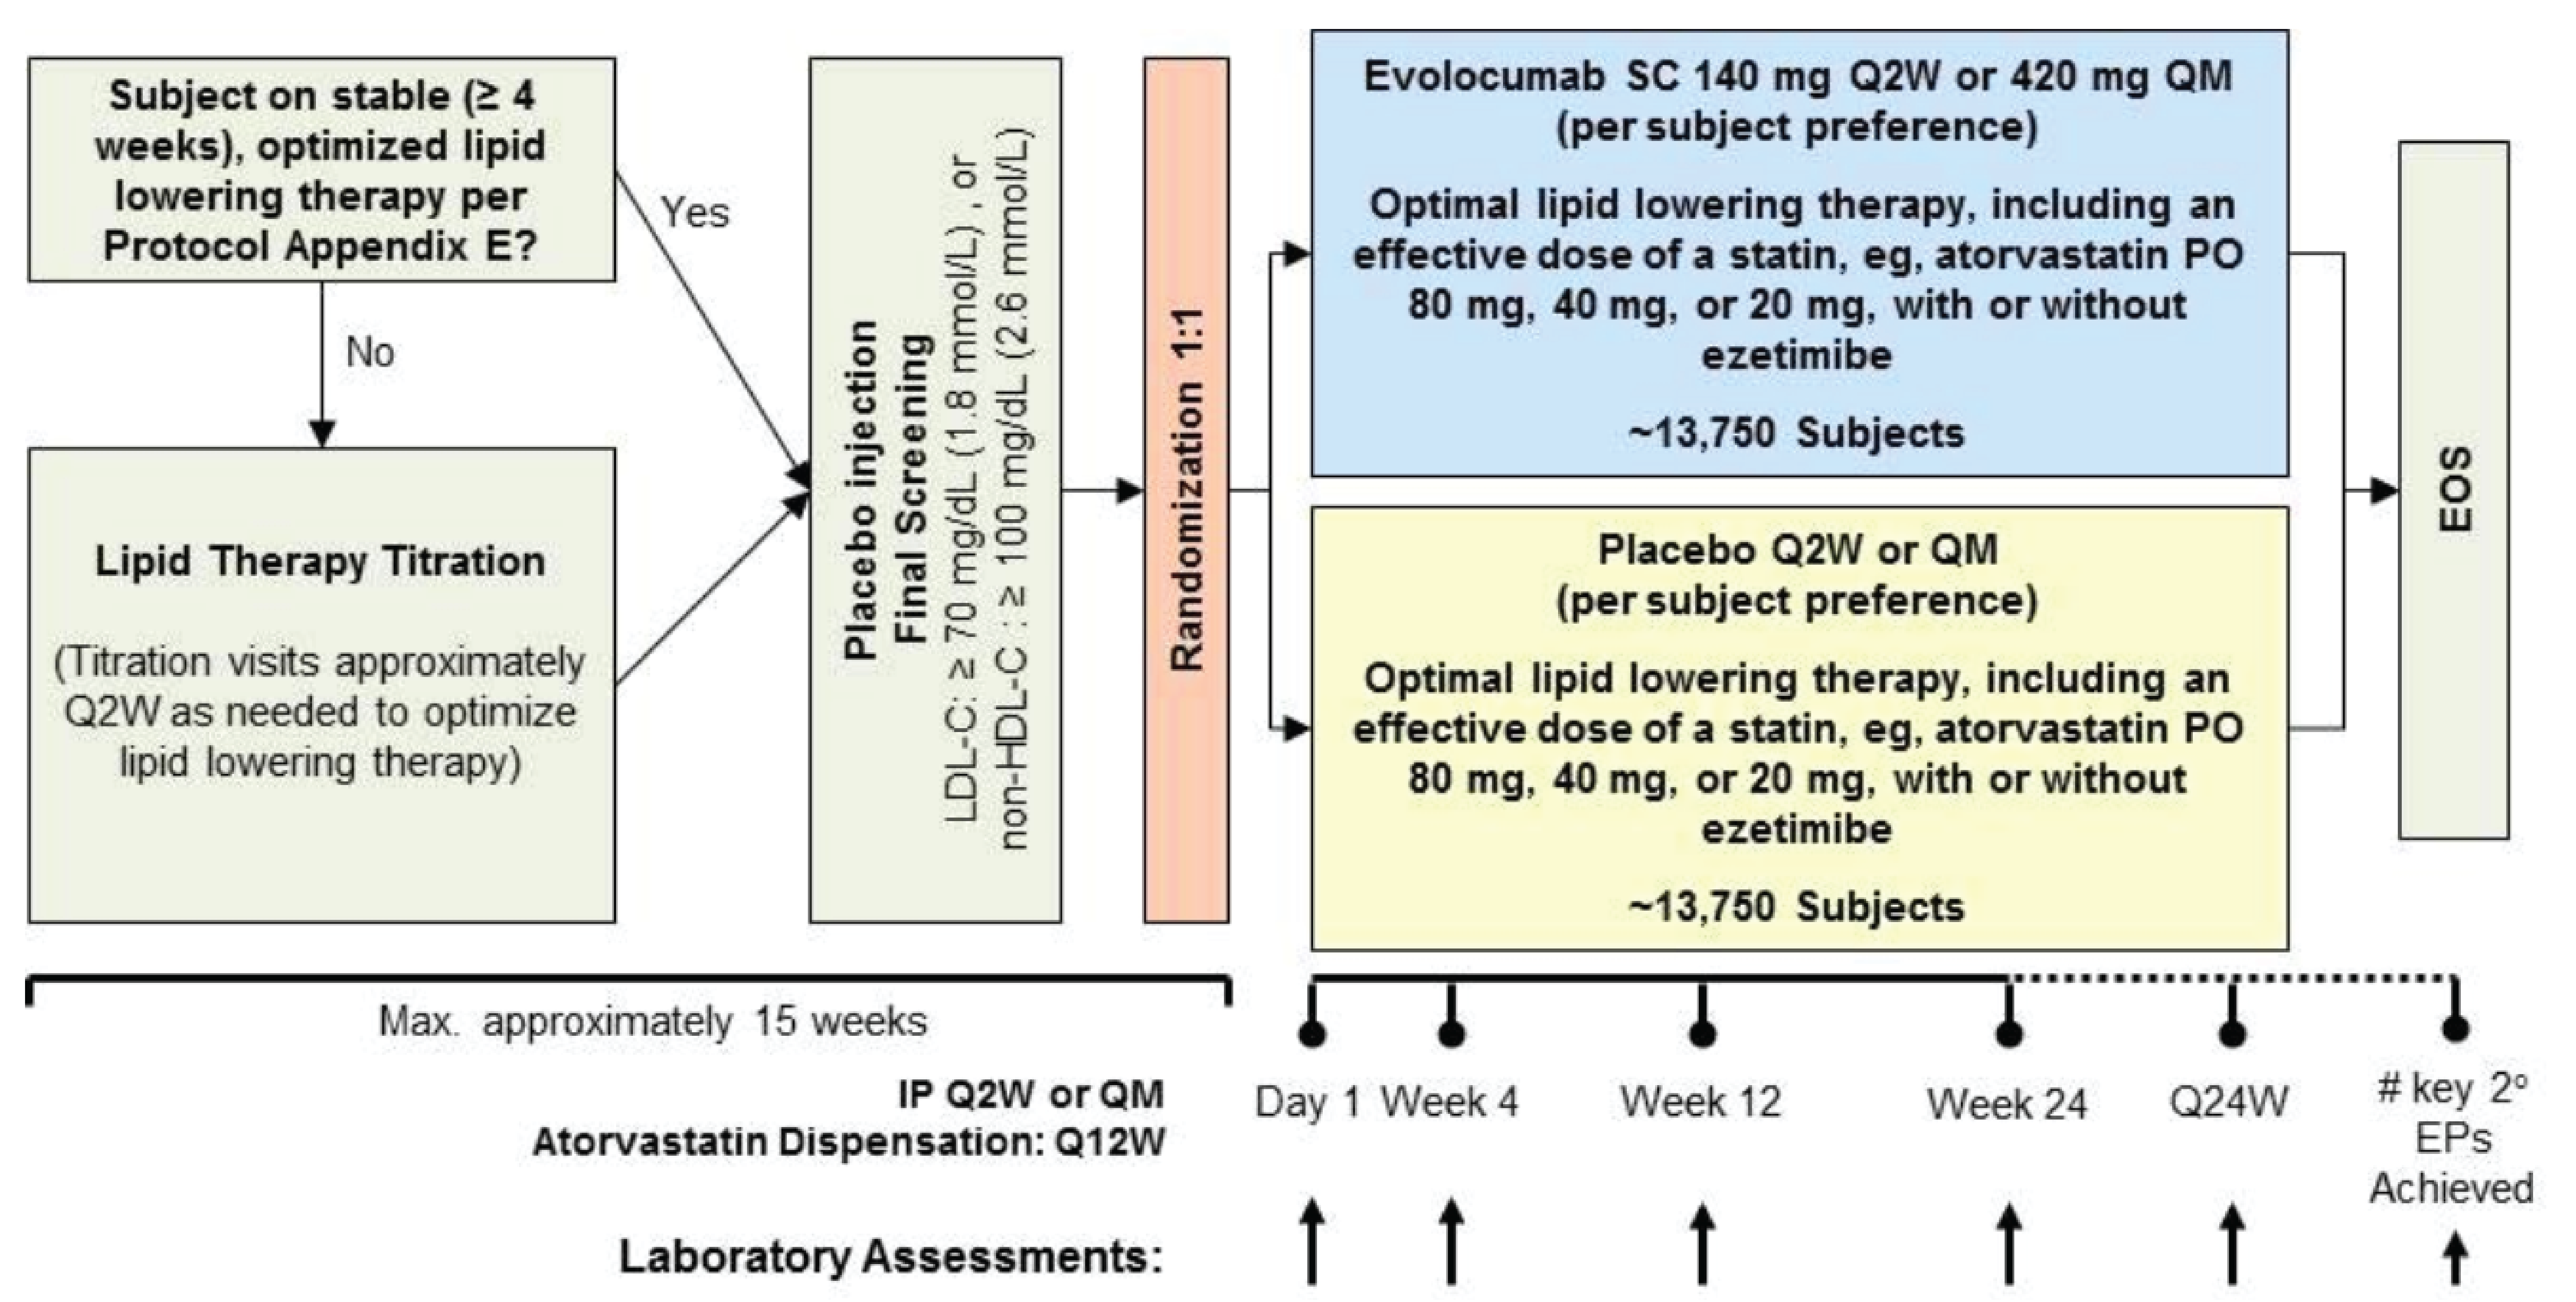
EOS = end of study; EP = end point; HDL-C = high-density-lipoprotein cholesterol; IP = investigational product; LDL-C = low-density lipoprotein cholesterol; PO = oral administration; Q12W = every 12 weeks; Q2W = every 2 weeks; Q24W = every 24 weeks; QM = once every month; SC = subcutaneous.
Source: Clinical Study Report of the FOURIER trial.12
Gencer et al. Study13
This study included patients from the FOURIER trial with a known date of prior MI.
Sabatine et al. (2018) Study14
This study included patients in the FOURIER trial who experienced a prior MI.
Interventions
FOURIER Trial12
Intervention and Comparator
Eligible patients were randomized in a 1:1 ratio to receive either subcutaneous evolocumab (140 mg once every 2 weeks administered as 1 prefilled autoinjector or pen or 420 mg once every month administered as 3 prefilled autoinjectors or pens) or matching placebo injection. The dosing schedule was selected in accordance with patient preference. On day 1, week 2 (for the every-2-week schedule only), and week 4, patients received instruction on and supervision in the use of the prefilled autoinjector or pen and remained for at least 30 minutes after injection for observation. Thereafter, patients administered the assigned intervention at a location external to the study centre. Dose adjustments of interventions were not permitted during the trial, with the exception of a switch in dose schedule. Every 3 months after the first 24 weeks of treatment, patients had the opportunity to switch between the 2 dosing schedules in accordance with their preference and subject to study drug availability.
Concomitant Lipid-Lowering Therapies
At randomization, all patients received optimized, background, lipid-lowering therapy, per study protocol (Table 8). Optimized, background, lipid-lowering therapy was defined as an effective statin dose (i.e., high-to-moderate intensity; at least atorvastatin 20 mg daily or equivalent), or, where locally approved, as a highly effective statin dose (i.e., at least atorvastatin 40 mg daily or equivalent, or any permitted dose of background statin therapy in combination with ezetimibe). Definitions of statin intensity were based on joint American College of Cardiology and the American Heart Association Guidelines (Table 9). In addition to background statin therapy, ezetimibe and other commercially available lipid-lowering therapy at dosages approved by local regulatory authorities were permitted.
Table 8: Permitted Background Statin Therapy in the FOURIER Trial
Background statin | Atorvastatin | Simvastatin | Rosuvastatin | Pitavastatin |
|---|---|---|---|---|
Permitted daily doses | 20 mga 40 mgb 80 mgb | 40 mga 80 mgb,c | 5 mga 10 mgb 20 mgb 40 mgb | 4 mga |
Note: Only the statins listed in Table 5 were used during study participation. Other lipid-lowering therapy was not a requirement of the FOURIER trial.
aFor patients with LDL-C greater than 2.6 mmol/L and not receiving highly effective statin therapy, the investigator was required to confirm that the selected dose of statin was optimized and appropriate for the patient for the duration of the study (i.e., a higher dose of statin therapy was not appropriate for the patient because of patient refusal, dose not tolerated, dose not available in the country, or other significant concern).
bThis dose was considered a highly effective therapy in the trial. Additionally, any of the statin doses listed in the table that were administered in combination with ezetimibe were considered to be highly effective therapy.
cSimvastatin 80 mg was not available in all participating countries in the trial. Approval by the local regulatory authority was required for patients using the simvastatin 80 mg dose in the trial.
Source: Clinical Study Report of the FOURIER trial.12
Table 9: Background Statin Intensity Defined in the FOURIER Trial
Background statin therapy | Definitions based on the joint ACC and AHA guidelines | ||
|---|---|---|---|
High-intensity statin (daily dose) | Moderate-intensity statin (daily dose) | Low-intensity statin (daily dose) | |
Atorvastatin | ≥ 40 mg | ≥ 10 mg to < 40 mg | < 10 mg |
Rosuvastatin | ≥ 20 mg | ≥ 5 mg to < 20 mg | < 5 mg |
Simvastatin | ≥ 80 mg | ≥ 20 mg to < 80 mg | < 20 mg |
Pravastatin | NA | ≥ 40 mg | < 40 mg |
Lovastatin | NA | ≥ 40 mg | < 40 mg |
Fluvastatin | NA | 80 mg | < 80 mg |
Pitavastatin | NA | ≥ 2 mg | < 2 mg |
ACC = American College of Cardiology; AHA = American Heart Association; NA = not applicable.
Source: Clinical Study Report of the FOURIER trial.12
Prohibited Treatments
The following treatments were prohibited during the trial:
all lipid therapies not being taken at the final screening visit, with the exception of ezetimibe, described later
mipomersen, lomitapide, and fibrates and derivatives, with the exception of fenofibrate at a stable (≥ 6 weeks before the final screening visit), optimized dose, per study protocol
any PCSK9 inhibitor other than evolocumab that was provided in the trial.
In general, no changes were made to patients’ background lipid-lowering therapy from baseline (i.e., end of screening) to the end of the study. However, because of the results of the IMPROVE-IT study,38 the addition of ezetimibe to a patient’s lipid-lowering regimen may be considered in the setting of an on-study ACS. The IMPROVE-IT study included adult patients who had been hospitalized in the preceding 10 days for an ACS, defined as an acute MI, with or without ST-segment elevation on electrocardiography, or high-risk unstable angina.38 Additionally, if a concomitant drug with the potential to impact the metabolism of a patient’s particular statin was required during the study, it may be necessary to withdraw or change the background statin therapy.
Outcomes
A list of efficacy end points assessed in this Clinical Review Report is provided in Table 10, followed by descriptions of the outcome measures. Summarized end points are based on outcomes included in the sponsor’s Summary of Clinical Evidence,2 as well as any outcomes identified as important to this review by the clinical experts consulted by CDA-AMC and input from patient and clinician groups and public drug plans. Using the same considerations, the CDA-AMC review team selected end points that were considered to be most relevant to expert committee deliberations and finalized this list of end points in consultation with members of the expert committee. Select notable harms outcomes considered to be important to expert committee deliberations were also assessed.
Table 10: Outcomes Summarized From the Gencer et al. and Sabatine et al. (2018) Studies
Outcome measure | Time point | FOURIER |
|---|---|---|
Clinical event outcomes | ||
Composite outcomes | ||
Time to cardiovascular death, MI, hospitalization for unstable angina, stroke, or coronary revascularization, whichever occurs first | Over a median follow-up of 26 monthsa | Primary end pointb |
Time to cardiovascular death, MI, or stroke, whichever occurs first | Key secondary end pointb | |
Cardiovascular events | ||
Time to first fatal or nonfatal MI | Over a median follow-up of 26 monthsa | Other secondary end pointsb |
Time to first coronary revascularization | ||
Mortality | ||
Time to cardiovascular death | Over a median follow-up of 26 monthsa | Other secondary end pointsb |
Time to death by any cause | Not assessed in the subgroup analyses of the FOURIER trial | Not assessed in the subgroup analyses of the FOURIER trial |
Cerebrovascular events | ||
Time to first fatal or nonfatal stroke | Over a median follow-up of 26 monthsa | Other secondary end pointsb |
Time to first ischemic fatal or nonfatal stroke or transient ischemic attack | Not assessed in the subgroup analyses of the FOURIER trial | Not assessed in the subgroup analyses of the FOURIER trial |
Lipid parameter outcomes | ||
LDL-C | ||
LDL-C response (LDL-C < 1.8 mmol/L) | Week 4 | Exploratory end pointb |
Change and percent change from baseline in LDL-C | Week 48 | Exploratory end pointb |
Notable harms | ||
Hypersensitivity | Not assessed in the subgroup analyses of the FOURIER trial | Not assessed in the subgroup analyses of the FOURIER trial |
Injection-site reactions | ||
Muscle events | ||
Neurocognitive events | ||
Demyelination events and peripheral neuropathy | ||
Hepatitis C infection | ||
Transaminase elevations and potential hepatic disorders | ||
LDL-C = low-density-lipoprotein cholesterol; MI = myocardial infarction.
aThe estimated study duration was 56 months from the date the first patient was randomized.
bMultiplicity was not taken into account for subgroup analyses in the Gencer et al.13 and Sabatine et al. (2018)14 studies.
Sources: Clinical Study Report of the FOURIER trial,12 Sabatine et al. (2018),14 and Gencer et al.13 Details included in the table are from the sponsor’s Summary of Clinical Evidence.2
FOURIER Trial12
Clinical Outcomes
The primary end point was time to cardiovascular death, MI, hospitalization for unstable angina, stroke, or coronary revascularization, whichever occurs first (including ischemic and hemorrhagic stroke). The key secondary end point was time to cardiovascular death, MI, or stroke, whichever occurs first. These end points were selected because they have the potential to be modified by a reduction in LDL-C. Other secondary end points included components of the composite end point, death by any cause, first hospitalization for worsening heart failure, and transient ischemic attack.
All fatal and nonfatal events, as well as events of new-onset diabetes, that occurred from randomization up to each patient’s end-of-study visit were collected by the investigator as potential end points for adjudication by an independent, external CEC, in the form of the Thrombolysis in Myocardial Infarction Study Group in Boston, Massachusetts. Additionally, the sponsor study team conducted regular reviews of the electronic case report forms used to identify any SAEs, lab parameters, and electrocardiogram findings that could indicate a potential end point. Such cases were brought to the attention of the study sites so that they could report the event as a potential end point for adjudication.
Adjudication of events was based on standardized definitions in the 2012 Standardized Definitions for Cardiovascular and Stroke End point Events in Clinical Trials and the 2012 Third Universal Definition of Myocardial Infarction.39 The CEC was blinded to treatment allocation and reviewed events according to prespecified criteria. Each potential end point was independently reviewed by 2 assigned adjudicators on the committee. If the adjudication results were concordant, then the adjudication of that potential end point was complete. If the adjudication results were discordant, then the potential end point was discussed at a committee meeting until a consensus was reached. If the committee was unable to reach consensus, then the case was submitted to the chairperson for final adjudication. If a reported potential end point was adjudicated as negative (i.e., did not meet the definition of an end point), the event was reclassified as an AE or SAE and was reported to regulatory agencies, as required.
Lipid Parameter Outcomes
Lipid parameter outcomes related to LDL-C were exploratory end points. For analysis of complete lipid profiles, fasting (at least 9 hours) blood samples were transported to 1 of the 2 generally used central laboratories, where standard laboratory procedures were used for lipid assessments. For all analyses related to LDL-C, unless otherwise specified, a reflexive approach based on the Friedewald equation was used to calculate LDL-C. If the calculated LDL-C was less than 1.0 mmol/L or if triglycerides were greater than 4.5 mmol/L, preparative ultracentrifugation LDL-C was determined.
Throughout the study, the central laboratory compared LDL-C concentrations with the patient’s prior assessed LDL-C level, without unblinding the study team, investigator, or site staff. If the measured LDL-C exceeded a preset threshold, the study centre was notified by an automated system to instruct the patient on adherence to the study drug, statin, ezetimibe, and any other concomitant lipid-lowering therapy, if applicable, and diet. To maintain the blind, the same reminder was provided to additional patients in each treatment group based on an algorithm that balanced the frequency of alerts for both treatment groups. Investigators were also informed if triglycerides were greater than 11.3 mmol/L to facilitate appropriate follow-up with the patient.
The Lipid Monitoring Committee monitored the LDL-C separation between treatment groups over the study period and was involved in the follow-up of patients meeting lipid-alert thresholds used by the central laboratory. This was a separate external, independent committee that reviewed unblinded lipid results by treatment group to ensure that the design parameter was being met, as described in the study protocol. This committee was advisory in nature and did not have access to clinical outcomes data; its primary function was to review treatment adherence and other relevant nonoutcomes data.
Patients were also monitored for very low LDL-C levels (< 0.6 mmol/L); these data were provided to the Data Monitoring Committee. This was a separate external, independent committee that reviewed the accumulating data from all ongoing studies of evolocumab for avoidable increased risk of harm to patients.
Notable Harms
The incidence of TEAEs was a safety end point in the FOURIER trial. All AEs were coded, using the Medical Dictionary for Regulatory Activities (MedDRA) Version 9.1, to a system organ class and preferred term. TEAEs were defined as any untoward medical occurrence in a patient, including worsening of a preexisting medical condition, that occurred between the first dose of the study drug and the end of the study.
When comparing evolocumab with relevant comparators for the indication under review, the following harms outcomes were considered important to expert committee deliberations: hypersensitivity, injection-site reactions, muscle events, neurocognitive events, demyelination events and peripheral neuropathy, hepatitis C infection, transaminase elevations, and potential hepatic disorders.
Statistical Analysis
FOURIER Trial12
The sample-size calculation was based on the key secondary end point (composite of cardiovascular death, MI, and stroke).12 The following assumptions were made: a 26-month enrolment period, a placebo event rate of 2% per year,40-48 a 3% loss-to-follow-up rate over the study duration of 56 months, attenuation of the treatment effect would occur due to a 3-month treatment lag, and noncompliance with study drug of 10% per year over the study. The HR for the triple composite end point was assumed to be 0.80, based on the 2010 Cholesterol Treatment Trialists' (CTT) Collaboration meta-analysis, which assessed the relation between LDL-C reduction and cardiovascular events.49 The overall type I error was controlled at a 0.05 significance level. Based on these assumptions, the attenuated HR was assumed to be 0.85, and based on a 2-sided log-rank test of demonstrating the superiority of evolocumab over placebo, a total sample size of 27,500 patients, with 1,630 patients experiencing a key secondary end point event, was required to ensure 90% power.50
The sponsor indicated that the subgroup analyses conducted in the Gencer et al. and Sabatine et al. (2018) studies were based on the efficacy analysis methods described in the FOURIER trial.15 The statistical analysis of efficacy end points in the Gencer et al. and Sabatine et al. (2018) studies is summarized in Table 11. Multiplicity was not taken into account for subgroup analyses.2,12
The primary analysis of all time-to-event end points, including the primary and secondary end points, was derived from a 2-sided log-rank test stratified by the randomization stratification factors to compare the survival functions of each treatment group. Kaplan-Meier curves were estimated and graphically displayed by treatment, and Kaplan-Meier estimates and corresponding 95% CIs were calculated. HRs and corresponding 95% CIs were estimated from a Cox model stratified by the randomization stratification factors. For all time-to-event end points, there were no imputations of data, with the exception of incomplete dates of events.
Events from the patient randomization date to the patient end-of-study date were included in the primary analyses of the primary and secondary efficacy end points. For all time-to-event calculations, the starting point was the patient’s date of randomization, and the event onset date was the onset date adjudicated by the CEC. The censoring date for patients without an event was the patient’s last nonfatal potential end point collection date. For patients who discontinued the study early (due to withdrawal of consent or loss to follow-up), vital status data were collected during the end-of-study visit period, before the overall study end date, as permitted by local law. All adjudicated cases of death collected up to the study end date, including cardiovascular death, noncardiovascular death, and undetermined death, were included in the analysis based on the adjudicated results.
Gencer et al. Study13
For the subgroup analyses, patients with a known date of prior MI were stratified according to recent MI (in the year before randomization) or remote MI (more than 1 year before randomization). Of note, patients who experienced an MI in the 4 weeks before randomization were excluded.
Sabatine et al. (2018) Study14
For the subgroup analyses, patients were stratified according to the number of prior MIs; the timing of prior MI (in relation to randomization); and the extent of coronary disease, defined as stenosis of 40% or more in 2 or more large vessels. According to the investigator, this was part of a prespecified analysis; the subgroup by timing of prior MI (< 2 years versus ≥ 2 years) was derived from previous studies of patients with a history of MI that identified time since MI to be a feature of patients who are at high cardiovascular risk and who would derive a greater relative and/or absolute risk reduction from therapies. For the purpose of this review, only the subgroup stratified by timing of prior MI is included in this report.
Analysis Populations
FOURIER Trial12
The sponsor indicated that the subgroup analyses conducted in the Gencer et al. and Sabatine et al. (2018) studies were based on the efficacy analysis methods described in the FOURIER trial.15 Therefore, the full analysis set (Table 12) was used for the primary analysis of the primary and secondary efficacy end points; all patients were analyzed according to their randomized treatment assignment.
Table 11: Statistical Analysis in the Gencer et al. and Sabatine et al. (2018) Studies
Efficacy end point | Statistical model | Adjustment factors | Handling of missing data | Sensitivity analyses |
|---|---|---|---|---|
Clinical outcomes | ||||
Time-to-event end points (including primary and secondary end points) |
| For the 2-sided log-rank test and the Cox model: Stratified by the randomization stratification factors:
| No imputation of data, with the exception of incomplete dates of events | Not applicable |
CI = confidence interval; HR = hazard ratio; KM = Kaplan-Meier; LDL-C = low-density-lipoprotein cholesterol.
Sources: Clinical Study Report of the FOURIER trial12 and additional information received from the sponsor on December 21, 2023.15 Details included in the table are from the sponsor’s Summary of Clinical Evidence.2
Table 12: Analysis Populations in the FOURIER Trial
Population | Definition | Application |
|---|---|---|
Full analysis set | All patients randomized | Efficacy analyses: all patients were analyzed according to their randomized treatment assignment |
Safety analysis set | Patients randomized who received at least 1 dose of the study drug | Safety analyses: patients were grouped according to their randomized treatment assignment unless the treatment received throughout the study was different than the randomized treatment assignment; if that was the case, the patient was grouped according to the actual treatment group |
Per-protocol analysis set | Patients who received at least 1 dose of the study drug and did not have any prespecified, selected important protocol deviations thought to impact the efficacy analyses | Sensitivity analyses |
Note: For the purpose of this review, the pharmacokinetic and electrocardiogram analysis sets are not included in Table 9.
Sources: Clinical Study Report of the FOURIER trial12 and additional information received from the sponsor on December 21, 2023.15 Details included in the table are from the sponsor’s Summary of Clinical Evidence.2
Results
FOURIER Trial12
Detailed information — including patient disposition, baseline characteristics, exposure to the study drug and concomitant lipid-lowering therapies, and efficacy and harms — on results from the FOURIER trial, which compared treatment groups, can be found in the December 2017 Clinical Review Report (Resubmission) on Evolocumab (Repatha), which is publicly available on the CDA-AMC website.
Patient Disposition
Gencer et al. Study13
A summary of patient disposition from the Gencer et al. study is presented in Table 13. The proportion of patients who discontinued the study was similar in the 2 treatment groups by subgroup, and were relatively low (i.e., ≤ 1.0% of patients in each treatment group).16
Table 13: Summary of Patient Disposition From the Gencer et al. Study (All Randomized Patients)
Patient disposition | Subgroup by timing of prior MI in the FOURIER trial | |||
|---|---|---|---|---|
Prior MI < 1 year | Prior MI ≥ 1 year | |||
Evolocumab (N = 2,821) | Placebo (N = 2,890) | Evolocumab (N = 8,308) | Placebo (N = 8,301) | |
Screened, N | NA | NA | ||
Included in the subgroup analysis, N | 2,821 | 2,890 | 8,308 | 8,301 |
Discontinued the study, n (%) | 27 (1.0) | 20 (0.7) | 48 (0.6) | 74 (0.9) |
Reason for discontinuation, n (%) | ||||
Full consent withdrawn | 27 (1.0) | 17 (0.6) | 46 (0.6) | 66 (0.8) |
Lost to follow-up | 0 | 3 (0.1) | 2 (< 0.1) | 8 (< 0.1) |
FAS, N | 2,821 | 2,890 | 8,308 | 8,301 |
PP, N | 2,799 | 2,876 | 8,272 | 8,265 |
Safety, N | 2,815 | 2,885 | 8,302 | 8,288 |
FAS = full analysis set; MI = myocardial infarction; NA = not available; PP = per protocol.
Source: Additional information received from the sponsor on January 30, 2024.16
Sabatine et al. (2018) Study14
A summary of patient disposition from the Sabatine et al. (2018) study is presented in Table 14. The proportion of patients who discontinued the study was similar in the 2 treatment groups by subgroup, and was relatively low (i.e., < 1.0% of patients in each treatment group).16
Table 14: Summary of Patient Disposition From the Sabatine et al. (2018) Study (All Randomized Patients)
Patient disposition | Subgroup by timing of prior MI in the FOURIER trial | |||
|---|---|---|---|---|
Prior MI < 2 years | Prior MI ≥ 2 years | |||
Evolocumab (N = 4,109) | Placebo (N = 4,293) | Evolocumab (N = 7,020) | Placebo (N = 6,898) | |
Screened, N | NA | NA | ||
Included in the subgroup analysis, N | 4,109 | 4,293 | 7,020 | 6,898 |
Discontinued the study, n (%) | 30 (0.7) | 36 (0.8) | 45 (0.6) | 58 (0.8) |
Reason for discontinuation, n (%) | ||||
Full consent withdrawn | 30 (0.7) | 30 (0.7) | 43 (0.6) | 53 (0.8) |
Lost to follow-up | 0 | 6 (0.1) | 2 (< 0.1) | 5 (< 0.1) |
FAS, N | 4,109 | 4,293 | 7,020 | 6,898 |
PP, N | 4,084 | 4,270 | 6,987 | 6,871 |
Safety, N | 4,103 | 4,284 | 7,014 | 6,889 |
FAS = full analysis set; MI = myocardial infarction; NA = not available; PP = per-protocol.
Source: Additional information received from the sponsor on January 30, 2024.16
Baseline Characteristics
Gencer et al. Study13
Summaries of baseline characteristics and concomitant lipid-lowering therapy use at baseline from the Gencer et al. study are presented in Table 15 and Table 16, respectively. The proportion of patients according to baseline demographics, relevant medical history, lipid parameter, and concomitant lipid-lowering therapy use was similar in the 2 treatment groups by subgroup.
Subgroup of Patients Who Experienced a Prior MI in the Previous Year16
A total of 2,821 patients were randomized to receive evolocumab and 2,890 patients were randomized to receive placebo. The proportion of patients who were male was 78.6% (n = 2,217) in the evolocumab group and 77.0% (n = 2,225) in the placebo group. The proportion of patients who were female was 21.4% (n = 604) in the evolocumab group and 23.0% (n = 665) in the placebo group. Most patients were white (85.5% [n = 2,413] of patients in the evolocumab group and 85.0% [n = 2,457] of patients in the placebo group). The remaining patients were Asian (9.9% [n = 278] of patients in the evolocumab group and 9.6% [n = 276] of patients in the placebo group), Black or African American (1.7% [n = 47] and 1.9% [n = 56] of patients, respectively), American Indian or Alaska Native [wording from original source] (0.4% [n = 12] and 0.7% [n = 20] of patients, respectively), and Native Hawaiian or other Pacific Islander (< 0.1% [n = 1] and 0.1% [n = 4] of patients, respectively). The mean age of patients was 59.7 years (SD = 9.3 years) in the evolocumab group and 59.5 years (SD = 9.2 years) in the placebo group.
Table 15: Summary of Baseline Characteristics From the Gencer et al. Study (All Randomized Patients)
Characteristic | Subgroup by timing of prior MI in the FOURIER trial | |||
|---|---|---|---|---|
Prior MI < 1 year | Prior MI ≥ 1 year | |||
Evolocumab (N = 2,821) | Placebo (N = 2,890) | Evolocumab (N = 8,308) | Placebo (N = 8,301) | |
Baseline demographics | ||||
Sex, n (%) | ||||
Female | 604 (21.4) | 665 (23.0) | 1,785 (21.5) | 1,750 (21.1) |
Male | 2,217 (78.6) | 2,225 (77.0) | 6,523 (78.5) | 6,551 (78.9) |
Race, n (%) | ||||
American Indian or Alaska Native [wording from original source] | 12 (0.4) | 20 (0.7) | 46 (0.6) | 48 (0.6) |
Asian | 278 (9.9) | 276 (9.6) | 777 (9.4) | 747 (9.0) |
Black or African American | 47 (1.7) | 56 (1.9) | 173 (2.1) | 190 (2.3) |
Native Hawaiian or Other Pacific Islander | 1 (< 0.1) | 4 (0.1) | 12 (0.1) | 4 (< 0.1) |
White | 2,413 (85.5) | 2,457 (85.0) | 7,151 (86.1) | 7,171 (86.4) |
Multiple | 5 (0.2) | 2 (< 0.1) | 12 (0.1) | 8 (< 0.1) |
Other | 65 (2.3) | 75 (2.6) | 137 (1.6) | 133 (1.6) |
Mean age, years (SD) | 59.7 (9.3) | 59.5 (9.2) | 63.0 (8.9) | 63.1 (8.7) |
Relevant medical history | ||||
Type of atherosclerosis, n (%) | ||||
MI | 2,821 (100.0) | 2,890 (100.0) | 8,308 (100.0) | 8,301 (100.0) |
Nonhemorrhagic stroke | 124 (4.4) | 141 (4.9) | 685 (8.2) | 689 (8.3) |
PAD | 133 (4.7) | 133 (4.6) | 788 (9.5) | 754 (9.1) |
Mean time from MI to enrolment, months (SD) | 5.379 (2.965) | 5.355 (2.911) | 85.739 (75.162) | 85.746 (74.518) |
Major cardiovascular risk factors, n (%) | ||||
Diabetes mellitus | 795 (28.2) | 904 (31.3) | 3,120 (37.6) | 3,043 (36.7) |
Age ≥ 65 years to ≤ 85 years | 904 (32.0) | 886 (30.7) | NA | NA |
MI or nonhemorrhagic stroke in the 6 months before screening | 2,142 (75.9) | 2,198 (76.1) | NA | NA |
Additional prior MI or stroke | 822 (29.1) | 834 (28.9) | NA | NA |
Current cigarette use | 717 (25.4) | 815 (28.2) | 2,331 (28.1) | 2,300 (27.7) |
History of symptomatic PAD, if enrolled with a history of MI or stroke | 133 (4.7) | 133 (4.6) | NA | NA |
Minor cardiovascular risk factors, n (%) | ||||
History of non-MI-related coronary revascularization | 573 (20.3) | 564 (19.5) | NA | NA |
Residual coronary artery disease (≥ 40% stenosis in ≥ 2 large vessels) | 748 (26.5) | 736 (25.5) | NA | NA |
HDL-C < 40 mg/dL for males or < 50 mg/dL for females | 1,242 (44.0) | 1,349 (46.7) | NA | NA |
hsCRP > 2 mg/L | 1,189 (42.1) | 1,260 (43.6) | NA | NA |
LDL-C ≥ 130 mg/dL or non-HDL-C ≥ 160 mg/dL | 354 (12.5) | 373 (12.9) | NA | NA |
Metabolic syndromea | 1,541 (54.6) | 1,573 (54.4) | NA | NA |
Risk factor count, n (%) | ||||
≥ 1 major risk factor or ≥ 2 minor risk factors | 2,814 (99.8) | 2,884 (99.8) | NA | NA |
No major risk factor and < 2 minor risk factors | 7 (0.2) | 6 (0.2) | NA | NA |
Baseline lipid parameter | ||||
Mean LDL-C, mmol/L (SD) | 2.453 (0.647) | 2.467 (0.647) | 2.563 (0.784) | 2.545 (0.711) |
HDL-C = high-density-lipoprotein cholesterol; hsCRP = high-sensitivity C-reactive protein; LDL-C = low-density-lipoprotein cholesterol; MI = myocardial infarction; NA = not available; PAD = peripheral artery disease; SD = standard deviation.
aMetabolic syndrome was defined as at least 3 of the following: waist circumference of greater than 40 inches for males and greater than 35 inches for females, triglyceride level of 1.7 mmol/L or greater, HDL-C level of less than 1.0 mmol/L for males and less than 1.3 mmol/L for females, systolic blood pressure of 130 mm Hg or greater or diastolic blood pressure of 85 mm Hg or greater or hypertension treated with medication, and fasting glucose level of 5.6 mmol/L or greater identified by the central laboratory at final screening.
Source: Additional information received from the sponsor on January 30, 2024.16
The mean time from MI to enrolment was 5.379 months (SD = 2.965 months) in the evolocumab group and 5.355 months (SD = 2.911 months) in the placebo group. Almost all patients had at least 1 major cardiovascular risk factor or at least 2 minor cardiovascular risk factors (99.8% [n = 2,814] of patients in the evolocumab group and 99.8% [n = 2,884] of patients in the placebo group). The remaining patients had no major risk factors and fewer than 2 minor risk factors (0.2% [n = 7] of patients in the evolocumab group and 0.2% [n = 6] of patients in the placebo group). At baseline, the mean LDL-C level was 2.453 mmol/L (SD = 0.647 mmol/L) in the evolocumab group and 2.467 mmol/L (SD = 0.647 mmol/L) in the placebo group.
Almost all patients were taking a statin at baseline (99.9% [n = 2,819] of patients in the evolocumab group and 100.0% [n = 2,889] of patients in the placebo group). The most commonly used statin — atorvastatin — was used by 84.6% (n = 2,387) of patients in the evolocumab group and 84.4% (n = 2,438) of patients in the placebo group. Most patients were taking high-intensity statins (77.7% [n = 2,191] of patients in the evolocumab group and 77.0% [n = 2,224] of patients in the placebo group) and moderate-intensity statins (22.2% [n = 626] of patients in the evolocumab group and 22.7% [n = 657] of patients in the placebo group). A total of 3.2% (n = 91) of patients in the evolocumab group and 3.3% (n = 95) of patients in the placebo group were taking ezetimibe at baseline. Overall, the proportion of patients taking a nonstatin lipid-lowering therapy — including fibrates (1.1% [n = 30] and 1.2% [n = 35], respectively), nicotinic acid and derivatives (0.2% [n = 5] and 0.1% [n = 3], respectively), bile acid sequestrants (< 0.1% [n = 1] in both treatment groups), and other lipid-lowering therapies (5.0% [n = 140] and 5.2% [n = 150], respectively) — was similar in the evolocumab and placebo groups.
Subgroup of Patients Who Were More Than 1 Year Beyond Their MI16
In general, the baseline characteristics of patients who were 1 year or more beyond their MI were similar to those of patients who experienced an MI in the previous year. A total of 8,308 patients were randomized to receive evolocumab and 8,301 patients were randomized to receive placebo. The mean time from MI to enrolment was 85.739 months (SD = 75.162 months) in the evolocumab group and 85.746 months (SD = 74.518 months) in the placebo group. Note that there was limited information available on cardiovascular risk factors for this subgroup.
Table 16: Summary of Baseline Concomitant Lipid-Lowering Therapy From the Gencer et al. Study (All Randomized Patients)
Concomitant therapy | Subgroup by timing of prior MI in the FOURIER trial | |||
|---|---|---|---|---|
Prior MI < 1 year | Prior MI ≥ 1 year | |||
Evolocumab (N = 2,821) | Placebo (N = 2,890) | Evolocumab (N = 8,308) | Placebo (N = 8,301) | |
Statin therapy intensity at baseline, per the joint ACC and AHA definition, n (%) | ||||
High | 2,191 (77.7) | 2,224 (77.0) | 5,780 (69.6) | 5,726 (69.0) |
Moderate | 626 (22.2) | 657 (22.7) | 2,506 (30.2) | 2,558 (30.8) |
Low | 1 (< 0.1) | 8 (0.3) | 16 (0.2) | 12 (0.1) |
Unknown | 1 (< 0.1) | 0 | 2 (< 0.1) | 1 (< 0.1) |
None | 2 (< 0.1) | 1 (< 0.1) | 4 (< 0.1) | 4 (< 0.1) |
Statins, n (%) | 2,819 (99.9) | 2,889 (100.0) | 8,304 (100.0) | 8,297 (100.0) |
Atorvastatin | 2,387 (84.6) | 2,438 (84.4) | 6,421 (77.3) | 6,453 (77.7) |
Rosuvastatin | 278 (9.9) | 271 (9.4) | 1,213 (14.6) | 1,153 (13.9) |
Simvastatin | 144 (5.1) | 164 (5.7) | 616 (7.4) | 629 (7.6) |
Pitavastatin | 8 (0.3) | 12 (0.4) | 42 (0.5) | 44 (0.5) |
Pravastatin | 3 (0.1) | 3 (0.1) | 11 (0.1) | 15 (0.2) |
Fluvastatin | 0 | 2 (< 0.1) | 4 (< 0.1) | 4 (< 0.1) |
Lovastatin | NR | NR | 1 (< 0.1) | 2 (< 0.1) |
HMG-CoA reductase inhibitors | NR | NR | 0 | 1 (< 0.1) |
Fibrates, n (%)a | 30 (1.1) | 35 (1.2) | 258 (3.1) | 271 (3.3) |
Fenofibrate | 29 (1.0) | 35 (1.2) | 244 (2.9) | 252 (3.0) |
Nicotinic acid and derivatives, n (%) | 5 (0.2) | 3 (0.1) | 56 (0.7) | 51 (0.6) |
Bile acid sequestrants, n (%) | 1 (< 0.1) | 1 (< 0.1) | 11 (0.1) | 11 (0.1) |
Other lipid-lowering therapies, n (%)a | 140 (5.0) | 150 (5.2) | 764 (9.2) | 777 (9.4) |
Ezetimibe | 91 (3.2) | 95 (3.3) | 537 (6.5) | 514 (6.2) |
Omega-3 fatty acids | 47 (1.7) | 52 (1.8) | 219 (2.6) | 273 (3.3) |
ACC = American College of Cardiology; AHA = American Heart Association; HMG-CoA = 3-hydroxy-3-methylglutaryl-coenzyme A; MI = myocardial infarction; NR = not reported.
Note: Coded using WHODrug Version June 1, 2016.
aThe most commonly used drug (identified as a preferred term) by medication category listed is based on a frequency of greater than 100 patients in any treatment group at baseline.
Source: Additional information received from the sponsor on February 7, 2024.51
Sabatine et al. (2018) Study14
Summaries of baseline characteristics and concomitant lipid-lowering therapy use at baseline from the Sabatine et al. (2018) study are presented in Table 17 and Table 18, respectively. The proportion of patients according to baseline demographics, relevant medical history, lipid parameter, and concomitant lipid-lowering therapy use were similar in the 2 treatment groups by subgroup.
Subgroup of Patients Who Experienced an MI in the Previous 2 Years16
In general, the baseline characteristics of patients who experienced an MI in the previous 2 years were similar to those of patients who experienced an MI in the previous year. A total of 4,109 patients were randomized to receive evolocumab and 4,293 patients were randomized to receive placebo. The mean time from MI to enrolment was 9.191 months (SD = 6.441 months) in the evolocumab group and 9.366 months (SD = 6.544 months) in the placebo group.
Subgroup of Patients Who Were 2 Years or More Beyond Their MI16
In general, the baseline characteristics of patients who were 2 years or more beyond their MI were similar to the those of patients who were 1 year or more beyond their MI. A total of 7,020 patients were randomized to receive evolocumab and 6,898 patients were randomized to receive placebo. The mean time from MI to enrolment was 98.252 months (SD = 75.324 months) in the evolocumab group and 99.600 months (SD = 74.460 months) in the placebo group. Note that there was limited information available on cardiovascular risk factors for this subgroup.
Table 17: Summary of Baseline Characteristics From the Sabatine et al. (2018) Study (All Randomized Patients)
Characteristic | Subgroup by timing of prior MI in the FOURIER trial | |||
|---|---|---|---|---|
Prior MI < 2 years | Prior MI ≥ 2 years | |||
Evolocumab (N = 4,109) | Placebo (N = 4,293) | Evolocumab (N = 7,020) | Placebo (N = 6,898) | |
Baseline demographics | ||||
Sex, n (%) | ||||
Female | 898 (21.9) | 1,007 (23.5) | 1,491 (21.2) | 1,408 (20.4) |
Male | 3,211 (78.1) | 3,286 (76.5) | 5,529 (78.8) | 5,490 (79.6) |
Race, n (%) | ||||
American Indian or Alaska Native [wording from original source] | 24 (0.6) | 33 (0.8) | 34 (0.5) | 35 (0.5) |
Asian | 442 (10.8) | 458 (10.7) | 613 (8.7) | 565 (8.2) |
Black or African American | 74 (1.8) | 85 (2.0) | 146 (2.1) | 161 (2.3) |
Native Hawaiian or Other Pacific Islander | 3 (< 0.1) | 4 (< 0.1) | 10 (0.1) | 4 (< 0.1) |
White | 3,465 (84.3) | 3,598 (83.8) | 6,099 (86.9) | 6,030 (87.4) |
Multiple | 6 (0.1) | 4 (< 0.1) | 11 (0.2) | 6 (< 0.1) |
Other | 95 (2.3) | 111 (2.6) | 107 (1.5) | 97 (1.4) |
Mean age, years (SD) | 60.2 (9.3) | 60.0 (9.2) | 63.4 (8.8) | 63.5 (8.5) |
Relevant medical history | ||||
Type of atherosclerosis, n (%) | ||||
MI | 4,109 (100.0) | 4,293 (100.0) | 7,020 (100.0) | 6,898 (100.0) |
Nonhemorrhagic stroke | 208 (5.1) | 236 (5.5) | 601 (8.6) | 594 (8.6) |
PAD | 223 (5.4) | 234 (5.5) | 698 (9.9) | 653 (9.5) |
Mean time from MI to enrolment, months (SD) | 9.191 (6.441) | 9.366 (6.544) | 98.252 (75.324) | 99.600 (74.460) |
Major cardiovascular risk factors, n (%) | ||||
Diabetes mellitus | 1,232 (30.0) | 1,394 (32.5) | 2,683 (38.2) | 2,553 (37.0) |
Age ≥ 65 to ≤ 85 years | 1,421 (34.6) | 1,419 (33.1) | NA | NA |
MI or nonhemorrhagic stroke in the 6 months before screening | 2,147 (52.3) | 2,214 (51.6) | NA | NA |
Additional prior MI or stroke | 1,215 (29.6) | 1,310 (30.5) | NA | NA |
Current cigarette use | 1,115 (27.1) | 1,219 (28.4) | 1,933 (27.5) | 1,896 (27.5) |
History of symptomatic PAD, if enrolled with a history of MI or stroke | 223 (5.4) | 234 (5.5) | NA | NA |
Minor cardiovascular risk factors, n (%) | ||||
History of non-MI–related coronary revascularization | 897 (21.8) | 915 (21.3) | NA | NA |
Residual coronary artery disease (≥ 40% stenosis in ≥ 2 large vessels) | 1,092 (26.6) | 1,144 (26.6) | NA | NA |
HDL-C < 40 mg/dL for males or < 50 mg/dL for females | 1,820 (44.3) | 1,962 (45.7) | NA | NA |
hsCRP > 2 mg/L | 1,707 (41.5) | 1,800 (41.9) | NA | NA |
LDL-C ≥ 130 mg/dL or non–HDL-C ≥ 160 mg/dL | 559 (13.6) | 578 (13.5) | NA | NA |
Metabolic syndromea | 2,281 (55.5) | 2,400 (55.9) | NA | NA |
Risk factor count, n (%) | ||||
≥ 1 major risk factor or ≥ 2 minor risk factors | 4,097 (99.7) | 4,277 (99.6) | NA | NA |
No major risk factor and < 2 minor risk factors | 12 (0.3) | 16 (0.4) | NA | NA |
Baseline lipid parameter | ||||
N | 4,109 | 4,292 | 7,020 | 6,898 |
Mean LDL-C, mmol/L (SD) | 2.476 (0.670) | 2.472 (0.639) | 2.570 (0.796) | 2.557 (0.727) |
HDL-C = high-density-lipoprotein cholesterol; hsCRP = high-sensitivity C-reactive protein; LDL-C = low-density-lipoprotein cholesterol; MI = myocardial infarction; NA = not available; PAD = peripheral artery disease; SD = standard deviation.
aMetabolic syndrome was defined as at least 3 of the following: waist circumference of greater than 40 inches for males and greater than 35 inches for females, triglyceride level of 1.7 mmol/L or greater, HDL-C level of less than 1.0 mmol/L for males and less than 1.3 mmol/L for females, systolic blood pressure of 140 mm Hg or greater or diastolic blood pressure of 85 mm Hg or greater or hypertension treated with medication, and fasting glucose level of 5.6 mmol/L or greater identified by the central laboratory at final screening.
Source: Additional information received from the sponsor on January 30, 2024.16
Table 18: Summary of Baseline Concomitant Lipid-Lowering Therapy From the Sabatine et al. (2018) Study (All Randomized Patients)
Concomitant therapy | Subgroup by timing of prior MI in the FOURIER trial | |||
|---|---|---|---|---|
Prior MI < 2 years | Prior MI ≥ 2 years | |||
Evolocumab (N = 4,109) | Placebo (N = 4,293) | Evolocumab (N = 7,020) | Placebo (N = 6,898) | |
Statin therapy intensity at baseline, per the joint ACC and AHA definition, n (%) | ||||
High | 3,115 (75.8) | 3,232 (75.3) | 4,856 (69.2) | 4,718 (68.4) |
Moderate | 986 (24.0) | 1,051 (24.5) | 2,146 (30.6) | 2,164 (31.4) |
Low | 5 (0.1) | 8 (0.2) | 12 (0.2) | 12 (0.2) |
Unknown | 1 (< 0.1) | 0 | 2 (< 0.1) | 1 (< 0.1) |
None | 2 (< 0.1) | 2 (< 0.1) | 4 (< 0.1) | 3 (< 0.1) |
Statins, n (%) | 4,107 (100.0) | 4,291 (100.0) | 7,016 (99.9) | 6,895 (100.0) |
Atorvastatin | 3,473 (84.5) | 3,610 (84.1) | 5,335 (76.0) | 5,281 (76.6) |
Rosuvastatin | 392 (9.5) | 404 (9.4) | 1,099 (15.7) | 1,020 (14.8) |
Simvastatin | 223 (5.4) | 247 (5.8) | 537 (7.6) | 546 (7.9) |
Pitavastatin | 16 (0.4) | 23 (0.5) | 34 (0.5) | 33 (0.5) |
Pravastatin | 3 (< 0.1) | 6 (0.1) | 11 (0.2) | 12 (0.2) |
Fluvastatin | 1 (< 0.1) | 2 (< 0.1) | 3 (< 0.1) | 4 (< 0.1) |
Lovastatin | NR | NR | 1 (< 0.1) | 2 (< 0.1) |
HMG-CoA reductase inhibitors | NR | NR | 0 | 1 (< 0.1) |
Fibrates, n (%)a | 51 (1.2) | 60 (1.4) | 237 (3.4) | 246 (3.6) |
Fenofibrate | 49 (1.2) | 59 (1.4) | 224 (3.2) | 228 (3.3) |
Nicotinic acid and derivatives, n (%) | 11 (0.3) | 6 (0.1) | 50 (0.7) | 48 (0.7) |
Bile acid sequestrants, n (%) | 4 (< 0.1) | 1 (< 0.1) | 8 (0.1) | 11 (0.2) |
Other lipid-lowering therapies, n (%)a | 222 (5.4) | 252 (5.9) | 682 (9.7) | 675 (9.8) |
Ezetimibe | 138 (3.4) | 155 (3.6) | 490 (7.0) | 454 (6.6) |
Omega-3 fatty acids | 82 (2.0) | 95 (2.2) | 184 (2.6) | 230 (3.3) |
ACC = American College of Cardiology; AHA = American Heart Association; HMG-CoA = 3-hydroxy-3-methylglutaryl-coenzyme A; MI = myocardial infarction; NR = not reported.
Note: Coded using WHODrug Version June 1, 2016.
aMost commonly used drug (identified as a preferred term) by medication category, listed based on a frequency of greater than 100 patients in any treatment group at baseline.
Source: Additional information received from the sponsor on February 7, 2024.51
Exposure to Study Treatments
Gencer et al. Study13
Study Drug16
A summary of patient exposure from the Gencer et al. study is presented in Table 19.
Subgroup of patients who experienced an MI in the previous year. Total study drug exposure was 5,899 patient-years in the evolocumab group and 6,063 patient-years in the placebo group. The median duration of study drug exposure was 25.791 months (interquartile range [IQR], 20.534 to 31.540 months) in the evolocumab group and 25.561 months (IQR, 20.271 to 31.934 months) in the placebo group. Total study exposure was 6,359 patient-years in the evolocumab group and 6,535 patient-years in the placebo group. The median duration of study exposure was 27.203 months (IQR, 22.111 to 32.493 months) in the evolocumab group and 27.269 months (IQR, 22.111 to 32.624 months) in the placebo group. Information on adherence was not available.
Subgroup of patients who were 1 year beyond their MI. The total patient-years of study drug exposure was 16,718 in the evolocumab group and 16,644 in the placebo group. The total patient-years of study exposure was 17,985 in the evolocumab group and 17,968 in the placebo group. The median durations of study drug exposure and study exposure were similar to the corresponding durations in the subgroup of patients who experienced an MI in the previous year. Information on adherence was not available.
Table 19: Summary of Patient Exposure From the Gencer et al. Study (Safety Analysis Set)
Exposure | Subgroup by timing of prior MI in the FOURIER trial | |||
|---|---|---|---|---|
Prior MI < 1 year | Prior MI ≥ 1 year | |||
Evolocumab (N = 2,815) | Placebo (N = 2,885) | Evolocumab (N = 8,302) | Placebo (N = 8,288) | |
Total study drug exposure, patient-years | 5,899 | 6,063 | 16,718 | 16,644 |
Mean duration, months (SD) | 25.145 (8.592) | 25.217 (8.588) | 24.165 (8.004) | 24.098 (8.105) |
Median duration, months, (IQR) | 25.791 | 25.561 | 24.805 | 24.706 |
Total, study exposure, patient-years | 6,359 | 6,535 | 17,985 | 17,968 |
Mean duration, months (SD) | 27.107 (6.797) | 27.184 (6.765) | 25.995 (6.243) | 26.015 (6.274) |
Median duration, months (IQR) | 27.203 | 27.269 | 25.889 | 25.988 |
Adherence | NA | NA | NA | NA |
IQR = interquartile range; MI = myocardial infarction; NA = not available; SD = standard deviation.
Source: Additional information received from the sponsor on January 30, 2024.16
Sabatine et al. (2018) Study14
Study Drug16
A summary of patient exposure from the Sabatine et al. (2018) study is presented in Table 20.
Subgroup of patients who experienced an MI in the previous 2 years. The total patient-years of study drug exposure was 8,598 in the evolocumab group and 8,980 in the placebo group. The total patient-years of study exposure was 9,266 in the evolocumab group and 9,691 in the placebo group. The median durations of study drug exposure and study exposure were similar to the corresponding durations in the subgroup of patients who experienced an MI in the previous year. Information on adherence was not available.
Subgroup of patients who were 2 years or more beyond their MI. The total patient-years of study drug exposure was 14,018 in the evolocumab group and 13,727 in the placebo group. The total patient-years of study exposure was 15,078 in the evolocumab group and 14,812 in the placebo group. The median durations of study drug exposure and study exposure were similar to the corresponding durations in the subgroup of patients who were 1 year or more beyond their MI. Information on adherence was not available.
Table 20: Summary of Patient Exposure From the Sabatine et al. (2018) Study (Safety Analysis Set)
Exposure | Subgroup by timing of prior MI in the FOURIER trial | |||
|---|---|---|---|---|
Prior MI < 2 years | Prior MI ≥ 2 years | |||
Evolocumab (N = 4,103) | Placebo (N = 4,284) | Evolocumab (N = 7,014) | Placebo (N = 6,889) | |
Total study drug exposure, patient-years | 8,598 | 8,980 | 14,018 | 13,727 |
Mean duration, months (SD) | 25.147 (8.602) | 25.154 (8.663) | 23.983 (7.871) | 23.910 (7.940) |
Median duration, months (IQR) | 25.791 | 25.741 | 24.608 | 24.509 |
Total study exposure, patient-years | 9,266 | 9,691 | 15,078 | 14,812 |
Mean duration, months (SD) | 27.099 (6.787) | 27.147 (6.795) | 25.796 (6.121) | 25.801 (6.128) |
Median duration, months (IQR) | 27.236 | 27.368 | 25.593 | 25.561 |
Adherence | NA | NA | NA | NA |
IQR = interquartile range; MI = myocardial infarction; NA = not available; SD = standard deviation.
Source: Additional information received from the sponsor on January 30, 2024.16
Efficacy
FOURIER Trial12
Detailed information on the key efficacy outcomes in the FOURIER trial can be found in the December 2017 Clinical Review Report (Resubmission) on Evolocumab (Repatha), which is publicly available on the CDA-AMC website.
The median length of follow-up was 25.99 months (IQR, 21.72 to 30.42 months) for all patients in the full analysis set of the FOURIER trial.
Clinical Outcomes From the Gencer et al.13 and Sabatine et al. (2018)14 Studies
The key efficacy results from the subgroup analyses in the Gencer et al. and Sabatine et al. (2018) studies are summarized in Table 22 and Table 21, respectively.
Cardiovascular Death, MI, or Stroke15
Of the patients who experienced an MI in the previous year, the composite end point of cardiovascular death, MI, and stroke was met by 6.45% (n = 182) of patients taking evolocumab and by 8.58% (n = 248) of patients taking placebo (HR = 0.75; 95% CI, 0.62 to 0.91). Of the patients who were 1 year or more beyond their MI, this composite end point was met by 6.04% (n = 502) of patients taking evolocumab and by 7.04% (n = 584) of patients taking placebo (HR = 0.85; 95% CI, 0.76 to 0.96).
Of the patients who experienced an MI in the previous 2 years, the composite end point of cardiovascular death, MI, and stroke was met by 6.45% (n = 265) of patients taking evolocumab and by 8.43% (n = 362) of patients taking placebo (HR = 0.76; 95% CI, 0.64 to 0.89). Of the patients who were 2 years or more beyond their MI, this composite end point was met by 5.97% (n = 419) of patients taking evolocumab and by 6.81% (n = 470) of patients taking placebo (HR = 0.87; 95% CI, 0.76 to 0.99). The absolute risk reduction was 2.9% (95% CI, 1.2% to 4.5%) in patients who experienced an MI in the previous 2 years and 1.0% (95% CI, –0.7% to 2.7%) in patients who were 2 years or more beyond their MI.14
Cardiovascular Death15
Of the patients who experienced an MI in the previous year, the end point of cardiovascular death was met by 1.77% (n = 50) of patients taking evolocumab and by 1.80% (n = 52) of patients taking placebo (HR = 1.00; 95% CI, 0.68 to 1.47). Of the patients who were 1 year or more beyond their MI, this end point was met by 1.88% (n = 156) of patients taking evolocumab and by 1.64% (n = 136) of patients taking placebo (HR = 1.15; 95% CI, 0.91 to 1.44).
This mortality end point was not assessed in the subgroups of patients who experienced an MI in the previous 2 years or who were 2 years or more beyond their MI.
MI (Fatal or Nonfatal)15
Of the patients who experienced an MI in the previous year, the end point of fatal or nonfatal MI was met by 4.50% (n = 127) of patients taking evolocumab and by 6.61% (n = 191) of patients taking placebo (HR = 0.67; 95% CI, 0.54 to 0.84). Of the patients who were 1 year or more beyond their MI, this cardiovascular end point was met by 3.56% (n = 296) of patients taking evolocumab and by 4.57% (n = 379) of patients taking placebo (HR = 0.78; 95% CI, 0.67 to 0.91).
This cardiovascular end point was not assessed in the subgroup of patients who experienced an MI in the previous 2 years or who were 2 years or more beyond their MI.
Stroke (Fatal or Nonfatal)15
Of the patients who experienced an MI in the previous year, the end point of fatal or nonfatal stroke was met by 1.06% (n = 30) of patients taking evolocumab and by 1.31% (n = 38) of patients taking placebo (HR = 0.81; 95% CI, 0.50 to 1.31). For the patients who were 1 year or more beyond their MI, this cerebrovascular end point was met by 1.32% (n = 110) of patients taking evolocumab and by 1.65% (n = 137) of patients taking placebo (HR = 0.80; 95% CI, 0.62 to 1.03).
This cerebrovascular end point was not assessed in the subgroup of patients who experienced an MI in the 2 previous years or who were 2 years or more beyond their MI.
Cardiovascular Death, MI, Hospitalization for Unstable Angina, Stroke, or Coronary Revascularization15
Of the patients who experienced an MI in the previous year, the composite end point of cardiovascular death, MI, hospitalization for unstable angina, stroke, and coronary revascularization was met by 11.45% (n = 323) of patients taking evolocumab and by 14.12% (n = 408) of patients taking placebo (HR = 0.81; 95% CI, 0.70 to 0.93). Of the patients who were 1 year or more beyond their MI, this composite end point was met by 10.24% (n = 851) of patients taking evolocumab and by 11.10% (n = 921) of patients taking placebo (HR = 0.92; 95% CI, 0.84 to 1.01).
Of the patients who experienced an MI in the previous 2 years, the composite end point of cardiovascular death, MI, hospitalization for unstable angina, stroke, and coronary revascularization was met by 11.17% (n = 459) of patients taking evolocumab and by 13.72% (n = 589) of patients taking placebo (HR = 0.80; 95% CI, 0.71 to 0.91). Of the patients who were 2 years or more beyond their MI, this composite end point was met by 10.19% (n = 715) of patients taking evolocumab and by 10.73% (n = 740) of patients taking placebo (HR = 0.95; 95% CI, 0.85 to 1.05). The absolute risk reduction was 3.4% (95% CI, 1.4% to 5.3%) in patients who experienced an MI in the previous 2 years and 0.8% (95% CI, –1.1% to 2.7%) in patients who were 2 years or more beyond their MI.14
Coronary Revascularization15
Of the patients who experienced an MI in the previous year, the end point of coronary revascularization was met by 7.30% (n = 206) of patients taking evolocumab and by 9.79% (n = 283) of patients taking placebo (HR = 0.74; 95% CI, 0.62 to 0.89). Of the patients who were 1 year or more beyond their MI, this cardiovascular end point was met by 5.89% (n = 489) of patients taking evolocumab and by 6.95% (n = 577) of patients taking placebo (HR = 0.84; 95% CI, 0.75 to 0.95).
This cardiovascular end point was not assessed in the subgroup of patients who experienced an MI in the previous 2 years or who were 2 years or more beyond their MI.
Other Clinical Outcomes of Importance
Transient ischemic attack and death by any cause were identified as relevant to expert committee deliberations, but these outcomes were not assessed in the subgroup analyses of the FOURIER trial.
Lipid Parameter Outcomes From the Gencer et al.13 and Sabatine et al. (2018)14 Studies
Treatment Response Based on LDL-C16
Of the patients who experienced an MI in the previous year, 244 of 2,821 patients (8.6%) in the evolocumab group and 198 of 2,889 patients (6.9%) in the placebo group had an LDL-C level of less than 1.8 mmol/L at baseline. Of the patients who experienced an MI in the previous year, 2,468 of 2,692 patients (91.7%) in the evolocumab group and 502 of 2,764 patients (18.2%) in the placebo group achieved a treatment response of an LDL-C level of less than 1.8 mmol/L at week 4. Of the patients who were 1 year or more beyond their MI, 517 of 8,308 patients (6.2%) in the evolocumab group and 560 of 8,301 patients (6.7%) in the placebo group had an LDL-C level of less than 1.8 mmol/L at baseline. Of the patients who were 1 year or more beyond their MI, 7,283 of 8,047 patients (90.5%) in the evolocumab group and 1,365 of 7,994 patients (17.1%) in the placebo group achieved a treatment response of an LDL-C level of less than 1.8 mmol/L at week 4.
Of the patients who experienced an MI in the previous 2 years, 331 of 4,109 patients (8.1%) in the evolocumab group and 284 of 4,292 patients (6.6%) in the placebo group had an LDL-C level of less than 1.8 mmol/L at baseline. Of the patients who experienced an MI in the previous 2 years, 3,608 of 3,941 patients (91.6%) in the evolocumab group and 753 of 4,094 patients (18.4%) in the placebo group achieved a treatment response of an LDL-C level of less than 1.8 mmol/L at week 4. Of the patients who were 2 years or more beyond their MI, 430 of 7,020 patients (6.1%) in the evolocumab group and 474 of 6,898 patients (6.9%) in the placebo group had an LDL-C level of less than 1.8 mmol/L at baseline. Of the patients who were 2 years or more beyond their MI, 6,143 of 6,798 patients (90.4%) in the evolocumab group and 1,114 of 6,664 patients (16.7%) in the placebo group achieved a treatment response of an LDL-C level of less than 1.8 mmol/L at week 4.
Change From Baseline in LDL-C16
Of the patients who experienced an MI in the previous year, the mean LDL-C level was 2.453 mmol/L (SD = 0.647 mmol/L) in the evolocumab group and 2.467 mmol/L (SD = 0.647 mmol/L) in the placebo group at baseline. Of the patients who experienced an MI in the previous year, the mean percent change from baseline to week 48 in LDL-C was –59.90% (SD = 30.12%) in the evolocumab group and 2.00% (SD = 27.41%) in the placebo group. Of the patients who were 1 year or more beyond their MI, the mean LDL-C level was 2.563 mmol/L (SD = 0.784 mmol/L) in the evolocumab group and 2.545 mmol/L (SD = 0.711 mmol/L) in the placebo group at baseline. Of the patients who were 1 year or more beyond their MI, the mean percent change from baseline to week 48 in LDL-C level was –60.60% (SD = 30.53%) in the evolocumab group and –0.98% (SD = 25.70%) in the placebo group.
Table 21: Summary of Key Efficacy Results From the Gencer et al. Study (Full Analysis Set)
Efficacy end point | Subgroup by timing of prior MI in the FOURIER trial | |||
|---|---|---|---|---|
Prior MI < 1 year | Prior MI ≥ 1 year | |||
Evolocumab (N = 2,821) | Placebo (N = 2,890) | Evolocumab (N = 8,308) | Placebo (N = 8,301) | |
Clinical event outcomes | ||||
Cardiovascular death, MI, or stroke | ||||
Number of patients with event, n (%) | 182 (6.45) | 248 (8.58) | 502 (6.04) | 584 (7.04) |
Hazard ratio (95% CI)a | 0.75 (0.62 to 0.91) | 0.85 (0.76 to 0.96) | ||
Nominal P value | 0.0028 | 0.0091 | ||
Interaction P valueb | 0.244 | |||
KM estimate at 36 months, % (95% CI) | 7.71 | 10.87 | 8.24 | 9.51 |
Absolute risk reduction, % (95% CI) | 3.16 (1.17 to 5.16) | 1.27 (–0.15 to 2.69) | ||
Cardiovascular death | ||||
Number of patients with event, n (%) | 50 (1.77) | 52 (1.80) | 156 (1.88) | 136 (1.64) |
Hazard ratio (95% CI)a | 1.00 (0.68 to 1.47) | 1.15 (0.91 to 1.44) | ||
Nominal P value | 0.9874 | 0.2426 | ||
Interaction P valueb | 0.5287 | |||
KM estimate at 36 months, % (95% CI) | 2.31 (1.56 to 3.06) | 2.50 (1.61 to 3.38) | 2.52 (2.02 to 3.02) | 2.20 (1.71 to 2.69) |
Absolute risk reduction, % (95% CI) | 0.19 (–0.97 to 1.34) | –0.32 (–1.02 to 0.38) | ||
MI (fatal or nonfatal) | ||||
Number of patients with event, n (%) | 127 (4.50) | 191 (6.61) | 296 (3.56) | 379 (4.57) |
Hazard ratio (95% CI)a | 0.67 (0.54 to 0.84) | 0.78 (0.67 to 0.91) | ||
Nominal P value | 0.0006 | 0.0011 | ||
Interaction P valueb | 0.2992 | |||
KM estimate at 36 months, % (95% CI) | 5.24 (4.26 to 6.21) | 8.04 (6.76 to 9.31) | 4.76 (3.95 to 5.56) | 6.37 (5.53 to 7.20) |
Absolute risk reduction, % (95% CI) | 2.80 (1.20 to 4.40) | 1.61 (0.46 to 2.77) | ||
Stroke (fatal or nonfatal) | ||||
Number of patients with event, n (%) | 30 (1.06) | 38 (1.31) | 110 (1.32) | 137 (1.65) |
Hazard ratio (95% CI)a | 0.81 (0.50 to 1.31) | 0.80 (0.62 to 1.03) | ||
Nominal P value | 0.3869 | 0.0799 | ||
Interaction P valueb | 0.9409 | |||
KM estimate at 36 months, % (95% CI) | 1.34 (0.80 to 1.88) | 1.88 (1.14 to 2.61) | 1.96 (1.39 to 2.52) | 2.15 (1.73 to 2.56) |
Absolute risk reduction, % (95% CI) | 0.54 (–0.37 to 1.45) | 0.19 (–0.51 to 0.89) | ||
Cardiovascular death, MI, hospitalization of unstable angina, stroke, or coronary revascularization | ||||
Number of patients with event, n (%) | 323 (11.45) | 408 (14.12) | 851 (10.24) | 921 (11.10) |
Hazard ratio (95% CI)a | 0.81 (0.70 to 0.93) | 0.92 (0.84 to 1.01) | ||
Nominal P value | 0.0039 | 0.0748 | ||
Interaction P valueb | 0.1277 | |||
KM estimate at 36 months, % (95% CI) | 13.49 | 17.19 | 13.33 | 14.38 |
Absolute risk reduction, % (95% CI) | 3.70 (1.29 to 6.10) | 1.05 (–0.58 to 2.69) | ||
Coronary revascularization | ||||
Number of patients with event, n (%) | 206 (7.30) | 283 (9.79) | 489 (5.89) | 577 (6.95) |
Hazard ratio (95% CI)a | 0.74 (0.62 to 0.89) | 0.84 (0.75 to 0.95) | ||
Nominal P value | 0.0012 | 0.0057 | ||
Interaction P valueb | 0.2339 | |||
KM estimate at 36 months, % (95% CI) | 8.84 | 12.14 | 7.49 | 9.12 |
Absolute risk reduction, % (95% CI) | 3.30 (1.22 to 5.38) | 1.63 (0.36 to 2.89) | ||
Lipid parameter outcomes | ||||
Treatment response based on LDL-C < 1.8 mmol/L | ||||
Nc | 2,821 | 2,889 | 8,308 | 8,301 |
Patients with LDL-C < 1.8 mmol/L at baseline, n (%)d | 244 (8.6) | 198 (6.9) | 517 (6.2) | 560 (6.7) |
Nc | 2,692 | 2,764 | 8,047 | 7,994 |
Patients with LDL-C < 1.8 mmol/L at week 4, n (%)d | 2,468 (91.7) | 502 (18.2) | 7,283 (90.5) | 1,365 (17.1) |
Change from baseline in LDL-C | ||||
N | 2,821 | 2,889 | 8,308 | 8,301 |
Mean LDL-C at baseline, mmol/L (SD)d | 2.453 (0.647) | 2.467 (0.647) | 2.563 (0.784) | 2.545 (0.711) |
N | 2,585 | 2,639 | 7,657 | 7,610 |
Mean LDL-C at week 48, mmol/L (SD)d | 0.979 (0.781) | 2.477 (0.843) | 1.020 (0.897) | 2.480 (0.843) |
Mean change from baseline to week 48 in LDL-C, mmol/L (SD)d | –1.461 (0.810) | 0.016 (0.696) | –1.543 (0.892) | –0.062 (0.675) |
Mean percent change from baseline to week 48 in LDL-C, % (SD)d | –59.90 (30.12) | 2.00 (27.41) | –60.60 (30.53) | –0.98 (25.70) |
CI = confidence interval; IQR = interquartile range; KM = Kaplan-Meier; LDL-C = low-density-lipoprotein cholesterol; MI = myocardial infarction; SD = standard deviation.
Notes: In the subgroup of patients who experienced an MI in the previous year, those whose most recent MI or stroke was in the 4 weeks before randomization were excluded from the FOURIER trial.
The median length of follow-up was 25.99 months (IQR, 21.72 to 30.42 months). Patients with events that occurred between patient randomization date and the patient last confirmed survival status date, inclusive, were included. The censoring date of patients without an event was the patient last nonfatal potential end point collection date.
Multiplicity was not taken into account for subgroup analyses.
Time to hospitalization for unstable angina was not a prespecified end point in the FOURIER trial; an ad hoc analysis was performed to ensure that the results were provided for each individual component of the primary end point.
aBased on a Cox model stratified by the randomization stratification factors collected with the Interactive Voice Response System.
bBased on a Cox model, adding subgroup and subgroup-by-treatment interaction.
cNumber of patients observed at each visit; the analysis set was all randomized patients.
dSummary statistics were based on observed data. When the calculated LDL-C was less than 40 mg/dL or triglycerides were greater than 400 mg/dL, the calculated LDL-C was replaced with ultracentrifugation LDL-C, if available.
Sources: Additional information received from the sponsor on December 21, 2023,15 and January 30, 2024.16 Details included in the table are from the sponsor’s Summary of Clinical Evidence.2
Of the patients who experienced an MI in the previous 2 years, the mean LDL-C level was 2.476 mmol/L (SD = 0.670 mmol/L) in the evolocumab group and 2.472 mmol/L (SD = 0.639 mmol/L) in the placebo group at baseline. Of the patients who experienced an MI in the previous 2 years, the mean percent change from baseline to week 48 in LDL-C level was –59.61% (SD = 31.05%) in the evolocumab group and 1.28% (SD = 26.73%) in the placebo group. Of the patients who were 2 years or more beyond their MI, the mean LDL-C level was 2.570 mmol/L (SD = 0.796 mmol/L) in the evolocumab group and 2.557 mmol/L (SD = 0.727 mmol/L) in the placebo group at baseline. Of the patients who were 2 years or more beyond their MI, the mean percent change from baseline to week 48 in LDL-C level was –60.90% (SD = 30.05%) in the evolocumab group and –1.14% (SD = 25.79%) in the placebo group.
Harms
FOURIER Trial12
Detailed information on harms outcomes in the FOURIER trial can be found in the December 2017 Clinical Review Report (Resubmission) on Evolocumab (Repatha), which is publicly available on the CDA-AMC website.
Treatment-Emergent Adverse Events
The proportion of patients with at least 1 TEAE or with at least 1 SAE was similar in the 2 treatment groups. A total of 10,664 patients (77.4%) in the evolocumab group and 10,644 patients (77.4%) in the placebo group reported at least 1 TEAE, with the most common TEAE being diabetes mellitus, which was reported in 1,207 patients (8.8%) and 1,130 patients (8.2%), respectively. A total of 3,410 patients (24.8%) in the evolocumab group and 3,404 patients (24.7%) in the placebo group reported at least 1 SAE, with the most common SAE being unstable angina, which was reported in 233 patients (1.7%) and 278 patients (2.0%), respectively.
The proportion of patients who stopped treatment due to any TEAE was also similar in the 2 treatment groups. A total of 608 patients (4.4%) in the evolocumab group and 573 patients (4.2%) in the placebo group stopped treatment due to any TEAE, with the most common TEAE being myalgia, which was reported in 37 patients (0.3%) and 46 patients (0.3%), respectively.
Table 22: Summary of Key Efficacy Results From the Sabatine et al. (2018) Study (Full Analysis Set)
Efficacy end point | Subgroup by timing of prior MI in the FOURIER trial | |||
|---|---|---|---|---|
Prior MI < 2 years | Prior MI ≥ 2 years | |||
Evolocumab (N = 4,109) | Placebo (N = 4,293) | Evolocumab (N = 7,020) | Placebo (N = 6,898) | |
Clinical event outcomes | ||||
Cardiovascular death, MI, or stroke | ||||
Number of patients with event, n (%) | 265 (6.45) | 362 (8.43) | 419 (5.97) | 470 (6.81) |
Hazard ratio (95% CI)a | 0.76 (0.64 to 0.89) | 0.87 (0.76 to 0.99) | ||
Nominal P value | 0.0005 | 0.0402 | ||
Interaction P valueb | 0.1762 | |||
KM estimate at 36 months, % (95% CI) | 7.91 | 10.76 | 8.30 | 9.29 |
Cardiovascular death, MI, hospitalization of unstable angina, stroke, or coronary revascularization | ||||
Number of patients with event, n (%) | 459 (11.17) | 589 (13.72) | 715 (10.19) | 740 (10.73) |
Hazard ratio (95% CI)a | 0.80 (0.71 to 0.91) | 0.95 (0.85 to 1.05) | ||
Nominal P value | 0.0004 | 0.2972 | ||
Interaction P valueb | 0.043 | |||
KM estimate at 36 months, % (95% CI) | 13.50 | 16.86 | 13.28 | 14.05 |
Lipid parameter outcomes | ||||
Treatment response based on LDL-C < 1.8 mmol/L | ||||
Nc | 4,109 | 4,292 | 7,020 | 6,898 |
Patients with LDL-C < 1.8 mmol/L at baseline, n (%)d | 331 (8.1) | 284 (6.6) | 430 (6.1) | 474 (6.9) |
Nc | 3,941 | 4,094 | 6,798 | 6,664 |
Patients with LDL-C < 1.8 mmol/L at week 4, n (%)d | 3,608 (91.6) | 753 (18.4) | 6,143 (90.4) | 1,114 (16.7) |
Change from baseline in LDL-C | ||||
N | 4,109 | 4,292 | 7,020 | 6,898 |
Mean LDL-C at baseline, mmol/L, (SD)d | 2.476 (0.670) | 2.472 (0.639) | 2.570 (0.796) | 2.557 (0.727) |
N | 3,766 | 3,927 | 6,476 | 6,322 |
Mean LDL-C at week 48, mmol/L, (SD)d | 0.994 (0.811) | 2.468 (0.822) | 1.019 (0.901) | 2.486 (0.856) |
Mean change from baseline to week 48 in LDL-C, mmol/L (SD)d | –1.468 (0.840) | –0.001 (0.678) | –1.554 (0.890) | –0.067 (0.682) |
Mean percent change from baseline to week 48 in LDL-C, % (SD)d | –59.61 (31.05) | 1.28 (26.73) | –60.90 (30.05) | –1.14 (25.79) |
CI = confidence interval; IQR = interquartile range; LDL-C = low-density-lipoprotein cholesterol; MI = myocardial infarction; SD = standard deviation.
Notes: For patients in the subgroup who experienced an MI in the previous 2 years, those whose most recent MI or stroke was in the 4 weeks before randomization were excluded from the FOURIER trial.
The median length of follow-up was 25.99 months (IQR, 21.72 to 30.42 months). Events occurring between the patient randomization date and the patient last confirmed survival status date, inclusive, were included. The censoring date of the patients without an event was the patient last nonfatal potential end point collection date.
Multiplicity was not taken into account for subgroup analyses.
aBased on a Cox model stratified by the randomization stratification factors collected with the Interactive Voice Response System.
bBased on a Cox model, adding subgroup and subgroup-by-treatment interaction.
cNumber of patients observed at each visit; the analysis set was all randomized patients.
dSummary statistics were based on observed data. When the calculated LDL-C was less than 40 mg/dL or triglycerides were greater than 400 mg/dL, the calculated LDL-C was replaced with ultracentrifugation LDL-C, if available.
Sources: Additional information received from the sponsor on December 21, 202315 and on January 30, 2024.16 Details included in the table are from the sponsor’s Summary of Clinical Evidence.2
TEAEs of Special Interest
The proportion of patients with TEAEs of special interest — including potential hypersensitivity, injection-site reaction, muscle events, neurocognitive events, demyelination events and peripheral neuropathy, hepatitis C infection, and transaminase elevations and hepatic disorder events — was similar in the 2 treatment groups. A total of 13 patients (< 0.1%) in the evolocumab group and 15 patients (0.1%) in the placebo group had a potential muscle-related AE (according to a narrow search strategy that included rhabdomyolysis, myopathy, and a myoglobin blood increase). A total of 1,381 patients (10.0%) in the evolocumab group and 1,344 patients (9.8%) in the placebo group had a potential muscle-related AE (according to a broader search strategy). A summary of harms results from the FOURIER trial is presented in Table 23.
Table 23: Summary of Harms Results From the FOURIER Trial (Safety Analysis Set)
Adverse events | Evolocumab (N = 13,769) | Placebo (N = 13,756) |
|---|---|---|
TEAEs, n (%) | ||
Patients with ≥ 1 TEAEa | 10,664 (77.4) | 10,644 (77.4) |
Diabetes mellitus | 1,207 (8.8) | 1,130 (8.2) |
Hypertension | 1,108 (8.0) | 1,190 (8.7) |
Nasopharyngitis | 1,068 (7.8) | 1,021 (7.4) |
Upper respiratory tract infection | 698 (5.1) | 655 (4.8) |
Treatment-emergent SAEs, n (%) | ||
Patients with ≥ 1 SAEb | 3,410 (24.8) | 3,404 (24.7) |
Angina unstable | 233 (1.7) | 278 (2.0) |
Angina pectoris | 208 (1.5) | 221 (1.6) |
Pneumonia | 147 (1.1) | 152 (1.1) |
Atrial fibrillation | 119 (0.9) | 132 (1.0) |
Noncardiac chest pain | 109 (0.8) | 133 (1.0) |
Patients who stopped treatment due to TEAEs, n (%) | ||
Patients who stopped treatment due to any TEAEc | 608 (4.4) | 573 (4.2) |
Myalgia | 37 (0.3) | 46 (0.3) |
Arthralgia | 14 (0.1) | 13 (< 0.1) |
Headache | 13 (< 0.1) | 8 (< 0.1) |
Elevated hepatic enzymes | 13 (< 0.1) | 4 (< 0.1) |
Asthenia | 12 (< 0.1) | 12 (< 0.1) |
Fatigue | 12 (< 0.1) | 23 (0.2) |
Dizziness | 10 (< 0.1) | 11 (< 0.1) |
TEAEs of special interest, n (%)d | ||
Potential hypersensitivity events (narrow SMQ)e | 653 (4.7) | 574 (4.2) |
Potential hypersensitivity events (broad SMQ) | 1,043 (7.6) | 964 (7.0) |
Potential injection-site reaction events (narrow AMQ)f | 267 (1.9) | 207 (1.5) |
Potential injection-site reaction events (broad AMQ) | 280 (2.0) | 213 (1.5) |
Potential muscle events (narrow SMQ)g | 13 (< 0.1) | 15 (0.1) |
Potential muscle events (broad SMQ) | 1,381 (10.0) | 1,344 (9.8) |
Potential neurocognitive events (HLGT)h | 217 (1.6) | 202 (1.5) |
Potential demyelination events (broad SMQ) and peripheral neuropathy (narrow SMQ)i | 102 (0.7) | 143 (1.0) |
Potential hepatitis C infection (narrow SMQ)j | 9 (< 0.1) | 4 (< 0.1) |
Potential hepatitis C infection (broad SMQ) | 344 (2.5) | 316 (2.3) |
Transaminase elevations and potential hepatic disorders (narrow SMQ)k | 407 (3.0) | 370 (2.7) |
Transaminase elevations and potential hepatic disorders (broad SMQ) | 433 (3.1) | 384 (2.8) |
AMQ = Amgen MedDRA query; HLGT = high-level group term; SAE = serious adverse event; SMQ = standard MedDRA query; TEAE = treatment-emergent adverse event.
Notes: TEAEs are presented by preferred terms and coded by Medical Dictionary for Regulatory Activities (MedDRA) Version 9.1.
Death from any cause was an adjudicated efficacy end point in the FOURIER trial. SAEs that did not meet the criteria for adjudicated end points and were subsequently reported as AEs, but later resulted in death, are included in the SAE section.
Standardized MedDRA Queries are validated, standard sets of MedDRA terms used to support signal detection and monitoring and represent a variety of safety topics of regulatory interest. Standardized MedDRA Queries include narrow and/or broad terms; narrow terms are highly likely to represent the condition of interest.17
aTEAEs reported by 5% or more of patients in any treatment group are listed in descending order of frequency in the evolocumab group.
bTreatment-emergent SAEs reported by 1% or more of patients in any treatment group are listed in descending order of frequency in the evolocumab group.
cTEAEs leading to discontinuation of the study drug reported by more than 10 patients in any treatment group are listed in descending order of frequency in the evolocumab group.
dThe SMQ and AMQ search strategies were used to retrieve AEs potentially related to the condition under review when heterogenous medical presentations may be expected.
eTEAEs reported in more than 0.2% of patients in any treatment group by high-level term using a narrow search strategy for potential hypersensitivity events included dermatitis and eczema; rash, eruptions, and exanthemas; nasal congestion and inflammations; urticarias; and allergic conditions NEC.
fTEAEs reported in more than 0.1% of patients in any treatment group by preferred term using a narrow search strategy for potential injection-site reaction events included injection-site pain, bruising, hematoma, erythema, and hemorrhage.
gTEAEs using narrow search strategy for potential muscle events included rhabdomyolysis, myopathy, and a myoglobin blood increase.
hTEAEs by high-level group term for potential neurocognitive events included cognitive and attention disorders and disturbances, deliria (including confusion), dementia and amnestic conditions, disturbances in thinking and perception, and mental impairment disorders.
iTEAEs reported in 1 or more patients in any treatment group by high-level term using broad and narrow search strategies for potential demyelination events and peripheral neuropathy, respectively, included peripheral neuropathies NEC, sensory abnormalities NEC, trigeminal disorders, acute and progressive multiple sclerosis, plasma cell neoplasms NEC, acute polyneuropathies, spinal cord and nerve root disorders NEC, chronic polyneuropathies, and optic nerve disorders NEC.
jTEAEs by preferred term using a narrow search strategy for potential hepatitis C infection included hepatitis C, chronic hepatitis, and a positive hepatitis C virus test.
kTEAEs reported in 0.1% or more of patients in any treatment group by high-level term using a narrow search strategy for potential transaminase elevations and hepatic disorders included liver function analyses, hepatocellular damage and hepatitis NEC, hepatic and hepatobiliary disorders NEC, and coagulation and bleeding analyses.
Sources: Clinical Study Report of the FOURIER trial.12 Details included in the table are from the sponsor’s Summary of Clinical Evidence.2
Gencer et al.13 and Sabatine et al. (2018)14 Studies
Safety outcomes were not assessed by subgroup in either the Gencer et al. study or the Sabatine et al. (2018) study.
Critical Appraisal
Internal Validity
FOURIER Trial
The FOURIER trial12 was a phase III, double-blind, placebo-controlled, randomized clinical trial. Based on the previous review of the FOURIER trial in the December 2017 Clinical Review Report (Resubmission) on Evolocumab (Repatha), the key appraisal points are as follows.
Allocation concealment was facilitated throughout the randomization process using an Interactive Voice or Web Response System and a computer-generated randomization schedule that was prepared before the start of the trial. Blinding was facilitated with the matched placebo injection. Local injection-site and hypersensitivity reactions are associated with PCSK9 inhibitors.52 The proportion of patients with these AEs were similar in the 2 treatment groups and low overall (< 8.0% of patients in each group), so unblinding of the study drug was not likely. The adjudication of clinical events according to standardized definitions was performed by an independent external committee that was blinded to treatment allocation. Of note, information on the number of events identified by the investigator that were negatively adjudicated by the committee and the corresponding reasons to support these negative adjudications were not available. Although the study protocol included a suggestion that the study drug be self-administered under the supervision of site staff at each study visit, information was not available to support adherence (or possible poor adherence) to the study drug when administered was external to the study site. However, instructions on adherence to the study drug and lipid-lowering regimen were provided to patients if their LDL-C levels exceeded a preset threshold; these reminders were carried out in a manner that maintained the double-blind study design.
Gencer et al. and Sabatine et al. (2018) Studies
The Gencer et al.13 and Sabatine et al. (2018)14 studies were based on subgroup analyses of the FOURIER trial.12 The subgroup analyses were based on the statistical methods used in the FOURIER trial, and the subgroups by timing of prior MI were prespecified; however, there was no clear hypothesis stated a priori. The P values on test for interaction term (in general, greater than 0.05, with the exception of the primary end point in the subgroup analysis by timing of prior MI [< 2 years versus ≥ 2 years]) strongly suggest that chance cannot be excluded as a likely explanation for the differential subgroup effect. There is a lack of evidence from randomized controlled trials and large observational studies to support consistent and similar findings from the subgroup analyses. Nonetheless, the subgroup analyses results were generally consistent with the overall FOURIER trial results, with the exception of stroke, for which the HR was 0.79 (95% CI, 0.66 to 0.95),12 and the corresponding subgroup analysis results included null values.
After consultation with the clinical experts, additional treatment-effect modifiers in patients with primary hyperlipidemia were identified, including family history of primary hyperlipidemia, HeFH, early age of MI, elevated lipoprotein (a), and high on-treatment LDL-C level. Randomization was not stratified by, and the statistical model was not adjusted for, these effect modifiers. Moreover, information on these factors at baseline was not available to support their balance (or possible imbalance) in treatment groups. However, randomization was likely preserved in the 2 treatment groups by subgroup, as baseline characteristics were similar in the treatment groups by subgroup. Furthermore, the proportion of patients who discontinued the study was similar in the 2 treatment groups by subgroup, and was low overall (< 1.0% of patients in each group).
The sample-size calculation was based on the key secondary end point for the full analysis set in the FOURIER trial, but not for the subgroup analyses. Consequently, there is an increased likelihood of unreliable or inaccurate results, particularly for cardiovascular death and stroke, which are components of the composite end points for which the 95% CI results included null values. Nonetheless, the sample size of subgroups was considered relatively large. Multiplicity was not accounted for in the subgroup analyses; therefore, the interpretation of the subgroup analysis results is subject to an increased likelihood of type I error.
Because the aforementioned conditions can lower the credibility and reliability of the subgroup analysis results, the available evidence should not be viewed as conclusive; however, it may be interpreted as likely indicative of a possible subgroup effect.
External Validity
Gencer et al. and Sabatine et al. (2018) Studies
Because the sponsor’s reimbursement request focused on patients with recent ACS (in the previous year), the clinical experts were consulted on the patient population included in the subgroup analyses, which did not include patients with unstable angina or with recent (in the previous 4 weeks) MI or stroke. Although evidence in these patients is lacking, the experts did not identify any major concerns related to generalizing the subgroup analysis results to these patients.
Patients in the evolocumab group received subcutaneous evolocumab 140 mg once every 2 weeks (self-administered as 1 prefilled autoinjector or pen) or evolocumab 420 mg once every month (self-administered as 3 prefilled autoinjectors or pens), per patient preference. Dose adjustments were not permitted, with the exception of a switch between dose schedules. Thus, the use of evolocumab in the trial aligns with the recommended dose for the indication under review, per the product monograph.1
At randomization, all patients were on an optimized, background lipid-lowering regimen, defined as an effective statin dose (i.e., high-to-moderate intensity of at least atorvastatin 20 mg daily or equivalent). Ezetimibe and other commercially available lipid-lowering therapy at dosages approved by local regulatory authorities were also permitted in the trial. Based on input from key interest-holders and in consultation with members of the expert committee, these were considered to be relevant comparators to evolocumab in the Canadian setting. Moreover, the clinical experts agreed that the permitted statins and their intensity, defined by American College of Cardiology and American Heart Association guidelines, were generally reflective of clinical practice. Regarding other PCSK9 inhibitors, funding is not yet in place for alirocumab, as negotiations concluded without an agreement in October 2019 for the indication of ASCVD.10
Outcomes on clinical events and LDL-C levels were assessed in this Clinical Review Report. The 2021 CCS dyslipidemia guidelines5 reference a meta-analysis by Silverman et al.53 on the association between reduction in LDL-C and reduction in risk of major vascular events (a composite of cardiovascular death, acute MI or other ACS, coronary revascularization, and stroke) across lipid-lowering drugs. Of note, 2 trials of PCSK9 inhibitors were included; however, dedicated cardiovascular outcome trials for PCSK9 inhibitors had not yet been completed at the time of the meta-analysis. Based on the 18 secondary prevention trials with statin therapy, reduction in LDL-C by 1 mmol/L was associated with a relative risk of 0.79 (95% CI, 0.73 to 0.86) for major vascular events.53 This finding supports the approximate linear relation between an absolute reduction in LDL-C with statin therapy and a proportional reduction in the incidence of major vascular events reported in past meta-analyses by the CTT Collaboration.49,54 More specifically, the CTT Collaboration reported that a reduction of 1 mmol/L in LDL-C that is sustained for 5 years with statin therapy is associated with a proportional reduction, by approximately one-fifth, in major coronary events, coronary revascularization, and stroke, largely irrespective of the initial lipid profile or other presenting characteristics.49,54 The updated CTT meta-analysis also demonstrated that additional reductions in LDL-C (to approximately 1 mmol/L to 2 mmol/L) with intensive statin therapy was associated with further reductions in the incidence of these clinical events.49 The absolute benefit is dependent on the absolute baseline risk of such events and the absolute reduction in LDL-C.5,54
Overall, no key concerns were identified related to the generalizability of the subgroup analysis results to the patient population in the reimbursement request. Of note, the estimated study duration was 56 months from the date the first patient was randomized; however, the median follow-up was 26 months. In the previous review of the FOURIER trial, the length of follow-up was deemed to be likely too short to assess the long-term harms associated with the use of evolocumab.18
Long-Term Extension Studies
The contents within this section have been informed by materials submitted by the sponsor. The following has been summarized and validated by the CDA-AMC review team.
This section summarizes the integrated results from 2 5-year OLE studies of the FOURIER trial (FOURIER-OLE). Patients who completed the parent trial had the option of enrolling in 1 of the 2 OLE studies. Additionally, this section summarizes an ad hoc subgroup analysis, based on the OLE studies, of patients who experienced an MI before and/or during the parent trial. All results reported herein are the integrated data from the 2 OLE studies.
Description of Studies
The FOURIER-OLE studies comprised 2 phase IIIb, multicentre, single-arm, 5-year OLE studies assessing the safety, tolerability, and clinical effects of long-term evolocumab administration in patients who completed the FOURIER trial (parent trial). The first OLE study (the first patient was enrolled on September 2, 2016) included patients who completed the parent trial at selected study sites located in North America or Eastern Europe (N = 5,035). The second OLE study (the first patient was enrolled on March 13, 2017) included patients who completed the parent trial at selected study sites located in Western Europe (N = 1,600).21,55,56
Populations
After completing the parent trial in which they were randomized to receive either evolocumab or placebo, patients were eligible to enrol in 1 of the 2 OLE studies. The key inclusion and exclusion criteria used in the FOURIER trial are described in Table 7.
Interventions
Upon enrolment in the OLE studies, all patients received open-label evolocumab (140 mg administered subcutaneously once every 2 weeks [1 prefilled autoinjector or pen] or 420 mg administered subcutaneously once every month [3 prefilled autoinjectors or pens], according to patient preference). Patients were permitted to switch between the 2 dosing schedules based on preference. Patients were advised to continue the same background lipid-lowering therapy, including a statin, which was consistent with the protocol for the parent trial.21,55,56
Outcomes
The primary end point of the OLE studies was the incidence of AEs. The secondary end points included percent change from baseline in LDL-C and the proportion of patients with a LDL-C level of less than 1.03 mmol/L at each scheduled visit (i.e., week 12, week 24, and every 24 weeks thereafter for 260 weeks [approximately 5 years]). The incidence of major cardiovascular events (i.e., cardiovascular death, MI, stroke or hospitalization for unstable angina, or coronary revascularization) were prespecified exploratory end points.21,55,56
Statistical Analysis
In the (descriptive) analysis of the primary and secondary end points, the integrated OLE safety analysis set, which includes all patients who received at least 1 dose of open-label evolocumab in the OLE studies, was used. Of note, the primary analysis of the primary and secondary end points only used data from the OLE studies (i.e., data from the parent FOURIER trial were not included). No formal hypothesis was tested; additionally, no statistical inference or missing value imputation was planned. For all end points, results were summarized according to the randomized treatment group in the parent trial and for the overall OLE study population.56
In the analysis of safety outcomes, patients were censored 30 days after permanent drug discontinuation or at the end of the study, whichever occurred first. For clinical event outcomes, the HR and associated 95% CI were estimated from stratified Cox models with the prespecified stratification factors at randomization. If the proportional hazards assumption was violated, modified Poisson regression was conducted as a sensitivity analysis. Landmark analyses were annually performed on the primary and key secondary composite end points.21
Ad Hoc Subgroup Analysis of Patients Who Experienced a Prior MI
An ad hoc subgroup analysis of the FOURIER-OLE studies was conducted in patients who experienced an MI before and/or during the parent FOURIER trial. A Cox model stratified by the FOURIER-OLE study was used to estimate the HR and associated 95% CI in the randomized treatment groups in the parent trial (evolocumab and placebo). A 2-sided log-rank test stratified by the OLE study was used to compare survival functions in the randomized treatment groups in the parent trial.23
Efficacy end points included:23
time to cardiovascular death, MI, hospitalization for unstable angina, stroke, or coronary revascularization, whichever occurred first
time to cardiovascular death, MI, or stroke, whichever occurred first
time to cardiovascular death
time to death by any cause
time to first MI
time to first stroke
time to first coronary revascularization
time to first hospitalization for unstable angina
time to coronary heart disease or MI
time to coronary heart disease death
LDL-C.
For patients who experienced an MI before and/or during the parent trial, the following outcomes were also summarized:23
enrolment by region
time from most recent MI to enrolment in the FOURIER-OLE study
duration of exposure during the OLE study only and during the parent FOURIER trial plus the FOURIER-OLE study
TEAEs
LDL-C using data from both the parent trial and the FOURIER-OLE study.
Results
Patient Disposition
A total of 6,635 patients were enrolled in the 2 OLE studies and included in the integrated analysis. The integrated OLE safety analysis set included 6,630 patients (99.9%) who received at least 1 dose of evolocumab in the OLE studies, 3,353 of whom received evolocumab in the parent trial and 3,277 of whom received placebo. A total of 5,209 patients (78.5%) completed approximately 5 years of treatment with evolocumab in the OLE studies and 1,421 patients (21.4%) discontinued treatment early. The most common reasons for treatment discontinuation were death (433 patients [6.5%]), patient request (425 patients [6.4%]), and AEs (281 patients [4.2%]).56
A total of 5,655 patients (85.2%) in the integrated OLE safety analysis set completed the OLE studies and 980 patients (14.8%) discontinued the study early. The most common reason for study discontinuation was death (646 patients [9.7%]). Final vital status was not available for 48 patients (0.7%), 34 who withdrew consent and 14 who were lost to follow-up. Of these, 7 patients were missing their final vital status date.56
Note that 1 of the 2 OLE studies continued for 260 weeks (approximately 5 years), whereas the other study was terminated early, at a median duration of exposure of approximately 240 weeks. The early termination of the study was not due to any safety findings.
Baseline Characteristics
A summary of the baseline characteristics of all patients in the FOURIER-OLE studies and included in the integrated analysis are presented in Table 24.
Ad Hoc Subgroup Analysis of Patients Who Experienced a Prior MI
A summary of the baseline characteristics of the subgroup of patients who had an MI before and/or during the parent FOURIER trial are presented in Table 25.
Table 24: Summary of Baseline Characteristics in the FOURIER-OLE Studies (Integrated OLE Safety Analysis Set)
Characteristic | Treatment group in the parent FOURIER study | |
|---|---|---|
Evolocumab (N = 3,353) | Placebo (N = 3,277) | |
Mean age, years (SD) | 62.4 (8.6) | 62.4 (8.6) |
Sex, n (%) | ||
Female | 773 (23.1) | 776 (23.7) |
Male | 2,580 (76.9) | 2,501 (76.3) |
Race, n (%) | ||
American Indian or Alaska Native [wording from original source] | 2 (< 0.1) | 2 (< 0.1) |
Asian | 23 (0.7) | 9 (0.3) |
Black or African American | 117 (3.5) | 112 (3.4) |
Native Hawaiian or Other Pacific Islander | 6 (0.2) | 5 (0.2) |
White | 3,142 (93.7) | 3,098 (94.5) |
Multiple | 4 (0.1) | 4 (0.1) |
Other | 59 (1.8) | 44 (1.3) |
Region, n (%) | ||
North America | 1,093 (32.6) | 1,105 (33.7) |
Europe | 2,260 (67.4) | 2,172 (66.3) |
Type of atherosclerosis, n (%) | ||
MI | 2,805 (83.7) | 2,750 (83.9) |
Nonhemorrhagic stroke | 546 (16.3) | 516 (15.7) |
PAD | 488 (14.6) | 460 (14.0) |
Mean time from MI to enrolment, months (SD) | 69.606 (74.237) | 68.531 (71.613) |
Major cardiovascular risk factors, n (%) | ||
Diabetes (type 1 or type 2) | 1,120 (33.4) | 1,143 (34.9) |
Age ≥ 65 to ≤ 85 years | 1,474 (44.0) | 1,388 (42.4) |
MI or nonhemorrhagic stroke in the 6 months before screening | 574 (17.1) | 560 (17.1) |
Additional prior MI or stroke | 844 (25.2) | 870 (26.5) |
Current cigarette use | 884 (26.4) | 887 (27.1) |
History of symptomatic PAD, if enrolled with a history of MI or stroke | 302 (9.0) | 274 (8.4) |
Minor cardiovascular risk factors, n (%) | ||
History of non-MI-related coronary revascularization | 1,087 (32.4) | 1,051 (32.1) |
Residual coronary artery disease (≥ 40% stenosis in ≥ 2 large vessels) | 860 (25.6) | 793 (24.2) |
HDL-C < 40 mg/dL for males or < 50 mg/dL for females | 1,291 (38.5) | 1,295 (39.5) |
hsCRP > 2 mg/L | 1,387 (41.4) | 1,373 (41.9) |
LDL-C ≥ 130 mg/dL or non-HDL-C ≥ 160 mg/dL | 521 (15.5) | 520 (15.9) |
Metabolic syndrome | 1,970 (58.8) | 1,964 (59.9) |
Risk factor count, n (%) | ||
≥ 1 major risk factor or ≥ 2 minor risk factors | 3,339 (99.6) | 3,261 (99.5) |
No major risk factor and < 2 minor risk factors | 14 (0.4) | 16 (0.5) |
Mean LDL-C, mmol/L (SD) | 2.518 (0.707) | 2.513 (0.676) |
HDL-C = high-density-lipoprotein cholesterol; hsCRP = high-sensitivity C-reactive protein; LDL-C = low-density-lipoprotein cholesterol; MI = myocardial infarction; OLE = open-label extension; PAD = peripheral artery disease; SD = standard deviation.
Source: Amgen FOURIER-OLE studies, Common Technical Document Module 2.7.3, Summary of Clinical Efficacy.22
Table 25: Summary of Baseline Characteristics in the MI Subgroup of the FOURIER-OLE Studies (Integrated Results)
Characteristic | Treatment group in the parent FOURIER study | |
|---|---|---|
Evolocumab (N = 2,815) | Placebo (N = 2,767) | |
Mean age, years (SD) | 62.2 (8.7) | 62.0 (8.6) |
Sex, n (%) | ||
Female | 584 (20.7) | 586 (21.2) |
Male | 2,231 (79.3) | 2,181 (78.8) |
Region, n (%) | ||
Europe | 1,931 (68.6) | 1,850 (66.9) |
North America | 884 (31.4) | 917 (33.1) |
Type of atherosclerosis | ||
MI, % | 100.0 | 100.0 |
Mean time since most recent MI, years (SD) | 8.070 (6.137) | 7.835 (5.905) |
Lipid measures at randomization | ||
Mean LDL-C, mmol/L (SD) | 2.5 (0.7) | 2.5 (0.7) |
LDL-C = low-density-lipoprotein cholesterol; MI = myocardial infarction; N = number of patients who received at least 1 dose of open-label evolocumab in the OLE studies; OLE = open-label extension; SD = standard deviation.
Source: Amgen FOURIER-OLE studies. Amgen data on file.23
Exposure to Study Treatments
Patients randomized to receive evolocumab in the parent trial had a median of 24.3 months of additional exposure to evolocumab (median, 84.2 months; Q1 and Q3 = 78.1 months and 89.8 months, respectively) compared to those who were randomized to receive placebo (median, 59.8 months; Q1 and Q3 = 52.8 months and 60.3 months, respectively). Overall, the FOURIER-OLE studies provided an additional 29,064 patient-years of exposure to evolocumab (beyond the parent study).56
Concomitant Lipid-Lowering Therapies
All patients in the parent trial (n = 6,630) reported the use of at least 1 lipid-lowering medication at baseline, as did 98.0% (n = 6,495) of patients at the start of the FOURIER-OLE studies, with almost all patients taking a statin. Atorvastatin was the most common background statin therapy used at baseline in the parent trial (78.8%) and at the start of the FOURIER-OLE studies (75.6%), followed by rosuvastatin (14.6% and 14.7%, respectively) and simvastatin (5.9% and 6.2%, respectively). Nearly all patients were taking a moderate-intensity (21.2%) or high-intensity (78.6%) statin at baseline in the parent trial; the corresponding proportions were similar at the start of the FOURIER-OLE studies (22.2% and 74.8%, respectively).56 Other commonly used lipid-lowering concomitant medications included fish oil, fibrates, and ezetimibe (approximately 3% to 6% each).
Ad Hoc Subgroup Analysis of Patients Who Experienced a Previous MI
In the MI subgroup, the mean duration of exposure to evolocumab was 81.42 months (SD = 14.3 months) in patients who were randomized to receive evolocumab in the parent trial and 52.70 months (SD = 14.4 months) in patients who received placebo in the parent trial.23
Concomitant Lipid-Lowering Therapies
No data were available on the concomitant lipid-lowering therapies used in the MI subgroup.
Efficacy
Change From Baseline in LDL-C
Among patients in the FOURIER-OLE studies, the median baseline reflexive LDL-C level in the parent trial was 2.36 mmol/L (Q1 and Q3 = 2.06 mmol/L and 2.80 mmol/L, respectively); the baseline LDL-C level was similar in the 2 randomized treatment groups of the parent trial.21,22
The percent change from baseline (in the parent study) in reflexive LDL-C at each scheduled visit of the FOURIER-OLE studies is presented in Figure 2. The observed mean percent reduction from baseline in LDL-C ranged from 53.4% to 67.2% during the 260-week OLE study period.21
Ad Hoc Subgroup Analysis of Patients Who Experienced a Previous MI
In the subset of patients (n = 5,582) who experienced an MI before and/or during the parent FOURIER trial, the mean baseline LDL-C level in the parent trial was 2.52 mmol/L (SD = 0.695 mmol/L), which was similar in patients randomized to receive evolocumab and those randomized to receive placebo in the parent trial.23 The mean LDL-C level during the 260-week OLE study period for the MI subgroup of patients was 1.061 mmol/L (SD = 0.924 mmol/L). The mean percent reduction from baseline to week 260 in LDL-C was approximately 57.7%, and was similar in patients who received evolocumab and those who received placebo in the parent trial.23 A summary on the LDL-C parameter is presented in Table 26.
Table 26: Summary of LDL-C Parameters in the MI Subgroup of the FOURIER-OLE Studies (Integrated Results)
LDL-C parameter | Treatment group in the parent FOURIER study | |
|---|---|---|
Evolocumab (N = 2,815) | Placebo (N = 2,767) | |
n | 2,815 | 2,767 |
Mean LDL-C at baseline in the parent FOURIER study, mmol/L (SD) | 2.522 (0.716) | 2.512 (0.673) |
Median (Q1 to Q3) | 2.370 (2.070 to 2.800) | 2.355 (2.055 to 2.800) |
n | 1,984 | 1,925 |
Mean LDL-C at OLE week 260, mmol/L (SD) | 1.037 (0.892) | 1.086 (0.956) |
Median (Q1 to Q3) | 0.780 (0.455 to 1.270) | 0.800 (0.440 to 1.420) |
Mean change from baseline to OLE week 260 in LDL-C, mmol/L (SD) | –1.487 (0.938) | –1.428 (0.996) |
Mean percent change from baseline to OLE week 260 in LDL-C, mmol/L (SD) | –58.81 (34.31) | –56.64 (36.11) |
LDL-C = low-density-lipoprotein cholesterol; OLE = open-label extension; Q1 = first quartile; Q3 = third quartile; SD = standard deviation.
Source: Amgen FOURIER-OLE studies.23
Time to Major Cardiovascular Events
A summary of major adverse cardiovascular events in the FOURIER-OLE studies, according to original randomization assignment in the parent study (N = 3,355 in the evolocumab group in the parent study and N = 3,280 in the placebo group in the parent study), is presented here.
Figure 2: Mean Percent Change From Baseline in LDL-C by Scheduled Visit and Treatment Group Using Data From the Parent Study and the OLE Studies (Integrated OLE Safety Analysis Set)
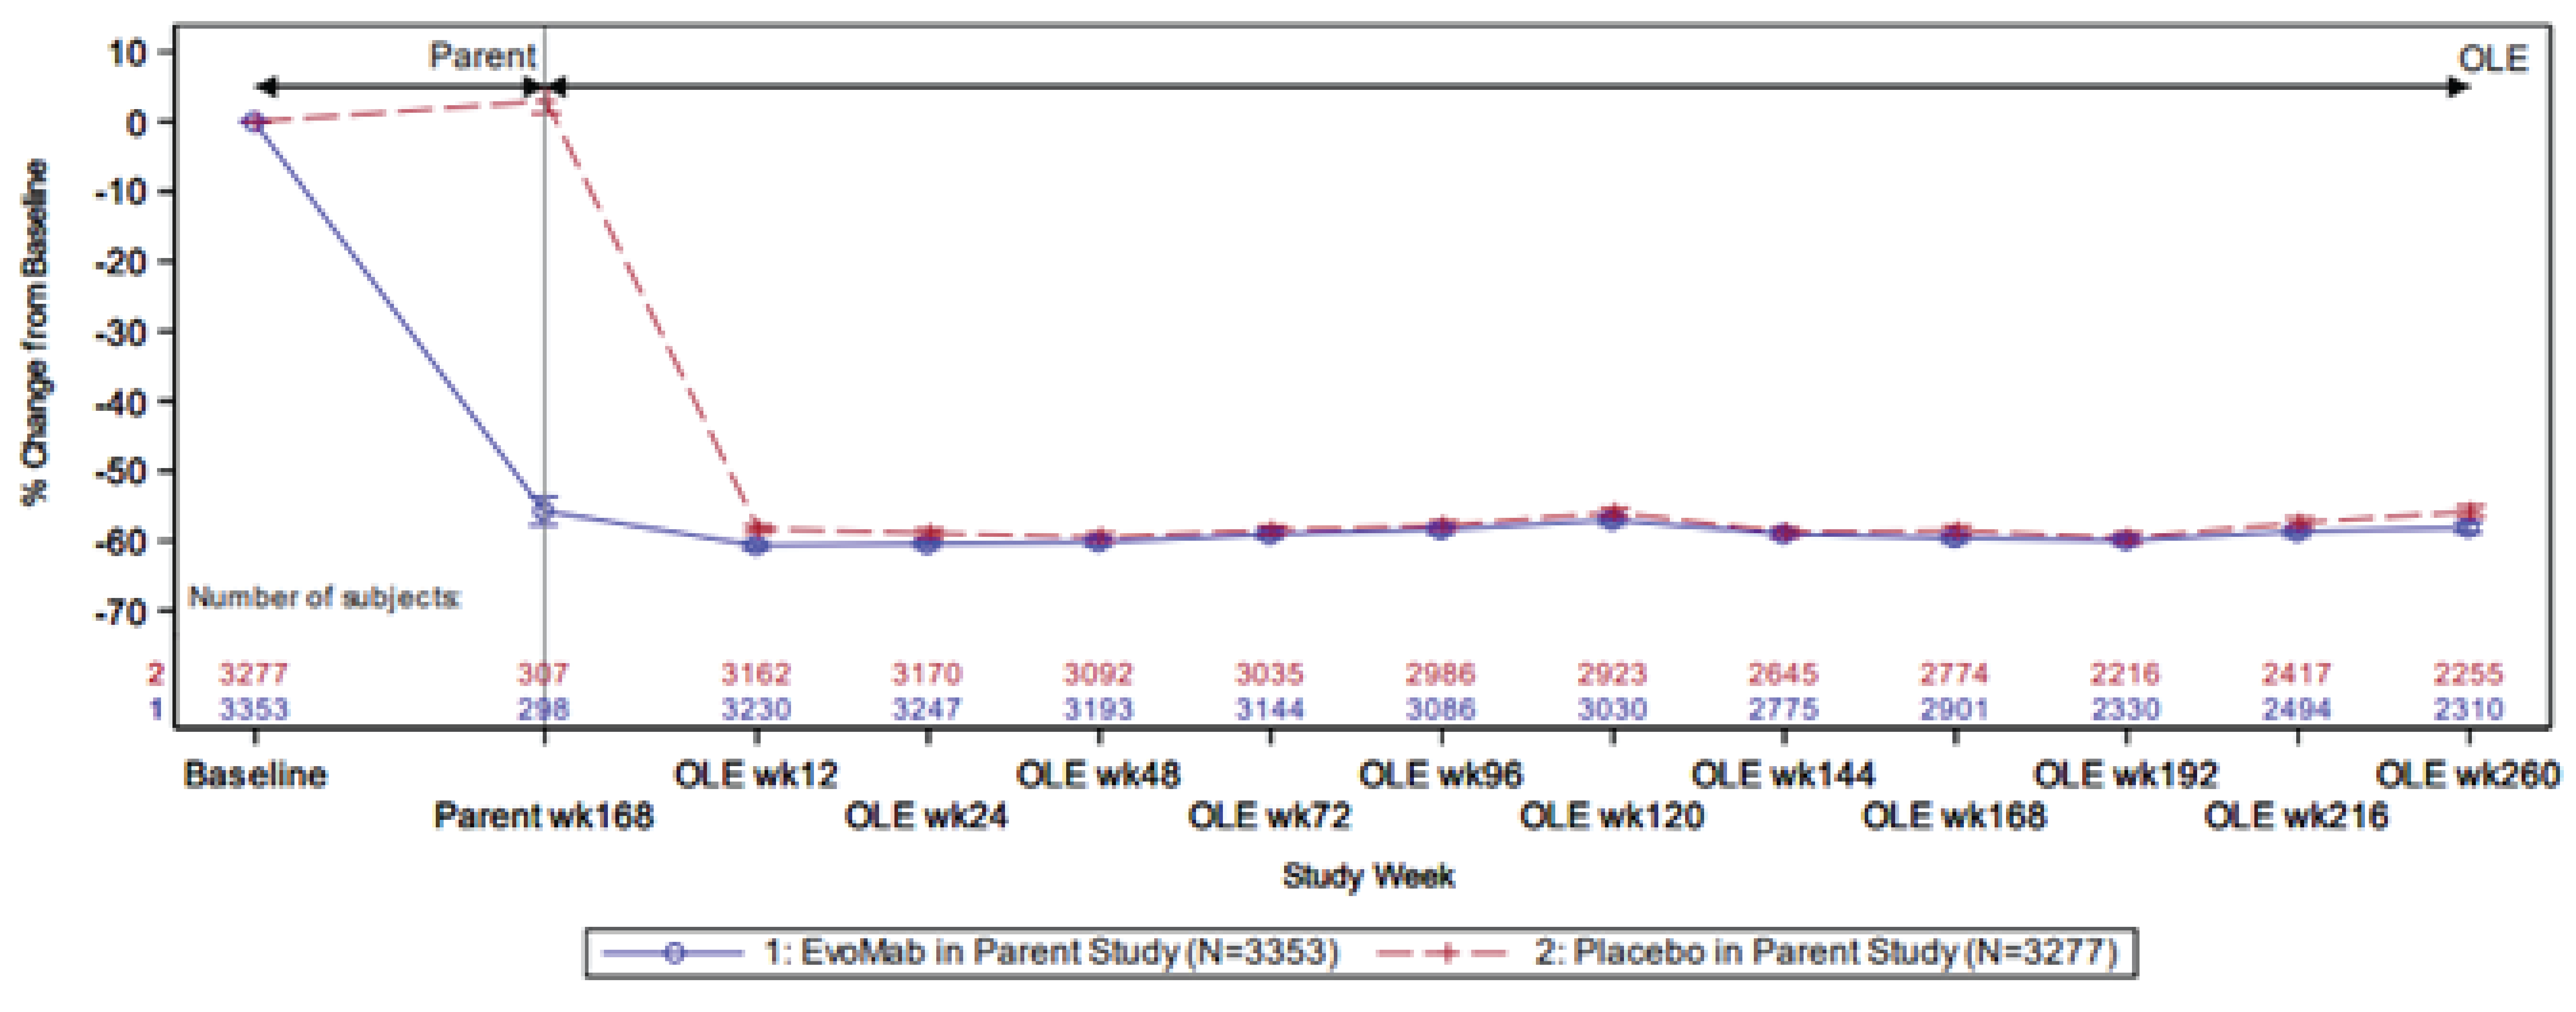
EvoMab = evolocumab; LDL-C = low-density-lipoprotein cholesterol; N = number of patients who received at least 1 dose of open-label evolocumab in the FOURIER-OLE studies; OLE = open-label extension.
Note: The vertical line represents the standard error around the mean.
Plot is based on observed data; no imputation was used for missing values.
Baseline was defined as the parent study baseline.
Source: Amgen FOURIER-OLE studies, Common Technical Document Module 2.7.3, Summary of Clinical Efficacy.22
Cardiovascular Death, MI, Stroke, Coronary Revascularization, or Hospitalization for Unstable Angina21
During the OLE study period, 490 patients (14.6%) originally randomized to the evolocumab group in the parent study experienced the FOURIER primary outcome of cardiovascular death, MI, stroke, hospitalization for unstable angina, or coronary revascularization, compared to 551 patients (16.8%) originally randomized to the placebo group (HR = 0.85; 95% CI, 0.75 to 0.96). The KM estimate for the primary outcome at 60 months was 15.38% (95% CI, 14.11% to 16.63%) for patients randomized to receive evolocumab in the parent trial and 17.50% (95% CI, 16.15% to 18.83%) for patients randomized to placebo, with a difference in event probability of 2.12% (95% CI, 0.28% to 3.96%).
Cardiovascular Death, MI, or Stroke21
The HR for the key secondary composite outcome of cardiovascular death, MI, and stroke was 0.80 (95% CI, 0.68 to 0.93), with 309 patients (9.2%) randomized to the evolocumab group and 374 (11.4%) randomized to the placebo group in the parent study experiencing these outcomes. The KM estimate for this key secondary composite outcome at 60 months was 9.75% (95% CI, 8.70% to 10.78%) in patients randomized to the evolocumab group in the parent trial and 11.90% (95% CI, 10.75% to 13.03%) in patients randomized to the placebo group, with a difference in event probability of 2.15% (95% CI, 0.61% to 3.70%).
Cardiovascular Death21
For cardiovascular death, 107 (3.19%) and 138 patients (4.21%) originally randomized to the evolocumab group and the placebo group in the parent study experienced this outcome, respectively. The HR for the individual component of cardiovascular death was 0.77 (95% CI, 0.60 to 0.99). The KM estimate for cardiovascular death at 60 months was 3.33% (95% CI, 2.70% to 3.95%) in patients randomized to the evolocumab group in the parent trial and 4.42% (95% CI, 3.69% to 5.15%) in patients randomized to the placebo group, with a difference in event probability of 1.10% (95% CI, 0.14% to 2.06%).
Death From Any Cause21
For death from any cause, 338 patients (10.07%) and 344 patients (10.49%) originally randomized to the evolocumab group and the placebo group in the parent study experienced this outcome, respectively. The HR for the individual component of death from any cause was 0.97 (95% CI, 0.83 to 1.13). The KM estimate for death from any cause at 60 months was 10.34% (95% CI, 9.28% to 11.39%) in patients randomized to the evolocumab group in the parent trial and 10.71% (95% CI, 9.62% to 11.79%) in patients randomized to the placebo group, with a difference in event probability of 0.37% (95% CI, –1.15% to 1.89%).
Myocardial Infarction21
For MI, 151 patients (4.5%) and 194 patients (5.91%) originally randomized to the evolocumab group and the placebo group in the parent study experienced this outcome, respectively. The HR for the individual component of MI was 0.75 (95% CI, 0.60 to 0.92). The KM estimate for MI at 60 months was 4.83% (95% CI, 4.08% to 5.59%) in patients randomized to the evolocumab group in the parent trial and 6.20% (95% CI, 5.35% to 7.05%) in patients randomized to the placebo group, with a difference in event probability of 1.37% (95% CI, 0.23% to 2.51%).
Stroke21
For stroke, 102 patients (3.04%) and 94 patients (2.87%) originally randomized to the evolocumab group and the placebo group in the parent study experienced this outcome, respectively. The HR for the individual component of stroke was 1.05 (95% CI, 0.80 to 1.39). The KM estimate for stroke at 60 months was 3.26% (95% CI, 2.63% to 3.88%) in patients randomized to the evolocumab group in the parent trial and 3.09% (95% CI, 2.47% to 3.71%) in patients randomized to the placebo group, with a difference in event probability of –0.17% (95% CI, –1.05% to 0.71%).
Coronary Revascularization21
For coronary revascularization, 280 patients (8.35%) and 313 patients (9.54%) originally randomized to the evolocumab group and the placebo group in the parent study experienced this outcome, respectively. The HR for the individual component of coronary revascularization was 0.85 (95% CI, 0.73 to 1.00). The KM estimate for coronary revascularization at 60 months was 8.91% (95% CI, 7.90% to 9.91%) in patients randomized to the evolocumab group in the parent trial and 10.13% (95% CI, 9.05% to 11.19%) in patients randomized to the placebo group, with a difference in event probability of 1.22% (95% CI, –0.25% to 2.69%).
Ad Hoc Subgroup Analysis of Patients Who Experienced a Previous MI
A summary of the major adverse cardiovascular events in the MI subgroup of the FOURIER-OLE studies is presented in Table 27. Among patients who experienced an MI before and/or during the parent FOURIER trial, 406 patients (14.42%) who were randomized to receive evolocumab in the parent trial experienced the FOURIER primary outcome of cardiovascular death, MI, stroke, hospitalization for unstable angina, or coronary revascularization, compared with 478 patients (17.28%) who were randomized to receive placebo in the parent trial (HR = 0.81; 95% CI, 0.71 to 0.93). The HR for the key secondary composite outcome of cardiovascular death, MI, and stroke was 0.77 (95% CI, 0.65 to 0.90); of note, the HR for the individual component of cardiovascular death was 0.68 (95% CI, 0.51 to 0.91). Event probabilities and, consequently, the difference in event probabilities between treatment groups from the parent trial were not available for the MI subgroup analysis.
Table 27: Major Adverse Cardiovascular Events in the MI Subgroup of the FOURIER-OLE Studies (Integrated Results)
Adverse events | Treatment group in the parent study | |
|---|---|---|
Evolocumab (N = 2,815) | Placebo (N = 2,767) | |
Cardiovascular death, MI, stroke, coronary revascularization, or hospitalization for unstable angina | ||
n (%) | 406 (14.42) | 478 (17.28) |
HR (95% CI), P value | 0.81 (0.71, 0.93), 0.002 | |
Cardiovascular death, MI, or stroke | ||
n (%) | 249 (8.85) | 315 (11.38) |
HR (95% CI), P value | 0.77 (0.65, 0.90), 0.0016 | |
Cardiovascular death | ||
n (%) | 80 (2.84) | 117 (4.23) |
HR (95% CI), P value | 0.68 (0.51, 0.91), 0.0081 | |
Death from any cause | ||
n (%) | 250 (8.88) | 277 (10.01) |
HR (95% CI), P value | 0.90 (0.76,1.07), 0.2217 | |
Myocardial infarction | ||
n (%) | 138 (4.90) | 172 (6.22) |
HR (95% CI), P value | 0.77 (0.62, 0.97), 0.0244 | |
Stroke | ||
n (%) | 71 (2.52) | 68 (2.46) |
HR (95% CI), P value | 1.02 (0.73, 1.42), 0.9196 | |
Coronary revascularization | ||
n (%) | 245 (8.70) | 286 (10.34) |
HR (95% CI), P value | 0.82 (0.69, 0.97), 0.0208 | |
CI = confidence interval; HR = hazard ratio; MI = myocardial infarction; OLE = open-label extension.
Note: N refers to the number of patients who experienced an MI before and/or during the parent FOURIER trial.
Source: Amgen FOURIER-OLE studies.23
Harms
In the integrated OLE safety analysis set, 2,894 patients (86.3%) randomized to evolocumab in the parent study and 2,830 patients (86.4%) randomized to placebo experienced at least 1 AE during the OLE studies (Table 28). The most frequently reported AE was hypertension (15% of patients). Other AEs reported by at least 5% of patients in either treatment group in the parent study include nasopharyngitis, bronchitis, arthralgia, diabetes mellitus, atrial fibrillation, back pain, upper respiratory tract infection, angina pectoris, and pneumonia (Table 28).
Approximately 43% of patients experienced at least 1 SAE during the OLE studies (43.4% of patients randomized to the evolocumab group in the parent study and 42.7% of patients randomized to placebo). SAEs that occurred in at least 1% of patients in either group in the parent study are summarized in Table 28. Acute MI, angina pectoris, pneumonia, atrial fibrillation, and cardiac failure were among the SAEs reported most frequently (in 2% to 3% of patients).
The incidence rates of TEAEs leading to the discontinuation of evolocumab in at least 5 patients in the OLE safety analysis set were low and are summarized in Table 28. Overall, approximately 8% of patients experienced an AE leading to discontinuation of evolocumab during the OLE study (7.7% of patients who received evolocumab in the parent study and 8.0% of patients who received placebo in the parent study). The most frequently reported AEs leading to the discontinuation of evolocumab in the OLE studies were in the system organ class of neoplasms, benign, malignant and unspecified (including cysts and polyps) (2.0% to 2.1% of patients), followed by cardiac disorders (1.5% to 2.1% of patients). None of the reported AEs leading to discontinuation were reported in more than 1% of patients.
The overall incidence of fatal AEs in the OLE safety analysis set was similar in patients randomized to evolocumab in the parent study (6.7% [223 patients]) and those randomized to placebo (6.5% [213 patients]). The most commonly reported fatal AEs were in 3 system organ classes: cardiac disorders; neoplasms benign, malignant and unspecified (including cysts and polyps); and infections and infestations. The incidence of fatal AEs in the cardiac disorders system organ class was 1.5% (50 patients) and 2.3% (74 patients) for those randomized to evolocumab and placebo, respectively, in the parent study. For the system organ class of neoplasms benign, malignant and unspecified (including cysts and polyps), the incidence of fatal AEs was 1.9% (64 patients) and 1.6% (51 patients) for those randomized to evolocumab and placebo, respectively, in the parent study.24
Notable harms identified for this review include potential hypersensitivity, injection-site reaction, muscle events, neurocognitive events, demyelination events and peripheral neuropathy, hepatitis C infection, and transaminase elevations and hepatic disorder events. Notable harms reported by at least 1% of patients in any treatment group in the OLE safety analysis set included potential injection-site reaction events, potential demyelination events (peripheral neuropathy, sensory abnormalities NEC, and chronic polyneuropathies), and transaminase elevations and potential hepatic disorders (liver function analyses and hepatocellular damage and hepatitis NEC) (Table 28). The numbers were similar in the evolocumab and placebo groups.
Ad Hoc Subgroup Analysis of Patients Who Experienced a Previous MI
The evolocumab safety profile in the MI subgroup was similar to that seen in the overall study population. Details, including TEAEs, SAEs, AEs leading to discontinuation, and device-related AEs, are presented in Table 29.
Table 28: Summary of Harms in the FOURIER-OLE Studies (Integrated OLE Safety Analysis Set)
Adverse events | Treatment group in the parent study | |
|---|---|---|
Evolocumab (N = 3,353) | Placebo (N = 3,277) | |
TEAEs, n (%) | ||
Patients with ≥ 1 TEAEa | 2,894 (86.3) | 2,830 (86.4) |
Hypertension | 512 (15.3) | 480 (14.6) |
Nasopharyngitis | 267 (8.0) | 232 (7.1) |
Bronchitis | 228 (6.8) | 199 (6.1) |
Arthralgia | 216 (6.4) | 206 (6.3) |
Diabetes mellitus | 204 (6.1) | 206 (6.3) |
Atrial fibrillation | 191 (5.7) | 218 (6.7) |
Back pain | 214 (6.4) | 185 (5.6) |
Upper respiratory tract infection | 180 (5.4) | 214 (6.5) |
Angina pectoris | 172 (5.1) | 183 (5.6) |
Pneumonia | 178 (5.3) | 162 (4.9) |
Treatment-emergent SAEs, n (%) | ||
Patients with ≥ 1 SAEb | 1,455 (43.4) | 1,400 (42.7) |
Acute myocardial infarction | 67 (2.0) | 92 (2.8) |
Angina pectoris | 76 (2.3) | 82 (2.5) |
Pneumonia | 93 (2.8) | 65 (2.0) |
Atrial fibrillation | 69 (2.1) | 72 (2.2) |
Cardiac failure | 71 (2.1) | 63 (1.9) |
Angina unstable | 50 (1.5) | 64 (2.0) |
Osteoarthritis | 51 (1.5) | 45 (1.4) |
Coronary artery disease | 40 (1.2) | 47 (1.4) |
Congestive cardiac failure | 40 (1.2) | 39 (1.2) |
Noncardiac chest pain | 47 (1.4) | 29 (0.9) |
Peripheral arterial occlusive disease | 38 (1.1) | 36 (1.1) |
Acute kidney injury | 38 (1.1) | 31 (0.9) |
Ischemic stroke | 41 (1.2) | 26 (0.8) |
Chronic obstructive pulmonary disease | 34 (1.0) | 32 (1.0) |
Patients who stopped treatment due to TEAEs, n (%)c | ||
Patients who stopped treatment due to any TEAE | 259 (7.7) | 261 (8.0) |
Cardiac disorders | 50 (1.5) | 69 (2.1) |
Cardiac failure | 14 (0.4) | 10 (0.3) |
Acute MI | 6 (0.2) | 7 (0.2) |
MI | 3 (< 0.1) | 8 (0.2) |
Cardiac arrest | 6 (0.2) | 12 (0.4) |
Gastrointestinal disorders | 11 (0.3) | 5 (0.2) |
General disorders and administration-site conditions | 26 (0.8) | 28 (0.9) |
Infections and infestations | 31 (0.9) | 19 (0.6) |
COVID-19 pneumonia | 6 (0.2) | 7 (0.2) |
Pneumonia | 13 (0.4) | 6 (0.2) |
Injury, poisoning, and procedural complications | 10 (0.3) | 2 (< 0.1) |
Musculoskeletal and connective tissue disorders | 8 (0.2) | 15 (0.5) |
Neoplasms benign, malignant and unspecifiedd | 71 (2.1) | 67 (2.0) |
Malignant non–small cell neoplasms of the respiratory tract, cell type specified | 6 (0.2) | 8 (0.2) |
Malignant pancreatic neoplasmse | 10 (0.3) | 2 (< 0.1) |
Malignant prostatic neoplasms | 6 (0.2) | 9 (0.3) |
Malignant respiratory tract and pleural neoplasms, cell type unspecified | 7 (0.2) | 11 (0.3) |
Respiratory tract small cell carcinomas | 6 (0.2) | 4 (0.1) |
Nervous system disorders | 19 (0.6) | 27 (0.8) |
Psychiatric disorders | 6 (0.2) | 4 (0.1) |
Respiratory, thoracic, and mediastinal disorders | 9 (0.3) | 11 (0.3) |
Skin and subcutaneous tissue disorders | 6 (0.2) | 6 (0.2) |
Vascular disorders | 12 (0.4) | 7 (0.2) |
All treatment-emergent fatal AEs, n (%) | ||
Patients who had any treatment-emergent fatal AE | 223 (6.7) | 213 (6.5) |
Cardiac disorders | 50 (1.5) | 74 (2.3) |
Infections and infestations | 34 (1.0) | 18 (0.5) |
Neoplasms benign, malignant and unspecified (including cysts and polyps) | 64 (1.9) | 51 (1.6) |
AEs of special interest, n (%)f | ||
Potential injection-site reaction eventsg | 78 (2.3) | 65 (2.0) |
Potential demyelination eventsg | ||
Peripheral neuropathyg | 45 (1.3) | 32 (1.0) |
Sensory abnormalities NECg | 62 (1.8) | 65 (2.0) |
Sensory abnormalities NECh | 37 (1.1) | 39 (1.2) |
Chronic polyneuropathiesg | 27 (0.8) | 33 (1.0) |
Transaminase elevations and potential hepatic disordersg | ||
Liver function analysesg | 63 (1.9) | 56 (1.7) |
Hepatocellular damage and hepatitis NECg | 47 (1.4) | 48 (1.5) |
Hepatocellular damage and hepatitis NECh | 35 (1.0) | 32 (1.0) |
AE = adverse event; NEC = not elsewhere classifiable; OLE = open-label extension; SAE = serious adverse event; TEAE = treatment-emergent adverse event.
aTEAEs reported by 5% or more of patients in any treatment group are listed in descending order of frequency in the evolocumab group.
bTreatment-emergent SAEs reported by 1% or more of patients in any treatment group are listed in descending order of frequency in the evolocumab group.
cTEAEs that led to the discontinuation of the study drug reported by more than 5 patients in any treatment group are listed in descending order of frequency in the evolocumab group.
dIncluding cysts and polyps.
eExcluding islet cell carcinoma and carcinoid tumours.
fAEs of special interest reported by 1% or more of patients in any treatment group are listed in descending order of frequency in the evolocumab group.
gBoth parent study and open-label study data are used.
hOpen-label study data only.
Source: Clinical Summary Report Module 2.7.4, Summary of Clinical Safety.24 Details included in the table are from the sponsor’s Summary of Clinical Evidence.
Table 29: Summary of Harms in the MI Subgroup of the FOURIER-OLE Studies (Integrated Results)
Adverse events | Treatment group in the parent study | |
|---|---|---|
Evolocumab (N = 2,815) | Placebo (N = 2,767) | |
TEAEs, n (%) | ||
≥ 1 adverse event | 2,426 (86.2) | 2,378 (85.9) |
Grade ≥ 2 | 2,278 (80.9) | 2,227 (80.5) |
Grade ≥ 3 | 1,548 (55.0) | 1,529 (55.3) |
Grade ≥ 4 | 449 (16.0) | 463 (16.7) |
SAEs, n (%) | ||
Patients with ≥ 1 SAE | 1,195 (42.5) | 1,180 (42.6) |
Patients who stopped treatment due to AEs, n (%) | ||
AEs leading to treatment discontinuation | 201 (7.1) | 217 (7.8) |
Serious | 173 (6.1) | 179 (6.5) |
AE = adverse event; SAE = serious adverse event; TEAE = treatment-emergent adverse event.
Source: Amgen FOURIER-OLE studies, Amgen data on file.23
Critical Appraisal
Internal Validity
This section summarizes the integrated results of 2 phase IIIb, multicentre, single-arm, 5-year OLE studies that included patients who completed the parent FOURIER trial. An open-label study design can influence the perception of improvement and/or harms by patients and clinicians, particularly in outcomes that are subjective in measurement and interpretation. However, because all fatal and nonfatal cardiovascular events and deaths were adjudicated by an external, independent CEC, the assessment of the primary and key secondary end points in the FOURIER-OLE studies were not likely to have been affected by the open-label design.
Because the descriptive analyses used in the OLE studies and the ad hoc subgroup analysis of patients who experienced a previous MI, the available evidence should only be considered suggestive of a potential treatment effect, subject to the uncertainty associated with the exploratory nature of the analyses.
External Validity
The baseline characteristics of all patients enrolled in the FOURIER-OLE studies were similar in the randomized treatment groups from the parent FOURIER trial. Although most patients were from the study sites located in Europe (> 66%), their demographics were generally similar to the patient population in Canada. In general, the baseline characteristics of patients in the MI subgroup were similar to the overall OLE patient population.
Because the sponsor’s reimbursement request is focused on the patient population with recent ACS (in the previous year), it should be noted that the MI subgroup included patients who experienced an MI before and/or during the parent FOURIER trial. The mean time from the most recent MI to enrolment in the overall OLE patient population was 69.606 months (SD = 74.237 months) in patients who were randomized to evolocumab in the parent trial and 68.531 months (SD = 71.613 months) in patients who were randomized to placebo. In the subset of patients who experienced a previous MI, the mean time from the most recent MI was 8.070 years (SD = 6.137 years) in patients who were randomized to evolocumab in the parent trial and 7.835 years (SD = 5.905 years) in patients who were randomized to placebo.
Study Addressing Gap in the Systematic Review Evidence
The contents within this section have been informed by materials submitted by the sponsor. The following has been summarized and validated by the CDA-AMC review team.
This section summarizes 1 study that was submitted by the sponsor to address a gap in the systematic review evidence. A summary of the evidence gap identified by the sponsor and a brief description of the study that addresses this gap are presented in Table 30.
Table 30: Summary of Gaps in the Systematic Review Evidence
Evidence gap | Study that addresses the evidence gap | |
|---|---|---|
Study description | Summary of key results | |
The FOURIER trial excluded patients whose most recent MI or stroke was in the 4 weeks before randomization (i.e., the evidence gap in the systematic review is the patient population with an acute ACS). | The EVOPACS study26 is a randomized, double-blind, placebo-controlled, multicentre study that assessed the efficacy and safety of evolocumab, compared to placebo, in the reduction of LDL-C when administered immediately after an ACS event. | At week 8, the proportion of patients with LDL-C levels of less than 1.8 mmol/L was 95.7% in the evolocumab group and 37.6% in the placebo group. At week 8, the mean change from baseline in LDL-C was –77.1% in the evolocumab group and –35.4% in the placebo group. Treatment with evolocumab, in addition to high-intensity statin therapy, was generally well tolerated in the acute ACS setting. |
ACS = acute coronary syndrome; LDL-C = low-density-lipoprotein cholesterol; MI = myocardial infarction.
Source: Details included in the table are from the sponsor’s Summary of Clinical Evidence.2
Description of Study
The EVOPACS study26 is a randomized, double-blind, placebo-controlled, multicentre study that assessed the efficacy and safety of evolocumab 420 mg administered subcutaneously every month, compared to matching placebo, in the reduction of LDL-C when administered immediately after an ACS event (N = 308). The primary objective was to evaluate the effectiveness of evolocumab, compared to placebo, administered in the acute phase of ACS in the reduction of LDL-C at week 8 in patients receiving guideline-recommended high-intensity statin treatment (i.e., atorvastatin 40 mg once daily). The secondary objective was to assess the safety and tolerability of early administration of evolocumab in the acute phase of ACS.26
Screening was performed on patients who were medically stabilized as soon as possible after hospital admission. The first patient was enrolled on January 23, 2018; patients were enrolled at 7 clinical centres in Switzerland and were randomized in a 1:1 ratio to receive either evolocumab or placebo. The analyses presented in this report are based on a database snapshot date of June 6, 2019.26
Populations
Patients eligible for inclusion were adults (aged ≥ 18 years) who were hospitalized for a recent ACS (NSTEMI or unstable angina in < 72 hours or STEMI in < 24 hours before screening) and who had LDL-C levels as follows:26
LDL-C of at least 1.8 mmol/L or non-HDL-C of at least 2.6 mmol/L in patients receiving stable treatment with a high-intensity statin for at least 4 weeks before enrolment (i.e., continuous treatment that was unchanged with regard to statin intensity over the previous 4 weeks)
LDL-C of at least 2.3 mmol/L or non-HDL-C of at least 3.1 mmol/L in patients receiving stable treatment with a low-intensity or moderate-intensity statin for at least 4 weeks before enrolment (i.e., continuous treatment that was unchanged with regard to statin intensity over the previous 4 weeks)
LDL-C of at least 3.2 mmol/L or non-HDL-C of at least 4.0 mmol/L in patients who were statin-naive or who had not been on a stable (unchanged) statin regimen for at least 4 weeks before enrolment.
Patients were excluded if their clinical status was unstable, or they experienced uncontrolled cardiac arrhythmia, severe renal dysfunction, active liver disease or hepatic dysfunction, intolerance to atorvastatin or statins, and previous use of evolocumab or another PCSK9 inhibitor.26
Interventions
Patients received 2 doses of evolocumab during the EVOPACS study; the first dose was administered by subcutaneous injection on day 1 (at the study site during hospitalization for the index ACS), and the second dose was administered at week 4 during a scheduled study-site visit. Evolocumab 420 mg and placebo were administered subcutaneously once monthly.
All patients received effective, high-intensity statin background therapy consisting of atorvastatin 40 mg once daily for the duration of the study, starting on day 1 and continuing through to week 8. Other medical therapies initiated during hospitalization for the index ACS event were administered in accordance with current guidelines for the management of patients with ACS and the clinical judgment of treating physicians.26
Outcomes
The primary end point was the percent change from baseline to week 8 in the calculated LDL-C level. The secondary end points included AEs, SAEs, product complaints, and laboratory abnormalities from baseline to week 8.26
Statistical Analysis
This study was a superiority trial powered to assess the primary end point: percent change from baseline to week 8 in LDL-C. It was assumed an average percent change of –30% in the placebo arm (atorvastatin 40 mg once daily) and –44% in the active treatment arm (evolocumab 420 mg administered subcutaneously once on day 1 plus atorvastatin 40 mg once daily) would yield a difference in LDL-C percent reduction of 14%. A common SD of 36% was adopted. To achieve 90% power at a significance level of 5% for a 2-sided t test, and assuming a dropout rate of 10% at week 8, a total of 308 patients (154 in each treatment group) were to be recruited.26
Efficacy and safety analyses were performed on the full analysis set, which included all randomized patients who received at least 1 dose of evolocumab. The superiority of evolocumab over placebo was assessed for all efficacy end points, without applying multiplicity adjustments. In all efficacy and safety analyses, patients were grouped according to their randomized treatment group assignment.26
The primary analysis — percent change in LDL-C from day 1 to 8 weeks — was conducted with a linear mixed-effects model, adjusted for the stratification factors (with the presence of stable statin treatment for at least 4 weeks before enrolment as a fixed effect and study centre as a random effect). Analysis was based on the intention-to-treat principle and patients contributed to the group to which they were randomized. For analyses of safety end points, missing data were not imputed.26
Results
Patient Disposition
The patient disposition for the EVOPACS trial is illustrated in Table 31.
Baseline Characteristics
A summary of baseline characteristics in the EVOPACS study is presented in Table 32.
Exposure to Study Treatments
A summary of treatment exposure in the EVOPACS study is presented in Table 33. Measures of patient compliance were not required for this study.
Co-interventions and Concomitant Medications
Patients were advised to follow a stable, therapeutic lifestyle and diet, as outlined in adult treatment panel III of the National Cholesterol Education Program, or an equivalent diet for the duration of the study. Lifestyle and dietary habits, as well as the level of physical exercise, were to be maintained throughout the study duration.26
Most patients (235 [76%]) were not taking a statin at baseline, 37 (12%) were on low-intensity to moderate-intensity statins, and 36 (12%) were on high-intensity statins. Twenty-four percent were taking Aspirin at baseline. By week 4, 281 patients (97%) were receiving high-intensity statins and 278 (96%) were on an Aspirin regimen. The use of these medications remained consistent throughout the rest of the study. In addition, the use of ticagrelor (an anticoagulant) by 4 patients (1%) at baseline increased to 198 patients (68%) by the time of discharge and remained at approximately those levels through week 8.26
Table 31: Summary of Patient Disposition in the EVOPACS Study
Patient disposition | Evolocumab (N = 155) | Placebo (N = 153) |
|---|---|---|
Baseline (index hospitalization) | ||
Refused injection and withdrew consent, n (%) | 0 | 1 (0.7) |
Double-blind injection of study drug, n (%) | 155 (100.0) | 152 (99.3) |
Patients who completed the study, n (%) | 146 (94.2) | 151 (98.7) |
Patients who discontinued the study, n (%) | 9 (5.8) | 2 (1.3) |
Patient died, n (%) | 2 (1.3) | 0 |
Patient refused further participation in the study, n (%) | 6 (3.9) | 2 (1.3) |
Patient was lost to follow-up, n (%) | 0 | 0 |
Other,a n (%) | 1 (0.6) | 0 |
aPatient was in very bad health and did not have any energy to spare for the study, based on the information from hospital letters.
Source: Amgen Clinical Study Report, EVOPACS.26
Table 32: Summary of Baseline Characteristics in the EVOPACS Study
Characteristic | Evolocumab (N = 155) | Placebo (N = 153) |
|---|---|---|
Mean age, years (SD) | 60.5 (12.0) | 61.0 (10.7) |
Sex, n (%) | ||
Male | 128 (83) | 123 (80) |
Female | NR | NR |
Mean body mass index, kg/m2 (SD) | 26.9 (4.0) | 27.8 (3.9) |
Medical history | ||
Family history of CAD, n (%) | 51 (33) | 42 (27) |
PAD, n (%) | 4 (3) | 4 (3) |
Diabetes mellitus, n (%) | 23 (15) | 24 (16) |
Insulin-treated, n (%) | 1 (1) | 6 (4) |
Arterial hypertension, n (%) | 79 (51) | 85 (56) |
Hypercholesterolemia, n (%) | 137 (88) | 129 (84) |
Active smoker, n (%) | 64 (41) | 46 (30) |
History of smoking, n (%) | 79 (51) | 75 (49) |
Previous MI, n (%) | 24 (15) | 19 (12) |
Previous PCI, n (%) | 25 (16) | 23 (15) |
Previous CABG, n (%) | 5 (3) | 4 (3) |
Premature CAD, cerebral or peripheral | ||
Vascular disease, n (%) | 14 (9) | 15 (10) |
History of CHF, n (%) | 6 (4) | 0 (0) |
History of stroke, n (%) | 2 (1) | 0 (0) |
History of TIA, n (%) | 5 (3) | 0 (0) |
History of malignancy, n (%) | 13 (8) | 10 (7) |
Lipid-lowering therapy, n (%)a | ||
No statin, n (%) | 124 (80) | 117 (76) |
Low- or moderate-intensity statin, n (%) | 13 (8) | 22 (14) |
High-intensity statin, n (%) | 18 (12) | 14 (9) |
Ezetimibe, n (%) | 6 (4) | 9 (6) |
Index ACS event, n (%) | ||
NSTE-ACS | 88 (57) | 107 (70) |
STEMI | 67 (43) | 46 (30) |
ACS = acute coronary syndrome; CABG = coronary artery bypass graft; CAD = coronary artery disease, CHF = congestive heart failure, MI = myocardial infarction, NR = not reported, NSTE = non-ST-elevation; PAD = peripheral artery disease, PCI = percutaneous intervention, SD = standard deviation; STEMI = ST-segment elevation myocardial infarction; TIA = transient ischemic attack.
Note: Baseline values were used, except if missing: Screening values used.
aStatin treatment stable (unchanged) for ≥ 4 weeks before study enrolment.
Source: Amgen Clinical Study Report, EVOPACS.26
Table 33: Summary of Treatment Exposure in the EVOPACS Study
Patient disposition | Evolocumab (N = 155) | Placebo (N = 152) |
|---|---|---|
Mean duration of IP exposure, daysa (SD) | 52.9 (11.7) | 56.2 (7.0) |
Median duration of IP exposure, daysa (Q1 to Q3) | 57.0 (54.0 to 58.0) | 57.0 (56.0 to 59.0) |
Mean cumulative dose of evolocumab, mgb (SD) | 785.8 (141.3) | 2.8 (34.1) |
Median cumulative dose of evolocumab, mgb (Q1 to Q3) | 840.0 (840.0 to 840.0) | 0.0 (0.0 to 0.0) |
Number of IP doses received, n (%) | ||
1 | 20 (12.9) | 8 (5.3) |
2 | 135 (87.1) | 144 (94.7) |
Mean duration of study exposure, daysc (SD) | 58.3 (11.2) | 59.9 (4.4) |
Median duration of study exposure, daysc (Q1 to Q3) | 59.0 (57.0 to 62.0) | 60.0 (57.0 to 62.0) |
IP = investigational product; Q1 = first quartile; Q3 = third quartile; SD = standard deviation.
aIP exposure = min (last IP dose date + 28 days, EOS date) – first IP dose date + 1.
bPartial doses imputed as 0 mg.
cStudy exposure = EOS date – first IP dose date + 1.
Source: Amgen Clinical Study Report, EVOPACS.26
Efficacy
LDL-C Outcome
A summary of the LDL-C parameter in the EVOPACS study is presented in Table 34. The mean change from baseline to week 8 in LDL-C was –77.1% (SD = 15.8%) in the evolocumab group and –35.4% (SD = 26.6%) in the placebo group (least squares mean difference = –40.7%; 95% CI, –45.2% to –36.2%). The mean LDL-C level at week 8 was 0.79 mmol/L (SD = 0.46 mmol/L) in the evolocumab group and 2.06 mmol/L (SD = 0.63 mmol/L) in the placebo group. At week 8, the proportion of patients with LDL-C levels of less than 1.8 mmol/L was 95.7% in the evolocumab group and 37.6% in the placebo group.
Table 34: Summary of LDL-C Outcomes in the EVOPACS Study
Variable | Evolocumab (N = 155) | Placebo (N = 153) | Mean difference (95% CI)a | P value |
|---|---|---|---|---|
Lipid parameter outcomes | ||||
Change from baseline in LDL-C (mmol/L) | ||||
Baseline, mean (SD) | 3.61 (1.00) | 3.42 (0.94) | 0.14 (–0.05 to 0.32) | 0.154 |
Week 8, mean (SD) | 0.79 (0.46) | 2.06 (0.63) | –1.27 (–1.40 to –1.14) | < 0.001 |
Mean absolute change from baseline (SD) | –2.83 (1.02) | –1.35 (1.04) | –1.43 (–1.63 to –1.22) | < 0.001 |
Mean percent change from baseline in primary end point, (SD) | –77.1 (15.8) | –35.4 (26.6) | –40.7 (–45.2 to –36.2) | < 0.001 |
Treatment response based on LDL-C < 1.8 mmol/L | ||||
LDL-C < 1.8 mmol/L at week 8, n of N (%) | 135 of 141 (95.7) | 56 of 149 (37.6) | 57.8 (49.4 to 66.2) | < 0.0001a |
CI = confidence interval; LDL-C = low-density-lipoprotein cholesterol; SD = standard deviation.
Note: Data are expressed as means or least squares + SD, or n (%). The P value is for the randomized arm, which used mixed models to correct for a random effect of the study site and a fixed effect of stable statin treatment before randomization.
aP value is based on the Cochran-Mantel Haenszel test stratified by randomization stratification factors.
Source: Amgen Clinical Study Report, EVOPACS.26
Harms
A total of 78 of 155 patients (50.3%) in the evolocumab group and 77 of 152 patients (50.7%) in the placebo group experienced at least 1 AE during the study. Nonserious AEs, including prespecified AE categories, occurred in 73 patients (47.1%) in the evolocumab group and 71 patients (46.7%) in the placebo group; for 2 patients (1.3%) (both in the placebo group), these AEs led to the discontinuation of the investigational product. The most common AE was chest pain (8 [5.2%] in the evolocumab group and 8 [5.3%] in the placebo group), followed by musculoskeletal pain (10 [6.5%] and 5 [3.3%], respectively), and nasopharyngitis (7 [4.5%] and 4 [2.6%] respectively).26
SAEs occurred in 12 patients (7.7%) in the evolocumab group and 11 patients (7.2%) in the placebo group, with 3 patients (1.0%) (2 patients [1.3%] and 1 patient [0.7%], respectively) experiencing SAEs leading to the discontinuation of the investigational product. Two patients (both in the evolocumab group) died during the study; neither death was considered to be related to the investigational product by the investigator or the Data Safety and Monitoring Board, and both were adjudicated as cardiovascular deaths.26
Key Take-Aways
The EVOPACS study was conducted to assess the tolerability, safety, and efficacy of evolocumab in the acute setting of ACS (< 4 weeks after an ACS event), which was not covered in the FOURIER outcomes study. However, interpretation of the results from the EVOPACS study is limited by the small sample size and short (8-week) follow-up. The clinical experts consulted by CDA-AMC did not consider the exclusion of patients whose most recent MI or stroke was in the 4 weeks before randomization to be a major gap in the evidence. The clinical experts advised that evolocumab is not likely to be initiated in patients with an index case of ACS in the inpatient setting, as they are most likely to be statin-naive, which was the case for this study as well, where 80% and 76% patients in the evolocumab and placebo arms were statin-naive, respectively. As a result, these patients would first be stabilized on a statin before any add-on therapies are considered. Nonetheless, the clinical experts expect that patients with acute MI and who are stabilized will likely respond to treatment with evolocumab in a manner similar to that in patients with nonacute MI.
Although most of the baseline characteristics were similar in the treatment groups, there were slight imbalances in index ACS events (for NSTE-ACS, there were 57% and 70% patients in the evolocumab group and placebo group, respectively; for STEMI, there were 43% and 30% patients in the evolocumab group and placebo group, respectively). Further, because active smoking was a major risk factor for cardiovascular events in the FOURIER trial, it should be noted that there were more active smokers in the evolocumab group than in the placebo group (41% versus 30%).
Additional Studies Submitted by the Sponsor
The contents within this section have been informed by materials submitted by the sponsor. The information in Table 35 was summarized and validated by the CDA-AMC review team.
Table 35: Summary of Additional Studies Submitted by the Sponsor
Included study or sponsor-identified gap in the systematic review evidence | Description of the sponsor-submitted study | Reason(s) for study exclusion in the reassessment of evolocumab |
|---|---|---|
HUYGENS study | ||
The HUYGENS study was included in the sponsor’s systematic review. The sponsor concluded that the findings from the HUYGENS study may provide a mechanistic rationale for the reduction in recurrent cardiovascular events with evolocumab in patients with recent NSTEMI2 (i.e., the study included patients with a clinical indication for coronary angiography during admission due to NSTE-ACS with interventional treatment of culprit plaque57). | The HUYGENS study57 was a phase III, double-blind, placebo-controlled, randomized study (N = 164). The primary objective was to evaluate the effect of evolocumab on FCT in adult patients with NSTE-ACS who are taking maximally tolerated statin therapy. The secondary objective was to evaluate the effects of evolocumab on coronary plaque morphology. The safety objective was to evaluate the safety and tolerability of evolocumab. Patients were enrolled between November 19, 2018, and December 27, 2019, at 23 clinical centres (Australia, Czech Republic, Germany, Hungary, Italy, and the Netherlands). Patients’ statin therapy was up-titrated to a maximally tolerated dose before randomization. Patients were randomized in a 1:1 ratio to receive evolocumab 420 mg SC once every month or matching placebo SC once every month, in the 7 days after providing informed consent. Randomization was stratified by duration of current statin use (> 4 weeks vs. ≤ 4 weeks) at screening. The planned duration of the study was 53 weeks, which included initial screening, double-blind study treatment, and the end-of-study follow-up periods. Publications: Nicholls et al. (2022)58 and Nicholls et al. (2021).59 | Based on input from the clinical experts consulted by CDA-AMC and input from patient and clinician groups and public drug plans, as well as in consultation with members of the expert committee, the end points of features of plaque morphology, such as FCT, were not considered to be most relevant to expert committee deliberations. |
ZERBINI study | ||
The ZERBINI study was submitted by the sponsor to address the following gap in the systematic review evidence. The sponsor-identified gap in the evidence was real-world evidence on the efficacy and safety of evolocumab in patients with ASCVD living in Canada. | The ZERBINI study60 was a retrospective and prospective observational chart review study (N = 131). The primary objective was to characterize the clinical characteristics of adult patients in Canada at the initiation of evolocumab therapy. The secondary and exploratory objectives were to evaluate the effectiveness, safety, and persistence of therapy with evolocumab over time. The study was conducted in Canada, Mexico, Columbia, Saudi Arabia, and Kuwait; the focus of this study was data reported on the subset of patients in Canada. The study included patients who were initiated on evolocumab therapy at a physician’s discretion between August 1, 2017, and July 9, 2019, at 15 sites in Canada. Data were collected from patient medical records up to 6 months before initiation of evolocumab therapy and 12 months after initiation, irrespective of the continuation or discontinuation of evolocumab therapy. Data collection ended on July 6, 2020. Publication: Gupta et al.60 | Based on input from the clinical experts consulted by CDA-AMC and input from patient and clinician groups and public drug plans, as well as in consultation with members of the expert committee, the end points of clinical characteristics and drug and resource use were not considered to be most relevant to expert committee deliberations. Moreover, the population was not specific to patients with recent ACS (in the previous year) and the study lacked a relevant comparator group. |
ACS = acute coronary syndrome; ASCVD = atherosclerotic cardiovascular disease; FCT = fibrous cap thickness; NSTE = non-ST-elevation; NSTEMI = non-ST-segment elevation myocardial infarction; SC = subcutaneous; vs. = versus.
Sources: Clinical Study Report of the HUYGENS study,57 Clinical Study Protocol of the ZERBINI study,61 and Gupta et al.60 Details included in the table are from the sponsor’s Summary of Clinical Evidence.2
Discussion
Summary of Available Evidence
Evidence Previously Reviewed by CDA-AMC
The FOURIER trial12 was a phase III, double-blind, placebo-controlled, randomized clinical trial (N = 27,564). The primary objective was to evaluate the effect of evolocumab, compared to placebo, on the risk of cardiovascular death, MI, stroke, hospitalization for unstable angina, or coronary revascularization, whichever occurred first, in patients with clinically evident ASCVD. The trial included patients with LDL-C of 1.8 mmol/L or more (or non-HDL-C of 2.6 mmol/L or more) after at least 2 weeks of optimized statin therapy, with or without ezetimibe. Patients were randomized in a 1:1 ratio to receive either subcutaneous evolocumab (140 mg once every 2 weeks or 420 mg once every month, per patient preference) or matching placebo injection. Treatment continued until a minimum of 1,630 patients experienced an event adjudicated by an independent external committee as qualifying for a key secondary end point event of cardiovascular death, MI, and stroke. The median follow-up period was 26 months.
New Evidence Identified in the Present Systematic Review Conducted by the Sponsor
The Gencer et al.13 and Sabatine et al. (2018) studies14 were subgroup analyses of the FOURIER trial. The objective of the Gencer et al. study was to evaluate the risks of major adverse cardiovascular events as a function of time from the date of the qualifying MI and to evaluate the effect of evolocumab on cardiovascular outcomes in patients who experienced an MI in the previous year. The objective of the Sabatine et al. (2018) study was to assess the efficacy of evolocumab in 3 subgroups of the FOURIER trial: timing from the most recent MI, number of prior MIs, and the presence of residual multivessel coronary artery disease. The subgroup of patients who experienced an MI in the previous year from the Gencer et al. study and the subgroup of patients who experienced an MI in the previous 2 years in the Sabatine et al. (2018) study were considered most relevant for the purpose of this review. Outcomes of clinical events (cardiovascular death, MI, stroke, hospitalization for unstable angina, or coronary revascularization) were assessed after a median follow-up of 26 months; LDL-C (LDL < 1.8 mmol/L and change from baseline) was assessed at weeks 4 and 48.
In the Gencer et al. study, 2,821 patients who experienced an MI in the previous year were randomized to receive evolocumab and 2,890 patients were randomized to receive placebo. The mean age of the patients was 59.7 years (SD = 9.3 years) in the evolocumab group and 59.5 years (SD = 9.2 years) in the placebo group. The mean time from MI to enrolment was 5.379 months (SD = 2.965 months) in the evolocumab group and 5.355 months (SD = 2.911 months) in the placebo group. Almost all patients had at least 1 major cardiovascular risk factor or at least 2 minor cardiovascular risk factors (99.8% [n = 2,814] of patients in the evolocumab group and 99.8% [n = 2,884] of patients in the placebo group). At baseline, the mean LDL-C level was 2.453 mmol/L (SD = 0.647 mmol/L) in the evolocumab group and 2.467 mmol/L (SD = 0.647 mmol/L) in the placebo group. Almost all patients — 99.9% (n = 2,819) of patients in the evolocumab group and 100.0% (n = 2,889) of patients in the placebo group — were taking a statin at baseline. A total of 3.2% (n = 91) of patients in the evolocumab group and 3.3% (n = 95) of patients in the placebo group were taking ezetimibe at baseline.
In general, the baseline characteristics of patients who experienced an MI in the previous 2 years in the Sabatine et al. (2018) study were similar to the baseline characteristics of those who experienced an MI in the previous year in the Gencer et al. study. A total of 4,109 patients who experienced an MI in the previous 2 years were randomized to receive evolocumab and 4,293 patients were randomized to receive placebo. The mean time from MI to enrolment was 9.191 months (SD = 6.441 months) in the evolocumab group and 9.366 months (SD = 6.544 months) in the placebo group.
Patients who completed the FOURIER trial had the option to enrol in 1 of the two 5-year extension studies (one study was conducted in North America and Eastern Europe and the other study was conducted in Western Europe) with open-label evolocumab (N = 5,305 and N = 1,600, respectively).19,20 The primary objective of both studies was to describe the safety and tolerability of the long-term administration of evolocumab. An ad hoc subgroup analysis of the OLE studies was also conducted in the subset of patients who experienced an MI before or during the parent trial. Comparisons were made between patients randomized to receive evolocumab versus placebo in the parent trial.
The mean age of patients in the MI subgroup was 62.2 years (SD = 8.7 years) in the evolocumab group and 62.0 years (SD = 8.6 years) in the placebo group. Most of the participants were male in this subgroup (79.3% in the evolocumab group and 78.8% in the placebo group). At baseline, the mean LDL-C level in the MI subgroup was 2.5 mmol/L (SD = 0.7 mmol/L) in both the evolocumab and placebo groups. These characteristics were similar in the overall FOURIER-OLE study population as well. Time from the most recent MI in the MI subgroup was 8.070 years (SD = 6.137 years) in the evolocumab group and 7.835 years (SD = 5.905 years) in the placebo group.
In the overall FOURIER-OLE study population, the mean time from MI to enrolment was 69.606 months (SD = 74.237 months) in the evolocumab group and 68.531 months (SD = 71.613 months) in the placebo group. Most of the participants were white (93.4% in the evolocumab group and 94.5% in the placebo group). The major and minor cardiovascular risk factors, as well as risk factor counts, were similar in the evolocumab and placebo groups of the overall OLE population. These baseline characteristics were not available for the MI subgroup population.
The EVOPACS study25 was a phase III, double-blind, placebo-controlled, randomized trial (N = 308). The primary objective was to assess the effectiveness of evolocumab 420 mg once every month, compared to placebo, in the reduction of LDL-C at week 8 in patients receiving high-intensity statin treatment during the acute phase of ACS. The mean age of the patients was 60.5 years (SD = 12.0 years) in the evolocumab group and 61.0 years (SD = 10.7 years) in the placebo group. Most of the participants were male (83% in the evolocumab group and 80% in the placebo group). Although half of the patients in both groups had a history of smoking, there were more active smokers in the evolocumab group than in the placebo group (41% versus 30%). Most of the patients enrolled in this study were statin-naive (80% in the evolocumab group and 76% in the placebo group). In terms of index ACS events, 57% of patients in the evolocumab group and 70% of patients in the placebo group had NSTE-ACS, and 43% of patients in the evolocumab group and 30% of patients in the placebo group had STEMI.
Interpretation of Results
Efficacy
The results from the Gencer et al. study are likely indicative of a possible differential effect with evolocumab, in addition to high-to-moderate intensity statin therapy, compared to placebo, on the primary and key secondary composite outcomes, over a median follow-up period of 26 months in the parent trial, in patients who experienced an MI in the previous year or who were 1 year or more beyond their MI. Of note, the subgroup analysis results for the primary end point included the null for the subset of patients who were 1 year or more beyond their MI (HR = 0.92; 95% CI, 0.84 to 1.01). After consultation with the clinical experts, each component of the composite outcome was concluded to be clinically meaningful, particularly the key secondary composite outcome of cardiovascular death, MI, and stroke. This possible differential treatment effect on the key secondary composite end point — HR was 0.75 (95% CI, 0.62 to 0.91) for patients who experienced an MI in the previous year and 0.85 (95% CI, 0.76 to 0.96) for patients who were 1 year or more beyond their MI — appears to be primarily driven by the reduction in risk of MI, but there was no difference in the risk of cardiovascular death and of stroke. Based on the association between an absolute reduction in LDL-C with statin therapy and a proportional reduction in the risk of major vascular events,49,53,54 the subgroup analysis results for the exploratory outcomes of change from baseline to week 48 in LDL-C, as well as of treatment response based on LDL-C levels of less than 1.8 mmol/L at week 4, are likely indicative of a possible benefit with evolocumab in patients who experienced an MI in the previous year or who were 1 year or more beyond their MI. Additionally, based on the HUYGENS study,58 there is likely a biological plausibility (involving plaque stabilization and regression) of the possible differential effect of evolocumab in patients with recent versus remote MI (< 1 year versus ≥ 1 year). Because the conditions that can lower the credibility and reliability of the subgroup analysis results have been described in the Critical Appraisal section of this report, the available evidence should not be viewed as conclusive; however, the results may be interpreted as likely indicative of a possible subgroup effect. Nonetheless, the subgroup analyses results were generally consistent with the direction of the results reported in the overall FOURIER trial, with the exception of stroke, for which the HR was 0.79 (95% CI, 0.66 to 0.95),12 whereas the corresponding subgroup analysis results included the null (the HR was 0.81 [95% CI, 0.50 to 1.31] for the subset of patients who experienced an MI in the previous year and 0.80 [95% CI, 0.62 to 1.03] for the subset of patients who were 1 year or more beyond their MI).
The results from the Sabatine et al. (2018) study for the subgroup of patients whose prior MI was categorized by a threshold of 2 years were generally consistent with the corresponding subgroup analysis results from the Gencer et al. study. Nonetheless, the subgroup analysis results for patients whose prior MI was categorized by a threshold of 2 years are likely supportive of the subgroup analysis results for patients whose prior MI was categorized by a threshold of 1 year. Also of note, the mean time from MI to enrolment was approximately 9 months in the subgroup of patients who experienced an MI in the previous 2 years; thus, in accordance with the reimbursement request, the subgroup analysis results for the timing of a prior MI (< 2 years versus ≥ 2 years) will not be further discussed.
To interpret the new evidence from a clinical perspective, the corresponding treatment benefit associated with statins was considered. A meta-analysis of 21 randomized controlled trials by Byrne et al. (2022)62 evaluated the association between an absolute reduction in LDL-C with statins and an absolute risk reduction of individual clinical outcomes (all-cause mortality, MI, and stroke). The meta-analysis results suggest that statin therapy (versus placebo or usual care in primary and secondary prevention) is associated with modest absolute risk reductions in the individual outcomes (0.8% [95% CI, 0.4% to 1.2%] for all-cause mortality; 1.3% [95% CI, 0.9% to 1.7%] for MI; and 0.4% [95% CI, 0.2% to 0.6%] for stroke) compared to the relative risk reductions (9% [95% CI, 5% to 14%]; 29% [95% CI, 22% to 34%]; and 14% [95% CI, 5% to 22%], respectively).62 However, Byrne et al. (2022)62 noted the presence of significant heterogeneity, thereby reducing the certainty of the results and, as such, a conclusive association between LDL-C and individual clinical events was not established. After consultation with the clinical experts, an absolute risk difference of 2% in 5 years for secondary prevention is generally considered the standard for generic lipid-lowering oral therapy. Overall, the possible differential effect of evolocumab between the subset of patients who experienced an MI in the previous year and the subset of patients who were 1 year or more beyond their MI is likely clinically meaningful.
An acute MI is an opportune time for patients to access appropriate and effective treatment, resources, and education. However, it is important to recognize that this subset of patients will eventually become patients with remote ACS and that, in theory, evolocumab is a lifelong medication. Thus, it is important to consider the overall evidence from the FOURIER trial in addition to the subgroup analysis results. In the December 2017 Clinical Review Report (Resubmission) on Evolocumab (Repatha), CDA-AMC concluded that the overall results of the FOURIER trial demonstrated the benefit of evolocumab over placebo for the primary and key secondary end points. The treatment effect was considered modest for the primary end point and the key secondary end point, with an absolute difference between evolocumab and placebo of 1.5% for both end points, and an HR of 0.85 (95% CI, 0.79 to 0.92) for the primary end point and 0.80 (95% CI, 0.73 to 0.88) for the key secondary end point. The treatment effect appeared to have been primarily driven by the reduction in the risk of MI, and there was no difference in mortality or hospitalization for unstable angina between groups. The reduction in clinical events was less than anticipated based on the reduction in LDL-C; however, this finding may have been due to the unexpectedly short follow-up of a median of 26 months relative to the planned follow-up of 5 years. CDA-AMC concluded that the clinical significance of the absolute difference between treatment groups was uncertain.18
In addition to the subgroup analysis results, new evidence from the 5-year, single-group, extension studies of the FOURIER trial with open-label evolocumab were also submitted by the sponsor. After consultation with the clinical experts on the ad hoc subgroup analysis of patients who experienced a prior MI, it was concluded that the results suggest a differential effect in the primary and key secondary end points in patients who were randomized to evolocumab in the parent trial compared to those who were randomized to placebo (i.e., delayed treatment). Of note, this differential effect on the key secondary composite end point was driven by the individual components of cardiovascular death and MI, but there was no difference in stroke. The subgroup analysis results were generally consistent with the integrated results from the OLE studies of the FOURIER trial, with the exception of coronary revascularization, for which the HR was 0.85 (95% CI, 0.73 to 1.00), whereas the corresponding subgroup analysis results did not include the null (HR = 0.82, 95% CI, 0.69 to 0.97). Regardless of treatment assignment in the parent trial, the mean change from baseline to week 260 in LDL-C level was approximately –60% in patients who experienced a prior MI. However, the OLE studies and the associated ad hoc subgroup analysis did not assess the differential treatment effect of evolocumab between patients who experienced an MI in the previous year and those who were 1 year or more beyond their MI. Specifically, the mean time from prior MI to enrolment was approximately 70 months in patients included in the integrated results of the OLE studies and approximately 96 months in patients included in the ad hoc subgroup analysis. Nonetheless, the results observed in the ad hoc subgroup analysis of the integrated OLE studies may suggest a treatment benefit in patients who experienced a prior MI and who received evolocumab earlier than those who received delayed treatment as a result of randomization in the parent trial.
The FOURIER trial excluded patients who experienced a recent MI or stroke (in the 4 weeks before randomization). In the context of the reimbursement request, the sponsor identified this as a gap in the systematic review evidence and submitted new evidence from the EVOPACS study to fill this gap. The efficacy results from the EVOPACS study suggest a benefit with evolocumab plus atorvastatin, over placebo, in the reduction of LDL-C, including a treatment response of a reduction in LDL-C to less than 1.8 mmol/L at week 8 in patients who experienced an ACS event in the previous 72 hours (i.e., acute ACS). However, limitations associated with the small sample size and short follow-up period should be considered when interpreting these results. After consultation with the clinical experts, it was noted that patients with an index MI are not likely to be started on evolocumab in the hospital setting, as they are most likely statin-naive and, as a result, will first be stabilized on a statin before any add-on therapies are considered. Nonetheless, the expectation was that acute, stabilized MI will likely respond to treatment with evolocumab in a manner similar to nonacute MI.
Based on the overall evidence submitted by the sponsor, evolocumab likely fills the unmet need identified by patients, clinician groups, and the clinical experts for additional pharmacologic options that are effective in lowering LDL-C with minimal side effects in patients with primary hyperlipidemia (including ASCVD). More specifically, this unmet need was highlighted in patients with recent ACS (in the previous year), who are at greater risk of cardiovascular events than those who are further along the trajectory of disease (i.e., history of remote MI [in the previous year]), and who have elevated LDL-C levels despite optimized statin therapy.
Although no major concerns related to generalizability were identified, the following key implementation issues should be considered. At baseline, ezetimibe was permitted but not required in the FOURIER trial. Approximately 3% to 7% of patients in each treatment group by timing of prior MI in the subgroup analysis studies were taking ezetimibe at baseline. During the study, the addition of ezetimibe to a patient’s lipid-lowering regimen could be considered in the setting of an on-study ACS. Therefore, the place in therapy of evolocumab in relation to ezetimibe that is supported by the new evidence is uncertain. However, the 2021 CCS dyslipidemia guidelines5 describe the recommended place in therapy of evolocumab in relation to ezetimibe (refer to the Standards of Therapy section of this report).
Input on considerations for the continuation of therapy differed between clinician groups and the clinical experts consulted by CDA-AMC. Input on the definition of treatment response in clinical practice varied, from thresholds referenced in the 2021 CCS dyslipidemia guidelines5 (i.e., LDL-C < 1.8 mmol/L or non-HDL-C < 2.4 mmol/L or ApoB < 0.7 g/L) to consistent and clinically meaningful lowering of LDL-C (or non-HDL-C or ApoB). In regard to the percent reduction in lipid parameters from pretreatment levels, input received from clinician groups on the definition of a clinically meaningful response varied from a more than 20% reduction in LDL-C to at least a 30% reduction in LDL-C or non-HDL-C. However, 1 clinician group (British Columbia Lipid Specialists) indicated that requiring a minimum percent reduction in LDL-C is not supported by clinical evidence and would lead to an administrative burden without a benefit to patients; this is consistent with input from the clinical experts, who advised that requiring a specific percent reduction in these lipid parameters is arbitrary. The Canadian Dyslipidemia Guideline Committee noted that an optimal response from PCSK9 inhibitors is a 50% to 60% reduction in LDL-C 3 to 6 months after starting therapy. Input on follow-up also varied, from 1 to 12 months after initiating therapy, depending on the patient’s cardiovascular risk, and repeated if nonadherence is suspected. Regarding alternative metrics to LDL-C in the assessment of treatment, the guidelines advise the use of non-HDL-C (< 2.4 mmol/L) or ApoB (< 0.7 g/L) in the setting of elevated triglyceride levels (> 1.5 mmol/L).5
Harms
Safety outcomes were not assessed by subgroups in the Gencer et al. and Sabatine et al. (2018) studies. Based on the review of evolocumab and appraisal of the FOURIER trial in the December 2017 Clinical Review Report (Resubmission) on Evolocumab (Repatha), CDA-AMC concluded that there were no clear differences in AEs or SAEs between treatment groups.18 Because AEs are commonly associated with statins, such as loss of muscle function or muscle weakness, patients expect evolocumab to lower cholesterol levels with minimal side effects. In particular, most patients indicated that the loss of muscle function is an AE they are not willing to tolerate. The incidence of notable harms, including muscle-related events (such as rhabdomyolysis, myopathy, and a myoglobin blood increase), in the FOURIER trial were similar in the 2 treatment groups. However, it is important to note that the duration of follow-up in the parent trial (median, 26 months) is likely inadequate for assessing the long-term relative safety of evolocumab. Although the incidence of AEs and SAEs were similar in the treatment groups in the EVOPACS study, the aforementioned limitation would also be applicable to this 8-week study with a relatively small sample size. No new safety signals were identified in the 5-year OLE of the FOURIER trial.
Conclusion
Two subgroup analyses of patients with a recent MI (< 1 year and < 2 years) in the FOURIER trial, published by Gencer et al. and Sabatine et al. (2018), informed the main body of evidence for this reassessment. The new evidence from the subgroup analyses of the FOURIER trial was submitted to support the identification of a subgroup of patients who would most benefit from evolocumab, which was raised in the previous resubmission for the ASCVD component of primary hyperlipidemia. Evolocumab in addition to high-to-moderate intensity statin therapy, compared to placebo, demonstrated an absolute benefit that was likely clinically meaningful and may be amplified in the subset of patients with a recent MI (i.e., in the previous year). The prespecified subgroup analyses results on the clinical event outcomes, with the exception of stroke, were generally consistent with the overall FOURIER trial results. This possible subgroup effect on the key secondary composite end point appears to have been primarily driven by the reduction in risk of MI, but there was no difference in the risk of cardiovascular death and stroke over a median follow-up period of 26 months. A biological plausibility for the proposed subgroup effect and a greater absolute risk for cardiovascular events were noted in patients who experienced a recent MI but not in patients further along the trajectory of their disease. The ad hoc subgroup analysis of patients who experienced a prior MI in the integrated OLE analysis also informed this reassessment, which provided results on the clinical event outcomes, with the exception of coronary revascularization, that were generally consistent with the analogous results reported in the overall population in the 5-year OLE of the FOURIER trial. Further, the ad hoc subgroup analysis of patients who experienced a prior MI may suggest a treatment benefit in patients who received evolocumab earlier than those who received delayed treatment as a result of randomization in the parent trial. Of note, this possible subgroup effect on the key secondary composite end point appears to have been driven by a reduction in the risk of cardiovascular death and MI, but there was no difference in the risk of stroke. Although no major concerns related to generalizability were identified, the place in therapy of evolocumab in relation to ezetimibe that is supported by the evidence is uncertain. The incidence of TEAEs reported in the FOURIER trial was similar in the 2 treatment groups, including muscle-related events, which is important to patients. However, it is important to note that the duration of follow-up in the parent trial is likely inadequate to assess the long-term relative safety of evolocumab. No new safety signals were identified in the 5-year OLE studies of the FOURIER trial.
References
1.Repatha (evolocumab): 140 mg/mL and 120 mg/mL solution for subcutaneous injection [product monograph]. Mississauga (ON): Amgen Canada Inc.; 2023 Sept 27.
2.Evolocumab (Repatha): sponsor summary of clinical evidence [internal sponsor’s report]. In: Drug Reimbursement Review sponsor submission: Evolocumab (Repatha) 140 mg/mL and 120 mg/mL solution for subcutaneous injection. Mississauga (ON): Amgen Canada Inc.; 2023 Nov 13.
3.Rosenson RS, Cannon CP. Patient education: High cholesterol and lipid treatment options (beyond the basics). In: Post TW, ed. UpToDate. Waltham (MA): UpToDate; 2023: http://www.uptodate.com. Accessed 2024 Feb 23.
4.Rosenson RS. Patient education: High cholesterol and lipids (beyond the basics). In: Post TW, ed. UpToDate. Waltham (MA): UpToDate; 2021: http://www.uptodate.com. Accessed 2024 Feb 20.
5.Pearson GJ, Thanassoulis G, Anderson TJ, et al. 2021 Canadian Cardiovascular Society guidelines for the management of dyslipidemia for the prevention of cardiovascular disease in adults. Can J Cardiol. 2021;37(8):1129-1150. PubMed
6.Gouda P, Savu A, Bainey KR, Kaul P, Welsh RC. Long-term risk of death and recurrent cardiovascular events following acute coronary syndromes. PLoS One. 2021;16(7):e0254008. PubMed
7.Mackinnon ES, Goeree R, Goodman SG, et al. Increasing prevalence and incidence of atherosclerotic cardiovascular disease in adult patients in Ontario, Canada from 2002 to 2018. CJC Open. 2022;4(2):206-213. PubMed
8.CADTH Drug Reimbursement Expert Review Committee final recommendation: evolocumab (Repatha - Amgen Canada Inc.). Ottawa (ON): CADTH; 2016 Feb: https://www.cadth.ca/sites/default/files/cdr/complete/SR0441_complete_Rapatha-Feb-23_16_e.pdf. Accessed 2024 Jan 4.
9.CADTH Drug Reimbursement Expert Review Committee final recommendation: evolocumab (Repatha - Amgen Canada Inc.). Ottawa (ON): CADTH; 2017 Nov: https://www.cadth.ca/sites/default/files/cdr/complete/SR0515_Repatha_Resubmission_complete_Nov_24_17.pdf. Accessed 2024 Jan 4.
10.Pan-Canadian Pharmaceutical Alliance (pCPA). Repatha (evolocumab). 2019; https://www.pcpacanada.ca/negotiation/21004. Accessed 2024 Jan 4.
11.Byrne RA, Rossello X, Coughlan JJ, et al. 2023 ESC Guidelines for the management of acute coronary syndromes. Eur Heart J. 2023;44(38):3720-3826. PubMed
12.Clinical Study Report: 20110118. A double-blind, randomized, placebo-controlled, multicenter study assessing the impact of additional LDL-Cholesterol reduction on major cardiovascular events when evolocumab (AMG 145) is used in combination with statin therapy in patients with clinically evident cardiovascular disease. [internal sponsor’s report]. Thousand Oaks (CA): Amgen Inc.; 2017 Apr 10.
13.Gencer B, Mach F, Murphy SA, et al. Efficacy of evolocumab on cardiovascular outcomes in patients with recent myocardial infarction: A prespecified secondary analysis from the FOURIER trial. JAMA Cardiol. 2020;5(8):952-957. PubMed
14.Sabatine MS, De Ferrari GM, Giugliano RP, et al. Clinical benefit of evolocumab by severity and extent of coronary artery disease: Analysis from FOURIER. Circulation. 2018;138(8):756-766. PubMed
15.Amgen Canada Inc., response to 2023 Dec 18 CADTH request for additional information regarding Repatha (evolocumab) CADTH review: [internal additional sponsor’s information]. Mississauga (ON): Amgen Canada Inc.; 2023 Dec 21.
16.Amgen Canada Inc., response to 2023 Dec 17 CADTH request for additional information regarding Repatha (evolocumab) CADTH review: [internal additional sponsor’s information]. Mississauga (ON): Amgen Canada Inc.; 2024 Jan 30.
17.Medical Dictionary for Regulatory Activities. Standardised MedDRA Queries (SMQs). https://www.meddra.org/how-to-use/tools/smqs. Accessed 2024 Jan 29.
18.Drug Reimbursement Review clinical guidance report: Evolocumab (Repatha) for primary hyperlipidemia and mixed dyslipidemia. Ottawa (ON): CADTH; 2017 Dec: https://www.cadth.ca/sites/default/files/cdr/clinical/SR0515_Repatha_Resubmission_CL_Report.pdf. Accessed 2024 Jan 4.
19.Clinical Study Report: 20160250. A multicenter, open-label, single-arm, extension study to assess long-term safety of evolocumab therapy in subjects with clinically evident cardiovascular disease in selected European countries [internal sponsor’s report]. Thousand Oaks (CA): Amgen Inc.; 2022 Aug 1.
20.Clinical Study Report: 20130295. A multicenter, open-label, single-arm, extension study to assess long-term safety of evolocumab therapy in patients with clinically evident cardiovascular disease [internal sponsor’s report]. Thousand Oaks (CA): Amgen Inc.; 2022 Jul 26.
21.O’Donoghue ML, Giugliano RP, Wiviott SD, et al. Long-Term evolocumab in patients with established atherosclerotic cardiovascular disease. Circulation. 2022;146(15):1109-1119. PubMed
22.Amgen, Inc. Common Technical Document – Section 2.7.3 Summary of Clinical Efficacy. A Multicenter, Open-label, Single-arm, Extension Study to Assess Long-term Safety of Evolocumab Therapy in Subjects With Clinically Evident Cardiovascular Disease (FOURIER-OLE). [CONFIDENTIAL Internal Manufacturer Report]. Thousand Oaks (CA); Amgen Inc.; 2022.
23.Amgen, Inc. FOURIER OLE study supplemental analysis. Data on file. [CONFIDENTIAL manufacturer information]. 2023.
24.Amgen, Inc. Common Technical Document – Section 2.7.4 Summary of Clinical Safety. A Multicenter, Open-label, Single-arm, Extension Study to Assess Long-term Safety of Evolocumab Therapy in Subjects With Clinically Evident Cardiovascular Disease (FOURIER-OLE). [CONFIDENTIAL Internal Manufacturer Report]. Thousand Oaks (CA); Amgen Inc.; 2022.
25.Clinical Study Report: 20167869. Evolocumab for early reduction of LDL-cholesterol levels in patients with acute coronary syndromes (EVOPACS): A randomized, double-blind, placebo-controlled multicenter study [internal sponsor’s report]. Bern (CH): Inselspital – Bern University Hospital; 2020 Apr 10.
26.Amgen, Inc. Clinical Study Report: 20167869. Evolocumab for Early Reduction of LDL-cholesterol Levels in Patients With Acute Coronary Syndromes (EVOPACS): A Randomized, Double-blind, Placebo-controlled Multicenter Study [CONFIDENTIAL internal manufacturer report]. Thousand Oaks (CA); 2020 Apr 10.
27.Anderson TJ, Gregoire J, Pearson GJ, et al. 2016 Canadian Cardiovascular Society guidelines for the management of dyslipidemia for the prevention of cardiovascular disease in the adult. Can J Cardiol. 2016;32(11):1263-1282. PubMed
28.Lipitor (atorvastatin): 10 mg, 20 mg, 40 mg, and 80 mg tablets, oral [product monograph]. Etobicoke (ON): BGP Pharma ULC; 2023 Aug 2: https://pdf.hres.ca/dpd_pm/00071897.PDF. Accessed 2024 Feb 23.
29.Crestor (rosuvastatin): 5, 10, 20, and 40 mg tablets, oral [product monograph]. Mississauga (ON): AstraZeneca Canada Inc.; 2024 Jan 24: https://pdf.hres.ca/dpd_pm/00074370.PDF. Accessed 2024 Feb 23.
30.Zocor (simvastatin): 10, 20, and 40 mg tablet, oral [product monograph]. Kirkland (QC): Organon Canada Inc.; 2023 Jul 27: https://pdf.hres.ca/dpd_pm/00071846.PDF. Accessed 2024 Feb 23.
31.Lovastatin: 20 mg and 40 mg tablet [product monograph]. Vaughan (ON): AA Pharma Inc.; 2021 Feb 23: https://pdf.hres.ca/dpd_pm/00060210.PDF. Accessed 2024 Feb 23.
32.Pravastatin: 10 mg, 20 mg, and 40 mg tablet [product monograph]. Kirkland (QC): Accord Healthcare Inc.; 2020 Nov 23: https://pdf.hres.ca/dpd_pm/00058959.PDF. Accessed 2024 Feb 23.
33.Fluvastatin: 20 and 40 mg capsule [product monograph]. Toronto (ON): Teva Canada Limited; 2016 Nov 7: https://pdf.hres.ca/dpd_pm/00037018.PDF. Accessed 2024 Feb 23.
34.Ezetrol (ezetimibe): 10 mg tablets [product monograph]. Kirkland (QC): Organon Canada Inc.; 2024 Jan 16: https://pdf.hres.ca/dpd_pm/00074278.PDF. Accessed 2024 Feb 23.
35.Sabatine MS, Giugliano RP, Keech AC, et al. Evolocumab and clinical outcomes in patients with cardiovascular disease. N Engl J Med. 2017;376(18):1713-1722. PubMed
36.Schwartz GG, Steg PG, Szarek M, et al. Alirocumab and cardiovascular outcomes after acute coronary syndrome. N Engl J Med. 2018;379(22):2097-2107. PubMed
37.Amgen Canada, Inc. NCT01764633: Further Cardiovascular Outcomes Research With PCSK9 Inhibition in Subjects With Elevated Risk (FOURIER). ClinicalTrials.gov. Bethesda (MD): U.S. National Library of Medicine; 2023: https://clinicaltrials.gov/study/NCT01764633. Accessed 2024 Jan 11.
38.Cannon CP, Blazing MA, Giugliano RP, et al. Ezetimibe added to statin therapy after acute coronary syndromes. N Engl J Med. 2015;372(25):2387-2397. PubMed
39.Hicks KA, Hung HM, Mahaffey KW, et al. Standardized definitions for cardiovascular and stroke end point events in clinical trials and the third universal definition of myocardial infarction [accessed by sponsor]. 2012.
40.Alberts MJ, Bhatt DL, Mas JL, et al. Three-year follow-up and event rates in the international REduction of Atherothrombosis for Continued Health Registry. Eur Heart J. 2009;30(19):2318-2326. PubMed
41.Study of the Effectiveness of Additional Reductions in Cholesterol Homocysteine Collaborative Group, Armitage J, Bowman L, et al. Intensive lowering of LDL cholesterol with 80 mg versus 20 mg simvastatin daily in 12,064 survivors of myocardial infarction: A double-blind randomised trial. Lancet. 2010;376(9753):1658-1669. PubMed
42.Baigent C, Landray MJ, Reith C, et al. The effects of lowering LDL cholesterol with simvastatin plus ezetimibe in patients with chronic kidney disease (Study of Heart and Renal Protection): A randomised placebo-controlled trial. Lancet. 2011;377(9784):2181-2192. PubMed
43.Cannon CP, Braunwald E, McCabe CH, et al. Intensive versus moderate lipid lowering with statins after acute coronary syndromes. N Engl J Med. 2004;350(15):1495-1504. PubMed
44.de Lemos JA, Blazing MA, Wiviott SD, et al. Early intensive vs a delayed conservative simvastatin strategy in patients with acute coronary syndromes: Phase Z of the A to Z trial. JAMA. 2004;292(11):1307-1316. PubMed
45.LaRosa JC, Grundy SM, Waters DD, et al. Intensive lipid lowering with atorvastatin in patients with stable coronary disease. N Engl J Med. 2005;352(14):1425-1435. PubMed
46.Pedersen TR, Faergeman O, Kastelein JJ, et al. High-dose atorvastatin vs usual-dose simvastatin for secondary prevention after myocardial infarction: The IDEAL study: A randomized controlled trial. JAMA. 2005;294(19):2437-2445. PubMed
47.Stone GW, Witzenbichler B, Guagliumi G, et al. Heparin plus a glycoprotein IIb/IIIa inhibitor versus bivalirudin monotherapy and paclitaxel-eluting stents versus bare-metal stents in acute myocardial infarction (HORIZONS-AMI): Final 3-year results from a multicentre, randomised controlled trial. Lancet. 2011;377(9784):2193-2204. PubMed
48.Wiviott SD, Braunwald E, McCabe CH, et al. Prasugrel versus clopidogrel in patients with acute coronary syndromes. N Engl J Med. 2007;357(20):2001-2015. PubMed
49.Cholesterol Treatment Trialists Collaboration, Baigent C, Blackwell L, et al. Efficacy and safety of more intensive lowering of LDL cholesterol: a meta-analysis of data from 170,000 participants in 26 randomised trials. Lancet. 2010;376(9753):1670-1681. PubMed
50.Shih JH. Sample size calculation for complex clinical trials with survival endpoints. Control Clin Trials. 1995;16(6):395-407. PubMed
51.Amgen Canada Inc., response to 2024 Feb 2 CADTH request for additional information regarding Repatha (evolocumab) CADTH review: [internal additional sponsor’s information]. Mississauga (ON): Amgen Canada Inc.; 2024 Feb 7.
52.Stroes ESG, Stiekema LCA, Rosenson RS. PSCK9 inhibitors: pharmacology, adverse effects, and use. In: Post TW, ed. UpToDate. Waltham (MA): UpToDate; 2023: http://www.uptodate.com. Accessed 2024 Feb 05.
53.Silverman MG, Ference BA, Im K, et al. Association between lowering LDL-C and cardiovascular risk reduction among different therapeutic interventions: A systematic review and meta-analysis. JAMA. 2016;316(12):1289-1297. PubMed
54.Baigent C, Keech A, Kearney PM, et al. Efficacy and safety of cholesterol-lowering treatment: prospective meta-analysis of data from 90,056 participants in 14 randomised trials of statins. Lancet. 2005;366(9493):1267-1278. PubMed
55.Gaba P, O’Donoghue ML, Park JG, et al. Association between achieved low-density lipoprotein cholesterol levels and long-term cardiovascular and safety outcomes: An analysis of FOURIER-OLE. Circulation. 2023;147(16):1192‐1203. PubMed
56.Amgen, Inc. Common Technical Document – Section 2.5 Clinical Overview. A Multicenter, Open-label, Single-arm, Extension Study to Assess Long-term Safety of Evolocumab Therapy in Subjects With Clinically Evident Cardiovascular Disease (FOURIER-OLE). [CONFIDENTIAL internal manufacturer report]. Thousand Oaks (CA); Amgen Inc.; 2022.
57.Clinical Study Report: 20160184. High-resolution assessment of coronary plaques in a global evolocumab randomized study (HUYGENS) [internal sponsor’s report]. Thousand Oaks (CA): Amgen Inc.; 2021 Sep 17.
58.Nicholls SJ, Kataoka Y, Nissen SE, et al. Effect of evolocumab on coronary plaque phenotype and burden in statin-treated patients following myocardial infarction. JACC Cardiovasc Imaging. 2022;15(7):1308-1321. PubMed
59.Nicholls SJ, Nissen SE, Prati F, et al. Assessing the impact of PCSK9 inhibition on coronary plaque phenotype with optical coherence tomography: Rationale and design of the randomized, placebo-controlled HUYGENS study. Cardiovasc Diagn Ther. 2021;11(1):120-129. PubMed
60.Gupta M, Mancini GBJ, Wani RJ, et al. Real-world insights into evolocumab use in patients with hyperlipidemia: Canadian analysis from the ZERBINI study. CJC Open. 2022;4(6):558-567. PubMed
61.Clinical Study Protocol: 20160327. Multizonal observational study conducted by clinical practitioners on Repatha use in subjects with hyperlipidemia - ZERBINI [internal sponsor’s report]. Thousand Oaks (CA): Amgen Inc.; 2017 Aug 15.
62.Byrne P, Demasi M, Jones M, Smith SM, O’Brien KK, DuBroff R. Evaluating the association between low-density lipoprotein cholesterol reduction and relative and absolute effects of statin treatment: A systematic review and meta-analysis. JAMA Intern Med. 2022;182(5):474-481. PubMed
Pharmacoeconomic Review
Abbreviations
ACS
acute coronary syndrome
ASCVD
atherosclerotic cardiovascular disease
BIA
budget impact analysis
CDA-AMC
Canada’s Drug Agency
CV
cardiovascular
HeFH
heterozygous familial hypercholesterolemia
ICER
incremental cost-effectiveness ratio
IS
ischemic stroke
LDL-C
low-density lipoprotein cholesterol
LLT
lipid-lowering therapy
MI
myocardial infarction
OLE
open-label extension
QALY
quality-adjusted life-year
RWE
real-world evidence
UA
unstable angina
Executive Summary
The executive summary comprises 2 tables (Table 1 and Table 2) and a conclusion.
Item | Description |
|---|---|
Drug product | Evolocumab (Repatha) 140 mg/mL, autoinjector or prefilled syringe,a subcutaneous injection 120 mg/mL, automated mini-doser with prefilled cartridge, subcutaneous injection |
Indication | Evolocumab is indicated for the reduction of elevated LDL-C in adult patients with primary hyperlipidemia (including HeFH and ASCVD):
|
Health Canada approval status | NOC |
Health Canada review pathway | Standard |
NOC date | September 10, 2015 (initial approval) September 27, 2023 (latest revision) |
Reimbursement request | Patients with recent ACS (in the previous year) who have an LDL-C level of at least 1.8 mmol/L despite taking moderate-to-high intensity statin therapy, with or without ezetimibe |
Sponsor | Amgen Canada Inc. |
Submission history | Yes Indication: Primary hyperlipidemia and mixed dyslipidemia Recommendation date: February 19, 2016 Recommendation: Reimburse with clinical criteria and/or conditions (HeFH only) Indication: Primary hyperlipidemia and mixed dyslipidemia Recommendation date: November 22, 2017 Recommendation: Reimburse with clinical criteria and/or conditions (HeFH and ASCVD) |
ACS = acute coronary syndrome; ASCVD = atherosclerotic cardiovascular disease; HeFH = heterozygous familial hypercholesterolemia; LDL-C = low-density-lipoprotein cholesterol; NOC = Notice of Compliance.
aPrefilled syringe is not available in Canada.
Table 2: Summary of Economic Evaluation
Component | Description |
|---|---|
Type of economic evaluation | Cost-utility analysis Markov model |
Target population | Adults with recent ACS (in the previous year) who have an LDL-C level of at least 1.8 mmol/L despite taking moderate-to-high intensity statin therapy, with or without ezetimibe |
Treatment | Evolocumab as an adjunct to optimized background LLT |
Dose regimen | Evolocumab administered as 140 mg every 2 weeks or 420 mg once monthly |
Submitted price | Evolocumab = $271.27 per 140 mg/mL single-use prefilled autoinjector Evolocumab = $587.75 per 120 mg/mL single-use automated mini-doser |
Submitted treatment cost | Annual per-patient cost = $7,053 |
Comparator | Optimized background LLT, comprising moderate-to-high intensity statin therapy with or without ezetimibe |
Perspective | Canadian publicly funded health care payer |
Outcomes | QALYs, LYs |
Time horizon | Lifetime (52 years) |
Key data sources |
|
Submitted results | ICER = $87,882 per QALY gained (incremental costs = $78,856; incremental QALYs = 0.90) |
Key limitations |
|
CDA-AMC reanalysis results |
|
ACS = acute coronary syndrome; CDA-AMC = Canada’s Drug Agency; CV = cardiovascular; ICER = incremental cost-effectiveness ratio; LDL-C = low-density-lipoprotein cholesterol; LLT = lipid-lowering therapy; LY = life-year; MI = myocardial infarction; OLE = open-label extension; QALY = quality-adjusted life-year.
Conclusions
Based on the Clinical Review by Canada’s Drug Agency (CDA-AMC), results from the subgroup analyses of patients who experienced a prior MI from the FOURIER trial are indicative of a possible differential effect in favour of evolocumab (Repatha) in combination with optimized lipid-lowering therapy (LLT) over optimized LLT alone for cardiovascular event outcomes over a median follow-up period of 26 months. The sponsor also used an ad hoc subgroup analysis that assessed data from the FOURIER open-label extension (OLE) study of patients who experienced an MI before and/or during the FOURIER trial, which suggested a benefit with evolocumab. However, the CDA-AMC Clinical Review noted that the duration of follow-up in the parent trial is likely inadequate to assess the long-term relative safety of evolocumab.
As limitations with the sponsor’s model could not be adequately addressed due to the lack of alternative data and limitations with the model structure, the sponsor’s base case was used: evolocumab plus optimized LLT is associated with 0.90 incremental QALYs at an additional cost of $78,856, resulting in an incremental cost-effectiveness ratio (ICER) of $87,882 compared to optimized LLT alone. The probability of being cost-effective at a $50,000 per QALY gained threshold was 0%. Using the sponsor’s base case, a price reduction of 50% would be necessary to achieve cost-effectiveness at a $50,000 per QALY gained threshold.
Some identified limitations could not be addressed through reanalysis, and CDA-AMC noted that the clinical benefit of evolocumab remains uncertain, given that 90% of the predicted incremental QALYs for evolocumab were accrued beyond the trial period, during which there was no comparative clinical evidence.
Patient, Clinician, and Drug Plan Input Relevant to the Economic Review
This section is a summary of the feedback received from the patient groups, clinician groups, and drug plans that participated in the CDA-AMC review process.
No patient input was received for this review.
Clinician input was received from the following groups: Cardiac Rehabilitation and Secondary Prevention Program at Western University, the Cambridge Cardiac Rehab Program, the University of Ottawa Heart Institute, the McMaster Lipid Clinic, British Columbia Lipid Specialists, the Canadian Dyslipidemia Guideline Committee, University of British Columbia and Vancouver General Hospital and St. Paul’s Hospital Cardiac Intensive Care Unit attending physicians, and University of Toronto faculty and clinicians with expertise in atherosclerotic cardiovascular disease and/or lipid disorders. Clinician input indicated that the current standard of care for patients with atherosclerotic cardiovascular disease (ASCVD) includes lifestyle changes (i.e., diet and physical activity), statins, and ezetimibe. Clinician input received by CDA-AMC indicated that if evolocumab becomes funded for patients with ASCVD, it would be readily taken up by patients who are not achieving optimal low-density-lipoprotein cholesterol (LDL-C) control on their current treatment(s). Regarding place in therapy, clinician input indicated that evolocumab would be used as an adjunct to statins, with or without ezetimibe; however, the clinicians also noted that many patients do not tolerate statins due to adverse effects and, thus, evolocumab would also be considered for use in patients who are not receiving statin therapy. The clinicians noted that the 2021 Canadian dyslipidemia guidelines already recommend the use of a PCSK9 inhibitor (including evolocumab) for patients in whom LDL-C levels remain at or above 1.8 mmol/L while they receive maximally tolerated statins; however, the lack of funding for many patients presents a barrier to access.
Drug plan input noted that evolocumab is currently listed in many jurisdictions for patients with heterozygous familial hypercholesterolemia (HeFH). Drug plan input raised concerns about evolocumab eligibility for patients who are unable to achieve appropriate LDL-C levels due to elevated triglyceride levels. Additionally, drug plan input raised questions regarding evidence for the use of evolocumab in combination with evinacumab or inclisiran, and whether patients could move to alternative treatments if the effect of evolocumab wanes over time. Drug plan input also raised concerns regarding the budget impact, given the number of patients in Canada who have experienced recent acute coronary syndrome (ACS).
Several of these concerns were addressed in the sponsor’s model, which:
included the use of evolocumab in addition to moderate-intensity or high-intensity statins, with or without ezetimibe.
CDA-AMC was unable to address the following concern raised from the patient, clinician, and drug plan input:
the use of evolocumab in patients with recent ACS who are not receiving statin therapy could not be addressed, owing to a lack of comparative clinical data specifically in the reimbursement requested population.
Economic Review
The current review is for evolocumab for adult patients who experienced ACS in the previous year and who have an LDL-C level of at least 1.8 mmol/L despite taking moderate-to-high intensity statin therapy, with or without ezetimibe.
Economic Evaluation
Summary of Sponsor’s Economic Evaluation
Overview
The sponsor submitted a cost-utility analysis of evolocumab in combination with optimized LLT (defined as moderate-to-high intensity statin therapy, with or without ezetimibe) compared with optimized LLT alone.1 The model population comprised adult patients who experienced ACS in the previous 1 year and who have an LDL-C level of at least 1.8 mmol/L despite taking moderate-to-high intensity statin therapy, with or without ezetimibe. The modelled population was aligned with the sponsor’s reimbursement request.
The recommended dose of evolocumab is either 140 mg every 2 weeks or 420 mg once monthly; the sponsor assumed both doses to be clinically equivalent. Evolocumab is administered subcutaneously and is intended for patient self-administration. Evolocumab is provided in either a 140 mg/mL single-use, prefilled autoinjector or a 3.5 mL, 120 mg/mL single-use automated mini-doser, at a submitted price of $271.27 and $587.75, respectively. The annual per-patient cost of evolocumab was estimated to be approximately $7,053. The sponsor estimated that the annual per-patient costs of the treatments included as comparators were as follows: $66 for ezetimibe (generic), $75 for high-intensity statins, and $63 for moderate-intensity statins.
The analysis was conducted from the perspective of the Canadian public health care payer. Cost and clinical outcomes (quality-adjusted life-years [QALYs], life-years) were estimated over a lifetime horizon (52 years; 1-year cycle length). Discounting (1.5% per annum) was applied for both costs and outcomes.
Model Structure
The sponsor submitted a Markov model that consisted of the following health states related to the number and type of potential cardiovascular events: other ASCVD (used to capture less severe cardiovascular (CV) events such as unstable angina [UA]), myocardial infarction (MI), 2 or more MIs, ischemic stroke (IS), 2 or more ISs, post-MI, post-IS, CV death, and non-CV death.1 The acute-event health states (i.e., MI, 2 or more MIs, IS, 2 or more ISs) corresponded to a 1-year period in which the event occurred to account for a reduced quality of life and increased health care costs. The postevent health states (i.e., post-MI, post-IS, post 2 or more MIs or ISs) represent the years after the event and account for the longer-term outcomes associated with each event or combination of events. Additionally, the model included composite health states that are a combination of either 2 or 3 event health states to retain memory of previous CV events. A simplified version of the sponsor’s model structure is depicted in Figure 1.
All patients entered the model in either the other ASCVD or MI health state, depending on their recent ACS event history, based on Canadian real-world evidence (RWE).2 Patients who started in the other ASCVD health state remained in this health state until they underwent their first MI, first IS, or died from a CV or non-CV cause. At the time of a CV event, patients transitioned to the relevant acute-event health state for 1 cycle. After that cycle, patients transitioned to the appropriate postevent health state (e.g., a move to the post-MI health state from the MI health state) or could experience another CV event (e.g., a move to the IS health state from the MI health state). Patients who started in the MI health state could transition to the post-MI health state, have another CV event, or die from a CV or non-CV cause. The sponsor assumed that only 1 CV event could happen in each annual cycle.
Model Inputs
The baseline population characteristics used to inform the model were based on a retrospective, observational, cohort study conducted in Alberta that used health administrative data.2 Specifically, the sponsor used data for patients with ASCVD who experienced a recent ACS to inform the mean age (68 years), proportion of females (32%), mean LDL-C level (2.16 mmol/L), distribution of prior CV events (81% MI, 19% other ASCVD), and distribution of optimized LLT (62% high-intensity statin, 38% moderate-intensity statin, 9% concomitant ezetimibe).
The sponsor informed the baseline CV event risk using the Alberta RWE,2 and adjusted the event rate by age and LDL-C level. The sponsor used a hazard ratio for age that was estimated using data from the Clinical Practice Research Datalink,3 and used the standardized event rate ratio from the Cholesterol Treatment Trialists’ Collaboration meta-analysis per 1 mmol/L change in LDL-C for any major vascular event.4 The sponsor further adjusted the baseline CV event rate to account for CV event history, which resulted in greater rates of recurrent CV events using data reported by Danese et al. (2021).3 Finally, the sponsor converted and disaggregated the adjusted baseline CV event rate into CV event-specific annual risks for MI, IS, and CV death. The sponsor based the disaggregation of the annual risk into CV event-specific risks using the distribution of secondary events experienced by patients in the Alberta RWE study.2
The sponsor used the LDL-C reduction observed in the FOURIER trial at 48 weeks and maintained the treatment benefit over the lifetime time horizon (i.e., there was no treatment waning over time). To estimate CV event rate ratios per 1 mmol/L LDL-C reduction, the sponsor used hazard ratios from a subgroup analysis of patients who experienced a recent MI from the FOURIER trial.5
Mortality from non-CV causes was estimated using Canadian and sex-specific general population mortality6 and the proportion of deaths from CV-related causes identified by Statistics Canada.7 The sponsor modelled mortality related to CV disease separately, and used a competing risk adjustment, in which in each cycle, non-CVD death is first taken into account and CV event-specific transition probabilities are applied conditionally upon being alive.8 The sponsor further assumed that the benefit of evolocumab on CV-related mortality would only be realized after 3 years of treatment.
Health state utilities were obtained from a publication of a Canadian cost-effectiveness analysis on left atrial appendage closure for stroke prevention in patients with atrial fibrillation.9 For health states that include more than 1 acute and/or postevent, the sponsor applied only the lowest utility value among all events within the health state.
The model included drug-acquisition costs and health care resource use costs associated with the modelled health states. The proportion of patients on the treatments included in optimized LLT was based on a Canadian RWE study.2 The sponsor categorized statin treatments and doses based on the American College of Cardiology and American Heart Association guidelines as high intensity or moderate intensity,10 and used the annual cost of each statin (from the Ontario Drug Benefit Formulary)11 and market shares (based on IQVIA drug use data)12 to estimate the weighted-average costs of statin treatment. The annual cost of evolocumab was adjusted based on estimates of treatment discontinuation from the FOURIER trial.
Health state costs were estimated from the Institute for Clinical Evaluative Sciences (ICES) claims data, based on publicly funded health services records in Ontario.13,14 Costs were estimated separately for the first year of an event and the postevent health states (calculated as the average cost from years 2 to 5 after an event). For composite health states that include a combination of 2 or 3 event states, only the highest-cost event in that state was applied. The cost for CV death was obtained from the CDA-AMC Pharmacoeconomic Review of rivaroxaban.15
The sponsor did not include the incidence, cost, or quality-of-life effects of treatment-related adverse events.
Summary of Sponsor’s Economic Evaluation Results
All analyses were run probabilistically (1,000 iterations for the base case and scenario analyses). The probabilistic results aligned with the deterministic results. The probabilistic findings are presented here.
Base-Case Results
In the sponsor’s base-case analysis, treatment with evolocumab plus optimized LLT was associated with incremental costs of $78,856 and a gain of 0.90 QALYs, compared with optimized LLT, over the lifetime time horizon, resulting in an ICER of $87,882 per QALY gained (Table 3). The probability of evolocumab plus optimized LLT being cost-effective at a $50,000 per QALY gained threshold compared to optimized LLT alone was 0%. Approximately 90% of the incremental QALYs in the sponsor’s base case were accrued after 7 years, which is the combined median duration of follow-up of the FOURIER and FOURIER-OLE trials. The submitted analysis is based on the publicly available list prices of all treatments, aside from evolocumab.
Table 3: Summary of the Sponsor’s Economic Evaluation Results
Drug | Total costs ($) | Incremental costs ($) | Total QALYs | Incremental QALYs | ICER vs. optimized LLT ($/QALY) |
|---|---|---|---|---|---|
Optimized LLT | 211,122 | Reference | 8.95 | Reference | Reference |
Evolocumab + optimized LLT | 289,978 | 78,856 | 9.84 | 0.90 | 87,882 |
ICER = incremental cost-effectiveness ratio; LLT = lipid-lowering therapy; QALY = quality-adjusted life-year.
Source: Sponsor’s pharmacoeconomic submission.1
Sensitivity and Scenario Analyses Results
The sponsor conducted several scenario analyses, including using baseline CV event rates from the FOURIER trial, alternative approaches to applying utilities (i.e., using the lowest values or multiplicative values for composite health states), and assuming that the delay in mortality benefit with evolocumab was 1 year. The conclusions of the sponsor’s base case were most sensitive to the approach for utility values applied in the model, with a 46% to 47% increase in the ICER due to a decline in incremental QALYs.
The sponsor conducted a scenario analysis from a societal perspective that included additional costs associated with short-term absenteeism, presenteeism, and caregiver time. In this analysis, relative to optimized LLT, the ICER was $87,882 per QALY gained. This result was the same as the sponsor’s base-case analysis using a health care payer perspective.
CDA-AMC Appraisal of the Sponsor’s Economic Evaluation
CDA-AMC identified several key limitations to the sponsor’s analysis that have notable implications for the economic analysis:
The relationship between treatment with evolocumab and CV events is uncertain. The sponsor used hazard ratios derived from the Gencer et al. subgroup analysis of the FOURIER trial to inform the rate ratios per 1 mmol/L LDL-C reduction for nonfatal MI and nonfatal IS in the submitted model, and used the FOURIER-OLE prior MI subgroup data to inform the risk of CV death after 3 years.5,16 The CDA-AMC Clinical Review reported that the results for the recent MI subgroup are indicative of a possible benefit when evolocumab is added to optimized LLT, based on the primary and key secondary composite outcomes over 26 months. The association between treatment with evolocumab and CV-related mortality (after the 3-year delay in benefit) was informed by results of the FOURIER-OLE study for the subgroup of patients with a history of MI. The results of the sponsor’s model are particularly sensitive to assumptions about the CV-related mortality benefit, for which there is uncertainty in the clinical evidence. The CDA-AMC Clinical Review noted that the results of the FOURIER-OLE study suggest that patients with a median of 24 months of additional exposure to evolocumab may have contributed to a reduction in CV death in the subgroup of patients who experienced an MI before or during the FOURIER trial. However, the CDA-AMC Clinical Review also noted limitations associated with the subgroup analysis, including the fact that the sample-size calculation was based on the full analysis set in the FOURIER trial but not in the subgroup analyses, and that multiplicity was not accounted for in the subgroup analyses. These limitations lead to some uncertainty in the analysis.
In light of the uncertainty regarding CV mortality and its impact on the results, CDA-AMC conducted 2 scenario analyses in which the lower and upper limits of the credible interval for the CV-related mortality risk ratio were applied to assess the impact on the cost-effectiveness of evolocumab compared to optimized LLT.
Long-term treatment discontinuation was not modelled. In their submitted model, the sponsor assumed that by year 3, 15% of patients would have discontinued treatment with evolocumab and that no further discontinuation would take place. The assumption that patients would be fully compliant with their treatment over their lifetime is likely inappropriate, according to the clinical experts consulted by CDA-AMC. In general, it has been established that adherence to long-term therapies can be low, especially for chronic diseases in which medications are prescribed as a preventive measure.17,18 For LLTs specifically, several studies have demonstrated the extent and impact of nonadherence to LLTs on CV health.19-23 Barriers to treatment adherence have also been identified specifically for LLTs, including patient, health care system, and treatment-related factors.24 Although research on LLT adherence has largely been focused on statin therapies, the long-term adherence to newer treatments like evolocumab remains unknown. However, the safety profile and reduced treatment frequency of evolocumab may promote better adherence.24
Because of its structure and programming, the sponsor’s model did not allow for the consideration of treatment discontinuation. The modelled population retained the full costs and benefits of evolocumab over the lifetime horizon. The impact of treatment discontinuation and subsequent treatment-effect waning on the cost-effectiveness of evolocumab over a lifetime time horizon is unknown.
CDA-AMC was unable to address this limitation.
The long-term efficacy of evolocumab on LDL-C lowering has not been established. In the submitted model, patients are assumed to receive the full benefit of the LDL-C reduction observed at 48 weeks in the FOURIER trial for up to 52 years (the model time horizon). The submitted model did not explore the impact of potential treatment waning over time. Although there is a lack of long-term data for the modelled time horizon (and thus uncertainty) to inform the persistence of LDL-C reduction over time, the clinical experts advised that the maintained benefit for patients who continue treatment may be a reasonable assumption. However, 90% of the sponsor’s predicted incremental health benefits were accrued beyond the time for which there are data, so the cost-effectiveness results may be influenced by changes in assumptions around the long-term effects of evolocumab.
CDA-AMC was unable to address this limitation in reanalysis.
The clinical evidence did not align with the requested population. The sponsor modelled patients with recent ACS (MI or UA). However, the evidence used to inform the clinical efficacy data in the model was predominantly from patients with history of MI only (i.e., Gencer et al., FOURIER-OLE MI subgroup analysis).5,16 As such, the cost-effectiveness of evolocumab in patients with UA is uncertain. However, clinical expert feedback indicated that, in practice, the preference would be to mostly treat MI, and that UA would make up a small proportion of cases.
CDA-AMC was unable to address this limitation in reanalysis. However, the impact on the cost-effectiveness results may be small, given the small proportion of UA cases.
The submitted model lacked transparency. The submitted model file relied on calculations that incorporated data held in multiple worksheets, some of which contained considerable numbers of blank columns between cells that needed to be checked. For example, on the worksheets related to transition probabilities, there are more than 900 columns, with only a small portion of them containing data. Formulas on these sheets refer to blank (zeroed out) columns, complicating the validation process. The model implies functionality that is not present (e.g., providing trace rows for an average starting age of 18 but preventing the user from inputting these values). These limitations make thorough auditing of the sponsor’s model impractical.
CDA-AMC was unable to address this limitation.
Additionally, the key assumptions detailed in Table 4 were made by the sponsor and have been appraised by CDA-AMC.
Table 4: Key Assumptions of the Submitted Economic Evaluation (Not Noted as Limitations to the Submission)
Sponsor’s key assumption | CDA-AMC comment |
|---|---|
The sponsor did not include the incidence, cost, and QoL effects of treatment-related AEs. | Appropriate. The clinical experts consulted by CDA-AMC agreed that the available evidence (e.g., GAUSS-2, RUTHERFORD-2, LAPLACE-2 phase III trials) showed no differences in the AE profile between evolocumab and its comparators. |
The sponsor used RWE from an observational study conducted with Alberta health administrative data to inform baseline characteristics of the modelled population. | Appropriate. The clinical experts indicated that the FOURIER trial results were generalizable to the Alberta RWE population. |
Due to the model structure and cycle length, the sponsor assumed that only 1 CV event could happen each year. | Likely appropriate. According to the clinical experts, some patients may experience more than 1 CV event per year; however, this is a conservative assumption. |
AE = adverse event; CDA-AMC = Canada’s Drug Agency; CV = cardiovascular; QoL = quality of life; RWE = real-world evidence.
CDA-AMC Reanalyses of the Economic Evaluation
Base-Case Results
Key limitations of the sponsor’s model could not be adequately addressed due to the lack of alternative data and limitations with the model structure (i.e., treatment waning and treatment discontinuation). As such, the sponsor’s base case was maintained.
Scenario Analysis Results
Given that the CDA-AMC Clinical Review noted some uncertainty surrounding the relationship between treatment with evolocumab and CV-related mortality, CDA-AMC conducted 2 scenario analyses involving different values for CV-related mortality: the first used the lower credible interval of the hazard ratio for CV mortality from the FOURIER-OLE trial, and the second used the upper credible interval. These changes are described in Table 10.
In scenario analysis 1, evolocumab plus optimized LLT was associated with 1.35 incremental QALYs at an additional cost of $92,755, compared with optimized LLT alone, resulting in an ICER of $68,809 per QALY gained. In scenario analysis 2, evolocumab plus optimized LLT was associated with 0.39 incremental QALYs at an additional cost of $63,829, compared with optimized LLT alone, resulting in an ICER of $164,205 per QALY gained. A summary of the CDA-AMC scenario analysis results can be found in Table 5. The probability of cost-effectiveness at a $50,000 per QALY gained threshold was 0% in both scenario analysis 1 and 2.
CDA-AMC conducted price reduction analyses based on the sponsor’s base case (Table 6). These analyses demonstrated that using the sponsor’s base case, a price reduction of 50% would be necessary to achieve cost-effectiveness at a $50,000 per QALY gained threshold.
Table 5: Summary of CDA-AMC Scenario Analysis Results
Stepped analysis | Drug | Total costs ($) | Total QALYs | ICER ($/QALY) |
|---|---|---|---|---|
Sponsor’s base case | Optimized LLT | 210,640 | 8.93 | Reference |
Evolocumab + optimized LLT | 289,809 | 9.85 | 85,942 | |
CDA-AMC scenario analysis 1: lower credible interval for CV death | Optimized LLT | 210,817 | 8.93 | Reference |
Evolocumab + optimized LLT | 303,572 | 10.28 | 68,809 | |
CDA-AMC scenario analysis 2: upper credible interval for CV death | Optimized LLT | 210,713 | 8.96 | Reference |
Evolocumab + optimized LLT | 274,542 | 9.35 | 164,205 |
CDA-AMC = Canada’s Drug Agency; CV = cardiovascular; ICER = incremental cost-effectiveness ratio; LLT = lipid-lowering therapy; QALY = quality-adjusted life-year.
Note: The CADTH reanalysis is based on publicly available prices of the comparator treatments.
Table 6: CDA-AMC Price Reduction Analyses
Price reduction analysis | Unit drug cost ($) | ICERs for evolocumab + optimized LLT vs. optimized LLT ($/QALY) (Sponsor’s base case) |
|---|---|---|
No price reduction | 271 | 87,882 |
10% | 244 | 80,233 |
20% | 217 | 72,653 |
30% | 190 | 65,072 |
40% | 163 | 57,492 |
50% | 136 | 49,912 |
60% | 109 | 42,332 |
70% | 81 | 34,752 |
80% | 54 | 27,171 |
90% | 27 | 19,591 |
100% | 0 | 12,011 |
CDA-AMC = Canada’s Drug Agency; ICER = incremental cost-effectiveness ratio; LLT = lipid-lowering therapy; QALY = quality-adjusted life-year.
Issues for Consideration
Evolocumab has undergone review by CDA-AMC twice, receiving a Reimburse With Conditions recommendation both times; the first was for HeFH25 and the second was for HeFH and ASCVD.26 Although evolocumab received a recommendation to reimburse with conditions from the Canadian Drug Expert Committee, negotiations with the pan-Canadian Pharmaceutical Alliance concluded without agreement for ASCVD.27
At the time of this writing, inclisiran (Leqvio) is under review for the treatment of HeFH and ASCVD as an adjunct to lifestyle changes in adults who are on maximally tolerated dose of a statin, with or without other LLTs. Given that this indication significantly overlaps with that being reviewed for evolocumab, inclisiran may be a relevant comparator that could not be included in the present analysis. The cost-effectiveness of evolocumab compared to inclisiran is unknown. Additionally, it is uncertain how the introduction of inclisiran would affect market-share expectations and, subsequently, the budget impact of evolocumab.
Clinician input noted that the 2021 Canadian Cardiovascular Society Guidelines for the Management of Dyslipidemia for the Prevention of Cardiovascular Disease in Adults recommends the use of PCSK9 inhibitors, such as evolocumab, as second-line or third-line therapy (after statins and ezetimibe) in post-ACS patients with LDL-C levels greater than 1.8 mmol/L.28 However, clinicians noted that they are unable to follow the guidelines in a considerable proportion of patients because of the funding status of PCSK9 inhibitors, which are not accessible without private insurance.
Overall Conclusions
Based on the CDA-AMC Clinical Review, results from the subgroup analyses of patients who experienced an MI in the previous year or who were 1 year or more beyond their MI from the FOURIER trial are indicative of a possible subgroup effect in favour of evolocumab in combination with optimized LLT over optimized LLT alone for CV event outcomes over a median follow-up period of 26 months. The sponsor also used an ad hoc subgroup analysis that assessed data from the FOURIER-OLE study of patients who experienced an MI before and/or during the FOURIER trial, which suggested a benefit. However, the Clinical Review noted that the duration of follow-up in the parent trial is likely inadequate to assess the long-term relative safety of evolocumab.
Using the sponsor’s base case, evolocumab plus optimized LLT is associated with 0.90 incremental QALYs at an additional cost of $78,856, resulting in an ICER of $87,882 compared to optimized LLT alone. The probability of being cost-effective at a $50,000 per QALY gained threshold was 0%, and a 50% price reduction would be required to achieve cost-effectiveness at this threshold. There is uncertainty in the predicted benefit of evolocumab due to limitations in comparative clinical efficacy. Given the uncertainty surrounding the relationship between treatment with evolocumab and CV-related mortality, CDA-AMC conducted 2 scenario analyses to assess the impact of alternative assumptions for this parameter. CDA-AMC’s scenario analyses applied the lower and upper credible intervals of the hazard ratio for CV-related mortality derived from the FOURIER-OLE subgroup analysis of patients with a history of MI. These analyses represent the greatest and smallest CV-related mortality benefits associated with treatment with evolocumab.
Results from scenario analysis 1 and scenario analysis 2 were generally aligned: evolocumab is not cost-effective at a willingness-to-pay threshold of $50,000 per QALY gained. In scenario analysis 1 (assuming the greatest mortality benefit associated with treatment with evolocumab), evolocumab was associated with an ICER of $68,809 per QALY gained compared to optimized background LLT alone. In scenario analysis 2 (assuming the smallest mortality benefit associated with treatment with evolocumab), evolocumab was associated with an ICER of $164,205 per QALY gained compared to optimized LLT alone. Using CDA-AMC’s scenario analyses, a price reduction of 35% to 69% would be necessary to achieve cost-effectiveness at a $50,000 per QALY gained threshold.
There were several limitations that add uncertainty to these results, including uncertainty about the clinical evidence that informed the relationship between treatment with evolocumab and CV events and structural assumptions around treatment discontinuation and waning. These limitations could not be addressed through reanalysis, and the predicted clinical benefit of evolocumab remains uncertain, given that 90% of the predicted incremental QALYs for evolocumab were accrued beyond the trial period, for which there is no clinical evidence.
References
1.Pharmacoeconomic evaluation [internal sponsor's report]. In: Drug Reimbursement Review sponsor submission: Repatha (evolocumab): 140 mg in 1.0 mL (140 mg/mL) and 420 mg in 3.5 mL (120 mg/mL) solution for subcutaneous injection. Mississauga (ON): Amgen Canada; 2023 Nov 29.
2.Mackinnon ES, Leiter LA, Wani RJ, et al. Real-world risk of recurrent cardiovascular events in atherosclerotic cardiovascular disease patients with LDL-C above guideline-recommended threshold: A retrospective observational study. Cardiol Ther. 2024;13(1):205-220. PubMed
3.Danese MD, Pemberton-Ross P, Catterick D, Villa G. Estimation of the increased risk associated with recurrent events or polyvascular atherosclerotic cardiovascular disease in the United Kingdom. Eur J Prev Cardiol. 2021;28(3):335-343. PubMed
4.Cholesterol Treatment Trialists Collaboration, Baigent C, Blackwell L, et al. Efficacy and safety of more intensive lowering of LDL cholesterol: A meta-analysis of data from 170,000 participants in 26 randomised trials. Lancet. 2010;376(9753):1670-1681. PubMed
5.Gencer B, Mach F, Murphy SA, et al. Efficacy of evolocumab on cardiovascular outcomes in patients with recent myocardial infarction: A prespecified secondary analysis from the FOURIER trial. JAMA Cardiol. 2020;5(8):952-957. PubMed
6.Statistics Canada. Table: 13-10-0114-01. Life expectancy and other elements of the life table, Canada, all provinces except Prince Edward Island [accessed by sponsor]. 2022; https://www150.statcan.gc.ca/t1/tbl1/en/tv.action?pid=1310011401.
7.Statistics Canada. Table 13-10-0147-01 Deaths, by cause, Chapter IX: Diseases of the circulatory system (I00 to I99). https://www150.statcan.gc.ca/t1/tbl1/en/tv.action?pid=1310014701. Accessed 2023 Jun 15.
8.Maruszczak M, Villa G, Lothgren M. Risk adjustments in economic models - what is their impact on predicted rates? Value Health. 2017;20(9):A753-A754.
9.Saw J, Bennell MC, Singh SM, Wijeysundera HC. Cost-effectiveness of left atrial appendage closure for stroke prevention in atrial fibrillation patients with contraindications to anticoagulation. Can J Cardiol. 2016;32(11):1355 e1359-1355 e1314.
10.Grundy SM, Stone NJ, Bailey AL, et al. 2018 AHA/ACC/AACVPR/AAPA/ABC/ACPM/ADA/AGS/APhA/ASPC/NLA/PCNA guideline on the management of blood cholesterol: A report of the American College of Cardiology/American Heart Association Task Force on Clinical Practice Guidelines. J Am Coll Cardiol. 2019;73(24):e285-e350. PubMed
11.Ontario Drug Benefits e-formulary; effective from July 31, 2023 [accessed by sponsor]. https://www.formulary.health.gov.on.ca/formulary/. Accessed 2023 Jun 10.
12.IQVIA. Total Prescription (TRx) by Strength and Molecule. Amgen data on file 2023 [sponsor provided reference].
13.ICES. Description and healthcare resource utilization of atherosclerotic cardiovascular disease in Ontario, Canada [accessed by sponsor]. https://www.ices.on.ca/services-for-researchers/all-projects/private-sector-projects/description-and-healthcare-resource-utilization-of-atherosclerotic-cardiovascular-disease-in-ontario-canada.
14.Rogoza R, Oh P, Goodman SG, et al. PCV32 Economic burden of atherosclerotic cardiovascular disease and specific events in Ontario, Canada. Value Health. 2020;23:S96.
15.Drug Reimbursement Review pharmacoeconomic report: Rivaroxaban (Xarelto) [accessed by sponsor]. Ottawa (ON): CADTH; 2019: https://www.cadth.ca/sites/default/files/cdr/pharmacoeconomic/SR0569_Xarelto_PE_Report.pdf.
16.Amgen Inc. FOURIER OLE study supplemental analysis. Data on file. [CONFIDENTIAL manufacturer information]. 2023.
17.Sabaté E. Adherence to long-term therapies: Evidence for action. Geneva (CH): World Health Organization; 2003.
18.Burnier M. The role of adherence in patients with chronic diseases. Eur J Intern Med. 2024;119:1-5. PubMed
19.Sotorra-Figuerola G, Ouchi D, Giner-Soriano M, Morros R. Impact of adherence to drugs for secondary prevention on mortality and cardiovascular morbidity: A population-based cohort study. IMPACT study. Pharmacoepidemiol Drug Saf. 2021;30(9):1250-1257. PubMed
20.Chi MD, Vansomphone SS, Liu IL, et al. Adherence to statins and LDL-cholesterol goal attainment. Am J Manag Care. 2014;20(4):e105-112. PubMed
21.Ho P, Magid D, Shetterly S, et al. Medication nonadherence is associated with a broad range of adverse outcomes in patients with coronary artery disease. Am Heart J. 2008;155(4):772-779. PubMed
22.Toth PP, Granowitz C, Hull M, Anderson A, Philip S. Long-term statin persistence is poor among high-risk patients with dyslipidemia: A real-world administrative claims analysis. Lipids Health Dis. 2019;18(1):175. PubMed
23.Drexel H, Coats AJS, Spoletini I, et al. An expert opinion paper on statin adherence and implementation of new lipid-lowering medications by the ESC Working Group on Cardiovascular Pharmacotherapy: Barriers to be overcome. Eur Heart J Cardiovasc Pharmacother. 2020;6(2):115-121. PubMed
24.Desai NR, Farbaniec M, Karalis DG. Nonadherence to lipid-lowering therapy and strategies to improve adherence in patients with atherosclerotic cardiovascular disease. Clin Cardiol. 2023;46(1):13-21. PubMed
25.CADTH Drug Reimbursement Expert Review Committee final recommendation: Evolocumab (Repatha - Amgen Canada Inc.) [accessed by sponsor]. Ottawa (ON): CADTH; 2016 Feb 19: https://www.cadth.ca/sites/default/files/cdr/complete/SR0441_complete_Rapatha-Feb-23_16_e.pdf.
26.CADTH Drug Reimbursement Expert Review Committee final recommendation: Evolocumab (Repatha — Amgen Canada Inc.) [accessed by sponsor]. Ottawa (ON): CADTH; 2017 Nov 22: https://www.cadth.ca/sites/default/files/cdr/complete/SR0515_Repatha_Resubmission_complete_Nov_24_17.pdf.
27.pan-Canadian Pharmaceutical Alliance. Repatha (evolocumab). 2019; https://www.pcpacanada.ca/negotiation/21004. Accessed 2024 Feb 15.
28.Pearson GJ, Thanassoulis G, Anderson TJ, et al. 2021 Canadian Cardiovascular Society guidelines for the management of dyslipidemia for the prevention of cardiovascular disease in adults. Can J Cardiol. 2021;37(8):1129-1150. PubMed
29.Ontario Ministry of Health, Ontario Ministry of Long-Term Care. Ontario drug benefit formulary/comparative drug index. 2023; https://www.formulary.health.gov.on.ca/formulary/. Accessed 2024 Feb 13.
30.Exceptional Access Program (EAP). Toronto (ON): Ontario Ministry of Health; Ontario Ministry of Long-Term Care; 2023: http://www.health.gov.on.ca/en/pro/programs/drugs/odbf/odbf_except_access.aspx. Accessed 2024 Feb 13.
31.Budget Impact Analysis [internal sponsor's report]. In: Drug Reimbursement Review sponsor submission: Repatha (evolocumab): 140 mg in 1.0 mL (140 mg/mL) and 420 mg in 3.5 mL (120 mg/mL) solution for subcutaneous injection. Mississauga (ON): Amgen Canada; 2023 Nov 29.
32.Brunham LR, Ruel I, Aljenedil S, et al. Canadian Cardiovascular Society position statement on familial hypercholesterolemia: Update 2018. Can J Cardiol. 2018;34(12):1553-1563. PubMed
33.Akioyamen LE, Genest J, Shan SD, et al. Estimating the prevalence of heterozygous familial hypercholesterolaemia: A systematic review and meta-analysis. BMJ Open. 2017;7(9):e016461. PubMed
34.Chen G, Farris MS, Cowling T, et al. Treatment and low-density lipoprotein cholesterol management in patients diagnosed with clinical atherosclerotic cardiovascular disease in Alberta. Can J Cardiol. 2019;35(7):884-891. PubMed
35.Statistics Canada. Table: 17-10-0057-01 Projected population, by projection scenario, age and sex, as of July 1 (x 1,000) [accessed by sponsor]. 2022; https://www150.statcan.gc.ca/t1/tbl1/en/tv.action?pid=1710005701.
36.Langer A, Tan M, Goldin L, Langer G. Can the use of cardiology medical record to deliver educational intervention improve care? On behalf of TAPP Program: Thinking Approach Towards Physician Support in Patient Management. Cardiol Vasc Res (Wilmington). 2023;7(4):1-4.
37.Sutherland G, Dihn T. Understanding the gap: A pan-Canadian analysis of prescription drug insurance coverage [accessed by sponsor]. Ottawa (ON): The Conference Board of Canada; 2017: https://www.conferenceboard.ca/e-library/abstract.aspx?did=9326.
38.Government of Canada. Canadian Chronic Disease Surveillance System (CCDSS). 2023; https://health-infobase.canada.ca/ccdss/data-tool/Index?G=00&V=9&M=5&Y=2017. Accessed 2024 Feb 15.
39.Canadian Institute for Health Information. Hospital stays in Canada, 2021-2022. 2023; https://www.cihi.ca/en/hospital-stays-in-canada-2021-2022. Accessed 2024 Feb 15.
Appendix 1: Cost Comparison Table
Table 7: CDA-AMC Cost Comparison for the Treatment of Acute Coronary Syndrome
Treatment | Strength / concentration | Form | Price ($) | Recommended dosage | Daily cost ($) | Annual cost ($) |
|---|---|---|---|---|---|---|
Evolocumab (Repatha) | 120 mg / mL 140 mg / mL | Single-use prefilled cartridge (420 mg/3.5 mL) Single-use prefilled syringe or autoinjector (140 mg/1 mL) | 587.75000 (per cartridge) 271.2700 (per autoinjector) | 420 mg monthly (cartridge) 140 mg every 2 weeks (syringe/autoinjector) | 19.31 | 7,053 |
Anti-PCSK9 monoclonal antibody | ||||||
Alirocumab (Praluent) | 75 mg / mL 150 mg / mL | Single-use prefilled pen or syringe | 267.8300 per pen or syringe | 75 mg once every 2 weeks or 300 mg once every 4 weeks | 19.07 | 6,964 |
HMG-CoA reductase inhibitors | ||||||
Atorvastatin calcium (Lipitor and generics) | 10 mg 20 mg 40 mg 80 mg | Tablet | 0.1743 0.2179 0.2342 0.2342 | 10 mg to 80 mg at bedtime | 0.17 to 0.23 | 64 to 85 |
Fluvastatin sodium (Lescol XL) | 80 mg | Tablet | 1.6225 | 80 mg daily | 1.62 | 592 |
Fluvastatin sodium (generic) | 20 mg 40 mg | Capsule | 0.6882 0.9671 | 20 mg to 40 mg at bedtime | 0.69 to 0.97 | 251 to 353 |
Lovastatin (Mevacor and generics) | 20 mg 40 mg | Tablet | 1.0846 1.9812 | 20 mg to 80 mg at bedtime | 1.08 to 3.96 | 396 to 1,446 |
Pravastatin sodium (Pravachol and generics) | 10 mg 20 mg 40 mg | Tablet | 0.2916 0.3440 0.4143 | 10 mg to 40 mg at bedtime | 0.29 to 0.41 | 106 to 151 |
Rosuvastatin calcium (Crestor and generics) | 5 mg 10 mg 20 mg 40 mg | Tablet | 0.1284 0.1354 0.1692 0.1990 | 10 mg to 40 mg daily | 0.14 to 0.20 | 49 to 73 |
Simvastatin (Zocor and generics) | 5 mg 10 mg 20 mg 40 mg 80 mg | Tablet | 0.1023 0.2023 0.2501 0.2501 0.2501 | 10 mg to 80 mg at bedtime | 0.20 to 0.25 | 74 to 91 |
Cholesterol absorption inhibitor | ||||||
Ezetimibe (Ezetrol + generics) | 10 mg | Tablet | 0.1811 | 10 mg daily | 0.18 | 67 |
Lipid-regulating drug | ||||||
Icosapent ethyl (Vascepa) | 1 g | Capsule | 2.4500a | 2 g twice daily | 9.80 | 3,580 |
Fibrates | ||||||
Bezafibrate | 400 mg | Tablet | 1.7460 | 400 mg daily | 1.75 | 638 |
Fenofibrate (generic) | 100 mg 200 mg | Capsule | 0.6105 0.9257 | 300 mg daily | 1.54 | 561 |
Fenofibrate (Lipidil EZ) | 48 mg 145 mg | Tablet | 0.3560 0.5489 | 48 to 145 mg daily | 0.36 0.55 | 130 200 |
Gemfibrozil (generic) | 300 mg | Capsule | 0.1340 | 600 mg daily | 0.27 | 98 |
Micro-coated fenofibrate (Lipidil Supra) | 160 mg | Tablet | 1.0022 | 160 mg daily | 1.00 | 366 |
CDA-AMC = Canada’s Drug Agency.
The comparators presented in the above table have been deemed to be appropriate based on feedback from clinical experts and participating drug plans. Comparators may be recommended (appropriate) practice or actual practice. Existing Product Listing Agreements are not reflected in the table and as such, the table may not represent the actual costs to public drug plans.
Note: All prices are from the Ontario Drug Benefit Formulary (accessed February 2024),29 unless otherwise indicated, and do not include dispensing fees.
aUnit price obtained from the Ontario Exceptional Access Program (accessed February 2024).30
Note: This table has not been copy-edited.
Appendix 2: Submission Quality
Note that this appendix has not been copy-edited.
Description | Yes or No | Comments |
|---|---|---|
Population is relevant, with no critical intervention missing, and no relevant outcome missing | Yes | No comment. |
Model has been adequately programmed and has sufficient face validity | No | Refer to limitation: The submitted model lacked transparency. |
Model structure is adequate for decision problem | Yes | No comment. |
Data incorporation into the model has been done adequately (e.g., parameters for probabilistic analysis) | Yes | No comment. |
Parameter and structural uncertainty were adequately assessed; analyses were adequate to inform the decision problem | Yes | No comment. |
The submission was well organized and complete; the information was easy to locate (clear and transparent reporting; technical documentation available in enough details) | Yes | No comment. |
Appendix 3: Additional Information on the Submitted Economic Evaluation
Note that this appendix has not been copy-edited.
ASCVD = atherosclerotic cardiovascular disease; CV = cardiovascular; IS = ischemic stroke; MI = myocardial infarction.
Source: Sponsor’s pharmacoeconomic submission.1
Detailed Results of the Sponsor’s Base Case
Table 9: Disaggregated Summary of the Sponsor’s Economic Evaluation Results
Parameter | Evolocumab + optimized LLT | Optimized LLT |
|---|---|---|
Discounted LYs | ||
Total | 11.21 | 10.26 |
Discounted QALYs | ||
Total | 9.84 | 8.95 |
Cardiovascular Events | 0.72 | 0.78 |
Myocardial infarction | 0.67 | 0.71 |
Ischemic stroke | 0.06 | 0.06 |
Cardiovascular death | 0.00 | 0.00 |
Post cardiovascular event | 9.12 | 8.17 |
Discounted costs ($) | ||
Total | 289,978 | 211,122 |
Drug costs | 68,792 | 785 |
Cardiovascular events | 58,756 | 64,114 |
Myocardial infarction | 41,077 | 44,251 |
Ischemic stroke | 11,963 | 13,227 |
Cardiovascular death | 5,716 | 6,635 |
Post cardiovascular event | 162,429 | 146,223 |
LLT = lipid-lowering therapy; LY = life-year; QALY = quality-adjusted life-year.
Source: Sponsor’s pharmacoeconomic submission.1
Appendix 4: Additional Details on CDA-AMC Reanalyses and Sensitivity Analyses of the Economic Evaluation
Note that this appendix has not been copy-edited.
Detailed Results of CDA-AMC Scenario Analyses
Table 10: CDA-AMC Revisions to the Submitted Economic Evaluation for Scenario Analyses
Stepped analysis | Sponsor’s value or assumption | CDA-AMC value or assumption |
|---|---|---|
Changes to derive CDA-AMC scenario analysis 1 | ||
1. Risk of CV-related mortality | HR = 0.68 | HR = 0.51 (greatest improvement in CV mortality associated with treatment with evolocumab) |
CDA-AMC reanalysis 1 | ― | 1 |
Changes to derive CDA-AMC scenario analysis 2 | ||
1. Risk of CV-related mortality | HR = 0.68 | HR = 0.91 (smallest improvement in CV mortality associated with treatment with evolocumab) |
CDA-AMC reanalysis 2 | ― | 1 |
CDA-AMC = Canada’s Drug Agency; CV = cardiovascular; HR = hazard ratio.
Note: In CDA-AMC’s reanalyses, the HR for CV-related mortality was not included in probabilistic analysis.
Table 11: Disaggregated Summary of CDA-AMC Scenario Analysis 1
Parameter | Evolocumab + optimized LLT | Optimized LLT |
|---|---|---|
Discounted LYs | ||
Total | 11.77 | 10.26 |
Discounted QALYs | ||
Total | 10.28 | 8.93 |
Cardiovascular events | 0.75 | 0.78 |
Myocardial infarction | 0.69 | 0.71 |
Ischemic stroke | 0.06 | 0.06 |
Cardiovascular death | 0.00 | 0.00 |
Post cardiovascular event | 9.53 | 8.15 |
Discounted costs ($) | ||
Total | 303,572 | 210,817 |
Drug costs | 72,199 | 784 |
Cardiovascular events | 60,531 | 64,004 |
Myocardial infarction | 42,379 | 44,025 |
Ischemic stroke | 13,018 | 13,354 |
Cardiovascular death | 5,134 | 6,625 |
Post cardiovascular event | 170,842 | 146,029 |
CDA-AMC = Canada’s Drug Agency; LLT = lipid-lowering therapy; LY = life-year; QALY = quality-adjusted life-year.
Table 12: Disaggregated Summary of CDA-AMC Scenario Analysis 2
Parameter | Evolocumab + optimized LLT | Optimized LLT |
|---|---|---|
Discounted LYs | ||
Total | 10.59 | 10.27 |
Discounted QALYs | ||
Total | 9.35 | 8.96 |
Cardiovascular events | 0.69 | 0.77 |
Myocardial infarction | 0.64 | 0.71 |
Ischemic stroke | 0.05 | 0.06 |
Cardiovascular death | 0.00 | 0.00 |
Post cardiovascular event | 8.66 | 8.19 |
Discounted costs ($) | ||
Total | 274,543 | 210,713 |
Drug costs | 65,041 | 785 |
Cardiovascular events | 56,717 | 63,944 |
Myocardial infarction | 39,216 | 44,069 |
Ischemic stroke | 11,187 | 13,250 |
Cardiovascular death | 6,314 | 6,625 |
Post cardiovascular event | 152,785 | 145,984 |
CDA-AMC = Canada’s Drug Agency; LLT = lipid-lowering therapy; LY = life-year; QALY = quality-adjusted life-year.
Table 13: CDA-AMC Price Reduction Analyses, Scenario Analyses
Analysis | Unit drug cost ($) | ICERs for evolocumab + optimized LLT vs. optimized LLT ($/QALY) | |
|---|---|---|---|
Price reduction | $ | CDA-AMC scenario 1 | CDA-AMC scenario 2 |
No price reduction | 271 | 68,809 | 164,205 |
10% | 244 | 63,419 | 147,652 |
20% | 217 | 58,130 | 131,097 |
30% | 190 | 52,841 | 114,543 |
40% | 163 | 47,552 | 97,989 |
50% | 136 | 42,263 | 81,434 |
60% | 109 | 36,974 | 64,880 |
70% | 81 | 31,685 | 48,325 |
80% | 54 | 26,396 | 31,771 |
90% | 27 | 21,107 | 15,217 |
100% | 0 | 15,819 | Dominant |
CDA-AMC = Canada’s Drug Agency; ICER = incremental cost-effectiveness ratio; LLT = lipid-lowering therapy; QALY = quality-adjusted life-year.
Note: At a $50,000 per QALY threshold, a price reduction of 35% (scenario 1) to 69% (scenario 2) would be necessary to achieve cost-effectiveness.
Appendix 5: Submitted Budget Impact Analysis and CDA-AMC Appraisal
Note that this appendix has not been copy-edited.
Table 14: Summary of Key Take-Aways
Key take-aways of the budget impact analysis |
|---|
|
Summary of Sponsor’s Budget Impact Analysis
The sponsor submitted a budget impact analysis (BIA) estimating the incremental budget impact of reimbursing evolocumab as an adjunct to optimized LLT for the treatment of recent ACS within the past 1 year who have LDL-C ≥ 1.8 mmol/L despite taking moderate-to-high intensity statin therapy, with or without ezetimibe.31 The sponsor used an epidemiologic approach using a participating public drug plan perspective, over a 3-year time horizon (2025 to 2027). The reference scenario includes optimized LLT as the comparator. Beginning with the population in Canada aged 18 years and older, excluding Quebec, the sponsor narrowed the population using estimates of HeFH prevalence,32,33 the proportion with ASCVD,34,35 the proportion of patients with recent ACS,2 the proportion of those receiving optimal LLT,13 the proportion of patients with LDL-C ≥ 1.8 mmol/L,36 and estimates of public drug coverage.37 Key inputs to the BIA are documented in Table 15.
The sponsor’s BIA included the following key assumptions:
The sponsor excluded the cost of optimized LLT from the BIA because it is not expected to change with the introduction of evolocumab for the requested population.
The sponsor assumed that no patients would discontinue evolocumab over the BIA time horizon.
Table 15: Summary of Key Model Parameters
Parameter | Sponsor’s estimate |
|---|---|
Target population | |
Pan-Canadian population aged ≥ 18 years (excluding Quebec) | 26,621,709 / 27,037,538 / 27,442,000 |
Proportion of population without HeFH | |
Proportion of patients without HeFH with clinically evident ASCVD | |
Proportion with recent ACS within the past 1 year (MI and/or UA) | 8.2%2 |
Proportion treated with moderate-to-high intensity statins, with or without ezetimibe | 83.1%13 |
Proportion of patients with LDL-C ≥ 1.8 mmol/L | 42.3%36 |
Proportion using public drug benefits | 30% to 79% (jurisdiction specific)37 |
Number of patients eligible for drug under review | 44,223 / 44,922 / 45,602 |
Market uptake (3 years) | |
Uptake (reference scenario) Optimized LLT | 100% / 100% / 100% |
Uptake (new drug scenario) Evolocumab + optimized LLT Optimized LLT | 30% / 40% / 50% 70% / 60% / 50% |
Cost of treatment (per patient, per year) | |
Evolocumab | $7,053 |
ACS = acute coronary syndrome; ASCVD = atherosclerotic cardiovascular disease; HeFH = heterozygous familial hypercholesterolemia; LDL-C = low-density lipoprotein cholesterol; LLT = lipid-lowering therapy; MI = myocardial infarction; UA = unstable angina.
Summary of the Sponsor’s BIA Results
The sponsor estimated the net budget impact of funding evolocumab for the requested population will be $93,570,873 in year 1, $126,733,581 in year 2, and $160,817,043 in year 3. The total incremental expenditure is estimated to be $381,121,498 over the first 3 years of listing evolocumab.
CDA-AMC Appraisal of the Sponsor’s BIA
CDA-AMC identified several key limitations to the sponsor’s analysis that have notable implications on the results of the BIA:
The sponsor’s derivation of the eligible population was inappropriate. The sponsor used a prevalence-based approach to estimate the eligible population beginning with the Canadian population prevalence of ASCVD.34,35 However, the sponsor then narrowed the ASCVD population with an estimate of the proportion of patients with ASCVD found to have had an ACS event during the follow-up period (mean duration of follow-up of 40.8 months) from the Alberta RWE study (an incidence-based approach).2 CDA-AMC identified limitations with this approach. First, the proportion of patients with ASCVD who had an ACS event was identified over 3 years and thus overestimated the annual incidence. Second, the sponsor’s mixed use of prevalence- and incidence-based sources leads to uncertainty. As a result, the sponsor overestimated the number of patients with ACS that happen per year in participating jurisdictions, with an estimate of approximately 183,000 people. Given the reimbursement request (i.e., patients with recent ACS within the past 1 year) a fully incidence-based approach is more appropriate.
Given that nearly all ACS events happen in people with ASCVD (whether diagnosed or not), an incidence-based approach to estimating the eligible population may be a more appropriate method. According to the Canadian Chronic Disease Surveillance System, the annual incidence of MI in adults aged 20 years and older is 214 per 100,000 people.38 Applying this incidence to the population in Canada (excluding Quebec) without HeFH results in an estimate of approximately 55 thousand people with recent MI. This estimate aligns with the Canadian Institute for Health Information’s estimate that approximately 51 thousand patients with acute MI are admitted to Canadian hospitals (excluding Quebec) annually.39 Clinical experts consulted by CDA-AMC indicated that to account for the incidence of UA, increasing the MI incidence by 10% would capture additional patients with UA. This results in an estimated incidence of 235 per 100,000 population. While conditions other than ASCVD could result in MI, the clinical experts indicated that those are rare, and that assuming all ACS is a result of ASCVD is reasonable.
CDA-AMC used the annual incidence of MI in Canada in 2020 to 2021 (214 per 100,000)38 with an increase of 10% to capture the incidence of UA to derive the eligible population. CDA-AMC maintained the sponsor’s narrowing of the population by those on optimal LLT (83.1%) and those whose LDL-C remains above the 1.8 mmol/L threshold (42.3%).
The clinical experts indicated that UA is a disappearing diagnosis due to the high sensitivity cardiac troponin assays. Thus, the clinical experts suggested that consideration of MI only, as opposed to the definition of ACS that includes UA, may be more relevant for the purpose of this review. As such, CDA-AMC performed a scenario analysis using only the annual incidence of MI (214 per 100,000) to estimate the patient population.
The market uptake of evolocumab is uncertain. The sponsor estimated market shares of evolocumab using internal forecasts. The clinical experts consulted by CDA-AMC indicated that the sponsor’s projections may be greater than what will happen in Canadian clinical practice. The clinical experts suggested that by year 3 of reimbursement the market uptake of evolocumab may reach 30%. However, the trajectory of that uptake including the year 1 estimate is uncertain and may be influenced by patient choice and physician education programs.
CDA-AMC maintained the sponsor’s estimates of market uptake in the base-case analysis.
CDA-AMC conducted a scenario analysis informed by clinical experts, assuming that the market uptake of evolocumab will be 12.5%, 20%, and 30% in years 1, 2, and 3, respectively.
CDA-AMC Reanalyses of the BIA
CDA-AMC revised the sponsor’s submitted analysis by using an incidence-based approach to estimating the eligible population. The changes applied to derive the CDA-AMC base case are described in Table 16.
Table 16: CDA-AMC Revisions to the Submitted BIA
Stepped analysis | Sponsor’s value or assumption | CDA-AMC value or assumption |
|---|---|---|
Changes to derive the CDA-AMC base case | ||
1. Annual incidence of MI | Applied proportion of patients with ASCVD who had recent ACS from Alberta RWE.2 | Applied the annual incidence of MI, adjusted for incidence of UA, to the population in Canada without HeFH. |
CDA-AMC base case | 1 | |
ACS = acute coronary syndrome; ASCVD = atherosclerotic cardiovascular disease; BIA = budget impact analysis; CDA-AMC = Canada’s Drug Agency; HeFH = heterozygous familial hypercholesterolemia; MI = myocardial infarction; RWE = real-world evidence; UA = unstable angina.
The results of the CDA-AMC step-wise reanalysis are presented in summary format in Table 17 and a more detailed breakdown is presented in Table 18.
The CDA-AMC base case suggests that reimbursing evolocumab in the requested population would be associated with an incremental cost of $31,417,178 in year 1, $42,551,826 in year 2, and $53,995,624 in year 3, for a 3-year budgetary impact of $127,964,628. The CDA-AMC incidence-based approach resulted in a smaller eligible population than the sponsor’s estimate, which resulted in a 66% decline in the predicted 3-year budget impact.
Table 17: Summary of CDA-AMC Reanalyses of the BIA
Stepped analysis | Three-year total ($) |
|---|---|
Submitted base case | $381,121,498 |
CDA-AMC base case | $127,964,628 |
BIA = budget impact analysis; CDA-AMC = Canada’s Drug Agency.
Note: The submitted analysis is based on the publicly available prices of the comparator treatments.
CDA-AMC conducted the following scenario analyses to address remaining uncertainty, using the CDA-AMC base case (results are provided in Table 18):
assuming that only patients with recent MI make up the eligible population (i.e., excluding patients with recent UA)
assuming that the market shares in years 1, 2, and 3 are 12.5%, 20%, and 30%, respectively
assuming that the price of evolocumab is reduced by 50% (CDA-AMC’s estimated price reduction from the sponsor’s base-case analysis).
Table 18: Detailed Breakdown of CDA-AMC Reanalyses of the BIA
Stepped analysis | Scenario | Year 0 (current situation) ($) | Year 1 ($) | Year 2 ($) | Year 3 ($) | Three-year total ($) |
|---|---|---|---|---|---|---|
Submitted base case | Reference | 0 | 0 | 0 | 0 | 0 |
New drug | 0 | 93,570,873 | 126,733,581 | 160,817,043 | 381,121,498 | |
Budget impact | 0 | 93,570,873 | 126,733,581 | 160,817,043 | 381,121,498 | |
CDA-AMC base case | Reference | 0 | 0 | 0 | 0 | 0 |
New drug | 0 | 31,417,178 | 42,551,826 | 53,995,624 | 127,964,628 | |
Budget impact | 0 | 31,417,178 | 42,551,826 | 53,995,624 | 127,964,628 | |
CDA-AMC scenario analysis 1: exclude incidence of UA | Reference | 0 | 0 | 0 | 0 | 0 |
New drug | 0 | 28,561,071 | 38,683,478 | 49,086,931 | 116,331,480 | |
Budget impact | 0 | 28,561,071 | 38,683,478 | 49,086,931 | 116,331,480 | |
CDA-AMC scenario analysis 2: alternative market uptake | Reference | 0 | 0 | 0 | 0 | 0 |
New drug | 0 | 13,090,491 | 21,275,913 | 32,397,374 | 66,763,778 | |
Budget impact | 0 | 13,090,491 | 21,275,913 | 32,397,374 | 66,763,778 | |
CDA-AMC scenario analysis 3: 50% price reduction | Reference | 0 | 0 | 0 | 0 | 0 |
New drug | 0 | 15,708,589 | 21,275,913 | 26,997,812 | 63,982,314 | |
Budget impact | 0 | 15,708,589 | 21,275,913 | 26,997,812 | 63,982,314 |
BIA = budget impact analysis; CDA-AMC = Canada’s Drug Agency; UA = unstable angina.
ISSN: 2563-6596
Canada’s Drug Agency (CDA-AMC) is a pan-Canadian health organization. Created and funded by Canada’s federal, provincial, and territorial governments, we’re responsible for driving better coordination, alignment, and public value within Canada’s drug and health technology landscape. We provide Canada’s health system leaders with independent evidence and advice so they can make informed drug, health technology, and health system decisions, and we collaborate with national and international partners to enhance our collective impact.
Disclaimer: CDA-AMC has taken care to ensure that the information in this document was accurate, complete, and up to date when it was published, but does not make any guarantee to that effect. Your use of this information is subject to this disclaimer and the Terms of Use at cda-amc.ca.
The information in this document is made available for informational and educational purposes only and should not be used as a substitute for professional medical advice, the application of clinical judgment in respect of the care of a particular patient, or other professional judgments in any decision-making process. You assume full responsibility for the use of the information and rely on it at your own risk.
CDA-AMC does not endorse any information, drugs, therapies, treatments, products, processes, or services. The views and opinions of third parties published in this document do not necessarily reflect those of CDA-AMC. The copyright and other intellectual property rights in this document are owned by the Canadian Agency for Drugs and Technologies in Health (operating as CDA-AMC) and its licensors.
Questions or requests for information about this report can be directed to Requests@CDA-AMC.ca.