Drugs, Health Technologies, Health Systems
Reimbursement Review
Burosumab (Crysvita)
Sponsor: Kyowa Kirin Canada, Inc.
Therapeutic area: Treatment of X-linked hypophosphatemia
This multi-part report includes:
Clinical Review
Pharmacoeconomic Review
Clinical Review
Abbreviations
1,25(OH)2D
1,25-dihydroxyvitamin D
6MWT
6-minute walk test
AE
adverse event
BALP
bone-specific alkaline phosphatase
BFI
Brief Fatigue Inventory
BPI
Brief Pain Inventory
CDA-AMC
Canada’s Drug Agency
CI
confidence interval
DMP
Disease Monitoring Program
FGF23
fibroblast growth factor 23
GEE
generalized estimating equation
HRQoL
health-related quality of life
LLN
lower limit of normal
LOCF
last observation carried forward
LSM
least squares mean
LTE
long-term extension
MCID
minimal clinically important difference
OR
odds ratio
PRO
patient-reported outcome
PS
propensity score
PTH
parathyroid hormone
RCT
randomized controlled trial
SAE
serious adverse event
SC
subcutaneous
SD
standard deviation
SE
standard error
TEAE
treatment-emergent adverse event
TmP/GFR
ratio of renal tubular maximum phosphate reabsorption rate to glomerular filtration rate
TRP
tubular reabsorption of phosphate
ULN
upper limit of normal
WOMAC
Western Ontario and McMaster Universities Osteoarthritis Index
XLH
X-linked hypophosphatemia
Executive Summary
An overview of the submission details for the drug under review is provided in Table 1.
Table 1: Background Information on Application Submitted for Review
Item | Description |
|---|---|
Drug product | Burosumab (Crysvita) injection, 10 mg/mL, 20 mg/mL, and 30 mg/mL, solution for injection, subcutaneous injection |
Sponsor | Kyowa Kirin Canada, Inc. |
Indication | For the treatment of XLH in adult and pediatric patients aged 6 months and older |
Reimbursement request | For the treatment of XLH in adult patients |
Health Canada approval status | NOC |
Health Canada review pathway | Priority review |
NOC date | December 5, 2018 |
Recommended dosage | The recommended dosage regimen in adults is 1 mg/kg of body weight, rounded to the nearest 10 mg up to a maximum dose of 90 mg, administered every 4 weeks. Dose recalculation should be performed if there are changes in patient weight of ± 10%. Burosumab should not be administered at doses greater than 1mg/kg in adults. |
NOC = Notice of Compliance; XLH = X-linked hypophosphatemia.
Introduction
X-linked hypophosphatemia (XLH) is a rare, chronically debilitating genetic disorder.1 It is characterized by renal phosphate wasting and consequent defective bone mineralization caused by inactivating mutations in the PHEX gene.2-4 Patients with XLH produce excess of the protein FGF23, leading to the impaired conservation of phosphate and consequent hypophosphatemia,5 suppressing the production of 1,25-dihydroxyvitamin D — or 1,25(OH)2D in short — and resulting in a decrease in the intestinal absorption of calcium and phosphate.1,6
XLH in children is characterized by vitamin D–resistant rickets.1 Adults with XLH can display manifestations such as osteomalacia, fractures and pseudofractures, early-onset osteoarthritis, and enthesopathies.7-12 These abnormalities in adults with XLH result in musculoskeletal pain and stiffness, impaired mobility and physical function, fatigue, and reduced health-related quality of life (HRQoL).7,13
Published information about the incidence and prevalence of XLH is limited. The estimated prevalence of XLH in Norway is 1 case per 100,000 children.14 The estimated prevalence of hypophosphatemic rickets in southern Denmark is 4.8 cases per 100,000 people (children and adults)15 and 2.03 cases per 100,000 people in Colombia.16 A recent population-based cohort study using a large primary care database in the UK estimated adult XLH prevalence as being 1.57 cases per 100,000 people.17 There are no known reported prevalence estimates for Canada.
In adults, primary treatment generally consists of the continued use of oral phosphate and active vitamin D analogues as well as pain management and orthopedic interventions.1,6
Burosumab is a recombinant human immunoglobulin G subclass 1 monoclonal antibody that inhibits the biological activity of FGF23 and thereby increases both renal phosphate reabsorption and the serum concentration of 1,25(OH)2D.18 It is indicated for the treatment of XLH in adult and pediatric patients aged 6 months and older.18 The burosumab dosing regimen for the treatment of XLH in adult patients is 1 mg/kg rounded to the nearest 10 mg up to a maximum dose of 90 mg, administered by subcutaneous (SC) injection every 4 weeks.18
Burosumab was previously reviewed by CADTH and a recommendation to reimburse with conditions was issued in May 2020 for the treatment of pediatric patients with XLH; a recommendation not to reimburse was issued for adults.19 The sponsor has submitted additional data and requested reassessment of the reimbursement request for the treatment of adult patients with XLH, as this population is included in the indication approved by Health Canada. The sponsor is proposing the following criteria for adult patients with XLH, which the sponsor indicated align with international consensus guidelines.6
Burosumab treatment can be initiated in adult patients (≥ aged 18 years) who have:
a clinical presentation consistent with XLH, including —
fasting hypophosphatemia, and
normal renal function (defined as fasting serum creatinine below the age-adjusted upper limit of normal [ULN])
a confirmed PHEX gene variant in either the patient or in a directly related family member with appropriate X-linked inheritance and —
persistent bone and/or joint pain due to XLH, and/or
osteomalacia that limits daily activities, and/or
pseudofractures or osteomalacia-related fractures
an insufficient response or refractoriness to conventional therapy or if patients experience complications related to conventional therapy.
The sponsor also proposed that patients should be assessed on an annual basis for continued benefit; treatment with burosumab can be renewed as long as the patient does not meet any of the discontinuation criteria. It was also proposed that in adult patients, burosumab should be discontinued if any of the following occur: hyperparathyroidism, nephrocalcinosis, evidence of fracture or pseudofracture based on radiographic assessment, or intolerable adverse events (AEs) (e.g., 1 patient discontinued the UX023-CL303 study [hereafter known as the CL303 trial] due to restless leg syndrome worsening from baseline).
Perspectives of Patients, Clinicians, and Drug Programs
The information in this section is a summary of input provided by the patient and clinician groups that responded to the call by Canada’s Drug Agency (CDA-AMC) for input and from the clinical expert consulted by CDA-AMC for the purpose of this review.
Patient Input
Input was submitted for this review by the Canadian XLH Network, a national, not-for-profit, patient support organization for people living and dealing with XLH. Information for this input was gathered through an online survey of XLH adult patients, family members, and caregivers from December 2 to 15, 2023.
Survey respondents indicated that symptoms of XLH during adulthood differed from childhood symptoms. When asked about adult symptoms, 44% of patients reported severe pain, 28% reported a loss of mobility, 21% reported a lack of energy, 21% had an increase in dental issues, and 26% had developed arthritis and/or spinal stenosis. All of these symptoms were reported to significantly impact patients’ quality of life as well as their social and psychological well-being.
Survey respondents indicated that with conventional treatment (a combination of phosphate and calcitriol), patients need to take large doses of phosphate up to 5 times daily and calcitriol 1 to 2 times daily; this addresses the issue of low phosphate but does not address pain and other serious symptoms of XLH. In addition, conventional treatment has serious side effects, such as nephrocalcinosis, kidney disease, calcium deposits, and parathyroid issues, all while allowing XLH to continue progressing. Furthermore, phosphate is very expensive and hard to access due to supply chain issues.
Respondents indicated that there is a need for treatment options that are accessible, affordable, and easier to take and that can boost energy levels and muscle function, reduce pain, and improve bone health and overall quality of life, with fewer side effects.
Clinician Input
Input From Clinical Experts Consulted by CDA-AMC
The clinical expert consulted by CDA-AMC noted that the goals of treatment in adults are to reduce osteomalacia and pseudofractures to alleviate generalized bone pain, enhance mobility that may be reduced, and cure any non-union fractures. Unmet needs pertained to the fact that while current treatment reduces downstream effects of the elevated FGF23 levels, while attempting to normalize serum phosphorus and 1,25(OH)2D, may further elevate FGF23 levels to cause a feedback loop that limits the efficacy of conventional treatment. The clinical expert also noted that there is a side effect burden to conventional therapy, including gastrointestinal upset due to oral phosphate, and hypercalciuria and nephrocalcinosis due to 1,25(OH)2D treatment, which can reduce kidney function and cause secondary hyperparathyroidism. In addition, the clinical expert stated that the majority of patients (> 70%) continue to have symptoms of pain, mobility issues, or complications despite treatment. Furthermore, since active vitamin D may need to be administered twice daily and oral phosphate is usually administered several times per day, adherence may not be optimal.
Per the clinical expert, burosumab would represent a shift in the current treatment paradigm as it addresses the underlying disease at an upstream level rather than a downstream level. They noted that treatment with burosumab is likely to be lifelong as the cause of the disease is a genetic mutation, which results in consequences that persist throughout life.
Per the clinical expert, symptomatic patients with bone pain due to bone disease (i.e., due to osteomalacia, pseudofractures, and nonunion fractures) are best suited for treatment. However, they also noted there may be benefit in treating adults with limited symptomatology to increase activity levels and a sense of well-being.
In the clinical expert’s practice, they would consider a reduction in bone pain, a reduction in fractures, and the healing of fractures to be clinically meaningful responses to therapy. Laboratory evidence of the normalization of serum phosphorus and biomarkers of bone metabolism (e.g., alkaline phosphatase) and the absence of elevations in serum creatinine or parathyroid hormone (PTH) as well as the absence of the development or acceleration of nephrocalcinosis would also be considered clinically meaningful responses.
The clinical expert noted that patients who are experiencing a sustained decline in serum phosphorus levels despite adherence to therapy (suggesting that burosumab treatment is not working) or who develop a severe allergic reaction to burosumab should discontinue therapy. Therapy should be continued if initiated during childhood as long as the patient does not meet any of the discontinuation criteria, since the consequences of elevated FGF23 can also be seen in adults. Specialist attention would likely be required to diagnose, treat, and monitor patients receiving burosumab (i.e., either an endocrinologist or rheumatologist with knowledge of the disorder).
Clinician Group Input
No input was received by clinician groups by the deadline of the call for input.
Drug Program Input
Input was obtained from the drug programs that participate in the CDA-AMC reimbursement review process. The following were identified as key factors that could potentially impact the implementation of a CDA-AMC recommendation for burosumab:
considerations for the initiation of therapy
considerations for the discontinuation of therapy
care provision issues.
The clinical expert consulted by CDA-AMC provided advice on the potential implementation issues raised by the drug programs. Refer to Table 4 for more details.
Clinical Evidence
Systematic Review
Description of Studies
The major focus for the reassessment of this indication was additional data analysis results for the 48-week and 96-week mark of the CL303 clinical trial, as well as an ad hoc week 48 analysis of the placebo-emergent arm (placebo treatment during the first 24 weeks, switching to burosumab after 24 weeks).20,21 The CL303 trial, which was included in the original submission, was a phase III, double-blind, placebo-controlled, randomized controlled trial (RCT) consisting of a 24-week placebo-controlled period and 2 open-label extensions providing 96 weeks of total follow-up. Patients in this study had to be aged 18 years to 65 years, with a diagnosis of XLH supported by classic clinical features of adult XLH (such as short stature or bowed legs) and either a documented PHEX mutation (in either the patient or in a directly related family member with appropriate X-linked inheritance) or a serum intact FGF23 level of greater than 30 pg/mL by Kainos assay; biochemical findings consistent with XLH — namely, serum phosphorus of less than 0.81 mmol/L and a ratio of renal tubular maximum phosphate reabsorption rate to glomerular filtration rate (TmP/GFR) of less than 2.5 mg/dL; an estimated glomerular filtration rate of 60 mL per minute or more (using the Chronic Kidney Disease Epidemiology Collaboration equation); or an estimated glomerular filtration rate of 45 mL per minute to less than 60 mL per minute at the second screening visit, with confirmation that the renal insufficiency was not due to nephrocalcinosis; as well as the presence of skeletal pain attributed to XLH and/or osteomalacia based on a Brief Pain Inventory (BPI) worst pain score of 4 or more at the first screening visit.
The proportion of patients attaining serum phosphorus levels above the lower limit of normal (LLN) (0.81 mmol/L) at the midpoint of the dosing cycle from baseline to week 24 was the primary outcome of the study. Key secondary end points were also measured at 24 weeks and included change in the following patient-reported outcome (PRO) measures: the BPI worst pain score, the Western Ontario and McMaster Universities Osteoarthritis Index (WOMAC) stiffness score, and the WOMAC physical function score. Other secondary end points included domains of the BPI, WOMAC, and Brief Fatigue Inventory (BFI) measured at week 24, week 48, and week 96. WOMAC is a self-administered questionnaire assessing pain, stiffness, and physical functioning in patients with hip and knee osteoarthritis, comprising pain, physical function, and stiffness domains; a higher score indicates worse pain, stiffness, and functional limitations. The BPI is a self-reported questionnaire designed to provide information about pain intensity (the sensory dimension) and the degree to which pain interferes with daily living (the reactive dimension); a high score represents a high level of pain intensity or pain interference. The BFI is a self-reported questionnaire that assesses the severity of fatigue and the impact of fatigue on daily functioning, measuring fatigue and the interference of fatigue on daily life; the items are measured on a 0 to 10 numeric rating scale and a score of 7 to 10 is considered severe fatigue.22
The proportion of patients attaining serum phosphorus levels above the LLN at the end of their dosing cycle (i.e., 4 weeks after dosing) was also a secondary end point measured at week 48, as were measures of bone metabolism (bone-specific alkaline phosphatase [BALP]), 1,25(OH)2D, and phosphorus homeostasis (TmP/GFR and tubular reabsorption of phosphate [TRP]), measured at week 24, week 48, and week 96. Exploratory end points were active pseudofractures and/or fractures, as well as the 6-minute walk test (6MWT), a supervised test that measures the distance a patient can walk on a hard, flat surface over a 6-minute period. Both were measured at week 24 and week 48 (neither exploratory outcome was measured at week 96).
Baseline characteristics were generally balanced between the 2 treatment arms. In terms of medical history, a numerically higher proportion of patients in the burosumab arm had osteoarthritis (69.1% of patients versus 57.6% of patients in the placebo arm). A numerically higher proportion of patients in the burosumab arm were classified as having a BPI average pain score of more than 6 (32.4% of patients in the burosumab arm and 25.6% of patients in the placebo arm); similarly, a numerically higher proportion of patients in the burosumab arm were classified as having a BPI worst pain score of more than 6 (77.9% of patients in the burosumab arm and 65.2% of patients in the placebo arm). A numerically higher proportion of patients in the burosumab arm had nephrocalcinosis than in the placebo arm (16.2% versus 7.6% of patients, respectively). The majority of patients in the burosumab and placebo arms (86.8% and 93.9% of patients, respectively) had received both vitamin D analogues and phosphate before the trial. There were no notable imbalances in baseline laboratory characteristics. A higher proportion of patients in the placebo arm had active pseudofractures at baseline (51.5%) than patients in the burosumab arm (42.6%). The majority of patients in both arms had had previous orthopedic surgery (66.2% of patients in the burosumab arm and 71.2% of patients in the placebo arm) or were taking nonopioid pain medications at baseline (65.2% of patients in the placebo arm and 69.1% of patients in the burosumab arm).
Efficacy Results
Proportion of Patients With Serum Phosphorus Levels Greater Than LLN
Following crossover to burosumab after week 24, the additional data from the reassessment reported that the proportion of patients in the placebo-emergent arm with midpoint serum phosphorus levels greater than LLN was 89.4% (95% confidence interval [CI], 79.7% to 94.8%) at week 48 and 68.2% (95% CI, 56.2% to 78.2%) at week 96. The proportion of patients with serum phosphorus levels greater than LLN in the burosumab-emergent arm (burosumab treatment during the first 24 weeks with continued burosumab after 24 weeks) was 83.8% (95% CI, 73.3% to 90.7%) at week 48 and 82.4% (95% CI, 71.6% to 89.6%) at week 96. There was no information on the patients with end point serum phosphorus levels greater than LLN for week 48 and week 96.
Brief Pain Inventory
Additional information submitted for the BPI worst pain scores reported that at week 48, the least squares mean (LSM) change from baseline in the placebo-emergent arm was −1.53 (95% CI, −1.98 to −1.09) and in the burosumab-emergent arm was −1.09 (95% CI, −1.51 to −0.66). At week 96, the LSM changes from baseline in the placebo-emergent arm was −0.99 (95% CI, −1.51 to −0.47) and in the burosumab-emergent arm was −1.48 (95% CI, −2.07 to −0.90).
BPI pain interference results at week 48 reported an LSM change from baseline of −1.27 (95% CI, −1.77 to −0.78) in the placebo-emergent arm and −1.04 (95% CI, −1.51 to −0.56) in the burosumab-emergent arm. At week 96, the LSM change from baseline was −1.08 (95% CI, −1.59 to −0.57) in the placebo-emergent arm and −1.43 (95% CI, −1.89 to −0.97) in the burosumab-emergent arm.
BPI pain severity results reported that at week 48, the LSM change from baseline in the 2 study arms was −1.20 (95% CI, −1.58 to −0.81) in the placebo-emergent group and −0.85 (95% CI, −1.16 to −0.54) in the burosumab-emergent group. At week 96, the LSM change from baseline was −1.18 (95% CI, −1.57 to −0.80) in the placebo-emergent arm and −1.42 (95% CI, −1.87 to −0.97) in the burosumab-emergent arm.
Western Ontario and McMaster Universities Osteoarthritis Index
For WOMAC physical function, at week 48, the LSM change from baseline was –6.35 (95% CI, –11.94 to –0.76) in the placebo-emergent arm and –7.76 (95% CI, –11.97 to –3.55) in the burosumab-emergent arm. At week 96, the LSM change from baseline was –8.41 (95% CI, –13.80 to –3.01) in the placebo-emergent arm and –9.02 (95% CI, –13.47 to –4.57) in the burosumab-emergent arm.
WOMAC stiffness scores reported that at week 48, the LSM change from baseline was –15.29 (95% CI, –22.23 to –8.35) for the placebo-emergent arm and –16.03 (95% CI, –22.53 to –9.53) in the burosumab-emergent arm. At week 96, the LSM change from baseline was –17.67 (95% CI, –24.99 to –10.34) in the placebo-emergent arm and –15.32 (95% CI, –22.33 to –8.31) in the burosumab-emergent arm.
WOMAC pain scores were not analyzed, but a trend toward numerically increasing reductions was reported between week 48 and week 96, for both the placebo-emergent and burosumab-emergent treatment arms.
6-Minute Walk Test
At week 48, the mean total distance walked at baseline was 367.28 m (standard deviation [SD] = 104.22) in the placebo-emergent arm and 365.66 m (SD = 125.44) in the burosumab-emergent arm. The LSM change from baseline in total distance walked was –5.71 (95% CI, –21.70 to 10.28) in the placebo-emergent arm and 5.92 (95% CI, –15.00 to 26.84) in the burosumab-emergent arm. This outcome was not measured at week 96.
Brief Fatigue Inventory
At week 48, the LSM change from baseline in BFI worst fatigue was –1.23 (95% CI, –1.84 to –0.62) in the placebo-emergent arm and –1.01 (95% CI, –1.57 to –0.45) in the burosumab-emergent arm. At week 96, the LSM change from baseline was –0.82 (95% CI, –1.53 to –0.11) in the placebo-emergent arm and –0.75 (95% CI, –1.35 to –0.26) in the burosumab-emergent arm.
At week 48, the LSM change from baseline in BFI global fatigue was –0.73 (95% CI, –1.34 to –0.12) in the placebo-emergent arm and –0.46 (95% CI, –1.01 to 0.09) in the burosumab-emergent arm. At week 96, the LSM change from baseline was –0.86 (95% CI, –1.43 to –0.29) in the placebo-emergent arm and –0.80 (95% CI, –1.36 to –0.25) in the burosumab-emergent arm.
Fractures and Pseudofractures
The reassessment submission’s additional 24-week analyses reported a higher probability of a fully healed fracture at 24 weeks in the burosumab arm: 0.458 in the burosumab arm versus 0.048 in the placebo arm (odds ratio [OR] = 16.76 [95% CI, 4.93 to 56.95]).
At 48 weeks, 46.2% of patients in the placebo arm and 57.1% of patients in the burosumab arm reported healed active fractures. In addition, 33.3% of patients in the placebo-emergent arm and 64.7% of patients in the burosumab-emergent arm reported healed pseudofractures. The probability of a fully healed fracture was 0.725 (95% CI, 0.516 to 0.933) in the burosumab-emergent arm and 0.386 (95% CI, 0.718 to 0.594) in the placebo-emergent arm. Fracture outcomes were not measured at 96 weeks.
Key Serum Biomarkers
At week 48, the LSM change from baseline for the levels of serum 1,25(OH)2D was 10.50 (95% CI, 5.76 to 15.24) in the placebo-emergent arm and 7.24 (95% CI, 2.44 to 12.04) in the burosumab-emergent arm. At week 96, the serum 1,25(OH)2D was 3.43 (95% CI, –1.17 to 8.03) in the placebo-emergent arm and 1.95 (95% CI, –2.66 to 6.57) in the burosumab-emergent arm.
At week 48, the LSM change from baseline in TmP/GFR in the placebo-emergent arm was 0.55 (95% CI, 0.38 to 0.72) and 0.48 (95% CI, 0.30 to 0.65) in the burosumab-emergent arm. At week 96, the LSM change was 0.29 (95% CI, 0.12 to 0.46) in the placebo-emergent arm and 0.46 (95% CI, 0.29 to 0.62) in the burosumab-emergent arm.
At week 48, the LSM change from baseline in TRP was 0.02 (95% CI, 0.00 to 0.05) for the placebo-emergent arm and 0.03 (95% CI, 0.02 to 0.05) in the burosumab-emergent arm. At week 96, LSM changes from baseline in the placebo-emergent group was –0.01 (95% CI, –0.04 to 0.02), while the burosumab-emergent group was 0.03 (95% CI, 0.01 to 0.05).
At week 48, the LSM change from baseline in BALP in the placebo-emergent arm was 6.69 (95% CI, 2.91 to 10.47) and in the burosumab-emergent arm was 0.23 (95% CI, –3.36 to 3.81). At week 96, the LSM change in the placebo-emergent arm was –2.49 (95% CI, –6.19 to 1.21) and –2.76 (95% CI, –5.98 to 0.45) in the burosumab-emergent arm.
Harms Results
Overall, 97% of patients in the placebo-emergent arm and 100% of patients in the burosumab-emergent arm experienced a treatment-emergent adverse event (TEAE). There were differences between the proportions of patients experiencing some TEAEs between the burosumab-emergent arm during the trial and the placebo-emergent arm after initiating burosumab. Specifically, there were differences in the proportion of patients in the burosumab-emergent arm and placebo-emergent arm reporting tooth abscesses (28% and 8%, respectively), vitamin D deficiency (22% and 11%, respectively), injection site reactions (12% and 25%, respectively), diarrhea (19% and 8%, respectively), upper respiratory tract infection (18% and 3%, respectively), nausea and dizziness (both 16% and 8% in each arm, respectively), depression (13% and 5%, respectively), hypoesthesia (10% and 5%, respectively), migraine (10% and 3%, respectively), oropharyngeal pain (6% and 12%, respectively), injection site pruritus (4% and 12%, respectively), and ectopic mineralization (0% and 11%, respectively).
During the placebo-controlled period, a serious adverse event (SAE) was reported in 1 patient in the placebo-emergent arm and in 2 patients in the burosumab-emergent arm. In the placebo-emergent arm during burosumab treatment, 10 patients overall reported SAEs. The burosumab-emergent arm reported SAEs in 12 patients during the whole trial. There were no withdrawals due to AEs and 1 death due to a traffic accident in the burosumab-emergent arm (judged not related to treatment).
AEs of special interest included injection site reactions, hypersensitivity, hyperphosphatemia, ectopic mineralization, and restless leg syndrome. A total of 16 (24%) patients in the placebo-emergent arm reported injection site reactions after initiating burosumab and 8 (12%) patients reported injection site reactions before initiating burosumab. In addition, 7 (11%) patients in the placebo-emergent arm experienced ectopic mineralization, which was not reported in any of the other treatment arms.
Noting the higher proportions of patients in the burosumab-emergent arm experiencing TEAEs and serious TEAEs, the reassessment included an exposure-adjusted analysis reporting incidence rates in each arm; it reported generally similar incidence rates in the placebo-emergent and burosumab-emergent arms.
Critical Appraisal
Internal Validity
There are some limitations impacting the internal validity of the CL303 trial. First, there were some concerns with imbalances in certain medical characteristics, which could impact the outcomes. A numerically higher proportion of patients in the burosumab arm had osteoarthritis (69.1% versus 57.6% of patients) and nephrocalcinosis (16.2% versus 7.6% of patients) relative to the placebo arm, and a numerically higher proportion of patients in the placebo arm (51.5% versus 41.6%) had active pseudofractures at baseline. These could bias the assessment of efficacy on outcomes pertaining to pain, active pseudofracture healing, and physical function. In addition, the sample size was powered only for the primary end point to demonstrate a statistically significant difference at week 24 for the primary outcome of serum phosphorus, and therefore there could be a lack of power for key secondary but clinically important outcomes, such as the PROs; this adds uncertainty regarding the exact magnitude of benefit for these outcomes. Furthermore, a total of 6 patients had discontinued from the placebo-emergent arm and 8 patients had discontinued from the burosumab-emergent arm as of week 96. Given the relatively small sample size, this could represent a notable loss to follow-up. In addition, by virtue of the study design, at week 48 all patients crossed over to receive burosumab. The lack of control group makes it difficult to attribute the changes in efficacy outcomes and harms to burosumab alone during the open-label phases, which may be of particular importance for the harms results as a possible cumulative side effect burden was observed. Furthermore, the reporting of PRO results, as subjective measures, could be impacted by the open-label design. There were some missing data for serum biomarkers and PRO scores (data from approximately 59 patients were available at the 96-week mark), which were handled by exclusion from the analysis, but the potential impacts of this choice were not explored by sensitivity analysis relative to other missing data methods. For fracture outcomes, only targeted radiography was performed to check the progress of fractures after the initial scan at baseline, and these scans did not appear to be identifying new fractures. This could impact the detection of new fractures in particular as the development or absence of fractures in non–X-rayed sites may be missed. Lastly, patients in the burosumab-emergent arm had higher rates of pain medication usage; these differences may bias the efficacy results, particularly those of the WOMAC pain and BPI measures.
Table 2: Summary of Key Results From Pivotal Studies and RCT Evidence
Outcome | CL303 study | |||
|---|---|---|---|---|
Week 48 results | Week 96 results | |||
Week 0 to week 24: Placebo Week 24 to week 48: Switch to burosumab N = 66 | Week 0 to week 24: Burosumab Week 24 to week 48: Continued burosumab N = 68 | Week 0 to week 24: Placebo Week 24 to week 96: Switch to burosumab N = 66 | Week 0 to week 24: Burosumab Week 24 to week 96: Continued burosumab N = 68 | |
Proportion of patients attaining serum phosphorus levels > LLN, dose midpoint | ||||
Complete cases, n | 66 | 68 | 66 | 68 |
Attaining > LLN, n (%) | 59 (89.4) | 57 (83.8) | 45 (68.2) | 56 (82.4) |
95% CIa | 79.7 to 94.8 | 73.3 to 90.7 | 56.2 to 78.2 | 71.6 to 89.6 |
P valueb | NR | NR | ||
Proportion of patients attaining serum phosphorus levels > LLN, dose end point | ||||
Complete cases, n | NR | NR | NR | NR |
Attaining > LLN, n (%) | NR | NR | NR | NR |
95% CI | NR | NR | NR | NR |
P valueb | NR | NR | ||
BPI worst pain | ||||
Complete cases, n | 66 | 66 | 59 | 59 |
Baseline, mean (SE) | 6.54 (1.43) | 6.82 (1.31) | 6.47 (1.45) | 6.87 (1.31) |
End point, mean (SE) | 4.91 (2.13) | 5.56 (1.90) | 5.37 (2.29) | 5.15 (2.38) |
LSM change from baseline (95% CI) | –1.53 (–1.98 to –1.09) | –1.09 (–1.51 to –0.66) | –0.99 (–1.51 to –0.47) | –1.48 (–2.07 to –0.90) |
LSM difference from week 24 (95% CI) | –1.18 (–1.61 to –0.76)c | NR | NR | |
P value (change from week 24)b | < 0.0001c | NR | NR | |
BPI pain interference | ||||
Complete cases, n | 66 | 66 | 59 | 59 |
Baseline, mean (SD) | 4.76 (2.17) | 5.20 (2.22) | 4.81 (2.12) | 5.29 (2.25) |
End point, mean (SD) | 3.18 (0.29) | 3.74 (0.28) | 3.43 (2.35) | 3.43 (2.33) |
LSM change from baseline (95% CI) | –1.27 (–1.77 to –0.78) | –1.04 (–1.51 to –0.56) | –1.08 (–1.59 to –0.57) | –1.43 (–1.89 to –0.97) |
P valueb | NR | NR | NR | NR |
BPI pain severity | ||||
Complete cases, n | 66 | 66 | 59 | 59 |
Baseline, mean (SD) | 4.92 (1.54) | 5.19 (1.55) | 4.89 (1.53) | 5.22 (1.58) |
End point, mean (SD) | 3.63 (2.07) | 4.19 (1.78) | 3.58 (1.95) | 3.58 (1.98) |
LSM change from baseline (95% CI) | –1.20 (–1.58 to –0.81) | –0.85 (–1.16 to –0.54) | –1.18 (–1.57 to –0.80) | –1.42 (–1.87 to –0.97) |
P valueb | NR | NR | NR | NR |
WOMAC physical function | ||||
Complete cases, n | 66 | 66 | 59 | 59 |
Baseline, mean (SD) | 43.89 (19.94) | 50.30 (19.34) | 44.39 (20.16) | 50.67 (20.23) |
End point, mean (SD) | 34.74 (22.62) | 38.35 (18.61) | 34.02 (22.70) | 38.51 (20.62) |
LSM change from baseline (95% CI) | –6.35 (–11.94 to –0.76) | –7.76 (–11.97 to –3.55) | –8.41 (–13.80 to –3.01) | –9.02 (–13.47 to –4.57) |
LSM difference from week 24 (95% CI) | –8.18 (–11.55 to –4.82)c | NR | NR | NR |
P value (change from week 24)b | < 0.0001c | NR | NR | NR |
WOMAC stiffness | ||||
Complete cases, n | 66 | 66 | 59 | 59 |
Baseline, mean (SD) | 61.36 (20.77) | 64.58 (20.28) | 60.59 (21.25) | 64.62 (20.52) |
End point, mean (SD) | 44.70 (22.47) | 45.27 (21.90) | 42.58 (24.02) | 47.25 (24.79) |
LSM change from baseline (95% CI) | –15.29 (–22.23 to –8.35) | –16.03 (–22.53 to –9.53) | –17.67 (–24.99 to –10.34) | –15.32 (–22.33 to –8.31) |
LSM difference from week 24 (95% CI) | –15.82 (–21.30 to –10.34)c | NR | NR | NR |
P value (change from week 24)b | < 0.0001c | NR | NR | NR |
WOMAC pain | ||||
Complete cases, n | 66 | 65 | 59 | 59 |
Baseline, mean (SD) | 47.95 (15.54) | 50.08 (17.60) | 48.31 (15.77) | 50.17 (17.93) |
End point, mean (SD) | 36.21 (20.34) | 37.50 (16.53) | 36.36 (20.80) | 35.59 (17.59) |
Observed mean change (SD) | –11.74 (18.739) | –12.46 (15.60) | –11.95 (18.08) | –14.58 (17.65) |
6MWT total distance walked (m) | ||||
Complete cases, n | 65 | 63 | NR | NR |
Baseline, mean (SD) | 367.42 (103.41) | 358.24 (110.98) | NR | NR |
End point, mean (SD) | 390.86 (106.51) | 392.49 (107.15) | NR | NR |
LSM change from baseline (95% CI) | 20.19 (3.02 to 37.35) | 30.50 (16.92 to 44.08) | NR | NR |
P valueb | NR | NR | NR | NR |
BFI worst fatigue | ||||
Complete cases, n | 66 | 66 | 59 | 58 |
Baseline, mean (SD) | 6.74 (1.53) | 6.95 (1.66) | 6.66 (1.49) | 7.00 (1.64) |
End point, mean (SD) | 5.31 (2.21) | 5.64 (2.15) | 5.69 (2.53) | 5.86 (2.52) |
LSM change from baseline (95% CI) | –1.23 (–1.84 to –0.62) | –1.01 (–1.57 to –0.45) | –0.82 (–1.53 to –0.11) | –0.75 (–1.35 to –0.15) |
P valueb | NR | NR | NR | NR |
BFI global fatigue | ||||
Complete cases, n | 66 | 66 | 59 | 58 |
Baseline, mean (SD) | 4.86 (1.93) | 5.34 (2.03) | 4.90 (1.86) | 5.33 (2.12) |
End point, mean (SD) | 3.55 (2.28) | 4.17 (2.22) | 3.51 (2.03) | 3.84 (2.20) |
LSM change from baseline (95% CI) | –0.73 (–1.34 to –0.12) | –0.46 (–1.01 to 0.09) | –0.86 (–1.43 to –0.29) | –0.80 (–1.36 to –0.25) |
P valueb | NR | NR | NR | NR |
Active pseudofracture status | ||||
Number at baseline, n | 78 | 51 | NR | NR |
Healed, n (%) | 26 (33.3) | 33 (64.7) | NR | NR |
Partially healed, n (%) | 32 (41.0) | 9 (17.6) | NR | NR |
Unchanged, n (%) | 10 (12.8) | 4 (7.8) | NR | NR |
Worse, n (%) | 0 | 0 | NR | NR |
Missing, n (%) | 10 (12.8) | 5 (9.8) | NR | NR |
New finding, n(%) | 0 | 0 | NR | NR |
Active fracture status | ||||
Number at baseline, n | 13 | 14 | NR | NR |
Healed, n (%) | 6 (46.2) | 8 (57.1) | NR | NR |
Partially healed, n (%) | 4 (30.8) | 2 (14.3) | NR | NR |
Unchanged, n (%) | 1 (7.7) | 2 (14.3) | NR | NR |
Worse, n (%) | 0 | 0 | NR | NR |
Missing, n (%) | 2 (15.4) | 2 (14.3) | NR | NR |
New finding, n (%) | 1 | 0 | NR | NR |
Active fracture or pseudofracture | ||||
Number at baseline | 91 | 65 | NR | NR |
Probability of fully healed (95% CI) | 0.386 (0.178 to 0.594)d | 0.725 (0.516 to 0.933)d | NR | NR |
OR (95% CI) fully healed | NR | NR | NR | NR |
P value vs. 0 probability of healingb | 0.0003d | < 0.0001d | NR | NR |
Probability of partially healed, unchanged, or worsened | 0.614 | 0.275 | NR | NR |
Serum 1,25(OH)2D (pg/mL) | ||||
Complete cases, n | 64 | 63 | 56 | 58 |
Baseline, mean (SD) | 33.50 (15.61) | 32.20 (13.21) | 33.10 (14.93) | 32.90 (13.17) |
Observed, mean (SD) | 41.90 (13.42) | 38.00 (13.62) | 35.50 (11.80) | 33.40 (10.52) |
LSM change from baseline (95% CI) | 10.50 (5.76 to 15.24) | 7.24 (2.44 to 12.04) | 3.43 (–1.17 to 8.03) | 1.95 (–2.66 to 6.57) |
P valueb | NR | NR | NR | NR |
TmP/GFR (mg/mL) | ||||
Complete cases, n | 62 | 61 | 58 | 57 |
Baseline, mean (SD) | 1.60 (0.37) | 1.68 (0.41) | 1.60 (0.38) | 1.70 (0.41) |
Observed, mean (SD) | 2.21 (0.59) | 2.21 (0.52) | 1.95 (0.56) | 2.18 (0.46) |
LSM change from baseline (95% CI) | 0.55 (0.38 to 0.72) | 0.48 (0.30 to 0.65) | 0.29 (0.12 to 0.46) | 0.46 (0.29 to 0.62) |
P valueb | NR | NR | NR | NR |
TRP | ||||
Complete cases, n | 64 | 63 | 59 | 58 |
Baseline, mean (SD) | 0.81 (0.08) | 0.81 (0.08) | 0.81 (0.09) | 0.81 (0.09) |
Observed, mean (SD) | 0.84 (0.09) | 0.85 (0.07) | 0.81 (0.10) | 0.84 (0.06) |
LSM change from baseline (95% CI) | 0.02 (0.00 to 0.05) | 0.03 (0.02 to 0.05) | –0.01 (–0.04 to 0.02) | 0.03 (0.01 to 0.05) |
P valueb | NR | NR | NR | NR |
BALP (mcg/mL) | ||||
Complete cases, n | 66 | 61 | 59 | 58 |
Baseline, mean (SD) | 24.60 (17.30) | 25.80 (22.16) | 24.40 (18.07) | 25.90 (20.82) |
Observed, mean (SD) | 31.90 (19.46) | 26.00 (18.79) | 22.50 (12.12) | 23.00 (11.93) |
LSM change from baseline (95% CI) | 6.69 (2.91 to 10.47) | 0.23 (–3.36 to 3.81) | –2.49 (–6.19 to 1.21) | –2.76 (–5.98 to 0.45) |
P valueb | NR | NR | NR | NR |
Harms, n (%) (safety analysis set)e | ||||
TEAEs | NR | NR | 64 (97.0) | 68 (100.0) |
SAEs | NR | NR | 10 (15.2) | 12 (17.6) |
WDAEs (from study treatment) | NR | NR | 0 | 0 |
Deaths | NR | NR | 0 | 1 (1.5) |
Notable harms, n (%)e | ||||
Injection site reactions | NR | NR | 16 (24.2) | 8 (11.8) |
Hypersensitivity | NR | NR | 6 (9.1) | 4 (5.9) |
Hyperphosphatemia | NR | NR | 4 (6.1) | 4 (5.9) |
Ectopic mineralization | NR | NR | 7 (10.6) | 0 |
Restless leg syndrome | NR | NR | 10 (15.2) | 8 (11.8) |
1,25(OH)2D = 1,25-dihydroxyvitamin D; 6MWT = 6-minute walk test; BALP = bone-specific alkaline phosphatase; BFI = Brief Fatigue Inventory; BPI = Brief Pain Inventory; CI = confidence interval; GEE = generalized estimating equation; LLN = lower limit of normal; LSM = least squares mean; NR = not reported; OR = odds ratio; SAE = serious adverse event; SD = standard deviation; TEAE = treatment-emergent adverse event; TmP/GFR = ratio of renal tubular maximum phosphate reabsorption rate to glomerular filtration rate; TRP = tubular reabsorption of phosphate; vs. = versus; WDAE = withdrawal due to adverse event; WOMAC = Western Ontario and McMaster Universities Osteoarthritis Index.
aThe 95% CI for the proportion of patients who attain mean serum phosphorus levels above the LLN was calculated using the Wilson score method.
bThe P value was not adjusted for multiplicity.
cEstimates of LSMs and P values for change from week 24 to week 48 in the placebo-emergent arm are from an ad hoc GEE model, similar to those for the planned analysis.
dThe 95% CI and P value corresponds to the probability of a fracture being graded as fully healed for the week 48 analysis.
eHarms in the placebo-emergent arm are those that occurred in the placebo arm after initiating burosumab (i.e., the treatment continuation period [week 24 to week 48], extension period I [week 48 to week 96], or extension period II [through week 149]). Harms in the burosumab-emergent group are those that occurred during any treatment period.
Sources: Sponsor’s Summary of Clinical Evidence,23 CL303 Clinical Study Report,20 and additional information provided by the sponsor.21,24
External Validity
There are some limitations impacting the external validity of the study. The study focused on adult patients with XLH but did not specifically select patients diagnosed with XLH as adults; furthermore, the patient population included were majority white and majority female, which could have under-represented patient populations, including Indigenous Peoples and males. The majority of the patient population reported receiving vitamin D and phosphate before treatment with burosumab, which does not provide any information on the effectiveness of burosumab for adults with XLH who have received no prior treatments. The frequent visits and dose adjustment protocols used in the trial setting may not exactly reflect daily clinical practice in Canada, and the optimized efficacy and safety profile during the trial may not be extrapolatable to the general patient population. Moreover, patients were prohibited from using certain concomitant medications during the trial. This may not represent prescribing patterns in routine practice and may impact the generalizability of the findings from these additional data analyses. For fracture healing, which may take longer to capture, the duration of the study may not have been a long enough time to fully determine the impact of burosumab on these outcomes. Furthermore, the PRO measures used in the study were noted by the clinical expert to not be routinely used in clinical practice, suggesting that the impact of treatment on subjective measures such as pain, fatigue, and stiffness in the clinical trial may not be easily translated into these settings. Lastly, while the sponsor provided minimal clinically important differences (MCIDs) for the WOMAC, BPI, and BFI domain scores, it is important to note that apart from 2 domains of WOMAC, where a general population sample was cited by the sponsor, these MCIDs were generated from cross-sectional data (the UX023-CL001 study),25 phase II clinical trial data (the UX023-CL203 study),25 and/or CL303 (pivotal trial) data,24 all collected by the sponsor. The UX023-CL001 and UX023-CL203 studies were cross-sectional data and had a small sample size (N = 20), respectively, and were considered exploratory. The CL303 trial data are both the data source for the MCIDs and the data analyzed in the trial. Therefore, there is no external reference data in a population with XLH to use as a comparison for meaningful clinical change, and there remains a lack of confirmatory data on the meaningfulness of these score changes in the general adult XLH population.
Long-Term Extension Studies
Description of Studies
Study BUR0226,27 was an open-label, phase III study evaluating the long-term efficacy and safety of burosumab in adult patients with XLH. It was undertaken using patient populations that had completed the CL303 study20 (a phase III RCT that evaluated measures of phosphate metabolism, PROs, and fractures and/or pseudofractures in adults with XLH) or the UX023-CL304 study, hereafter known as the CL304 trial (this was a phase III, single-arm study that evaluated measures of osteomalacia in patients with XLH who received burosumab treatment, and was not appraised in the current submission).28 Patients completing the CL303 study were eligible to transition to the BUR02 study; however, there was an interval between the CL303 and BUR02 trials (a mean of 9 months; range, 6 months to 16 months) where interim burosumab treatment was provided via an early access program only to the patients for whom the drug supply was accessible.
Efficacy Results
Serum Phosphate Levels Above the LLN
At the baseline of the BUR02 trial, 34.3% of patients had serum phosphate levels above the LLN. The proportion increased to 55.9% at week 12 and remained mostly within a range between 55% and 75% in subsequent visits. At the end of the study, 66.7% of the patients had serum phosphate levels above the LLN.
Key Serum Biomarkers
At the CL303 trial baseline, the mean TmP/GFR was 0.55 (SD = –0.15) mmol/L and it increased to 0.70 (SD = 0.26) mmol/L at week 12a; this level was sustained through both the CL303 and BUR02 studies. At the final analysis, the mean (SD) TmP/GFR was 0.62 (SD = 0.22) mmol/L and it increased to 0.69 (SD = 0.14) mmol/L at week 48b; these levels were sustained over time.
At the interim analysis, the mean (SD) serum 1,25(OH)2D was 79.95 (SD = 29.77) pmol/L at the CL303 trial baseline, 98.56 (SD = 30.27) pmol/L at week 48a, and 83.36 (SD = 32.97) pmol/L at week 72a. At the baseline of the BUR02 trial, the mean (SD) serum 1,25(OH)2D was 78.43 (SD = 41.49) pmol/L and it increased to 92.85 (SD = 36.06) pmol/L at week 12b, remaining consistent to week 48b of the BUR02 study.
According to the final analysis, at baseline, the mean (SD) serum concentration of 1,25(OH)2D was 32.67 (SD = 16.35) pg/mL. At week 12, the 1,25(OH)2D concentration increased to 39.86 (SD = 15.57) pg/mL. At week 24, week 48, week 72, and week 96, the mean (SD) serum 1,25(OH)2D levels were 36.34 (SD = 9.80) pg/mL, 37.04 (SD = 7.83) pg/mL, 38.16 (SD = 11.30) pg/mL, and 41.01 (SD = 12.80) pg/mL, respectively. At the end of the study, the mean (SD) serum 1,25(OH)2D was 38.53 (SD = 12.70) pg/mL.
Patient-Reported Outcomes
Based on the interim analyses in the CL303 study, the LSM (standard error [SE]) of WOMAC stiffness scores was –14.77 points (SE = 4.03 points) at week 36a; this reduction was sustained at all subsequent time points in the 2 studies. Similar results were reported for the WOMAC physical function score.
In the final analysis of the BUR02 study, the mean (SD) stiffness score was 55.15 (18.75) at baseline, and the mean (SD) change was –3.13 (17.68) at week 12. The mean stiffness scores were maintained at lower than baseline throughout subsequent visits. The mean (SD) changes in stiffness score from baseline to week 24, week 48, and week 96 were –9.19 (SD = 22.89) points, –8.62 (SD = 18.63) points, and –9.09 (SD = 20.48) points, respectively. At the end of the BUR02 study, the mean score decreased by –14.52 (22.61) points. Similar decreases were observed for the WOMAC pain score and the physical function score.
Based on the interim analyses in the CL303 study, the LSM change from baseline in the BPI average worst pain scores at week 12a was −0.88 (SE = 0.281) and it decreased from baseline at all subsequent time points in the 2 studies except for week 24a. The BPI pain interference scores had also decreased from baseline with an LSM change from baseline of −1.22 (SE = 0.309) at week 12a and at all subsequent time points in both studies except week 24a.
Similarly, according to the final analysis from the BUR02 trial, the mean (SD) BPI worst pain score was 5.78 (SD = 1.725) points at baseline. The mean change in BPI worst pain score from baseline to week 12 was −0.51 (SD = 1.698) points, and this level was maintained at lower than baseline at week 24, week 36, week 48, week 72, and week 96.
The mean BPI pain severity score was 4.52 (SD = 1.657) points at baseline (N = 32) and the mean change in BPI worst pain score from baseline was −0.40 (SD = 1.416) points at week 12 (N = 12). These values were maintained throughout subsequent visits. Similar decreases were observed for the BPI pain interference score.
Based on the interim analyses, the LSM of the BPI average worst fatigue scores decreased from baseline results and were consistent at all subsequent time points. Similar trends were observed for the BFI global fatigue score and fatigue interference score. The BFI fatigue severity scores had decreased from baseline with an LSM of −1.45 (SE = 0.45) at week 12a and at all time points through to the end of the BUR02 trial.
According to the final analysis, at baseline of the BUR02 study, the mean BFI worst fatigue score was 5.91 (SD = 1.75) points. The mean change in worst fatigue score from baseline to week 24, week 48, week 72, and week 96 were −0.49 (SD = 1.78) points, −0.46 (SD = 2.00) points, −0.34 (SD = 2.24) points, and −0.64 (SD = 1.73) points, respectively. Similar trends were observed for the BFI global fatigue score and fatigue interference score.
6-Minute Walk Test
At the interim analysis, the 6MWT actual distance walked increased from the CL303 trial baseline at week 24a to week 48b. At the final analysis, at the baseline of the BUR02 study, the mean actual distance walked was 393.3 (SD = 93.25) m. After BUR02 study entry and continuation with burosumab treatment, the mean changes in actual walking distance increased from baseline to week 12, and all subsequent visits.
Harms Results
Safety data were not evaluated as part of the interim analysis. At the final analysis, all patients had received all scheduled doses and no patients had skipped doses. Almost all patients (n = 34) experienced 1 or more TEAE but most events were mild to moderate in severity. Among the patients who experienced a TEAE, the most common TEAEs were vitamin D deficiency (55.9%), arthralgia (38.2%), and hypophosphatemia (26.5%).
Six patients experienced SAEs (17.1%); these events occurred in single patients from each subgroup. No patients experienced related treatment-emergent SAEs. No deaths or TEAEs leading to death were reported during the CL303 study. No patient had a TEAE that led to withdrawal of the study drug or study discontinuation. There was no notable difference in the overall incidence of AEs between the 2 subgroups.
Critical Appraisal
Internal Validity
The open-label designs of the BUR02 study could bias the magnitude of the efficacy of subjective PRO results due to unblinded exposure to the study medication during the treatment period. In addition, the absence of control arm in the BUR02 study and the lack of data beyond week 96 make interpretation of the long-term sustainability of treatment effect challenging.
The interim analysis showed that the clinical effect of burosumab decreased when treatment was interrupted and returned after patients resumed the medication, but analysis based on the doses received by the patients was not performed and it cannot be confirmed whether those who received 1 dose versus 6 doses of burosumab would have different outcomes.
Furthermore, treatment history and concomitant medications during the gap between the pivotal studies and the BUR02 trial were not assessed, limiting the ability to interpret the outcomes efficiently.
External Validity
As the BUR02 study consisted of patients who took part in the CL303 and CL304 parent studies, it is reasonable to expect that the same strengths and limitations related to generalizability apply to the extension studies.
The patient population of those studies may not be reflective of the wider, more heterogeneous clinical population in terms of demographic and clinical characteristics; therefore, the results presented may differ from those observed in a real-world clinical setting. The study population was not reflective of the Canadian population and therefore the patients enrolled may not reflect the gender, racial, or ethnic diversity of the Canadian population, which may reduce the generalizability of results.
Indirect Comparisons
No indirect comparisons were submitted as part of this review.
Studies Addressing Gaps in the Evidence From the Systematic Review
Description of Studies
The Disease Monitoring Program (DMP) is a cohort study intended to last for up to 10 years per patient and enrol at least 500 adult and pediatric patients with XLH at up to 39 sites in the US, Canada, and Latin America.29 Patients receiving burosumab in a real-world setting (i.e., outside of clinical trials), those enrolled in the DMP after receiving burosumab in a clinical trial setting, and those who were not receiving burosumab at all (i.e., receiving conventional therapy or no treatment) were included. An analysis of the year 1 data was submitted, consisting of data collected from 2 matched patient cohorts: patients who were reported to be receiving conventional therapy at baseline (July 16, 2018) and who never received burosumab during the DMP, and patients who reported receiving burosumab in a real-world setting and who initiated burosumab at any point after DMP initiation. Patients provided information on demographics, family history, diagnostic history, medical and surgical history, growth history, disease-specific clinical symptoms and progression, concomitant medications and therapies, disability, and quality of life.
Outcomes
The outcomes of interest were serum phosphate levels and WOMAC pain, WOMAC stiffness, and WOMAC physical function scores at the year 1 mark. Information on outcomes was collected at the baseline visit and again at the approximate year 1 visit.
Statistical Analysis
The 2 patient cohorts were balanced on baseline characteristics using propensity score (PS) matching algorithms that included the following: demographics (age, race, and gender), clinical characteristics (weight, height, body mass index, serum phosphate level, WOMAC pain score, WOMAC stiffness score, and WOMAC physical function score), disease and/or medical characteristics (PHEX mutation positivity, age at XLH diagnosis, number of historical fractures, osteoarthritis, and enthesopathy and/or bone spurs and/or osteophytes).
Mean changes to outcome variables between the baseline visit and the year 1 visit were calculated for the cohorts; changes in outcomes were only calculated for those patients who had a baseline and year 1 measure for that outcome. For continuous baseline variables, the F-test was performed to check for the equality of variance between the 2 cohorts, and equal or unequal variance student t test was used. For categorical baseline variables, a chi-square test was performed with a P value of 0.05 or less being considered statistically significant.
Efficacy Results
The matching procedure balanced cohorts with respect to race, weight at baseline, height at baseline, WOMAC pain score, and WOMAC stiffness score. A total of 44% of patients in the burosumab cohort reported receiving conventional therapy at baseline, and 56% of patients reported receiving no treatment. All patients in the conventional therapy cohort reported receiving conventional therapy. There was a mean delay of 245.8 (SD = 275.2) days in initiating burosumab in the burosumab cohort, and the year 1 visit for patients occurred an average of 408.8 (SD = 94.0) days after the baseline visit in the burosumab cohort and 431.3 (SD = 89.3) days in the conventional therapy cohort.
The proportion of patients in the burosumab cohort with serum phosphate levels greater than LLN was 20.0% at baseline and 58.3% at the year 1 visit; this attained statistical significance relative to the conventional therapy cohort (28.6% of patients had serum phosphate levels > LLN at year 1; P value = 0.0013). There was no significant difference between the 2 cohorts in terms of the change in WOMAC physical function, WOMAC pain, or WOMAC stiffness scores at the year 1 visit.
Harms Results
Information on harms was not provided for the DMP study.
Critical Appraisal
The design of the DMP study is subject to some notable limitations due to missing key information. It is unclear when the initiation of burosumab occurred in the burosumab cohort whereas the analysis appeared to consider the time between baseline and burosumab initiation as time spent on burosumab treatment. The treatment patterns of the cohort after baseline but before burosumab initiation are also not known. The dosing of all therapies during the study, conventional or burosumab, is largely unknown. While transparently discussed in the submission, this remains an important consideration as potential variations in real-world practice or differences in the degrees of patient adherence to therapy are unaccounted for in the assessment. There was no information provided on the recruitment methods of sites or patients; therefore, the study settings are largely unknown. There was also no information on which point in the dosing cycle (e.g., midpoint, end point) the serum phosphate results were measured. Since the pivotal trial demonstrated that there are notable variations in the proportion of patients with serum phosphorus levels greater than LLN at the end point versus the midpoint of the dosing cycle, this could greatly impact the definition of the interventions and render inference very uncertain. The results must also be interpreted in the context of no harms data having been reported, which is an important consideration as this leaves a considerable knowledge gap in understanding the full impact of burosumab treatment. Furthermore, the patients in the burosumab cohort comprised both patients who had been receiving conventional therapy at baseline and those who hadn’t been receiving any therapy — the magnitude of benefit due to burosumab treatment may vary within subgroups of patients based on their previous treatment patterns, which is not explored in sensitivity analyses in the cohort study. There is also no discussion of the methods used to identify the variables included in the PS matching. The matching itself did not attain balance on fractures (38.0% in the burosumab cohort versus 49.3% in the conventional therapy cohort) or the country variable, and as such any country-level differences in practice would not be controlled for in this analysis. There is also the possibility of selection bias as approximately half the patients entering the burosumab cohort had no treatment at baseline, and without treatment history it isn’t known whether these patients were refractory to conventional therapy or their disease activity levels were such that it was not needed.
There are also limitations on the generalizability of this cohort study. Less than a quarter of the participants were from Canada, and therefore results may not translate directly to the characteristics of this clinical population. In addition, with an average of 245.8 days until the first burosumab exposure and a mean duration between visits of 408.8 days, the burosumab cohort was treated for less time than was covered in the CL303 pivotal trial and BUR02 long-term extension (LTE), limiting the applicability of these results to longer time periods. Furthermore, similar to the CL303 trial, the cohort study used the same MCIDs and therefore the same limitations apply regarding the lack of an externally validated measure of clinical meaningfulness. Overall, the potential biases that may or may not be imparted by the presence of missing information greatly complicates the definition of the intervention and comparator, as well as any causal inference linking burosumab treatment to the observed results, rendering it difficult to draw conclusions regarding the relationship between burosumab treatment and patient outcomes in a real-world setting.
Conclusions
The major areas of the reassessment addressed the lack of clinically meaningful results in the domains of pain, physical function, and fatigue in adults with XLH, as well as a lack of active comparator data against conventional therapy for XLH. Additional data from the CL303 trial broadly showed normalization of serum phosphorus in a notable majority of patients that persisted in many patients over time, although a waning in the proportion of patients with serum phosphorus levels greater than LLN was observed at 96 weeks after enrolment. A trend toward increased healing in fractures or pseudofractures was also noted along with a statistically significant OR of full healing relative to no healing at all at 24 weeks, although longer-term data remained lacking. While potentially notable reductions in WOMAC scores, particularly stiffness scores, were reported and reductions maintained over longer time periods, there was a lack of notable impact noted in the BPI pain and fatigue scores, with reductions of at most 2 points from baseline. The meaningfulness of these changes remains unknown due to the fact that the MCIDs provided in the submission were derived from the same dataset as that of the pivotal trial and are thus hampered by a lack of external validity. Data from the safety assessment of burosumab noted no serious safety signals but a potentially cumulative impact of TEAEs, which was identified through an analysis adjusting for the duration of burosumab exposure; this is a potentially important consideration as treatment with burosumab will be lifelong, per the clinical expert consulted by CDA-AMC. The LTE study also reported an increase in vitamin D deficiency and hypophosphatemia at later time points, although the clinical impact of these results is unclear. The reassessment was not able to conclude anything about comparative evidence due to limitations in the real-world evidence portion and there remains an information gap on the safety of burosumab relative to conventional therapy.
Introduction
Disease Background
Content in this section has been informed by materials submitted by the sponsor and clinical expert input. The following has been summarized and validated by the CDA-AMC review team.
XLH is a rare, chronically debilitating genetic disorder.1 It is characterized by renal phosphate wasting and consequent defective bone mineralization caused by inactivating mutations in PHEX.2-4 In the absence of functional PHEX, patients with XLH produce excess FGF23, leading to the impaired conservation of phosphate and consequent hypophosphatemia.5 Excess FGF23 also suppresses 1,25(OH)2D production, resulting in decreased intestinal absorption of calcium and phosphate.1,6
Phosphorus plays a critical role in several essential biological processes, bone formation, and metabolism, and is an essential component of cell membranes and nucleic acids.2,3 Patients usually develop clinical symptoms during the first or second year of life.6 XLH in children is characterized by vitamin D–resistant rickets, and results in variable degrees of delayed walking, a waddling gait, leg bowing, enlarged cartilages, bone pain, craniosynostosis, dental abscesses, and impaired growth.1 Adults with XLH can have manifestations such as fractures and pseudofractures, and early-onset osteoarthritis and enthesopathies causing musculoskeletal pain, stiffness, and fatigue.7-12 These musculoskeletal abnormalities in adults with XLH also result in impaired mobility and physical function, and reduced HRQoL.7,13
As is the case with many rare diseases, published information about the incidence and prevalence of XLH is limited. The estimated prevalence of XLH in Norway is 1 case per 100,000 children.14 The estimated prevalence of hypophosphatemic rickets in southern Denmark is 4.8 cases per 100,000 people (children and adults),15 and 2.03 cases per 100,000 people in Colombia.16 A recent population-based cohort study using a large primary care database in the UK estimated adult XLH prevalence as being 1.57 cases per 100,000 people.17 There are no known reported prevalence estimates for Canada.
Standards of Therapy
Content in this section has been informed by materials submitted by the sponsor and clinical expert input. The following has been summarized and validated by the CDA-AMC review team.
Due to the multivariate manifestations of XLH, particularly in adulthood, care involves pharmacological and non-pharmacological management, and can include the involvement of many specialists (e.g., endocrinologists, rheumatologists, geneticists, orthopedic surgeons, dentists, nephrologists, pain specialists). The goals of therapy for XLH in adults are to normalize phosphate concentrations as well as to decrease the extent of osteomalacia and pseudofractures to reduce bone pain, enhance mobility, cure nonunion fractures, and/or improve fracture healing or surgical recovery. Reduction of these events increases patients’ ability to participate in life activities and improves HRQoL.
In Canada, conventional therapy for adults with XLH involves oral phosphate supplements and active vitamin D analogues (calcitriol or alfacalcidol).30 Active vitamin D analogues are publicly funded for XLH, while phosphate supplementation is accessible as an over-the-counter product. The clinical expert consulted by CDA-AMC noted that current treatment generally reduces hypophosphatemia and low 1,25(OH)2D levels, which are downstream effects of the elevated FGF23 levels; however, they do not reverse the course of disease. Furthermore, conventional therapy has a notable side effect burden. Per the clinical expert, frequent phosphate administration may produce gastrointestinal upset and secondary or tertiary hyperparathyroidism, and 1,25(OH)2D treatment may produce hypercalciuria and nephrocalcinosis that may potentially lead to renal failure; these complications may require additional therapy. Furthermore, the clinical expert noted that although not all patients respond to available treatments, even in those who respond with the normalization of serum phosphate and 1,25(OH)2D, this may further elevate FGF23 levels and set up an unwanted feedback loop that limits the efficacy of conventional treatment.
Drug Under Review
Burosumab is a recombinant human immunoglobulin G subclass 1 monoclonal antibody that binds to the N-terminal domain of FGF23. This inhibits the biological activity of FGF23, thereby increasing both renal phosphate reabsorption and the serum concentration of 1,25(OH)2D.18 It is indicated for the treatment of XLH in adult and pediatric patients aged 6 months and older.18 The burosumab dosage regimen for the treatment of XLH in adult patients is 1 mg/kg rounded to the nearest 10 mg up to a maximum dose of 90 mg, administered by SC injection every 4 weeks.18
Burosumab was previously reviewed by CADTH and a recommendation to reimburse with conditions was issued in May 2020 for treatment of pediatric patients with XLH.19 The sponsor has submitted additional data and requested a reassessment of the reimbursement request for the treatment of adult patients with XLH, as this population is included within the indication approved by Health Canada. The sponsor is proposing the following criteria for adult patients with XLH, which they indicated align with international consensus guidelines.6
Burosumab treatment is proposed by the sponsor to be initiated in adult patients (≥ aged 18 years) who have:
a clinical presentation consistent with XLH, including —
fasting hypophosphatemia, and
normal renal function (defined as fasting serum creatinine below the age-adjusted ULN)
a confirmed PHEX gene variant in either the patient or in a directly related family member with appropriate X-linked inheritance and —
persistent bone and/or joint pain due to XLH, and/or
osteomalacia that limits daily activities, and/or
pseudofractures or osteomalacia-related fractures
insufficient response or are refractory to conventional therapy or if patients experience complications related to conventional therapy.
Key characteristics of burosumab are summarized in Table 3 with other treatments available for XLH.
Table 3: Key Characteristics of Burosumab, Alfacalcidol, Calcitriol, Sodium Phosphate, and Cinacalcet Hydrochloride
Characteristic | Burosumab (Crysvita) | Alfacalcidol (One-Alpha) | Calcitriol (Calcitriol-Odan) | Sodium phosphate (Phoslax) | Phosphate effervescenta | Cinacalcet hydrochloride (Sensipar) |
|---|---|---|---|---|---|---|
Mechanism of action | An antibody that binds to and inhibits the biological activity of FGF23 | A synthetic analogue of 1,25-dihydroxyvitamin D, the active form of vitamin D. It stimulates intestinal calcium and phosphorus absorption, resorbs bone at high doses, and possibly enhances renal calcium reabsorption. | Calcitriol is synthesized 1,25-dihydroxyvitamin D. It stimulates intestinal calcium and phosphorus absorption, resorbs bone at high doses, and possibly enhances renal calcium reabsorption. | Natural product of sodium and phosphate | Natural product of sodium and phosphate | A synthetic molecule that directly lowers PTH levels by increasing the sensitivity of the calcium-sensing receptor to extracellular calcium |
Indication | Indicated for the treatment of XLH in adult and pediatric patients aged 6 months and olderb | Indicated for adult patients with chronic renal failure for:
| Indicated in the management of:
| Correction of hypophosphatemia | Correction of hypophosphatemia | Indicated for the treatment of secondary or tertiary HPT |
Route of administration | SC | Capsules, oral drops, or injection | Oral | Oral | Oral | Oral |
Recommended dosage | 1 mg/kg of body weight, rounded to the nearest 10 mg up to a maximum dose of 90 mg, administered every 4 weeks | 0.75 mcg to 1.5 mcg daily | 0.5 mcg to 0.75 mcg daily | 750 mg to 1,600 mg daily | 750 mg to 1,600 mg daily | Starting oral dose is 30 mg once daily, titrated every 2 weeks to 4 weeks through dosages of 30 mg twice daily, 60 mg twice daily, and 90 mg twice daily to reduce serum calcium levels |
Serious adverse effects or safety issues | Hyperphosphatemia, hypersensitivity, injection site reactions | Hypercalcemia | Hypercalcemia, hypersensitivity reactions | Can cause diarrhea at high doses | Can cause diarrhea at high doses | Hypocalcemia, hypotension, and/or worsening heart failure |
HPT = hyperparathyroidism; PTH = parathyroid hormone; SC = subcutaneous; XLH = X-linked hypophosphatemia.
aThe brand name of the tablets is Jamp-sodium phosphate effervescent.
bHealth Canada–approved indication.
Sources: Product monographs of burosumab,18 alfacalcidol,31 calcitriol,32 sodium phosphates,33 phosphate effervescent,34,35 and cinacalcet hydrochloride.36
Perspectives of Patients, Clinicians, and Drug Programs
Patient Group Input
This section was prepared by the CDA-AMC review team based on the input provided by patient groups. The full original patient input that CDA-AMC received has been included in the Perspectives of Patients, Clinicians, and Drug Programs section of this report.
Input was submitted for this review by the Canadian XLH Network, a national, not-for-profit, patient support organization for people living and dealing with XLH. Information for this input was gathered through an online survey of XLH adult patients and family and caregivers from December 2 to 15, 2023.
Of the 57 respondents to the survey, 46% live in Canada, 88% identify as female, and 88% are aged between 30 years and 59 years. The majority of the respondents were diagnosed as children, and 12% were diagnosed as adults. Respondents indicated that symptoms of XLH during adulthood differed from childhood symptoms. When asked about adult symptoms, 44% of patients reported severe pain, 28% reported a loss of mobility, 21% reported a lack of energy, 21% had an increase in dental issues, and 26% had developed arthritis and/or spinal stenosis. All of these symptoms were reported to significantly impact patients’ quality of life, and their social and psychological well-being.
Survey respondents indicated that while conventional treatment (a combination of phosphate and calcitriol) was available to adult patients in Canada, patients need to take large doses of phosphate up to 5 times daily and calcitriol 1 to 2 times daily, a treatment that addresses the issue of low phosphate but does not address pain and other serious symptoms of XLH. In addition, conventional treatment has serious side effects, such as nephrocalcinosis, kidney disease, calcium deposits, and parathyroid issues, all while allowing XLH to continue progressing. Furthermore, phosphate is very expensive and hard to access due to supply chain issues. To manage their pain, all patients surveyed use over-the-counter or prescription pain medication, and most of the respondents (88%) reported having had major surgeries and anticipating more in the future.
Respondents indicated that there is a need for treatment options that are accessible and affordable, are easier to take, can boost energy levels and muscle function, reduce pain, and improve bone health and overall quality of life, with fewer side effects.
Clinician Input
Input From Clinical Experts Consulted by CDA-AMC
All of the CDA-AMC review teams include at least 1 clinical specialist with expertise regarding the diagnosis and management of the condition for which the drug is indicated. Clinical experts are a critical part of the review team and are involved in all phases of the review process (e.g., providing guidance on the development of the review protocol, assisting in the critical appraisal of clinical evidence, interpreting the clinical relevance of the results, providing guidance on the potential place in therapy). The following input was provided by 1 clinical specialist with expertise in the diagnosis and management of XLH in adults.
Unmet Needs
Per the clinical expert, the goals of treatment in adults are to reduce osteomalacia and pseudofractures, cure any nonunion fractures to alleviate generalized bone pain, and enhance mobility that may have been reduced. Reduction of these events can increase the ability to maintain employment and improve HRQoL. It is often recommended that only symptomatic adults (i.e., those displaying symptoms of disease along with indicative laboratory markers and imaging studies) be treated.
The clinical expert noted that current treatment improves hypophosphatemia and low 1,25(OH)2D levels, which are downstream effects of the elevated FGF23 levels that occur in this disease. However, the treatment, by normalizing serum phosphate and 1,25(OH)2D, may further elevate FGF23 levels to cause a feedback loop that limits the efficacy of conventional treatment. There is also a side effect burden to conventional therapy, including gastrointestinal upset and secondary hyperparathyroidism due to oral phosphate, as well as hypercalciuria and nephrocalcinosis leading to decreased renal function due to 1,25(OH)2D treatment. Thiazide diuretics and cinacalcet may be added to conventional phosphate and active vitamin D therapy to treat complications of conventional therapy, such as hypercalciuria and hyperparathyroidism, respectively. In addition, the clinical expert noted that the majority of patients (> 70%) continue to have symptoms of pain, mobility issues, or complications despite treatment. Since active vitamin D may need to be administered twice daily and oral phosphate is usually administered several times per day, adherence may not be optimal.
Place in Therapy
Per the clinical expert consulted by CDA-AMC, burosumab would represent a shift in the current treatment paradigm as it addresses the underlying disease at an upstream level rather than a downstream level. Since burosumab inhibits the action of FGF23, renal TRP would be increased and serum phosphorus levels elevated into the normal range; therefore, oral phosphate therapy should no longer be required. With the reduction in FGF23 action, 1,25(OH)2D synthesis can increase and supplementation should also no longer be required.
The clinical expert noted that mechanistically, burosumab should be used as a first-line treatment by itself and not in combination with other treatments — namely, sodium phosphate and 1,25(OH)2D. For pragmatic reasons, a trial with conventional therapy could be initiated and then burosumab substituted if side effects persist. The expert noted that treatment with burosumab is likely to be lifelong as the cause of the disease remains. It is possible for burosumab to stop working, but this would most likely be due to adherence issues rather than the therapy itself.
Patient Population
The clinical expert noted that symptomatic patients with bone pain due to bone disease (i.e., due to osteomalacia, pseudofractures, and nonunion fractures) are best suited for treatment. Likewise, treatment should likely not be considered in adults who are asymptomatic unless they have asymptomatic fractures detected by radiography. In the expert’s experience, most patients they have met with tended to be symptomatic, although as a rare disease, the overall group of patients is small.
However, the clinical expert also noted that there may be benefit in treating adults with limited symptomatology to increase activity levels and a sense of well-being. In addition, patients with XLH scheduled for an elective orthopedic surgical procedure such as joint replacement might benefit from a course of therapy (either burosumab or phosphate and calcitriol) for 6 months before the procedure to ensure optimal healing of the bone and the secure placement of hardware.
Assessing the Response to Treatment
In clinical practice, a reduction in bone pain, a reduction in fractures, and the healing of fractures would be considered by the clinical expert consulted by CDA-AMC to be clinically meaningful responses to therapy, particularly if they were accompanied by improved motor ability, reduced stiffness, and the improved ability to perform activities of daily living. Laboratory evidence of the normalization of serum phosphate and biomarkers of bone metabolism (e.g., alkaline phosphatase) and the absence of elevations in serum creatinine or PTH as well as the absence of the development or acceleration of nephrocalcinosis would also be important.
Per the clinical expert, several outcomes measured in clinical trials are not routinely used in clinical practice — specifically, standardized measures of osteoarthritis symptoms to determine symptoms and the 6MWT.
Discontinuing Treatment
Per the clinical expert, patients who are experiencing a sustained decline in serum phosphorus levels despite adherence to therapy (suggesting that burosumab treatment is not working) or who develop a severe allergic reaction to burosumab should discontinue therapy. Therapy should be continued if initiated during childhood since the consequences of elevated FGF23 can also be seen in adults. The expert noted that the discontinuation criteria provided in the CADTH recommendation for the pediatric indication (hyperparathyroidism, nephrocalcinosis, or evidence of fracture or pseudofracture based on radiographic assessment)19 would also be reasonable in adults.
Prescribing Considerations
The expert noted that specialist care would be required to diagnose, treat, and monitor patients receiving burosumab — either an endocrinologist or rheumatologist with knowledge of the disorder. The clinical expert acknowledged that patients could also likely be taught to self-administer burosumab.
Clinician Group Input
This section was prepared by the CDA-AMC review team based on the input provided by clinician groups. The full original clinician group input that CDA-AMC received has been included in the Perspectives of Patients, Clinicians, and Drug Programs section of this report.
No input was received by clinician groups by the deadline of the call for input.
Drug Program Input
The drug programs provide input on each drug being reviewed through the CDA-AMC reimbursement review processes by identifying issues that may impact their ability to implement a recommendation. The implementation questions and corresponding responses from the clinical expert consulted by CDA-AMC are summarized in Table 4.
Table 4: Summary of Drug Plan Input and Clinical Expert Response
Drug program implementation questions | Clinical expert response |
|---|---|
Considerations for initiation of therapy | |
The initial recommended initiation criteria for pediatrics from CADTH requires radiographic evidence of rickets with an RSS total score of 2 or greater. Given that rickets is predominately a childhood condition, is the RSS an appropriate tool to evaluate XLH rickets in adults?
|
|
The inclusion criteria of the pivotal trial, CL303, were as follows:
Should any of the aforementioned inclusion criteria in the CL303 trial be used as reimbursement criteria for patients initiating therapy in adulthood? |
|
For patients who either have an insufficient response or are refractory to conventional therapy, what duration of a trial of conventional therapy should be required? |
|
For patients who are undergoing treatment with burosumab for a time-limited period to treat pseudofractures or osteomalacia-related fractures, should they be eligible for re-treatment if they sustain an additional fracture post-treatment? |
|
The sponsor requested reimbursement for patients with the following indications:
Is there evidence that patients with recurrent dental complications of XLH in the absence of the aforementioned manifestations could be considered for a trial with burosumab? |
|
Considerations for continuation or renewal of therapy | |
The current initiation criteria for coverage with burosumab do not contain any specific details about patients with nephrocalcinosis. However, the current renewal criteria for burosumab state that coverage may be renewed in patients already initiated unless any of the following occurs:
If a patient with nephrocalcinosis were to initiate burosumab and, upon renewal, still had this condition, they would not be eligible for renewal of coverage. Is it reasonable to infer that they are not responding to burosumab if they still have nephrocalcinosis? |
|
Considerations for discontinuation of therapy | |
As per the sponsor’s request, the proposed initiation criteria are as follows:
If the main indication of treatment is to reduce pain and improve mobility, should a time-limited trial of burosumab be considered (i.e., 1 year)? |
|
If the main indication of treatment is for pseudofractures or osteomalacia-related fractures, what is an appropriate duration of trial of burosumab to assess benefit? |
|
The initial CADTH recommended discontinuation criteria for burosumab in adults is the following: “In adolescent or adult patients who initiated burosumab based on the aforementioned criteria for pediatric patients, burosumab should be discontinued if any of the following occur: hyperparathyroidism, nephrocalcinosis, or evidence of fracture or pseudofracture based on radiographic assessment.” Should burosumab be continued in adolescent and adult patients who initiated it as pediatric patients? |
|
Care provision issues | |
Are there side effects with long-term continuous treatment with burosumab that should be monitored for? |
|
BPI = Brief Pain Inventory; LLN = lower limit of normal; RSS = Rickets Severity Scale; TmP/GFR = ratio of renal tubular maximum phosphate reabsorption rate to glomerular filtration rate; XLH = X-linked hypophosphatemia.
Clinical Evidence
The objective of the CDA-AMC Clinical Review Report is to review and critically appraise the clinical evidence submitted by the sponsor on the beneficial and harmful effects of burosumab 10 mg/mL, 20 mg/mL, and 30 mg/mL for SC administration in the treatment of XLH in adults. The focus has been placed on comparing burosumab to relevant comparators and identifying gaps in the current evidence.
A summary of the clinical evidence included by the sponsor in the reassessment of burosumab for adults with XLH is presented in 3 sections with the CDA-AMC critical appraisal of the evidence included at the end of each section. The first section, the systematic review, includes pivotal studies and RCTs that were selected according to the sponsor’s systematic review protocol. The second section includes a sponsor-submitted LTE study. The third section includes an additional study that was considered by the sponsor to address important gaps in the systematic review evidence.
Included Studies
Clinical evidence from the following are included in the CDA-AMC review and appraised in this document:
One pivotal RCT (the CL303 study) identified in the systematic review
One LTE study
One additional study addressing gaps in the evidence.
Systematic Review
Content in this section has been informed by materials submitted by the sponsor. The following has been summarized and validated by the CDA-AMC review team.
Description of Studies
Characteristics of the included studies are summarized in Table 5.
Table 5: Details of Studies Included in the Systematic Review
Detail | CL303 study |
|---|---|
Designs and populations | |
Study design | Phase III, double-blind, placebo-controlled RCT (24 weeks) with 2 open-label extensions (up to 96 weeks) |
Locations | France, Ireland, Italy, Japan, South Korea, the UK, and the US |
Patient enrolment dates | Start date: October 22, 2015 End date: December 6, 2018 |
Randomized (N) | 134 patients (66 patients randomized to placebo and 68 patients randomized to burosumab) |
Inclusion criteria |
|
Exclusion criteria |
|
Drugs | |
Intervention | Burosumab administered subcutaneously at 1 mg/kg (rounded to the nearest 10 mg) every 4 weeks |
Comparator | Matched placebo solution administered subcutaneously every 4 weeks |
Study duration | |
Screening phase | 2 screening visits, the second a minimum of 14 days after oral phosphate and vitamin D metabolite treatment was stopped |
Treatment phase | 24 weeks (double-blind, placebo-controlled) |
Follow-up phases |
|
Outcomes | |
Primary end point | Proportion of patients attaining mean serum phosphorus levels above the LLN (0.81 mmol/L) |
Secondary and exploratory end points | Secondary end points:
Exploratory end points:
|
Publication status | |
Publications | |
1,25(OH)2D = 1,25-dihydroxyvitamin D; 6MWT = 6-minute walk test; BALP = bone-specific alkaline phosphatase; BFI = Brief Fatigue Inventory; BPI = Brief Pain Inventory; GFR = glomerular filtration rate; LLN = lower limit of normal; LTE = long-term extension; PTH = parathyroid hormone; RCT = randomized controlled trial; TmP/GFR = ratio of renal tubular maximum phosphate reabsorption rate to glomerular filtration rate; TRP = tubular reabsorption of phosphate; ULN = upper limit of normal; WOMAC = Western Ontario and McMaster Universities Osteoarthritis Index; XLH = X-linked hypophosphatemia.
Sources: Sponsor’s Summary of Clinical Evidence23 and the CL303 Clinical Study Report.20
The CL303 study20 was a randomized, double-blind, placebo-controlled, multicentre phase III study evaluating the safety and efficacy of burosumab in adult patients with XLH. A total of 163 patients were screened; 134 patients were enrolled in the study and randomized in a 1:1 ratio to receive burosumab or placebo. The most common reason for not advancing past screening was that patients did not meet the minimum pain level in the inclusion criteria (N = 10 patients). Randomization was stratified based on region (North America, the European Union, Japan, and South Korea) and was also planned to be stratified on pain intensity using the BPI worst pain scores (less than or equal to 6 or greater than 6 at the first screening visit). Due to stratification misclassification, 97 patients and 37 patients were randomized according to their BPI average pain scores of less than or equal to 6 and greater than 6, respectively. A total of 44 patients and 90 patients were randomized per the planned stratification of BPI worst pain less than or equal to 6 and greater than 6, respectively. The submission investigated the consequences of the misclassification and due to the high correlation between worst pain and average pain scores, it judged the impact to be minimal; analyses were done using the actual randomization strata. There were no study sites in Canada.
Patients randomized to burosumab received 1 mg/kg (rounded to the nearest 10 mg) or placebo administered subcutaneously every 4 weeks (28 days) for 24 weeks. After completing the week 24 visit, patients randomized to placebo crossed over into a treatment continuation phase to receive open-label burosumab 1 mg/kg (rounded to the nearest 10 mg) subcutaneously every 4 weeks (28 days) until week 48. During the placebo-controlled period, patients had clinic and/or home health visits at 2-week intervals beginning at baseline, plus visits at week 1 and week 21; the window for visits was plus or minus 3 days. During the treatment continuation and extension periods, patients had clinic and/or home visits at 2-week or 4-week intervals, plus or minus 5 days.
All patients and investigators remained blinded to the original double-blind treatment assignments until week 48 analyses were completed. All patients continued burosumab treatment on the same dosing regimen in the treatment continuation and extension phases. Analyses up until week 96 were included in the CL303 study as part of the systematic review; results from the CL303 study participants who continued, plus participants from another study, CL304, who continued up until treatment extension II were reported as part of the LTE study section. Full details of the overall study design are in Figure 1.
Figure 1: Study Design for CL303 Trial
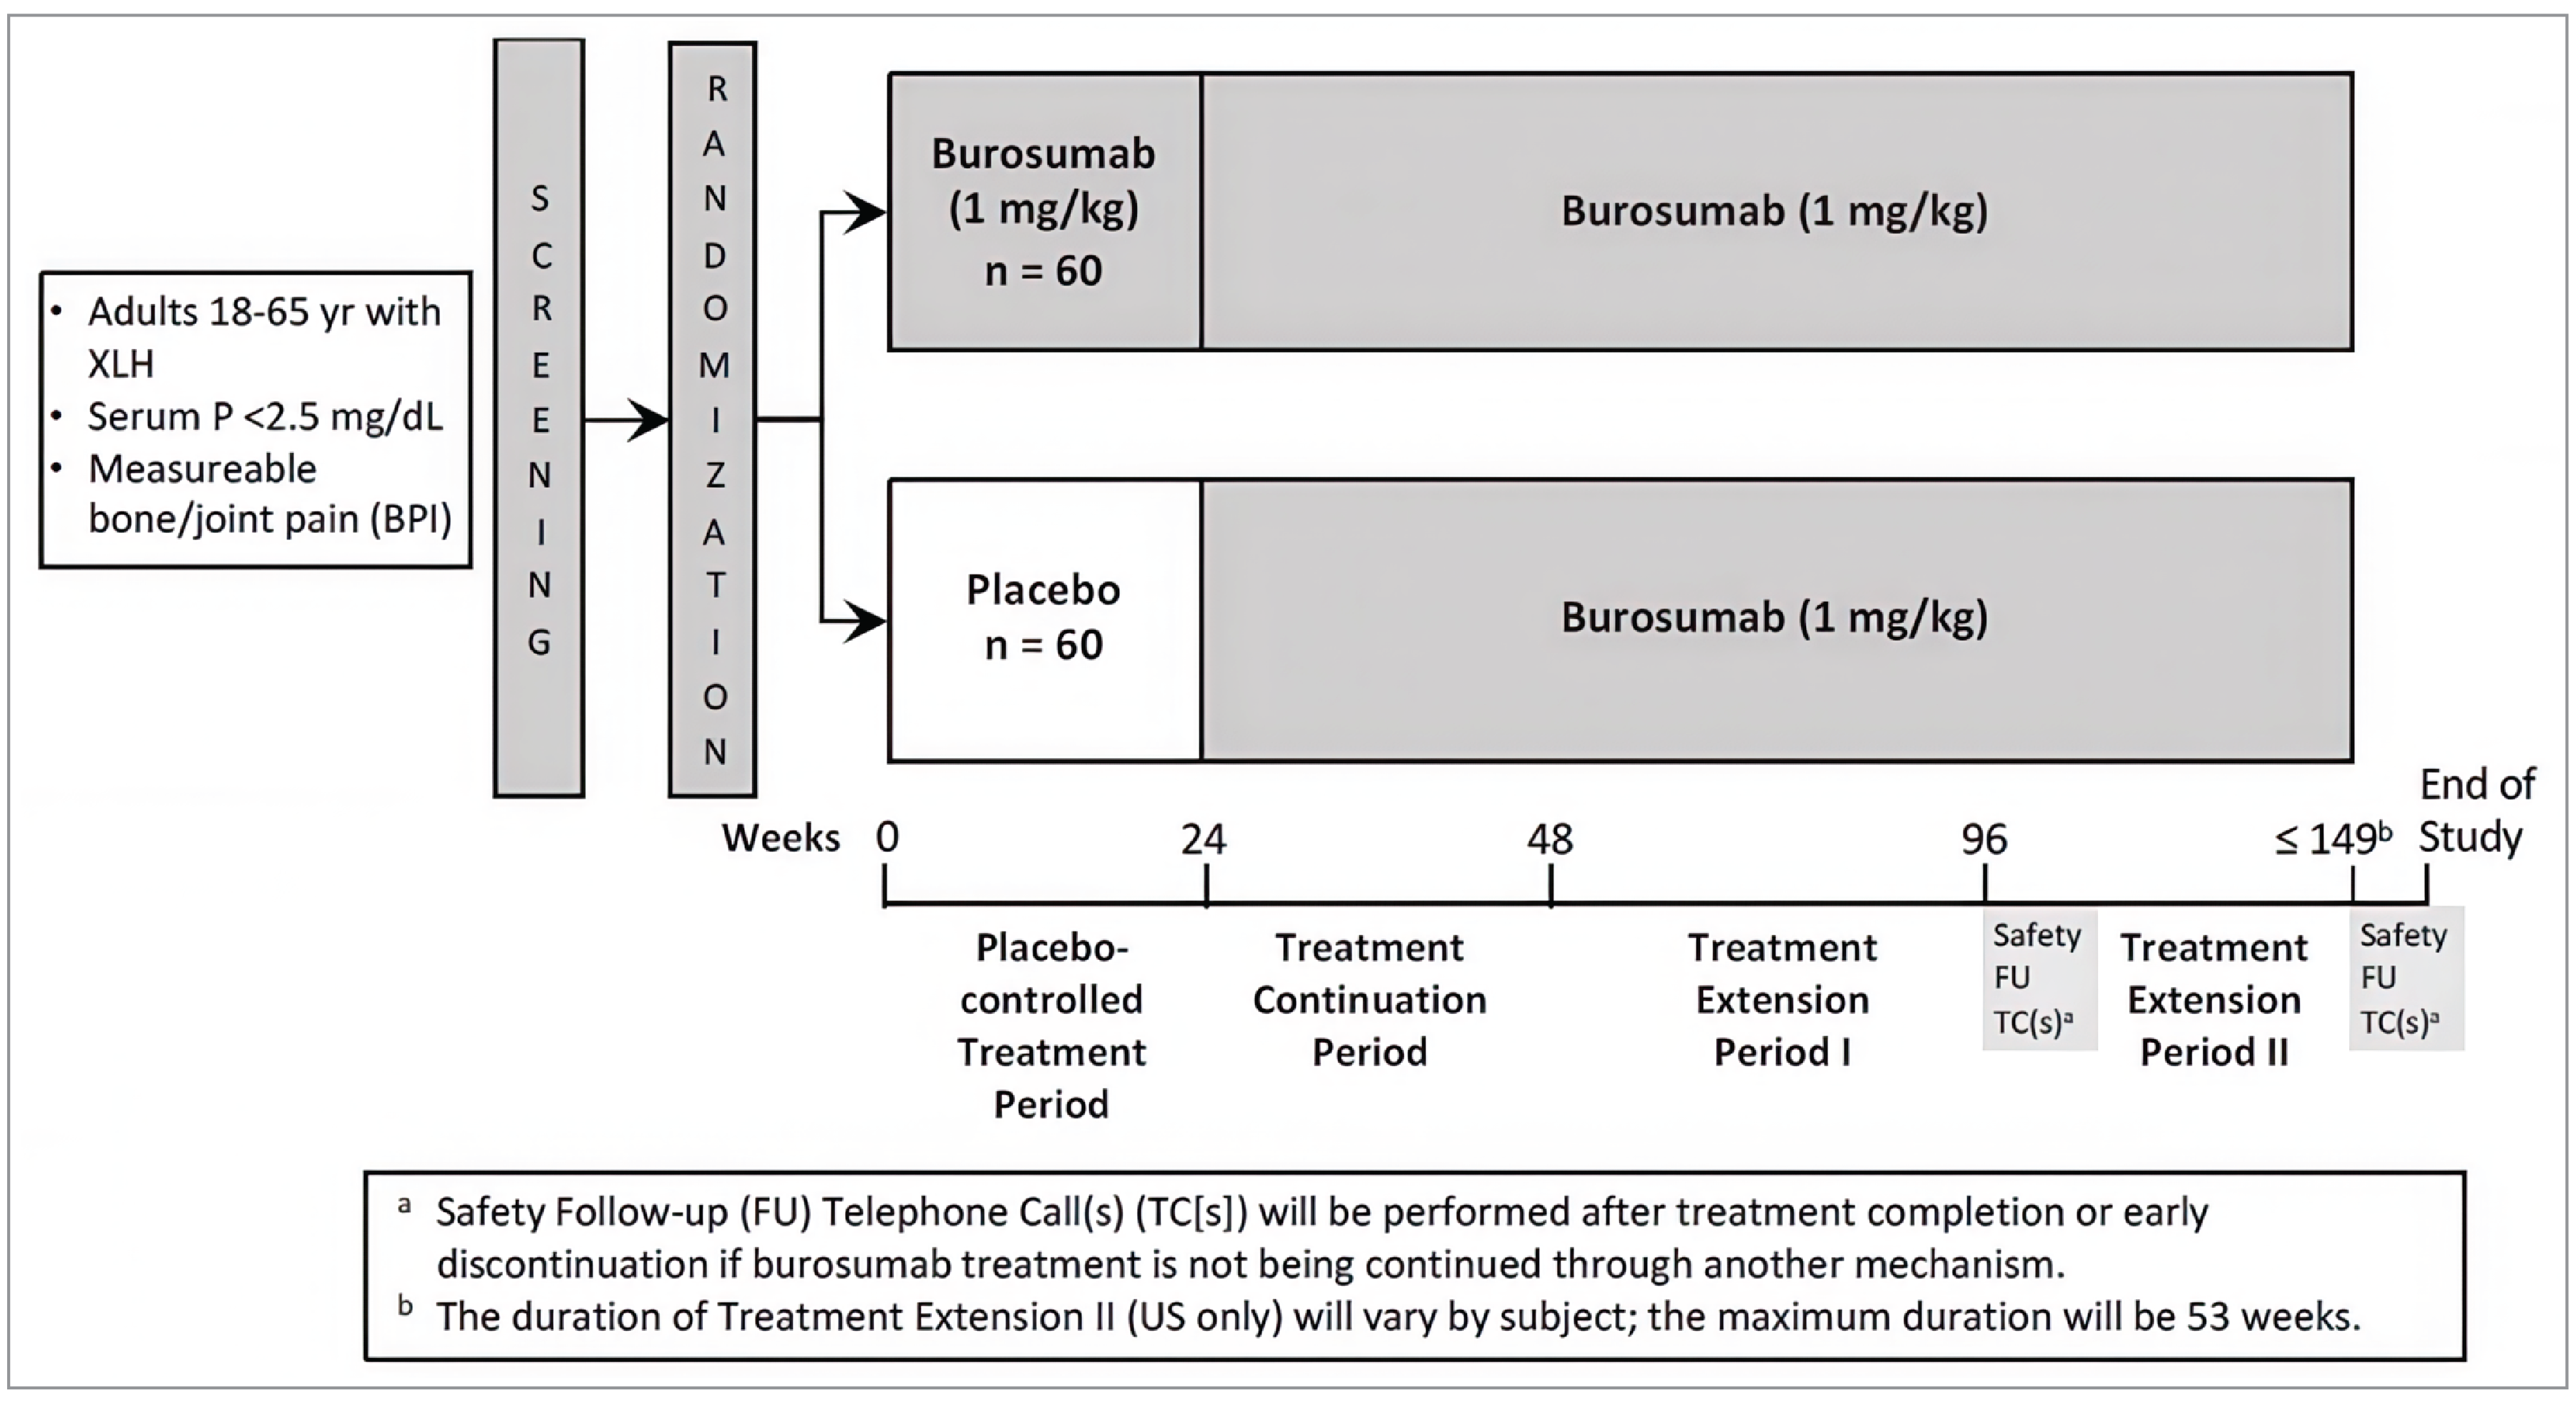
BPI = Brief Pain Inventory; FU = follow-up; P = phosphorus; TC = telephone call; XLH = X-linked hypophosphatemia.
Source: Sponsor’s Summary of Clinical Evidence.23
Populations
Inclusion and Exclusion Criteria
The study population consisted of adult patients aged between 18 years and 65 years with a minimum threshold of bone or joint pain at baseline and a diagnosis of XLH, defined as clinical and biochemical features consistent with XLH and/or a confirmed PHEX mutation (self or a family member consistent with X-linked inheritance). If patients were receiving chronic pain medications, they had to have been on a stable regimen for at least 21 days before screening and be willing to maintain medications at the same stable dose (a maximum of 60 mg oral morphine equivalents per day). There were no specific inclusion criteria for previous treatment patterns before study enrolment, but patients had to discontinue any conventional therapies between the screening visit and randomization (a 2-week washout period). Per the exclusion criteria, patients would have had to have an absence of, or control over, calcium and parathyroid-related complications, as well as no recent treatments that could impact bone metabolism and no planned surgeries.
Interventions
Both placebo and burosumab solutions had the same composition, apart from the presence of the active ingredient, and were supplied as a sterile, clear, colourless, preservative-free solution in single-use, 5 mL vials. The burosumab vials contained 1 mL of burosumab at a concentration of 30 mg/mL, and the placebo vials contained 1 mL of placebo. Both interventions were prepared and administered in the same manner; trained personnel at study sites administered the study drug by SC injection every 28 days into the abdomen, upper arms, or thighs, rotating injection sites with each administration. A maximum of 1.5 mL was administered in any 1 site, and if a larger volume were required, it was administered in multiple sites.
For patients randomized to burosumab, the dose was calculated based on baseline body weight up to a maximum dose of 90 mg, and remained fixed for the duration of the study provided that serum phosphorus levels did not exceed 5.0 mg/dL at any time or 4.5 mL/dL on 2 occasions, and body weight did not change by more than 20%. If serum phosphorus increased to more than 5.0 mg/dL at any time, the patient treatment assignment was unblinded to the investigator (if this occurred during the placebo-controlled treatment period) and the dose of burosumab was decreased by half. If serum phosphorus increased above the ULN (4.5 mg/dL) but did not exceed 5.0 mg/dL, the patient treatment assignment was unblinded (if this occurred during the placebo-controlled treatment period) and the dose of burosumab decreased by half only if a second phosphorus result exceeded the ULN. Following a downward dose adjustment, the investigator, together with the sponsor’s medical monitor, determined if, when, and how to titrate the dose upward.
If at any time during the study a patient did not receive a dose within 21 days of a scheduled dose, that dose was skipped and the next dose administered at the next scheduled dosing visit. Doses were administered no fewer than 14 days apart.
Throughout the study, a patient's diet or medication schedule was not to change significantly unless medically indicated. Investigators could prescribe any concomitant medications or treatments deemed necessary to provide adequate supportive care except for those specified as prohibited medications: pharmacologic vitamin D metabolites or analogues, oral phosphate, aluminum hydroxide antacids, acetazolamides, thiazides, bisphosphonate therapy, denosumab therapy, teriparatide therapy, chronic use of systemic corticosteroids, PTH suppressors, and any other monoclonal antibody therapy. Oral supplementation of 1,25(OH)2D could be provided if serum levels decreased to less than 20 ng/mL. Nonsteroidal anti-inflammatory drugs, opioids, or other narcotic pain medications were permitted, being limited to 60 mg oral morphine equivalents per day. Pain medication use (prescription and over the counter) was recorded by patients in a pain medication diary for 7 consecutive days before the baseline visit and visits at week 12, week 24, week 36, and week 48. Concomitant therapies and medications were reviewed and recorded in the patient electronic Clinical Report Form at each study visit and during home health visits, as applicable. Patients were required to maintain any chronic pain medication(s) at a stable dose(s) and schedule through the placebo-controlled period (up to week 24); this requirement did not apply for subsequent treatment periods.
Outcomes
A list of efficacy end points assessed in this Clinical Review Report is provided in Table 6, followed by descriptions of the outcome measures. Summarized end points are based on outcomes included in the sponsor’s Summary of Clinical Evidence23 as well as any outcomes identified as important to this review according to the clinical expert consulted by CDA-AMC and input from patient and clinician groups and public drug plans. Using the same considerations, the CDA-AMC review team select end points that were deemed to be most relevant to inform the CDA-AMC expert committee deliberations and finalized this list of end points in consultation with members of the expert committee.
The proportion of patients attaining serum phosphorus levels above the LLN (0.81 mmol/L) at the midpoint of the dosing cycle (i.e., when serum levels of burosumab are at their peak) was the primary outcome of the study. The clinical expert consulted by CDA-AMC confirmed that this outcome is a surrogate for clinical outcomes in XLH and an efficacy end point as burosumab’s mechanism of action equalizes serum phosphorus.
Key secondary end points and secondary end points were PRO measures of pain, fatigue, stiffness, and physical function. The key secondary end points were measured at 24 weeks and included change in the BPI worst pain score, and WOMAC stiffness and WOMAC physical function scores. Other secondary end points included domains of the BPI, WOMAC, and BFI. The clinical expert consulted by CDA-AMC noted that these PRO measures are not commonly used in routine clinical practice. PROs at each visit were summarized, analyzed, and reported at week 24, week 48, and week 96 as secondary outcomes.
The proportion of patients attaining serum phosphorus levels greater than the LLN at the end of their dosing cycle (i.e., 4 weeks after dosing) was also a secondary end point as were measures of bone metabolism (BALP), serum 1,25(OH)2D, and phosphorus homeostasis (TmP/GFR and TRP). The clinical expert consulted by CDA-AMC noted that these serum biomarkers are important outcomes to measure in XLH management.
Exploratory end points were active pseudofractures and/or fractures, as well as the 6MWT. The clinical expert noted that pseudofractures and fractures were important efficacy outcomes, but that the 6MWT was not routinely used in clinical practice.
Table 6: Efficacy Outcomes Summarized From CL303 Study
Outcome measure | Time point | CL303 study |
|---|---|---|
Proportion of patients attaining mean serum phosphorus levels above the LLN (0.81 mmol/L) at the midpoint of the dose interval (i.e., week 2, week 6, week 10, week 14, week 18, and week 22) | Averaged across dose cycles between baseline and week 24 | Primarya |
Proportion of patients attaining mean serum phosphorus levels above the LLN at the end of the dose cycle (4 weeks after dosing) | Averaged across dose cycles | Secondary |
Change from baseline to week 24 in BPI worst pain score | At week 24 | Key secondarya |
Change from baseline to week 24 in WOMAC stiffness score | At week 24 | Key secondarya |
Change from baseline to week 24 in WOMAC physical function score | At week 24 | Key secondarya |
Change from baseline to postbaseline visits in BPI worst pain, pain severity, and pain interference scores | Each visit | Secondary |
Change from baseline to postbaseline visits in WOMAC stiffness and physical function scores | Each visit | Secondary |
Change and percentage change from baseline to postbaseline visits in serum phosphorus, serum 1,25(OH)2D, urinary phosphorus, TmP/GFR, and TRP | Each visit | Secondary |
Change and percentage change from baseline to postbaseline visits in biochemical markers of bone remodelling (BALP) | Each visit | Secondary |
Change from baseline to postbaseline visits in BFI worst fatigue and global fatigue scores | Each visit | Secondary |
Active pseudofractures and/or fractures from baseline that had healed, had partially healed, were unchanged, or had worsened at postbaseline visits | Each visit | Exploratory |
Change from baseline to postbaseline visits in 6MWT total distance | Each visit | Exploratory |
1,25(OH)2D = 1,25-dihydroxyvitamin D; 6MWT = 6-minute walk test; BALP = bone-specific alkaline phosphatase; BFI = Brief Fatigue Inventory; BPI = Brief Pain Inventory; LLN = lower limit of normal; TmP/GFR = ratio of renal tubular maximum phosphate reabsorption rate to glomerular filtration rate; TRP = tubular reabsorption of phosphate; WOMAC = Western Ontario and McMaster Universities Osteoarthritis Index.
aStatistical testing for these end points was adjusted for multiple comparisons (e.g., hierarchical testing) at the 24-week mark of the trial.
Source: Sponsor’s Summary of Clinical Evidence.23
Detailed Outcome Descriptions
A summary of the PROs measured in the study can be found in Table 7, followed by detailed descriptions of all outcomes. Briefly, the submission supplied MCIDs for the BPI and WOMAC scores, which were validated by the sponsor using data from 3 studies in patients with XLH as a source: the UX023-CL001 study (a cross-sectional survey of adults with XLH [N = 201 patients]),25 the UX023-CL203 study (a phase II trial in adults with XLH [N = 20 patients]),25 and the CL303 study (the pivotal trial in this submission [N = 134 patients]).20 MCIDs for the BFI were also provided by the sponsor using the CL303 trial alone as a data source.25 The MCID for the 6MWT came from assessment in a hypophosphatasia population and was not provided by the sponsor.
Table 7: Summary of PRO Measures and Their Measurement Properties
Outcome measure | Type | Conclusions about measurement properties | MCID |
|---|---|---|---|
BPI | Self-reported, 11-item instrument for assessing pain intensity (4 items) and pain interference (7 items) with daily living.42 Numeric rating scales from 0 to 10 are used, with 0 representing “no pain” and 10 representing “pain as bad as you can imagine” for pain intensity, and 0 (no interference) and 10 (complete interference) for pain interference. The scores for the 2 subscales are calculated using the mean of their corresponding items’ scores.43,44 | Validity: Although originally developed for evaluation of breast, prostate, colon, rectum, or gynecologic cancer pain, it has been shown to be a valid instrument (e.g., in terms of construct, convergent, and discriminative validity) for the evaluation of nonmalignant chronic pain (e.g., low back pain, osteoarthritis, rheumatoid arthritis, multiple sclerosis) across various languages. It is also commonly used for nonmalignant pain.43,44 Reliability: It has shown to be reliable in terms of internal consistency and test-retest reliability.43,44 | Change from baseline based on data from the CL303 study: ≥ –1.72 points for worst pain (average and greatest) and ≥ –1.0 points for pain interference45 |
WOMAC | Self-administered questionnaire assessing pain, stiffness, and physical functioning in patients with hip and knee osteoarthritis. It consists of 24 items divided into 3 subscales:46,47 pain (5 items), stiffness (2 items), and physical function (17 items). There are 2 scale formats: a 10 cm VAS and a 5-point Likert scale. The 2 formats were found to be highly correlated and to yield similar precision for discriminating treatments in patients with osteoarthritis.48 The Likert version was used in the CL303 trial. It is rated on an ordinal scale of 0 to 4, where 0 means the lowest level of symptoms or physical disability. Each of the pain, stiffness, and physical function subscales is summated to a maximum score of 20, 8, and 68, respectively, providing a maximum global score of 96 (the sum of the 3 subscales).49 Higher scores on the WOMAC tool indicate worse pain, stiffness, and functional limitations. | Validity: It is a valid, reliable, and responsive measure of outcome in knee osteoarthritis,46,50,51 and has been widely used in other painful musculoskeletal disorders, such as lower back pain, rheumatoid arthritis, systemic lupus erythematosus, and fibromyalgia.12 One study suggests that WOMAC has acceptable face and content validity in the adult XLH population.12 Another study that enrolled adult patients with XLH also tested the scale discriminant validity and convergent-divergent validity and supported the use of WOMAC in this study population.52 | Change from baseline: ≥ –10 points for total score, ≥ –8 points for physical function, ≥ –10 points for stiffness, and ≥ –11 points for pain53 |
BFI | Self-reported, 9-item questionnaire to assess the severity and impact of fatigue on daily functioning. Two dimensions are measured: fatigue (3 items) and the interference of fatigue on daily life (6 items pertaining to general activity, mood, walking ability, normal work, relations with others, and enjoyment of life). The BFI is measured on a 0 to 10 numeric rating scale. For the dimension of fatigue severity, 0 represents “no fatigue” and 10 represents “fatigue as bad as you can imagine.” For the dimension of interference from fatigue, 0 represents “does not interfere” and 10 represents “completely interferes.” A score of 7 to 10 is considered severe fatigue.22,24 A global fatigue score can be obtained by averaging all the items on the BFI.54 | Validity: Validated and used in patients with various conditions, including cancer, osteoarthritis, and rheumatoid arthritis.12 The construct validity, concurrent validity, and discriminant validity of BFI have been demonstrated in cancer patients. Reliability: The reliability of the BFI was assessed based on 1 study that included 305 adult patients with cancer (coefficient alphas were 0.95 to 0.96).22 | Change from baseline based on data from the CL303 study: ≥ –1.5 points for worst fatigue (average and greatest), ≥ –1.2 points for global fatigue, and ≥ –1.2 points for fatigue interference.39,55 |
6MWT | The 6MWT is a supervised test that measures the distance a patient can walk on a hard, flat surface over a 6-minute period.56 A specific protocol outlining training, the level of support provided to the patient, and standardization of the distance available for the patient to walk (30 m) is provided by the American Thoracic Society.56 | Validity: Used and validated in multiple adult patient populations with cardiopulmonary conditions (e.g., heart failure, chronic obstructive pulmonary disease, pulmonary hypertension).56 The reliability and validity of the 6MWT were evaluated in 24 patients with hypophosphatasia.57 Reliability: The test-retest reliability was high for children, adolescents, and adults (i.e., Pearson correlation coefficients ranged from 0.81 to 0.95).57 | MCIDs for patients with hypophosphatasia were estimated using distribution-based methods (31 m for children and adults and 43 m for adolescents).57 Reported distances associated with a noticeable functional improvement range from 54 m in patients with stable chronic obstructive pulmonary disease and 43 m in patients with heart failure.56 |
6MWT = 6-minute walk test; BFI = Brief Fatigue Inventory; BPI = Brief Pain Inventory; MCID = minimal clinically important difference; PRO = patient-reported outcome; VAS = visual analogue scale; WOMAC = Western Ontario and McMaster Universities Osteoarthritis Index.
Proportion of Patients With Serum Phosphorus Levels Greater Than LLN
The level of serum phosphorus was selected as an outcome based on the mechanism of action of burosumab inhibiting FGF23, which plays a role in regulating serum phosphorus. Per the clinical expert, the proportion of patients attaining serum phosphorus levels greater than LLN at the midpoint of the dosing cycle determines the efficacy when the burosumab dose effect is maximal, and the proportion of patients attaining serum phosphorus levels greater than LLN at the end of the dosing cycle determines efficacy when the burosumab dose effect is at its minimum level due to its biological half-life.
Serum phosphorus was analyzed by the local laboratory at screening visit 1 and screening visit 2 for eligibility, and by the central laboratory at all other indicated time points.
Brief Pain Inventory
The BPI is a self-reported questionnaire designed to provide information about pain intensity (the sensory dimension, 4 items) and the degree to which pain interferes with daily living (the reactive dimension, 7 items). It is recommended by the Initiative on Methods, Measurement, and Pain Assessment in Clinical Trials as a core outcome measure of pain.42 Four items assess a patient’s pain intensity — at its worst intensity in the last 24 hours, at its least intensity in the last 24 hours, average pain, and pain right now — using a 0 to 10 numeric rating scale, with 0 representing “no pain” and 10 representing “pain as bad as you can imagine.” For the 7 items assessing pain interference with functioning, patients are asked to rate how their pain interferes with 7 life domains, including general activity, mood, walking ability, normal work, relations with others, sleep, and enjoyment of life, on a similar numeric rating scale. The anchor points in each item of the interference scale are 0 (no interference) and 10 (complete interference). The scores for the 2 BPI subscales (pain intensity and pain interference) range from 0 to 10 and are calculated using the means of their corresponding items’ scores.
The total BPI score is the mean of the 2 subscale scores. A high score represents a high pain intensity or pain interference. Although originally developed for the evaluation of breast, prostate, colon, rectum, or gynecologic cancer pain, it has also been shown to be a reliable and valid instrument for the evaluation of nonmalignant chronic pain (e.g., low back pain, osteoarthritis, rheumatoid arthritis, multiple sclerosis) across various languages. It is also commonly used for nonmalignant pain.43,44
Patients recorded responses to the 4 questions of the BPI pain severity dimension (worst, least, average, and now) in a paper diary for the week preceding the baseline and week 12, week 24, week 36, and week 48 visits. The modified short-form BPI was administered at baseline and at week 12, week 24, week 36, week 48, week 72, and week 96.
Western Ontario and McMaster Universities Osteoarthritis Index
WOMAC is a self-administered questionnaire assessing pain, stiffness, and physical functioning in patients with hip and knee osteoarthritis. It is a valid, reliable, and responsive measure of outcome in knee osteoarthritis46,50,51 and has been widely used in other painful musculoskeletal disorders, such as lower back pain, rheumatoid arthritis, systemic lupus erythematosus, and fibromyalgia.12 WOMAC consists of 24 items divided into 3 subscales:47
pain (5 items) — during walking, using stairs, in bed, sitting or lying, and standing upright
stiffness (2 items) — after first waking and later in the day
physical function (17 items) — using stairs, rising from sitting, standing, bending, walking, getting in and out of a car, shopping, putting on and taking off socks, rising from bed, lying in bed, getting into and out of a bath, sitting, getting on and off a toilet, heavy domestic duties, and light domestic duties.
There are 2 scale formats for WOMAC: a 10 cm visual analogue scale and a 5-point Likert scale. The 2 formats were found to be highly correlated and to yield similar precision for discriminating treatments in patients with osteoarthritis.48 The Likert version of WOMAC was used in the CL303 study. It is rated on an ordinal scale of 0 to 4, where 0 means the lowest level of symptoms or physical disability. Each subscale is summated to a maximum score of 20, 8, and 68 for pain, stiffness, and physical function, respectively, providing a maximum global score of 96 (the sum of the 3 subscales).52 Higher scores on WOMAC indicate worse pain, stiffness, and functional limitations.
One study suggests that the WOMAC tool has acceptable face and content validity in the adult XLH population.12 Another study that enrolled adult patients with XLH also tested the scale discriminant validity and convergent-divergent validity and supported the use of WOMAC in this study population.52
The WOMAC tool was administered at baseline and week 12, week 24, week 36, week 48, week 72, and week 96.
Brief Fatigue Inventory
The BFI is a self-reported questionnaire to assess the severity of fatigue and the impact of fatigue on daily functioning. Two dimensions are measured in this 9-item instrument: fatigue (3 items) and the interference of fatigue on daily life (6 items pertaining to general activity, mood, walking ability, normal work, relations with others, and enjoyment of life). The items are measured on a 0 to 10 numeric rating scale. For the dimension of severity of fatigue, 0 represents “no fatigue” and 10 represents “fatigue as bad as you can imagine.” For the dimension of interference from fatigue, 0 represents “does not interfere” and 10 represents “completely interferes.” A score of 7 to 10 is considered severe fatigue.22 A global fatigue score can be obtained by averaging all the items on the BFI.54
The BFI has been validated and used in patients with various conditions, including cancer, osteoarthritis, and rheumatoid arthritis.20,22 The construct validity, concurrent validity, and discriminant validity of BFI have been demonstrated in cancer patients. Reliability of the BFI was assessed based on 1 study that included 305 adult patients with cancer (coefficient alphas were 0.95 to 0.96).22
Patients recorded responses to the 3 questions of the BFI fatigue dimension (now, as usual, and at its worst) in a paper diary for the week preceding the baseline visit and the week 12, week 24, week 36, and week 48 visits. The complete BFI was administered at baseline and at week 12, week 24, week 36, week 48, week 72, and week 96.
Change in 1,25(OH)2D, Serum Phosphorus, Urinary Phosphorus, TmP/GFR, and TRP
Samples for these serum and urinary markers were generally collected following a minimum overnight fasting time of 8 hours and before study drug administration (if applicable); 2-hour fasting urine samples were used for select measurements. Local laboratory analyses were performed at screening visit 1 and screening visit 2, and all other analyses were performed at a central laboratory. Two-hour fasting urine collection was required to calculate TmP/GFR and TRP using simultaneously measured urine and blood creatinine and phosphorus concentrations. Both 2-hour and 24-hour urine were used for measurements of urinary phosphorus, creatinine, and calcium.
Change in BALP
Samples for serum and urinary markers were generally collected following a minimum overnight fasting time of 8 hours and before study drug administration (if applicable). Local laboratory analyses were performed at screening visit 1 and screening visit 2, and all other analyses were performed at a central laboratory.
6-Minute Walk Test
The 6MWT is a supervised test that measures the distance a patient can walk on a hard, flat surface over a 6-minute period.56 A specific protocol outlining training, level of support provided to the patient, and standardization of distance available for the patient to walk (30 m) is provided by the American Thoracic Society.56
The 6MWT has been used and validated in multiple adult patient populations with cardiopulmonary conditions (e.g., heart failure, chronic obstructive pulmonary disease, pulmonary hypertension).56 Multiple studies have also established a proposed MCID in these populations. Reported distances associated with a noticeable functional improvement range from 54 m in patients with stable chronic obstructive pulmonary disease and 43 m in patients with heart failure.56 Initial improvements in 6MWT results should be interpreted with caution, given that there has been a well-documented learning effect in patients previously unfamiliar with the test.58 Motivation, encouragement, and co-operation can have a significant positive impact on the results, and the magnitude of these effects could be comparable to the effect of interventions.59,60 This could be of special concern in situations where blinding is not present or is compromised, particularly when no comparator arm is available. Age, height, and weight of children can impact the results, although this may be less of a concern for adult patients who are not actively growing.
The reliability and validity of the 6MWT were evaluated in 24 patients with hypophosphatasia. The test-retest reliability was high for children, adolescents, and adults (i.e., Pearson correlation coefficients ranged from 0.81 to 0.95).57 MCIDs for patients with hypophosphatasia were estimated using distribution-based methods (31 m for children and adults and 43 m for adolescents).57
The 6MWT was administered at study visit 1 for practice purposes to minimize training effects. For patients unable to complete the 6MWT at screening, the test was not performed during the study. The 6MWT was also administered at baseline and at week 12, week 24, week 36, week 48, week 72, and, if applicable, every 24 weeks during the treatment extension period, and at the end of the LTE phase. Assistive devices could be used, with any use noted on the clinical report form.
Active Pseudofractures and/or Fractures
A radiographic skeletal survey was conducted at the baseline visit to determine the number and subsequent healing or resolution of current pseudofractures and fractures, as well as progression of enthesopathy. Standard radiographs were obtained of the chest, lateral spine, right and left hand and wrist, right and left humerus, right and left radius and ulna, right and left femur and pelvis, right and left tibia and fibula, and right and left foot. Targeted radiography at locations predetermined by the skeletal survey as areas with active pseudofractures or fractures was performed starting at week 12, week 24, week 36, and week 48 to monitor the frequency and healing of fractures and/or pseudofractures. During the treatment extension periods (week 48 to week 96, and the LTE phase), targeted X-rays were only performed at clinic visits if indicated to follow healing of any newly diagnosed fractures.
Postbaseline radiographs were compared with baseline radiographs using a predefined list of abnormalities by a trained central reader who was blinded to treatment assignment. Existing and new pseudofractures and fractures were graded as either healed, partially healed, or fully healed.
Statistical Analysis
A summary of the analysis methods, sensitivity analyses, and missing data methodology for the outcomes in the CL303 study can be found in Table 8, followed by a detailed description of the statistical analysis.
Table 8: Statistical Analysis of Efficacy End Points From CL303 Study
End point | Statistical model | Adjustment factors | Handling of missing data | Sensitivity analyses |
|---|---|---|---|---|
Primary outcome | ||||
Proportion of patients attaining mean serum phosphorus levels above the LLN (0.81 mmol/L) at the midpoint of the dose interval |
|
| Missing data were treated as missing. | Subgroup analyses (BPI average pain, BPI worst pain, region, sex, and race) |
Key secondary outcomes | ||||
Change from baseline to week 24 in BPI worst pain score | GEE repeated measures analysis |
| Missing data were treated as missing. |
|
Change from baseline to week 24 in WOMAC stiffness score | GEE repeated measures analysis |
| Missing data were treated as missing. |
|
Change from baseline to week 24 in WOMAC physical function score | GEE repeated measures analysis |
| Missing data were treated as missing. |
|
Secondary outcomes | ||||
All secondary outcomes | GEE repeated measures analysis |
| Missing data were treated as missing. | NR |
Exploratory outcomes | ||||
Active pseudofractures and/or fractures from baseline that had healed, had partially healed, were unchanged, or had worsened at postbaseline visits | Descriptive summary | NR | NR | NR |
Change from baseline to postbaseline visits in 6MWT total distance and percentage predicted distance |
| NR | NR | NR |
6MWT = 6-minute walk test; BOCF = baseline observation carried forward; BPI = Brief Pain Inventory; CMH = Cochran-Mantel-Haenszel; GEE = generalized estimating equation; LLN = lower limit of normal; LOCF = last observation carried forward; mBOCF = modified baseline observation carried forward; NR = not reported; vs. = versus; WOMAC = Western Ontario and McMaster Universities Osteoarthritis Index.
aGEE estimates are from a GEE model that includes the change from baseline for the 6MWT end point as the dependent variable and region, visit, treatment, actual randomization stratification, and treatment-by-visit as fixed factors, the baseline of each 6MWT as a covariate, and compound symmetry covariance structure.
Sources: Sponsor’s Summary of Clinical Evidence23 and the CL303 Clinical Study Report.20
Statistical Tests and Models
The primary outcome was analyzed using a Cochran-Mantel-Haenszel test to compare the percentages of patients in the burosumab and placebo groups who attained a serum phosphorus level above the LLN (0.81 mmol/L) at the midpoint of the dosing interval, as averaged across dose cycles between baseline and week 24, controlling for BPI average pain score and geographic region. The primary end point was tested at the 2-sided alpha level of 0.05. Descriptive analyses were performed for the changes to week 48 and week 96.
Key secondary outcomes and secondary outcomes were analyzed at a 2-sided alpha level of 0.05 using generalized estimating equation (GEE) linear regression models. They included treatment, BPI average pain randomization stratification factors (except for the BPI worst pain outcome), region, visit, and interaction of treatment-by-visit as fixed factors, and was adjusted for baseline measurement. The models employed a compound symmetry covariance structure, which specified constant variance for assessments and constant covariance between assessments over time. In general, the P value for testing the statistical significance between the 2 treatment groups was provided for the change from baseline to week 24. Type III tests for the LSMs were used for the statistical comparison and 95% CIs also were reported.
To control the familywise error rate at the 0.05 level, a hierarchical testing procedure was used for the primary and key secondary efficacy end points. First, if the primary efficacy end point was statistically significant (i.e., the burosumab group was superior to the placebo group [P value < 0.05 by a 2-sided test]), then the 3 key secondary end points were tested as a group at the 0.05 level. The Hochberg adjustment was applied for multiple testing for the 3 end points, ordering the nominal P values for the end points from largest to smallest to determine the significance level at which they were tested. The largest P value was tested at a significance level of 0.05, the second-largest P value was tested at a significance level of 0.025, and the smallest P value was tested at a significance level of 0.0167. The full description of the testing procedure is shown in Figure 2.
Descriptive analyses were performed for the changes to week 48 and week 96. At week 48, in addition to the planned analysis, an ad hoc analysis using a GEE model similar to that of the key secondary and secondary outcomes was performed for the change from week 24 to week 48 in BPI worst pain, WOMAC stiffness, and WOMAC physical function scores in the placebo to burosumab group, with the LSM difference, 95% CI, and P value reported.
Figure 2: Flow Chart for the Multiplicity Adjustment in CL303 Study
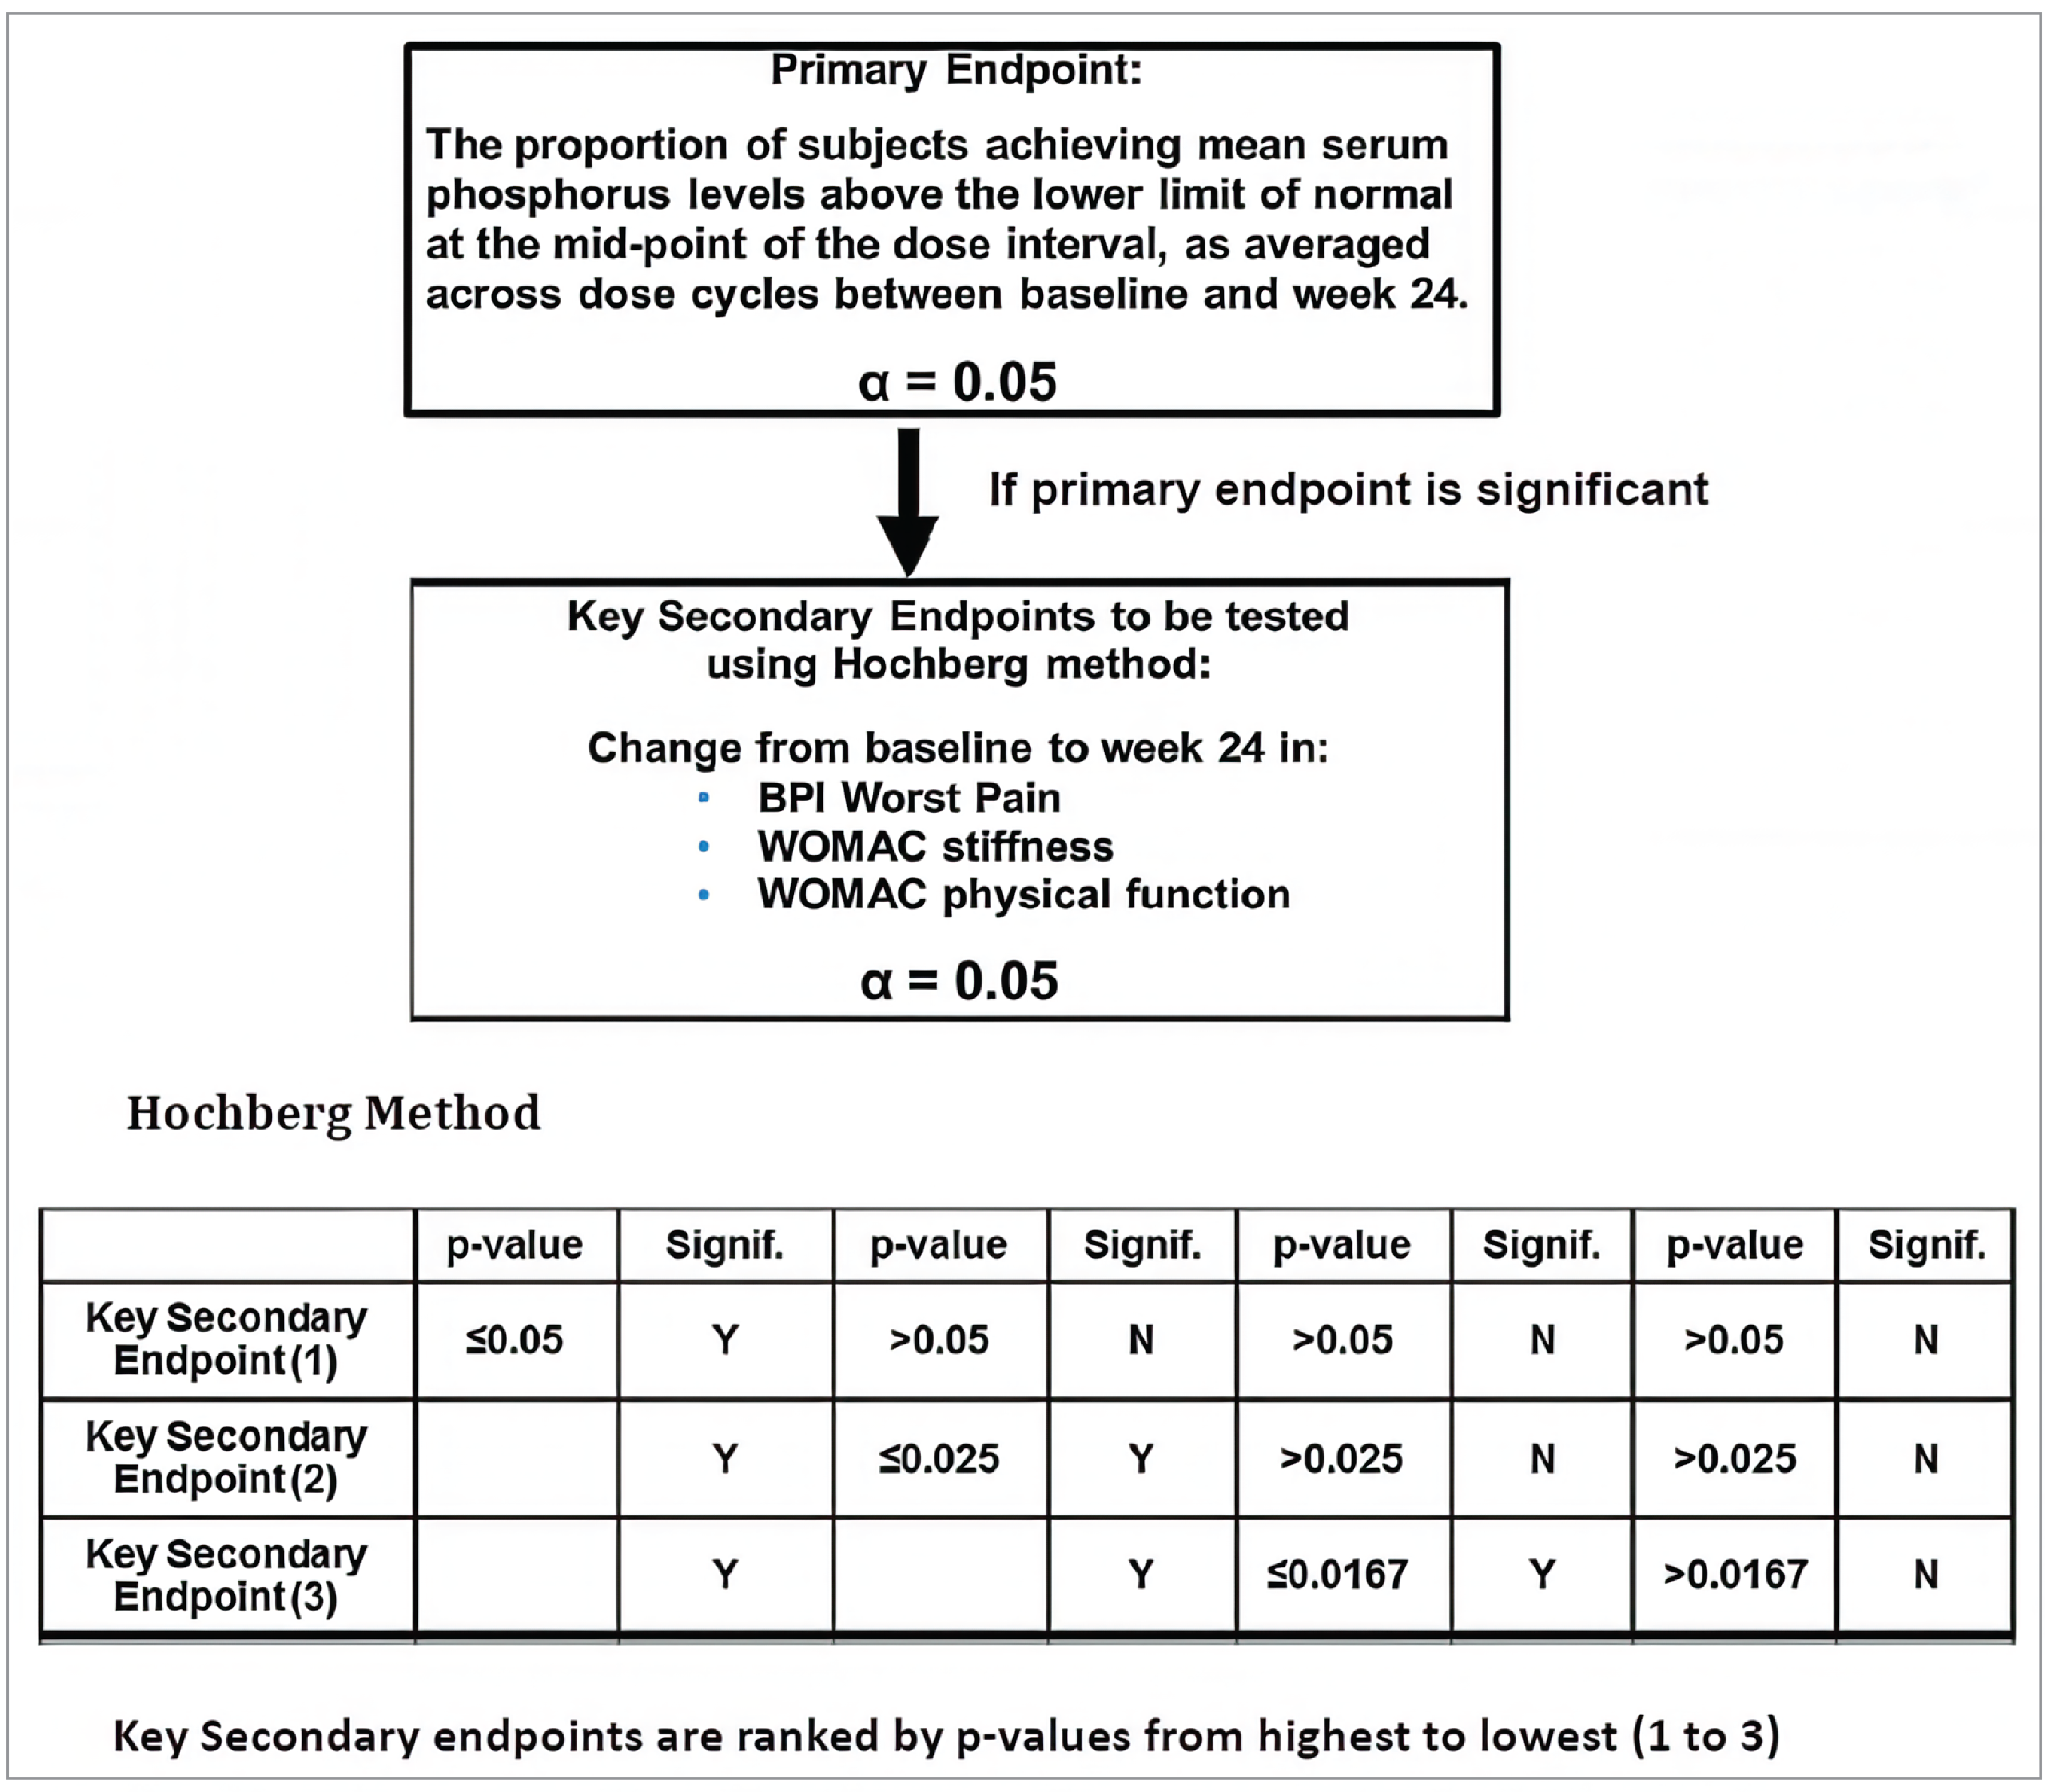
Alpha = alpha; BPI = Brief Pain Inventory; N = no; signif. = significant; WOMAC = Western Ontario and McMaster Universities Osteoarthritis Index; Y = yes.
Source: Sponsor’s Summary of Clinical Evidence.23
The exploratory outcomes were summarized via descriptive statistics using methods similar to the descriptive statistical methods applied for the primary, key secondary, and secondary outcomes after week 24. In addition to the planned analysis, fracture and pseudofracture grades were analyzed using a hierarchical generalized linear mixed proportional odds model for binary responses, with the dependent variable being healed, partially healed, unchanged, or worse. The model included treatment, visit, treatment-by-visit and fracture type as fixed factors as well as random intercepts for patients and fractures nested within patients. Estimates of the probabilities for fracture grade occurrence, ORs for healed fractures at each visit, and 95% CIs were reported.
All efficacy analyses were conducted per protocol.
Missing Data and Sensitivity Analyses
For all outcomes, there was no imputation or accounting for missingness in the data in the primary analyses. Sensitivity analyses were carried out for the key secondary outcomes and consisted broadly of carrying forward select observations to the corresponding end points. In the last observation carried forward (LOCF) analysis, the last nonmissing postbaseline observation before discontinuation was carried forward to the corresponding end point for evaluation. In the baseline observation carried forward analysis, the nonmissing baseline observation was carried forward to the corresponding end point for evaluation. The modified baseline observation carried forward analysis proceeded as follows: for discontinuations due to AEs or death, the worst of baseline observation carried forward and LOCF was used; otherwise, LOCF was used. The results of sensitivity analyses were not appraised in the submission reassessment as they applied only to key secondary outcomes.
Sample Size and Power Calculation
A sample size of 60 patients per group (total sample size of 120 patients) was planned to provide 95% statistical power to detect a 50% difference between the burosumab and placebo groups in the percentages of patients attaining mean serum phosphorus levels above the LLN at the midpoint and end-of-dose intervals between baseline and week 24, at the 2-sided significance level of 0.05. The determination of the sample size for this study was based on the assumption that the percentage of patients who attained mean serum phosphorus levels in the normal range at the midpoint of the dose interval from baseline to week 24 would be 60% and 10% in the burosumab and placebo groups, respectively. The submission did not specify any literature or clinical source as the basis for using a 50% difference between treatment arms and did not specify any expected SD or losses to follow-up.
With a total sample size of 120 patients, the CL303 study design also had greater than or equal to 80% power to detect a mean difference of 1.0 in change from baseline between the burosumab and placebo groups in BPI worst pain, assuming a mean change from baseline of 2.0 in the burosumab group and of 1.0 in the placebo group, a common SD of 1.8, and a 10% dropout rate. The submission did not specify any literature or clinical source for the difference between treatment arms.
Subgroup Analyses
Subgroup analyses by baseline BPI worst pain (> 6 or ≤ 6), an actual stratification factor based on BPI average pain (> 6 or ≤ 6), and region (North America, the European Union, Japan, and South Korea) were performed separately for select efficacy end points. Select AE summaries were presented by region as well. Subgroup analyses by sex and race were also conducted separately for select efficacy end points. If the number of patients within a particular race category was too small, alternative categorizations of race were considered (e.g., white versus non-white [from original source]). Subgroup results were not appraised by CDA-AMC.
Analysis Populations
The efficacy analyses were conducted on the primary analysis set, which included all randomized patients who received at least 1 dose of the study drug during the placebo-controlled period; patients were analyzed per protocol.
The safety analysis set consisted of all randomized patients who received at least 1 dose of the study drug. Patients were analyzed according to the actual treatment received.
The pharmacokinetic analysis set consisted of all patients in the safety analysis set who had 1 or more evaluable burosumab concentration.
Table 9: Analysis Populations of CL303 Study
Population | Definition | Application |
|---|---|---|
Primary analysis set | All randomized patients who received ≥ 1 dose of study drug during the placebo-controlled treatment period. Patients were analyzed according to randomized treatment group, regardless of the actual treatment received. | Efficacy analyses at each specific milestone (i.e., week 24, week 48, and week 96 or final analysis) |
Safety analysis set | All randomized patients who received ≥ 1 dose of study drug. Patients were analyzed based on the actual treatment received. | All safety analyses |
Pharmacokinetic analysis set | This was a subset of patients in the safety analysis set who had ≥ 1 evaluable burosumab concentration. | Analyses of pharmacokinetic end points at each specific milestone (i.e., week 24, week 48, and week 96 or final analysis) |
Postprandial substudy analysis set (not appraised by CDA-AMC) | This was a subset of patients in the safety analysis set who participated in the substudy and had ≥ 1 data point collected in the substudy. | Analyses of postprandial serum phosphorus and calcium |
CDA-AMC = Canada’s Drug Agency.
Source: Sponsor’s Summary of Clinical Evidence.23
Results
Patient Disposition
A total of 163 patients were screened for inclusion in the trial; 29 patients did not advance past screening and 134 patients were randomized into the treatment arms (66 patients in the placebo arm and 68 patients in the burosumab arm) — more than the minimum numbers required by the power calculations. The most common reason for not advancing past screening was the inclusion criteria of worst pain score of 4 or more. After randomization, discontinuations were similar between the study arms. Full details of patient disposition are in Table 10.
Table 10: Summary of Patient Disposition From CL303 Study
Patient disposition | CL303 study | |
|---|---|---|
Placebo (N = 66) | Burosumab (N = 68) | |
Screened, N | 163 | |
Did not advance past screening, n (%) | 29 (17.8) | |
Most common reason for not advancing past screening, n (%) | ||
Baseline score of ≥ 4 on BPI worst pain (inclusion criterion) | 10 (6.1) | |
Baseline serum intact PTH ≥ 2.5 × ULN (exclusion criterion) | 5 (3.1) | |
Randomized, N | 66 | 68 |
Placebo-controlled treatment period (to week 24) | ||
Discontinued from study, n (%) | 0 | 1 (1.5) |
Reason for discontinuation, n (%) | ||
Withdrawn consent | 0 | 1 (1.5) |
Treatment continuation period (to week 48) | ||
Discontinued from study, n (%) | 3 (4.5) | 4 (5.9) |
Reason for discontinuation, n (%) | ||
Withdrawn consent | 0 | 1 (5.5) |
Other | 3 (4.5) | 3 (4.4) |
Treatment extension period I (to week 96) | ||
Discontinued from study, n (%) | 3 (4.5) | 4 (5.9) |
Reason for discontinuation, n (%) | ||
Withdrawn consent | 0 | 1 (1.5) |
Death | 0 | 1 (1.5) |
Lost to follow-up | 0 | 1 (1.5) |
Other | 3 (4.5) | 1 (1.5) |
PAS, N (%) | 66 (100.0) | 68 (100.0) |
Pharmacokinetic analysis set, N (%) | 66 (100.0) | 68 (100.0) |
Safety, N (%) | 66 (100.0) | 68 (100.0) |
BPI = Brief Pain Inventory; PAS = primary analysis set; PTH = parathyroid hormone; ULN = upper limit of normal.
Source: Sponsor’s Summary of Clinical Evidence.23
Of note, an error in the stratification plan for the randomization led to a number of patients being stratified according to their BPI average pain domain scores as opposed to their BPI worst pain domain scores. This resulted in 34.8% of patients in the placebo arm being stratified into the “6 or less” strata as opposed to the “greater than 6” strata, which they would have been if stratified as planned. In the burosumab arm, 45.6% of patients were stratified into the “6 or less” strata as opposed to the “greater than 6” strata, which they would have been if stratified as planned.
Table 11: Randomization Stratification Categories (PAS)
Category | Placebo (N = 66) | Burosumab (N = 68) |
|---|---|---|
Patients randomized by actual pain intensity randomization stratification based on BPI average pain,a n (%) | ||
≤ 6 | 49 (74.2) | 48 (70.6) |
> 6 | 17 (25.8) | 20 (29.4) |
Patients randomized by planned pain intensity randomization stratification based on BPI worst pain,a n (%) | ||
≤ 6 | 27 (40.9) | 17 (25.0) |
> 6 | 39 (59.1) | 51 (75.0) |
Patient randomization by actual and planned randomization stratification, n (%) | ||
≤ 6 and ≤ 6 | 26 (39.4) | 17 (25.0) |
≤ 6 and > 6 | 23 (34.8) | 31 (45.6) |
> 6 and ≤ 6 | 1 (1.5) | 0 |
> 6 and > 6 | 16 (24.2) | 20 (29.4) |
BPI = Brief Pain Inventory; PAS = primary analysis set.
aPer the study protocol, stratification was planned according to BPI worst pain. However, a programming issue resulted in randomization actually being stratified according to BPI average pain. The baseline values for both pain scores were defined as the mean of the values from the baseline visit and the previous 7 days of diary scores.
Sources: Sponsor’s Summary of Clinical Evidence23 and the CL303 Clinical Study Report.20
Baseline Characteristics
Overall, the patient population encompassed by these baseline characteristics was majority female (65.2% female and 34.8% male in the placebo arm and 64.7% female and 35.3% male in the burosumab arm) and majority white (80.3% white, 13.6% of Asian descent, 4.5% Black or African American, and 1.5% other in the placebo arm; 80.9% white, 17.6% of Asian descent, and 1.5% other in the burosumab arm). Baseline characteristics were generally balanced between the 2 treatment arms.
In terms of medical history, a numerically higher proportion of patients in the burosumab arm had osteoarthritis (69.1% versus 57.6% of patients in the placebo arm). Similarly, a numerically higher proportion of patients in the burosumab arm were classified as having a BPI average pain score of more than 6 (32.4% versus 25.8% of patients in the placebo arm); this was similar for the BPI worst pain score where the proportion of patients with a score of more than 6 was 77.9% in the burosumab arm and 65.2% in the placebo arm. A numerically higher proportion of patients in the burosumab arm had nephrocalcinosis than in the placebo arm (16.2% versus 7.6% of patients, respectively). The majority of patients in the burosumab and placebo arms (86.8% and 93.9% of patients, respectively) had received both vitamin D analogues and phosphate before the trial. There were no notable imbalances in baseline laboratory characteristics. A higher proportion of patients in the placebo arm had active pseudofractures at baseline (51.5%) than patients in the burosumab arm (42.6%). The majority of patients in both arms had had previous orthopedic surgery (71.2% of patients in the placebo arm and 66.2% of patients in the burosumab arm) or were taking nonopioid pain medications at baseline (66.7% of patients in the placebo arm and 69.1% of patients in the burosumab arm).
Table 12: Summary of Baseline Characteristics From Studies Included in the Systematic Review (PAS)
Characteristic | CL303 study | |
|---|---|---|
Placebo (N = 66) | Burosumab (N = 68) | |
Demographic characteristics | ||
Age, (years) | ||
Mean (SD) | 38.65 (12.76) | 41.29 (11.58) |
Range | 18.5 to 65.5 | 20.0 to 63.4 |
Sex, n (%) | ||
Male | 23 (34.8) | 24 (35.3) |
Female | 43 (65.2) | 44 (64.7) |
Race, n (%) | ||
Asian | 9 (13.6) | 12 (17.6) |
Black or African American | 3 (4.5) | 0 |
White | 53 (80.3) | 55 (80.9) |
Other | 1 (1.5) | 1 (1.5) |
Weight (kg) | ||
Mean (SD) | 71.27 (18.89) | 70.06 (19.00) |
Range | 36.1 to 126.6 | 37.1 to 139.6 |
Height (cm), n | 65 | 67 |
Mean (SD) | 152.69 (11.84) | 152.15 (9.49) |
Range | 120.6 to 175.0 | 126.2 to 176.0 |
Body mass index (kg/m2), n | 65 | 67 |
Mean (SD) | 30.60 (7.79) | 29.98 (7.49) |
Range | 17.4 to 58.6 | 19.7 to 64.6 |
Medical history and disease characteristics | ||
Time since XLH diagnosis (years), n | 42 | 39 |
Mean (SD) | 31.36 (15.79) | 31.47 (15.59) |
Range | 0.5 to 64.7 | 0.5 to 55.8 |
Osteoarthritis, n (%) | 38 (57.6) | 47 (69.1) |
Nephrocalcinosis (calcium deposits in kidneys), n (%) | 5 (7.6) | 11 (16.2) |
Nephrolithiasis (kidney stones), n (%) | 8 (12.1) | 10 (14.7) |
Previous orthopedic surgery, n (%) | 47 (71.2) | 45 (66.2) |
Prior therapies, n (%) | ||
Phosphate only | 1 (1.5) | 3 (4.4) |
Vitamin D metabolites or analogues only | 3 (4.5) | 3 (4.4) |
Phosphate and vitamin D metabolites or analogues | 62 (93.9) | 59 (86.8) |
No phosphate or vitamin D metabolites or analogues | 0 | 3 (4.4) |
Key pharmacodynamic parameters at baseline | ||
Serum phosphorus (mg/dL), n | 66 | 68 |
Mean (SD) | 1.92 (0.32) | 2.03 (0.30) |
TmP/GFR (mg/dL), n | 64 | 66 |
Mean (SD) | 1.60 (0.37) | 1.68 (0.40) |
Serum 1,25(OH)2D (pg/mL), n | 64 | 66 |
Mean (SD) | 33.5 (15.6) | 32.4 (13.0) |
Baseline radiographic characteristics, n (%) | ||
Patients with bowing (any location) | 62 (93.9) | 64 (94.1) |
Bowing in upper extremities (any location) | 59 (89.4) | 58 (85.3) |
Bowing in lower extremities (any location) | 55 (83.3) | 60 (88.2) |
Enthesopathy (any location) | 65 (98.5) | 68 (100.0) |
Active fractures (any location) | 8 (12.1) | 8 (11.8) |
Nonactive fractures (any location) | 37 (56.1) | 42 (61.8) |
Active pseudofractures (any location) | 34 (51.5) | 29 (42.6) |
Nonactive pseudofractures (any location) | 22 (33.3) | 24 (35.3) |
Baseline pain | ||
BPI average pain, pointsa | ||
Mean (SD) | 5.05 (1.48) | 5.14 (1.56) |
≤ 6, n (%) | 49 (74.2) | 46 (67.6) |
> 6, n (%) | 17 (25.8) | 22 (32.4) |
BPI worst pain, pointsa | ||
Mean (SD) | 6.54 (1.43) | 6.81 (1.31) |
≤ 6, n (%) | 23 (34.8) | 15 (22.1) |
> 6, n (%) | 43 (65.2) | 53 (77.9) |
Any pain medication at baseline, n (%) | 44 (66.7) | 47 (69.1) |
Opioids | 13 (19.7) | 17 (25.0) |
Nonopioid pain medicationsb | 43 (65.2) | 47 (69.1) |
Neuropathic pain medications/antidepressants | 3 (4.5) | 4 (5.9) |
Other | 1 (1.5) | 7 (10.3) |
Baseline genetic status | ||
PHEX mutation result, n (%) | ||
Pathogenic | 50 (75.8) | 46 (67.6) |
Likely pathogenic | 7 (10.6) | 8 (11.8) |
Variant of uncertain significance | 8 (12.1) | 9 (13.2) |
Likely benign | 0 | 0 |
No mutation | 1 (1.5) | 5 (7.4) |
Zygosity, n (%) | ||
Heterozygous | 42 (63.6) | 42 (61.8) |
Mosaic | 1 (1.5) | 0 |
Hemizygous | 22 (33.3) | 21 (30.9) |
No mutation | 1 (1.5) | 5 (7.4) |
1,25(OH)2D = 1,25-dihydroxyvitamin D; BPI = Brief Pain Inventory; PAS = primary analysis set; SD = standard deviation; TmP/GFR = ratio of renal tubular maximum phosphate reabsorption rate to glomerular filtration rate; XLH = X-linked hypophosphatemia.
aMean of the baseline visit score and diary scores from the 7 days before the baseline visit.
bNonsteroidal anti-inflammatory medications and acetaminophen or paracetamol.
Source: Sponsor’s Summary of Clinical Evidence.23
Exposure to Study Treatments
Full details of study treatment exposure are in Table 13. Briefly, as the CL303 trial was a crossover study design, patients originally randomized to the placebo arm had approximately 30 patient-years of less time exposed to burosumab. The mean duration of exposure in days was 477.0 days in the placebo arm and 634.0 days in the burosumab arm. No patients were reported to have discontinued treatment due to nonadherence; further information on adherence was not available.
Table 13: Summary of Patient Exposure From Studies Included in the Systematic Review
Exposure | CL303 study | |
|---|---|---|
Placebo (N = 66) | Burosumab (N = 68) | |
Placebo-controlled period (week 0 to week 24) | ||
Total burosumab exposure, patient-yearsa | None | 31.30 |
Duration in days, mean (SD) | None | 168.1 (0.26) |
Duration in days, median (IQR or range) | None | 168 (163 to 177) |
Combined placebo-controlled period, treatment continuation period, and treatment extension I (week 0 to week 96) | ||
Total burosumab exposure, patient-yearsa | 86.20 | 118.09 |
Duration in days, mean (SD) | 477.0 (10.78) | 634 (13.65) |
Duration in days, median (IQR or range) | 504 (165 to 511) | 672 (167 to 672) |
IQR = interquartile range; SD = standard deviation.
aTotal patient-years of exposure = the sum of duration of exposure to burosumab (for all patients in each treatment group) ÷ 365.25.
Source: Sponsor’s Summary of Clinical Evidence.23
Concomitant Medications and Cointerventions
Most patients (98.5%) received 1 or more concomitant medication during the study. The most common classes (reported in ≥ 25% of patients overall) were analgesics (83.6%), anti-inflammatory and antirheumatic products (80.6%), vitamins (64.2%), systemic antibacterials (54.5%), all other nontherapeutic products (53.7%), systemic antihistamines (44.0%), cough and cold preparations (36.6%), drugs for acid-related disorders (34.3%), corticosteroids for systemic use (32.8%), nasal preparations (30.6%), and psychoanaleptics (26.9%).
Based on patients’ diaries, overall pain medication use at the beginning of the placebo-controlled period was 69.1% in the burosumab arm and 66.7% in the placebo arm, and at the end of the placebo-controlled period was 66.2% in the burosumab arm and 60.6% in the placebo arm. Opioid use at the beginning of the placebo-controlled period was 25.0% in the burosumab arm and 19.7% in the placebo arm; at the end of the placebo-controlled period, 23.5% of patients in the burosumab arm and 21.2% of patients in the placebo arm reported opioid use. At week 48 (the last week of data collection), pain medication use was reported by 63.5% of patients in the burosumab-emergent arm and by 54.0% of patients in the placebo-emergent arm. Opioid use at week 48 was reported by 20.6% of patients in the burosumab-emergent arm and by 17.5% of patients in the placebo-emergent arm.
Efficacy
The proportion of patients who attained serum phosphorus concentrations greater than the LLN at both midpoints and end points of the dosing cycle is shown in Table 14. Changes from baseline to week 24, week 48, and week 96 in the key secondary and secondary PRO measures are summarized in Table 15. Key pseudofracture and fracture outcomes at week 24 and week 48 are summarized in Table 16, and key serum biomarker results are found in Table 17. A discussion of these outcomes follows each table.
Table 14: Summary of Key Serum Phosphorus Efficacy Results From CL303 Study (PAS)
Variable | Change from baseline to week 24 | Change from week 24 to week 48 | Change from week 48 to week 96 | |||
|---|---|---|---|---|---|---|
Placebo N = 66 | Burosumab N = 68 | Week 0 to week 24: Placebo Week 24 to week 48: Burosumab N = 66 | Week 0 to week 48: Burosumab N = 68 | Week 0 to week 24: Placebo Week 24 to week 96: Burosumab N = 66 | Week 0 to week 96: Burosumab N = 68 | |
Proportion of patients with serum phosphorus levels > LLN at dose midpoints | ||||||
Complete cases, n | 66 | 68 | 66 | 68 | 66 | 68 |
Attaining > LLN, n (%) | 5 (7.6) | 63 (92.6) | 59 (89.4) | 57 (83.8) | 45 (68.2) | 56 (82.4) |
95% CI for proportiona | 3.3 to 16.5 | 83.9 to 96.8 | 79.7 to 94.8 | 73.3 to 90.7 | 56.2 to 78.2 | 71.6 to 89.6 |
P valueb | < 0.0001 | NR | NR | NR | NR | |
Proportion of patients with serum phosphorus levels > LLN at dose end points | ||||||
Complete cases, n | 66 | 68 | NR | NR | NR | NR |
Attaining > LLN, n (%) | 4 (6.1) | 46 (67.6) | NR | NR | NR | NR |
95% CI for proportion | 2.4 to 14.6 | 55.8 to 77.6 | NR | NR | NR | NR |
P value | NR | NR | NR | |||
CI = confidence interval; LLN = lower limit of normal; NR = not reported; PAS = primary analysis set.
aThe 95% CI for the proportion of patients who attain mean serum phosphorus levels above the LLN was calculated using the Wilson score method.
bThe P value was adjusted for multiplicity in the 24-week analysis.
Sources: Sponsor’s Summary of Clinical Evidence,23 the CL303 Clinical Study Report,20 and additional information provided by the sponsor.21
Proportion of Patients with Serum Phosphorus Levels Greater Than LLN
As noted in the previous CADTH reimbursement review, the proportion of patients with midpoint serum phosphorus levels greater than LLN was statistically significantly greater in the burosumab arm compared to the placebo arm.30 The additional information on serum phosphorus levels following crossover to burosumab reported that the proportion of patients with midpoint serum phosphorus levels greater than LLN was 89.4% (95% CI, 79.7% to 94.8%) in the placebo-emergent arm and 83.8% (95% CI, 73.3% to 90.7%) in the burosumab-emergent arm at week 48. The proportion of patients with serum phosphorus levels greater than LLN at week 96 was 68.2% (95% CI, 56.2% to 78.2%) in the placebo-emergent arm and 82.4% (95% CI, 71.6% to 89.6%) in the burosumab-emergent arm. There was no information on the patients with serum phosphorus levels greater than LLN at the ends of dosing cycles for week 48 and week 96.
Brief Pain Inventory
As noted in the previous CADTH reimbursement review, the LSM differences in the placebo and burosumab arms for worst pain, pain interference, and pain severity at 24 weeks did not attain statistical significance.30 In addition, the LSM change in BPI worst pain and BPI pain interference did not reach the MCID threshold specified by the current submission (≥ –1.72 points for worst pain and ≥ –1.00 points for pain interference) in either treatment arm.
BPI Worst Pain
At week 48, the LSM change from baseline in the placebo-emergent arm was −1.53 (95% CI, −1.98 to −1.09) and −1.09 (95% CI, −1.51 to −0.66) in the burosumab-emergent arm; the point estimates did not attain the MCID provided by the submission. The ad hoc analysis for the placebo-emergent group showed the change in BPI worst pain between week 24 and week 48 was −1.18 (95% CI, −1.61 to −0.76; P value < 0.0001). At week 96, the LSM changes from baseline at week 48 were −0.99 (95% CI, −1.51 to −0.47) in the placebo-emergent arm and −1.48 (95% CI, −2.07 to −0.90) in the burosumab-emergent arm. The point estimates did not surpass the MCID provided in the submission.
BPI Pain Interference
At week 48, the LSM change from baseline was −1.27 (95% CI, −1.77 to −0.78) in the placebo-emergent arm and −1.04 (95% CI, −1.51 to −0.56) in the burosumab-emergent arm. The point estimates in both arms surpassed the MCIDs provided in the submission. At week 96, the LSM change from baseline in the placebo-emergent group was −1.08 (95% CI, −1.59 to −0.57) in the placebo-emergent arm and −1.43 (95% CI, −1.89 to −0.97) in the burosumab-emergent arm. The point estimates in both arms surpassed the MCIDs provided in the submission.
Table 15: Summary of Key PRO Efficacy Results From CL303 Study (PAS)
Variable | Change from baseline to week 24 | Change from baseline to week 48 | Change from baseline to week 96 | |||
|---|---|---|---|---|---|---|
Placebo N = 66 | Burosumab N = 68 | Week 0 to week 24: Placebo Week 24 to week 48: Burosumab N = 66 | Week 0 to week 48: Burosumab N = 68 | Week 0 to week 24: Placebo Week 24 to week 96: Burosumab N = 66 | Week 0 to week 96: Burosumab N = 68 | |
BPI worst pain | ||||||
Complete cases, n | 65 | 67 | 66 | 66 | 59 | 59 |
Baseline, mean (SE) | 6.51 (1.42) | 6.80 (1.32) | 6.54 (1.43) | 6.82 (1.31) | 6.47 (1.45) | 6.87 (1.31) |
End point, mean (SE) | 6.09 (2.01) | 5.82 (1.92) | 4.91 (2.13) | 5.56 (1.90) | 5.37 (2.29) | 5.15 (2.38) |
LSM change (95% CI) | −0.32 (−0.76 to 0.11) | −0.79 (−1.20 to −0.37) | −1.53 (−1.98 to −1.09) | −1.09 (−1.51 to −0.66) | −0.99 (−1.51 to −0.47) | −1.48 (−2.07 to −0.90) |
LSM difference (95% CI) | −0.46 (−1.00 to 0.08) | −1.18 (−1.61 to −0.76)b | NR | NR | ||
P valuea | 0.0919 (vs. P = 0.05) | < 0.0001b | NR | NR | NR | |
BPI pain interference | ||||||
Complete cases, n | 65 | 67 | 66 | 66 | 59 | 59 |
Baseline, mean (SD) | 4.70 (2.14) | 5.18 (2.12) | 4.76 (2.17) | 5.20 (2.22) | 4.81 (2.12) | 5.29 (2.25) |
End point, mean (SD) | 4.16 (2.39) | 4.36 (2.35) | 3.18 (0.29) | 3.74 (0.28) | 3.43 (2.35) | 3.43 (2.33) |
LSM change (95% CI) | −0.35 (−0.87 to 0.18) | −0.52 (−1.02 to −0.03) | −1.27 (−1.77 to −0.78) | −1.04 (−1.51 to −0.56) | −1.08 (−1.59 to −0.57) | −1.43 (−1.89 to −0.97) |
LSM difference (95% CI) | −0.17 (−0.73 to 0.39) | NR | NR | NR | NR | |
P value | 0.5476 | NR | NR | NR | NR | |
BPI pain severity | ||||||
Complete cases, n | 65 | 67 | 66 | 66 | 59 | 59 |
Baseline, mean (SD) | 4.88 (1.53) | 5.17 (1.54) | 4.92 (1.54) | 5.19 (1.55) | 4.89 (1.53) | 5.22 (1.58) |
End point, mean (SD) | 4.65 (2.13) | 4.45 (1.88) | 3.63 (2.07) | 4.19 (1.78) | 3.58 (1.95) | 3.58 (1.98) |
LSM change (95% CI) | −0.13 (−0.51 to 0.24) | −0.57 (−0.90 to −0.24) | −1.20 (−1.58 to −0.81) | −0.85 (−1.16 to −0.54) | −1.18 (−1.57 to −0.80) | −1.42 (−1.87 to −0.97) |
LSM difference (95% CI) | −0.43 (−0.93 to 0.06) | NR | NR | NR | NR | |
P value | 0.0844 | NR | NR | NR | NR | |
WOMAC physical function | ||||||
Complete cases, n | 65 | 66 | 66 | 66 | 59 | 59 |
Baseline, mean (SD) | 43.62 (19.97) | 50.33 (19.34) | 43.89 (19.94) | 50.30 (19.34) | 44.39 (20.16) | 50.67 (20.23) |
End point, mean (SD) | 42.65 (22.76) | 43.43 (19.51) | 34.74 (22.62) | 38.35 (18.61) | 34.02 (22.70) | 38.51 (20.62) |
LSM change (95% CI) | 1.79 (−3.54 to 7.13) | −3.11 (−8.12 to 1.89) | −6.35 (−11.94 to −0.76) | −7.76 (−11.97 to −3.55) | −8.41 (−13.80 to −3.01) | −9.02 (−13.47 to −4.57) |
LSM difference (95% CI) | −4.90 (−9.76 to −0.05) | −8.18 (−11.55 to −4.82)b | NR | NR | NR | |
P valuea | 0.0478 (vs. P = 0.025) | < 0.0001b | NR | NR | NR | |
WOMAC stiffness | ||||||
Complete cases, n | 65 | 67 | 66 | 66 | 59 | 59 |
Baseline, mean (SD) | 61.54 (21.35) | 64.37 (20.21) | 61.36 (20.77) | 64.58 (20.28) | 60.59 (21.25) | 64.62 (20.52) |
End point, mean (SD) | 60.38 (21.83) | 53.73 (20.76) | 44.70 (22.47) | 45.27 (21.90) | 42.58 (24.02) | 47.25 (24.79) |
LSM change (95% CI) | 0.46 (−5.70 to 6.61) | −7.85 (−13.80 to −1.91) | −15.29 (−22.23 to −8.35) | −16.03 (−22.53 to −9.53) | −17.67 (−24.99 to −10.34) | −15.32 (−22.33 to −8.31) |
LSM difference (95% CI) | −8.31 (−14.68 to −1.94) | −15.82 (−21.30 to −10.34)b | NR | NR | NR | |
P valuea | 0.0122 (vs. P = 0.0167) | < 0.0001b | NR | NR | NR | |
WOMAC pain | ||||||
Complete cases, n | 65 | 66 | 66 | 65 | 59 | 59 |
Baseline, mean (SD) | 47.77 (15.54) | 50.08 (17.46) | 47.95 (15.54) | 50.08 (17.60) | 48.31 (15.77) | 50.17 (17.93) |
End point, mean (SD) | 45.23 (18.38) | 43.36 (17.11) | 36.21 (20.34) | 37.50 (16.53) | 36.36 (20.80) | 35.59 (17.59) |
Observed mean change (SD) | −2.54 (15.49) | −6.67 (17.61) | −11.74 (18.739) | −12.46 (15.60) | −11.95 (18.08) | −14.58 (17.65) |
6MWT total distance walked (m) | ||||||
Complete cases, n | 64 | 65 | 65 | 63 | NR | NR |
Baseline, mean (SD) | 367.28 (104.22) | 365.66 (125.44) | 367.42 (103.41) | 358.24 (110.98) | NR | NR |
End point, mean (SD) | 369.44 (103.39) | 378.98 (110.84) | 390.86 (106.51) | 392.49 (107.15) | NR | NR |
LSM change (95% CI) | −5.71 (−21.70 to 10.28) | 5.92 (−15.00 to 26.84) | 20.19 (3.02 to 37.35) | 30.50 (16.92 to 44.08) | NR | NR |
LSM difference (95% CI) | 11.63 (−8.91 to 32.17) | NR | NR | NR | NR | |
P value | 0.2671 | NR | NR | NR | NR | |
BFI worst fatigue | ||||||
Complete cases, n | 65 | 67 | 66 | 66 | 59 | 58 |
Baseline, mean (SD) | 6.72 (1.53) | 6.92 (1.66) | 6.74 (1.53) | 6.95 (1.66) | 6.66 (1.49) | 7.00 (1.64) |
End point, mean (SD) | 6.07 (2.00) | 5.99 (2.19) | 5.31 (2.21) | 5.64 (2.15) | 5.69 (2.53) | 5.86 (2.52) |
LSM change (95% CI) | −0.46 (−1.03 to 0.11) | −0.65 (−1.22 to −0.09) | −1.23 (−1.84 to −0.62) | −1.01 (−1.57 to −0.45) | −0.82 (−1.53 to −0.11) | −0.75 (−1.35 to −0.15) |
LSM difference (95% CI) | −0.20 (−0.79 to 0.40) | NR | NR | NR | NR | |
P value | 0.5221 | NR | NR | NR | NR | |
BFI global fatigue | ||||||
Complete cases, n | 65 | 67 | 66 | 66 | 59 | 58 |
Baseline, mean (SD) | 4.82 (1.92) | 5.33 (2.02) | 4.86 (1.93) | 5.34 (2.03) | 4.90 (1.86) | 5.33 (2.12) |
End point, mean (SD) | 4.20 (2.34) | 4.68 (2.31) | 3.55 (2.28) | 4.17 (2.22) | 3.51 (2.03) | 3.84 (2.20) |
LSM change (95% CI) | −0.03 (−0.61 to 0.54) | 0.04 (−0.49 to 0.57) | −0.73 (−1.34 to −0.12) | −0.46 (−1.01 to 0.09) | −0.86 (−1.43 to −0.29) | −0.80 (−1.36 to −0.25) |
LSM difference (95% CI) | 0.08 (−0.48 to 0.63) | NR | NR | NR | NR | |
P value | 0.7912 | NR | NR | NR | NR | |
6MWT = 6-minute walk test; BFI = Brief Fatigue Inventory; BPI = Brief Pain Inventory; CI = confidence interval; GEE = generalized estimating equation; LSM = least squares mean; NR = not reported; PAS = primary analysis set; PRO = patient-reported outcome; SD = standard deviation; SE = standard error; vs. = versus; WOMAC = Western Ontario and McMaster Universities Osteoarthritis Index.
aThe P value was adjusted for multiplicity for the week 24 analysis.
bEstimates of LSMs and P values for change from week 24 to week 48 in the placebo-emergent group are from an ad hoc GEE model, similar to those for the planned analysis.
Sources: Sponsor’s Summary of Clinical Evidence,23 the CL303 Clinical Study Report,20 and additional information provided by the sponsor.21
BPI Pain Severity
At week 48, the LSM change from baseline was –1.20 (95% CI, –1.58 to –0.81) in the placebo-emergent arm and –0.85 (95% CI, –1.16 to –0.54) in the burosumab-emergent arm. At week 96, the LSM change from baseline was –1.18 (95% CI, –1.57 to –0.80) in the placebo-emergent arm and –1.42 (95% CI, –1.87 to –0.97) in the burosumab-emergent arm. There were no MCIDs provided for this outcome.
Western Ontario and McMaster Universities Osteoarthritis Index
As noted in the previous CADTH reimbursement review, the LSM difference for change in WOMAC physical function score did not attain statistical significance at week 24 following the Hochberg adjustment for multiplicity, and the WOMAC stiffness scores did attain statistical significance after the Hochberg adjustment.30 In addition to this, the WOMAC physical function and WOMAC stiffness score point estimates did not attain the MCIDs provided in the current submission (≥ –8.00 points for physical function and ≥ –10.00 points for stiffness).
WOMAC Physical Function
At week 48, the LSM change from baseline was –6.35 (95% CI, –11.94 to –0.76) in the placebo-emergent arm and –7.76 (95% CI, –11.97 to –3.55) in the burosumab-emergent arm. These point estimates did not surpass the MCID provided by the submission. At week 96, the LSM change from baseline was –8.41 (95% CI, –13.80 to –3.01) in the placebo-emergent arm and –9.02 (95% CI, –13.47 to –4.57) in the burosumab-emergent arm. The point estimates in both arms surpassed the MCID provided in the submission.
WOMAC Stiffness
At week 48, the LSM change from baseline was –15.29 (95% CI, –22.23 to –8.35) in the placebo-emergent arm and –16.03 (95% CI, –22.53 to –9.53) in the burosumab-emergent arm. The point estimates surpassed the MCID in both arms. The ad hoc analysis for the change in scores between week 24 and week 48 in the placebo-emergent arm showed a statistically significant reduction in scores following burosumab initiation at –15.82 (95% CI, –21.30 to –10.34; P value < 0.0001). At week 96, the LSM change from baseline was –17.67 (95% CI, –24.99 to –10.34) in the placebo-emergent arm and –15.32 (95% CI, –22.33 to –8.31) in the burosumab-emergent arm. Both point estimates surpassed the MCID.
WOMAC Pain
LSM changes from baseline were not reported in the submission. A trend toward numerically increasing reductions in observed WOMAC pain scores was reported in the submission between week 48 and week 96, for both the placebo-emergent and burosumab-emergent treatment arms.
6-Minute Walk Test
At week 48, the mean total distance walked at baseline was 367.28 (SD = 104.22) m in the placebo-emergent arm and 365.66 (SD = 125.44) m in the burosumab-emergent arm. The LSM change in total distance walked was −5.71 (95% CI, −21.70 to 10.28) in the placebo-emergent arm and 5.92 (95% CI, −15.00 to 26.84) in the burosumab-emergent arm. These point estimates did not surpass the MCIDs provided. This outcome was not measured at week 96.
Brief Fatigue Inventory
As noted in the previous CADTH reimbursement request, the change from baseline to week 24 in BFI worst fatigue and global fatigue scores did not attain statistical significance.30 In addition to this, the point estimates and 95% CIs did not surpass the MCIDs provided by the sponsor in the current submission for either score (≥ –1.5 points for worst fatigue and ≥ –1.2 points for global fatigue).
BFI Worst Fatigue
At week 48, the LSM change from baseline was –1.23 (95% CI, –1.84 to –0.62) in the placebo-emergent arm and –1.01 (95% CI, –1.57 to –0.45) in the burosumab-emergent arm. The point estimates did not surpass the MCID provided by the submission. At week 96, the LSM change from baseline was –0.82 (95% CI, –1.53 to –0.11) in the placebo-emergent arm and –0.75 (95% CI, –1.35 to –0.26) in the burosumab-emergent arm. The point estimates did not surpass the MCID provided by the submission.
BFI Global Fatigue
At week 48, the LSM change from baseline was –0.73 (95% CI, –1.34 to –0.12) in the placebo-emergent arm and –0.46 (95% CI, –1.01 to 0.09) in the burosumab-emergent arm. The point estimates did not surpass the MCID provided in the submission. At 96 weeks, the LSM change from baseline was –0.86 (95% CI, –1.43 to –0.29) in the placebo-emergent arm and –0.80 (95% CI, –1.36 to –0.25) in the burosumab-emergent arm. The point estimates did not surpass the MCID provided in the submission.
Active Fractures and Pseudofractures
As noted in the previous CADTH reimbursement review, 50.0% of patients in the burosumab arm had active fractures graded as healed and 0.0% of patients in the placebo arm had active fractures graded as healed.30 A total of 41.2% of patients in the burosumab arm and 9.0% of patients in the placebo arm had active pseudofractures graded as healed. The reassessment submission’s additional 24-week analyses reported a probability of a fully healed fracture at 24 weeks in the burosumab arm of 0.458 and a probability of 0.048 in the placebo arm. The OR of a fully healed fracture was 16.76 (95% CI, 4.93 to 56.95) for patients treated with burosumab (P < 0.0001).
At 48 weeks, 46.2% of patients in the placebo-emergent arm and 57.1% of patients in the burosumab arm had a fracture status of healed. A total of 33.3% of patients in the placebo-emergent arm and 64.7% of patients in the burosumab-emergent arm reported healed pseudofractures. The probability of a fully healed fracture was 0.725 (95% CI, 0.516 to 0.933) in the burosumab-emergent arm and 0.386 (95% CI, 0.718 to 0.594) in the placebo-emergent arm.
Table 16: Summary of Key Fracture-Related Efficacy Results From CL303 Study (PAS)
Variable | Change from baseline to week 24 | Change from baseline to week 48 | Change from baseline to week 96 | |||
|---|---|---|---|---|---|---|
Placebo N = 66 | Burosumab N = 68 | Week 0 to week 24: Placebo Week 24 to week 48: Burosumab N = 66 | Week 0 to week 48: Burosumab N = 68 | Week 0 to week 24: Placebo Week 24 to week 96: Burosumab N = 66 | Week 0 to week 96: Burosumab N = 68 | |
Active pseudofracture status | ||||||
Number at baseline, n | 78 | 51 | 78 | 51 | NR | NR |
Healed, n (%) | 7 (9.0) | 21 (41.2) | 26 (33.3) | 33 (64.7) | NR | NR |
Partially healed, n (%) | 19 (24.4) | 13 (25.5) | 32 (41.0) | 9 (17.6) | NR | NR |
Unchanged, n (%) | 39 (50.0) | 6 (11.8) | 10 (12.8) | 4 (7.8) | NR | NR |
Worse, n (%) | 8 (10.3) | 2 (3.9) | 0 | 0 | NR | NR |
Missing, n (%) | 5 (6.4) | 9 (17.6) | 10 (12.8) | 5 (9.8) | NR | NR |
New finding, n | 0 | 2 | 0 | 0 | NR | NR |
Active fracture status | ||||||
Number at baseline, n | 13 | 14 | 13 | 14 | NR | NR |
Healed, n (%) | 0 | 7 (50.0) | 6 (46.2) | 8 (57.1) | NR | NR |
Partially healed, n (%) | 6 (46.2) | 3 (21.4) | 4 (30.8) | 2 (14.3) | NR | NR |
Unchanged, n (%) | 2 (15.4) | 3 (21.4) | 1 (7.7) | 2 (14.3) | NR | NR |
Worse, n (%) | 3 (23.1) | 0 | 0 | 0 | NR | NR |
Missing, n (%) | 2 (15.4) | 1 (7.1) | 2 (15.4) | 2 (14.3) | NR | NR |
New finding, n | 0 | 1 | 1 | 0 | NR | NR |
Active fracture or pseudofracture | ||||||
Number at baseline, n | 91 | 65 | 91 | 65 | NR | |
Probability of fully healed (95% CI) | 0.048 (NR) | 0.458 (NR) | 0.386 (0.178 to 0.594)a | 0.725 (0.516 to 0.933)a | NR | NR |
OR (95% CI) fully healed | 16.76 (4.93 to 56.95) | NR | NR | NR | ||
P value | < 0.0001 | 0.0003a | < 0.0001a | NR | ||
Probability of partially healed, unchanged, or worsened | 0.952 | 0.542 | 0.614 | 0.275 | NR | NR |
CI = confidence interval; NR = not reported; OR = odds ratio; PAS = primary analysis set.
aThe 95% CI and P value correspond to the probability of a fracture being graded as fully healed for the week 48 analysis, vs. 0 probability of healing.
Sources: Sponsor’s Summary of Clinical Evidence23 and the CL303 Clinical Study Report.20
Table 17: Summary of Key Serum Biomarker Efficacy Results From CL303 Study (PAS)
Variable | Change from baseline to week 24 | Change from baseline to week 48 | Change from baseline to week 96 | |||
|---|---|---|---|---|---|---|
Placebo N = 66 | Burosumab N = 68 | Week 0 to week 24: Placebo Week 24 to week 48: Burosumab N = 66 | Week 0 to week 48: Burosumab N = 68 | Week 0 to week 24: Placebo Week 24 to week 96: Burosumab N = 66 | Week 0 to week 96: Burosumab N = 68 | |
Serum 1,25(OH)2D (pg/mL)a | ||||||
Complete cases, n | 64 | 65 | 64 | 63 | 56 | 58 |
Baseline, mean (SD) | 33.50 (15.61) | 32.90 (12.56) | 33.50 (15.61) | 32.20 (13.21) | 33.10 (14.93) | 32.90 (13.17) |
Observed, mean (SD) | 34.90 (14.52) | 57.00 (18.02) | 41.90 (13.42) | 38.00 (13.62) | 35.50 (11.80) | 33.40 (10.52) |
LSM change from baseline (95% CI) | 2.72 (−2.81 to 8.25) | 25.46 (18.55 to 32.36) | 10.50 (5.76 to 15.24) | 7.24 (2.44 to 12.04) | 3.43 (−1.17 to 8.03) | 1.95 (−2.66 to 6.57) |
LSM difference (95% CI) | 22.74 (18.03 to 27.44) | NR | NR | |||
P value | < 0.0001 | NR | NR | |||
TmP/GFR (mg/dL) | ||||||
Complete cases, n | 62 | 65 | 62 | 61 | 58 | 57 |
Baseline, mean (SD) | 1.60 (0.37) | 1.67 (0.40) | 1.60 (0.37) | 1.68 (0.41) | 1.60 (0.38) | 1.70 (0.41) |
Observed, mean (SD) | 1.73 (0.42) | 2.21 (0.48) | 2.21 (0.59) | 2.21 (0.52) | 1.95 (0.56) | 2.18 (0.46) |
LSM change from baseline (95% CI) | 0.13 (−0.04 to 0.31) | 0.56 (0.34 to 0.77) | 0.55 (0.38 to 0.72) | 0.48 (0.30 to 0.65) | 0.29 (0.12 to 0.46) | 0.46 (0.29 to 0.62) |
LSM difference (95% CI) | 0.43 (0.29 to 0.56) | NR | NR | |||
P value | < 0.0001 | NR | NR | |||
TRP | ||||||
Complete cases, n | 63 | 67 | 64 | 63 | 59 | 58 |
Baseline, mean (SD) | 0.81 (0.09) | 0.81 (0.08) | 0.81 (0.08) | 0.81 (0.08) | 0.81 (0.09) | 0.81 (0.09) |
Observed, mean (SD) | 0.80 (0.11) | 0.84 (0.07) | 0.84 (0.09) | 0.85 (0.07) | 0.81 (0.10) | 0.84 (0.06) |
LSM change from baseline (95% CI) | −0.01 (−0.04 to 0.01) | 0.03 (0.01 to 0.05) | 0.02 (0.00 to 0.05) | 0.03 (0.02 to 0.05) | −0.01 (−0.04 to 0.02) | 0.03 (0.01 to 0.05) |
LSM difference (95% CI) | 0.04 (0.02 to 0.07) | NR | NR | |||
P value | 0.0008 | NR | NR | |||
BALP (mcg/L) | ||||||
Complete cases, n | 61 | 63 | 66 | 61 | 59 | 58 |
Baseline, mean (SD) | 24.00 (16.68) | 23.50 (19.61) | 24.60 (17.30) | 25.80 (22.16) | 24.40 (18.07) | 25.90 (20.82) |
Observed, mean (SD) | 26.00 (17.33) | 30.20 (26.26) | 31.90 (19.46) | 26.00 (18.79) | 22.50 (12.12) | 23.00 (11.93) |
LSM change from baseline (95% CI) | 1.61 (−3.08 to 6.29) | 5.96 (1.38 to 10.54) | 6.69 (2.91 to 10.47) | 0.23 (−3.36 to 3.81) | −2.49 (−6.19 to 1.21) | −2.76 (−5.98 to 0.45) |
LSM difference (95% CI) | 4.35 (−0.51 to 9.22) | NR | NR | |||
P value | 0.0795 | NR | NR | |||
1,25(OH)2D = 1,25-dihydroxyvitamin D; BALP = bone-specific alkaline phosphatase; CI = confidence interval; LSM = least squares mean; NR = not reported; PAS = primary analysis set; SD = standard deviation; TmP/GFR = ratio of renal tubular maximum phosphate reabsorption rate to glomerular filtration rate; TRP = tubular reabsorption of phosphate.
aWeek 22 values were used for the week 24 analysis as this biomarker was not measured at week 24.
Sources: Sponsor’s Summary of Clinical Evidence,23 the CL303 Clinical Study Report,20 and additional information provided by the sponsor.21
Key Serum Biomarkers
Serum 1,25(OH)2D
The previous CADTH reimbursement request reported that the LSM difference in serum 1,25(OH)2D concentrations was statistically significantly larger in the burosumab arm relative to the placebo arm.30 At week 48, the LSM change in the levels of serum 1,25(OH)2D was 10.50 (95% CI, 5.76 to 15.24) in the placebo-emergent arm and 7.24 (95% CI, 2.44 to 12.04) in the burosumab-emergent arm. At week 96, the LSM change from baseline was 3.43 (95% CI, –1.17 to 8.03) in the placebo-emergent arm and 1.95 (95% CI, –2.66 to 6.57) in the burosumab-emergent arm.
TmP/GFR and TRP
As noted in the previous CADTH reimbursement review, the LSM difference showed a statistically significant increase in TmP/GFR for the burosumab arm relative to the placebo arm at 24 weeks.30 At week 48, the LSM change from baseline in TmP/GFR was 0.55 (95% CI, 0.38 to 0.72) in the placebo-emergent arm and 0.48 (95% CI, 0.30 to 0.65) in the burosumab-emergent arm. At week 96, the LSM change was 0.29 (95% CI, 0.12 to 0.46) in the placebo-emergent arm and 0.46 (95% CI, 0.29 to 0.62) in the burosumab-emergent arm.
In the previous CADTH reimbursement review, the change in TRP from baseline at 24 weeks was statistically significantly greater in the burosumab arm.30 At week 48, the LSM change from baseline was 0.02 (95% CI, 0.00 to 0.05) for the placebo-emergent arm and 0.03 (95% CI, 0.02 to 0.05) in the burosumab-emergent arm. At week 96, LSM change from baseline in the placebo-emergent group was –0.01 (95% CI, –0.04 to 0.02), while the LSM change in the burosumab-emergent group was 0.03 (95% CI, 0.01 to 0.05).
Bone-Specific Alkaline Phosphatase
The previous CADTH reimbursement review noted statistically nonsignificant changes in BALP at 24 weeks.30 At week 48, the LSM change from baseline in BALP in the placebo-emergent arm was 6.69 (95% CI, 2.91 to 10.47) and the LSM change from baseline in the burosumab-emergent arm was 0.23 (95% CI, –3.36 to 3.81). At week 96, the LSM change was –2.49 (95% CI, –6.19 to 1.21) in the placebo-emergent arm and –2.76 (95% CI, –5.98 to 0.45) in the burosumab-emergent arm.
Harms
Overall, 97% of patients in the placebo-emergent arm and 100% of patients in the burosumab-emergent arm experienced a TEAE. The most common TEAEs in the burosumab-emergent arm over the entire duration of the trial were arthralgia (41%), nasopharyngitis (41%), headache (32%), tooth abscess (28%), and back pain and pain in extremity (27% each). The most common TEAEs in the placebo-emergent arm during the placebo-controlled period (first 24 weeks) were arthralgia (24%), pain in extremity (15%), fatigue (11%), and oropharyngeal pain (11%). After initiating burosumab, the most common TEAEs in the placebo-emergent arm were arthralgia (36%), nasopharyngitis (36%), headache (27%), and back pain (26%). Table 18 contains harms data for the most commonly reported TEAEs (reported in > 10% of patients in either arm). The data for the burosumab arm were presented together for the placebo-controlled period and the open-label period, and the data for the placebo arm were presented separately for the placebo-controlled period and the open-label period.
Adverse Events
Overall, there were differences between the burosumab-emergent arm during the entire trial and the placebo-emergent arm after initiating burosumab for some TEAEs. Specifically, there were differences between the burosumab-emergent arm and the placebo-emergent arm in the proportion of patients reporting tooth abscesses (28% and 8%, respectively), vitamin D deficiency (22% and 11%, respectively), injection site reactions (12% and 25%, respectively), diarrhea (19% and 8%, respectively), upper respiratory tract infection (18% and 3%, respectively), nausea and dizziness (both 16% and 8% in each arm, respectively), depression (13% and 5%, respectively), hypoesthesia (10% and 5%, respectively), migraine (10% and 3%, respectively), oropharyngeal pain (6% and 12%, respectively), injection site pruritus (4% and 12%, respectively), and ectopic mineralization (0% and 11%, respectively).
Serious Adverse Events
During the placebo-controlled period, an SAE was reported in 1 patient (invasive ductal breast carcinoma) in the placebo-emergent arm and 2 patients (irritable bowel syndrome and back pain) in the burosumab-emergent arm.
In the placebo-emergent arm, 10 patients overall reported SAEs. A total of 6 patients reported SAEs between week 24 and week 48 (presyncope, palpitations, cervical spinal stenosis, periodontal disease, pseudarthrosis, and subdural hematoma) and 4 patients reported SAEs between week 48 and week 96 (partial seizures, arthralgia [separate events for each knee], joint range of motion decreased, and benign parathyroid tumour).
The burosumab-emergent arm overall reported SAEs in 12 patients. A total of 4 patients reported SAEs between week 24 and week 48 (colitis, procedural nausea and/or vomiting, spinal column stenosis and myelopathy, and musculoskeletal pain) and 4 patients reported SAEs between week 48 and week 96 (knee deformity, cholelithiasis and gastroenteritis, spondylolisthesis, and duodenal ulcer).
Withdrawals Due to AEs
No patients stopped treatment due to AEs.
Mortality
There was 1 death reported in the burosumab-emergent cohort, which was due to a road traffic accident. Per the submission, this was judged not related to the study treatment.
Notable Harms
AEs of special interest included injection site reactions, hypersensitivity, hyperphosphatemia, ectopic mineralization, and restless leg syndrome. A total of 16 (24%) patients in the placebo-emergent arm reported injection site reactions after initiating burosumab and 8 (12%) patients reported injection site reactions before initiation. In addition, 7 (11%) patients in the placebo-emergent arm experienced ectopic mineralization, which was not reported in any of the other treatment arms. Lastly, there were 0 reports of hyperphosphatemia in the placebo-emergent arm during the placebo-controlled period; hyperphosphatemia was reported in 6% of patients in the placebo-emergent arm after initiating burosumab and in 6% of patients in the burosumab-emergent arm throughout the trial.
Noting the higher proportions of patients in the burosumab-emergent arm experiencing TEAEs and serious TEAEs, the submission included an exposure-adjusted analysis reporting incidence rates in each arm, which revealed generally similar incidence rates in the placebo-emergent and burosumab-emergent arms. Full results of this analysis were not available in the submission.
Table 18: Summary of Harms Results From CL303 Study (SAS)
AE | CL303 study | ||
|---|---|---|---|
Placebo (N = 66); placebo-controlled period | Week 0 to week 24: Placebo Week 24 to week 96: Burosumab (N = 66) Treatment continuation or extension periodsa | Burosumab (N = 68); any treatment perioda | |
≥ 1 TEAE, n (%) | 61 (92.4) | 64 (97.0) | 68 (100.0) |
Most common TEAEs,b n (%) | |||
Arthralgia | 16 (24.2) | 24 (36.4) | 28 (41.2) |
Nasopharyngitis | 6 (9.1) | 24 (36.4) | 28 (41.2) |
Headache | 5 (7.6) | 18 (27.3) | 22 (32.4) |
Back pain | 6 (9.1) | 17 (25.8) | 18 (26.5) |
Tooth abscess | 6 (9.1) | 5 (7.6) | 19 (27.9) |
Pain in extremity | 10 (15.2) | 10 (15.2) | 18 (26.5) |
Fatigue | 7 (10.6) | 14 (21.2) | 16 (23.5) |
Vitamin D deficiency | 3 (4.5) | 7 (10.6) | 15 (22.1) |
Diarrhea | 5 (7.6) | 5 (7.6) | 13 (19.1) |
Musculoskeletal pain | 4 (6.1) | 10 (15.2) | 13 (19.1) |
Toothache | 1 (1.5) | 10 (15.2) | 12 (17.6) |
Pain | 6 (9.1) | 9 (13.6) | 12 (17.6) |
Upper respiratory tract infection | 6 (9.1) | 2 (3.0) | 12 (17.6) |
Restless legs syndrome | 5 (7.6) | 10 (15.2) | 11 (16.2) |
Muscle spasms | 2 (3.0) | 9 (13.6) | 11 (16.2) |
Dizziness | 4 (6.1) | 5 (7.6) | 11 (16.2) |
Nausea | 6 (9.1) | 5 (7.6) | 11 (16.2) |
Cough | 3 (4.5) | 11 (16.7) | 10 (14.7) |
Constipation | 0 | 4 (6.1) | 10 (14.7) |
Influenza | 3 (4.5) | 6 (9.1) | 9 (13.2) |
Insomnia | 1 (1.5) | 6 (9.1) | 9 (13.2) |
Procedural pain | 0 | 6 (9.1) | 9 (13.2) |
Depression | 1 (1.5) | 3 (4.5) | 9 (13.2) |
Vitamin D, decreased | 0 | 9 (13.6) | 8 (11.8) |
Bone pain | 4 (6.1) | 6 (9.1) | 8 (11.8) |
Hypertension | 2 (3.0) | 5 (7.6) | 8 (11.8) |
Myalgia | 1 (1.5) | 5 (7.6) | 8 (11.8) |
Injection site reaction | 2 (3.0) | 8 (12.1) | 7 (10.3) |
Hypoesthesia | 1 (1.5) | 3 (4.5) | 7 (10.3) |
Migraine | 1 (1.5) | 2 (3.0) | 7 (10.3) |
Fall | 0 | 7 (10.6) | 6 (8.8) |
Joint swelling | 0 | 7 (10.6) | 5 (7.4) |
Oropharyngeal pain | 7 (10.6) | 8 (12.1) | 4 (5.9) |
Injection site pruritus | 0 | 8 (12.1) | 3 (4.4) |
SAEs, n (%) | |||
Patients with ≥ 1 SAE | 1 (1.5) | 10 (15.2) | 12 (17.6) |
Patients who stopped treatment due to AEs, n (%) | |||
Patients who stopped treatment | 0 | 0 | 0 |
Deaths, n (%) | |||
Patients who died | 0 | 0 | 1 (1.5) |
AEs of special interest, n (%) | |||
Injection site reactions | 8 (12.1) | 16 (24.2) | 8 (11.8) |
Hypersensitivity | 4 (6.1) | 6 (9.1) | 4 (5.9) |
Hyperphosphatemia | 0 | 4 (6.1) | 4 (5.9) |
Ectopic mineralization | 0 | 7 (10.6) | 0 |
Restless leg syndrome | 6 (9.1) | 10 (15.2) | 8 (11.8) |
AE = adverse event; SAE = serious adverse event; SAS = safety analysis set; TEAE = treatment-emergent adverse event.
aThis includes the treatment continuation period (week 24 to week 48), extension period I (week 48 to week 96), or extension period II (through week 149).
bThese were the most common TEAEs that occurred in 10% or more of patients in either study arm.
Source: Sponsor’s Summary of Clinical Evidence.23
Critical Appraisal
Internal Validity
The CL303 study was a double-blind, randomized trial with a 24-week placebo-controlled period, followed by an open-label treatment continuation phase (24 additional weeks, all patients receiving burosumab) and open-label treatment extension I (48 additional weeks) for adult patients with XLH. The additional data analyses for this reassessment of reimbursement focused on longer-term efficacy by comparing the within-group changes in the placebo-emergent group and the burosumab-emergent group at week 48 and week 96. Of note, the submission claimed an error in the stratification randomization process such that patients were randomized on the basis of the BPI average pain score rather than the BPI worst pain score, which affected the majority of patients. Analyses were conducted on the basis of actual randomization. Overall, there appeared to be a low risk of bias from the randomization process itself, as it was stratified and centrally conducted; treatment allocation concealment and blinding processes were not applicable to the data considered in the reassessment as the study design was open-label at week 48 and week 96.
Most baseline characteristics were balanced between study arms at randomization; however, there were some concerns with imbalances in certain medical characteristics, which may impact the outcomes. A numerically higher proportion of patients in the burosumab arm relative to the placebo arm had osteoarthritis (69.1% versus 57.6% of patients, respectively) and nephrocalcinosis (16.2% versus 7.6% of patients, respectively), and a numerically higher proportion of patients in the placebo arm relative to the burosumab arm had active pseudofractures at baseline (51.5% versus 41.6%, respectively). Osteoarthritis and pseudofractures both may cause pain and could bias the assessment of efficacy on outcomes pertaining to pain, and the imbalance in pseudofractures could impact the active pseudofracture healing outcome. Both of these outcomes may also impact the physical function outcome. This limitation would apply to the results at all time points (24 weeks, 48 weeks, and 96 weeks).
There are some major limitations pertaining to both the open-label study design and the statistical analyses, which may cast a degree of inconclusiveness on the sustainability of treatment effect at later time points. First, the sample size was powered only for the primary end point to demonstrate a statistically significant difference at week 24 for the primary outcome of serum phosphorus, and therefore there could be a lack of power for key secondary but clinically important outcomes, such as the PROs. This adds uncertainty to the exact magnitude of benefit for these outcomes. Of note, there were fluctuations in the primary outcome results at week 48 and week 96 — specifically, in the placebo-emergent group, the percentage of patients attaining serum phosphorus levels above the LLN was 89% at week 48 and 68% at week 96; in the burosumab-emergent group, this percentage remained nearly unchanged (83% at week 48 and 82% at week 96). The explanation for this is unclear. The concerns around statistical power apply particularly to the week 48 ad hoc analysis. First, since this analysis was not preplanned, it should be considered exploratory as the timing of this analysis relative to the rest of the week 48 analyses is not clear. Second, a total of 6 patients had discontinued from the placebo-emergent arm and 8 patients had discontinued from the burosumab-emergent arm as of week 96; given the relatively small sample size, this could represent a notable loss to follow-up. Third, by study design, at week 48 all patients crossed over to receive burosumab. The lack of control group impacts causal inference and it is therefore difficult to attribute the changes in efficacy outcomes and harms to burosumab alone during the open-label phases. This may be of particular importance for the harms results as a possible cumulative side effect burden was observed.
There are some limitations that impact the interpretation of the results. While there was likely a low risk of bias for the measurement of laboratory outcomes (serum phosphorus, 1,25(OH)2D, TmP/GFR, TRP, and BALP) as they were analyzed at a central laboratory, the reporting of PRO results, as subjective measures, could be impacted by the open-label design. In addition, information on unblinding for safety reasons or the measure of adherence to burosumab treatment was unavailable. Furthermore, there are some missing data for serum biomarkers and PRO scores (data from 59 patients in the placebo-emergent arm and from 58 patients in the burosumab-emergent arm were available at the 96-week mark), which were handled by exclusion from the analysis, but the potential impacts of this choice are not explored by sensitivity analysis relative to other missing data methods. For fracture outcomes, only targeted radiography was performed to check the progress of fractures after the initial scan at baseline, and these scans did not appear to be identifying new fractures, but tracking the progress of old ones. This could have impacted the detection of new fractures in particular, as the development or absence of fractures in non–X-rayed sites may be missed, which may bias the numbers of fractures in favour of healed ones. In addition, at week 48, patients in the burosumab-emergent arm had numerically higher rates of pain medication usage (63.5% of patients in the burosumab-emergent arm and 54.0% of patients in the placebo-emergent arm) and opioid use (20.6% of patients in the burosumab-emergent arm and 17.5% of patients in the placebo-emergent arm). These differences in the use of pain medications may bias the efficacy results, particularly of the WOMAC pain and BPI measures. Lastly, TEAE results were not reported separately for the placebo-controlled period and the open-label period in the burosumab-emergent cohort, and this could limit the comparability of the 2 treatment arms in terms of reporting the timing of TEAEs.
External Validity
Per the clinical expert consulted by CDA-AMC, the inclusion and exclusion criteria of the CL303 study were applicable and specific to patients with XLH, though they noted there remains a lack of data on what to do with a patient who is receiving burosumab and subsequently becomes pregnant. The study also focused on adult patients with XLH but did not specifically select patients diagnosed with XLH as adults; although this is likely a small number, this might impact the generalizability to this patient population. Furthermore, the patient population included was majority white and majority female, which could have under-represented patient populations that include Indigenous Peoples and males. Lastly, the majority of the patient population reported receiving vitamin D and phosphate before treatment with burosumab, which does not provide any information on the effectiveness of burosumab for treatment-naive adults with XLH.
There are limitations that affect the generalizability of these results to real-life situations. The frequent visits and dose adjustment protocols used in the trial setting may not exactly reflect daily clinical practice in Canada and therefore the optimized efficacy and safety profile during the trial may not be extrapolatable to the general patient population. Moreover, patients were prohibited from using certain concomitant medications such as pharmacologic vitamin D metabolites or analogues, oral phosphate, aluminum hydroxide antacids, acetazolamides, thiazides, bisphosphonate therapy, denosumab therapy, teriparatide therapy, or chronic use of systemic corticosteroids during the trial. This may not represent prescribing patterns in routine practice and may impact the generalizability of the findings from these additional data analyses for reassessment. For fracture healing, which may take longer to capture, the duration of the study may not have been a long enough time to fully determine the impact of burosumab on these outcomes. Furthermore, the PRO measures used in the study were noted by the clinical expert to not be routinely used in clinical practice, suggesting that the impact of treatment on subjective measures such as pain, fatigue, and stiffness in the clinical trial may not be easily translated into these settings. Lastly, while the sponsor provided MCIDs for the WOMAC, BPI, and BFI domain scores, it is important to note that apart from 2 domains of WOMAC, where a general population sample was cited by the sponsor, these MCIDs were derived from cross-sectional data (the UX023-CL001 study), phase II trial data (the UX023-CL203 study), and the CL303 pivotal trial data, all collected by the sponsor.25 The CL303 study is limited by being the same data used in the efficacy analyses, and the UX023-CL001 and UX023-CL203 studies are also limited by being cross-sectional data and having a small sample size (N = 20), respectively. There is therefore no external data in a reference population with XLH to use as a comparison for meaningful clinical change. Furthermore, the MCIDs were obtained through post hoc analysis and not from studies designed for this purpose, and should be considered exploratory thresholds. Therefore, there remains a lack of confirmatory data on the meaningfulness of these score changes in the general adult XLH population.
LTE Study
Content in this section has been informed by materials submitted by the sponsor. The following has been summarized and validated by the CDA-AMC review team.
Description of Study
The BUR02 study26,27 was an open-label, phase III study evaluating the long-term efficacy and safety of burosumab in adult patients with XLH. It was undertaken using patient populations that had completed the CL30320 or CL304 study.28 The CL303 trial20 was a phase III RCT that evaluated measures of phosphate metabolism, PROs, and fractures and pseudofractures in adults with XLH and is appraised in the Systematic Review section. The CL304 study was a phase III, single-arm study that evaluated measures of osteomalacia in patients with XLH who received burosumab treatment; it was not appraised in the current submission.28 Patients completing the CL303 trial were eligible to transition to the BUR02 study. However, there was an interval between the CL303 and BUR02 trials (a mean of 9 months; range, 6 months to 16 months) where interim burosumab treatment was provided via an early access program only to the patients for whom the drug supply was accessible. Therefore, some participants received compassionate burosumab treatment during this period whereas others did not. An exploratory analysis (not reported in this review) evaluated the effects of burosumab treatment continuation versus interruption. The time to implement compassionate use in each country varied and treatment during the interim period was not captured.40,61
The primary objective of the BUR02 trial was to evaluate the long-term impact of burosumab treatment on maintaining serum phosphate levels within the normal range. Secondary objectives were to assess the effects of burosumab on PROs, clinical laboratory tests, and ambulatory function.26
The planned duration of treatment in this study was until December 2021 or until burosumab became commercially available within each participating country. Due to the impact of COVID-19 and at the investigator’s discretion, patients were allowed to withdraw from the study sooner than December 2021.26 The end-of-study visit occurred 4 weeks (± 7 days) after the patient received their last dose of burosumab on the study. A safety follow-up telephone call occurred 12 weeks (± 7 days) after the patient’s final study site visit to collect information on any ongoing or new AEs, SAEs, or concomitant medications. The end of the study was defined as the last day that protocol-specified assessments were conducted for the last patient. The maximum planned study duration was approximately 140 weeks.26
An interim analysis was conducted and 2 data cut analyses were performed after the completion of week 12 and week 48 of the BUR02 trial to support a publication regarding the changes in outcomes between the CL303 and BUR02 trials, among the 31 patients from the CL303 study only, who enrolled in the BUR02 study.61 This section reports results from both the interim and final analysis provided by the submission.26,61
Populations
The inclusion and exclusion criteria for the BUR02 study were consistent with those of the CL303 and CL304 parent trials. Briefly, adult participants (aged 18 years to 65 years) with a confirmed diagnosis of XLH, biochemical findings consistent with XLH, and a BPI worst pain score of 4 or more and who had completed the CL303 or CL304 study — including the final study visit — were eligible for the BUR02 trial regardless of their response to primary or secondary end points in the CL303 and CL304 trials. Major exclusion criteria for both the BUR02 trial and the interim analysis were clinically significant hypocalcemia, hypercalcemia, or any other concurrent condition that would interfere with participation or affect safety.
Patients who did not complete the CL303 or CL304 trial were included on a case-by-case basis. The interim analysis evaluated a subset of the BUR02 study population that had previously enrolled in the CL303 study. It was noted in the submission that patients from the CL304 study could not be included in the interim analysis because their inclusion would violate the principles of the GEE model that was used in the interim analysis.
Interventions
Participants in the BUR02 study continued on the burosumab regimen they received at the end of the parent trials: SC burosumab every 4 weeks. Doses were rounded to the nearest 10 mg, and the dose was to remain fixed unless serum phosphorus levels increased to more than 5.0 mg/dL, at which point the dose would be reduced by half, or the patient’s body weight changed by more than 20% from baseline, at which point the dose would be recalculated to account for the new body weight.
Outcomes
The primary outcome in the BUR02 study was the proportion of patients attaining a mean trough serum phosphate level (i.e., the serum level just before the administration of the next burosumab dose) above the LLN. Secondary outcomes included the effects of continued burosumab treatment on laboratory markers — namely, serum 1,25(OH)2D, serum phosphate, urinary phosphate and renal phosphate reabsorption (TmP/GFR) — on PROs such as BPI, BFI, WOMAC, and the Short Form (36) Health Survey version 2, and on ambulatory function using the 6MWT. Harms outcomes were evaluated only in the final analysis by the incidence, frequency, and severity of AEs, TEAEs, and SAEs, including death.
Outcomes in the BUR02 study were generally defined and evaluated consistently with the methods of the CL303 study; the CL304 trial evaluated a smaller subset of PROs compared to the CL303 and BUR02 studies. The submission noted a couple of key differences between the CL303 and CL304 studies and the BUR02 trial. First, study samples were analyzed at different central laboratories for the BUR02 trial and the CL303 and CL304 studies, which used slightly different values for the LLN for each biochemical end point. Furthermore, only end point serum phosphate values were analyzed in the BUR02 trial while the CL303 study analyzed serum phosphorus levels at the midpoint and end point of the dose interval.
Statistical Analysis
No formal statistical testing was planned as part of the BUR02 study and all statistical analyses were descriptive and exploratory. No adjustment was made to account for multiplicity. Subgroups were predefined as patients who had taken placebo during the double-blind period from the CL303 study and patients who had received burosumab during the double-blind period of the CL303 study or during the CL304 study.
The final BUR02 trial analysis was based on the full analysis set that consisted of all enrolled patients who completed the CL303 and CL304 studies and received at least 1 burosumab dose during the BUR02 study. All changes were calculated from the BUR02 trial baseline; ad hoc analyses were also conducted to understand how outcomes had changed from the CL303 and CL304 studies baseline. The ad hoc analyses could not consider all PROs that were evaluated in the CL303 and BUR02 studies because the CL304 study evaluated a smaller subset of PROs. For the final BUR02 study analysis, study visits were described as starting at baseline (week 0b) and week 12b to week 144b.
The interim analysis considered patients from the CL303 trial and changes were calculated from the CL303 trial baseline using the same methods as those from the CL303 study. The change from the CL303 study baseline to each assessment time point in the CL303 and BUR02 trials was analyzed using a GEE repeated measures analysis to align with the methods used in the CL303 trial. The model included treatment, the actual randomization stratification factor based on BPI average pain (except the model for BPI worst pain), region, visit, and interaction of treatment-by-visit as fixed factors, adjusted for phase III baseline measurements. Compound symmetry was used as the covariance structure for the model, which specified constant variances for the assessments and constant covariances between the assessments over time. Nominal P values were calculated and these analyses were not adjusted to account for multiplicity. To differentiate the time points, study visits in the CL303 trial have been described as baseline and week 12a to week 96a, while study visits in the BUR02 trial have been described as week 0b to week 48b (where 0b corresponds to the BUR02 study entry or baseline).
Results
Patient Disposition
A total of 35 patients were enrolled at 10 centres: 34 patients from the CL303 study and 1 patient from the CL304 study. At the data cut-off in January 2021, 31 participants had received up to 48 weeks of further burosumab treatment. Patient disposition from both interim and final analyses is summarized in Table 19.
At the interim analysis, 31 (91.1%) patients from the CL303 trial had completed the 48-week treatment period in the BUR02 trial and there were no study or treatment discontinuations due to TEAEs or death. At the final analysis, all 35 patients from the CL303 and CL304 trials had received burosumab and 25 (71.4%) patients had completed the study. Ten (25%) patients prematurely terminated the study; common reasons for discontinuation were withdrawal of consent (2 patients) and “other reasons” (not specified, 8 patients). No patients discontinued due to AEs.
Table 19: Patient Disposition for BUR02 Study
Patient disposition | Interim BUR02 study analysis (N = 31) | Final BUR02 study analysis (N = 35) |
|---|---|---|
Screened, n | 34 | 35 |
Enrolled, n (%) | 34 (100) | 35 (100) |
Allocated to burosumab, n (%) | 34 (100) | 35 (100) |
Treated, n (%) | 34 (100) | 35 (100) |
Excluded from interim analysis, n (%) | 3 (8.8) | NA |
Withdrew consent | 2 (5.9) | NA |
Did not complete week 48b | 1 (2.9) | NA |
Completed week 48b, n (%) | 31 (91.1) | NA |
Completed BUR02 study, n (%) | NA | 25 (71.4) |
Early termination from study, n (%) | 0 | 10 (28.6) |
Withdrew consent | NA | 2 (5.7) |
Other reasons (not specified) | NA | 8 (22.9) |
NA = not applicable.
Sources: Sponsor’s interim analysis Clinical Study Report61 and BUR02 trial final Clinical Study Report.27
Baseline Characteristics
Demographics and baseline disease characteristics are presented in Table 20. At the interim analysis, data were available up to week 48b from 31 patients who had previously participated in the CL303 trial. The study population had a mean age of 40.1 (SD = 12.2) years, with 67.7% of patients being female. Most of the patients had pathogenic PHEX variants (87.1%) and histories of pain medication, orthopedic surgery, and osteoarthritis.
Table 20: Summary of Baseline Characteristics for BUR02 Study
Characteristic | Interim BUR02 study analysis (N = 31) | Final BUR02 study analysis (N = 35) |
|---|---|---|
Age (years) | ||
Mean (SD) | 40.1 (12.1) | 40.4 (11.7) |
Range | 18.5 to 59.9 | 18.5 to 59.9 |
Sex, n (%) | ||
Female | 21 (67.7) | 23 (65.7) |
Male | 10 (32.3) | 12 (34.3) |
Race, n (%) | ||
Asian | 1 (1.29) | 0 |
Black | 1 (1.29) | 1 (3.2) |
White | 33 (94.3) | 20 (96.8) |
Height (cm) | 154.4 (13.0) | 154.4 (12.4) |
BMI, kg/m2, mean (SD) | 27.7 (5.5) | 27.2 (5.6) |
PHEX gene variation, n (%) | ||
Pathogenic | 27 (87.1) | 29 (82.9) |
Likely pathogenic | 1 (3.2) | 3 (8.6) |
Significance uncertain | 2 (6.5) | 2 (5.7) |
None | 1 (3.2) | 1 (2.9) |
Any pain medication at baseline, n (%) | 25 (80.6) | 26 (76.5) |
Any opioid at baseline, n (%) | 8 (25.8) | 8 (22.9) |
Enthesopathy on radiograph, n (%) | 31 (100) | 34 (97.1) |
Nephrocalcinosis score > 0, n (%) | 17 (54.8) | 17 (48.6) |
Medical history, n (%) | ||
Orthopedic surgery | 20 (64.5) | 22 (64.5) |
Osteoarthritis | 20 (64.5) | 23 (65.7) |
BMI = body mass index; SD = standard deviation.
Source: Sponsor’s ad hoc analyses comparing the 2 patient populations.62
Concomitant Medications and Cointerventions
Concomitant vitamin D and analogues were common (88.6%) among the 35 patients enrolled in the BUR02 study. Based on the interim analysis, the number of patients using pain medication was 25 (81%) patients at the phase III baseline,16 (52%) patients at the open-label extension baseline, and 15 (48%) patients at the end of the open-label extension. Concomitant pain medications included anilides (80.0%), propionic acid derivatives (54.3%), natural opium alkaloids (22.9%), acetic acid derivatives and related substances (20.0%), opioids in combination with nonopioid analgesics (17.1%), and other opioids (17.1%). Glucocorticoids were used by 25.7% of patients and corticosteroids were used by 8.6% of patients.
At the end of the BUR02 study, 34 of the 35 (97.1%) patients continued to receive burosumab via the sponsor’s post-trial access program.
Exposure to Study Treatments
At the interim analysis, the mean burosumab dose at the CL303 trial baseline was 1.0 (SD = 0.06) mg/kg (range, 0.9 mg/kg to 1.1 mg/kg) and remained constant through week 48b of the BUR02 study. A slightly broader dose range was observed up to week 48b of the BUR02 study (0.8 mg/kg to 1.5 mg/kg).61
At the final analysis, all 35 patients had received all their scheduled doses; no doses were skipped. Among all 35 patients, the mean time from the first burosumab dose in the BUR02 trial to study completion or early withdrawal was 116.2 (SD = 30.7) weeks.27
Efficacy
Full results for the serum biomarker interim analysis are contained in Table 21, and results from the final analysis are in Table 22. Highlights of these results are summarized as follows.
Proportion of Patients With Serum Phosphate Levels Greater Than LLN
At baseline, when the patients had completed their scheduled burosumab treatment in their previous study (the CL303 or CL304 trial), 34.3% of patients had serum phosphate levels above the LLN. The proportion increased to 55.9% at week 12 and remained primarily within a range of 55% to 75% in subsequent visits. At the end of the study, 66.7% of the patients reported serum phosphate levels above the LLN (Table 22).
Key Serum Biomarkers
Ratio of Renal Tubular Maximum Phosphate Reabsorption Rate to Glomerular Filtration Rate
At the CL303 study baseline, the mean TmP/GFR was 0.55 (SD = 0.15) mmol/L and increased to 0.70 (SD = 0.26) mmol/L at week 12a, with that level sustained through both studies.
At the final analysis, the mean TmP/GFR was 0.62 (SD = 0.22) mmol/L and it increased to 0.69 (SD = 0.14) mmol/L at week 48b, with these levels sustained over time. At the end of the study, the mean TmP/GFR was 0.71 (SD = 0.20) mmol/L.
1,25(OH)2D Concentrations
At the interim analysis, the mean serum 1,25(OH)2D was 79.95 (SD = 29.77) pmol/L at the CL303 study baseline, 98.56 (SD = 30.27) pmol/L at week 48a, and 83.36 (SD = 32.97) pmol/L at week 72a. At the BUR02 study baseline, the mean serum 1,25(OH)2D was 78.43 (SD = 41.49) pmol/L and increased to 92.85 (SD = 36.06) pmol/L at week 12b, remaining consistent through to week 48b of the BUR02 study.
According to the final analysis, at baseline, the mean serum concentration of 1,25(OH)2D was 32.67 (SD = 16.35) pg/mL. At week 12, the 1,25(OH)2D concentration increased to 39.86 (SD = 15.57) pg/mL. At week 24, week 48, week 72, and week 96, the mean serum 1,25(OH)2D was 36.34 (SD = 9.80) pg/mL, 37.04 (SD = 7.83) pg/mL, 38.16 (SD = 11.30) pg/mL, and 41.01 (SD = 12.80) pg/mL, respectively. At the end of the study, the mean serum 1,25(OH)2D was 38.53 (SD = 12.70) pg/mL.
Table 21: Laboratory Tests of Efficacy (Interim Analysis)
Time point, mean (SD) | TmP/GFR (N = 31) | 1,25(OH)2D (pmol/L) (N = 31) |
|---|---|---|
CL303 study | ||
CL303 study baseline | 0.55 (0.15) n = 30 | 79.92 (29.25) n = 30 |
Week 12a | 0.70 (0.26) n = 28 | NR |
Week 24a | 0.64 (0.20) n = 31 | NR |
Week 36a | NR | NR |
Week 48a | 0.75 (0.23) n = 31 | 98.56 (30.27) n = 31 |
Week 72a | 0.68 (0.16) n = 30 | 83.36 (32.97) n = 30 |
Week 96a | 0.69 (0.18) n = 30 | 87.28 (27.81) n = 31 |
Interstudy period (variable length); BUR02 study | ||
Week 0b (BUR02 study entry) | 0.64 (0.22) n = 28 | 78.43 (41.49) n = 31 |
Week 12b | 0.66 (0.17) n = 29 | 92.85 (36.06) n = 30 |
Week 24b | 0.70 (0.18) n = 26 | 87.20 (22.21) n = 27 |
Week 36b | 0.74 (0.17) n = 24 | 94.86 (26.70) n = 26 |
Week 48b | 0.69 (0.15) n = 23 | 89.98 (18.38) n = 24 |
1,25(OH)2D = 1,25-dihydroxyvitamin D; NR = not reported; SD = standard deviation; TmP/GFR = ratio of renal tubular maximum phosphate reabsorption rate to glomerular filtration rate.
Sources: Sponsor’s BUR02 Clinical Study Report27 and additional information provided by the sponsor.61
Table 22: Laboratory Tests of Efficacy (Final Analysis)
Time point, mean (SD) | Patients attaining trough serum phosphorus > LLN N (%) | TmP/GFR (N = 35) | 1,25(OH)2D (pg/mL) (N = 35) |
|---|---|---|---|
Week 0b (BUR02 study entry) | 12 (34.3) n = 35 | 0.62 (0.22) n = 32 | 32.67 (16.35) n = 35 |
Week 12b | 19 (55.9) n = 34 | 0.66 (0.175) n = 33 | 39.86 (15.57) n = 34 |
Week 24b | 19 (59.4) n = 32 | 0.69 (0.18) n = 30 | 36.34 (9.80) n = 32 |
Week 36b | 22 (75.9) n = 29 | 0.73 (0.16) n = 26 | 39.28 (11.16) n = 28 |
Week 48b | 18 (66.7) n = 27 | 0.69 (0.14) n = 24 | 37.04 (7.83) n = 25 |
Week 60b | 15 (60.0) n = 25 | 0.68 (0.16) n = 23 | 36.92 (8.41) n = 25 |
Week 72b | 15 (53.6) n = 28 | 0.67 (0.19) n = 25 | 38.16 (11.30) n = 28 |
Week 84b | 16 (61.5) n = 26 | 0.70 (0.18) n = 24 | 42.00 (19.27) n = 25 |
Week 96b | 16 (64.0) n = 25 | 0.72 (0.15) n = 23 | 41.01 (12.80) n = 23 |
Week 108b | 16 (72.7) n = 22 | 0.74 (0.21) n = 20 | 42.41 (11.37) n = 19 |
Week 120b | 16 (94.1) n = 17 | 0.74 (0.14) n = 3 | 52.97 (6.21) n = 3 |
Week 132b | 3 (100) n = 3 | 0.63 (NE) n = 1 | 52.70 (NE) n = 1 |
Week 144b | 1 (100) n = 1 | — | — |
End of treatment in BUR02 study | 22 (66.7) n = 33 | 0.71 (0.20) n = 30 | 38.53 (12.70) n = 33 |
1,25(OH)2D = 1,25-dihydroxyvitamin D; LLN = lower limit of normal; NE = not estimable; SD = standard deviation; TmP/GFR = ratio of renal tubular maximum phosphate reabsorption rate to glomerular filtration rate.
Note: % = n/N assessed × 100 unless the denominator for the percentage calculation is specified.
Source: Sponsor’s BUR02 trial final Clinical Study Report.27
Patient-Reported Outcomes
WOMAC
The full results for relevant WOMAC domains are in Table 23 (interim analysis) and Table 24 (final analysis). In summary, based on the interim analyses in the CL303 study, the LSM of WOMAC stiffness scores was –14.77 (SE = 4.03) at week 36a and this reduction was sustained at all subsequent time points in the 2 studies. Similar results were reported for the WOMAC physical function score.
In the final analysis of the BUR02 study, the mean stiffness score was 55.15 (SD = 18.75) points at baseline, and the mean change was –3.13 (SD = 17.68) points at week 12. The mean stiffness scores were maintained at lower than baseline throughout subsequent visits. The mean changes in stiffness score from baseline to week 24, week 48, and week 96 were –9.19 (SD = 22.89) points, –8.62 (SD = 18.63) points, and –9.09 (SD = 20.48) points, respectively. At the end of the BUR02 study, the mean score decreased by –14.52 (SD = 22.61) points. Similar decreases were observed for the WOMAC pain score and physical function score.
Table 23: Patient-Reported WOMAC Outcomes From CL303 Study and BUR02 Study (Interim Analysis)
Time point | WOMAC stiffness (N = 31) | WOMAC pain (N = 31) | WOMAC physical function (N = 31) |
|---|---|---|---|
CL303 study | |||
CL303 study baseline, mean (SD) measured value | n = 31 64.11 (2.44) | n = 31 48.23 (2.38) | n = 31 51.94 (2.73) |
Week 12a, least squares mean CfB (SE) | n = 31 –6.31 (4.13) | n = 31 –5.58 (2.57) | n = 31 –9.28 (2.79) |
Week 24a, least squares mean CfB (SE) | n = 31 –4.35 (3.86) | n = 31 –3.88 (2.38) | n = 30 –7.64 (2.31) |
Week 36a, least squares mean CfB (SE) | n = 30 –14.77 (4.03) | n = 30 –10.13 (2.99) | n = 30 –14.34 (2.69) |
Week 48a, least squares mean CfB (SE) | n = 31 –19.41 (3.90) | n = 31 –15.51 (2.80) | n = 31 –15.22 (2.84) |
Week 72a, least squares mean CfB (SE) | n = 30 –16.39 (4.21) | n = 31 –10.62 (2.94) | n = 30 –13.98 (2.80) |
Week 96a, least squares mean CfB (SE) | n = 30 –21.39 (3.72) | n = 31 –14.79 (2.66) | n = 30 –17.38 (2.34) |
Interstudy period (variable length); BUR02 study | |||
Week 0b (BUR02 study entry), least squares mean CfB (SE) | n = 30 –11.30 (3.68) | n = 30 –8.22 (2.69) | n = 29 –10.76 (2.86) |
Week 12b, least squares mean CfB (SE) | n = 29 –14.84 (3.53) | n = 29 –8.47 (3.23) | n = 28 –15.08 (2.64) |
Week 24b, least squares mean CfB (SE) | n = 31 –19.93 (3.92) | n = 31 –14.38 (3.09) | n = 31 –15.84 (2.68) |
Week 36b, least squares mean CfB (SE) | n = 29 –19.51 (3.16) | n = 29 –15.41 (3.25) | n = 29 –17.88 (2.63) |
Week 48b, least squares mean CfB (SE) | n = 28 –22.93 (3.54) | n = 28 –13.84 (3.13) | n = 28 –18.03 (2.69) |
CfB = change from baseline; SD = standard deviation; SE = standard error; WOMAC = Western Ontario and McMaster Universities Osteoarthritis Index.
Note: Consistent with the CL303 study methods, the least squares mean CfB was calculated at the interim analysis using a generalized estimating equation relative to the CL303 study baseline.
Source: Sponsor’s interim analysis data tables (Table 2.2.2).61
Table 24: Patient-Reported WOMAC Outcomes From CL303 Study and BUR02 Study (Final Analysis)
Time point | WOMAC stiffness (N = 35) | WOMAC pain (N = 35) | WOMAC physical function (N = 35) |
|---|---|---|---|
CL303 study and CL304 study baseline, mean (SD) measured value | Not calculable; CL304 study did not record | Not calculable; CL304 study did not record | Not calculable; CL304 study did not record |
Week 96a, arithmetic mean CfB (SD) | Not calculable; CL304 study did not record | Not calculable; CL304 study did not record | Not calculable; CL304 study did not record |
Interstudy period (variable length) | |||
Week 0b, arithmetic mean CfB (SD) | Not calculable; CL304 study did not record | Not calculable; CL304 study did not record | Not calculable; CL304 study did not record |
BUR02 study | |||
Week 0b (BUR02 study baseline), mean (SD) measured value | n = 34 55.15 (18.75) | n = 34 42.65 (14.42) | n = 33 45.48 (17.20) |
Week 12b, arithmetic mean CfB (SD) | n = 32 –3.13 (17.68) | n = 32 –2.50 (12.38) | n = 30 –4.56 (11.12) |
Week 24b, arithmetic mean CfB (SD) | n = 34 –9.19 (22.89) | n = 34 –7.21 (13.32) | n = 33 –6.73 (11.85) |
Week 36b, arithmetic mean CfB (SD) | n = 32 –8.98 (22.50) | n = 32 –7.97 (14.02) | n = 31 –7.72 (11.67) |
Week 48b, arithmetic mean CfB (SD) | n = 29 –8.62 (18.63) | n = 29 –5.17 (13.06) | n = 28 –7.14 (11.11) |
Week 60b, arithmetic mean CfB (SD) | n = 2 –12.50 (17.68) | n = 2 –5.00 (28.28) | n = 2 –2.21 (21.83) |
Week 72b, arithmetic mean CfB (SD) | n = 15 –5.00 (21.55) | n = 15 –4.67 (12.74) | n = 14 –7.25 (12.53) |
Week 84b, arithmetic mean CfB (SD) | n = 3 –12.50 (25.00) | n = 3 –11.67 (12.58) | n = 2 –5.88 (8.32) |
Week 96b, arithmetic mean CfB (SD) | n = 22 –9.09 (20.48) | n = 22 –2.95 (12.79) | n = 21 –3.24 (10.80) |
Week 108b, arithmetic mean CfB (SD) | n = 0 — | n = 0 — | n = 0 — |
Week 120b, arithmetic mean CfB (SD) | n = 3 –12.50 (0.00) | n = 3 5.00 (5.00) | n = 3 –0.49 (6.63) |
Week 132b, arithmetic mean CfB (SD) | n = 1 0.00 (NE) | n = 1 5.00 (NE) | n = 1 1.47 (NE) |
Week 144b, arithmetic mean CfB (SD) | n = 0 — | n = 0 — | n = 0 — |
End of study and/or end of treatment, arithmetic mean CfB (SD) | n = 31 –14.52 (22.61) | n = 31 –7.42 (17.79) | n = 30 –7.45 (14.68) |
CfB = change from baseline; NE = not estimable; SD = standard deviation; WOMAC = Western Ontario and McMaster Universities Osteoarthritis Index.
Note: The arithmetic mean change from the BUR02 study baseline was calculated at the final analysis.
Source: Sponsor’s BUR02 trial final Clinical Study Report (Table 14.2.2.6.1 and Table 14.2.2.6.2).27
Brief Pain Inventory
The interim analysis results for the BPI are available in Table 25, and the final analysis results are in Table 26. Briefly, based on the interim analyses in the CL303 study, the LSM change from baseline in the BPI average worst pain scores at week 12a was −0.88 (SE = 0.281) and decreased from baseline at all subsequent time points in the 2 studies except for week 24a. The BPI pain interference scores had also decreased from baseline with an LSM change from baseline of −1.22 (SE = 0.309) at week 12a and at all subsequent time points in both studies except week 24a.
Similarly, according to the final analysis from the BUR02 trial, the mean BPI worst pain score was 5.78 (SD = 1.725) points at baseline. The mean changes in BPI worst pain score from baseline to week 12 was −0.51 (SD = 1.698) points and these levels were maintained at lower than baseline at week 24, week 36, week 48, week 72, and week 96.
The mean BPI pain severity score was 4.52 (SD = 1.657) points at baseline (N = 32), and the mean change in BPI worst pain score from baseline was −0.40 (SD = 1.416) points at week 12 (N = 12). These values were maintained throughout subsequent visits. The mean BPI pain interference score was 3.48 (SD = 2.135) points at baseline, and the mean change in the BPI pain interference score from baseline was −0.37 (SD = 1.862) points at week 24. The lower values were maintained throughout subsequent visits in the BUR02 trial.
Table 25: Patient-Reported BPI Outcomes From CL303 Study and BUR02 Study (Interim Analysis)
Time point | BPI worst pain (average) (N = 31) | BPI (pain severity) (N = 31) | BPI (pain interference) (N = 31) |
|---|---|---|---|
CL303 study | |||
CL303 study baseline, mean (SD) measured value | n = 31 6.74 (1.162) | n = 31 5.24 (1.651) | n = 31 5.06 (1.985) |
Week 12a, least squares mean CfB (SE) | n = 31 –0.88 (0.281) | n = 31 –0.79 (0.285) | n = 31 –1.22 (0.309) |
Week 24a, least squares mean CfB (SE) | n = 31 –0.67 (0.345) | n = 31 –0.27 (0.311) | n = 31 –0.90 (0.289) |
Week 36a, least squares mean CfB (SE) | n = 31 –1.43 (0.351) | n = 31 –1.16 (0.332) | n = 31 –1.60 (0.341) |
Week 48a, least squares mean CfB (SE) | n = 31 –1.60 (0.324) | n = 31 –1.46 (0.280) | n = 31 –1.94 (0.302) |
Week 72a, least squares mean CfB (SE) | n = 30 –1.47 (0.371) | n = 30 –1.55 (0.282) | n = 30 –1.83 (0.280) |
Week 96a, least squares mean CfB (SE) | n = 30 –1.77 (0.408) | n = 30 –1.95 (0.263) | n = 30 –2.32 (0.302) |
Interstudy period (variable length); BUR02 study | |||
Week 0b (BUR02 study entry), least squares mean CfB (SE) | n = 28 –1.27 (0.286) | n = 31 –0.98 (0.266) | n = 31 –1.86 (0.353) |
Week 12b, least squares mean CfB (SE) | n = 29 –1.13 (0.374) | n = 29 –1.14 (0.318) | n = 29 –1.52 (0.329) |
Week 24b, least squares mean CfB (SE) | n = 30 –1.40 (0.326) | n = 31 –1.49 (0.302) | n = 31 –1.92 (0.337) |
Week 36b, least squares mean CfB (SE) | n = 23 –1.87 (0.374) | n = 28 –1.92 (0.325) | n = 28 –2.19 (0.351) |
Week 48b, least squares mean CfB (SE) | n = 27 –1.82 (0.385) | n = 29 –1.78 (0.325) | n = 29 –2.18 (0.345) |
BPI = Brief Pain Inventory; CfB = change from baseline; SD = standard deviation; SE = standard error.
Note: Consistent with the CL303 study methods, the least squares mean CfB was calculated at the interim analysis using a generalized estimating equation relative to the CL303 study baseline.
Source: Sponsor’s interim analysis data tables (Table 2.2.2).61
Table 26: Patient-Reported BPI Outcomes From BUR02 Study (Final Analysis)
Time point | BPI worst pain (average) (N = 35) | BPI (pain severity) (N = 35) | BPI (pain interference) (N = 35) |
|---|---|---|---|
CL303 study and CL304 study baseline, mean (SD) measured value | n = 35 6.75 (1.115) | Not calculable; CL304 study did not record | n = 35 4.97 (1.940) |
Week 96a, arithmetic mean CfB (SD) | n = 33 –1.81 (2.539) | Not calculable; CL304 study did not record | n = 33 –2.25 (2.043) |
Interstudy period (variable length) | |||
Week 0b, arithmetic mean CfB (SD) | n = 32 –0.98 (1.944) | Not calculable; CL304 study did not record | n = 35 –1.48 (2.620) |
BUR02 study | |||
Week 0b (BUR02 study baseline), mean (SD) measured value | n = 32 5.78 (1.725) | n = 32 4.52 (1.657) | n = 35 3.48 (2.135) |
Week 12b, arithmetic mean CfB (SD) | n = 12 –0.51 (1.892) | n = 12 –0.40 (1.801) | n = 0 NR |
Week 24b, arithmetic mean CfB (SD) | n = 30 –0.40 (1.698) | n = 30 –0.40 (1.416) | n = 35 –0.37 (1.862) |
Week 36b, arithmetic mean CfB (SD) | n = 24 –0.43 (1.558) | n = 23 –0.30 (1.462) | n = 31 –0.68 (1.851) |
Week 48b, arithmetic mean CfB (SD) | n = 24 –0.53 (2.081) | n = 23 –0.36 (1.973) | n = 31 –0.40 (2.202) |
Week 60b, arithmetic mean CfB (SD) | n = 0 NR | n = 0 NR | n = 1 –0.71 (NE) |
Week 72b, arithmetic mean CfB (SD) | n = 21 –0.46 (2.178) | n = 21 –0.40 (2.224) | n = 28 –0.17 (2.170) |
Week 84b, arithmetic mean CfB (SD) | n = 0 NR | n = 0 NR | n = 3 –1.80 (1.477) |
Week 96b, arithmetic mean CfB (SD) | n = 22 –0.58 (1.820) | n = 21 –0.42 (1.907) | n = 22 –0.27 (2.115) |
Week 108b, arithmetic mean CfB (SD) | n = 0 NR | n = 0 NR | n = 0 NR |
Week 120b, arithmetic mean CfB (SD) | n = 1 1.25 (NE) | n = 1 –0.19 (NE) | n = 3 –0.38 (1.373) |
Week 132b, arithmetic mean CfB (SD) | n = 0 NR | n = 0 NR | n = 1 0.00 (NE) |
Week 144b, arithmetic mean CfB (SD) | n = 0 NR | n = 0 NR | n = 0 NR |
BPI = Brief Pain Inventory; CfB = change from baseline; NE = not estimable; NR = not reported; SD = standard deviation.
Note: The arithmetic mean change from the BUR02 study baseline was calculated at the final analysis.
Sources: Sponsor’s BUR02 trial final Clinical Study Report (Table 11-4, Table 14.2.2.4.1, Table 14.2.2.4.2, Table 14.2.2.4.3, and Table 14.2.2.4.4)27 and ad hoc analyses.62
Brief Fatigue Inventory
The interim results of the changes in BFI scores are available in Table 27 and those for the final analysis are in Table 28. Briefly, based on the interim analyses, the LSM of the BFI average worst fatigue scores decreased from baseline results and were consistent at all subsequent time points. Similar trends were observed for the BFI global fatigue score and fatigue interference score. The BFI fatigue severity scores had decreased from baseline with an LSM of −1.45 (SE = 0.45) at week 12a and results were consistent at all time points through to the end of the BUR02 trial.
According to the final analysis, at the baseline of the BUR02 study, the mean BFI worst fatigue score was 5.91 (SD = 1.75) points. The mean change in worst fatigue score from baseline to week 24, week 48, week 72, and week 96 were −0.49 (SD = 1.78) points, −0.46 (SD = 2.00) points, −0.34 (SD = 2.24) points, and −0.64 (SD = 1.73) points, respectively. Similar trends were observed for the BFI global fatigue score and fatigue interference score.
Table 27: Patient-Reported BFI Outcomes From CL303 Study and BUR02 Study (Interim Analysis)
Time point | BFI worst fatigue (average) (N = 31) | BFI global fatigue (N = 31) |
|---|---|---|
CL303 study | ||
CL303 study baseline, mean (SD) measured value | n = 31 7.04 (0.28) | n = 31 5.27 (0.39) |
Week 12a, least squares mean CfB (SE) | n = 31 –1.24 (0.43) | n = 31 –1.43 (0.41) |
Week 24a, least squares mean CfB (SE) | n = 31 –1.08 (0.45) | n = 31 –1.34 (0.38) |
Week 36a, least squares mean CfB (SE) | n = 31 –1.63 (0.47) | n = 31 –1.80 (0.43) |
Week 48a, least squares mean CfB (SE) | n = 31 –1.86 (0.47) | n = 31 –1.97 (0.38) |
Week 72a, least squares mean CfB (SE) | n = 30 –0.83 (0.47) | n = 30 –1.51 (0.37) |
Week 96a, least squares mean CfB (SE) | n = 30 –1.36 (0.52) | n = 30 –2.21 (0.38) |
Interstudy period (variable length); BUR02 study | ||
Week 0b (BUR02 study entry), least squares mean CfB (SE) | n = 28 –1.63 (0.48) | n = 31 –1.92 (0.40) |
Week 12b, least squares mean CfB (SE) | n = 29 –1.72 (0.54) | n = 29 –1.80 (0.41) |
Week 24b, least squares mean CfB (SE) | n = 30 –1.81 (0.46) | n = 31 –2.03 (0.41) |
Week 36b, least squares mean CfB (SE) | n = 24 –1.79 (0.47) | n = 29 –2.03 (0.35) |
Week 48b, least squares mean CfB (SE) | n = 27 –2.04 (0.50) | n = 29 –2.23 (0.42) |
BFI = Brief Fatigue Inventory; CfB = change from baseline; SD = standard deviation; SE = standard error.
Note: Consistent with the CL303 study methods, the least squares mean CfB was calculated at the interim analysis using a generalized estimating equation relative to the CL303 study baseline.
Source: Sponsor’s interim analysis data tables (Table 2.4.2).61
The WOMAC tool and select BPI and BFI scales were not assessed in the CL304 study. Therefore, the calculation of change from the preceding study baseline (part of the interim analyses) was not possible with the full sample of patients in the BUR02 study. Nevertheless, directionally consistent results in all evaluated outcomes were observed in the final analyses and ad hoc analyses across all patients who were enrolled in the BUR02 study (results shown in Table 24 and Table 26).
Table 28: Patient-Reported BFI Outcomes From BUR02 Study (Final Analysis)
Time point, mean | BFI worst fatigue (greatest) (N = 35) | BFI global fatigue (N = 35) |
|---|---|---|
CL303 study and CL304 study baseline, mean (SD) measured value | Not calculable; CL304 study did not record | Not calculable; CL304 study did not record |
Week 96a, arithmetic mean CfB (SD) | Not calculable; CL304 study did not record | Not calculable; CL304 study did not record |
Interstudy period (variable length) | ||
Week 0b, arithmetic mean CfB (SD) | Not calculable; CL304 study did not record | Not calculable; CL304 study did not record |
BUR02 study | ||
Week 0b (BUR02 study baseline), mean (SD) measured value | n = 31 5.91 (1.75) | n = 35 3.77 (2.26) |
Week 12b, arithmetic mean CfB (SD) | n = 12 –0.14 (1.75) | n = 33 –0.08 (1.41) |
Week 24b, arithmetic mean CfB (SD) | n = 29 –0.49 (1.78) | n = 35 –0.34 (1.62) |
Week 36b, arithmetic mean CfB (SD) | n = 24 0.13 (1.66) | n = 32 –0.31 (1.90) |
Week 48b, arithmetic mean CfB (SD) | n = 23 –0.46 (2.00) | n = 31 –0.39 (1.79) |
Week 60b, arithmetic mean CfB (SD) | n = 0 NR | n = 1 –2.33 (NE) |
Week 72b, arithmetic mean CfB (SD) | n = 21 –0.34 (2.24) | n = 29 –0.18 (1.88) |
Week 84b, arithmetic mean CfB (SD) | n = 0 NR | n = 3 –2.00 (1.94) |
Week 96b, arithmetic mean CfB (SD) | n = 21 –0.64 (1.73) | n = 22 –0.30 (1.73) |
Week 108b, arithmetic mean CfB (SD) | n = 0 NR | n = 0 NR |
Week 120b, arithmetic mean CfB (SD) | n = 1 –1.38 (NE) | n = 3 –1.44 (1.53) |
Week 132b, arithmetic mean CfB (SD) | n = 0 NR | n = 1 –0.67 (NE) |
Week 144b, arithmetic mean CfB (SD) | n = 0 NR | n = 0 NR |
End of study and/or end of treatment, arithmetic mean CfB (SD) | n = 0 NR | n = 31 –0.69 (1.90) |
BFI = Brief Fatigue Inventory; CfB = change from baseline; NE = not estimable; NR = nor reported; SD = standard deviation.
Note: The arithmetic mean change from BUR02 study baseline was calculated at the final analysis.
Sources: Sponsor’s BUR02 trial final Clinical Study Report (Table 14.2.2.5.1 and Table 14.2.2.5.2)27 and ad hoc analyses.62
6-Minute Walk Test
Results from the interim analysis of the ambulatory function as measured by 6MWT are available in Table 29 and results from the final analysis are in Table 30. Briefly, at the interim analysis, the 6MWT actual distance walked increased from the CL303 study baseline at week 24a with a mean change of 27.43 (SD = 9.03) m through to week 48b of the BUR02 study.
At the final analysis, at the baseline visit for the BUR02 trial, the mean actual distance walked was 393.3 (SD = 93.25) m. After the BUR02 trial entry and continuation with burosumab treatment, the mean changes in actual walking distance from baseline to week 12, week 24, week 48, week 72, and week 96 were 11.10 m, 18.55 m, 14.00 m, 18.73 m, and 12.22 m, respectively. At the end of the study, the mean changes in actual walking distance was 23.8 (SD = 78.21) m.
Table 29: Ambulatory Function During BUR02 Study (Interim Analysis)
Time point | 6MWT results, m (N = 31) |
|---|---|
CL303 study baseline, mean (SE) measured value | n = 31 360.06 (14.31) |
Week 12a, least squares mean CfB (SE) | n = 30 10.92 (9.59) |
Week 24a, least squares mean CfB (SE) | n = 31 27.43 (9.03) |
Week 36a, least squares mean CfB (SE) | n = 30 41.74 (9.16) |
Week 48a, least squares mean CfB (SE) | n = 31 54.40 (10.24) |
Week 72a, least squares mean CfB (SE) | n = 30 47.67 (11.77) |
Week 96a, least squares mean CfB (SE) | Not assessed |
Interstudy period (variable length) | |
Week 0b (BUR02 study entry), least squares mean CfB (SE) | n = 30 35.75 (14.00) |
Week 12b, least squares mean CfB (SE) | n = 29 50.80 (8.86) |
Week 24b, least squares mean CfB (SE) | n = 28 48.21 (10.25) |
Week 36b, least squares mean CfB (SE) | n = 22 43.42 (12.34) |
Week 48b, least squares mean CfB (SE) | n = 16 51.90 (12.18) |
6MWT = 6-minute walk test; CfB = change from baseline; SE = standard error.
Note: Consistent with the CL303 study methods, the least squares mean CfB was calculated at the interim analysis using a generalized estimating equation relative to the CL303 study baseline.
Source: Sponsor’s interim analysis data tables (Table 2.4.2).61
Table 30: Ambulatory Function During BUR02 Study (Final Analysis)
Time point | 6MWT results, m (N = 35) |
|---|---|
Week 0b (BUR02 study baseline), mean (SD) measured value | n = 33 393.33 (93.24) |
Week 12b, arithmetic mean CfB (SD) | n = 31 11.10 (46.68) |
Week 24b, arithmetic mean CfB (SD) | n = 31 18.55 (64.84) |
Week 36b, arithmetic mean CfB (SD) | n = 22 29.05 (71.24) |
Week 48b, arithmetic mean CfB (SD) | n = 15 14.00 (48.51) |
Week 60b, arithmetic mean CfB (SD) | n = 2 57.00 (59.40) |
Week 72b, arithmetic mean CfB (SD) | n = 11 18.73 (71.86) |
Week 84b, arithmetic mean CfB (SD) | n = 2 81.00 (29.70) |
Week 96b, arithmetic mean CfB (SD) | n = 18 12.22 (71.79) |
Week 108b, arithmetic mean CfB (SD) | Not assessed |
Week 120b, arithmetic mean CfB (SD) | n = 2 –4.50 (91.22) |
Week 132b, arithmetic mean CfB (SD) | Not assessed |
Week 144b, arithmetic mean CfB (SD) | Not assessed |
End of study and/or end of treatment, arithmetic mean CfB (SD) | n = 30 23.80 (78.21) |
6MWT = 6-minute walk test; CfB = change from baseline; SD = standard deviation.
Note: The arithmetic mean change from BUR02 study baseline was calculated at the final analysis.
Source: Sponsor’s BUR02 trial final Clinical Study Report (Table 14.2.2.2.1).27
Harms
Safety data were not evaluated as part of the interim analysis; full harms results from the final analysis are available in Table 31. At the final analysis, all patients had received all scheduled doses and no patients had skipped doses. Almost all patients (n = 34) experienced 1 or more TEAE but most events were mild to moderate in severity. Among the patients who experienced a TEAE, the most common TEAEs were vitamin D deficiency (55.9%), arthralgia (38.2%), and hypophosphatemia (26.5%). No notable differences were observed between the 2 subgroups in the BUR02 study.
Six patients experienced SAEs (17.1%); these events occurred in single patients from each subgroup. No patients experienced related treatment-emergent SAEs. No deaths or TEAEs leading to death were reported during this study. No patient had a TEAE that led to withdrawal of the study drug or study discontinuation. There was no notable difference in the overall incidence of AEs between the 2 subgroups.
Table 31: Summary of Harms Results During the Placebo-Controlled Treatment Period (SAS)
AE | Placebo in double-blind period of CL303 study (N = 18) | Burosumab in double-blind period of CL303 study or in CL304 study (N = 17) | All patients in BUR02 study (N = 35) |
|---|---|---|---|
≥ 1 TEAE, n (%) | 17 (94.4%) | 17 (100%) | 34 (97.1%) |
Most common TEAEs (≥ 5% of patients in all patients), n (%)a | |||
Musculoskeletal and connective tissue disorders | 12 (70.6%) | 11 (64.7%) | 23 (67.6%) |
Arthralgia | 7 (41.2%) | 6 (35.3%) | 13 (38.2%) |
Back pain | 2 (11.8%) | 3 (17.6%) | 5 (14.7%) |
Myalgia | 2 (11.8%) | 1 (5.9%) | 3 (8.8%) |
Arthritis | 1 (5.9%) | 1 (5.9%) | 2 (5.9%) |
Enthesopathy | 2 (11.8%) | 0 | 2 (5.9%) |
Muscular weakness | 1 (5.9%) | 1 (5.9%) | 2 (5.9%) |
Osteoarthritis | 1 (5.9%) | 1 (5.9%) | 2 (5.9%) |
Rotator cuff syndrome | 0 | 2 (11.8%) | 2 (5.9%) |
Infections and infestations | 11 (64.7%) | 11 (64.7%) | 22 (64.7%) |
Nasopharyngitis | 2 (11.8%) | 4 (23.5%) | 6 (17.6%) |
Tooth abscess | 2 (11.8%) | 3 (17.6%) | 5 (14.7%) |
Bronchitis | 0 | 3 (17.6%) | 3 (8.8%) |
Influenza | 2 (11.8%) | 1 (5.9%) | 3 (8.8%) |
COVID-19 | 0 | 2 (11.8%) | 2 (5.9%) |
Cystitis | 1 (5.9%) | 1 (5.9%) | 2 (5.9%) |
Ear infection | 1 (5.9%) | 1 (5.9%) | 2 (5.9%) |
Rhinitis | 1 (5.9%) | 1 (5.9%) | 2 (5.9%) |
Metabolism and nutrition disorders | 9 (52.9%) | 11 (64.7%) | 20 (58.8%) |
Vitamin D deficiency | 9 (52.9%) | 10 (58.8%) | 19 (55.9%) |
Hypophosphatemia | 3 (17.6%) | 6 (35.3%) | 9 (26.5%) |
General disorders and administration site conditions | 8 (47.1%) | 5 (29.4%) | 13 (38.2%) |
Injection site hypersensitivity | 3 (17.6%) | 3 (17.6%) | 6 (17.6%) |
Fatigue | 3 (17.6%) | 1 (5.9%) | 4 (11.8%) |
Injection site hematoma | 2 (11.8%) | 1 (5.9%) | 3 (8.8%) |
Nervous system disorders | 4 (23.5%) | 8 (47.1%) | 12 (35.3%) |
Headache | 2 (11.8%) | 3 (17.6%) | 5 (14.7%) |
Dizziness | 1 (5.9%) | 1 (5.9%) | 2 (5.9%) |
Hypoesthesia | 0 | 2 (11.8%) | 2 (5.9%) |
Migraine | 1 (5.9%) | 1 (5.9%) | 2 (5.9%) |
Investigations | 4 (23.5%) | 7 (41.2%) | 11 (32.4%) |
Blood cholesterol, increased | 1 (5.9%) | 2 (11.8%) | 3 (8.8%) |
Blood phosphorus, decreased | 1 (5.9%) | 2 (11.8%) | 3 (8.8%) |
Vitamin D, decreased | 1 (5.9%) | 2 (11.8%) | 3 (8.8%) |
Alanine aminotransferase, increased | 2 (11.8%) | 0 | 2 (5.9%) |
Amylase, increased | 1 (5.9%) | 1 (5.9%) | 2 (5.9%) |
Aspartate aminotransferase, increased | 2 (11.8%) | 0 | 2 (5.9%) |
Blood parathyroid hormone, increased | 0 | 2 (11.8%) | 2 (5.9%) |
Lipase, increased | 0 | 2 (11.8%) | 2 (5.9%) |
Gastrointestinal disorders | 7 (41.2%) | 3 (17.6%) | 10 (29.4%) |
Abdominal pain | 1 (5.9%) | 2 (11.8%) | 3 (8.8%) |
Toothache | 3 (17.6%) | 0 | 3 (8.8%) |
Injury, poisoning, and procedural complications | 2 (11.8%) | 5 (29.4%) | 7 (20.6%) |
Ligament sprain | 2 (11.8%) | 1 (5.9%) | 3 (8.8%) |
Postvaccination syndrome | 0 | 2 (11.8%) | 2 (5.9%) |
Respiratory, thoracic, and mediastinal disorders | 4 (23.5%) | 2 (11.8%) | 6 (17.6%) |
Oropharyngeal pain | 3 (17.6%) | 0 | 3 (8.8%) |
Cough | 1 (5.9%) | 1 (5.9%) | 2 (5.9%) |
Rhinorrhea | 1 (5.9%) | 1 (5.9%) | 2 (5.9%) |
Ear and labyrinth disorders | 2 (11.8%) | 3 (17.6%) | 5 (14.7%) |
Vertigo | 0 | 2 (11.8%) | 2 (5.9%) |
Immune system disorders | 2 (11.8%) | 3 (17.6%) | 5 (14.7%) |
Seasonal allergy | 2 (11.8%) | 1 (5.9%) | 3 (8.8%) |
Psychiatric disorders | 3 (17.6%) | 1 (5.9%) | 4 (11.8%) |
Anxiety | 2 (11.8%) | 0 | 2 (5.9%) |
Renal and urinary disorders | 3 (17.6%) | 0 | 3 (8.8%) |
Nephrolithiasis | 2 (11.8%) | 0 | 2 (5.9%) |
SAEs, n (%) | |||
Patients with ≥ 1 SAE | 3 (16.7%) | 3 (17.6%) | 6 (17.1%) |
Pericarditis | 1 (33.3%) | 0 | 1 (16.7%) |
Meniere disease | 0 | 1 (33.3%) | 1 (16.7%) |
Diverticulum, intestinal | 0 | 1 (33.3%) | 1 (16.7%) |
Procedural failure | 1 (33.3%) | 0 | 1 (16.7%) |
Drug hypersensitivity | 0 | 1 (33.3%) | 1 (16.7%) |
Respiratory tract infection | 1 (33.3%) | 0 | 1 (16.7%) |
Sciatica | 0 | 1 (33.3%) | 1 (16.7%) |
Patients who stopped treatment due to AEs, n (%) | |||
Patients who stopped treatment | 0 | 0 | 0 |
Deaths, n (%) | |||
Patients who died | 0 | 0 | 0 |
AEs of special interest, n (%) | |||
Injection site reactions | 3 (17.6%) | 3 (17.6%) | 6 (17.6%) |
Hypersensitivity | 0 | 1 (5.9%) | 1 (2.9%) |
Hyperphosphatemia | 0 | 0 | 0 |
Ectopic mineralization | Not recorded | Not recorded | Not recorded |
Restless leg syndrome | 1 (5.9%) | 0 | 1 (2.9%) |
AE = adverse event; SAE = serious adverse event; SAS = safety analysis set; TEAE = treatment-emergent adverse event.
aThis was calculated of the 34 (97.1%) patients who experienced 1 or more TEAE.
Source: Sponsor’s BUR02 trial final Clinical Study Report (Table 12-1, Table 12-2, Table 12-3, and Table 14.3.1.3).27
Critical Appraisal
Internal Validity
The study included a subset of patients who had completed the CL303 parent trial. Therefore, it is possible that patients who continued and remained on the treatment were also those who had good performance on the drug. This selection bias could potentially bias the results in favour of burosumab. Furthermore, the open-label designs of the BUR02 study could bias the assessment of subjective PRO results. In addition to this, the absence of control arms in both studies and the lack of data beyond week 96 in the BUR02 study make the conclusion of the long-term sustainability of treatment effect challenging.
The interim analysis showed that the clinical effect of burosumab reduced when treatment was interrupted and returned after patients resumed the medication, but the analysis was not based on the doses received by the patients and it cannot be confirmed whether there was a relationship between this and the LTE outcomes — for example, whether those who received 1 dose versus 6 doses of burosumab would have different outcomes. Furthermore, treatment history and concomitant medications during the gap between the pivotal studies and the BUR02 trial were not assessed, limiting the ability to interpret the outcomes appropriately.
External Validity
As the BUR02 study consisted of patients who took part in the parent studies (the CL303 and CL304 trials), it is reasonable to expect that the same strengths and limitations related to generalizability apply to the extension studies.
The patient population of those studies may not be reflective of the wider, more heterogeneous clinical population in terms of demographic and clinical characteristics, particularly as only a subset of patients in the CL303 trial continued on to the BUR02 trial; therefore, the results presented may differ from those observed in a real-world clinical setting. The study population was not reflective of the Canadian population (majority white and majority female) and therefore the patients enrolled may not have reflected the gender, racial, or ethnic diversity present in clinical settings. This may reduce the generalizability of results.
Studies Addressing Gaps in the Systematic Review Evidence
Content in this section has been informed by materials submitted by the sponsor. The following has been summarized and validated by the CDA-AMC review team.
A lack of comparative data on the standard of care (i.e., conventional therapy) was highlighted as a concern in the previous reimbursement review. The pivotal trial, the CL303 study, employed a crossover design with the placebo-controlled portion followed by an open-label extension, while the LTE, the BUR02 study, was also an open-label single-arm study. Given this, data from the first year of a real-world DMP that analyzed data from 2 matched cohorts of patients receiving either burosumab or conventional therapy was submitted to fill the gap. A summary of this study can be found in Table 32.
Table 32: Summary of Gaps in the Systematic Review Evidence
Evidence gap | Studies that address gaps | |
|---|---|---|
Study description | Summary of key results | |
Lack of evidence comparing burosumab to conventional therapy | Real-world DMP: This is an ongoing, longitudinal, multicountry program designed to characterize XLH disease progression and presentation as well as to investigate longitudinal changes in biomarkers, clinical measures, and patient and/or caregiver reported outcomes (year 1 data analysis available). | At year 1, a statistically significant difference in the proportion of patients in the burosumab cohort with serum phosphorus > LLN was reported compared to the conventional therapy cohort (58.3% of patients in the burosumab cohort > LLN and 28.6% of patients in the conventional therapy cohort > LLN; P = 0.0013). |
DMP = Disease Monitoring Program; LLN = lower limit of normal; XLH = X-linked hypophosphatemia.
Source: Sponsor’s Summary of Clinical Evidence.23
Description of Studies
The DMP is a 10-year cohort study intended to enrol at least 500 adult and pediatric patients with XLH at up to 39 sites in the US, Canada, and Latin America.29 Patients receiving burosumab in a real-world setting (i.e., outside of clinical trials), patients enrolled in the DMP after receiving burosumab in a clinical trial setting, and patients who were not receiving burosumab at all (i.e., receiving conventional therapy or no treatment) were included. The DMP initiated on July 16, 2018, and is estimated to complete in December 2032. Funding is provided by the sponsor for operation of the DMP. It is registered on ClinicalTrials.gov (NCT03651505).
Populations
Patient Selection
Details of the study design are in Figure 3. Briefly, included in the present submission was a retrospective analysis for year 1 of the DMP data (referred to as the DMP study) for adult patients with XLH only.63 Within the adult population, 5 cohorts were defined a priori based on their treatment:
patients previously enrolled in burosumab trials and rolling over into the DMP
patients receiving burosumab in a real-world setting who had received burosumab before DMP enrolment
patients receiving burosumab in a real-world setting who started burosumab after DMP enrolment
patients receiving conventional therapy who never received burosumab during the DMP (to date)
patients receiving no treatment and who also never received burosumab.
The analysis was done on 2 matched patient cohorts: patients who were reported to be receiving conventional therapy at baseline (July 16, 2018) and who never received burosumab during the DMP, and patients who reported receiving burosumab in a real-world setting and who started on burosumab at any point after DMP initiation. Patients in the burosumab cohort could therefore have been receiving conventional therapy or no therapy at baseline, but were included in the burosumab cohort as they initiated the treatment after the baseline visit. Adult patients who were enrolled in the DMP from the date of initiation through to the end of 2022 were eligible for inclusion.
Interventions
Patients enrolled in the DMP received burosumab, conventional therapy (oral phosphate and/or vitamin D analogues), and/or no therapy in their DMP site at the discretion of their treating physician and per the guidelines of the country or region they were being treated in. The submission noted that due to the rare nature of XLH, there are few treatment guidelines and it is unlikely that there would be great variation between countries in terms of practice.
Patients previously receiving burosumab in clinical trials were permitted to “roll over” to receive burosumab during the DMP period after they completed the preceding trial, but were not permitted to do so in the DMP while in a clinical trial unless approval was given from the sponsor. Per the submission, patients will be allowed to continue participating in the DMP regardless of any changes to their XLH treatment during the 10-year course of the DMP. Full details of the DMP, including inclusion and exclusion criteria, are in Table 33.
Table 33: Details of the Study Addressing Gaps in the Systematic Review Evidence
Detail | DMP study |
|---|---|
Designs and populations | |
Study design | Retrospective matched analysis of year 1 data from an ongoing, prospective, multicentre, longitudinal cohort study (DMP study) with 2 subgroups:
|
Enrolled, N | Overall DMP: N = 457 patients
|
Key inclusion criteria | Per investigator assessment:
|
Key exclusion criteria |
|
Drugs | |
Intervention | Per the discretion of treating physician (dosing information not available in submission):
|
Comparator(s) | Per the discretion of treating physician (dosing information and CT regimens not available in submission):
|
Outcomes | |
Primary end points |
|
Notes | |
Publications | None |
CT = conventional therapy; DMP = Disease Monitoring Program; LLN = lower limit of normal; WOMAC = Western Ontario and McMaster Universities Osteoarthritis Index; XLH = X-linked hypophosphatemia.
Sources: Sponsor’s Summary of Clinical Evidence23 and the Disease Monitoring Program Technical Report.63
Figure 3: Patient Cohort Selection From the DMP Study
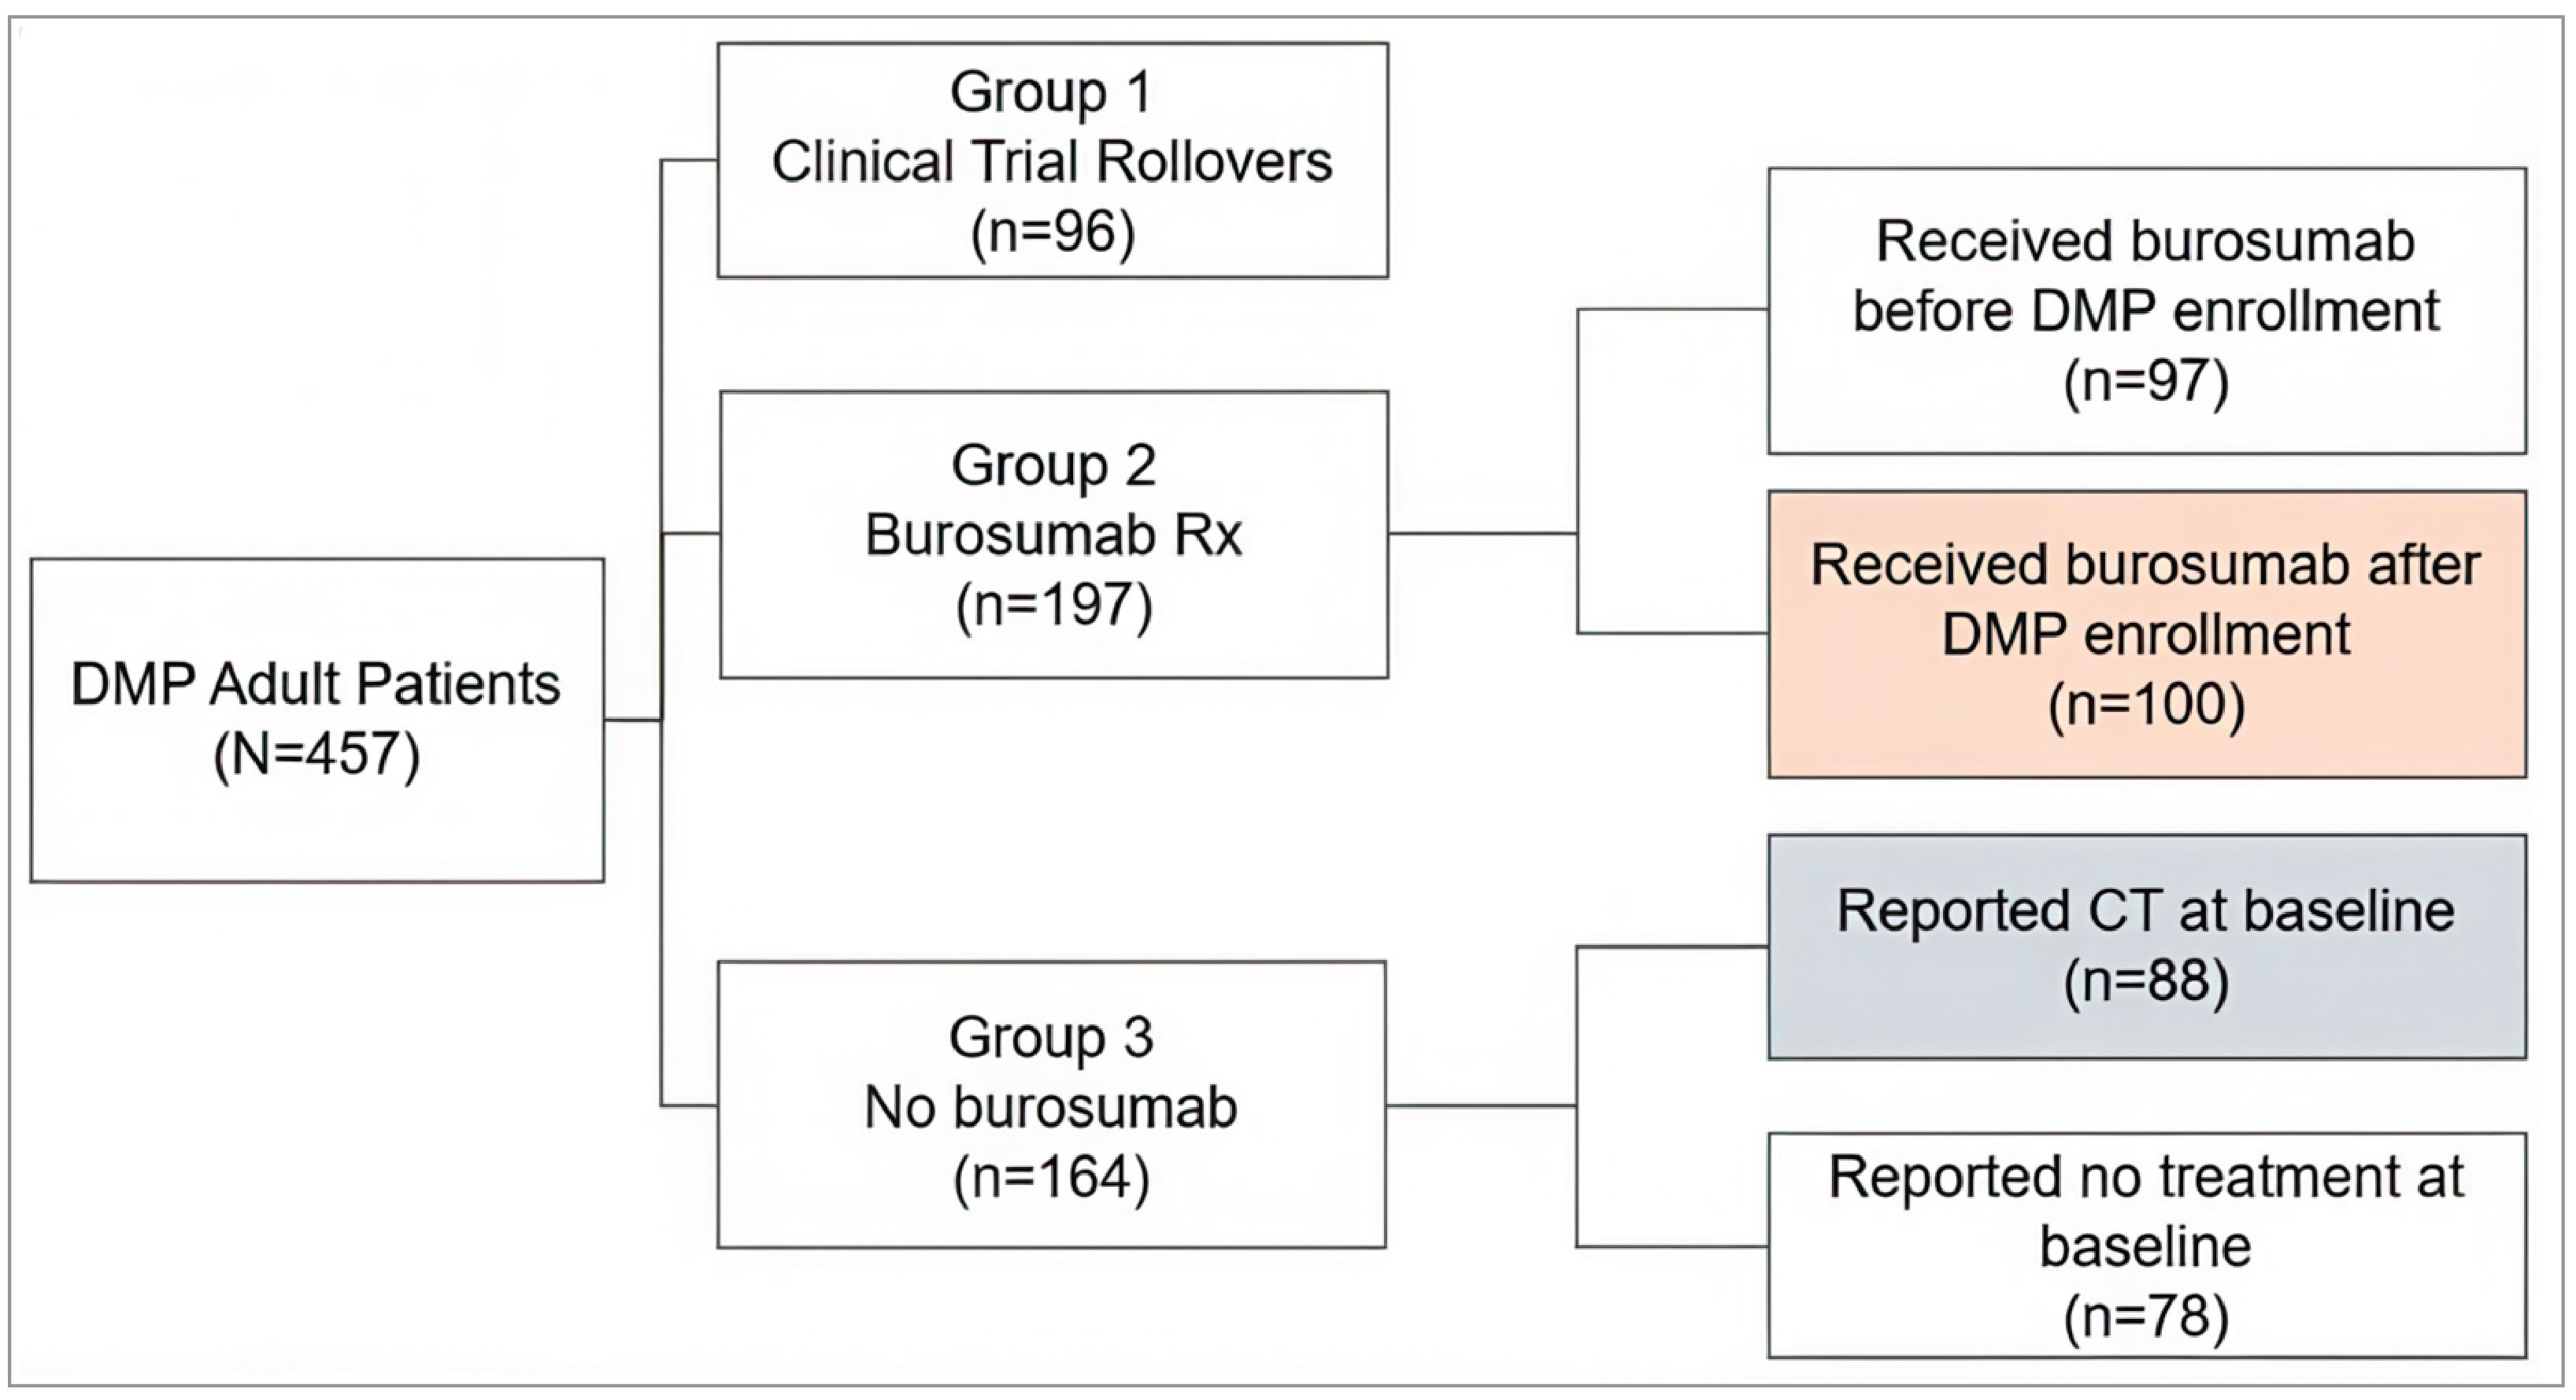
CT = conventional therapy; DMP = Disease Monitoring Program; Rx = prescription.
Source: Sponsor’s Summary of Clinical Evidence.23
Outcomes
The outcomes of interest were serum phosphate levels, WOMAC pain, WOMAC stiffness, and WOMAC physical function scores at the year 1 mark. Information on the outcomes of interest was collected per protocol, with no specific prioritization of outcomes. Information on outcomes was collected at the baseline visit and again at the approximate year 1 visit. A description of the specific outcomes and information on their validity can be found in the Outcomes subsection of the Systematic Review section of this report. Similar to the pivotal trial, the MCID for WOMAC scores was defined as a change from baseline of –11. 0 points or more for pain, –10.0 points or more for stiffness, and –8.0 points or more for physical function.
Data Collection
After consent and study enrolment, patients provided information on demographics, family history, diagnostic history, medical and surgical history, growth history, disease-specific clinical symptoms and progression, concomitant medications and therapies, disability, and quality of life. Disease-specific information included XLH-related gene mutations, laboratory results, and the results of any specialized testing, including but not limited to mobility, pulmonary, and cardiac function.
Data collected during in-clinic assessments at baseline and at the year 1 visit included measurement of the fasting serum phosphate level (a minimum 4-hour fast was required) and administration of the WOMAC index pain, stiffness, and physical function domains. Full details of the timing of data collection are in Figure 4.
Figure 4: Study Design for Year 1 Analysis of the DMP Study
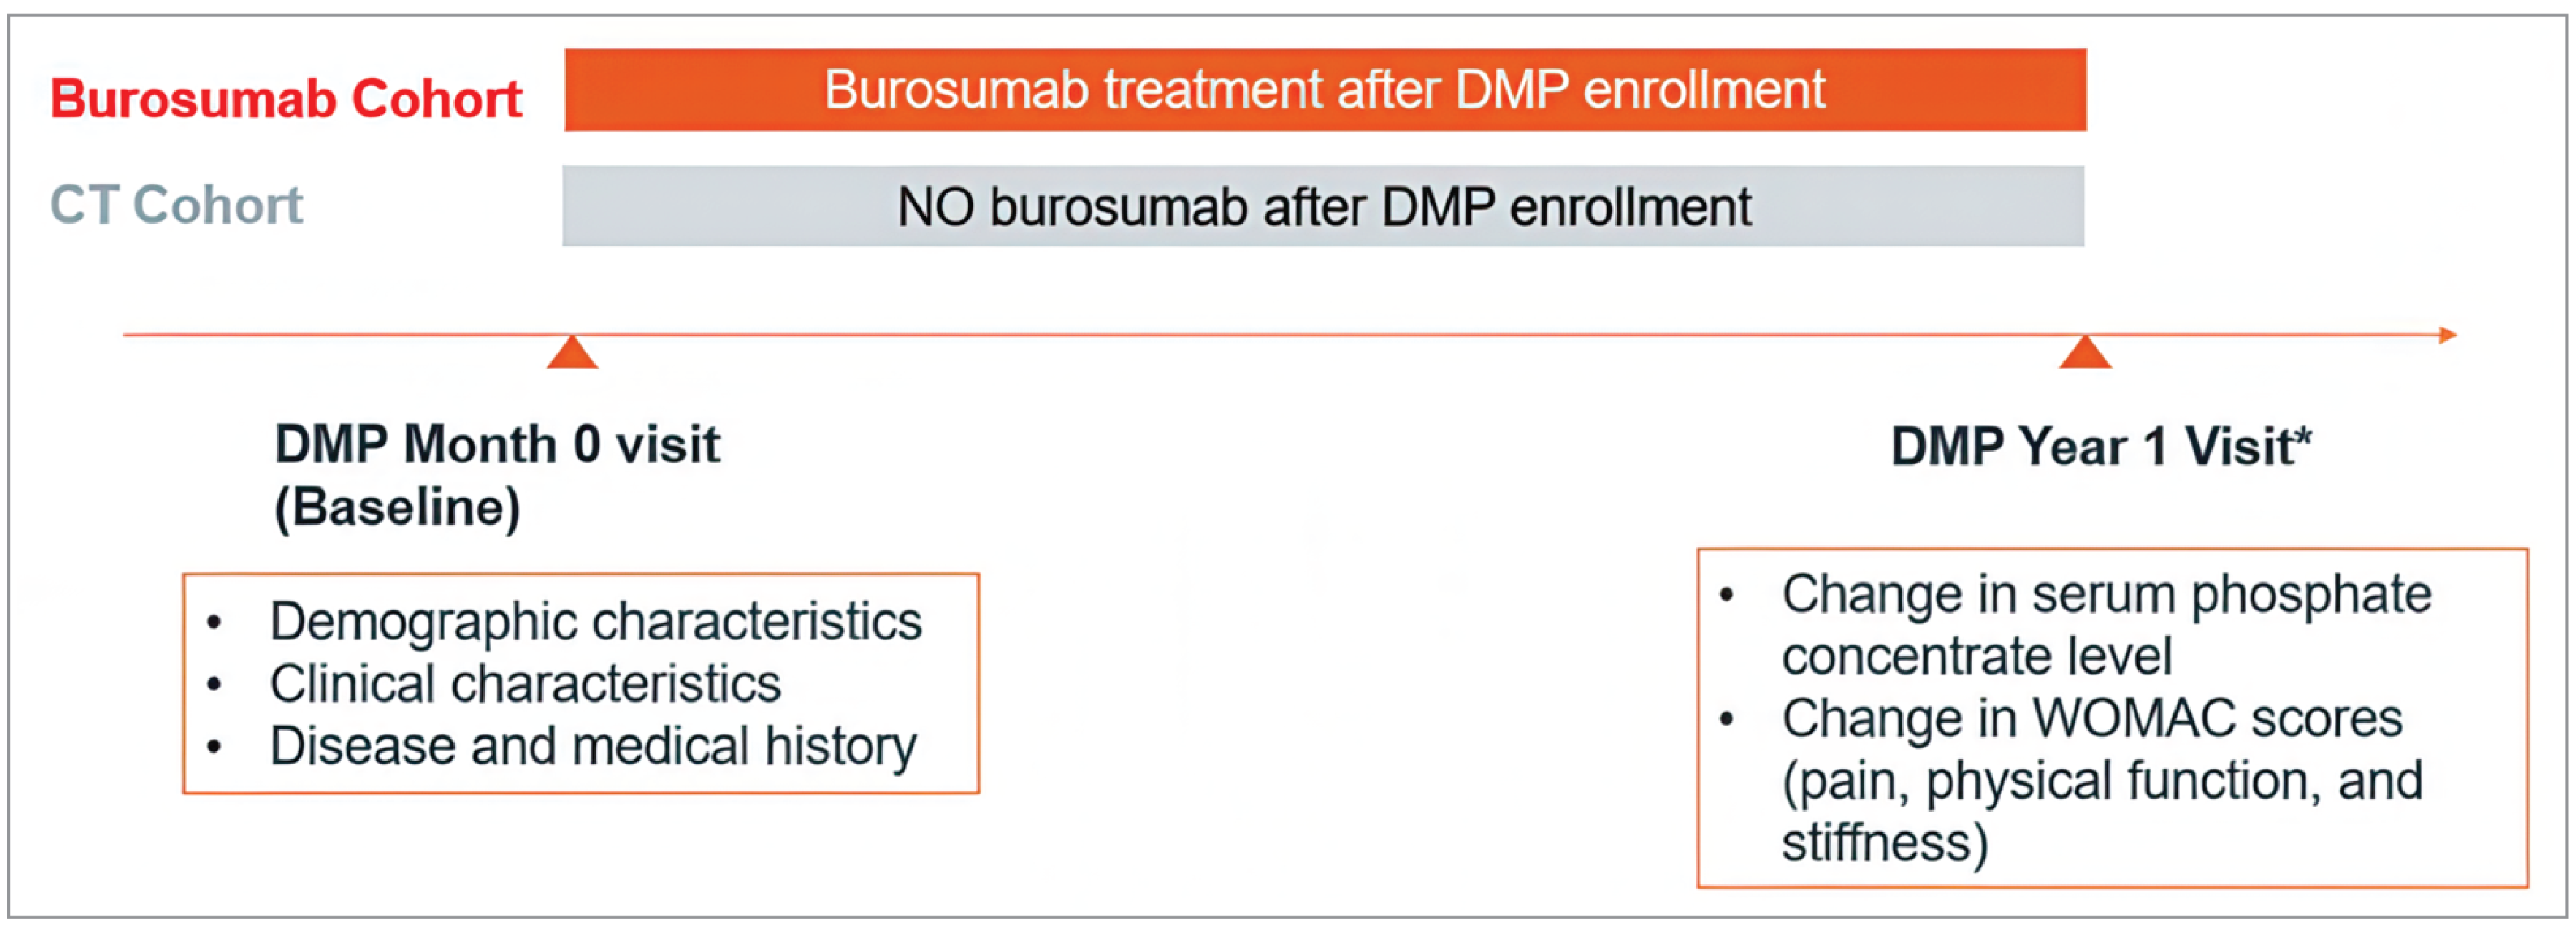
CT = conventional therapy; DMP = Disease Monitoring Program; WOMAC = Western Ontario and McMaster Universities Osteoarthritis.
*Year 1 visit was not at the exact 1-year mark.
Source: Sponsor’s Summary of Clinical Evidence.23
Statistical Analysis
PS Matching
The 2 patient cohorts were balanced on baseline characteristics using PS matching algorithms. The following baseline characteristics were included in the matching: demographics (age, race, and gender), clinical characteristics (weight, height, body mass index, serum phosphate, WOMAC pain score, WOMAC stiffness score, and WOMAC physical function score), and disease and/or medical characteristics (PHEX mutation positivity, age at XLH diagnosis, number of historical fractures, osteoarthritis, and enthesopathy and/or bone spurs and/or osteophytes).
A 1:1 greedy caliper PS matching was used with a predefined caliper width of 0.50. An exact match was required on gender and the matching occurred in descending order. Missing values for the number of fractures were imputed as 0, and other missing variables were imputed with the mean value for that variable.
General linear regressions were conducted as sensitivity analyses to determine associations between burosumab treatment and the outcomes studied. Parameters included in these regressions were treatment group, age, age at XLH diagnosis, gender, race, conventional therapy, treatment history, serum phosphate concentration level at baseline, WOMAC scores at baseline (all domains plus total score), weight, height, osteoarthritis, nephrocalcinosis and enthesopathy and/or bone spurs and/or osteophytes. Results were not available in the submission.
Analytical Methods
Patient baseline characteristics and disease history were summarized for both cohorts, before and after matching. All baseline assessments were summarized at the time of DMP enrolment. Mean changes to outcome variables between the baseline visit and the year 1 visit were calculated for the cohorts before and after matching; changes in outcomes were only calculated for those patients who had a baseline and year 1 measure for that outcome. Missing data were treated as missing without imputation for outcomes.
For continuous baseline variables, the F-test was performed to check for equality of variance between the 2 cohorts. Based on the P value of the F statistic (with the P value being at 5% level of significance), an equal or unequal variance student t test was used. For categorical baseline variables, a chi-square test was performed with a P value of 0.05 or less being considered statistically significant. There was no adjustment for multiple comparisons.
Results
Patient Disposition
Baseline Characteristics
Full baseline characteristics before and after matching can be found in Table 34. Briefly, several patient characteristics were similar between the burosumab and conventional therapy cohorts such as age, age at XLH diagnosis, nephrocalcinosis, receiving conventional therapy as a child, body mass index, and serum phosphate. The matching procedure balanced cohorts with respect to race, weight at baseline, height at baseline, and WOMAC pain and WOMAC stiffness scores. Matching did not attain balance between the cohorts in terms of ethnicity and country. A total of 44% of patients in the burosumab cohort reported receiving conventional therapy at baseline and 56% of patients reported receiving no treatment. All patients in the conventional therapy cohort reported receiving conventional therapy.
Table 34: Baseline Characteristics of DMP Cohorts Before and After Matching
Characteristic | Before matching | After matching | ||||
|---|---|---|---|---|---|---|
Burosumab (N = 100) | CT (N = 88) | P value | Burosumab (N = 71) | CT (N = 71) | P value | |
Demographic characteristics | ||||||
Age (years) | ||||||
Mean (SD) | 38.6 (14.10) | 40.5 (16.69) | 0.3908 | 38.2 (14.73) | 39.6 (16.92) | 0.591 |
Range | 18.3 to 73.2 | 18.2 to 82.8 | 18.5 to 73.2 | 18.2 to 82.8 | ||
Sex, n (%) | ||||||
Female | 74 (74.0) | 72 (81.8) | 0.1991 | 58 (81.7) | 58 (81.7) | 1.0000 |
Male | 26 (26.0) | 16 (18.2) | 13 (18.3) | 13 (18.3) | ||
Race, n (%) | ||||||
White | 70 (70.0) | 72 (81.8) | 0.0162 | 59 (83.1) | 57 (80.3) | 0.8047 |
Other races | 5 (5.0) | 8 (9.1) | 4 (5.6) | 6 (8.5) | ||
Unknown | 25 (25.0) | 8 (9.1) | 8 (11.3) | 8 (11.3) | ||
Ethnicity, n (%) | ||||||
Hispanic or Latino | 11 (11.0) | 59 (67.0) | < 0.0001 | 9 (12.7) | 43 (60.6) | < 0.0001 |
Not Hispanic or Latino | 66 (66.0) | 23 (26.1) | 56 (78.9) | 22 (31.0) | ||
Other | 23 (23.0) | 6 (6.8) | 6 (8.5) | 6 (8.5) | ||
Country, n (%) | ||||||
Argentina | 0 (0.0) | 3 (3.4) | < 0.0001 | 0 (0.0) | 2 (2.8) | < 0.0001 |
Brazil | 4 (4.0) | 31 (35.2) | 3 (4.2) | 23 (32.4) | ||
Canada | 21 (21.0) | 7 (8.0) | 9 (12.7) | 7 (9.9) | ||
Chile | 0 (0.0) | 22 (25.0) | 0 (0.0) | 16 (22.5) | ||
Colombia | 2 (2.0) | 2 (2.3) | 2 (2.8) | 2 (2.8) | ||
US | 73 (73.0) | 23 (26.1) | 57 (80.3) | 21 (29.6) | ||
Clinical characteristics | ||||||
Age at XLH diagnosis (years) | ||||||
Mean (SD) | 10.6 (17.89) | 8.8 (13.59) | 0.4308 | 9.9 (17.01) | 8.4 (13.84) | 0.5860 |
Range | –0.1 to 71.7 | –0.1 to 81.9 | –0.1 to 66.8 | –0.1 to 81.9 | ||
Family PHEX mutation positive, n (%) | ||||||
Yes | 47 (47.0) | 43 (48.9) | 0.1104 | 32 (45.1) | 36 (50.7) | 0.3456 |
No | 28 (28.0) | 33 (37.5) | 21 (29.6) | 24 (33.8) | ||
Unsure | 25 (25.0) | 12 (13.6) | 18 (25.4) | 11 (15.5) | ||
Number of fractures | ||||||
Patients with a fracture, n (%) | 43 (43.0) | 44 (50.0) | 0.2189 | 27 (38.0) | 35 (49.3) | 0.1174 |
Mean (SD) | 5.7 (12.88) | 3.2 (3.12) | 2.4 (2.04) | 3.5 (3.40) | ||
Medical history, n (%) | ||||||
Osteoarthritis | 46 (46.0) | 35 (39.8) | 0.3896 | 27 (38.0) | 28 (39.4) | 0.8632 |
Enthesopathy and/or bone spurs and/or osteophytes | 54 (54.0) | 41 (46.6) | 0.3106 | 33 (46.5) | 31 (43.7) | 0.7359 |
Nephrocalcinosis | 18 (18.0) | 16 (18.2) | 0.9742 | 16 (22.5) | 13 (18.3) | 0.5323 |
CT as a child | 79 (79.0) | 69 (78.4) | 0.9213 | 56 (78.9) | 55 (77.5) | 0.8390 |
Weight at baseline (kg) | ||||||
N (missing) | 98 (2) | 85 (3) | 0.0040 | 70 (1) | 69 (2) | 0.3876 |
Mean (SD) | 74.2 (18.93) | 66.5 (16.44) | 71.3 (16.83) | 68.8 (17.03) | ||
Height at baseline (cm) | ||||||
N (missing) | 86 (14) | 85 (3) | 0.0003 | 61 (10) | 68 (3) | 0.2591 |
Mean (SD) | 153.1 (9.20) | 147.6 (10.25) | 152.2 (9.12) | 150.3 (9.20) | ||
Body mass index (kg/m2) | ||||||
N (missing) | 85 (15) | 82 (6) | 0.4787 | 60 (11) | 66 (5) | 0.8512 |
Mean (SD) | 31.4 (8.01) | 30.6 (7.35) | 31.0 (8.27) | 30.7 (7.87) | ||
Serum phosphate level (mg/dL) | ||||||
N (%) with value at baseline | 99 (99.0) | 87 (98.9) | 0.2327 | 70 (98.6) | 70 (98.6) | 0.5516 |
Mean (SD) | 2.2 (0.41) | 2.2 (0.44) | 2.2 (0.44) | 2.2 (0.47) | ||
WOMAC pain | ||||||
N (%) with score at baseline | 98 (98.0) | 86 (97.7) | 0.0263 | 69 (97.2) | 70 (98.6) | 0.7114 |
Mean (SD) | 36.1 (23.28) | 28.3 (24.31) | 30.9 (20.09) | 29.4 (25.39) | ||
WOMAC physical function | ||||||
N (%) with value at baseline | 97 (97.0) | 86 (97.7) | 0.5228 | 68 (95.8) | 70 (98.6) | 0.5846 |
Mean (SD) | 32.4 (25.13) | 30.0 (26.10) | 27.6 (23.16) | 29.9 (25.91) | ||
WOMAC stiffness | ||||||
N (%) with value at baseline | 98 (98.0) | 87 (98.9) | 0.0086 | 69 (97.2) | 70 (98.6) | 0.3560 |
Mean (SD) | 49.1 (25.27) | 38.5 (28.99) | 44.7 (24.39) | 40.5 (28.98) | ||
WOMAC total | ||||||
N (%) with value at baseline | 98 (98.0) | 87 (98.9) | 0.0019 | 69 (97.2) | 70 (98.6) | 0.6454 |
Mean (SD) | 39.2 (25.52) | 32.3 (26.82) | 34.4 (23.71) | 33.3 (27.17) | ||
CT = conventional therapy; DMP = Disease Monitoring Program; SD = standard deviation; WOMAC = Western Ontario and McMaster Universities Osteoarthritis Index; XLH = X-linked hypophosphatemia.
Sources: Sponsor’s Summary of Clinical Evidence23 and Disease Monitoring Program Technical Report.63
Exposure to Study Treatments
Because treatment history, dosing, and frequency of medications was not captured in the DMP study or was not available for all patients, exposure to study treatments could not be assessed in detail. The submission noted that there was a mean delay of 245.8 (SD = 275.2) days in initiating burosumab in that cohort. In addition, the year 1 visit for patients occurred an average of 408.8 (SD = 94.0) days after the baseline visit in the burosumab cohort and 431.3 (SD = 89.3) days in the conventional therapy cohort; the submission speculated that real-world practice and the COVID-19 pandemic may have been factors for the delays.
Table 35: Treatment Exposure in the Matched DMP Cohorts
Factor | Matched cohort | P value | |
|---|---|---|---|
Burosumab (N = 71) | Conventional therapy (N = 71) | ||
Receiving conventional therapy at baseline, n (%) | 27 (38.0) | 71 (100.0) | NR |
Time between baseline and year 1 visit | |||
Complete cases, n (%) | 60 (84.5) | 56 (78.9) | 0.1887 |
Mean (SD) days between visits | 408.8 (94.0) | 431.3 (89.3) | |
Time between baseline and first burosumab dose | |||
Complete cases, n (%) | 69 (97.2) | NR | NR |
Mean (SD) days until first burosumab dose | 245.8 (275.2) | NR | |
DMP = Disease Monitoring Program; NR = not reported; SD = standard deviation.
Source: Sponsor’s Summary of Clinical Evidence.23
Efficacy
Full efficacy results are available in Table 36. Briefly, a total of 20.0% of patients had serum phosphate levels greater than LLN at baseline and at the year 1 visit, 58.3% of patients had serum phosphate levels greater than LLN. The year 1 results attained statistical significance relative to the conventional therapy cohort (28.6% of patients at year 1; P value = 0.0013).
There was no significant difference between the 2 cohorts in terms of the change in WOMAC physical function or WOMAC stiffness scores, nor was there a difference in the proportion of patients attaining the MCIDs provided by the submission. The mean change in WOMAC pain scores was also not significant between the 2 cohorts; however, the proportion of patients attaining the MCID provided by the submission was significant (37.3% of patients in the burosumab cohort and 12.3% of patients in the conventional therapy cohort; P value = 0.0019).
Table 36: Key Efficacy Results From the Matched DMP Cohorts
Variable | Matched cohort | P value | |
|---|---|---|---|
Burosumab N = 71 | Conventional therapy N = 71 | ||
Proportion of patients with serum phosphate levels > LLN, n (%) | |||
Baseline | 12 (20.0) | 8 (14.3) | 0.4156 |
Year 1 | 35 (58.3) | 16 (28.6) | 0.0013 |
WOMAC pain | |||
Complete cases, n (%) | 57 (80.3) | 59 (83.1) | |
Baseline score | 31.2 (19.66) | 29.3 (26.65) | |
Year 1 score | 25.6 (21.42) | 29.6 (26.88) | |
Change in score, mean (SD) | –5.6 (19.41) | 0.3 (13.51) | 0.0614 |
Patients attaining MCID,a n (%) | 22 (37.3) | 7 (12.3) | 0.0019 |
WOMAC physical function | |||
Complete cases, n (%) | 59 (83.1) | 57 (80.3) | |
Baseline score | 26.5 (22.67) | 30.0 (27.46) | |
Year 1 score | 23.0 (21.71) | 29.1 (26.28) | |
Change in score, mean (SD) | –3.6 (16.67) | –0.8 (15.42) | 0.3597 |
Patients attaining MCID,a n (%) | 29 (49.2) | 20 (35.1) | 0.1252 |
WOMAC stiffness | |||
Complete cases, n (%) | 59 (83.1) | 57 (80.3) | |
Baseline score | 44.5 (24.04) | 40.8 (30.30) | |
Year 1 score | 36.20 (22.11) | 38.4 (27.43) | |
Change in score, mean (SD) | –8.3 (21.85) | –2.4 (19.83) | 0.1342 |
Patients attaining MCID,a n (%) | 19 (32.2) | 13 (22.8) | 0.2576 |
DMP = Disease Monitoring Program; LLN = lower limit of normal; MCID = minimal clinically important difference; SD = standard deviation; WOMAC = Western Ontario and McMaster Universities Osteoarthritis Index.
aThe MCID for WOMAC pain was –11.0 points or more from baseline, for WOMAC stiffness was –10.0 points or more from baseline, and for WOMAC physical function was –8.0 points or more from baseline. All MCIDs were provided by the sponsor.
Sources: Sponsor’s Summary of Clinical Evidence23 and the Disease Monitoring Program Technical Report.63
Harms
Information on harms was not included in the submission.
Critical Appraisal
To fill the evidence gap of there being no comparative data for burosumab treatment versus conventional therapy in the CL303 pivotal trial, a retrospective analysis of the first year of data collected for an ongoing DMP was also submitted. Per the submission, the DMP is scheduled to run for 10 years. The patient population contained in the year 1 analysis was allowed to be refractive from clinical trials but not actively in 1 without approval, which would provide information on a real-world treatment approach. Furthermore, patients in the burosumab cohort provided in this submission were not yet on burosumab at the time of enrolment, which would provide information on newly initiated burosumab treatment outcomes.
The design of the study is subject to some notable limitations due to missing key information. The first and most important limitation is that it is unclear when the initiation of burosumab occurred in the burosumab cohort, yet patients in the burosumab cohort were classified there even if they were not receiving burosumab therapy for the entire study duration. Related to this, the treatment patterns of the cohort after baseline but before burosumab initiation are not known. It is therefore likely that the results could be biased because some amount of time during year 1 (on average, more than half of the time) between baseline and year 1 will include time spent either receiving conventional therapy or no therapy, rather than burosumab. This may bias the results in favour of conventional therapy as both arms may be receiving the same treatment or no treatment and may underestimate the improvement of outcomes associated with burosumab. A second important limitation is that the dosing of all therapies during the study, conventional or burosumab, is largely unknown. While transparently discussed in the submission, this remains an important consideration as potential variations in real-world practice or differences in the degrees of patient adherence to therapy are unaccounted for in the assessment. This could impact the classification of the intervention in both arms as burosumab requires regular injections while conventional therapy requires multiple doses of medication per day; by extension, the degree to which real-world dosing variations impact the results are unknown. In addition, there was no information provided on recruitment methods of sites or patients; therefore, the study settings are largely unknown. This could bias the results if certain practice sites or patients would be more or less likely to enrol in the cohort study (e.g., hospital settings versus outpatient or community settings). Furthermore, there is no information on which point in the dosing cycle (e.g., midpoint, end point) the serum phosphorus results were measured. Since the pivotal trial demonstrated that there are notable variations in the proportion of patients with serum phosphate levels greater than LLN at the end point versus the midpoint of the dosing cycle, this could impact the interpretation of the results for serum phosphorus and render inference uncertain. As a final note, the results must also be interpreted in the context of there being no harms data reported, which is an important consideration as this leaves a considerable knowledge gap in understanding the full impact of burosumab treatment in a real-world setting. Overall, the potential biases imparted by the presence of missing information greatly complicates any inference from the results and renders it difficult to draw conclusions regarding the causal relationship between burosumab treatment and patient outcomes in a real-world setting.
In addition to this, the study methods are subject to limitations. First, the patients in the burosumab cohort could have comprised both patients who had been receiving conventional therapy at baseline and those who hadn’t been receiving any therapy — the magnitude of benefit due to burosumab treatment may vary within subgroups of patients based on their previous treatment patterns, which is not explored in sensitivity analyses in the cohort study. Furthermore, there is no discussion of the methods used to identify the variables included in the PS matching. The matching itself did not attain numeric balance on fractures (38.0% in the burosumab cohort versus 49.3% in the conventional therapy cohort; P = 0.1174), and differences persisted in the matched cohorts for the country and ethnicity variables. As such, any differences in these variables would not be controlled for in this analysis. Lastly, there is also the possibility of selection bias as approximately half the patients entering the burosumab cohort had no treatment at baseline and without treatment history, it isn’t known whether these patients were refractory to conventional therapy or whether their disease activity levels were such that it was not needed.
Lastly, there are limitations on the generalizability of this cohort study. Less than a quarter of participants were from Canada, and therefore results may not translate directly to the characteristics of this clinical population. In addition, with an average of 245.8 days until the first burosumab exposure and a mean duration between visits of 408.8 days, the burosumab cohort was treated for less time than those in the pivotal clinical trial and the LTE, limiting the applicability of these results to longer time periods. Furthermore, similar to the CL303 pivotal trial, the cohort study used the same MCIDs and therefore the same limitations apply regarding the lack of an externally validated measure of clinical meaningfulness.
Discussion
Summary of Available Evidence
The current submission was a reassessment of part of the original submission on burosumab. In the previous submission, the Canadian Drug Expert Committee recommended reimbursing burosumab if initiated in pediatric patients but identified key gaps in evidence for the reimbursement request in adults with XLH. Hence, the Canadian Drug Expert Committee recommended not to reimburse burosumab if initiated in adult patients. This review is targeted to address the gaps in evidence for the reimbursement request in adults with XLH. Note that for the purposes of this review, the pediatric indication is not being reviewed or revised and no additional information was appraised for this population.
To address the concerns over a lack of statistically significant results in the domains of pain, physical function, and fatigue in adults with XLH, the submission included additional data from the open-label extensions of the CL303 study and an ad hoc statistical analysis in the placebo-emergent treatment arm. The CL303 study was a 96-week pivotal, randomized, double-blind, placebo-controlled phase III study with 2 open-label extensions (week 24 to week 48 and week 48 to week 96) that evaluated the efficacy and safety of burosumab in adult patients with XLH. The sponsor also submitted an open-label LTE trial, the BUR02 study, which included a subset of patients from the CL303 trial and a patient from the CL304 trial (a single-arm study that evaluated measures of osteomalacia in patients with XLH, and was not appraised in this review). Together, this provided 144 weeks of follow-up. The proportion of patients with serum phosphorus concentrations greater than the LLN (0.81 mmol/L) at the midpoint of the dosing cycle was the primary outcome for the CL303 trial, while mean serum phosphorus levels at the end of the dosing cycle was the primary outcome for the BUR02 study. To address the concerns over the lack of comparative data for burosumab versus conventional therapy, the submission included a year 1 matched cohort analysis of a study population of adults with XLH enrolled in a 10-year DMP. The 2 matched cohorts were patients who were reported to be receiving conventional therapy at baseline and who never received burosumab during the DMP, and patients who reported receiving burosumab in a real-world setting and who initiated burosumab at any point after DMP initiation.
Key secondary outcomes for the CL303 study were change from baseline in BPI worst pain scores, WOMAC physical function scores, and WOMAC stiffness scores at week 24, and secondary outcomes were the proportion of patients with serum phosphorus concentrations greater than the LLN at the end point of the dosing cycle, as well as the change from baseline in BPI worst pain scores, WOMAC physical function scores, and WOMAC stiffness scores at week 48 and week 96, BPI pain interference, BPI pain severity, WOMAC pain, BFI worst fatigue, BFI global fatigue, serum 1,25(OH)2D, TmP/GFR, TRP, and BALP. Secondary outcomes for the BUR02 study were all domains of the BPI, WOMAC, and BFI, as well as serum 1,25(OH)2D, serum phosphate, urinary phosphate, and TmP/GFR. The healing of pseudofractures and fractures as well as the 6MWT were exploratory outcomes for the CL303 study and the BUR02 study. The proportion of patients with serum phosphorus levels greater than the LLN as well as the change in WOMAC physical function, WOMAC stiffness, and WOMAC pain scores from baseline were the outcomes for the retrospective DMP study matched cohort analysis.
Baseline characteristics were generally well balanced in the CL303 trial, with the exception of some differences in the proportion of patients with baseline osteoarthritis (greater in the burosumab arm), nephrocalcinosis (greater in the burosumab arm), and pseudofractures (greater in the placebo arm). The study population for the CL303 trial was generally applicable to the Canadian context and specific to adults with XLH; as patients in the BUR02 trial came from the CL303 trial, most of the study population in the LTE study was also applicable. The study populations for all 3 pieces of evidence (the CL303 study, the BUR02 study, and the DMP study) were majority white and majority female. In the CL303 study, the majority of patients (93.9% in the placebo-emergent arm and 86.8% in the burosumab-emergent arm) also reported receiving vitamin D analogues plus phosphate before initiating the study. In the DMP study, approximately 44% of patients in the burosumab cohort were receiving conventional therapy at baseline and 56% of patients were receiving no therapy; further information on dosing was not available. The majority of patients in the CL303 study were taking nonopioid pain medications at baseline (> 65% of patients in both arms), and this was also the case for the BUR02 study (> 75% of patients in both arms were taking any pain medication at baseline).
Interpretation of Results
Efficacy
XLH is a rare disease and burosumab is the only drug in its class; the main comparator is conventional therapy (phosphate supplementation and vitamin D analogues). Per the clinical expert consulted by CDA-AMC, conventional therapy treats the downstream deficits while burosumab would be expected to treat the main cause of the symptoms of XLH. Serum biomarkers and imaging, mainly of pseudofractures, are the main evidence that the clinical expert reported using to gauge the effectiveness of therapy. Unmet needs that were highlighted by the patient group included medication that was accessible, affordable, and easier to take, and that would boost energy and muscle function, reduce pain, improve quality of life, and have fewer side effects. The efficacy outcomes from the CL303 study, the BUR02 study, and the DMP study corresponded to most of the needs highlighted and were therefore of clinical importance to patients and clinicians.
Additional evidence from the CL303 trial submitted for the reassessment of burosumab demonstrated that more than 80% of patients in both the placebo-emergent and burosumab-emergent arms had midpoint serum phosphorus levels greater than LLN at 48 weeks, which was maintained for patients in the burosumab-emergent arm at 96 weeks. A slight decrease in this proportion was observed at 96 weeks in the placebo-emergent group to just under 70% of patients; the clinical implications of this difference are unclear. Treatment with burosumab at week 48 and week 96 had variable impacts on other serum biomarkers. There was an overall trend toward smaller LSM increases from baseline in serum 1,25(OH)2D at week 48 and week 96; per the clinical expert consulted by CDA-AMC, the smaller increase at week 96 could reflect the waning or inhibition of the FGF23 effect or reflect normalized serum phosphorus. An overall trend toward a slight increase in TmP/GFR and TRP was observed, suggesting phosphate reabsorption is impacted by treatment. A trend toward decreasing BALP was observed by week 96, which, per the clinical expert, could reflect normalized serum phosphorus. However, the extent to which these changes translate to clinical impact is unclear.
There was a numeric increase in the proportion of healed active fractures and healed pseudofractures at week 48 in both treatment arms, with a numerically higher proportion of healed pseudofractures in the burosumab-emergent arm than in the placebo-emergent arm at 48 weeks. The additional analysis provided in the reassessment reported a numerically higher probability of a healed fracture in the burosumab-emergent arm than in the placebo-emergent arm, both at 24 weeks and 48 weeks, and a sustained numeric impact of burosumab treatment on pseudofracture and fracture healing. There is also the possibility of a lagging effect or a treatment duration–dependent effect based on the fact that the burosumab-emergent arm had a higher proportion of healed fractures than the placebo-emergent arm after initiating burosumab; however, results were not reported beyond 48 weeks and long-term clinical impacts on fracture healing or prevention remain unclear.
The additional results submitted for the CL303 trial for PROs demonstrated variable impacts. Sponsor-provided MCIDs sourced from CL303 study data are provided in the reassessment, but it is unclear whether these thresholds would be the same across patient populations with XLH not enrolled in this trial. Furthermore, the MCIDs were obtained through post hoc analysis and not studies designed for this purpose, and therefore should be considered exploratory thresholds. Overall, the numeric reduction observed in all BPI domain pain scores at week 24 was further reduced at week 48, and the magnitude of score reduction was maintained at week 96 in both treatment arms. However, the point estimates for BPI worst pain did not surpass the sponsor-provided MCIDs at any time point; the point estimates for BPI pain interference did surpass the MCID by a numerically small amount. There were sustained reductions in WOMAC physical function between week 24, week 48, and week 96, with the greatest reduction observed between baseline and week 96. Sustained reductions of a notable magnitude were also observed in the WOMAC stiffness domain between week 24 and week 48, and further reductions were observed between week 48 and week 96. The point estimates for both arms surpassed the sponsor-provided MCID at 96 weeks. The 6MWT scores showed a numeric increase in the total distance walked in the burosumab-emergent arm at week 48 and a numeric decrease in the placebo-emergent arm; however, these changes did not attain the MCID provided for patients with hypophosphatasia and data from week 96 were not reported. Some reductions were observed in BFI worst fatigue between week 24 and week 48, but slight increases in score were observed between week 48 and week 96, although an overall score reduction was still observed between baseline and week 96. The point estimates for the LSM changes from baseline did not surpass the sponsor-provided MCID. Similarly, a slight reduction in BFI global fatigue scores was observed at week 48 and again at week 96, suggesting sustained reductions in fatigue scores, but the impact of this benefit did not surpass the sponsor-provided MCID.
The results from the CL303 trial were subject to some limitations impacting internal and external validity, which include some imbalances in medical characteristics between treatment arms, a potentially notable loss to follow-up (6 patients in the placebo-emergent arm and 8 patients in the burosumab-emergent arm discontinued by week 96), and higher proportions of patients using pain medications in the burosumab-emergent arm; this last may bias the results for pain outcomes. There could also be a lack of power for key secondary and secondary outcomes, and the open-label design impacts the ability to attribute the results to burosumab alone and may also impact the ascertainment of subjective PRO results. The concerns around statistical power apply particularly to the week 48 ad hoc analysis; as this analysis was not preplanned, it should therefore be considered exploratory. Only targeted radiography was performed to check the progress of fractures after the initial scan at baseline, and the development or absence of fractures in non–X-rayed sites may therefore have been missed. Information on unblinding for safety reasons or the measure of adherence to burosumab treatment was unavailable. The frequent visits and dose adjustment protocols used in the trial setting may not exactly reflect daily clinical practice in Canada, and patients were prohibited from using certain concomitant medications during the trial, which may not represent prescribing patterns in routine practice and may impact the generalizability of the findings from these additional data analyses. The duration of the study may not have been a long enough time to fully determine the impact of burosumab on fracture outcomes. Furthermore, the PRO measures used in the study were noted by the clinical expert as not being routinely used in clinical practice, suggesting that the impact of treatment on subjective measures such as pain, fatigue, and stiffness in the clinical trial may not be easily translated into these settings. Lastly, the MCIDs provided by the sponsor were derived from the same study data as the results,24 and there is no external reference population with XLH to use as a comparison for meaningful clinical change.
Longer-term evidence was also submitted in the form of an additional LTE study, the BUR02 trial, using a subset of the patients from the CL303 trial and an additional patient from the CL304 trial. Overall, the proportion of patients with end point serum phosphate levels greater than LLN remained relatively consistent with the 24-week end point serum phosphorus results from the CL303 trial, with proportions ranging from plus or minus 10% of the 24-week results from the CL303 study. While this isn’t indicative of peak effectiveness in the BUR02 study as midpoint serum phosphorus levels were not measured, it does suggest that end point serum phosphate levels greater than LLN were maintained over longer time periods. In terms of other serum biomarkers, TmP/GFR remained broadly consistent with week 96 results from the CL303 study, with slight increases from baseline noted. This implies the effect on tubular reabsorption was maintained over longer time periods. Serum 1,25(OH)2D was variable during the BUR02 study, but a general trend toward increased 1,25(OH)2D was noted, whereas in the CL303 study, a trend toward decreasing 1,25(OH)2D was observed. Per the clinical expert, serum 1,25(OH)2D levels reflect both FGF23 inhibition and serum phosphorus, and the clinical goal is normalized 1,25(OH)2D when treating XLH. Overall, the extent to which these serum results translate to clinical outcomes is unclear.
With regard to PROs at later time periods, WOMAC scores in the BUR02 study were observed to reduce with increasing magnitudes over time, a trend similar to that observed in the CL303 trial. The largest score reduction was observed for WOMAC stiffness by the end of the BUR02 trial phase; this, to a similar degree, was observed at the end of the CL303 trial. Baseline scores at the beginning of the BUR02 trial were slightly higher than those at the end of the CL303 study; a possible reason for this could be that patients stopped therapy for a period of time between the CL303 and BUR02 studies. WOMAC physical function and pain scores were similarly observed to reduce with increasing magnitudes over time, although to a lesser degree than stiffness scores. The clinical meaningfulness of these score reductions is unclear as the same MCID limitations applicable to the CL303 study were also applicable here. Similar to the CL303 trial, small reductions in BPI pain scores were maintained in all domains over the duration of the BUR02 study, implying that pain scores do not improve markedly with longer treatment times and that the degree of pain improvement is likely not notable. Similarly, BFI scores were observed to be reduced and maintained to a similar degree as in the CL303 trial, but the magnitude of the improvement was not notably large over time. Overall, the BUR02 study was subject to some limitations. There was no comparator arm for the study, which could particularly impact the reporting of PROs. As only patients who had completed the parent trials (the CL303 and CL304 studies) continued on to the BUR02 study, there is the possibility of selection bias toward those with better performance on treatment enrolling in the BUR02 study. The study population was not reflective of the Canadian population (majority white and majority female) and therefore the patients enrolled may not reflect the gender, racial, or ethnic diversity present in clinical settings. This may reduce the generalizability of results.
In the absence of direct comparative evidence for burosumab versus conventional therapy, the submission included a matched cohort analysis of patient data from a real-world DMP; year 1 data were included while the DMP is scheduled to run for 10 years. Two cohorts, 1 receiving burosumab treatment and 1 receiving conventional therapy, were compared using PS matching. The main findings were that at the year 1 visit, a statistically significantly greater proportion of patients in the burosumab cohort reported serum phosphate levels greater than LLN than in the conventional therapy cohort. Other results for PROs were not statistically significant. The submission noted that information on dosing in both cohorts, the timing of burosumab initiation, treatment patterns after study enrolment but before burosumab initiation, and the timing of serum phosphate sample collection were largely unknown. The lack of information on dosing in both arms makes it difficult to ascertain the exact interventions received in either cohort, and there is an important lack of information on the treatment patterns before burosumab initiation. This is a key bias as the exposure tables demonstrate that patients spent a notable period of time not exposed to burosumab therapy, and therefore the intervention in both cohorts cannot be defined and the results in the burosumab cohort cannot be causally related to the same duration of burosumab exposure in the way that results in the conventional therapy cohort could be. There was no adjustment in the results for patient time exposed or justification for why this adjustment was not made. Furthermore, the treatment history of the patients will likely have impacted their baseline serum phosphate levels and the presence of other symptoms, and it is not known whether the impact of burosumab treatment would be different in patients who are refractory to conventional therapy or who are treatment naive. The lack of information on the timing of serum phosphate sample collection is also a key limitation as this would directly impact the proportion of patients attaining the LLN, which in the CL303 study was analyzed at the dose cycle midpoint for serum phosphorus. The comparability of the cohorts is also impacted by this lack of context. Overall, reporting of the methodology was insufficient to define the interventions adequately and appraise the study. As a result, no firm conclusions can be drawn about the comparative efficacy of burosumab versus conventional therapy.
Harms
Similar to the previous CADTH report, nearly all patients reported some type of TEAE during the study period in the CL303 trial. Overall, the proportion of patients with SAEs remained low with the additional data provided in the reassessment, and a similar proportion of patients in the placebo-emergent arm reported SAEs after initiating burosumab relative to the burosumab-emergent arm. There was 1 death judged not to be linked to the treatment, and no withdrawals due to AEs. Hypersensitivity was experienced by 4 (6.1%) patients in the placebo-emergent arm during the placebo-controlled period, 6 (9.1%) patients in the placebo-emergent arm in the open-label period, and 4 (5.9%) patients in the burosumab-emergent arm during treatment. Hyperphosphatemia occurred in 4 (6.1%) patients in the placebo-emergent arm in the open-label period and in 4 (5.9%) patients in the burosumab-emergent arm throughout the trial. Restless leg syndrome occurred in 6 (9.1%) patients in the placebo-emergent arm during the placebo-controlled period, in 10 (15.2%) patients in the placebo-emergent arm during the open-label period, and in 8 (11.8%) patients in the burosumab-emergent arm during treatment. Of note, ectopic mineralization occurred in 7 (10.6%) patients in the placebo-emergent arm during the open-label period, but no patients experienced this outcome in the burosumab-emergent arm.
Noting higher proportions of patients with TEAEs in the burosumab arm, the submission included an additional exposure-adjusted analysis reporting incidence rates in each arm of the CL303 trial, which revealed generally similar incidence rates in the placebo-emergent and burosumab-emergent arms after adjusting for exposure time; full results were not presented in the submission. This new information implies there is a possibility of cumulative AEs over time with burosumab treatment, which is important considering that per the clinical expert consulted by CDA-AMC, burosumab will likely be a lifelong treatment. The implications of this possible effect remain unclear. As this safety analysis was not conducted in the LTE trial (the BUR02 study) or the DMP study portions of the submission, further inference about longer-term exposure to burosumab remains challenging.
There was a broadly similar overall safety profile noted in the LTE trial, the BUR02 study, with no deaths, a low proportion of patients with SAEs, and no withdrawals due to TEAEs during the study period. Hypersensitivity was experienced by 1 (2.9%) patient, hyperphosphatemia did not occur in any patients, and restless leg syndrome occurred in 1 (2.9%) patient. Of note, ectopic mineralization was not recorded. The BUR02 study results reported 2 additional AEs, which were not reported to the same extent in the CL303 trial: vitamin D deficiency and hypophosphatemia. Vitamin D deficiency was reported in 19 (55.9%) patients in the BUR02 study whereas 15 (22.1%) patients in the burosumab-emergent arm, 7 (10.6%) patients in the placebo-emergent arm during the open-label period, and 3 (4.5%) patients in the placebo-emergent arm during the placebo-controlled period reported it in the CL303 trial. Hypophosphatemia was reported in 9 (26.5%) patients in the BUR02 study (it was not reported as an AE in the CL303 study). Per the clinical expert consulted by CDA-AMC, serum 1,25(OH)2D reflects the inhibition of FGF23 by burosumab but also reflects serum phosphorus, which reduces serum 1,25(OH)2D. This information represents potentially important considerations, but further interpretation would require additional information on whether hypophosphatemia co-occurred in patients experiencing vitamin D deficiency, which is unknown. Apart from these factors, there was overall a numeric reduction in the proportion of patients reporting some of the most common TEAEs in the CL303 study, such as arthralgia, nasopharyngitis, tooth abscesses, and injection site reactions.
The reporting of harms is subject to some specific limitations. As TEAE results were not reported separately for the placebo-controlled period and the open-label period in the burosumab-emergent cohort in the CL303 study, the comparability of the 2 treatment arms is limited. This is an important consideration when assessing the safety of burosumab due to the potential cumulative effect of TEAEs observed during the trial; reporting placebo-controlled and open-label time periods separately would improve the comparability of the burosumab-emergent arm with the placebo-emergent arm. In addition, data on harms were not collected from the DMP and therefore the incidence of AEs from burosumab relative to conventional therapy are not available, leaving this evidence gap unaddressed.
Conclusion
The major areas of the reassessment addressed the lack of clinically meaningful results in the domains of pain, physical function, and fatigue in adults with XLH, as well as a lack of active comparator data against conventional therapy for XLH. Additional data from the CL303 study broadly showed normalization of serum phosphorus in a notable majority of patients, which persisted in many over time, although a waning in the proportion with serum phosphorus levels greater than LLN was observed at week 96. A trend toward increased healing in fractures or pseudofractures was also noted along with statistically significant odds of full healing relative to no healing at all at 24 weeks, although longer-term data remained lacking. While potentially notable reductions in WOMAC scores, particularly stiffness scores, were reported and reductions were maintained over longer time periods, there was a lack of notable impact noted in the pain and fatigue scores, with reductions in at most 2 points from baseline. The meaningfulness of these changes remains unknown due to the fact that the MCIDs provided in the submission were derived from the same dataset as the CL303 pivotal trial and are thus hampered by a lack of external validity. Data from the safety assessment of burosumab noted no serious safety signals, but there was a potentially cumulative impact of TEAEs, which was identified through an analysis adjusting for the duration of burosumab exposure. This is a potentially important consideration as treatment with burosumab will be lifelong, per the clinical expert consulted by CDA-AMC. The LTE trial, the BUR02 study, also reported an increase in vitamin D deficiency and hypophosphatemia at later time points, although the clinical impact of these results is unclear. The reassessment was not able to conclude anything about comparative evidence due to limitations in the real-world evidence portion and there remains no information on the safety of burosumab relative to conventional therapy.
References
1.Carpenter TO, Imel EA, Holm IA, Jan de Beur SM, Insogna KL. A clinician's guide to X-linked hypophosphatemia. J Bone Miner Res. 2011;26(7):1381-1388. PubMed
2.Razzaque MS. The FGF23-Klotho axis: endocrine regulation of phosphate homeostasis. Nat Rev Endocrinol. 2009;5(11):611-619. PubMed
3.Martin A, David V, Quarles LD. Regulation and function of the FGF23/klotho endocrine pathways. Physiol Rev. 2012;92(1):131-155. PubMed
4.Lang F, Leibrock C, Pandyra AA, Stournaras C, Wagner CA, Foller M. Phosphate homeostasis, inflammation and the regulation of FGF-23. Kidney Blood Press Res. 2018;43(6):1742-1748. PubMed
5.Pettifor JM. What's new in hypophosphataemic rickets? Eur J Pediatr. 2008;167(5):493-499. PubMed
6.Haffner D, Emma F, Eastwood DM, et al. Clinical practice recommendations for the diagnosis and management of X-linked hypophosphataemia. Nat Rev Nephrol. 2019;15(7):435-455. PubMed
7.Che H, Roux C, Etcheto A, et al. Impaired quality of life in adults with X-linked hypophosphatemia and skeletal symptoms. Eur J Endocrinol. 2016;174(3):325-333. PubMed
8.Chesher D, Oddy M, Darbar U, et al. Outcome of adult patients with X-linked hypophosphatemia caused by PHEX gene mutations. J Inherit Metab Dis. 2018;41(5):865-876. PubMed
9.Javaid MK, Ward L, Pinedo-Villanueva R, et al. Musculoskeletal features in adults with X-linked hypophosphatemia: an analysis of clinical trial and survey data. J Clin Endocrinol Metab. 2022;107(3):e1249-e1262. PubMed
10.Lo SH, Lachmann R, Williams A, Piglowska N, Lloyd AJ. Exploring the burden of X-linked hypophosphatemia: a European multi-country qualitative study. Qual Life Res. 2020;29(7):1883-1893. PubMed
11.Skrinar A, Dvorak-Ewell M, Evins A, et al. The lifelong impact of X-linked hypophosphatemia: results from a burden of disease survey. J Endocr Soc. 2019;3(7):1321-1334. PubMed
12.Theodore-Oklota C, Bonner N, Spencer H, Arbuckle R, Chen CY, Skrinar A. Qualitative research to explore the patient experience of X-linked hypophosphatemia and evaluate the suitability of the BPI-SF and WOMAC as clinical trial end points. Value Health. 2018;21(8):973-983. PubMed
13.Forestier-Zhang L, Watts L, Turner A, et al. Health-related quality of life and a cost-utility simulation of adults in the UK with osteogenesis imperfecta, X-linked hypophosphatemia and fibrous dysplasia. Orphanet J Rare Dis. 2016;11(1):160. PubMed
14.Transparency Committee. Crysvita 10 mg solution for injection, English summary. Saint-Denis (FR): Haute Autorité de Santé; 2021: https://www.has-sante.fr/upload/docs/application/pdf/2022-02/crysvita_02062021_summary_ct19067.pdf. Accessed by sponsor, no date provided.
15.Pharmaceutical Benefits Advisory Committee. May 2022 PBAC Intracycle Meeting Outcomes. 2022 [sponsor provided reference].
16.Huertas-Quintero JA, Losada-Trujillo N, Cuellar-Ortiz DA, Velasco-Parra HM. Hypophosphatemic rickets in Colombia: a prevalence-estimation model in rare diseases. 2018. Lancet Reg Health Am. 2022;7:100131. PubMed
17.Hawley S, Shaw NJ, Delmestri A, et al. Prevalence and mortality of individuals with X-linked hypophosphatemia: a United Kingdom real-world data analysis. J Clin Endocrinol Metab. 2020;105(3):e871-878. PubMed
18.Crysvita (burosumab injection): 10 mg/mL, 20 mg/mL and 30 mg/mL single-use 1 mL vials, solution for subcutaneous injection [product monograph]. Oakville (ON): Innomar Strategies; 2023 Mar 15. Accessed February 28, 2022.
19.CADTH Drug Reimbursement Expert Review Committee final recommendation: burosumab (Crysvita — Kyowa Kirin Limited). Ottawa (ON): CADTH; 2020 May 27: https://www.cadth.ca/sites/default/files/cdr/complete/SR0602%20Crysvita%20-%20CDEC%20Final%20Recommendation%20May%2029%2C%202020_For%20posting.pdf. Accessed 2022 Nov 11.
20.Clinical Study Report: UX023-CL303, week 96/final analysis. a randomized, double-blind, placebo-controlled, phase 3 study with open-label extension to assess the efficacy and safety of KRN23 in adults with X-linked hypophosphatemia (XLH) [internal sponsor's report]. Novato (CA): Ultragenyx Pharmaceutical Inc.; 2019 Sep 19.
21.Kyowa Kirin Canada Inc. response to February 13, 2024 request for additional information regarding Crystiva (burosumab) CADTH review [internal additional sponsor's information]. Princeton (NJ): Kyowa Kirin Canada Inc.; 2024 Feb 20.
22.Mendoza TR, Wang XS, Cleeland CS, et al. The rapid assessment of fatigue severity in cancer patients: use of the Brief Fatigue Inventory. Cancer. 1999;85(5):1186-1196. PubMed
23.Crysvita (burosumab) for the treatment of X-linked hypophosphataemia (XLH) in adult patients [internal sponsor's report]. In: Drug Reimbursement Review sponsor submission: Crysvita (burosumab injection), 10 mg/mL, 20 mg/mL and 30 mg/mL single-use 1 mL vials, solution for subcutaneous injection. Princeton (NJ): Kyowa Kirin Canada. 2023 Dec.
24.Kyowa Kirin Canada Inc. response to February 20, 2024 CADTH request for additional information regarding Crystiva (burosumab) CADTH review [internal additional sponsor's information]. Princeton (NJ): Kyowa Kirin Canada Inc.; 2024 Feb 27.
25.Kyowa Kirin Canada, Inc. response to April 4, 2024 CADTH request for sponsor comments on draft clinical report for Crystiva (burosumab) CADTH review [internal additional sponsor's information]. Princeton (NJ): Kyowa Kirin Canada, Inc.; 2024 Apr 15.
26.Clinical Study Protocol: BUR02. A phase 3b open-label study of the anti-FGF23 antibody, burosumab (KRN23) in adults with X-linked hypophosphatemia, version 5.0 (XLH) [internal sponsor's report]. Galashiels (UK): Kyowa Kirin Pharmaceutical Development, Ltd; 2021 Mar 24.
27.Clinical Study Report: BUR02. A phase 3b open-label study of the anti-FGF23 antibody, burosumab (KRN23) in adults with X-linked hypophosphatemia (XLH) [internal sponsor's report]. Galashiels (UK): Kyowa Kirin Pharmaceutical Development, Ltd; 2022 Aug 26.
28.Insogna KL, Rauch F, Kamenický P, et al. Burosumab improved histomorphometric measures of osteomalacia in adults with X-linked hypophosphatemia: a phase 3, single-arm, international trial. J Bone Miner Res. 2019;34(12):2183-2191. PubMed
29.X-linked Hypophosphatemia Disease Monitoring Program (XLH-DMP), amendment 2 [internal sponsor's report]. In: Drug Reimbursement Review sponsor submission: Crysvita (burosumab injection), 10 mg/mL, 20 mg/mL and 30 mg/mL single-use 1 mL vials, solution for subcutaneous injection. Princeton (NJ): Kyowa Kirin Canada. 2020 Oct 01.
30.Reimbursement Review clinical guidance report: burosumab (Crysvita) for the treatment of X-linked hypophosphatemia (XLH) in adult and pediatric patients 1 year of age and older. Ottawa (ON): CADTH; 2020 Jul: https://www.cadth.ca/sites/default/files/cdr/clinical/sr0602-crysvita-clinical-review-report.pdf. Accessed by sponsor, no date provided.
31.One-Alpha (alfacalcidol): 0.25 and 1 mcg oral capsules, 2 mcg.mL oral drops, or 2 mcg/mL for intravenous injection [product monograph]. Mississauga (ON): Xediton Pharmaceuticals Inc.; 2022 Jan 26: https://pdf.hres.ca/dpd_pm/00064529.PDF. Accessed 2022 Nov 02.
32.Calcitriol Capsules (calcitriol): 0.25 mcg and 0.5 mcg capsules [product monograph]. Varennes (QC): Strides Pharma Canada Inc.; 2022 Sep 23: https://pdf.hres.ca/dpd_pm/00067499.PDF. Accessed 2022 Nov 02.
33.Licensed Natural Health Products Database (LNHPD). Product information. Brand name(s): Phoslax; Licence holder: Odan Laboratories Ltd.; Licence Status: Active; Natural Product Number (NPN): 80000689. Ottawa (ON): Health Canada; 2024: https://health-products.canada.ca/lnhpd-bdpsnh/info?licence=80000689. Accessed 2024 Mar 04.
34.Licensed Natural Health Products Database (LNHPD). Product information. Brand name(s): Phosphate Effervescent Tablets; Licence holder: Biovantek; Licence Status: Active; Natural Product Number (NPN): 80068758. Ottawa (ON): Health Canada; 2024: https://health-products.canada.ca/lnhpd-bdpsnh/info?licence=80068758. Accessed 2024 Mar 04.
35.Licensed Natural Health Products Database (LNHPD). Product information. Brand name(s): Jamp-Phosphate Effervescent; Licence holder: JAMP Pharma Corporation; Licence Status: Active; Natural Product Number (NPN): 80036102. Ottawa (ON): Health Canada; 2024: https://health-products.canada.ca/lnhpd-bdpsnh/info?licence=80036102. Accessed 2024 Mar 04.
36.Sensipar (cinacalcet hydrochloride): 30 mg, 60 mg, and 90 mg, oral tablets [product monograph]. Mississauga (ON): Amgen Canada Inc.; 2018 Nov 20: https://pdf.hres.ca/dpd_pm/00048361.PDF. Accessed 2023 Mar 04.
37.Insogna KL, Briot K, Imel EA, et al. A randomized, double-blind, placebo-controlled, phase 3 trial evaluating the efficacy of burosumab, an anti-FGF23 antibody, in adults with X-linked hypophosphatemia: week 24 primary analysis. J Bone Miner Res. 2018;33(8):1383-1393. PubMed
38.Portale AA, Carpenter TO, Brandi ML, et al. Continued beneficial effects of burosumab in adults with X-linked hypophosphatemia: results from a 24-week treatment continuation period after a 24-week double-blind placebo-controlled period. Calcif Tissue Int. 2019;105(3):271-284. PubMed
39.Briot K, Portale AA, Brandi ML, et al. Burosumab treatment in adults with X-linked hypophosphataemia: 96-week patient-reported outcomes and ambulatory function from a randomised phase 3 trial and open-label extension. RMD Open. 2021;7(3):e001714. PubMed
40.Kamenicky P, Briot K, Brandi ML, et al. Benefit of burosumab in adults with X-linked hypophosphataemia (XLH) is maintained with long-term treatment. RMD Open. 2023;9(1):e002676. PubMed
41.Kyowa Kirin, Inc. NCT02526160: Study of KRN23 in adults with X-linked hypophosphatemia (XLH). ClinicalTrials.gov. Bethesda (MD): U.S. National Library of Medicine; 2024: https://classic.clinicaltrials.gov/ct2/show/NCT02526160. Accessed 2024 Mar 25.
42.Dworkin RH, Turk DC, Farrar JT, et al. Core outcome measures for chronic pain clinical trials: IMMPACT recommendations. Pain. 2005;113(1-2):9-19. PubMed
43.Atkinson TM, Mendoza TR, Sit L, et al. The Brief Pain Inventory and its “pain at its worst in the last 24 hours” item: clinical trial endpoint considerations. Pain Med. 2010;11(3):337-346. PubMed
44.Song CY, Lin SF, Huang CY, Wu HC, Chen CH, Hsieh CL. Validation of the Brief Pain Inventory in patients with low back pain. Spine (Phila Pa 1976). 2016;41(15):E937-E942. PubMed
45.Skrinar A, Theodore-Oklota C, Bonner N, Arbuckle R, Williams A, Nixon A. Confirmatory psychometric validation of the brief pain inventory (BPI-SF) in adult X-linked hypophosphatemia (XLH). ISPOR | International Society For Pharmacoeconomics and Outcomes Research; 2019 [sponsor provided reference].
46.Roos EM, Klassbo M, Lohmander LS. WOMAC osteoarthritis index. Reliability, validity, and responsiveness in patients with arthroscopically assessed osteoarthritis. Western Ontario and MacMaster Universities. Scand J Rheumatol. 1999;28(4):210-215. PubMed
47.Physiopedia. WOMAC Osteoarthritis Index. 2019; https://www.physio-pedia.com/index.php?title=WOMAC_Osteoarthritis_Index&oldid=180346. Accessed 2024 Mar 04.
48.Bolognese JA, Schnitzer TJ, Ehrich EW. Response relationship of VAS and Likert scales in osteoarthritis efficacy measurement. Osteoarthritis Cartilage. 2003;11(7):499-507. PubMed
49.McConnell S, Kolopack P, Davis AM. The Western Ontario and McMaster Universities Osteoarthritis Index (WOMAC): a review of its utility and measurement properties. Arthritis Rheum. 2001;45(5):453-461. PubMed
50.Salaffi F, Carotti M, Grassi W. Health-related quality of life in patients with hip or knee osteoarthritis: comparison of generic and disease-specific instruments. Clin Rheumatol. 2005;24(1):29-37. PubMed
51.Brazier JE, Harper R, Munro J, Walters SJ, Snaith ML. Generic and condition-specific outcome measures for people with osteoarthritis of the knee. Rheumatology (Oxford). 1999;38(9):870-877. PubMed
52.Ruppe MD, Zhang X, Imel EA, et al. Effect of four monthly doses of a human monoclonal anti-FGF23 antibody (KRN23) on quality of life in X-linked hypophosphatemia. Bone Rep. 2016;5:158-162. PubMed
53.Skrinar A, Theodore-Oklota C, Bonner N, Arbuckle R, Williams A, Nixon A. PRO152 Confirmatory psychometric validation of the Western Ontario Mcmaster Universities Osteoarthritis Inventory (WOMAC) in adult X-linked hypophosphatemia (XLH). Value Health. 2019;22(Supplement 3):S870.
54.Brief Fatigue Inventory. Sydney (AU): Moving Ahead, Centre of Research Excellence (CRE) in Brain Recovery, The School of Psychology, UNSW: http://movingahead.psy.unsw.edu.au/documents/research/outcome%20measures/adult/TBI%20Related%20Symptoms/Website%20Brief%20Fatigue%20Inventory.pdf. Accessed 2024 Mar 04.
55.Nixon A, Williams A, Theodore-Oklota C. Psychometric validation of the Brief Fatigue Inventory (BFI) in adult X-linked hypophosphatemia (XLH). Virtual: ISPOR 2020: https://www.ispor.org/docs/default-source/intl2020/nixon-bfi-validation-ispor-posterfinal-version-1-28apr20-pdf.pdf. Accessed 2022 Dec 06.
56.ATS Committee on Proficiency Standards for Clinical Pulmonary Function Laboratories. ATS statement: guidelines for the six-minute walk test. Am J Respir Crit Care Med. 2002;166(1):111-117. PubMed
57.Phillips D, Tomazos IC, Moseley S, L'Italien G, Gomes da Silva H, Lerma Lara S. Reliability and validity of the 6-Minute Walk Test in hypophosphatasia. JBMR Plus. 2019;3(6):e10131. PubMed
58.Pankoff BA, Overend TJ, Lucy SD, White KP. Reliability of the six-minute walk test in people with fibromyalgia. Arthritis Care Res. 2000;13(5):291-295. PubMed
59.Garofano RP, Barst RJ. Exercise testing in children with primary pulmonary hypertension. Pediatr Cardiol. 1999;20(1):61-64; discussion 65. PubMed
60.Guyatt GH, Pugsley SO, Sullivan MJ, et al. Effect of encouragement on walking test performance. Thorax. 1984;39(11):818-822. PubMed
61.A pre-specified analysis of the maintenance of effect of burosumab treatment across all time points collected from the 96-week phase 3 UX023-CL303 study through to week 48 of the phase 3b BUR02 study in 31 adults with X-linked hypophosphataemia (XLH) [internal sponsor's report]. Galashiels (UK): Kyowa Kirin Pharmaceutical Development Ltd; 2021 Jul 08.
62.Ad hoc analyses: comparing all BUR02 subjects to the subjects from the analyses of Kamenicky et al [internal sponsor's report]. Princeton (NJ): Kyowa Kirin Services Ltd; 2023.
63.Technical report: the DMP analysis of brosumab versus conventional therapy in adults with XLH [internal sponsor's report]. In: Drug Reimbursement Review sponsor submission: Crysvita (burosumab injection), 10 mg/mL, 20 mg/mL and 30 mg/mL single-use 1 mL vials, solution for subcutaneous injection. Princeton (NJ): Kyowa Kirin Canada. 2024 Jan 02.
Pharmacoeconomic Review
Abbreviations
AE
adverse event
BIA
budget impact analysis
CDA-AMC
Canada’s Drug Agency
CUA
cost-utility analysis
ICER
incremental cost-effectiveness ratio
LLN
lower limit of normal
LY
life-year
MCID
minimal clinically important difference
QALY
quality-adjusted life-year
RWE
real-world evidence
SOC
standard of care
WOMAC
Western Ontario and McMaster Universities Osteoarthritis Index
XLH
X-linked hypophosphatemia
Executive Summary
The executive summary comprises 2 tables (Table 1 and Table 2) and a conclusion.
Item | Description |
|---|---|
Drug product | Burosumab (Crysvita), 10 mg/mL, 20 mg/mL, and 30 mg/mL, solution for injection, subcutaneous injection |
Indication | For the treatment of XLH in adult and pediatric patients aged 6 months and older |
Health Canada approval status | NOC |
Health Canada review pathway | Priority review |
NOC date | December 5, 2018 |
Reimbursement request | For the treatment of XLH in adult patients |
Sponsor | Kyowa Kirin Canada, Inc. |
Submission history | Previously reviewed: Yes Indication: Treatment of XLH in adult and pediatric patients aged 1 year and older Recommendation date: May 27, 2020 Recommendation: Reimburse with clinical criteria and/or conditions in pediatric patients who are aged at least 1 year and in whom epiphyseal closure has not yet occurred |
NOC = Notice of Compliance; XLH = X-linked hypophosphatemia.
Table 2: Summary of Economic Evaluation
Component | Description |
|---|---|
Type of economic evaluation | Cost-utility analysis Markov model |
Target population | Adult patients with XLH |
Treatment | Burosumab |
Dosage regimen | For adults, the recommended dosage is 1 mg/kg of body weight, rounded to the nearest 10 mg, up to a maximum dose of 90 mg, administered every 4 weeks |
Submitted price | Burosumab $4,514.94 per 10 mg vial $9,029.90 per 20 mg vial $13,544.84 per 30 mg vial |
Submitted treatment cost | $389,427 per patient annually |
Comparator | SOC comprising phosphate, active vitamin D (calcitriol or alfacalcidol), or no treatment |
Perspective | Canadian publicly funded health care payer |
Outcomes | QALYs, LYs |
Time horizon | Lifetime (up to 110 years of age) |
Key data sources |
|
Submitted results | ICER = $1,482,062 per QALY gained (incremental costs = $4,055,002; incremental QALYs = 2.74). |
Key limitations |
|
CDA-AMC reanalysis results |
|
CDA-AMC = Canada’s Drug Agency; ICER = incremental cost-effectiveness ratio; LY = life-year; QALY = quality-adjusted life-year; RCT = randomized controlled trial; SOC = standard of care; vs. = versus; WOMAC = Western Ontario and McMaster Universities Osteoarthritis Index; XLH = X-linked hypophosphatemia.
Conclusions
The clinical review by Canada’s Drug Agency (CDA-AMC) concluded that results from the additional data submitted from the UX023-CL303 study (or the CL303 study in short) reporting on the 2 study populations initially randomized to burosumab and placebo for 24 weeks (all receiving burosumab in open-label extensions at week 48 and week 96) showed that a notable majority of patients had midpoint serum phosphorus levels greater than the lower limit of normal (LLN); however, a waning in the proportion achieving this outcome was observed at 96 weeks. A trend toward increased healing in fractures or pseudofractures was also noted along with statistically significant odds of a fracture being graded as fully healed at 24 weeks, although longer-term data remained lacking. While potentially notable reductions in Western Ontario and McMaster Universities Osteoarthritis Index (WOMAC) scores, particularly stiffness scores, were reported and reductions maintained over longer time periods, there was a lack of notable impact noted in the pain and fatigue scores, and the meaningfulness of these changes remains unknown. The reassessment was not able to conclude anything with certainty about comparative efficacy due to limitations in the real-world evidence (RWE) and there remains no information on the safety of burosumab relative to conventional therapy. The uncertainty in direct and indirect benefits assumed with burosumab is reflected in the submitted economic analysis.
The CDA-AMC base-case results were similar to the sponsor’s base case. In the CDA-AMC base case, burosumab was associated with incremental costs of $3,877,365, an incremental quality-adjusted life-year (QALY) gain of 2.31, and an incremental LY gain of 0.41 versus with SOC, resulting in an incremental cost-effectiveness ratio (ICER) of $1,680,920 per QALY gained. Key drivers of the analysis included the drug acquisition costs of burosumab (incremental costs = $3,895,214), as well as the utility benefit assumed to occur in all patients treated with burosumab regardless of response to treatment (incremental QALYs = 1.61, which accounts for approximately 70% of all total QALY gains). The probability that burosumab was cost-effective at a $50,000 per QALY gained threshold was 0%. Relative to SOC, the annual drug acquisition costs of burosumab would need to decrease to approximately $822 to $1,057 per patient (from $389,427 per patient per year) to be considered cost-effective at a $50,000 per QALY threshold (99.8% reduction).
CDA-AMC notes that a number of assumptions were used in the sponsor’s economic model: direct benefits of burosumab versus standard of care (SOC) (e.g., a reduction in morbidities occurring due to conventional therapies) and indirect benefits associated with serum phosphate normalization (e.g., a reduction in fracture incidence equivalent to the general population, reduced mortality). These assumptions are not fully supported by clinical evidence. Consistent with the sponsor’s analysis, the CDA-AMC base case estimates that more than 93% of the incremental QALYs are accrued after the trial period and are mainly driven by the use of treatment-specific utilities. In the absence of robust, head-to-head long-term clinical evidence compared to conventional therapies, the extent of treatment benefit associated with burosumab is highly uncertain. Consequently, the CDA-AMC base case may overestimate the clinical benefits associated with burosumab and therefore represent optimistic (upper bound) clinical benefits based on current clinical evidence. Higher price reductions may therefore be required for burosumab to be cost-effective.
Input Relevant to the Economic Review
This section is a summary of the feedback received from the patient groups, clinician groups, and drug plans that participated in the CDA-AMC review process.
Patient input was received from the Canadian XLH Network. Patients with X-linked hypophosphatemia (XLH) and their caregivers were surveyed, and 46% of respondents resided in Canada. They indicated that XLH symptoms negatively impact daily life by decreasing quality of life, and causing severe pain and loss of mobility, resulting in fatigue and energy loss, causing dental issues, impacting the ability to attend work or go to school, and leading to arthritis and/or spinal stenosis. Patients reported using phosphate and calcitriol as SOC treatment for adult patients in Canada. The most common side effects associated with SOC include diarrhea, stomach pain, nephrocalcinosis, calcification, and thyroid issues. Patient groups expressed concern surrounding the financial burden, supply issues, and side effects associated with SOC. Most patients reported having multiple surgeries due to XLH, such as osteotomies, knee or hip replacements, 8-plate surgery, and dental surgeries. Patients and caregivers indicated that the most important outcomes for new treatment options include easier management of disease symptoms, decreased adverse events (AEs), a reduced need for surgery, and improved quality of life. Patients who reported being treated with burosumab indicated positive results and the improvement of symptoms.
Clinician input received from a rheumatologist with experience in treating patients with metabolic bone diseases such as XLH indicated that SOC for adult patients with XLH comprises phosphate and calcitriol. However, many patients discontinue treatment due to a lack of efficacy and SOC-related complications such as nephrocalcinosis and deterioration in renal function. In their opinion, burosumab is effective in the pediatric population; however, patients who were diagnosed during childhood before burosumab was available for the pediatric population (and who are now adults) would not be eligible for treatment. If burosumab were to be made available for the adult population, clinician input suggested that it would address the underlying disease and become the new SOC for adults living with XLH.
Drug plan input expressed concerns surrounding the evidence gap on the effectiveness of burosumab versus SOC in adults. Drug plans also noted potential concerns with patient eligibility and discrepancies between recommended initiation criteria for pediatrics versus adult patients. In particular, this is regarding how radiographic evidence of rickets with a Rickets Severity Scale score of 2 or greater is required but drug plans noted that rickets is predominantly a childhood condition. Additionally, drug plans noted the uncertainty surrounding whether patients receiving short-term treatment with burosumab for pseudofractures or osteomalacia-related fractures would be eligible for re-treatment upon additional post-treatment fractures. Drug plans questioned whether time-limited trials of burosumab should be considered, given the uncertainty surrounding the appropriate duration of treatment with burosumab to assess benefits on pseudofractures or osteomalacia-related fractures. Lastly, drug plans noted that burosumab has a confidential price that was negotiated with the pan-Canadian Pharmaceutical Alliance.
Several of these concerns were included in the sponsor’s model:
The sponsor’s model incorporated health state utility values mapped from WOMAC scores, which consider pain, stiffness, and physical function.
Morbidity events related to fractures and side effects associated with vitamin D and phosphate (e.g., hyperparathyroidism, parathyroidism, kidney stones) were included in the sponsor’s base-case analysis.
Morbidity events related to dental problems, spinal stenosis, spinal surgery, and hearing loss or tinnitus were included by the sponsor in a scenario analysis.
CDA-AMC was unable to address the following concerns raised from input:
The evidence gap on the clinical effectiveness of burosumab versus vitamin D and phosphate in adults, and the lack of direct evidence on the effect of burosumab on most morbidities were unresolved concerns.
Economic Review
Economic Evaluation
Summary of Sponsor’s Economic Evaluation
Overview
The sponsor submitted a cost-utility analysis (CUA) of burosumab versus SOC.1 The model target population consisted of adult patients with XLH aligned with the population of the CL303 study, which was treatment line–agnostic (i.e., most patients had phosphate + vitamin D as prior therapy, some had only 1 or the other, and a small number of patients had no prior therapy). The target population was aligned with the Health Canada–indicated population and was also broadly aligned with the reimbursement request. The reimbursement request is for the treatment of adult patients living with XLH, in the second-line treatment,1 who meet a defined set of eligibility criteria defined as follows:
a clinical presentation consistent with XLH, including fasting hypophosphatemia and normal renal function
a confirmed PHEX gene variant in either the patient or in a directly related family member with appropriate X-linked inheritance and —
persistent bone and/or joint pain due to XLH, and/or
osteomalacia that limits daily activities, and/or
pseudofractures or osteomalacia-related fractures
insufficient response or refractoriness to SOC or if patients experience SOC-related complications.
Burosumab is available in 10 mg, 20 mg, and 30 mg single-use vials for subcutaneous injection.2 The recommended dosage in adults is 1 mg/kg of body weight, rounded to the nearest 10 mg, up to a maximum of 90 mg, administered every 4 weeks.2 Doses greater than 1 mg/kg in adults should not be administered.2 Based on the weight distribution of patients from the CL303 study, the sponsor estimated annual treatment costs of $389,427 per patient.1 This estimate includes a dose reduction to 0.5 mg/kg for 5.97% of patients to account for those patients attaining serum phosphate levels above the upper limit of the normal range with burosumab, observed in the CL303 study.1 SOC was assumed as being a mix of phosphate and active vitamin D (i.e., active treatments) and no treatment. The costs of active treatments were based on dose regimens from international treatment guidelines for XLH (the midpoint of the dose ranges), estimated to annually cost $1,535 for phosphate and $425 for active vitamin D, and applied to 54.3% of all patients receiving SOC, based on the proportion of patients receiving conventional therapy before the initiation of the CL303 study.1
Outcomes modelled included QALYs and life-years (LYs) over a lifetime horizon (up to 110 years of age) and a cycle length of 1 year. Additionally, the model included serum phosphate normalization (i.e., response to treatment) and clinical events (i.e., comorbidities). The model structure and flow within and across health states and what affected the occurrence of clinical events were designed differently for each treatment arm. The base-case analysis was conducted from the Canadian public health care system perspective with costs and outcomes discounted at 1.5% per year.
Model Structure
The sponsor submitted a Markov model with 3 health states: on burosumab, on SOC, and dead (Figure 1).1 All patients enter the model either on treatment with burosumab or SOC. Patients receiving burosumab can discontinue treatment and transition to the SOC state, or continue on burosumab until transitioning to the dead state. Patients receiving SOC continued to receive SOC until transitioning to the dead state.
In the SOC treatment arm, death and all morbidities were modelled as clinical events regardless of serum phosphate levels. Patients receiving SOC do not have their phosphate status modelled and do not experience any reduction in morbidities or XLH-related mortality based on achieving serum phosphate normalization.
For the burosumab treatment arm, in addition to tracking treatment status and survival, the submitted model directly estimates the proportion of patients achieving serum phosphate normalization (defined as 2.5 mg/dL [0.81 mmol/L] as a dichotomous status for patients in the “on burosumab” state) and the occurrence of morbidities, which were modelled as clinical events. Serum phosphate normalization status is defined at the end of the first model cycle and remains unchanged for as long as the patients remain on the on burosumab state. Patients transitioning to the SOC state do not have a serum phosphate level status. Some comorbidities were directly affected by treatment with burosumab (hyperparathyroidism, parathyroidism, and kidney stones) while others were indirectly affected by achieving serum phosphate normalization (death and fractures [in the base case], dental problems, spinal stenosis and spinal surgery, and tinnitus or hearing loss [in the scenario analysis]). Therefore, upon burosumab discontinuation and the initiation of SOC, the indirect effects of attaining serum phosphate normalization (on the risk of death and some clinical events) were tapered to be the same as for patients in SOC regardless of serum phosphate levels.
The model was run discretely for sex and a variety of starting age ranges. Results were calculated by weighting the sex-specific and age group–specific results.
Model Inputs
The baseline patient characteristics in the sponsor’s model were aligned with the CL303 study (same distribution across age groups, 65.2% female and 34.8% male).1
Clinical event rates for morbidities were informed by an XLH life-course analysis assessing the prevalence of morbidities at baseline from the CL303 study and survey findings from the UX023-CL001 study (the CL001 study in short): fracture rates were informed by bone scan data and modelled as repeated events assuming a constant rate over time; the rates of hyperparathyroidism, parathyroidectomy, and kidney stones were informed by prevalence data and modelled using external data depending on whether patients required surgical intervention or medical management, or were placed under watchful waiting; and the rates of spinal surgery, tinnitus and hearing loss, spinal stenosis, and dental problems were informed by prevalence data and modelled under the assumption that surgical intervention would be required as treatment (used in scenario analysis only).1,3 These risks of clinical events were assumed to be the same for all patients in SOC or those on burosumab who did not attain serum phosphate normalization.
For patients being treated with burosumab, a proportion of patients were assumed to achieve serum phosphate normalization in the burosumab state (defined as achieving a mean serum phosphate concentration above the LLN of 2.5 mg/dL [0.81 mmol/L]). This proportion was derived from the 24-week results of the CL303 study. It was assumed as the difference between the trial arms (92.6% for patients who initiated treatment with burosumab minus 7.6% for patients who initiated treatment on SOC = 85.1%) and it remained constant over the model time horizon.1 For this proportion of patients attaining serum phosphate normalization, the clinical event rates for morbidities associated with chronic hypophosphatemia (i.e., fractures [base case] and spinal surgery, tinnitus and hearing loss, spinal stenosis, and dental problems [scenario analysis]) were reduced and assumed to be equivalent to those of the general population (derived from literature).1 For all other morbidity rates related to vitamin D and phosphate intake (e.g., hyperparathyroidism, parathyroidectomy, kidney stones), the sponsor assumed that all patients treated with burosumab, while remaining on treatment, immediately had their risks reduced to be equivalent to those of the general population due to the cessation of SOC.
The risk of all-cause mortality was incorporated based on Canadian life tables (age group–dependent and sex-dependent) and adjusted for excess mortality associated with XLH by applying a hazard ratio of 6.65 to all patients (derived from Hawley et al. [2020]).1,4 For the proportion of patients in the burosumab state who achieved serum phosphate normalization, this excess mortality associated with XLH was assumed to be reduced by 50%. For the proportion of patients not achieving serum phosphate normalization while in the burosumab state, the risk of death was assumed to be the same as that in SOC.
The indirect benefits of treatment with burosumab modelled through serum phosphate normalization (death and fractures) were tapered, meaning the sponsor assumed benefits to be gradually achieved upon treatment (50% of benefit in year 1, then full benefits in subsequent years if remaining on treatment) and gradually lost upon discontinuation (50% of benefit remaining in year 1 after discontinuation, followed by the removal of benefits in subsequent years).
The annual discontinuation rate of treatment with burosumab was based on 48-week and 96-week data from the CL303 study (7.9% in year 1 and 6.9% in subsequent years).3 Patients who discontinued burosumab were assumed to experience morbidities and risk of death at the same rate as patients receiving SOC, following the tapering period.
Utilities were derived by mapping WOMAC data from the CL303 study and the BUR02 study (up to 3.2 years) to the EQ-5D tool via a published mapping algorithm developed by Wailoo et al. (2014) using the UK EQ-5D tariff.1,5 Baseline age-dependent utilities were calculated using linear regression and the WOMAC scores from patients in the placebo arm. All patients entered the model with this baseline utility (e.g., 0.49 if aged 18 years) for both the burosumab and SOC treatment arms. Patients receiving SOC accrued this age-dependent baseline utility throughout the model and did not receive any treatment utility benefit regardless of their serum phosphate levels. Burosumab treatment–specific utility benefit was assumed as the mean change in utility from baseline at annual intervals, and estimated as the difference between the utilities in the burosumab and placebo treatment arms of the trial (0.1152 in year 1, 0.1612 in year 2, and 0.1756 in year 3 and beyond). In the model, this burosumab treatment–specific utility benefit was added to the baseline utilities for all patients in the burosumab state regardless of serum phosphate levels. Upon treatment discontinuation, the utility benefit associated with burosumab is gradually lost (50% of benefit remaining in year 1 after discontinuation, followed by the removal of benefits in subsequent years) and patients return to the same age-dependent baseline utility values as those in SOC.
Disutilities related to morbidities were applied as utility multipliers and assumed to be independent of each other. Disutility multipliers were applied for individual fractures (e.g., lower limb, spinal, upper limb, other)1 in the first 12 months following fracture, and long-term disutility due to fractures was assumed to persist for subsequent years until patient death. Disutility associated with SOC due to gastrointestinal issues was applied to 56% of patients treated with vitamin D and phosphate, based on a patient advocacy group survey commissioned by the sponsor.3
Costs considered in the model included drug acquisition costs, treatment monitoring costs, and costs associated with morbidities. Drug acquisition costs for burosumab were sourced from the sponsor.1 SOC costs for vitamin D (e.g., calcitriol, alfacalcidol) were sourced from the Ontario Drug Benefit Formulary and costs for phosphate were obtained from Alberta Health Services.6,7 Treatment monitoring costs included physician visits, the assessment of serum phosphate levels, and kidney ultrasounds, based on the frequency of use derived from international treatment guidelines for XLH and costs sourced from the Ontario Schedule of Benefits.8-10 Resource use costs for morbidities such as fractures, kidney stones, and hyperparathyroidism and parathyroidectomy were based on published literature and included as a one-off cost in the year in which each clinical event occurred.1
Summary of Sponsor’s Economic Evaluation Results
All analyses were run probabilistically (2,000 iterations for the base-case and scenario analyses). The deterministic and probabilistic results were similar. The probabilistic findings are presented as follows.
Base-Case Results
In the sponsor’s base case (Table 3), burosumab was associated with incremental costs of $4,055,002, an incremental QALY gain of 2.74, and an incremental LY gain of 0.97 versus with SOC, resulting in an ICER of $1,482,062 per QALY gained. The probability that burosumab was cost-effective at a $50,000 per QALY gained threshold was 0%.
The majority of the incremental QALYs (more than 93%) associated with burosumab were accrued in the model after extrapolation of the trial data (i.e., clinical data informing WOMAC scores were largely based on 96-week data from the CL303 study versus up to 110 years of age, which is the model’s time horizon). Key drivers of cost-effectiveness results were the drug acquisition costs of burosumab and the treatment-specific utilities attributed to burosumab derived from mapping WOMAC scores (fatigue, pain, stiffness) to EQ-5D. Additional results from the sponsor’s submitted economic evaluation base case are presented in Appendix 3.
Table 3: Summary of the Sponsor’s Economic Evaluation Results
Drug | Total costs ($) | Incremental costs ($) | Total LYs | Incremental LYs | Total QALYs | Incremental QALYs | ICER vs. SOC ($/QALY) |
|---|---|---|---|---|---|---|---|
SOC | 61,798 | Reference | 20.95 | Reference | 8.68 | Reference | Reference |
Burosumab | 4,116,801 | 4,055,002 | 21.92 | 0.97 | 11.42 | 2.74 | 1,482,062 |
ICER = incremental cost-effectiveness ratio; LY = life-year; QALY = quality-adjusted life-year; SOC = standard of care; vs. = versus.
Note: The submitted analysis is based on the publicly available prices of all treatments.
Source: Sponsor’s pharmacoeconomic submission.1
Sensitivity and Scenario Analysis Results
The sponsor conducted several scenario analyses including CL001 study data to inform population characteristics, utilities, and clinical morbidity prevalence; lower reductions in morbidity incidence with burosumab; additional morbidities such as dental problems, spinal stenosis and spinal surgery, and tinnitus or hearing loss; alternate fracture incidence data for morbidity; and reduced XLH-related mortality. Across all scenario analyses, ICERs ranged from $1,377,197 to $1,611,932 per QALY. The ICER was most sensitive to changes in the reduction in the incidence of morbidities and toxicities when treated with burosumab (from 100% to 50%) and changes in the reduction in excess XLH-related mortality with burosumab (from 50% to 25%), resulting in ICERs of $1,611,932 and $1,605,302, respectively.
The sponsor conducted a scenario analysis from a societal perspective; this analysis included additional costs associated with lost productivity as well as the health-related quality of life impact of XLH on caregivers. In this analysis, relative to SOC, the ICER was $1,335,463 per QALY gained, similar to the sponsor’s base case using a health care payer perspective.
CDA-AMC Appraisal of the Sponsor’s Economic Evaluation
CDA-AMC identified several key limitations to the sponsor’s analysis that have notable implications for the economic analysis.
The comparative efficacy of burosumab is highly uncertain and assumptions used in the model are not fully supported by the clinical evidence: The treatment effect of burosumab in the adult XLH population was assumed by the sponsor to include direct benefits of burosumab treatment itself, as well as indirect benefits associated with achieving serum phosphate normalization, and several key assumptions in the model are not supported by the submitted clinical evidence.
First, the direct benefits of burosumab were modelled as improved quality of life mapped from WOMAC scores (encompassing stiffness, pain, and fatigue), as well as a 100% reduction of all morbidities associated with SOC active treatments (i.e., phosphate and active vitamin D intake that may lead to hyperparathyroidism, parathyroidectomy, and kidney stones). The CDA-AMC clinical review found that treatment with burosumab versus placebo led to reductions in WOMAC scores for stiffness, although there was a lack of notable impact in pain or fatigue scores. Importantly, however, the magnitude of benefit and meaningfulness of the observed changes in WOMAC scores remains unclear since the minimal clinically important differences (MCIDs) had limited external validity due to the pivotal trial data also being the source data for the MCIDs, and the CL303 study being only powered for the primary end point and therefore may not be powered to capture changes in WOMAC outcomes. The magnitude of WOMAC benefits predicted with burosumab versus SOC is therefore associated with uncertainty. Additionally, morbidity related to SOC active treatments was not a formal outcome measured in the pivotal trial (as it was designed versus placebo), and numerically similar rates occurred across both treatment arms. There is no existing clinical evidence to support a 100% reduction in hyperthyroidism, parathyroidectomy, and kidney stones once patients begin treatment with burosumab. Clinical expert input obtained by CDA-AMC suggested that it is likely that patients discontinuing SOC active treatments would eventually experience the resolution of all morbidities related to phosphate and active vitamin D intake, yet the extent of this reduction is unknown.
Second, the indirect benefits were assumed to apply to patients treated with burosumab who achieved serum phosphate normalization. For the clinical evidence, the CDA-AMC clinical review concluded that results from the CL303 study showed a notable majority of patients from the burosumab-emergent and placebo-emergent arms had serum phosphorus levels above LLN at week 48 and week 96 during the open-label phase of the CL303 study; however, a waning in the proportion of patients maintaining this response was observed at later time points. Clinical experts consulted by CDA-AMC noted that the magnitude of effect in serum phosphate normalization observed in the initial 24-week results was likely clinically meaningful. However, there was no trial evidence to support reductions in the incidence of fractures (or reduction in mortality) as assumed by the sponsor. In the model, all patients with XLH experienced an increased incidence of fractures due to XLH at baseline. However, patients with burosumab achieving serum phosphate normalization were then assumed to experience the same incidence of fractures as the general population. Based on the available 24-week trial data, there was a trend toward the increased healing of fractures or pseudofractures with burosumab versus placebo, but the magnitude of benefit is unknown and long-term data are lacking. There is no clinical evidence to suggest that the risk of new fractures in burosumab-treated patients achieving serum phosphate normalization is equivalent to the general population as this outcome was not assessed in the pivotal trial. Clinical expert input obtained by CDA-AMC suggested that it is reasonable to assume a reduction in the risk of fractures after achieving serum phosphate normalization; however, the extent to which it would be similar to the general population is unknown and may be an overestimation of the treatment benefit.
Lastly, there remains no head-to-head trial in patients with XLH of burosumab versus active therapies included in the SOC (active vitamin D and phosphate). The submitted RWE had important limitations and the CDA-AMC clinical review was not able to draw conclusions with certainty about the comparative safety or efficacy of burosumab relative to active therapies. In the absence of direct comparative evidence, the sponsor assumed that the placebo data would be representative of both patients receiving no treatment or active therapies in the SOC treatment arm in the model. For other key parameters such as the incidence of fractures, the sponsor conducted a life-course analysis of baseline data of the CL303 study and the CL001 study, and this was assumed to represent the natural history of the disease for patients with XLH in SOC.
Overall, the limitations with the available clinical evidence to inform the relative efficacy of burosumab versus SOC and the various assumptions of indirect benefit after achieving serum phosphate normalization likely led to an overestimation of incremental QALYs gained with burosumab.
CDA-AMC was unable to address the lack of direct comparative evidence to active treatments.
CDA-AMC adjusted the benefit of burosumab in the reduction of incident fractures from 100% to 80%, aligned with clinical expert input.
Assumptions regarding the reduction in XLH-related mortality associated with burosumab are highly uncertain and not supported by clinical evidence: The sponsor assumed a survival benefit with burosumab upon achieving serum phosphate normalization (i.e., treatment response). The sponsor modelled an increased risk of mortality associated with XLH by applying a hazard ratio of 6.65 to the general population risk of death, based on Hawley et al. (2020).4 This citation hypothesized that reduced survival in patients with XLH may be driven by an imbalance in comorbidities and other characteristics of patients with XLH, the management of comorbidities, and a potential direct FGF23 pathway. However, clinical expert input indicated that clinical events such as renal failure requiring dialysis or life-threatening hip fractures would be the most likely drivers of increased mortality in patients with XLH.
Notably, the sponsor does not model mortality based on the incidence of fractures or renal failure in the submitted model but instead assumes that all patients on burosumab achieving treatment response will experience a 50% reduction in XLH-related mortality relative to patients receiving SOC. Mortality was not a formal outcome assessed in the CL303 study (versus placebo). Based on count data, numerically similar deaths occurred during the pivotal trial across both treatment arms. Additionally, although trial data showed a statistically significant odds ratio of fractures or pseudofractures fully healed for burosumab versus placebo at week 24 (50.0% versus 0.0% of baseline active fractures and 41.2% versus 9.0% of pseudofractures were fully healed for burosumab and placebo, respectively), long-term data are lacking. Some literature suggests that treatment of osteoporosis may be associated with reductions in mortality, and that effect sizes were found to be small and most prominent in study populations with higher mortality rates.11 As such, there is insufficient clinical evidence to support a reduction in excess mortality in the patient population with XLH and it is uncertain whether interventions reducing fractures would have an impact on mortality as optimistic as the sponsor’s assumption. Clinical expert input indicated that a reduction of 50% may be overestimated and there is a considerable amount of uncertainty regarding the extent of this assumed survival benefit. CDA-AMC notes that this assumed reduction in mortality is a key driver of cost-effectiveness estimates.
CDA-AMC adjusted the reduction in XLH-related mortality from 50% to 25%, aligned with clinical expert input.
The durability of treatment response with burosumab is highly uncertain: In the submitted model, indirect benefits of treatment with burosumab (in mortality and the incidence of fractures) were assumed to be associated with achieving serum phosphate normalization (i.e., treatment response). Although serum phosphate normalization is a key driver of results, data informing this parameter was based on the 24-week results from the CL303 study and assumed to be maintained indefinitely for the remainder of the lifetime time horizon (i.e., up to 110 years of age) until treatment discontinuation or death. Based on trial data from the CL303 study, 92.6% (63 of 68) of patients receiving burosumab attained serum phosphorus levels above LLN at week 24. By week 96, 82.4% (56 of 68) of patients initially randomized to burosumab showed this response. The submitted trial data may represent a treatment waning effect with burosumab. Whether the proportion of patients achieving treatment response would decrease further after week 96 is uncertain due to the lack of data beyond this time point. CDA-AMC notes that more than 93% of the incremental QALYs gained with burosumab relative to SOC were accrued based on extrapolation (i.e., in the post-trial period), highlighting the importance of assumptions related to long-term relative treatment effectiveness. Uncertainty exists surrounding the durability of the treatment effect with burosumab; however, the exclusion of a treatment waning effect as seen in the pivotal trial data likely leads to an overestimation of treatment benefit over time.
CDA-AMC applied a treatment waning effect of 10.2% in years 3 and beyond to reflect the available 96-week trial data from the CL303 study.
There is uncertainty regarding utility values and disutility multipliers: Several methodological issues were identified with the derivation of utilities and how they were applied in the model. Therefore, the utility estimates produced in the sponsor’s base-case analysis are associated with uncertainty.
First, the derivation of utility values was estimated by mapping the WOMAC scores from the CL303 study and the BUR02 study using a published algorithm in patients with knee osteoarthritis.5 According to the CDA-AMC Guidelines for the Economic Evaluation of Health Technologies: Canada — 4th Edition,12 mapping as a means of deriving health utilities is not recommended, since “the predictive value can vary dramatically depending on the instruments being mapped, the algorithm used, and the severity of the health states included, and, therefore, mapping is unlikely to successfully capture the utility relationship.” Although the sponsor mentions various available algorithms, the authors of the algorithm chosen by the sponsor concluded that “stiffness has limited relationship to EQ-5D, whereas functional disability and pain are strong predictors.”5 The CDA-AMC clinical review found that while potentially notable reductions in WOMAC scores, particularly stiffness scores, were reported and reductions maintained over longer time periods, there was a lack of notable impact noted in the pain or fatigue scores, with reductions below 2 points from baseline. The meaningfulness of these changes remains unknown since the MCIDs provided in the submission were derived from the same dataset as the pivotal trial and are thus hampered by a lack of external validity. Therefore, the uncertainty of using mapping techniques to derive utility values is compounded by the uncertainties concerning the relative benefits of burosumab on the relevant domains of the WOMAC scores that are strong predictors of utilities.
Second, the sponsor assumed that treatment itself would lead to improvement in quality of life and this benefit is expected to both increase (across the initial 3 years of treatment) and also be maintained as long as patients remain on treatment with burosumab, regardless of their response status. All patients receiving burosumab accrued a utility benefit ranging from 0.12 (year 1), 0.16 (year 2), and 0.18 (year 3 and subsequent years), regardless of achieving treatment response (i.e., serum phosphate normalization). Treatment-specific utilities are generally considered to be inappropriate, and health state (e.g., response) and event-specific utilities are preferred, as per the CDA-AMC Guidelines for the Economic Evaluation of Health Technologies: Canada — 4th Edition.12 Notably, the majority of incremental QALYs estimated by the model was attributed to the gain in quality of life attributed to the treatment itself (relative to the reduction in quality of life due to fractures or morbidities associated with SOC therapies). The utilities estimated by the model likely favoured burosumab because patients treated with burosumab who did not achieve serum phosphate normalization were assumed to experience the same utility benefit as those who did respond to treatment.
Lastly, the sponsor captured the impact of newly occurring fractures (e.g., lower limb or hip fracture, vertebrae or spinal fracture, upper limb, other fractures) through utility multipliers, assumed to be independent of one another. The disutility multipliers were applied first in the year in which the event happened (e.g., acute event) and a long-term disutility was applied in subsequent years that was assumed to persist for the remainder of the time horizon. According to clinical experts consulted by CDA-AMC, it is not expected that a patient with XLH experiencing fractures would have a decrease in quality of life for the remainder of their lifetime. Experts noted that the healing time required for severe fractures in patients with XLH would be considerably longer than in the general population (e.g., months or a year for patients with XLH compared to weeks for an individual without XLH). However, an individual fracture event would still be expected to heal and the assumed lifelong decrease in quality of life did not meet face validity. The negative impact of fractures on quality of life was therefore likely overestimated by the assumption that a disutility would be experienced for the remainder of the patient's lifetime after the initial clinical event. Additionally, it is uncertain whether the use of utility multipliers would also be double counting the decrease in quality of life due to fractures, if they were already reflected within the utilities mapped from the WOMAC scores.
CDA-AMC could not address the issues with the predicted utility values in reanalysis due to the submitted model structure.
A scenario analysis was conducted where the effect of fracture-related utility multipliers was removed.
The submitted model structure is associated with methodological limitations: The sponsor submitted a Markov model with 3 health states based on treatment status (instead of treatment response) and survival. The model structure and patient flow across health states differ based on whether patients receive burosumab or SOC. In the burosumab treatment arm only, the occurrence of morbidities and risk of XLH-related mortality differs based on whether patients achieve serum phosphate normalization (i.e., treatment response). Patients receiving SOC remain at baseline risk for XLH-related mortality, morbidities associated with XLH (e.g., the increased incidence of fractures), and morbidities associated with SOC treatments (e.g., hyperthyroidism), regardless of serum phosphate levels. There are several limitations associated with the sponsor’s approach to modelling XLH. First, based on best practices in modelling, the model structure and patient flow across health states should not differ between treatment arms. Based on the same response definition of achieving serum phosphate normalization (i.e., achieving a mean serum phosphate concentration above the LLN of 2.5 mg/dL [0.81 mmol/L]), the sponsor did not model the possibility of patients benefiting from SOC. Notably, SOC comprised active vitamin D and phosphate, or no active treatment. While it is reasonable to assume that patients would not benefit from receiving no treatment, clinical expert input indicated that it was possible for a small proportion of patients to achieve serum phosphate normalization when treated with active vitamin D and phosphate.
Second, patients within the SOC health state may have differing baseline characteristics, which introduces heterogeneity into the model. It is unclear if patients in the placebo arm of the CL303 study were refractory to conventional treatments and uncertain as to why 54.3% of patients in the trial received prior active therapy when the remainder did not (i.e., it was not clear if patients discontinued due to AEs or other reasons). From a methodological perspective, health states in an economic model should represent a homogenous group of patients who have similar expected costs and quality-of-life considerations and should be based on the clinical or care pathway for the condition of interest; this is not adequately captured by the modelling of SOC.
Third, the parameters used to inform the SOC treatment arm were derived from the placebo arm of the CL303 study, and as it only included patients who did not receive any active treatment, it remains uncertain whether patients on conventional therapy would respond similarly to those who did not receive any active treatment. Response to treatment was not included in the submitted model in the SOC treatment arm.
Overall, the cost-effectiveness of burosumab was likely slightly overestimated by excluding the possibility of any benefit with SOC, although this was not expected to largely impact the ICER as it is anticipated that only a small proportion of patients receiving SOC would achieve serum phosphate normalization.
CDA-AMC could not address this limitation in reanalysis.
Discontinuation after the trial period is uncertain and likely overestimated: In the submitted model, discontinuation was assumed to be 7.9% in year 1, followed by 6.9% in subsequent years (based on 48-week and 96-week data from the CL303 study, respectively). Notably, AEs for burosumab-treated patients were not included in the model. While it is reasonable to assume an initial treatment discontinuation within the economic model, it is uncertain if discontinuation would occur at the same rate over a lifetime. By applying a constant rate of discontinuation in subsequent years, the model predicted that approximately 51% of patients would have discontinued treatment with burosumab after 10 years. Based on the trial data, discontinuation occurred for reasons not reported, and no patients were reported to have stopped treatment due to AEs. Clinical experts consulted by CDA-AMC confirmed that XLH is a chronic disease and patients are likely to continue treatment if well tolerated, as limited treatment alternatives exist. Discontinuation may be due to patient preference when seeing improvements in symptoms over time. However, disease recurrence is expected to occur after discontinuation, and it is reasonable to expect that patients would then resume treatment to alleviate disease-related symptoms. Since discontinuation data beyond 2 years is limited, the clinical experts consulted by CDA-AMC deemed that assuming a constant discontinuation rate did not meet face validity in the context of chronic treatment. By assuming a fixed discontinuation rate over a lifetime and not accounting for patients resuming treatment after discontinuation (if not specified to be due to lack of efficacy or AEs), drug costs and the ICER for burosumab versus SOC were likely underestimated.
CDA-AMC assessed an alternate annual probability of discontinuation of 3.5% in a scenario analysis.
Additionally, the following key assumptions were made by the sponsor and have been appraised by CDA-AMC (refer to Table 4).
Table 4: Key Assumptions of the Submitted Economic Evaluation (Not Noted as Limitations to the Submission)
Sponsor’s key assumption | CDA-AMC comment |
|---|---|
Patients enrolled in the CL303 study were assumed to be representative of patients in Canada who would be eligible for treatment with burosumab. | Likely appropriate. Clinical expert input and the CDA-AMC clinical review noted that the pivotal trial participant characteristics were generally representative of patients seen in clinical practice. However, the reimbursement criteria specifies “insufficient response or refractory to conventional therapy or if patients experience complications related to conventional therapy” and it was not clear in the trial whether all patients were refractory to conventional therapy or not. The majority of patients, however, was previously treated with conventional therapies. |
The proportion of patients experiencing dose reductions was assumed to remain constant for the lifetime time horizon. | Uncertain. As per the product monograph, a proportion of patients may require dose reductions if their serum phosphorus levels are above the normal range. However, serum phosphorus should be reassessed every 2 weeks after any change in dose, and it is unclear whether patients who required dose reductions based on the 96 weeks of the CL303 study would eventually resume their original dose during their lifetime. CDA-AMC notes that if patients who experience dose reductions eventually return to their original starting dose, their drug acquisition costs are underestimated. As such, the cost-effectiveness of burosumab may be overestimated. |
No utility impacts were associated with treatment-related adverse events. | Uncertain. The overall incidence and severity of safety events were comparable across the burosumab and placebo arms in the CL303 study, but a potentially cumulative treatment-emergent adverse event burden was identified through an analysis adjusting for the duration of burosumab exposure; this is a potentially important consideration as treatment with burosumab will be lifelong, per the clinical expert consulted by CDA-AMC. |
CDA-AMC = Canada’s Drug Agency.
CDA-AMC Reanalyses of the Economic Evaluation
Base-Case Results
CDA-AMC undertook reanalyses that addressed key limitations within the submitted economic model, as summarized in Table 5. The CDA-AMC base case was derived by making changes in model parameter values and assumptions, in consultation with clinical experts. CDA-AMC undertook a stepped reanalysis that assumed patients achieving response on burosumab experienced an 80% reduction in the incidence of fractures versus SOC, and a 25% reduction in XLH-related mortality versus SOC; CDA-AMC also applied a treatment waning effect of 10.2% after year 3 on treatment to reflect loss of response. All CDA-AMC probabilistic reanalyses were based on 2,000 iterations. CDA-AMC was unable to address remaining limitations of the model, including the lack of long-term comparative clinical data beyond 24 weeks, in addition to the lack of evidence to support assumptions surrounding reductions in mortality and fracture incidence.
Table 5: CDA-AMC Revisions to the Submitted Economic Evaluation
Stepped analysis | Sponsor’s value or assumption | CDA-AMC value or assumption |
|---|---|---|
Changes to derive the CDA-AMC base case | ||
1. Incidence of fractures | Incidence of fractures with XLH is reduced to the general population for patients achieving serum phosphate normalization on burosumab (100% reduction to general population risks) | Incidence of fractures with XLH for patients achieving serum phosphate normalization on burosumab is reduced by 80% relative to SOC |
2. Reduction in XLH-related mortality | Patients achieving serum phosphate normalization on burosumab experienced a 50% reduction in XLH-related mortality vs. SOC (HR = 3.83) | Patients achieving serum phosphate normalization on burosumab experienced a 25% reduction in XLH-related mortality vs. SOC (HR = 5.24) |
3. Treatment waning effect | Treatment benefit is maintained indefinitely (100% of benefit after year 3) unless discontinuation occurs | A treatment waning effect of 10.2% is applied after year 3 on treatment to reflect the loss of response in patients remaining on treatment with burosumab using 96-week data from the CL303 study. |
CDA-AMC base case | ― | Reanalysis 1 + 2 + 3 |
CDA-AMC = Canada’s Drug Agency; HR = hazard ratio; SOC = standard of care; vs. = versus; XLH = X-linked hypophosphatemia.
In the CDA-AMC base case, burosumab was associated with incremental costs of $3,877,365, an incremental QALY gain of 2.31, and an incremental LY gain of 0.41 versus with SOC, resulting in an ICER of $1,680,920 per QALY gained. The probability that burosumab was cost-effective at a $50,000 per QALY gained threshold was 0%.
Results were driven by the drug acquisition costs of burosumab (incremental costs = $3,895,214) (Table 11). Consistent with the sponsor’s analysis, the CDA-AMC base case estimates that more than 93% of the incremental QALYs are accrued after the trial period. The majority of benefit predicted with burosumab is based on the WOMAC benefit of burosumab, leading to an incremental QALY gain of 1.61 (approximately 70% of all incremental QALY gains).
Table 6: Summary of the Stepped Analysis of the CDA-AMC Reanalysis Results
Stepped analysis | Drug | Total costs ($) | Total QALYs | ICER ($/QALY) |
|---|---|---|---|---|
Sponsor’s base case | SOC | 61,285 | 8.76 | Reference |
Burosumab | 3,926,396 | 11.35 | 1,491,795 | |
CDA-AMC reanalysis 1: Reduced benefit on fractures | SOC | 61,285 | 8.76 | Reference |
Burosumab | 3,928,696 | 11.28 | 1,538,170 | |
CDA-AMC reanalysis 2: Reduced benefit on mortality | SOC | 61,285 | 8.76 | Reference |
Burosumab | 3,819,044 | 11.10 | 1,605,302 | |
CDA-AMC reanalysis 3: Treatment waning | SOC | 61,285 | 8.76 | Reference |
Burosumab | 3,906,612 | 11.28 | 1,529,509 | |
CDA-AMC base case (reanalysis 1 + 2 + 3) (deterministic) | SOC | 61,285 | 8.76 | Reference |
Burosumab | 3,812,945 | 10.99 | 1,687,655 | |
CDA-AMC base case (reanalysis 1 + 2 + 3) (probabilistic) | SOC | 61,618 | 8.71 | Reference |
Burosumab | 3,938,983 | 11.02 | 1,680,920 |
CDA-AMC = Canada’s Drug Agency; ICER = incremental cost-effectiveness ratio; QALY = quality-adjusted life-year; SOC = standard of care.
Note: The CDA-AMC reanalysis is based on publicly available prices of the comparator treatments. The results of all steps are presented deterministically unless otherwise indicated, while the cumulative CDA-AMC base case is always presented both deterministically and probabilistically.
Table 7: CDA-AMC Price Reduction Analyses
Analysis; price reduction | Unit drug cost per mg ($) | ICERs for burosumab vs. SOC ($/QALY) | |
|---|---|---|---|
Sponsor base case | CDA-AMC reanalysis | ||
No price reduction | 451 | 1,482,062 | 1,680,920 |
10% | 406 | 1,340,096 | 1,517,537 |
20% | 361 | 1,198,130 | 1,354,153 |
30% | 316 | 1,056,164 | 1,190,769 |
40% | 271 | 914,198 | 1,027,385 |
50% | 226 | 772,232 | 864,002 |
60% | 181 | 630,266 | 700,618 |
70% | 135 | 488,300 | 537,234 |
80% | 90 | 346,334 | 373,851 |
90% | 45 | 204,368 | 210,467 |
100% | 0 | Burosumab is dominant | Burosumab is dominant |
CDA-AMC = Canada’s Drug Agency; ICER = incremental cost-effectiveness ratio; QALY = quality-adjusted life-year; SOC = standard of care; vs. = versus.
Scenario Analysis Results
CDA-AMC undertook price reduction analyses based on the sponsor’s submitted results and the CDA-AMC base-case reanalysis. The CDA-AMC base case suggests that a 99.8% price reduction is required for burosumab to be considered cost-effective at a willingness-to-pay threshold of $50,000 per QALY gained versus SOC. The annual drug acquisition costs of burosumab would range from $822 to $1,057 per patient at a 99.8% price reduction.
CDA-AMC conducted the following additional scenario analyses to determine the impact of alternate assumptions on the cost-effectiveness of burosumab relative to SOC.
CDA-AMC removed disutility multipliers (e.g., a decrease in utility after experiencing fractures that is assumed for the patient’s lifetime).
CDA-AMC implemented an alternate annual discontinuation rate of 3.5% in years 2 and beyond.
When disutility multipliers for fracture events were removed, the ICER of burosumab versus SOC increased to $1,909,204 per QALY gained. When applying a lower annual discontinuation rate of 3.5% for burosumab after year 1, the ICER remained relatively stable at $1,674,958 per QALY gained versus the CDA-AMC base case. However, the incremental costs and QALYs increased considerably (incremental costs = $5,376,131; incremental QALYs = 3.21), highlighting that patients will likely incur higher burosumab-related treatment costs during their lifetime due to being on treatment longer than predicted by the sponsor. The results of these analyses are presented in Table 12.
Issues for Consideration
Genetic testing costs to obtain a diagnosis of XLH (i.e., a confirmed PHEX gene variant in either the patient or in a directly related family member with appropriate X-linked inheritance as per the submitted reimbursement request) were excluded from the analysis. However, CDA-AMC notes that the sponsor offers a genetic testing program that covers all genetic testing costs if patients meet program eligibility.13
Burosumab has been previously reviewed by CADTH for the treatment of XLH in adult and pediatric patients aged 1 year and older at a submitted price of $499.23 per mg.14 The final recommendation was to reimburse with clinical criteria and/or conditions in pediatric patients only who are aged at least 1 year and in whom epiphyseal closure has not yet occurred.14
Overall Conclusions
The CDA-AMC clinical review concluded that results from the additional data submitted from the CL303 study reporting on the 2 study populations initially randomized to burosumab and placebo for 24 weeks, all receiving burosumab in open-label extensions at week 48 and week 96, showed that a notable majority of patients had midpoint serum phosphorus levels greater than the LLN; however, a waning in the proportion of patients attaining this outcome was observed at 96 weeks. A trend toward increased healing in fractures or pseudofractures was also noted along with statistically significant odds of a fracture being graded as fully healed at 24 weeks, although longer-term data remained lacking. While potentially notable reductions in WOMAC scores, particularly stiffness scores, were reported and reductions maintained over longer time periods, there was a lack of notable impact noted in the pain and fatigue scores, and the meaningfulness of these changes remains unknown. The reassessment was not able to conclude anything with certainty about comparative efficacy due to limitations in the RWE and there remains no information on the safety of burosumab relative to conventional therapy. The uncertainty in direct and indirect benefits assumed with burosumab is reflected in the submitted economic analysis.
The CDA-AMC base-case results were similar to the sponsor’s base case. In the CDA-AMC base case, burosumab was associated with incremental costs of $3,877,365, an incremental QALY gain of 2.31, and an incremental LY gain of 0.41 versus with SOC, resulting in an ICER of $1,680,920 per QALY gained. Key drivers of the analysis include the drug acquisition costs of burosumab (incremental costs = $3,895,214), as well as the utility benefit assumed to occur in all patients treated with burosumab regardless of response to treatment (incremental QALYs = 1.61, which accounts for approximately 70% of all total QALY gains). The probability that burosumab was cost-effective at a $50,000 per QALY gained threshold was 0%. Relative to SOC, the annual drug acquisition costs of burosumab would need to decrease to approximately $822 to $1,057 per patient (from $389,427 per patient per year) to be considered cost-effective at a $50,000 per QALY threshold (99.8% reduction).
CDA-AMC notes that a number of assumptions were used in the sponsor’s economic model: direct benefits of burosumab versus SOC (e.g., a reduction in morbidities occurring due to conventional therapies) and indirect benefits associated with serum phosphate normalization (e.g., a reduction in fracture incidence equivalent to the general population, reduced mortality) that are not fully supported by clinical evidence. Consistent with the sponsor’s analysis, the CDA-AMC base case estimates that more than 93% of the incremental QALYs are accrued after the trial period and are mainly driven by the use of treatment-specific utilities. In the absence of robust, head-to-head, long-term clinical evidence compared to conventional therapies, the extent of treatment benefit associated with burosumab is highly uncertain. Consequently, the CDA-AMC base case may overestimate the clinical benefits associated with burosumab and therefore represent optimistic (upper bound) clinical benefits based on current clinical evidence. Higher price reductions may therefore be required for burosumab to be cost-effective.
References
1.Pharmacoeconomic evaluation [internal sponsor's report]. In: Drug Reimbursement Review sponsor submission: Crysvita (burosumab injection), 10 mg/mL, 20 mg/mL and 30 mg/mL single-use 1 mL vials, solution for subcutaneous injection. Princeton (NJ): Kyowa Kirin Canada; 2024 Jan 02.
2.Crysvita (burosumab injection): 10 mg/mL, 20 mg/mL and 30 mg/mL single-use 1 mL vials, solution for subcutaneous injection [product monograph]. Oakville (ON): Innomar Strategies; 2023 Mar 15.
3.Clinical Study Report: UX023-CL303, week 96/final analysis. a randomized, double-blind, placebo-controlled, phase 3 study with open-label extension to assess the efficacy and safety of KRN23 in adults with X-linked hypophosphatemia (XLH) [internal sponsor's report]. Novato (CA): Ultragenyx Pharmaceutical Inc.; 2019 Sep 19.
4.Hawley S, Shaw NJ, Delmestri A, et al. Prevalence and mortality of individuals with X-linked hypophosphatemia: a United Kingdom real-world data analysis. J Clin Endocrinol Metab. 2020;105(3):e871-878. PubMed
5.Wailoo A, Hernandez Alava M, Escobar Martinez A. Modelling the relationship between the WOMAC Osteoarthritis Index and EQ-5D. Health Qual Life Outcomes. 2014;12(1):37. PubMed
6.Ontario Ministry of Health, Ontario Ministry of Long-Term Care. Ontario drug benefit formulary/comparative drug index. 2023; https://www.formulary.health.gov.on.ca/formulary/. Accessed by sponsor, no date provided.
7.Government of Alberta. Interactive drug benefit list. 2023; https://idbl.ab.bluecross.ca/idbl/load.do. Accessed by sponsor, no date provided.
8.Haffner D, Emma F, Eastwood DM, et al. Clinical practice recommendations for the diagnosis and management of X-linked hypophosphataemia. Nat Rev Nephrol. 2019;15(7):435-455. PubMed
9.Schedule of benefits for physician services under the Health Insurance Act: (June 29, 2023 (effective July 24, 2023)). Toronto (ON): Ontario Ministry of Health; 2023: https://www.health.gov.on.ca/en/pro/programs/ohip/sob/physserv/sob_master.pdf. Accessed by sponsor, no date provided.
10.Schedule of benefits for laboratory services. (Effective July 24, 2023). Toronto (ON): Ontario Ministry of Health; 2023: https://www.health.gov.on.ca/en/pro/programs/ohip/sob/lab/sob_lab_2023.pdf. Accessed by sponsor, no date provided.
11.Bolland MJ, Grey AB, Gamble GD, Reid IR. Effect of osteoporosis treatment on mortality: a meta-analysis. J Clin Endocrinol Metab. 2010;95(3):1174-1181. PubMed
12.Guidelines for the economic evaluation of health technologies: Canada. 4th ed. Ottawa (ON): CADTH; 2017: https://www.cadth.ca/guidelines-economic-evaluation-health-technologies-canada-4th-edition. Accessed 2024 Mar 12.
13.Invitae Corporation. The Kyowa Kirin Sponsored Hypophosphatemia Program. 2024; https://www.invitae.com/ca/sponsored-testing/hypophosphatemia. Accessed 2024 Mar 18.
14.Drug Reimbursement Expert Review Committee final recommendation: burosumab (Crysvita — Kyowa Kirin Limited). Ottawa (ON): CADTH; 2020: https://www.cadth.ca/burosumab. Accessed 2024 Mar 12.
15.Endocrinology and Diabetes Clinic. Disorders of calcium and phosphorous. Vancouver (BC): BC Children's Hospital; 2021: http://www.bcchildrens.ca/endocrinology-diabetes-site/documents/cpdisorders.pdf. Accessed 2024 Mar 12.
16.Government BC. BC PharmaCare formulary search. 2023; https://pharmacareformularysearch.gov.bc.ca. Accessed 2024 Mar 12.
17.Budget Impact Analysis [internal sponsor's report]. In: Drug Reimbursement Review sponsor submission: Crysvita (burosumab injection), 10 mg/mL, 20 mg/mL and 30 mg/mL single-use 1 mL vials, solution for subcutaneous injection. Princeton (NJ): Kyowa Kirin Canada; 2024 Jan 02.
18.Beck-Nielsen SS, Brock-Jacobsen B, Gram J, Brixen K, Jensen TK. Incidence and prevalence of nutritional and hereditary rickets in southern Denmark. Eur J Endocrinol. 2009;160(3):491-497. PubMed
Appendix 1: Cost Comparison Table
Please note that this appendix has not been copy-edited.
The comparators presented in the following table have been deemed to be appropriate based on feedback from clinical experts. Comparators may be recommended (appropriate) practice or actual practice. Existing Product Listing Agreements are not reflected in the table and as such, the table may not represent the actual costs to public drug plans.
Table 8: CDA-AMC Cost Comparison Table for Management of X-Linked Hypophosphatemia
Treatment | Strength/ concentration | Form | Price | Recommended dosage | Daily cost ($) | Annual cost ($)a |
|---|---|---|---|---|---|---|
Recommended use | ||||||
Burosumab (Crysvita) | 10 mg/mL 20 mg/mL 30 mg/mL | Single-use vial | 4,514.9400 9,029.9000 13,544.8410 | 1 mg/kg of body weight, rounded to the nearest 10 mg up to a maximum dose of 90 mg, administered every 4 weeksa | 1,125.64 to 1,447.25 | 410,860 to 528,248b |
Actual practice (off-label use) | ||||||
Phosphates | ||||||
Sodium phosphates (Phoslax) | 125 mg/mLd | Oral solution | 0.5985 per grame | 750 mg to 1,600 mg dailyc | 0.45 to 0.96 | 164 to 350 |
Sodium phosphate | 500 mg | Oral effervescent tablet | 1.4010f per tablet | 750 mg to 1,600 mg dailyc | 2.80 to 5.60 | 1,023 to 2,045 |
Vitamin D | ||||||
Vitamin D Alfacalcidol (One-Alpha) | 0.25 mcg 1 mcg | Capsule | 0.5751 1.7215 per tablet | 0.75 mcg to 1.50 mcg per dayc | 1.73 to 2.87 | 630 to 1,048 |
Calcitriol (Calcitriol-Odan) | 0.25 mcg 0.50 mcg | Capsule | 0.2341 0.3723 per tablet | 0.50 mcg to 0.75 mcg per dayc | 0.47 to 0.61 | 171 to 221 |
CDA-AMC = Canada’s Drug Agency.
Note: Burosumab prices are from the sponsor’s pharmacoeconomic submission.1 All other prices are from the Ontario Drug Benefit Formulary (accessed March 2024), unless otherwise indicated, and do not include dispensing fees.6
aAfter initiation of treatment, measure fasting serum phosphorus on a monthly basis, measured 2 weeks postdose, for the first 3 months of treatment, and thereafter as appropriate. If the serum phosphorus level is within the normal range, continue with the same dose. If the serum phosphorus level is above the normal range, withhold the next dose and reassess the serum phosphorus level after 4 weeks. The patient must have a serum phosphorus level below the normal range to be able to reinitiate burosumab. Once the serum phosphorus level is below the normal range, treatment may be restarted at half the previous starting dose up to a maximum dose of 40 mg every 4 weeks. Reassess serum phosphorus 2 weeks after any change in dose. Do not adjust dose more frequently than every 4 weeks.2
bBased on an average patient weight of 70.7 kg, as reported in the CL303 trial and assuming patients receiving 13 administrations per year. It was assumed that no doses are held due to the serum phosphorus level being above the normal range,1 and using 70 mg and 90 mg to calculate the range (average dose/weight to maximum dose).
cDosing according to international treatment guidelines for XLH and validated by clinical experts consulted by CDA-AMC.8
dPer BC Children’s Hospital for Phoslax strength.15
ePer BC PharmaCare Formulary (accessed March 2024).16
fAlberta Interactive Drug Benefit List (accessed March 2024).7
Appendix 2: Submission Quality
Please note that this appendix has not been copy-edited.
Description | Yes or no | Comments |
|---|---|---|
Population is relevant, with no critical intervention missing, and no relevant outcome missing | Yes | No comment. |
Model has been adequately programmed and has sufficient face validity | No | Refer to CDA-AMC key limitation “the submitted model structure is associated with methodological limitations.” |
Model structure is adequate for decision problem | Yes | No comment. |
Data incorporation into the model has been done adequately (e.g., parameters for probabilistic analysis) | Yes | No comment. |
Parameter and structural uncertainty were adequately assessed; analyses were adequate to inform the decision problem | Yes | No comment. |
The submission was well organized and complete; the information was easy to locate (clear and transparent reporting; technical documentation available in enough details) | No | The sponsor’s pharmacoeconomic report lacked clarity and detail in the technical report (i.e., assumptions regarding morbidities related to hypophosphatemia were unclear and spread across multiple sections of the report). |
CDA-AMC = Canada’s Drug Agency.
Appendix 3: Additional Information on the Submitted Economic Evaluation
Please note that this appendix has not been copy-edited.
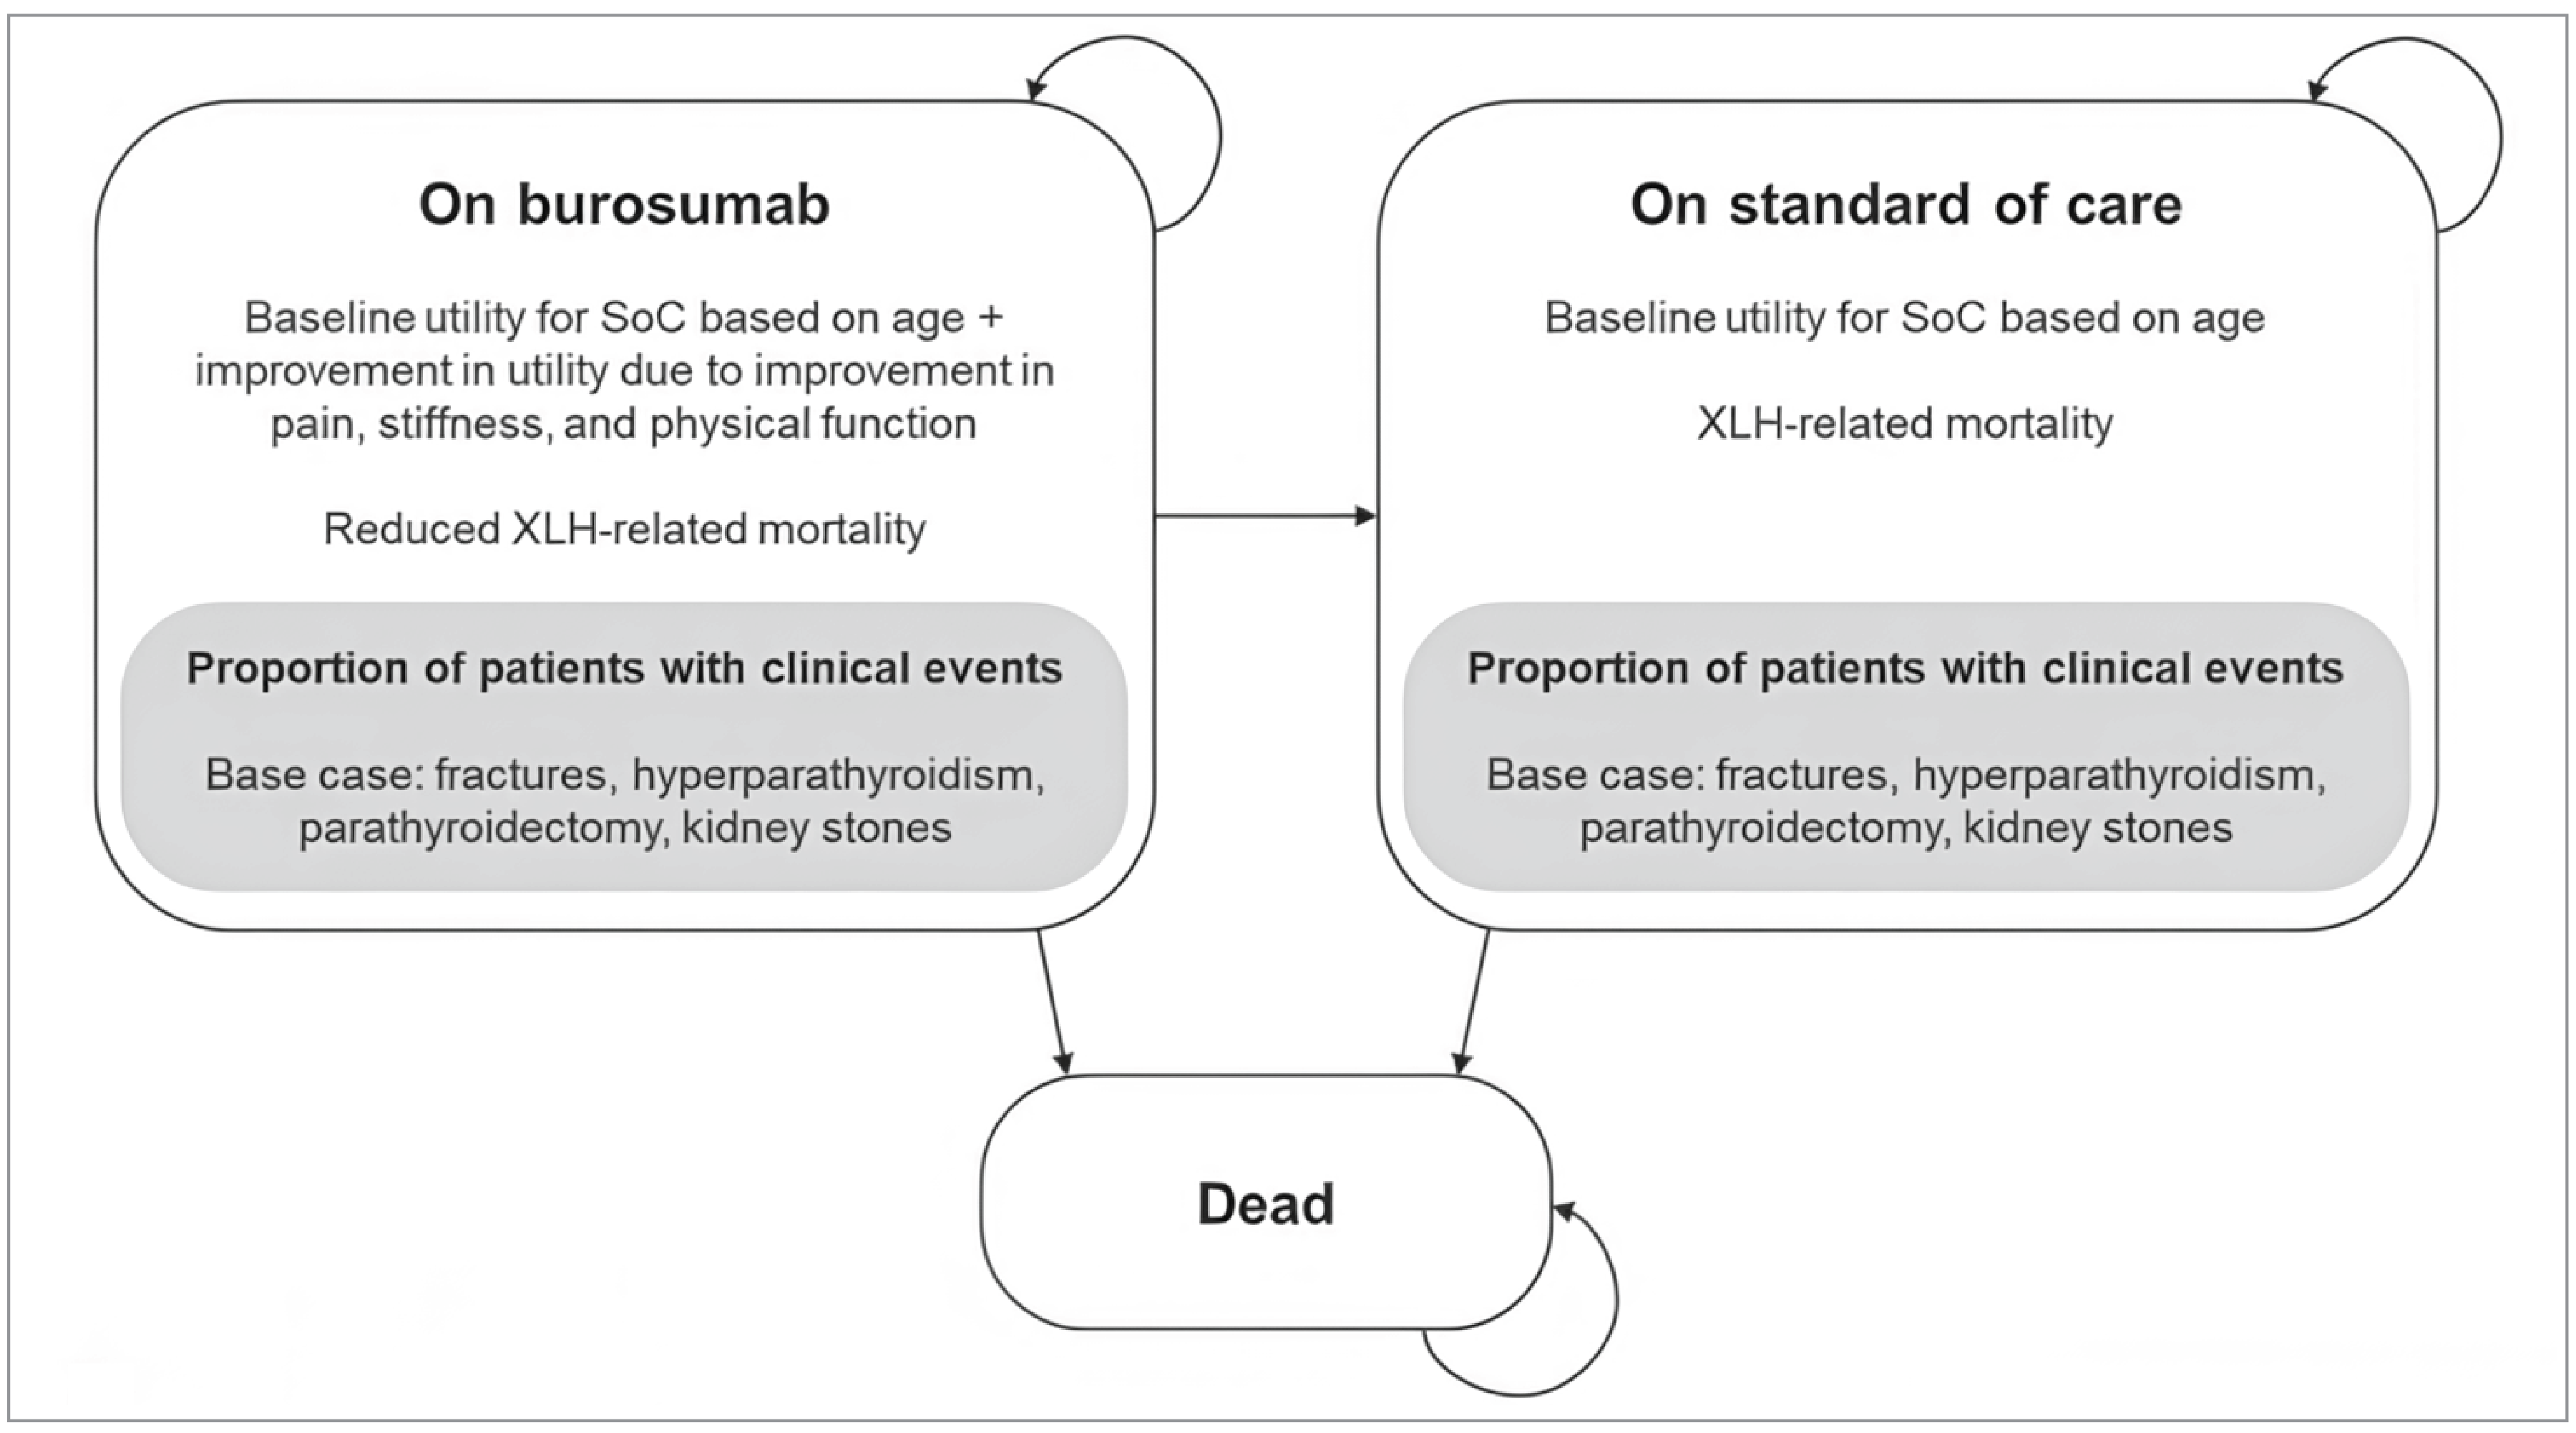
Detailed Results of the Sponsor’s Base Case
Table 10: Disaggregated Summary of the Sponsor’s Economic Evaluation Results
Parameter | Burosumab | Standard of care |
|---|---|---|
Discounted LYs | ||
Total | 21.92 | 20.95 |
Discounted QALYs | ||
Total | 11.42 | 8.68 |
Baseline QALYs | 9.06 | 8.68 |
WOMAC benefit of burosumab | 1.69 | 0 |
Morbidities avoided due to burosumab | 0.39 | 0 |
GI events avoided due to burosumab | 0.28 | 0 |
Discounted costs ($) | ||
Total | 4,116,801 | 61,798 |
Burosumab treatment costs | 4,075,450 | 0 |
SOC treatment costs | 12,400 | 22,301 |
Disease monitoring | 4,089 | 3,357 |
Clinical morbidity-related | 24,861 | 36,141 |
GI = gastrointestinal; LY = life-year; QALY = quality-adjusted life-year; WOMAC = Western Ontario and McMaster Universities Osteoarthritis Index.
Source: Sponsor’s pharmacoeconomic submission, probabilistic results.1
Appendix 4: Additional Details on the CDA-AMC Reanalyses and Sensitivity Analyses of the Economic Evaluation
Please note that this appendix has not been copy-edited.
Detailed Results of CDA-AMC Base Case
Table 11: Disaggregated Summary of Results of Economic Evaluation by CDA-AMC
Parameter | Burosumab | Standard of care |
|---|---|---|
Discounted LYs | ||
Total | 21.36 | 20.95 |
Discounted QALYs | ||
Total | 11.02 | 8.71 |
Baseline QALYs | 8.87 | 8.71 |
WOMAC benefit of burosumab | 1.61 | 0 |
Morbidities avoided due to burosumab | 0.27 | 0 |
GI events avoided due to burosumab | 0.27 | 0 |
Discounted costs ($) | ||
Total | 3,938,983 | 61,618 |
Burosumab treatment costs | 3,895,214 | 0 |
SOC treatment costs | 12,311 | 22,300 |
Disease monitoring | 4,027 | 3,391 |
Clinical morbidity-related | 27,432 | 35,927 |
CDA-AMC = Canada’s Drug Agency; GI = gastrointestinal; LY = life-year; QALY = quality-adjusted life-year; SOC = standard of care; WOMAC = Western Ontario and McMaster Universities Osteoarthritis Index.
Scenario Analyses
Table 12: Scenario Analyses Conducted on the CDA-AMC Base Case (Probabilistic)
Scenario analysis | Drug | Total costs ($) | Total QALYs | ICER ($/QALY) |
|---|---|---|---|---|
CDA-AMC base case | SOC | 61,618 | 8.71 | Reference |
Burosumab | 3,938,983 | 11.02 | 1,680,920 | |
Scenario 1: Disutility multipliers removed | SOC | 61,924 | 8.73 | Reference |
Burosumab | 3,984,366 | 10.78 | 1,909,204 | |
Scenario 2: Annual discontinuation rate of 3.5% | SOC | 62,071 | 8.72 | Reference |
Burosumab | 5,438,201 | 11.93 | 1,674,958 |
CDA-AMC = Canada’s Drug Agency; ICER = incremental cost-effectiveness ratio; QALY = quality-adjusted life-year; SOC = standard of care.
Appendix 5: Submitted Budget Impact Analysis and CDA-AMC Appraisal
Please note that this appendix has not been copy-edited.
Table 13: Summary of Key Take-Aways
Key take-aways of the budget impact analysis |
|---|
|
Summary of Sponsor’s Budget Impact Analysis
In the submitted budget impact analysis (BIA), the sponsor assessed the budget impact of reimbursing burosumab for the treatment of adult patients with XLH.17 The analysis took the perspective of CDA-AMC–participating Canadian public drug plans using a top-down, epidemiological approach over a 3-year time horizon. Data to inform the model were obtained from various sources, including the published literature, the sponsor’s internal data, and input from clinical experts consulted by the sponsor, and key inputs to the BIA are documented in Table 14.
Table 14: Summary of Key Model Parameters
Parameter | Sponsor’s estimate (reported as year 1 / year 2 / year 3 if appropriate) |
|---|---|
Target population | |
Adult population in Canada | 26,075,291 / 26,428,792 / 26,782,294 |
Prevalence of XLH | 1 in 20,00018 |
Proportion of patients with a diagnosis of XLH and are managed by health care professionals | 43%17 |
Number of patients eligible for drug under review | 553 / 561 / 568 |
Market uptake (3 years) | |
Uptake (reference scenario) SOC | 100% / 100% / 100% |
Uptake (new drug scenario) Burosumab SOC | 18% / 27% / 32% 82% / 73% / 68% |
Cost of treatment (per patient, per year) | |
Burosumaba SOCb | $411,989 $1,574 |
SOC = standard of care; XLH = X-linked hypophosphatemia.
aAnnual drug costs based on the average patient weight at baseline from the CL303 study, not accounting for dose reductions.
bAnnual drug costs based on international treatment guidelines for XLH, assumed to be the average daily dose based on the midpoint of the recommended range: 1,175 mg of phosphate, 0.625 mcg of calcitriol and 1.125 mcg of alfacalcidol.
Summary of the Sponsor’s BIA Results
The sponsor estimated that the budget impact of reimbursing burosumab for the treatment of adult patients with XLH would be $40,925,681 in year 1, $59,612,957 in year 2, and $70,773,738 in year 3, for a 3-year total of $171,312,375. The sponsor estimates spending $171,668,414 on burosumab over 3 years.
CDA-AMC Appraisal of the Sponsor’s BIA
CDA-AMC identified several key limitations to the sponsor’s analysis that have notable implications on the results of the BIA:
The market uptake of burosumab is likely underestimated: The sponsor’s submitted BIA indicated that burosumab would result in a market uptake of 18% in year 1, 27% in year 2, and 32% in year 3 based on the sponsor’s internal estimates. However, CDA-AMC obtained clinical expert feedback indicating that the market uptake of burosumab does not align with clinical expectations and indicated the sponsor may have underestimated burosumab uptake. According to clinical experts consulted by CDA-AMC, there is a high unmet need in adult patients with XLH given the lack of currently available treatments besides. Notably, clinician and patient input also highlighted that conventional treatments such as phosphate and vitamin D have limited efficacy and result in severe morbidities such as hyperparathyroidism, parathyroidism, and kidney stones. As such, clinical experts indicated that they expect more than half of the diagnosed patients (approximately 50% to 60%) to be managed with burosumab by year 3 if burosumab were to be publicly reimbursed for adult patients.
To address this limitation, CDA-AMC undertook a reanalysis by revising the market shares for burosumab in the new drug scenario to 55% in year 3, and proportionally increased the market shares to 31% in year 1 and 48% in year 2.
Drug acquisition costs were not aligned with the submitted CUA: The product monograph stipulates that patients may require dose decreases with burosumab if the serum phosphorus level is above the normal range. Once serum phosphorus levels are above the normal range, treatment is expected to be restarted at half the previous starting dose. As per the 96-week data from the CL303 study, 8 of 134 patients (5.97%) remained on 0.5 mg/kg dosing until the end of the study, which was accounted for in the estimation of drug acquisition costs in the submitted CUA model. Furthermore, the CUA model calculated drug costs based on patient weight distribution from the CL303 study at baseline, whereas the BIA used average patient weight at baseline. The estimated annual costs of burosumab were therefore $411,989 in the BIA model and $397,550 in the CUA model. Drug acquisition costs should be consistent across the submitted BIA and CUA models.
CDA-AMC adjusted the annual drug acquisition costs in the BIA model to $397,550 to align with the CUA, accounting for patient weight distribution at baseline and dose reductions as per the pivotal trial data.
The derivation of the target population was associated with uncertainty: In the derivation of the target population, the sponsor assumes that 43% of adult patients with XLH are diagnosed and managed by health care professionals based on internal forecasts. This assumption results in an estimate of approximately 545 eligible patients with XLH for treatment in current practice across Canada. CDA-AMC notes that this parameter is highly uncertain and also highly influential on the estimated budget impact of burosumab; the sponsor’s assumption nearly halves the eligible target population. Clinical experts consulted by CDA-AMC also noted that there is a considerable amount of uncertainty surrounding the true number of adult patients with XLH who may be undiagnosed and confirmed that the true number of undiagnosed and untreated patients is unknown.
Given the lack of data to inform this parameter, CDA-AMC tested an alternate proportion of 68% of adult patients with XLH who are diagnosed and managed by health care professionals in a scenario analysis.
Assumption of discontinuation was likely overestimated: Annual discontinuation was 6.9% based on 96-week data from The CL303 study, which was adjusted for annual rate to 6.4% in the submitted BIA. It is appropriate to account for discontinuation in the BIA but it is uncertain if discontinuation would occur at the same rate over the model time horizon. Based on the trial data, discontinuation occurred for reasons not reported, but not due to AEs. Clinical experts consulted by CDA-AMC confirmed that XLH is a chronic disease and patients are likely to continue treatment if well tolerated, as limited treatment alternatives exist. Discontinuation may be due to patient preference when seeing improvements in symptoms over time. However, disease recurrence is expected to occur after discontinuation, and it is reasonable to expect that patients would then resume treatment to alleviate disease-related symptoms. Since discontinuation data beyond 2 years is limited, the clinical experts consulted by CDA-AMC deemed that assuming a constant discontinuation rate did not meet face validity in the context of chronic treatment. By assuming a fixed discontinuation rate and not accounting for patients resuming treatment after discontinuation (if not specified to be due to lack of efficacy or AEs), drug costs and the budget impact of burosumab are likely underestimated.
CDA-AMC assessed an alternate annual discontinuation of 3.5% in a scenario analysis, aligned with the CUA model.
The sponsor’s prevalence-based approach was associated with uncertainty: The sponsor uses a prevalence-based approach in their submitted BIA model, where the target population across the model time horizon increases only by population growth. CDA-AMC notes that this approach assumes a static population, where mortality is assumed to be the same as incidence. However, as per the sponsor’s pharmacoeconomic submission, the sponsor suggests that burosumab results in a 50% reduction of XLH-related mortality, and it is unclear whether this assumed survival benefit is accounted for in the derivation of the target population. If there is an anticipated survival benefit with treatment, the number of prevalent patients living with XLH is expected to increase over time, hence the number of eligible patients per year in the sponsor’s BIA model may be underestimated.
CDA-AMC could not address this limitation in reanalysis due to limitations with the submitted model structure.
The price of drugs paid by public drug plans is uncertain: Analyses by both the sponsor and CDA-AMC are based on publicly available list prices for all comparators. Actual costs paid by public drug plans are unknown.
CDA-AMC could not address this limitation in reanalysis.
CDA-AMC Reanalyses of the BIA
Table 15: CDA-AMC Revisions to the Submitted BIA
Stepped analysis | Sponsor’s value or assumption | CDA-AMC value or assumption |
|---|---|---|
Changes to derive the CDA-AMC base case | ||
1. Market shares of burosumab | 18% / 27% / 32% | 31% / 48% / 55% |
2. Annual cost of burosumab with dose reduction | $411,989 | $397,550 |
CDA-AMC base case | Reanalysis 1 + 2 | |
BIA = budget impact analysis; CDA-AMC = Canada’s Drug Agency.
The results of the CDA-AMC step-wise reanalysis are presented in summary format in Table 16 and a more detailed breakdown is presented in Table 17. The CDA-AMC reanalysis of the BIA estimated that the 3-year budget impact of reimbursing burosumab for the treatment of adult patients with XLH would be $68,007,856 in year 1, $102,397,186 in year 2, and $117,143,623 in year 3, for a 3-year cumulative total of $287,548,665. The CDA-AMC base case estimates $288,168,029 spending on burosumab over 3 years.
Table 16: Summary of the CDA-AMC Reanalyses of the BIA
Stepped analysis | Three-year total ($) |
|---|---|
Submitted base case | 171,312,375 |
CDA-AMC reanalysis 1 – market shares | 298,014,482 |
CDA-AMC reanalysis 2 – annual cost with dose reduction | 165,296,144 |
CDA-AMC base case | 287,548,665 |
BIA = budget impact analysis; CDA-AMC = Canada’s Drug Agency.
Note: The CDA-AMC reanalysis is based on publicly available prices of the comparator treatments.
CDA-AMC conducted the following scenario analyses to address remaining uncertainty, using the CDA-AMC base case (results are provided in Table 17:
Assuming that 68% of adult patients with XLH are diagnosed and managed by health care professionals
Assuming that annual discontinuation of treatment with burosumab is 3.5%.
Table 17: Detailed Breakdown of the CDA-AMC Reanalyses of the BIA
Stepped analysis | Scenario | Year 0 (current situation) ($) | Year 1 ($) | Year 2 ($) | Year 3 ($) | Three-year total ($) |
|---|---|---|---|---|---|---|
Submitted base case | Reference | 466,039 | 472,533 | 479,027 | 485,522 | 1,903,121 |
New drug | 466,039 | 41,398,214 | 60,091,984 | 71,259,259 | 173,215,497 | |
Budget impact | 0 | 40,925,681 | 59,612,957 | 70,773,738 | 171,312,375 | |
CDA-AMC base case | Reference | 466,039 | 472,533 | 479,027 | 485,522 | 1,903,121 |
New drug | 466,039 | 68,480,390 | 102,876,213 | 117,629,144 | 289,451,786 | |
Budget impact | 0 | 68,007,856 | 102,397,186 | 117,143,623 | 287,548,665 | |
CDA-AMC scenario analysis 1: 68% of adult patients diagnosed and treated | Reference | 736,992 | 747,262 | 757,532 | 767,802 | 3,009,587 |
New drug | 736,992 | 108,294,570 | 162,687,965 | 186,018,182 | 457,737,708 | |
Budget impact | 0 | 107,547,308 | 161,930,433 | 185,250,380 | 454,728,121 | |
CDA-AMC scenario analysis 2: 3.5% annual discontinuation of burosumab | Reference | 466,039 | 472,533 | 479,027 | 485,522 | 1,903,121 |
New drug | 466,039 | 68,480,390 | 104,848,441 | 120,724,885 | 294,519,755 | |
Budget impact | 0 | 68,007,856 | 104,369,414 | 120,239,364 | 292,616,634 |
BIA = budget impact analysis; CDA-AMC = Canada’s Drug Agency.
Note: The CDA-AMC reanalysis is based on publicly available prices of the comparator treatments.
ISSN: 2563-6596
Canada’s Drug Agency (CDA-AMC) is a pan-Canadian health organization. Created and funded by Canada’s federal, provincial, and territorial governments, we’re responsible for driving better coordination, alignment, and public value within Canada’s drug and health technology landscape. We provide Canada’s health system leaders with independent evidence and advice so they can make informed drug, health technology, and health system decisions, and we collaborate with national and international partners to enhance our collective impact.
Disclaimer: CDA-AMC has taken care to ensure that the information in this document was accurate, complete, and up to date when it was published, but does not make any guarantee to that effect. Your use of this information is subject to this disclaimer and the Terms of Use at cda-amc.ca.
The information in this document is made available for informational and educational purposes only and should not be used as a substitute for professional medical advice, the application of clinical judgment in respect of the care of a particular patient, or other professional judgments in any decision-making process. You assume full responsibility for the use of the information and rely on it at your own risk.
CDA-AMC does not endorse any information, drugs, therapies, treatments, products, processes, or services. The views and opinions of third parties published in this document do not necessarily reflect those of CDA-AMC. The copyright and other intellectual property rights in this document are owned by the Canadian Agency for Drugs and Technologies in Health (operating as CDA-AMC) and its licensors.
Questions or requests for information about this report can be directed to Requests@CDA-AMC.ca.