Drugs, Health Technologies, Health Systems
Reimbursement Review
Metreleptin (Myalepta)
Sponsor: Medison Pharma Canada Inc.
Therapeutic area: Leptin deficiency in lipodystrophy
This multi-part report includes:
Clinical Review
Pharmacoeconomic Review
Ethics Review
Clinical Review
Abbreviations
AGL
acquired generalized lipodystrophy
APL
acquired partial lipodystrophy
AE
adverse event
ALT
alanine aminotransferase
AST
aspartate aminotransferase
ATE
average treatment effect
CGL
congenital generalized lipodystrophy
CEEAS
controlled concomitant medication efficacy-evaluable analysis set
CFAS
controlled concomitant medication full analysis set
CI
confidence interval
FAS
full analysis set
FPLD
familial partial lipodystrophy
GL
generalized lipodystrophy
GRADE
Grading of Recommendations Assessment, Development and Evaluation
HR
hazard ratio
HRQoL
health-related quality of life
IPW
inverse probability weighting
JAK
Janus kinase
LOCF
last observation carried forward
NIH
National Institutes of Health
PL
partial lipodystrophy
RCT
randomized controlled trial
SAE
serious adverse event
SE
standard error
SD
standard deviation
STAT
signal transducer and activator of transcription
TEAE
treatment-emergent adverse event
ULN
upper limit of normal
WOCF
worst observation carried forward
Executive Summary
An overview of the submission details for the drug under review is provided in Table 1.
Table 1: Background Information of Application Submitted for Review
Item | Description |
|---|---|
Drug product | Metreleptin (Myalepta), 3 mg, 5.8 mg, and 11.3 mg, powder for solution, subcutaneous injection |
Sponsor | Medison Pharma Canada Inc. |
Indication | As an adjunct to diet as a replacement therapy to treat the complications of leptin deficiency in lipodystrophy patients:
|
Reimbursement request | As per indication |
Health Canada approval status | NOC |
Health Canada review pathway | Priority review |
NOC date | January 17, 2024 |
Recommended dose |
|
LD = lipodystrophy; NOC = Notice of Compliance; PL = partial lipodystrophy.
Introduction
Lipodystrophy is a rare, progressive, chronic, and life-threatening disease characterized by selective absence of adipose tissue. Generalized lipodystrophy (GL) and partial lipodystrophy (PL) encompass a heterogeneous group of disorders featuring complete or partial loss of adipose tissue; these disorders may be congenital (congenital GL [CGL] or familial PL [FPLD]) or acquired (acquired GL [AGL] or acquired PL [APL]).1 The lack of adipose tissue is also associated with leptin deficiency, which results in the early development of serious metabolic disorders such as severe insulin-resistant diabetes and hypertriglyceridemia.2,3 Complications of lipodystrophy also frequently include multiorgan damage that may become irreversible, affecting organs such as the liver, kidneys, and pancreas.4-11
In addition to the clinical burden, lipodystrophy also has a major detrimental emotional, psychological, and physical burden on patients, reducing life expectancy and health-related quality of life (HRQoL), and compromising the ability to carry out even basic daily activities.12-18 People with lipodystrophy often experience insatiable hunger and hyperphagia, which causes distress to them and caregivers, including those who need to ensure that children with lipodystrophy do not eat inedible objects.1,19 The impact of lipodystrophy also leads to a high direct and indirect economic burden.11,15,18
The lack of precise diagnostic criteria for lipodystrophy makes it hard to firmly establish the diagnosis of lipodystrophy; overestimation or underestimation of disease prevalence is likely.20,21 The prevalence of GL has been estimated to be 0.23 cases to 0.96 cases per million and the prevalence of PL has been estimated to be 1.67 cases to 2.84 cases per million.10 There are no epidemiological studies of lipodystrophy in Canada; however, it is estimated that there are fewer than 30 GL cases and fewer than 200 PL cases in Canada.
Metreleptin mimics the physiological effects of leptin by binding to and activating the human leptin receptor, which belongs to the Class I cytokine family of receptors that signal through the Janus kinase (JAK)/signal transducer and activator of transcription (STAT) transduction pathway.22 Metreleptin is indicated as an adjunct to diet as a replacement therapy to treat the complications of leptin deficiency experienced by patients with lipodystrophy:
with confirmed CGL (Berardinelli-Seip syndrome) or AGL (Lawrence syndrome) in adults and children aged 2 years and older
with confirmed FPLD or APL (Barraquer-Simons syndrome), in adults and children aged 12 years and older with persistent significant metabolic disease for whom standard treatments have failed to achieve adequate metabolic control.
The sponsor reimbursement request is consistent with the approved Health Canada indication. Metreleptin is administered once daily as a subcutaneous injection. The recommended daily dose is based on body weight. Based on clinical response (e.g., inadequate metabolic control) or other considerations (e.g., tolerability issues, excessive weight loss, especially in pediatric patients), the dose may be adjusted.22
Stakeholder Perspectives
The information in this section is a summary of input provided by the patient and clinician groups who responded to CADTH’s call for input and from clinical experts consulted by CADTH for the purpose of this review.
Patient Input
One patient group, Lipodystrophy Canada, responded to CADTH’s call for input for the current review of metreleptin as an adjunct to diet as a replacement therapy to treat the complications of leptin deficiency in patients with lipodystrophy. Information for this input was gathered from 2 patients with PL, 1 in Canada (Patient 1) and 1 in the UK (Patient 2).
According to both patients, lipodystrophy tremendously affects their physical and mental health and every aspect of their life. Patients experience hormonal imbalance, insulin resistance, diabetes, uncontrolled hunger, hypertriglyceridemia, hypertension, body image issues, low self-esteem, and fatigue.
According to the patient input, symptoms associated with the disease affect school life and social relationships and contribute to bullying based on their masculine appearance, which increases their symptoms of depression. Patients noted that disease symptoms and management affect their everyday activities and HRQoL.
Both patients manage their disease by addressing comorbid conditions, and they agreed that the currently available treatments are not ideal, with no treatment available that directly targets lipodystrophy. The 2 patients with prior metreleptin experience reported significant improvements in their disease symptoms and quality of life.
Clinician Input
Input From Clinical Experts Consulted by CADTH
The information in this section is based on input received from a panel of 4 clinical specialists consulted by CADTH for the purpose of this review.
The clinical experts explained that there is an unmet need for effective therapies that control metabolic parameters for patients with GL and an unmet need for effective therapies that control metabolic parameters for patients with PL whose metabolic parameters are not controlled with current standard-of-care therapies. The experts expect metreleptin to become first-line therapy for patients with GL and to be used to treat PL in those patients with metabolic parameters that are not controlled with current standard-of-care therapies. The clinical experts noted that while genetic testing can be helpful to confirm a diagnosis of familial GL, often there is not a perfect correlation between a true positive in terms of genetic testing and the clinical presentation of GL. As such, the clinical experts did not consider that a confirmed genetic test result should be required before initiating therapy for this patient population. To identify patients with PL that would be suitable for treatment with metreleptin, the clinical experts suggested that elevated hemoglobin A1C and triglyceride levels are an adequate substitute given the impracticalities of measuring leptin levels directly. The clinical experts noted that the levels used in the submitted pivotal trial to define severe PL (baseline hemoglobin A1C ≥ 6.5% and/or triglycerides ≥ 5.65 mmol/L) would be appropriate criteria for identifying patients with PL who have uncontrolled disease while receiving standard-of-care therapies. The clinical experts noted that to assess response to metreleptin for patients with lipodystrophy, hemoglobin A1C and triglyceride levels would be monitored to determine whether metabolic control has been improved. The experts suggested that determining a clinically meaningful response would be context-dependent on a number of factors including the baseline hemoglobin A1C and triglyceride levels, as well as the background therapies that the patient was receiving at the time of metreleptin treatment initiation. The clinical experts suggested that the prescribing of metreleptin should be done by an endocrinologist or a pediatric endocrinologist.
Clinician Group Input
One clinician group responded to CADTH’s call for input by a group of endocrinologists, medical geneticists, lipidologists, and internal medicine specialists. Information for this input was gathered mainly through the clinical registries of patients in Canada with various forms of lipodystrophies.
The clinician group indicated that the current treatment paradigm for lipodystrophy, which does not target the underlying pathophysiology, consists of supportive care for comorbid conditions or complications. This includes diet, exercise, and antidyslipidemic and antihyperglycemic medications.
The clinician group stated that there are significant unmet therapeutic needs for patients living with lipodystrophy, as there is no cure for this disease, and available treatments address the associated metabolic complications. Conventional therapies are considered inadequate due to the severity of metabolic abnormalities experienced by patients with GL or with the more severe forms of PL, increasing their risk of end-organ damage and early death. Therefore, there is a need for a therapy that aims at correcting the underlying pathophysiology of leptin deficiency.
The clinician group noted that metreleptin can ameliorate hyperphagia and improve hepatic and peripheral insulin sensitivity, and has an established benefit versus risk profile. According to the clinician group, metreleptin is the primary first-line therapy for people with GL, including children, and for people with PL with more severe metabolic diseases and/or who do not respond well to standard treatment approaches.
The clinician group indicated that the outcomes of interest in assessing clinical response are changes in metabolic control. If clinical response is not seen after 6 months of treatment and the patient adheres to the administration technique, is receiving the correct dose, and adheres to diet, a dose increase should be considered before stopping treatment.
Drug Program Input
The drug programs identified the following jurisdictional implementation issues: relevant comparators, considerations for initiation of therapy, considerations for continuation or renewal of therapy, considerations for prescribing of therapy, generalizability, care provision issues, and system and economic issues. Refer to Table 6 for more details.
Clinical Evidence
Systematic Review
Description of Studies
The National Institutes of Health (NIH) 991265/20010769 study was a phase II/III, open-label, single-arm, single-centre, investigator-sponsored study. Study 991265 was a pilot, dose-escalation study; its objectives were to determine if metreleptin can be safely administered to a group of participants with clinically significant lipodystrophy and to determine if metreleptin treatment would be effective in lowering plasma glucose and lipid abnormalities experienced by people with clinically significant lipodystrophy. Study 20010769 was a long-term study conducted to determine the long-term safety and efficacy of metreleptin treatment for patients with lipodystrophy. Participant enrolment occurred between July 24, 2000, and March 26, 2014; the data cut-off date was in December 2014. Study 20010769 allowed for the rollover of participants from the pilot study, as well as for direct enrolment of new participants. A total of 107 participants were enrolled in the studies, which were conducted at the NIH, but also enrolled participants from countries outside the US, including Canada. Nine participants enrolled in the pilot Study 991265; of these, 8 rolled over to receive metreleptin in Study 20010769, into which 98 participants enrolled directly. A total of 66 of the 107 participants had GL and 41 had PL. There were 31 participants in a specified PL subgroup, that is, those patients with PL with baseline hemoglobin A1C greater than or equal to 6.5% and/or triglycerides greater than or equal to 5.65 mmol/L.
Actual change from baseline in hemoglobin A1C and percent change from baseline in fasting triglyceride levels to month 12 were the co-primary efficacy end points. The clinical experts considered month 12 an appropriate time point for analysis as the effects of metreleptin could be expected to be seen by this time. The sponsor noted that this 12-month period would allow for individual dose titrations to achieve maximum effects in given patients; 12 months was also an acceptable length of time over which to assess the clinical impact of the treatment. To account for patients who may have discontinued treatment before month 12, last observation carried forward (LOCF) methods were used to determine changes from baseline to month 12. Specifically, hemoglobin A1C and triglyceride samples obtained on or after day 180 were used in the analysis for patients without samples obtained within the month 12 window (day 365 ± 65 days).
Efficacy Results
Change From Baseline in Hemoglobin A1C at 12 Months
In the GL cohort, mean hemoglobin A1C was 8.6% (standard deviation [SD] = 2.33) at baseline and 6.4% (SD = 1.68) at month 12, for a mean change from baseline of –2.2% (95% confidence interval [CI], –2.7% to –1.6%). In the overall PL cohort, mean hemoglobin A1C was 7.9% (SD = ||||%) at baseline and 7.4% (SD = ||||%) at month 12, for a mean change from baseline of –0.6% (95% CI, |||| || ||||). In the specified PL subgroup, mean hemoglobin A1C was 8.7% (SD = ||||%) at baseline and 7.9% (SD = ||||%) at month 12, for a mean change from baseline of –0.9% (95% CI, |||| || ||||).
Change From Baseline in Fasting Triglycerides at 12 Months
In the GL cohort, mean triglyceride level was 14.7 mmol/L (SD = 25.66 mmol/L) at baseline and 4.5 mmol/L (SD = 6.10 mmol/L) at month 12, for a relative mean change from baseline of –32.1% (95% CI, –51.0% to –13.2%). In the overall PL cohort, mean triglyceride level were |||| |||||| ||||||| at baseline and ||| |||||| at month 12, for a relative mean change from baseline of ||||| |||| ||| ||||| || |||||. In the specified PL subgroup, mean triglyceride level was |||| |||||| ||||||| and at month 12 were ||| |||||| |||||||, for a mean change from baseline of |||| |||| ||| ||||| || |||||.
The sponsor, |||||| ||| |||| ||| || || ||| ||||||| ||||||||, conducted an ad hoc sensitivity analysis, removing 1 patient in the PL cohort who was recorded as a patient with noncompliance behaviour. The results of this ad hoc analysis showed a mean change from baseline in triglyceride levels of –20.8% (95% CI, ||||| || ||||) in the PL cohort and –37.4% (95% CI, ||||| || |||||) in the specified PL subgroup.
Change From Baseline in Fasting Glucose at 12 Months
In the GL cohort, mean glucose level was 10.2 mmol/L (SD = 5.05 mmol/L) at baseline and 7.0 mmol/L (SD = 3.40 mmol/L) at month 12, for a relative mean change from baseline of –19.7% (95% CI, –29.4% to –10.0%). In the overall PL cohort, mean glucose level was 8.8 mmol/L (SD = 4.39 mmol/L) at baseline and 7.5 mmol/L (SD = 3.28 mmol/L) at month 12, for a relative mean change from baseline of –6.1% (95% CI, –16.0% to 3.8%). In the specified PL subgroup, mean glucose level was 10.0 mmol/L (SD = |||| mmol/L) at baseline and 8.1 mmol/L (SD = |||| mmol/L) at month 12, for a relative mean change from baseline of –13.2% (95% CI, –24.4% to –1.9%).
Change From Baseline in Liver Volume at 12 Months
In the GL cohort (N = 21), mean baseline liver volume was 3,357.7 mL (SD = 1,121.74 mL); the relative mean change from baseline was –33.8% (SD = 14.78%). In the overall PL cohort (N = 9), mean baseline liver volume was 2,624.6 mL (SD = 936.21 mL); the relative mean change from baseline was –13.4% (SD = ||||). In the specified PL subgroup (N = 8), mean baseline liver volume was 2,411.7 mL (SD = 731.91 mL), the relative mean change from baseline was –12.4% (SD = ||||).
Harms Results
Treatment-emergent adverse events (TEAEs) occurred in 89.4% of patients in the GL cohort of the safety analysis set and 85.4% of patients in the PL cohort of the safety analysis set. The most common adverse events (AEs) in the GL cohort were weight decrease (25.8%), abdominal pain (16.7%), and hypoglycemia (15.2%). The most common AEs in the PL cohort were hypoglycemia (17.1%), abdominal pain (14.6%), and nausea (14.6%).
Serious adverse events (SAEs) occurred in 34.8% of patients in the GL cohort, |||| ||||||||| |||| |||||| ||| |||||||||||| |||||| ||| |||| ||||||. SAEs occurred in 24.4% of the PL cohort, |||| ||||||||| |||| ||||||| |||||||||||| ||||||| ||| |||||||||| |||||| ||| |||| ||||||.
TEAEs that resulted in treatment discontinuation occurred among 5 patients (7.6%) in the GL cohort and 1 patient (2.4%) in the PL cohort.
Death occurred in 4.5% of the patients in the GL cohort, including due to renal failure, cardiac arrest, and chronic hepatic failure. Death occurred in 2.4% of the patients in the PL cohort, including due to hypoxic-ischemic encephalopathy.
Critical Appraisal
The major limitations associated with the NIH 991265/20010769 study include the single-arm, open-label design of the study. The lack of comparative data is a key limitation to the interpretation of the results from a single-arm trial, as it is difficult to distinguish between the effect of the intervention relative to that of a placebo effect, or the effect of natural history. It is acknowledged that there may be practical limitations to conducting a randomized controlled trial (RCT) with patients with lipodystrophy due to the rarity of the condition. The open-label nature of the trial also potentially increases the risk of bias, however the end points included are objective laboratory values and therefore are unlikely to have been influenced by this bias. Harms outcomes however may be impacted by the open-label design of the study.
The NIH 991265/20010769 study had a large number of drop-outs and missing data at the 12-month primary analysis because of the challenges in conducting a clinical study that included international participants at the NIH. LOCF methods were used to carry forward the results from 6 months onward. Patients who did not have an observation after 6 months from baseline were considered to have missing data and were not included in the analysis. Excluding patients with final observations before 6 months violates intent-to-treat principles as not all randomized patients were included in the primary analysis. In addition, this imputation may underestimate the variance in the results, potentially resulting in narrower CIs. Also, interim analyses were conducted without adjusting for multiplicity to account for the increased risk of type I error. The co-primary end points did not require multiplicity adjustment because both end points needed to achieve statistical significance to be considered a positive result. However, statistical significance was only achieved for the PL cohort on removal from the analysis of a patient with noncompliance behaviour.
The NIH 991265/20010769 study began to enrol patients in July 2000. As this was 23 years before the writing of this report, the clinical experts suggested that standards of therapy and patient support may have evolved since then. However, the clinical benefit of metreleptin is anticipated to be consistent with that observed in the NIH 991265/20010769 study. Lipodystrophy is a chronic disease and patients would be expected to receive treatment for life. The generalizability of the results beyond the maximum 14-year follow-up of the NIH 991265/20010769 study is unknown, although the clinical experts consulted by CADTH did not expect the efficacy of metreleptin to change beyond the time horizon of the NIH 991265/20010769 study. The clinical experts consulted considered the patient characteristics from the NIH 991265/20010769 study to be broadly generalizable to that of the expected patient population in Canada.
GRADE Summary of Findings and Certainty of the Evidence
The selection of outcomes for Grading of Recommendations Assessment, Development and Evaluation (GRADE) assessment was based on the sponsor’s Summary of Clinical Evidence, consultation with clinical experts, and input received from patient and clinician groups and public drug plans. The following list of outcomes was finalized in consultation with expert committee members:
change from baseline to month 12 in hemoglobin A1C
change from baseline to month 12 in fasting triglycerides
change from baseline to month 12 in fasting glucose
change from baseline to month 12 in liver volume.
Table 2: Summary of Findings for Metreleptin Treatment for Patients With Leptin Deficiency in GL (NIH 991265/20010769 Study)
Outcome and follow-up | Patients (studies), N | Effect | Certainty | What happens |
|---|---|---|---|---|
Mean change from baseline in hemoglobin A1C, % (95% CI) Follow-up: 12 months | 59 (1 single-arm trial) | Actual CFB: –2.2 (95% CI, –2.7 to –1.6) | Very lowa,b | The evidence is very uncertain about the effects of metreleptin on hemoglobin A1C when compared with any comparator |
Mean change from baseline in fasting triglycerides, % (95% CI) Follow-up: 12 months | 57 (1 single-arm trial) | Percent CFB: –32.1 (95% CI, –51.0 to –13.2) | Very lowa,b | The evidence is very uncertain about the effects of metreleptin on fasting triglycerides when compared with any comparator |
Mean change from baseline in fasting glucose, mmol/L (95% CI) Follow-up: 12 months | 59 (1 single-arm trial) | Actual CFB: –3.0 (95% CI, –4.2 to –1.7) Percent CFB: –19.7 (95% CI, –29.4 to –10.0) | Very lowa,b | The evidence is very uncertain about the effects of metreleptin on fasting glucose when compared with any comparator |
Mean change from baseline in liver volume, mL (SD) Follow-up 12 months | 12 (1 single-arm trial) | Actual CFB: –1350.9 (||||||) Percent CFB: –33.8 (|||||) | Very lowa,b | The evidence is very uncertain about the effects of metreleptin on liver volume when compared with any comparator |
Harms | ||||
SAEs (safety end point), n Follow-up: maximum study duration of 14 years | 66 (1 single-arm trial) | 35 per 100 | Very lowa,c | The evidence is very uncertain about the effects of metreleptin on SAEs when compared with any comparator |
CFB = change from baseline; CI = confidence interval; GL = generalized lipodystrophy; NIH = National Institutes of Health; SAE = serious adverse event; SD = standard deviation.
Note: Study limitations (which refers to internal validity or risk of bias), inconsistency across studies, indirectness, imprecision of effects, and publication bias were considered when assessing the certainty of the evidence. All serious concerns in these domains that led to the rating down of the level of certainty are documented in the table footnotes. For single-arm trials, all serious concerns with study limitations (which refers to internal validity or risk of bias), inconsistency across studies, indirectness, imprecision of effects, and publication bias are documented in the table footnotes.
aIn the absence of a comparator group, conclusions about efficacy relative to any comparator cannot be drawn and the certainty of evidence starts at very low and cannot be rated up.
bRated down 2 levels for very serious imprecision due to the small sample size. Rated down 1 level for a high amount of missing data requiring imputation.
cRated down 1 level for serious risk of bias due to potential for bias in favour of metreleptin arising from the open-label nature of the study.
Table 3: Summary of Findings for Metreleptin Treatment of Patients With Leptin Deficiency in PL (NIH 991265/20010769 Study)
Outcome and follow-up | Patients (studies), N | Effect | Certainty | What happens |
|---|---|---|---|---|
Mean change from baseline in hemoglobin A1C, % (95% CI) Follow-up: 12 months | 37 (1 single-arm trial) | Actual CFB: –0.6 (95% CI, –1.0 to –0.2) | Very lowa,b | The evidence is very uncertain about the effects of metreleptin on hemoglobin A1C when compared with any comparator |
Mean change from baseline in fasting triglycerides, % (95% CI) Follow-up: 12 months | 37 (1 single-arm trial) | Percent CFB: |||| |||| ||| ||||| || ||||| | Very lowa,b | The evidence is very uncertain about the effects of metreleptin on fasting triglycerides when compared with any comparator |
Mean change from baseline in fasting glucose, mmol/L (95% CI) Follow-up: 12 months | 37 (1 single-arm trial) | Actual CFB: –1.2 (95% CI, –2.1 to –0.3) Percent CFB: –6.1% (95% CI, –16.0 to 3.8) | Very lowa,b | The evidence is very uncertain about the effects of metreleptin on fasting glucose when compared with any comparator |
Mean change from baseline in liver volume, mL (SD) Follow-up: 12 months | 8 (1 single-arm trial) | Actual CFB: –376.8 (||||||) Percent CFB: –13.4% (||||) | Very lowa,b | The evidence is very uncertain about the effects of metreleptin on liver volume when compared with any comparator |
Harms | ||||
SAEs (safety end point), n Follow-up: maximum study duration of 14 years | 41 (1 single-arm trial) | 24 per 100 | Very lowa,c | The evidence is very uncertain about the effects of metreleptin on SAEs when compared with any comparator |
CFB = change from baseline; CI = confidence interval; NIH = National Institutes of Health; PL = partial lipodystrophy; SAE = serious adverse event; SD = standard deviation.
Note: Study limitations (which refers to internal validity or risk of bias), inconsistency across studies, indirectness, imprecision of effects, and publication bias were considered when assessing the certainty of the evidence. All serious concerns in these domains that led to the rating down of the level of certainty are documented in the table footnotes. For single-arm trials, all serious concerns with study limitations (which refers to internal validity or risk of bias), inconsistency across studies, indirectness, imprecision of effects, and publication bias are documented in the table footnotes.
aIn the absence of a comparator group, conclusions about efficacy relative to any comparator cannot be drawn and the certainty of evidence starts at very low and cannot be rated up.
bRated down 2 levels for very serious imprecision due to the small sample size. Rated down 1 level for a high amount of missing data requiring imputation.
cRated down 1 level for serious risk of bias due to potential for bias in favour of metreleptin arising from the open-label nature of the study.
Indirect Comparisons
Description of Studies
One unpublished supportive analysis was conducted to estimate the comparative treatment effect of metreleptin with or without supportive care compared to supportive care alone using an inverse probability weighting (IPW) and multivariate regression methods to adjust for differences between patients from the NIH follow-up study and an observational study of patients with GL and PL receiving supportive care alone.23
One published supportive analysis by Cook et al. (2021)44 estimated the treatment effect of metreleptin on mortality of patients with GL or PL using a Cox proportional hazards model to control for differences between patients who have received metreleptin treatment and the historical cohort of patients with no experience with metreleptin treatment.6
Efficacy Results
In the unpublished supportive analysis, after IPW, the mean difference between metreleptin with or without supportive care compared to supportive care alone in hemoglobin A1C levels was |||||| |||| ||| ||||| || |||||, the mean difference in triglyceride levels was ||||| |||||| |||| ||| |||||| || ||||| and the hazard ratio (HR) for all-cause mortality was |||| |||| ||| |||| || |||||.
In the Cook et al. (2021) supportive analysis, the Cox proportional hazards model–predicted mortality HR for the overall metreleptin-treated cohort versus the matched metreleptin-naive cohort was 0.35 (95% CI, 0.13 to 0.90). Statistically significant differences in mortality risk between patients who received metreleptin treatment and patients with no experience of metreleptin in the GL subgroup were not detected from the Cox proportional hazards model (HR = 0.455; 95% CI, 0.150 to 1.387).
Critical Appraisal
The unpublished supportive analysis was associated with major limitations relating to the use of retrospective chart reviews and missing data, inability to adjust for important prognostic covariates and small sample sizes resulting in imprecise and wide 95% CIs.
The published Cook et al. (2021) historical control arm analysis utilized a more robust methodology for adjusting the patient populations on important prognostic factors (though still not capturing all important factors). However, mortality was the only end point assessed, and the few events captured resulted in imprecise and wide 95% CIs. The Cook et al. (2021) analysis also had missing data because details of the standard-of-care therapies used in the historical control arm were not available.
Studies Addressing Gaps in the Evidence From the Systematic Review
Study FHA101 was a single-arm, multicentre, open-label, expanded-access study conducted at multiple treatment centres in the US with patients with lipodystrophy. The primary objective was to provide metreleptin, an investigational medication, under a treatment protocol to patients with lipodystrophy that is associated with diabetes mellitus and/or hypertriglyceridemia. A secondary objective was to assess the long-term efficacy, safety, and tolerability of metreleptin among people with diabetes mellitus and/or hypertriglyceridemia. Patient enrolment occurred between March 30, 2009, and January 23, 2016. A total of 41 patients were enrolled across 6 centres in the US.
Efficacy Results
Study FHA101 found that treatment with metreleptin led to sustained improvements in glycemic control and hypertriglyceridemia in this small group of patients, both with GL and in the PL subgroup. Among the 9 patients with GL included in the full analysis set (FAS), mean hemoglobin A1C was reduced from 7.7% at baseline (n = 9) to 6.2% at month 12 using LOCF (n = 5), a mean change of –1.2%. Results were similar for the 7 patients in the PL subgroup included in the FAS; treatment with metreleptin led to reductions in hemoglobin A1C from 7.8% at baseline (n = 7) to 7.0% at month 12 using LOCF (n = 7), a mean change of –0.8%.
Mean fasting glucose levels were reduced from 11.4 mmol/L at baseline (n = 9) to 10.2 mmol/L at month 12 using LOCF (n = 6) in the GL group, a mean change of –1.5 mmol/L, representing a 7.3% decrease in fasting glucose levels. For the PL subgroup, mean fasting glucose levels were reduced from 8.0 mmol/L at baseline (n = 7) to 6.9 mmol/L at month 12 using LOCF (n = 7), a mean change of –1.1 mmol/L, representing a 9% decrease from baseline.
Mean fasting triglyceride concentrations were reduced from 19.9 mmol/L at baseline (n = 8) to 7.6 mmol/L at month 12 using LOCF (n = 6) in the GL group, corresponding to a mean percent change of –26.9%. In the PL subgroup, mean fasting triglyceride concentrations, which were lower in this group of patients compared to those with GL, were reduced from 4.0 mmol/L (n = 7) at baseline to 3.6 mmol/L at month 12 using LOCF (n = 7), a mean change of –8.5%.
Harms Results
Treatment with metreleptin was safe and generally well tolerated by patients with GL and by patients in the PL subgroup. The most common TEAEs among patients in the GL group were hypoglycemia, infections, abdominal pain and increased liver function tests. Most TEAEs were mild to moderate in severity. The AE profile of patients in the PL subgroup was generally similar to that of patients with GL. The most common TEAEs among patients in the PL subgroup were hypoglycemia, urinary tract infection, upper respiratory tract infection, anxiety, nausea, and sinusitis. Two patients were reported to have neoplasms, but the investigator considered that these were unrelated to metreleptin. A total of 3 patients, including 1 with GL, 1 in the PL subgroup, and 1 with PL (not in the subgroup), developed neutralizing antibodies.
During the 5-year study, 2 deaths were reported, neither of which was assessed as drug-related.
Critical Appraisal
The open-label design of Study FHA101 is considered a limitation that could bias the results parameters. The lack of a control arm is considered a key constraint that limits the interpretation of study outcomes. A small number of patients with GL and PL were evaluated; therefore, observed results should be interpreted with caution.
External Validity
As there were no study sites in Canada, there may be limitations in generalizing these findings to the Canadian context.
Conclusions
Lipodystrophy is a rare disease and no currently available therapies directly target the underlying disease pathology. There is an unmet need for effective therapies that control metabolic parameters for patients with GL and an unmet need for effective therapies that control metabolic parameters for patients with PL who are unable to achieve metabolic control with current standard-of-care therapies. Metreleptin is a first-in-class treatment that replaces leptin and directly targets the underlying leptin deficiency experienced by patients with lipodystrophy. The NIH 991265/20010769 study demonstrated improvements from baseline in hemoglobin A1C and triglyceride levels although the evidence is very uncertain regarding the effects of metreleptin on metabolic parameters, mainly due to the lack of a comparator arm. Evidence gaps from the NIH 991265/20010769 study include the effect of metreleptin treatment on outcomes identified by patients as important, such as impact on hunger, HRQoL, and fertility; as such, the impact of metreleptin on these outcomes is uncertain. Treatment with metreleptin was well tolerated over the study period and the safety profile was as expected, according to clinical experts.
There were important technical limitations in the conduct of the historical control arm comparisons, including not adjusting for important prognostic covariates, missing data, and unclear standard of therapies used for the historical control arm. As such, the historical control arm analyses were inconclusive and imprecise given the small sample sizes and wide 95% CIs.
While the results of the included studies aligned with clinical experts’ expectation that metreleptin will address the unmet needs in this patient population, there were important limitations in the included studies leading to uncertainty in the evidence due to the single-arm design of the trial and the high amount of missing data at the 12-month time point.
Introduction
The objective of this report is to review and critically appraise the evidence submitted by the sponsor on the beneficial and harmful effects of metreleptin (3 mg, 5.8 mg, and 11.3 mg, powder for solution, subcutaneous injection) for the treatment of the complications of leptin deficiency experienced by patients with lipodystrophy.
Disease Background
Contents within this section have been informed by materials submitted by the sponsor and clinical expert input. The following has been summarized and validated by the CADTH review team.
Lipodystrophy is a rare, progressive, chronic, and life-threatening disease characterized by selective absence of adipose tissue. Lipodystrophy encompasses a heterogeneous group of disorders featuring complete or partial loss of adipose tissue; these disorders may be congenital (CGL or FPLD) or acquired (AGL or APL).1 The absence of adipose tissue in people with lipodystrophy leads to reduced storage capacity for lipids, which are therefore accumulated ectopically in other organs. The lack of adipose tissue is also associated with leptin deficiency, which results in the early development of serious metabolic disorders such as severe insulin-resistant diabetes and hypertriglyceridemia.2,3 Complications of lipodystrophy also frequently include multiorgan damage that may become irreversible, affecting organs such as the liver, kidneys, and pancreas.4-11 Data from a study that assessed the natural history of non–HIV-related GL and PL noted Kaplan-Meier estimates of mean time to first organ abnormality of 7.7 years (standard error [SE] = 0.9 years) in GL and 16.1 years (SE = 1.5 years) in PL. Mean time to diabetes or insulin resistance was 12.7 years (SE = 1.2 years) among patients with GL and 19.1 years (SE = 1.7 years) among patients with PL.7 These comorbidities of lipodystrophy ultimately lead to premature death.1,7,24 The same systematic review of patients with non–HIV-related lipodystrophy indicated that the mean time to death was 51.2 years (SE = 3.5 years) for patients with GL and 66.6 years (SE = 1.0 years) for patients with PL.7 However, the mean age at mortality varied between studies. In another systematic review of people with non–HIV-related lipodystrophy, the mean age at mortality was 12.5 years and 32.2 years for CGL and AGL, respectively, and 27.8 years and 22.7 years for FPLD and APL, respectively.25
In addition to the clinical burden, lipodystrophy has a major detrimental emotional, psychological, and physical burden on patients, reducing life expectancy and HRQoL, and compromising the ability to carry out even basic daily activities.12-18 Caregivers (and family members) often experience many of the same complications as patients with lipodystrophy, from deterioration of mental health to a reduced quality of day-to-day life.15,26 The emotional, psychological, and physical (body image) burden faced by younger pediatric or adolescent patients as well as their caregivers is considerable on top of the earlier onset of the complications.1,15-18 People with lipodystrophy often experience insatiable hunger and hyperphagia, which causes distress to them and their caregivers, not least those who must ensure that children in their care do not eat inedible objects.1,19 Lipodystrophy also results in a high direct economic burden due health care resource utilization (physician visits, hospitalizations, medications, and therapy for mental health) as well as an indirect economic burden from lost opportunities, reduced household income, time burden, and social stigma.11,15-18
Estimated Disease Prevalence
Awareness of GL and PL is low due to its rarity, making it difficult to accurately estimate its prevalence or incidence.10 The overlap of clinical presentation with more common diseases may further complicate the diagnosis of lipodystrophy. Moreover, the lack of precise diagnostic criteria for lipodystrophy makes it hard to firmly establish the diagnosis; overestimation or underestimation of disease prevalence is likely.20,21 The prevalence of GL has been estimated to be 0.23 cases to 0.96 cases per million and the prevalence of PL has been estimated to be 1.67 cases to 2.84 cases per million.10 There are no epidemiological studies of lipodystrophy in Canada; however, it is estimated that there are fewer than 30 cases of GL and fewer than 200 cases of PL in Canada.
Limited published international and European estimates of the 4 major subtypes of lipodystrophy indicate that prevalence ranges from 0.1 cases to 90 cases per million, depending on the information source and the methodology used for computation of the estimate.10 Chiquette et al. attempted to quantitatively estimate prevalence of lipodystrophy by conducting electronic medical record and literature searches to identify cases.10 The prevalence range of all lipodystrophies across electronic medical record databases was reported to be 1.3 cases to 4.7 cases per million. For the quintiles search, the estimated prevalence of diagnosed lipodystrophy was 0.23 cases per million for GL and 2.84 cases per million for PL. For all literature searches, the prevalence of all lipodystrophy in Europe was 2.6 cases per million (0.96 cases per million for GL and 1.67 cases per million for PL). Other studies have reported higher prevalence estimates of lipodystrophy at 3.23 cases to 4.7 cases per 100,000.27,28
New cases of lipodystrophy are identified mostly by diabetes specialists, endocrinologists, and lipid specialists. However, due to the rarity of this disease, many clinicians are unfamiliar with diagnosis and management, and diagnosis can take many years. In a chart review, Akinci et al. reported that the average time from first symptoms to diagnosis was 3.1 years for patients with GL and 9.0 years for patients with PL.7
Although experienced lipodystrophy specialists can easily recognize and diagnose lipodystrophy, no firm objective diagnostic criteria have been established for less experienced clinicians.1 Multiple societies, including a 17-member committee of nominees from worldwide endocrine societies, have attempted to develop consensus recommendations for the detection of lipodystrophy.1,29-31 In these multisociety practice guidelines, published in 2016, Brown et al. recommended that diagnosis be initially based on clinical history, physical examination, body composition, and metabolic status.1 Confirmatory genetic testing is helpful in suspected familial lipodystrophy and should be considered in at-risk family members.1 For patients in whom lipodystrophy is suspected, Brown et al. recommended screening for comorbidities associated with the disease including diabetes, dyslipidemia, nonalcoholic fatty liver disease (NAFLD), nonalcoholic steatohepatitis (NASH), and cardiovascular and reproductive dysfunction.1 These recommendations are similar to those of other guidelines that state that clinical characteristics and comorbid conditions should be the basis for referral to a lipodystrophy specialist.29
Methods to identify suspected lipodystrophy are widely available and conducted across Canada; these include clinical history, physical examination, body composition, and metabolic status. Similarly, screening for comorbidities associated with lipodystrophy, including diabetes, dyslipidemia, NAFLD, NASH, and cardiovascular and reproductive dysfunction, are also widely available and conducted across Canada. Confirmatory genetic testing for suspected familial lipodystrophy may not be readily available across the country.
Standards of Therapy
Contents within this section have been informed by materials submitted by the sponsor and clinical expert input. The following has been summarized and validated by the CADTH review team.
There are no approved drugs for the treatment of lipodystrophy in Canada;32 patients currently receive supportive care for comorbid conditions or complications of lipodystrophy (i.e., diet and exercise, and antihyperglycemic and lipid-lowering medications).29,31 However, these supportive care treatments do not address the underlying mechanism of the disease, i.e., the lack of adipose tissue and resulting leptin deficiency, and patients require numerous medications to manage comorbid conditions of lipodystrophy. The American Association of Clinical Endocrinologists29 and the Japan Endocrine Society31 both suggest diet and exercise as options for the metabolic management of lipodystrophy alongside antihyperglycemic and lipid-lowering medications. Metformin, sulfonylureas, thiazolidinediones, and insulin can be used to manage hyperglycemia, while fibrates and statins can be used to manage hypertriglyceridemia. They acknowledge, however, that when the complications associated with lipodystrophy are severe, the aforementioned supportive care treatments (alone or in combination) are likely to be inadequate at establishing metabolic control as they do not address the underlying leptin deficiency.
The clinical experts consulted agreed that standard of care includes a variety of supportive therapies aimed at achieving metabolic control to reduce comorbidities. The clinical experts suggested that standard-of-care therapies can have success in some patients with PL, but that patients with GL do not experience the same level of metabolic control while receiving standard-of-care therapies. Of note, the Ethics Review Report uses the term “metabolic management” in place of “metabolic control” in alignment with recommendations from patient groups regarding the use of language in the context of treating people with metabolic conditions.
Drug Under Review
Metreleptin mimics the physiological effects of leptin by binding to and activating the human leptin receptor, which belongs to the Class I cytokine family of receptors that signal through the JAK/STAT transduction pathway.22 Metreleptin is indicated as an adjunct to diet as a replacement therapy to treat the complications of leptin deficiency experienced by patients with lipodystrophy:
with confirmed CGL (Berardinelli-Seip syndrome) or AGL (Lawrence syndrome) in adults and children aged 2 years and older
with confirmed FPLD or APL (Barraquer-Simons syndrome), in adults and children aged 12 years and older with persistent significant metabolic disease for whom standard treatments have failed to achieve adequate metabolic control.
Metreleptin is contraindicated for patients with general obesity not associated with confirmed generalized leptin deficiency or confirmed PL. Metreleptin is also contraindicated for patients with HIV-related lipodystrophy.
The sponsor reimbursement request is consistent with the approved Health Canada indication. Metreleptin is administered once daily as a subcutaneous injection. The recommended daily dose is based on body weight (refer to Table 4).22 Based on clinical response (e.g., inadequate metabolic control) or other considerations (e.g., tolerability issues, excessive weight loss, especially in pediatric patients), the dose may be adjusted.22
Table 4: Recommended Dose of Metreleptin
Baseline weight | Starting daily dose (injection volume) | Dose adjustments (injection volume) | Maximum daily dose (injection volume) |
|---|---|---|---|
Males and females ≤ 40 kg | 0.06 mg/kg (0.012 mL/kg) | 0.02 mg/kg (0.004 mL/kg) | 0.13 mg/kg (0.026 mL/kg) |
Males > 40 kg | 2.5 mg (0.5 mL) | 1.25 mg (0.25 mL) to 2.5 mg (0.5 mL) | 10 mg (2 mL) |
Females > 40 kg | 5 mg (1 mL) | 1.25 mg (0.25 mL) to 2.5 mg (0.5 mL) | 10 mg (2 mL) |
Source: Metreleptin draft product monograph.22
Adipocytes store lipids to meet the fuel requirements of nonadipose tissues during fasting. For patients with lipodystrophy, the deficiency of adipose tissue leads to hypertriglyceridemia and ectopic deposition of fat in nonadipose tissues such as liver and muscle, contributing to metabolic abnormalities including insulin resistance. Native leptin is a hormone predominantly secreted by adipose tissues that informs the central nervous system of the status of energy stores in the body. In people with lipodystrophy, leptin deficiency, resulting from the loss of adipose tissue, contributes to excess caloric intake, which exacerbates the metabolic abnormalities, though leptin likely has effects on insulin sensitivity independent of food intake.33 Metreleptin mimics the physiological effects of leptin by binding to and activating the human leptin receptor, which belongs to the Class I cytokine family of receptors that signals through the JAK/STAT transduction pathway.22
In the absence of treatments that directly address leptin deficiency experienced by patients with lipodystrophy, patients often receive supportive care to manage comorbid conditions or complications of lipodystrophy. Although supportive care treatments are not indicated for lipodystrophy, they are indicated for comorbid conditions that are commonly diagnosed in patients with lipodystrophy (i.e., diabetes, hypertriglyceridemia, hypertension); as such, they are included in the basket of medications currently used to manage complications of lipodystrophy. Key characteristics of metreleptin are summarized in Table 5.
Table 5: Key Characteristics of Metreleptin
Characteristic | Metreleptin |
|---|---|
Mechanism of action | Metreleptin mimics the physiological effects of leptin by binding to and activating the human leptin receptor, which belongs to the Class I cytokine family of receptors that signal through the JAK/STAT transduction pathway. |
Indication | Health Canada indication: As an adjunct to diet as a replacement therapy to treat the complications of leptin deficiency experienced by patients with lipodystrophy:
|
Route of administration | Subcutaneous injection |
Recommended dose (injection volume) | Starting dose:
Dose adjustment:
Maximum daily dose:
|
Serious adverse effects or safety issues |
|
APL = acquired partial lipodystrophy; CGL = congenital generalized lipodystrophy; FPLD = familial partial lipodystrophy; JAK = Janus kinase; STAT = signal transducer and activator of transcription.
Source: Metreleptin Product Monograph.22
Stakeholder Perspectives
Patient Group Input
This section was prepared by the CADTH review team based on the input provided by patient groups. The full original patient input received by CADTH has been included in the Stakeholder section of this report.
One patient group, the Lipodystrophy Canada, responded to CADTH’s call for input for the current review of metreleptin as an adjunct to diet as a replacement therapy to treat the complications of leptin deficiency experienced by patients with lipodystrophy. The Lipodystrophy Canada is a not-for-profit foundation with the core mission of providing support and resources to patients with lipodystrophy and their caregivers. Information for this input was gathered from 2 patients from Canada (patient 1) and the UK (patient 2) with PL.
According to both patients, lipodystrophy affects their physical and mental health and every other aspect of their life tremendously. They experience hormonal imbalance, insulin resistance, diabetes, uncontrolled hunger, hypertriglyceridemia, hypertension, body image issues, low self-esteem, and fatigue. In addition, patient 1, whose sibling died after severe insulin resistance damaged their kidneys, experienced hirsutism, acanthosis nigricans, myocardial infarction, and heart arrhythmias that necessitated surgery to implant a cardiac device.
According to the patient input, symptoms associated with the disease affect school life and social relationships and contribute to bullying due to their masculine appearance, which increases their symptoms of depression. The patients noted that disease symptoms and constant medical appointments, medication intake, very high doses of insulin, and check-ups affect their everyday activities and HRQoL.
Both patients manage their disease by addressing comorbid conditions such as hyperglycemia, insulin resistance, hypertriglyceridemia, and hypertension. Both patients agreed that the treatments that are currently available are not ideal, as conventional treatments keep all health parameters at suboptimal levels and no available treatment directly targets lipodystrophy.
The 2 patients with prior metreleptin experience reported significant improvements in their disease symptoms and quality of life. They stated that the drug improved fatty liver symptoms, triglycerides, and hypertension symptoms; regulated their satiety; and improved their overall health and HRQoL. Metreleptin allowed patient 1 to cease insulin therapy and patient 2 to reduce insulin intake.
Clinician Input
Input From Clinical Experts Consulted by CADTH
All CADTH review teams include at least 1 clinical specialist with expertise on the diagnosis and management of the condition for which the drug is indicated. Clinical experts are a critical part of the review team and are involved in all phases of the review process (e.g., providing guidance on the development of the review protocol, assisting in the critical appraisal of clinical evidence, interpreting the clinical relevance of the results, and providing guidance on the potential place in therapy of the drug). In addition, as part of the review of metreleptin, a panel of 4 clinical experts from across Canada was convened to characterize unmet therapeutic needs, assist in identifying and communicating situations where there are gaps in the evidence that could be addressed through the collection of additional data, promote the early identification of potential implementation challenges, gain further insight into the clinical management of a condition, and explore the potential place in therapy of the drug (e.g., potential reimbursement conditions). A summary of this panel discussion follows.
Unmet Needs
The clinical panel noted that for patients with GL, standard-of-care therapies show little response. As a result of the disease, patients experience metabolic abnormalities such as elevated hemoglobin A1C and triglyceride levels putting them at risk for complications such as pancreatitis, damage to the liver and other organs, or cardiovascular abnormalities. The lack of circulating leptin results in uncontrolled constant increased appetite that can be debilitating. The clinical experts noted that caregivers of children with lipodystrophy must restrict access to food in the house to keep their child from overeating. A lack of circulating leptin also results in delayed onset of puberty and a markedly changed physical appearance that can lead to adolescent patients being bullied at school. The clinical experts agreed that current treatment options do not address these unmet needs for patients with GL. The clinical experts noted that an unmet need exists for patients with PL who are unable to have their metabolic parameters adequately controlled with standard-of-care therapies.
Place in Therapy
The clinical panel noted that the place in therapy for metreleptin would be different depending on the type of lipodystrophy the patient has (i.e., GL or PL). For patients with GL, metreleptin would be used as first-line therapy given the lack of efficacy provided by current standard-of-care therapies and in keeping with the treatment philosophy for a rare proven genetic disorder that matches the pathophysiology as closely as possible. For patients with PL, a portion are able to have their metabolic parameters controlled with standard-of-care therapies without the use of metreleptin, often with low to moderate doses of insulin. However, for a subset of patients, PL cannot be managed even with high doses of insulin; it is for these patients with uncontrolled disease and very low leptin levels, that the addition of metreleptin would be considered. The clinical expert panel also noted that many patients with PL receive treatment for underlying metabolic abnormalities before they receive a diagnosis of PL. If there is documented inability to control metabolic abnormalities with standard-of-care therapies before the diagnosis of PL, then metreleptin could be considered immediately.
Patient Population
The clinical expert panel explained that lipodystrophy is generally split into 2 subtypes, GL and PL. GL is a very rare genetic disorder, often identified in a younger patient population. The clinical experts noted that while genetic testing can help confirm a diagnosis of familial GL, often there is no perfect correlation between a true positive in terms of genetic testing and the clinical presentation of GL. As such, the clinical experts did not believe a confirmed genetic test result should be required for initiation of therapy for this patient population. Patients with GL have very low levels of circulating leptin, which is the underlying cause of the multitude of comorbidities that affect this population.
The clinical expert panel noted that patients with PL are a more heterogenous population, often diagnosed later in life than patients with GL. When determining which patients with PL would be most suited for treatment with metreleptin, the clinical experts suggested those patients who have uncontrolled metabolic parameters and low levels of circulating leptin. However, the clinical experts described testing for leptin levels as an uncommon and difficult-to-access laboratory test. To identify patients with PL for whom treatment with metreleptin could be suitable, the clinical experts suggested that elevated hemoglobin A1C and triglyceride levels were an adequate substitute given the impracticalities of measuring leptin levels directly. The experts noted that the levels used in the submitted pivotal trial to define severe PL (baseline hemoglobin A1C ≥ 6.5% and/or triglycerides ≥ 5.65 mmol/L) would be an appropriate criterion for identifying patients with PL who have uncontrolled disease on standard-of-care therapies.
Assessing the Response Treatment
The clinical expert panel noted that to assess response to metreleptin for patients with lipodystrophy, hemoglobin A1C and triglyceride levels would be monitored to determine whether metabolic control has improved. The experts suggested that determining a clinically meaningful response would be context-dependent on a number of factors including the baseline hemoglobin A1C and triglyceride levels, as well as the background therapies that the patient was receiving at the time of metreleptin initiation. Other clinical measures such as change in liver volume and change in plasma glucose levels can be informative but are not as heavily relied upon as hemoglobin A1C and triglyceride levels. The clinical experts suggested that it is important for patients with lipodystrophy to have their metabolic parameters reduced to a level where they are at a reduced risk for complications such as pancreatitis.
Other parameters the clinical experts noted as important included the ability to reduce the amount of insulin required by the patient as well as to reduce other background therapies that the patient may have been receiving before metreleptin initiation. The clinical experts also noted that for patients with child-bearing potential experiencing amenorrhea, the resumption of normal menstrual cycles and fertility is a very important outcome to monitor given how meaningful it is to patients’ quality of life.
Discontinuing Treatment
The expert panel agreed that treatment with metreleptin is life-long for patients with lipodystrophy provided the patient is still experiencing metabolic control while on treatment. Patients would be monitored for continued efficacy based on hemoglobin A1C and a lipid panel. Treatment would be discontinued if the patient experienced a worsening of metabolic parameters (potentially due to neutralizing antibodies) or if there were intolerable AEs attributable to metreleptin, that is, immunological side effects. However, the clinical expert panel noted that intolerable AEs appear to be uncommon.
Prescribing Considerations
The clinical panel suggested that metreleptin should be prescribing by an endocrinologist or a pediatric endocrinologist. The panel noted that specialist involvement is particularly important because initiating metreleptin treatment can impact insulin sensitivity experienced by patients with lipodystrophy, potentially leading to hypoglycemia if the insulin dose is not prophylactically adjusted. The experts noted that with the rise of telemedicine and virtual appointments, patients with PL who live in remote areas and may not have had access to an endocrinologist can have virtual consultations. Prescribing for PL can also be virtual, in coordination with the local primary care team. The panel noted that patients with GL should continue to be seen in person in hospital as treatment often involves the coordination of multiple specialties.
Clinician Group Input
This section was prepared by the CADTH review team based on the input provided by clinician groups. The full original clinician group input received by CADTH has been included in the Stakeholder section of this report.
One clinician group responded to CADTH’s call for input from a group of endocrinologists, medical geneticists, lipidologists, and internal medicine specialists from across Canada linked by their common interest in the care of patients with rare lipodystrophies, a serious group of disorders for which there is no cure, and which can lead to severe life-threatening complications. Information for this input was gathered mainly through the clinical registries of patients in Canada with various forms of lipodystrophies.
According to the clinician group input, lipodystrophy is characterized by complete or partial loss, or absence of, subcutaneous adipose tissue, known as GL and PL, leading to accumulation of lipids in the liver, skeletal muscle, heart, and pancreas, triggering hyperphagia, and resulting in insulin resistance, diabetes, hepatic steatosis, and severe hypertriglyceridemia. At an early age, this condition can cause potentially life-threatening acute pancreatitis.
The clinician group indicated that the current treatment paradigm for lipodystrophy, which does not target the underlying pathophysiology, consists of supportive care for comorbid conditions or complications. This includes diet and exercise, statins, fibrates, and omega-3 fatty acids to control dyslipidemia, and antihyperglycemic medications such as metformin, sulfonylureas, thiazolidinediones, glucagon-like peptide-1 receptor agonists, and sodium-glucose cotransporter-2 inhibitors.
The clinician group stated that there are significant unmet therapeutic needs for patients living with lipodystrophy, as there is no cure for this disease, and available treatments address the associated metabolic complications. Conventional therapies are inadequate because of the severity of metabolic abnormalities experienced by patients with GL and more severe forms of PL, increasing their risk of end-organ damage and early death. Therefore, there is a need for a therapy that aims at correcting the underlying pathophysiology of leptin deficiency.
The clinician group noted that metreleptin, which mimics the physiological effects of leptin, can ameliorate hyperphagia and improve hepatic and peripheral insulin sensitivity, and has an established benefit versus risk profile. According to the clinician group, metreleptin is the primary first-line therapy for patients with GL, including children, for whom starting early treatment with this drug is recommended to prevent serious complications. Also, patients with PL and with more severe metabolic diseases and who do not respond well to standard treatment approaches could benefit from metreleptin.
The clinician group indicated that the outcomes of interest in assessing clinical response are changes in metabolic control, such as 0.5% hemoglobin A1C reduction and 15% reduction in serum triglycerides. If clinical response is not seen after 6 months of treatment and the patient adheres to the administration technique, is receiving the correct dose, and adheres to diet, a dose increase should be considered before stopping treatment.
Drug Program Input
The drug programs provide input on each drug being reviewed through CADTH’s Reimbursement Review processes by identifying issues that may impact their ability to implement a recommendation. The implementation questions and corresponding responses from the clinical experts consulted by CADTH are summarized in Table 6.
Table 6: Summary of Drug Plan Input and Clinical Expert Response
Drug program implementation questions | Clinical expert response |
|---|---|
Relevant comparators | |
There is no direct comparator as there is no treatment for LD. There were some indirect comparators used such as lifestyle modification (diet and exercise, cosmetic surgery such as facial reconstruction with free flaps and silicone to replace adipose tissue, liposuction/lipectomy), hyperphagia therapy (anorexigenic agents, appetite suppressants, bariatric surgery), antihyperglycemic agents (insulin, thiazolidinediones, metformin, DPP-4 inhibitors, GLP-1 agonists, SGLT2 inhibitor, sulfonylureas), hypertriglyceridemia therapy (statins, fibrates, fish oils). | Comment from the drug plans to inform CDEC deliberations. |
Considerations for initiation of therapy | |
There was no genetic testing to confirm familial LD. Diagnosis was as follows: “Clinically significant lipodystrophy identified by the study physician during the physical examination as an absence of fat outside the range of normal variation and/or identified as a disfiguring factor by the patient.” Is there any scenario where a genetic test would be required to initiate therapy? | The clinical experts agreed that an absolute requirement for genetic testing to confirm familial LD is not necessary. While genetic testing can be used to confirm familial LD, the diagnosis should be made taking into account the full clinical presentation of the patient. The clinical experts also noted that the presence of a pathogenic or likely pathogenic DNA variant in a gene known to cause familial PL would be considered to be diagnostic of familial PL, provided that that variant (or variants) was not annotated exclusively to another disorder such as limb-girdle muscular dystrophy. |
Should patients be required to have been prescribed standard of care before becoming eligible for metreleptin? | The experts suggested that for patients with GL, metreleptin would be included as the initial treatment regimen. Patients with PL are often already receiving treatment for metabolic disorders with standard-of-care therapies before a diagnosis of PL is made. Therefore, practically speaking, patients with PL will have received standard of care, and if they are not adequately responding to that therapy, metreleptin should be added in an attempt to bring their metabolic parameters under control. In the event of identifying an incident patient with PL, the clinical experts agreed that existing therapies would still be tried first and moving on to metreleptin treatment if the disease could not be controlled. |
Considerations for continuation or renewal of therapy | |
What monitoring parameters should be in place to consider patients for renewal (lipid panel, hemoglobin A1C, and so on)? | The clinical experts agreed that monitoring for improvements in hemoglobin A1C and lipid parameters should be required for renewal of therapy. |
Considerations for prescribing of therapy | |
There can be difficulty accessing specialists in endocrinology or pediatric endocrinology in remote areas. Can metreleptin be initiated by internal medicine physicians in consultation with specialists? | The clinical experts agreed that initiation of treatment, for both patients with GL and those with PL, should be coordinated with an endocrinology or pediatric endocrinology specialist. They noted that for patients with PL who live in remote areas or are otherwise unable to easily access specialists, consultation can be virtual. The experts noted that patients with GL should see a specialist in person. |
Generalizability | |
In the submitted trial, patients with HIV were excluded. Should metreleptin be used for this patient population? | The clinical experts noted that LD associated with HIV is a distinct type with a distinct pathophysiology. Therefore, metreleptin reimbursement for HIV-associated LD would require a separate submission to CADTH and is outside the scope of the current review. |
Care provision issues | |
Although not required for an initial diagnosis of familial LD, genetic marker testing is required to make a definitive diagnosis in suspected LD and especially in those with a family history of LD and at-risk family members. This can result in issues with access. | Comment from the drug plans to inform CDEC deliberations. |
System and economic issues | |
Metreleptin is considered to be added to current standard of care. This will have an increased incremental budget impact. | Comment from the drug plans to inform CDEC deliberations. |
CDEC = Canadian Drug Expert Committee; DPP = dipeptidyl peptidase; GL = generalized lipodystrophy; GLP-1 = glucagon-like peptide-1 receptor; LD = lipodystrophy; PL = partial lipodystrophy; SGLT = sodium-glucose cotransporter.
Clinical Evidence
The objective of CADTH’s Clinical Review Report is to review and critically appraise the clinical evidence submitted by the sponsor on the beneficial and harmful effects of metreleptin (3 mg, 5.8 mg, and 11.3 mg, powder for solution, subcutaneous injection) for the treatment of the complications of leptin deficiency experienced by patients with lipodystrophy. The focus is on comparing metreleptin to relevant comparators and identifying gaps in the current evidence.
A summary of the clinical evidence provided by the sponsor in the review of metreleptin is presented in 2 sections with CADTH’s critical appraisal of the evidence included at the end of each section. The first section, the systematic review, includes pivotal studies and RCTs that were selected according to the sponsor’s systematic review protocol. CADTH’s assessment of the certainty of the evidence in this first section using the GRADE approach follows the critical appraisal of the evidence. The second section includes additional studies that were considered by the sponsor to address important gaps in the systematic review evidence.
Included Studies
Clinical evidence from the following are included in the CADTH review and appraised in this document:
1 pivotal clinical trial identified in a systematic review
1 supportive clinical trial
2 historical control arm analyses addressing gaps in evidence.
Systematic Review
Contents within this section have been informed by materials submitted by the sponsor. The following has been summarized and validated by the CADTH review team.
Description of Studies
Characteristics of the included studies are summarized in Table 7.
Table 7: Details of Studies Included in the Systematic Review
Detail | NIH 991265/20010769 study |
|---|---|
Designs and populations | |
Study design | Phase II/III, open-label, single-arm, single-centre, investigator-sponsored |
Locations | Studies 991265/20010769 were conducted at the NIH in Bethesda, MD, US. Patients were enrolled from the US, countries in Europe, including the UK and the Eastern Mediterranean region, and Canada. |
Patient enrolment dates: | Start date: July 24, 2000 End date: March 26, 2014 |
Enrolled (N) | Enrolled N = 107
Generalized lipodystrophy, N = 66 Partial lipodystrophy, N = 41 |
Inclusion criteria |
|
Exclusion criteria | General: Pregnant women, women in their reproductive years who did not use an effective method of birth control, and women who were nursing or who were lactating within 6 weeks of having completed nursing. Exclusions for underlying disease likely to increase side effects or to hinder objective data collection:
|
Drugs | |
Intervention | Study 991265 Metreleptin was administered subcutaneously. Dosing was determined on the basis of body weight and varied by age and sex. Injections were to be administered at a single site with a maximum allowable volume of 2.0 mL. The metreleptin dosing regimen in the pilot study was as follows:
Study 20010769 Metreleptin was administered subcutaneously:
|
Comparator(s) | NA |
Study duration | |
Screening phase | 7 days |
Treatment phase | Study 991265: Up to 8 months, at which point all but 1 participant continued on to the long-term study (Study 20010769). Study 20010769: Up to 14 years. |
Follow-up phase | Study 991265: Patients could elect to continue metreleptin treatment in the long term 20010769 study. Study 20010769: Every 6 months. |
Outcomes | |
Primary end point | The co-primary efficacy end points were defined as:
|
Secondary and exploratory end points | Secondary Key secondary:
Other secondary:
Exploratory:
|
Publication status | |
Publications | Brown et al. (2018)34 Chan et al. (2011)35 Diker-Cohen et al. (2015)36 Oral et al. (2002)37 Oral et al. (2019)38 |
ACTH = adrenocorticotropic hormone; ALT = alanine aminotransferase; AST = aspartate aminotransferase; FFA = free fatty acid; HDL-C = high-density lipoprotein cholesterol; IVGTT = IV glucose tolerance test; LDL-C = low-density lipoprotein cholesterol; NIH = National Institutes of Health; OGTT = oral glucose tolerance test.
Source: Study 991265/20010769 Clinical Study Report.39 Details included in the table are from the sponsor’s Summary of Clinical Evidence.
The NIH 991265/20010769 was a phase II/III, open-label, single-arm, single-centre, investigator-sponsored study. Study 991265 was a pilot, dose-escalation study, with the objectives to determine if metreleptin can be safely administered to a group of patients with clinically significant lipodystrophy and to determine if metreleptin treatment will be effective in lowering plasma glucose and lipid abnormalities experienced by patients with clinically significant lipodystrophy. Additional objectives of this study were to determine if treatment with metreleptin could ameliorate lipid deposition in liver and muscle or improve the hypogonadotropic hypogonadism observed in some patients. Study 20010769 was a long-term study conducted to determine the long-term safety and efficacy of metreleptin treatment for patients with lipodystrophy.
Patient enrolment occurred between July 24, 2000, and March 26, 2014; the data cut-off date was in December 2014. Study 20010769 allowed for the rollover of patients from the pilot study, as well as for direct enrolment of new patients. A total of 107 patients were enrolled in the studies, which were conducted at the NIH. Although these studies were conducted at the NIH, patients were also enrolled from countries outside the US, including Canada. Nine of the 107 patients were enrolled in the pilot Study 991265; of these, 8 rolled over to receive metreleptin in Study 20010769, and 98 patients enrolled directly into Study 20010769. A total of 66 of the 107 patients had GL and 41 had PL, including 31 patients in the PL subgroup, that is, those patients with PL with baseline hemoglobin A1C greater than or equal to 6.5% and/or triglyceride levels greater than or equal to 5.65 mmol/L.
Patients were assessed 7 days before initiation of metreleptin for evaluation of study eligibility and to undergo baseline assessments, including a complete medical history and physical examination, including vital signs. At the end of the baseline evaluation, patients began subcutaneous metreleptin injections and were observed on therapy as inpatients for at least 48 hours before discharge. Patients received detailed education on home glucose-monitoring and self-injection techniques.
Populations
Inclusion and Exclusion Criteria
Eligible patients were aged older than 5 years in Study 991265 and 6 months or older in Study 20010769 with clinically significant lipodystrophy. To be eligible to participate in Study 991265, participants’ circulating leptin levels had to be less than or equal to 8.0 ng/mL in females and less than or equal to 6.0 ng/mL in males to be eligible. To be eligible to participate in Study 20010769, circulating leptin levels had to be less than 12.0 ng/mL in females and less than 8.0 ng/mL in males as measured using a Linco assay on a specimen obtained after an overnight fast; in children aged 6 months to 5 years, a circulating leptin level of less than 6 ng/mL was used. In both studies, the presence of at least 1 of the following metabolic abnormalities was an inclusion criterion: diabetes as defined by American Diabetes Association criteria; fasting insulin greater than 30 µU/mL; fasting hypertriglyceridemia, defined as triglyceride levels greater than 2.26 mmol/L in Study 991265 and greater than 2.26 mmol/L or postprandially elevated to greater than 5.65 mmol/L when fasting was clinically not indicated (e.g., in infants) in Study 20010769. General exclusion criteria included “pregnant women, women in their reproductive years who did not use an effective method of birth control, and women who were nursing or who were lactating within 6 weeks of having completed nursing.”39
Interventions
All patients received metreleptin subcutaneously, either administered by themselves or by caregivers. Dosing was administered on a body weight basis and varied by age and sex. Injections were to be administered at a single site at a maximum allowable volume of 2.0 mL. Administering the study drug at the same time each day was recommended; dosing was to alternate between sites on the abdomen and limbs.
Because of variability in individual metabolic profiles at baseline and differences in response to metreleptin (likely due in large part to sex and lipodystrophy subtype), metreleptin doses for each patient were adjusted according to individual response, for example, increased to achieve better efficacy or decreased (based on AEs or effects such as excessive weight loss). Thus, an individualized approach was utilized to determine each patient’s dose.
All patients were admitted to the NIH Clinical Center for screening and baseline assessments. These were scheduled to occur over 7 days. Patients received detailed education on self-injection and home glucose-monitoring techniques.
Patients were to be discontinued from treatment immediately if there was a systemic life-threatening allergic reaction to metreleptin, AEs that were not readily explained by other causes unrelated to current protocol, development of any medical problem listed in the exclusion criteria, and noncompliance with self-monitoring requirements and clinical centre visits, among other reasons.
Study 991265
At the time of initiation of the pilot Study 991265, the dose of metreleptin required to achieve a normal leptin concentration was proposed to be 0.03 mg/kg of lean body weight for females aged between 14 and 18 years, 0.04 mg/kg of lean body weight for adult females, and 0.02 mg/kg of lean body weight for males, regardless of age. Patients were initially started at 50% of this predicted dose with subsequent dose increases (to 100% and 200%) based on safety and effectiveness. A conservative, empirical approach to dosing was employed: the dose was calculated based on body weight (mg per kg) and gradually titrated from a low starting dose that was escalated over several months, with the total daily dose administered twice a day (a.m. and p.m.). Approximately twice the dose was used for females than that for males based upon the observation that females in general have higher concentrations of leptin even after adjustment for differences in body compositions. The target dose of metreleptin for each patient was achieved via a 2-step dose escalation and the dosing regimen in this pilot study was as follows:
month 1: 0.02 mg/kg/day for females aged 18 years or older, 0.015 mg/kg/day for females aged younger than 18 years, and 0.01 mg/kg for males (considered “50%” target dose)
month 2: 0.04 mg/kg/day for females aged 18 years or older, 0.03 mg/kg/day for females younger than 18 years, and 0.02 mg/kg for males (considered “100%” target dose)
month 3 to 4: 0.08 mg/kg/day for females aged 18 years or older, 0.06 mg/kg/day for females younger than 18 years, and 0.04 mg/kg for males (considered “200%” target dose).
Any individual patient could participate in Study 991265 for up to 8 months, after which they could roll over into the long-term Study 20010769.
Study 20010769
The dosing regimen in Study 20010769 was initially the same as in Study 991265. However, dosing of metreleptin evolved to initiating at more typical efficacious doses with minimal titration, and dosing frequency was modified from twice daily to once daily. In females aged 5 years and older, the modified starting dose was 0.08 mg/kg/day to 0.10 mg/kg/day; in females younger than 5 years and all males, the starting dose was 0.06 mg/kg/day. The metreleptin target dose for each patient was initially achieved via a 2-step dose escalation. As information about metreleptin dosing grew, patients who initiated later started at higher doses and required minimal to no dose escalation.
The dose of metreleptin could be increased after the 6-month follow-up. All dose escalations were performed in increments of 0.02 mg/kg/day for females aged 10 years and older and 0.01 mg/kg/day in all other patients. Only 1 dose increase could be done per week to evaluate the effect on body weight and on injection sites. In individuals aged older than 5 years, the dose of metreleptin was not to be increased beyond 0.12 mg/kg/day unless there was a clear decline in metabolic status without alternative explanations for the metabolic change (such as an infection, noncompliance, or dietary indiscretion). Dose escalations without prior approval were capped at 0.24 mg/kg/day for any patient. If patients could not tolerate a higher dose level, they could continue treatment at the next lowest tolerated dose. The dosing frequency was also modified during the course of the study. The total daily dose was originally administered twice a day in 2 equal doses approximately 12 hours apart. With an amendment to the protocol, patients could switch to once daily dosing while keeping the total daily dose constant after the 1-year follow-up. If, according to the principal investigator or the coordinating nurse practitioner, there was a decline in clinical benefit with once daily dosing, the patients were to go back to twice daily dosing. Dosing was later initiated at once a day.
Outcomes
A list of efficacy end points assessed in this Clinical Review Report is provided in Table 8, and descriptions of the outcome measures follow. Summarized end points are based on outcomes included in the sponsor’s Summary of Clinical Evidence as well as any outcomes identified as important to this review according to the clinical expert(s) consulted by CADTH and stakeholder input from patient and clinician groups and public drug plans. Using the same considerations, the CADTH review team selected end points considered most relevant to informing CADTH’s expert committee deliberations and finalized this list of end points in consultation with members of the expert committee. All summarized efficacy end points were assessed using GRADE. Select notable harms outcomes considered important for informing CADTH’s expert committee deliberations were also assessed using GRADE.
Table 8: Outcomes Summarized From the Studies Included in the Systematic Review
Outcome measure | Time point | NIH 991265/20010769 study |
|---|---|---|
Actual change from baseline in hemoglobin A1C | At month 12 | Co-primary efficacy end pointa |
Percent change from baseline in fasting serum triglycerides | At month 12 | Co-primary efficacy end pointa |
Proportion of patients achieving target actual decreases of:
| At month 12 | Key secondary efficacy end point |
Actual and percent change from baseline in fasting plasma glucose levels | At month 12 | Key secondary efficacy end point |
Actual change from baseline in hemoglobin A1C | At each postbaseline visitb | Other secondary efficacy end point |
Percent and actual change from baseline in fasting serum triglycerides | At each postbaseline visitb | Other secondary efficacy end point |
Percent and actual change from baseline in fasting plasma glucose | At each postbaseline visitb | Other secondary efficacy end point |
Proportion of patients with baseline hemoglobin A1C > 7% who achieve:
| Through month 12 | Other secondary efficacy end point |
Proportion of patients with baseline triglycerides ≥ 2.26 mmol/L (≥ 200 mg/dL) who achieve:
| Through month 12 | Other secondary efficacy end point |
Proportion of patients with baseline triglycerides ≥ 5.65 mmol/L (≥ 500 mg/dL) who achieve:
| Through month 12 | Other secondary efficacy end point |
Proportion of patients achieving target actual decreases (≥ 1%, ≥ 1.5%, and ≥ 2%) in hemoglobin A1C | At 2 consecutive postbaseline visitsb on or after month 4 through month 12 | Other secondary efficacy end point |
Proportion of patients achieving target percent decreases (≥ 30%, ≥ 35%, and ≥ 40%) in fasting serum triglycerides | At 2 consecutive postbaseline visitsb on or after month 4 through month 12 | Other secondary efficacy end point |
Actual and percent change from baseline in fasting lipids (total cholesterol, LDL-C, HDL-C, and FFAs) | Through month 12 | Other secondary efficacy end point |
Actual change from baseline in ALT and AST at each postbaseline visit | Through month 12 | Other secondary efficacy end point |
Actual change from baseline in liver volume at each postbaseline visit | Through month 12 | Other secondary efficacy end point |
Proportion of patients achieving:
| At month 4 (day 120) | Exploratory efficacy end point |
Proportion of patients achieving target decreases in both hemoglobin A1C (≥ 1%, ≥ 1.5%, and ≥ 2%) and fasting serum triglycerides (≥ 30%, ≥ 35%, and ≥ 40%) | At each postbaseline visitb through month 12 | Exploratory efficacy end point |
Actual change from baseline in:
| Not applicable | Exploratory efficacy end point |
Assessment of hormonal, endocrine, cortisol, and ACTH levels and pelvic ultrasound and biopsy results | Not applicable | Exploratory efficacy end point |
ACTH = adrenocorticotropic hormone; ALT = alanine aminotransferase; AST = aspartate aminotransferase; FFA = free fatty acid; HDL-C = high-density lipoprotein cholesterol; IVGTT = IV glucose tolerance test; LDL-C = low-density lipoprotein cholesterol; NIH = National Institutes of Health; OGTT = oral glucose tolerance test.
aNo adjustment for analysis of 2 primary end points is required since the end points of change from baseline in hemoglobin A1C and fasting triglyceride levels are regarded as co-primary, that is, significance on both end points is required for an overall significant result.
bIn the pilot study, postbaseline visits were initially scheduled at months 1, 2, and 4; visits at months 6, 8, and 12 were added by protocol amendment. Note that patients in this study who elected to continue metreleptin treatment were transferred to the long-term study at approximately month 8 of treatment. The original protocol for Study 20010769 included postbaseline visits at months 1, 2, 6, 4, 8, and 12; Amendment 1 removed the month 6 assessment and added assessments every 6 months after month 12. As more experience was gained with the safety and effectiveness profile of metreleptin, and as many of the patients travelled a great distance to the NIH for treatment, the visit schedule was reduced or modified with Amendment F to include visits at months 3, 6, and 12 and every 6 months thereafter.
Source: Study 991265/20010769 Clinical Study Report.39 Details included in the table are from the sponsor’s Summary of Clinical Evidence.
According to the clinical experts and clinician group input, change in hemoglobin A1C and triglyceride levels are the common metabolic parameters that are measured to assess disease control in the population of patients with lipodystrophy. The thresholds that determine a clinically meaningful response depend on the individual patient, the starting level of metabolic parameters, and the background therapies received. Other important end points included were change in plasma glucose and change in liver volume as this can impact long-term complications.
Primary Efficacy Outcomes
Actual change from baseline in hemoglobin A1C and percent change from baseline in fasting triglyceride levels to month 12 were the co-primary efficacy end points. The clinical experts considered month 12 an appropriate time point for analysis as the effects of metreleptin could be expected to be seen by this time. The sponsor noted that this 12-month period would allow for individual dose titrations to achieve maximum effects in given patients; 12 months was also an acceptable length of time over which to assess the clinical impact of the treatment. To account for patients who discontinued treatment before month 12, LOCF methods were used to determine changes from baseline to month 12. Specifically, hemoglobin A1C and triglyceride samples obtained on or after day 180 were used in the analysis for patients without samples obtained within the month 12 window (day 365 ± 65 days).
Secondary Efficacy Outcomes
Serum chemistry parameters, including fasting glucose, were tested using laboratory assessments at screening or baseline, then at months 1, 2, 4, 6, 8, and 12, and then every 6 months. The actual and percent change from baseline in fasting plasma glucose levels at month 12 was assessed as a key secondary efficacy end point. The actual and percent change from baseline in fasting glucose at each postbaseline visit was also assessed as a secondary efficacy end point.
Patients aged 5 years and older underwent MRI of the liver to evaluate its size and estimate fat deposition. IV gadolinium was administered to accurately calculate fat volume in the liver. Assessments were conducted at screening or baseline, at months 4, 8, and 12, and then every 6 months. Actual change from baseline in liver volume at each postbaseline visit through month 12 was assessed as a secondary efficacy end point.
Statistical Analysis
Sample Size and Power Calculation
The NIH investigators specified a sample size justification in both study protocols as follows:
Based on preliminary data in a cross-sectional study, the mean ± SD HbA1c data for 8 patients with GL was 9.1 ± 2.2%. Based on assumption of a 1.5% (for protocol 991265 and 1.0% for 20010769) actual decrease in HbA1c levels over a period of 4 months (for protocol 991265 (and 12 months for 20010769)) as clinically meaningful, 10 patients would be required for 80% study power and an alpha error of 5%. Also, based on previous cross-sectional data, the mean ± SD fasting TG levels for 8 patients with GL was 2200 ± 900 mg/dL. Based on assumption of 660 mg/dL (or 30% decrease from the mean baseline) decrease as clinically meaningful, 10 patients with hypertriglyceridemia would be required for 80% study power and 5% alpha error.
Upon validation of the sample size calculation, it was found that, based on these assumptions, 32 patients would be required to participate in the sample to be able to detect a 1% actual decrease in hemoglobin A1C and 15 patients would be required to detect a 1.5% actual decrease in hemoglobin A1C with 80% power and 5% 1-sided alpha error. For triglycerides, a sample size of 13 would be required to detect a reduction of 660 mg/dL with 80% power and 5% 1-sided alpha error. The final sample size across the 2 protocols was 107 patients. As it became clear that treatment with metreleptin was improving the metabolic abnormalities associated with lipodystrophy and could be safely administered long-term with benefits to patients, the protocol was amended to expand the eligibility criteria and to increase the sample size.
Statistical Testing
Tabulations were produced for appropriate demographic, baseline, efficacy, pharmacokinetic, and safety parameters. For categorical variables, summary tabulations of the number and percentage of patients within each category (with a category for missing data, where appropriate) of the parameter were presented. For continuous variables, the number of patients, mean, median, SD, minimum, and maximum values were presented. Geometric mean and SE of the geometric mean were presented as appropriate.
For analysis of change from baseline, the total number of patients by time point reflected the actual number of patients with data for that specific parameter at baseline and the specified time point. The total number of patients at a given time point depended on whether data for that time point were available and whether the study visit fell within the specified analysis visit window.
Formal statistical hypothesis testing was performed on the primary efficacy end point with all tests conducted at the 2-sided, 0.05 level of significance. Summary statistics were presented, as well as CIs on selected parameters.
Interim safety and efficacy data were examined at several data cuts over the course of the study. As such, multiple interim reports were produced for regulatory submissions. The analyses presented in this report are the final analyses.
Co-Primary End Points
The co-primary efficacy analyses were performed using the FAS. Actual change from baseline in hemoglobin A1C and actual and percent changes from baseline in fasting triglyceride levels were summarized using descriptive statistics and 95% CIs by type (GL or PL) and PL subgroup, by sex and overall for GL and PL separately. P values were computed using paired t tests to determine if the change from baseline to month 12 was significantly different from 0, at a 1-sided alpha-level of 0.025. The LOCF method was used to impute any missing month 12 hemoglobin A1C and fasting triglyceride results. The imputation only took into account results that were at least 6 months (180 days) postbaseline. Thus, analysis of primary efficacy end points included all patients who had baseline and at least month 6 measurements and were presented by type and PL subgroup, by sex and overall for GL and PL separately.
Mean actual and percent changes over time through month 12 in hemoglobin A1C and fasting triglycerides were plotted with SEs by type and PL subgroup, by sex and overall for GL and PL separately. Waterfall plots of by-patient changes from baseline to month 12 in hemoglobin A1C and fasting triglyceride levels were also presented by peak titre and overall.
Scatter plots showing the correlated by-patient changes in hemoglobin A1C and fasting triglyceride levels were also presented by type and PL subgroup, by sex and overall for GL and PL separately.
No adjustment for analysis of 2 primary end points was required since the end points of change from baseline in hemoglobin A1C and fasting triglyceride levels were regarded as co-primary, that is, significance on both end points was required for an overall significant result. No formal statistical analyses on the primary end point that adjust for possible covariate effects were planned.
A sensitivity analysis on the co-primary efficacy end points was performed using the efficacy-evaluable analysis set, controlled concomitant medication full analysis set (CFAS), and controlled concomitant medication efficacy-evaluable analysis set (CEEAS). For tables using the CFAS or CEEAS, a patient only contributed to the change in parameter for which the concomitant medication was controlled. In other words, a patient could only contribute to the change in hemoglobin A1C if there was no increase in the first 12 months in antidiabetic medications and could only contribute to the change in fasting triglycerides if there was no increase in the first 12 months in lipid-lowering therapies. Analyses using the CFAS also used the LOCF imputation method. An additional sensitivity analysis using the FAS on the co-primary end points used the worst observation carried forward (WOCF) imputation method. An analysis using the baseline observation carried forward (BOCF) imputation was also conducted to comply with a specific request from Health Canada.
Secondary End Points
Actual and percent change from baseline in liver volume at each postbaseline analysis visit through month 12 was summarized using descriptive statistics by type and PL subgroup, by sex and overall for GL and PL separately. It was also presented by age subgroups (< 18 years and ≥ 18 years).
Table 9: Statistical Analysis of Efficacy End Points
End point | Statistical modela | Handling of missing data | Sensitivity analyses |
|---|---|---|---|
Co-primary: Actual change from baseline in hemoglobin A1C at month 12 | Descriptive statistics and 95% CIs by type (GL, PL) and PL subgroup, by sex and overall for GL and PL separately using the FAS. P values were computed using paired t tests to determine if the change from baseline to month 12 was significantly different from 0, at a 1-sided alpha-level of 0.025. | The LOCF method was used to impute any missing month 12 hemoglobin A1C and fasting triglyceride results. The imputation only took into account results that were at least 6 months (180 days) postbaseline. | A sensitivity analysis on the co-primary efficacy end points was performed using the EEAS, CFAS, and CEEAS. Analyses using the CFAS also used the LOCF imputation method. An additional sensitivity analysis, using the FAS, on the co-primary end points used a WOCF imputation method. An analysis using a BOCF imputation was also conducted to comply with a specific request from Health Canada. |
Co-primary: Percent change from baseline in fasting serum triglycerides at month 12 | Descriptive statistics and 95% CIs by type (GL, PL) and PL subgroup, by sex and overall for GL and PL separately using the FAS. P values were computed using paired t tests to determine if the change from baseline to month 12 was significantly different from 0, at a 1-sided alpha-level of 0.025. | The LOCF method was used to impute any missing month 12 hemoglobin A1C and fasting triglyceride results. The imputation only took into account results that were at least 6 months (180 days) postbaseline. | A sensitivity analysis on the co-primary efficacy end points was performed using the EEAS, CFAS, and CEEAS. Analyses using the CFAS also used the LOCF imputation method. An additional sensitivity analysis, using the FAS, on the co-primary end points used a WOCF imputation method. An analysis using a BOCF imputation was also conducted to comply with a specific request from Health Canada. |
Key secondary Proportion of patients achieving target actual decreases of:
| Reported as the number (%) of responders with 2-sided exact binomial 95% CI among the types and PL subgroup, by sex and overall for GL and PL separately using the FAS. | NA | Sensitivity analyses were performed using the EEAS, CFAS, and CEEAS. |
Key secondary: Actual and percent change from baseline in fasting plasma glucose levels at month 12 | Summarized in a similar manner as the co-primary efficacy end points. | NA | Sensitivity analyses were performed using the EEAS, CFAS, and CEEAS. |
Other secondary: Actual change from baseline in hemoglobin A1C at each postbaseline visit | Descriptive statistics and 95% CIs for each postbaseline visit by type and PL subgroup, by sex and overall for GL and PL separately, using the FAS. Visits that include data for < 10% of patients were not reported. The MMRM model was used as an alternative method to analyze these changes over time for the entire duration of the study, using type and PL subgroup, sex, and baseline values as fixed effects and analysis visits as random effects. Interaction terms were used, as appropriate. P values at month 6, month 12, month 24, and month 36 were presented, as appropriate. The P value over all visits was also presented. The Kenward-Roger approximation was used to estimate the denominator degrees of freedom and adjust standard errors. | NA | NA |
Other secondary: Percent and actual change from baseline in fasting serum triglycerides at each postbaseline visit | Descriptive statistics and 95% CIs for each postbaseline visit by type and PL subgroup, by sex and overall for GL and PL separately, using the FAS. Visits that include data for < 10% of patients were not reported. The MMRM model was used as an alternative method to analyze these changes over time for the entire duration of the study, using type and PL subgroup, sex, and baseline values as fixed effects and analysis visits as random effects. Interaction terms were used, as appropriate. P values at month 6, month 12, month 24, and month 36 were presented, as appropriate. The P value over all visits was also presented. The Kenward-Roger approximation was used to estimate the denominator degrees of freedom and adjust standard errors. | NA | NA |
Other secondary: Percent and actual change from baseline in fasting plasma glucose at each postbaseline visit | Descriptive statistics and 95% CIs for each postbaseline visit by type and PL subgroup, by sex and overall for GL and PL separately, using the FAS. Visits that include data for < 10% of patients were not reported. The MMRM model was used as an alternative method to analyze these changes over time for the entire duration of the study, using type and PL subgroup, sex, and baseline values as fixed effects and analysis visits as random effects. Interaction terms were used, as appropriate. P values at month 6, month 12, month 24, and month 36 were presented, as appropriate. The P value over all visits was also presented. The Kenward-Roger approximation was used to estimate the denominator degrees of freedom and adjust standard errors. | NA | NA |
Other secondary Proportion of patients with baseline hemoglobin A1C > 7% who achieve:
| Summarized by type and PL subgroup, by sex and overall for GL and PL separately. | NA | NA |
Other secondary Proportion of patients with baseline triglycerides ≥ 2.26 mmol/L (≥ 200 mg/dL) who achieve:
| Summarized by type and PL subgroup, by sex and overall for GL and PL separately. | NA | NA |
Other secondary Proportion of patients with baseline triglycerides ≥ 5.65 mmol/L (≥ 500 mg/dL) at baseline who achieve:
| Summarized by type and PL subgroup, by sex and overall for GL and PL separately. | NA | NA |
Other secondary: Proportion of patients achieving target actual decreases (≥ 1%, ≥ 1.5%, and ≥ 2%) in hemoglobin A1C at 2 consecutive postbaseline visits on or after month 4 through month 12 | Summarized by type and PL subgroup, by sex and overall for GL and PL separately. | NA | NA |
Other secondary: Proportion of patients achieving target percent decreases (≥ 30%, ≥ 35%, and ≥ 40%) in fasting serum triglycerides at 2 consecutive postbaseline visits on or after month 4 through month 12 | Summarized by type and PL subgroup, by sex and overall for GL and PL separately. | NA | NA |
Other secondary: Actual and percent change from baseline in fasting lipids (total cholesterol, LDL-C, HDL-C, and FFA) through month 12 | Descriptive statistics by type and PL subgroup, by sex and overall for GL and PL separately. | NA | NA |
Other secondary: Actual change from baseline in ALT and AST at each postbaseline visit through month 12 | Descriptive statistics by type and PL subgroup, by sex and overall for GL and PL separately. | NA | NA |
Other secondary: Actual change from baseline in liver volume at each postbaseline visit through month 12 | Descriptive statistics by type and PL subgroup, by sex and overall for GL and PL separately. This was also presented by age subgroups (< 18 years and ≥ 18 years). | NA | NA |
ALT = alanine aminotransferase; AST = aspartate aminotransferase; BOCF = baseline observation carried forward; CEEAS = Controlled Concomitant Medication Efficacy-Evaluable Analysis Set; CFAS = controlled concomitant medication full analysis set; CI = confidence interval; EEAS = efficacy-evaluable analysis set; FAS = full analysis set; FFA = free fatty acid; GL = generalized lipodystrophy; HDL-C = high-density lipoprotein cholesterol; LDL-C = low-density lipoprotein cholesterol; LOCF = last observation carried forward; MMRM = mixed-effect model for repeated measures; NA = not applicable; PL = partial lipodystrophy; WOCF = worst observation carried forward.
aAll descriptive statistical analyses were performed using SAS statistical software version 9.3, unless otherwise noted.
Source: Study 991265/20010769 Clinical Study Report.39 Details included in the table are from the sponsor’s Summary of Clinical Evidence.
Analysis Populations
Table 10 summarizes the analysis populations in the NIH 991265/20010769 study.
Table 10: Analysis Populations of the NIH 991265/20010769 Study
Population | Definition | Application |
|---|---|---|
SAS | All enrolled patients who received at least 1 dose of study drug. | Analysis of safety end points |
FAS | All patients in the SAS who had either primary efficacy parameter of interest measured at baseline and at ≥ 1 postbaseline visit. | Analyses of primary and secondary efficacy end points |
EEAS | All patients in the FAS who had either efficacy parameter of interest measured at month 12 and no major protocol violations before month 12. | Analyses of the primary and key secondary efficacy end points |
CFASa | All patients in the FAS who had controlled concomitant medication use, described as no change or a decrease in baseline concomitant medications (antidiabetic or lipid-lowering therapies), before month 12. | Analyses of the primary and key secondary efficacy end points |
CEEASa | All patients in the CFAS who had either efficacy parameter of interest measured at month 12 and have no major protocol violations before month 12. | Analyses of the primary and key secondary efficacy end points |
Antibody analysis set | All patients in the SAS who had antibody status assessed at least once while receiving treatment. | Analysis of antibody end points |
CEEAS = controlled concomitant medication efficacy-evaluable analysis set; CFAS = controlled concomitant medication full analysis set; EEAS = efficacy-evaluable analysis set; FAS = full analysis set; NIH = National Institutes of Health; SAS = safety analysis set.
aData for all antidiabetic or lipid-lowering therapies, including type, dose, regimen, and route of administration, underwent medical review. Patients who had these types of medications added or doses increased, which may have had an impact on the efficacy end points, were excluded from the CFAS and CEEAS. Patients were excluded separately based on the type of medication that was added or increased, e.g., patients with potentially confounding antidiabetes medications were excluded from the analyses of hemoglobin A1C and those with potentially confounding lipid-lowering therapies were excluded from the analyses of triglycerides.
Source: Study 991265/20010769 Clinical Study Report.39 Details included in the table are from the sponsor’s Summary of Clinical Evidence.
Results
Patient Disposition
Table 11 summarizes the patient disposition from the NIH 991265/20010769 study. A total of 66 patients with GL and 41 patients with PL received treatment. Of the patients in the GL cohort, 34.8% discontinued treatment prematurely, with the most common reason cited being transfer to another program. In the PL cohort, 36.6% of patients discontinued treatment prematurely, with the most common reason cited being noncompliance.
Table 11: Summary of Patient Disposition From Studies Included in the Systematic Review
Patient disposition | NIH 991265/20010769 study | ||
|---|---|---|---|
GL overall (N = 66) | PL subgroupa (N = 31) | PL overall (N = 41) | |
Total number of patients | |||
Receiving treatment, n | 66 | 31 | 41 |
Premature discontinuation, n (%) | 23 (34.8) | 11 (35.5) | 15 (36.6) |
Primary reason for premature discontinuation, n (%) | |||
Noncompliance | 5 (7.6) | 6 (19.4) | 6 (14.6) |
Death | 3 (4.5) | 1 (3.2) | 1 (2.4) |
Ineligibility determined | 2 (3.0) | 0 | 0 |
Adverse event | 1 (1.5) | 0 | 0 |
Lost to follow-up | 1 (1.5) | 0 | 0 |
Other: | 11 (16.7) | 4 (12.9) | 8 (19.5) |
Transferred to other program | 8 | 1 | 2 |
Lack of efficacy/no benefit | 1 | 3 | 5 |
Otherb | 2 | 0 | 1 |
Patients contacted for follow-up,c n (%) | 38 (57.6) | 20 (64.5) | 26 (63.4) |
Safety analysis set,d n (%) | || ||||||| | || ||||||| | || ||||||| |
Full analysis set,e n (%) | || |||||| | || |||||| | || |||||| |
Controlled concomitant medication full analysis set,f n (%) | || |||||| | || |||||| | || |||||| |
Efficacy-evaluable analysis set,g n (%) | || |||||| | || |||||| | || |||||| |
Controlled concomitant medication efficacy-evaluable analysis set,h n (%) | || |||||| | || |||||| | || |||||| |
Antibody analysis set,i n (%) | || |||||| | |||||| | || |||||| |
GL = generalized lipodystrophy; NIH = National Institutes of Health; PL = partial lipodystrophy.
aThe PL subgroup included patients with baseline hemoglobin A1C ≥ 6.5% and/or triglycerides ≥ 5.65 mmol/L.
bOther reasons included diagnosis of bipolar disorder, health issues, and gastric bypass surgery.
cPatients who were receiving treatment at the time when metreleptin was approved in the US were contacted to determine if and how they were able to continue therapy.
dAll enrolled patients who received at least 1 dose of the study drug.
eAll patients in the safety analysis set who had either primary efficacy parameter measured at baseline and at ≥ 1 postbaseline visit.
fAll patients in the full analysis set who had controlled concomitant medication use before month 12.
gAll patients in the full analysis set who had either efficacy parameter of interest measured at month 12 and no major protocol violations before month 12.
hAll patients in the controlled concomitant medication full analysis set who had either efficacy parameter of interest measured at month 12 and no major protocol violations before month 12.
IAll patients in the safety analysis set who have antibody status assessed ≥ 1 while enrolled in the study.
Source: Study 991265/20010769 Clinical Study Report.39 Details included in the table are from the sponsor’s Summary of Clinical Evidence.
Baseline Characteristics
A summary of baseline characteristics in the NIH 991265/20010769 study is shown in Table 12. In the GL cohort, most of the patients were female (77.3%) and the mean age was 17.8 years (SD = ||||||| years). Mean baseline hemoglobin A1C was 8.6% (SD = 2.32%) and mean fasting triglyceride levels were 14.5 mmol/L (SD = |||||||| mmol/L).
Most of the patients in the overall PL cohort were also female (97.6%) and the mean age was 34.1 years (SD = ||||||| years). Mean baseline hemoglobin A1C was 8.0% (SD = 2.15%) and mean fasting triglyceride levels were |||| |||||| |||||||, while the specified PL subgroup had baseline hemoglobin A1C of 8.8% (SD = 1.88%) and mean fasting triglyceride levels of |||| |||||| |||||||.
The baseline characteristics outlined in Table 12 are limited to those that are most relevant to this review or were considered as having the greatest effect on the outcomes or interpretation of the study results.
Table 12: Summary of Baseline Characteristics From Studies Included in the Systematic Review
Characteristic | NIH 991265/20010769 study | ||
|---|---|---|---|
GL overall (N = 66) | PL subgroupa (N = 31) | PL overall (N = 41) | |
Sex, n (%) | |||
Male | 15 (22.7) | 1 (3.2) | 1 (2.4) |
Female | 51 (77.3) | 30 (96.8) | 40 (97.6) |
Race or ethnicity, n (%) | |||
Asian | 3 (4.5) | 1 (3.2) | 1 (2.4) |
Black | 16 (24.2) | 0 | 0 |
Caucasian [wording from original source] | 31 (47.0) | 26 (83.9) | 36 (87.8) |
Hispanic | 11 (16.7) | 2 (6.5) | 2 (4.9) |
Native American [wording from original source] | 2 (3.0) | 0 | 0 |
Other | 3 (4.5) | 2 (6.5) | 2 (4.9) |
Age (years), n | 66 | 31 | 41 |
Mean (SD) | 17.8 ||||||| | 37.0 ||||||| | 34.1 ||||||| |
Median | 15 | 38 | 34 |
Range | 1.0 to 68.0 | 15.0 to 64.0 | 10.0 to 64.0 |
< 2 | || |||||| | || |||||| | || |||||| |
≥ 2 to < 6 | || |||||| | || |||||| | || |||||| |
≥ 6 to < 12 | || |||||| | || |||||| | || |||||| |
≥ 12 to < 18 | || |||||| | || |||||| | || |||||| |
≥ 18 | || |||||| | 26 (83.9) | || |||||| |
Lipodystrophy type, n (%) | |||
Acquired | 21 (31.8) | 4 (12.9) | 6 (14.6) |
Congenital or familial | 45 (68.2) | 27 (87.1) | 35 (85.4) |
Fasting leptin (ng/mL), n | || | || | || |
Mean (SD) | ||| |||||| | ||| |||||| | ||| |||||| |
Median | 1.0 | 5.9 | 5.9 |
Range | 0.2 to 5.3 | 1.6 to 16.9 | 1.0 to 16.9 |
Weight category (kg), n (%) | |||
||| || | || |||||| | || |||||| | || |||||| |
||| || | || |||||| | || ||||||| | || |||||| |
BMI (kg/m2), n | || | || | || |
Mean (SD) | |||| |||||| | |||| |||||| | |||| |||||| |
Median | 20.5 | 25.1 | 25.3 |
Range | 14.0 to 29.5 | 18.6 to 33.3 | 17.7 to 33.3 |
Hemoglobin A1C (%), n | || | || | || |
Mean (SD) | 8.6 (2.32) | 8.8 (1.88) | 8.0 (2.15) |
Median | 8.7 | 8.6 | 7.8 |
Min, max | 4.5, 13.7 | 5.7, 13.3 | 4.6, 13.3 |
Hemoglobin A1C (%), n (%) | |||
|||| | || |||||| | ||||| | || |||||| |
≥ 6.5 | 49 (74.2) | 29 (93.5) | 29 (70.7) |
|||| | || |||||| | || |||||| | || |||||| |
≥ 8.0 | 42 (63.6) | 19 (61.3) | 19 (46.3) |
Fasting TG (mmol/L), n | || | || | || |
Mean (SD) | 14.5 ||||||| | |||| ||||||| | |||| ||||||| |
Median | 4.6 | 5.5 | 4.1 |
Min, max | 0.6, 143.3 | 1.2, 109.5 | 1.1, 109.5 |
Fasting TG, n (%) | |||
||||| |||||| | || |||||| | ||||| | |||||| |
≥ 2.26 mmol/L | 50 (75.8) | 27 (87.1) | 34 (82.9) |
||||| || ||||| |||||| | || |||||| | || |||||| | || |||||| |
≥ 5.65 mmol/L | 26 (39.4) | 15 (48.4) | 15 (36.6) |
Fasting glucose (mmol/L), n | 64 | 31 | 41 |
Mean (SD) | |||| |||||| | ||| |||||| | ||| |||||| |
Median | 8.7 | 8.8 | 7 |
Min, max | 3.6, 26.5 | 5.0, 20.4 | 2.7, 20.4 |
Fasting glucose, n (%) | |||
||||| |||||| | || |||||| | |||||| | || |||||| |
||||| || ||||| |||||| | || |||||| | |||||| | |||||| |
||||| |||||| | || |||||| | || |||||| | || |||||| |
ALT, n (%) | |||
|||| | || |||||| | || |||||| | || |||||| |
> ULN | 49 (74.2) | 9 (29.0) | 14 (34.1) |
AST, n (%) | |||
|||| | || |||||| | || |||||| | || |||||| |
> ULN | 36 (54.5) | 7 (22.6) | 10 (24.4) |
ALT = alanine aminotransferase; AST = aspartate aminotransferase; BMI = body mass index; GL = generalized lipodystrophy; max = maximum; min = minimum; NIH = National Institutes of Health; PL = partial lipodystrophy; SD = standard deviation; TG = triglyceride; ULN = upper limit of normal.
aThe PL subgroup includes patients with baseline hemoglobin A1C ≥ 6.5% and/or triglycerides ≥ 5.65 mmol/L.
Source: Study 991265/20010769 Clinical Study Report.39 Details included in the table are from the sponsor’s Summary of Clinical Evidence.
Exposure to Study Treatments
A summary of metreleptin exposure in the NIH 991265/20010769 study is shown in Table 13. The mean overall duration (from first to last dose, including any drug interruptions), in the GL cohort was 62.5 months (SD = 45.66 months), in the overall PL cohort was 48.1 months (SD = 44.14 months), and in the specified PL subgroup was 47.5 months (SD = 47.11 months). The average daily dose was 5.0 mg/day (SD = 3.01 mg/day) in the GL cohort, 8.4 mg/day (2.45 mg/day) in the overall PL cohort, and 8.4 mg/day (2.40 mg/day) in the specified PL subgroup.
Table 13: Summary of Patient Exposure From Studies Included in the Systematic Review
Exposure parameter | NIH 991265/20010769 study | ||
|---|---|---|---|
GL overall (N = 66) | PL subgroupa (N = 31) | PL overall (N = 41) | |
Overall durationb (months), n | 66 | 31 | 41 |
Mean (SD) | 62.5 (45.66) | 47.5 (47.11) | 48.1 (44.14) |
Median | 49.9 | 29.3 | |||| |
Min, max | |||| ||||| | |||| ||||| | |||| ||||| |
Actual durationb (months) | || | || | || |
Mean (SD) | |||| ||||||| | |||| ||||||| | |||| ||||||| |
Median | |||| | |||| | |||| |
Min, max | |||| ||||| | |||| ||||| | |||| ||||| |
Total exposure (patient years) | 328.3 | 121.3 | ||||| |
Dose intensityc (mg/month), n | || | || | || |
Mean (SD) | ||||| ||||||| | ||||| ||||||| | ||||| ||||||| |
Median | ||||| | ||||| | ||||| |
Min, max | ||||| ||||| | |||||| ||||| | |||||| ||||| |
Average daily dosed (mg/day), n | 66 | 31 | 41 |
Mean (SD) | 5.0 (3.01) | 8.4 (2.40) | 8.4 (2.45) |
Median | ||| | 8.1 | ||| |
Min, max | 0.8, 19.0 | |||| |||| | |||| |||| |
Weighted average dose over study periode (mg/kg), n | 66 | 31 | 41 |
Mean (SD) | 0.098 (0.0400) | 0.124 (0.0301) | 0.123 (0.0301) |
Median | ||||| | 0.119 | ||||| |
Min, max | |||||| ||||| | |||||| ||||| | |||||| ||||| |
Weighted average dose over study periode (mg), n | 66 | 31 | 41 |
Mean (SD) | ||| |||||| | ||| |||||| | ||| |||||| |
Median | ||| | ||| | ||| |
Min, max | |||| |||| | |||| |||| | |||| |||| |
Maximum daily dose over study period (mg/kg), n | 66 | 31 | 41 |
Mean (SD) | ||||| |||||||| | ||||| |||||||| | ||||| |||||||| |
Median | ||||| | ||||| | ||||| |
Min, max | |||||| ||||| | |||||| ||||| | |||||| ||||| |
Maximum daily dose over study period (mg), n | 66 | 31 | 41 |
Mean (SD) | ||| |||||| | ||| |||||| | ||| |||||| |
Median | ||| | |||| | |||| |
Min, max | |||| |||| | |||| |||| | |||| |||| |
GL = generalized lipodystrophy; max = maximum; min = minimum; NIH = National Institutes of Health; PL = partial lipodystrophy; SD = standard deviation.
aThe PL subgroup includes patients with baseline hemoglobin A1C ≥ 6.5% and/or triglycerides ≥ 5.65 mmol/L.
bOverall duration is from first to last dose; actual duration excludes drug interruptions.
cDose intensity is the cumulative amount of drug exposure divided by actual treatment duration.
dAverage daily dose is the cumulative amount of drug exposure divided by overall number of planned dosing days.
eWeighted average dose over the study period is the sum of daily doses (in mg/kg or mg) over the overall duration at that dose/regimen divided by the total duration of all dose regimens.
Source: Study 991265/20010769 Clinical Study Report.39 Details included in the table are from the sponsor’s Summary of Clinical Evidence.
A summary of baseline medication use in the NIH 991265/20010769 study is shown in Table 14. Antidiabetic medication use was reported for 80.3% of patients in the GL cohort, 90.2% in the overall PL cohort, and 96.8% in the specified PL subgroup. Lipid-lowering medication use was reported by 51.5% of patients in the GL cohort, 82.9% in the overall PL cohort, and 83.9% in the specified PL subgroup.
Table 14: Baseline Medication Use in NIH 991265/20010769 Study (Safety Analysis Set)
Baseline medication | NIH 991265/20010769 study | ||
|---|---|---|---|
GL overall (N = 66) | PL subgroupa (N = 31) | PL overall (N = 41) | |
Antidiabetic medication,b n (%) | 53 (80.3) | 30 (96.8) | 37 (90.2) |
Any insulin | 39 (59.1) | 17 (54.8) | 20 (48.8) |
Insulin alone | 19 (28.8) | 6 (19.4) | 6 (14.6) |
Insulin plus oral agent | 20 (30.3) | 10 (32.3) | 13 (31.7) |
Oral agent alone | 12 (18.2) | 12 (38.7) | 15 (36.6) |
Oral antidiabetic medications | || |||||| | || |||||| | || |||||| |
|||||||||| | || |||||| | || |||||| | || |||||| |
|||||||||||||||||| | |||| | || |||||| | || |||||| |
||||||||||||| | ||||| | |||||| | |||||| |
Lipid-lowering therapies,b n (%) | 34 (51.5) | 26 (83.9) | 34 (82.9) |
HMG-CoA reductase inhibitors | 11 (16.7) | 12 (38.7) | 13 (31.7) |
Other lipid-modifying agents | 10 (15.2) | 15 (48.4) | 19 (46.3) |
Fibrates | 25 (37.9) | 17 (54.8) | 21 (51.2) |
Other concomitant medications,c n (%) | |||
|||||||||| | |||||| | |||||| | |||||| |
||||||||||||||| |||| | |||||| | |||||| | |||||| |
||||||||| | |||||| | |||||| | |||||| |
||||||||||||| | |||||| | |||||| | |||||| |
||||||||||||||| | |||||| | |||||| | |||||| |
|||||||||||||| | |||||| | |||||| | |||||| |
ATC = anatomic therapeutic class; GL = generalized lipodystrophy; HMG-CoA = 3-hydroxy-3-methyl-glutaryl-coenzyme A; NIH = National Institutes of Health; PL = partial lipodystrophy; WHODD = WHO Drug Dictionary.
aThe PL subgroup includes patients with baseline hemoglobin A1C ≥ 6.5% and/or triglycerides ≥ 5.65 mmol/L.
bTerms across multiple WHODD ATC classes are grouped to provide overall incidence.
cIndividual WHODD preferred terms reported with incidence > 10% in GL or PL groups.
Source: Study 991265/20010769 Clinical Study Report.39
Efficacy
A summary of key efficacy outcomes from the NIH 991265/20010769 study is shown in Table 15.
Change From Baseline in Hemoglobin A1C at 12 Months
Change from baseline in hemoglobin A1C at 12 months for the FAS population is shown in Table 15. In the GL cohort, mean hemoglobin A1C was 8.6% (SD = 2.33%) at baseline and 6.4% (SD = 1.68%) at month 12, for a mean change from baseline of –2.2% (95% CI, –2.7% to –1.6%). Included in the 12-month analysis were 59 of 62 patients in the FAS, with || patients imputed using LOCF. In the overall PL cohort, mean hemoglobin A1C was 7.9% (SD = ||||) at baseline and 7.4% (SD = ||||) at month 12, for a mean change from baseline of –0.6% (95% CI, |||| || ||||). Included in the 12-month analysis were 37 of 40 patients in the FAS, with | patients imputed using LOCF. In the specified PL subgroup, mean hemoglobin A1C was 8.7% (SD = ||||) at baseline and 7.9% (SD = ||||) at month 12, for a mean change from baseline of –0.9% (95% CI, |||| || ||||). Included in the 12-month analysis were 28 of 30 patients in the PL subgroup, with | patients imputed using LOCF.
Sensitivity analyses were conducted using the CFAS population. In the GL cohort (N = 54), the mean change from baseline was –1.9% (95% CI, –2.6% to –1.2%). In the overall PL cohort (N = 31), the mean change from baseline was –0.4% (95% CI, –0.9% to 0.0%). In the specified PL subgroup (N = 23), the mean change from baseline was –0.7% (95% CI, –1.2% to –0.2%).
Table 15: Summary of Key Efficacy Results From Studies Included in the Systematic Review
Parameter statistic | GL | PL | |||
|---|---|---|---|---|---|
Males (N = 15) | Females (N = 47) | Overall (N = 62) | PL subgroupa (N = 30) | Overall (N = 40) | |
Hemoglobin A1C (%) | |||||
Baseline value, n | 15 | |||||| | 62 | 30 | 40 |
Mean (SD) | 8.1 (2.52) | |||||| | 8.6 (2.33) | 8.7 (||||) | 7.9 (||||) |
Median | ||||| | |||||| | |||| | |||| | |||||| |
Min, max | ||| |||| | |||||||| |||| | |||| |||| | |||| |||| | || |||| |
Month 12 value, n | || | || | 59 | 28 | 37 |
Mean (SD) | |||||| | |||||| | 6.4 (1.68) | 7.9 (||||) | 7.4 (||||) |
Median | |||||| | |||||| | |||| | ||| | ||| |
Min, max | |||||||| |||| | |||||||| |||| | |||| |||| | |||| |||| | ||||| |||| |
Actual change from baseline, n | |||||| | |||||| | 59 | 28 | 37 |
Mean (SD) | |||||| | |||||| | –2.2 (2.15) | –0.9 (||||) | –0.6 (||||) |
95% CI | |||||| | |||||| | –2.7 to –1.6 | |||||| ||||| | |||||| ||||| |
P valueb | |||||||| |||| | |||||||| |||| | < 0.001 | < 0.001 | 0.005 |
Fasting TG (mmol/L) | |||||
Baseline value, n | |||||| | |||||| | 61 | || | || |
Mean (SD) | |||||| | |||||| | 14.7 (25.66) | |||||| | |||||| |
Median | |||||| | |||||| | |||||||| ||||| | |||||| | |||||| |
Min, max | |||||| | |||||| | |||||| | |||||| | |
Month 12 value, n | |||||| | |||||| | 58 | |||||| | |||||| |
Mean (SD) | |||||| | |||||| | 4.5 (6.10) | |||||| | |||||| |
Median | |||||| | |||||| | |||| | |||||| | |||||| |
Min, max | |||||| | |||||| | |||| |||| | |||||| | |||||| |
% change from baseline, n | |||||| | |||||| | 57 | |||||| | |||||| |
Mean (SD) | |||||| | |||||| | –32.1 (71.28) | |||||| | |||||| |
95% CI | |||||| | |||||| | –51.0 to –13.2 | |||||| | |||||| |
P valueb | |||||||| |||| | |||||||| |||| | 0.001 | |||||| | |||||| |
Fasting glucose (mmol/L) | |||||
Baseline value, n | |||||| | |||||| | 62 | 30 | 40 |
Mean (SD) | |||||| | |||||| | 10.2 (5.05) | 10.0 (||||) | 8.8 (4.39) |
Median | |||||| | |||||| | ||||| | |||| | ||||| |
Min, max | |||||| | |||||| | ||| |||| | |||| |||| | ||| |||| |
Month 12 value, n | |||||| | |||||| | 59 | 28 | 37 |
Mean (SD) | |||||| | |||||| | 7.0 (3.40) | 8.1 (||||) | 7.5 (3.28) |
Median | |||||| | |||||| | ||||| | |||| | |||| |
Min, max | |||||| | |||||| | ||| |||| | |||| |||| | |||| |||| |
Actual change from baseline, n | |||||| | |||||| | 59 | 28 | 37 |
Mean (SD) | |||||| | |||||| | –3.0 (4.72) | –1.8 (2.83) | –1.2 (2.69) |
95% CI | |||||| | |||||| | –4.2 to –1.7 | –2.9 to –0.7 | –2.1 to –0.3 |
P valueb | |||||| | |||||| | < 0.001 | 0.003 | 0.012 |
% change from baseline, n | |||||| | |||||| | 59 | 28 | 37 |
Mean (SD) | |||||| | |||||| | –19.7 (37.21) | –13.2 (28.99) | –6.1 (29.59) |
95% CI | |||||| | |||||| | –29.4 to –10.0 | –24.4 to –1.9 | –16.0 to 3.8 |
P valueb | |||||||| |||| | |||||||| |||| | < 0.001 | 0.023 | 0.219 |
Liver volume (mL) | |||||
Baseline value, n | |||||| | |||||| | 21 | || | || |
Mean (SD) | |||||| | |||||| | 3,357.7 (1,121.74) | 2,411.7 (731.91) | 2,624.6 (936.21) |
Median | |||||| | |||||| | ||||||| | ||||||||| | ||||||| |
Min, max | |||||| | |||||| | ||||||| |||||| | ||||||| |||||| | ||||||| |||||| |
Change from baseline to month 12, n | |||||| | |||||| | 12 | || | || |
Mean (SD) | |||||| | |||||| | –1,350.9 (||||||) | |||||| |||||| | –376.8 (||||||) |
Median | |||||| | |||||| | ||||||||| | |||||||||||| | ||||||| |
Min, max | |||||| | |||||| | ||||||| |||||| | ||||| |||| | ||||||| |||| |
% change from baseline to month 12, n | |||||| | |||||| | 12 | || | || |
Mean (SD) | |||||| | |||||| | –33.8 (|||||) | –12.4 (||||) | –13.4 (||||) |
Median | |||||| | |||||| | |||||| | |||||| | ||||| |
Min, max | |||||| | |||||| | |||||| ||||| | |||||| ||| | ||||||| ||| |
CI = confidence interval; FAS = full analysis set; GL = generalized lipodystrophy; max = maximum; min = minimum; LOCF = last observation carried forward; PL = partial lipodystrophy; SD = standard deviation; TG = triglyceride.
Note: The LOCF imputation method only includes results that are at least 6 months (180 days) postbaseline.
aThe PL subgroup included patients with baseline hemoglobin A1C ≥ 6.5% and/or triglycerides ≥ 5.65 mmol/L.
bP values computed using paired t tests.
Source: Study 991265/20010769 Clinical Study Report.39
Change From Baseline in Fasting Triglycerides at 12 Months
Change from baseline in fasting triglyceride levels at 12 months for the FAS population is shown in Table 15. In the GL cohort, mean triglyceride level was 14.7 mmol/L (SD = 25.66 mmol/L) at baseline and 4.5 mmol/L (SD = 6.10 mmol/L) at month 12, for a relative mean change from baseline of –32.1% (95% CI, −51.0% to −13.2%). Included in the 12-month analysis were 57 of 62 patients in the FAS, with || patients imputed using LOCF. In the overall PL cohort, mean triglyceride level was |||| |||||| ||||||| at baseline and ||| |||||| at month 12, for a relative mean change from baseline of ||||| |||| ||| ||||| || ||||). Included in the 12-month analysis were 37 of 40 patients in the FAS, with | patients imputed using LOCF. In the specified PL subgroup, mean triglyceride level was |||| |||||| ||||||| at baseline and ||| |||||| ||||||| at month 12, for a mean change from baseline of |||| |||| ||| ||||| || ||||). Included in the 12-month analysis were 28 of 30 patients in the PL subgroup, with ||| patients imputed using LOCF.
Sensitivity analyses were conducted using the CFAS population. In the GL cohort (N = 54), the mean change from baseline was –26.5% (95% CI, –49.7% to –3.3%). In the overall PL cohort (N = 31), the mean change from baseline was –19.2% (95% CI, –42.7% to 4.3%). In the specified PL subgroup (N = 23), the mean change from baseline was –34.0% (95% CI, –49.6% to 4.3%). The sponsor, |||||| ||| |||| ||| || || ||| ||||||| ||||||||, conducted an ad hoc sensitivity analysis, removing 1 patient in the PL cohort who was recorded as patient with noncompliance behaviour. The results of this ad hoc analysis showed a mean change from baseline in triglyceride levels of –20.8% (95% CI, ||||| || ||||) in the PL cohort and –37.4% (95% CI, ||||| || |||||) in the specified PL subgroup.
Change From Baseline in Fasting Glucose at 12 Months
Change from baseline in fasting glucose at 12 months for the FAS population is shown in Table 15. In the GL cohort, mean glucose level was 10.2 mmol/L (SD = 5.05 mmol/L) at baseline and 7.0 mmol/L (SD = 3.40 mmol/L) at month 12, for a relative mean change from baseline of –19.7% (95% CI, –29.4% to –10.0%). Included in the 12-month analysis were 59 of 62 patients in the FAS, with || patients imputed using LOCF. In the overall PL cohort, mean glucose level was 8.8 mmol/L (SD = 4.39 mmol/L) at baseline and 7.5 mmol/L (SD = 3.28 mmol/L) at month 12, for a relative mean change from baseline of –6.1% (95% CI, –16.0% to 3.8%). Included in the 12-month analysis were 37 of 40 patients in the FAS, with |||| patients imputed using LOCF. In the specified PL subgroup, mean glucose level was 10.0 mmol/L (SD = |||| mmol/L) at baseline and 8.1 mmol/L (SD = |||| mmol/L) at month 12, for a relative mean change from baseline of –13.2% (95% CI, –24.4% to –1.9%). Included in the 12-month analysis were 28 of 30 patients in PL subgroup, with | patients imputed using LOCF.
Sensitivity analyses were conducted using the CFAS population. In the GL cohort (N = 54), the mean change from baseline was |||||% (95% CI, ||||| || ||||). In the overall PL cohort (N = 31), the mean change from baseline was ||||| |||| ||| ||||| || ||||). In the specified PL subgroup (N = 23), the mean change from baseline was ||||| |||| ||| ||||| || ||||).
Change From Baseline in Liver Volume at 12 Months
Change from baseline in liver volume at 12 months for the FAS population is shown in Table 15. In the GL cohort (N = 21), mean baseline liver volume was 3,357.7 mL (SD = 1,121.74 mL); the relative mean change from baseline was –33.8% (SD = |||||). In the overall PL cohort (N = 9), mean baseline liver volume was 2,624.6 mL (SD = 936.21 mL); the relative mean change from baseline was –13.4% (SD = ||||). In the specified PL subgroup (N = 8), mean baseline liver volume was 2,411.7 mL (SD = 731.91 mL); the relative mean change from baseline was –12.4% (SD = ||||).
Sensitivity analyses were not conducted using the CFAS population for the liver volume end point.
Harms
Refer to Table 16 for harms data.
Adverse Events
Of the patients in the GL cohort, 59 (89.4%) experienced TEAEs. Of the patients in the PL cohort, 35 (85.4%) experienced TEAEs. The most common AEs in the GL cohort were weight decrease (25.8%), abdominal pain (16.7%), and hypoglycemia (15.2%). The most common AEs in the PL cohort were hypoglycemia (17.1%), abdominal pain (14.6%), and nausea (14.6%).
Serious Adverse Events
In the GL cohort, 23 (34.8%) patients experienced SAEs, with ||||||||| |||| |||||| ||| |||||||||||| |||||| ||| |||| ||||||. In the PL cohort, 10 (24.4%) patients SAEs, with ||||||||| |||| ||||||| |||||||||||| ||||||| ||| |||||||||| |||||| ||| |||| ||||||.
Withdrawals Due to Adverse Events
Five (7.6%) of the patients in the GL cohort and 1 (2.4%) of the patients in the PL cohort experienced TEAEs that resulted in treatment discontinuation.
Mortality
Three (4.5%) of the patients in the GL cohort died, due to renal failure, cardiac arrest, and chronic hepatic failure. One (2.4%) of the patients in the PL cohort died, due to hypoxic-ischemic encephalopathy.
Notable Harms
No notable harms were identified by the clinical experts consulted for this review.
Table 16: Summary of Harms Results From Studies Included in the Systematic Review
Adverse events | NIH 991265/20010769 study | ||
|---|---|---|---|
GL overall (N = 66) | PL subgroupa (N = 31) | PL overall (N = 41) | |
Most common ≥ 5% TEAEs by preferred term, n (%) | |||
Patients with TEAEs | 59 (89.4) | 27 (87.1) | 35 (85.4) |
Weight decrease | 17 (25.8) | 2 (6.5) | 2 (4.9) |
Abdominal pain | 11 (16.7) | 6 (19.4) | 6 (14.6) |
Nausea | 6 (9.1) | 5 (16.1) | 6 (14.6) |
Constipation | 3 (4.5) | 3 (9.7) | 3 (7.3) |
Hypoglycemia | 10 (15.2) | 6 (19.4) | 7 (17.1) |
Decreased appetite | 8 (12.1) | 1 (3.2) | 1 (2.4) |
Headache | 8 (12.1) | 0 | 0 |
Fatigue | 6 (9.1) | 3 (9.7) | 3 (7.3) |
Ear infection | 6 (9.1) | 0 | 0 |
Upper respiratory tract infection | 5 (7.6) | 1 (3.2) | 2 (4.9) |
Arthralgia | 6 (9.1) | 2 (6.5) | 3 (7.3) |
Back pain | 5 (7.6) | 2 (6.5) | 2 (4.9) |
Pain in extremity | ||||| | ||||| | ||||| |
Anxiety | 5 (7.6) | 0 | 1 (2.4) |
Depression | 4 (6.1) | 1 (3.2) | 3 (7.3) |
Ovarian cyst | 5 (7.6) | 0 | 1 (2.4) |
Alopecia | 3 (4.5) | 3 (9.7) | 3 (7.3) |
SAEs reported among ≥ 1 patient by preferred term, n (%) | |||
Patients with ≥ 1 SAE | 23 (34.8) | 7 (22.6) | 10 (24.4) |
||||||||| |||| | ||||| | ||||| | ||||| |
||||||||||| | ||||| | ||||| | ||||| |
||||||||| | ||||| | ||||| | ||||| |
|||||| | ||||| | ||||| | ||||| |
||||| |||||||| | ||||| | ||||| | ||||| |
||||||| ||||||| | ||||| | ||||| | ||||| |
|||||||||| | ||||| | ||||| | ||||| |
Patients who stopped treatment due to adverse events, n (%) | |||
Patients with TEAEs leading to discontinuation | 5 (7.6) | 1 (3.2) | 1 (2.4) |
|||||||| |||||||| |||||||||| ||||||| | ||||| | ||||| | ||||| |
||||| ||||||||||||| ||||||||| | ||||| | ||||| | ||||| |
|||||||||||||||| |||||||||||||| | ||||| | ||||| | ||||| |
||||| ||||||| | ||||| | ||||| | ||||| |
|||||||||| |||||| |||||||| ||||||||||| | ||||| | ||||| | ||||| |
||||||| ||||||| ||||||| | ||||| | ||||| | ||||| |
||||||| |||||| | ||||| | ||||| | ||||| |
Deaths, n (%) | |||
Patients who died | 3 (4.5) | 1 (3.2) | 1 (2.4) |
Renal failure | 1 (1.5) | 0 | 0 |
Cardiac arrest | 1 (1.5) | 0 | 0 |
Chronic hepatic failure | 1 (1.5) | 0 | 0 |
Hypoxic-ischemic encephalopathy | 0 | 1 (3.2) | 1 (2.4) |
GL = generalized lipodystrophy; NIH = National Institutes of Health; PL = partial lipodystrophy; SAE = serious adverse event; TEAE = treatment-emergent adverse event.
Source: Study 991265/20010769 Clinical Study Report.39 Details included in the table are from the sponsor’s Summary of Clinical Evidence.
Pubertal Status
Pubertal status was assessed as a safety evaluation in the NIH 991265/20010769 study. There were 27 patients with GL younger than 18 years and 6 patients with PL (33 patients total) younger than 18 years with pubertal status assessed at baseline. Of these 33 patients, 26 had complete, near complete, or likely complete puberty. Of the remaining 7 patients (all with GL), 4 had delayed puberty before metreleptin treatment and 3 had precocious puberty. Follow-up was available for 3 of the patients with delayed puberty, 2 of whom experienced normal development while receiving metreleptin while 1 continued to have delayed puberty.
Endocrine Abnormalities
For 10 female patients in the NIH 991265/20010769 study, luteinizing hormone responses to luteinizing hormone–releasing hormone were noted as being more robust with metreleptin therapy, particularly for the 3 youngest patients. Of the 10 female patients, 8 had amenorrhea before therapy and all 8 developed normal menses after metreleptin therapy initiation.40
Critical Appraisal
Internal Validity
The NIH 991265/20010769 study, the pivotal trial submitted by the sponsor, was a phase II/III, single-arm, open-label clinical trial. The lack of comparative data is a key limitation to the interpretation of the results from a single-arm trial, as it is difficult to distinguish between the effect of the intervention relative to a placebo effect, or the effect of natural history. It is acknowledged that there may be practical limitations to conducting an RCT of patients with lipodystrophy due to the rarity of the condition. However, while this provides context to the decision to conduct a single-arm trial, the limitations to the interpretation of the results remain. The open-label nature of the trial also increases the risk of bias. However, the study end points are objective laboratory values and therefore unlikely to have been influenced by this bias. Harms outcomes, however, may be impacted by the open-label design of the study.
When assessing the efficacy end points in the NIH 991265/20010769 study, the large number of drop-outs and missing data, due to the challenges of conducting a clinical study at the NIH that included international participants, must be taken into account. The co-primary end points of change from baseline in hemoglobin A1C and triglyceride levels were to be assessed at month 12. The statistical plan allowed for patients with missing data at month 12 to carry forward, according to LOCF methodology, if data from month 6 onwards were available. The clinical experts consulted by CADTH considered this to be a reasonable method to account for missing data given that most responses should be apparent in the laboratory findings by month 6. Despite this methodology to account for missing data, only 59 of 66 patients with GL and 37 of 41 patients with PL who received metreleptin were included in the change from baseline in hemoglobin A1C results and 57 of 66 patients with GL and 37 of 41 patients with PL who received metreleptin were included in the change from baseline in triglyceride results. The number of patients available for analysis at the 12-month time point was reduced because no measurements were available from 6 months onward. This analysis did not follow the intention-to-treat philosophy and likely overestimated the treatment effect. An additional impact of imputation methodology allowing results from 6 months onwards is the likely reduction in imprecision. It is likely that results after 12 months would be more variable than results after 6 months given the additional time available for treatment to improve laboratory measurements or wane in efficacy. In particular, data for ||% of the patients with GL included in the hemoglobin A1C end point were imputed as were data for ||% of the patients in the PL subgroup. As such, the 95% CIs presented are likely artificially narrow. Most notably, in the change from baseline in liver volume results, only 12 patients with GL and 8 patients with PL were included in the results because no imputation methodology was used for this end point. Therefore, any conclusions drawn from the change from baseline results are likely to be uninformative.
Statistical hypothesis testing was performed on the primary efficacy end point with all tests conducted at the 2-sided, 0.05 level of significance. It was noted that for the trial to be considered positive, both end points had to reach statistical significance, removing the need to adjust for multiplicity. However, multiple interim analyses were conducted with no reports of methodology changes that adjusted for the increased risk of type I error associated with interim analyses. In addition, it must be acknowledged that a statistically significant change from baseline in triglyceride levels in the PL cohort occurred only on the removal from the analysis of patient with noncompliance behaviour .
Given the possibility for concomitant medications to have an impact on end points, particularly in this disease area, the NIH 991265/20010769 study included a sensitivity analysis using the concomitant therapy–controlled population. In this analysis, only those patients who did not increase concomitant therapy use for a given end point (i.e., increase in antidiabetic therapies for the hemoglobin A1C end point) were included in the analysis. This removed proportionally more patients from the PL cohort than from the GL cohort, with results generally consistent with the primary analysis. BOCF and WOCF sensitivity analyses were also presented by the sponsor (data not reported in this report), in addition to the primary analysis of LOCF, to assess the impact of missing data on the end points of interest. The results of these sensitivity analyses were generally consistent with the primary analysis. It is noted that alternative assessments of the impact of missing data (such as using multiple imputation, assessments for data not missing at random) were not performed.
External Validity
The NIH 991265/20010769 study began to enrol patients in July 2000. As this was 23 years before the writing of this report, the clinical experts suggested that standards of therapy and patient support may have evolved since then. However, the clinical benefit of metreleptin is anticipated to be consistent with that observed in the NIH 991265/20010769 study. Lipodystrophy is a chronic disease and patients would be expected to receive treatment for life if experiencing benefit. The generalizability of the results beyond the 14-yrear follow-up of the NIH 991265/20010769 study is unknown, although the clinical experts consulted by CADTH did not expect the efficacy of metreleptin to change beyond the time horizon of the NIH 991265/20010769 study. The clinical experts consulted considered the patient characteristics from the NIH 991265/20010769 study to be broadly generalizable to that of the expected patient population in Canada.
GRADE Summary of Findings and Certainty of the Evidence
Methods for Assessing the Certainty of the Evidence
For pivotal studies and RCTs identified in the sponsor’s systematic review, GRADE was used to assess the certainty of the evidence for outcomes considered most relevant to informing CADTH’s expert committee deliberations, and a final certainty rating was determined as outlined by the GRADE Working Group:41,42
High certainty: We are very confident that the true effect lies close to that of the estimate of the effect.
Moderate certainty: We are moderately confident in the effect estimate – the true effect is likely to be close to the estimate of the effect, but there is a possibility that it is substantially different. We use the word “likely” for evidence of moderate certainty (e.g., “X intervention likely results in Y outcome”).
Low certainty: Our confidence in the effect estimate is limited – the true effect may be substantially different from the estimate of the effect. We use the word “may” for evidence of low certainty (e.g., “X intervention may result in Y outcome”).
Very low certainty: We have very little confidence in the effect estimate – the true effect is likely to be substantially different from the estimate of effect. We describe evidence of very low certainty as “very uncertain.”
For single-arm trials: Although GRADE guidance is not available for noncomparative studies, the CADTH review team assessed pivotal single-arm trials for study limitations (which refers to internal validity or risk of bias), inconsistency across studies, indirectness, imprecision of effects, and publication bias to present these important considerations. Because the lack of a comparator arm does not allow for a conclusion to be drawn on the effect of the intervention versus any comparator, the certainty of evidence for single-arm trials starts at very low and there is no opportunity for rating up.
When possible, certainty was rated in the context of the presence of an important (nontrivial) treatment effect; if this was not possible, certainty was rated in the context of the presence of any treatment effect (i.e., the clinical importance is unclear). In all cases, the target of the certainty of evidence assessment was based on the point estimate and where it was located relative to the threshold for a clinically important effect (when a threshold was available) or to the null.
Results of GRADE Assessments
Table 2 shows the GRADE summary of findings for metreleptin.
Indirect Evidence
Contents within this section have been informed by materials submitted by the sponsor. The following has been summarized and validated by the CADTH review team.
Objectives for the Summary of Supportive Analyses
As the pivotal NIH 991265/20010769 study was a single-arm study, no head-to-head efficacy data are available for metreleptin compared to supportive care for patients with lipodystrophy. To provide further context for the relative efficacy of metreleptin to supportive care, and to support the pharmacoeconomic model for metreleptin, the sponsor identified 2 supportive analyses estimating the relative effects of metreleptin compared to supportive care for patients with lipodystrophy.6,23
Description of Supportive Analyses
One unpublished supportive analysis was conducted to estimate the comparative treatment effect of metreleptin with or without supportive care compared to supportive care alone using an IPW and multivariate regression methods to adjust for differences between patients from the NIH follow-up study and an observational study of patients with GL and PL on supportive care alone.23
One published supportive analysis by Cook et al. (2021) estimated the effect of metreleptin treatment on mortality among patients with GL or PL using a Cox proportional hazards model to control for differences between patients receiving metreleptin treatment and those who have no experience of metreleptin.6
The study selection criteria for each supportive analysis are shown in Table 17.
Table 17: Study Selection Criteria and Methods for Supportive Analyses Submitted by the Sponsor
Characteristics | Unpublished supportive analysis | Cook et al. (2021) study |
|---|---|---|
Population |
| Not reported |
Intervention/comparators |
| Not reported |
Outcome |
| Not reported |
Study designs |
| Not reported |
Publication characteristics |
| Not reported |
Exclusion criteria |
| Not reported |
Databases searched |
| Not reported |
Selection process |
| Not reported |
Data extraction process |
| Data from medical records of patients who received metreleptin treatment were extracted using a Microsoft Excel-based data collection form, while data from medical records of patients with no experience with metreleptin were extracted and entered into internet-based case report forms by local staff at each treatment centre. Data extraction focused on capturing abnormalities related to metabolic complications associated with lipodystrophy (e.g., insulin resistance, diabetes, dyslipidemia, hepatic steatosis) rather than an exhaustive set of medical conditions in each patient. |
Quality assessment | Not reported | Not reported |
DPP = dipeptidyl peptidase; EASD = European Association for the Study of Diabetes; ECE = European Conference of Endocrinology; ESPE = European Society for Pediatric Oncology; PES = Pediatric Endocrine Society; GL = generalized lipodystrophy; GLP-1 = glucagon-like peptide-1 receptor; IPD = individual patient-level data; PL = partial lipodystrophy; NIH = National Institutes of Health; SGLT = sodium-glucose cotransporter.
Sources: Sponsor-submitted Indirect Treatment Comparison Technical Report;43 Cook et al. (2021).44 Details included in the table are from the sponsor’s Summary of Clinical Evidence.
Supportive Analysis Design
Study Selection Methods
Unpublished Supportive Analysis
The NIH follow-up study extended the NIH 991265/20010769 study by undertaking a chart review to collect long-term data and additional outcomes for patients with lipodystrophy who received metreleptin therapy at the NIH. The study is based on the participants in the original NIH 991265/20010769 study. These long-term data from the NIH follow-up study were used for the metreleptin data in the supportive analysis where individual patient-level data were available.
The systematic literature review identified 36 observational studies with participants who were not receiving metreleptin treatment and were receiving supportive care. The key relevant study identified, the GL and PL natural history study, was an observational chart review study of participants who had not received metreleptin treatment. As individual patient-level data were available for both studies, this supported the use of methods selecting observables to minimize bias to average treatment effect (ATE) of metreleptin with or without supportive care compared to supportive care alone.
Cook et al. (2021) Study
No systematic review to inform study selection was reported in published Cook et al. (2021) study. The study included a retrospective chart review of participants enrolled in the NIH 991265/20010769 study; 7 participants who met the eligibility criteria for the NIH 991265/20010769 study enrolled in a parallel nonrandomized study evaluating metreleptin.33 A retrospective chart review of 230 patients with metreleptin-naive lipodystrophy from Brazil, Turkey, and the US was used as the comparator population.7
Supportive Analyses Methods
Unpublished Supportive Analysis
The IPW uses the propensity score function, which is a function of a set of observed covariates. Each participant’s weighting is equal to the inverse of the probability of receiving metreleptin, given the person’s certain characteristics. As the IPW uses the inverse of the probability of treatment assignment to weight outcomes, the ATE corresponds to the difference in these weighted means. Due to the relatively small sample size in the hemoglobin A1C outcome of the supportive care alone arm compared to the metreleptin with or without supportive care arm, stabilized IPW was used to avoid excessively high weights in the supportive care arm.
An ATE was calculated using linear models for continuous outcomes (change in hemoglobin A1C, triglycerides, alanine aminotransferase [ALT], and aspartate aminotransferase [AST] from baseline to month 12), generalized linear models for categorical outcomes (incidence of pancreatitis), and Cox proportional hazards models for time-to-event outcomes (all-cause mortality), using the propensity score weights as a link function. For continuous outcomes, the ATE was estimated by the weighted mean difference between the 2 groups, where the inverse of the probability of treatment assignment was used to weight outcomes. For categorical outcomes, the ATE was estimated by the odds ratio using the exponential of the coefficient of treatment assignment. For time-to-event outcomes, the ATE was estimated by the HR using the exponential of the coefficient of treatment assignment. Robust SEs were calculated using a robust sandwich estimator to take into account that the IPW uses weighted data.
Potential sensitivity analyses were considered, including the addition of extra covariates (history of baseline elevated hemoglobin A1C and elevated triglycerides, baseline leptin levels, and baseline pancreatitis) and subgroups (patients with GL and PL for whom supportive care failed). These sensitivity analyses were not deemed feasible due to the extent of the missing data in the GL and PL natural history study, alongside the limited number of mortality and pancreatitis events across the studies.
The covariates in the model, which were validated by clinical expert opinion, included sex, age at baseline, and lipodystrophy type. A variety of additional covariates were considered for inclusion in the propensity score model, but they were not deemed feasible due to the extent of missing data in the GL and PL natural history study.
Cook et al. (2021) Study
To adjust for patient characteristic differences between the participants with no experience with metreleptin treatment and those who had received metreleptin treatment, balanced risk set–matching was used to match participants in both groups in terms of similarity in age, sex, lipodystrophy diagnosis type, number of organs (heart, kidney, or liver) with an observed abnormality, and presence of elevated hemoglobin A1C levels (≥ 6.5%) at treatment initiation. Pancreatitis was not used as a matching criterion due to the large imbalance between the cohort of patients with no experience with metreleptin treatment and of patients who received metreleptin treatment.
A Mahalanobis distance calculation was conducted to determine the optimal index date for the metreleptin-naive population. The Mahalanobis distance was calculated for all possible monthly index dates for the metreleptin-naive population with a lower Mahalanobis distance indicating a closer match across selected patient characteristics. Participants were followed until the date of data abstraction or until loss to follow-up or death. A participant with no experience of metreleptin could be matched to only 1 participant who received metreleptin treatment to reduce the possibility of 1 person having an outsized impact on the analyses. Participants with no experience of metreleptin were also required to have at least 6 months of follow-up from the selected index date.
Primary analysis was assessed in the combined populations of GL and PL for patients with no experience of metreleptin treatment and those who received metreleptin treatment, with a subgroup analysis conducted in the GL population alone. The ATE of metreleptin on mortality was estimated by comparing the outcome of a metreleptin-treated cohort with that of matched metreleptin-naive cohort. Kaplan-Meier survival analysis was used to estimate mean time-to-mortality from treatment initiation for patients who received metreleptin treatment and from the index observation date for matched patients with no experience with metreleptin treatment. A log-rank test was conducted to compare time-to-mortality between the 2 cohorts.
A Cox proportional hazards model that controlled for treatment status, lipodystrophy diagnosis (GL or PL), age, triglyceride levels, hemoglobin A1C levels at 6.5% or greater, 1 or more episodes of pancreatitis, and abnormalities observed in the heart or kidneys at the time of treatment initiation or index date was used. A comparison of analysis methods is shown in Table 18.
Table 18: Supportive Analyses Methods
Methods | Unpublished supportive analysis | Cook et al. (2021) study |
|---|---|---|
Analysis methods |
|
|
Outcomes |
|
|
Adjustment variables |
|
|
Follow-up time points |
|
|
Sensitivity analyses |
|
|
Subgroup analysis | NA | Participants with GL |
ALT = alanine aminotransferase; AST = aspartate aminotransferase; GL = generalized lipodystrophy; NA = not applicable.
Sources: Sponsor-submitted Indirect Treatment Comparison Technical Report;43 Cook et al. (2021).44 Details included in the table are from the sponsor’s Summary of Clinical Evidence.
Results of Supportive Analyses
Summary of Included Studies
Unpublished Supportive Analysis
An assessment of homogeneity for the sponsor-submitted unpublished supportive analysis is shown in Table 19.
Cook et al. (2021) Study
An assessment of homogeneity for the Cook et al. (2021) supportive analysis is shown in Table 20.
Results
Unpublished Supportive Analysis
A description of the covariates before and after IPW for each analyzed outcome is shown in Table 21. After weighting, covariates were broadly balanced. The biggest difference after weighting was in the mortality outcome; death occurred among 24.7% of the male patients in the supportive care arm compared to 19.4% of the male patients in the metreleptin with or without supportive care arm.
Table 19: Assessment of Homogeneity for Unpublished Supportive Analysis
Characteristics | Description and handling of potential effect modifiers |
|---|---|
Disease severity | Patients in the NIH follow-up study generally had higher levels of indicators of lipodystrophy severity, such as increased leptin levels, and a greater proportion had pancreatitis. This led to difficulties when comparing outcomes between the studies, as naive analyses do not consider this severity and are thus likely to underestimate the ATE of metreleptin. Thus, the estimate of the ATE for metreleptin tried to adjust for this severity. |
Trial eligibility criteria | Both studies recruited patients with lipodystrophy including GL and PL. |
Observation period | Not reported |
Study time frame | The duration of the study time frames differed considerably with the GL and PL natural history study lasting longer. Significant changes in supportive care could be expected over this time frame, which is a further limitation of the analysis. However, the overlap between the NIH follow-up study and the GL and PL natural history study was from 2000 to 2017, which would better reflect current clinical practice than the years before 2000. |
Study design | Both studies involved retrospective chart reviews, for which patient-level data were available. |
ATE = average treatment effect; GL = generalized lipodystrophy; NIH = National Institutes of Health; PL = partial lipodystrophy.
Source: Sponsor-submitted Indirect Treatment Comparison Technical Report.43 Details included in the table are from the sponsor’s Summary of Clinical Evidence.
Table 20: Assessment of Homogeneity for Cook et al. (2021)
Characteristics | Description and handling of potential effect modifiers |
|---|---|
Disease severity | Nearly all the observed differences between the metreleptin-treated and metreleptin-naive cohorts were statistically significant before matching (P < 0.05 for all). Compared with patients who received metreleptin treatment, those who had no experience with metreleptin treatment were older when their lipodystrophy symptoms were first recorded, more likely to be male than female, less likely to be diagnosed with GL, and less likely to have a severe metabolic phenotype. Demographic characteristics such as age and sex were balanced after matching. Unbalanced characteristics that remained after matching were all clinical in nature, and the direction of imbalance was suggestive of greater disease severity in the metreleptin-treated cohort. |
Trial eligibility criteria | Trial eligibility criteria were similar. Patients receiving metreleptin treatment had clinically significant non–HIV-related lipodystrophy as well as low leptin levels, diabetes, elevated insulin, and/or elevated triglycerides. Patients with a diagnosis of non–HIV-related GL or PL and who had no experience with metreleptin treatment were also eligible for inclusion. |
Observation period | Data from patients receiving metreleptin treatment were available from the date of study enrolment until death or censoring. Similarly, the observation period for patients with no experience with metreleptin treatment was defined as the time period from birth until the date of data abstraction or until loss to follow-up or death. Patients were also required to have at least 1 year of follow-up after the date of their lipodystrophy diagnosis. |
Study time frame | There was substantial overlap in the period of enrolment for the patients who received metreleptin treatment and those with no experience with metreleptin treatment. |
Study design | Data from patients receiving metreleptin treatment were mostly (105 patients) obtained retrospectively from a single-arm clinical trial conducted at the NIH (7 patients were enrolled in a nonrandomized parallel group study to evaluate the short-term effects of metreleptin initiation or withdrawal). Retrospective data for patients with no experience with metreleptin treatment were similarly obtained from a natural history study of lipodystrophy based on medical records of 230 patients obtained from centres in Brazil, Turkey, and the US. |
GL = generalized lipodystrophy; NIH = National Institutes of Health; PL = partial lipodystrophy.
Sources: Cook et al. (2021).44 Details included in the table are from the sponsor’s Summary of Clinical Evidence.
Table 21: Covariates Used in Comparison of Effects of Metreleptin With or Without SC Versus SC Alone Before and After IPW
Characteristic | Unweighted | Weighted | ||
|---|---|---|---|---|
SC | Metreleptin with or without SC | SC | Metreleptin with or without SC | |
Change in hemoglobin A1C | ||||
N | 21 | 101 | NAa | NAa |
Age (years), mean (SD) | 38.91 (15.93) | 28.91 (15.92) | ||||| ||||||| | ||||| ||||||| |
Male, n (%) | 5 (23.81) | 16 (15.84) | |||| ||||||| | |||| ||||||| |
Partial LD type, n (%) | 18 (85.71) | 39 (38.61) | |||| ||||||| | |||| ||||||| |
Change in triglycerides | ||||
N | 46 | 101 | NAb | NAb |
Age (years), mean (SD) | 26.68 (19.49) | 24.23 (15.42) | 24.18 (20.43) | 25.42 (15.61) |
Male, n (%) | 12 (26.0) | 16 (15.84) | 24.9 (16.6) | 25.2 (17.3) |
Partial LD type, n (%) | 33 (71.74) | 39 (38.61) | 71.6 (47.8) | 70.3 (48.3) |
Mortality | ||||
N | 228 | 106 | NAc | NAc |
Age (years), mean (SD) | 26.21 (18.37) | 24.21 (15.18) | 25.63 (18.55) | 25.33 (15.17) |
Male, n (%) | 68 (29.82) | 16 (15.09) | 82.9 (24.7) | 62.5 (19.4) |
Partial LD type, n (%) | 149 (63.35) | 41 (38.68) | 190.0 (56.6) | 176.6 (54.8) |
IPW = inverse probability weighting; LD = lipodystrophy; NA = not available; SD = standard deviation; SC = supportive care.
aWhile reported as N values, the weighted sample sizes are not true sample sizes and should be interpreted with caution. Weighted sample sizes: SC, N = 125; metreleptin with or without SC, N = 121.
bWhile reported as N values, the weighted sample sizes are not true sample sizes and should be interpreted with caution. Weighted sample sizes: SC, N = 150; metreleptin with or without SC, N = 145.
cWhile reported as N values, the weighted sample sizes are not true sample sizes and should be interpreted with caution. Weighted sample sizes: SC, N = 335; metreleptin with or without SC, N = 322.
Sources: Sponsor-submitted Indirect Treatment Comparison Technical Report.43 Details included in the table are from the sponsor’s Summary of Clinical Evidence.
Table 22: IPW Efficacy Results for Metreleptin With or Without SC Versus SC Alone
Efficacy | ATE of metreleptin with or without SC vs. SC alone |
|---|---|
Mean change in hemoglobin A1C | |
Coefficient (mean hemoglobin A1C, %) | ||||||||||||||||| ||||||||| |
Standard error | ||||||||||||||||| ||||||||| |
95% CI | ||||||||||||||||| ||||||||| |
P value | ||||||||||||||||| ||||||||| |
Mean change in triglycerides | |
Coefficient (triglycerides, mg/dL [mmol/L]) | |||||||||||||||||||| ||||||||| |
Standard error | |||||||||||||||||||| ||||||||| |
95% CI | |||||||||||||||||||| ||||||||| |
P value | |||||||||||||||||||| ||||||||| |
All-cause mortality | |
Coefficient | |||||||||||||||||||| ||||||||| |
Hazard ratio | |||||||||||||||||||| ||||||||| |
Standard error | |||||||||||||||||||| ||||||||| |
95% CI | |||||||||||||||||||| ||||||||| |
P value | |||||||||||||||||||| ||||||||| |
ATE = average treatment effect; CI = confidence interval; IPW = inverse probability weighting; SC = supportive care; vs. = versus.
aDenotes significance at the P < 0.05 level.
Source: Sponsor-submitted Indirect Treatment Comparison Technical Report.43 Details included in the table are from the sponsor’s Summary of Clinical Evidence.
Results of the IPW analysis from the sponsor-submitted unpublished supportive analysis are shown in Table 22. The mean change in hemoglobin A1C was |||||| |||| ||| ||||| || |||||. An alternative stabilized IPW analysis was conducted to account for large weights being allocated to a small number of patients in the supportive care alone arm. This analysis yielded a mean change in hemoglobin A1C of –1.52% (95% CI, –2.28 to –0.77; P < 0.001).
Cook et al. (2021) Study
A summary of the characteristics of patients in the metreleptin-treated cohort and those in the metreleptin-naive cohort prematching and postmatching is shown in Table 23.
In the metreleptin-treated cohort, 11 patients with GL and 1 patient with PL (the patient had FPLD) died. In the matched metreleptin-naive cohort, 9 patients with GL and 3 patients with PL died. Figure 1 shows the Kaplan-Meier curve for time-to-mortality in the 2 populations (log-rank test P value = 0.2). The Kaplan-Meier curve from the Cox proportional hazards model, adjusted for selected covariates, is shown in Figure 2. The HR was 0.35 (95% CI, 0.134 to 0.900; P = 0.029).
Mortality risk of patients receiving metreleptin treatment and patients with no experience with metreleptin treatment in the GL subgroup were described using Kaplan-Meier analysis (log-rank test P = 0.6). The Cox proportional hazards model resulted in an HR of 0.455 (95% CI, 0.150 to 1.387; P = 0.166).
Critical Appraisal of Unpublished Supportive Analysis
The unpublished supportive analysis submitted by the sponsor was designed as a comparison of a prospective single-arm (NIH 991265/20010769) study compared against retrospective chart review. Data from retrospective chart reviews can have a number of confounding factors both in reported characteristics and unreported characteristics that may bias the results. Retrospective chart review analysis also tends to have a high amount of missing or unreliable data. In the case of the sponsor-provided unpublished supportive analysis, missing data resulted in a low sample size for outcomes such as change from baseline in hemoglobin A1C. This resulted in a small number of patients in the supportive care population being heavily weighted and in an imprecise 95% CI. The sponsor conducted a stabilized IPW to account for this, resulting in a significant benefit in favour of metreleptin in this end point; however, the ad hoc nature introduces bias and likely overestimates the true effect for this analysis since the ability to account for patient differences is more limited compared to the primary analysis.
Table 23: Patient Demographic and Clinical Characteristics Prematching and Postmatching (Overall Cohort)
Characteristic | Metreleptin treated (N = 103) | Prematching metreleptin naive (N = 230) | Matched metreleptin naive (N = 103) |
|---|---|---|---|
Age at first symptoms (years), mean (SD) | 13.8 (11.5) | 19.2 (16.5)a | 15.0 (14) |
Age at start of treatment or index observation date (years), mean (SD) | 24.7 (15.7) | 21.2b (5.94) | 25.3 (17.1) |
Male, % | 15.5 | 30.4a | 21.4 |
Diagnosis of GL, % | 60.2 | 35.2a | 60.2 |
GL or PL subtype,c % | |||
AGL | 12.6 | 3.0a | 3.9b |
CGLd | 42.7 | 31.3 | 55.3 |
Generalized progeroid lipodystrophy | 4.9 | 0.9 | 1.0 |
APL | 2.9 | 12.2b | 2.9 |
FPLDe | 36.9 | 52.6b | 36.9 |
Clinical characteristics at start of treatment or index observation date:f | |||
Elevated hemoglobin A1C (≥ 6.5%), % | 78.6 | 24.3a | 60.2a |
Triglyceride levels (mg/dL),c mean (SD) | 1,304 (2,180) | 472a (785) | 486a (592) |
Experienced ≥ 1 episode of pancreatitis,c n (%) | 40.8 | 3.91a | 10.7a |
Organs among heart, liver, and kidneys with observed abnormalities, mean (SD) | 2.049 (0.797) | 0.613a (0.893) | 1.650a (0.871) |
Heart, % | 46.6 | 8.26a | 29.1a |
Liver, % | 92.2 | 35.7a | 83.5 |
Kidneys, % | 66.0 | 17.4a | 52.4b |
Patients with record of triglyceride levels, n | 102 | 103g | 82g |
Patients with record of hemoglobin A1C levels, n | 103 | 118g | 77g |
AGL = acquired generalized lipodystrophy; CGL = congenital generalized lipodystrophy; FPLD = familial partial lipodystrophy; GL = generalized lipodystrophy; NA = not applicable; SD = standard deviation.
aP < 0.01 compared with metreleptin-treated cohort.
bP < 0.05 compared with metreleptin-treated cohort.
cGL and PL subtypes, triglyceride levels, and pancreatitis were not used as matching parameters for the metreleptin-naive cohort.
dPatients with mutations in AGPAT2 were the most common (n = 26 in metreleptin-treated cohort; n = 22 in matched metreleptin-naive cohort), followed by those with mutations in BSCL2 (n = 15 in metreleptin-treated cohort; n = 15 in matched metreleptin-naive cohort). The metreleptin-treated cohort also included 2 patients with CGL with other mutations, and 1 patient with CGL whose genetic testing data were either missing or a mutation could not be confirmed. The matched metreleptin-naive cohort also included 2 patients with PTRF4 mutations, 2 patients with CGL with other mutations, and 16 patients with CGL whose genetic testing data were either missing or a mutation could not be confirmed.
ePatients with mutations in LMNA were the most common (n = 20 in metreleptin-treated cohort; n = 25 in matched metreleptin-naive cohort), followed by those with mutations in PPARG (n = 8 in metreleptin-treated cohort; n = 3 in matched metreleptin-naive cohort). The metreleptin-treated cohort also had 1 patient with FPLD with a mutation in PCYT1A and 9 patients with FPLD whose genetic testing data were either missing or a mutation could not be confirmed. The matched metreleptin-naive cohort also included 3 patients with Köbberling type FPLD, 5 patients with FPLD who had other mutations, and 2 patients with FPLD whose genetic testing data were either missing or a mutation could not be confirmed.
fIndex observation date for the prematching metreleptin-naive cohort was defined as the time at which patients with no experience with metreleptin treatment achieved the mean age at the start of treatment of patients receiving metreleptin treatment (24.7 years) or the date of their last available observation, whichever came first.
gCounts only include patients who have laboratory measurements taken on or after their index observation date.
Source: Cook et al. (2021). Copyright Cook et al. (2021). Reprinted in accordance with Creative Commons Attribution-NonCommercial-NoDerivs licence (CC BY-NC-ND 4.0 DEED): https://creativecommons.org/licenses/by-nc-nd/4.0/.6
The high amount of missing data in the retrospective chart review impacted the ability to control for important covariates in the IPW. Only 3 covariates were included: age, sex, and lipodystrophy type. Important variables such as baseline level of hemoglobin A1C and triglycerides could not be included, further reducing the reliability of the results. Clinical experts consulted by CADTH did not consider the list of included covariates to be sufficient for capturing the prognostic factors and treatment-effect modifiers important for patients with lipodystrophy. It is noted that these 2 variables were included as preplanned sensitivity analyses but deemed infeasible due to missing data. Further to the issue of missing data, population characteristics of these important variables were not presented for any patients included in the historical control arm of the analysis. The details of the standard-of-care therapies received by the historical control arm are also unknown, further increasing the uncertainty of the presented results, particularly when considering the retrospective chart review began in the year 1960.
The variables that were included in the IPW were mostly well balanced, although the low starting sample sizes for the supportive care population (N = 46 in unweighted population for the triglyceride level outcome) suggests that a few patients were very heavily weighted in the analysis.
Figure 1: Mortality Risk for Patients Receiving Metreleptin Treatment Versus Matched Patients With No Experience With Metreleptin Treatment (Overall Cohort)
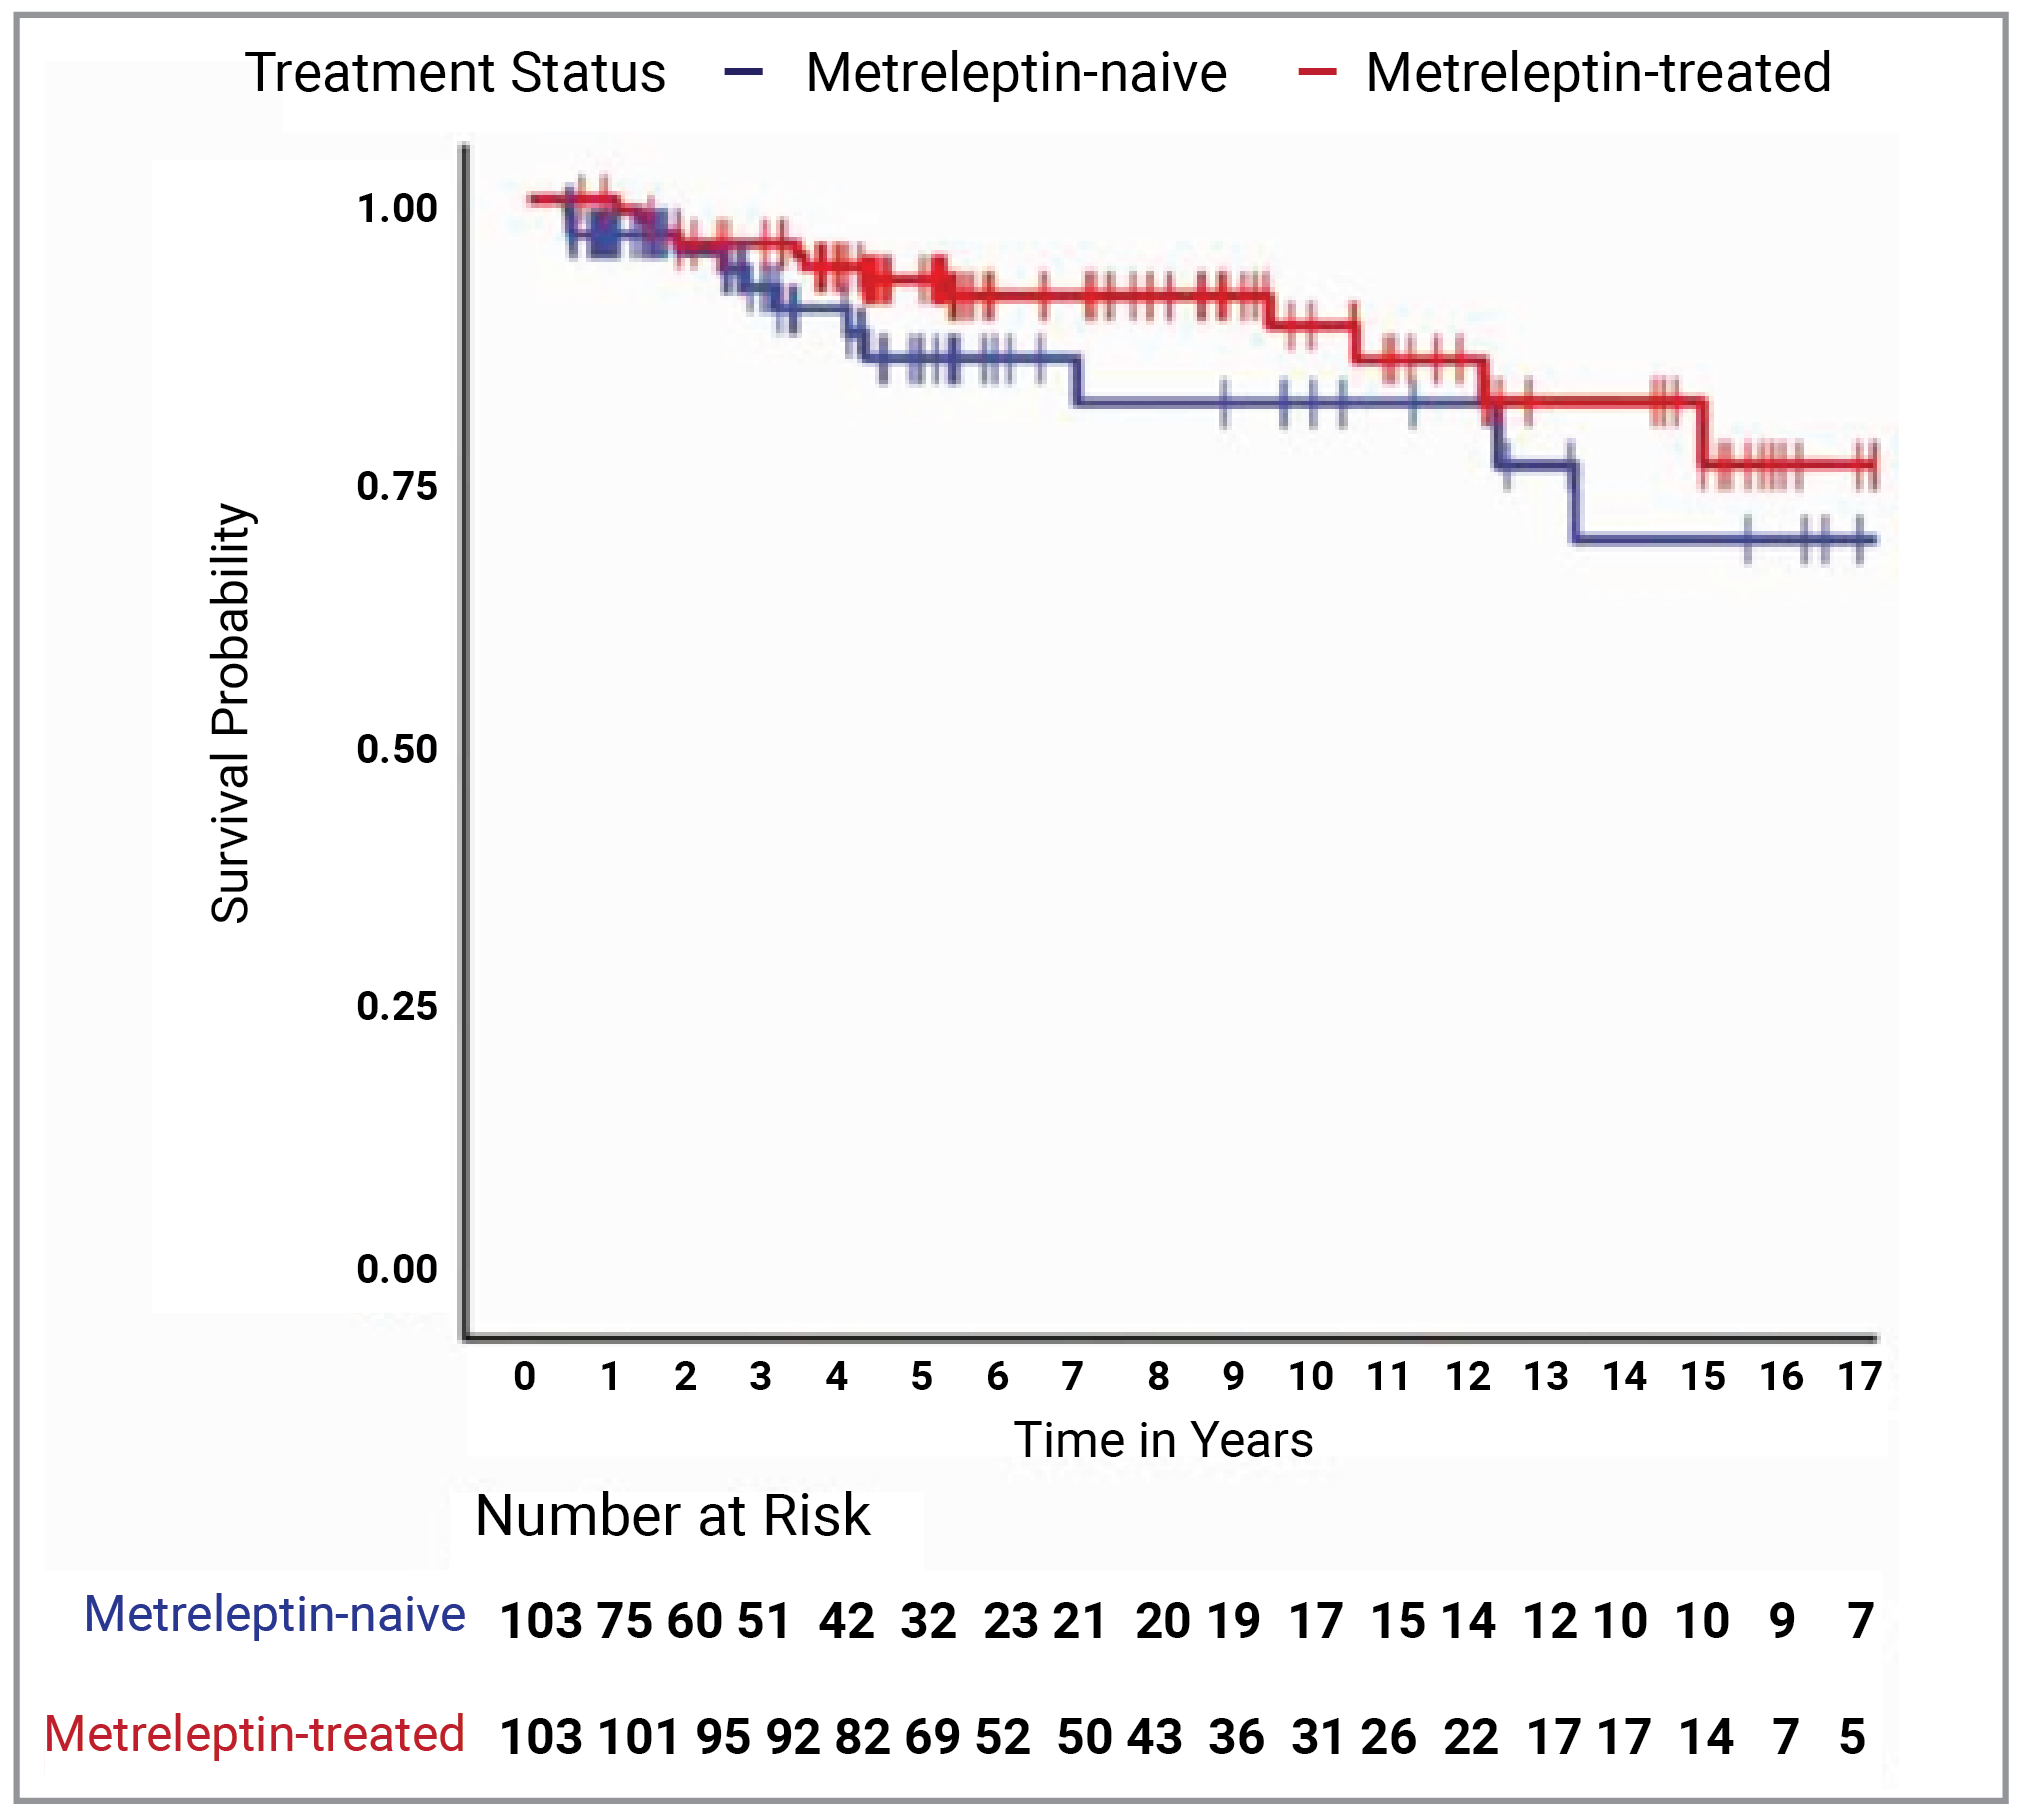
Note: Vertical bars denote censoring events.
Source: Cook et al. (2021). Copyright Cook et al. (2021). Reprinted in accordance with Creative Commons Attribution-NonCommercial-NoDerivs licence (CC BY-NC-ND 4.0 DEED): https://creativecommons.org/licenses/by-nc-nd/4.0/.6
Figure 2: Cox Proportional Hazards Model–Predicted Mortality for Patients Receiving Metreleptin Treatment Versus Matched Patients With No Experience With Metreleptin Treatment (Overall Cohort)
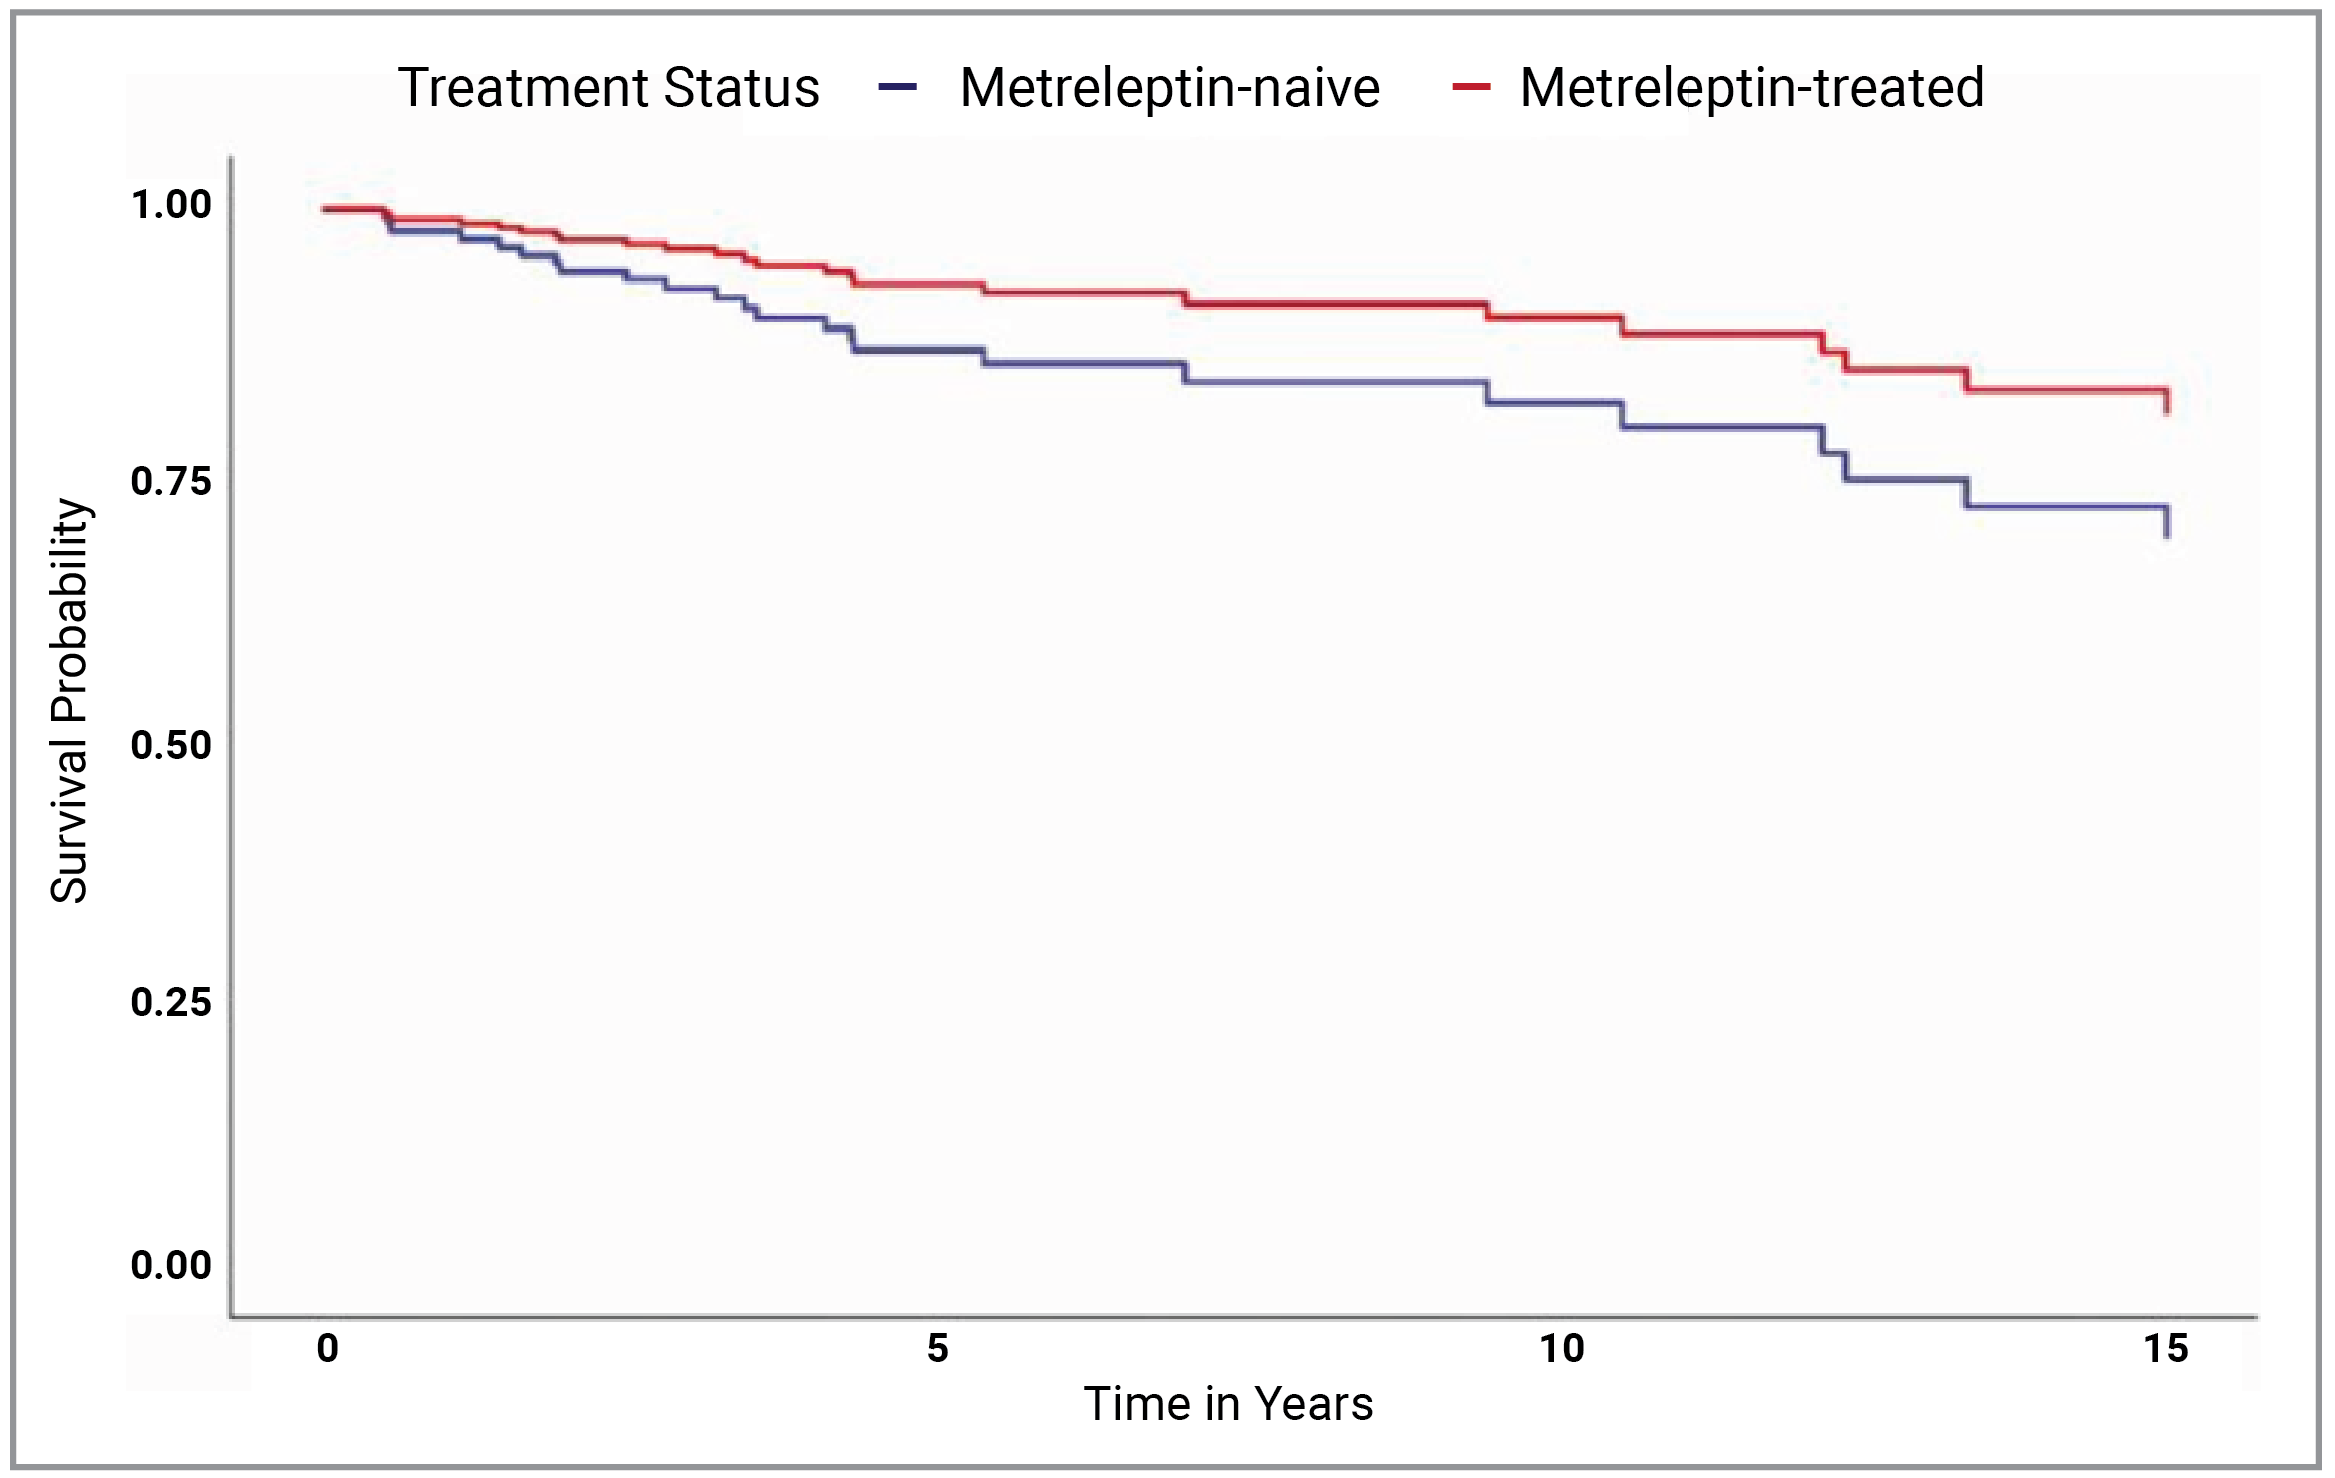
GL = generalized lipodystrophy; PL = partial lipodystrophy.
Note: Modelled results are after adjusting for the following covariates: lipodystrophy diagnosis (GL or PL), birth year, triglyceride levels, elevated hemoglobin A1C, history of ≥ 1 episodes of pancreatitis, and the presence of observed abnormalities in the heart or kidneys.
Source: Cook et al. (2021). Copyright Cook et al. (2021). Reprinted in accordance with Creative Commons Attribution-NonCommercial-NoDerivs licence (CC BY-NC-ND 4.0 DEED): https://creativecommons.org/licenses/by-nc-nd/4.0/.6
Critical Appraisal of Cook et al. (2021)
Similar to the sponsor-submitted unpublished supportive analysis, the supportive analysis from Cook et al. (2021) is based on a comparison of a prospective single-arm trial (NIH 991265/20010769) against retrospective chart review. Data from retrospective chart reviews can have a number of confounding factors both in reported characteristics and unknown unreported characteristics that may bias the results.
The Cook et al. (2021) supportive analysis used a matching approach to identify patients from the retrospective chart review that most closely match patients from the NIH 991265/20010769 study. Matching was based on selected variables of age, sex, lipodystrophy diagnosis type, number of organs (heart, kidney or liver) with an observed abnormality, and presence of elevated hemoglobin A1C levels (≥ 6.5%) at treatment initiation. In the postmatching population, there were some residual imbalances in important prognostic variables such as presence of elevated hemoglobin A1C (78.6% in the metreleptin-treated versus 60.2% in the metreleptin-naive population) and the number of organs with observed abnormalities. The patients receiving metreleptin treatment appear to have a more severe presentation of lipodystrophy, potentially increasing the likelihood of seeing a larger change from baseline in hemoglobin A1C and triglyceride levels and therefore biasing the results in favour of metreleptin.
The end points included in the Cook et al. (2021) analyses were focused on risk of mortality. Given the small number of mortality events recorded in both populations, the results were imprecise and uncertain. While mortality is a very important end point in this disease context, the extended survival horizons of patients with lipodystrophy make any mortality analysis difficult to assess due to the low number of events. As such, metabolic parameter end points such as hemoglobin A1C and triglyceride levels offer more immediate and reliable insight into the effectiveness of therapies in treating lipodystrophy. Metabolic end points were not considered in the Cook et al. (2021) analysis. In addition, the exact standard of therapies used in the retrospective control arm was not described, making it difficult to assess the relevance of comparing metreleptin to standard of care.
The Cox proportional hazards model adjusted further for treatment status, lipodystrophy diagnosis (GL or PL), age, triglyceride levels, hemoglobin A1C levels at 6.5% or greater, 1 or more episodes of pancreatitis, and abnormalities observed in the heart or kidneys at the time of treatment initiation or index date. The clinical experts consulted by CADTH considered this list of adjustment factors to be a more comprehensive list than the one that was included in the unpublished analysis; however, it is still unlikely to capture all prognostic factors and effect modifiers. After the Cox proportional hazards model adjustment, the results showed a benefit in risk of mortality for patients receiving metreleptin treatment compared with those with no experience with metreleptin treatment, but these results cannot be considered conclusive due to these noted limitations of the analysis.
Summary
Both the sponsor-submitted historical control arm analyses compared retrospective chart review data of patients with lipodystrophy receiving standard of care with data from a cohort of patients with lipodystrophy, mostly from the NIH 991265/20010769 study, who received metreleptin. There was little overlap between the outcomes assessed in each analysis. As such, determining the level of consistency between the analyses is difficult. The Cook et al. (2021) supportive analysis assessed the time-to-mortality and risk of mortality in the combined GL and PL cohort. The matched analysis found no difference between the metreleptin-treated and metreleptin-naive cohorts. A Cox proportional hazards analysis controlling for selected variables found a benefit in time-to-mortality in the combined GL and PL cohort; no difference was found in the GL only cohort. However, the major limitations of this analysis relating to the small number of events preclude drawing any conclusions from this analysis.
The sponsor-submitted unpublished supportive analysis assessed risk of mortality in the combined GL and PL cohorts, finding no difference between the metreleptin with or without supportive care cohort and the supportive care alone cohort. Given the small number of deaths reported in the follow-up time available, the results in this outcome are very uncertain.
The sponsor-submitted supportive analysis also assessed end points of interest including change in hemoglobin A1C and change in fasting triglycerides. The major limitations relating to the small number of variables included for adjustment preclude drawing any conclusions from this analysis.
Studies Addressing Gaps in the Systematic Review Evidence
Contents within this section have been informed by materials submitted by the sponsor. The following has been summarized and validated by the CADTH review team.
Description of Study
Study FHA10145 was a single-arm, multicentre, open-label, expanded-access study conducted at multiple treatment centres in the US. The primary objective was to provide metreleptin, an investigational medication, under a treatment protocol to patients with lipodystrophy associated with diabetes mellitus and/or hypertriglyceridemia. A secondary objective was to assess the long-term efficacy, safety, and tolerability of metreleptin among people with diabetes mellitus and/or hypertriglyceridemia. Participant enrolment took place between March 30, 2009, and January 23, 2016. A total of 41 participants were enrolled across 6 centres in the US.
Eligibility Criteria
Patients were eligible to enrol in Study FHA101 if they were aged 5 years or older and had physician-confirmed GL or PL with diabetes mellitus and/or hypertriglyceridemia. In addition, participants were required to adhere with the contraception and reproduction restrictions of the study. Patients were excluded from the study if they had been diagnosed with HIV infection, had acquired lipodystrophy and clinically significant hematologic abnormalities, had known infectious liver disease, or had known allergies to Escherichia coli–derived proteins or hypersensitivity to any component of the study treatment.
Interventions
All patients participating in Study FHA101 received metreleptin subcutaneously. Dosing was initially determined based on body weight and varied by age and sex.
Investigators were aware that the doses of patients’ concomitant medications (including antidiabetic medications such as insulin, or antihyperlipidemic medications) might have required adjustment upon initiation of metreleptin treatment. Patients were carefully monitored during the period of adjustments to their concomitant medication(s).
Patients who receiving insulin therapy were monitored closely during the first several weeks of treatment as insulin doses may have needed to be adjusted downward as frequently as weekly (especially for those on high doses of insulin) to avoid hypoglycemia. Consideration was to be given to an empiric decrease in insulin doses of approximately 25% upon initiation of metreleptin treatment. Patients who were receiving oral insulin sensitizers alone had less risk for hypoglycemia; investigators evaluated the need to adjust the dosages of these medications at each follow-up visit during metreleptin treatment. Similarly, investigators evaluated the need to adjust the dosages of lipid medications at each follow-up visit during metreleptin treatment for patients who were receiving lipid medications for hypertriglyceridemia. If metreleptin treatment was discontinued for any reason, further adjustment of concomitant medications could have been warranted.
Outcomes
The main efficacy outcomes assessed in Study FHA101 were hemoglobin A1C and fasting serum triglyceride levels. Other outcomes measured included levels of fasting plasma glucose and hepatic enzymes such as ALT and AST.
Hemoglobin A1C and Triglyceride Levels
Primary efficacy outcomes for Study FHA101 were the actual change from baseline in hemoglobin A1C at month 12 and percent change from baseline in fasting triglyceride levels at month 12.
Key secondary efficacy outcomes included the proportion of patients achieving target actual decreases of 1% or greater in hemoglobin A1C; or a 30% or greater decrease in fasting triglycerides at month 12, a 1.5% or greater decrease in hemoglobin A1C at month 12, or a 35% or greater decrease in fasting triglycerides at month 12; a 2% or greater actual decrease in hemoglobin A1C, or a 40% or greater decrease in fasting triglycerides at month 12.
Target decreases in both hemoglobin A1C (≥ 1%, ≥ 1.5%, and ≥ 2%) and fasting serum triglycerides (≥ 30%, ≥ 35%, and ≥ 40%) at each postbaseline visit through month 12 were assessed as an exploratory efficacy outcome.
Regarding hemoglobin A1C levels alone, the following were assessed as secondary or exploratory efficacy outcomes:
Other secondary: Actual change from baseline in hemoglobin A1C at each postbaseline visit
Other secondary: Proportion of patients with baseline hemoglobin A1C greater than 7% who achieve:
a target decrease to less than or equal to 7% postbaseline through month 12
a target decrease of greater than or equal to 1% or who decrease to less than or equal to 7% postbaseline through month 12
Other secondary: Proportion of patients who achieve target actual decreases (≥ 1%, ≥ 1.5%, and ≥ 2%) in hemoglobin A1C at 2 consecutive postbaseline visits on or after month 3 through month 12
Exploratory: Proportion of patients who achieve target actual decreases (≥ 1%, ≥ 1.5%, and ≥ 2%) hemoglobin A1C at month 3.
Regarding triglyceride levels alone, the following were assessed as secondary (or exploratory) efficacy outcomes:
Other secondary: Percent and actual change from baseline in fasting serum triglycerides at each postbaseline visit
Other secondary: Proportion of patients with baseline triglycerides greater than or equal to 2.26 mmol/L (≥ 200 mg/dL) who achieve:
a target decrease to less than 2.26 mmol/L (< 200 mg/dL) postbaseline through month 12
a target decrease of greater than or equal to 30% or who decrease to less than 2.26 mmol/L (< 200 mg/dL) postbaseline through month 12
Other secondary: Proportion of patients with baseline triglycerides greater than 5.65 mmol/L (> 500 mg/dL) at baseline who achieve:
a target decrease to less than 5.65 mmol/L (< 500 mg/dL) postbaseline through month 12
a target decrease of greater than or equal to 30% or who decrease to less than 5.65 mmol/L (< 500 mg/dL) postbaseline through month 12
Other secondary: Proportion of patients who achieve target percent decreases (≥ 30%, ≥ 35%, and ≥ 40%) in fasting serum triglycerides at 2 consecutive postbaseline visits on or after month 3 through month 12
Exploratory: Proportion of patients who achieve target percent decreases (≥ 30%, ≥ 35%, and ≥ 40%) in fasting serum triglycerides at month 3.
Fasting Plasma Glucose
The actual and percent change from baseline for fasting glucose levels at month 12 was assessed as a key secondary efficacy outcome. The percent and actual change from baseline in fasting plasma glucose at each postbaseline visit was assessed as a secondary efficacy end point.
Hepatic Enzymes
The actual change from baseline in ALT and AST at each postbaseline visit through month 12 was assessed as a secondary efficacy outcome.
Safety was assessed by examining SAEs as well as the AEs the investigator considered to be clinically significant and/or related. Safety evaluations also included reviewing any new concomitant medications and changes in dose or frequency of existing concomitant medications, clinical laboratory evaluations, measuring body weight and vital signs (systolic and diastolic blood pressure and heart rate), and collecting blood samples for potential assessment of antileptin antibodies.
Statistical Analysis
There was no formal hypothesis and no formal statistical testing in Study FHA101. Safety and efficacy end points were summarized descriptively. Subgroup analyses were planned for the primary and key secondary efficacy end points based on the presence of metabolic abnormalities at baseline (hemoglobin A1C [< 6.5% and ≥ 6.5%], ≥ 7%, and ≥ 8% and fasting triglycerides [< 2.26 mmol/L and ≥ 2.26 mmol/L or < 200 mg/dL and ≥ 200 mg/dL; ≥ 5.65 mmol/L or ≥ 500 mg/dL]).
For analysis of change from baseline, the total number of patients by time point reflected the actual number of patients with data for that specific parameter at baseline and the specified time point. The total number of patients at a given time point depended on whether data for that time point were available and whether the study visit fell within the specified analysis visit window.
Summary statistics were presented, as well as CIs on selected parameters.
The FAS was the primary population for the analyses of primary and secondary efficacy end points, with analyses performed for the primary and key secondary end points on the efficacy-evaluable analysis set, CFAS, and CEEAS as supportive or sensitivity analyses. In general, no substitutions were made to accommodate missing data points. All data recorded in the electronic case report form were included in data listings that accompanied the Clinical Study Report. For the primary efficacy end point analysis at month 12, a LOCF method of missing data imputation was used; in addition, a WOCF method was used as a supportive analysis.
Baseline Characteristics
A summary of demographic and key clinical characteristics of patients in Study FHA101 is presented in Table 24. Of the 9 patients with GL, most were female (8 patients; 89%) and white (8 patients; 89%); the majority (6 patients, 67%) were aged 18 years and older at the time of enrolment and median age was 25 years. Of the 9 patients with GL, 2 (22%) had the congenital form of the disease and 6 (67%) had the acquired form; the subtype was not reported for 1 patient. Of the 3 patients in the GL group who were enrolled at the University of Michigan and whose baseline fasting levels were available, baseline leptin levels were ||| ||||| in all 3 patients. Median body mass index was 21.3; 8 (89%) of the ||| || patients with GL weighed more than 40 kg at study entry.
Overall, 31 (97%) of the 32 patients with PL were female, as were all the patients in the PL subgroup. The majority of the 32 patients with PL were white (69%), as were 5 (71%) of the 7 patients in the PL subgroup. At the time of enrolment, the patients with PL were older than those with GL, and they were all aged 18 years and older. Most (29 of 32 patients; 91%) had the familial form of the disease, including 6 of 7 patients in the PL subgroup. Of the 24 patients with PL who were enrolled at the University of Michigan, baseline leptin levels were available for ||||| patients with a median of |||| ||||| and ||| ||||| in the ||| || patients in the PL subgroup. Median body mass index was 30.3 kg/m2 in the overall PL group and 27.6 kg/m2 in the PL subgroup.
Table 24: Summary of Baseline Characteristics of Study FHA101 (Safety Analysis Set)
Characteristic | Study FHA101 GL (N = 9) | Study FHA101 PL subgroupa (N = 7) | Study FHA101 PL overall (N = 32) |
|---|---|---|---|
Sex, n (%) | |||
Male | 1 (11.1) | 0 | 1 (3.1) |
Female | 8 (88.9) | 7 (100.0) | 31 (96.9) |
Race or ethnicity, n (%) | |||
Asian | 0 | 0 | 1 (3.1) |
Native American [wording from original source] | 0 | 0 | 2 (6.3) |
Black | 1 (11.1) | 2 (28.6) | 3 (9.4) |
Caucasian [wording from original source] | 8 (88.9) | 5 (71.4) | 22 (68.8) |
Hispanic | 0 | 0 | 1 (3.1) |
Age (years), n | 9 | 7 | 32 |
Mean (SD) | |||| ||||||| | |||| ||||||| | |||| ||||||| |
Median (min, max) | 25.0 (9.0 to 67.0) | 42.0 (23.0 to 57.0) | 44.5 (23.0 to 67.0) |
Lipodystrophy type, n (%) | |||
AGL | 6 (66.7) | 0 | 0 |
APL | 0 | 1 (14.3) | 3 (9.4) |
CGL | 2 (22.2) | 0 | 0 |
FPLD | 0 | 6 (85.7) | 29 (90.6) |
Fasting leptin (ng/mL), n | |||| ||||||| | |||| ||||||| | |||| ||||||| |
Mean (SD) | ||||||||| | ||| |||||| | |||| ||||||| |
Median (min, max) | ||| |||| || |||| | ||| |||| || |||| | |||| |||| || ||||| |
Weight category (kg), n (%) | |||
≤ 40 kg | |||| ||||||| | |||| ||||||| | |||| ||||||| |
> 40 kg | |||| ||||||| | |||| ||||||| | |||| ||||||| |
BMI (kg/m2), n | 9 | 7 | 32 |
Mean (SD) | |||| |||||| | |||| |||||| | |||| |||||| |
Median (min, max) | 21.3 (13.9 to 38.4) | 27.6 (20.9 to 30.5) | 30.3 (19.1 to 41.2) |
Hemoglobin A1C (%), n | |||
Mean (SD) | ||| |||||| | ||| |||||| | ||| |||||| |
Median (min, max) | 8.4 (5.1 to 10.2) | 7.6 (5.7 to 11.1) | 8.0 (5.6 to 12.8) |
Hemoglobin A1C (%), n (%) | |||
|||| | |||| ||||||| | |||| ||||||| | |||| ||||||| |
≥ 6.5 | 6 (66.7) | 6 (85.7) | || |||||| |
|||| | |||| ||||||| | |||| ||||||| | || |||||| |
|||| | |||| ||||||| | |||| ||||||| | || |||||| |
Fasting TG (mmol/L), n | 8 | 7 | 32 |
Mean (SD) | |||| ||||||| | ||| |||||| | ||| ||||||| |
Median (min, max) | 3.3 (1.5 to 119.9) | 2.9 (0.7 to 14.0) | 3.2 (0.7 to 50.4) |
Fasting TG, n (%) | |||
||||| |||||| | |||| ||||||| | |||| ||||||| | |||| ||||||| |
≥ 2.26 mmol/L | 6 (66.7) | 4 (57.1) | 23 (71.9) |
≥ 5.65 mmol/L | 3 (33.3) | 1 (14.3) | 7 (21.9) |
Fasting glucose (mmol/L), n | 9 | 7 | 32 |
Mean (SD) | |||| |||||| | ||| |||||| | ||| |||||| |
Median (min, max) | 10.4 (4.2 to 23.3) | 7.4 (5.1 to 13.4) | 7.8 (2.0 to 15.0) |
Fasting glucose, n (%) | |||
||||| |||||| | |||| ||||||| | |||| ||||||| | |||| ||||||| |
||||| || ||||| |||||| | |||| ||||||| | |||| ||||||| | |||| ||||||| |
||||| |||||| | |||| ||||||| | |||| ||||||| | |||| ||||||| |
ALT, n (%) | |||
|||| | |||| ||||||| | |||| ||||||| | |||| ||||||| |
> ULN | 4 (44.4) | 2 (28.6) | 9 (28.1) |
AST, n (%) | |||
|||| | |||| ||||||| | |||| ||||||| | |||| ||||||| |
> ULN | 4 (44.4) | 0 | 5 (15.6) |
AGL = acquired generalized lipodystrophy; ALT = alanine aminotransferase; APL = acquired partial lipodystrophy; AST = aspartate aminotransferase; BMI = body mass index; CGL = congenital generalized lipodystrophy; FPLD = familial partial lipodystrophy; GL = generalized lipodystrophy; max = maximum; min = minimum; PL = partial lipodystrophy; SD = standard deviation; TG = triglyceride; ULN = upper limit of normal.
aThe PL subgroup includes patients with baseline leptin < 12 ng/mL and hemoglobin A1C ≥ 6.5% and/or triglycerides ≥ 5.65 mmol/L.
Sources: Sponsor’s Summary of Clinical Evidence; Study FHA101 Clinical Study Report.45
Patient Disposition
Patient disposition in Study FHA101 is summarized in Table 25. Overall, 24 (59%) of the 41 patients participating in the study were reported to have prematurely discontinued the study treatment, including 4 (44%) of the 9 patients with GL and 20 (63%) of the 32 patients with PL. The most common reason for early discontinuation from the study was withdrawal by the patient, reported for 1 (11%) of the patients with GL and 9 (28%) of the patients with PL. Death was reported as the cause for withdrawal for 2 patients. AEs led to the withdrawal of 3 patients in the overall PL group.
Table 25: Summary of Patient Disposition – Study FHA101
Patient disposition | Study FHA101 GL (N = 9) | Study FHA101 PL subgroupa (N = 7) | Study FHA101 PL overall (N = 32) |
|---|---|---|---|
Total number of patients, n (%) | |||
Received treatment | 9 (100.0) | 7 (100.0) | 32 (100.0) |
Premature discontinuation | 4 (44.4) | 2 (28.6) | 20 (62.5) |
Reason for discontinuation, n (%) | |||
Adverse event | 0 | 0 | 3 (9.4) |
Lost to follow-up | 1 (11.1) | 0 | 1 (3.1) |
Death | 1 (11.1) | 0 | 1 (3.1) |
Physician decision | 1 (11.1) | 1 (14.3) | 6 (18.8) |
Withdrawal by patient | 1 (11.1) | 1 (14.3) | 9 (28.1) |
Patients contacted for follow-up, n (%) | 2 (22.2) | 0 | 4 (12.5) |
Safety analysis setb, n (%) | 9 (100.0) | 7 (100.0) | 32 (100.0) |
Full analysis setc, n (%) | 9 (100.0) | 7 (100.0) | 29 (90.6) |
Controlled concomitant medication full analysis setd, n (%) | 2 (22.2) | 6 (85.7) | 18 (56.3) |
Efficacy-evaluable analysis sete, n (%) | |||| ||||||| | |||| ||||||| | || |||||| |
Controlled concomitant medication efficacy-evaluable analysis setf, n (%) | 2 (22.2) | 5 (71.4) | 9 (28.1) |
Pharmacokinetic analysis setg, n (%) | |||| ||||||| | |||| ||||||| | || |||||| |
Antibody analysis seth, n (%) | |||| ||||||| | |||| ||||||| | || |||||| |
GL = generalized lipodystrophy; PL = partial lipodystrophy.
aThe PL subgroup includes patients with baseline leptin < 12 ng/mL and hemoglobin A1C ≥ 6.5% and/or triglycerides ≥ 5.65 mmol/L.
bAll enrolled patients who received at least 1 dose of study drug.
cAll patients in the safety analysis set who had either primary efficacy parameter measured at baseline and at ≥ 1 postbaseline visit.
dAll patients in the full analysis set who had controlled concomitant medication use before month 12.
eAll patients in the full analysis set who had either efficacy parameter of interest measured at month 12 and no major protocol violations before month 12.
fAll patients in the controlled concomitant medication full analysis set who had either efficacy parameter of interest measured at month 12 and no major protocol violations before month 12.
gAll patients in the safety analysis set who provided at least 1 blood sample for pharmacokinetic evaluation of metreleptin.
hAll patients in the safety analysis set who had antibody status assessed at least once while participating in the study.
Sources: Sponsor’s Summary of Clinical Evidence; Study FHA101 Clinical Study Report.45
Exposure to Study Treatments
Patient exposure to study treatment is summarized in Table 26. In Study FHA101, the median overall duration of treatment was 21.3 months for patients in the GL group and ranged from ||| || |||| months. Median actual duration of treatment (excluding dose interruptions) was |||| months. The median average daily dose received by patients with GL was ||| mg/day. The median maximum daily dose over the study period was 5.0 mg; the maximum daily weight-based dose administered in the study was ||||| mg/kg. Because of the dose titration specified by protocol through Amendment 4 and subsequent dose adjustments based on individual clinical response, as well as evolution of the dosing regimen over time, a weighted average dose was calculated. The median weighted average daily dose received by patients with GL was 3.7 mg or 0.057 mg/kg over the study period.
In the PL subgroup, median overall duration of treatment with metreleptin was 53.1 months and ranged from |||| || |||| months; median actual duration of treatment (excluding dose interruptions) was similar at |||| months. Median average daily dose in the PL subgroup was ||| mg/day and median maximum daily dose was 10.0 mg, both higher than in the GL group. The median maximum daily dose administered in the PL subgroup was ||||| mg/kg. The median weighted average daily dose received by patients in the PL subgroup over the study period was 9.0 mg or 0.110 mg/kg.
Table 26: Summary of Patient Exposure – Study FHA101 (Safety Analysis Set)
Patient exposure | Study FHA101 GL (N = 9) | Study FHA101 PL subgroupa (N = 7) | Study FHA101 PL overall (N = 32) |
|---|---|---|---|
Overall durationb (months), n | |||| ||||||| | |||| ||||||| | |||| ||||||| |
Mean (SD) | |||| ||||||| | |||| ||||||| | |||| ||||||| |
Median (min, max) | 21.3 (||| || ||||) | 53.1 (|||| || ||||) | (|||| |||| || ||||) |
Actual durationb (months), n | | || |||| | | || |||| | | || |||| |
Mean (SD) | |||| ||||||| | |||| ||||||| | |||| ||||||| |
Median (min, max) | |||| ||||| || ||||| | |||| ||||| || ||||| | |||| |||| || ||||| |
Total exposure, patient years | 11.3 | 28.4 | |||| |
Dose intensityc (mg/month), n | | || |||| | | || |||| | | || |||| |
Mean (SD) | ||||| ||||||| | ||||| ||||||| | ||||| ||||||| |
Median (min, max) | ||||| ||||| || |||||| | ||||| |||||| || |||||| | ||||| ||||| || |||||| |
Average daily dosed (mg/day), n | | || |||| | | || |||| | | || |||| |
Mean (SD) | 3.1 (1.23) | 8.9 (2.25) | ||| |||||| |
Median (min, max) | ||| |||| || |||| | ||| |||| || |||| | ||| |||| || ||||| |
Weighted average dose over study periode (mg/kg), n | | || |||| | | || |||| | | || |||| |
Mean (SD) | ||||| |||||||| | ||||| |||||||| | ||||| |||||||| |
Median (min, max) | 0.057 (||||| || |||||) | 0.110 (||||| || |||||) | ||||| |||||| || |||||| |
Weighted average dose over study periode (mg), n | ||| || |||||| | ||| || |||||| | ||| || |||||| |
Mean (SD) | ||| |||||| | ||| |||||| | ||| |||||| |
Median (min, max) | 3.7 |||| || |||| | 9.0 |||| || ||||| | ||| |||| || ||||| |
Maximum daily dose over study period (mg/kg), n | ||| || |||||| | ||| || |||||| | ||| || |||||| |
Mean (SD) | ||||| |||||||| | ||||| |||||||| | ||||| |||||||| |
Median (min, max) | ||||| |||||| || |||||| | ||||| |||||| || |||||| | ||||| |||||| || |||||| |
Maximum daily dose over study period (mg), n | ||| || |||||| | ||| || |||||| | ||| || |||||| |
Mean (SD) | ||| |||||| | |||| |||||| | ||| |||||| |
Median (min, max) | 5.0 |||| || |||| | 10.0 |||| || ||||| | |||| |||| || ||||| |
GL = generalized lipodystrophy; max = maximum; min = minimum; PL = partial lipodystrophy; SD = standard deviation.
aThe PL subgroup includes patients with baseline leptin < 12 ng/mL and hemoglobin A1C ≥ 6.5% and/or triglycerides ≥ 5.65 mmol/L.
bOverall duration is from first to last dose; actual duration excludes drug interruptions.
cDose intensity is the cumulative amount of drug exposure divide by actual treatment duration.
dAverage daily dose is the cumulative amount of drug exposure divided by overall number of planned dosing days.
eWeighted average dose over the study period is the sum of daily doses (in mg/kg or mg) over the overall duration at that dose or regimen divided by the total duration of all dose regimens.
Sources: Sponsor’s Summary of Clinical Evidence; Study FHA101 Clinical Study Report.45
Concomitant Medication and Co-intervention
Concomitant medications were defined as medications used on or after the first date of study medication administration. Medications were coded using the WHO Drug Dictionary version 2016Q1. Key medications patients were receiving at the study baseline are summarized in Table 27.
Antidiabetic medications were administered to 2 (22%) of the patients with GL, 19 (59%) of the patients with PL, and 6 (86%) of the patients in the PL subgroup. Lipid-lowering therapies were administered to 19 (59%) of the patients with PL, 2 (22%) of those with GL, and 6 (86%) of those in the PL subgroup. Other commonly administered medications included lisinopril and hydrochlorothiazide for hypertension, spironolactone for edema, acetylsalicylic acid for cardiac prophylaxis, and vitamins.
Table 27: Baseline Medication Use – Study FHA101 (Safety Analysis Set)
Baseline medication | Study FHA101 GL (N = 9) | Study FHA101 PL subgroupa (N = 7) | Study FHA101 PL overall (N = 32) |
|---|---|---|---|
Antidiabetic medication,b n (%) | 2 (22.2) | 6 (85.7) | 19 (59.4) |
Any insulin | |||| ||||||| | |||| ||||||| | |||| ||||||| |
Insulin alone | |||| ||||||| | |||| ||||||| | |||| ||||||| |
Insulin plus oral agent | |||| ||||||| | |||| ||||||| | |||| ||||||| |
Oral agent alone | |||| ||||||| | |||| ||||||| | |||| ||||||| |
Lipid-lowering therapiesb | 2 (22.2) | 6 (85.7) | 19 (59.4) |
HMG-CoA reductase inhibitors | |||| ||||||| | |||| ||||||| | |||| ||||||| |
Other lipid-modifying agents | |||| ||||||| | |||| ||||||| | |||| ||||||| |
Fibrates | |||| ||||||| | |||| ||||||| | |||| ||||||| |
Other concomitant medicationsc | |||| ||||||| | |||| ||||||| | |||| ||||||| |
Metformin | |||| ||||||| | |||| ||||||| | |||| ||||||| |
Lisinopril | |||| ||||||| | |||| ||||||| | |||| ||||||| |
Spironolactone | |||| ||||||| | |||| ||||||| | |||| ||||||| |
Simvastatin | |||| ||||||| | |||| ||||||| | |||| ||||||| |
Fish oil | |||| ||||||| | |||| ||||||| | |||| ||||||| |
Multivitamins | |||| ||||||| | |||| ||||||| | |||| ||||||| |
Cyclobenzaprine hydrochloride | |||| ||||||| | |||| ||||||| | |||| ||||||| |
Acetylsalicylic acid | |||| ||||||| | |||| ||||||| | |||| ||||||| |
Hydrochlorothiazide | |||| ||||||| | |||| ||||||| | |||| ||||||| |
Pioglitazone hydrochloride | |||| ||||||| | |||| ||||||| | |||| ||||||| |
ATC = anatomic therapeutic class; GL = generalized lipodystrophy; HMG-CoA = 3-hydroxy-3-methyl-glutaryl-coenzyme A; PL = partial lipodystrophy; WHODD = WHO Drug Dictionary.
aThe PL subgroup includes patients with baseline leptin < 12 ng/mL and hemoglobin A1C ≥ 6.5% and/or triglycerides ≥ 5.65 mmol/L.
bTerms across multiple WHODD ATC classes are grouped to provide overall incidence.
cIndividual WHODD preferred terms reported with incidence > 15% in the overall GL group or PL subgroup.
Sources: Sponsor’s Summary of Clinical Evidence; Study FHA101 Clinical Study Report.45
Efficacy
All primary evaluations of the efficacy of metreleptin were based on the FAS. Results for the primary and key secondary efficacy end points were analyzed for all 4 analysis sets. Results of the sensitivity analyses for the primary and secondary end points were consistent with those in the primary analysis; therefore, these results were not presented in this report.
Co-Primary End Point: Change From Baseline in Hemoglobin A1C and Triglycerides at Month 12
The co-primary efficacy end points were actual change from baseline in hemoglobin A1C at month 12 and percent change from baseline in fasting triglyceride levels at month 12. Results are presented in Table 28.
Among the patients with GL, mean hemoglobin A1C was reduced from 7.7% at baseline to 6.2% at month 12 (LOCF), a mean change of –1.2%, and mean fasting triglyceride concentrations were reduced from 19.9 mmol/L at baseline to 7.6 mmol/L at month 12 (LOCF), corresponding to a mean percent change of –26.9%.
Among the 29 patients in the overall PL group, mean hemoglobin A1C was reduced from 8.1% at baseline to 7.8% at month 12 (LOCF), a mean change of –0.4%, and mean fasting triglyceride concentrations were reduced from 8.5 mmol/L at baseline to 6.4 mmol/L at month 12 (LOCF), corresponding to a mean percent change of 8.7%.
Table 28: Change From Baseline to Month 12 in Hemoglobin A1C and Fasting Triglycerides Using LOCF in Study FHA101 (FAS Population)
Parameter statistic | Study FHA101 GL (N = 9) | Study FHA101 PL subgroupa (N = 7) | Study FHA101 PL overall (N = 29) |
|---|---|---|---|
Hemoglobin A1C (%) | |||
Baseline value, n | 9 | 7 | 29 |
Mean (SD) | 7.7 (1.99) | 7.8 (1.71) | 8.1 (1.77) |
Median (min, max) | ||| |||| || ||||| | ||| |||| || ||||| | ||| |||| || ||||| |
Month 12 value, n | 5 | 7 | 26 |
Mean (SD) | 6.2 (1.96) | 7.0 (0.76) | 7.8 (1.76) |
Median (min, max) | ||| |||| || |||| | ||| |||| || |||| | ||| |||| || ||||| |
Actual change from baseline, n | 5 | 7 | 26 |
Mean (SD) | –1.2 (2.53) | –0.8 (1.85) | –0.4 (1.49) |
95% CI | –4.3 to 2.0 | –2.5 to 0.9 | –1.0 to 0.2 |
P valueb | 0.360 | 0.289 | 0.210 |
Fasting TG (mmol/L) | |||
Baseline value, n | 8 | 7 | 29 |
Mean (SD) | 19.9 (40.90) | 4.0 (4.54) | 8.5 (12.37) |
Median (min, max) | ||| |||| || |||||| | ||| |||| || ||||| | ||| |||| || ||||| |
Month 12 value, n | 6 | 7 | 26 |
Mean (SD) | 7.6 (11.10) | 3.6 (3.57) | 6.4 (10.06) |
Median (min, max) | ||| |||| || ||||| | ||| |||| || ||||| | ||| |||| || ||||| |
Actual change from baseline, n | 5 | 7 | 26 |
Mean (SD) | –26.9 (78.32) | –8.5 (30.22) | 8.7 (93.39) |
95% CI | –124.1 to 70.4 | –36.4 to 19.5 | –29.1 to 46.4 |
P valueb | 0.486 | 0.485 | 0.640 |
CI = confidence interval; FAS = full analysis set; GL = generalized lipodystrophy; LOCF = last observation carried forward; max = maximum; min = minimum; PL = partial lipodystrophy; SD = standard deviation; TG = triglyceride.
Note: The LOCF imputation method only includes results that are at least 6 months (180 days) postbaseline.
aThe PL subgroup includes patients with baseline leptin < 12 ng/mL and hemoglobin A1C ≥ 6.5% and/or triglycerides ≥ 5.65 mmol/L.
bP values computed using paired t tests.
Sources: Sponsor’s Summary of Clinical Evidence; Study FHA101 Clinical Study Report.45
Among the 7 patients in the PL subgroup included in the FAS, mean hemoglobin A1C was reduced from 7.8% at baseline to 7.0% at month 12 (LOCF), a mean change of –0.8%. Mean triglyceride concentrations were reduced in the PL subgroup from 4.0 mmol/L at baseline to 3.6 mmol/L at month 12 (LOCF), a mean change of –8.5%.
Individual patient changes to month 12 (LOCF) for hemoglobin A1C (%) and triglycerides (mmol/L) are presented in waterfall plots for the GL group and the overall PL group in Figure 3 and Figure 4, respectively. The waterfall plots show that most patients in the GL group and approximately ||% of patients in the overall PL group achieved reductions in both hemoglobin A1C and triglycerides during the first 12 months of treatment with metreleptin.


Key Secondary End Point: Responder Analyses – Patients With Target Reductions in Hemoglobin A1C and Triglycerides at Month 12 Using LOCF
Table 29 presents results for the key secondary efficacy end points of target reductions in hemoglobin A1C and triglyceride levels at month 12 (LOCF) for the FAS. Overall, 3 (50%) of 6 patients with GL had a 1% or greater actual decrease in hemoglobin A1C or a 30% or greater decrease in triglycerides at month 12 (LOCF). Three of the patients with GL achieved the highest target decreases of 2% or greater in hemoglobin A1C or 40% or greater in triglycerides at that time.
In the overall PL group for the FAS, 9 (35%) of the 26 patients achieved a 1% or greater actual decrease in hemoglobin A1C or a 30% or greater decrease in triglycerides at month 12 (LOCF), with 7 patients (27%) achieving the highest target decreases of 2% or greater in hemoglobin A1C or 40% or greater in triglycerides.
In the PL subgroup for the FAS, 2 (29%) of the 7 patients achieved a 1% or greater actual decrease in hemoglobin A1C or a 30% or greater decrease in triglycerides at month 12 (LOCF) with 1 patient (14%) achieving the highest target decreases of 2% or greater in hemoglobin A1C or 40% or greater in triglycerides.
Table 29: Patients who Met Target Reductions in Hemoglobin A1C or Triglycerides at Month 12 Using LOCF in Study FHA101 (FAS Population)
Parameter statistic | Study FHA101 GL (N = 9) | Study FHA101 PL subgroupa (N = 7) | Study FHA101 PL overall (N = 29) |
|---|---|---|---|
≥ 1% actual decrease in hemoglobin A1C or ≥ 30% decrease in triglycerides | |||
n/N1 (%) | 3/6 (50.0) | 2/7 (28.6) | 9/26 (34.6) |
95% CIb | (11.8 to 88.2) | (3.7 to 71.0) | (17.2 to 55.7) |
≥ 1.5% actual decrease in hemoglobin A1C or ≥ 35% decrease in triglycerides | |||
n/N1 (%) | 3/6 (50.0) | 2/7 (28.6) | 9/26 (34.6) |
95% CIb | (11.8 to 88.2) | (3.7 to 71.0) | (17.2 to 55.7) |
≥ 2% actual decrease in hemoglobin A1C or ≥ 40% decrease in triglycerides | |||
n/N1 (%) | 3/6 (50.0) | 1/7 (14.3) | 7/26 (26.9) |
95% CIb | (11.8 to 88.2) | (0.4 to 57.9) | (11.6 to 47.8) |
CI = confidence interval; FAS = full analysis set; GL = generalized lipodystrophy; LOCF = last observation carried forward; n = number of responders; N1 = number of patients in the FAS evaluated at month 12 using LOCF; PL = partial lipodystrophy.
aThe PL subgroup includes patients with baseline leptin < 12 ng/mL and hemoglobin A1C ≥ 6.5% and/or triglycerides ≥ 5.65 mmol/L.
b95% CI based on the 2-sided exact binomial proportions.
Sources: Sponsor’s Summary of Clinical Evidence; Study FHA101 Clinical Study Report.45
Key Secondary End Point: Effect of Metreleptin Treatment on Fasting Glucose Levels: Change to Month 12 Using LOCF
Table 30 presents results for the key secondary efficacy end point of changes from baseline to month 12 in fasting glucose levels using LOCF for the FAS.
In general, changes in fasting plasma glucose followed a similar pattern as changes in hemoglobin A1C.
Among the patients with GL included in the FAS, mean glucose levels were reduced from 11.4 mmol/L at baseline to 10.2 mmol/L at month 12 (LOCF), a mean change of –1.5 mmol/L, representing a –7.3% decrease in fasting glucose levels.
Results in the PL subgroup were similar to the GL group for the FAS; in the PL subgroup, mean baseline glucose levels were 8.0 mmol/L with a reduction to a mean level of 6.9 mmol/L at month 12 (LOCF), a mean change of –1.1 mmol/L, representing a 9% decrease from baseline. In the overall PL group, mean baseline glucose levels were 8.5 mmol/L with a reduction to a mean level of 8.3 mmol/L at month 12 (LOCF), a mean change of –0.2 mmol/L, representing a 14% increase from baseline.
The effect of long-term treatment with metreleptin on fasting glucose was similar, but not statistically significant, to the effect observed for hemoglobin A1C among patients with GL and the overall PL group. In the GL group, mean changes from baseline in fasting glucose were –5.6 mmol/L, –6.6 mmol/L, and –3.6 mmol/L at months 12, 24, and 36, respectively, and overall least squares mean change based on the mixed-effects model repeated measures analysis was –2.3 mmol/L (P = 0.008). In the overall PL group, mean changes from baseline in fasting glucose were –0.9 mmol/L, –1.2 mmol/L, and –1.7 mmol/L at months 12, 24, and 36, respectively, and the overall least squares mean change based on the mixed-effects model repeated measures analysis was –0.7 mmol/L (P = 0.132).
Individual patient changes to month 12 using LOCF for fasting glucose levels (mmol/L) are presented in waterfall plots for the GL group and the overall PL group in Figure 5 for the FAS. These graphic displays show that |||| patients with GL and || || || patients in the overall PL group achieve reductions in fasting glucose levels during the first 12 months of treatment with metreleptin.
Table 30: Actual and Percent Changes From Baseline to Month 12 in Fasting Glucose Using LOCF (FAS Population)
Glucose levels (mmol/L) | Study FHA101 GL (N = 9) | Study FHA101 PL subgroupa (N = 7) | Study FHA101 PL overall (N = 29) |
|---|---|---|---|
Baseline value, n | 9 | 7 | 29 |
Mean (SD) | 11.4 (6.03) | 8.0 (2.83) | 8.5 (3.45) |
Median (min, max) | |||| |||| || ||||| | ||| |||| || ||||| | ||| |||| || ||||| |
Month 12 value, n | 6 | 7 | 27 |
Mean (SD) | 10.2 (7.58) | 6.9 (2.16) | 8.3 (2.99) |
Median (min, max) | ||| |||| || ||||| | ||| |||| || ||||| | ||| |||| || ||||| |
Actual change from baseline, n | 6 | 7 | 27 |
Mean (SD) | –1.5 (9.90) | –1.1 (2.95) | –0.2 (4.14) |
95% CI | –11.9 to 8.8 | –3.8 to 1.6 | –1.8, 1.5 |
P valueb | 0.719 | 0.358 | 0.838 |
% change from baseline, n | 6 | 7 | 27 |
Mean (SD) | –7.3 (53.71) | –9.0 (26.45) | 13.9 (69.14) |
95% CI | –63.6 to 49.1 | –33.4 to 15.5 | –13.4 to 41.3 |
P valueb | 0.754 | 0.403 | 0.304 |
CI = confidence interval; FAS = full analysis set; GL = generalized lipodystrophy; LOCF = last observation carried forward; max = maximum; min = minimum; NA = not applicable; PL = partial lipodystrophy; SD = standard deviation.
Note: The LOCF imputation method only includes results that are at least 6 months (180 days) postbaseline.
aThe PL subgroup includes patients with baseline leptin < 12 ng/mL and hemoglobin A1C ≥ 6.5% and/or triglycerides ≥ 5.65 mmol/L.
bP values computed using paired t tests.
Sources: Sponsor’s Summary of Clinical Evidence; Study FHA101 Clinical Study Report.45

Other Secondary End Point: Target Reductions in Hemoglobin A1C and Triglyceride Levels at Month 12 Using LOCF Among Patients With Elevated Baseline Levels of Hemoglobin A1C and Triglycerides
Responder analyses at month 12 using LOCF were also conducted on the FAS for patients with abnormal baseline levels of hemoglobin A1C (> 7%) and triglycerides (≥ 2.26 mmol/L and ≥ 5.65 mmol/L); results are summarized in Table 31. For these analyses, the target reductions for hemoglobin A1C were less than or equal to 7%, or improvement by greater than or equal to 1%, and for triglycerides were to less than 2.26 mmol/L or less than 5.65 mmol/L or improvement by greater than or equal to 30%.
Among patients with GL who had hemoglobin A1C greater than 7% at baseline, ||||| |||||||||| had hemoglobin A1C levels improve by month 12 (LOCF) to less than or equal to 7%; among ||| |||| |||||||, this improvement resulted in a decrease in hemoglobin A1C greater than or equal to 1%. Of the patients in the PL subgroup with hemoglobin A1C greater than 7% at baseline, ||||| |||||||||| had a reduction in hemoglobin A1C to 7% or less with the same number having this level of reduction or decrease in hemoglobin A1C levels of 1% or greater at that time. Of patients in the overall PL group with hemoglobin A1C greater than 7% at baseline, ||||| || || |||||||| had a reduction in hemoglobin A1C of 7% or less, with ||||| || || |||||||| having a reduction in hemoglobin A1C of 1% or greater at that time.
Among those patients with GL with baseline triglycerides greater than or equal to 2.26 mmol/L, ||||| |||||||||| had reductions in their triglyceride levels with metreleptin treatment to less than 2.26 mmol/L at month 12 using LOCF and |||||||| ||||| achieved a reduction in their triglyceride levels to less than 2.26 mmol/L or achieved a reduction from baseline of greater than or equal to 30% at that time. Among the || |||||||| with higher baseline triglycerides levels of greater than or equal to 5.65 mmol/L, |||| || ||| |||||||| |||||| had a reduction in triglyceride levels to less than 5.65 mmol/L or of greater than or equal to 30% at month 12 using LOCF.
In the PL subgroup, |||| || ||||||||||| with triglycerides greater than or equal to 2.26 mmol/L were able to achieve triglyceride levels less than 2.26 mmol/L or have a greater than 30% reduction at month 12 of metreleptin treatment. In the overall PL group, ||||| || ||| || |||||||| with triglycerides greater than or equal to 2.26 mmol/L were able to achieve triglycerides levels of less than 2.26 mmol/L with ||||| || ||| || |||||||| having triglyceride levels of less than 2.26 mmol/L or a greater than or equal to 30% reduction at month 12 of metreleptin treatment.
||||||||| ||||||||| | ||||| ||||||||| ||||| | ||||| ||||||||| ||||||||||| | ||||| ||||||||| ||||||| |||||| |
|---|---|---|---|
|||||||| |||| |||||||| ||||| ||| | |||
||||| ||| || ||||| || | |||
|||| ||| | ||| |||||| | ||| |||||| | |||| |||||| |
||| || | |||| || ||||| | |||| || ||||| | |||| || ||||| |
||||| ||| || ||| |||||||| |||| || || ||||| || | |||
|||| ||| | ||| |||||| | ||| |||||| | |||| |||||| |
||| || | |||| || ||||| | |||| || ||||| | ||||| || ||||| |
||||||| |||| |||||||| ||||||||||||| ||||| |||||| | |||
|| ||||| |||||| || ||||| || | |||
|||| ||| | ||| |||||| | ||| ||||| | |||| |||||| |
||| || | |||| || ||||| | |||| || ||||| | |||| || ||||| |
|| ||||| |||||| || |||| |||||||| |||| || || ||||| || | |||
|||| ||| | ||| |||||| | ||| ||||| | |||| |||||| |
||| | | ||||| || ||||| | |||| || ||||| | ||||| || ||||| |
||||||| |||| |||||||| ||||||||||||| ||||| |||||| | |||
|| ||||| |||||| || ||||| || | |||
|||| ||| | ||| ||||| | ||| ||||| | ||| ||||| |
||| || | |||| || ||||| | |||| || ||||| | |||| || ||||| |
|| ||||| |||||| || |||| |||||||| |||| || || ||||| || | |||
|||| ||| | ||| ||||||| | ||| ||||| | ||| |||||| |
||| || | ||||| || |||||| | |||| || ||||| | ||||| || ||||| |
|||||||||||| ||||||||| ||||||| |||||||| |||| ||||||||||||||| ||||||||| || ||||||||||| ||||||| || ||| ||||||||| || ||||| |||||||| |||||| ||||||||||| ||||||| |||||||| ||||||| |||||||||||||| |||||||||||||||| ||||||||||||||| |||| ||
Other Secondary End Point: Target Reductions in Hemoglobin A1C or Triglycerides at 2 Consecutive Visits Before Month 12
The proportion of patients in the FAS who were considered responders at 2 consecutive (nonmissing) visits between months 3 and 12 with reductions in hemoglobin A1C of 1% or more (Table 32) or reductions in triglycerides of 30% or more (Table 33) were evaluated.
In the GL group, ||||| |||||||||| included in the analysis had a reduction in hemoglobin A1C of 1% or greater at 2 consecutive visits, ||||| ||||||||| in the PL subgroup, and ||||| || || |||||||| in the overall PL group. For triglycerides, |||| |||| |||||||| had a 40% or greater reduction at 2 consecutive visits, ||||| |||||||||| in the PL subgroup, and ||||| || ||| || |||||||| in the overall PL group.
||||||||| ||||||||| | ||||| ||||||||| ||||| | ||||| ||||||||| |||||| |||||||||||||| | ||||| ||||||||| ||||||| |||||| |
|---|---|---|---|
||| |||||| |||||||| || ||||| || ||| ||||||||||| |||||| | |||
|||| ||| | ||| |||||| | ||| |||||| | |||| |||||| |
||| | | |||| || ||||| | |||| || ||||| | |||| || ||||| |
||||| |||||| |||||||| || ||||| || ||| ||||||||||| |||||| | |||
|||| ||| | ||| |||||| | ||| |||||| | |||| |||||| |
||| | | |||| || ||||| | |||| || ||||| | |||| || ||||| |
||| |||||| |||||||| || ||||| || ||| ||||||||||| |||||| | |||
|||| ||| | ||| |||||| | ||| |||||| | |||| ||||| |
||| | | |||| || ||||| | |||| || ||||| | |||| || ||||| |
||||||||||||||| |||||||| |||||||||||||||||||| || || ||||||| || ||| |||||| || |||||||| || ||| |||| |||||||| ||| ||| ||| ||||| ||||||||| || ||| ||||||||||| ||||||||||| |||||| ||||||| ||||||| ||||| ||| || ||||| || ||||||| ||||
||||||||| ||||||||| | ||||| ||||||||| ||||| | ||||| ||||||||| |||||| ||||||||||||| | ||||| ||||||||| ||||||| |||||| |
|---|---|---|---|
|||||||| || |||| || ||||||||||||| || ||| ||||||||||| |||||| | |||
|||| ||| | ||| |||||| | ||| |||||| | |||| |||||| |
||| | | |||| || ||||| | |||| || ||||| | |||| || ||||| |
|||||||| || |||| || ||||||||||||| || ||| ||||||||||| |||||| | |||
|||| ||| | ||| |||||| | ||| |||||| | |||| |||||| |
||| || | |||| || ||||| | |||| || ||||| | ||||| ||||| |
|||||||| || |||| || ||||||||||||| || ||| ||||||||||| |||||| | |||
|||| ||| | ||| |||||| | ||| |||||| | |||| |||||| |
||| | | |||| || ||||| | |||| || ||||| | |||| || ||||| |
||||||||||||||| ||||||||| |||||||||||||||||||| || || ||||||| || ||| |||||| || |||||||| || ||| |||| |||||||| ||| ||| ||| ||||| ||||||||| || ||| ||||||||||| ||||||||||| |||||| ||||||| ||||||| ||||| || || ||||| || ||||||| ||||| |||||||| |||||||||||||||||||| ||||||||| ||||||| || |||||||| ||||||||| ||||| |||||||||||||| ||||| |||||
Other Secondary End Point: Effect of Metreleptin Treatment on Hepatic Enzymes – Changes to Month 12 Using LOCF
Approximately half of the patients in the GL group entered the study with elevated hepatic aminotransferase levels (44% with ALT > upper limit of normal [ULN] and 44% with AST > ULN) (refer to Table 24). In the GL group, reductions in both ALT and AST levels occurred during treatment with metreleptin (Table 34). Mean change in the GL group from baseline to month 12 using LOCF in ALT was –191.5 μU/mL; the changes were observed early, with a mean change to month 3 of ||||| |||. Similar results were observed for AST with a mean change for patients in the GL group to month 3 of ||||| ||| and to month 12 of –104.1 μU/mL. The reductions were greater in the male patient with GL, as he had entered the study with elevated aminotransferase levels.
Reductions in aminotransferase levels were also observed among patients in the PL subgroup, although these were of lower magnitude than those in the GL group; this is likely related to lower baseline levels of ALT and AST in this group of patients (29% with ALT > ULN, and none with AST > ULN). In the PL subgroup, mean changes to month 12 (LOCF) in ALT and AST were –5.1 μU/mL and –0.3 μU/mL, respectively.
Reductions in aminotransferase levels were also observed in the overall PL group, although these were also of lower magnitude than that in the GL group; this is likely related to lower baseline levels of ALT and AST in this group of patients (28% with ALT > ULN, and 16% with AST > ULN). In the overall PL group, mean changes to month 12 (LOCF) in ALT and AST were –7.4 μU/mL and –3.6 μU/mL, respectively.
Table 34: Change From Baseline to Month 12 in Liver Aminotransferase Levels (FAS Population)
Glucose levels (mmol/L) | Study FHA101 GL (N = 9) | Study FHA101 PL subgroupa (N = 7) | Study FHA101 PL overall (N = 29) |
|---|---|---|---|
ALT (μU/mL) | |||
Baseline value, n | 9 | 7 | 29 |
Mean (SD) | 122.1 (140.47) | 35.3 (16.64) | 40.7 (34.37) |
Median (min, max) | |||| ||||| || |||||| | |||| ||||| || ||||| | |||| |||| || |||||| |
Actual change from baseline to month 12, n | 4 | 5 | 19 |
Mean (SD) | –191.5 (167.27) | –5.1 (12.94) | –7.4 (25.80) |
Median (min, max) | |||||| |||||||| |||| | |||| ||||||| ||||| | ||| ||||||| ||||| |
AST (μU/mL) | |||
Baseline value, n | 9 | 7 | 29 |
Mean (SD) | 76.0 (72.52) | 27.7 (8.98) | 35.9 (28.44) |
Median (min, max) | |||| ||||| || |||||| | |||| ||||| || ||||| | |||| ||||| || |||||| |
Actual change from baseline to month 12, n | 4 | 5 | 19 |
Mean (SD) | –104.1 (74.18) | –0.3 (7.21) | –3.6 (24.81) |
Median (min, max) | |||||| ||||||| || |||| | ||| |||||| ||||| | ||| ||||||| ||||| |
ALT = alanine aminotransferase; AST = aspartate aminotransferase; FAS = full analysis set; GL = generalized lipodystrophy; max = maximum; min = minimum; PL = partial lipodystrophy; SD = standard deviation.
aThe PL subgroup includes patients with baseline leptin < 12 ng/mL and hemoglobin A1C ≥ 6.5% and/or triglycerides ≥ 5.65 mmol/L.
Sources: Sponsor’s Summary of Clinical Evidence; Study FHA101 Clinical Study Report.45
Exploratory End Point: Early Response – Target Reductions in Hemoglobin A1C or Triglyceride Levels at Month 3
Early response to metreleptin treatment, that is, by month 3 of treatment, was also assessed; results for the FAS are summarized in Table 35.
As shown, ||||| |||||||| in the GL group and |||| || ||||||||||| in the PL subgroup achieved a 1% or greater reduction in hemoglobin A1C by month 3; ||||| || ||| || |||||||| in the overall PL group achieved a 1% or greater reduction in hemoglobin A1C by month 3; reductions of greater than or equal to 2% were achieved by ||||||| in the GL group.
Target reductions of triglycerides of 30% or greater at month 3 were observed in ||||| |||||||||| with GL, in ||||| |||||||| in the PL subgroup, and in ||||| || || |||||||| in the overall PL group, with the same number of patients with GL and ||||| || || |||||||| in the overall PL group achieving 40% or greater reductions by this early time point.
||||||||| ||||||||| | ||||| ||||||||| ||||| | ||||| ||||||||| ||||||||| | ||||| ||||||||| ||||||| |||||| |
|---|---|---|---|
|||||||| || ||||| || |||| | |||
||| |||||| |||||||| || |||| | |||
|||| ||| | ||| |||||| | ||| ||||| | |||| |||||| |
||| ||| | |||| || ||||| | |||| || ||||| | |||| || ||||| |
||||| |||||| |||||||| || |||| | |||
|||| ||| | ||| |||||| | ||| ||||| | |||| ||||| |
||| ||| | |||| || ||||| | |||| || ||||| | |||| || ||||| |
||| |||||| |||||||| || |||| | |||
|||| ||| | ||| |||||| | ||| ||||| | |||| ||||| |
||| ||| | |||| || ||||| | |||| || ||||| | |||| || ||||| |
|||||||| || ||||||||||||| || |||| | |||
|||| |||||||| | |||
|||| ||| | ||| |||||| | ||| |||||| | |||| |||||| |
||| ||| | ||||| || ||||| | |||| || ||||| | |||| || ||||| |
|||| |||||||| | |||
|||| ||| | ||| |||||| | ||| |||||| | |||| |||||| |
||| ||| | ||||| || ||||| | |||| || ||||| | |||| || ||||| |
|||| |||||||| | |||
|||| ||| | ||| |||||| | ||| |||||| | |||| |||||| |
||| ||| | ||||| || ||||| | |||| || ||||| | |||| || ||||| |
||||||||||| ||||||||| |||||| |||||||| |||| |||||||||||||| |||||||||| || ||||||||||| ||||||| || ||| ||||||||| || ||||| |||||||| ||||||| ||||||||||| ||||||| |||||||| |||||||| |||||||||||||| |||||||||||||| |||| |||||||| |||||| ||| ||||| |||| ||||| |||||| ||||||||||||| ||||| |||||||| || ||||| || ||| ||||||| ||||| |||||||| ||||||||||||||||||| ||||||||| ||||||| || |||||||| ||||||||| ||||| |||||||||||||| ||||| |||||
Exploratory End Point: Composite Response – Target Reductions in Both Hemoglobin A1C and Triglycerides at Month 12 Using LOCF
Patients in the FAS who met target decreases in both hemoglobin A1C and triglycerides at the month 12 (LOCF) assessment were evaluated; results are presented in Table 36. In the GL group, |||| |||||||||| achieved both an actual decrease in hemoglobin A1C of 1% or greater and a 30% or greater reduction in triglycerides at month 12 (LOCF); with ||||||| ||||| achieving the highest target reductions of a 2% or greater actual decrease in hemoglobin A1C and a 40% or greater reduction in triglycerides. In the PL subgroup, ||||| |||||||||| achieved the highest target reduction of a 2% or greater actual decrease in hemoglobin A1C and a 40% or greater reduction in triglycerides. In the overall PL group, ||| || || |||||||| achieved the highest target reduction of a 2% or greater actual decrease in hemoglobin A1C and a 40% or greater reduction in triglycerides.
||||||||| ||||||||| | ||||| ||||||||| ||||| | ||||| ||||||||| |||||||||| | ||||| ||||||||| ||||||| |||||| |
|---|---|---|---|
||| |||||| |||||||| || ||||| ||| |||| |||||||| || ||||||||||||| | |||
|||| ||| | ||| |||||| | ||| |||||| | |||| |||||| |
||| | | |||| || ||||| | |||| || ||||| | |||| || ||||| |
||||| |||||| |||||||| || ||||| ||| |||| |||||||| || ||||||||||||| | |||
|||| ||| | ||| |||||| | ||| |||||| | |||| |||||| |
||| | | |||| || ||||| | |||| || ||||| | |||| || ||||| |
||| |||||| |||||||| || ||||| ||| |||| |||||||| || ||||||||||||| | |||
|||| ||| | ||| |||||| | ||| |||||| | |||| ||||| |
||| | | |||| || ||||| | |||| || ||||| | |||| || ||||| |
||||||||||| ||||||||| |||||| |||||||| |||| |||||||||||||| |||||||||| || ||||||||||| ||||||| || ||| ||||||||| || ||||| |||||||| ||||||| ||||||||||| ||||||| |||||||| |||||||| |||||||||||||| |||||||||||||| |||| |||||||| |||||| ||| ||||| |||| ||||| |||||| ||||||||||||| ||||| |||||||| || ||||| || ||| ||||||| ||||| |||||||| ||||||||||||||||||| ||||||||| ||||||| || |||||||| ||||||||| ||||| |||||||||||||| ||||| ||||||
Harms
Analyses of AEs were performed for TEAEs, where “treatment emergent” was defined as any AE that begins or worsens during or after the first injection of metreleptin through 30 days after the last metreleptin dose.
At each visit, all AEs that the investigator judged to be clinically significant and/or related to study medication were recorded in the appropriate section of the AE case report form and evaluated by the investigator. Minimum information required for each AE included type of event, duration (start and end dates), intensity, seriousness, causality to study medication, action taken, and outcome.
A summary of the key harms data in Study FHA101 is presented in Table 37.
Table 37: Study FHA101 Summary of Harms (Safety Analysis Set)
Adverse events | Study FHA101 GL (N = 9) | Study FHA101 PL subgroupa (N = 7) | Study FHA101 PL overall (N = 32) |
|---|---|---|---|
Most common ≥ 10% TEAEs by preferred term, n (%) | |||
Patients with TEAEs | 7 (77.8) | 7 (100.0) | 27 (84.4) |
Hypoglycemia | 2 (22.2) | 3 (42.9) | 11 (34.4) |
Abdominal pain | 2 (22.2) | 1 (14.3) | 5 (15.6) |
Nausea | 1 (11.1) | 2 (28.6) | 12 (37.5) |
Vomiting | 1 (11.1) | 1 (14.3) | 4 (12.5) |
Headache | 1 (11.1) | 1 (14.3) | 4 (12.5) |
Vertigo | 0 | 0 | 4 (12.5) |
Injection site bruising | 1 (11.1) | 1 (14.3) | 4 (12.5) |
Upper respiratory tract infection | 2 (22.2) | 3 (42.9) | 6 (18.8) |
Urinary tract infection | 1 (11.1) | 3 (42.9) | 6 (18.8) |
Sinusitis | 0 | 2 (28.6) | 5 (15.6) |
Muscle spasm | 0 | 1 (14.3) | 6 (18.8) |
Liver function test increased | 2 (22.2) | 1 (14.3) | 1 (3.1) |
Ear infection | 2 (22.2) | 0 | 1 (3.1) |
SAEs reported for ≥ 1 patient by preferred term, n (%) | |||
Patients with ≥ 1 SAE | 6 (66.7) | 0 | 10 (31.3) |
Nausea | |||| ||||||| | |||| ||||||| | |||| ||||||| |
Abdominal pain | |||| ||||||| | |||| ||||||| | |||| ||||||| |
Constipation | |||| ||||||| | |||| ||||||| | |||| ||||||| |
Diabetic gastroparesis | |||| ||||||| | |||| ||||||| | |||| ||||||| |
Diverticulum | |||| ||||||| | |||| ||||||| | |||| ||||||| |
Erosive esophagitis | |||| ||||||| | |||| ||||||| | |||| ||||||| |
Ileus paralytic | |||| ||||||| | |||| ||||||| | |||| ||||||| |
Pancreatitis | |||| ||||||| | |||| ||||||| | |||| ||||||| |
Pancreatitis, acute | |||| ||||||| | |||| ||||||| | |||| ||||||| |
Vomiting | |||| ||||||| | |||| ||||||| | |||| ||||||| |
Cellulitis | |||| ||||||| | |||| ||||||| | |||| ||||||| |
Escherichia urinary tract infection | |||| ||||||| | |||| ||||||| | |||| ||||||| |
Gastroenteritis | |||| ||||||| | |||| ||||||| | |||| ||||||| |
Gastroenteritis, viral | |||| ||||||| | |||| ||||||| | |||| ||||||| |
Infectious colitis | |||| ||||||| | |||| ||||||| | |||| ||||||| |
Urinary tract infection | |||| ||||||| | |||| ||||||| | |||| ||||||| |
Urosepsis | |||| ||||||| | |||| ||||||| | |||| ||||||| |
Liver function tests increased | |||| ||||||| | |||| ||||||| | |||| ||||||| |
Blood creatine phosphokinase increased | |||| ||||||| | |||| ||||||| | |||| ||||||| |
Hypoglycemia | |||| ||||||| | |||| ||||||| | |||| ||||||| |
Diabetic ketoacidosis | |||| ||||||| | |||| ||||||| | |||| ||||||| |
Hyperglycemia | |||| ||||||| | |||| ||||||| | |||| ||||||| |
Hypertriglyceridemia | |||| ||||||| | |||| ||||||| | |||| ||||||| |
Lactic acidosis | |||| ||||||| | |||| ||||||| | |||| ||||||| |
Juvenile idiopathic arthritis | |||| ||||||| | |||| ||||||| | |||| ||||||| |
Tenosynovitis | |||| ||||||| | |||| ||||||| | |||| ||||||| |
Adenocarcinoma | |||| ||||||| | |||| ||||||| | |||| ||||||| |
Squamous cell carcinoma | |||| ||||||| | |||| ||||||| | |||| ||||||| |
Headache | |||| ||||||| | |||| ||||||| | |||| ||||||| |
Loss of consciousness | |||| ||||||| | |||| ||||||| | |||| ||||||| |
Dyspnea | |||| ||||||| | |||| ||||||| | |||| ||||||| |
Pleural effusion | |||| ||||||| | |||| ||||||| | |||| ||||||| |
Hypertension | |||| ||||||| | |||| ||||||| | |||| ||||||| |
Hypotension | |||| ||||||| | |||| ||||||| | |||| ||||||| |
Peripheral vascular disorder | |||| ||||||| | |||| ||||||| | |||| ||||||| |
MELAS syndrome | |||| ||||||| | |||| ||||||| | |||| ||||||| |
Vertigo positional | |||| ||||||| | |||| ||||||| | |||| ||||||| |
Chest pain | |||| ||||||| | |||| ||||||| | |||| ||||||| |
Suicidal ideation | |||| ||||||| | |||| ||||||| | |||| ||||||| |
Chronic kidney disease | |||| ||||||| | |||| ||||||| | |||| ||||||| |
Urticaria | |||| ||||||| | |||| ||||||| | |||| ||||||| |
Patients who stopped treatment due to adverse events, n (%) | |||
Patients with TEAEs leading to discontinuation | 1 (11.1) | 0 | 3 (9.4) |
Muscle spasms | |||| ||||||| | |||| ||||||| | |||| ||||||| |
Adenocarcinoma | 1 (11.1) | 0 | 0 |
Loss of consciousness | 0 | 0 | 1 (3.1) |
Pleural effusion | |||| ||||||| | |||| ||||||| | |||| ||||||| |
Deaths, n (%) | |||
Patients who died | 1 (11.1) | 0 | 1 (3.1) |
Loss of consciousness | 0 | 0 | 1 (3.1) |
Adenocarcinoma | 1 (11.1) | 0 | 0 |
GL = generalized lipodystrophy; MELAS = mitochondrial encephalomyopathy with lactic acidosis and stroke-like episodes; PL = partial lipodystrophy; SAE = serious adverse event; TEAE = treatment-emergent adverse event.
Note: System organ classes and preferred terms are coded using the Medical Dictionary for Regulatory Activities (MedDRA) Version 19.0. System organ classes and preferred terms are listed in descending order of frequency based on the overall safety analysis set. A study participant with multiple occurrences of an adverse event is counted only once in the System Organ Class and Preferred Term category.
Sources: Sponsor’s Summary of Clinical Evidence; Study FHA101 Clinical Study Report.45
GL Group
In the GL group, 7 (78%) of the 9 patients reported at least 1 TEAE; drug-related TEAEs were reported for 6 (67%) of the patients with GL. TEAEs reported in 2 or more patients in the GL group were hypoglycemia, upper respiratory tract infection, abdominal pain, increased liver function tests, and ear infection (each 2 patients).
One ||||||||||| |||||| patient died of worsening adenocarcinoma of undetermined origin. Overall, 6 (67%) of the 9 patients with GL experienced at least 1 SAE. The most commonly reported SAE was ||||||||| ||||| |||||||| ||||| || |||||||||; all other SAEs were reported in || |||||||.
There was 1 TEAE that led to discontinuation of study treatment by a patient in the GL group (||||||||| ||||||||||||||).
Overall PL Group
In the overall PL group, 27 (84%) of the 32 patients reported at least 1 TEAE. TEAEs reported in 2 or more patients in the overall PL group were hypoglycemia, abdominal pain, nausea, vomiting, headache, vertigo, injection site bruising, upper respiratory tract infection, urinary tract infection, sinusitis, and muscle spasm.
One ||||||||||| |||||| patient in the overall PL group experienced loss of consciousness that resulted in death. SAEs were reported in 10 (31%) of the 32 patients in the overall PL group, most commonly |||||||||||| reported for | patients.
Critical Appraisal
Internal Validity
The single-arm design is a key limitation to the interpretation of the results from a single-arm trial, as it is difficult to distinguish between the effect of the intervention relative to a placebo effect, or the effect of natural history. It is acknowledged that there may be practical limitations to conducting an RCT with patients with lipodystrophy due to the rarity of the condition. However, while this provides context to the decision to conduct a single-arm trial, the limitations to the interpretation of the results remain. The open-label nature of the trial also increases the risk of bias. Nevertheless, the end points included are objective laboratory values and therefore are unlikely to have been influenced by this bias. Harms outcomes, however, may be impacted by the open-label design of the study. In addition, only a small number of patients with GL and PL were evaluated, so observed results should be interpreted with caution given the small size of this study and the lack of a placebo control. Statistical hypothesis testing was not part of the design, and there was no active comparator or placebo arm.
External Validity
As there were no study sites in Canada, there may be limitations in generalizing these findings to the context in Canada.
Discussion
Summary of Available Evidence
The evidence included in this review consisted of 1 pivotal trial in the systematic review (the NIH 991265/20010769 study),39 1 supportive trial (Study FHA101),45 1 sponsor-submitted historical control arm analysis,23 and 1 historical control arm analysis identified in the literature (Cook et al. (2021).44
The NIH 991265/20010769 study was a phase II/III, open-label, single-arm, single-centre, investigator-sponsored study. Study 991265 was a pilot, dose-escalation study to determine if metreleptin can be safely administered to a group of patients with clinically significant lipodystrophy and to determine if metreleptin treatment will be effective in lowering plasma glucose and lipid abnormalities experienced by patients with clinically significant lipodystrophy. Eight of the 9 participants in the pilot Study 991265 elected to continue on to the long-term Study 20010769, and new participants were enrolled from July 2000 to March 2014. A total of 107 participants were enrolled, 66 with GL and 41 with PL. Patients could participate in the studies for up to 14 years; however, the co-primary end points were change from baseline to month 12 in hemoglobin A1C and fasting triglyceride levels. Key secondary end points included the proportion of patients achieving target actual decreases of 1% or greater, 1.5% or greater, and 2% or greater in hemoglobin A1C or target actual decreases of 30% or greater, 35% or greater, and 40% or greater in fasting serum triglycerides at month 12 and change from baseline in fasting plasma glucose.
In the NIH 991265/20010769 study, 77.3% of patients in the GL cohort and 97.6% of the patients in the PL cohort were female. Mean age was 17.8 years in the GL cohort and 34.1 years in the PL cohort. Baseline mean hemoglobin A1C was 8.6% (SD = 2.32%) in the GL cohort and 8.0% (SD = 2.15%) in the PL cohort, while mean baseline fasting triglyceride levels were 14.5 mmol/L (SD = ||||| mmol/L) in the GL cohort and |||| |||||| ||||||| in the PL cohort.
One sponsor-submitted historical control arm analysis using retrospective chart review data compared against the NIH 991265/20010769 follow-up study using IPW was summarized and critically appraised. The analysis used IPW based on 3 covariates: age, sex, and lipodystrophy subtype (GL or PL). End points included change in hemoglobin A1C, triglyceride levels, and all-cause mortality.
An historical control arm analysis using retrospective chart review data compared against the NIH 991265/20010769 study was identified in the literature, summarized, and critically appraised. The analysis used a matching methodology to identify patients with the greatest similarity based on age, sex, lipodystrophy diagnosis type, number of organs (heart, kidney, or liver) with an observed abnormality, and presence of elevated hemoglobin A1C levels (≥ 6.5%) at treatment initiation.
Study FHA101 was a single-arm, multicentre, open-label, expanded-access study conducted at multiple treatment centres in the US. The primary objective was to provide metreleptin, an investigational medication, under a treatment protocol to patients with lipodystrophy associated with diabetes mellitus and/or hypertriglyceridemia. A secondary objective was to assess the long-term efficacy, safety, and tolerability of metreleptin for people with diabetes mellitus and/or hypertriglyceridemia. The main efficacy outcomes assessed in this study were hemoglobin A1C and fasting serum triglycerides. Other outcomes measured in this study include fasting plasma glucose and hepatic enzymes such as ALT and AST.
Interpretation of Results
Efficacy
The efficacy of metreleptin treatment for patients with lipodystrophy was informed by 1 pivotal trial, the NIH 991265/20010769 study, which enrolled 107 patients, 66 with GL and 41 with PL. Lipodystrophy, particularly the GL form, is a rare disease, and metreleptin is the only drug approved for use in this disease. As such, the single-arm design of the pivotal trial is understandable, and the small sample size is expected. Nevertheless, these limitations resulted in initiating GRADE assessment at a level of “very low” and further downgrading for imprecisions in the assessment of the certainty of evidence by GRADE. The clinical experts consulted by CADTH highlighted that the enrolled patients were generally similar to those encountered in real-world clinical practice despite the small sample sizes. The key clinical inclusion criteria aligned with clinical practice guidelines per the clinical experts consulted by CADTH.
The NIH 991265/20010769 study included co-primary end points of change from baseline to month 12 in hemoglobin A1C and fasting triglyceride levels, both of which the clinical experts consulted by CADTH considered clinically important. The results in the GL cohort were considered clinically meaningful with a mean change from baseline in hemoglobin A1C of –2.2% (95% CI, –2.7% to –1.6%) and in triglyceride levels of –32.1% (95% CI, –51.0% to –13.2%). These results align with the clinical experts’ expectations for metreleptin as a first-line therapy for patients with GL. The importance of these results is further highlighted by the lack of efficacy shown by standard-of-care therapies in this patient group, according to clinical experts. The results in the overall PL cohort were lower in magnitude, with a mean change from baseline in hemoglobin A1C of –0.6% (95% CI, |||| || ||||) and triglyceride levels of |||||| |||| ||| ||||| || |||||). The triglyceride results may have been impacted by a patient with noncompliance behaviour; when their data were removed from the analysis, change from baseline in triglyceride levels was –20.8% (95% CI, ||||| || ||||). These results also align with the clinical expectations of metreleptin in the PL population; it is expected that some patients could have their metabolic parameters controlled with standard-of-care therapies, while metreleptin may be an option for patients with severe PL and elevated markers of metabolic abnormalities. The specified PL subgroup in the NIH 991265/20010769 study was defined as patients with baseline hemoglobin A1C levels of 6.5% or greater and/or triglyceride levels of 5.65 mmol/L or greater. The clinical experts consulted considered these baseline values as a reasonable way to identify those patients with PL that cannot be controlled with standard-of-care therapy. The mean change from baseline in this subgroup of patients in hemoglobin A1C was –0.9% (95% CI, |||| || ||||) and triglyceride levels was ||||| |||| ||| ||||| || ||||||. Again, the triglyceride results may have been impacted by data from a patient with noncompliance behaviour; when data related to this patient were removed from the analysis, change from baseline in triglyceride levels was –37.4% (95% CI, ||||| || |||||). It should be noted that the high amount of missing data may have resulted in overestimating the treatment effect through violation of the intention-to-treat principle (through the exclusion of patients with final observations before 6 months) and underestimated the variance in the results (through imputation of 6-month results to the 12-month time point). Other end points included in this review were change from baseline in fasting glucose and change from baseline in liver volume, the results of which were generally consistent with that of the co-primary end points.
Metabolic parameter end points are important for clinical decision-making, according to the clinical experts. However other outcomes important to patients were not included in the pivotal NIH 991265/20010769 study. Given the importance of leptin in the regulation of hunger, patients with leptin deficiency experience unsatisfiable hunger that often leads to overeating. Patient input identified reducing this constant hunger as very important. Hunger and HRQoL were not included in the NIH 991265/20010769 study and therefore the impact of metreleptin on hunger remains uncertain; however, some published evidence suggests that patients receiving metreleptin treatment report a decrease in appetite.46 Fertility in people who are of child-bearing potential and the resumption of normal puberty in adolescents are other important outcomes identified by patients and by clinical experts; these were studied in a small subset of patients from the NIH 991265/20010769 study. While the results show a resumption of normal menses for 8 patients, baseline pubertal status and subsequent follow-up of only 3 patients was assessed and therefore the impact on puberty is uncertain.
Patients could be enrolled for up to 14 years in the NIH 991265/20010769 study; however, the co-primary end point analyses were for change from baseline to month 12. The clinical experts consulted by CADTH noted that 12 months is a reasonable amount of time in which to expect a detectable response to metreleptin, although it is insufficient to evaluate long-term outcomes such as differences in long-term organ complications or mortality. The supportive single-arm FHA101 study was broadly consistent with the pivotal NIH 991265/20010769 study.
Both the unpublished analysis and the Cook et al. (2021)44 historical control arm analyses compared retrospective chart review data of patients with lipodystrophy receiving standard of care with a population of patients with lipodystrophy receiving metreleptin, mostly from the NIH 991265/20010769 study. There was little overlap between the outcomes assessed in each analysis, as such, determining the level of consistency between the analyses was difficult. The Cook et al. (2021) analysis assessed the time-to-mortality and risk of mortality in the combined GL and PL population. The matched analysis found no difference between the metreleptin-treated and metreleptin-naive populations. A Cox proportional hazards analysis controlling for selected variables found a benefit in time-to-mortality in the combined GL and PL population; no difference was found in the GL only population. Major limitations were associated with these analyses, including the retrospective source of the historical control arm and the low number of events captured, leading to imprecise CIs.
The sponsor-submitted unpublished historical control arm analysis assessed risk of mortality in the combined GL and PL population and found no difference between the metreleptin with or without supportive care population and the supportive care alone population. Given the small number of deaths reported in the follow-up time available, the results in this outcome are very uncertain. The unpublished historical control arm analysis also assessed change from baseline in hemoglobin A1C and triglyceride levels; however, the inability to adjust for important prognostic covariates due to high amounts of missing data rendered any estimates of the relative efficacy of metreleptin against standard-of-care therapies alone uninformative.
Harms
Analysis of safety for metreleptin was based on the safety analysis set in the NIH 991265/20010769 study, which included all 66 patients with GL and 41 patients with PL. The incidence of harms reported in the NIH 991265/20010769 study were as expected, according to clinical experts consulted by CADTH, with 89.4% of patients in the GL cohort and 85.4% of patients in the PL cohort reporting TEAEs. One TEAE that warrants further discussion is hypoglycemia, which occurred in 15.2% of patients in the GL cohort and 17.1% of patients in the PL cohort. Discussion with the clinical experts revealed that hypoglycemia can become an issue when receiving metreleptin because the patient can become much more insulin sensitive very quickly. If the background insulin is not proactively adjusted, hypoglycemia could occur. The clinical experts suggested that potential occurrence of hypoglycemia is manageable provided metreleptin is prescribed under the care of an endocrinologist or a pediatric endocrinologist. Similar conclusions regarding harms can be drawn from the supportive Study FHA101.
The historical control arm analyses included by the sponsor did not include outcomes related to harms.
Conclusion
Lipodystrophy is a rare disease with no therapies currently available that directly target the underlying disease pathology. There is an unmet need for effective therapies that control metabolic parameters for patients with GL and an unmet need for effective therapies that control metabolic parameters for patients with PL who are unable to achieve metabolic control with current standard-of-care therapies. Metreleptin is a first-in-class treatment that replaces leptin and directly targets the underlying leptin deficiency experienced by patients with lipodystrophy. The NIH 991265/20010769 study showed improvements from baseline in hemoglobin A1C and triglyceride levels; however, the evidence is very uncertain regarding the effects of metreleptin on metabolic parameters, mainly due to the lack of a comparator arm. Evidence gaps from the NIH 991265/20010769 study include the effect of metreleptin treatment on outcomes identified by patients as important, such as impact on hunger, HRQoL, and fertility; as such, the impact of metreleptin on these outcomes is uncertain. Treatment with metreleptin was well tolerated over the study period and the safety profile was as expected, according to clinical experts.
There were important technical limitations in the conduct of the historical control arm comparisons, including not adjusting for important prognostic covariates, missing data, and unclear standard of therapies used for the historical control arm. As such, the historical control arm analyses were inconclusive and imprecise given the small sample sizes and wide 95% CIs.
While the results of the included studies aligned with clinical experts’ expectations that metreleptin will address the unmet needs of this patient population, the single-arm design of the trial and the high amount of missing data at the 12-month time point are important limitations that resulted in uncertainty in the evidence.
References
1.Brown RJ, Araujo-Vilar D, Cheung PT, et al. The Diagnosis and Management of Lipodystrophy Syndromes: A Multi-Society Practice Guideline. J Clin Endocrinol Metab. 2016;101(12):4500-4511. PubMed
2.Javor ED, Cochran EK, Musso C, Young JR, Depaoli AM, Gorden P. Long-term efficacy of leptin replacement in patients with generalized lipodystrophy. Diabetes. 2005;54(7):1994-2002. PubMed
3.Haque WA, Shimomura I, Matsuzawa Y, Garg A. Serum adiponectin and leptin levels in patients with lipodystrophies. J Clin Endocrinol Metab. 2002;87(5):2395. PubMed
4.Akinci B, Oral E, Neidert A, et al. Burden of illness associated with generalized lipodystrophy in leptin replacement therapy-naïve patients: A longitudinal medical chart review study [sponsor supplied reference]. Poster presented at: EASD; 2018.2018: https://www.easd.org/virtualmeeting/home.html#!resources/burden-of-illness-associated-with-generalised-lipodystrophy-gl-in-leptin-replacement-therapy-naive-patients-a-longitudinal-medical-chart-review-study.
5.Aegerion Pharmaceuticals. Clinical study report: Protocol 991265 and 20010769. Metreleptin: Long Term Efficacy and Safety of Leptin Replacement in the Treatment of Patients with Lipodystrophy. 2016 [sponsor supplied reference].
6.Cook K, Adamski K, Gomes A, et al. Effects of Metreleptin on Patient Outcomes and Quality of Life in Generalized and Partial Lipodystrophy. J Endocr Soc. 2021;5(4):bvab019. PubMed
7.Akinci B, Oral EA, Neidert A, et al. Comorbidities and Survival in Patients With Lipodystrophy: An International Chart Review Study. J Clin Endocrinol Metab. 2019;104(11):5120-5135. PubMed
8.Javor ED, Moran SA, Young JR, et al. Proteinuric nephropathy in acquired and congenital generalized lipodystrophy: baseline characteristics and course during recombinant leptin therapy. J Clin Endocrinol Metab. 2004;89(7):3199-3207. PubMed
9.Akinci B, Unlu SM, Celik A, et al. Renal complications of lipodystrophy: A closer look at the natural history of kidney disease. Clin Endocrinol (Oxf). 2018;89(1):65-75. PubMed
10.Chiquette E, Oral EA, Garg A, Araujo-Vilar D, Dhankhar P. Estimating the prevalence of generalized and partial lipodystrophy: findings and challenges. Diabetes Metab Syndr Obes. 2017;10:375-383. PubMed
11.Aegerion Pharmaceuticals Ltd. BASELINE ANALYSIS REPORT - Assessing the impact of lipodystrophy on health related quality of life: The QuaLip study [sponsor supplied reference]. 2019.
12.Dhankhar P, Isupov T, Araujo-Vilar D, et al. Estimating Quality of Life of Patients with Lipodystrophy. Value in Health. 2015 May 1;18(3):A292.
13.Sullivan PW, Ghushchyan VH. EQ-5D Scores for Diabetes-Related Comorbidities. Value Health. 2016;19(8):1002-1008. PubMed
14.Eldin AJ, Akinci B, Luo Y, et al. Pain Is a Major Driver of Quality of Life and Psychoemotional Health in Lipodystrophy Syndromes. J Endocrine Soc. 2020;4 Suppl. 1:A571.
15.Gomes A, Cook K, Wong A, Tuttle E, Stratton A, Sanders R. Experiences and Perspectives of Patients with Non-HIV-Associated Lipodystrophies and Their Caregivers: A Qualitative Study. Patient. 2021;14(5):673-685. PubMed
16.Jalal Eldin A, Akinci B, Meral R, et al. MON-101 The LD Lync Study: Natural History Study of Lipodystrophy Syndromes: Early Lessons from the Pilot Data. J Endocr Soc. 2019;3(Supplement_1).
17.Calabro PF, Ceccarini G, Calderone A, et al. Psychopathological and psychiatric evaluation of patients affected by lipodystrophy. Eat Weight Disord. 2020;25(4):991-998. PubMed
18.The Analysis Group. Technical Report: Lipodystrophy Patient and Caregiver Research. 2018 Oct 17 [sponsor supplied reference].
19.National Institute for Health and Care Excellence. Metreleptin for treating lipodystrophy [sponsor supplied reference]. (HST14). London (GB): NICE; 2021: https://www.nice.org.uk/guidance/hst14/resources/metreleptin-for-treating-lipodystrophy-pdf-50216258848453.
20.Hallal C, Kieling CO, Nunes DL, et al. Diagnosis, misdiagnosis, and associated diseases of achalasia in children and adolescents: a twelve-year single center experience. Pediatr Surg Int. 2012;28(12):1211-1217. PubMed
21.Rother KI, Brown RJ. Novel forms of lipodystrophy: why should we care? Diabetes Care. 2013;36(8):2142-2145. PubMed
22.Amryt Pharmaceuticals DAC, Imported by Medison Pharma Canada Inc. MYALEPTA (metreleptin for injection) Product Monograph. Draft [sponsor supplied reference].
23.FIECON. Indirect Treatment Comparison Technical Report. Mereleptin for the treatment of patients with lipodystrophy. 21 February 2020. Unpublished [sponsor supplied reference].
24.Patni N, Alves C, von Schnurbein J, et al. A Novel Syndrome of Generalized Lipodystrophy Associated With Pilocytic Astrocytoma. J Clin Endocrinol Metab. 2015;100(10):3603-3606. PubMed
25.Gupta N, Asi N, Farah W, et al. Clinical Features and Management of Non-HIV-Related Lipodystrophy in Children: A Systematic Review. J Clin Endocrinol Metab. 2017;102(2):363-374. PubMed
26.Porterhouse Insights. Lipodystrophy caregiver disease burden survey. 2020 [sponsor supplied reference].
27.de Azevedo Medeiros LB, Candido Dantas VK, Craveiro Sarmento AS, et al. High prevalence of Berardinelli-Seip Congenital Lipodystrophy in Rio Grande do Norte State, Northeast Brazil. Diabetol Metab Syndr. 2017;9:80. PubMed
28.Gonzaga-Jauregui C, Ge W, Staples J, et al. Clinical and Molecular Prevalence of Lipodystrophy in an Unascertained Large Clinical Care Cohort. Diabetes. 2020;69(2):249-258. PubMed
29.Handelsman Y, Oral EA, Bloomgarden ZT, et al. The clinical approach to the detection of lipodystrophy - an AACE consensus statement. Endocr Pract. 2013;19(1):107-116. PubMed
30.Araujo-Vilar D, Santini F. Diagnosis and treatment of lipodystrophy: a step-by-step approach. J Endocrinol Invest. 2019;42(1):61-73. PubMed
31.Tanaka T, Kusakabe T, Ebihara K, et al. Practice guideline for lipodystrophy syndromes-clinically important diseases of the Japan Endocrine Society (JES). Endocr J. 2021;68(9):1027-1042. PubMed
32.Shamsudeen I, Hegele RA. Advances in the care of lipodystrophies. Curr Opin Endocrinol Diabetes Obes. 2022;29(2):152-160. PubMed
33.Brown RJ, Valencia A, Startzell M, et al. Metreleptin-mediated improvements in insulin sensitivity are independent of food intake in humans with lipodystrophy. J Clin Invest. 2018;128(8):3504-3516. PubMed
34.Brown RJ, Oral EA, Cochran E, et al. Long-term effectiveness and safety of metreleptin in the treatment of patients with generalized lipodystrophy. Endocrine. 2018;60(3):479-489. PubMed
35.Chan JL, Lutz K, Cochran E, et al. Clinical effects of long-term metreleptin treatment in patients with lipodystrophy. Endocr Pract. 2011;17(6):922-932. PubMed
36.Diker-Cohen T, Cochran E, Gorden P, Brown RJ. Partial and generalized lipodystrophy: comparison of baseline characteristics and response to metreleptin. J Clin Endocrinol Metab. 2015;100(5):1802-1810. PubMed
37.Oral EA, Simha V, Ruiz E, et al. Leptin-Replacement Therapy for Lipodystrophy. NEJM. 2002;346(8):570-578. PubMed
38.Oral EA, Gorden P, Cochran E, et al. Long-term effectiveness and safety of metreleptin in the treatment of patients with partial lipodystrophy. Endocrine. 2019;64(3):500-511. PubMed
39.Clinical Study Report: 991265/20010769. Long Term Efficacy and Safety of Leptin Replacement in the Treatment of Patients with Lipodystrophy [internal sponsor's report]. Cambridge (MA): Aegerion Pharmaceuticals, Inc.; 2016.
40.Musso C, Cochran E, Javor E, Young J, DePaoli AM, Gorden P. The long-term effect of recombinant methionyl human leptin therapy on hyperandrogenism and menstrual function in female and pituitary function in male and female hypoleptinemic lipodystrophic patients. Metabolism. 2005;54(2):255-263. PubMed
41.Balshem H, Helfand M, Schünemann HJ, et al. GRADE guidelines: 3. Rating the quality of evidence. Journal of clinical epidemiology. 2011;64(4):401-406. PubMed
42.Santesso N, Glenton C, Dahm P, et al. GRADE guidelines 26: informative statements to communicate the findings of systematic reviews of interventions. Journal of clinical epidemiology. 2020;119:126-135. PubMed
43.Indirect Treatment Comparison Technical Report Metreleptin for the treatment of patients with lipodystrophy [internal sponsor's report]. In: Drug Reimbursement Review sponsor submission: Metreleptin 3 mg, 5.8 mg, and 11.3 mg, powder for solution, subcutaneous injection. St. Albans, Hertfordshire: Medison Pharma Canada Inc.; 2020 Feb 21.
44.Cook K, Ali O, Akinci B, et al. Effect of Leptin Therapy on Survival in Generalized and Partial Lipodystrophy: A Matched Cohort Analysis. J Clin Endocrinol Metab. 2021;106(8):e2953-e2967. PubMed
45.Clinical Study Report: Study FHA101. Metreleptin. An Open-Label Treatment Protocol to Provide Metreleptin for the Treatment of Diabetes Mellitus and/or Hypertriglyceridaemia Associated with Lipodystrophy [internal sponsor's report]. Cambridge, MA: Aegerion Pharmaceuticals, Inc; 2016.
46.Moran SA, Patten N, Young JR, et al. Changes in body composition in patients with severe lipodystrophy after leptin replacement therapy. Metabolism. 2004;53(4):513-519. PubMed
Pharmacoeconomic Review
Abbreviations
ALT
alanine transaminase
AST
aspartate transaminase
BIA
budget impact analysis
EHR
electronic health record
GL
generalized lipodystrophy
ICER
incremental cost-effectiveness ratio
ITC
indirect treatment comparison
NIH
National Institutes of Health
NOC
Notice of Compliance
PCOS
polycystic ovarian syndrome
PL
partial lipodystrophy
QALY
quality-adjusted life-year
TTO
time trade-off
UKPDS
United Kingdom Prospective Diabetes Study
WTP
willingness to pay
Executive Summary
The executive summary comprises 2 tables (Table 1 and Table 2) and a conclusion.
Item | Description |
|---|---|
Drug product | Metreleptin (Myalepta), 3 mg, 5.8 mg, and 11.3 mg powder for solution |
Submitted price | Metreleptin, 3 mg, 5.8 mg, and 11.3 mg powder for solution, subcutaneous injection: $803, $1,605, and $3,120, respectively. |
Indication | As an adjunct to diet as a replacement therapy to treat the complications of leptin deficiency in lipodystrophy patients:
|
Health Canada approval status | NOC |
Health Canada review pathway | Priority review |
NOC date | January 17, 2024 |
Reimbursement request | As per indication |
Sponsor | Medison Pharma Canada Inc. |
Submission history | Previously reviewed: No |
GL = generalized lipodystrophy; LD = lipodystrophy; NOC = Notice of Compliance; PL = partial lipodystrophy.
Table 2: Summary of Economic Evaluation
Component | Description |
|---|---|
Type of economic evaluation | Cost-utility analysis Patient-level simulation consisting of 6 separate Markov submodels |
Target population | Patients with confirmed congenital or acquired GL aged 2 years and older, as well as patients with confirmed familial or acquired PL aged 12 years or older for whom standard treatments have failed to achieve adequate metabolic control. The target population is aligned with the proposed Health Canada indication. |
Treatment | Metreleptin, in combination with supportive care (SC). SC consists of antidiabetic therapies (i.e., insulin, metformin, empagliflozin, semaglutide), lipid-lowering therapies (i.e., atorvastatin, rosuvastatin, fenofibrate, bezafibrate), and antihypertensive therapies (i.e., ramipril, losartan). |
Comparator | SC |
Perspective | Publicly funded health care payer in Canada |
Outcomes | QALYs, life-years |
Time horizon | Lifetime (95 years) |
Key data sources |
|
Submitted results |
|
Key limitations |
|
CADTH reanalysis results |
|
ALT = alanine transaminase; AST = aspartate transaminase; GL = generalized lipodystrophy; ICER = incremental cost-effectiveness ratio; ITC = indirect treatment comparison; LD = lipodystrophy; NIH = National Institutes of Health; NOC = Notice of Compliance; PL = partial lipodystrophy; QALY = quality-adjusted life-year; SC = supportive care; WTP = willingness to pay.
Conclusions
Evidence from the National Institutes of Health (NIH) 991265/20010769 study suggests that metreleptin in combination with supportive care is associated with clinically meaningful improvements in changes from baseline in hemoglobin A1C, alanine transaminase (ALT), and aspartate transaminase (AST) at 12 months in patients with generalized lipodystrophy (GL) and patients with partial lipodystrophy (PL). The CADTH Clinical Review noted that, as a phase II/III, single-arm clinical trial, the NIH 991265/20010769 study’s lack of comparative data was a key limitation to the interpretation of the results, as it is difficult to distinguish between the effect of the intervention relative to a placebo effect or the effect of natural history. The CADTH Clinical Review further noted that the large number of drop-outs and missing data must be taken into account when assessing the efficacy end points in the pivotal trial. Given that only 59 of 66 patients with GL and 37 of 41 patients with PL who received metreleptin were included in the change from baseline in hemoglobin A1C results, the sponsor’s analysis does not adhere to the intention-to-treat philosophy and likely overestimates the treatment effect. Therefore, CADTH’s ability to draw robust conclusions from the change from baseline results is limited. This uncertainty is propagated into the submitted economic model given that the absolute mean reductions in hemoglobin A1C observed between baseline and month 12 were used to generate transition probabilities in the cardiovascular, kidney, retinopathy, and neuropathy submodels in the sponsor’s patient-level simulation.
The CADTH base-case results were similar to the sponsor’s submitted analysis: metreleptin plus supportive care was not cost-effective relative to supportive care alone at a willingness-to-pay (WTP) threshold of $50,000 per quality-adjusted life-year (QALY) gained. In the CADTH base case, metreleptin plus supportive care was associated with an incremental cost-effectiveness ratio (ICER) of $5,308,188 per QALY gained compared to supportive care alone (incremental costs: $6,895,438; incremental QALYs: 1.30). Drug acquisition costs for metreleptin represented the entirety (approximately100%) of incremental cost compared to supportive care alone. The probability that metreleptin plus supportive care was cost-effective at a WTP threshold of $50,000 per QALY was 0%. The estimated ICER was higher than the sponsor’s base-case value, driven primarily by the exclusion of caregiver disutilities and the reversal of the hemoglobin A1C benefit after treatment discontinuation. Reducing the price of metreleptin would improve the likelihood of cost-effectiveness. A price reduction from $803 to $8 (2.5 mg dose), or from $1,605 to $16 (5 mg dose), or from $3,120 to $31 (10 mg dose) would decrease the ICER of metreleptin plus supportive care to $50,000 per QALY gained. The estimated incremental effectiveness of metreleptin remains highly uncertain due to limitations within the clinical evidence.
Stakeholder Input Relevant to the Economic Review
This section is a summary of the feedback received from the patient groups, registered clinicians, and drug plans that participated in the CADTH review process.
One patient group, the Lipodystrophy Canada Foundation, provided input through data collected from 2 patients with lipodystrophy living in Canada and the UK. The most important outcomes for the patients included delaying disease progression and long-term complications, with the ultimate objective of improving survival, reducing side effects from treatments, preserving independence to minimize the burden on caregivers, and maintaining quality of life. Overall, patients’ experience was influenced by the physical symptoms associated with lipodystrophy (e.g., fatigue, extreme hunger, and generalized pain) and the psychosocial effects associated with the disease (i.e., depression associated with multiple-organ disease progression and anxiety associated with extreme hunger and food-seeking behaviour). In terms of experience with current treatment options, both of the patients surveyed receive antidiabetic therapies, lipid-lowering therapies, and antihypertensive therapies. Important side effects of therapies included gastrointestinal upset, fatigue, and skin fibrosis associated with insulin injections. Patients emphasized the need for therapies that directly target lipodystrophy in addition to therapies that manage the cascading effects of the condition on multiple-organ systems. The patients noted that current therapeutic options, which primarily target each of the metabolic and cardiovascular pathologies associated with lipodystrophy, offer suboptimal management even at maximum dosages and frequencies. Of note, both respondents had experience with metreleptin. While receiving treatment with metreleptin, patients experienced the complete reversal of severe fatty liver, normalization of serum triglycerides, increased insulin sensitivity and complete cessation of insulin therapy, restoration of menses, improvement in acanthosis nigricans, and improvement in hyperphagia. The patients did not report any treatment-emergent side effects with metreleptin.
Registered clinician input was received from a group of endocrinologists, medical geneticists, lipidologists, and internal medicine specialists from across Canada linked by a common interest in the care of patients with lipodystrophy. According to clinician input, the comorbid conditions and complications experienced by patients with lipodystrophy tend to be managed suboptimally with supportive care, which fails to target the underlying pathophysiology. Clinicians noted that current supportive care consists of the treatment of metabolic complications associated with the disease and includes low fat diets, antidiabetic medications, and lipid-lowering medications. Clinicians further noted that antidiabetic therapies may be effective in some patients; however, diabetes is often suboptimally managed despite high doses of insulin. Clinician groups highlighted the significant unmet medical need for a therapy that aims at correcting the underlying pathophysiology of leptin deficiency, as conventional treatments fail in the majority of patients with lipodystrophy and increase their risk of end-organ damage and early death. Clinicians noted that metreleptin is the only lipodystrophy therapy that targets the underlying leptin deficiency and that it would be considered first-line therapy for patients with GL. Furthermore, it was noted that metreleptin should be considered in the first-line setting for patients with PL with metabolic parameters similar to those experienced by patients with GL in terms of their severity and refractory nature.
Participating drug plans asked whether patients would be required to receive supportive care before determining whether they were eligible to receive metreleptin treatment as well as whether objective clinical parameters could be used to determine renewal of treatment. Drug plans voiced concerns related to the potential difficulty in accessing endocrinology specialists in remote areas, thus leading to the question of whether metreleptin treatment could be initiated by internal medicine physicians in consultation with specialists. In addition, drug plans noted that genetic testing would be required to make a definitive diagnosis among patients with suspected lipodystrophy, which may exacerbate accessibility issues. Finally, participating drug plans anticipated that since dosing is weight-based for patients weighing less than or equal to 40 kg (0.06 mg/kg) and each vial requires reconstitution, the remainder of the 3 mg dose vial would be considered wastage and discarded.
Several of these concerns were addressed in the sponsor’s model:
The impact of disease complications on patients’ quality of life was captured across 6 organ systems with utility values.
CADTH was unable to address the following concerns raised from stakeholder input:
Given that metreleptin has demonstrated health benefits beyond those encompassed in the scope of this economic analysis (including improvements in hyperphagia and polycystic ovarian syndrome [PCOS] symptoms), CADTH notes that the effectiveness of metreleptin may be underestimated due to the submitted model’s inability to account for potential incremental utility gains associated with these other symptoms.
Economic Review
The current review is for metreleptin (Myalepta), for patients with confirmed congenital or acquired GL, as well as patients with confirmed familial or acquired PL aged 12 years or older with persistent significant metabolic abnormalities (e.g., persistent insulin resistance, poorly controlled diabetes, persistent hypertriglyceridemia) for whom standard treatments have failed to achieve adequate metabolic control.
Economic Evaluation
Summary of Sponsor’s Economic Evaluation
Overview
The sponsor submitted a cost-utility analysis of metreleptin treatment in combination with supportive care compared with supportive care alone.1 Aligned with Health Canada’s indicated population, the modelled population comprised patients with confirmed congenital or acquired GL, as well as patients with confirmed familial or acquired PL aged 12 years or older with persistent significant metabolic abnormalities (e.g., persistent insulin resistance, poorly controlled diabetes, persistent hypertriglyceridemia) for whom standard treatments have failed to achieve adequate metabolic control.
Metreleptin functions by binding to and activating the human leptin receptor, which belongs to the Class I cytokine family of receptors that signals through the Janus kinase/signal transducer and activator of transcription transduction pathway.2 Metreleptin is available as a 3 mg, 5.8 mg, and 11.3 mg lyophilized powder for solution for subcutaneous injection.2 The recommended daily dose of metreleptin is based on body weight. Metreleptin should be self-administered once daily at the same time every day. Based on clinical response and tolerability, the dose may be decreased or increased by the recommended dose adjustment levels to the maximum dose (refer to Table 17). Metreleptin dose increases in children and adults based on incomplete clinical response can be considered after a minimum of 6 months of treatment. The metreleptin treatment captured in the economic model reflected the Health Canada dosing regimen. The submitted price of metreleptin is $3,120 for the 11.3 mg vial (supplying up to a 10 mg dose), $1,605 for the 5.8 mg vial (supplying up to a 5 mg dose), and $803 for the 3 mg vial (supplying up to a 2.8 mg dose). The sponsor estimated the annual per-patient cost of metreleptin according to vial size: $1,139,730 for patients using the 11.3 mg vial, $586,066 for patients using the 5.8 mg vial, and $293,179 for patients using the 3 mg vial. Based on Early Access Program data, the sponsor assumed that 13%, 61%, and 26% of patients would receive the 11.3 mg, 5.8 mg, and 3 mg vials, respectively.1
Supportive care, the comparator for this analysis, encompassed a basket of therapies commonly used in clinical practice in Canada: antidiabetic therapies (i.e., insulin, metformin, empagliflozin, semaglutide); lipid-lowering therapies (i.e., atorvastatin, rosuvastatin, fenofibrate, bezafibrate); and antihypertensive therapies (i.e., ramipril, losartan). The sponsor estimated the annual cost of supportive care alone to be $3,615 and $2,302 for patients with GL and PL, respectively.1 In addition, the sponsor estimated the annual cost of supportive care for patients receiving metreleptin to be $700 and $1,248 for those with GL and PL, respectively.1 Wastage was included in the base-case analysis.
The clinical outcomes modelled were changes in levels of hemoglobin A1C, triglycerides, insulin, ALT, and AST. The economic outcomes of interest were QALYs and life-years. The economic evaluation was conducted over a lifetime time horizon, from the perspective of the public health care payer in Canada. Costs and outcomes were discounted at 1.5% per annum.3
Model Structure
The sponsor submitted a patient-level simulation consisting of 6 separate Markov submodels, which simulate the progression of disease on distinct organ systems (i.e., liver disease, acute pancreatitis, cardiovascular disease, chronic kidney disease, retinopathy, and neuropathy) for a typical patient profile of each lipodystrophy type (GL: 33%; PL: 67%) and sex (females: 91%; males: 9%). The overall model structure is presented in Figure 1 and the corresponding Markov submodels are presented in Figure 2, Figure 3, Figure 4, Figure 5, Figure 6, and Figure 7. In the sponsor’s probabilistic base case, 2,500 patients with lipodystrophy were simulated and the expected costs and clinical effects of metreleptin treatment with supportive care and supportive care alone were calculated. In each simulation cycle, a single patient exists simultaneously in a discrete health state in each of the 6 independent submodels. Upon model initiation, a single patient occupies 1 health state corresponding to no complications in each of the 6 submodels, and as time progresses, the patient may experience complications in none, 1, or several of these 6 submodels. Transitions between health states occur on a yearly cycle length and patients accrue life-years, QALYs, and costs during each cycle. A patient may die at any time and from any health state in each of the 6 submodels; at this point, they are removed from all submodels and transition to a death state.
Model Inputs
Baseline patient characteristics were derived from NIH 991265/20010769 study, an open-label, single-arm, investigator-led pivotal trial integrating efficacy and safety data from 2 related studies (the pilot Study 991265 and the long-term Study 20010769) of metreleptin for patients with congenital or acquired GL as well as for those with familial or acquired PL (N = 107). As the model is a probabilistic patient-level simulation, baseline characteristics including age, weight, baseline hemoglobin A1C, and baseline triglyceride levels were sampled from a distribution based on the mean and standard deviation (Table 18). These were used to inform the weight-based drug dosage regimens and the age- and sex-specific distribution of the general population mortality risk.
Clinical efficacy parameters used to characterize effects of metreleptin treatment with supportive care and supportive care alone were derived from various data sources. Baseline transition probabilities for the liver,4 pancreas,5 cardiovascular,6-8 kidney,7 neuropathy,7 and retinopathy7 submodels were obtained from published literature on diseases where lipodystrophy complications are commonly observed. Transition probabilities were adjusted to reflect the baseline hemoglobin A1C level and risk associated with early-onset type 2 diabetes in the population with lipodystrophy. Differences between patients receiving metreleptin treatment with supportive care and those receiving supportive care alone were used to generate transition probabilities for the cohort receiving metreleptin treatment with supportive care in the cardiovascular, kidney, neuropathy, and retinopathy submodels. The sponsor used the absolute mean reductions in hemoglobin A1C observed between baseline and month 12 in the NIH 991265/20010769 study for patients with GL and PL. The sponsor calculated the impact that the observed reduction in hemoglobin A1C had on the risk of cardiovascular complications using real-world data from the United Kingdom Prospective Diabetes Study (UKPDS).9 The relative benefits for the kidney, neuropathy, and retinopathy submodels are derived within the model via the application of the Eastman method, which modulates the transition probabilities based on hemoglobin A1C levels in each cycle.10 With respect to liver complications, estimates of benefits for patients receiving metreleptin treatment with supportive care, relative to supportive care alone, were derived by using ALT and AST as surrogate outcomes. Using results from the sponsor-submitted indirect treatment comparison (ITC), the estimated change in ALT and AST levels for patients receiving metreleptin treatment with supportive care, compared to those receiving supportive care alone, was used to formulate risk ratios that were applied directly to transitions in the liver submodel.11,12 Results from the ITC were also applied directly to the baseline annual pancreatitis risk for patients receiving supportive care alone to obtain the pancreatitis risk for patients receiving metreleptin treatment with supportive care.12
Mortality risk is assumed not to fall below that of the age- and sex-matched general population in Canada. The sponsor calculated the risk of mortality separately across the 6 Markov submodels. To avoid double-counting in each submodel, mortality risks from the 6 separate submodels are aggregated conservatively by selecting the highest individual risk of death across all organ systems to create a single probability for mortality risk. Patients have a random probability of dying from this mortality risk in any cycle.
The sponsor assumed that the efficacy of metreleptin treatment with supportive care would likely be assessed after treatment initiation based on whether certain metabolic criteria had been met. In the base case, a stopping rule based on a clinical response threshold of at least 0.5% reduction from baseline in hemoglobin A1C or at least 15% reduction from baseline in fasting triglyceride levels was applied to patients with PL in the first model cycle, representing discontinuation within the first year after treatment initiation. In addition, an annual discontinuation rate calculated based on that seen in the NIH 991265/20010769 study was implemented in the model.13 The average time to treatment discontinuation in the base case is 8.6 years.1
The sponsor assumed that following metreleptin discontinuation, a patient who had received metreleptin with supportive care for several years would experience a lower risk of disease progression in the hemoglobin A1C–driven organ submodels (i.e., the cardiovascular, kidney, neuropathy, and retinopathy submodels). As such, the reduction in hemoglobin A1C that occurs as a 1-off event among patients receiving metreleptin with supportive care at the start of the model does not revert following treatment discontinuation. In addition, the sponsor assumed that the benefits to the liver associated with metreleptin treatment with supportive care are maintained for 1 year after treatment discontinuation.
Patients accrued health state–specific QALYs as well as treatment-related and health state–specific costs as they transitioned through changes in disease progression. Health state utility values were drawn from the UKPDS 62 substudy.14 In the UKPDS, the EQ-5D instrument was administered to 3,667 patients with type 2 diabetes to estimate the impact of diabetes-related complications on utility-based measures of quality of life. The sponsor assumed that utility data from patients with type 2 diabetes would be generalizable to the target population of patients with lipodystrophy given that the condition leads to insulin-resistant diabetes, which tends to be experienced through complications across organ systems covering a number of diabetes-related health states in the model. Utility values for the liver submodel were informed using the National Institute for Health Care Excellence (NICE) nonalcoholic fatty liver disease guidelines.4 The utility value for acute pancreatitis was obtained by means of a discrete choice experiment in the general population, which generated QALY decrements associated with the disease attributes.15 The sponsor assumed that age-specific utility values for the population in Canada would be representative of patients with lipodystrophy without any symptoms, who would be expected to have an unaffected quality of life. As such, utility decrements were applied to age-specific utility baseline values for population norms in Canada.16 For patients experiencing complications in multiple-organ submodels, the utility decrements associated with each organ were applied to the baseline value using a multiplicative approach. Due to the low frequency of drug-related serious adverse events, adverse events were not included in the model.
A disutility value representing quality-of-life decrements due to caregiver burden was applied in the base case. The utility decrement was derived by subtracting the average EQ-5D time trade-off (TTO) utility value for caregivers in the UK Lipodystrophy Caregiver Burden Survey from the EQ-5D UK-specific TTO value for the equivalent age group.17-19 The mean number of carers per patient with lipodystrophy was assumed to be 1.67, based on the caregiver burden survey.19 The caregiver utility decrement was multiplied by the mean number of caregivers per patient to produce an overall decrement per patient, per cycle.
Costs captured in the model included those associated with drug acquisition, disease monitoring, and medical follow-up, as well as those associated with disease management across each organ submodel.1 Drug acquisition costs for metreleptin were based on the sponsor’s submitted price.1 The dosing modelled for metreleptin is consistent with that described in the overview section. As described in the Overview section, supportive care encompassed a basket of therapies commonly used in clinical practice in Canada (i.e., antidiabetic, lipid-lowering, and antihypertensive therapies). Drug acquisition costs were sourced from the Ontario Drug Benefit Formulary.20 Tests and medical visit costs related to standard monitoring of patients with lipodystrophy were calculated based on frequencies derived from clinical expert input in Canada. Patients with GL and PL would be expected to be seen by 3 health care professionals (i.e., an endocrinologist, dietician, and diabetes specialist nurse) once every 4 months, and patients receiving metreleptin treatment were assumed to require 2 more visits within the first year of initiating treatment. At each routine medical visit, complete blood count would be performed and hemoglobin A1C levels, urinary creatinine, and lipid and liver profiles would be measured. In addition, abdominal ultrasounds, echocardiograms, and retinal photographs would be performed each year, while cardiac stress tests would be conducted once every 5 years. Unit costs for medical tests were derived from the Ontario Ministry of Health Schedule of Benefits for Laboratory Services.21 Unit costs for medical visits were derived from the Ontario Health Insurance Plan Schedule of Benefits and Fees.22 Costs associated with management of complications within each organ submodel were sourced from the literature.23-36 Where published literature costs were not available, cost inputs were informed based on the opinion of clinical experts in Canada.
Summary of Sponsor’s Economic Evaluation Results
The sponsor conducted the base case via a probabilistic sensitivity analysis on a single cohort of 2,500 patients individually simulated. The deterministic (single cohort of 1,000 patients) and probabilistic results were similar. The probabilistic findings are presented in the following section.
Base-Case Results
Compared with supportive care alone, metreleptin was associated with an incremental QALY gain of 3.66 and an incremental cost of $6,782,797, resulting in an ICER of $1,853,646 per QALY (Table 3). Of note, the sponsor’s analysis predicted that metreleptin treatment with supportive care was associated with a longer duration of life than supportive care alone (i.e., incremental life-years: 1.62).
Given the duration of follow-up required to analyze the coprimary efficacy end points in the NIH 991265/20010769 study (i.e., 12 months) in contrast to the model’s time horizon (i.e., 95 years), it is important to note that 92% of the QALY benefit realized by patients receiving metreleptin was derived from the period beyond which there are observed trial data (i.e., the extrapolated period). Most of the incremental QALY gain associated with treatment with metreleptin relative to supportive care alone was realized via improvements in caregiver utility (53%), rather than through utility improvements experienced by patients with lipodystrophy. The key cost driver among patients receiving metreleptin was the cost of drug acquisition, accounting for 96% of the total cost incurred by the public payer. The main cost driver among patients receiving supportive care alone was associated with the management of end-stage renal disease, which accounted for 35% of the total estimated cost.
In subgroup analyses, the sponsor presented disaggregated results for patients with GL and for patients with PL. For patients with GL, metreleptin was associated with an incremental QALY gain of 4.85 and an incremental cost of $7,025,876 compared with supportive care alone, resulting in an ICER of $1,448,624 per QALY. For patients with PL, metreleptin was associated with an incremental QALY gain of 3.06 and an incremental cost of $6,661,257 compared with supportive care alone, resulting in an ICER of $2,174,232 per QALY.
Metreleptin was not cost-effective at a WTP threshold of $50,000 per QALY in any of the simulations (in both overall and subgroup analyses) when compared to supportive care alone. The sponsor’s submitted analysis is based on the publicly available prices for all drug treatments.
Table 3: Summary of the Sponsor’s Economic Evaluation Results, Overall
Drug | Total costs ($) | Incremental costs ($) | Total QALYs | Incremental QALYs | ICER vs. SC ($/QALY) |
|---|---|---|---|---|---|
SC | 357,331 | Reference | 11.21 | Reference | Reference |
Metreleptin + SC | 7,140,128 | 6,782,797 | 14.87 | 3.66 | 1,853,646 |
ICER = incremental cost-effectiveness ratio; QALY = quality-adjusted life-year; SC = supportive care; vs. = versus.
Source: Sponsor’s pharmacoeconomic submission.1
Table 4: Summary of the Sponsor’s Economic Evaluation Results, Generalized Lipodystrophy
Drug | Total costs ($) | Incremental costs ($) | Total QALYs | Incremental QALYs | ICER vs. SC ($/QALY) |
|---|---|---|---|---|---|
SC | 404,834 | Reference | 11.54 | Reference | Reference |
Metreleptin + SC | 7,430,710 | 7,025,876 | 16.39 | 4.85 | 1,448,624 |
ICER = incremental cost-effectiveness ratio; QALY = quality-adjusted life-year; SC = supportive care; vs. = versus.
Source: Sponsor’s pharmacoeconomic submission.1
Table 5: Summary of the Sponsor’s Economic Evaluation Results, Partial Lipodystrophy
Drug | Total costs ($) | Incremental costs ($) | Total QALYs | Incremental QALYs | ICER vs. SC ($/QALY) |
|---|---|---|---|---|---|
SC | 333,580 | Reference | 11.04 | Reference | Reference |
Metreleptin + SC | 6,994,837 | 6,661,257 | 14.11 | 3.06 | 2,174,232 |
ICER = incremental cost-effectiveness ratio; QALY = quality-adjusted life-year; SC = supportive care; vs. = versus.
Source: Sponsor’s pharmacoeconomic submission.1
Additional results from the sponsor’s submitted economic evaluation base case are presented in Appendix 3.
Sensitivity and Scenario Analysis Results
The sponsor assessed several model parameters and assumptions in probabilistic scenario analyses. These included using a societal perspective; assuming that treatment-related benefits for the liver are maintained for 3 years after discontinuation of metreleptin treatment; applying different discontinuation rates for patients with GL (1.5%) and patients with PL (3.9%); applying the stopping rule for metreleptin to both patients with GL and patients with PL; adopting alternative estimates for the relative risk reduction in liver complications for patients receiving metreleptin treatment (77% for patients with GL and 25% for patients with PL); adopting alternative prevalence estimates for GL (25%) and PL (75%); assuming that hemoglobin A1C levels revert to baseline immediately after discontinuation of metreleptin treatment; and using alternative values for the reduction in hemoglobin A1C associated with metreleptin derived from pooled GL and PL ITC analyses. Each scenario was developed probabilistically, for a single cohort of 1,250 patients.
The most influential parameters were alternative assumptions regarding treatment efficacy, particularly the duration of metreleptin treatment benefits after treatment discontinuation and the reduction in hemoglobin 1AC levels associated with metreleptin as well as discontinuation rates. When applying alternative discontinuation rates, the ICER increased to $1,931,105 per QALY gained. Moreover, when assuming 3-year maintenance of treatment-related benefits to the liver, the ICER decreased to $1,482,262 per QALY gained. All other scenarios resulted in ICERs from between $1,715,758 and $1,904,660 per QALY gained.
The sponsor conducted a scenario analysis from a societal perspective. This analysis included additional costs associated with work productivity losses for both carers and patients as well as caregiver disutilities. In this analysis, relative to supportive care alone, the ICER was $1,715,758 per QALY gained for the overall population. This was similar to the sponsor’s base-case analysis using a health care payer perspective.
CADTH Appraisal of the Sponsor’s Economic Evaluation
CADTH identified several key limitations to the sponsor’s analysis that have notable implications on the economic analysis:
Effect of metreleptin on cardiovascular, kidney, liver, neuropathy, and retinopathy outcomes is uncertain. The submitted model considers changes in hemoglobin A1C, ALT, and AST levels as the primary metrics of treatment effectiveness and health state occupancy in 5 of the 6 submodels. The sponsor stated that hemoglobin A1C is a good predictor of diabetes-related complications, including cardiovascular disease, kidney disease, retinopathy, and neuropathy in patients with lipodystrophy, and that the relationship between hemoglobin A1C and hard outcomes in each of these disease settings (e.g., stroke, microalbuminuria, peripheral arterial disease, and blindness) is established. Hence, the absolute mean reductions in hemoglobin A1C (2.2% for GL; 0.6% for PL) observed from baseline to month 12 for patients receiving metreleptin treatment with supportive care and for patients receiving supportive care alone in the NIH 991265/20010769 study were used to generate transition probabilities in the cardiovascular, kidney, retinopathy, and neuropathy submodels. Similarly, the sponsor stated that ALT and AST are reliable predictors of liver-related complications and that the relationship between ALT and AST levels and liver-related disease outcomes (e.g., advanced fibrosis and compensated cirrhosis) is established.
For the cardiovascular submodel, the sponsor used results from the UKPDS, a prospective UK study in patients with type 2 diabetes, to calculate the impact that the observed reduction in hemoglobin A1C would have on the risk of cardiovascular complications.9 Hence, in the submitted model, the sponsor estimated that a 1% reduction of hemoglobin A1C is associated with a risk reduction of 14%, 12%, and 16% for myocardial infarction, stroke, and heart failure, respectively. CADTH notes that the true relationship between reductions in hemoglobin A1C and risk of cardiovascular complications with the use of metreleptin is unknown. In the sponsor’s submission, the use of hemoglobin A1C as a surrogate outcome predicted a reduced risk of cardiovascular complications among patients receiving metreleptin treatment with supportive care, compared to supportive care alone, in both the GL and PL subgroups. This reduced risk has not been shown in clinical studies. In the absence of such evidence, clinical experts consulted by CADTH for this review indicated that while the relationship between hemoglobin A1C and cardiovascular outcomes is credible and established in the literature, there is uncertainty regarding the quantification of the associated cardiovascular risk reduction as it pertains to patients with lipodystrophy.
For the kidney, neuropathy, and retinopathy submodels, the relative benefits of treatment with metreleptin were derived within the model via the application of the Eastman method10 and beta coefficients from the Sheffield diabetes model,7 which adjusted the probability of disease-specific complications based on hemoglobin A1C levels in each cycle. In the kidney submodel, the sponsor estimated a 78% reduction in the risk of developing microalbuminuria in patients with hemoglobin A1C at 6.4% compared with patients with hemoglobin A1C at 10% (transition probability: 0.010 versus 0.044). In the retinopathy submodel, the sponsor estimated that patients with hemoglobin A1C at 6.4% would experience a 98% reduction in the risk of developing background retinopathy compared with patients with hemoglobin A1C of 10% (transition probability: 0.001 versus 0.045). In the neuropathy submodel, the sponsor estimated a 90% reduction in the risk of developing background retinopathy in patients with hemoglobin A1C at 6.4% compared with patients with hemoglobin A1C at 10% (transition probability: 0.005 versus 0.051). CADTH notes that the association between decreases in hemoglobin A1C levels and the likelihood of experiencing kidney, neuropathy, and retinopathy complications when using metreleptin remains unclear. In the sponsor’s submission, the use of hemoglobin A1C as a surrogate outcome predicted a decreased likelihood of kidney disease, neuropathy, and retinopathy in patients who received metreleptin treatment when compared to those receiving supportive care alone, in both the GL and PL subgroups. However, this effect has not been shown in clinical trials. Without such evidence, clinical experts consulted by CADTH indicated that, although the associations between hemoglobin A1C levels and kidney, neuropathy, and retinopathy outcomes are clinically plausible and well-documented in the existing literature, there is uncertainty surrounding the precise measurement of the associated risk reduction, particularly as it concerns patients with lipodystrophy.
For the liver submodel, estimates of benefits for patients who received metreleptin treatment with supportive care, relative to supportive care alone, were derived by using ALT and AST as surrogate outcomes. Estimated reductions in ALT (44 U/L) and AST (28 U/L) levels for patients who received metreleptin treatment with supportive care, compared to those receiving supportive care alone, from the sponsor-submitted ITC12 were used to formulate a risk ratio of 0.61, which was directly applied to the probability of developing complications of the liver. Hence, in the liver submodel, the sponsor estimated that the risk of liver complications, including advanced fibrosis and compensated cirrhosis, is 39% lower in patients receiving metreleptin treatment with supportive care than in patients receiving supportive care alone. CADTH notes that the true relationship between reductions in ALT and AST levels and risk of liver complications with the use of metreleptin is unknown. In the submitted model, the use of ALT and AST as surrogate outcomes predicted a reduced risk of liver disease in patients receiving metreleptin treatment, compared to supportive care alone, in both GL and PL subgroups. However, this effect has not been demonstrated in clinical studies. In the absence of such evidence, clinical experts consulted by CADTH for this review indicated that while the relationship between ALT and AST levels and liver outcomes is credible and documented in the literature, the quantification of the associated risk reduction among patients with lipodystrophy is uncertain.
Given that the probability of disease progression in each of the organ-specific submodels impacts survival, the strength of the proxy relationships between hemoglobin A1C, ALT, and AST levels and disease-specific outcomes are highly relevant to the cost-effectiveness results. In the sponsor’s submission, the use of these surrogate outcomes predicted a survival benefit among patients receiving metreleptin treatment with supportive care compared to supportive care alone, in both GL and PL subgroups (2.28 and 1.30 incremental life-years, respectively). CADTH notes that a survival gain associated with the use of metreleptin has not been shown in clinical studies. A published ITC by Cook et al. (2021) estimated the treatment effect of metreleptin on mortality among patients with GL or PL using a Cox proportional hazard model to control for differences between patients who had received metreleptin treatment and those with no experience with metreleptin.37 CADTH notes that significant differences in mortality risk between patients who had received metreleptin treatment and patients in the GL subgroup who had no experience with metreleptin were not detected using the Kaplan-Meier analysis (log-rank test P = 0.6) or Cox proportional hazards model (hazard ratio = 0.455; 95% CI, 0.150 to 1.387; P = 0.166). In the absence of robust evidence, CADTH notes that the true relationship between reductions in hemoglobin A1C, ALT, and AST and survival gains with the use of metreleptin is unknown. Clinical experts consulted by CADTH for this review indicated that patients who experience a reduction in hemoglobin A1C, ALT, and AST levels are likely to have lower incidence of complications related to diabetes and the liver, which may improve survival. Clinical expert input further noted that although the surrogate relationships driving survival are plausible, the quantification of the survival benefit associated with metreleptin is uncertain.
CADTH notes that the cardiovascular, kidney-related, neuropathy, retinopathy, and liver-related benefits predicted by the submitted model of the use of metreleptin treatment with supportive care have not been shown in clinical trials. As such, it is plausible that the prevention of disease-specific complications, and the resulting survival benefit associated with metreleptin treatment with supportive care, may be overestimated. CADTH was unable to address this limitation owing to a lack of clinical data.
Inclusion of caregiver disutilities in the base-case analysis is highly uncertain. The sponsor applied a disutility value representing quality-of-life decrements due to caregiver burden in the base case. The utility decrement of –0.10 was derived by subtracting the average EQ-5D TTO utility value for caregivers in the UK Lipodystrophy Caregiver Burden Survey from the EQ-5D UK-specific TTO value for the equivalent age group. The sponsor sourced the mean number of carers per patient with lipodystrophy (n = 1.67) from this survey to calculate a caregiver disutility value per patient, per cycle. The hypothetical caregiver benefit with metreleptin was assumed to be 100%, reflecting the sponsor’s assumption that treatment with metreleptin would result in the complete relief of the caregiver burden. The sponsor noted that the inclusion of caregiver utility in the model’s base case is justified given that lipodystrophy is a rare, severe disease with substantial unmet need and burden. CADTH notes that the parameters used to derive the caregiver burden and the assumptions made regarding the caregiver benefit associated with metreleptin treatment with supportive care have not been shown in clinical studies; thus, these are highly uncertain. Moreover, according to CADTH guidelines, the analysis of health-related quality of life must focus on the target population,38 that is, patients with confirmed congenital or acquired GL as well as patients with confirmed familial or acquired PL aged 12 years or older with persistent significant metabolic abnormalities (e.g., persistent insulin resistance, poorly controlled diabetes, persistent hypertriglyceridemia) for whom standard treatments have failed to achieve adequate metabolic control. Hence, having identified the target population, any spillover effects that fall outside the target population should be incorporated in a nonreference case analysis. Since patients with lipodystrophy are the target population, the impact of including any meaningful health effects accrued by informal caregivers should be assessed using a scenario analysis.
CADTH conducted a reanalysis of the base case that removed caregiver disutilities.
CADTH conducted a scenario analysis that included caregiver disutilities.
Efficacy of metreleptin after treatment discontinuation is unknown. The sponsor assumed that following discontinuation of metreleptin treatment, patients would continue to experience a lower risk of disease progression in the hemoglobin A1C–driven organ submodels (i.e., the cardiovascular, kidney, neuropathy, and retinopathy submodels). As such, the reduction in hemoglobin A1C levels among patients receiving metreleptin treatment with supportive care at the start of the model does not revert following treatment discontinuation. Likewise, the sponsor assumed that the benefits associated with metreleptin treatment with supportive care would be maintained for 1 year following treatment discontinuation. The clinical experts consulted by CADTH for this review indicated that there is no evidence to support enduring legacy effects of glycemic control associated with long-term use of metreleptin. The clinical experts also remarked that, among patients with lipodystrophy, hemoglobin A1C is likely to remain under control only while the human leptin receptor is activated by metreleptin (i.e., during the treatment period). Specifically, experts noted that if treatment with metreleptin were discontinued, the clinically plausible expectation is that glycemic control would worsen immediately, and thus hemoglobin A1C–related complications would proceed along the same risk trajectory as that observed before treatment with metreleptin. Regarding the benefits to the liver associated with metreleptin treatment, the clinical experts noted that it is likely that the reduction in fatty deposits and accumulation in the liver would yield a short-term legacy effect by slowing the progression to later stages of disease. CADTH further notes that limited evidence exists showing that, among patients with nonalcoholic steatohepatitis, ALT levels revert to baseline values within 18 months of discontinuation of treatment with pioglitazone.39 While the literature, and clinical expert opinion, point to the plausibility of legacy effects on the liver associated with treatments that reduce ALT levels, CADTH notes that there is no evidence of benefits to the liver associated with use of metreleptin after its discontinuation.
CADTH conducted a reanalysis of the base case that reversed the hemoglobin A1C benefit after discontinuation of metreleptin treatment. Given the clinical plausibility of the sponsor’s assumption, benefits to the liver associated with metreleptin treatment were maintained for 1 year, as per the submitted base case.
Proportion of patients with GL is overestimated. The sponsor assumed the proportion of patients with GL to be 33% and the proportion of patients with PL to be 67%. CADTH notes that the sponsor did not provide the source on which this assumption is based. CADTH further notes that based upon prevalence estimates for GL and PL corresponding to 0.00010% and 0.00028%, respectively,40 it is estimated that 25% of all patients with lipodystrophy would have GL and the remaining 75% would have PL. The clinical expert panel convened by CADTH indicated that the proportions of patients with GL and PL derived from Chiquette et al.40 aligned with their expectation in current clinical practice in Canada.
CADTH conducted a reanalysis of the base case that assumed 25% of all patients with lipodystrophy would have GL, and the remaining 75% would have PL.
Model lacked transparency and its programming prevented CADTH from fully exploring the associated uncertainties. The sponsor’s submitted model was programmed with limited transparency, with several outputs resulting from Microsoft Visual Basic for Applications coding rather than formula-based operations. CADTH was unable to fully explore the uncertainty with parameters in the model, although results of the deterministic stepwise analysis met face validity.
CADTH was unable to address this limitation in reanalysis.
Poor modelling practices were employed. The sponsor’s submitted model included numerous IFERROR statements, resulting in situations where the parameter value was over-written with an alternative value without alerting the user to the automatized overwriting. The systematic use of IFERROR statements rendered thorough auditing of the sponsor’s model impractical, as it remains unclear whether the model ran inappropriately by overriding errors.
CADTH was unable to address this limitation, noting that a thorough validation of the submitted model was not possible.
The following key assumptions were made by the sponsor and have been appraised by CADTH (refer to Table 6).
Table 6: Key Assumptions of the Submitted Economic Evaluation
Sponsor’s key assumption | CADTH comment |
|---|---|
For patients experiencing complications in multiple-organ submodels, the utility decrements associated with each organ were applied to the baseline value using a multiplicative approach. | Acceptable. CADTH notes that there are 3 conventional methods used to estimate the mean health state utility value for a combined condition when data only exist for relevant single conditions: the additive method, which assigns a constant absolute decrement; the multiplicative method, which assigns a relative decrement; and the minimum method, which assumes no additional decrement over that observed for the condition with the lowest utility value.41 It should be noted that although the multiplicative disutility approach is recommended as less error-prone than the additive calculation approach and less likely to overestimate the utility value than the minimum value approach, this calculation method is likely to underestimate the true utility score.42 Though it is possible that the QALYs in both treatment arms may be underestimated, it is unlikely that this would impact the cost-effectiveness results. |
QALY = quality-adjusted life-year.
CADTH Reanalyses of the Economic Evaluation
Base-Case Results
CADTH’s reanalyses addressed several limitations within the economic model. The CADTH base case was derived by making changes in model parameter values and assumptions, in consultation with clinical experts. These included: removing caregiver disutilities to align the analysis of health-related quality of life with the target patient population; reversing the hemoglobin A1C benefit after treatment discontinuation given the absence of evidence to support legacy effects associated with long-term use of metreleptin; and adjusting the proportion of patients with GL and PL in accordance with published estimates. These changes are summarized in Table 7.
Table 7: CADTH Revisions to the Submitted Economic Evaluation
Stepped analysis | Sponsor’s value or assumption | CADTH value or assumption |
|---|---|---|
Corrections to sponsor’s base case | ||
None | — | — |
Changes to derive the CADTH base case | ||
1. Caregiver disutilities | Included | Excluded |
2. Post-discontinuation treatment benefit | Reductions in hemoglobin A1C among patients receiving metreleptin treatment with SC at the start of the model do not revert following treatment discontinuation. | Reductions in hemoglobin A1C among patients receiving metreleptin treatment with SC at the start of the model revert following treatment discontinuation. |
3. Proportion of patients with LD subtype |
|
|
CADTH base case | Reanalysis 1 + 2 + 3 | |
GL = generalized lipodystrophy; LD = lipodystrophy; PL = partial lipodystrophy; SC = supportive care.
In the CADTH base case, metreleptin plus supportive care was associated with an ICER of $5,308,188 per QALY gained compared to supportive care alone (incremental costs: $6,895,438; incremental QALYs: 1.30) (Table 8). The probability that metreleptin plus supportive care was cost-effective at a WTP threshold of $50,000 per QALY was 0%.
CADTH’s estimated ICER was higher than the sponsor’s base-case value, driven primarily by the exclusion of caregiver disutilities and the reversal of the hemoglobin A1C benefit after treatment discontinuation. In line with clinical expert advice, the CADTH base case achieved more plausible survival estimates in the absence of long-term evidence, while still reflecting a survival benefit with metreleptin treatment with supportive care. As was true for the sponsor’s base case, more than 100% of the incremental cost between patients receiving metreleptin treatment with supportive care compared to supportive care alone was driven by the cost of metreleptin acquisition.
CADTH base-case results for patients with GL and patients with PL are presented in Table 9 and Table 10, respectively. For patients with GL, metreleptin was associated with an incremental QALY gain of 2.27 and an incremental cost of $7,274,459 compared with supportive care alone, resulting in an ICER of $3,199,437 per QALY. For patients with PL, metreleptin was associated with an incremental QALY gain of 0.97 and an incremental cost of $6,767,340 compared with supportive care alone, resulting in an ICER of $6,979,408 per QALY. Across subgroup analyses, metreleptin was not cost-effective at a WTP threshold of $50,000 per QALY in any of the simulations when compared to supportive care alone.
CADTH base case is based on publicly available prices of the comparator treatments. A detailed breakdown of the disaggregated results is available in Appendix 4.
Table 8: Summary of the Stepped Analysis of the CADTH Reanalysis Results, Overall
Stepped analysis | Drug | Total costs ($) | Total QALYs | ICER ($/QALY) |
|---|---|---|---|---|
Sponsor’s base case (Deterministic) | SC | 350,359 | 10.98 | Reference |
Metreleptin + SC | 7,040,007 | 14.71 | 1,795,482 | |
CADTH reanalysis 1: Exclusion of caregiver utilities | SC | 350,359 | 14.48 | Reference |
Metreleptin + SC | 7,040,007 | 16.34 | 3,582,012 | |
CADTH reanalysis 2: Reversal of hemoglobin A1C reductions post-discontinuation | SC | 350,359 | 10.98 | Reference |
Metreleptin + SC | 7,050,596 | 14.35 | 1,991,282 | |
CADTH reanalysis 3: Proportion of patients with LD subtype | SC | 345,559 | 10.96 | Reference |
Metreleptin + SC | 7,017,042 | 14.54 | 1,865,636 | |
CADTH base case (reanalysis 1 + 2 + 3) | SC | 345,559 | 14.45 | Reference |
Metreleptin + SC | 7,026,368 | 15.81 | 4,897,455 | |
CADTH base case: Probabilistic | SC | 354,083 | 14.72 | Reference |
Metreleptin + SC | 7,249,521 | 16.02 | 5,308,188 |
ICER = incremental cost-effectiveness ratio; QALY = quality-adjusted life-year; SC = supportive care.
Table 9: Summary of the Stepped Analysis of the CADTH Reanalysis Results, Generalized Lipodystrophy
Stepped analysis | Drug | Total costs ($) | Total QALYs | ICER ($/QALY) |
|---|---|---|---|---|
Sponsor’s base case (deterministic) | SC | 390,003 | 11.14 | Reference |
Metreleptin + SC | 7,229,643 | 16.11 | 1,378,090 | |
CADTH reanalysis 1: Exclusion of caregiver utilities | SC | 390,003 | 14.72 | Reference |
Metreleptin + SC | 7,229,643 | 17.88 | 2,168,559 | |
CADTH reanalysis 2: Reversal of hemoglobin A1C reductions after discontinuation | SC | 390,003 | 11.14 | Reference |
Metreleptin + SC | 7,250,661 | 15.29 | 1,653,226 | |
CADTH reanalysis 3: Proportion of patients with LD subtype | SC | 390,003 | 11.14 | Reference |
Metreleptin + SC | 7,229,643 | 16.11 | 1,378,090 | |
CADTH base case (reanalysis 1 + 2 + 3) | SC | 390,003 | 14.72 | Reference |
Metreleptin + SC | 7,250,661 | 16.94 | 3,092,116 | |
CADTH base case: Probabilistic | SC | 402,296 | 15.21 | Reference |
Metreleptin + SC | 7,676,755 | 17.49 | 3,199,437 |
ICER = incremental cost-effectiveness ratio; LD = lipodystrophy; QALY = quality-adjusted life-year; SC = supportive care.
Table 10: Summary of the Stepped Analysis of the CADTH Reanalysis Results, Partial Lipodystrophy
Stepped analysis | Drug | Total costs ($) | Total QALYs | ICER ($/QALYs) |
|---|---|---|---|---|
Sponsor’s base case (deterministic) | SC | 330,538 | 10.90 | Reference |
Metreleptin + SC | 6,945,189 | 14.01 | 2,128,837 | |
CADTH reanalysis 1: Exclusion of caregiver utilities | SC | 330,538 | 14.35 | Reference |
Metreleptin + SC | 6,945,189 | 15.58 | 5,402,584 | |
CADTH reanalysis 2: Reversal of hemoglobin A1C reductions after discontinuation | SC | 330,538 | 10.90 | Reference |
Metreleptin + SC | 6,950,563 | 13.87 | 2,227,280 | |
CADTH reanalysis 3: Proportion of patients with LD subtype | SC | 330,538 | 10.90 | Reference |
Metreleptin + SC | 6,945,189 | 14.01 | 2,128,837 | |
CADTH base case (reanalysis 1 + 2 + 3) | SC | 330,538 | 14.35 | Reference |
Metreleptin + SC | 6,950,563 | 15.43 | 6,156,436 | |
CADTH base case: Probabilistic | SC | 337,788 | 14.56 | Reference |
Metreleptin + SC | 7,105,128 | 15.53 | 6,979,408 |
ICER = incremental cost-effectiveness ratio; LD = lipodystrophy; QALY = quality-adjusted life-year; SC = supportive care.
Table 11: Summary of the CADTH Reanalysis Results, Probabilistic
Drug | Total costs | Total QALYs | Total LYs | ICER vs. SC |
|---|---|---|---|---|
CADTH base case, overall | ||||
SC | 354,083 | 14.72 | 20.47 | Reference |
Metreleptin + SC | 7,249,521 | 16.02 | 21.82 | 5,308,188 |
CADTH base case, GL | ||||
SC | 402,296 | 15.21 | 21.43 | Reference |
Metreleptin + SC | 7,676,755 | 17.49 | 23.54 | 3,199,437 |
CADTH base case, PL | ||||
SC | 337,788 | 14.56 | 20.14 | Reference |
Metreleptin + SC | 7,105,128 | 15.53 | 21.24 | 6,979,408 |
GL = generalized lipodystrophy; ICER = incremental cost-effectiveness ratio; LY = life-year; PL = partial lipodystrophy; QALY = quality-adjusted life-years; SC = supportive care; vs. = versus.
Scenario Analysis Results
CADTH undertook price reduction analyses based on the sponsor’s results and CADTH’s base case. Results of the CADTH base case for the overall population suggested a price reduction of 99% would be required for metreleptin plus supportive care to be cost-effective relative to supportive care alone at a WTP threshold of $50,000 per QALY gained (Table 12). Price reductions of 98% and 99% would be required for metreleptin plus supportive care to be cost-effective at the same threshold in the GL and PL subgroups, respectively (Table 13 and Table 14).
Table 12: CADTH Price Reduction Analyses, Overall
Analysis | ICERs for metreleptin vs. SC | |
|---|---|---|
Price reduction | Sponsor base case | CADTH reanalysis |
No price reduction | 1,795,493 | 4,897,595 |
10% | 1,614,960 | 4,406,174 |
20% | 1,434,427 | 3,914,753 |
30% | 1,253,894 | 3,423,332 |
40% | 1,073,361 | 2,931,911 |
50% | 892,828 | 2,440,490 |
60% | 712,295 | 1,949,069 |
70% | 531,762 | 1,457,649 |
80% | 351,229 | 966,228 |
90% | 170,696 | 474,807 |
100% | Dominant | Dominant |
ICER = incremental cost-effectiveness ratio; SC = supportive care; vs. = versus.
Table 13: CADTH Price Reduction Analyses, Generalized Lipodystrophy
Analysis | ICERs for metreleptin vs. SC | |
|---|---|---|
Price reduction | Sponsor base case | CADTH reanalysis |
No price reduction | 1,378,098 | 3,092,058 |
10% | 1,238,775 | 2,780,413 |
20% | 1,099,451 | 2,468,768 |
30% | 960,127 | 2,157,123 |
40% | 820,803 | 1,845,478 |
50% | 681,479 | 1,533,833 |
60% | 542,155 | 1,222,188 |
70% | 402,832 | 910,543 |
80% | 263,508 | 598,897 |
90% | 124,184 | 287,252 |
100% | Dominant | Dominant |
ICER = incremental cost-effectiveness ratio; SC = supportive care; vs. = versus.
Table 14: CADTH Price Reduction Analyses, Partial Lipodystrophy
Analysis | ICERs for metreleptin vs. SC | |
|---|---|---|
Price reduction | Sponsor base case | CADTH reanalysis |
No price reduction | 2,128,814 | 6,156,445 |
10% | 1,915,373 | 5,539,682 |
20% | 1,701,931 | 4,922,918 |
30% | 1,488,489 | 4,306,155 |
40% | 1,275,048 | 3,689,392 |
50% | 1,061,606 | 3,072,628 |
60% | 848,165 | 2,455,865 |
70% | 634,723 | 1,839,101 |
80% | 421,282 | 1,222,338 |
90% | 207,840 | 605,575 |
100% | Dominant | Dominant |
ICER = incremental cost-effectiveness ratio; SC = supportive care; vs. = versus.
CADTH undertook 1 scenario analysis that applied a disutility value representing quality-of-life decrements due to caregiver burden. In alignment with clinical expert input, CADTH notes that including caregiver utility in a nonreference case analysis is justified considering that lipodystrophy is a rare and severe disease with substantial unmet need and burden on informal caregivers. CADTH further notes that burden to caregiver quality of life in this rare disease setting is considerable, with substantial time requirements resulting in effects ranging from deterioration of mental health to daily strain.43 When including caregiver utility, as in the sponsor’s submitted base case, the ICER of metreleptin plus supportive care decreased to $2,116,901 (incremental costs: $6,970,621; incremental QALYs: 3.29) relative to supportive care alone, in the overall indicated population. In the GL subgroup, the ICER decreased to $1,771,327 (incremental costs: $7,097,683; incremental QALYs: 4.01) and in the PL subgroup, the ICER decreased to $2,270,267 (incremental costs: $6,927,677; incremental QALYs: 3.05). There was a 0% probability that metreleptin was cost-effective at a WTP threshold of $50,000 per QALY gained in any of the analyzed populations.
The results of this analysis are presented in Table 21.
Issues for Consideration
CADTH notes that there are patient symptoms improved by metreleptin treatment that were not taken into account within the scope of the current economic model. These symptoms include hyperphagia and PCOS. These conditions may have a notable impact on the psychological well-being of people with lipodystrophy. For instance, hyperphagia was likened to a state of starvation by both patients interviewed as part of the input from the Lipodystrophy Canada Foundation. The interviewees described the extent to which hyperphagia interfered with daily activities, caused distress, and impacted long-term mental well-being. Clinical experts consulted by CADTH for this review noted that reproductive issues such as PCOS may also affect psychological well-being negatively. This is aligned with evidence showing that, following miscarriage, people may experience posttraumatic stress, anxiety, and depression.44 In the NIH follow-up study, improvements of 96% to 100% in hyperphagia symptom prevalence were observed among patients with PL and GL, respectively, 1 year after initiation of metreleptin treatment. In addition, improvements of 33% to 57% in PCOS symptom prevalence among patients with PL and GL, respectively, were observed 1 year after initiation of metreleptin treatment.13 Clinical experts consulted by CADTH noted that improvements in these symptoms would positively impact the quality of life of patients with lipodystrophy. The potential benefits of metreleptin associated with improvements in hyperphagia and PCOS are not reflected in the estimated incremental QALYs gained in the sponsor’s submitted results and CADTH’s base case.
CADTH notes that the comparator of this economic analysis, supportive care alone, includes drugs that have confidential pricing. The pan-Canadian Pharmaceutical Alliance (pCPA) concluded negotiations with a letter of intent for Ozempic (semaglutide) for type 2 diabetes mellitus.45 Ozempic has a confidential negotiated price and is currently funded by jurisdictional drug formularies.46-48 The CADTH reanalyses were based on the publicly available price of Ozempic, which may differ from the confidential price and may influence the results of the cost-effectiveness and budget impact analyses (BIAs). Participating drug plans indicate that no patients with GL and 15% of patients with PL are currently receiving treatment with Ozempic.
The pan-Canadian Pharmaceutical Alliance also concluded negotiations with a letter of intent for Jardiance (empagliflozin) for type 2 diabetes mellitus with high cardiovascular risk.49 Jardiance has a confidential negotiated price and is currently funded by jurisdictional drug formularies.50,51 The CADTH reanalyses were based on the publicly available price of empagliflozin, which may differ from the confidential price and may influence the results of the cost-effectiveness and BIAs. Participating drug plans indicate that 3% of patients with GL and 37% of patients with PL are currently receiving treatment with empagliflozin.
Overall Conclusions
Evidence from the NIH 991265/20010769 study suggests that metreleptin treatment is associated with clinically meaningful improvements in changes from baseline in hemoglobin A1C, ALT, and AST levels at 12 months in patients with GL and in patients with PL. The CADTH Clinical Review noted that, as a phase II/III, single-arm clinical trial, the NIH 991265/20010769 study’s lack of comparative data was a key limitation to the interpretation of the results, as it is difficult to distinguish between the effect of the intervention relative to a placebo effect or the effect of natural history. The CADTH Clinical Review further noted that the large number of drop-outs and missing data must be taken into account when assessing the efficacy end points in the pivotal trial. Given that only 59 of 66 patients with GL and 37 of 41 patients with PL who received metreleptin were included in the change from baseline in hemoglobin A1C results, the sponsor’s analysis does not adhere to the intention-to-treat philosophy and likely overestimates the treatment effect. Therefore, CADTH’s ability to draw robust conclusions from the change from baseline results is limited. This uncertainty extends into the submitted economic model given that the absolute mean reductions in hemoglobin A1C observed between baseline and month 12 were used to generate transition probabilities in the cardiovascular, kidney, retinopathy, and neuropathy submodels in the sponsor’s patient-level simulation.
CADTH also identified several limitations with the sponsor’s economic submission. These limitations include the following: the effect of metreleptin treatment with supportive care on cardiovascular, kidney-related, liver-related, neuropathy, and retinopathy complications is uncertain and has not been shown in clinical studies; the inclusion of caregiver disutilities in the submitted base case is inappropriate; the effect associated with the use of metreleptin treatment with supportive care on hemoglobin A1C levels after metreleptin treatment discontinuation is unknown; and the proportion of patients with GL is overestimated. As part of the base-case reanalysis, CADTH removed caregiver disutilities to align the analysis of health-related quality of life with the target patient population; reversed the hemoglobin A1C benefit after treatment discontinuation given the absence of evidence to support legacy effects associated with long-term use of metreleptin; and adjusted the proportion of patients with GL and PL in accordance with published estimates.
The CADTH base-case results are similar to the sponsor’s submitted analysis: metreleptin plus supportive care is not cost-effective relative to supportive care alone at the commonly accepted WTP threshold of $50,000 per QALY gained. In the CADTH base case, metreleptin plus supportive care was associated with an ICER of $5,308,188 per QALY gained compared to supportive care alone (incremental costs: $6,895,438; incremental QALYs: 1.30). The probability that metreleptin plus supportive care was cost-effective at a WTP threshold of $50,000 per QALY was 0%. The estimated ICER was higher than the sponsor’s base-case value, driven primarily by the exclusion of caregiver disutilities and the reversal of the hemoglobin A1C benefit after treatment discontinuation. Specifically, the CADTH base case estimated a reduced survival benefit with metreleptin treatment with supportive care when compared to the sponsor’s base case (i.e., incremental life-years: 1.62 [sponsor’s base case] versus 1.36 [CADTH’s reanalysis]), and this translated into a reduced difference in QALYs between metreleptin plus supportive care and supportive care alone. In line with clinical expert advice, the CADTH base case achieved more plausible estimates in the absence of long-term evidence, while still conferring a survival benefit with metreleptin treatment with supportive care. Due primarily to the drug acquisition cost for metreleptin, a price reduction of 99% would be necessary for metreleptin to be considered cost-effective at a WTP threshold of $50,000 per QALY gained. This would reduce the price of metreleptin from $803 to $8 (2.5 mg dose); from $1,605 to $16 (5 mg dose); and from $3,120 to $31 (10 mg dose).
CADTH conducted subgroup base-case analyses to assess the cost-effectiveness of metreleptin plus supportive care among patients with GL and patients with PL, separately. For patients with GL, metreleptin plus supportive care was associated with an incremental QALY gain of 2.27 and an incremental cost of $7,274,459 compared with supportive care alone, resulting in an ICER of $3,199,437 per QALY. For patients with PL, metreleptin plus supportive care was associated with an incremental QALY gain of 0.97 and an incremental cost of $6,767,340 compared with supportive care alone, resulting in an ICER of $6,979,408 per QALY. Drug acquisition costs for metreleptin represented the entirety (approximately 100%) of incremental cost compared to supportive care alone. Across subgroup analyses, metreleptin was not cost-effective at a WTP threshold of $50,000 per QALY in any of the simulations when compared to supportive care alone. Price reductions of 98% and 99% would be required for metreleptin plus supportive care to be cost-effective at a WTP threshold of $50,000 per QALY gained in the GL and PL patient subgroups, respectively. CADTH included caregiver utility in a nonreference case analysis that took into account the substantial burden on informal caregivers associated with lipodystrophy. The cost-effectiveness of metreleptin plus supportive care was sensitive to the inclusion of caregiver disutilities. When accounting for spillover quality-of-life decrements due to caregiver burden, the ICER of metreleptin plus supportive care decreased to $2,116,901 (incremental costs: $6,970,621; incremental QALYs: 3.29) relative to supportive care alone, in the overall indicated population. Moreover, in the GL subgroup, the ICER decreased to $1,771,327 (incremental costs: $7,097,683; incremental QALYs: 4.01), and in the PL subgroup, the ICER decreased to $2,270,267 (incremental costs: $6,927,677; incremental QALYs: 3.05).
Clinical uncertainties in the extrapolation period could not be adequately explored due to a lack of clinical data. In the submitted model, the use of hemoglobin A1C, ALT, and AST levels as surrogate outcomes predicted a reduced risk of cardiovascular, kidney-related, liver-related, neuropathy, and retinopathy complications among patients receiving metreleptin with supportive care compared to supportive care alone, which has not been shown in clinical studies. In the absence of such evidence, clinical experts consulted by CADTH for this review indicated that while the relationship between the aforementioned surrogate and primary end points is credible and established in the literature, there is uncertainty regarding the quantification of the associated risk reduction across organ subsystems, particularly as it pertains to patients with lipodystrophy. CADTH notes that given the probability of disease progression in each of the organ-specific submodels impacts survival, the strength of the surrogate relationships between hemoglobin A1C, ALT, and AST levels and disease-specific outcomes are highly relevant to the cost-effectiveness results. CADTH further notes that a survival gain associated with the use of metreleptin has not been shown in clinical studies, and although the surrogate relationships driving survival are plausible, according to clinical expert opinion, the quantification of the survival benefit associated with metreleptin treatment remains uncertain.
References
1.Pharmacoeconomic evaluation [internal sponsor's report]. In: Drug Reimbursement Review sponsor submission: Mylepta (metreleptin): powder for solution, 3mg, 5.8mg, 11.3mg, subcutaneous injection. Toronto (ON): Medison Canada; 2023 Jul 25.
2.Mylepta (metreleptin for injection): powder for solution, 3mg, 5.8mg, 11.3mg, subcutaneous injection [product monograph] [DRAFT]. Toronto (ON): Medison Pharma Canada Inc.
3.Gilead. Pharmacoeconomic evaluation [internal sponsor's report]. In: Drug Reimbursement Review sponsor submission: AXICABTAGENE CILOLEUCEL, Burlington (ON): Gilead Sciences Canada; 2023 Apr 12. Burlington2023.
4.National Institute for Health Care Excellence. Non-alcoholic fatty liver disease (NAFLD): assessment and management. NICE guideline [NG49] [sponsor supplied reference]. London (GB): NICE; 2016: https://www.nice.org.uk/guidance/ng49/evidence.
5.Akinci B, Oral EA, Neidert A, et al. Comorbidities and Survival in Patients With Lipodystrophy: An International Chart Review Study. J Clin Endocrinol Metab. 2019;104(11):5120-5135. PubMed
6.Bebu I, Schade D, Braffett B, et al. Risk Factors for First and Subsequent CVD Events in Type 1 Diabetes: The DCCT/EDIC Study. Diabetes Care. 2020;43(4):867-874. PubMed
7.Thokala P, Kruger J, Brennan A, et al. Assessing the cost-effectiveness of type 1 diabetes interventions: the Sheffield type 1 diabetes policy model. Diabet Med. 2014;31(4):477-486. PubMed
8.Smith L, Atherly A, Campbell J, Flattery N, Coronel S, Krantz M. Cost-effectiveness of a statewide public health intervention to reduce cardiovascular disease risk. BMC Public Health. 2019;19(1):1234. PubMed
9.Stratton IM, Adler AI, Neil HA, et al. Association of glycaemia with macrovascular and microvascular complications of type 2 diabetes (UKPDS 35): prospective observational study. BMJ. 2000;321(7258):405-412. PubMed
10.Eastman RC, Javitt JC, Herman WH, et al. Model of complications of NIDDM. I. Model construction and assumptions. Diabetes Care. 1997;20(5):725-734. PubMed
11.Hossain N, Afendy A, Stepanova M, et al. Independent predictors of fibrosis in patients with nonalcoholic fatty liver disease. Clin Gastroenterol Hepatol. 2009;7(11):1224-1229, 1229 e1221-1222.
12.FIECON. Indirect Treatment Comparison Technical Report. Mereleptin for the treatment of patients with lipodystrophy. 21 February 2020. Unpublished.
13.Aegerion Pharmaceuticals. Clinical study report: Protocol 991265 and 20010769. Metreleptin: Long Term Efficacy and Safety of Leptin Replacement in the Treatment of Patients with Lipodystrophy. 2016 [sponsor supplied reference].
14.Clarke P, Gray A, Holman R. Estimating utility values for health states of type 2 diabetic patients using the EQ-5D (UKPDS 62). Med Decis Making. 2002;22(4):340-349. PubMed
15.National Institute for Health Care Excellence. Metreleptin for treating lipodystrophy [HST14] [sponsor supplied reference]. 2021; https://www.nice.org.uk/guidance/hst14/history.
16.Guertin JR, Feeny D, Tarride JE. Age- and sex-specific Canadian utility norms, based on the 2013-2014 Canadian Community Health Survey. CMAJ. 2018;190(6):E155-E161. PubMed
17.Janssen MF, Szende A, Cabases J, Ramos-Goni JM, Vilagut G, Konig HH. Population norms for the EQ-5D-3L: a cross-country analysis of population surveys for 20 countries. Eur J Health Econ. 2019;20(2):205-216. PubMed
18.Kind P, Dolan P, Gudex C, Williams A. Variations in population health status: results from a United Kingdom national questionnaire survey. BMJ. 1998;316(7133):736-741. PubMed
19.Porterhouse Insights. Lipodystrophy caregiver disease burden survey. 2020.
20.Ontario Ministry of Health, Ontario Ministry of Long-Term Care. Ontario drug benefit formulary/comparative drug index. 2022; https://www.formulary.health.gov.on.ca/formulary/. Accessed 2022 Aug 1.
21.Ontario Ministry of Health. Schedule of Benefits for Laboratory Services [sponsor supplied reference]. Toronto Government of Ontario; 2020: https://www.health.gov.on.ca/en/pro/programs/ohip/sob/lab/lab_mn2020.pdf.
22.Ontario Ministry of Health. Schedule of Benefits: Physician Services Under the Health Insurance Act [sponsor supplied reference]. Toronto: Government of Ontario; 2023: https://www.health.gov.on.ca/en/pro/programs/ohip/sob/physserv/sob_master.pdf.
23.Zhang E, Wartelle-Bladou C, Lepanto L, Lachaine J, Cloutier G, Tang A. Cost-utility analysis of nonalcoholic steatohepatitis screening. Eur Radiol. 2015;25(11):3282-3294. PubMed
24.Biondi MJ, Estes C, Razavi-Shearer D, et al. Cost-effectiveness modelling of birth and infant dose vaccination against hepatitis B virus in Ontario from 2020 to 2050. CMAJ Open. 2023;11(1):E24-E32. PubMed
25.McGillion MH, Croxford R, Watt-Watson J, Lefort S, Stevens B, Coyte P. Cost of illness for chronic stable angina patients enrolled in a self-management education trial. Can J Cardiol. 2008;24(10):759-764. PubMed
26.Lachaine J, Charron JN, Gregoire JC, Hegele RA, Leiter LA. Cost-Effectiveness of Icosapent Ethyl (IPE) for the Reduction of the Risk of Ischemic Cardiovascular Events in Canada. Clinicoecon Outcomes Res. 2023;15:295-308. PubMed
27.Garg A. Acquired and inherited lipodystrophies. N Engl J Med. 2004;350(12):1220-1234. PubMed
28.Tran DT, Ohinmaa A, Thanh NX, et al. The current and future financial burden of hospital admissions for heart failure in Canada: a cost analysis. CMAJ Open. 2016;4(3):E365-E370. PubMed
29.Levy AR, Johnston KM, Daoust A, et al. Health expenditures after first hospital admission for heart failure in Nova Scotia, Canada: a retrospective cohort study. CMAJ Open. 2021;9(3):E826-E833. PubMed
30.Manns B, Hemmelgarn B, Tonelli M, et al. The Cost of Care for People With Chronic Kidney Disease. Can J Kidney Health Dis. 2019;6:2054358119835521. PubMed
31.Ferguson TW, Whitlock RH, Bamforth RJ, et al. Cost-Utility of Dialysis in Canada: Hemodialysis, Peritoneal Dialysis, and Nondialysis Treatment of Kidney Failure. Kidney Med. 2021;3(1):20-30 e21. PubMed
32.Tarride JE, Collet JP, Choinière M, Rousseau C, Gordon A. The economic burden of neuropathic pain in Canada. J Med Econ. 2006;9(1-4):55-68.
33.O'Reilly D, Hopkins R, Blackhouse G, et al. Long-Term Cost-utility Analysis of a Multidisciplinary Primary Care Diabetes Management Program in Ontario. Can J Diabetes. 2007;31(3):205-214.
34.Haig J, Barbeau M, Ferreira A. Cost-effectiveness of ranibizumab in the treatment of visual impairment due to diabetic macular edema. J Med Econ. 2016;19(7):663-671. PubMed
35.Gonder JR, Walker VM, Barbeau M, et al. Costs and Quality of Life in Diabetic Macular Edema: Canadian Burden of Diabetic Macular Edema Observational Study (C-REALITY). J Ophthalmol. 2014;2014:939315. PubMed
36.Deloitte. The cost of vision loss and blindness in Canada [report] [sponsor supplied reference]. 2021; https://www.fightingblindness.ca/wp-content/uploads/2021/12/Deloitte-Cost-of-vision-loss-and-blindness-in-Canada-report-May-2021.pdf.
37.Cook K, Ali O, Akinci B, et al. Effect of Leptin Therapy on Survival in Generalized and Partial Lipodystrophy: A Matched Cohort Analysis. J Clin Endocrinol Metab. 2021;106(8):e2953-e2967. PubMed
38.Canadian Agency for Drugs Technologies in Health. Guidelines for the Economic Evaluation of Health Technologies: Canada (4th Ed.) [sponsor supplied reference]. 2017; https://www.cadth.ca/guidelines-economic-evaluation-health-technologies-canada-4th-edition.
39.Bril F, Lomonaco R, Kalavalapalli S, Lai J, Cusi K. 223-OR: Pioglitazone Discontinuation in Patients with Nonalcoholic Steatohepatitis (NASH) Is Associated with Disease Recurrence. Diabetes. 2019;68:223-OR.
40.Chiquette E, Oral EA, Garg A, Araujo-Vilar D, Dhankhar P. Estimating the prevalence of generalized and partial lipodystrophy: findings and challenges. Diabetes Metab Syndr Obes. 2017;10:375-383. PubMed
41.Ara R, Wailoo A. NICE DSU Technical support document 12: The use of health state utility values in decision models [sponsor supplied reference]. 2011; http://nicedsu.org.uk/tsd12%20utilities%20in%20modelling%20final/.
42.Ara R, Brazier J. Estimating Health State Utility Values for Comorbidities. Pharmacoeconomics. 2017;35(Suppl 1):89-94. PubMed
43.Gomes A, Cook K, Wong A, Tuttle E, Stratton A, Sanders R. Experiences and Perspectives of Patients with Non-HIV-Associated Lipodystrophies and Their Caregivers: A Qualitative Study. Patient. 2021;14(5):673-685. PubMed
44.Ndefo UA, Eaton A, Green MR. Polycystic ovary syndrome: a review of treatment options with a focus on pharmacological approaches. P T. 2013;38(6):336-355. PubMed
45.pCPA. Ozempic (semaglutide) [sponsor supplied reference]. 2019; https://www.pcpacanada.ca/negotiation/21094. Accessed September 29 2023, 2023.
46.Ontario Drug Formulary. Semaglutide. Toronto: Ontario Ministry of Health and Long Term Care; 2023: https://www.formulary.health.gov.on.ca/formulary/results.xhtml?q=semaglutide&type=1. Accessed 2023 Sep 27.
47.Alberta Drug Formulary. Semaglutide. 2023; https://idbl.ab.bluecross.ca/idbl/drugsList;jsessionid=4zDYEMUIpvWjjLBtnshXGXdQOFitQUvpkGydBcm_yC19-7T-pcUQ!841252228?searchTerm=ozempic&category=&brandName=&ptc=&mfgCode=. Accessed 2023 Sep 23.
48.Saskatchewan Drug Plan. Semaglutide. 2023; https://formulary.drugplan.ehealthsask.ca/SearchFormulary/BG/864634. Accessed 2023 Sep 27.
49.pCPA. Jardiance (empagliflozin) 2018; https://www.pcpacanada.ca/negotiation/20956.
50.Alberta Drug Formulary. Empagliflozin. 2023; https://idbl.ab.bluecross.ca/idbl/drugsList?_cid=009626c8-47ff-40f1-be53-770434338897&searchTerm=empagli&genericName=EMPAGLIFLOZIN. Accessed 2023 Sep 23.
51.Ontario Drug Formulary. Empagliflozin. Toronto: Ontario Ministry of Health and Long Term Care; 2023: https://www.formulary.health.gov.on.ca/formulary/results.xhtml?q=empagliflozin&type=1. Accessed 2023 Sep 27.
52.Sutherland G, Dihn T. Understanding the gap: a pan-Canadian analysis of prescription drug insurance coverage. Ottawa (ON): The Conference Board of Canada; 2017: https://www.conferenceboard.ca/e-library/abstract.aspx?did=9326. Accessed 2023 Sep 27.
53.Gonzaga-Jauregui C, Ge W, Staples J, et al. Clinical and Molecular Prevalence of Lipodystrophy in an Unascertained Large Clinical Care Cohort. Diabetes. 2020;69(2):249-258. PubMed
54.Araujo-Vilar D, Santini F. Diagnosis and treatment of lipodystrophy: a step-by-step approach. J Endocrinol Invest. 2019;42(1):61-73. PubMed
55.Statistics Canada. Infographic 3, Population of urban areas growing faster than rural areas, although rural population still increasing 2022; https://www150.statcan.gc.ca/n1/daily-quotidien/220209/g-a003-eng.htm. Accessed 2023 Oct 4.
Appendix 1: Cost Comparison Table
Table 15: CADTH Cost Comparison Table for Lipodystrophy
Treatment | Strength / concentration | Form | Price ($) | Recommended dose | Daily cost ($) | Annual cost ($) |
|---|---|---|---|---|---|---|
Metreleptin (Myalepta) | 5 mg/mL | 3 mg vial (2.5 mg dose) 5.8 mg vial (5 mg dose) 11.3 mg vial (10 mg dose) with powder for solution | 802.6800a 1,604.5600 3,120.4100 | The dose range is 0.06 mg/kg to 0.13 mg/kg in patients weighing ≤ 40 kg; 2.5 mg to 10 mg in males weighing > 40 kg; and 5 mg to 10 mg in females weighing > 40 kg (Refer to Table 17). Dose is administered once daily. | 802.68 to 3,120 | 293,179 to 1,139,730 |
Antidiabetic therapies | ||||||
Empagliflozin (Jardiance) | 10 mg 25 mg | Tablet | 2.7671 2.7671 | Starting dose is 10 mg once daily. In patients requiring additional glycemic control, the dose can be increased to 25 mg once daily. | 2.77 | 1,010 |
Metformin | 500 mg | Tablet | 0.0247 | 500 mg 3 or 4 times daily. | 0.07 to 0.10 | 27.05 to 36.06 |
Regular human insulin (Novolin ge NPH) | 100 U/mL | 5 × 3 mL prefilled pens 10 mL vial | 48.8200 24.8300 | Insulin requirement is usually between 0.3 and 1.0 U/kg/day. In insulin resistance, the daily insulin requirement may be substantially higher. Clinical experts noted that doses from 500 U to 1,000 U daily may be required among patients with LD. | 12.42 to 24.83 | 4,531 to 9,063 |
Semaglutide (Ozempic) | 1.34 mg/mL | 1.5 mL prefilled pen 3 mL prefilled pen | 210.8700 210.8700 | 0.25 mg once weekly, increasing to 0.5mg once weekly after 4 weeks, and again to 1.0 mg once weekly to further improve glycemic control | Initial 4 weeks: 3.75 Thereafter: 7.42 | Year 1: 2,597 Thereafter: 2,699 |
Lipid-lowering therapies | ||||||
Atorvastatin | 10 mg 20 mg 40 mg 80 mg | Tablet | 0.1743 0.2179 0.2342 0.2342 | Starting dose is 10 or 20 mg once daily. Patients who require a large reduction in LDL-C (more than 45%) may be started at 40 mg once daily. The dose range is 10 to 80 mg once daily. | 0.17 to 0.23 | 63.62 to 85.48 |
Rosuvastatin | 5 mg 10 mg 20 mg 40 mg | Tablet | 0.1284 0.1354 0.1692 0.1990 | Dose range is 5 to 40 mg orally once daily. | 0.13 to 0.20 | 46.87 to 72.64 |
Fenofibrate | 100 mg | Tablet | 0.6105 | 200 mg once daily. | 1.22 | 445.67 |
Bezafibrate | 400 mg | Tablet | 1.7460 | 400 mg once daily. | 1.75 | 637.29 |
Antihypertensive therapies | ||||||
Ramipril | 2.5 mg 5 mg 10 mg | Tablet | 0.0817 0.0817 0.1034 | Starting dose is 2.5 mg once daily. The dose range is 2.5 mg to 10 mg once daily. | 0.08 to 0.10 | 29.82 to 37.74 |
Losartan | 25 mg 50 mg 100 mg | Tablet | 0.3148 0.3148 0.3148 | Starting dose is 50 mg once daily. The dose range is 50 to 100 mg once daily. | 0.31 | 114.90 |
LD = lipodystrophy.
The comparators presented in this table have been deemed to be appropriate based on feedback from clinical experts and drug plans. Comparators may be recommended (appropriate) practice or actual practice. Existing Product Listing Agreements are not reflected in the table and as such, the table may not represent the actual costs to public drug plans.
Note: All prices are from the Ontario Drug Benefit Formulary (accessed September 2023), unless otherwise indicated, and do not include dispensing fees. Recommended doses are from product monographs unless otherwise indicated.
aSponsor’s submitted price.1
Note that this table has not been copy-edited.
Appendix 2: Submission Quality
Note that this appendix has not been copy-edited.
Description | Yes or no | Comments |
|---|---|---|
Population is relevant, with no critical intervention missing, and no relevant outcome missing | Yes | No comment. |
Model has been adequately programmed and has sufficient face validity | No | Model lacked transparency and its programming prevented CADTH from fully exploring the associated uncertainties. The sponsor’s submitted model was programmed with limited transparency, with several outputs resulting from Visual Basic for Applications coding rather than formula-based operations. CADTH was unable to fully explore the uncertainty with parameters in the model, although results of the deterministic stepwise analysis met face validity. |
Model structure is adequate for decision problem | Yes | No comment. |
Data incorporation into the model has been done adequately (e.g., parameters for probabilistic analysis) | Yes | No comment. |
Parameter and structural uncertainty were adequately assessed; analyses were adequate to inform the decision problem | Yes | No comment. |
The submission was well organized and complete; the information was easy to locate (clear and transparent reporting; technical documentation available in enough details) | Yes | No comment. |
Appendix 3: Additional Information on the Submitted Economic Evaluation
Note that this appendix has not been copy-edited.
Figure 1: Patient-Level Simulation Overall Model Structure
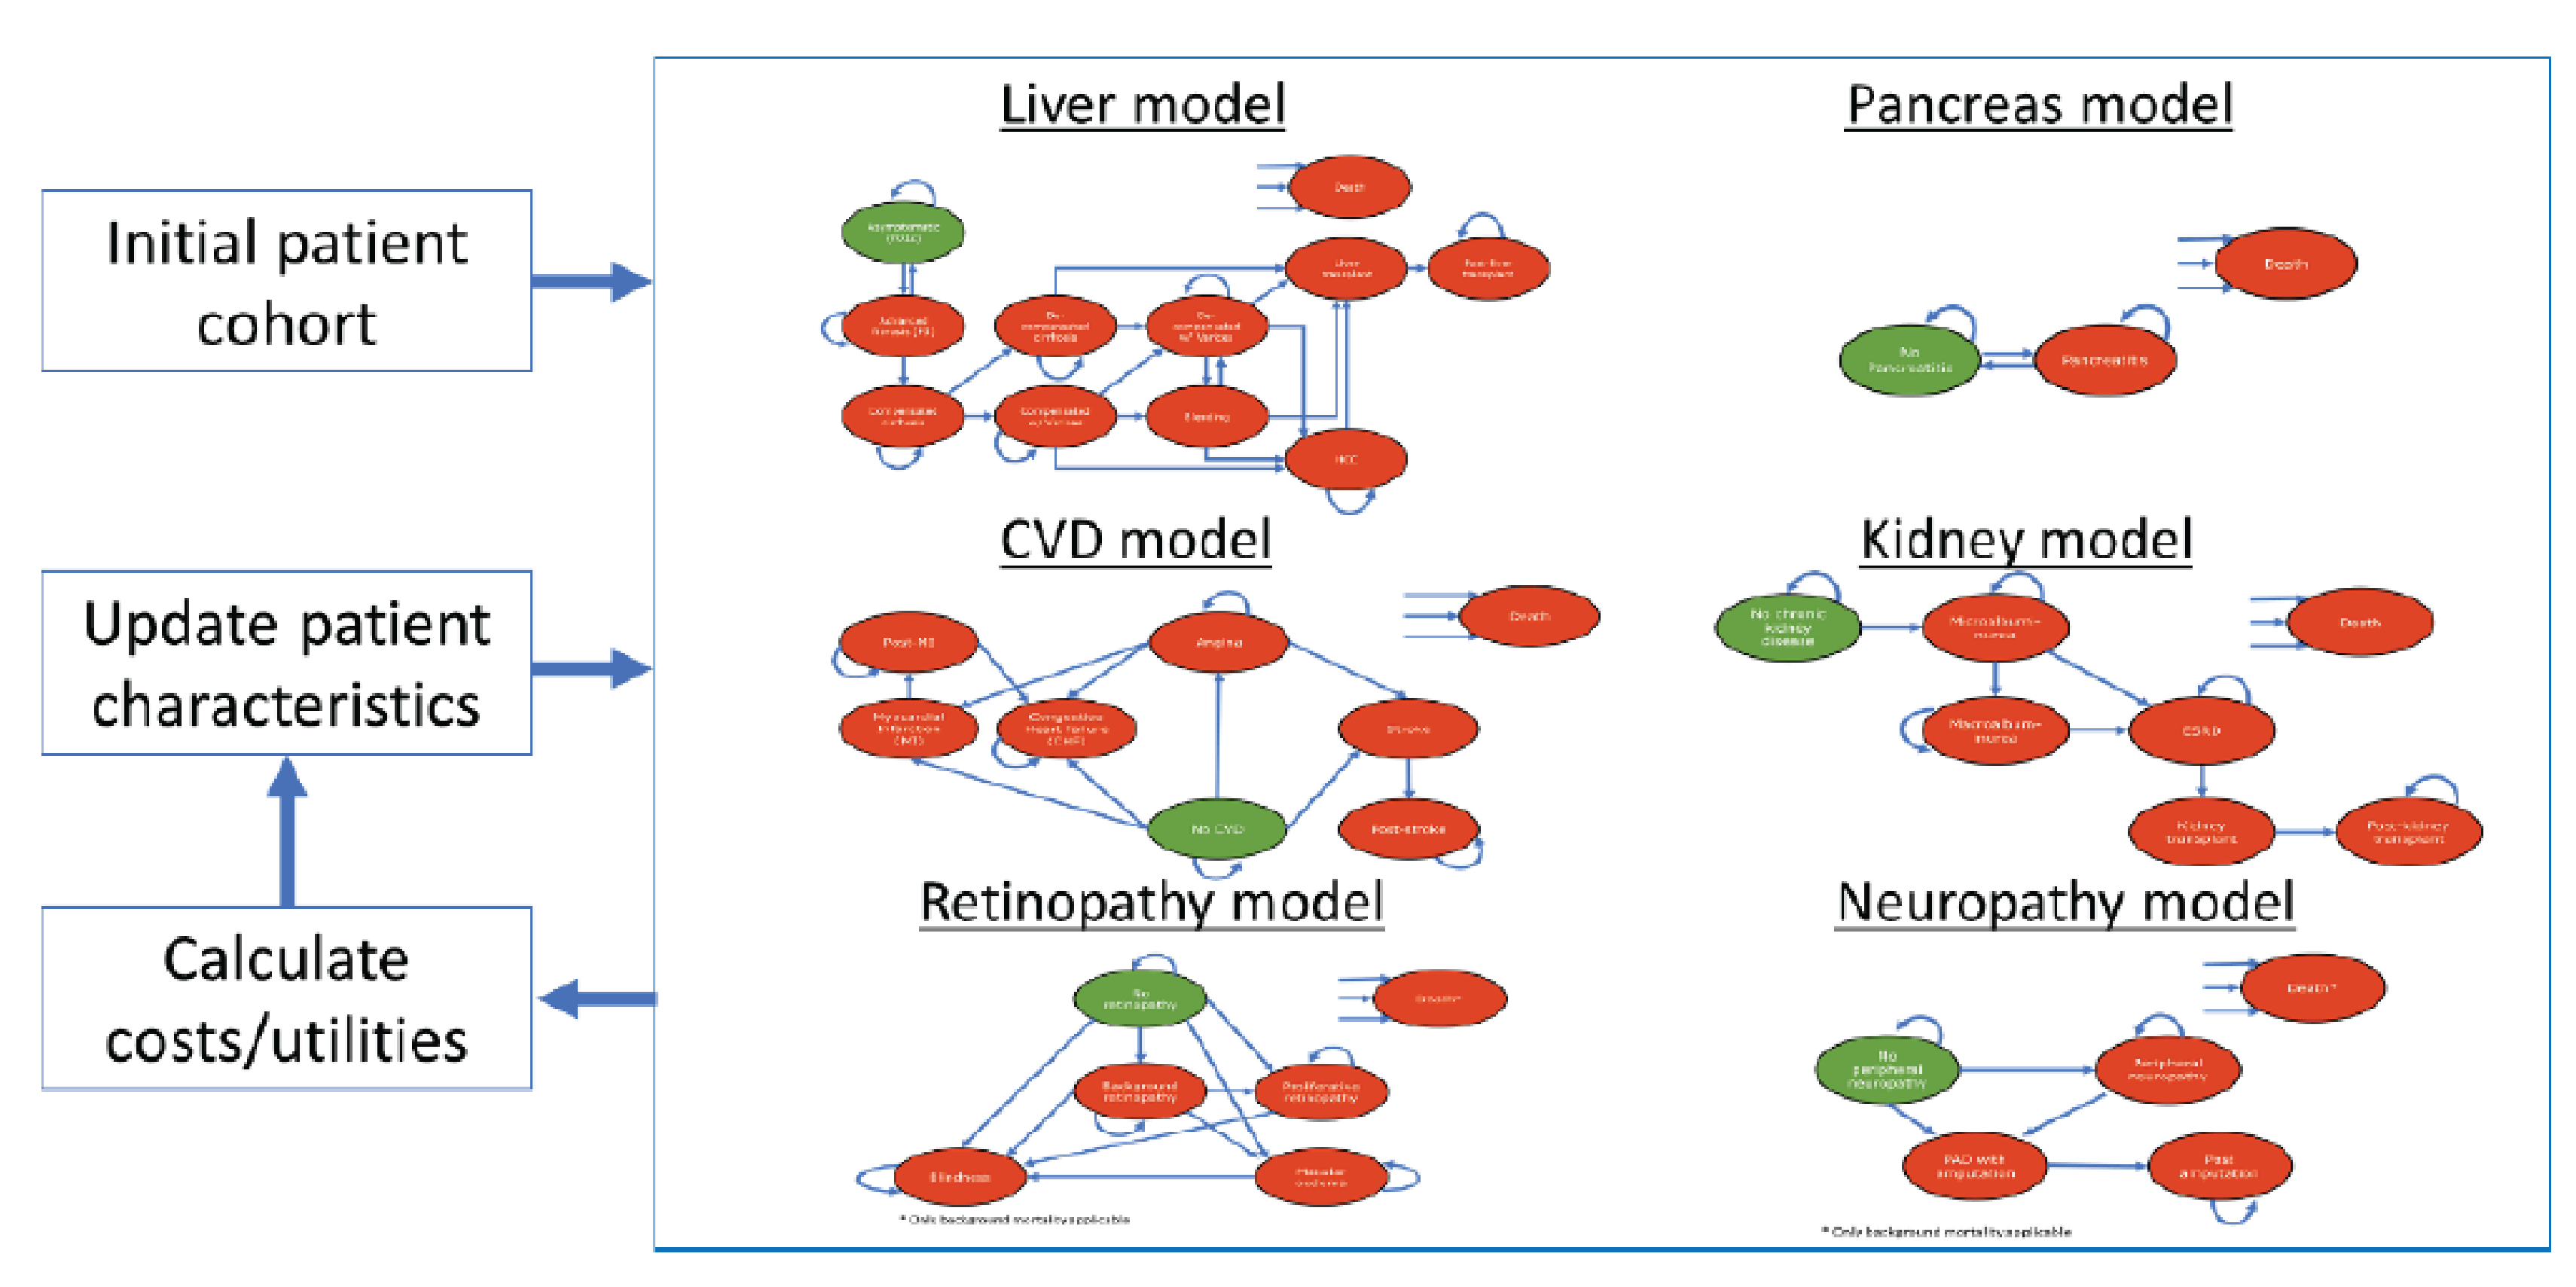
CVD = cardiovascular disease.
Source: Sponsor’s pharmacoeconomic submission.1
Figure 2: Liver Disease Submodel
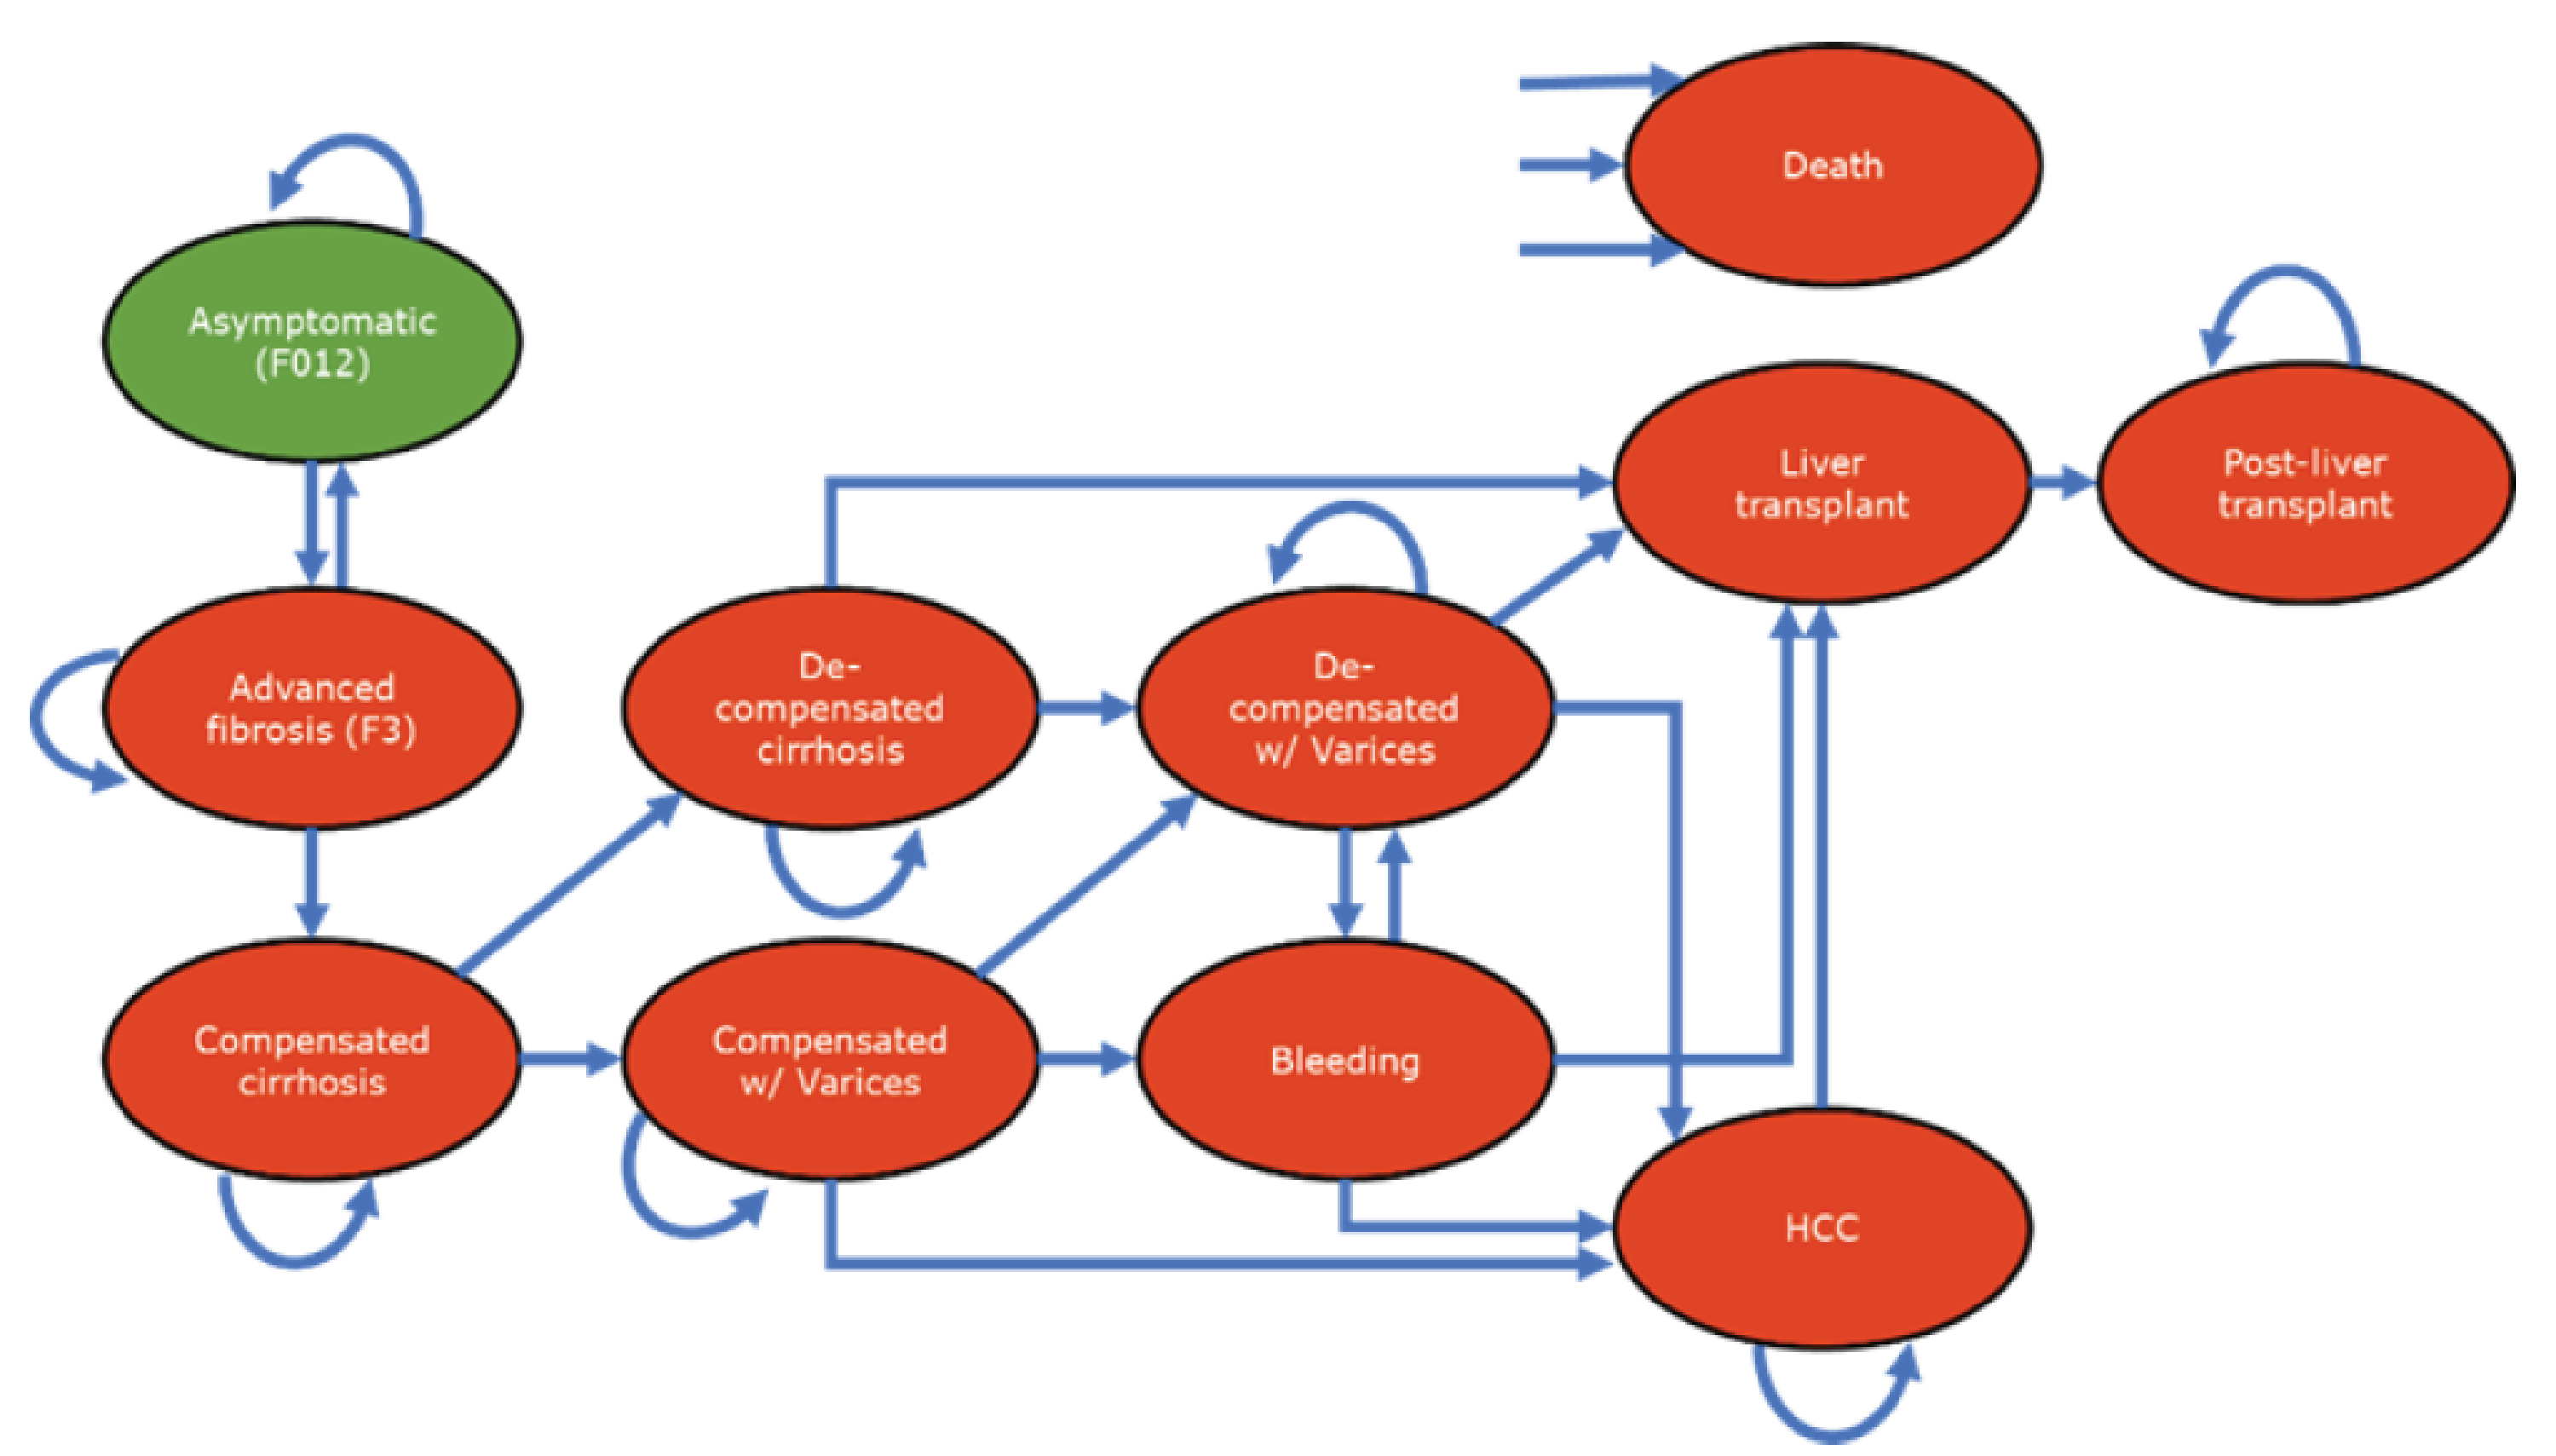
F = fibrosis; HCC = hepatocellular carcinoma; w/ = with.
Source: Sponsor’s pharmacoeconomic submission.1
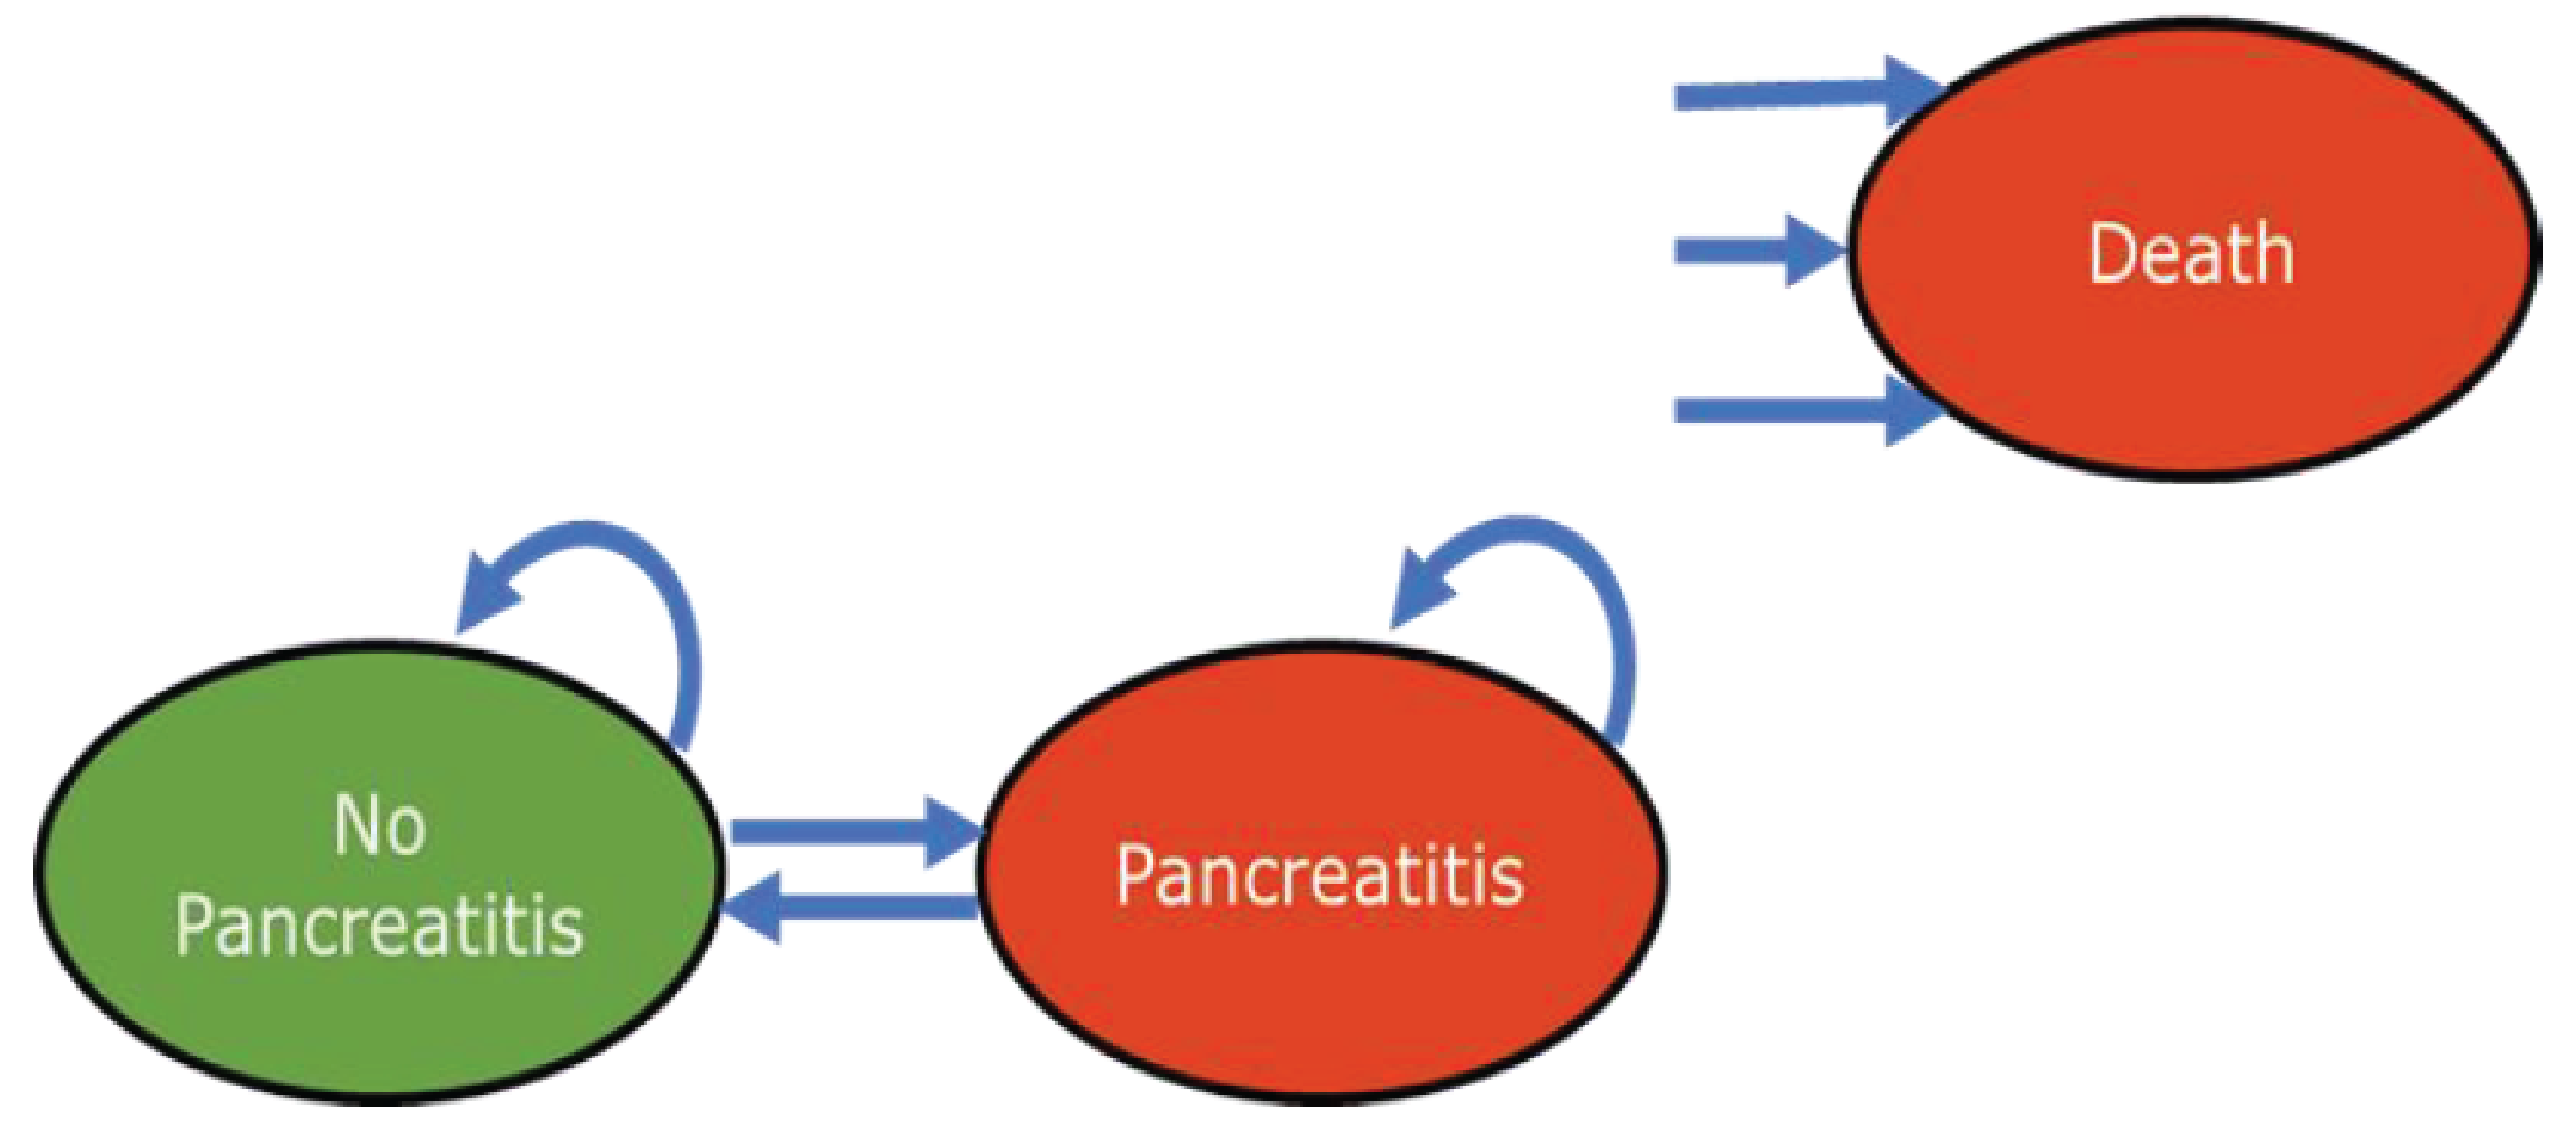
Figure 4: Cardiovascular Disease Submodel
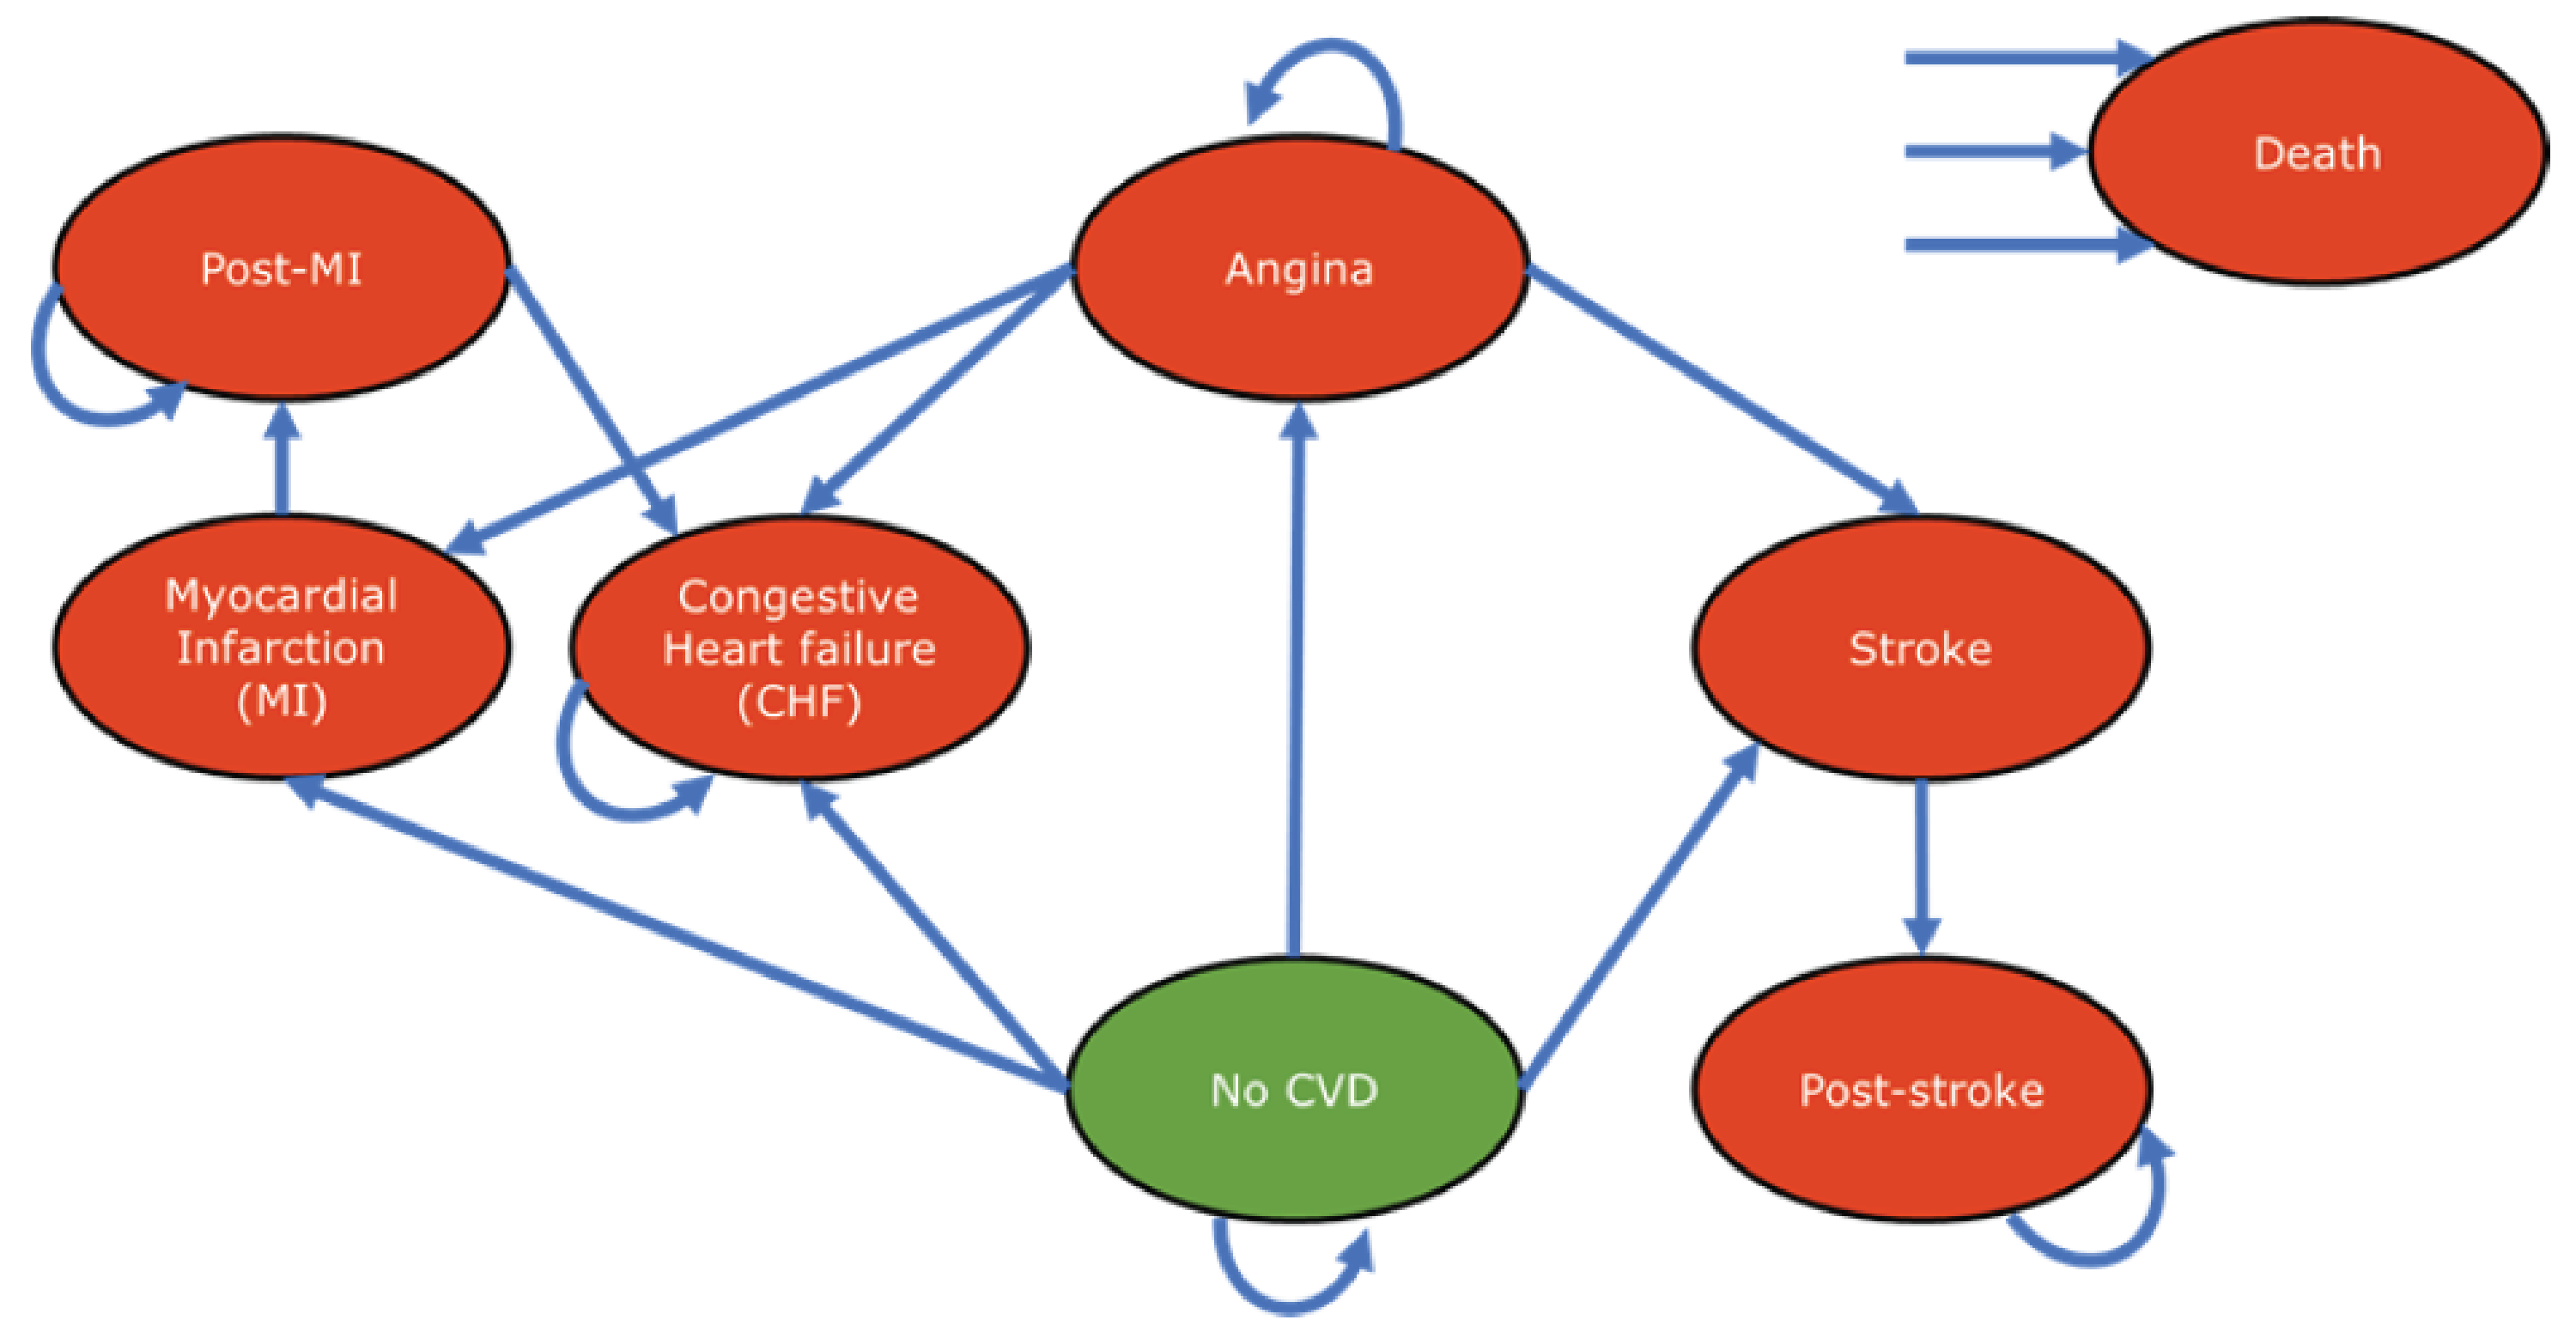
CHF = congestive heart failure; CVD = cardiovascular disease; MI = myocardial infarction.
Source: Sponsor’s pharmacoeconomic submission.1
Figure 5: Chronic Kidney Disease Submodel
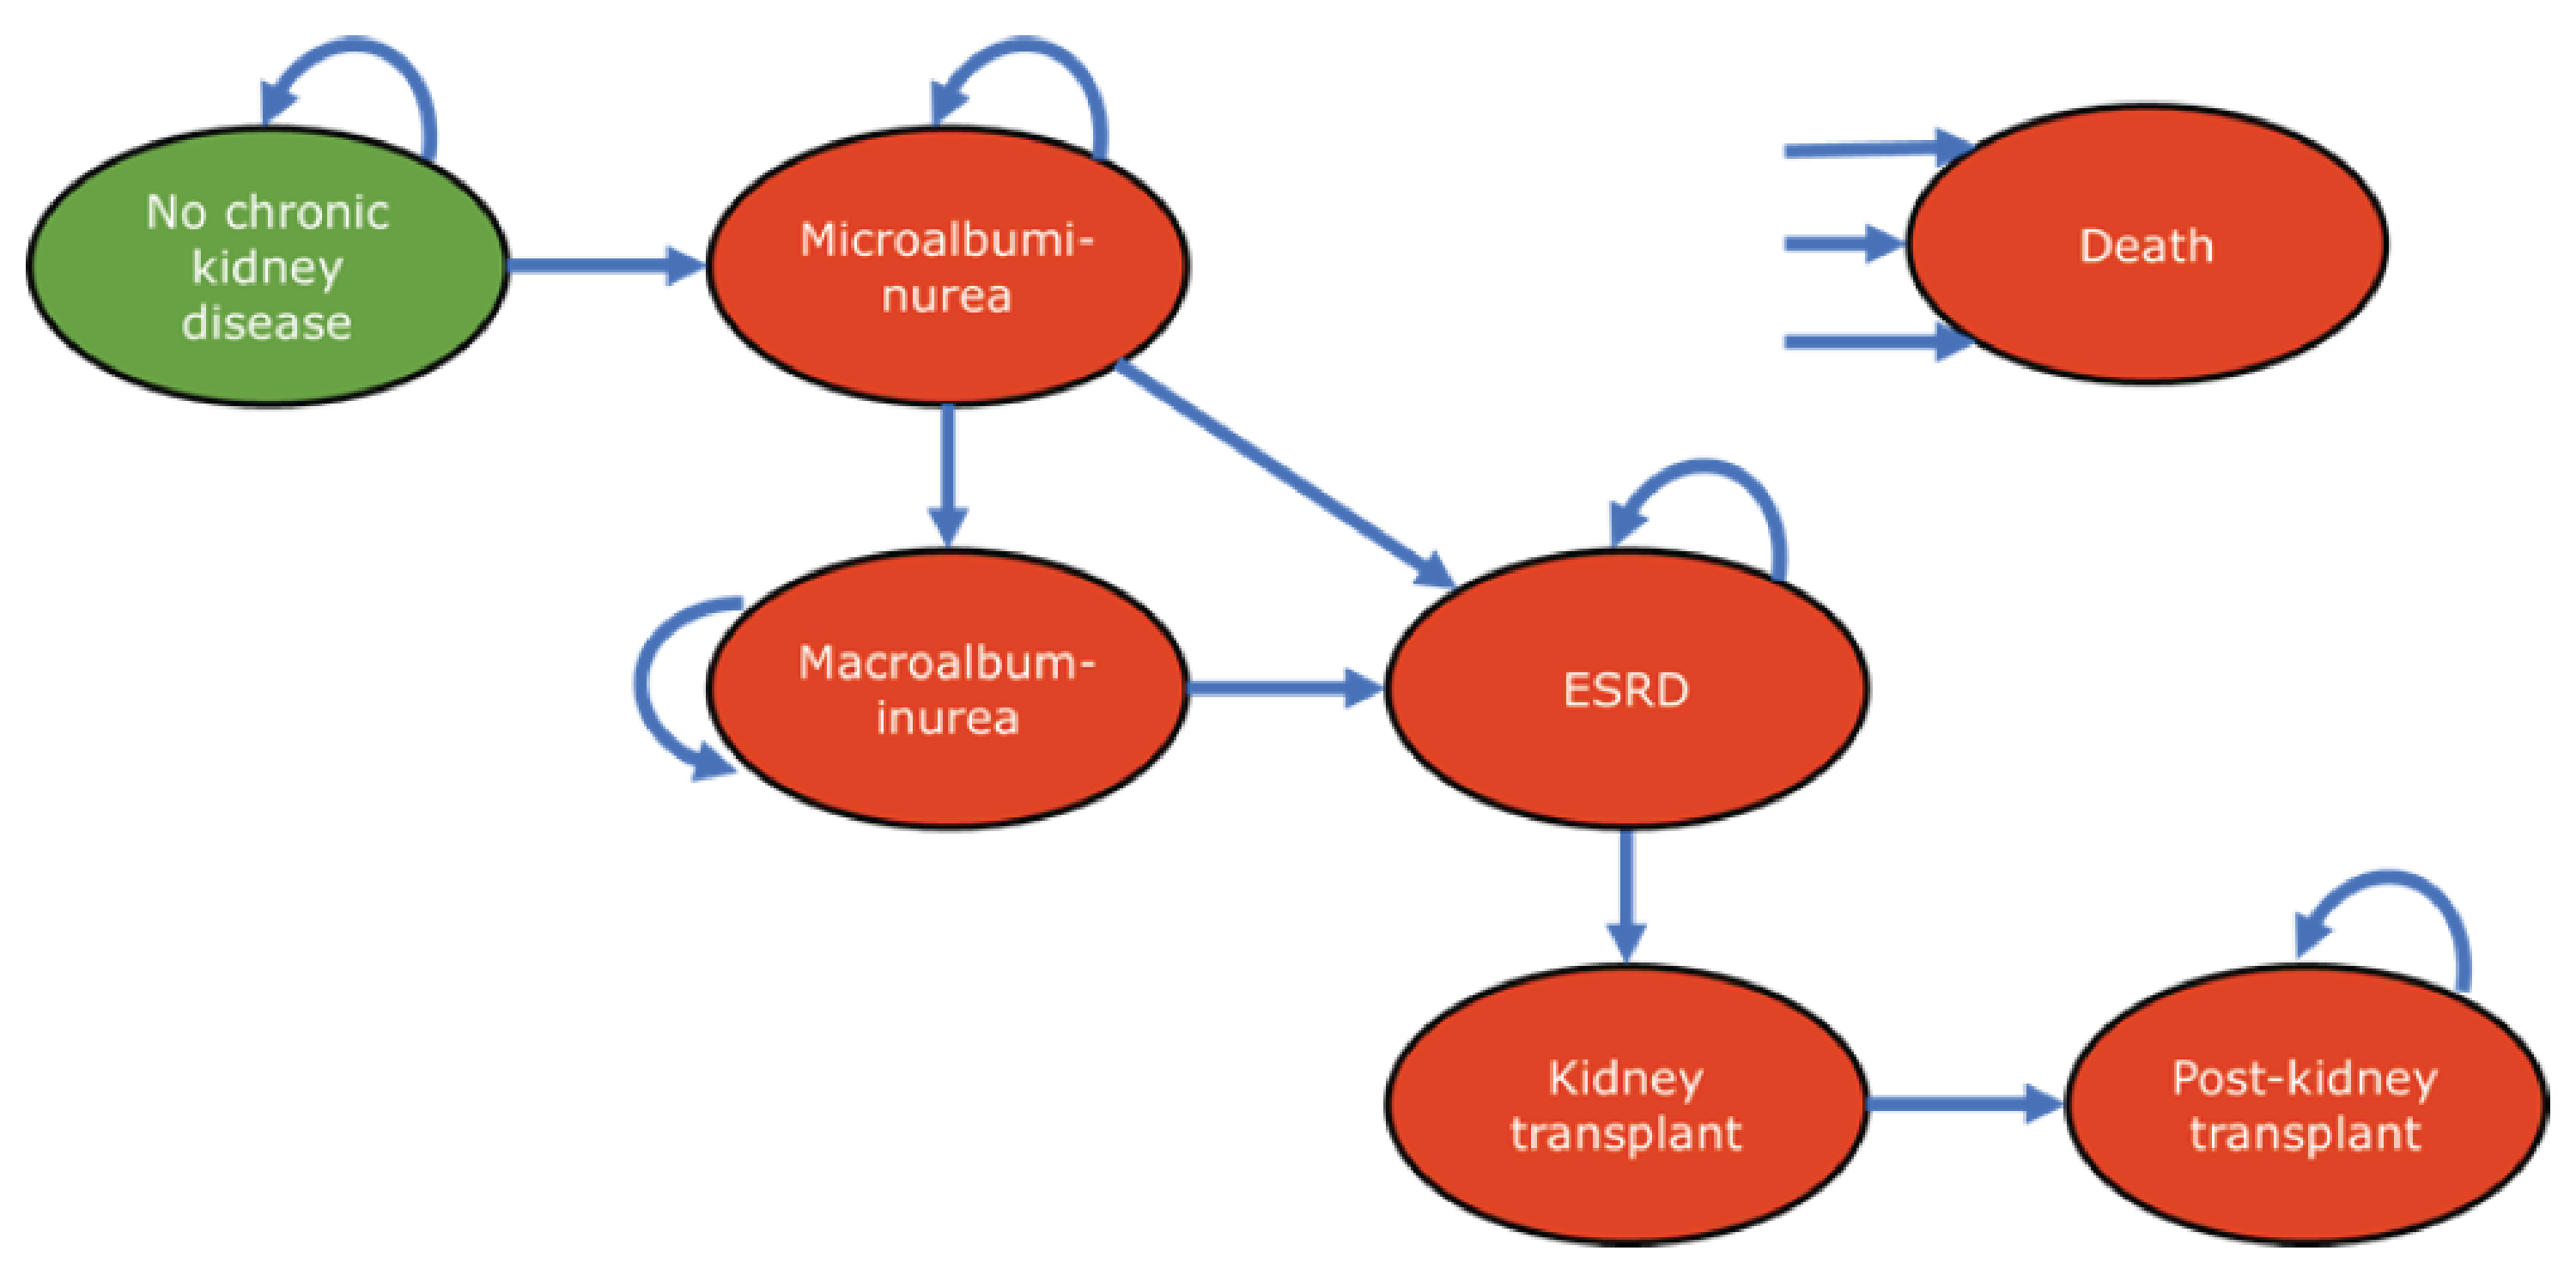
ESRD = end-stage renal disease.
Source: Sponsor’s pharmacoeconomic submission.1
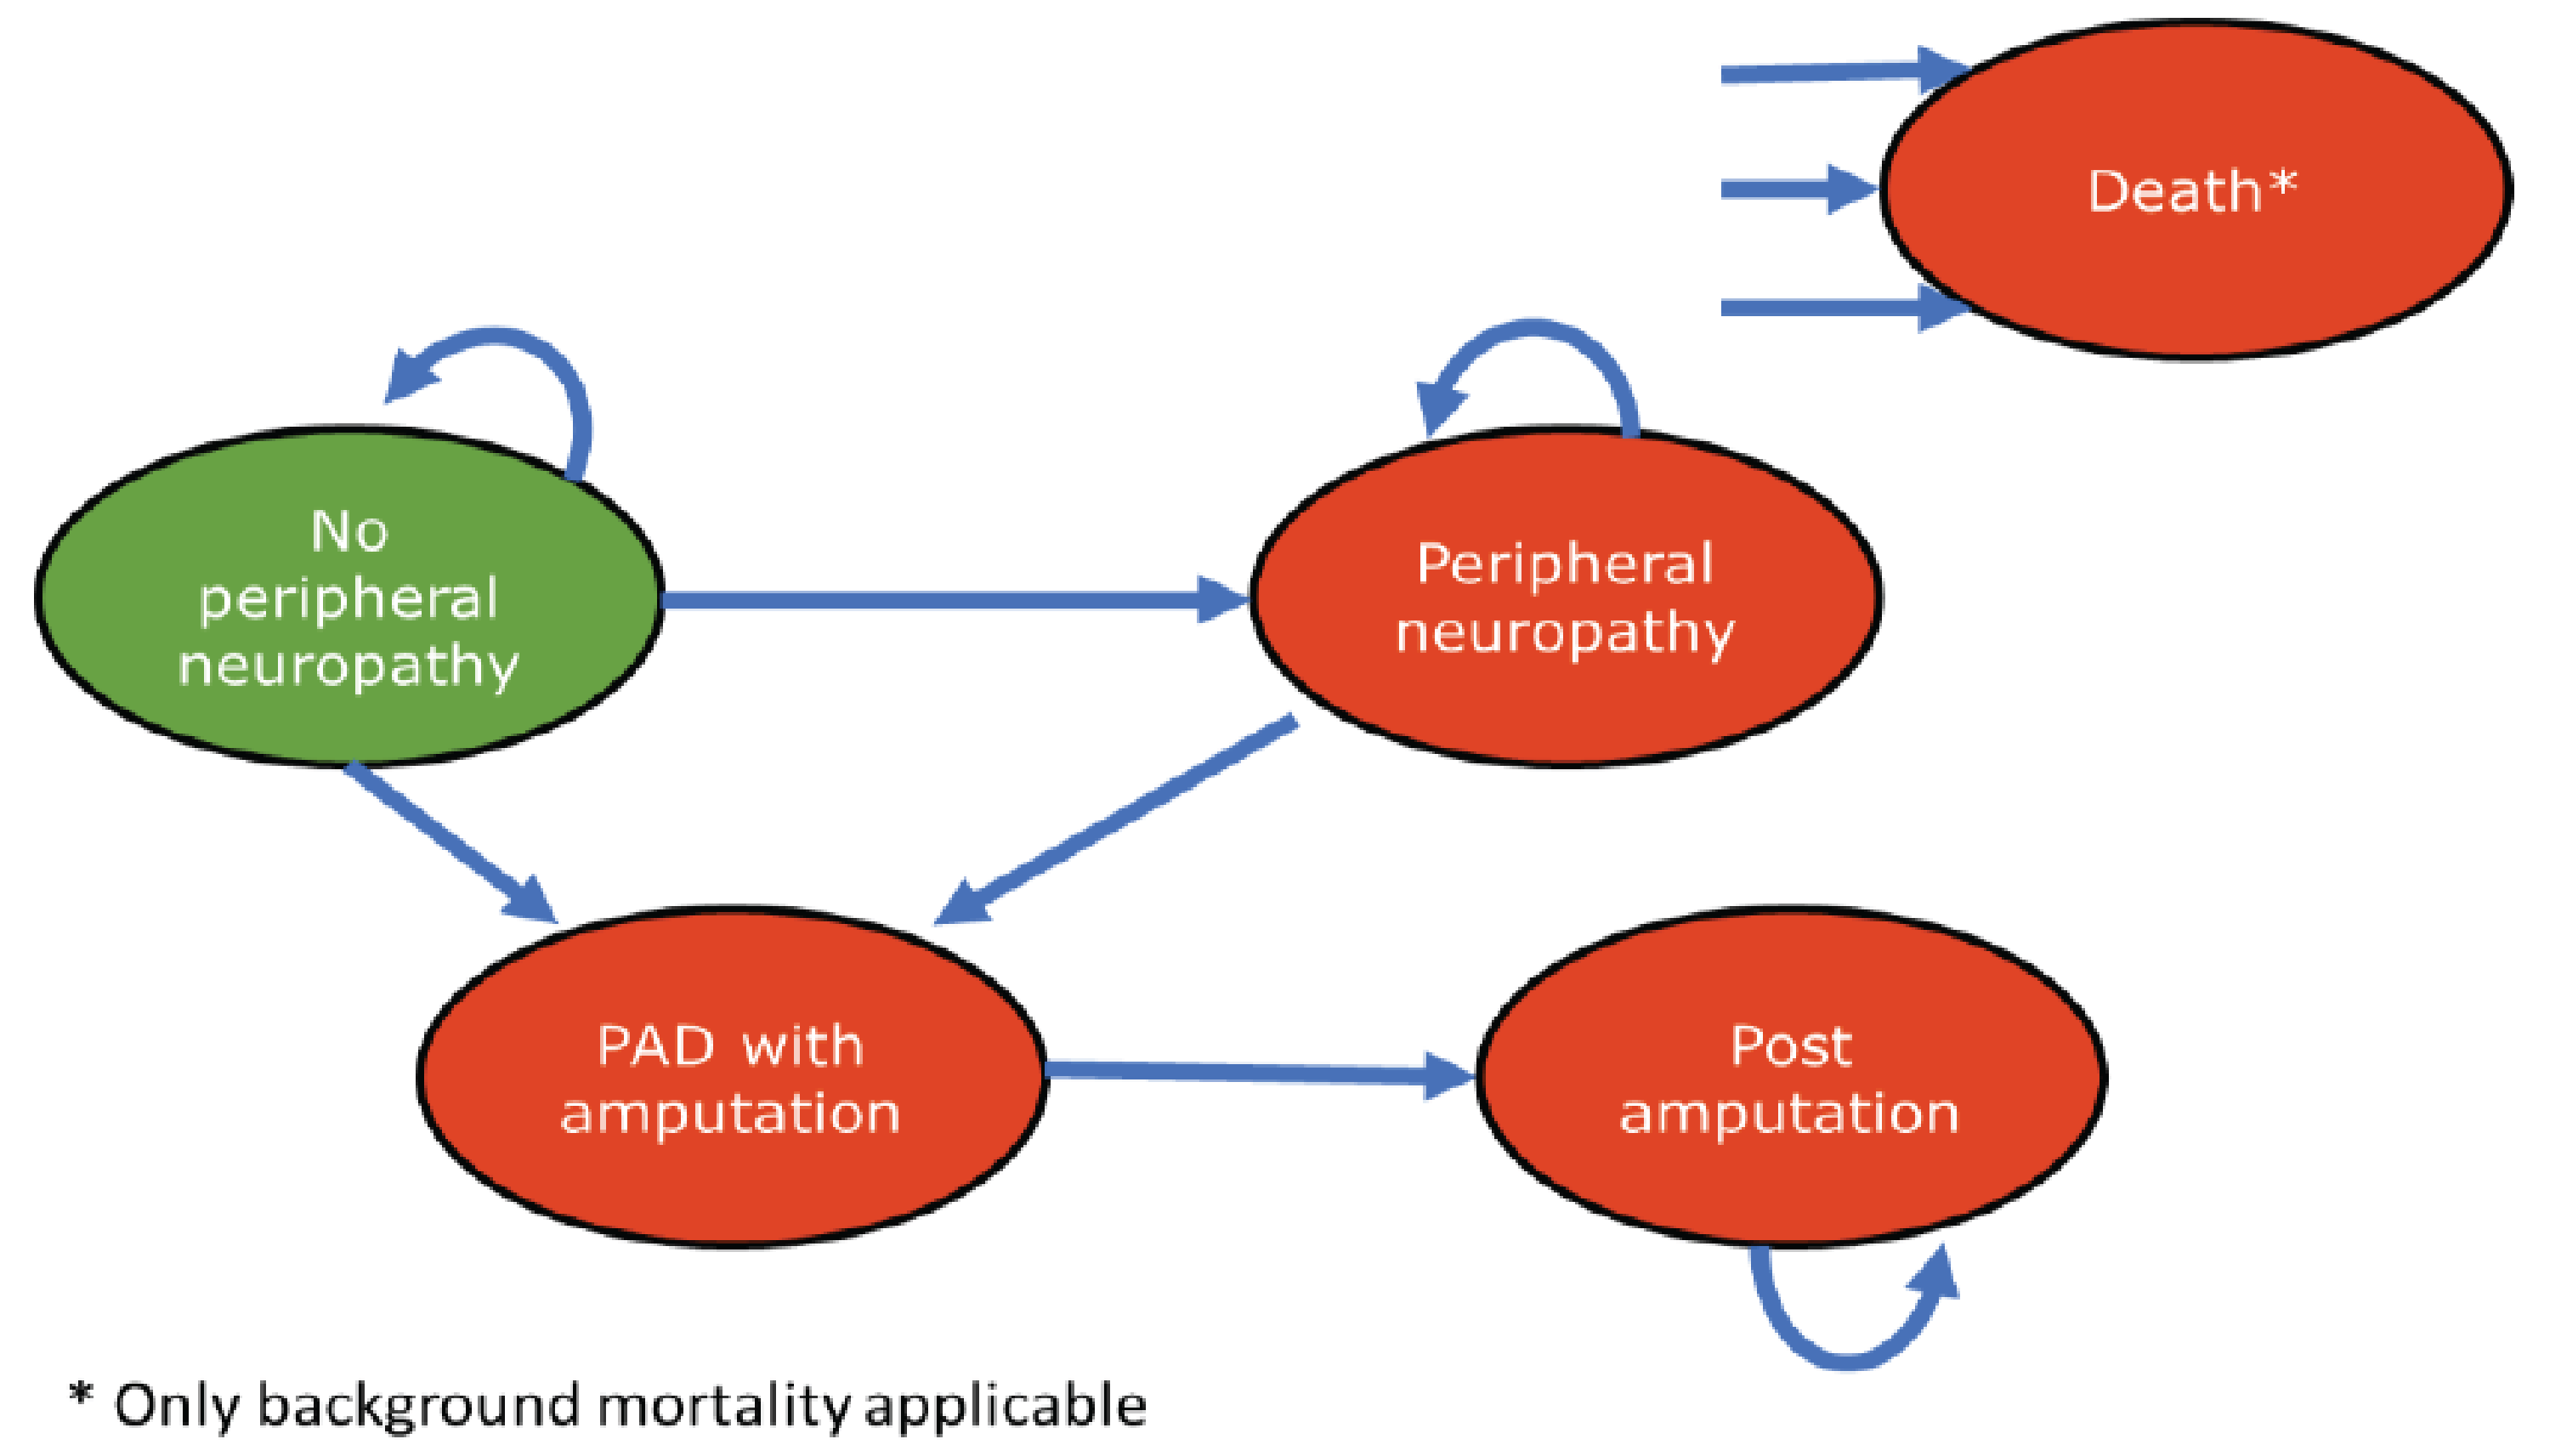
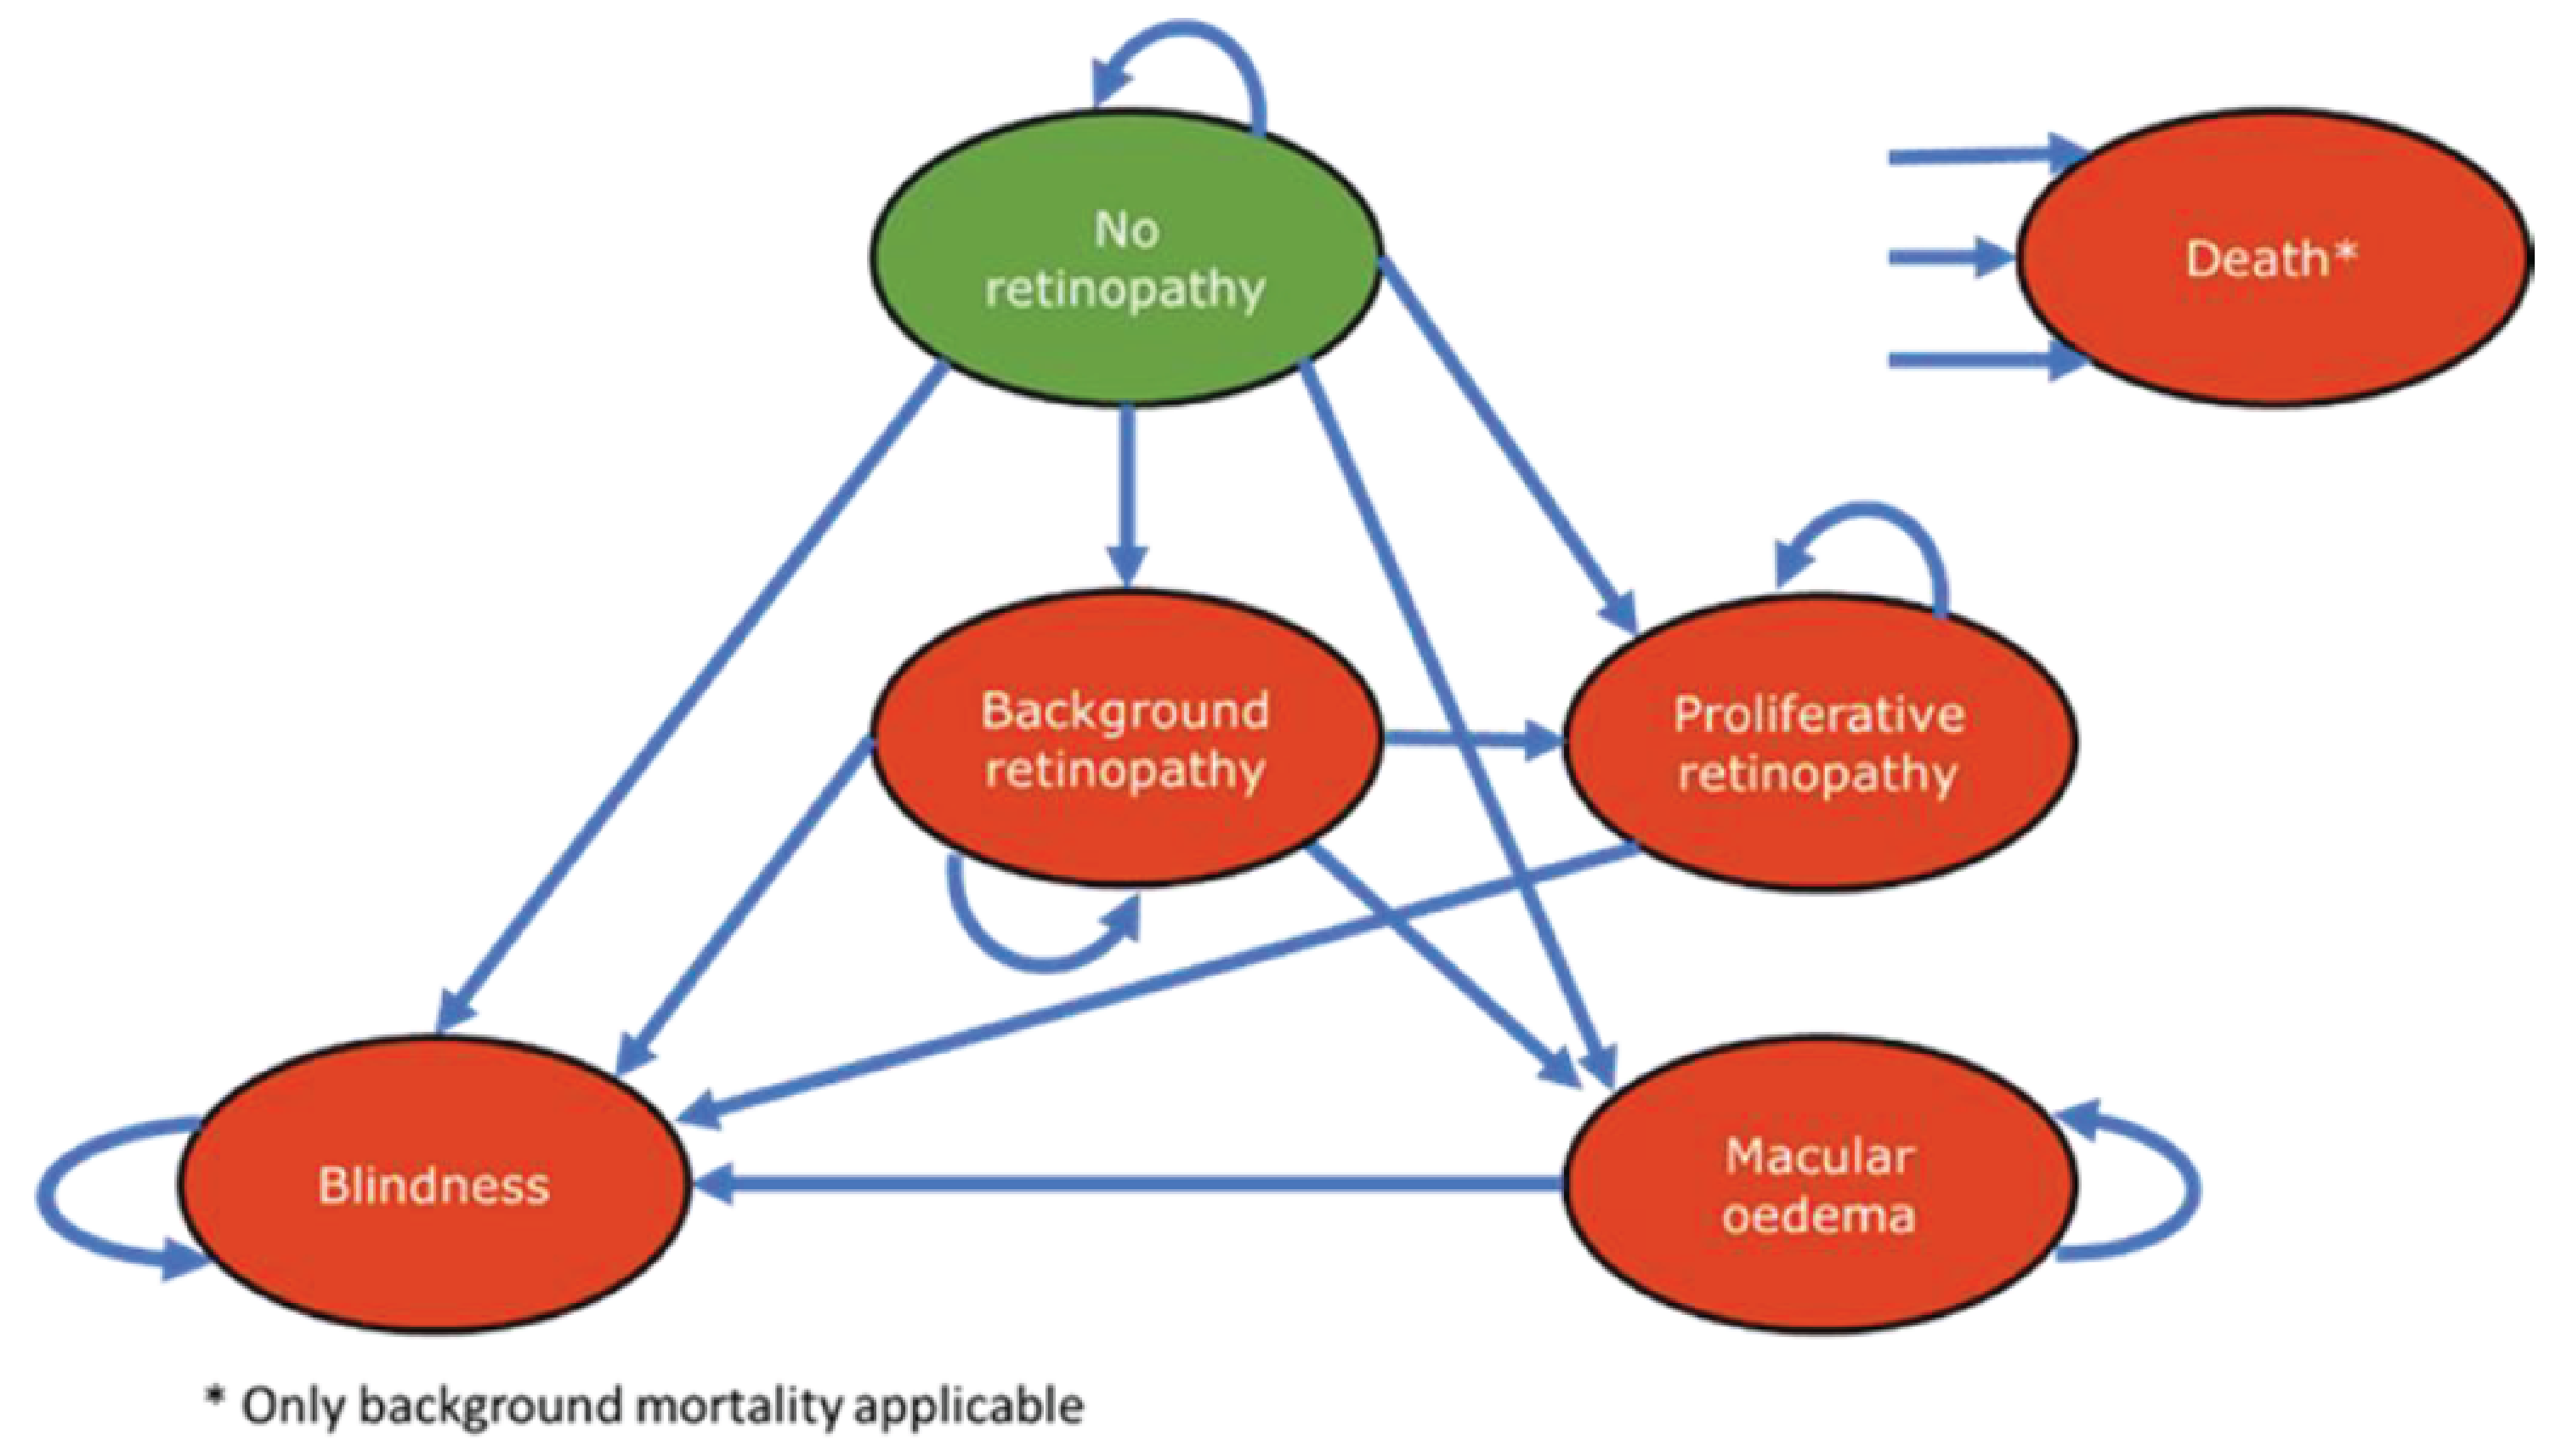
Table 17: Metreleptin Recommended Dose
Baseline weight | Starting daily dose (injection volume) | Dose adjustments (injection volume) | Maximum daily dose (injection volume) |
|---|---|---|---|
Males and Females ≤ 40 kg | 0.06 mg/kg (0.012 mL/kg) | 0.02 mg/kg (0.004 mL/kg) | 0.13 mg/kg (0.026 mL/kg) |
Males > 40 kg | 2.5 mg (0.5 mL) | 1.25 mg (0.25 mL) to 2.5 mg (0.5 mL) | 10 mg (2 mL) |
Females > 40 kg | 5 mg (1 mL) | 1.25 mg (0.25 mL) to 2.5 mg (0.5 mL) | 10 mg (2 mL) |
Source: Sponsor’s submitted product monograph.2
Table 18: Baseline Patient Characteristics for Patients With GL or PL
Baseline parameters | GL | PL |
|---|---|---|
Proportion of patients (%) | Male: 22.7% Female: 77.3% | Male: 2.4% Female: 97.6% |
Age (years), mean (SE) | Male: 19.5 (4.67) Female: 17.3 (1.49) | 34.1 (2.29) a |
Hemoglobin A1C, % (SE) | Male: 8.1 (0.65) Female: 8.8 (0.32) | 8.0 (0.34) a |
Triglyceride (mg/dL), (SE) | 1,288.70 (275.75)a | 1,063.20 (316.14) a |
Weight (kg), (SE) | Male: 55.1 (5.22) Female: 51.9 (2.60) | 69.1 (2.52) a |
GL = generalized lipodystrophy; PL = partial lipodystrophy; SE = standard error.
aData by sex is not available for this parameter in the sponsor’s submission.
Source: Sponsor’s pharmacoeconomic submission.1
Appendix 4: Additional Details on the CADTH Reanalyses and Sensitivity Analyses of the Economic Evaluation
Note that this appendix has not been copy-edited.
Detailed Results of CADTH Base Case
Table 19: Disaggregated Summary of CADTH’s Economic Evaluation Results by Submodels
Parameter | SC | Metreleptin + SC | Incremental |
|---|---|---|---|
Discounted LYs | |||
Total | 20.47 | 21.82 | 1.36 |
Cardiovascular | 20.49 | 21.84 | 1.35 |
Liver disease | 20.49 | 21.85 | 1.35 |
Chronic kidney disease | 20.49 | 21.84 | 1.35 |
Retinopathy | 20.49 | 21.84 | 1.35 |
Neuropathy | 20.47 | 21.82 | 1.36 |
Pancreatitis | 0.32 | 0.32 | 0.00 |
Discounted QALYs | |||
Total | 14.72 | 16.02 | 1.30 |
Baseline age-adjusted utility | 18.41 | 19.54 | 1.13 |
Cardiovascular disutilities | –0.30 | –0.32 | –0.01 |
Liver disease disutilities | –1.42 | –1.28 | 0.14 |
Chronic kidney disease disutilities | –0.84 | –0.80 | 0.03 |
Retinopathy disutilities | –0.43 | –0.40 | 0.03 |
Neuropathy disutilities | –1.22 | –1.20 | 0.02 |
Pancreatitis disutilities | –0.04 | –0.04 | 0.00 |
Discounted costs ($) | |||
Total | 354,083 | 7,249,521 | 6,895,438 |
Drug acquisition | 56,940 | 6,965,200 | 6,908,259 |
Medical visits and tests | 35,906 | 39,003 | 3,097 |
Cardiovascular | 17,109 | 17,333 | 224 |
Liver disease | 33,745 | 25,936 | –7,809 |
Chronic kidney disease | 157,765 | 150,093 | –7,672 |
Retinopathy | 17,848 | 16,892 | –956 |
Neuropathy | 33,150 | 33,473 | 323 |
Pancreatitis | 1,619 | 1,591 | –28 |
ICER ($/QALY) | 5,308,188 | ||
ICER = incremental cost-effectiveness ratio; LY = life-year; QALY = quality-adjusted life-year; SC = supportive care.
Table 20: Disaggregated Summary of CADTH’s Economic Evaluation Results by Health States
Parameter | SC | Metreleptin + SC | Incremental |
|---|---|---|---|
Discounted LYs | |||
Total | 20.47 | 21.82 | 1.36 |
Cardiovascular | |||
No CVD | 16.47 | 17.60 | 1.13 |
Angina | 1.43 | 1.60 | 0.17 |
MI | 0.20 | 0.21 | 0.01 |
Post-MI | 1.95 | 2.05 | 0.11 |
CHF | 0.27 | 0.24 | –0.03 |
Stroke | 0.04 | 0.03 | –0.01 |
Post-stroke | 0.14 | 0.11 | –0.03 |
Liver disease | |||
Asymptomatic liver disease | 14.94 | 17.55 | 2.61 |
Advanced fibrosis | 3.82 | 3.10 | –0.72 |
Compensated cirrhosis | 1.10 | 0.80 | –0.30 |
Decompensated cirrhosis | 0.21 | 0.14 | –0.07 |
Compensated / varices | 0.06 | 0.04 | –0.02 |
Decompensated / varices | 0.19 | 0.12 | –0.07 |
Bleeding | 0.08 | 0.06 | –0.02 |
HCC | 0.01 | 0.00 | 0.00 |
Transplant | 0.01 | 0.01 | –0.01 |
Post transplant | 0.09 | 0.04 | –0.05 |
Chronic kidney disease | |||
No CKD | 12.42 | 14.05 | 1.63 |
Microalbuminuria | 1.70 | 1.73 | 0.03 |
Macroalbuminuria | 0.77 | 0.72 | –0.05 |
ESRD | 2.39 | 2.30 | –0.09 |
Transplant | 0.19 | 0.18 | –0.02 |
Post transplant | 3.02 | 2.86 | –0.15 |
Retinopathy | |||
No retinopathy | 12.07 | 13.99 | 1.91 |
BG retinopathy | 2.30 | 2.16 | –0.14 |
Pro retinopathy | 3.94 | 3.41 | –0.53 |
Macular edema | 2.00 | 2.07 | 0.07 |
Blindness | 0.18 | 0.22 | 0.04 |
Neuropathy | |||
No PN | 12.23 | 13.65 | 1.42 |
CCN | 5.50 | 5.57 | 0.07 |
PADAmp | 2.74 | 2.60 | –0.13 |
Pancreatitis | |||
Pancreatitis | 0.32 | 0.32 | 0.00 |
Discounted QALYs | |||
Total | 14.72 | 16.02 | 1.30 |
General | |||
Baseline age-adjusted utility | 18.41 | 19.54 | 1.13 |
Cardiovascular disutilities | |||
Angina | –0.13 | –0.14 | –0.02 |
MI | –0.01 | –0.01 | 0.00 |
Post-MI | –0.11 | –0.11 | –0.01 |
CHF | –0.03 | –0.03 | 0.00 |
Stroke | –0.01 | 0.00 | 0.00 |
Post-stroke | –0.02 | –0.02 | 0.00 |
Liver disease disutilities | |||
Asymptomatic liver disease | –0.48 | –0.56 | –0.08 |
Advanced fibrosis | –0.57 | –0.47 | 0.11 |
Compensated cirrhosis | –0.30 | –0.22 | 0.08 |
Decompensated cirrhosis | –0.07 | –0.05 | 0.02 |
Chronic kidney disease disutilities | |||
Macroalbuminuria | –0.04 | –0.03 | 0.00 |
ESRD | –0.52 | –0.51 | 0.02 |
Transplant | –0.03 | –0.03 | 0.00 |
Post transplant | –0.25 | –0.24 | 0.01 |
Retinopathy disutilities | |||
BG retinopathy | –0.06 | –0.06 | 0.00 |
Pro retinopathy | –0.27 | –0.24 | 0.03 |
Macular edema | –0.08 | –0.08 | 0.00 |
Blindness | –0.01 | –0.02 | 0.00 |
Neuropathy disutilities | |||
CCN | –0.46 | –0.46 | 0.00 |
PADAmp | –0.76 | –0.74 | 0.03 |
Pancreatitis disutilities | |||
Pancreatitis | –0.04 | –0.04 | 0.00 |
Discounted costs ($) | |||
Total | 354,083 | 7,249,521 | 6,895,438 |
General | |||
Drug | 56,940 | 6,965,200 | 6,908,259 |
Medical visits/tests | 35,906 | 39,003 | 3,097 |
Cardiovascular | |||
Angina | 2,515 | 2,845 | 330 |
MI | 2,863 | 2,956 | 93 |
Post-MI | 7,395 | 7,771 | 377 |
CHF | 2,621 | 2,319 | −302 |
Stroke | 978 | 810 | –168 |
Post-stroke | 738 | 632 | –106 |
Liver disease | |||
Asymptomatic liver disease | 6,567 | 7,588 | 1,021 |
Advanced fibrosis | 10,144 | 8,279 | –1,865 |
Compensated cirrhosis | 3,161 | 2,333 | –828 |
Decompensated cirrhosis | 3,556 | 2,296 | –1,259 |
Compensated / varices | 163 | 107 | –56 |
Decompensated / varices | 3,182 | 1,996 | –1,186 |
Bleeding | 239 | 170 | –69 |
HCC | 157 | 65 | –93 |
Transplant | 1,532 | 743 | –789 |
Posttransplant | 5,045 | 2,359 | –2,686 |
Chronic kidney disease | |||
Macroalbuminuria | 10,465 | 9,887 | –578 |
ESRD | 125,204 | 119,735 | –5,468 |
Transplant | 14,758 | 13,570 | –1,188 |
Post transplant | 7,339 | 6,900 | –439 |
Retinopathy | |||
PRO retinopathy | 8,272 | 7,189 | –1,083 |
Macular edema | 9,288 | 9,367 | 79 |
Blindness | 288 | 336 | 48 |
Neuropathy | 0 | ||
CCN | 29,375 | 29,914 | 540 |
PADAmp | 3,775 | 3,559 | –216 |
Pancreatitis | |||
Pancreatitis | 1,619 | 1,591 | –28 |
ICER ($/QALY) | 5,308,188 | ||
BG = background; CCN = confirmed clinical neuropathy; CHF = chronic heart failure; CKD = chronic kidney disease; CVD = cardiovascular disease; ESRD = end-stage renal disease; HCC = hepatocellular carcinoma; ICER = incremental cost-effectiveness ratio; LY = life-year; MI = myocardial infarction; PADAmp = peripheral artery disease amputation; PN = peripheral neuropathy; PRO = proliferative; QALY = quality-adjusted life-year; SC = supportive care.
Scenario Analyses
Table 21: Scenario Analysis of CADTH’s Economic Evaluation Results
Stepped analysis | Drug | Total costs ($) | Total QALYs | ICER ($/QALY) |
|---|---|---|---|---|
CADTH base case | SC | 354,083 | 14.72 | Reference |
Metreleptin + SC | 7,249,521 | 16.02 | 5,308,188 | |
Scenario 1: Inclusion of caregiver utilities | SC | 346,903 | 11.23 | Ref. |
Metreleptin + SC | 7,317,524 | 14.52 | 2,116,901 | |
CADTH base case (GL subgroup) | SC | 402,296 | 15.21 | Reference |
Metreleptin + SC | 7,676,755 | 17.49 | 3,199,437 | |
GL subgroup – Scenario 1: Inclusion of caregiver utilities | SC | 402,035 | 11.63 | Reference |
Metreleptin + SC | 7,499,718 | 15.63 | 1,771,327 | |
CADTH base case (PL subgroup) | SC | 337,788 | 14.56 | Reference |
Metreleptin + SC | 7,105,128 | 15.53 | 6,979,408 | |
PL subgroup – Scenario 1: Inclusion of caregiver utilities | SC | 328,270 | 11.09 | Reference |
Metreleptin + SC | 7,255,948 | 14.15 | 2,270,267 |
GL = generalized lipodystrophy; ICER = incremental cost-effectiveness ratio; PL = partial lipodystrophy; QALY = quality-adjusted life-year; SC = supportive care.
Appendix 5: Submitted BIA and CADTH Appraisal
Note that this appendix has not been copy-edited.
Table 22: Summary of Key Take-Aways
Key take-aways of the BIA |
|---|
|
Summary of Sponsor’s BIA
The sponsor submitted a BIA to estimate the incremental three-year budget impact of reimbursing metreleptin for the treatment of patients with congenital or acquired GL in adults and children 2 years of age and above, as well as patients with familial or acquired PL in adults and children 12 years of age and above with persistent significant metabolic abnormalities (e.g., persistent insulin resistance, poorly controlled diabetes, persistent hypertriglyceridemia) for whom standard treatments have failed to achieve adequate metabolic control, as per its Health Canada indication. The analysis was performed from the perspective of the public drug plan formulary in Canada. The sponsor estimated the budget impact by comparing 2 scenarios: a reference scenario that estimated the total costs associated with supportive care for the treatment of patients with congenital or acquired GL, as well as patients with familial or acquired PL for whom standard treatments have failed to achieve adequate metabolic control; and a new drug scenario, where metreleptin is funded. supportive care was composed of antidiabetic therapies (i.e., insulin, metformin, empagliflozin, semaglutide), lipid-lowering therapies (i.e., atorvastatin, rosuvastatin, fenofibrate, bezafibrate), and antihypertensive therapies (i.e., ramipril, losartan). The sponsor estimated the eligible population using an epidemiology-based approach, leveraging data from multiple sources in the scientific literature13,40,52 and assumptions based on clinical expert input. Drug acquisition costs were the only costs considered in the model. The dosing modelled for metreleptin reflected the product monograph. Key inputs to the BIA are documented in Table 23.
Key assumptions made by the sponsor include the following:
100% of patients with GL are diagnosed given that they present with severe metabolic complications (e.g., insulin-resistant diabetes, hypertriglyceridemia) that render them identifiable by the health care system
50% of patients with PL are diagnosed given that the partial loss of adipose tissue may occur over time rendering them less identifiable compared to patients with GL
20% of patients with PL are inadequately controlled with supportive care (i.e., patients with more severe metabolic complications including elevated hemoglobin A1C and triglyceride levels).
Table 23: Summary of Key Model Parameters
Parameter | Sponsor’s estimate (reported as year 1 / year 2 / year 3 if appropriate) |
|---|---|
Target population | |
Pan-Canadian population | 30,975,432 |
Prevalence of GL40 | 0.000096% |
Diagnosis rate | 100% |
British Columbia | 100% |
Alberta | 100% |
Saskatchewan | 100% |
Manitoba | 100% |
Ontario | 91% |
New Brunswick | 41% |
Nova Scotia | 100% |
Prince Edward Island | 42% |
Newfoundland and Labrador | 25% |
NIHB Program | 100% |
Number of eligible patients with GL | 31 / 31 / 31 |
Prevalence of PL40 | 0.000284% |
Diagnosis rate | 50% |
Proportion of patients who are inadequately controlled | 20% |
British Columbia | 100% |
Alberta | 100% |
Saskatchewan | 100% |
Manitoba | 100% |
Ontario | 53% |
New Brunswick | 31% |
Nova Scotia | 100% |
Prince Edward Island | 27% |
Newfoundland and Labrador | 22% |
NIHB Program | 100% |
Number of eligible patients with PL | 29 / 29 / 30 |
Market uptake (3 years) | |
Uptake (reference scenario) | |
Patients with GL SC | 100% / 100% / 100% |
Patients with PL SC | 100% / 100% / 100% |
Uptake (new drug scenario) | |
Patients with GL Metreleptin + SC SC | 70% / 90% / 95% 30% / 10% / 5% |
Patients with PL Metreleptin + SC SC | 50% / 75% / 90% 50% / 25% / 10% |
Cost of treatment (per patient)a | |
Annual cost of treatment | |
Patients with GL Metreleptin + SC SC | $583,271 to $583,338 $3,401 to $3,615 |
Patients with PL Metreleptin + SC SC | $583,032 to $583,129 $2,069 to $2,302 |
GL = generalized lipodystrophy; NIHB = Non-Insured Health Benefits; PL = partial lipodystrophy; SC = supportive care.
aAnnual per-patient cost of treatment varies across jurisdictions given that the unit price of therapies included in the SC basket of therapies varies by jurisdiction.
Summary of the Sponsor’s BIA Results
Results of the sponsor’s base-case BIA suggest that the incremental expenditures associated with the reimbursement of metreleptin for the treatment of patients with congenital or acquired GL aged 2 years or older, as well as patients with familial or acquired PL aged 12 years or older with persistent significant metabolic abnormalities (e.g., persistent insulin resistance, poorly controlled diabetes, persistent hypertriglyceridemia) for whom standard treatments have failed to achieve adequate metabolic control would be $23,639,151 in year 1, $29,796,711 in year 2, and $32,974,055 in year 3, for a three-year cumulative total of $86,409,917.
CADTH Appraisal of the Sponsor’s BIA
CADTH identified several key limitations to the sponsor’s analysis that have notable implications on the results of the BIA:
Prevalence of lipodystrophy is uncertain. The sponsor estimated the prevalence of diagnosed GL and PL to be 0.96 and 2.84 cases per million, respectively, based on the upper range estimates reported by Chiquette et al. (2017).40 CADTH notes that Gonzaga-Jauregui et al. (2020) derived an estimated clinical prevalence of lipodystrophy of approximately 1 in 20,000 individuals, which is substantially higher than previously reported.53 Similar to Chiquette et al., Gonzaga-Jauregui et al. queried databases for the corresponding clinical diagnosis codes for lipodystrophy and excluded individuals with HIV. However, instead of using additional inclusion and exclusion criteria, Gonzaga-Jauregui et al. characterized the clinical features of lipodystrophy by evaluating the fraction of individuals presenting with the expected associated comorbidities. CADTH notes that the additional criteria applied in Chiquette et al. have the potential to bias estimates: (1) by pairing the ICD-9-CM code 272.6 with a metabolic disorder, patients with lipodystrophy who did not have active metabolic abnormalities or abnormalities that were presently controlled were excluded; (2) the databases queried varied in their search capabilities, resulting in the inconsistent application of the inclusion and exclusion criteria; (3) estimates resulting from the Quintiles database (approximately 17 million) likely underestimated true prevalence due to only including patients with complete records for adjudication; and (4) the number of cases derived from literature searches relied on the assumption that only 25% of cases would be reported, which has the potential to underestimate true prevalence.40 CADTH notes that Gonzaga-Jauregui et al. evaluated the clinical and genetic prevalence of lipodystrophy in large electronic health record (EHR) databases. They interrogated the EHR information for less than 1.3 million adults from the Geisinger Health System (GHS), as well as the EHR information for less than 85 million adults from the Truven Health MarketScan Research database using consistent search criteria across databases. Using the GHS cohort, the prevalence of lipodystrophy was estimated to be 1 in 13,889. Using the MarketScan database, which was further standardized based on the projected age and sex of the US population to enhance accuracy in the overall population, the authors reported a 1 in 21,142 prevalence estimate.53 In light of the discrepancy between published estimates, CADTH notes that the prevalence of lipodystrophy in Canada is highly uncertain.
CADTH conducted a scenario analysis that explored the prevalence estimates of GL and PL in accordance with the most recent published estimates reported by Gonzaga-Jauregui et al. (2020). CADTH used the upper bound estimate reported using the MarketScan database analysis (approximately 1 in 20,000) to explore the budgetary impact of a higher prevalence estimate of lipodystrophy. Based on this estimate, the proportion of the population in Canada estimated to have GL and PL is 0.0012% and 0.0037%, respectively. Clinical experts consulted by CADTH for this review validated the estimated prevalence of lipodystrophy in Canada by Gonzaga-Jauregui et al.
Diagnosis rate for GL is overestimated. The sponsor assumed that the diagnosis rate of patients with GL is 100% (i.e., the prevalence of GL represents all patients diagnosed with GL). The sponsor justified the assumption that all patients with GL are clinically diagnosed by stating that patients with suspected GL are easily identifiable given that they present with generalized loss of adipose tissue and severe metabolic complications at an early age (including insulin-resistant diabetes and hypertriglyceridemia). CADTH notes that the literature concerning the diagnosis and treatment of lipodystrophy suggests that due to its rarity and heterogeneity, lipodystrophy may frequently be unrecognized or misdiagnosed.54 Clinical experts consulted by CADTH for this review indicated that it is reasonable to believe that a proportion of patients with GL would remain undiagnosed or misdiagnosed in Canada. Clinical experts further noted that although patients with GL tend to present with several complications rendering them more visible to health care professionals (relative to patients with PL), those living in rural areas are less likely to have interactions with medical specialists and may, thus, be more prone to remain undiagnosed or misdiagnosed.
CADTH conducted a reanalysis by revising the diagnosis rate of GL to 82%, which represents the urban population living in Canada.55 CADTH considers this proportion to be more plausible and in line with the assumption that patients living in rural areas are generally less likely to access relevant medical specialists and receive a diagnosis of GL.
Proportion of patients with PL who are inadequately controlled is underestimated. In patients with PL, metreleptin is anticipated to be used only among those with persistent significant metabolic abnormalities (e.g., persistent insulin resistance, poorly controlled diabetes, persistent hypertriglyceridemia) who are inadequately controlled on supportive care. The sponsor assumed that 20% of patients with PL would be considered inadequately controlled based on clinical expert opinion. CADTH notes that this proportion is lower than estimates reported in the literature. The NIH pivotal study estimated that 76% of patients with PL met the criteria for a subgroup which included patients with hemoglobin A1C ≥ 6.5% or triglyceride levels ≥ 5.65 mmol/L at baseline. Clinical experts consulted by CADTH indicated that patients with PL presenting with these characteristics would be considered inadequately controlled in clinical practice in Canada. CADTH additionally notes that real-world evidence by Akinci et al. (2019)5 demonstrates that 46% of patients with PL had hemoglobin A1C ≥ 6.5% based on an international chart review. As such, the literature suggests that between 46% and 76% of patients with PL may be inadequately controlled. Clinical experts suggested that the proportions observed in the NIH pivotal study may overestimate what is likely to be observed in a real-world setting, noting that the study may have included patients with more severe disease profiles than would be observed in clinical practice. Hence, the proportions reported by Akinci et al. based on real-world evidence are more likely to reflect the expected proportion of patients with PL who are inadequately controlled in clinical practice in Canada.
CADTH conducted a reanalysis by revising the proportion of patients with PL who are inadequately controlled on supportive care to 46% in accordance with the estimate reported by Akinci et al. (2019).5
CADTH Reanalyses of the BIA
CADTH revised the sponsor’s submitted analysis by updating the prevalence of GL and PL in accordance with the most recent published estimates; varying the diagnosis rate of GL in line with the assumption that a proportion of patients with GL may be undiagnosed or misdiagnosed; and changing the proportion of patients with PL who are inadequately controlled with supportive care in accordance with real-world evidence. The changes applied to derive the CADTH base case are described in Table 24.
Table 24: CADTH Revisions to the Submitted BIA
Stepped analysis | Sponsor’s value or assumption | CADTH value or assumption |
|---|---|---|
Corrections to sponsor’s base case | ||
None | — | — |
Changes to derive the CADTH base case | ||
1. Diagnosis rate for GL | 100% | 82% |
2. Proportion of patients with PL who are inadequately controlled | 20% | 46% |
CADTH base case | Reanalyses 1 + 2 | |
BIA = budget impact analysis; GL = generalized lipodystrophy; LD = lipodystrophy; PL = partial lipodystrophy.
The results of the CADTH stepwise reanalysis are presented in summary format in Table 25 and a more detailed breakdown is presented in Table 26. The CADTH base case suggests that reimbursing metreleptin for the treatment of patients with congenital or acquired GL in adults and children 2 years of age and above, as well as patients with familial or acquired PL in adults and children 12 years of age and above with persistent significant metabolic abnormalities (e.g., persistent insulin resistance, poorly controlled diabetes, persistent hypertriglyceridemia) for whom standard treatments have failed to achieve adequate metabolic control, would be associated with an incremental cost of $34,557,718 in year 1, $47,241,427 in year 2, and $54,144,756 in year 3, for a 3-year budgetary impact of $135,943,900.
Table 25: Summary of the CADTH Reanalyses of the BIA
Stepped analysis | Three-year total |
|---|---|
Submitted base case | 86,409,917 |
CADTH reanalysis 1 | 94,799,122 |
CADTH reanalysis 2 | 127,554,695 |
CADTH base case | 135,943,900 |
BIA = budget impact analysis.
CADTH conducted additional scenario analyses to address remaining uncertainty, using the CADTH base case. Results are provided in Table 26.
Using prevalence estimates based on the estimates reported by Gonzaga-Jauregui et al. (i.e., GL: 0.0012%; PL: 0.0037%).
Applying a 99% price reduction to assess the budgetary impact if the price of metreleptin reflected the price upon which it would be considered cost-effective at the WTP threshold of $50,000 per QALY gained, as per CADTH’s base case cost-utility analysis.
Using alternative prevalence estimates for GL and PL resulted in a 12-fold increase in the budgetary impact. Results of CADTH’s scenario analyses demonstrate that the estimated budget impact is sensitive to changes in drug cost, with the three-year total budgetary impact declining to $1,019,891 when applying the required price reduction.
In subgroup analyses, the CADTH base case suggests that reimbursing metreleptin for the treatment of patients with congenital or acquired GL in adults and children 2 years of age and above would be associated with a three-year budgetary impact of $55,644,361. Additionally, reimbursing metreleptin for the treatment of patients with familial or acquired PL in adults and children 12 years of age and above with persistent significant metabolic abnormalities (e.g., persistent insulin resistance, poorly controlled diabetes, persistent hypertriglyceridemia) for whom standard treatments have failed to achieve adequate metabolic control would be associated with a three-year budgetary impact of $80,299,539.
Table 26: Detailed Breakdown of the CADTH Reanalyses of the BIA
Stepped analysis | Scenario | Year 0 | Year 1 | Year 2 | Year 3 | Three-year total |
|---|---|---|---|---|---|---|
Submitted base case | Reference | 170,356 | 172,678 | 175,034 | 177,425 | 525,137 |
New drug | 170,356 | 23,811,829 | 29,971,745 | 33,151,480 | 86,935,054 | |
Budget impact | 0 | 23,639,151 | 29,796,711 | 32,974,055 | 86,409,917 | |
CADTH base case | Reference | 264,940 | 268,550 | 272,212 | 275,927 | 816,689 |
New drug | 264,940 | 34,826,268 | 47,513,638 | 54,420,683 | 136,760,589 | |
Budget impact | 0 | 34,557,718 | 47,241,427 | 54,144,756 | 135,943,900 | |
CADTH scenario analysis 1: Alternative prevalence estimate | Reference | 3,226,823 | 3,270,677 | 3,315,143 | 3,360,231 | 9,946,051 |
New drug | 3,226,823 | 403,819,470 | 574,510,090 | 665,232,351 | 1,643,561,911 | |
Budget impact | 0 | 400,548,793 | 571,194,946 | 661,872,121 | 1,633,615,860 | |
CADTH scenario 2: 99% price reduction | Reference | 264,940 | 268,550 | 272,212 | 275,927 | 816,689 |
New drug | 264,940 | 525,071 | 626,536 | 684,972 | 1,836,579 | |
Budget impact | 0 | 256,521 | 354,324 | 409,046 | 1,019,891 | |
CADTH base case (GL subgroup) | Reference | 127,757 | 129,500 | 131,268 | 133,062 | 393,830 |
New drug | 127,757 | 15,765,481 | 19,509,771 | 20,762,939 | 56,038,191 | |
Budget impact | 0 | 15,635,981 | 19,378,503 | 20,629,877 | 55,644,361 | |
CADTH base case (PL subgroup) | Reference | 137,183 | 139,050 | 140,944 | 142,865 | 422,859 |
New drug | 137,183 | 19,060,786 | 28,003,868 | 33,657,744 | 80,722,398 | |
Budget impact | 0 | 18,921,736 | 27,862,924 | 33,514,879 | 80,299,539 |
BIA = budget impact analysis; GL = generalized lipodystrophy; PL = partial lipodystrophy.
Ethics Review
Abbreviations
GL
generalized lipodystrophy
NIH
National Institutes of Health
PL
partial lipodystrophy
Summary
Lipodystrophy encompasses a heterogeneous group of rare, chronic, and progressive disorders characterized by the total (generalized lipodystrophy [GL]) or partial (partial lipodystrophy [PL]) loss of subcutaneous adipose tissue (i.e., fat). Lipodystrophy is associated with deficiency in leptin, a hormone released by fat cells.
Patient group, clinician group, and drug program input, as well as relevant literature gathered during this review, were reviewed to identify ethical considerations relevant to the use of metreleptin to treat the complications of leptin deficiency in patients with lipodystrophy with confirmed:
congenital GL or acquired GL in adults and children aged 2 years and older
familial PL or acquired PL in adults and children aged 12 years and older for whom standard therapies have failed to achieve metabolic control.
Ethical considerations identified in this review included those related to the following:
Treatment, care, and experiences of patients with lipodystrophy: There are significant physical, psychosocial, and financial impacts of this rare condition and its associated complications for people with lipodystrophy and their families. People with lipodystrophy who are male, have PL, have limited agency to self-advocate, are unable to access a family physician and specialist care, or live in rural and remote communities may experience disproportionate barriers to timely diagnosis, standard treatment or care, and ultimately, access to therapies like metreleptin. Socioeconomic and cultural factors may also impact the ability of people with lipodystrophy to manage the condition. There is an unmet need for an effective therapy for treating complications of leptin deficiency in GL and severe cases of PL due to the limited efficacy of standard-of-care therapies.
Clinical and economic evidence used in the evaluation of metreleptin: The clinical trial evidence directionally showed improvements from baseline in hemoglobin A1C and triglyceride levels, an expected safety profile according to clinical experts; and that people with lipodystrophy tolerated metreleptin well during the study period. However, evidence regarding the short- and long-term safety and efficacy of metreleptin is deemed very uncertain. Furthermore, the clinical trial evidence did not assess some outcomes important to people with lipodystrophy, their families, and health care providers, including changes in subjectively experienced hunger, fertility, and health-related quality of life. These evidentiary limitations present challenges for assessing clinical benefits and harms associated with using, or forgoing the use of, metreleptin, as well as for the pharmacoeconomic assessment of cost-effectiveness.
Clinical use and implementation of metreleptin: Despite uncertainties in the available clinical evidence, clinical experts noted that they would prescribe metreleptin given its potential to address an unmet need for treating life-altering and life-limiting complications related to leptin deficiency in GL and treatment-refractory cases of PL. Making decisions about the benefits and harms of metreleptin use may be particularly challenging when treating population groups that were not included or were underrepresented in the studies informing the available clinical evidence (e.g., older adults and pregnant people). Clinical experts also noted that the representation of racial groups within the study population may not reflect the context in Canada. Ensuring equitable access to this medication requires addressing potential diagnostic and monitoring-related barriers to access; in addition, it is necessary to consider how geography and limited agency to self-advocate or navigate the health care system may contribute to or exacerbate these barriers. This includes considering whether tests required to determine treatment eligibility are routinely accessible across Canada. Given the evidentiary uncertainty and the fact that metreleptin does not cure lipodystrophy, clear and ongoing informed consent conversations are required. This involves open and collaborative communication between the prescribing clinician, the patient, and/or their surrogate decision-maker about the disease process, the risks and benefits of treatment, uncertainty in and changes to available evidence, and treatment values and goals. Informed consent in pediatric contexts should consider each pediatric patient’s unique vulnerabilities, developing capacity, and the evolving evidence base.
Health systems: Ethical considerations for health systems related to the implementation of metreleptin highlight potential challenges of funding decisions for high-cost drugs for rare diseases. These include challenges in assessing opportunity costs and the fair allocation of scarce resources in the context of limited long-term evidence for the safety, efficacy, and comparative effectiveness of metreleptin. Clinical experts noted the potential for inequities in access to therapy if reimbursement of metreleptin were inconsistent across jurisdictions in Canada. Clinical experts anticipated that implementing metreleptin would not increase health care utilization beyond the care already received by people with lipodystrophy. The experts also noted that metreleptin use might even decrease health care resource needs over a person’s lifetime, although there is no long-term evidence to support this expectation.
Objectives
To identify and describe ethical considerations associated with the use of metreleptin as an adjunct to diet as a replacement therapy to treat the complications of leptin deficiency in patients with lipodystrophy with confirmed:
congenital GL (Berardinelli-Seip syndrome) or acquired GL (Lawrence syndrome) in adults and children aged 2 years and older
familial PL or acquired PL, in adults and children aged 12 years and older with persistent significant metabolic abnormalities (e.g., persistent insulin resistance, poorly controlled diabetes, persistent hypertriglyceridemia) for whom standard treatments have failed to achieve adequate metabolic control.
Ethical considerations identified in this review related to the context of lipodystrophy, evidentiary bases, use of metreleptin, and health systems.
The objective stated here reflects the wording in the sponsor’s submission. Patient groups have advocated against using the word “control” in the context of treating people with metabolic conditions.1 For this reason, the term “metabolic management” is used instead of “metabolic control” throughout the remainder of this report.
Research Questions
What ethical considerations arise in the context of lipodystrophy, including those related to its diagnosis, treatment, and outcomes?
What ethical considerations arise related to the evidence (e.g., clinical and economic data) used to evaluate metreleptin?
What ethical considerations arise in the use of metreleptin for people with lipodystrophy, their caregivers, and clinicians?
What ethical considerations for health systems are involved in the context of metreleptin?
Methods
Overview
To identify ethical considerations relevant to the use of metreleptin as an adjunct to diet as a replacement therapy to treat the complications of leptin deficiency in people with lipodystrophy, this Ethics Review report was driven by relevant questions identified in the EUnetHTA HTA Core Model Version 3.02 and supplemented by relevant questions from the Equity Checklist for Health Technology Assessment.3 These guiding questions were organized to respond to the research questions posed, and investigated ethical considerations related to:
people living with lipodystrophy and their caregivers (i.e., challenges and disparities related to receiving a diagnosis, accessing treatment or clinical care, and experiencing benefits from diagnosis and treatment)
the evidence used to demonstrate the benefits, harms, and value of metreleptin (i.e., ethical considerations in relevant clinical trials, including their representativeness, choice of outcome measures, appropriateness of analytical methods and models to all population groups; ethical considerations related to the data or assumptions in the economic evaluation)
the use of metreleptin, including considerations related to benefits and harms to people with lipodystrophy, their relatives and caregivers, clinicians or society, and considerations related to access to these therapies
the uptake of metreleptin in health systems, including considerations related to the distribution of health care resources.
Data Collection: Review of Project Inputs and Literature
Data to inform this Ethics Review Report drew from an identification of ethical considerations (e.g., values, norms, or implications for equity, justice, resource allocation, and ethical considerations in the evidentiary basis) in the patient and clinician group, clinical expert, and drug program input collected by CADTH to inform this review, as well as a complementary search of the published literature. Ongoing collaboration and communication with CADTH reviewers working on the clinical and economic reviews for this submission also assisted in the clarification and identification of the ethical considerations raised.
Review of Project Inputs
During this CADTH review, a single reviewer collected and considered input from 6 main sources for content related to ethical considerations relevant to addressing the research questions. In addition to the published literature, this report considered the following sources:
the sponsor submission, including information and external references or sources relevant to each of the research questions driving this report
clinician group input received by CADTH from a group of endocrinologists, medical geneticists, lipidologists, and internal medicine specialists from across Canada with a common interest in the care of people with rare lipodystrophies
patient input received by CADTH from the Lipodystrophy Canada Foundation
drug program input received by CADTH from drug programs participating in the CADTH reimbursement review process
discussions with clinical experts (N = 4) directly engaged by CADTH throughout this reimbursement review, including through 1 teleconference discussion involving 1 expert, 1 panel discussion involving 3 experts, and written comments on drafts of the CADTH Clinical Review Report and a summary of the panel discussion received from 4 experts; during the 2 discussions, the ethics reviewer asked the clinical experts targeted questions related to ethical considerations corresponding to the research questions driving this report; the clinical experts included a clinical geneticist, 2 endocrinologists, and 1 pediatric endocrinologist with experience treating people with lipodystrophy in Canada
engagement with CADTH clinical and economic reviewers to identify domains of ethical interest arising from their respective reviews and relevant questions and sources to further pursue in this report.
Literature Search Methods
An information specialist conducted a literature search on key resources including MEDLINE via Ovid, Philosopher’s Index via Ovid, PsycINFO via Ovid, the Cumulative Index to Nursing and Allied Health Literature (CINAHL) via EBSCO, and Scopus. Google Scholar was used to search for additional materials not captured in the major bibliographic databases. The search strategy comprised both controlled vocabulary, such as the National Library of Medicine’s Medical Subject Headings (MeSH), and keywords. The main search concepts were metreleptin and lipodystrophy.
Search filters were applied to limit retrieval to citations related to ethics concepts or considerations and qualitative studies. Search terms for equity were also applied to the main concepts to capture additional articles. Duplicates were removed by manual deduplication in EndNote. The search was completed on August 21, 2023.
Literature Screening and Selection
Literature retrieved according to the search and selection methods detailed in the Literature Search Methods section was screened in 2 stages. First, titles and abstracts of retrieved citations were screened for relevance by a single reviewer. Articles were identified and retrieved for full-text review by a single reviewer if their titles or abstracts identified ethical considerations or provided normative analysis (i.e., focusing on “what ought to be” through argumentation) or presented empirical research (i.e., focusing on “what is” through observation) of ethical considerations related to: the experiences, incidence, diagnosis, treatment, or outcomes of lipodystrophy in Canada or similar contexts; or the evidence on, use of, or implications of metreleptin for people living with congenital GL, acquired GL, familial PL, or acquired PL. In the second stage, full-text publications categorized as “retrieve” were reviewed by the same reviewer. Texts that included substantive information meeting the aforementioned criteria were included in the review, and reports that did not meet these criteria were excluded. In a parallel process, other sources drawn from relevant bibliographies, relevant key concepts, and consultation with experts or other CADTH reviewers were retrieved and reviewed using these selection criteria.
Data Analysis
Data analysis was driven by the 4 research questions guiding this report and included the collection, coding, and thematic analysis of data drawn from the literature and project inputs. The reviewer conducted 2 iterative cycles of coding and analysis to abstract, identify, and synthesize relevant ethical considerations in the literature and from relevant project inputs.
In the initial coding phase, publications and input sources were reviewed for ethics content (e.g., claims related to potential harms, benefits, equity, justice, resource allocation, and ethics issues in the evidentiary basis). Once identified, claims related to ethics content were coded using methods of qualitative description.4 In the second coding phase, major themes and subcodes were identified through repeated readings of the data,4 and summarized into thematic categories within each guiding domain or research question. Where ethics content did not fit into these categories or domains outlined in the research questions, this was noted, as were discrepancies or conflicts between ethical considerations or values identified between project sources or within thematic categories. Data analysis was iterative, and themes identified in the literature, in project inputs, and during consultations with clinical experts were used to further refine and reinterpret the identified ethics considerations.
Data collected and analyzed from these sources were thematically organized and described according to the 4 research questions and domains driving this report. The results of this analysis and its limitations and conclusions are described in the Results section.
Results
Description of Included Sources
The literature search identified 474 results. Following title and abstract screening, 430 citations were excluded and 44 potentially relevant publications from the electronic searches were retrieved for full-text review. Of the potentially relevant publications, 33 were excluded as they did not discuss ethical considerations related to metreleptin or the lipodystrophy subtypes of interest that was not already detailed in the included narrative review or the clinical evidence detailed in the Clinical Review Report (n = 32) or were presentation abstracts reporting the same findings as an included citation (n = 1). Eleven publications were included in this report. Three additional publications were retrieved through manual searching.
A total of 17 publications were used to inform this ethics review. Of these publications, 11 discussed ethical considerations in the context of lipodystrophy, including those related to diagnosis, care, treatment, and the experiences of people with lipodystrophy and/or their families and caregivers; 1 provided a broader understanding of diversity in clinical trials; 9 discussed ethical considerations regarding the use of metreleptin; 1 discussed ethical considerations regarding informed consent and assent in pediatric contexts; 1 provided ethical considerations regarding the uptake of metreleptin in health systems; and 1 provided a broader understanding of ethical considerations for drugs for rare diseases.
Key Ethical Considerations
Treatment, Care, and Experiences of Lipodystrophy
Lipodystrophy encompasses a heterogeneous group of rare, chronic, and progressive disorders characterized by the total (GL) or partial (PL) loss of subcutaneous adipose tissue (i.e., fat).5 These conditions may be congenital (i.e., congenital GL or familial PL) or acquired (i.e., acquired GL and acquired PL).5 GL has an estimated prevalence of 0.23 cases per million, while PL has an estimated prevalence of 2.84 cases per million.5 As reported in the CADTH Clinical Review Report, other studies have reported higher prevalence estimates of lipodystrophy at 3.23 to 4.7 per 100,000.6,7 The conditions are associated with deficiencies in leptin, a hormone that modulates homeostasis, neuroendocrine and immune function, and glucose, lipid, and bone metabolism.5 As detailed in the Clinical Review Report, leptin deficiency may result in the development of serious metabolic disorders, including severe insulin-resistant diabetes and hypertriglyceridemia.5 Complications of lipodystrophy may also lead to life-altering, life-threatening, and sometimes irreversible impacts on multiple body systems, including the neurologic, cardiovascular, hepatic, renal, musculoskeletal, and reproductive systems.5,8,9 Distressing symptoms of leptin deficiency include insatiable hunger resulting in extreme food anxiety and food-seeking behaviour.5 Condition severity varies even between people with the same pathogenic genetic variants (in the context of genetically determined lipodystrophies), but generally depends on the degree of adipose tissue loss, type of lipodystrophy experienced, age, and sex.5 Of note, people with congenital GL disproportionately experience more severe and earlier-onset complications.5
Difficulties and Disparities in Accessing or Engaging With Care, Treatment, and Self-Management
Patient input, drug plan input, clinical experts, and published literature provided insight into challenges and inequities in accessing or engaging with care and treatment of lipodystrophy, including challenges related to obtaining a diagnosis, accessing and engaging with specialist care, and engaging with activities to promote metabolic management.5,8-15 Patient input, drug plan input, clinical experts, and published literature reported that misdiagnosis or underdiagnosis of lipodystrophy is likely common due to its rarity and heterogeneity, the clinical features shared with other conditions (e.g., type 2 diabetes mellitus), and a lack of precise diagnostic criteria.5 These sources reported that many people with lipodystrophy wait years to receive a diagnosis and that obtaining one depends largely on their ability to self-advocate and access care from endocrine or genetic specialists.5,10-13 Patient input and clinical experts reported that nonspecialist providers may not have the knowledge required to recognize separate signs and symptoms as connected to an underlying disorder and make a diagnosis or refer to a specialist. Clinical experts similarly reported that diagnostic genetic testing may be less accessible in less populous provinces, territories, and regions in Canada and that males and people with PL often have more subtle phenotypic features that may prevent them from receiving a timely diagnosis.5 It follows that people with limited agency to self-advocate, unable to access a family physician and specialist care, living in rural and remote communities, males, and people with PL may experience disproportionate barriers to timely diagnosis. In turn, they may have disproportionately less access to monitoring and treatment decisions tailored to the nature, timing, and severity of symptoms and complications known for a specific lipodystrophy subtype and genetic counselling to inform reproductive decision-making and family testing.5,8,9,14
Patient input, clinician input, clinical experts, and published literature detailed how the monitoring and management of lipodystrophy that focuses on identifying and treating metabolic challenges and associated complications are life-long and typically led by a multidisciplinary team of specialists working out of tertiary care centres.5,9-12 Clinical experts noted that while specialists can monitor and treat virtually people with lipodystrophy who live far from tertiary centres, people in rural and remote communities may still experience disproportionate barriers to accessing timely and quality care. Access to lipodystrophy care and treatment also depends on a person’s ability to self-advocate and “fight for treatment,” navigate the health care system, and educate nonspecialist health providers about their condition.11,12 It follows, then, that people with lipodystrophy and their families living far from tertiary centres or with limited agency to navigate the health care system or self-advocate (e.g., those belonging to population groups with a history of systemic oppression or those with subtypes of lipodystrophy associated with intellectual or developmental delays)9 may disproportionately experience difficulties accessing and benefiting from timely treatment and care.
Even when able to access care and treatment, some people with lipodystrophy may experience difficulties engaging with it. People with lipodystrophy and their clinicians assess metabolic management by measuring biomarkers such as hemoglobin A1C, daily blood glucose levels, and triglycerides to determine whether they are within targeted ranges.5,10,15 As noted in patient and clinician input and by clinical experts, the current treatment paradigm implies the need for people with lipodystrophy to develop and engage with “self-technologies” (i.e., “self-control, self-discipline, and self-monitoring”) for metabolic management.5,10,12,15 However, such “self-technologies” require people with lipodystrophy and their families to expend significant cognitive, time, and financial resources to monitor and respond to blood glucose levels and blood pressure, plan and engage in recommended diet and exercise, manage the use of multiple medications, and attend medical and testing appointments.5,10,12,15 Patient input and the published literature details how engaging with self-technologies can be challenging due to symptoms like fatigue; the inconvenience, discomfort, and expense of injectable medications; feeling dismissed by health care providers; and experiencing mental health issues.11,12 People with lipodystrophy also often have to creatively balance metabolic management with upholding valued sociocultural practices (e.g., sharing meals of specific foods) and pleasures to protect their psychosocial well-being.15 Clinical experts also acknowledged that socioeconomic and cultural factors may impact the ability of people with lipodystrophy to attain adequate metabolic management and highlighted the need for more research examining the nature of these disparities.
At the time of this review, there are no Health Canada–approved drugs to treat GL or PL in Canada, and no drugs target the underlying pathophysiology of lipodystrophy, including leptin deficiency. Patient input, clinician input, and clinical experts emphasized the unmet need for effective therapies for GL and treatment-refractory PL that can stabilize metabolic biomarkers (e.g., hemoglobin A1C and triglycerides) within targeted ranges to reduce the risk of complications such as pancreatitis, end organ damage, and the risk of early death; address insulin resistance; alleviate insatiable hunger; and improve reproductive health (e.g., allowing for the onset of puberty, regular menses, and improved fertility). The clinical experts also noted a lack of therapies to address the debilitating subjective experiences of hunger and food-related anxiety, which they described as a “profound quality of life issue.”
Patient, Family, and Caregiver Experiences of Lipodystrophy
Patient input, the clinical experts, and the published literature reported that living with lipodystrophy is a physical burden for patients and their families.10-12,15-17 People with lipodystrophy and their families were concerned about or lived with life-altering and life-threatening physical complications (e.g., organ damage and reductions in reproductive health, sleep, energy, and mobility), adverse treatment effects (e.g., pain and lumps at injection sites and hypoglycemia), and bothersome and debilitating symptoms, including insatiable hunger, chronic pain, and fatigue.9,10,12,16 Some people with the condition described their hunger as constant and severe, with 1 reporting feeling “starving, famished” and as though “I’m going to die if I don’t eat soon.”12,16 This distressing hunger led them to feel “extreme” anxiety and engage in food-seeking behaviours, causing frustration, embarrassment, altered mood, and limited social functioning.5,16 Clinical experts and published literature reported that extreme hunger was burdensome for families, with parents needing to exercise hypervigilance to control their child’s food intake and modify the diet of the entire family to accommodate the needs of their child with lipodystrophy.12
Living with lipodystrophy also causes great psychosocial burdens for people with lipodystrophy and their families due to stigma associated with the physical presentation of lipodystrophy; the burdens of care, treatment, and management; and the possible heritability of the condition. Patient input, clinical experts, and the published literature detailed how the effect of lipodystrophy on physical appearance and a lack of treatments to address these effects can be distressing for people with the condition, particularly those identifying as women.11,15,17 Patient input and published literature detailed how living with physical features of lipodystrophy typically associated with masculinity (e.g., prominent muscles, hirsutism, and reduced or absent breast tissue) can lead women to feel less feminine and experience low self-esteem; worry about their potential of finding a partner; experience stigmatization, unwelcome comments, harassment, and bullying; and experience social deprivation.5,11,15,17 Parents of children with lipodystrophy were also psychologically distressed when they became aware of the stigma and bullying that children with lipodystrophy can experience as a result of their appearance.12
Patient input and published literature also reported that people with lipodystrophy and their families were constantly conscious of, burdened by, and underprepared for navigating the health care system and partaking in multiple, daily self-management activities.10,12,15 The literature reported that people with lipodystrophy and their families can experience relief and validation on receiving a diagnosis after attempting to determine the cause of their symptoms.11,12 However, being diagnosed with the condition could also lead to worry and fear for the future when understanding its possible complications, especially life-threatening organ damage and reduced fertility.10-12 People with lipodystrophy with heritable subtypes also experienced anxiety and guilt about the potential of passing the condition onto their children and feel distressed if family members refuse to undertake genetic testing.10,12 Patient input and the literature reported that the physical and psychosocial burdens related to living with lipodystrophy can cause some people with lipodystrophy and their caregivers to experience anxiety, depression, and even thoughts of suicide.10,12 People with lipodystrophy and their families reported a need for improved access to psychological supports, including opportunities to connect with others living with the condition.10,11 Some anticipated that the existence of medications targeting the condition may increase public awareness of lipodystrophy, which could further alleviate some of the psychosocial burdens associated with living with the condition.10
Lipodystrophy was also financially burdensome to people with lipodystrophy and their families. Patient input and literature reported that people with lipodystrophy experienced school and work absenteeism or reduced performance due to disruptive symptoms, reduced engagement with higher education because of bullying, and high costs of noninsured prescription medications.10,12 Parents reported worrying whether schools could accommodate the needs of their child with lipodystrophy, and experienced loss of work opportunities, productivity, or employment due to the demands of caregiving.12
Ethics of Evidence
As described in detail in the CADTH Clinical Review Report, the National Institutes of Health (NIH) 991265/20010769 pivotal trial (a phase II/III, open-label, single-arm, single-centre, investigator-sponsored study) sought to evaluate the safety and efficacy of metreleptin treatment among people with GL (n = 66) and PL (n = 41). Of the participants with PL, 31 were specified as belonging to a subgroup with severe PL, the characteristics of which are detailed in the Clinical Review Report. The Clinical Review Report describes additional clinical evidence submitted by the sponsor, including 1 supportive trial (Study FHA101), 1 sponsor-submitted historical control arm analysis, and 1 published historical control arm analysis. This section focuses primarily on the NIH 991265/20010769 trial.
The clinical experts considered the characteristics of the participants in the NIH 991265/20010769 study broadly generalizable to the patient population in Canada. However, participants in the GL and PL cohorts had a mean age of 17.8 and 34.1 years, respectively, and the limited representation of people aged 65 years and older may present challenges for making clinical decisions for this age group and raise questions about the ethical considerations related to balancing benefits and harms and informed consent, as detailed in the Ethical Considerations in the Use of Metreleptin section.5 Also of note, most study participants were female (77.3% of participants in the GL cohort and 97.6% in the PL cohort). Clinical experts observed that this disparity in representation reflects that seen in clinical practice, with females more likely to be diagnosed with lipodystrophy at a female-to-male ratio of 3:1.5 They attributed this disparity largely to differences between the sexes in phenotypic features rather than actual prevalence.5 However, 1 clinical expert remarked that females have a greater likelihood of developing autoimmune conditions and therefore may be more likely to have lipodystrophy thought to be linked to such conditions.
The clinical experts did not report differences in estimated prevalence of lipodystrophy between different racial or ethnic groups, although they indicated that congenital GL may be more common in populations with high occurrences of consanguinity.8 However, they reported that the representation of racial groups within the study population (as detailed in the Clinical Review Report) may not reflect the context in Canada. The literature has identified the underrepresentation of racial, ethnic, and other equity-deserving groups in clinical trials as ethically concerning, as diverse clinical trial participation may build trust in medical research and institutions (which can impact patients’ willingness to pursue treatment), promote fairness for potential participants and their communities, and produce higher-quality biomedical knowledge.18
As detailed in the Clinical Review Report, the NIH 991265/20010769 trial found that study participants tolerated treatment with metreleptin well over the study period. However, 89.4% of participants in the GL cohort and 85.4% in the PL cohort experienced treatment-related adverse events, the most common of which included weight loss, abdominal pain, hypoglycemia, and nausea. While discussing the safety evidence, the clinical experts noted that careful monitoring and prophylactic intervention would be required to reduce the risk of hypoglycemia, which occurred in 15.2% of participants in the GL cohort and 17.1% of participants in the PL cohort of the pivotal trial.
The NIH 991265/20010769 trial used actual change from baseline in hemoglobin A1C and percent change from baseline in fasting serum triglycerides to month 12 as coprimary efficacy end points. Clinical experts noted that these were appropriate, clinically relevant end points. However, the trial did not assess some outcomes identified in patient input, clinical expert consultations, and the literature as important to people with lipodystrophy, their families, and clinicians, including measures of subjectively experienced hunger, fertility, and health-related quality of life.10-12 The exclusion of these additional outcomes as efficacy end points in the clinical evidence may hinder the ability to weigh valued treatment benefits against potential harms in shared decision-making. As detailed in the Clinical Review Report, the NIH 991265/20010769 study directionally showed improvements from baseline in hemoglobin A1C and triglyceride levels, and changes from baseline in fasting glucose and liver volume were generally consistent with those of the coprimary end points. The trial also reported findings concerning resumption of puberty, which is an outcome reported as important to people with lipodystrophy and clinicians. Specifically, the trial reported that some patients experienced resumption of menses after initiating treatment with metreleptin. However, as the Clinical Review Report discusses, the evidence concerning the short- and long-term safety and efficacy of metreleptin use is very uncertain. Limitations of the pivotal trial included, but were not limited to, its single-arm and open-label design, the high amount of missing data at the 12-month time point (i.e., due to the challenges in conducting a clinical study including international participants at the NIH), and the unknown generalizability of results beyond the time horizon of the study.
While evidentiary uncertainty concerning efficacy and safety is not uncommon in the context of drugs for the treatment of rare diseases, it hinders the assessment of the balance of harms and benefits of using or forgoing metreleptin, which has implications for making clinical decisions and for informed consent.19 Clinical experts emphasized, however, that they considered the available efficacy and safety evidence sufficient to prescribe metreleptin for people with GL or people with PL for whom standard treatments have not achieved adequate metabolic management, especially considering the rarity of the disease and the absence of effective alternatives to target metabolic factors in these groups. One person with lipodystrophy in the patient input emphasized a desire to consider the possible, albeit unmeasured, quality-of-life benefits of using metreleptin in the absence of evidentiary certainty in the context of decision-making regarding its use: “Please don’t make the mistake of making the evidence-burden [sic] too high. You just need to talk to the patients who have benefited from this treatment.” Clinical experts noted that database or registry data may help address gaps in the long-term clinical evidence to better inform making clinical decisions regarding the benefits and harms of using metreleptin.
As discussed in greater detail in the Pharmacoeconomic Report in this review, the uncertainty of the effect of metreleptin on cardiovascular, kidney, liver, neuropathy, and retinopathy outcomes and survival benefit hindered the ability to accurately model and assess the cost-effectiveness of metreleptin. These limitations affect cost-effectiveness analyses for drugs for rare diseases more generally and present challenges for assessing the opportunity costs – or forgone benefits – associated with reimbursing and resourcing metreleptin over other health technologies, which complicates resource allocation decisions at a health systems level.19
Ethical Considerations in the Use of Metreleptin
There are several important ethical considerations pertaining to the use of metreleptin, including those related to balancing benefits and harms, informed consent, and access.
Balancing Benefits and Harms
Given the unmet need for effective therapies to treat complications of leptin deficiency in GL and treatment-refractory cases of PL and alleviate burdens associated with them, the clinical experts noted they would prescribe metreleptin based on the available efficacy and safety evidence despite its uncertainty and limitations. As previously detailed, lipodystrophy results in physical, psychosocial, and financial burdens for people with lipodystrophy and their families that are largely related to complications of leptin deficiency.10-12,15-17 Clinician input, clinical experts, and the literature reported that, if metreleptin can improve metabolic factors such as hemoglobin A1C and triglyceride levels, its use would lead to short- and long-term clinical benefits, including improved hepatic, pancreatic, neurologic, renal, and cardiovascular health; a potentially reduced risk of cancers linked to insufficient metabolic management; reduced need for polypharmacy and insulin; and reduced burden of metabolic management. However, supportive evidence for these outcomes is either uncertain or not currently available.5,9 The patient input, clinician input, clinical experts, and literature also reported that metreleptin (given its mechanism of action) would be expected to alleviate symptoms of hunger and improve reproductive health, growth in pediatric patients, and possibly even the body image issues, psychosocial functioning, and health-related quality of life of people with lipodystrophy; and that some people with lipodystrophy have experienced some of these changes following treatment with metreleptin.5,10,17 The 2 people with lipodystrophy who shared their experiences with metreleptin in the patient input reported that these benefits could be “life-changing,” with 1 person writing, “This treatment has changed (and saved) my life.” More clinical research and real-world data (e.g., collected through registries) on the effects of metreleptin on long-term health and the outcomes important to people with lipodystrophy, their families, and clinicians may better inform balancing the benefits and harms of this potentially life-long treatment in the context of shared decision-making.
Clinical experts and the literature described how prescribing clinicians can help people with lipodystrophy benefit from metreleptin with minimal risk of harm by monitoring, assessing, and responding to treatment-related adverse events in an individualized manner.5 Clinical experts noted, for example, how weight loss, a commonly reported treatment-related adverse event in the pivotal trial, could be explained by reduced hunger, an outcome deemed important to people with lipodystrophy and clinicians. As such, weight loss could also be considered a treatment benefit by an individual with lipodystrophy based on their preferences, experiences, and needs. Clinical experts and the literature also provided insight into the need to consider hypoglycemia, reported by people with lipodystrophy as a concerning adverse effect, as a potential outcome of metreleptin treatment increasing insulin sensitivity and secretion.5,10 In the patient input, people with lipodystrophy reported satisfaction with no longer requiring insulin or needing lower (and, therefore, less painful) dosages. Clinical experts and the literature reported that people with lipodystrophy can still experience benefits of increased insulin sensitivity while avoiding hypoglycemia if their prescribing endocrinologists provided them with appropriate education, carefully monitored their blood glucose levels, and prophylactically decreased their dosages of antihyperglycemic agents when starting metreleptin.5 Clinical experts and the literature similarly noted that clinicians should monitor precocious puberty in children and dyslipidemia and renal and hepatic function in all people treated with metreleptin to understand the balance of benefits and harms and guide individualized medication management.5
The published literature reported potential serious adverse effects associated with metreleptin including the risk of severe immunologic responses (e.g., anaphylaxis), life-threatening acute pancreatitis with discontinuation, neutralizing antibody activity to metreleptin or leptin, and T-cell lymphomas.5 Of note, a causal relationship between metreleptin use and T-cell lymphoma has not been established,5 and a clinical expert pointed out that only 1 participant with GL in the NIH 991265/20010769 trial withdrew due to T-cell lymphoma.
The clinical experts and the published literature also provided insight into how balancing benefits and harms may be particularly challenging when treating pregnant people and older adults, as these groups were not included or underrepresented, respectively, in the studies informing the available clinical evidence.5 Clinicians may consider paying particular attention to the development and impacts of adverse events in older adults treated with metreleptin, as this group is more likely to have renal, hepatic, and cardiac comorbidities and receive concomitant medications.5 The literature recommended that prescribing providers reduce the risk of preventable harm in this population by starting metreleptin at the “low end of the dosing interval.”5 Similarly, clinical experts noted that metreleptin treatment may improve reproductive health and fertility and that difficulties with metabolic management during pregnancy may adversely affect the short- and long-term health of a pregnant person and their fetus. However, the efficacy and harms of metreleptin during human pregnancies are unknown.5 Clinical experts described how clinicians treating pregnant people commonly substitute drugs with unknown or harmful effects within pregnancy for those with a known safety profile. However, for pregnant people with lipodystrophy experiencing treatment-refractory complications related to leptin deficiency, there may be no effective alternatives.
Access
The clinical experts and literature provided insight into potential barriers to accessing metreleptin, including those related to receiving specialist care and tests to determine treatment eligibility and taking the medication as prescribed. Given the complexity of lipodystrophy and the novelty of metreleptin, clinical experts recommended that specialist endocrinologists or pediatric endocrinologists prescribe the medication; nevertheless, they indicated that a family physician or internal medicine physician familiar with managing diabetes and lipid disorders could conduct continued monitoring under the guidance of a specialist. This raises concerns about potential barriers to equitable access to metreleptin for people with lipodystrophy who cannot obtain virtual or in-person specialist care, including those without access to regular medical care (e.g., people without a family physician) or those accessing care outside of tertiary care centres. Other groups previously identified as being at a disproportionate risk of experiencing challenges in accessing the treatments available for lipodystrophy (e.g., those experiencing difficulties obtaining a timely diagnosis or with limited agency to navigate the health care system or self-advocate due to systemic oppression and/or disability) may also experience disproportionate difficulties in accessing metreleptin. One clinical expert suggested issuing a statement on the features of lipodystrophy as part of family physicians’ continuing medical education to help mitigate possible inequities in accessing metreleptin within Canada.
Clinical experts discussed how making endogenous leptin levels or genetic testing results the criteria for treatment eligibility could present barriers to equitable access to metreleptin for people with lipodystrophy. Clinical experts noted that leptin testing is not widely available in the country, is administratively burdensome, and can be difficult to interpret. Similarly, clinical experts and drug plan input noted that accessing genetic testing for heritably linked lipodystrophies may be difficult for those residing outside of populous provinces (i.e., Alberta, British Columbia, Ontario, and Quebec) with major tertiary care centres. Clinical experts also described that while genetic testing can facilitate a diagnosis of heritably linked lipodystrophies, some people have distinct clinical features of these conditions without known pathogenic variants, indicating that some variants related to the condition remain unknown.
The clinical experts instead emphasized that they would prioritize easily accessible measures directly related to the mechanism of action of metreleptin (e.g., hemoglobin A1C and triglyceride levels) to determine treatment eligibility and evaluate its effectiveness in promoting more equitable access to and continued use of the medication. When evaluating treatment efficacy, they would also consider holistic outcomes important to people with lipodystrophy and clinicians that they considered may improve with treatment of leptin deficiency. These include patient- and family-reported improvements in hunger, abdominal pain, and health-related quality of life; reduced need for insulin and other background therapies; growth velocity and the acceleration of motor, speech, and social milestones in children; onset of puberty, resolution of amenorrhea (in females), and improved fertility; and reduced hospital admissions. They voiced hesitancy in using diagnostic imaging (e.g., to assess changes in hepatomegaly) as a requirement for initiating or continuing metreleptin, as such testing may not be widely accessible throughout Canada and would increase the use of expensive health care resources.
The clinical experts considered that treatment with metreleptin would be life-long for people with lipodystrophy. However, these experts reported that they would discontinue the drug if it caused intolerable adverse events, was ineffective (the clinician input suggested that effectiveness could be determined after 6 months of using the medication as prescribed and after considering a dose increase), or was no longer effective (e.g., due to neutralizing antibodies). Assessing and, if possible, addressing factors challenging to a person’s ability to engage with metreleptin treatment as prescribed before discontinuing it due to a lack of efficacy may help mitigate preventable barriers to accessing and potentially benefiting from the medication. Patient input and the published literature identified that these factors may include low mood or low self-esteem,11 poor comfort of use, local side effects (e.g., pain, redness, and induration at injection sites), and practical difficulties related to preparing, managing, and acquiring equipment for the daily reconstitution and subcutaneous injection of metreleptin.17
Informed Consent
Informed consent and shared decision-making regarding the use of metreleptin involves open and collaborative communication between the prescribing clinician, the patient, and/or their surrogate decision-maker about the disease process of lipodystrophy, the risks and benefits of treatment with metreleptin, the uncertainty in the available evidence, and treatment values and goals.20 Since clinical experts consider that metreleptin could be a life-long medication for eligible people with lipodystrophy, these conversations should continue as the evidence base grows, and as people with lipodystrophy transition through care settings (e.g., from pediatric to adult care). Pediatric patients with lipodystrophy have distinct vulnerabilities as they depend on their caregivers to access and manage treatment and may have inexperience with and a lack of mature judgment required to make decisions about their health.20 As metreleptin is a chronic medication, clinicians should reassess a pediatric patient’s capacity to consent as they mature and obtain informed consent or assent from them when appropriate.20
While the clinical experts expected metreleptin to have the potential to alleviate complications related to leptin deficiency, it is important that clinicians disclose that the medication does not cure the underlying loss of adipose tissue. The literature has reported that people with lipodystrophy can experience disappointment or emotional distress when confronted with a lack of curative or effective treatments for their condition.11 Conversations to obtain informed consent may deepen an understanding of the chronic nature of lipodystrophy, which may exacerbate negative emotional experiences. Clinicians may consider using communication strategies and facilitating access to psychosocial supports to help mitigate the adverse effects that negative emotions and uncertainty may have on the ability of a person with lipodystrophy or substitute decision-maker to make informed decisions and maintain emotional well-being.20
Health Systems Considerations
The reimbursement of metreleptin for the treatment of leptin deficiency in lipodystrophy raises several questions to do with health systems and resource considerations, including the ongoing need for specialist care and monitoring, opportunity costs, distributive justice, and issues related to approaches for providing equitable reimbursement across Canada.
Clinical experts and the published literature detailed the high health system resource utilization by people with lipodystrophy before initiating leptin replacement therapy, including the need for medical appointments with specialists, emergency department visits, and hospitalizations for complications such as pancreatitis.12 Clinical experts anticipated that, while metreleptin would initially require careful monitoring, this would not exceed routine monitoring for people with lipodystrophy and that metreleptin use could result in fewer specialist appointments, hospitalizations, and medications required over the long term. Of the 9 people with lipodystrophy or caregivers of people with lipodystrophy who had taken leptin replacement therapy for an unreported amount of time included in a mixed-methods study (funded in part by Amryt Pharmaceuticals, with which the sponsor has a distribution agreement for metreleptin), 7 explicitly reported improved symptom management, 4 reported reduced use of insulin to manage their blood glucose, and 3 reported fewer hospital visits following treatment.12
However, as detailed in the Pharmacoeconomic Report, the uncertainty of evidence and limitations in the comparative effectiveness data limit the ability to model and assess the cost-effectiveness of metreleptin accurately. In turn, this limits the ability to consider opportunity costs, or forgone benefits, associated with its reimbursement in the context of limited health care budgets and to help inform an understanding of the fair allocation of limited health care resources. Furthermore, 1 clinical expert highlighted how potential inconsistencies in funding across different provinces, territories, and private insurance plans within Canada could contribute to inequitable access and use of metreleptin for people with lipodystrophy. This raises the question of the potential role of pan-Canadian approaches to reimbursement to support equitable access to metreleptin within and across jurisdictions.
Limitations
Given both the rarity of lipodystrophy and the novelty of metreleptin, there is very little published literature discussing ethical considerations related to using metreleptin as an adjunct to diet as a replacement therapy to treat the complications of leptin deficiency in people with the subtypes of lipodystrophy relevant to this review. Nonetheless, this does not imply that ethical considerations in using metreleptin to treat leptin deficiency in lipodystrophy are absent. This review of ethical considerations was augmented by drawing from additional resources collected during this reimbursement review, including patient group, clinician group, and drug program input, and discussion with clinical experts, as well as engagement with CADTH clinical and pharmacoeconomic review teams, to provide a more comprehensive understanding of the ethical considerations related to the use of metreleptin.
Although this Ethics Review report drew on and considered patient group, clinician group, drug program, and clinical expert input, it is possible that more direct engagement with people experienced with or potentially impacted by lipodystrophy and/or the use of metreleptin (e.g., direct interviews with people with lipodystrophy, caregivers, family members, and decision-makers) could have offered additional relevant ethical considerations or domains of analysis.
Conclusion
Input from patient groups, clinician groups, provincial drug programs, and clinical experts and the published literature were reviewed for ethical considerations relevant to the use of metreleptin as an adjunct to diet as a replacement therapy to treat the complications of leptin deficiency in people aged 2 years and older with lipodystrophy with confirmed congenital GL or acquired GL and aged 12 years and older with familial PL or acquired PL for whom standard therapies did not achieve adequate metabolic management. In the context of lipodystrophy, ethical considerations highlighted the significant physical, psychosocial, and financial impacts of this rare condition and its associated complications on people with lipodystrophy, their families, and their caregivers. People with lipodystrophy who are male, have PL, have limited agency to self-advocate, are unable to access a family physician and specialist care, or live in rural and remote communities may experience disproportionate barriers to timely diagnosis, standard treatment or care, and ultimately, access to therapies like metreleptin. Socioeconomic and cultural factors may also impact the ability of people with lipodystrophy to manage the condition. There is an unmet need for an effective treatment for complications of leptin deficiency in GL and severe cases of PL due to the limited efficacy of standard-of-care therapies. While the clinical trial evidence directionally showed improvements from baseline in hemoglobin A1C and triglyceride levels, an expected safety profile according to clinical experts, and that people with lipodystrophy tolerated metreleptin during the study period, evidence regarding the short- and long-term safety and efficacy of metreleptin is deemed very uncertain. Furthermore, the clinical trial evidence did not assess some other outcomes important to people with lipodystrophy, their families, and health care providers, including changes in subjectively experienced hunger, fertility, and health-related quality of life. These evidentiary limitations present challenges in assessing clinical benefits and harms associated with using, or forgoing the use of, metreleptin as well as the pharmacoeconomic assessment of cost-effectiveness.
Despite uncertainties in the available clinical evidence, the clinical experts noted that they would prescribe metreleptin given its potential to address an unmet need for treating life-altering and life-limiting complications related to leptin deficiency in GL and treatment-refractory cases of PL. Patient input and the literature reported that some people with lipodystrophy and their families described their experience with metreleptin treatment as “life-changing” in terms of how effectively the medication addressed complications related to leptin deficiency. Given the complexity of lipodystrophy and metreleptin, the clinical experts noted that endocrinologists with knowledge of the condition should prescribe the medication and carefully monitor, reduce the risk of, and respond to commonly reported adverse effects, including hypoglycemia. Making decisions about the benefits and harms of metreleptin use may be particularly challenging when treating population groups that were not included or were underrepresented in the studies informing the available clinical evidence (e.g., older adults and pregnant people). Clinical experts also noted that the representation of racial groups within the study population may not reflect the context in Canada. Ensuring equitable access to this injectable medication requires addressing potential diagnostic and monitoring-related barriers to access and use. In addition, it is necessary to consider how geography and limited agency to self-advocate or navigate the health care system may contribute to or exacerbate these barriers. This includes considering whether tests required to determine treatment eligibility are routinely accessible across Canada. Given the evidentiary uncertainty and the fact that metreleptin does not cure lipodystrophy, clear and ongoing informed consent conversations are required. This involves open and collaborative communication between the prescribing clinician, the patient, and/or the surrogate decision-maker about the disease process, the risks and benefits of treatment, the uncertainty in and changes to available evidence, and treatment values and goals. Informed consent in pediatric contexts should consider and respond to each patient’s unique vulnerabilities, developing capacity, and the evolving evidence base.
Finally, ethical considerations for health systems related to the implementation of metreleptin highlight challenges of funding decisions for high-cost drugs for rare diseases. These include challenges in assessing opportunity costs and the fair allocation of scarce resources in the context of limited long-term evidence for safety, efficacy, and comparative effectiveness of metreleptin. Clinical experts noted the potential for inequities in access to therapy if reimbursement of metreleptin were inconsistent across jurisdictions in Canada. Clinical experts anticipated that implementing metreleptin would not increase health care utilization beyond that already received by people with lipodystrophy. The experts also noted that metreleptin use might even decrease health care resource needs over a person’s lifetime, although there is no long-term evidence to support this expectation.
References
1.Language matters: Summary. Ottawa (ON): Diabetes Canada; 2022: https://www.diabetes.ca/DiabetesCanadaWebsite/media/Advocacy-and-Policy/Language-Matters-Plain-Language-Summary-(2).pdf. Accessed 2023 Aug 31.
2.EUnetHTA. HTA core model 3.0. 2016; https://www.eunethta.eu/hta-core-model-3-0/. Accessed 2023 Aug 10.
3.Benkhalti M, Espinoza M, Cookson R, Welch V, Tugwell P, Dagenais P. Development of a checklist to guide equity considerations in health technology assessment. Int J Technol Assess Health Care. 2021;37:e17.
4.Sandelowski M. Whatever happened to qualitative description? Res Nurs Health. 2000;23(4):334-340.
5.Calcaterra V, Magenes VC, Rossi V, Fabiano V, Mameli C, Zuccotti G. Lipodystrophies in non-insulin-dependent children: Treatment options and results from recombinant human leptin therapy. Pharmacol Res. 2023;187:106629.
6.de Azevedo Medeiros LB, Candido Dantas VK, Craveiro Sarmento AS, et al. High prevalence of Berardinelli-Seip Congenital Lipodystrophy in Rio Grande do Norte State, Northeast Brazil. Diabetol Metab Syndr. 2017;9:80.
7.Gonzaga-Jauregui C, Ge W, Staples J, et al. Clinical and molecular prevalence of lipodystrophy in an unascertained large clinical care cohort. Diabetes. 2020;69(2):249-258.
8.Semple RK, Savage DB, Brierley GV, O'Rahilly S. Chapter 22 - Syndromes of severe insulin resistance and/or lipodystrophy. In: Weiss RE, Refetoff S, eds. Genetic diagnosis of endocrine disorders (second edition). San Diego (CA): Academic Press; 2016:307-324.
9.Hsu RH, Lin WD, Chao MC, et al. Congenital generalized lipodystrophy in Taiwan. J Formos Med Assoc. 2019;118(1 Pt 1):142-147.
10.Yagi N, Toda A, Mitani K, Kotobuki Y, Ogawa W. A qualitative research study of experiences and perceptions of people living with insulin resistance syndrome or lipoatrophic diabetes in Japan. Diabetes Ther. 2023;14(8):1345-1356.
11.Adams C, Stears A, Savage D, Deaton C. “We're stuck with what we've got”: The impact of lipodystrophy on body image. J Clin Nurs. 2018;27(9-10):1958-1968.
12.Gomes A, Cook K, Wong A, Tuttle E, Stratton A, Sanders R. Experiences and perspectives of patients with non-HIV-associated lipodystrophies and their caregivers: A qualitative study. Patient. 2021;14(5):673-685.
13.Hakim A, Zhang X, DeLisle A, et al. Clinical utility of genomic analysis in adults with idiopathic liver disease. J Hepatol. 2019;70(6):1214-1221.
14.Jeru I, Vantyghem MC, Bismuth E, et al. Diagnostic challenge in PLIN1-associated familial partial lipodystrophy. J Clin Endocrinol Metab. 2019;104(12):6025-6032.
15.Damasceno EB, Figueiredo JG, Franca JMB, Veras JCD, Borges REA, Melo LP. Experience of people living with the Berardinelli-Seip Syndrome in the Brazilian Northeast. Cien Saude Colet. 2018;23(2):389-398.
16.Martin SA, Sanchez RJ, Olayinka-Amao O, Harris C, Fehnel S. Qualitative interviews in patients with lipodystrophy to assess the patient experience: Evaluation of hunger and other symptoms. J Patient Rep Outcomes. 2022;6(1):84.
17.Vatier C, Kalbasi D, Vantyghem MC, et al. Adherence with metreleptin therapy and health self-perception in patients with lipodystrophic syndromes. Orphanet J Rare Dis. 2019;14(1):177.
18.Schwartz AL, Alsan M, Morris AA, Halpern SD. Why diverse clinical trial participation matters. N Engl J Med. 2023;388(14):1252-1254.
19.Wagner M, Goetghebeur MM, Ganache I, et al. HTA challenges for appraising rare disease interventions viewed through the lens of an institutional multidimensional value framework. Expert Rev Pharmacoecon Outcomes Res. 2023;23(2):143-152.
20.Katz AL, Webb SA, Committee On B. Informed consent in decision-making in pediatric practice. Pediatrics. 2016;138(2).
ISSN: 2563-6596
Canada’s Drug Agency (CDA-AMC) is a pan-Canadian health organization. Created and funded by Canada’s federal, provincial, and territorial governments, we’re responsible for driving better coordination, alignment, and public value within Canada’s drug and health technology landscape. We provide Canada’s health system leaders with independent evidence and advice so they can make informed drug, health technology, and health system decisions, and we collaborate with national and international partners to enhance our collective impact.
Disclaimer: CDA-AMC has taken care to ensure that the information in this document was accurate, complete, and up to date when it was published, but does not make any guarantee to that effect. Your use of this information is subject to this disclaimer and the Terms of Use at cda-amc.ca.
The information in this document is made available for informational and educational purposes only and should not be used as a substitute for professional medical advice, the application of clinical judgment in respect of the care of a particular patient, or other professional judgments in any decision-making process. You assume full responsibility for the use of the information and rely on it at your own risk.
CDA-AMC does not endorse any information, drugs, therapies, treatments, products, processes, or services. The views and opinions of third parties published in this document do not necessarily reflect those of CDA-AMC. The copyright and other intellectual property rights in this document are owned by the Canadian Agency for Drugs and Technologies in Health (operating as CDA-AMC) and its licensors.
Questions or requests for information about this report can be directed to Requests@CDA-AMC.ca.