CADTH Reimbursement Review
Eptinezumab (Vyepti)
Sponsor: Lundbeck Canada Inc.
Therapeutic area: Migraine
This multi-part report includes:
Clinical Review
Pharmacoeconomic Review
Stakeholder Input
Clinical Review
Abbreviations
AE
adverse event
ANCOVA
analysis of covariance
CGRP
calcitonin gene–related peptide
CI
confidence interval
CM
chronic migraine
CMH
Cochran-Mantel Haenszel
CrI
credible interval
eDiary
electronic diary
EM
episodic migraine
EQ-5D-5L
5-Level EQ-5D questionnaire
HIT-6
Headache Impact Test 6-item
HRQoL
health-related quality of life
ICHD
International Classification of Headache Disorders
mAbs
monoclonal antibodies
MBS
most bothersome symptom
MHD
monthly headache day
MMD
monthly migraine day
MMRM
mixed model for repeated measures
MOH
medication overuse headache
MRR
migraine response rate
MSQ
Migraine-Specific Quality of Life Questionnaire
MSQ v2.1
Migraine-Specific Quality of Life Questionnaire version 2.1
MTP
multiple-testing procedure
NMA
network meta-analysis
PGIC
patient global impression of change
RCT
randomized controlled trial
RR
relative risk
SAE
serious adverse event
SD
standard deviation
SF-36
Short Form (36) Health Survey
TEAE
treatment-emergent adverse event
VAS
visual analogue scale
WDAE
withdrawal due to adverse event
WPAI
Workplace Productivity and Activity Impairment
Executive Summary
An overview of the submission details for the drug under review is provided in Table 1.
Item | Description |
|---|---|
Drug product | Eptinezumab (Vyepti), 100 mg/mL solution for IV infusion |
Indication | Indicated for the prevention of migraine in adults who have had at least 4 migraine days per month |
Reimbursement request | For the prevention of migraine in adults who have at least 4 migraine days per month and have experienced an inadequate response, intolerance, or contraindication to at least 2 oral prophylactic migraine medications |
Health Canada approval status | NOC |
Health Canada review pathway | Standard |
NOC date | January 11, 2021 |
Sponsor | Lundbeck Canada Inc. |
NOC = Notice of Compliance.
Introduction
Migraine is a complex neurologic disorder, the precise cause of which is not completely understood. Patients with migraine report migraine attacks characterized by severe headaches (throbbing and diffuse pain) accompanied by other symptoms, such as nausea and/or vomiting, dizziness, sensory hypersensitivity, and tingling or numbness in the extremities and/or face. Migraines can occur with or without aura, and the aura is characterized by a wide range of primarily neurologic symptoms that can affect vision, speech, sensations, muscle strength, and cognitive function. All of these symptoms associated with migraine can impair quality of life. Patients report numerous social and financial impacts of migraine — including disruption to social relationships — which can be affected by exhaustion and frequent migraine attacks. Based on a study published in 2011, at least 2.6 million adult females and almost 1 million adult males in Canada have migraine,1,2 although this may be an underestimate, as not everyone who has migraine seeks medical help, which is required for an official diagnosis. Approximately three-quarters of patients experiencing migraine report impaired function, and one-third require bedrest during a migraine attack.3
Two approaches are available to treat migraine: management of acute attacks and prophylaxis, the latter of which is typically only considered for those with more frequent migraine attacks (≥ 4 migraine days per month). Topiramate is an oral anticonvulsant that is indicated in adults for the prophylaxis of migraine headache.4 Onabotulinum toxin A has a Health Canada indication for chronic migraine prophylaxis4 and was previously reviewed by CADTH. Several calcitonin gene–related peptide (CGRP) receptor inhibitors (erenumab, fremanezumab, galcanezumab, and eptinezumab) have been approved by Health Canada for the prevention of migraine.4 Many other therapies used for migraine prophylaxis are used off-label, as they lack an official indication for this purpose from Health Canada. Broadly speaking, the main categories are antidepressants, anticonvulsants, and cardiovascular drugs. While they are well-established drugs, they all have various tolerability issues for patients, and this is important given that they are to be used on a chronic basis in migraine prophylaxis.
Eptinezumab is a CGRP inhibitor indicated for the prevention of migraine in adults who have at least 4 migraine days per month. Eptinezumab is administered as an IV infusion at a dose of 100 mg every 12 weeks. According to the Health Canada product monograph, the dosage of eptinezumab may be increased to eptinezumab 300 mg every 12 weeks. The need for dose escalation should be assessed within 12 weeks of treatment initiation. The sponsor has requested a recommendation for reimbursement of eptinezumab for the prevention of migraine in adults who have at least 4 migraine days per month and have experienced an inadequate response, intolerance, or contraindication to at least 2 oral prophylactic migraine medications.
The objective of this report was to perform a systematic review of the beneficial and harmful effects of eptinezumab for the prevention of migraine in adults who have at least 4 migraine days per month.
Stakeholder Perspectives
The information in this section is a summary of input provided by the patient groups who responded to CADTH’s call for patient input and from 1 clinical expert consulted by CADTH for the purpose of this review.
Patient Input
Patient input was provided as a joint submission by 2 groups, Migraine Canada and Migraine Québec, for the review of eptinezumab, and data were collected via 2 online surveys and in the form of direct input from patients with experience with eptinezumab who reside in the US.
Patients report migraine as affecting their quality of life and sleep, mental health, social relationships, and day-to-day functioning at work and school. Patients identified improving quality of life and decreasing the frequency and intensity of headaches, as well as symptoms other than pain, as key outcomes of interest.
According to the surveys conducted in 2021 and 2022, 30% and 24% of respondents, respectively, reported having found a preventive treatment that provided greater than 50% improvement in the frequency and intensity of migraine with no significant side effects. According to the 2021 survey, 66% of respondents reported discontinuing their preventive medication due to side effects. Additionally, 57% of respondents in the 2021 survey indicated they had not filled their prescription in the past 6 months due to lack of coverage.
Clinician Input
Input From Clinical Experts Consulted by CADTH
The clinical expert consulted by CADTH for this review identified the following unmet needs: patients who have a delayed response with migraine prevention treatment, patients whose migraines are refractory to current treatment options, lack of therapies that reverse the course of the disease, and bioavailability (lack of an IV formulation).
With respect to place in therapy, the clinical expert indicated that eptinezumab would complement onabotulinum toxin A, and that, ideally, eptinezumab would be administered in the first line along with other CGRP monoclonal antibodies (mAbs); however, the expert also noted that, in real-world use, eptinezumab is likely to be used as a later treatment due to cost and insurance coverage requirements.
The clinical expert noted that the patients most likely to benefit from eptinezumab are those with episodic migraine (EM) or chronic migraine (CM). The patients most in need of an intervention such as eptinezumab are those having difficulty self-administering subcutaneous injections, and those with chronic daily headache and medication overuse headache (MOH).
According to the clinical expert, a clinically meaningful response could include a reduction in monthly headache days (MHDs) and monthly migraine days (MMDs) and a 50% response (50% reduction in MMDs). The clinical expert also indicated that patient-reported outcomes should also be taken into account, as well as a reduction in use of acute medications for migraine.
According to the clinical expert, indications for discontinuing treatment would include lack of response after a 6-month trial, intolerable side effects, allergy and/or anaphylaxis, patient preference, or switching to another CGRP mAb due to inconvenience with IV administration.
Clinician Group Input
No clinician group input was received for the review of eptinezumab.
Drug Program Input
In response to a question about whether prior treatment with another preventive therapy, including another CGRP mAb, should be considered when determining eligibility for reimbursement, the clinical expert consulted by CADTH for this review replied that some patients may respond to an alternative CGRP mAb despite failure on a previous 1, and that failure on another CGRP mAb should not be a criterion for determining eligibility for reimbursement for a subsequent CGRP mAb.
With respect to initiation criteria, the clinical expert agreed that the initiation criteria for fremanezumab and galcanezumab (confirmed diagnosis of EM or CM and inadequate response, intolerance, or contraindication to at least 2 oral prophylactic medications, with physicians providing the numbers of MHDs and MMDs at the time of initial request) would be appropriate for application to eptinezumab. However, they believed that, if approved for reimbursement, the maximum duration of initial authorization should be greater than 6 months instead of 6 months or less, as eptinezumab is administered every 3 months.
With respect to renewal criteria, the clinical expert noted that, if the criterion for at least a 50% reduction in the number of migraine days per month was not met, the prescriber should be given the opportunity to provide a rationale for continued use, given that some patients will respond but not achieve a 50% reduction.
In response to whether there were circumstances in which patients could be initiated at the eptinezumab 300 mg dose rather than starting at eptinezumab 100 mg, the clinical expert stated that there was uncertainty in this context due to the lack of data for switching between doses. The clinical expert added that this would depend on the cost of the drug.
With respect to whether eptinezumab could be combined with onabotulinum toxin A, the clinical expert noted that, although there are no data on a combination of eptinezumab and onabotulinum toxin A, there are data showing that a combination therapy of onabotulinum toxin A and other CGRP mAbs can be effective in some patients and that eptinezumab could be used with onabotulinum toxin A.
Clinical Evidence
Pivotal Studies and Protocol-Selected Studies
Description of Studies
Three pivotal sponsor-funded, multicentre, double-blind, randomized controlled trials (RCTs) were included in this review, each comparing 2 different dosages of eptinezumab, 100 mg and 300 mg every 12 weeks, to placebo. Totals of 892 patients with either EM or CM in the DELIVER trial,5 674 patients with frequent EM in the PROMISE-1 trial,6 and 1,050 patients with CM in the PROMISE-2 trial7 were randomized at a ratio of 1:1:1 to the eptinezumab 100 mg, eptinezumab 300 mg, or placebo group. In each study, patients received 2 doses of eptinezumab or placebo, 1 at baseline and 1 at week 12. The primary outcome in each of the 3 studies was the change from baseline to weeks 1 to 12 in MMDs. Key secondary outcomes, all controlled for multiplicity, included the number of patients achieving at least a 75% or at least a 50% reduction in MMDs, the number of patients with migraine 1 day after dosing, migraine prevalence on days 1 to 28 postdose, change from baseline in Headache Impact Test 6-item (HIT-6) scores, and acute medication usage.
In the DELIVER trial,5 the mean age of patients was approximately 44 years, while in the PROMISE studies the mean age of patients was approximately 40 years. In all studies, the majority of patients were female (approximately 90% in the DELIVER trial, 82% in the PROMISE-1 trial,6 and 88% in the PROMISE-2 trial7) and white (96% in the DELIVER trial, 84% in the PROMISE-1 trial, and 91% in the PROMISE-2 trial). In the DELIVER trial, 60% of patients had EM, ||||| had 14 or fewer MHDs, 62% had 2 prior migraine prophylaxis failures, 31% had 3 prior failures, 7% had 4 prior failures, and 12% had a diagnosis of MOH. In the PROMISE-1 trial, 36% had more than 9 MMDs, and in the PROMISE-2 trial, 45% had 17 or more MMDs.
Efficacy Results
In the DELIVER trial,5 for weeks 1 to 12, MMDs were estimated to be reduced by 2.7 days among patients on eptinezumab compared to those on placebo for the 100 mg dose (95% confidence interval [CI], −3.4 to −2.0; P < 0.0001) and by 3.2 days for the 300 mg dose (95% CI, −3.9 to −2.5; P < 0.0001). For weeks 13 to 24, MMDs were estimated to be reduced by 3.0 days among patients on eptinezumab compared to those on placebo for the 100 mg dose (95% CI, −3.8 to −2.2; P < 0.0001) and by 3.7 days for the 300 mg dose (95% CI, −4.5 to −3.0; P < 0.0001). These comparisons were statistically significant based on the prespecified sequence of testing. Sensitivity analyses of the primary outcome were consistent with that of the primary analysis. In the PROMISE-1 trial,6 for weeks 1 to 12, MMDs were estimated to be reduced by 0.7 days among patients on eptinezumab for the 100 mg dose (95% CI, −1.3 to −0.1; P = 0.0182) and by 1.1 days for the 300 mg dose (95% CI, −1.7 to −0.5; P < 0.0001). These comparisons were statistically significant based on the prespecified sequence of testing. Results of the sensitivity analyses were consistent with that of the primary analysis. For weeks 13 to 24, MMDs were estimated to be reduced by 1.0 days among patients on eptinezumab for the 100 mg dose (95% CI, −1.7 to −0.2) and by 1.2 days on the 300 mg dose (95% CI, −2.0 to −0.4). Because these comparisons fell outside of the multiple-testing procedure (MTP), no P values are reported here. In the PROMISE-2 trial,7 for weeks 1 to 12, MMDs were estimated to be reduced by 2.0 days among patients on eptinezumab for the 100 mg dose (95% CI, −2.9 to −1.2; P = 0.0182) and by 2.6 days for the 300 mg dose (95% CI, −3.5 to −1.7; P < 0.0001). These comparisons were statistically significant based on the prespecified sequence of testing. For weeks 13 to 24, MMDs were estimated to be reduced by 2.0 days among patients on eptinezumab for the 100 mg dose (95% CI, −2.9 to −1.0) and by 2.7 days for the 300 mg dose (95% CI, −3.6 to −1.7). Because these comparisons fell outside of the MTP, no P values are reported here. Results of the sensitivity analysis were consistent with that of the primary analysis. Data for prespecified subgroup analyses of the primary outcome in the DELIVER, PROMISE-1, and PROMISE-2 trials are presented in Table 34 and Table 35 in Appendix 3. No formal analyses were performed for the PROMISE-1 and PROMISE-2 trials. In the DELIVER trial, analyses were conducted with no control for multiplicity. ||||||||||||||||||||||||||||||||||||||||||||||||||||||||||||||||||||||||||||||||||||||||||||||||||||||||||||||||||||||||||||||||||||||||||||||||||||||||||||.
Reduction of 50% in MMDs
In the DELIVER trial,5 the proportions of patients achieving a 50% or greater reduction in MMDs at weeks 1 to 12 were 42% in the eptinezumab 100 mg group, 50% in the eptinezumab 300 mg group, and 13% with placebo, with odds ratios (ORs) of 4.91 (95% CI, 3.29 to 7.47; P < 0.0001) in the eptinezumab 100 mg group and 6.58 (95% CI, 4.41 to 10.01; P < 0.0001) in the eptinezumab 300 mg group. These comparisons were statistically significant based on the prespecified sequence of testing. The proportion of patients achieving a 50% or greater reduction in MMDs at weeks 1 to 12 was also reported in the PROMISE-1 trial,6 with mean differences in proportions of 12.4% (95% CI, 3.2 to 21.5) between eptinezumab 100 mg and placebo, and 18.9% (95% CI, 9.8 to 28.0; P = 0.0001) between eptinezumab 300 mg and placebo. The comparison between eptinezumab 300 mg and placebo was statistically significant based on the prespecified sequence of testing; however, the P value for the comparison between eptinezumab 100 mg and placebo is not reported here due to early failure of the hierarchy. The proportion of patients achieving a 50% or greater reduction in MMDs at weeks 1 to 12 was also reported in the PROMISE 2 trial,7 with differences in proportions of 18.2% (95% CI, 11.1 to 25.4; P < 0.0001) between eptinezumab 100 mg and placebo and 22.1% (95% CI, 14.9 to 29.2; P < 0.0001) between eptinezumab 300 mg and placebo. These comparisons were statistically significant based on the prespecified sequence of testing.
Reduction of 75% in MMDs
In the DELIVER trial,5 the proportions of patients achieving a 75% or greater reduction in MMDs at weeks 1 to 12 were 16% in the eptinezumab 100 mg group, 19% in the eptinezumab 300 mg group, and 2% with placebo, for ORs of 9.19 (95% CI, 4.16 to 24.35; P < 0.0001) in the eptinezumab 100 mg group, and 11.43 (95% CI, 5.22 to 30.15; P < 0.0001) in the eptinezumab 300 mg group. These comparisons were statistically significant based on the prespecified sequence of testing. The proportion of patients achieving a 75% or greater reduction in MMDs for weeks 1 to 4 was also reported in the PROMISE-1 trial,6 with differences in proportions of 10.5% (95% CI, 2.4 to 18.6; P = 0.0112) between eptinezumab 100 mg and placebo, and 11.3% (95% CI, 3.2 to 19.3; P = 0.0066) between eptinezumab 300 mg and placebo, both in favour of eptinezumab. These comparisons were statistically significant based on the prespecified sequence of testing. From weeks 1 to 12 in the PROMISE-1 trial, the differences in proportions were 6.0% (95% CI, −1.4 to 13.3; P = 0.1126) between eptinezumab 100 mg and placebo, and 13.5% (95% CI, 5.8 to 21.2; P = 0.0007) between eptinezumab 300 mg and placebo. The comparison between eptinezumab 300 mg and placebo was statistically significant based on the prespecified sequence of testing; however, the comparison between eptinezumab 100 mg and placebo was not statistically significant, and this is where the hierarchy failed in the PROMISE-1 trial. The proportion of patients achieving a 75% or greater reduction in MMDs at weeks 1 to 4 was also reported in the PROMISE-2 trial,7 with differences in proportions of 15.3% (95% CI, 9.3 to 21.4) between eptinezumab 100 mg and placebo, and 21.3% (95% CI, 15.0 to 27.6; P < 0.0001) between eptinezumab 300 mg and placebo. These comparisons were statistically significant based on the prespecified sequence of testing. From weeks 1 to 12, the difference between eptinezumab 100 mg and placebo was 11.7% (95% CI, 5.8 to 17.5; P < 0.0001) and the difference between eptinezumab 300 mg and placebo was 18.1% (95% CI, 12.0 to 24.3; P < 0.0001). These comparisons were statistically significant based on the prespecified sequence of testing.
Reduction of 100% in MMDs
In the DELIVER trial,5 the proportions of patients achieving a 100% or greater reduction in MMDs (100% responders) for weeks 1 to 12 were also reported: 5.9% versus 7.7% versus 1.1% for eptinezumab 100 mg versus eptinezumab 300 mg versus placebo, respectively. The proportions of 100% responders for weeks 1 to 4 were also reported for eptinezumab 100 mg, eptinezumab 300 mg, and placebo: 9% versus 15% versus 6%, respectively, in the PROMISE-1 trial,6 and 8% versus 13% versus 3%, respectively, in the PROMISE-2 trial.7 The proportions of 100% responders for weeks 9 to 12 were also reported for eptinezumab 100 mg, eptinezumab 300 mg and placebo: 13%, 16%, and 10%, respectively, in the PROMISE-1 trial, and 11%, 17%, and 6%, respectively, in the PROMISE-2 trial.
Patients With Migraine the First Day After Dosing
The proportion of patients who had a migraine the first day after dosing was a secondary outcome of the DELIVER trial.5 From a baseline of |||||| of patients with migraine, 27.2% had a migraine on the first day after dosing in the eptinezumab 100 mg group, while from a baseline of ||||||, 24.4% had a migraine the day after dosing in the eptinezumab 300 mg group, and in placebo, from a baseline of ||||||, 43.7% had a migraine the first day after dosing. The proportion of patients with a migraine the first day after dosing was a key secondary outcome of the PROMISE-16 and PROMISE-2 trials.7 In the PROMISE-1 trial, from a baseline of 31.0% with migraine, 14.8% of patients had a migraine the day after dosing in the eptinezumab 100 mg group, while from a baseline of 30.8% with migraine, 13.9% had a migraine the day after dosing in the eptinezumab 300 mg group, and in placebo, from a baseline of 29.8% with migraine, 22.5% had a migraine the day after dosing. The P values reported by the sponsor were tested after failure of the statistical hierarchy and are not reported here. In the PROMISE-2 trial, from a baseline of 57.5% of patients with migraine, 28.6% had a migraine the day after dosing in the eptinezumab 100 mg group, while from a baseline of 57.4% with migraine, 27.8% had migraine the day after dosing in the eptinezumab 300 mg group, and with placebo, from a baseline of 58.0% with migraine, 42.3% had a migraine the day after dosing. When compared to placebo, the differences between eptinezumab 100 mg and placebo (P < 0.0001) and eptinezumab 300 mg and placebo (P < 0.0001) were statistically significant based on the prespecified sequence of testing.
Headache Frequency
In the DELIVER trial,5 the MHD mean change from baseline to weeks 1 to 12 was −4.6 (standard error [SE] = 0.37) from a baseline of 14.5 (SE = 5.6) for eptinezumab 100 mg; −5.1 (SE = 0.37) from a baseline mean of 14.4 (standard deviation [SD] = 5.5) for eptinezumab 300 mg; and −2.1 (SE = 0.38) from a baseline mean of 14.5 (SD = 5.8) for placebo. Because the change from baseline in MHDs was not part of the MTP, the P values were not reported. In the PROMISE-1 trial,6 the difference in the mean change from baseline to weeks 1 to 12 in MHDs versus placebo for eptinezumab 100 mg was |||||||||||||||||||||||| from a baseline mean of 10.0 (SD = 3.0), and for eptinezumab 300 mg was −|||||||||||||||||||||||||| from a baseline mean of 10.1 (SD = 3.1). Change from baseline in MHDs was not part of the MTP and P values are not reported. In the PROMISE-2 trial,7 the difference in the mean change from baseline to weeks 1 to 12 in MHDs versus placebo for eptinezumab 100 mg was −1.7 (95% CI, −2.6 to −0.9) from a baseline mean of 20.4 (SD = 3.1), and for eptinezumab 300 mg it was −2.3 (95% CI, −3.2 to −1.4) from a baseline mean of 20.4 (SD = 3.2). Change from baseline in MHDs was not part of the MTP and P values were not reported.
Acute Medication Use
In the DELIVER trial,5 for weeks 1 to 12, monthly days using migraine medications were estimated to be reduced by 2.5 days from a mean baseline of 11.2 days (SD = 5.5) among patients on eptinezumab compared to those on placebo for the 100 mg dose (95% CI, −3.2 to −1.9) and by 3.0 days from a mean baseline of 11.0 days (SD = 5.3) for the 300 mg dose (95% CI, −3.6 to −2.4). In the DELIVER trial, for weeks 13 to 24, monthly days using migraine medications were estimated to be reduced by 2.9 days for the 100 mg dose (95% CI, −3.6 to −2.2) among patients on eptinezumab compared to those on placebo and by 3.5 days for the 300 mg dose (95% CI, −4.2 to −2.8). As these comparisons were not part of the MTP, the P values are not reported here. In the PROMISE-1 trial,6 for weeks 1 to 12, monthly days using migraine medications were estimated to be reduced by 0.5 days from a mean baseline of 1.5 days (SD = 2.6) among patients on eptinezumab compared to those on placebo for the 100 mg dose (95% CI, −0.7 to −0.3) and by 0.4 days from a mean baseline of 1.6 (SD = 2.7) for the 300 mg dose (95% CI, −0.6 to −0.2). No P values are reported here because this outcome was not part of the MTP. In the PROMISE-2 trial,7 for weeks 1 to 12, monthly days using migraine medications were estimated to be reduced placebo by 1.2 days from a mean baseline of 6.6 days (SD = 6.9) among patients on eptinezumab compared to those on for the 100 mg dose (95% CI, −1.7 to −0.7) and by 1.4 days from a mean baseline of 6.7 days (SD = 6.5) for the 300 mg dose (95% CI, −1.9 to −0.9; P < 0.0001). No P value is reported here for the 100 mg dose in the PROMISE-2 trial because testing was not part of the MTP.
Other Patient-Reported Outcomes
Patient Global Impression of Change (PGIC) scores were reported in the DELIVER trial,5 and the differences at week 24 versus placebo were |||||||||||||||||||||||||||||| in the eptinezumab 100 mg group and |||||||||||||||||||||||||||||| in the eptinezumab 300 mg group. As PGIC was not part of the MTP, the P values are not reported here. Improvement in PGIC scores was reported as a binary outcome in the PROMISE-2 trial,7 with the percentage of patients who were “very much improved” for eptinezumab 100 mg versus eptinezumab 300 mg versus placebo being ||||||||||||||||||, and the percentage for patients who were “much improved” being ||||||||||||||||||||||||||||||. This outcome was not assessed in the PROMISE-1 trial.
Health-Related Quality of Life
In the DELIVER trial,5 the change from baseline to week 24 in the 5-Level EQ-5D (EQ-5D-5L) visual analogue scale (VAS) scores was estimated to be improved by 4.7 points from a baseline mean of 75.9 (SD = ||||||) among patients on eptinezumab compared to those on placebo for the 100 mg dose (95% CI, 1.8 to 7.7) and by 8.0 points from a baseline mean of 74.5 (SD = ||||||) for the 300 mg dose (95% CI, 5.1 to 10.8). In the PROMISE-1 trial,6 the VAS mean change from baseline to week 24 was |||||||||||| for eptinezumab 100 mg, |||||||||||| for eptinezumab 300 mg, and |||||||||||| for placebo. In the PROMISE-2 trial,7 the VAS mean change from baseline to week 32 was |||||||||||| for eptinezumab 100 mg, |||||||||||| for eptinezumab 300 mg, and |||||||||||| for placebo. Positive changes indicate improvement on this scale.
In the DELIVER trial,5 for the Migraine-Specific Quality of Life Questionnaire (MSQ), the change from baseline to week 24 in the role function restrictive domain was estimated to be improved by 15.1 points from a baseline mean of 35.7 (SD = ||||||) among patients on eptinezumab compared to those on placebo for the 100 mg dose (95% CI, 11.7 to 18.5) and by 15.0 points from a baseline mean of 35.7 (SD = ||||||) for the 300 mg dose (95% CI, 11.6 to 18.4). For the MSQ role function preventive domain, the mean change from baseline to week 24 was estimated to be improved by 12.6 points from a mean baseline of 50.2 (SD = ||||||) among patients on eptinezumab compared to those on placebo for the 100 mg dose (95% CI, 9.4 to 15.8) and by 13.2 points from a mean baseline of 51.0 (SD = ||||||) for the 300 mg dose (95% CI, 10.1 to 16.4). For the MSQ emotional function domain, the change from baseline to week 24 was estimated to be improved by 14.1 points from a mean baseline of 50.3 (SD = ||||||) among patients on eptinezumab compared to those on placebo for the 100 mg dose (95% CI, 10.5 to 17.7) and by 14.1 points from a mean baseline of 48.6 (SD = ||||||) for the 300 mg dose (95% CI, 10.6 to 17.7).
Symptoms
In the DELIVER trial,5 the mean change from baseline to week 12 in the HIT-6 score was estimated to be decreased (improved) by −3.8 points from a mean baseline of 66.6 (SD = 4.7) among patients on eptinezumab compared to those on placebo for the 100 mg dose (95% CI, −5.0 to −2.5; P < 0.0001) and by −5.4 points from a mean baseline of 66.5 (SD = 4.4) for the 300 mg dose (95% CI, −6.7 to −4.2; P < 0.0001). In the PROMISE-2 trial,7 the mean change from baseline to week 12 in the HIT-6 score was estimated to have decreased (improved) by −1.7 points from a mean baseline of 65.0 (SD = 4.9) among patients on eptinezumab compared to those on placebo for the 100 mg dose (95% CI, −2.8 to −0.7; P < 0.0001) and by −2.9 points from a mean baseline of 65.1 (SD = 5.0) for the 300 mg dose (95% CI, −3.9 to −1.8; P < 0.0001).
In the DELIVER trial,5 most bothersome symptom (MBS) scores were also reported under symptoms, and the mean scores at week 24 were estimated to be decreased (improved) placebo by |||||||||||||||||||||||||||||||||||| among patients on eptinezumab compared to those on eptinezumab 100 mg and by |||||||||||||||||||||||||||||| for eptinezumab 300 mg. In the PROMISE-2 trial,7 MBS scores at week 32 were reported as very much improved, eptinezumab 100 mg, 300 mg and placebo of |||||||||||||||||||||||| and much improved as ||||||, |||||||||||||||||||||||| respectively. The HIT-6 and the MBS scores were not assessed in the PROMISE-1 trial.
Health Care Resource Utilization
In the DELIVER trial,5 for health care resource utilization (HCRU), the number of patients with no visit to a family physician in the eptinezumab 100 mg versus eptinezumab 300 mg versus placebo groups was ||||||||||||||||||||||||, the number of patients who had no visit to a specialist was ||||||||||||||||||||||||, and the number of those with no emergency department visits due to migraine was ||||||||||||||||||||||||||||||||||||||||||, respectively. There were few hospitalizations due to migraine (|||||| of patients in each group) and similar numbers were reported for overnight hospital stays due to migraine.
Work Days Lost
In the DELIVER trial,5 the mean change from baseline to week 24 in absenteeism score on the Workplace Productivity and Activity Impairment (WPAI) instrument was estimated to be decreased (improved) by −4.5 points from a mean baseline of 11.4 (SD = ||||||) among patients on eptinezumab compared to those on placebo for the 100 mg dose (95% CI, −7.8 to −1.1) and by −4.7 points from a mean baseline of 12.0 (SD = ||||||) for the 300 mg dose (95% CI, −8.0 to −1.5). Outcomes related to the loss of work days were not assessed in the PROMISE-1 trial and PROMISE-2 trials.
Harms Results
No deaths were reported in any of the studies.
Adverse events (AEs) among patients randomized to the eptinezumab 100 mg, eptinezumab 300 mg, and placebo groups were reported by 43%, 41%, and 40% of those in the DELIVER trial;5 63%, 58%, and 60% in the PROMISE-1 trial;6 and 44%, 52% and 47% in the PROMISE-2 trial,7 respectively.
Serious adverse events (SAEs) among patients who were randomized to eptinezumab 100 mg, eptinezumab 300 mg, and placebo occurred in 2%, 2%, and 1% of those in the DELIVER trial; 2%, 1%, and 3% in the PROMISE-1 trial; and less than 1%, 1%, and less than 1% in the PROMISE-2 trial, respectively. No SAEs occurred in more than 1 patient.
In the DELIVER trial, treatment stoppages due to an AE occurred in 0.3% of patients in the eptinezumab 100 mg and placebo groups and 2% of patients in the eptinezumab 300 mg group. In the PROMISE-1 trial, 3% of patients in the eptinezumab 100 mg and placebo groups and 2% in the eptinezumab 300 mg group stopped treatment due to an AE; and in the PROMISE-2 trial, less than 1%, less than 1%, and 2% of patients stopped treatment due to an AE in the eptinezumab 100 mg, placebo, and eptinezumab 300 mg groups, respectively.
Notable harms identified by the review team included anaphylaxis or hypersensitivity reactions, antibody formation, cardiovascular events, suicidality, alopecia, and fatigue. The most common notable harms in the DELIVER trial were hypersensitivity and/or anaphylaxis, occurring in 2% of patients in each of the eptinezumab 100 mg and placebo groups and 3% of patients in the eptinezumab 300 mg group, and cardiovascular or cerebrovascular disorders, occurring in 3% of patients in the eptinezumab 100 mg and placebo groups and 1% in the eptinezumab 300 mg group. All other notable harms occurred in 1% of patients or less, and in the PROMISE-1 trial and PROMISE-2 trials, notable harms occurred in 1% of patients or less.
Table 2: Summary of Key Results From Pivotal and Protocol-Selected Studies
Characteristic | DELIVER | PROMISE-1 | PROMISE-2 | ||||||
|---|---|---|---|---|---|---|---|---|---|
EPT100 | EPT300 | PLA | EPT100 | EPT300 | PLA | EPT100 | EPT300 | PLA | |
CFB in MMDs | |||||||||
Baseline MMDs, mean (SD) | 13.8 (NR) | 13.7 (NR) | 13.9 (NR) | 8.7 (2.9) | 8.6 (2.9) | 8.4 (2.7) | 14.5 (4.3) | 14.9 (4.5) | 15.1 (4.4) |
CFB in MMDs (weeks 1 to 12), mean (SE) | −4.8 (0.37) | −5.3 (0.37) | −2.1 (0.38) | −3.9 (NR) | −4.3 (NR) | −3.2 (NR) | −7.7 (NR) | −8.2 (NR) | −5.6 (NR) |
Difference vs. placebo (95% CI) | −2.7 (−3.4 to −2.0) | −3.2 (−3.9 to −2.5) | NA | −0.69 (−1.25 to −0.12) | −1.11 (−1.68 to −0.54) | NA | −2.03 (−2.88 to −1.18) | −2.60 (−3.45 to −1.74) | NA |
P value | < 0.0001a | < 0.0001a | NA | 0.0182e | 0.0001e | NA | < 0.0001e | < 0.0001e | NA |
≥ 50% reduction from baseline in MMDs (weeks 1 to 12), n (%) | 126 (42) | 145 (50) | 39 (13) | 110 (50) | 125 (56) | 83 (37) | 205 (58) | 215 (61) | 144 (39) |
OR (95% CI) | 4.91 (3.29 to 7.47) | 6.58 (4.41 to 10.01) | NA | 1.66 (1.14 to 2.43) | 2.16 (1.48 to 3.16) | NA | 2.10 (1.56 to 2.82) | 2.45 (1.81 to 3.30) | NA |
P value | < 0.0001b | < 0.0001b | NA | 0.0085 f to j | 0.0001 f | NA | < 0.0001f | < 0.0001f | NA |
≥ 75% reduction from baseline in MMDs (weeks 1 to 12), n (%) | 47 (16) | 55 (19) | 6 (2) | 49 (22) | 66 (30) | 36 (16) | 95 (27) | 116 (33) | 55 (15) |
OR (95% CI) | 9.19 (4.16 to 24.35) | 11.43 (5.22 to 30.15) | NA | 1.75 (1.13 to 2.71) | 1.82 (1.180 to 2.80) | NA | 2.05 (1.42 to 2.97) | 2.78 (1.94 to 3.99) | NA |
P value | < 0.0001b | < 0.0001b | NA | 0.1126f | 0.0007 f | NA | 0.0001f | < 0.0001f | |
Acute medication use | |||||||||
Baseline monthly days using migraine meds, mean (SD) | 11.2 (5.5) | 11.0 (5.3) | 11.2 (5.9) | 1.5 (2.6) | 1.6 (2.7) | 1.5 (2.5) | 6.6 (6.9) | 6.7 (6.5) | 6.2 (6.7) |
CFB weeks 1 to 12, mean (SE) | −4.1 (0.33) | −4.6 (0.34) | −1.6 (0.34) | −0.9 (||||||) | −0.8 (||||||) | −0.4 (||||||) | −3.3 (4.9) | −3.5 (4.6) | −1.9 (4.2) |
Difference vs. placebo (95% CI) | −2.5 (−3.2 to −1.9) | −3.0 (−3.6 to −2.4) | NA | −0.47 (−0.68 to −0.27) | −0.36 (−0.56 to −0.15) | NA | −1.15 (−1.66 to −0.65) | −1.38 (−1.88 to −0.87) | NA |
P value | < 0.0001c,i | < 0.0001c,i | NA | < 0.000g,i | 0.0006g,i | NA | < 0.0001g,i | < 0.0001g | NA |
EQ-5D-5L VAS | |||||||||
CFB in VAS score, week 24, mean (SE) | 2.0 (1.4) | 5.2 (1.4) | −2.8 (1.4) | |||||| | |||||| | |||||| | |||||| | |||||| | |||||| |
Difference vs. placebo (95% CI) | 4.7 (1.8 to 7.7) | 8.0 (5.1 to 10.8) | NA | NR | NR | NR | NR | NR | NR |
P value | 0.0014d,i | < 0.0001d,i | NA | NR | NR | NR | NR | NR | NR |
Headache symptoms | |||||||||
CFB to week 12 in HIT-6, mean (SD) | −6.9 (0.61) | −8.5 (0.60) | −3.1 (0.61) | NR | NR | NR | −6.2 | −7.3 | −4.5 |
Difference vs. placebo (95% CI) | −3.8 (−5.0 to −2.5) | −5.4 (−6.7 to −4.2) | NA | NA | NA | NA | −1.73 (−2.76 to −0.70) | −2.88 (−3.91 to −1.84) | NA |
P value | P < 0.0001d | P < 0.0001d | NA | NA | NA | NA | 0.0010h,i | < 0.0001h | NA |
Harms, n (%) | |||||||||
AE | 127 (43) | 120 (41) | 119 (40) | 141 (63) | 129 (58) | 132 (60) | 155 (44) | 182 (52) | 171 (47) |
SAE | 5 (2) | 7 (2) | 4 (1) | 4 (2) | 3 (1) | 6 (3) | 3 (< 1) | 4 (1) | 3 (< 1) |
DC treatment due to AE | 1 (0.3) | 6 (2) | 1 (0.3) | 6 (3) | 5 (2) | 6 (3) | 3 (< 1) | 8 (2) | 2 (< 1) |
Notable harms | |||||||||
Hypersensitivity and/or anaphylaxis | 6 (2) | 10 (3) | 6 (2) | 1 (< 1) | 2 (< 1) | 0 | 0 | 6 (2) | 0 |
Cardiovascular and/or cerebrovascular disorders | 9 (3) | 4 (1) | 8 (3) | 1 (< 1) | 1 (< 1) | 1 (< 1) | 2 (< 1) | 3 (< 1) | 1 (< 1) |
Seizures | 0 | 1 (< 1) | 0 | |||||| | |||||| | |||||| | |||||| | |||||| | |||||| |
Suicidal ideation or behaviour | 0 | 0 | 1 (< 1) | |||||| | |||||| | |||||| | |||||| | |||||| | |||||| |
AE = adverse event; ANCOVA = analysis of covariance; CFB = change from baseline; CI = confidence interval; DC = discontinued; EQ-5D-5L = 5-Level EQ-5D questionnaire; HIT-6 = Headache Impact Test 6-item; MHD = monthly headache day; MMD = monthly migraine day; MMRM = mixed model for repeated measures; NA = not applicable; MSQ = Migraine-Specific Quality of Life questionnaire; OR = odds ratio; SAE = serious adverse event; SD = standard deviation; SE = standard error; VAS = visual analogue scale; WPAI = Workplace Productivity and Activity Impairment.
aThe estimated means, mean differences from placebo, and 95% CIs are from an MMRM with month (weeks 1 to 4, weeks 5 to 8, weeks 9 to 12, weeks 13 to 16, weeks 17 to 20, weeks 21 to 24), country, stratification factor (MHDs at baseline: ≤ 14 vs. > 14) and treatment as factors, baseline score as a continuous covariate, treatment-by-month interaction, baseline score-by-month interaction, and stratum-by-month interaction.
bThe comparison is based on a logistic regression model including baseline MMDs as a continuous covariate, and treatment and stratification factor (MHDs at baseline: ≤ 14 vs. > 14) as factors.
cEstimated means, mean differences from placebo, and 95% CIs are from an MMRM with month (weeks 1 to 4, weeks 5 to 8, weeks 9 to 12, weeks 13 to 16, weeks 17 to 20, weeks 21 to 24), country, stratification factor (MHDs at baseline: ≤ 14 vs. > 14) and treatment as factors, baseline score as a continuous covariate, treatment-by-month interaction, baseline score-by-month interaction, and stratum-by-month interaction.
dThe MMRM includes the following fixed effects: visit, country, stratification factor (MHDs at baseline: ≤ 14 vs. > 14) and treatment as factors; baseline HIT-6 total score, EQ-5D-5L VAS score, MSQ subscores, and WPAI subscores as a continuous covariate (HIT-6, EQ-5D-5L, MSQ, and WPAI outcomes only); baseline score-by-visit interaction; treatment-by-visit interaction; and stratum-by-visit interaction.
eANCOVA with treatment as a factor and the stratification variables: baseline migraine days and prophylactic medication use as independent variables.
fCochran-Mantel-Haenszel test stratified by randomized baseline migraine days (≤ 9 days or > 9 days) in the PROMISE-1 trial and baseline migraine days (< 17 days or ≥ 17 days) and prophylactic medication use (yes or no) in the PROMISE-2 trial.
gANCOVA with treatment as a factor and baseline migraine days as a covariate in the PROMISE-1 trial and with treatment as a factor and baseline medication and the stratification variables; baseline migraine days and prophylactic medication use as covariates in the PROMISE-2 trial.
hANCOVA model with treatment as a factor and baseline HIT-6 score and the stratification variables: baseline migraine days and prophylactic medication use as independent variables.
iThese P values have not been adjusted for multiplicity.
jThese P values were tested after failure of the statistical hierarchy and therefore should be considered supportive.
Sources: Clinical Study Report for DELIVER,5 PROMISE-1,6 and PROMISE-2.7
Critical Appraisal
Issues related to internal validity included a large number of withdrawals in the PROMISE-1 trial6 (> 20% across groups) that may have affected results for efficacy and harms, most notably by changing the mix of baseline characteristics in the study population. According to the sponsor, 94% of patients remained in the study at the time of the 12-week assessment for the primary and a number of key secondary outcomes; however, this large number of withdrawals may have affected results after week 12, particularly those for harms, and if the patients who already discontinued the study would have been more or less likely to experience harm from continued use of eptinezumab. None of the health-related quality of life (HRQoL) hypothesis-testing procedures were controlled for multiplicity in any of the included studies, limiting any conclusions that can be drawn from these important outcomes as the lack of control for multiple statistical comparisons increases the risk of type I error.
With respect to external validity, because none of the included studies featured an active comparator, any comparisons to other drugs for migraine prophylaxis are indirect; the limitations of these analyses are outlined in the following section. In 2 of the 3 included studies, patients only received 2 doses of eptinezumab, for a total double-blind observation period of 24 weeks. This is not a sufficient period of time to adequately assess the durability of response to eptinezumab or long-term harms. Although a longer-term study, PREVAIL,8 is available, it did not include a control group, limiting any conclusions that can be drawn regarding long-term efficacy or harms.
Indirect Comparisons
Description of Studies
The sponsor submitted an unpublished network meta-analysis (NMA), informed by a systematic literature review (SLR), to identify all existing RCTs that aimed to compare eptinezumab with key comparators (erenumab, fremanezumab, galcanezumab, and onabotulinum toxin A) for the prevention of EM or CM in adults who have experienced an inadequate response, intolerance, or contraindication to at least 2 oral prophylactic migraine medications.9
A feasibility assessment was conducted by the sponsor to assess the suitability of an NMA for the comparison of the identified studies with the DELIVER trial. A total of 11 studies were included in the Bayesian NMA, evaluating the comparative impact of eptinezumab, key CGRP mAbs, and placebo on efficacy and HRQoL in EM and CM patients. Characteristics of trials reporting on anti-CGRPs and onabotulinum toxin A in EM and CM were assessed for heterogeneity of study characteristics and baseline characteristics. Given the differences in treatment by migraine type, separate analyses were conducted for EM and CM.9
The NMA was conducted in a Bayesian framework using fixed-effect models as base-case analyses due to the limited number of studies per comparison. As no closed loops were formed in the networks, it was not possible to assess consistency between direct and indirect evidence.9
The primary analysis of the NMA consisted of comparisons between eptinezumab and anti-CGRPs for EM and CM separately. The outcomes included in the NMA were 50% migraine response rate (MRR), change from baseline in MMDs at 12 weeks, change from baseline in MMDs at 12 weeks with acute medication use, change from baseline in MSQ v2.1 (Migraine-Specific Quality of Life Questionnaire [MSQ version 2.1]) domains (role function restrictive, emotional function, and role function preventive) at 12 weeks, 75% MRR, and change from baseline in HIT-6 score at 12 weeks.9
Two secondary analyses were conducted. The first consisted of comparisons with onabotulinum toxin A for the end points of change from baseline in MMDs and 50% MRR using data from 24 weeks for onabotulinum toxin A and 12 weeks for eptinezumab due to limited data availability. The other secondary analysis consisted of comparisons with anti-CGRPs, adjusting for the route of administration for change from baseline in MMDs at week 12, given that eptinezumab is the only treatment administered by IV, and may demonstrate greater placebo effects.9
Efficacy Results
||||||||||||||||||||||||||||||||||||||||||||||||||||||||||||||||||||||||||||||||||||||||||||||||||||||||||||||||||||||||||||||||||||||||||||||||||||||||||||||||||||||||||||||||||||||||||||||||||||||||||||||||||||||||||||||||||||||||||||||||||||||||||||||||||||||||||||||||||||||||||||||||||||||||||||||||||||||||||||||||||||||||||||||||||||||||||||||||||||||||||||||||||||||||||||||||||||||||||||||||||||||||||||||||||||||||||||||||||||||||||||||||||||||||||||||||||||||||||||||||||||||||||||||||||||||||||||||||||||||||||||||||||||||
||||||||||||||||||||||||||||||||||||||||||||||||||||||||||||||||||||||||||||||||||||||||||||||||||||||||||||||||||||||||||||||||||||||||||||||||||||||||||||||||||||||||||||||||||||||||||||||||||||||||||||||||||||||||||||||||||||||||||||||||||||||||||||||||||||||||||||||||||||||||||||||||||||||||||||||||||||||||||||||||||||||||||||||||||||||||||||||||||||||||||||||||||||||||||||||||||||||||||||||||||||||||||||||||||||||||||||||||||||||||||||||||||||||||||||||||||||||||||||||||||||||||||||||||||||||||||||||||||||||||||||||||||||||
|||||||||||||||||||||||||||||||||||||||||||||||||||||||||||||||||||||||||||||||||||||||||||||||||||||||||||||||||||||||||||||||||||||||||||||||||||||||||||||||||||||||||||||||||||||||||||||||||||||||||||||||||||||||||||||||||||||||||||||||||||||||||||||||||||||||||||||||||||||||||||||||||||||||||||||||||||||||||||||||||||||||||||||||||||||||||||||||||||||||||||||||
Harms Results
Harms were not evaluated in the sponsor-submitted NMA.
Critical Appraisal
Given the common comparator of placebo in RCTs of migraine treatments, the sponsor conducted a Bayesian NMA, which was considered appropriate. The NMA was informed by an adequately conducted SLR that included planned searches of multiple databases, conference proceedings, and clinical trial registries, as well as regulatory and health technology assessment agency websites, updated to mid-2021.
The CADTH team and the clinical expert consulted by CADTH agreed that the methods used by the sponsor for inclusion of studies in the NMA was reasonable. However, additional sources of heterogeneity, including differences in dosing schedules and time of assessment, were noted but not explored in the sponsor’s feasibility analyses. Concurrent with the feasibility assessment, the sponsor identified the following potential treatment-effect modifiers, based on the results of subgroup analyses from the included trials: MOH (for CM patients only), baseline severity (i.e., EM versus CM and baseline MMDs) and number of prior treatment failures. Given the lack of comparability of EM and CM patients due to differences in migraine frequency and severity, all analyses were conducted separately based on the diagnosis of EM or CM, and only patients with 2 or more prior treatment failures were included.
Outcomes included in the NMA were relevant to the treatment of both EM and CM in Canada. Outcomes focused on reductions from baseline in migraine frequency (50% MMR and 75% MRR and change from baseline in MMDs [with use of acute medication]) and HRQoL (MSQ v2.1 domains and HIT-6). Because no outcomes related to safety were evaluated, the comparative safety of eptinezumab and other CGRP mAbs remains unknown.
The NMA was conducted within a Bayesian framework using fixed effects for all efficacy outcomes. Model statistics (i.e., deviance information criterion) for model selection were generated, although the results were not reported. Based on the lack of available data, only arm-level data were used for comparisons. Given the absolute outcome measures considered in the analyses, this was considered appropriate; however, because arm-based models do not preserve randomization, comparative estimates are at a greater risk of bias in relative treatment effects.
While some NMAs suggested that eptinezumab is favoured when compared with erenumab and galcanezumab for certain outcomes (50% MRR, change from baseline in MMDs) it is worth noting that the results are produced using fixed-effect models, and it is uncertain if the fixed-effect model was the appropriate model to use in these comparisons due to the lack of reporting of a deviance information criterion. As a result, it is impossible to conclude that eptinezumab was superior to erenumab and galcanezumab. Moreover, in all fixed-effects analyses, results were associated with wide 95% credible intervals (CrIs), with most estimates crossing the threshold of no effect, resulting in notable imprecision in the results. Results for random-effects analyses for the 2 main outcomes were generally associated with even wider 95% CrIs.
Other Relevant Evidence
One open-label, phase III study, PREVAIL,8 was summarized to provide additional information on the long-term safety and efficacy of repeated, IV infusions of eptinezumab administered quarterly in patients with CM for the preventive treatment CM.
Description of Studies
The PREVAIL trial8 was conducted to evaluate the long-term safety of up to 8 IV infusions of eptinezumab 300 mg administered at 12-week intervals in 128 adult patients with CM for up to 84 weeks of treatment. The secondary objective was to evaluate the efficacy of eptinezumab by assessing its impact on patient-reported outcomes. The inclusion and exclusion criteria were generally consistent with the pivotal PROMISE-2 clinical trial.7 Patients were eligible to enrol in PREVAIL if they were diagnosed with migraine at an age of 50 years or greater and had a history of CM for 1 or more years before screening. The duration of the study was 106 weeks, which included a 2-week screening period, 48-week primary treatment period, 36-week secondary treatment period, and 20-week follow-up period. In each treatment period, patients received 4 IV infusions of eptinezumab every 12 weeks; only patients who received all 4 infusions in the primary treatment period were permitted to enter the secondary treatment period. Patients were evaluated at day 0, weeks 2, 4, 8, and 12, and every 12 weeks thereafter. Patients who failed to receive all 4 infusions of eptinezumab in the primary treatment period or did not provide consent for participation in the secondary treatment period were followed up at weeks 48 and 56.
The mean age of patients in the PREVAIL trial was 41.5 years (SD = 11.33). The majority of patients were female (85.2%) and white (95.3%). The mean duration of migraine diagnosis at baseline was 21.2 years (SD = 11.65). The patient-reported mean numbers of headache days, migraine days, and migraine attacks per 28-day period in the 3 months before screening were 20.3 (SD = 3.68), 14.1 (SD = 4.25), and 10.5 (SD = 4.29), respectively.8
A total of 128 patients were enrolled in PREVAIL and all patients received at least 1 dose of eptinezumab (safety population). A total of 22 patients (17.2%) prematurely discontinued the study, with the most common reason being withdrawal by patient in 18 patients (14.1%). Overall, 100 patients (78.1%) completed the study (week 104). A total of 86 patients (67.2%) received a total of 8 doses of the study drug. The concomitant use of at least 1 acute and 1 prophylactic treatment for headaches was reported in 127 patients (99.2%) and 46 patients (35.9%), respectively.8
Efficacy Results
Health-Related Quality of Life
For the EQ-5D-5L VAS, the mean scores at baseline and week 48 were |||||||||||||||||||||| and ||||||||||||||||||||||, respectively, demonstrating improvement (n = 114).8
Headache Symptoms
For the HIT-6, the mean total scores at baseline and weeks 101 to 104 were 65.2 (SD = 4.76) and 56.1 (SD = 9.07), respectively, demonstrating improvement (n = 96).8
At baseline, the MBSs reported were sensitivity to light in 31 patients (24.2%), nausea in 14 patients (10.9%), sensitivity to sound in 10 patients (7.8%), pain with activity in 10 patients (7.8%), mental cloudiness in 4 patients (3.1%), vomiting in 2 patients (1.6%), mood changes in 2 patients (1.6%), and other symptoms in 55 patients (43.0%). Most patients reported being “very much improved” (35.7%) or “much improved” (39.3%) at week 48 relative to baseline (n = 112). “No change” was reported by 11 patients (9.8%). No patients reported being “minimally worse,” “much worse,” and “very much worse” at week 48 relative to baseline.8
Other Patient-Reported Outcomes
For the PGIC, most patients reported being “very much improved” (49.0%) or “much improved” (34.4%) at week 104 relative to baseline (n = 96). “No change” was reported by 5 patients (5.2%). No patients reported being “minimally worse,” “much worse,” and “very much worse” at week 104 relative to baseline.8
Harms Results
A total of 91 patients (71.1%) reported at least 1 treatment-emergent adverse event (TEAE), with the most common event being nasopharyngitis in 18 patients (14.1%). A total of 5 patients (3.9%) reported at least 1 serious TEAE; no single event was reported in more than 1 patient (< 1%). A total of 8 patients (6.3%) reported any TEAE that led to study drug withdrawal, 3 (2.3%) of whom reported study drug withdrawal due to hypersensitivity. No other single event was reported in more than 1 patient (1%). No deaths were reported for the duration of the study. For notable TEAEs, hypersensitivity was reported in 5 patients (3.9%), hypertension was reported in 2 patients (1.6%), and anaphylactic reaction, hypotension, and deep vein thrombosis were reported in 1 patient (< 1%).8
Critical Appraisal
In the absence of an active comparator or placebo group, our ability to interpret the safety and efficacy results from the open-label study, PREVAIL,8 is limited. The interpretation of the safety and efficacy results may be further limited by the missing data in patient-reported outcomes at week 104, and the fact that only 86 patients (67.2%) received all 8 doses of eptinezumab. An open-label study design can bias the reporting of end points, particularly in any subjective measures included in the efficacy and safety parameters due to the unblinding of the study drug during the treatment period, and the direction and magnitude of the bias is therefore uncertain. Of note, 28 patients (21.9%) had participated in a prior clinical trial of eptinezumab. These patients were eligible to enrol if the investigator determined they had not experienced any clinically significant AEs related to the study drug during the previous study. Consequently, these patients may be more tolerant to eptinezumab, and their inclusion may result in lower AE rates than would be expected in a nonselected population.
The baseline characteristics in patients with CM in PREVAIL were generally consistent with the baseline characteristics in the PROMISE-2 trial,7 which also included patients with CM. The clinical expert consulted by CADTH for this review estimated that at least 80% of patients presenting with migraines in clinical practice are females; 109 patients (85.2%) were female in PREVAIL. Because only eptinezumab 300 mg was evaluated in PREVAIL, the generalizability of the safety and efficacy results in the open-label study to eptinezumab 100 mg is limited.
Conclusions
Evidence from 3 double-blind RCTs suggests that eptinezumab 100 mg and 300 mg given intravenously every 12 weeks reduces monthly migraine frequency, relative to placebo, when used as prophylaxis in patients with EM or CM. This reduction in migraine frequency may be accompanied by a reduction in use of acute migraine medication and there is evidence of a reduction in symptoms on the HIT-6. No conclusions can be drawn regarding the impact of eptinezumab on HRQoL as there was no adjustment for multiplicity in the statistical analyses for this outcome. Eptinezumab appears to result in a relatively low risk of treatment discontinuations due to AEs, and no safety issues were identified beyond what is described in the product monograph. However, double-blind treatment consisted of only 2 infusions in 2 studies and a maximum of 4 infusions in the other study, and findings from a longer-term study are limited by the lack of a control group. No evidence from a direct comparison between eptinezumab and other prophylactic treatments for migraine was identified for this review. Results from an indirect comparison between eptinezumab and other CGRP inhibitors and onabotulinum toxin A were inconclusive due to methodological limitations with the analysis, and the indirect comparison did not assess safety.
Introduction
Disease Background
Migraine is a complex neurologic disorder whose precise cause is not completely understood. Patients with migraine report migraine attacks characterized by severe headache (throbbing and diffuse pain), accompanied by other symptoms such as nausea and/or vomiting, dizziness, sensory hypersensitivity, and tingling or numbness in the extremities and/or face. Migraines can occur with or without aura, and the aura is characterized by a wide range of primarily neurologic symptoms that can affect vision, speech, sensations, and muscle strength. Cognitive function can also be affected. All of these symptoms associated with migraine can impair quality of life, and patients also report that their quality of life is affected even when they do not have a migraine, as they fear the next attack. Patients report numerous social and financial impacts, including disrupted social relationships, due to exhaustion and frequent migraine attacks. Based on a study published in 2011, in Canada, at least 2.6 million adult females and almost 1 million adult males have migraine,1,2 although this may be an underestimate, as not everyone who has migraine seeks medical help, which is required for an official diagnosis. Approximately 3-quarters of patients experiencing migraine report impaired function, and one-third require bedrest during a migraine attack.3
Standards of Therapy
Two approaches are available to treat migraine: management of acute attacks and prophylaxis, which is typically only considered for those with more frequent migraines (≥ 4 migraine days per month). Topiramate is an oral anticonvulsant that is indicated in adults for the prophylaxis of migraine headache.4 Onabotulinum toxin A, which has a Health Canada indication for CM prophylaxis,4 was previously reviewed by CADTH. It is administered by multiple and technically challenging subcutaneous injections in various muscles of the head and neck. Many other therapies used for migraine prophylaxis are used off-label, as they lack an official indication for this purpose from Health Canada. Broadly speaking, the main categories are antidepressants (tricyclics and serotonin-norepinephrine reuptake inhibitors), anticonvulsants (various), and cardiovascular drugs (beta-blockers, calcium channel blockers, angiotensin-converting enzyme inhibitors, and angiotensin receptor blockers). There is a lack of understanding of how the mechanisms of these drugs relate to migraine prophylaxis. While they are generally safe and well-established drugs, they all have various tolerability issues for patients, and this is important given that they are to be used on a chronic basis in migraine prophylaxis.
In clinical practice, patients on migraine prophylaxis frequently discontinue or switch treatments due to lack of efficacy or tolerability.10,11
Drug
Eptinezumab is administered as an IV infusion at a dosage of 100 mg every 12 weeks. According to the Health Canada product monograph,4 the dosage of eptinezumab may be increased to 300 mg every 12 weeks. The need for dose escalation should be assessed within 12 weeks of treatment initiation. Eptinezumab is indicated for the prevention of migraine in adults who experience at least 4 migraine days per month. Eptinezumab is a CGRP mAb, and CGRP is thought to play an important role in the pathophysiology of migraine. The sponsor’s requested reimbursement criteria is for the prevention of migraine in adults who have at least 4 migraine days per month and have experienced an inadequate response, intolerance, or contraindication to at least 2 oral prophylactic migraine medications. Eptinezumab was submitted for review by CADTH following receipt of a Notice of Compliance on January 11, 2021, and underwent the standard review process at Health Canada.
Table 3: Key Characteristics of Drugs Used for Migraine Prophylaxis
Characteristic | CGRP mAbs | Botulinum toxin | Beta-blockers | Anticonvulsants |
|---|---|---|---|---|
Drugs most commonly used in migraine | Erenumab Fremanezumab Galcanezumab Eptinezumab | Onabotulinum toxin A | Propranolol Timolol Nadolol Metoprolol | Topiramate Gabapentin Valproic acid |
Mechanism of action | Erenumab: binds to CGRP receptor Others: binds to CGRP ligand | Inhibits presynaptic release of CGRP, and other neurotransmitters | Beta-1 receptor antagonists | Multiple mechanisms of action |
Indicationa | For prevention of migraine in patients who have at least 4 migraine days monthly | For prophylaxis of headaches in adults with CM (≥ 15 days/month with headache lasting ≥ 4 hours a day) | Migraine prophylaxis: propranolol, timolol Others: none for migraine | Topiramate: migraine prophylaxis |
Route of administration | Eptinezumab: IV Others: subcutaneous | Intramuscular Injection | Oral | Oral |
Recommended dosage | Erenumab: 70 mg or 140 mg once monthly Fremanezumab: 675 mg quarterly, 675 mg followed by 225 mg monthly (patients with CM), or 225 mg monthly (patients with EM) Galcanezumab: 240 mg loading dose followed by 120 mg monthly | 5 units to 31 different sites, across 7 different head/neck muscle areas | Varies by drug | Varies by drug |
Characteristic | TCAs or SNRIs | CCBs | ACEi/ARBs | — |
Drugs most commonly used in migraine | Amitriptyline Nortriptyline Venlafaxine | Flunarizine Verapamil | Lisinopril Candesartan | — |
Mechanism of action | Inhibits reuptake of serotonin, norepinephrine | Blocks L-type calcium channels | Inhibits effects of angiotensin 2 | — |
Health Canada Indication | None for migraine | Flunarizine: migraine prophylaxis Others: none for migraine | None for migraine | — |
Route of administration | Oral | Oral | Oral | — |
ACEi = angiotensin-converting enzyme inhibitor; ARB = angiotensin receptor blocker; CCB = calcium channel blocker; CGRP = calcitonin gene–related peptide; CM = chronic migraine; EM = episodic migraine; mAbs = monoclonal antibodies; SNRI = serotonin-norepinephrine reuptake inhibitor; TCA = tricyclic antidepressant.
Source: Product monographs from e-CPS.4
Stakeholder Perspectives
Patient Group Input
This section was prepared by CADTH staff based on the input provided by patient groups. The full original patient input received by CADTH is included in the stakeholder section at the end of this report.
Patient input was provided as a joint submission by 2 groups, Migraine Canada and Migraine Québec, for the review of eptinezumab. Migraine Canada is a national federally registered charity and Migraine Québec is a provincial nonprofit patient organization. Both organizations have a mission to support and inform individuals living with migraine and raise awareness about the impact of the disease, and both advocate for optimal care for patients with migraine and support research to find cures to improve quality of life.
The information used to inform the submission was based on 2 online surveys conducted by Migraine Canada with promotional support by Migraine Québec in late fall of 2021 and June 2022, as well as direct input from 13 patients living in the US who have experience with eptinezumab. A total of 1,165 adult patients in Canada with migraine and their caregivers responded to the 2021 survey; the majority (68%) of patients ranged in age from 30 to 59 years. Among the respondents to this survey, 19% lived with 1 to 6 migraine days per month, 28% lived with 8 to 14 migraine days per month, and 52% lived with 15 or more migraine days per month (CM). A total of 132 patients (114 in Canada and 18 in the US) responded to the 2022 survey; the majority (71%) of patients ranged in age from 30 to 59 years. Among the respondents to this survey, 11% lived with 1 to 6 migraine days per month, 20% lived with 8 to 14 migraine days per month, and 70% lived with 15 or more migraine days per month.
Respondents to the 2021 survey described how living with migraine has affected their quality of life and sleep, mental health, social relationships, and day-to-day functioning at work and school. The majority (73%) of respondents indicated they live in fear of the next migraine attack and have difficulty planning ahead. Further, 67% of respondents reported regularly needing to change or cancel plans or avoid interacting with others. More than 20% of respondents indicated they are on short- or long-term disability or have retired early due to migraine. Thirty-eight percent of respondents indicated their migraines have always or regularly disrupted their sleep. With respect to caregiver burden, 31% and 35% of respondents described themselves as a burden to others for 16 to 30 and 6 to 15 days per month, respectively. According to the 2022 survey, migraines have led to the development of moderate-to-severe depression and/or anxiety requiring counselling and/or medications in 48% of respondents.
Most (78%) of the 2021 survey respondents indicated they have taken a prescription medication for the prevention of migraine; the most commonly prescribed were topiramate, amitriptyline, and botulinum toxin. Similarly, 74% of respondents to the 2022 survey reported taking more than 5 preventive treatments. Approximately 30% and 24% of respondents to the 2021 and 2022 survey, respectively, reported having found a preventive treatment that provides greater than 50% improvement in frequency and intensity of migraine attacks with no significant side effects. According to the 2021 survey, 66% of respondents reported discontinuing their preventive medication for migraine due to side effects. Further, 57% of respondents to the 2021 survey indicated they have not filled their prescription in the past 6 months due to the cost and lack of coverage, and 33% of respondents to the 2022 survey indicated their preference for an infusion every 3 months as the mode of administration.
A total of 13 patients in the US provided direct input on their experience with eptinezumab. Of these, 6 patients reported a 50% benefit and 3 patients reported a 75% benefit with eptinezumab versus previous therapies used; 4 patients either reported no improvement or not having taken eptinezumab for a sufficient amount of time to comment. According to the patients, the advantages of eptinezumab included reduced frequency and intensity of migraines leading to improved day-to-day functioning. The disadvantages included cost, having to travel to an infusion centre, and discontinued treatment due to severe joint aches. According to the patients, side effects were tolerable and included insomnia, hypersensitivity reaction, and sore throat for 24 to 48 hours postinfusion; 67% reported no side effects. Finally, 83% indicated eptinezumab was easier and more convenient to use when compared to other therapeutic options.
The majority (73%) of respondents to the 2021 survey indicated there is a need for a new preventive medication. According to respondents to both surveys, the most valuable outcomes for preventive treatment are improvement in quality of life, and decrease in headache intensity, headache frequency, and symptoms other than pain (e.g., sensitivity to light, sound, nausea, and brain fog). When selecting therapy, respondents to the 2022 survey indicated the trade-offs they would consider included efficacy versus side effects, cost, and taking daily medications. Overall, patients in Canada living with migraine expect to have access to new treatment options that will address the gaps in the currently available options, many of which are not effective and are associated with intolerable side effects.
Clinician Input
Input From Clinical Experts Consulted by CADTH
All CADTH review teams include at least 1 clinical specialist with expertise in the diagnosis and management of the condition for which the drug is indicated. Clinical experts are a critical part of the review team and are involved in all phases of the review process (e.g., providing guidance on the development of the review protocol, assisting in the critical appraisal of clinical evidence, interpreting the clinical relevance of the results, and providing guidance on the potential place in therapy). The following input was provided by 1 clinical specialist with expertise in the diagnosis and management of migraine.
Unmet Needs
The clinical expert consulted by CADTH for this review identified the following unmet needs:
delayed response for migraine prevention treatment
not all patients respond to available treatments
patients become refractory to current treatment options
no treatments are available that reverse the course of the disease
lack of availability of different routes of administration, such as IV.
The clinical expert noted that current limitations include cost, coverage, access, delayed response, and intolerability to oral medications.
Place in Therapy
The clinical expert consulted by CADTH for this review noted that CGRP inhibitors target an important aspect of the pathophysiology of migraine, as opposed to the other drugs used for migraine, antidepressants, antihypertensives, and antiseizure medications, which act more indirectly. The current guidelines are older (published between 2012 and 2013) and therefore did not include the CGRP mAbs, although onabotulinum toxin A is included for CM. The current treatment paradigm is to try 2 to 3 oral medications (due to evidence and cost) before proceeding to other, more expensive options, such as CGRP mAbs.
The clinical expert noted that eptinezumab can be used in patients who have contraindications to other oral treatments and who have problems with self-administration of subcutaneous injections, such as the other CGRP mAbs. They also noted that use of eptinezumab does not represent a shift in the treatment paradigm but provides another option.
Patient Population
The clinical expert consulted by CADTH for this review stated that the patients most likely to respond to eptinezumab are those with EM or CM. The clinical expert identified patients having trouble self-administering CGRP mAbs and chronic daily headache and those with MOH as most in need of an effective prophylactic measure for EM. The clinical expert did not anticipate that this would depend on disease characteristics. The expert noted that the patients best suited for treatment could be identified through clinical judgment and/or exams. The expert added that misdiagnosis is unlikely, and that migraine tends to be an underdiagnosed condition.
Assessing Response to Treatment
The clinical expert identified key outcomes of interest when assessing treatment response as MHDs, MMDs, a 50% reduction in MMDs, and improvement in Migraine Disability Assessment Scale (MIDAS) and HIT-6 scores. The clinical expert noted that a clinically meaningful response could be indicated by a reduction in MHDs and MMDs and a 50% reduction in MMDs; however, patient-reported outcomes should also be considered, as well as a reduction in use of acute medications for migraine.
Discontinuing Treatment
The clinical expert consulted by CADTH for this review noted possible reasons for discontinuing treatment include a lack of treatment response (subjectively reported by the patient) after a 6- to 12-month trial, intolerable side effects, allergy and anaphylaxis, patient preference, or a switch to other CGRP mAbs due to the inconvenience associated with IV infusions.
Prescribing Conditions
The clinical expert stated that doses could be delivered at an infusion centre or specialty pharmacy, and that a specialist would not be required to diagnose patients. However, the clinical expert indicated that a specialist should manage the patient initially and provide education on the product. The clinical expert noted that subsequent monitoring of the patient could be carried out by nonspecialists if the patient has not experienced any issues with treatment.
Additional Considerations
The clinical expert consulted by CADTH for this review added that infusion treatment could offer advantages over previous options due to the potential for more rapid onset and 100% bioavailability.
Clinician Group Input
No clinician group input was received for the review of eptinezumab.
Drug Program Input
The drug programs provide input on each drug being reviewed through CADTH’s reimbursement review processes by identifying issues that may affect their ability to implement a recommendation. The implementation questions and corresponding responses from the clinical experts consulted by CADTH are summarized in Table 4.
Table 4: Summary of Drug Plan Input and Clinical Expert Responses
Drug program implementation questions | Clinical expert response |
|---|---|
Relevant comparators | |
In the pivotal studies for eptinezumab, the comparator was placebo, while other therapies for the prevention of migraine may have been appropriate comparators. | No response required. For CDEC consideration. |
Considerations for initiation of therapy | |
The sponsor reimbursement request is for patients who have experienced an inadequate response, intolerance, or contraindication to at least 2 oral prophylactic migraine medications (according to the CDEC initiation criteria for fremanezumab and galcanezumab). The sponsor also indicated that there is growing evidence that a patient not appropriately responding to one anti-CGRP antibody may respond better to another. Should prior treatment with another preventive therapy, including other anti-CGRP antibodies, be considered when determining eligibility for reimbursement of eptinezumab? | The clinical expert noted that some patients may respond to alternative CGRP despite failure to a previous CGRP and it is not possible to identify who those patients are in advance. The clinical expert believed that ideally, eptinezumab would be used in the first line along with other CGRP mAbs; however, due to limitations such as cost and coverage, reimbursement will likely only be considered after a trial of 2 oral prophylaxis treatments. |
The CDEC initiation criteria for fremanezumab and galcanezumab is as follows: 1. The patient has a confirmed diagnosis of episodic or chronic migraine according to the International Headache Society criteria, defined as: 1.1. Episodic migraine: migraine headaches on at least 4 days per month and fewer than 15 headache days per month for more than 3 months. 1.2. Chronic migraine: headaches for at least 15 days per month for more than 3 months of which at least 8 days per month are with migraine. 2. The patient has experienced an inadequate response, intolerance, or contraindication to at least 2 oral prophylactic migraine medications. 3. The physician must provide the number of headache and migraine days per month at the time of initial request for reimbursement. 4. The maximum duration of initial authorization is 6 months. Should the initiation criteria for eptinezumab be aligned with that of fremanezumab and galcanezumab? | The clinical expert agreed with all the initiation criteria described for fremanezumab and galcanezumab are appropriate, with the exception of the maximum duration of initial authorization. The clinical expert noted that 6 months is not enough time to adequately evaluate response, given that eptinezumab is administered every 3 months. The clinical expert believed that up to 1 year for initial authorization would be more clinically appropriate. |
Considerations for continuation or renewal of therapy | |
The CDEC renewal criteria for fremanezumab and galcanezumab is as follows: 1. The physician must provide proof of beneficial clinical effect when requesting continuation of reimbursement, defined as a reduction of at least 50% in the average number of migraine days per month at the time of first renewal compared with baseline. At subsequent renewals the physician must provide proof that the initial 50% reduction in the average number of migraine days per month has been maintained. 2. The maximum duration of subsequent authorizations following the initial authorization is 6 months. Should the renewal criteria for eptinezumab be aligned with that of fremanezumab and galcanezumab? | The clinical expert believed that if the 50% reduction criterion was not fulfilled, the specialist should be given the opportunity to provide a rationale for continued use given that not every patient will achieve a 50% reduction. The clinical expert suggested that using a 30% reduction and a reduction in HIT-6 (5 points) would be appropriate for eligibility for renewal. |
Considerations for prescribing of therapy | |
The recommended dose of eptinezumab is 100 mg administered by IV infusion every 12 weeks. Some patients may benefit from 300 mg administered by IV infusion every 12 weeks. The need for dose escalation should be assessed within 12 weeks after initiation of the treatment. Are there any cases in which a patient should receive the 300 mg dose immediately without first trialling the 100 mg dose? Would immediate reimbursement of the 300 mg dose be a valid option in certain cases? | The clinical expert stated that there is a lack of data on switching between doses and therefore uncertainty exists on this issue. The clinical expert believed this would depend on the cost of the drug. If eptinezumab 300 mg is 3 times the cost of eptinezumab 100 mg, and if a patient fails at least 2 doses of 100 mg, then at least 2 doses of 300 mg will be tried next. If eptinezumab 300 mg is the same or similar in cost to eptinezumab 100 mg, the clinical expert suggested patients who are refractory at the first visit should be offered 300 mg, depending on patient characteristics. |
Eptinezumab is administered via IV infusion by a health care professional and requires availability of infusion clinics and trained health care professionals. | No response required. For CDEC consideration. |
CADTH recommendations for galcanezumab and fremanezumab state that, because there is no evidence for combination use of the respective therapies with onabotulinum toxin A, they should not be used together. Is there any evidence to support the combination use of eptinezumab with onabotulinum toxin A, compared with the previous agents and onabotulinum toxin A? | The clinical expert noted that there are no data for eptinezumab combined with onabotulinum toxin A, but noted that there are data for onabotulinum toxin A combined with other monoclonal antibodies. Based on this, the clinical expert suggested that eptinezumab could be used with onabotulinum toxin A. |
System and economic issues | |
Currently, a 300 mg stock-keeping unit is not available and is still under development. In economic components of the submission, the 300 mg dose is costed linearly with the 100 mg dose as the only way to obtain a 300 mg dose is by purchasing three 100 mg/mL vials. Compared with eptinezumab 300 mg, eptinezumab 100 mg was found to be less costly and less effective. Following the review of eptinezumab by CADTH, Lundbeck Canada Inc. plans to address the 300 mg dose cost with the pCPA and to provide participating drug plans |||||||||||||||||||||||||||||||||||||||||||||||||||||||||||||||||||||||||||||||||||||||||||||||||||||||||||||||||||||||||||||||||||||||||||||||||||||||||||||||||||||||||||||||| | No response required. For CDEC consideration. |
CDEC = CADTH Canadian Drug Expert Committee; CGRP = calcitonin gene–related peptide; HIT-6 = Headache Impact Test 6-item; pCPA = pan-Canadian Pharmaceutical Alliance.
Clinical Evidence
The clinical evidence included in the review of eptinezumab is presented in 3 sections. The first section, the systematic review, includes pivotal studies provided in the sponsor’s submission to CADTH and Health Canada, as well as those studies that were selected according to an a priori protocol. The second section includes indirect evidence from the sponsor. The third section includes sponsor-submitted long-term extension studies and additional relevant studies that were considered to address important gaps in the evidence included in the systematic review.
Systematic Review (Pivotal and Protocol-Selected Studies)
Objectives
To perform a systematic review of the beneficial and harmful effects of eptinezumab for the prevention of migraine in adults who have at least 4 migraine days per month.
Methods
Studies selected for inclusion in the systematic review included pivotal studies provided in the sponsor’s submission to CADTH and Health Canada, as well as those meeting the selection criteria presented in Table 5. Outcomes included in the CADTH review protocol reflect those considered to be important to patients, clinicians, and drug plans.
Table 5: Inclusion Criteria for the Systematic Review
Criteria | Description |
|---|---|
Patient population | Adult patients with migraine who have had at least 4 migraine days per month Subgroups of interest:
|
Intervention | Eptinezumab 100 mg IV infusion every 12 weeks; some patients may benefit from a dose of 300 mg IV infusion every 12 weeks |
Comparators | Pharmacologic interventions:
|
Outcomes | Key outcomes:
Harms outcomes: AEs, SAEs, WDAEs, AEs of special interest (e.g., anaphylaxis and/or hypersensitivity reactions, antibody formation, cardiovascular events, suicidality, alopecia, fatigue) |
Study design | Published and unpublished phase III and IV randomized controlled trials |
AE = adverse event; CGRP = calcitonin gene–related peptide; HIT-6 = Headache Impact Test 6-item; mAbs = monoclonal antibodies; MBS = most bothersome symptoms; MIDAS = Migraine Disability Assessment Scale; MSQ = Migraine-Specific Quality of Life questionnaire; PGIC = Patient Global Impression of Change; SAE = serious adverse event; WDAE = withdrawal due to adverse event.
The literature search for clinical studies was performed by an information specialist using a peer-reviewed search strategy according to the PRESS Peer Review of Electronic Search Strategies checklist.12
Published literature was identified by searching the following bibliographic databases: MEDLINE All (1946–) via Ovid and Embase (1974–) via Ovid. All Ovid searches were run simultaneously as a multifile search. Duplicates were removed using Ovid deduplication for multifile searches, followed by manual deduplication in EndNote. The search strategy comprised both controlled vocabulary, such as the National Library of Medicine’s MeSH (Medical Subject Headings), and keywords. The main search concepts were Vyepti (eptinezumab). Clinical trials registries searched included the US National Institutes of Health’s clinicaltrials.gov, WHO’s International Clinical Trials Registry Platform search portal, Health Canada’s Clinical Trials Database, and the European Union Clinical Trials Register.
No filters were applied to limit the retrieval by study type. Retrieval was not limited by publication date or by language. Conference abstracts were excluded from the search results. Appendix 1 provides detailed search strategies.
The initial search was completed on July 7, 2022. Regular alerts updated the search until the meeting of the CADTH Canadian Drug Expert Committee on October 26, 2022.
Grey literature (literature that is not commercially published) was identified by searching relevant websites from the Grey Matters: A Practical Tool For Searching Health-Related Grey Literature checklist.13 Included in this search were the websites of regulatory agencies (FDA and European Medicines Agency). Google was used to search for additional internet-based materials. Appendix 1 provides more information on the grey literature search strategy.
These searches were supplemented by reviewing bibliographies of key papers and through contacts with appropriate experts. In addition, the sponsor of the drug was contacted for information regarding unpublished studies.
Two CADTH clinical reviewers independently selected studies for inclusion in the review based on titles and abstracts, according to the predetermined protocol. Full-text articles of all citations considered potentially relevant by at least 1 reviewer were acquired. Reviewers independently made the final selection of studies to be included in the review, and differences were resolved through discussion.
Findings From the Literature
Three studies were identified from the literature for inclusion in the systematic review (Figure 1). The included studies are summarized in Table 6. A list of excluded studies is presented in Appendix 2.
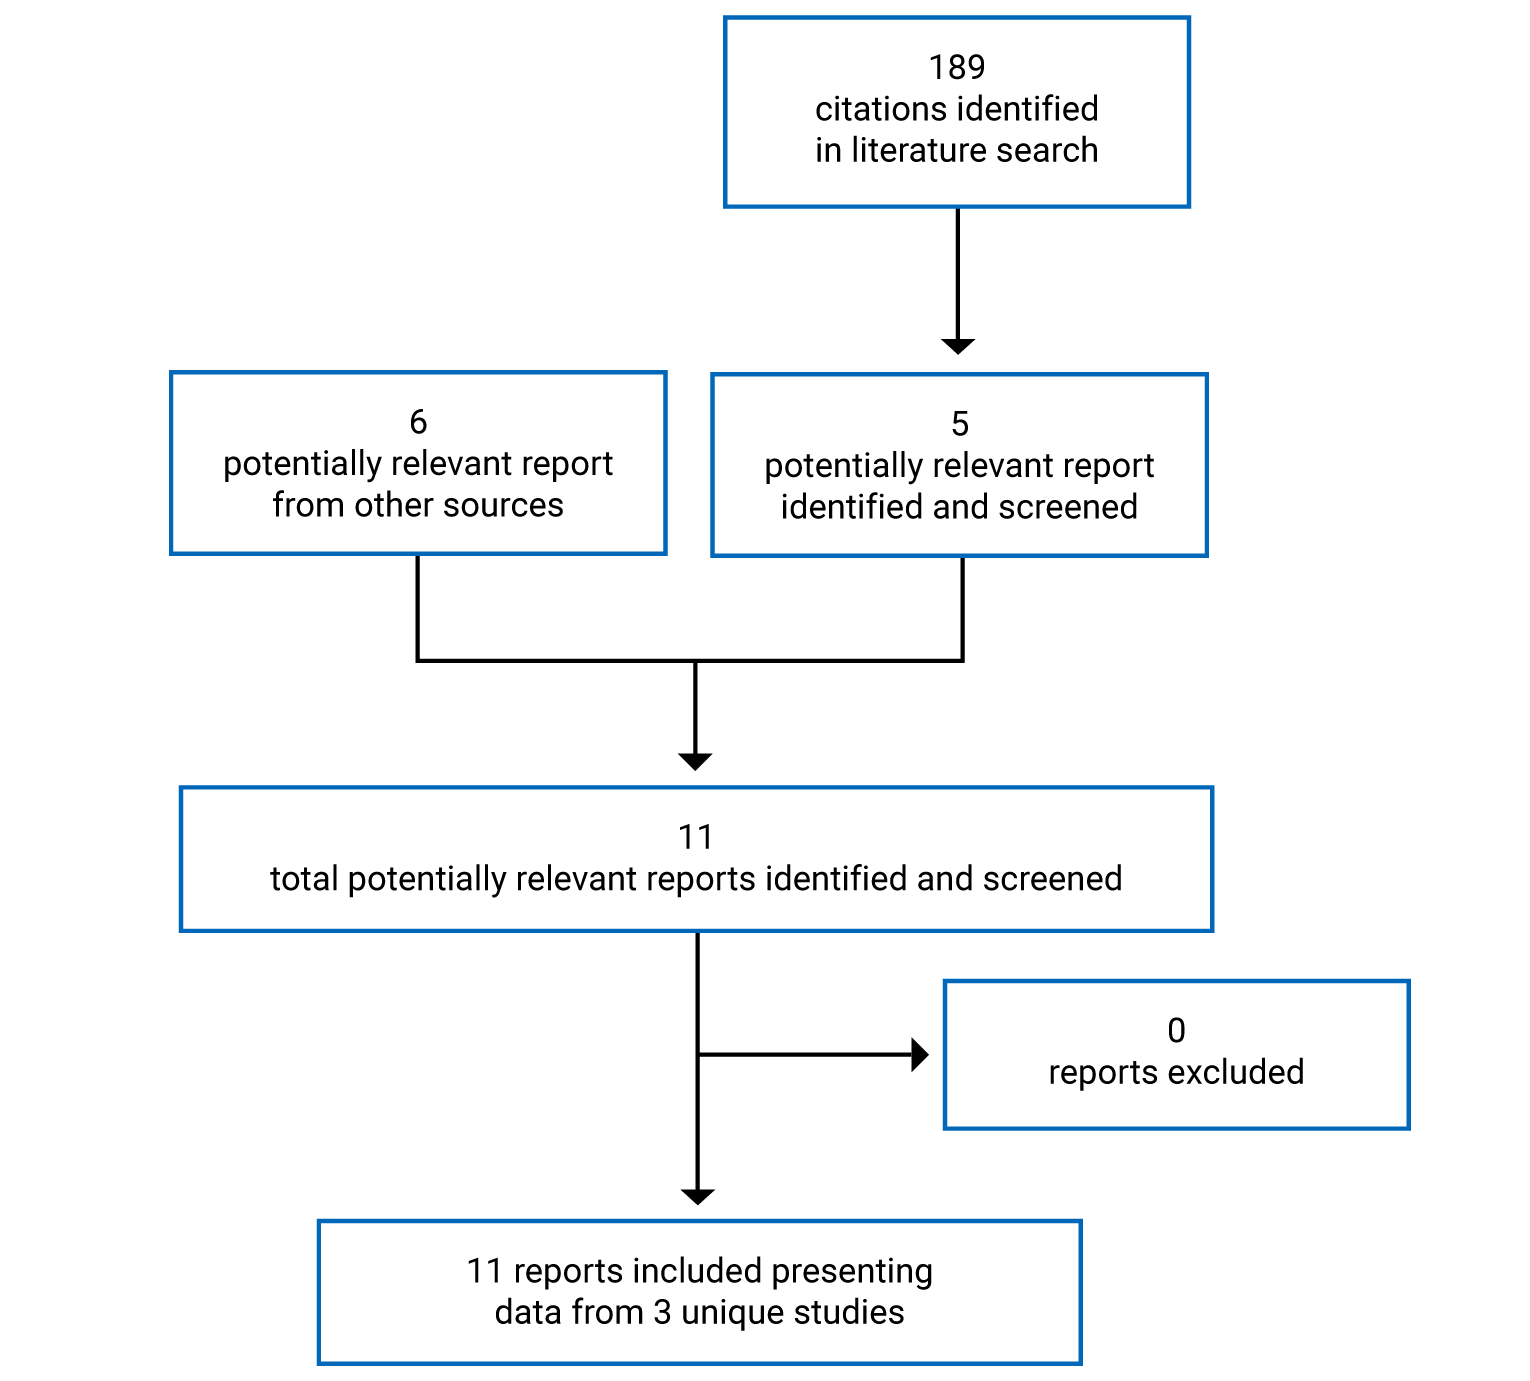
Table 6: Details of Included Studies
Detail | DELIVER | PROMISE-1 | PROMISE-2 |
|---|---|---|---|
Designs and populations | |||
Study design | Double-blind RCT | Double-blind RCT | Double-blind RCT |
Locations | 96 sites, 17 countries (US, Europe) | 84 sites, 2 countries (US, Georgia) | 128 sites; 13 countries (US, Europe) |
Patient enrolment dates | June 2020 to October 2021 (data cut-off) | September 30, 2015, to December 14, 2017 | November 30, 2016, to April 20, 2018 |
Randomized (N) | 892 | 674 | 1,072 |
Inclusion criteria | Outpatients with a primary diagnosis of migraine according to the Headache Classification Committee of the IHS, the ICHD-3 2018 criteria, who:
|
|
|
Exclusion criteria |
|
|
|
Drugs | |||
Intervention | Eptinezumab 100 mg by IV infusion at weeks 0 and 12 Eptinezumab 300 mg by IV infusion at weeks 0 and 12 | Eptinezumab 30 mg by IV infusion at weeks 0, 12, 24, 36 Eptinezumab 100 mg by IV infusion at weeks 0, 12, 24, 36 Eptinezumab 300 mg by IV infusion at weeks 0, 12, 24, 36 | Eptinezumab 100 mg by IV infusion at weeks 0 and 12 Eptinezumab 300 mg by IV infusion at weeks 0 and 12 |
Comparator(s) | Placebo by IV infusion at weeks 0 and 12 | Placebo by IV infusion at weeks 0, 12, 24, 36 | Placebo by IV infusion at weeks 0 and 12 |
Duration | |||
Phase | |||
Screening | 28 to 30 days | 4 weeks | 28 to 30 days |
Double-blind | 24 weeks | 48 weeks | 24 weeks |
Follow-up | 48 week extension | 20 weeks | 20 weeks |
Outcomes | |||
Primary end point | CFB in number of MMDs (weeks 1 to 12) | CFB in number of MMDs (weeks 1 to 12) | CFB in number of MMDs (weeks 1 to 12) |
Secondary and exploratory end points | Key secondary end points:
Secondary end points:
Exploratory end points
Safety end points:
| Key secondary outcomes:
Other secondary end points:
Tertiary end points:
Safety end points:
| Key secondary outcomes:
Other secondary end points:
Tertiary end points
Safety end points:
|
Notes | |||
Publications | Ashina (2022) | Ashina (2020) | Lipton (2020); Diener (2020); Silberstein (2020) |
AE = adverse event; ASC-12 = Allodynia Symptom Checklist-12; CGRP = calcitonin gene–related peptide; CFB = change from baseline; CM = chronic migraine; C-SSRS = Columbia Suicide Severity Rating Scale; DSM-5 = Diagnostic and Statistical Manual of Mental Disorders, Fifth Edition; ECG = electrocardiogram; eDiary = electronic diary; EM = episodic migraine; EQ-5D-5L = 5-Level EQ-5D questionnaire; HCRU = health care resource utilization; HIT-6 = Headache Impact Test 6-item; HRT = hormone replacement therapy; ICHD-3 = International Classification of Headache Disorders, Third Edition; IHS = International Headache Society; MBS = most bothersome symptom; MHD = monthly headache day; MMD = monthly migraine day; MOH = medication overuse headache; MSQ = Migraine-Specific Quality of Life questionnaire; PGIC = Patient Global Impression of Change; RCT = randomized controlled trial; SAE = serious adverse event; SF-36 = Short Form (36) Health Survey; VAS = visual analogue scale; WPAI = Workplace Productivity and Activity Impairment.
Note: Six additional reports were included (sponsor’s submission, Health Canada Review).
Sources: Clinical Study Reports for DELIVER,5 PROMISE-1,6 and PROMISE-2 studies.7
Description of Studies
Three pivotal, sponsor-funded, multinational, double-blind RCTs were included in this review. All studies compared eptinezumab 100 mg and eptinezumab 300 mg to placebo.
The primary objective of the DELIVER5 trial was to evaluate the efficacy of eptinezumab for the prevention of migraine in patients with unsuccessful prior preventive treatments. Secondary objectives were to evaluate the HRQoL and work productivity impact of eptinezumab, and the effect of long-term treatment with eptinezumab. The DELIVER trial randomized 892 patients with either EM or CM at a ratio of 1:1:1 to eptinezumab 100 mg, eptinezumab 300 mg, or placebo. This was a multinational study with 96 sites in 17 countries (US and Europe), and no Canadian sites. Randomization was stratified by country and MHDs at baseline (≤ 14 MHDs, > 14 MHDs).
The primary objective of the PROMISE-16 and PROMISE-2 trials7 was to evaluate the efficacy of repeat doses of eptinezumab administered by IV infusion compared to placebo in patients with frequent EM (PROMISE-1) and CM (PROMISE-2) and the secondary objectives were to evaluate safety and pharmacokinetics. The PROMISE-1 trial randomized 674 patients with EM and the PROMISE-2 trial randomized 1,050 patients with CM at a ratio of 1:1:1 to eptinezumab 100 mg, eptinezumab 300 mg, or placebo. In the PROMISE-1 trial, randomization was stratified by migraine days during screening (≤ 9 days or > 9 days) and in the PROMISE-2 trial, randomization was stratified by migraine days during screening (< 17 days or ≥ 17 days) and prophylactic medication use during the 3 months before screening (yes or no). The PROMISE-1 trial was conducted at 84 sites in 2 countries (US and Georgia) and the PROMISE-2 trial was conducted at 128 sites in 13 countries (US and Europe). No Canadian sites were included in the PROMISE-1 or PROMISE-2 trial.
Populations
Inclusion and Exclusion Criteria
In the DELIVER trial,5 patients had to fulfill criteria for either EM or CM, with at least 4 MMDs during screening, and a 12-month history of EM or CM. Patients in the PROMISE-1 trial6 had to have at least a 12-month history of migraine with no more than 14 MHDs, of which at least 4 had to be migraine days in the 3 months before screening, while in the PROMISE-2 trial,7 patients were to have a history of CM for at least 12 months before screening, and between 15 and 26 MHDs during the 28-day screening, with no more than 8 MMDs. In the DELIVER trial, patients had to have evidence of failure to 2 to 4 different preventive migraine medications in the past 10 years. Patients in the PROMISE-1 trial were not regularly using prophylactic medications for migraine in the 2 months before screening, while patients in the PROMISE-2 trial had to be stable on migraine prophylaxis for at least 3 months before entering the study.
Patients were excluded from the DELIVER trial5 if they had failed valproate and/or divalproex or botulinum toxin A or B and had tried other preventive medications since the failure of valproate or onabotulinum toxin A before study inclusion. Otherwise, all studies excluded patients with clinically significant pain syndromes that might act as confounders, as well as patients with specific migraine or headache subtypes that might also act as confounders. Patients with a history of certain psychiatric disorders such as psychosis or mania were also excluded from all studies.
Baseline Characteristics
In the DELIVER trial,5 patients were approximately 44 years of age, while in the PROMISE studies, patients were approximately 40 years of age (Table 7 and Table 8). In all studies, the majority of patients were female (approximately 90% in the DELIVER trial, 82% in the PROMISE-1 trial,6 and 88% in the PROMISE-2 trial)7 and white (96% in the DELIVER trial, 84% in the PROMISE-1 trial, and 91% in the PROMISE-2 trial). In the DELIVER trial, 60% of patients had EM, |||||| had 14 or fewer MHDs, 62% had 2 prior migraine prophylaxis failures, 31% had 3 prior failures, 7% had 4 prior failures, and 12% had a diagnosis of MOH. In the PROMISE-1 trial, 36% had more than 9 MMDs, and in the PROMISE-2 trial, 45% had 17 or more MMDs.
With respect to imbalances in baseline characteristics within studies, for eptinezumab 100 mg versus eptinezumab 300 mg versus placebo in the DELIVER trial,5 differences were observed in the proportion of female patients in each treatment group (93% versus 89% versus 88%, respectively), and the proportion of patients with EM in each treatment group (59% versus 64% versus 58%, respectively). In the PROMISE-1 trial,6 imbalances between the eptinezumab 100 mg versus eptinezumab 300 mg versus placebo treatment groups were observed for the proportion of female patients (80% versus 89% versus 84%, respectively), race (white: 88% versus 84% versus 82%, respectively), and the percent of migraines with severe intensity (33.9% versus 28.2% versus 33.6%). In the PROMISE-2 trial,7 imbalances were observed for race (white: 93% versus 92% versus 88% for eptinezumab 100 mg versus eptinezumab 300 mg versus placebo, respectively).
Table 7: Summary of Baseline Characteristics (DELIVER Trial)
Characteristic | Eptinezumab 100 mg N = 299 | Eptinezumab 300 mg N = 293 | Placebo N = 298 |
|---|---|---|---|
Mean age, years (SD) | 44.6 (10.8) | 43.1 (10.2) | 43.8 (10.8) |
Female, n (%) | 277 (93) | 260 (89) | 263 (88) |
Race, n (%) | |||
White | 288 (96) | 281 (96) | 285 (96) |
Unknown | 11 (4) | 12 (4) | 11 (4) |
Time since first migraine diagnosis, years, mean (SD) | 18.4 (11.6) | 16.8 (10.9) | 17.7 (11.5) |
Current migraine diagnosis, n (%) | |||
EM | 176 (59) | 186 (64) | 173 (58) |
CM | 123 (41) | 107 (36) | 125 (42) |
MHD stratification group, n (%) | |||
≤ 14 MHDs | ||||||||||| | ||||||||||| | ||||||||||| |
> 14 MHDs | ||||||||||| | ||||||||||| | ||||||||||| |
Experience fully reversible aura symptoms, n (%) | 83 (28) | 91 (31) | 89 (30) |
Experience aura symptoms without headache, n (%) | 18 (6) | 14 (5) | 14 (5) |
MOH diagnosis, n (%) | 38 (13) | 35 (12) | 37 (12) |
Number of previous treatment failures, n (%) | |||
0 | ||||||||||| | ||||||||||| | ||||||||||| |
1 | ||||||||||| | ||||||||||| | ||||||||||| |
2 | 187 (63) | 183 (63) | 180 (60) |
3 | 92 (31) | 95 (32) | 90 (30) |
4 | 19 (6) | 14 (5) | 27 (9) |
CM = chronic migraine; EM = episodic migraine; MHD = migraine headache day; MOH = medication overuse headache; SD = standard deviation.
Source: Clinical Study Report for DELIVER.5
Table 8: Baseline Characteristics (PROMISE-1 and PROMISE-2 Trials)
Characteristic | PROMISE-1 | PROMISE-2 | ||||
|---|---|---|---|---|---|---|
EPT100 N = 221 | EPT300 N = 222 | PLACEBO N = 222 | EPT100 N = 356 | EPT300 N = 350 | Placebo N = 366 | |
Mean age, years (SD) | 40.0 (10.7) | 40.2 (11.7) | 39.9 (11.7) | 41.0 (11.7) | 41.0 (10.4) | 39.6 (11.3) |
Female, n (%) | 179 (80) | 199 (89) | 186 (84) | 307 (86) | 314 (90) | 325 (89) |
Race, n (%) | ||||||
White | 196 (88) | 187 (84) | 181 (82) | 332 (93) | 322 (92) | 321 (88) |
Black or African American | 17 (8) | 27 (12) | 30 (14) | 21 (6) | 23 (7) | 38 (10) |
Time since first migraine diagnosis (years), mean (SD) | 17.4 (11.2) | 18.2 (11.8) | 16.9 (11.2) | 18.3 (12.2) | 19.0 (11.5) | 17.0 (11.6) |
MHDs, mean (SD) | 10.0 (3.5) | 10.1 (3.2) | 10.0 (2.9) | 20.1 (3.3) | 20.1 (3.3) | 20.0 (3.4) |
MMDs, mean (SD) | 8.7 (2.9) | 8.6 (2.9) | 8.4 (2.7) | 14.5 (4.3) | 14.9 (4.5) | 15.1 (4.4) |
Migraine days, n (%) | ||||||
≤ 9 days | 143 (64) | 143 (64) | 144 (65) | NR | NR | NR |
> 9 days | 80 (36) | 81 (36) | 78 (35) | NR | NR | NR |
< 17 days | NR | NR | NR | 192 (54) | 193 (55) | 204 (56) |
≥ 17 days | NR | NR | NR | 164 (46) | 157 (45) | 162 (44) |
% migraines with severe intensity, mean (SD) | 33 (29) | 28 (25) | 34 (29) | ||||||||||| | ||||||||||| | ||||||||||| |
History of prophylactic medication use, n (%) | NR | NR | NR | 132 (37) | 130 (37) | 135 (37) |
Experience aura, n (%) | ||||||||||| | ||||||||||| | ||||||||||| | ||||||||||| | ||||||||||| | ||||||||||| |
Experience aura symptoms without headache, n (%) | ||||||||||| | ||||||||||| | ||||||||||| | ||||||||||| | ||||||||||| | ||||||||||| |
MOH diagnosis, n (%) | NR | NR | NR | 139 (39) | 147 (42) | 145 (40) |
EPT100 = eptinezumab 100 mg; EPT300 = eptinezumab 300 mg; MHD = migraine headache day; MMD = monthly migraine day; MOH = medication overuse headache; NR = not reported; SD = standard deviation.
Sources: Clinical Study Reports for PROMISE-16 and PROMISE-2 trials.7
Interventions
Eptinezumab 100 mg, eptinezumab 300 mg, and placebo treatments were administered as IV infusions at baseline and at week 12 for the double-blind treatment period in the DELIVER5 and PROMISE-2 trials.7 In the PROMISE-1 trial,6 infusions were administered at baseline and at weeks 12, 24, and 36. Infusions were administered by blinded study personnel over a maximum of 1 hour.
Patients were not allowed to use prophylactic treatments for migraine within a week of the screening visit and during the study. This included beta-blockers (propranolol or metoprolol), anticonvulsants (topiramate, valproate, or divalproex), tricyclic antidepressants (amitriptyline), calcium channel blockers (flunarizine), angiotensin-2 receptor blockers (candesartan), and other medications locally approved for migraine prevention. Other drugs in these classes were allowed if prescribed for nonmigraine indications. Acute treatment of migraine (by prescription or over the counter as recommended by a health care professional) was allowed provided the dose had been stable for at least 12 weeks before screening. Patients were also not allowed to use central nervous system (CNS) and migraine-related devices or injectable therapies within 8 weeks of screening, onabotulinum toxin A for any reason within 16 weeks of screening, or monoamine oxidase inhibitors, ketamine, methysergide, methylergonovine or nimesulide within 12 weeks of screening. Barbiturates and prescription opioids were allowed for no more than 4 days per month, provided that the patient did not meet the criteria for MOH and had been on a stable regimen (no more than 4 days per month) for at least 2 months before screening.
Outcomes
A list of efficacy end points identified in the CADTH review protocol that were assessed in the clinical trials included in this review is provided in Table 9. These end points are summarized in the following section. A detailed discussion and critical appraisal of the outcome measures is provided in Appendix 4.
Table 9: Summary of Outcomes of Interest Identified in the CADTH Review Protocol
Outcome measure | DELIVER | PROMISE-1 | PROMISE-2 |
|---|---|---|---|
Migraine frequency | Primary outcome: CFB in MMDs (weeks 1 to 12) [1] EPT 300 mg vs. placebo [1] EPT 100 mg vs. placebo [3] | Primary outcome: CFB in MMDs (weeks 1 to 12) EPT 300 mg vs. placebo [1] EPT 100 mg vs. placebo [5] | Primary outcome: CFB in MMDs (weeks 1 to 12) EPT 300 mg vs. placebo [1] EPT 100 mg vs. placebo [5] |
50% reduction in MMDs (weeks 1 to 12) EPT 300 mg vs. placebo [2] EPT 100 mg vs. placebo [4] | 50% reduction in MMDs (weeks 1 to 12) EPT 300 mg vs. placebo [4] EPT 100 mg vs. placebo [8] | 50% reduction in MMDs (weeks 1 to 12) EPT 300 mg vs. placebo [6] EPT 100 mg vs. placebo [8] | |
CFB in MMDs (week 13 to 24) EPT 300 mg vs. placebo [5] EPT 100 mg vs. placebo [8] | |||
75% reduction in MMDs (weeks 1 to 12) EPT 300 mg vs. placebo [6] EPT 100 mg vs. placebo [9] | 75% reduction in MMDs (weeks 1 to 4) EPT 300 mg vs. placebo [2] EPT 100 mg vs. placebo [6] 75% reduction in MMDs (weeks 1 to 12) EPT 300 mg vs. placebo [3] EPT 100 mg vs. placebo [7] | 75% reduction in MMDs (weeks 1 to 4) EPT 300 mg vs. placebo [2] EPT 100 mg vs. placebo [7] 75% reduction in MMDs (weeks 1 to 12) EPT 300 mg vs. placebo [3] EPT 100 mg vs. placebo [11] | |
Secondary outcomes: Change from baseline in the percentage of migraines or headaches with severe pain intensity (weeks 1 to 12) Change from baseline in the number of MMDs in patients with MOH (weeks 1 to 12) Migraine on the day after first dosing | % patients with migraine 1 day after dose EPT 300 mg vs. placebo [9] EPT 100 mg vs. placebo [10] | % patients with migraine 1 day after dose EPT 300 mg vs. placebo [4] EPT 100 mg vs. placebo [9] | |
Other secondary: 100% migraine responder rates (weeks 1 to 12) Migraine responder rates for time periods other than weeks 1 to 12 Change in frequency of migraine days between baseline and time periods other than weeks 1 to 12 Percent change in migraine or headache days Time to first migraine after dosing Migraine or headache hours Migraine or headaches with severe intensity | Migraine prevalence days 1 to 28 postdose EPT 300 mg vs. placebo [5] EPT 100 mg vs. placebo [10] Other secondary: Change in frequency of migraine days (weeks 1 to 24) 100% migraine responder rate (weeks 1 to 12) Migraine responder rates for time periods other than weeks 1 to 12 Change in frequency of migraine days between baseline and time periods other than weeks 1 to 12 Percent change in headache or migraine days Time to first migraine after dosing Migraine or headache hours Migraine or headaches with severe intensity | ||
Headache frequency | Secondary outcomes: ≥ 50% reduction from baseline in MHDs (weeks 1 to 12) ≥ 75% reduction from baseline in MHDs (weeks 1 to 12) 100% reduction from baseline in MHDs (average of every-fourth-week results, weeks 1 to 12) Change from baseline in the number of MHDs (weeks 1 to 12) | Other secondary: Headache responder rates Change in the frequency of headache days | Other secondary: Headache responder rates Change in the frequency of headache days |
Acute headache pain med intake | Secondary outcomes: Change from baseline in the number of monthly days with use of acute migraine medication (weeks 1 to 12) Change from baseline in the number of monthly days with use of acute migraine medication (weeks 13 to 24) | Other secondary: Change in acute migraine medication days (weeks 1 to 12) Migraines or headaches with acute medication usage | Acute medication usage EPT 300 mg vs. placebo [12] Other secondary: Migraine or headache with acute medication usage |
Other patient-reported outcomes | Secondary outcomes: PGIC score at week 12 PGIC score at week 24 | — | Other secondary: PGIC |
HRQoL | Secondary outcomes: CFB to week 12 in the MSQ subscores (role function restrictive, role function preventive, emotional function) CFB to week 12 in EQ-5D-5L VAS | Other secondary: SF-36 EQ-5D-5L | Other secondary: SF-36 EQ-5D-5L |
Symptoms | CFB in HIT-6 EPT 300 mg vs. placebo [7] EPT 100 mg vs. placebo [10] Secondary outcomes: MBS score at week 12, as measured relative to baseline CFB to week 24 in the HIT-6 score ≥ 5-point reduction from baseline to week 12 in HIT-6 score ≥ 5-point reduction from baseline to week 24 in HIT-6 score | — | CFB in HIT-6 EPT 300 mg vs. placebo [13] Tertiary: MBS |
HCRU | Secondary outcome: HCRU at week 24 | — | — |
Loss of work days | Secondary outcome: CFB to week 12 in the WPAI subscores (absenteeism, presenteeism, work productivity loss, activity impairment) CFB to week 24 in the WPAI subscores | — | — |
CFB = change from baseline; EPT = eptinezumab; EQ-5D-5L = 5-Level EQ-5D questionnaire; HCRU = health care resource utilization; HIT-6 = Headache Impact Test 6-item; MBS = most bothersome symptom; MHD = monthly headache day; MMD = monthly migraine day; MOH = migraine overuse headache; MSQ = Migraine-Specific Quality of Life questionnaire; PGIC = Patient Global Impression of Change; SF-36 = Short Form (36) Health Survey; VAS = visual analogue scale; WPAI = Work Productivity and Activity Impairment.
Note: Numbers in square brackets [-] indicate ranking in multiple-testing procedure.
Sources: Clinical Study Reports for DELIVER,5 PROMISE-1,6 and PROMISE-2.7
Migraine Frequency
The change from baseline in MMDs from weeks 1 to 12 was the primary outcome in each of the included studies. Headache episodes were self-reported by the patient. An episode is a single headache event that the patient reported as having a start and an end and lasting at least 30 minutes. The term headache encompassed both headaches and migraine headaches. The migraine and headache end points were summarized at 4-week intervals (weeks 1 to 4, 5 to 8, 9 to 12, 13 to 16,17 to 20, and 21 to 24), 12-week intervals (weeks 1 to 12 and 13 to 24) and the 24-week interval (weeks 1 to 24). The characteristics of each headache were collected in an electronic diary (eDiary) at the end of the headache, and for each headache it was determined whether it qualifies as a migraine. If a headache qualified as migraine, every day the headache lasted counted as a migraine day.5-7
A migraine day is defined as any day with a headache that meets the CM definition as outlined in the International Headache Society International Classification of Headache Disorders (ICHD, third edition, beta version 2013). A migraine is defined as a self-reported headache that:
lasted 4 hours or more or 30 minutes to 4 hours, and was believed by the patient to be a migraine that was relieved by medication
had at least 2 of the following: a unilateral location, pulsating quality, moderate or severe pain intensity, and aggravation by or causing avoidance of routine physical activity
had at least 1 of the following: nausea and/or vomiting and photophobia and phonophobia.
Headache Impact Test 6-Item
The HIT-6 (version 1.0) was assessed as a key secondary outcome in the DELIVER5 and PROMISE-2 trials.7 The HIT-6 is a tool used to measure the impact and effect on the ability to function normally in daily life when a headache occurs. The HIT-6 is a 6-question, Likert-type, self-reporting questionnaire with responses ranging from “Never” to “Always” with the following response scores: Never = 6, Rarely = 8, Sometimes = 10, Very Often = 11, Always = 13.14,15 The total score for the HIT-6 is the sum of each response score and is treated as missing if the response is missing for 1 or more questions. The HIT-6 total score ranges from 36 to 78, with scores of 60 or greater indicating a “severe” impact on life, 56 to 59 a “substantial” impact, 50 to 55 “some” impact, and 49 or lower “little to no” impact.14,15 The estimated between-group minimal important difference (MID) in migraine for the HIT-6 was 1.516 and the estimated within-group MID was 6 in patients with CM.17 With respect to validity, support has been demonstrated for construct validity when compared to other headache-related assessments in patients with EM, CM, and nonmigraine headaches,18 and support has been demonstrated for construct and convergent validity19 and for convergent and known-groups validity in patients with CM.20 Internal consistency20 and test-retest reliability were adequate in patients with CM, EM, and nonmigraine headaches.18,19 Responsiveness to change was demonstrated in patients with CM.19,20
Five-Level EQ-5D Questionnaire
The EQ-5D-5L VAS was reported in each of the included studies as a secondary or “other” secondary outcome. The EQ-5D-5L is a descriptive system of HRQoL states consisting of 5 dimensions (mobility, self-care, usual activities, pain and/or discomfort, and anxiety and/or depression) each of which can take 1 of 5 responses. The responses record 5 levels of severity (no problems, slight problems, moderate problems, severe problems, and extreme problems) within a particular EQ-5D dimension. The EQ-5D-5L additionally includes a VAS scale, which ranges from 0 (worst health imaginable) to 100 (best health imaginable).21 No MID specific to migraine was found for the EQ-5D-5L and no studies were identified that assessed the validity, reliability, and responsiveness to change in patients with migraine.
Patient Global Impression of Change
PGIC was assessed as a secondary outcome in the DELIVER trial and as an “other” secondary outcome in the PROMISE-2 trial. PGIC is a single patient-reported item reflecting the patient’s impression of change in disease status since the start of the study (in relation to activity limitations, symptoms, emotions, and overall quality of life). The item is rated on a 7-point scale (very much improved, much improved, minimally improved, no change, minimally worse, much worse, and very much worse), with a high score indicating worsening.5 No MID specific to migraine was found for PGIC and none of the identified studies assessed the validity, reliability, and responsiveness to change in patients with migraine.
Most Bothersome Symptom
MBS scores were assessed as a secondary outcome in the DELIVER trial and as a tertiary outcome in the PROMISE-2 trial. Investigators verbally obtained the MBS associated with a given patient’s migraines during the baseline visit. Patients were asked to rate the improvement in this symptom from baseline on a 7-point scale identical to the scale used for PGIC. The MBS areas included: nausea, vomiting, sensitivity to light, sensitivity to sound, mental cloudiness, fatigue, pain with activity, mood changes, and other.5 No MID specific to migraine was found for the MBS and no studies were identified that assessed the validity, reliability, and responsiveness to change in patients with migraine.
Migraine-Specific Quality of Life Questionnaire
The change from baseline in MSQ subscores for role function restrictive, role function preventive, and emotional function were assessed as secondary outcomes in the DELIVER trial. The MSQ is a 14-item questionnaire used to assess quality of life in patients with migraine across 3 domains: role function restrictive (7 items), role function preventive (4 items), and emotional function (3 items). Items are rated on a 6-point scale (1 = none of the time; 6 = all of the time). The overall score for each domain is obtained by summing the item responses then rescaling then to a 0- to 100-point scale, with higher scores indicative of better quality of life.22 In patients with 3 to 12 migraines per month but not more than 15 headache days per month, the estimated group-level MIDs were 3.2 for role function restrictive, 4.6 for role function preventive, and 7.5 for emotional function.23 Support was demonstrated for construct and known-groups validity when compared to other headache-related and HRQoL instruments in patients with EM and CM.22,24,25 Internal consistency and test-retest reliability were adequate in patients with EM and CM,22,24,25 and support was demonstrated for the responsiveness to change in patients with EM and CM.24,25
WPAI Questionnaire
The change from baseline in WPAI subscores (absenteeism, presenteeism, work productivity loss, and activity impairment) was assessed as a secondary outcome in the DELIVER trial. The WPAI is a 6-item questionnaire used to assess the impact of migraine on work productivity and activity impairment. Items were employment status, work-hours missed due to migraine, work-hours missed due to other reasons, hours worked, impact of migraine on productivity at work, and impact of migraine on daily activity performance, other than work.5 No MID specific to migraine was found for the WPA and none of the identified studies assessed the validity, reliability, and responsiveness to change in patients with migraine.
Statistical Analysis
Primary Outcome of the Studies
Power Calculation
In the DELIVER trial,5 power was determined by simulations of the end points in the testing strategy. Randomization of 280 patients per treatment group provided approximately 94% power for a comparison of eptinezumab 100 mg to placebo and 99% power for a comparison of eptinezumab 300 mg to placebo. This sample size also provided at least 68% power for the individual key secondary end points to show an effect, with a combined power of 58% for seeing an effect on all primary and key secondary end points and both doses in the testing strategy.
In the PROMISE-1 trial,6 a total of 200 patients per group provided at least 95% power for each change in frequency of migraine days (weeks 1 to 12), individually, assuming a treatment effect of at least 1 day and a common SD of 2.7 days or less. The sample-size calculations were performed using PASS 2008 software and based on t-tests that approximated the analysis of covariance (ANCOVA).
In the PROMISE-2 trial,7 a total of 350 patients per group provided at least 90% power for the primary end point for each comparison, assuming a treatment effect of at least 1 day and a common SD of 4 days or less. For the key secondary 75% responder rate end points, 90% power was achieved for the pairwise comparisons, assuming a placebo responder rate of 20% and an eptinezumab responder rate of 31%. These sample-size calculations were performed using PASS 2008 and based upon a t-test and chi-square test that approximated ANCOVA and Cochran-Mantel-Haenszel (CMH) tests.
Statistical Test or Model
Changes from baseline in the number of MMDs for the first six 4-week intervals were analyzed using a restricted maximum likelihood–based MMRM. The model included the fixed effects of month (weeks 1 to 4, 5 to 8, 9 to 12, 13 to 16, 17 to 20, and 21 to 24), country, stratification (MHDs at baseline: ≤ 14 MHDs versus > 14 MHDs), and treatment as factors; baseline MMDs as a continuous covariate; treatment-by-month interaction; baseline score-by-month interaction; and stratum-by-month interaction. An unstructured variance structure was used to model within-patient errors. The Kenward-Roger approximation was used to estimate denominator degrees of freedom.5-7
In the PROMISE-1 trial,6 an ANCOVA model was used to test for a difference between treatment arms. This model included the change from baseline measure as the response variable. Treatment and baseline migraine days (continuous covariate) were the independent variables. In addition, model-based estimates, including confidence intervals for the treatment differences, were used to summarize the results for the primary end point. In the PROMISE-2 trial,7 an ANCOVA model was also used, and the model included the change from baseline measure as the response variable. Treatment and variables measuring the stratification factors concepts, baseline migraine days (continuous covariate), and prophylactic medication use (binary covariate: use versus no use) were the independent variables.
Data Imputation Methods
If a patient completed at least 21 days of diary entries within each 28 day period, then normalization was used to account for the missing data. This was accomplished by multiplying the observed results by the inverse of the completion rate. If the diary was completed for fewer than 21 days in a 28-day period, then the results for the 28-day interval were a weighted function of the observed data for the current 4 week interval and the results from the previous interval. The weights were proportional to how many days the diary was completed and provided greater weight to the results from the current interval as the diary completion rate increased.5-7
Subgroup Analyses
In the DELIVER trial,5 the primary efficacy analysis was repeated for the following subgroups relevant to the protocol developed by the CADTH review team: EM (MMDs ≥ 4, MHDs ≤ 14) and CM (MMDs ≥ 8, MHDs > 14), MOH diagnosis, number of failed treatments (2, > 2) and low-frequency EM (4 MMDs to < 8), high-frequency EM (8 to 14 MMDs), and CM (MMDs ≥ 8). The assumption of an equal treatment effect across subgroups was investigated on an exploratory basis for all these subgroups. For the PROMISE-16 and PROMISE-2 trials,7 prespecified subgroup data were presented descriptively; no formal analyses were performed.
Sensitivity Analyses
In the DELIVER trial,5 to explore the assumptions related to the behaviour of the patients who withdrew due to AEs or lack of efficacy, a sensitivity analysis exploring the assumptions was performed in which monthly values for all patients were calculated using the prorating imputation rule without penalization for withdrawal due to AEs or lack of efficacy. To explore the robustness of the results to missing eDiary data during the first 4 weeks after infusion, a sensitivity analysis similar to the primary analysis was performed. In this analysis, baseline values were used to calculate values for weeks 1 to 4 for patients with fewer than 14 days of eDiary data in the first 4 weeks after their first infusion.
In the PROMISE-1 trial,6 the primary end point and key secondary end points were analyzed using a modification to Missing Data Rule 2 to evaluate the robustness of the selected algorithm. The analysis replaced Xp with Xb, where Xb was the baseline average daily result, if the patient withdrew from the study due to an AE, study burden, lack of efficacy, or worsening of study indication, or if the patient died.
In the PROMISE-2 trial,7 the first group of sensitivity analyses implemented the missing-data rules as follows: The primary end point was analyzed using a modification to the Missing Date Rule 2 (eDiary completed for fewer than 21 days) to better understand the robustness of the selected algorithm. The analysis replaced Xp with Xb, where Xb was the baseline average daily result, if the patient withdrew from the study due to an AE, study burden, lack of efficacy, or worsening of study indication, or if the patient died. 2. The primary end point was analyzed using repeated measures if the individual time periods (weeks 1 to 4, 5 to 8, and 9 to 12) were included in the model and Missing Date Rule 2 (eDiary completed for fewer than 21 days) was not used. Patients who did not complete the diary for more than 7 days out of 28 were not included for that 4-week period. The model specified an unstructured variance-covariance matrix and included the treatment group, time point, baseline, and treatment group–by–time point interaction. The Kenward-Roger approximation was used to estimate the degrees of freedom. The second group of sensitivity analyses changed the definition of baseline, which was redefined using 28 days of headache diary data ending on the day of the first dose. The primary analysis was repeated using this updated definition of the baseline. Finally, a repeated measures model that included all six 4-week intervals and both Missing Data Rule 1 and Missing Data Rule 2 was run. This model was identical in structure to the model specified for the missing-data sensitivity analysis outlined earlier but looked at how the primary analysis, based upon the ANCOVA model, compared to a repeated measures analysis.
Secondary Outcomes of the Studies
In the DELIVER trial,5 the key secondary end points related to 50% and 75% responses were analysed using logistic regression with baseline MMDs as a continuous covariate and treatment and stratification (MHDs at baseline: ≤ 14 MHDs versus > 14 MHDs) as factors. The logistic regression model was fitted using the maximum-likelihood method and the logit link function. The key secondary end point, change from baseline to week 12 in HIT-6 score, was analyzed using an MMRM similar to the 1 used for the primary end point. All the visits from the placebo-controlled period were included in the analysis. The comparisons were the contrasts between each dose of eptinezumab and placebo at week 12. The MTP strategy was a sequence of tests, either testing 1 end point at a time or using the Bonferroni-Holm method to test a group of end points. If the results of the first step were statistically significant, the formal testing continued with the next step, ensuring protection of the type I error. For the last 2 steps, the Bonferroni-Holm method was used to test the group of end points. The consecutive order of the smallest (P[1]), second smallest (P[2]), and largest P value (P[3]) had to be less than alpha/3, less than alpha/2, and less than alpha, where alpha is less than 0.05, respectively, in favour of the dose tested to consider the effect on all 3 key secondary outcomes to be statistically significant. The MTP for the DELIVER trial is depicted in Figure 2.
In the PROMISE-1 trial,6 for the key secondary end points (responder rates and percentage of patients with a migraine on the day after dosing) this testing was based upon CMH) and/or extended CMH tests. The tests were stratified by the randomization stratification factor. The change in acute migraine medication day end points was tested using an ANCOVA model with change from baseline measure as the response, and treatment and baseline acute migraine medication days as independent variables. In the PROMISE-1 trial, the MTP started with the comparison of the eptinezumab 300 mg and placebo groups as the primary end point. If this was significant, testing continued to a subset of the key secondary end points for eptinezumab 300 mg (first the weeks 1 to 4, 75% responder end point followed by the weeks 1 to 12, 75% responder end point, and then the weeks 1 to 12, 50% responder end point). The procedure then moved on to the primary end point for the eptinezumab 100 mg group, and subsequently to the same subset of key secondary end points as tested for the eptinezumab 300 mg dose. The procedure then moved on to the remaining key secondary end points for eptinezumab 300 mg and eptinezumab 100 mg groups (i.e., percentage of patients with a migraine on the day after dosing). Figure 3 depicts the MTP for the PROMISE-1 trial.
Figure 2: Multiple-Testing Procedure for DELIVER Trial
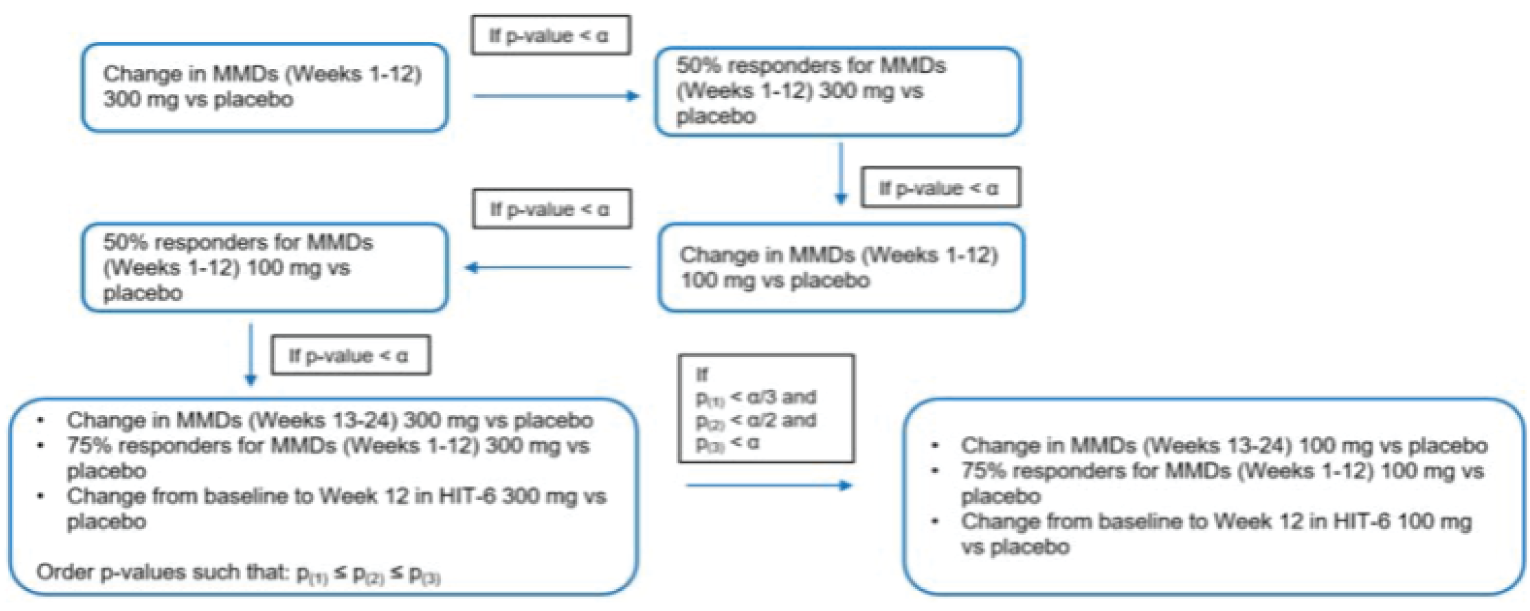
HIT-6 = Headache Impact Test 6-item; MMD = monthly migraine day.
Source: Clinical Study Report for DELIVER trial.5
Figure 3: Multiple-Testing Procedure for PROMISE-1 Trial
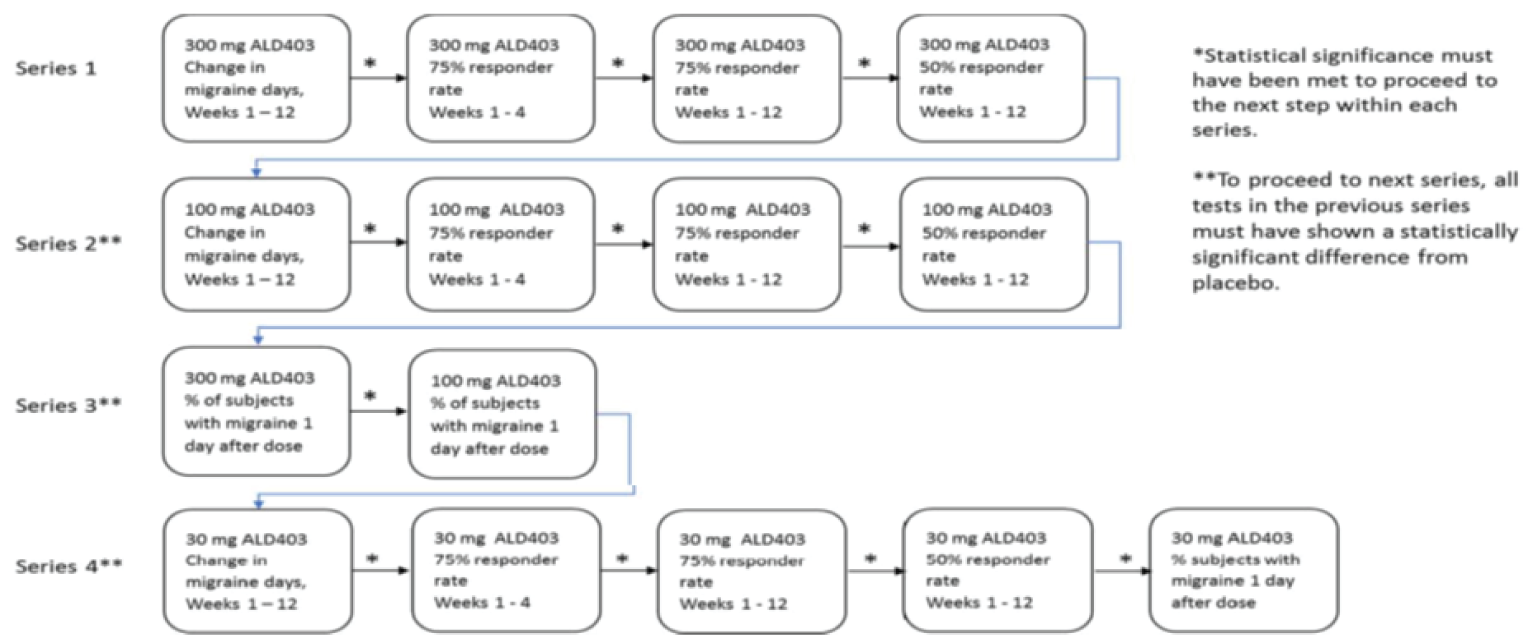
ALD403 = eptinezumab.
Source: Clinical Study Report for PROMISE-1 trial.6
In the PROMISE-2 trial,7 testing of the 75% MRR (weeks 1 to 4), 75% MRR (weeks 1 to 12), and 50% MRR (weeks 1 to 12) end points was performed with a CMH test controlling for the randomization stratification factors of baseline migraine days (< 17 days or ≥ 17 days) and prophylactic medication use (yes or no). For the percent of patients with migraine on the day after dosing, an extended CMH test was used, as patients with missing data had a value imputed between 0 and 1. Continuous outcomes such as change from baseline in HIT-6 and acute migraine medication usage were tested in a similar manner as the primary outcome (ANCOVA) using treatment and the baseline HIT-6 total score (continuous covariate), along with the stratification factors (baseline migraine days [< 17 days or ≥ 17 days]) and prophylactic med use (yes or no), and for acute medication usage, the model included the acute migraine medication usage change from baseline as the response variable. Treatment and the baseline acute migraine medication (continuous covariate), along with the baseline stratification variables as the independent variables. The MTP procedure first evaluated the comparison of the 300 mg and placebo groups for the primary end point. If this was significant, testing continued to the first set of key secondary end points for 300 mg. Within this set, the Holm procedure was used. If a significant difference was detected for all tests within this group, the procedure then moved on to the second set of key secondary end points for 300 mg (the Holm procedure was used within this set). The procedure then moved on to the 100 mg group for the primary end point and subsequently the secondary end points groups. If these end points were significant, the procedure moved to the final secondary end points for 300 mg. Within each end point group, the Holm procedure was used. Figure 4 depicts the MTP for the PROMISE-2 trial.
Figure 4: Multiple-Testing Procedure for PROMISE-2 Trial
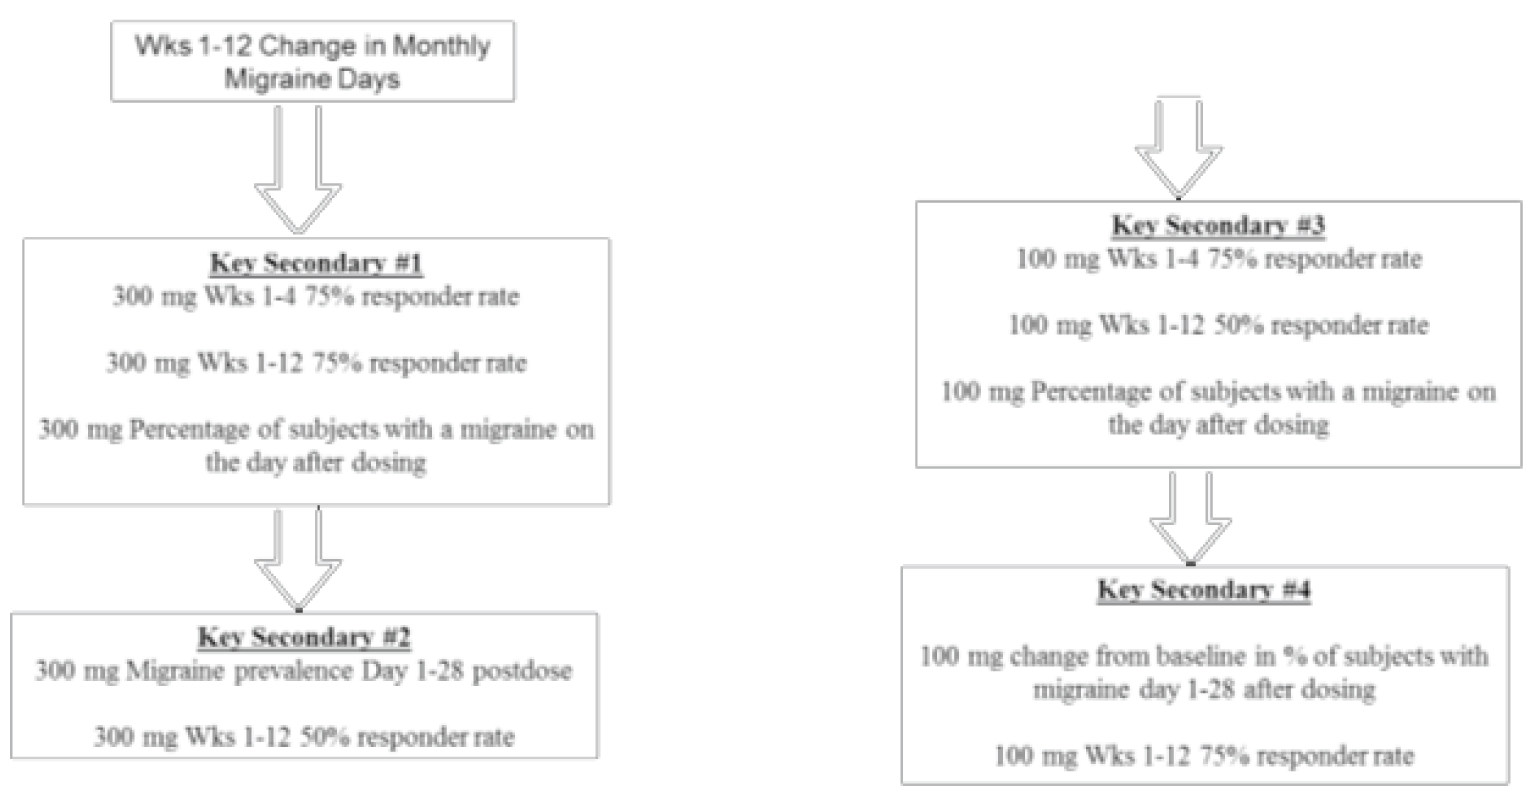
Wks = weeks.
Source: Clinical Study Report for PROMISE-2 trial.7
Table 10: Statistical Analysis of Efficacy End Points
End point | Statistical model | Adjustment factors | Sensitivity analyses |
|---|---|---|---|
DELIVER | |||
Change from baseline in MMDs | Restricted maximum likelihood–based mixed model for repeated measures (MMRM) | Fixed effects of month, country, stratification (MHDs at baseline: ≤ 14 MHDs or > 14 MHDs), and treatment as factors; baseline MMDs as a continuous covariate; treatment-by-month interaction; baseline score-by-month interaction; and stratum-by-month interaction |
|
Patients with ≥ 50% reduction in MMDs Patients with ≥ 75% reduction in MMDs | Logistic regression | Baseline MMDs as a continuous covariate and treatment and stratification (MHDs at baseline: ≤ 14 MHDs or > 14 MHDs) as factors | Patients were imputed with nonresponse if they did not have a value of MMDs for all 3 postbaseline 4-week periods included in weeks 1 to 12 |
Change from baseline in acute medication use | MMRM | Month (weeks 1 to 4, weeks 5 to 8, weeks 9 to 12, weeks 13 to 16, weeks 17 to 20, weeks 21 to 24), country, stratification factor (MHDs at baseline: ≤ 14 or > 14) and treatment as factors, baseline score as a continuous covariate, treatment-by-month interaction, baseline score-by-month interaction, and stratum-by-month interaction | Not specified |
Change from baseline in: HIT-6 EQ-5D VAS MSQ subscores WPAI subscores | MMRM | Fixed effects: visit, country, stratification factor (MHDs at baseline: ≤ 14 or > 14) and treatment as factors Baseline HIT-6 total score, EQ-5D VAS score, MSQ subscores, or WPAI subscores as a continuous covariate (HIT-6, EQ-5D, MSQ and WPAI outcomes only), baseline score-by-visit interaction, treatment-by-visit interaction, and stratum-by-visit interaction | HIT-6: pattern-mixture model, in which missing HIT-6 scores were imputed using a sequential regression-based multiple-imputation method, based on the imputation models established from the placebo group |
PROMISE-1 | |||
Change from baseline in MMDs | ANCOVA |
|
|
Patients with ≥ 50% reduction in MMDs Patients with ≥ 75% reduction in MMDs | CMH and/or extended CMH tests | Stratified by the randomization stratification factor | Not specified |
PROMISE-2 | |||
Change from baseline in MMD | ANCOVA | Treatment and variables measuring the stratification factors concepts, baseline migraine days (continuous covariate), and prophylactic medication use (binary covariate: use vs. no use) were the independent variables |
|
Patients with ≥ 50% reduction in MMDs Patients with ≥ 75% reduction in MMDs | CMH test controlling for the randomization stratification factors baseline migraine days (< 17 days or ≥ 17 days) and prophylactic med use (yes or no) | Controlling for the randomization stratification factors baseline migraine days (< 17 days or ≥ 17 days) and prophylactic med use (yes or no) | Not specified |
AE = adverse event; ANCOVA = analysis of covariance; CMH = Cochran-Mantel-Haenszel; eDiary = electronic diary; HIT-6 = Headache Impact Test 6-item; MHD = monthly headache day; MMD = monthly migraine day; MMRM = mixed model for repeated measures; MSQ = Migraine-Specific Quality of Life questionnaire; VAS = visual analogue scale; WPAI = Workplace Productivity and Activity Impairment.
Sources: Clinical Study Report for DELIVER,5 PROMISE-1,6 and PROMISE-2 trials.7
Analysis Populations
The all-patients-randomized set in the DELIVER trial5 included all patients randomized into the study while the all-patients-treated set included all patients who received at least 1 infusion of the study drug. The full analysis set included all patients in the all-patients-treated set who had a valid baseline assessment and at least 1 valid postbaseline 4-week assessment of MMDs in weeks 1 to 12.
In the PROMISE-16 and PROMISE-2 trials,7 the full analysis population comprised all randomized patients who received the study drug or placebo. Patients were summarized within the treatment group to which they were randomly assigned. This population was used for efficacy analysis. The safety population included all patients who received the study drug or placebo. Patients were summarized within the treatment group for which they actually received treatment. If a patient was treated with 2 different doses, they were summarized in the treatment arm of the highest dose received. This population was used for the safety analyses.
Results
Patient Disposition
Study discontinuations were lower in the DELIVER trial5 (eptinezumab 100 mg: 4%; eptinezumab 300 mg: 3%; and placebo: 2%) than in the PROMISE-1 trial6 (22%, 24%, and 26%, respectively) and the PROMISE-2 trial7 (9%, 8%, and 11%, respectively). The most common reasons for study withdrawal in the DELIVER trial were AEs and withdrawn consent (Table 11). The most common reasons for study withdrawal in the PROMISE-1 and PROMISE-2 trials were lost to follow-up and (in the PROMISE-1 trial only) and study burden (Table 12).
Table 11: Patient Disposition (DELIVER Trial)
Disposition | EPT100 | EPT300 | Placebo |
|---|---|---|---|
Screened, N | 1,369 | ||
Randomized | 299 | 294 | 299 |
Randomized and received > 1 dose of study drug | 299 | 294 | 298 |
Discontinued from study, N (%) | 11 (4) | 10 (3) | 5 (2) |
Reason for discontinuation, N (%) | |||
Adverse events | 1 (< 1) | 6 (2) | 1 (< 1) |
Lack of efficacy | 3 (1) | 0 | 1 (< 1) |
Withdrawn consent | 5 (2) | 2 (1) | 1 (< 1) |
Protocol violation | 1 (< 1) | 1 (< 1) | 0 |
Lost to follow-up | 1 (< 1) | 0 | 0 |
Other | 0 | 1 (< 1) | 2 (1) |
Full analysis set | 299 | 293 | 298 |
All-patients-randomized set | 299 | 294 | 299 |
All-patients-treated set | 299 | 294 | 298 |
EPT100 = eptinezumab 100 mg every 12 weeks; EPT300 = eptinezumab 300 mg every 12 weeks.
Source: Clinical Study Report for DELIVER trial.5
Table 12: Patient Disposition (PROMISE-1 and PROMISE-2 Trials)
Disposition | PROMISE-1 | PROMISE-2 | ||||
|---|---|---|---|---|---|---|
EPT100 | EPT300 | Placebo | EPT100 | EPT300 | Placebo | |
Screened, N | 2,413 | 2,263 | ||||
Randomized | 225 | 224 | 225 | 372 | 374 | 375 |
Randomized and treated | 222 | 222 | 222 | 356 | 350 | 366 |
Discontinued from study, N (%) | 49 (22) | 53 (24) | 57 (26) | 32 (9) | 28 (8) | 41 (11) |
Reason for discontinuation, N (%) | ||||||
Adverse event | 3 (1) | 3 (1) | 1 (< 1) | 0 | 4 (1) | 1 (< 1) |
Study burden | |||||| (7) | |||||| (5) | |||||| (10) | 4 (1) | 3 (< 1) | 3 (< 1) |
Lack of efficacy | |||||| (1) | |||||| (< 1) | |||||| (4) | 5 (1) | 6 (2) | 10 (3) |
Other (withdrawal by patient) | 8 (4) | 15 (7) | 9 (4) | 11 (3) | 7 (2) | 9 (3) |
Lost to follow-up | 16 (7) | 22 (10) | 17 (8) | 9 (3) | 8 (2) | 16 (4) |
Physician decision | 1 (< 1) | 1 (< 1) | 0 | 2 (< 1) | 0 | 1 (< 1) |
Other | 3 (1) | 0 | 1 (< 1) | 1 (< 1) | 0 | 1 (< 1) |
Analysis set | ||||||
Full analysis set | 221 | 222 | 222 | 356 | 350 | 366 |
Safety | 223 | 224 | 222 | 356 | 350 | 366 |
EPT100 = eptinezumab 100 mg every 12 weeks; EPT300 = eptinezumab 300 mg every 12 weeks; NR = not reported.
Sources: Clinical Study Report for PROMISE-16 and PROMISE-2 trials.7
Exposure to Study Treatments
In the DELIVER trial,5 98% of patients in each of eptinezumab 100 mg and 300 mg groups received both infusions, and 99% of patients in the placebo group received both infusions. In the PROMISE-1 trial,6 79% of patients in the eptinezumab 100 mg group, 80% of patients in the eptinezumab 300 mg group, and 75% of patients in the placebo group received 4 doses of the study drug, while 5% in each of the eptinezumab 100 mg and 300 mg groups and 4% of patients in the placebo group received 3 doses, 8%, 9%, and 10% of patients, respectively, received 2 doses, and 8%, 6%, and 10% of patients, respectively, received 1 dose. In the PROMISE-2 trial,7 2 doses were received by 96% of patients in the eptinezumab 100 mg group, 97% of patients in the eptinezumab 300 mg group, and 93% of patients in the placebo group.
Efficacy
Only those efficacy outcomes and analyses of subgroups identified in the review protocol are reported in the following section. Appendix 3 provides detailed efficacy data.
Migraine Frequency
The change from baseline in MMDs from weeks 1 to 12 was the primary outcome of all 3 included studies.
In the DELIVER trial,5 for weeks 1 to 12, MMDs were estimated to be reduced by 2.7 days among patients on eptinezumab compared to those on placebo for the 100 mg dose (95% CI, −3.4 to −2.0; P < 0.0001) and by 3.2 days for the 300 mg dose (95% CI, −3.9 to −2.5; P < 0.0001) (Table 13). For weeks 13 to 24 MMDs were estimated to be reduced by 3.0 days among patients on eptinezumab compared to those on placebo for the 100 mg dose (95% CI, −3.8 to −2.2; P < 0.0001) and by 3.7 days for the 300 mg dose (95% CI, −4.5 to −3.0; P < 0.0001). These comparisons were statistically significant based on the prespecified sequence of testing. Sensitivity analyses of the primary outcome using prorating to account for patients who withdrew during weeks 1 to 4 and weighting to account for patients with more than 14 days of eDiary reporting yielded results that were consistent with that of the primary analysis. These data are not reported in this review.
In the PROMISE-1 trial,6 for weeks 1 to 12, MMDs were estimated to be reduced by 0.7 days among patients on eptinezumab for the 100 mg dose (95% CI, −1.3 to −0.1; P = 0.0182) and by 1.1 days among those on the 300 mg dose (95% CI, −1.7 to −0.5; P < 0.0001) (Table 14). These comparisons were statistically significant based on the prespecified sequence of testing. Results of the sensitivity analyses were consistent with that of the primary analysis (data not included in this report). For weeks 13 to 24, MMDs were estimated to be reduced by 1.0 days among patients on eptinezumab on the 100 mg dose (95% CI, −1.7 to −0.2) and by 1.2 days among those on the 300 mg dose (95% CI, −2.0 to −0.4). As these comparisons fell outside of the MTP, no P values are reported here.
In the PROMISE-2 trial,7 for weeks 1 to 12, MMDs were estimated to be reduced by 2.0 days among patients on eptinezumab for the 100 mg dose (95% CI, −2.9 to −1.2; P = 0.0182) and by 2.6 days for the 300 mg dose (95% CI, −3.5 to −1.7; P < 0.0001) (Table 14). These comparisons were statistically significant based on the prespecified sequence of testing. For weeks 13 to 24 MMDs were estimated to be reduced by 2.0 days among patients on eptinezumab for the 100 mg dose (95% CI, −2.9 to −1.0) and by 2.7 days for the 300 mg dose (95% CI, −3.6 to −1.7). As these comparisons fell outside of the MTP, no P values are reported here. Results of the sensitivity analysis were consistent with that of the primary analysis.
Data for prespecified subgroup analyses of the primary outcome in the DELIVER,5 PROMISE-1,6 and PROMISE-2 trials7 are presented in Table 34 and Table 35 in Appendix 3. No formal analyses were performed for the PROMISE-1 and PROMISE-2 trials. In the DELIVER trial, analyses were conducted with no control for multiplicity. ||||||||||||||||||||||||||||||||||||||||||||||||||||||||||||||||||||||||||||||||||||||||||||||||||||||||||||||||||||||||||||||||||||||||||||||||||||||||||||||||||||||||||||||||||||
Reduction of 50% in MMDs
In the DELIVER trial,5 the proportions of patients achieving a 50% or greater reduction in MMDs at weeks 1 to 12 were 42% in the eptinezumab 100 mg group, 50% in the eptinezumab 300 mg group, and 13% with placebo, with ORs9 of 4.91 (95% CI, 3.29 to 7.47; P < 0.0001) in the eptinezumab 100 mg group and 6.58 (95% CI, 4.41 to 10.01; P < 0.0001) in the eptinezumab 300 mg group (Table 13). These comparisons were statistically significant based on the prespecified sequence of testing.
The proportion of patients achieving a 50% or greater reduction in MMDs at weeks 1 to 12 was also reported in the PROMISE-1 trial,6 with mean differences in proportions of 12.4% (95% CI, 3.2 to 21.5) between eptinezumab 100 mg and placebo and 18.9% (95% CI, 9.8 to 28.0; P = 0.0001) between eptinezumab 300 mg and placebo (Table 14). The comparison between eptinezumab 300 mg and placebo was statistically significant based on the prespecified sequence of testing; however, the P value for the comparison between eptinezumab 100 mg and placebo will not be reported here due to early failure of the hierarchy.
The proportion of patients achieving a 50% or greater reduction in MMDs at weeks 1 to 12 was also reported in the PROMISE 2 trial,7 with differences in proportions of 18.2% (95% CI, 11.1 to 25.4; P < 0.0001) between eptinezumab 100 mg and placebo and 22.1% (95% CI, 14.9 to 29.2; P < 0.0001) between eptinezumab 300 mg and placebo (Table 14). These comparisons were statistically significant based on the prespecified sequence of testing.
Reduction of 75% in MMDs
In the DELIVER trial,5 the proportions of patients achieving a 75% or greater reduction in MMDs at weeks 1 to 12 were 16% in the eptinezumab 100 mg group, 19% in the eptinezumab 300 mg group, and 2% with placebo, for ORs of 9.19 (95% CI, 4.16 to 24.35; P < 0.0001) in the eptinezumab 100 mg group and 11.43 (95% CI, 5.22 to 30.15; P < 0.0001) in the eptinezumab 300 mg group (Table 13). These comparisons were statistically significant based on the prespecified sequence of testing.
The proportion of patients achieving a 75% or greater reduction in MMDs weeks 1 to 4 was also reported in the PROMISE-1 trial,6 with differences in proportions of 10.5% (95% CI, 2.4 to 18.6, P = 0.0112) between eptinezumab 100 mg and placebo and 11.3% (95% CI, 3.2 to 19.3, P = 0.0066) between eptinezumab 300 mg and placebo, both in favour of eptinezumab (Table 14). From weeks 1 to 12 in the PROMISE-1 trial, the differences in proportions were 6.0% (95% CI, −1.4 to 13.3; P = 0.1126) between eptinezumab 100 mg and placebo and 13.5% (95% CI, 5.8 to 21.2; P = 0.0007) between eptinezumab 300 mg and placebo. The comparison between eptinezumab 300 mg and placebo was statistically significant based on the prespecified sequence of testing; however, the comparison between eptinezumab 100 mg and placebo was not statistically significant, and this is where the hierarchy failed in the PROMISE-1 trial.
The proportion of patients achieving a 75% or greater reduction in MMDs at weeks 1 to 4, was also reported in the PROMISE-2 trial,7 with differences in proportions of 15.3% (95% CI, 9.3 to 21.4) between eptinezumab 100 mg and placebo and 21.3% (95% CI, 15.0 to 27.6; P < 0.0001) between eptinezumab 300 mg and placebo. These comparisons were statistically significant based on the prespecified sequence of testing. From weeks 1 to 12, the differences in proportions were 11.7% (95% CI, 5.8 to 17.5; P < 0.0001) between eptinezumab 100 mg and placebo and 18.1% (95% CI, 12.0 to 24.3; P < 0.0001) between eptinezumab 300 mg and placebo. These comparisons were statistically significant based on the prespecified sequence of testing.
Reduction of 100% in MMDs
In the DELIVER trial,5 the proportions of patients achieving a 100% or greater reduction in MMDs (100% responders) for weeks 1 to 12 for eptinezumab 100 mg versus eptinezumab 300 mg versus placebo were 5.9% versus 7.7% versus 1.1%, respectively (Table 13).
In the PROMISE-1 trial,6 the 100% response rates for weeks 1 to 4 for eptinezumab 100 mg, eptinezumab 300 mg, and placebo were 9% versus 15% versus 6%, respectively, and in the PROMISE-2 trial7 the 100% response rates were 8% versus 13% versus 3%, respectively. For weeks 9 to 12 for eptinezumab 100 mg, eptinezumab 300 mg, and placebo, the 100% responses rates were 13%, 16%, and 10%, respectively, in the PROMISE-1 trial, and 11%, 17%, and 6%, respectively, in the PROMISE-2 trial (Table 14).
Patients With Migraine the First Day After Dosing
The proportion of patients who had a migraine the first day after dosing was a secondary outcome in the DELIVER trial.5 From a baseline of |||||| of patients with migraine, 27.2% of patients in the eptinezumab 100 mg group had a migraine the day after dosing, while from a baseline of ||||||, 24.4% of patients in the eptinezumab 300 mg group had a migraine the day after dosing, and in placebo, from a baseline of ||||||, 43.7% had a migraine the first day after dosing.
The proportion of patients with a migraine the first day after dosing was a key secondary outcome of the PROMISE-16 and PROMISE-2 trials.7 In the PROMISE-1 trial, from a baseline of 31.0% with migraine, 14.8% of patients in the eptinezumab 100 mg group had a migraine the day after dosing, and from a baseline of 30.8% with migraine, 13.9% of patients in the eptinezumab 300 mg group had a migraine the day after dosing, and in placebo, from a baseline of 29.8% with migraine, 22.5% had a migraine the day after dosing. The P values reported by the sponsor were tested after failure of the statistical hierarchy and are not reported here. In the PROMISE-2 trial, from a baseline of 57.5% of patients with migraine, 28.6% of patients in the eptinezumab 100 mg group had a migraine the day after dosing; from a baseline of 57.4% with migraine, 27.8% of patients in the eptinezumab 300 mg group had migraine the day after dosing; and with placebo, from a baseline of 58.0% with migraine, 42.3% had a migraine the day after dosing. When compared to placebo, the differences between eptinezumab 100 mg and placebo (P < 0.0001) and eptinezumab 300 mg and placebo (P < 0.0001) were statistically significant based on the prespecified sequence of testing.
Headache Frequency
In the DELIVER trial,5 the MHD mean changes from baseline to weeks 1 to 12 were |||||||||||| from a baseline of 14.5 (SD = 5.6) for eptinezumab 100 mg, |||||||||||| from a baseline mean of 14.4 (SD = 5.5), and |||||||||||| from a baseline mean of 14.5 (SD = 5.8) for placebo (Table 13). Because change from baseline in MHDs was not part of the MTP, no P values were reported.
In the PROMISE-1 trial,6 the differences in the mean change from baseline to weeks 1 to 12 in MHDs versus placebo were |||||||||||||||||||||||||||||| from a baseline mean of 10.0 (SD = 3.0) for eptinezumab 100 mg, and |||||||||||||||||||||||||||||||||||| from a baseline mean of 10.1 (SD = 3.1) for eptinezumab 300 mg (Table 14). Because change from baseline in MHDs was not part of the MTP, no P values were reported.
In the PROMISE-2 trial,7 the differences in the mean change from baseline to weeks 1 to 12 in MHDs versus placebo were −1.7 (95% CI, −2.6 to −0.9) from a baseline mean of 20.4 (SD = 3.1) for eptinezumab 100 mg and −2.3 (95% CI, −3.2 to −1.4) from a baseline mean of 20.4 (SD = 3.2) for eptinezumab 300 mg (Table 14). Because change from baseline in MHDs was not part of the MTP, no P values were reported.
Acute Medication Use
In the DELIVER trial,5 for weeks 1 to 12, monthly days using migraine medications were estimated to be reduced by 2.5 days from a mean baseline of ||||||||||||||||||||||||||||||) among patients on eptinezumab compared to those on placebo for the 100 mg dose (95% CI, −3.2 to −1.9) and by 3.0 days (from a mean baseline of |||||||||||| days) for the 300 mg dose (95% CI, −3.6 to −2.4) (Table 13). In the DELIVER trial, for weeks 13 to 24, monthly days using migraine medications were estimated to be reduced by 2.9 days among patients on eptinezumab compared to those on placebo for the 100 mg dose (95% CI, −3.6 to −2.2) and by 3.5 days for the 300 mg dose (95% CI, −4.2 to −2.8). As these comparisons were not part of the MTP, no P values are reported here.
In the PROMISE-1 trial,6 for weeks 1 to 12, monthly days using migraine medications were estimated to be reduced by 0.5 days placebo from a mean baseline of 1.5 (SD = 2.6 days) among patients on eptinezumab compared to those on the 100 mg dose (95% CI, −0.7 to −0.3) and by 0.4 days from a mean baseline of 1.6 (SD = 2.7 days) for the 300 mg dose (95% CI, −0.6 to −0.2) (Table 14). As this outcome was not part of the MTP, no P values are reported here. In the PROMISE-2 trial,7 for weeks 1 to 12, monthly days using migraine medications were estimated to be reduced by 1.2 days from a mean baseline of 6.6 (SD = 6.9 days) among patients on eptinezumab compared to those on placebo for the 100 mg dose (95% CI, −1.7 to −0.7) and by 1.4 days from a mean baseline of 6.7 (SD = 6.5 days) for the 300 mg dose (95% CI, −1.9 to −0.9; P < 0.0001) (Table 14). No P values were reported for the 100 mg dose in the PROMISE-2 trial because testing was not part of the MTP.
Other Patient-Reported Outcomes
PGIC scores were reported in the DELIVER trial,5 and the differences at week 24 versus placebo were ||||||||||||||||||||||||||) in the eptinezumab 100 mg group and |||||||||||||||||||||||| in the eptinezumab 300 mg group. As PGIC was not part of the MTP, no P values are reported here. Improvement in PGIC scores was reported as a binary outcome in the PROMISE-2 trial,7 with the percentages of patients who were “very much improved” in the eptinezumab 100 mg versus eptinezumab 300 mg versus placebo groups reported as ||||||||||||||||||||||||, respectively and the percentages of patients who were “much improved” reported as ||||||||||||||||||, respectively. This outcome was not assessed in the PROMISE-1 trial.
Health-Related Quality of Life
In the DELIVER trial,5 the changes from baseline to week 24 in EQ-5D-5L VAS scores were estimated to be improved by 4.7 points from a baseline mean of 75.9 (SD = ||||||) among patients on eptinezumab compared to those on placebo for the 100 mg dose (95% CI, 1.8 to 7.7) and by 8.0 points from a baseline mean of 74.5 (SD = ||||||) for the 300 mg dose (95% CI, 5.1 to 10.8) (Table 13).
In the DELIVER trial,4 for the MSQ, the changes from baseline to week 24 in the role function restrictive domain were estimated to be improved by 15.1 points from a baseline mean of 35.7 (SD = ||||||) among patients on eptinezumab compared to those on placebo for the 100 mg dose (95% CI, 11.7 to 18.5) and by 15.0 points from a baseline mean of 35.7 (SD = ||||||) for the 300 mg dose (95% CI, 11.6, 18.4). For the MSQ role function preventive domain, the mean changes from baseline to week 24 were estimated to be improved by 12.6 points from a mean baseline of 50.2 (SD = ||||||) among patients on eptinezumab compared to those on placebo for the 100 mg dose (95% CI, 9.4 to 15.8) and by 13.2 points from a mean baseline of 51.0 (SD = ||||||) for the 300 mg dose (95% CI, 10.1, 16.4). For MSQ emotional function domain, the changes from baseline to week 24 were estimated to be improved by 14.1 points from a mean baseline of 50.3 (SD = ||||||) among patients on eptinezumab compared to those on placebo for the 100 mg dose (95% CI, 10.5 to 17.7) and by 14.1 points from a mean baseline of 48.6 (SD = ||||||) for the 300 mg dose (95% CI, 10.6 to 17.7) (Table 13).
In the PROMISE-1 trial,6 the mean changes from baseline to week 24 in the EQ-5D-5L VAS were |||||||||||| for eptinezumab 100 mg, |||||||||||||||||| for eptinezumab 300 mg, and |||||||||||| for placebo (Table 14). In the PROMISE-2 trial,7 the mean changes from baseline to week 32 in the EQ-5D-5L VAS were |||||||||||| for eptinezumab 100 mg, |||||||||||| for eptinezumab 300 mg, and |||||||||||| for placebo (Table 14). Values above zero indicate improvement on this scale.
Symptoms
In the DELIVER trial,5 the mean changes from baseline to week 12 in the HIT-6 score were estimated to be decreased (improved) by −3.8 points from a mean baseline of 66.6 (SD = 4.7) among patients on eptinezumab compared to those on placebo for the 100 mg dose (95% CI, −5.0 to −2.5; P < 0.0001) and by −5.4 points from a mean baseline of 66.5 (SD = 4.4) for the 300 mg dose (95% CI, −6.7 to −4.2; P < 0.0001) (Table 13).
In the DELIVER trial,4 MBS scores were also reported under symptoms, and the mean scores at week 24 were estimated to be decreased (improved) by |||||||||||||||||||||||||||||| among patients on eptinezumab compared to those on placebo for eptinezumab 100 mg and by |||||||||||||||||||||||||||||| for eptinezumab 300 mg (Table 13).
In the PROMISE-2 trial,7 the mean changes from baseline to week 12 in the HIT-6 score were estimated to be decreased (improved) by −1.7 points from a mean baseline of 65.0 (SD = 4.9) among patients on eptinezumab compared to those on placebo for the 100 mg dose (95% CI, −2.8 to −0.7; P < 0.0001) and by −2.9 points from a mean baseline of 65.1 (SD = 5.0) for the 300 mg dose (95% CI, −3.9 to −1.8; P < 0.0001) (Table 14).
In the PROMISE-2 trial,7 MBS scores were reported as “very much improved” in the eptinezumab 100 mg, eptinezumab 300 mg, and placebo groups by ||||||||||||||||||, respectively, while ||||||||||||||||||, respectively, reported scores as “much improved” (Table 14). The HIT-6 and the MBS were not assessed in the PROMISE-1 trial.
Health Care Resource Utilization
In the DELIVER trial,5 for HCRU, the percentages of patients with no visit to a family physician were ||||||||||||||||||||||||% in the eptinezumab 100 mg, eptinezumab 300 mg, and placebo groups, respectively, with ||||||||||||||||||||||| reporting no visit to a specialist and ||||||||||||||||||||||||||||||, reporting no emergency department visits due to migraine, respectively. There were few hospitalizations due to migraine (|||||| of patients in each group) and similar numbers were seen for overnight hospital stays due to migraine (Table 13).
Work Days Lost
In the DELIVER trial,5 the mean changes from baseline to week 24 in absenteeism score on the WPAI instrument were estimated to be decreased (improved) by −4.5 points from a mean baseline of 11.4 (SD = 19.4) among patients on eptinezumab compared to those on placebo for the 100 mg dose (95% CI, −7.8 to −1.1) and by −4.7 points from a mean baseline of 12.0 (SD = 19.3) for the 300 mg dose (95% CI, −8.0 to −1.5) (Table 13). Outcomes related to the loss of work days were not assessed in the PROMISE-1 and PROMISE-2 trials.
Table 13: Efficacy Results (DELIVER Trial, Full Analysis Set)
Outcome | EPT100 N = 299 | EPT300 N = 293 | Placebo N = 298 |
|---|---|---|---|
Change from baseline in MMDs | |||
Mean (SD) baseline MMDs | 13.8 (NR) | 13.7 (NR) | 13.9 (NR) |
Mean (SE) CFB in MMDs (weeks 1 to 12) | −4.8 (0.37) N = 299 | −5.3 (0.37) N = 293 | −2.1 (0.38) N = 298 |
Difference vs. placebo (95% CI) | −2.7 (−3.4 to −2.0) | −3.2 (−3.9 to −2.5) | NA |
P valuea | < 0.0001 | < 0.0001 | NA |
Mean (SE) CFB in MMDs (weeks 13 to 24) | −5.4 (0.39) N = 287 | −6.1 (0.39) N = 286 | −2.4 (0.39) N = 295 |
Difference vs. placebo (95% CI) | −3.0 (−3.8 to −2.2) | −3.7 (−4.5 to −3.0) | NA |
P valuea | < 0.0001 | < 0.0001 | NA |
≥ 50% reduction from baseline in MMDs (weeks 1 to 12) | 126 of 299 (42) | 145 of 293 (50) | 39 of 298 (13) |
Odds ratio (95% CI) | 4.91 (3.29 to 7.47) | 6.58 (4.41 to 10.01) | NA |
P valueb | < 0.0001 | < 0.0001 | NA |
≥ 75% reduction from baseline in MMDs (weeks 1 to 12) | 47 of 299 (16) | 55 of 293 (19) | 6 of 298 (2) |
Odds ratio (95% CI) | 9.19 (4.16 to 24.35) | 11.43 (5.22 to 30.15) | NA |
P valueb | < 0.0001 | < 0.0001 | NA |
Patients with 100% reduction in MMDs, weeks 1 to 12 | 5.9% N = 299 | 7.7% N = 293 | 1.1% N = 298 |
P value | < 0.0001f | < 0.0001f | NA |
Patients with 100% reduction in MMDs, weeks 13 to 24 | |||||||||||||||||| | |||||||||||||||||| | |||||||||||||||||| |
P valueb | < 0.0001 f | < 0.0001f | NA |
Patients with migraine on the day after first dosing, % | |||
Baseline | |||||||||||||||||| | |||||||||||||||||| | |||||||||||||||||| |
Infusion visit 2 plus 1 day | 27.2% N = 299 | 24.4% N = 293 | 43.7% N = 298 |
P valuec | < 0.0001f | < 0.0001f | NA |
MHDs | |||
Mean (SD) baseline MHDs | 14.51 (5.63) | 14.38 (5.45) | 14.53 (5.79) |
Mean (SE) CFB, weeks 1 to 12 | −4.6 (0.37) N = 299 | −5.1 (0.37) N = 293 | −2.1 (0.38) N = 298 |
Mean (SE) CFB, weeks 13 to 24 | −5.6 (0.39) N = 287 | −6.2 (0.39) N = 286 | |||||||||||||||||| N = 295 |
Acute medication use | |||
Mean (SD) baseline monthly days using migraine meds | |||||||||||||||||| | |||||||||||||||||| | |||||||||||||||||| |
Mean (SE) CFB weeks 1 to 12 | −4.1 (0.33) N = 298 | −4.6 (0.34) N = 290 | −1.6 (0.34) N = 298 |
Difference vs. placebo (95% CI) | −2.5 (−3.2 to −1.9) | −3.0 (−3.6 to −2.4) | NA |
P valued | < 0.0001f | < 0.0001f | NA |
Mean (SE) CFB weeks 13 to 24 | −4.6 (0.36) N = 287 | −5.2 (0.36) N = 285 | −1.7 (0.36) N = 294 |
Difference vs. placebo (95% CI) | −2.9 (−3.6 to −2.2) | −3.5 (−4.2 to −2.8) | NA |
P valued | < 0.0001f | < 0.0001f | NA |
Other patient-reported outcomes | |||
PGIC scores, week 24, mean (SE) | |||||||||||||||||| | |||||||||||||||||| | |||||||||||||||||| |
Difference vs. placebo (95% CI) | |||||||||||||||||| | |||||||||||||||||| | NA |
P valuee | |||||||||||||||||| | |||||||||||||||||| | NA |
Health-related quality of life | |||
Mean (SD) baseline EQ-5D-5L VAS score | 75.9 (19.0) N = 276 | 74.5 (20.7) N = 285 | 74.0 (20.4) N = 287 |
Mean (SE) CFB in EQ-5D-5L VAS score, week 24 | 2.0 (1.40) N = 258 | 5.2 (1.37) N = 273 | −2.8 (1.38) N = 276 |
Difference vs. placebo (95% CI) | 4.7 (1.8, 7.7) | 8.0 (5.1, 10.8) | NA |
P valuee | 0.0014f | < 0.0001f | NA |
MSQ, role function restrictive, mean (SD) baseline | 35.7 (17.3) N = 276 | 35.7 (16.7) N = 287 | 35.1 (17.1) N = 288 |
MSQ, role function restrictive, mean (SE) CFB to week 24 | 30.1 (1.78) N = 259 | 30.0 (1.73) N = 275 | 15.0 (1.76) N = 278 |
Difference vs. placebo (95% CI) | 15.1 (11.7, 18.5) | 15.0 (11.6, 18.4) | NA |
P valuee | < 0.0001f | < 0.0001f | NA |
MSQ, role function preventive, mean (SD) baseline | 50.2 (21.4) N = 276 | 51.0 (21.5) N = 287 | 50.5 (22.1) N = 288 |
MSQ, role function preventive, mean (SE) CFB to week 24 | 25.7 (1.65) N = 259 | 26.3 (1.61) N = 275 | 13.1 (1.63) N = 278 |
Difference vs. placebo (95% CI) | 12.6 (9.4 to 15.8) | 13.2 (10.1 to 16.4) | NA |
P valuee | < 0.0001f | < 0.0001f | NA |
MSQ, emotional function, mean (SD) baseline | 50.3 (24.7) N = 276 | 48.6 (23.8) N = 287 | 48.4 (26.6) N = 288 |
MSQ, emotional function, mean (SE) CFB to week 24 | 24.1 (1.86) N = 259 | 24.1 (1.81) N = 275 | 9.9 (1.84) N = 278 |
Difference vs. placebo (95% CI) | 14.1 (10.5 to 17.7) | 14.1 (10.6 to 17.7) | NA |
P valuee | < 0.0001f | < 0.0001f | NA |
Symptoms | |||
Mean (SD) baseline HIT−6 scores | 66.6 (4.7) N = 281 | 66.5 (4.4) N = 287 | 66.2 (4.4) N = 288 |
Mean (SD) change from baseline to week 12 in the HIT−6 score | −6.9 (0.61) N = 277 | −8.5 (0.60) N = 283 | −3.1 (0.61) N = 288 |
Difference vs. placebo (95% CI) | −3.8 (−5.0 to −2.5) | −5.4 (−6.7 to −4.2) | NA |
P valuee | < 0.0001 | < 0.0001 | NA |
MBS scores, mean (SE) at week 24 | |||||||||||||||||| | |||||||||||||||||| | |||||||||||||||||| |
Difference vs. placebo (95% CI) | |||||||||||||||||| | |||||||||||||||||| | NA |
P valuee | |||||||||||||||||| | |||||||||||||||||| | NA |
Health care resource utilization during study | |||
Visits to a family practitioner, number of patients, n (%) week 24 | |||
0 | |||||||||||||||||| | |||||||||||||||||| | |||||||||||||||||| |
1 | |||||||||||||||||| | |||||||||||||||||| | |||||||||||||||||| |
2 | |||||||||||||||||| | |||||||||||||||||| | |||||||||||||||||| |
3 | |||||||||||||||||| | |||||||||||||||||| | |||||||||||||||||| |
4 | |||||||||||||||||| | |||||||||||||||||| | |||||||||||||||||| |
5 | |||||||||||||||||| | |||||||||||||||||| | |||||||||||||||||| |
Visits to a specialist, n (%) week 24 | |||
0 | |||||||||||||||||| | |||||||||||||||||| | |||||||||||||||||| |
1 | |||||||||||||||||| | |||||||||||||||||| | |||||||||||||||||| |
2 | |||||||||||||||||| | |||||||||||||||||| | |||||||||||||||||| |
3 | |||||||||||||||||| | |||||||||||||||||| | |||||||||||||||||| |
4 | |||||||||||||||||| | |||||||||||||||||| | |||||||||||||||||| |
5 | |||||||||||||||||| | |||||||||||||||||| | |||||||||||||||||| |
Emergency department visits due to migraine, n (%) | |||
0 | |||||||||||||||||| | |||||||||||||||||| | |||||||||||||||||| |
1 | |||||||||||||||||| | |||||||||||||||||| | |||||||||||||||||| |
3 | |||||||||||||||||| | |||||||||||||||||| | |||||||||||||||||| |
4 | |||||||||||||||||| | |||||||||||||||||| | |||||||||||||||||| |
5 | |||||||||||||||||| | |||||||||||||||||| | |||||||||||||||||| |
Hospital admissions due to migraine, n (%) | |||
0 | |||||||||||||||||| | |||||||||||||||||| | |||||||||||||||||| |
1 | |||||||||||||||||| | |||||||||||||||||| | |||||||||||||||||| |
5 | |||||||||||||||||| | |||||||||||||||||| | |||||||||||||||||| |
Overnight hospital stays due to migraine, n (%) | |||
0 | |||||||||||||||||| | |||||||||||||||||| | |||||||||||||||||| |
1 | |||||||||||||||||| | |||||||||||||||||| | |||||||||||||||||| |
5 | |||||||||||||||||| | |||||||||||||||||| | |||||||||||||||||| |
6 | |||||||||||||||||| | |||||||||||||||||| | |||||||||||||||||| |
Work days lost | |||
WPAI, absenteeism score, mean (SD) baseline | 11.41 (19.40) | 11.95 (19.31) | 12.85 (20.07) |
CFB to week 24 | −6.01 (23.69) N = 151 | −6.50 (20.17) N = 168 | −1.52 (22.08) N = 180 |
Difference vs. placebo (95% CI) | −4.5 (−7.8 to −1.1) | −4.7 (−8.0 to −1.5) | NA |
P valuee | 0.0092f | 0.0046f | NA |
CFB = change from baseline; CI = confidence interval; EPT100 = eptinezumab 100 mg every 12 weeks; EPT300 = eptinezumab 300 mg every 12 weeks; EQ-5D-5L = 5-Level EQ-5D questionnaire; HIT-6 = Headache Impact Test 6-item; MSQ = Migraine-Specific Quality of Life questionnaire; MBS = most bothersome symptom; MHD = monthly headache day; MMD = monthly migraine day; MMRM = mixed model for repeated measures; NA = not applicable; NR = not reported; PGIC = Patient Global Impression of Change; SD = standard deviation; SE = standard error; VAS = visual analogue scale; WPAI = Workplace Productivity and Activity Impairment.
aThe estimated means, mean differences from placebo, and 95% CIs are from an MMRM with month (weeks 1 to 4, weeks 5 to 8, weeks 9 to 12, weeks 13 to 16, weeks 17 to 20, and weeks 21 to 24), country, stratification factor (MHDs at baseline: ≤ 14 vs. > 14) and treatment as factors, baseline score as a continuous covariate, treatment-by-month interaction, baseline score-by-month interaction, and stratum-by-month interaction.
bThe comparison is based on logistic regression model including baseline MMDs as a continuous covariate, and treatment and stratification (MHDs at baseline ≤ 14 vs. > 14) as factors.
cP values are computed separately for each active treatment group using an extended CMH test, adjusting for the stratification factor (MHDs at baseline ≤ 14 vs. > 14).
dEstimated means, mean differences from placebo, and 95% confidence intervals are from an MMRM with month (weeks 1 to 4, weeks 5 to 8, weeks 9 to 12, weeks 13 to 16, weeks 17 to 20, and weeks 21 to 24), country, stratification factor (MHDs at baseline: ≤ 14 vs. > 14) and treatment as factors, baseline score as a continuous covariate, treatment-by-month interaction, baseline score-by-month interaction, and stratum-by-month interaction.
eMMRM includes the following fixed effects: visit, country, stratification factor (MHDs at baseline: ≤ 14 vs. > 14) and treatment as factors; baseline HIT-6 total score, EQ-5D VAS score, MSQ subscores, and WPAI subscores as a continuous covariate (HIT-6, EQ-5D, MSQ, and WPAI outcomes only); baseline score-by-visit interaction, treatment-by-visit interaction, and stratum-by-visit interaction.
fThese P values have not been adjusted for multiplicity.
Source: Clinical Study Report for DELIVER trial.5
Table 14: Efficacy Results (PROMISE-1 and PROMISE-2 Trials, Full Analysis Set)
Outcome | PROMISE-1 | PROMISE-2 | ||||
|---|---|---|---|---|---|---|
EPT100 N = 221 | EPT300 N = 222 | Placebo N = 222 | EPT100 N = 356 | EPT300 N = 350 | Placebo N = 366 | |
Change from baseline in MMDs | ||||||
Mean (SD) baseline MMDs | 8.7 (2.85) | 8.6 (2.87) | 8.4 (2.68) | 14.5 (4.3) | 14.9 (4.5) | 15.1 (4.4) |
Mean (SE) CFB in MMDs (weeks 1 to 12) | −3.9 (NR) N = 221 | −4.3 (NR) N = 222 | −3.2 (NR) N = 222 | −7.7 (NR) N = 356 | −8.2 (NR) N = 350 | −5.6 (NR) N = 366 |
Difference vs. placebo (95% CI) | −0.69 (−1.25 to −0.12) | −1.11 (−1.68 to −0.54) | NA | −2.03 (−2.88 to −1.18) | −2.60 (−3.45 to −1.74) | NA |
P valuea | 0.0182 | 0.0001 | NA | < 0.0001 | < 0.0001 | NA |
Mean (SE) CFB in MMDs (weeks 13 to 24) | −4.6 (3.50) N = 221 | −4.8 (3.99) N = 222 | −3.6 (4.28) N = 222 | −8.2 (NR) | −8.8 (NR) | −6.2 (NR) |
Difference vs. placebo (95% CI) | −1.0 (−1.68 to −0.22) | −1.2 (−1.95 to −0.41) | NA | −1.98 (−2.94 to −1.01) | −2.65 (−3.62 to −1.68) | NA |
≥ 50% reduction from baseline in MMDs (weeks 1 to 12), n (%) | 110 of 221 (50) | 125 of 222 (56) | 83 of 222 (37) | 205 (58) | 215 (61) | 144 (39) |
Difference vs. placebo (95% CI) | 12.4 (3.2 to 21.5) | 18.9 (9.8 to 28.0) | NA | 18.2 (11.1 to 25.4) | 22.1 (14.9 to 29.2) | NA |
P valueb | 0.0085 g | 0.0001 | NA | < 0.0001 | < 0.0001 | NA |
Odds ratio (95% CI) | 1.66 (1.14 to 2.43) | 2.16 (1.48 to 3.16) | NA | 2.10 (1.56 to 2.82) | 2.45 (1.81 to 3.30) | NA |
≥ 75% reduction from baseline in MMDs (weeks 1 to 4), n (%) | 68 of 221 (31) | 70 of 222 (32) | 45 of 222 (20) | 110 of 356 (31) | 129 of 350 (37) | 57 of 366 (16) |
Difference vs. placebo (95% CI) | 10.5 (2.4 to 18.6) | 11.3 (3.2 to 19.3) | NA | 15.3 (9.3 to 21.4) | 21.3 (15.0 to 27.6) | NA |
P valueb | 0.0112 | 0.0066 | NA | < 0.0001 | < 0.0001 | NA |
Odds ratio (95% CI) | 1.75 (1.13 to 2.71) | 1.82 (1.18 to 2.80) | NA | 2.45 (1.71 to 3.51) | 3.21 (2.24 to 4.58) | NA |
≥ 75% reduction from baseline in MMDs (weeks 1 to 12) n (%) | 49 of 221 (22) | 66 of 222 (30) | 36 of 222 (16) | 95 of 356 (27) | 116 of 350 (33) | 55 of 366 (15) |
Difference vs. placebo (95% CI) | 6.0 (−1.4 to 13.3) | 13.5 (5.8 to 21.2) | NA | 11.7 (5.8 to 17.5) | 18.1 (12.0 to 24.3) | NA |
P valueb | 0.1126 | 0.0007 | NA | 0.0001 | < 0.0001 | NA |
Odds ratio (95% CI) | 1.47 (0.91 to 2.37) | 2.18 (1.38 to 3.44) | NA | 2.05 (1.42 to 2.97) | 2.78 (1.94 to 3.99) | NA |
100% migraine responder rates | ||||||
Weeks 1 to 4, n (%) | ||||||| (9) | ||||||| (15) | ||||||| (6) | ||||||| (8) | ||||||| (13) | ||||||| (3) |
Difference vs. placebo (95% CI) | ||||||||||||||||||||| | ||||||||||||||||||||| | NA | |||||||||||||| | |||||||||||||| | NA |
Weeks 9 to 12, n (%) | ||||||| (13) | ||||||| (16) | ||||||| (10) | ||||||| (11) | ||||||| (17) | ||||||| (6) |
Difference from placebo (95% CI) | ||||||||||||||||||||| | ||||||||||||||||||||| | NA | ||||||||||||||||||||| | ||||||||||||||||||||| | NA |
Patients with migraine the day after dosing | ||||||
Patients with a migraine at baseline, % | 31.0 | 30.8 | 29.8 | 57.5 | 57.4 | 58.0 |
Patients with migraine on day 1, % | 14.8 | 13.9 | 22.5 | 28.6 | 27.8 | 42.3 |
P valueb vs. placebo | 0.0312g | 0.0159g | NA | < 0.0001 | < 0.0001 | NA |
Change in MHDs | ||||||
Mean (SD) MHDs, baseline | 10.0 (3.02) | 10.1 (3.06) | 9.9 (2.83) | 20.4 (3.1) | 20.4 (3.2) | 20.6 (3.0) |
Mean (SD) CFB, weeks 1 to 12 | |||||||||||||||||||| | |||||||||||||||||||| | |||||||||||||||||||| | −8.2 (5.8) | −8.8 (6.1) | −6.4 (6.0) |
Mean difference vs. placebo (95% CI) | |||||||||||||||||||| | |||||||||||||||||||| | NA | −1.7 (−2.59 to −0.87) | −2.3 (−3.22 to −1.44) | NA |
75% responder, weeks 1 to 24, n (%) | |||||||||||||||||||| | |||||||||||||||||||| | |||||||||||||||||||| | |||||||||||||||||||| | |||||||||||||||||||| | |||||||||||||||||||| |
Difference from placebo (95% CI) | |||||||||||||||||||| | |||||||||||||||||||| | NA | |||||||||||||||||||| | |||||||||||||||||||| | NA |
50% responder, weeks 1 to 4, n (%) | |||||||||||||||||||| | |||||||||||||||||||| | |||||||||||||||||||| | |||||||||||||||||||| | |||||||||||||||||||| | |||||||||||||||||||| |
Difference from placebo (95% CI) | |||||||||||||||||||| | |||||||||||||||||||| | NA | |||||||||||||||||||| | |||||||||||||||||||| | NA |
50% responder, weeks 21 to 24, n (%) | |||||||||||||||||||| | |||||||||||||||||||| | |||||||||||||||||||| | |||||||||||||||||||| | |||||||||||||||||||| | |||||||||||||||||||| |
Difference from placebo (95% CI) | |||||||||||||||||||| | |||||||||||||||||||| | NA | |||||||||||||||||||| | |||||||||||||||||||| | NA |
Change in acute medication usage | ||||||
Mean (SD) baseline medication usage, days | 1.5 (2.58) | 1.6 (2.65) | 1.5 (2.46) | 6.6 (6.9) | 6.7 (6.5) | 6.2 (6.7) |
Mean (SD) change from baseline to weeks 1 to 12 | −0.9 (2.00) N = 221 | −0.8 (1.77) N = 222 | −0.4 (1.27) N = 222 | −3.3 (4.9) N = 356 | −3.5 (4.6) N = 350 | −1.9 (4.2) N = 366 |
Mean difference vs. placebo (95% CI) | −0.47 (−0.68 to −0.27) | −0.36 (−0.56 to −0.15) | NA | −1.15 (−1.66 to −0.65) | −1.38 (−1.88 to −0.87) | NA |
P valued | < 0.0001f | 0.0006f | NA | < 0.0001f | < 0.0001 | NA |
Other patient-reported outcome (PGIC) | ||||||
PGIC at week 32, n | NR | NR | NR | |||||||||||||||||||| | |||||||||||||||||||| | |||||||||||||||||||| |
Very much improved | NR | NR | NR | |||||||||||||||||||| | |||||||||||||||||||| | |||||||||||||||||||| |
Much improved | NR | NR | NR | |||||||||||||||||||| | |||||||||||||||||||| | |||||||||||||||||||| |
Minimally improved | NR | NR | NR | |||||||||||||||||||| | |||||||||||||||||||| | |||||||||||||||||||| |
No change | NR | NR | NR | |||||||||||||||||||| | |||||||||||||||||||| | |||||||||||||||||||| |
Minimally worse | NR | NR | NR | |||||||||||||||||||| | |||||||||||||||||||| | |||||||||||||||||||| |
Much worse | NR | NR | NR | |||||||||||||||||||| | |||||||||||||||||||| | |||||||||||||||||||| |
Very much worse | NR | NR | NR | |||||||||||||||||||| | |||||||||||||||||||| | |||||||||||||||||||| |
Health-related quality of life | ||||||
EQ-5D-5L VAS | ||||||
Mean (SD) baseline | |||||||||||||||||||| | |||||||||||||||||||| | |||||||||||||||||||| | |||||||||||||||||||| | |||||||||||||||||||| | |||||||||||||||||||| |
Mean (SD) CFB to week 24 (PROMISE-1) to week 32 (PROMISE-2) | |||||||||||||||||||| | |||||||||||||||||||| | |||||||||||||||||||| | |||||||||||||||||||| | |||||||||||||||||||| | |||||||||||||||||||| |
Symptoms | ||||||
HIT-6 | ||||||
HIT-6 score, mean (SD) baseline | NR | NR | NR | 65.0 (4.94) N = 356 | 65.1 (4.99) N = 350 | 64.8 (5.46) N = 366 |
CFB to weeks 9 to 12 in the HIT-6 score, estimated mean | NR | NR | NR | −6.2 | −7.3 | −4.5 |
Mean difference vs. placebo (95% CI) | NA | NA | NA | −1.73 (−2.76 to −0.70) | −2.88 (−3.91 to −1.84) | NA |
P valuee | NA | NA | NA | 0.0010 f | < 0.0001 | NA |
MBS, week 32, n | NR | NR | NR | |||||||||||||||||||| | |||||||||||||||||||| | |||||||||||||||||||| |
Very much improved | NR | NR | NR | |||||||||||||||||||| | |||||||||||||||||||| | |||||||||||||||||||| |
Much improved | NR | NR | NR | |||||||||||||||||||| | |||||||||||||||||||| | |||||||||||||||||||| |
Minimally improved | NR | NR | NR | |||||||||||||||||||| | |||||||||||||||||||| | |||||||||||||||||||| |
No change | NR | NR | NR | |||||||||||||||||||| | |||||||||||||||||||| | |||||||||||||||||||| |
Minimally worse | NR | NR | NR | |||||||||||||||||||| | |||||||||||||||||||| | |||||||||||||||||||| |
Much worse | NR | NR | NR | |||||||||||||||||||| | |||||||||||||||||||| | |||||||||||||||||||| |
Very much worse | NR | NR | NR | |||||||||||||||||||| | |||||||||||||||||||| | |||||||||||||||||||| |
ANCOVA = analysis of covariance; CFB = change from baseline; CI = confidence interval; EPT100 = eptinezumab 100 mg every 12 weeks; EPT300 = eptinezumab 300 mg every 12 weeks; EQ-5D-5L = 5-Level EQ-5D questionnaire; HIT-6 = Headache Impact Test 6-item; MBS = most bothersome symptom; MHD = monthly headache day; MMD = monthly migraine day; NA = not applicable; NR = not reported; PGIC = Patient Global Impression of Change; SD = standard deviation; SE = standard error.
aANCOVA with treatment as a factor and the stratification variables: baseline migraine days and prophylactic medication used as independent variables.
bCochran-Mantel-Haenszel test stratified by randomized baseline migraine days (≤ 9 days or > 9 days) in the PROMISE-1 trial and baseline migraine days (< 17 days or ≥ 17 days) and prophylactic medication use (yes vs. no) in the PROMISE-2 trial.
cNominal P values are obtained from a repeated measure model including treatment group, visit (weeks 1, 2, 3, and 4), baseline migraine prevalence and treatment group–by–visit interaction.
dANCOVA with treatment as a factor and baseline migraine days as a covariate in the PROMISE-1 trial and with treatment as a factor and baseline medication and the stratification variables; baseline migraine days and prophylactic medication use as covariates in the PROMISE-2 trial.
eANCOVA model with treatment as a factor and baseline HIT-6 and the stratification variables: baseline migraine days and prophylactic medication use as independent variables.
fThese P values have not been adjusted for multiplicity.
gThese P values were tested after failure of the statistical hierarchy and therefore should be considered supportive.
Sources: Clinical Study Report for PROMISE-16 and PROMISE-2 trials.7
Harms
Only those harms identified in the review protocol are reported below. Table 15 and Table 16 provide detailed harms data.
Adverse Events
In the DELIVER trial,5 AEs were reported by 43%, 41%, and 40% of patients (Table 15). AEs were reported by 63%, 58%, and 60% of patients in the PROMISE-1 trial6 and 44%, 52%, and 47% of patients in the PROMISE-2 trial7 (Table 16) who were randomized to eptinezumab 100 mg, eptinezumab 300 mg, and placebo, respectively.
Serious Adverse Events
SAEs occurred in 2%, 2%, and 1% of patients in the DELIVER trial5 (Table 15); 2%, 1%, and 3% of patients in the PROMISE-1 trial;6 and less than 1%, 1%, and less than 1% of patients in the PROMISE-2 trial7 (Table 16) who were randomized to eptinezumab 100 mg, eptinezumab 300 mg, and placebo, respectively. No specific SAEs occurred in more than 1 patient.
Withdrawals due to Adverse Events
In the DELIVER trial,5 treatment stoppages due to an AE occurred in 0.3% of patients in the eptinezumab 100 mg and placebo groups and 2% of patients in the eptinezumab 300 mg group (Table 15). In the PROMISE-1 trial,6 3% of patients in the eptinezumab 100 mg and placebo groups, and 2% in the eptinezumab 300 mg group stopped treatment due to an AE, and in the PROMISE-2 trial7 less than 1% in the eptinezumab 100 mg and placebo groups, and 2% of patients on eptinezumab 300 mg stopped treatment due to an AE (Table 16).
Mortality
No deaths occurred in any of the studies.5-7
Table 15: Summary of Harms (DELIVER Trial)
Outcome | EPT100 (N = 299) | EPT300 (N = 294) | Placebo (N = 298) |
|---|---|---|---|
Patients with ≥ 1 adverse event | |||
n (%) | 127 (43) | 120 (41) | 119 (40) |
Most common events,a n (%) | |||
COVID-19 | 20 (7) | 17 (6) | 16 (5) |
Nasopharyngitis | 5 (2) | 9 (3) | 3 (1) |
Fatigue | 2 (1) | 6 (2) | 4 (1) |
Patients with ≥ 1 serious adverse event | |||
n (%) | 5 (2) | 7 (2) | 4 (1) |
Most common events,a n (%) | |||
Anaphylactic reaction | 0 | 2 (1) | 0 |
Patients who stopped treatment due to adverse events | |||
n (%) | 1 (0.3) | 6 (2.0) | 1 (0.3) |
Most common events,a n (%) | |||
Anaphylactic reaction | 0 | 2 (1) | 0 |
Deaths | |||
n (%) | 0 | 0 | 0 |
Notable harms, n (%) | |||
Hypersensitivity and/or anaphylaxis | 6 (2) | 10 (3) | 6 (2) |
Cardiovascular and/or cerebrovascular disorders | 9 (3) | 4 (1) | 8 (3) |
Seizures | 0 | 1(< 1) | 0 |
Hepatic events | 2 (1) | 2 (1) | 4 (1) |
Suicidal ideation/behaviour | 0 | 0 | 1 (< 1) |
EPT100 = eptinezumab 100 mg every 12 weeks; EPT300 = eptinezumab 300 mg every 12 weeks.
aFrequency greater than 2% in any group.
Source: Clinical Study Report for DELIVER trial.5
Table 16: Summary of Harms (PROMISE-1 and PROMISE-2 Trials)
Outcome | PROMISE-1 | PROMISE-2 | ||||
|---|---|---|---|---|---|---|
EPT100 N = 223 | EPT300 N = 224 | Placebo N = 222 | EPT100 N = 356 | EPT300 N = 350 | Placebo N = 366 | |
Patients with ≥ 1 adverse event | ||||||
n (%) | 141 (63) | 129 (58) | 132 (60) | 155 (44) | 182 (52) | 171 (47) |
Most common events,a n (%) | ||||||
URTI | 22 (10) | 23 (10) | 16 (7) | 15 (4) | 19 (5) | 20 (6) |
Nasopharyngitis | 17 (8) | 14 (6) | 12 (5) | 19 (5) | 33 (9) | 22 (6) |
Sinusitis | 6 (3) | 11 (5) | 14 (6) | 7 (2) | 9 (3) | 15 (4) |
Patients with ≥ 1 serious adverse event | ||||||
n (%) | 4 (2) | 3 (1) | 6 (3) | 3 (< 1) | 4 (1) | 3 (< 1) |
Most common events,a n (%) | No event in > 1 patient | No event in > 1 patient | ||||
Patients who stopped treatment due to adverse events | ||||||
n (%) | 6 (3) | 5 (2) | 6 (3) | 3 (< 1) | 8 (2) | 2 (< 1) |
Most common events,a n (%) | ||||||
Hypersensitivity | 1 (< 1) | 2 (< 1) | |||||||||||| | 0 | 6 (2) | 0 |
Deaths | ||||||
n (%) | 0 | 0 | 0 | 0 | 0 | 0 |
Notable harms | ||||||
Hypersensitivity and/or anaphylaxis, n (%) | 1 (< 1) | 2 (< 1) | 0 | 0 | 6 (2) | 0 |
Cardiovascular and/or cerebrovascular disorders | 1 (< 1) | 1 (< 1) | 1 (< 1) | 2 (< 1) | 3 (< 1) | 1 (< 1) |
Vascular disorders | 4 (2) | 2 (< 1) | 2 (< 1) | 3 (< 1) | 4 (1) | 3 (< 1) |
Seizures | |||||||||||| | |||||||||||| | |||||||||||| | |||||||||||| | |||||||||||| | |||||||||||| |
Increased ALT | 1 (< 1) | 1 (< 1) | 1 (< 1) | 0 | 1 (< 1) | 3 (< 1) |
Increased AST | 0 | 0 | 0 | 0 | 2 (< 1) | 1 (< 1) |
Hepatic enzyme increased | 0 | 1 (< 1) | 0 | 1 (< 1) | 1 (< 1) | 1 (< 1) |
Liver function test increased | 0 | 0 | 0 | 1 (< 1) | 1 (< 1) | 1 (< 1) |
Transaminases increased | 0 | 1 (< 1) | 0 | NR | NR | NR |
Suicidal ideation/behaviour | |||||||||||| | |||||||||||| | |||||||||||| | |||||||||||| | |||||||||||| | |||||||||||| |
Depression, suicidal | 0 | 0 | 0 | 1 (< 1) | 0 | 0 |
ALT = alanine transaminase; AST = aspartate transaminase; EPT100 = eptinezumab 100 mg every 12 weeks; EPT300 = eptinezumab 300 mg every 12 weeks; NR = not reported; URTI = upper respiratory tract infection.
aFrequency greater than 2% in any group.
Sources: Clinical Study Reports for PROMISE-16 and PROMISE-2 trials.7
Notable Harms
Notable harms identified by the review team included: anaphylaxis or hypersensitivity reactions, antibody formation, cardiovascular events, suicidality, alopecia, and fatigue. The most common notable harms that were reported in the included studies were hypersensitivity and/or anaphylaxis, occurring in 2% of patients in each of the eptinezumab 100 mg and placebo groups, and 3% of patients in the eptinezumab 300 mg group in the DELIVER trial,5 and cardiovascular or cerebrovascular disorders, occurring in 3% of patients in the eptinezumab 100 mg and placebo groups, and 1% in the eptinezumab 300 mg group in the DELIVER trial. All other notable harms in the DELIVER trial occurred in 1% of patients or less, and in the PROMISE-16 and PROMISE-27 trials, notable harms occurred in 1% of patients or less.
Critical Appraisal
Internal Validity
All 3 studies appeared to have been well designed, with steps taken to maintain allocation concealment during the randomization process, maintain blinding during the treatment period, and control for multiplicity. Some issues with respect to critical appraisal are noted in the following section.
While the study withdrawal rates were less than 5% across groups in the DELIVER trial,5 they were notably higher in the PROMISE-2 trial7 (approximately 10% of patients) and particularly in the PROMISE-1 trial,6 in which study withdrawals ranged from 22% to 26% of patients across groups. The most common reasons for discontinuing the study in the PROMISE-1 trial were “study burden” and “loss to follow-up,” neither of which provided much insight into why there were such high withdrawals in the PROMISE-1 trial compared to the other studies, although patients in the PROMISE-1 trial were to receive 4 infusions, double the amount of the other 2 studies, suggesting that the longer duration of treatment may have played a role. No further explanation was provided in the Clinical Study Report, although the sponsor noted that 94% of patients remained in the study until week 12, which was the time point at which the primary outcome was assessed. Although there were no clear differences in withdrawals between study groups, such a large number of withdrawals may confound assessment of outcomes after week 12, as the equal distribution of prognostic characteristics between groups achieved at the time of randomization may no longer be the case.
Although HRQoL was assessed in the included studies, none of the HRQoL outcomes were controlled for multiplicity and therefore this limits any conclusions that can be drawn from this data, which should be considered supportive in nature. As it is clear from the patient input provided to CADTH that migraine has a significant impact on HRQoL, the lack of multiplicity control for any of the HRQoL outcomes should be considered a limitation of the evidence from the studies included in this review.
The validity and reliability of the MSQ and HIT-6 were reviewed by the CADTH review team and were considered to be adequate. No studies were found that reported on the validity or reliability for the MBS, while no studies specific to migraine were found for the EQ-5D-5L, WPAI, or PGIC. MIDs for patients with migraine were found for the MSQ and HIT-6, but not for the other instruments. The lack of studies assessing validity and reliability, or reporting MIDs, is a limitation when trying to interpret these outcomes.
Although prespecified subgroup data were reported for the subgroups of interest in our protocol, any analyses that have been reported were exploratory and were not adjusted for multiple comparisons, limiting any conclusions that can be drawn.
Migraine and headache-related outcomes were assessed by use of an eDiary. The sponsor noted in the clinical study reports that whether a migraine occurred was determined from eDiary entries; however, it was not clear whether the investigator or the patient made the determination. Compliance to eDiary entries was only reported in the DELIVER trial, and for each of the 4-week intervals it was reported as greater than 96% for patients with at least 14 days of compliance and greater than 90% for patients with at least 21 days of compliance, which the sponsor described as a “high level” of compliance. If patients made fewer than 21 days of entries in a 28-day period, then the results were calculated as a weighted function of the observed data for the current 4-week interval and the results for the previous interval. This approach assumes that the rate of MMDs was the same for days with missing and those with nonmissing data, and there are limitations to making such an assumption. For example, patients who are experiencing a migraine may be less likely to complete their diary entry, and this may lead to an underestimate of MMDs.
External Validity
The clinical expert consulted by CADTH on this review described the populations enrolled in the included studies as reflective of the populations that would be treated with this drug in Canada. The DELIVER study was the only trial that enrolled patients who had failed at least 2 prior prophylaxis regimens, and this is therefore the only trial that features a population that reflects the reimbursement criteria proposed by the sponsor. For example, in the PROMISE-2 trial, only 37% of patients had used migraine prophylaxis at all before the study, and the number of patients using prior prophylaxis was not reported in the PROMISE-1 trial. There were no notable differences between groups in baseline characteristics within studies. The clinical expert consulted by CADTH for this review stated that the number of prior prophylaxis drugs would have no impact on the efficacy of CGRP mAbs.
None of the included studies featured an active comparator, and there are therefore no direct comparisons available of eptinezumab versus other CGRP mAbs or other drugs in the therapeutic class, such as botulinum toxin. Indirect treatment comparisons (ITCs) were available, and their limitations are noted in the following section. The lack of direct comparative data limits our ability to assess the claim, for example, that eptinezumab has a faster onset of action than other drugs in its class.
In 2 of the included studies, patients received only 2 doses of eptinezumab during the blinded treatment period, and in the other study the maximum number of doses received was 4. This limits our ability to draw conclusions regarding the longer-term efficacy or harms of eptinezumab. Most of the outcomes that were controlled for multiplicity, including the primary outcome in each study, were assessed at the 12-week time point, after patients had received only a single dose of eptinezumab. It is therefore not known whether the efficacy of eptinezumab begins to wane with time, and the long-term safety is also unclear.
The primary outcome of each of the included studies was the change from baseline in MMDs for weeks 1 to 12. Change in MMDs is a common and widely accepted outcome for assessing response to therapies for migraine prophylaxis, and is an appropriate and relevant primary outcome, according to the clinical expert consulted by CADTH for this review. In their input to CADTH, patients made it clear that migraine frequency is of paramount importance. The clinical expert noted that the instruments used in the included studies to assess patient-reported outcomes such as HRQoL and symptoms are not used in clinical practice, while an instrument such as MIDAS, which is sometimes used in clinical practice, was not assessed in any of the included trials. It is clear that migraine has a significant impact on patients’ HRQoL; however, although HRQoL instruments were included in the clinical trials, the fact that none of the statistical testing procedures were controlled for multiplicity limits any conclusions that can be drawn regarding this important outcome.
Across the studies the sponsor tended to use ORs in their primary analyses instead of relative risks (RRs). ORs tend to exaggerate the effect estimate compared to RRs, which are more intuitive. It is unclear why the sponsor used ORs instead of RRs.
Indirect Evidence
Objectives and Methods for the Summary of Indirect Evidence
The objective of this section is to summarize and critically appraise the methods and findings of the sponsor-submitted review of the literature and NMA comparing eptinezumab with key comparators for the prevention of EM or CM in adults who have experienced an inadequate response, intolerance, or contraindication to at least 2 oral prophylactic migraine medications.
A focused literature search for NMAs dealing with migraines was run in MEDLINE All (1946–) on July 6, 2022. No limits were applied to the search. The literature search identified 56 articles, 5 of which were retrieved for scrutiny. Upon further review of the 5 potential studies, no additional ITCs were included in the review as the evidence was associated with many limitations in conduct and did not address any additional gaps in the literature.
Description of the Indirect Evidence
The sponsor conducted an SLR in May 2020 and updated it in June 2021 to identify evidence for inclusion in the NMA. A feasibility assessment was conducted to determine the comparability of eligible studies with the DELIVER trial for eptinezumab. A total of 11 studies were included in the Bayesian network, evaluating the comparative impact of eptinezumab, key CGRP mAbs (erenumab, fremanezumab, and galcanezumab), and placebo on efficacy and HRQoL in patients with EM and CM.9
Methods of Sponsor-Submitted NMA
Objectives
The objective of the sponsor-submitted NMA was to provide comparative estimates of efficacy and HRQoL for eptinezumab and key comparators for the prevention of migraine in adults who have at least 4 migraine days per month and have experienced an inadequate response, intolerance, or contraindication to at least 2 oral prophylactic migraine medications. Given the differences in treatment by migraine type, separate analyses were conducted for EM and CM.9
Study Selection Methods
The sponsor-submitted NMA was informed by an SLR (updated to June 2021) to identify all existing RCTs for the treatment of EM and CM. Methods for identification of citations included database searches of Embase, MEDLINE, MEDLINE In-Process, MEDLINE Daily, MEDLINE Epub Ahead of Print, the Cochrane Database for Systematic Reviews and Cochrane Central Register of Controlled Trials, and the University of York Centre for Reviews and Dissemination platform (only for the original SLR). Manual searches of conference proceedings, clinical trial databases, health technology assessment websites, and reference lists were also conducted.9 No information on screening or data extraction methods, or methods for assessing data quality included in the SLR were provided.
Eligibility criteria for inclusion in the NMA were more refined than in the SLR. Table 17 summarizes the predefined study selection criteria for the SLR and NMA. The main population of interest for the NMA was patients with documented treatment failure of at least 2 preventive migraine medications.9 The list of eligible interventions, comparators, and outcomes was also more restricted in the NMA compared with the SLR. Key outcomes in the NMA included 50% MRR, and changes from baseline at week 12 in MMDs, MMDs with acute medication use, MSQ v2.1 domains, and HIT-6 scores. Assessment time points of interest for the NMA were changes evaluated at 12 weeks. Time points varied between comparators, including anti-CGRPs and onabotulinum toxin A. For CGRP mAbs, when changes from weeks 1 to 12 were not available, the outcome corresponding to the primary end point (i.e., week 9 to 12) or the latest available time point up until week 12 (i.e., week 4 to 8) was preferred. For onabotulinum toxin A, data were not available at week 12, and data from week 24 were used instead, applying the same principles for CGRP mAbs.9
NMA Methods
Feasibility Assessment
A feasibility assessment was conducted to assess the suitability of an NMA for the comparisons of interest. Characteristics of trials reporting the effects of anti-CGRPs and onabotulinum toxin A on EM and CM were assessed for heterogeneity via study and baseline characteristics. Study characteristics assessed included participants’ country, trial start date, route of administration, diagnostic criteria for EM and CM, and migraine-day definition. Baseline characteristics considered in the feasibility assessment included age, sex, race or ethnicity, weight, migraine severity (EM or CM), disease duration, MHDs, MMDs, monthly migraine frequency, preventive medication use, acute medication use, and codiagnosis of MOH. Baseline characteristics were also assessed for prior treatment–failure subgroups.9
Table 17: Study Selection Criteria for Sponsor-Submitted SLR and Network Meta-Analysis
PICOS criteria | Inclusion criteria — SLR | Inclusion criteria — network meta-analysis |
|---|---|---|
Population | Adults (≥ 18 years) with EM or CM | Patients with EM or CM with documented treatment failure of at least 2 preventive migraine medications |
Intervention |
|
|
Comparator | Any pharmacological treatment, including placebo |
|
Outcome |
|
|
Study design |
| Double-blind Phase II to IV RCTs with at least a 12-week double-blind period, including subgroups |
Publication characteristics |
| Time point: weeks 1 to 12 |
AE = adverse event; CFB = change from baseline; CGRP = calcitonin gene–related peptide; CM = chronic migraine; EM = episodic migraine; HIT-6 = Headache Impact Test 6-item; HRQoL = health-related quality of life; MHD = monthly headache day; MMD = monthly migraine day; MRR = migraine response rate; MSQ = Migraine-Specific Quality of Life questionnaire; MSQ v2.1 = Migraine-Specific Quality of Life Questionnaire version 2.1; PICOS = population, intervention, comparison, outcomes and study; q4w = every 4 weeks; q12w = every 12 weeks; RCT = randomized controlled trial; SLR = systematic literature review; WPAI = Work Productivity and Activity Impairment.
Source: Sponsor-submitted network meta-analysis.9
NMA Methods
The NMA was conducted in a Bayesian framework using fixed-effect models as base-case analyses due to the limited number of studies per comparison. Random-effects models were also fitted for the 2 priority outcomes (MMDs and 50% MRR). Due to data availability, only arm-level data were used for comparisons, and contrast-level data were not required.9 As no closed loops were formed in the networks, there was no potential for conflict between direct and indirect evidence, and inconsistency was not assessed.
The primary analysis of the NMA consisted of comparisons between eptinezumab and anti-CGRPs for both EM and CM separately, to control for potential differences identified during the feasibility assessment. Potential differences in baseline MOH across CM populations were a limitation of the analyses, although it was not feasible to assess the extent of any differences in MOH due to a lack of reporting across studies. Two secondary analyses were conducted. The first consisted of comparisons with onabotulinum toxin A for the end points of change from baseline in MMDs and 50% MRR using data from 24 weeks for onabotulinum toxin A and 12 weeks for eptinezumab due to limited data availability. Additionally, changes from baseline in MHDs data were used for onabotulinum toxin A, while changes from baseline in MMDs were used for eptinezumab. The other secondary analysis consisted of comparisons with anti-CGRPs, adjusting for the route of administration for change from baseline in MMDs at week 12, given that eptinezumab is the only treatment administered by IV. This secondary analysis was conducted because it was deemed likely that patients receiving placebo through IV rather than subcutaneously had an elevated response (greater reduction) in terms of MMDs. As such, in this analysis, a random additive effect of 1.34 MMDs was subtracted from the mean differences of treatments with subcutaneous administration, to mimic an IV placebo effect.9
For continuous data, a normal likelihood and an identity link were assumed. For binary outcomes, it was assumed that the data followed a binomial distribution. All analyses were carried out by Markov chain Monte Carlo simulation, using 3 different chains with dispersed initial values. A total of 30,000 burn-in samples were used and the remaining samples of the posterior distributions of the model parameters were used for inference. Fixed-effect models were run for a total of 100,000 runs per chain, implying that 210,000 samples of the posterior distribution were used for inference. Models including random effects were run for a total of 200,000 runs per chain, implying that 510,000 samples were used to draw inference. Posterior medians were reported along with 95% CrIs, and statistical superiority or inferiority was determined by whether the 95% CrIs crossed the value of no treatment effect. Vague prior distributions were supplied for basic parameters and trial baselines. Vague prior distributions were also assigned in random effects models with a binomial likelihood. For random-effect models with a normal likelihood and identity link (i.e., change from baseline in MMDs), the prior distribution of the between-study variance was informed by the posterior distribution of an NMA conducted for phase III trials in patients with EM. Specifically, the posterior distribution of the between-trial SD followed an approximate log-normal distribution with a mean of −1.1 and an SD of 1.17 on the logarithmic scale.9
Convergence was confirmed by visual inspection of the trace plots for the 3 chains. Three types of plots were produced for each basic parameter: a Gelman-Rubin plot, an autocorrelation plot, and a density plot. For cases in which studies reported zero events, a 0.5 correction was applied to all treatment arms to ensure model convergence. Due to the limited number of studies per treatment comparison, generation of model statistics for model selection between fixed- and random-effect models was not performed as fixed effects were chosen as the base case.
For continuous outcomes, the mean and SE were required for the analysis. If the mean was not reported, the observation was not included in the analysis. If the SE was not reported, then the SE was derived from the SD and number of patients or the CI, if available. When necessary, standard errors were digitized. No model for imputation of SDs was required to be applied. Where missing, 50% MRR data stratified by subgroups of interest was calculated. For the FOCUS study, 50% MRR was reported using a mixed EM and CM group for 2 or more prior treatment failures, and the percentage of responders per arm for patients with 2, 3, and 4 prior treatment failures stratified by migraine type was reported. As no sample sizes were reported, sample sizes were imputed using the total number of EM and CM patients per arm and the distribution of 2, 3, and 4 prior treatment failures for the full trial population under the assumption that the treatment-failure distribution was independent of EM or CM classification. The imputed sample sizes enabled the pooling of the percentage of responders per arm for 2, 3, and 4 prior treatment failures in patients with EM or CM to give 50% MRR rates for patients with EM and 2 or more treatment failures and those with CM and 2 or more treatment failures. For binary outcomes, the number of events and sample size was required. If these data were not available but percentages were reported, then the number of events were derived from the percentages, and, where applicable, it was assumed the sample size was equal to the number randomized and rounded to the nearest integer.9
Results of Sponsor-Submitted NMA
Summary of Included Studies and Results of the Feasibility Assessment
Complete results of the SLR were not provided. A total of 11 studies were identified as being suitable for inclusion in the NMA; 10 of which were identified in the SLR, with the final study being the DELIVER clinical trial for eptinezumab.9 A summary of key study and baseline characteristics from the intention-to-treat population of each included study is reported in Table 18.
The year of the study start date ranged from 2006 to 2020. All trials were multinational, ranging from 2 countries to 17. Treatments were administered by subcutaneous injection in 8 of 11 studies, intramuscular injection of onabotulinum toxin A in 2 studies, and IV of eptinezumab in 1 study. The migraine classifications of each study were generally consistent. CM was consistently defined as headache on 15 or more days per month, with at least 8 days fulfilling migraine criteria or having migraine features. EM was consistently defined as headache on fewer than 15 days per month, with 4 to 14 having migraine features. There was a general consistency in definition of migraine days across studies. Migraine days were consistently defined as a day with a headache with features meeting the ICHD criteria for a migraine. There was some inconsistency regarding how long the headache meeting ICHD criteria was required to last (≥ 30 or ≥ 4 hours), and some inconsistency in which version of the ICHD was used. Additionally, there was some inconsistency in definition of migraine days in terms of whether days on which migraine-specific acute preventive medications were taken were counted as migraine days. In some studies, these medications needed to be taken alongside a headache (meeting the ICHD criteria), whereas in others they did not.9
When reported, demographic and baseline characteristics were similar across studies included in the feasibility assessment. In the studies evaluated, the majority of patients were white (range, 70.27% to 95.96%) and female (range, 81.3% to 89.89%), with ages ranging between 40 and 47 years. The authors noted that there were differences in many baseline characteristics, including MHDs, MMDs, migraine frequency, and days of acute medication use or medication overuse across studies, likely because some populations were specific to EM or CM, or consisted of both EM and CM patients.9
During the feasibility assessment, subgroup results from the RCTs included from the SLR and subgroup results from the DELIVER clinical trial were reviewed to identify potential treatment effect–modifying variables. Based on the results of subgroup analyses from different RCTs (NCT02066415 for erenumab; FOCUS for fremanezumab; REGAIN and CONQUER for galcanezumab; and DELIVER for eptinezumab) it was concluded that the number of prior treatment failures, baseline severity (i.e., EM or CM, and baseline MMDs), and MOH (for CM patients only) were potential treatment-effect modifiers.9
Table 18: Baseline Characteristics of Studies Included in the Feasibility Assessment
Parameter | DELIVER | CONQUER | EVOLVE-1 | EVOLVE-2 | FOCUS | LIBERTY | NCT02066415 | PREEMPT-1 | PREEMPT-2 | REGAIN | STRIVE |
|---|---|---|---|---|---|---|---|---|---|---|---|
Study characteristics | |||||||||||
Migraine type | Mixed | Mixed | Episodic | Episodic | Mixed | Episodic | Chronic | Chronic | Chronic | Chronic | Episodic |
Treatments and dose | EPT 100 mg q12w EPT 300 mg q12w Placebo | GAL 120 mg q4w Placebo | GAL 120 mg q4w GAL 240 mg q4w Placebo | GAL 120 mg q4w GAL 240 mg q4w Placebo | FRE 675 mg, 225 mg, 225 mg q4w FRE 675 mg q12w Placebo | ERE 140 mg q4w Placebo | ERE 70 mg q4w ERE 140 mg q4w Placebo | OnaA 155 mg to 195 mg Placebo | OnaA 155 mg to 195 mg Placebo | GAL 120 mg q4w GAL 240 mg q4w Placebo | ERE 70 mg q4w ERE 140 mg q4w Placebo |
Sample size, N | 890 | 462 | 858 | 915 | 838 | 246 | 667 | 679 | 705 | 1,113 | 955 |
Outcomes for comparison with DELIVER | — | MMDs, 50% MRR, acute medication use, MSQ v2.1 | MMDs, 50% MRR, acute medication use | MMDs, 50% MRR, acute medication use | MMDs, 50% MRR | MMDs, 50% MRR, acute medication use, HIT-6 | MMDs, 50% MRR, acute medication use, HIT-6 | 50% MRR, MHDs | 50% MRR, MHDs | MMDs, 50% MRR, acute medication use, MSQ v2.1 | MMDs, 50% MRR, acute medication use |
Baseline characteristics | |||||||||||
Age, mean (SD) | 43.8 (10.6) | 45.8 (11.8) | 40.7 (11.6) | 41.9 (11.2) | 46.2 (11.1) | 44.4 (10.5) | 42.1 (11.3) | 41.7 (NR) | 41.0 (NR) | 41.0 (12.2) | 40.9 (11.2) |
Sex, % | |||||||||||
Male | 10.00 | 14.07 | 16.32 | 14.64 | 16.47 | 18.70 | 17.24 | 12.52 | 14.61 | 15.00 | 14.76 |
Female | 90.00 | 85.93 | 83.68 | 85.36 | 83.53 | 81.30 | 82.76 | 87.48 | 85.39 | 85.00 | 85.24 |
Ethnicity, % | |||||||||||
White | 95.96 | 79.00 | 80.42 | 70.27 | 93.79 | 92.28 | 94.15 | — | — | 48.98 | 89.11 |
Black | — | 1.08 | 10.96 | 6.89 | 0.95 | — | 4.05 | — | — | 6.47 | 6.91 |
Hispanic | 0.56 | 6.71 | 14.22 | 25.90 | — | 5.69 | — | — | — | — | — |
Asian | — | 15.58 | 2.80 | 11.15 | 0.48 | — | 1.20 | — | — | 4.76 | 1.78 |
Weight, mean (SD) | ||||||||| | — | — | — | 71.03 (13.6) | 72.44 (15.4) | — | — | — | — | — |
Migraine severity, mean (SD) | — | — | 4.32 (1.11) | 4.23 (1.2) | — | — | — | — | — | 4.88 (1.2) | — |
Disease duration (years), mean (SD) | 17.64 (11.4) | 23.24 (13.6) | 20.05 (12.4) | 20.59 (12.4) | 24.20 (13.4) | — | 21.69 (12.5) | 20.45 (NR) | 18.04 (4.0) | 21.08 (12.8) | — |
MHDs, mean (SD) | 14.47 (5.6) | 15.05 (6.2) | — | 10.67 (3.5) | — | 10.10 (2.8) | 20.81 (3.85) | 19.90 (3.7) | 19.80 (3.7) | 21.40 (4.1) | 9.23 (2.6) |
MMDs, mean (SD) | 13.80 (5.6) | 13.23 (5.9) | 9.12 (3) | 9.13 (3.0) | 14.17 (5.8) | 9.25 (2.7) | 18.02 (4.6) | 19.10 (4.1) | 18.95 (4.0) | 19.45 (4.5) | 8.29 (2.5) |
Migraine frequency, mean (SD) | 11.13 (5.7) | — | 5.73 (1.7) | 5.65 (1.8) | — | — | 4.31 (1.7) | 12.10 (5.4) | 12.36 (5.3) | — | 5.17 (1.5) |
Acute medication use, mean (SD) | 11.13 (5.6) | 12.35 (6) | 7.38 (3.5) | 7.54 (3.4) | 12.43 (6.2) | 4.60 (2.9) | 9.36 (7.3) | — | — | 15.15 (6.5) | 3.33 (3.4) |
MOH, % | ||||||||| | — | — | — | — | — | — | — | — | 63.61 | — |
Preventive medication use, % | ||||||||| | — | 60.02 | 65.46 | — | — | — | — | 65.12 | 14.56 | 2.51 |
EPT = eptinezumab; ERE = erenumab; FRE = fremanezumab; GAL = galcanezumab; HIT-6 = Headache Impact Test 6-item; MHD = monthly headache day; MMD = monthly migraine day; MOH = medication overuse headache; MRR = migraine response rate; MSQ v2.1 = Migraine-Specific Quality of Life questionnaire version 2.1; NR = not reported; OnaA = onabotulinum toxin A; q4w = every 4 weeks; q12w = every 12 weeks; SD = standard deviation.
Source: Sponsor-submitted network meta-analysis.9
Results of the Sponsor-Submitted NMA
Primary Analyses — Anti-CGRP with 2 or More Treatment Failures
|||||||||||||||||||||||||||||||||||||||||||||||||||||||||||||||||||||||||||||||||||||||||||||||||||||||||||||||||||||||||||||||||||||||||||||||||||||||||||||||||||||||||||||||||||||||||||||||||||||||||||||||||||||||||||||||||||||||||||||||||||||||||||||||||||||||||||||||||||||||||||||||||||||||||||||||||||||||||||||||||||| 50% MRR at Week 12 (Fixed Effects)
||||||||||||||||||||||||||||||||||||||||||||||||||||||||||||||||||||||||||||||||||||||||||||||||||||||||||||||||||||||||||||||||||||||||||||||||||||||||||||||||||||||||||||||||||||||||||||||||||||||||||||||||||||||||||||||||||||||||||||||||||||||||||||
Figure 5: Network Diagram — 50% MRR at Week 12 (2 or More Treatment Failures)

Note: This figure was redacted at the request of the sponsor.
Source: Sponsor-submitted network meta-analysis.9
||||||||||||||||||||||||||||||||||||||||||||||||||||||||||||||||||||||||||||||||||||||||||||||||||||||||||||||||||||||||||||||||||||||||||||||||||||||||||||||||||||||||||||||||||||||||||||||||||||||||||||||||||||||||||||||||||||||||||||||||||||||||||||||||||||||||||||||||||||||||||||||||||||||||||||||||||||||||||||||||||||||||||||||||||||||||||||||||||||||||||||||||||||||||||||||||||||||||||||||||||||||||||||||||||||||||||||||||||||||||||||||||||||||||||||||||||||||||||||||||||||||||||||||||||||||||||||||||||||||||||||||||||||||||||||||||||||||||||||||||||||||||||||||||||||||||||||||||||||||||||||||||||||||||||||||||||||||||||||||||||||||||||||||||||||||||||||||||||||||||||||||||||||||||||||||||||||||||||||||||||||||||||||||||||||||||||||||||||||||||||||||||||||||||||||||||||||||||||||||||||||||||||||||||||||||||||||||||||||||||||||||||||||||||||||||||||||||||||||||||||||||||||||||||||||||||||||||||||||||||||||||||||||||||||||||||||||||||||||||||||||||||||||||||||||||||||||||||||||||||||||
Table 19: 50% MRR (OR [95% CrI]) at Week 12 (2 or More Treatment Failures)
||||||||||||||| | ||||||||||||||| | ||||||||||||||| | ||||||||||||||| | ||||||||||||||| | ||||||||||||||| | ||||||||||||||| | ||||||||||||||| | ||||||||||||||| | ||||||||||||||| |
|---|---|---|---|---|---|---|---|---|---|
||||||||||||||| | |||||||||
||||||||||||||| | ||||||||||||||| | ||||||||||||||| | ||||||||||||||| | ||||||||||||||| | ||||||||||||||| | ||||||||||||||| | ||||||||||||||| | ||||||||||||||| | ||||||||||||||| |
||||||||||||||| | ||||||||||||||| | ||||||||||||||| | ||||||||||||||| | ||||||||||||||| | ||||||||||||||| | ||||||||||||||| | ||||||||||||||| | ||||||||||||||| | ||||||||||||||| |
||||||||||||||| | ||||||||||||||| | ||||||||||||||| | ||||||||||||||| | ||||||||||||||| | ||||||||||||||| | ||||||||||||||| | ||||||||||||||| | ||||||||||||||| | ||||||||||||||| |
||||||||||||||| | ||||||||||||||| | ||||||||||||||| | ||||||||||||||| | ||||||||||||||| | ||||||||||||||| | ||||||||||||||| | ||||||||||||||| | ||||||||||||||| | ||||||||||||||| |
||||||||||||||| | ||||||||||||||| | ||||||||||||||| | ||||||||||||||| | ||||||||||||||| | ||||||||||||||| | ||||||||||||||| | ||||||||||||||| | ||||||||||||||| | ||||||||||||||| |
||||||||||||||| | ||||||||||||||| | ||||||||||||||| | ||||||||||||||| | ||||||||||||||| | ||||||||||||||| | ||||||||||||||| | ||||||||||||||| | ||||||||||||||| | ||||||||||||||| |
||||||||||||||| | ||||||||||||||| | ||||||||||||||| | ||||||||||||||| | ||||||||||||||| | ||||||||||||||| | ||||||||||||||| | ||||||||||||||| | ||||||||||||||| | ||||||||||||||| |
||||||||||||||| | ||||||||||||||| | ||||||||||||||| | ||||||||||||||| | ||||||||||||||| | ||||||||||||||| | ||||||||||||||| | ||||||||||||||| | ||||||||||||||| | ||||||||||||||| |
||||||||||||||| | ||||||||||||||| | ||||||||||||||| | ||||||||||||||| | ||||||||||||||| | ||||||||||||||| | ||||||||||||||| | ||||||||||||||| | ||||||||||||||| | ||||||||||||||| |
CrI = credible interval; EPT = eptinezumab; ERE = erenumab; FRE = fremanezumab; GAL = galcanezumab; MRR = migraine response rate; OR = odds ratio; PBO = placebo; q4w = every 4 weeks; q12w = every 12 weeks.
Results are presented with the columns as the reference treatment (column vs. row). Results greater than 1 favour the comparator, results of less than 1 favour the reference.
Galcanezumab 240 mg every 4 weeks is not within the summary of product characteristics but is included in the analysis for completeness.
Source: Sponsor-submitted network meta-analysis.9
Change From Baseline in MMDs at Week 12 (Fixed Effects)
||||||||||||||||||||||||||||||||||||||||||||||||||||||||||||||||||||||||||||||||||||||||||||||||||||||||||||||||||||||||||||||||||||||||||||||||||||||||||||||||||||||||||||||||||||||||||||||||||||||||||||||||||||||||||||||||||||||||||||||||||||||||||||||||||||||||||||||||||||||||||||||||||||||||||||
Figure 6: Network Diagram — Change From Baseline in MMDs at Week 12 (2 or More Treatment Failures)

Note: This figure was redacted at the request of the sponsor.
Source: Sponsor-Submitted NMA.9
|||||||||||||||||||||||||||||||||||||||||||||||||||||||||||||||||||||||||||||||||||||||||||||||||||||||||||||||||||||||||||||||||||||||||||||||||||||||||||||||||||||||||||||||||||||||||||||||||||||||||||||||||||||||||||||||||||||||||||||||||||||||||||||||||||||||||||||||||||||||||||||||||||||||||||||||||||||||||||||||||||||||||||||||||||||||||||||||||||||||||||||||||||||||||||||||||||||||||||||||||||||||||||||||||||||||||||||||||||||||||||||||||||||||||||||||||||||||||||||||||||||||||||||||||||||||||||||||||||||||||||||||||||||||||||||||||||||||||||||||||||||||||||||||||||||||||||||||||||||||||||||||||||||||||||||||||||||||||||||||||||||||||||||||||||||||||||||||||||||||||||||||||||||||||||||||||||||||||||||||||||||||||||||||||||||||||||||||||||||||||||||
Table 20: Change From Baseline in MMDs (95% CrI) at Week 12 (2 or More Treatment Failures)
||||||||||||||| | ||||||||||||||| | ||||||||||||||| | ||||||||||||||| | ||||||||||||||| | ||||||||||||||| | ||||||||||||||| | ||||||||||||||| | ||||||||||||||| | ||||||||||||||| | |
|---|---|---|---|---|---|---|---|---|---|---|
||||||||||||||| | ||||||||||
||||||||||||||| | ||||||||||||||| | ||||||||||||||| | ||||||||||||||| | ||||||||||||||| | ||||||||||||||| | ||||||||||||||| | ||||||||||||||| | ||||||||||||||| | ||||||||||||||| | |
||||||||||||||| | ||||||||||||||| | ||||||||||||||| | ||||||||||||||| | ||||||||||||||| | ||||||||||||||| | ||||||||||||||| | ||||||||||||||| | ||||||||||||||| | ||||||||||||||| | |
||||||||||||||| | ||||||||||||||| | ||||||||||||||| | ||||||||||||||| | ||||||||||||||| | ||||||||||||||| | ||||||||||||||| | ||||||||||||||| | ||||||||||||||| | ||||||||||||||| | |
||||||||||||||| | ||||||||||||||| | ||||||||||||||| | ||||||||||||||| | ||||||||||||||| | ||||||||||||||| | ||||||||||||||| | ||||||||||||||| | ||||||||||||||| | ||||||||||||||| | |
||||||||||||||| | ||||||||||||||| | ||||||||||||||| | ||||||||||||||| | ||||||||||||||| | ||||||||||||||| | ||||||||||||||| | ||||||||||||||| | ||||||||||||||| | ||||||||||||||| | |
||||||||||||||| | ||||||||||||||| | ||||||||||||||| | ||||||||||||||| | ||||||||||||||| | ||||||||||||||| | ||||||||||||||| | ||||||||||||||| | ||||||||||||||| | ||||||||||||||| | |
||||||||||||||| | ||||||||||||||| | ||||||||||||||| | ||||||||||||||| | ||||||||||||||| | ||||||||||||||| | ||||||||||||||| | ||||||||||||||| | ||||||||||||||| | ||||||||||||||| | |
||||||||||||||| | ||||||||||||||| | ||||||||||||||| | ||||||||||||||| | ||||||||||||||| | ||||||||||||||| | ||||||||||||||| | ||||||||||||||| | ||||||||||||||| | ||||||||||||||| | |
||||||||||||||| | ||||||||||||||| | ||||||||||||||| | ||||||||||||||| | ||||||||||||||| | ||||||||||||||| | ||||||||||||||| | ||||||||||||||| | ||||||||||||||| | ||||||||||||||| | |
CrI = credible interval; EPTI = eptinezumab; ERE = erenumab; FRE = fremanezumab; GAL = galcanezumab; MMD = monthly migraine day; PBO = placebo; q4w = every 4 weeks; q12w = every 12 weeks.
Notes: Results are presented with the columns as the reference treatment (column vs. row). Results of less than 0 favour the comparator, results greater 0 favour the reference. Galcanezumab 240 mg every 4 weeks is not within the summary of product characteristics but is included in the analysis for completeness.
Source: Sponsor-submitted network meta-analysis.9
Change From Baseline in MMDs With Use of Acute Medication at Week 12 (Fixed Effects)
|||||||||||||||||||||||||||||||||||||||||||||||||||||||||||||||||||||||||||||||||||||||||||||||||||||||||||||||||||||||||||||||||||||||||||||||||||||||||||||||||||||||||||||||||||||||||||||||||||||||||||||||||||||||||||||||||||||||||||||||||||||||||||||||||||||||||||||||||||||||||||||
Figure 7: Network Diagram — Change From Baseline in MMDs With Acute Medication Use at Week 12 (2 or More Treatment Failures)

Note: This figure was redacted at the request of the sponsor.
Source: Sponsor-submitted network meta-analysis.9
||||||||||||||||||||||||||||||||||||||||||||||||||||||||||||||||||||||||||||||||||||||||||||||||||||||||||||||||||||||||||||||||||||||||||||||||||||||||||||||||||||||||||||||||||||||||||||||||||||||||||||||||||||||||||||||||||||||||||||||||||||||||||||||||||||||||||||||||||||||||||||||||||||||||||||||||||||||||||||||||||||||||||||||||||||||||||||||||||||||||||||||||||||||||||||||||||||||||||||||||||||||||||||||
Table 21: Change From Baseline in MMDs (95% CrI) With Acute Medication Use at Week 12 (2 or More Treatment Failures)
||||||||||||||| | ||||||||||||||| | ||||||||||||||| | ||||||||||||||| | ||||||||||||||| | ||||||||||||||| | ||||||||||||||| | ||||||||||||||| |
|---|---|---|---|---|---|---|---|
||||||||||||||| | |||||||
||||||||||||||| | ||||||||||||||| | ||||||||||||||| | ||||||||||||||| | ||||||||||||||| | ||||||||||||||| | ||||||||||||||| | ||||||||||||||| |
||||||||||||||| | ||||||||||||||| | ||||||||||||||| | ||||||||||||||| | ||||||||||||||| | ||||||||||||||| | ||||||||||||||| | ||||||||||||||| |
||||||||||||||| | ||||||||||||||| | ||||||||||||||| | ||||||||||||||| | ||||||||||||||| | ||||||||||||||| | ||||||||||||||| | ||||||||||||||| |
||||||||||||||| | ||||||||||||||| | ||||||||||||||| | ||||||||||||||| | ||||||||||||||| | ||||||||||||||| | ||||||||||||||| | ||||||||||||||| |
||||||||||||||| | ||||||||||||||| | ||||||||||||||| | ||||||||||||||| | ||||||||||||||| | ||||||||||||||| | ||||||||||||||| | ||||||||||||||| |
||||||||||||||| | ||||||||||||||| | ||||||||||||||| | ||||||||||||||| | ||||||||||||||| | ||||||||||||||| | ||||||||||||||| | ||||||||||||||| |
||||||||||||||| | ||||||||||||||| | ||||||||||||||| | ||||||||||||||| | ||||||||||||||| | ||||||||||||||| | ||||||||||||||| | ||||||||||||||| |
CrI = credible interval; EPTI = eptinezumab; ERE = erenumab; GAL = galcanezumab; MMD = monthly migraine day; NA = not applicable; PBO = placebo; q4w = every 4 weeks; q12w = every 12 weeks.
Notes: Results are presented with the columns as the reference treatment (column vs. row). Results of less than 0 favour the comparator, results greater than 0 favour the reference. Galcanezumab 240 mg q4w is not within the summary of product characteristics but is included in the analysis for completeness.
Source: Sponsor-submitted network meta-analysis.9
Change From Baseline in MSQ Role Function Restrictive at Week 12 (Fixed Effects)
||||||||||||||||||||||||||||||||||||||||||||||||||||||||||||||||||||||||||||||||||||||||||||||||||||||||||||||||||||||||||||||||||||||||||||||||||||||||||||||||||||||||||||||||||||||||||||||||||||||||||||||||||
Figure 8: Network Diagram — Change From Baseline in RF-R MSQ at Week 12 (2 or More Treatment Failures)

Note: This figure was redacted at the request of the sponsor.
Source: Sponsor-submitted network meta-analysis.9
||||||||||||||||||||||||||||||||||||||||||||||||||||||||||||||||||||||||||||||||||||||||||||||||||||||||||||||||||||||||||||||||||||||||||||||||||||||||||||||||||||||||||||||||||||||||||||||||||||||||||||||||||||||||||||||||||||||||||||||||||||||||||||||||||||||||||||||||||||||||||||||||||||||||||||||||||||||||||||||||||||||||||||||||||||||||||||||||||||||||||||||||||||||||||||||||||||||||||||||||||||||||||||||||||||||||||||||||||||||||||||||||||||||||||||||||||||||||||||||||
Table 22: Change From Baseline in RF-R MSQ (95% CrI) at Week 12 (Episodic Migraine, 2 or More Treatment Failures)
||||||||||||||| | ||||||||||||||| | ||||||||||||||| | ||||||||||||||| | ||||||||||||||| | ||||||||||||||| |
|---|---|---|---|---|---|
||||||||||||||| | |||||
||||||||||||||| | ||||||||||||||| | ||||||||||||||| | ||||||||||||||| | ||||||||||||||| | ||||||||||||||| |
||||||||||||||| | ||||||||||||||| | ||||||||||||||| | ||||||||||||||| | ||||||||||||||| | ||||||||||||||| |
||||||||||||||| | ||||||||||||||| | ||||||||||||||| | ||||||||||||||| | ||||||||||||||| | ||||||||||||||| |
||||||||||||||| | ||||||||||||||| | ||||||||||||||| | ||||||||||||||| | ||||||||||||||| | ||||||||||||||| |
||||||||||||||| | ||||||||||||||| | ||||||||||||||| | ||||||||||||||| | ||||||||||||||| | ||||||||||||||| |
EPTI = eptinezumab; GAL = galcanezumab; MSQ = Migraine-Specific Quality of Life questionnaire; PBO = placebo; q4w = every 4 weeks; q12w = every 12 weeks; RF-R = role function restrictive.
Notes: Results are presented with the columns as the reference treatment (column vs. row). Results of less than 0 favour the comparator, results greater than 0 favour the reference. Galcanezumab 240 mg every 4 weeks is not within the summary of product characteristics but is included in the analysis for completeness.
Source: Sponsor-submitted network meta-analysis.9
Change From Baseline in MSQ Emotional Function at Week 12 (Fixed Effects)
|||||||||||||||||||||||||||||||||||||||||||||||||||||||||||||||||||||||||||||||||||||||||||||||||||||||||||||||||||||||||||||||||||||||||||||||||||||||||||||||||||||||||||||||||||||||||||||||||||||||||||||||||||||||||||||
||||||||||||||||||||||||||||||||||||||||||||||||||||||||||||||||||||||||||||||||||||||||||||||||||||||||||||||||||||||||||||||||||||||||||||||||||||||||||||||||||||||||||||||||||||||||||||||||||||||||||||||||||||||||||||||||||||||||||||||||||||||||||||||||||||||||||||||||||||||||||||||||||||||||||||||||||||||||||||||||||||||||||||||||||||||||||||||||||||||||||||||||||||||||||||||||||||||||||||||||||||||||||||||||||||||||||
Figure 9: Network Diagram — Change From Baseline in EF MSQ at Week 12 (2 or More Treatment Failures)

Note: This figure was redacted at the request of the sponsor.
Source: Sponsor-submitted network meta-analysis.9
Table 23: Change From Baseline in EF MSQ (95% CrI) at Week 12 (2 or More Treatment Failures)
||||||||||||||| | ||||||||||||||| | ||||||||||||||| | ||||||||||||||| | ||||||||||||||| |
|---|---|---|---|---|
||||||||||||||| | ||||
||||||||||||||| | ||||||||||||||| | ||||||||||||||| | ||||||||||||||| | ||||||||||||||| |
||||||||||||||| | ||||||||||||||| | ||||||||||||||| | ||||||||||||||| | ||||||||||||||| |
||||||||||||||| | ||||||||||||||| | ||||||||||||||| | ||||||||||||||| | ||||||||||||||| |
||||||||||||||| | ||||||||||||||| | ||||||||||||||| | ||||||||||||||| | ||||||||||||||| |
EF = emotional function; EPTI = eptinezumab; GAL = galcanezumab; MSQ = Migraine-Specific Quality of Life questionnaire; PBO = placebo; q4w = every 4 weeks; q12w = every 12 weeks.
Note: Results are presented with the columns as the reference treatment (column vs. row). Results of less than 0 favour the comparator, results greater than 0 favour the reference.
Source: Sponsor-submitted network meta-analysis.9
Change From Baseline in MSQ Role Function Preventive at Week 12 (Fixed Effects)
||||||||||||||||||||||||||||||||||||||||||||||||||||||||||||||||||||||||||||||||||||||||||||||||||||||||||||||||||||||||||||||||||||||||||||||||||||||||||||||||||||||||||||||||||||||||||||||||||||||||||||||||||
||||||||||||||||||||||||||||||||||||||||||||||||||||||||||||||||||||||||||||||||||||||||||||||||||||||||||||||||||||||||||||||||||||||||||||||||||||||||||||||||||||||||||||||||||||||||||||||||||||||||||||||||||||||||||||||||||||||||||||||||||||||||||||||||||||||||||||||||||||||||||||||||||||||||||||
Figure 10: Network Diagram — Change From Baseline in RF-P MSQ at Week 12 (2 or More Treatment Failures)

Note: This figure was redacted at the request of the sponsor.
Source: Sponsor-submitted network meta-analysis.9
Table 24: Change From Baseline in RF-P MSQ (95% CrI) at Week 12 (Episodic Migraine, 2 or More Treatment Failures)
||||||||||||||| | ||||||||||||||| | ||||||||||||||| | ||||||||||||||| | ||||||||||||||| |
|---|---|---|---|---|
||||||||||||||| | ||||
||||||||||||||| | ||||||||||||||| | ||||||||||||||| | ||||||||||||||| | ||||||||||||||| |
||||||||||||||| | ||||||||||||||| | ||||||||||||||| | ||||||||||||||| | ||||||||||||||| |
||||||||||||||| | ||||||||||||||| | ||||||||||||||| | ||||||||||||||| | ||||||||||||||| |
||||||||||||||| | ||||||||||||||| | ||||||||||||||| | ||||||||||||||| | ||||||||||||||| |
||||||||||||||| | ||||
||||||||||||||| | ||||||||||||||| | ||||||||||||||| | ||||||||||||||| | ||||||||||||||| |
||||||||||||||| | ||||||||||||||| | ||||||||||||||| | ||||||||||||||| | ||||||||||||||| |
||||||||||||||| | ||||||||||||||| | ||||||||||||||| | ||||||||||||||| | ||||||||||||||| |
||||||||||||||| | ||||||||||||||| | ||||||||||||||| | ||||||||||||||| | ||||||||||||||| |
EPTI = eptinezumab; GAL = galcanezumab; MSQ = Migraine-Specific Quality of Life questionnaire; PBO = placebo; q4w = every 4 weeks; q12w = every 12 weeks; RF-P = role function preventive.
Note: Results are presented with the columns as the reference treatment (column vs. row). Results of less than 0 favour the comparator, results greater than 0 favour the reference.
Source: Sponsor-submitted network meta-analysis.9
MRR of 75% at Week 12 (Fixed Effects)
|||||||||||||||||||||||||||||||||||||||||||||||||||||||||||||||||||||||||||||||||||||||||||||||||||||||||||||||||||||||||||||||||||||||||||||||||||||||||||||||||||||||||||||||||||||||||||||||||||
||||||||||||||||||||||||||||||||||||||||||||||||||||||||||||||||||||||||||||||||||||||||||||||||||||||||||||||||||||||||||||||||||||||||||||||||||||||||||||||||||||||||||||||||||||||||||||||||||||||||||||||||||||||||||||||||||||||||||||||||||||||||||||||||||||||||||||||||||||||||||||||||||||||||||||||||||||||||||||||||||||||||||||||||||||||||||||||||||||||||||||||||||||||||||||||||||||||||||||||||||||||||||||||||||||||||||||||||||||||||||||||||||||||||||||||||||||||||||||||||||||||||||||||||||||||||||||||||||||||||||||||||||||||||||||||||||||||||||||||||||||||||||||||||||||||||||||||||||||||
Figure 11: Network Diagram — 75% MRR at Week 12 (2 or More Treatment Failures)

Note: This figure was redacted at the request of the sponsor.
Source: Sponsor-submitted network meta-analysis.9
Table 25: 75% MRR (OR [95% CrI]) at Week 12 (2 or More Treatment Failures)
||||||||||||||| | ||||||||||||||| | ||||||||||||||| | ||||||||||||||| | ||||||||||||||| | ||||||||||||||| | ||||||||||||||| | ||||||||||||||| |
|---|---|---|---|---|---|---|---|
||||||||||||||| | |||||||
||||||||||||||| | ||||||||||||||| | ||||||||||||||| | ||||||||||||||| | ||||||||||||||| | ||||||||||||||| | ||||||||||||||| | ||||||||||||||| |
||||||||||||||| | ||||||||||||||| | ||||||||||||||| | ||||||||||||||| | ||||||||||||||| | ||||||||||||||| | ||||||||||||||| | ||||||||||||||| |
||||||||||||||| | ||||||||||||||| | ||||||||||||||| | ||||||||||||||| | ||||||||||||||| | ||||||||||||||| | ||||||||||||||| | ||||||||||||||| |
||||||||||||||| | ||||||||||||||| | ||||||||||||||| | ||||||||||||||| | ||||||||||||||| | ||||||||||||||| | ||||||||||||||| | ||||||||||||||| |
||||||||||||||| | ||||||||||||||| | ||||||||||||||| | ||||||||||||||| | ||||||||||||||| | ||||||||||||||| | ||||||||||||||| | ||||||||||||||| |
||||||||||||||| | ||||||||||||||| | ||||||||||||||| | ||||||||||||||| | ||||||||||||||| | ||||||||||||||| | ||||||||||||||| | ||||||||||||||| |
||||||||||||||| | ||||||||||||||| | ||||||||||||||| | ||||||||||||||| | ||||||||||||||| | ||||||||||||||| | ||||||||||||||| | ||||||||||||||| |
CrI = credible interval; EPTI = eptinezumab; ERE = erenumab; GAL = galcanezumab; MRR = migraine response rate; OR = odds ratio; PBO = placebo; q4w = every 4 weeks; q12w = every 12 weeks.
Notes: Results are presented with the columns as the reference treatment (column vs. row). Results of less than 1 favour the comparator, results greater than 1 favour the reference. Galcanezumab 240 mg every 4 weeks is not within the summary of product characteristics but is included in the analysis for completeness.
Source: Sponsor-submitted network meta-analysis.9
Change From Baseline in HIT-6 (Fixed Effects)
||||||||||||||||||||||||||||||||||||||||||||||||||||||||||||||||||||||||||||||||||||||||||||||||||||||||||||||||||||||||||||||||||||||||||||||||||||||||||||||||||||||||||||||||||||||||||||||||||||||||||||||||||||||||||||||||||||||||||||||||||||||||||||||||||||||||||||||||||||||||||||||||||||||||||||||||||||||||||||||||||||||||||||||||||||||||||||||||||||||||||||||||||||||||||||||||||||||||||||||||||||||||||||||||||||||||||||||||||
|||||||||||||||||||||||||||||||||||||||||||||||||||||||||||||||||||||||||||||||||||||||||||||||||||||||||||||||||||||||||||||||||||||||||||||||||||||||||||||||||||||||||||||||||||||||||||||||||||||||||||||||||||||||||||||||||||||||||||||||||||||||||||||||||||||||||||||||||||||||||||||||||||||||||||||||||||||||||||||||||||||||||||||||||||||||||||||||||||||||||||||||||||||||||||||||||||||||||||||||||||||||||||||||||||||||||||||||||||||||||||||||||||||||||||||||||||||||||||||||||||||||||||||||||||||||||||||||||||||||||||||||||||||||||||||||||||||||||||||||||||||||||||||||||||||||||||
Secondary Analyses
Comparisons With Onabotulinum Toxin A (CM)
MRR of 50% at Week 12 (Fixed Effects): |||||||||||||||||||||||||||||||||||||||||||||||||||||||||||||||||||||||||||||||||||||||||||||||||||||||||||||||||||||||||||||||||||||||||||||||||||||||||||||||||||||||||||||||||||||||||||||||||||||||||||||||||||||||||||||||||||||||||||||||||||||||||||||||||||||||||||||||||||||||||||||||||||||||||||||||||||||||||||
Change From Baseline in MMDs at Week 12 (Fixed Effects): ||||||||||||||||||||||||||||||||||||||||||||||||||||||||||||||||||||||||||||||||||||||||||||||||||||||||||||||||||||||||||||||||||||||||||||||||||||||||||||||||||||||||||||||||||||||||||||||||||||||||||||||||||||||||||||||||||||||||||||||||||||||||||||||||||||||||||||||
Figure 12: Network Diagram — Change From Baseline in HIT-6 at Week 12 (2 or More Treatment Failures)

Note: This figure was redacted at the request of the sponsor.
Source: Sponsor-submitted network meta-analysis.9
Table 26: Change From Baseline in HIT-6 (95% CrI) at Week 12 (2 or More Treatment Failures)
||||||||||||||| | ||||||||||||||| | ||||||||||||||| | ||||||||||||||| | ||||||||||||||| | ||||||||||||||| |
|---|---|---|---|---|---|
||||||||||||||| | |||||
||||||||||||||| | ||||||||||||||| | ||||||||||||||| | ||||||||||||||| | ||||||||||||||| | ||||||||||||||| |
||||||||||||||| | ||||||||||||||| | ||||||||||||||| | ||||||||||||||| | ||||||||||||||| | ||||||||||||||| |
||||||||||||||| | ||||||||||||||| | ||||||||||||||| | ||||||||||||||| | ||||||||||||||| | ||||||||||||||| |
||||||||||||||| | ||||||||||||||| | ||||||||||||||| | ||||||||||||||| | ||||||||||||||| | ||||||||||||||| |
||||||||||||||| | ||||||||||||||| | ||||||||||||||| | ||||||||||||||| | ||||||||||||||| | ||||||||||||||| |
EPTI = eptinezumab; ERE = erenumab; HIT-6 = Headache Impact Test 6-item; NA = not applicable; PBO = placebo; q4w = every 4 weeks; q12w = every 12 weeks; RF-P = role function preventive.
Note: Results are presented with the columns as the reference treatment (column vs. row). Results of less than 0 favour the comparator, results greater 0 favour the reference.
Source: Sponsor-submitted network meta-analysis.9
Table 27: Chronic Migraine — 50% MRR at Week 12 (OR [95% CrI])
||||||||||||||| | ||||||||||||||| | ||||||||||||||| | ||||||||||||||| | ||||||||||||||| |
|---|---|---|---|---|
||||||||||||||| | ||||||||||||||| | ||||||||||||||| | ||||||||||||||| | ||||||||||||||| |
||||||||||||||| | ||||||||||||||| | ||||||||||||||| | ||||||||||||||| | ||||||||||||||| |
||||||||||||||| | ||||||||||||||| | ||||||||||||||| | ||||||||||||||| | ||||||||||||||| |
||||||||||||||| | ||||||||||||||| | ||||||||||||||| | ||||||||||||||| | ||||||||||||||| |
BOT 155-195 = onabotulinum toxin A 155 mg to 195 mg; CrI = credible interval; EPTI = eptinezumab; MRR = migraine response rate; OR = odds ratio; PBO = placebo; q12w = every 12 weeks.
|||||||||||||||||||||||||||||||||||||||||||||||||||||||||||||||||||||||||||||||||||||||||||||||||||||||||||||||||||||||||||||||||||||||
Source: Sponsor-submitted network meta-analysis.9
Table 28: Chronic Migraine — Change From Baseline in MMDs (95% CrI) at Week 12
||||||||||||||| | ||||||||||||||| | ||||||||||||||| | ||||||||||||||| | ||||||||||||||| |
|---|---|---|---|---|
||||||||||||||| | ||||||||||||||| | ||||||||||||||| | ||||||||||||||| | ||||||||||||||| |
||||||||||||||| | ||||||||||||||| | ||||||||||||||| | ||||||||||||||| | ||||||||||||||| |
||||||||||||||| | ||||||||||||||| | ||||||||||||||| | ||||||||||||||| | ||||||||||||||| |
||||||||||||||| | ||||||||||||||| | ||||||||||||||| | ||||||||||||||| | ||||||||||||||| |
BOT 155-195 = onabotulinum toxin A 155 mg to 195 mg; CrI = credible interval; EPTI = eptinezumab; MMD = monthly migraine day; PBO = placebo; q12w = every 12 weeks.
|||||||||||||||||||||||||||||||||||||||||||||||||||||||||||||||||||||||||||||||||||||||||||||||||||||||||||||||||||||||||||||||||||||||
Source: Sponsor-submitted network meta-analysis.9
Adjusting for Route of Administration (EM and CM)
Change from Baseline in MMDs at Week 12 (2 or More Treatment Failures, Fixed Effects): ||||||||||||||||||||||||||||||||||||||||||||||||||||||||||||||||||||||||||||||||||||||||||||||||||||||||||||||||||||||||||||||||||||||||||||||||||||||||||||||||||||||||||||||||||||||||||||||||||||||||||||||||||||||||||||||||||||||||||||||||||||||||||||||||||||||||||||||||||||||||||||||||||||||||||||||||||||||||||||||||||||||||||||||||||||||||||||||||||||||||||||||||||||||||||||||||||||||||||||||||||||||||||||||||||||||||||||||||||||||||||||||||||||||||||||||||||||||||||||||||||||||||
Figure 13: Episodic Migraine (2 or More Treatment Failures) Change From Baseline in MMDs at Week 12 Adjusted for Route of Administration

Note: This figure was redacted at the request of the sponsor.
|||||||||||||||||||||||||||||||||||||||||||||||||||||||||||||||||||||||||||||||||||||||||||||||||||||||||||||||
Source: Sponsor-submitted network meta-analysis.9
Critical Appraisal of Sponsor-Submitted NMA
Given the common comparator of placebo in migraine RCTs, the sponsor conducted a Bayesian NMA, which was considered appropriate. The NMA was informed by an adequately conducted SLR that included planned searches (updated to mid-2021) of multiple databases, conference proceedings, and clinical trial registries, as well as regulatory and health technology assessment agency websites. Inclusion of studies was based on prespecified population, intervention, comparison, outcomes, and study (PICOS) criteria; however, no information was provided on the methods of study selection or data extraction (i.e., duplicate reviewers), the results of a quality assessment, or how it was conducted. Given that only phase III RCTs were included, the quality of studies was not expected to be low. Additionally, predefined criteria for inclusion in the NMA were stricter than those of the SLR, requiring patients to have documented treatment failure of at least 2 preventive migraine medications, as well as more restrictive comparators (restricted to anti-CGRPs and onabotulinum toxin A), and outcomes of interest. Overall, the selection criteria for the NMA were considered relevant and appropriate to the Canadian context, although use of onabotulinum toxin A is limited in Canada.
The CADTH team and the clinical expert consulted by CADTH agreed that the methods for the inclusion of studies in the NMA chosen by the sponsor were reasonable, but additional sources of heterogeneity, including differences in dosing schedules and time of assessment, were not explored in the sponsor’s feasibility analyses. As such, the difference in dosing schedules may have led to an improved response on receipt of the second dose for monthly (i.e., every 4 weeks) dosing schedules compared to 12-week dosing schedules, which may limit the comparability of effect estimates for dosing schedules. As no adjustments were made for dosing schedule or time of assessment, the effect of these sources of heterogeneity remains unknown. This limitation was also noted for comparisons with onabotulinum toxin A as outcomes were assessed at week 24 as opposed to week 12 for anti-CGRPs.
Concurrent with the feasibility assessment, the sponsor identified the following potential treatment-effect modifiers based on the results of subgroup analyses from the included trials: MOHs (for CM patients only), baseline severity (i.e., EM versus CM and baseline MMDs) and number of prior treatment failures. The sponsor noted that some heterogeneity was observed across studies in baseline severity (i.e., baseline MMDs, although this was due to the diagnosis of EM or CM), and in the proportion of patients with higher numbers of prior treatment failures (e.g., 3 or more). Given the lack of comparability of EM and CM patients due to differences in migraine frequency and severity, all analyses were conducted separately based on the diagnosis of EM or CM, and included only patients with 2 or more prior treatment failures. The sponsor also noted that the proportion of patients with MOH at baseline was poorly reported across CM studies and therefore could not be adjusted for in the CM comparisons, resulting in an unbalanced influence of MOHs on the treatment effect across studies. Secondary analyses specifically comparing eptinezumab to onabotulinum toxin A in CM, and analyses adjusting for route of administration (although not considered a prognostic factor or treatment-effect modifier) were conducted. The methods applied to the secondary analysis adjusting for route of administration were considered appropriate, and the clinical expert consulted by CADTH agreed that a greater placebo effect would be observed for IV therapy compared to SC therapy. No additional subgroup or sensitivity analyses were performed to determine other sources of heterogeneity.
The NMA was conducted within a Bayesian framework using fixed effects for all efficacy outcomes. The sponsor noted that, due to the lack of studies per treatment comparison, the between-study heterogeneity could not be informed by the data, and random-effects models that generated implausible results were only conducted as secondary to the main outcomes of change from baseline in MMDs and 50% MRR. However, although model statistics (i.e., deviance information criterion) for model selection were generated, the results were not reported, and it remains uncertain if the fixed-effect model was the most appropriate choice for these comparisons. Also, based on the lack of available data, only arm-level data were used for comparisons. Given the absolute outcome measures considered in the analyses, this was considered appropriate. However, because arm-based models do not preserve randomization, comparative estimates are at a greater risk of bias in relative treatment effects, although the direction of bias is uncertain and would depend on the potential for heterogeneity and placebo response within the individual studies.
In most cases, comparisons for almost all competing interventions were based on single trials, anchored through placebo, and the available trials formed networks with no closed loops. It was therefore not possible to validate the transitivity assumption of the NMA and check for consistency of results between direct and indirect comparisons.
Outcomes included in the NMA were relevant to the treatment of both EM and CM in Canada. Outcomes focused on reductions from baseline in migraine frequency (50% and 75% MRR and change from baseline in MMDs, with use of acute medication) and HRQoL (MSQ v2.1 domains and HIT-6). Because no outcomes related to safety were evaluated, the comparative safety of eptinezumab and other CGRP mAbs remains unknown.
While some NMAs suggested that eptinezumab is favoured when compared with erenumab and galcanezumab for certain outcomes (50% MRR and change from baseline in MMDs), the results were produced using a fixed-effect model, and as previously mentioned, it is uncertain if the fixed-effect model was an appropriate choice for these comparisons due to the lack of reporting of the deviance information criterion. As a result, superiority of eptinezumab compared with erenumab and galcanezumab cannot be concluded. Moreover, in all fixed-effects analyses, results were associated with wide 95% CrIs, with most estimates crossing the 0 or 1 threshold, resulting in notable imprecision in the results. Results for random-effects analyses for the 2 main outcomes were generally associated with even wider 95% CrIs.
Other Relevant Evidence
This section includes an additional relevant study included in the sponsor’s submission to CADTH that was considered to address important gaps in the evidence included in the systematic review.
PREVAIL Trial
One open-label, phase III study, PREVAIL,8 is summarized here to provide additional information on the long-term safety and efficacy of repeated IV infusions of eptinezumab administered quarterly in patients with CM for the preventive treatment of CM.
Methods
The PREVAIL trial8 was conducted to evaluate the long-term safety of up to 8 IV infusions of eptinezumab 300 mg administered at 12-week intervals in 128 adult patients with CM for up to 84 weeks of treatment. The secondary objective was to evaluate the efficacy of eptinezumab by assessing its impact on patient-reported outcomes. Patients were eligible to enrol in the PREVAIL trial if they were diagnosed with migraine at a maximum age of 50 years and had a history of CM for 1 year or longer before screening. The duration of the study was 106 weeks, which included a 2-week screening period, 48-week primary treatment period, 36-week secondary treatment period, and 20-week follow-up period. In each treatment period, patients received 4 IV infusions of eptinezumab every 12 weeks; only patients who received all 4 infusions in the primary treatment period were permitted to enter the secondary treatment period. Patients were evaluated at day 0, weeks 2, 4, 8, and 12, and every 12 weeks thereafter. Patients who failed to receive all 4 infusions of eptinezumab in the primary treatment period or did not provide consent for participation in the secondary treatment period were followed up at weeks 48 and 56.
The PREVAIL trial was conducted between December 2016 and April 2019 at 20 study sites in the US; no study sites in Canada were included.8
Populations
The eligibility criteria at screening are briefly summarized in the following section.
The inclusion and exclusion criteria were generally consistent with the pivotal PROMISE-27 clinical trial. Adults 18 to 65 years of age, inclusive, with a diagnosis of migraine at a maximum age of 50 years and a history of CM for 1 year or longer were eligible to enrol. A prescription or over-the-counter medication indicated for the acute and/or prophylactic treatment of migraine had to have been recommended or prescribed to the patient by a health care provider. Patients taking any prophylactic medication for headaches had to be stable on the medication for at least 3 months before screening. No requirement that patients had to have demonstrated an inadequate response to any prior prophylactic medication was stated in the inclusion and exclusion criteria.8
Patients were excluded from the study if they had used: any devices, neuromodulation, neurostimulation, and injectable therapy for headache prophylaxis in the 2 months before screening and for the entire study; botulinum toxin injection in the 4 months before screening and entire study; and monoamine oxidase inhibitors, ketamine, methysergide, methylergonovine, or nimesulide in the 3 months before screening and entire study. Patients who participated in prior clinical trials of CGRP antagonists may have been eligible to enrol if their last dose of the study drug was more than 6 months before screening and they did not experience any clinically significant AEs related to the study drug during the previous study, as determined by the investigator.8
A summary of detailed baseline characteristics in the safety population is available in Table 29.
The mean age of patients in the PREVAIL trial8 was 41.5 years (SD = 11.33). The majority of patients were female (85.2%) and white (95.3%). The mean duration of migraine diagnosis at baseline was 21.2 years (SD = 11.65). Fifty-six patients (43.8%) reported experience with aura. Forty-nine patients (38.3%) had a diagnosis of MOH. The patient-reported mean numbers of headache days, migraine days, and migraine attacks per 28-day period in the 3 months before screening were 20.3 (SD = 3.68), 14.1 (SD = 4.25), and 10.5 (SD = 4.29), respectively.
Table 29: Summary of Baseline Characteristics in PREVAIL Trial (Safety Population)
Characteristic | Eptinezumab 300 mg (N = 128) |
|---|---|
Demographics | |
Age (years), mean (SD) | 41.5 (11.33) |
Female, n (%) | 109 (85.2) |
Race, n (%) | |
White | 122 (95.3) |
Black or African American | 4 (3.1) |
Asian | 1 (< 1) |
American Indian or Alaska Native [wording from original source] | 0 |
Native Hawaiian or other Pacific Islander | 0 |
Multiple races | 1 (< 1) |
Migraine history | |
Duration of migraine at baseline (years), mean (SD) | 21.2 (11.65) |
Experience aura, n (%) | 56 (43.8) |
MOH diagnosis, n (%) | 49 (38.3) |
Number of headache days, mean (SD)a | 20.3 (3.68) |
Number of migraine days, mean (SD)a | 14.1 (4.25) |
Number of migraine attacks, mean (SD)a | 10.5 (4.29) |
MOH = medication overuse headache; SD = standard deviation.
aPatient-reported average number per 28-day period in the 3 months preceding screening.
Source: Clinical Study Report for PREVAIL.8
Interventions
Eptinezumab 300 mg was prepared in 100 mL of 0.9% saline solution and administered as an IV infusion over 30 (plus 15) minutes every 12 weeks beginning on day 0 by the investigator or designee. A total infusion duration of up to 1 hour may have been permitted if required at the discretion of the investigator.8
Concomitant Medications
Headache prophylactic treatment was permitted during the open-label study provided that patients were stable on the medication for at least 3 months before screening, and no changes to the regimen were permitted except at the discretion of the investigator. After week 48, changes to the prophylactic treatment were permitted at the discretion of the investigator or primary treating clinician.8
Prescription barbiturates and opiates were permitted for up to 4 days per month provided that patients were on a stable regimen for at least 2 months before screening and for the entire study duration and it was medically necessary and prescribed by a licensed health care professional for indications other than migraine.8
Outcomes
The safety end points included AEs, SAEs, clinical laboratory assessments, vital signs, electrocardiograms, and the Columbia Suicide Severity Rating Scale.
The patient-reported outcomes included the EQ-5D-5L, Short Form (36) Health Survey (SF-36) version 2.0, HIT-6, MBS, PGIC, and MIDAS tools.
Statistical Analysis
End points were summarized with descriptive statistics based on observed data through week 104 in the safety population, which comprised all patients who received at least 1 dose of open-label eptinezumab. For the SF-36 and HIT-6, a sample P value from t-tests based on change from baseline was performed; t-tests were descriptive only and an alpha control was not utilized.8
If the start date of an adverse event or concomitant medication was incomplete or missing, it was assumed to have started on or after the administration of the study drug, unless the incomplete date clearly indicated the event started before treatment with the study drug.8
Patient Disposition
A detailed summary of the patient disposition in the PREVAIL trial is provided in Table 30.
The total number of patients who were screened was not reported, but 30 patients were reported to have signed the informed consent form but were not enrolled due to either failing to meet inclusion criteria (12 patients) or meeting exclusion criteria (18 patients). Five patients (3.9%) were enrolled despite having met the exclusion criterion pertaining to the participation in a previous eptinezumab clinical trial within 6 months of screening. The decision was made based on the time they received their last dose of the study drug in the previous trial (administered > 6 months before screening) and the absence of clinically significant TEAEs related to the study drug during their participation in the previous trial.8
A total of 128 patients were enrolled in the open-label study and all patients received at least 1 dose of eptinezumab (safety population). Of the 28 patients (21.9%) who had participated in prior clinical studies of eptinezumab, 3 (2.3%) were previously in the pivotal PROMISE-16 trial. A total of 22 patients (17.2%) prematurely discontinued the study, with the most common reason being withdrawal by patient in 18 patients (14.1%). Of the patients who withdrew from the study, 1 patient (< 1%) withdrew due to an AE and no patients withdrew due to either lack of efficacy or worsening of study indication. Overall, 119 patients (93.0%) completed the primary treatment phase at week 36, and 100 patients (78.1%) completed the study at week 104.8
Table 30: Summary of Patient Disposition in PREVAIL Trial
Disposition | Eptinezumab 300 mg |
|---|---|
Screened, n | NR |
Enrolled, n | 128 |
Completed study, n (%) | 100 (78.1) |
Primary treatment phase (week 36) | 119 (93.0) |
Secondary treatment phase (week 84) | 101 (78.9) |
Discontinued study, n (%) | 22 (17.2) |
Withdrawal by patient | 18 (14.1) |
Study burden | 9 (7.0) |
Adverse event | 1 (< 1) |
Lack of efficacy | #1# |||||||||||||||||||||||||| |
Worsening of study indication | |||||||||||||||||||||||||||| |
Other | |||||||||||||||||||||||||||| |
Loss to follow-up | 4 (3.1) |
Safety, n | 128 (100) |
NR = not reported.
Source: Clinical Study Report for PREVAIL trial.8
Exposure to Study Treatment
A total of 112 patients (87.5%) received dose 4 of eptinezumab at week 36, and 97 patients (75.8%) received dose 8 of the study drug at week 84. A total of 86 patients (67.2%) received a total of 8 doses of the study drug. Ten patients (7.8%) reported a TEAE that led to study drug interruption (partial exposure to eptinezumab), with the most common events (frequency > 1 patient) being infusion-site extravasation in 6 patients (4.7%) and hypersensitivity in 2 patients (1.6%).8
The concomitant use of at least 1 acute and 1 prophylactic treatment for headaches was reported in 127 patients (99.2%) and 46 patients (35.9%), respectively. The most frequently (> 10%) reported acute medications were Thomapyrin N (57 patients; 44.5%), ibuprofen (52 patients; 40.6%), sumatriptan (43 patients; 33.6%), paracetamol (26 patients; 20.3%), and naproxen sodium (13 patients; 10.2%). The most frequently (> 10%) reported prophylactic medication was topiramate in 16 patients (12.5%).8
Efficacy
Only those efficacy outcomes identified in the review protocol are reported below. A detailed summary of change from baseline in the patient-reported outcomes in the safety population in PREVAIL is available in Table 31.
Health-Related Quality of Life
For the EQ-5D-5L VAS, the mean score at baseline and week 48 were ||||||||||||||||||||| and ||||||||||||||||||||| respectively, demonstrating improvement (n = 114).8
Headache Symptoms
For HIT-6, the mean total scores at baseline and weeks 101 to 104 were 65.2 (SD = 4.76) and 56.1 (SD = 9.07), respectively, demonstrating improvement (n = 96). Further, 118 patients (92.2%) reported a “severe impact” on life (HIT-6 total score of 60 to 788) and 1 patient (< 1%) reported “little to no impact” (HIT-6 total score of 36 to 49)8 at baseline. At week 101 to 104, a “severe impact” was reported by 37 patients (38.5%) and “little to no impact” was reported by 24 patients (25.0%) (n = 96).8
At baseline, the MBSs reported were sensitivity to light in 31 patients (24.2%), nausea in 14 patients (10.9%), sensitivity to sound in 10 patients (7.8%), pain with activity in 10 patients (7.8%), mental cloudiness in 4 patients (3.1%), vomiting in 2 patients (1.6%), mood changes in 2 patients (1.6%), and other symptoms in 55 patients (43.0%). Most patients reported being “very much improved” (35.7%) or “much improved” (39.3%) at week 48 relative to baseline (n = 112). “Minimally improved” was reported by 17 patients (15.2%) and “no change” was reported by 11 patients (9.8%). No patients reported being “minimally worse,” “much worse,” or “very much worse” at week 48 relative to baseline.8
Table 31: Summary of Change From Baseline in PROs in PREVAIL Trial (Safety Population)
Change from baseline | Eptinezumab 300 mg (N = 128) |
|---|---|
EQ-5D-5L VASa,b | |
Overall health at baseline, mean (SD) | ||||||||||||||||||||| |
Week 48 | |
N | ||||||||||||||||||||| |
Overall health, mean (SD) | ||||||||||||||||||||| |
Change from baseline, mean (SD) | ||||||||||||||||||||| |
HIT-6 | |
HIT-6 total score at baseline, mean (SD) | 65.2 (4.76) |
Week 101 to 104 | |
N | 96 |
HIT-6 total score, mean (SD) | 56.1 (9.07) |
Change from baseline, mean (SD) | −9.4 (9.47) |
MBSa | |
MBS at baseline, n (%) | |
Sensitivity to light | 31 (24.2) |
Nausea | 14 (10.9) |
Sensitivity to sound | 10 (7.8) |
Pain with activity | 10 (7.8) |
Mental cloudiness | 4 (3.1) |
Vomiting | 2 (1.6) |
Mood changes | 2 (1.6) |
Fatigue | 0 |
Other symptom | 55 (43.0) |
MBS at week 48 | |
N | 112 |
Very much improved, n (%) | 40 (35.7) |
Much improved, n (%) | 44 (39.3) |
Minimally improved, n (%) | 17 (15.2) |
No change, n (%) | 11 (9.8) |
Minimally worse, n (%) | 0 |
Much worse, n (%) | 0 |
Very much worse, n (%) | 0 |
PGIC | |
PGIC response at week 104c | |
N | 96 |
Very much improved, n (%) | 47 (49.0) |
Much improved, n (%) | 33 (34.4) |
Minimally improved, n (%) | 11 (11.5) |
No change, n (%) | 5 (5.2) |
Minimally worse, n (%) | 0 |
Much worse, n (%) | 0 |
Very much worse, n (%) | 0 |
EQ-5D-5L = 5-Level EQ-5D questionnaire; HIT-6 = Headache Impact Test 6-item; MBS = most bothersome symptom; PGIC = Patient Global Impression of Change; PRO = patient-reported outcome; SD = standard deviation; VAS = visual analogue scale.
Note: Baseline was defined as the last assessment conducted before dosing on day 0. For change from baseline, only patients with a value at both baseline and postbaseline visits were included.
aSummary of EQ-5D VAS assessments were provided for baseline, week 4, and week 12, and every 12 weeks thereafter, up to week 48. Summary of MBS assessments were provided for baseline, day 0, week 4, week 8, and week 12, and every 12 weeks thereafter, up to week 48. For both EQ-5D-5L and MBS, assessments were scheduled up to week 48.
bPatients rated their overall health using a VAS (0 = worst health imaginable; 100 = best health imaginable).
cAccording to patient’s impression of change in disease status since day 0.
Source: Clinical Study Report for PREVAIL trial.8
Other Patient-Reported Outcomes
For PGIC, most patients reported being “very much improved” (49.0%) or “much improved” (34.4%) at week 104 relative to baseline (n = 96). “Minimally improved” was reported by 11 patients (11.5%) and “no change” by 5 patients (5.2%). No patients reported being “minimally worse,” “much worse,” and “very much worse” at week 104 relative to baseline.8
Harms
Only those harms identified in the review protocol are reported below. A detailed summary of harms in the safety population in the PREVAIL trial is available in Table 32.
A total of 91 patients (71.1%) reported at least 1 TEAE, with the most common events (frequency > 5% of patients) being nasopharyngitis in 18 patients (14.1%), upper respiratory tract infection and sinusitis in 10 patients (7.8%) each, influenza in 8 patients (6.3%), and bronchitis and migraine in 7 patients (5.5%).8
A total of 5 patients (3.9%) reported at least 1 serious TEAE; no single event was reported in more than 1 patient (< 1%).8
A total of 8 patients (6.3%) reported any TEAE that led to study drug withdrawal, of which 3 patients (2.3%) reported study drug withdrawal due to hypersensitivity. No other single event was reported in more than 1 patient (1%).8
No deaths were reported for the duration of the open-label study.8
For notable TEAEs, hypersensitivity was reported in 5 patients (3.9%), hypertension was reported in 2 patients (1.6%), and anaphylactic reaction, hypotension, and deep vein thrombosis were reported in 1 patient (< 1%).8
Table 32: Summary of Harms in PREVAIL Trial (Safety Population)
Harm | Eptinezumab 300 mg (N = 128) |
|---|---|
Patients with at least 1 TEAE | |
n (%) | 91 (71.1) |
Most common events,a n (%) | |
Nasopharyngitis | 18 (14.1) |
Upper respiratory tract infection | 10 (7.8) |
Sinusitis | 10 (7.8) |
Influenza | 8 (6.3) |
Bronchitis | 7 (5.5) |
Migraine | 7 (5.5) |
Fatigue | 6 (4.7) |
Infusion-site extravasation | 6 (4.7) |
Pharyngitis streptococcal | ||||||||||||||||||||| |
Weight increased | 6 (4.7) |
Patients with at least 1 serious TEAE | |
n (%) | 5 (3.9) |
Anaphylactic reaction | 1 (< 1) |
Pneumonia | 1 (< 1) |
Diabetes mellitus inadequate control | 1 (< 1) |
Osteoarthritis | 1 (< 1) |
Uterine leiomyoma | 1 (< 1) |
Conversion disorder | 1 (< 1) |
Patients with any TEAE leading to study drug withdrawal | |
n (%) | 8 (6.3) |
Hypersensitivity | 3 (2.3) |
Anaphylactic reaction | 1 (< 1) |
Palpitations | 1 (< 1) |
Infusion-site erythema | 1 (< 1) |
Metabolism and nutrition disorders | 1 (< 1) |
Diabetes mellitus inadequate control | 1 (< 1) |
Complex regional pain syndrome | 1 (< 1) |
Deep vein thrombosis | 1 (< 1) |
Patients with any TEAE resulting in death | |
n (%) | 0 |
Notable harms, n (%) | |
Immune system disorders | |
Hypersensitivity | 5 (3.9) |
Anaphylactic reaction | 1 (< 1) |
Vascular disorders | 4 (3.1) |
Hypertension | ||||||||||||||||||||| |
Hypotension | 1 (< 1) |
Deep vein thrombosis | 1 (< 1) |
TEAE = treatment-emergent adverse event.
aReported in 5% or more of patients.
Note: Patients were counted only once per preferred term for events.
Source: Clinical Study Report for PREVAIL trial.8
Critical Appraisal
Internal Validity
In the absence of an active comparator or placebo group, the interpretation of the safety and efficacy results from the open-label PREVAIL study8 is limited. Interpretation of the safety and efficacy results may be further limited by the missing data in patient-reported outcomes at week 104, and only 86 patients (67.2%) received all 8 doses of eptinezumab. The open-label study design can bias the reporting of end points, particularly in any subjective measures included in the efficacy and safety parameters due to the unblinding of the study drug during the treatment period; the direction and magnitude of the bias is uncertain. Of note, 28 patients (21.9%) had participated in a prior clinical trial of eptinezumab. These patients were eligible to enrol if they had not experienced any clinically significant AEs related to the study drug during the previous study, as determined by the investigator. Consequently, these patients may be more tolerant to eptinezumab, and their inclusion may result in lower AEs rates than would be expected in a nonselected population. Although the study design only permitted those patients who received all 4 IV infusions in the primary treatment period to enter the secondary treatment period, this is unlikely to bias the results as a total of 112 patients (87.5%) received dose 4 of eptinezumab at week 36 (primary treatment period).
External Validity
The baseline characteristics in patients with chronic migraines in the PREVAIL trial were generally consistent with the baseline characteristics in the PROMISE-2 trial,7 which also included patients with CM. The clinical expert consulted by CADTH for this review had estimated that at least 80% of patients presenting with migraines in clinical practice are females; 109 patients (85.2%) were female in the PREVAIL trial.8 As only eptinezumab 300 mg was evaluated in the PREVAIL trial, the generalizability of the safety and efficacy results from the open-label study to the recommended dose of eptinezumab 100 mg administered by IV infusion every 12 weeks per product monograph may be limited.
Discussion
Summary of Available Evidence
Three pivotal, sponsor-funded, multicentre, double-blind RCTs were included in this review, each comparing eptinezumab 100 mg and eptinezumab 300 mg every 12 weeks, to placebo. A total of 892 patients with either EM or CM in the DELIVER trial,5 674 patients with frequent EM in the PROMISE-1 trial,6 and 1,050 patients with CM in the PROMISE-2 trial7 were randomized at a ratio of 1:1:1 to each of the eptinezumab 100 mg, eptinezumab 300 mg, or placebo groups. In the DELIVER and PROMISE-2 trials, patients received 2 doses of eptinezumab or placebo, 1 at baseline and 1 at week 12, and in the PROMISE-1 trial, patients received up to 4 doses of eptinezumab, also at 12-week intervals. The primary outcome in each of the 3 studies was the change from baseline to weeks 1 to 12 in MMDs. Key secondary outcomes, all controlled for multiplicity, included the number of patients achieving at least a 75% or at least a 50% reduction in MMDs, the number of patients with migraine 1 day after dosing, migraine prevalence on days 1 to 28 postdose, change from baseline in HIT-6 scores and acute medication usage. Additional information available to this review included an ITC submitted by the sponsor and a long-term, open-label study, PREVAIL.8
In the DELIVER trial,5 the mean age of patients was approximately 44 years, while in the PROMISE studies6,7 patients were close to 40 years of age. In all studies, the majority of patients were female (approximately 90% in the DELIVER trial, 82% in the PROMISE-1 trial,6 and 88% in the PROMISE-2 trial)7 and white (96% in DELIVER, 85% in the PROMISE-1 trial and 91% in the PROMISE-2 trial). In the DELIVER trial, 60% of patients had EM, and |||||||| had 14 or fewer MHDs, there were 62% with 2 prior migraine prophylaxis failures, 31% with 3 prior failures and 7% with 4 prior failures, 12% had a diagnosis of MOH. In the PROMISE-1 trial, 36% had greater than 9 MMDs, and 45% had 17 MMDs or greater.
Interpretation of Results
Efficacy
The sponsor requested that eptinezumab be reimbursed in patients who have experienced an inadequate response, intolerance, or contraindication to at least 2 prior prophylactic medications before being eligible for eptinezumab. Of the 3 included trials, only the DELIVER5 trial enrolled exclusively patients with a history of at least 2 prior prophylactic treatments, and therefore this is the only study that informs the reimbursement request. The type of prior failed treatments was not specified, and the clinical expert consulted by CADTH for this review noted that failure on a previous CGRP mAb should be counted among prior treatment failures, and should not disqualify someone from receiving a subsequent CGRP mAb. The clinical expert also noted that, although many treatment options are available that can potentially be used for migraine prophylaxis, there is often limited evidence supporting their use in migraine prophylaxis. In the DELIVER trial, treatment with eptinezumab 100 mg and eptinezumab 300 mg demonstrated a reduction in the frequency of MMDs compared to placebo at week 12 based on the primary outcome of change from baseline to weeks 1 to 12 in MMDs. The clinical expert consulted by CADTH on this review considered the reduction in MMDs reported across the included studies to be clinically significant. In the DELIVER trial, a benefit was also demonstrated for treatment with eptinezumab 100 mg and eptinezumab 300 mg relative to placebo based on the key secondary outcomes, such as 50% and 75% reduction in MMDs from baseline to weeks 1 to 12, change from baseline in MMDs from baseline to weeks 13 to 24, and change from baseline in the HIT-6. Based on subgroup analyses in the DELIVER trial, these results in the DELIVER trial appeared to be consistent regardless of whether patients had CM or EM, and regardless of whether patients had failed 2 prior prophylactics or more than 2. Findings from a recently completed but yet to be published study, SUNLIGHT, suggest that patients with MOH may not respond well to eptinezumab.26,27 The relatively small SUNLIGHT study (N = 193) enrolled patients with migraine and MOH at primarily sites in Asia, and reported a lack of superiority for eptinezumab versus placebo for the primary outcome of reduction in MMDs. While numerous caveats, such as the small sample size and the lack of a publication, are associated with these data, they do raise questions about the efficacy of eptinezumab in MOH. There was no clear indication from subgroup analyses in the DELIVER trial of a lack of efficacy for eptinezumab in MOH; however, there were relatively few patients in this subgroup (approximately 35 per group) and no formal hypothesis testing was conducted, making it difficult to draw any conclusions.
In addition to reducing the numbers of MMDs and MHDs, HRQoL is a key outcome of importance to patients, according to patient input submitted to CADTH. The impact of migraine on HRQoL is not surprising, given the large number of symptoms associated with the condition, most notably pain. Although HRQoL outcomes were assessed in the included trials, the lack of multiplicity control limits any conclusions that can be drawn from the relevant data. Of the HRQoL scales used, only MSQ has an MID specific to a population with migraine. In the DELIVER trial, when compared to placebo, results for role function restrictive, role function preventive, and emotional function were all greater than the between-group MID for each of these subscales, indicating an improvement in HRQoL among patients treated with eptinezumab according to the MSQ. Symptoms assessed using the HIT-6 were part of the MTP in the DELIVER trial, and the improvement associated with both doses was statistically significant and exceeded the MID for between-group differences. Therefore, although there is some evidence that the reduction in MMDs elicited by eptinezumab is accompanied by a statistically and clinically significant improvement in symptoms, the improvement in HRQoL versus placebo is less clear due to limitations with the way the analyses were conducted and the lack of MIDs specific to migraine.
There is some evidence from the included trials that eptinezumab works within the first 4 weeks of treatment, and the clinical expert consulted by CADTH on this review did not find that surprising, given the IV route of administration. All studies assessed the proportion of patients who had migraine the day after receiving their first dose; however, in only 1 of 3 studies were the P values reported controlled for multiplicity, limiting conclusions that can be drawn about how rapid the onset of action is for eptinezumab. Additionally, due to the relatively short-term nature of the included studies — only 2 doses of eptinezumab in 2 of the studies and up to 4 in the other — it is not clear how durable the response to eptinezumab will be. Although patients in the PROMISE-1 trial6 were to receive up to 4 doses of eptinezumab, this study had a high withdrawal rate, which both confounds the analyses presented from the study and raises the question of whether responses to eptinezumab would remain durable beyond the initial 2 doses, which is where almost all of the efficacy assessments were performed for all of the included studies, including the primary outcome, which was assessed at week 12. The PREVAIL8 study was a long-term, uncontrolled study that assessed longer-term efficacy and harms of eptinezumab 300 mg in CM, with patients receiving up to 8 doses. The lack of a control group makes it challenging to assess efficacy or harms; however, the patient withdrawal rate was lower (17%) in this study than in the PROMISE-1 trial (22% to 26%, respectively, across groups) perhaps suggesting other unknown reasons for the high withdrawals in the PROMISE-1 trial.
In the absence of direct comparative evidence, the sponsor submitted a fixed-effects NMA comparing eptinezumab with anti-CGRP treatments and onabotulinum toxin A in both EM and CM groups with 2 or more prior treatment failures. Outcomes of interest included 50% MRR, change from baseline in MMDs, change from baseline in MMDs with acute medication use, change from baseline in MSQ v2.1 domains (role function restrictive, emotional function, and role function preventive), 75% MRR, and change from baseline in HIT-6. ||||||||||||||||||||||||||||||||||||||||||||||||||||||||||||||||||||||||||||||||||||||||||||||||||||||||||||||||||||||||||||||||||||||||||||||||||||||||||||||||||||||||||||||||||||||||||||||||||||||||||||||||||||||||||||||||||||||||||||||||||||||||||||||||||||||||||||||||||||||||||||||||||||||||||||||||||||||||||||||||||||||||||||||||. There were both noted and unmarked heterogeneity between studies, resulting in wide 95% CrIs, calling into question the precision of estimates. Moreover, due to the lack of reporting for model statistics (i.e., deviance information criteria), it is uncertain if the fixed-effect model was the most appropriate choice for these comparisons, and the evidence does not support a conclusion of superiority of eptinezumab over erenumab and galcanezumab in terms of migraine frequency and severity. The sponsor-submitted NMA did not evaluate safety outcomes.
Harms
Notable harms of interest for eptinezumab included hypersensitivity reactions, vascular and cardiovascular events, suicidality, and hepatic events, and these events occurred infrequently across the trials, with no indication of an elevated risk associated with eptinezumab. Injection-related reactions, in particular, tend to be relatively common with some of the CGRP mAbs, according to the clinical expert consulted by CADTH for this review; however, infusion reactions only occurred in less than 1% to 3% of patients treated with eptinezumab across the 3 studies, and there was no clear numerical difference in risk versus placebo. Across the studies, only 2 patients, both in the DELIVER trial5 and both in the 300 mg dose group, experienced an SAE of hypersensitivity. The clinical expert also noted that the need for fewer injections of eptinezumab could be considered an advantage due to the relatively high frequency of injection reactions with other CGRP mAbs such as galcanezumab, although it is not known whether the relatively low frequency of infusion reactions was due to relatively few infusions or whether something about eptinezumab makes it less likely to cause infusion/injection reactions compared to other CGRP mAbs. Hypersensitivity reactions occurred with numerically higher frequency in the PREVAIL trial8 (4%), in which patients received more doses of eptinezumab; however, there are challenges with making such naive comparisons, particularly because the PREVAIL trial lacked a control group.
The sponsor-submitted NMA did not evaluate safety outcomes.
Conclusions
Evidence from 3 double-blind RCTs suggests that eptinezumab 100 mg and 300 mg given intravenously every 12 weeks reduces monthly migraine frequency when used as prophylaxis in patients with EM or CM, relative to placebo. This reduction in migraine frequency may be accompanied by a reduction in the use of acute migraine medication and there is evidence of a reduction in symptoms on the HIT-6. No conclusions can be drawn regarding the impact of eptinezumab on HRQoL as there was no adjustment for multiplicity in the statistical analyses for this outcome. Eptinezumab appears to result in a relatively low risk of treatment discontinuations due to AE, and no safety issues were identified beyond what is described in the product monograph. However, double-blind treatment consisted of only 2 infusions in 2 studies, and a maximum of 4 infusions in a third study, and findings from a longer-term study are limited by the lack of a control group. No direct comparisons between eptinezumab and other prophylactic treatments for migraine were identified for this review. Results from an indirect comparison between eptinezumab and other CGRP inhibitors and onabotulinum toxin A were inconclusive due to methodological limitations with the analysis, and the indirect comparison did not assess safety.
References
1.Becker WJ, Findlay T, Moga C, Scott NA, Harstall C, Taenzer P. Guideline for primary care management of headache in adults. Can Fam Physician. 2015;61(8):670-679. PubMed
2.Cooke LJ, Becker WJ. Migraine prevalence, treatment and impact: the canadian women and migraine study. Can J Neurol Sci. 2010;37(5):580-587. PubMed
3.Lipton RB, Bigal ME, Diamond M, Freitag F, Reed ML, Stewart WF. Migraine prevalence, disease burden, and the need for preventive therapy. Neurology. 2007;68(5):343-349. PubMed
4.Vyepti (eptinezumab for injection): 100 mg/mL, solution for infusion [product monograph]. Saint-Laurent (QC): Lundbeck Canada Inc; 2021 Aug 20.
5.Clinical Study Report: 18898A. Interventional, randomized, double-blind, parallel-group, placebo-controlled study with an extension period to evaluate the efficacy and safety of eptinezumab for the prevention of migraine in patients with unsuccessful prior preventive treatments [internal sponsor's report]. Copenhagen (DK): H.Lundbeck A/S; 2021 Dec 10.
6.Clinical Study Report: ALD403-CLIN-006. A parallel group double-blind randomized placebo-controlled trial to evaluate the efficacy and safety of ALD403 administered intravenously in patients with frequent episodic migraines [internal sponsor's report]. Bothell (WA): Alder BioPharmaceuticals, Inc; 2018 Jul 26.
7.Clinical Study Report: ALD403-CLIN-011. A parallel group, double-blind, randomized, placebo controlled phase III trial to evaluate the efficacy and safety of ALD403 administered intravenously in patients with chronic migraine [internal sponsor's report]. Bothell (WA): Alder BioPharmaceuticals, Inc; 2018 Sep 19.
8.Clinical Study Report: ALD403-CLIN-013. An open-label phase III trial to evaluate the safety of ALD403 administered intravenously in patients with chronic migraine [internal sponsor's report]. Bothell (WA): Alder BioPharmaceuticals, Inc; 1800.
9.Network meta-analysis of eptinezumab versus key comparators for migraine prevention [internal sponsor's report]. In: Drug Reimbursement Review sponsor submission: Vyepti (eptinezumab), 100 mg/mL, solution for infusion. Montreal (QC): Lundbeck Canada Inc; 2022 Jun.
10.Ford JH, Jackson J, Milligan G, Cotton S, Ahl J, Aurora SK. A Real-World Analysis of Migraine: A Cross-Sectional Study of Disease Burden and Treatment Patterns. Headache. 2017;57(10):1532-1544. PubMed
11.Hepp Z, Bloudek LM, Varon SF. Systematic review of migraine prophylaxis adherence and persistence. J Manag Care Pharm. 2014;20(1):22-33. PubMed
12.McGowan J, Sampson M, Salzwedel DM, Cogo E, Foerster V, Lefebvre C. PRESS Peer Review of Electronic Search Strategies: 2015 guideline statement. J Clin Epidemiol. 2016;75:40-46. PubMed
13.Grey matters: a practical tool for searching health-related grey literature. Ottawa (ON): CADTH; 2019: https://www.cadth.ca/grey-matters. Accessed 2022 Jun 23.
14.Coeytaux RR, Kaufman JS, Chao R, Mann JD, Devellis RF. Four methods of estimating the minimal important difference score were compared to establish a clinically significant change in Headache Impact Test. J Clin Epidemiol. 2006;59(4):374-380. PubMed
15.Kawata AK, Coeytaux RR, Devellis RF, Finkel AG, Mann JD, Kahn K. Psychometric properties of the HIT-6 among patients in a headache-specialty practice. Headache. 2005;45(6):638-643. PubMed
16.Smelt AF, Assendelft WJ, Terwee CB, Ferrari MD, Blom JW. What is a clinically relevant change on the HIT-6 questionnaire? An estimation in a primary-care population of migraine patients. Cephalalgia. 2014;34(1):29-36. PubMed
17.Houts CR, Wirth RJ, McGinley JS, Cady R, Lipton RB. Determining Thresholds for Meaningful Change for the Headache Impact Test (HIT-6) Total and Item-Specific Scores in Chronic Migraine. Headache. 2020;60(9):2003-2013. PubMed
18.Yang M, Rendas-Baum R, Varon SF, Kosinski M. Validation of the Headache Impact Test (HIT-6) across episodic and chronic migraine. Cephalalgia. 2011;31(3):357-367. PubMed
19.Rendas-Baum R, Yang M, Varon SF, Bloudek LM, DeGryse RE, Kosinski M. Validation of the Headache Impact Test (HIT-6) in patients with chronic migraine. Health Qual Life Outcomes. 2014;12:117. PubMed
20.Houts CR, McGinley JS, Wirth RJ, Cady R, Lipton RB. Reliability and validity of the Headache Impact Test 6-itemin chronic migraine from the PROMISE-2 study. Qual Life Res. 2021;30(3):931-943. PubMed
21.EuroQol Research Foundation. EQ-5D-5L user guide: basic information on how to use the EQ-5D-5L instrument. 2019; https://euroqol.org/publications/user-guides/. Accessed 2022 Jul 18.
22.Bagley CL, Rendas-Baum R, Maglinte GA, et al. Validating Migraine-Specific Quality of Life Questionnaire v2.1 in episodic and chronic migraine. Headache. 2012;52(3):409-421. PubMed
23.Cole JC, Lin P, Rupnow MF. Minimal important differences in the Migraine-Specific Quality of Life Questionnaire (MSQ) version. Cephalalgia. 2009;29(11):1180-1187. PubMed
24.Speck RM, Yu R, Ford JH, Ayer DW, Bhandari R, Wyrwich KW. Psychometric validation and meaningful within-patient change of the Migraine-Specific Quality of Life questionnaire version 2.1 electronic patient-reported outcome in patients with episodic and chronic migraine. Headache. 2021;61(3):511-526. PubMed
25.Rendas-Baum R, Bloudek LM, Maglinte GA, Varon SF. The psychometric properties of the Migraine-Specific Quality of Life Questionnaire version 2.1 (MSQ) in chronic migraine patients. Qual Life Res. 2013;22(5):1123-1133. PubMed
26.Lundbeck's Migraine Drug Hits Roadblock in Phase III | BioSpace. https://www.biospace.com/article/phase-iii-stumble-dims-vyepti-s-sunlight-in-asia/. Accessed 2022 Sep 1.
27.Eptinezumab in Adults With Migraine and Medication Overuse Headache - Full Text View - ClinicalTrials.gov. https://clinicaltrials.gov/ct2/show/NCT04772742. Accessed 2022 Sep 1.
28.EuroQol--a new facility for the measurement of health-related quality of life. Health Policy. 1990;16(3):199-208. PubMed
29.Brooks R. EuroQol: the current state of play. Health Policy. 1996;37(1):53-72. PubMed
30.Dodick DW, Silberstein S, Saper J, et al. The impact of topiramate on health-related quality of life indicators in chronic migraine. Headache. 2007;47(10):1398-1408. PubMed
31.Kosinski M, Bayliss MS, Bjorner JB, et al. A six-item short-form survey for measuring headache impact: the HIT-6. Qual Life Res. 2003;12(8):963-974. PubMed
32.Dunlop BW, Gray J, Rapaport MH. Transdiagnostic clinical global impression scoring for routine clinical settings. Behavioral sciences (Basel, Switzerland). 2017;7(3). PubMed
33.Forkmann T, Scherer A, Boecker M, Pawelzik M, Jostes R, Gauggel S. The Clinical Global Impression Scale and the influence of patient or staff perspective on outcome. BMC Psychiatry. 2011;11:83. PubMed
34.Kadouri A, Corruble E, Falissard B. The improved Clinical Global Impression Scale (iCGI): development and validation in depression. BMC Psychiatry. 2007;7:7. PubMed
35.McClure NS, Sayah FA, Xie F, Luo N, Johnson JA. Instrument-defined estimates of the minimally important difference for EQ-5D-5L index scores. Value Health. 2017;20(4):644-650. PubMed
36.Schober P, Boer C, Schwarte LA. Correlation coefficients: appropriate use and interpretation. Anesth Analg. 2018;126(5):1763-1768. PubMed
37.Cohen J. A power primer. Psychol Bull. 1992;112(1):155-159. PubMed
38.Ailani J, Burch RC, Robbins MS. The American Headache Society Consensus Statement: Update on integrating new migraine treatments into clinical practice. Headache. 2021;61(7):1021-1039. PubMed
Appendix 1: Literature Search Strategy
Note that this appendix has not been copy-edited.
Clinical Literature Search
Overview
Interface: Ovid
Databases:
MEDLINE All (1946 to present)
Embase (1974 to present)
Note: Subject headings and search fields have been customized for each database. Duplicates between databases were removed in Ovid.
Date of search: July 7, 2022
Alerts: Bi-weekly search updates until project completion.
Search filters applied: No filters were applied to limit the retrieval by study type.
Limits:
No date or language limits were used.
Conference abstracts: excluded.
Syntax | Description |
|---|---|
/ | At the end of a phrase, searches the phrase as a subject heading |
MeSH | Medical Subject Heading |
.fs | Floating subheading |
exp | Explode a subject heading |
* | Before a word, indicates that the marked subject heading is a primary topic; or, after a word, a truncation symbol (wildcard) to retrieve plurals or varying endings |
.ti | Title |
.ot | Original title |
.ab | Abstract |
.hw | Heading word; usually includes subject headings and controlled vocabulary |
.kf | Author keyword heading word (MEDLINE) |
.dq | Candidate term word (Embase) |
.rn | Registry number |
.nm | Name of substance word (MEDLINE) |
medall | Ovid database code: MEDLINE All, 1946 to present, updated daily |
oemezd | Ovid database code; Embase, 1974 to present, updated daily |
Multi-Database Strategy
(Eptinezumab* or Vyepti or ald 403 or ald403 or 8202AY8I7H).ti,ab,kf,ot,hw,rn,nm.
1 use medall
* eptinezumab/ or (Eptinezumab* or Vyepti or ald 403 or ald403).ti,ab,kf,dq.
3 use oemezd
4 not (conference review or conference abstract).pt.
2 or 5
remove duplicates from 6
Clinical Trials Registries
ClinicalTrials.gov
Produced by the US National Library of Medicine. Targeted search used to capture registered clinical trials.
[Search -- Studies with results | Vyepti or eptinezumab]
WHO ICTRP
International Clinical Trials Registry Platform, produced by the World Health Organization. Targeted search used to capture registered clinical trials.
[Search terms -- Vyepti or eptinezumab]
Health Canada’s Clinical Trials Database
Produced by Health Canada. Targeted search used to capture registered clinical trials.
[Search terms -- Vyepti or eptinezumab]
EU Clinical Trials Register
European Union Clinical Trials Register, produced by the European Union. Targeted search used to capture registered clinical trials.
[Search terms -- Vyepti or eptinezumab]
Grey Literature
Search dates: June 23, 2022, to June 29, 2022
Keywords: Vyepti, eptinezumab, migraine
Limits: None
Updated: Search updated prior to the completion of stakeholder feedback period
Relevant websites from the following sections of the CADTH grey literature checklist Grey Matters: A Practical Tool for Searching Health-Related Grey Literature were searched:
Health Technology Assessment Agencies
Health Economics
Clinical Practice Guidelines
Drug and Device Regulatory Approvals
Advisories and Warnings
Drug Class Reviews
Clinical Trials Registries
Databases (free)
Health Statistics
Internet Search
Appendix 2: Excluded Studies
There were no excluded studies for this review.
Appendix 3: Detailed Outcome Data
Note that this appendix has not been copy-edited.
Table 34: Subgroup Data (DELIVER Trial)
Outcome | DELIVER | ||
|---|---|---|---|
EPT100 | EPT300 | PLACEBO | |
||||||||||||||||||||||||||||||||||||||||||||||||||||||||||||||| | |||
||||||||||||||||||||||||||||||||||||||||||||||||||||||||||||||| | |||
||||||||||||||||||||||||||||||||||||||||||||||||||||||||||||||| | |||
||||||||||||||||||||||||||||||||||||||||||||||||||||||||||||||| | ||||||||||||||||||||| | ||||||||||||||||||||| | ||||||||||||||||||||| |
||||||||||||||||||||||||||||||||||||||||||||||||||||||||||||||| | ||||||||||||||||||||| | ||||||||||||||||||||| | ||||||||||||||||||||| |
||||||||||||||||||||||||||||||||||||||||||||||||||||||||||||||| | ||||||||||||||||||||| | ||||||||||||||||||||| | ||||||||||||||||||||| |
||||||||||||||||||||||||||||||||||||||||||||||||||||||||||||||| | ||||||||||||||||||||| | ||
||||||||||||||||||||||||||||||||||||||||||||||||||||||||||||||| | |||
||||||||||||||||||||||||||||||||||||||||||||||||||||||||||||||| | |||
||||||||||||||||||||||||||||||||||||||||||||||||||||||||||||||| | ||||||||||||||||||||| | ||||||||||||||||||||| | ||||||||||||||||||||| |
||||||||||||||||||||||||||||||||||||||||||||||||||||||||||||||| | ||||||||||||||||||||| | ||||||||||||||||||||| | ||||||||||||||||||||| |
||||||||||||||||||||||||||||||||||||||||||||||||||||||||||||||| | ||||||||||||||||||||| | ||||||||||||||||||||| | ||||||||||||||||||||| |
||||||||||||||||||||||||||||||||||||||||||||||||||||||||||||||| | ||||||||||||||||||||| | ||||||||||||||||||||| | ||||||||||||||||||||| |
||||||||||||||||||||||||||||||||||||||||||||||||||||||||||||||| | ||||||||||||||||||||| | ||||||||||||||||||||| | ||||||||||||||||||||| |
||||||||||||||||||||||||||||||||||||||||||||||||||||||||||||||| | ||||||||||||||||||||| | ||||||||||||||||||||| | ||||||||||||||||||||| |
||||||||||||||||||||||||||||||||||||||||||||||||||||||||||||||| | ||||||||||||||||||||| | ||||||||||||||||||||| | ||||||||||||||||||||| |
||||||||||||||||||||||||||||||||||||||||||||||||||||||||||||||| | ||||||||||||||||||||| | ||
||||||||||||||||||||||||||||||||||||||||||||||||||||||||||||||| | |||
||||||||||||||||||||||||||||||||||||||||||||||||||||||||||||||| | |||
||||||||||||||||||||||||||||||||||||||||||||||||||||||||||||||| | ||||||||||||||||||||| | ||||||||||||||||||||| | ||||||||||||||||||||| |
||||||||||||||||||||||||||||||||||||||||||||||||||||||||||||||| | ||||||||||||||||||||| | ||||||||||||||||||||| | ||||||||||||||||||||| |
||||||||||||||||||||||||||||||||||||||||||||||||||||||||||||||| | ||||||||||||||||||||| | ||||||||||||||||||||| | ||||||||||||||||||||| |
||||||||||||||||||||||||||||||||||||||||||||||||||||||||||||||| | ||||||||||||||||||||| | ||||||||||||||||||||| | ||||||||||||||||||||| |
||||||||||||||||||||||||||||||||||||||||||||||||||||||||||||||| | ||||||||||||||||||||| | ||||||||||||||||||||| | ||||||||||||||||||||| |
||||||||||||||||||||||||||||||||||||||||||||||||||||||||||||||| | ||||||||||||||||||||| | ||||||||||||||||||||| | ||||||||||||||||||||| |
||||||||||||||||||||||||||||||||||||||||||||||||||||||||||||||| | ||||||||||||||||||||| | ||||||||||||||||||||| | ||||||||||||||||||||| |
||||||||||||||||||||||||||||||||||||||||||||||||||||||||||||||| | |||
||||||||||||||||||||||||||||||||||||||||||||||||||||||||||||||| | ||||||||||||||||||||| | ||||||||||||||||||||| | ||||||||||||||||||||| |
||||||||||||||||||||||||||||||||||||||||||||||||||||||||||||||| | ||||||||||||||||||||| | ||||||||||||||||||||| | ||||||||||||||||||||| |
||||||||||||||||||||||||||||||||||||||||||||||||||||||||||||||| | ||||||||||||||||||||| | ||||||||||||||||||||| | ||||||||||||||||||||| |
||||||||||||||||||||||||||||||||||||||||||||||||||||||||||||||| | ||||||||||||||||||||| | ||||||||||||||||||||| | ||||||||||||||||||||| |
||||||||||||||||||||||||||||||||||||||||||||||||||||||||||||||| | ||||||||||||||||||||| | ||||||||||||||||||||| | ||||||||||||||||||||| |
||||||||||||||||||||||||||||||||||||||||||||||||||||||||||||||| | ||||||||||||||||||||| | ||||||||||||||||||||| | ||||||||||||||||||||| |
||||||||||||||||||||||||||||||||||||||||||||||||||||||||||||||| | ||||||||||||||||||||| | ||
CFB = change from baseline; CM = chronic migraine; CI = confidence interval; EM = episodic migraine; MMD = monthly migraine day; MOH = medication overuse headache; SE = standard error.
Source: Clinical Study Report for DELIVER trial.5
Table 35: Subgroup Data (PROMISE-1 and PROMISE-2 Trials)
Outcome | PROMISE-1 | PROMISE-2 | ||||
|---|---|---|---|---|---|---|
EPT100 | EPT300 | PLACEBO | EPT100 | EPT300 | PLACEBO | |
Change from baseline in MMDs to weeks 1-12 | ||||||
By frequency of migraine at baseline | ||||||
Subgroup | Baseline Migraine Days ≤9 days | Baseline Migraine Days < 17 days | ||||
Mean (SD) baseline | NR N = 142 | NR N = 142 | NR N = 144 | |||||||||||||| | |||||||||||||| | |||||||||||||| |
Mean (SD) CFB | -3.2 (2.76) | -3.6 (2.86) | -2.1 (3.52) | -6.8 ||||||| | -7.4 ||||||| | -4.3 ||||||| |
Mean diff vs placebo (95% CI) | -1.1 (-1.9 to −0.4) | -1.5 (-2.2 to −0.7) | NA | -2.6 (-3.6 to −1.5) | -3.1 (-4.1 to −2.1) | NA |
P value | NR | NR | NR | NR | NR | NR |
Subgroup | Baseline Migraine Days > 9 days | Baseline Migraine Days ≥17 days | ||||
Mean (SD) baseline | NR N = 79 | NR N = 80 | NR N = 78 | |||||||||||||| | |||||||||||||| | |||||||||||||| |
Mean (SD) CFB | -5.1 (3.65) | -5.6 (3.95) | -4.8 (3.40) | -8.9 ||||||| | -9.5 ||||||| | -7.7 ||||||| |
Mean diff vs placebo (95% CI) | -0.3 (-1.5, 0.8) | -0.8 (-1.9, 0.4) | NA | -1.2 (-2.7, 0.4) | -1.8 (-3.3 to −0.3) | NA |
P value | NR | NR | NR | NR | NR | NR |
Interaction P value | NR | NR | NR | NR | NR | NR |
By MOH | ||||||
Patients with MOH | ||||||
Baseline | NR | NR | NR | 16.7 (4.6) N = 139 | 16.7 (4.9) N = 147 | 16.7 (4.4) N = 145 |
Mean (SD) CFB to weeks 1-12 | NR | NR | NR | -8.4 (6.29) | -8.6 (5.74) | -5.4 (6.72) |
Mean diff vs placebo (95% CI) | NR | NR | NR | -3.0 (-4.6 to −1.5) | -3.2 (-4.7 to −1.8) | |
Patients without MOH | ||||||
Baseline | NR | NR | NR | |||||||||||||| | |||||||||||||| | |||||||||||||| |
Mean (SD) CFB to weeks 1-12 | NR | NR | NR | -7.4 ||||||| | -8.1 ||||||| | -6.1 ||||||| |
Mean diff vs placebo (95% CI) | NR | NR | NR | -1.3 (-2.4 to −0.2) | -2.1 (-3.2 to −0.9) | NA |
P value | NR | NR | NR | NR | NR | NR |
Interaction P value | NR | NR | NR | NR | NR | NR |
By previous failures | ||||||
NR | NR | NR | NR | Only reported prior prophylactic use/not | ||
CFB=change from baseline; CI=confidence interval; MMD=monthly migraine day; MOH=medication overuse headache; NR=not reported; SE=standard error
Source: Clinical Study Report for PROMISE-16 and PROMISE-2 trials.7
Appendix 4: Description and Appraisal of Outcome Measures
Note that this appendix has not been copy-edited.
Aim
To describe the following outcome measures and review their measurement properties including validity, reliability, responsiveness to change, and the MID:
Patient Global Impression of Change (PGIC)
EuroQol of Life – 5-Dimensional – 5-Level (EQ-5D-5L)
Migraine-Specific Quality of Life Questionnaire, version 2.1 (MSQ v2.1)
Six-item Headache Impact Test (HIT-6)
Most Bothersome Symptom (MBS)
Work Productivity and Activity Impairment Questionnaire: Migraine (WPAI:M)
Findings
The validity, reliability, responsiveness, and the MID of each outcome measure were summarized and evaluated in Table 36.
Table 36: Summary of Outcome Measures and their Measurement Properties
Outcome measure | Type | Conclusions about measurement properties | MID |
|---|---|---|---|
PGIC | A single item rating scale used to assess a patient’s impression of the overall change experienced in the disease status since the start of study. Patients were asked to rate their impression on a 7-point scale that ranged from “very much better” to “very much worse;” higher scores indicate worsening.5 | Studies determining the validity, reliability, and responsiveness to change of PGIC in patients with migraine were not identified in the literature. | Studies determining the MID in PGIC was not identified in patients with migraine. |
EQ-5D-5L | A generic instrument that is applicable to a wide range of health conditions and treatments to assess health status.21,28,29 The descriptive system comprises of 5 dimensions: mobility, self-care, usual activities, pain/discomfort, and anxiety/depression. Patients respond to each dimension using 5 levels (1 = no problems; 5 = extreme problems or unable to perform). Results from the descriptive system can be converted into a single, country-specific index score (0 = dead; 1.0 = perfect health). Negative scores are health states that the society considers to be worse than dead. The EQ VAS records the patient’s self-rated health on a vertical VAS with end points labelled as 0 (worst health imaginable) and 100 (best health imaginable). Patients mark an “X” on the scale that best reflects their health on that day.21 | Studies determining the validity, reliability, and responsiveness to change of EQ-5D-5L in patients with migraine were not identified in the literature. | Studies determining the MID in EQ-5D-5L was not identified in patients with migraine. |
MSQ v2.1 | A 14-item questionnaire used to assess quality of life in patients with migraine across 3 domains: role function – restrictive (7 items), role function – preventive (4 items), and emotional function (3 items).22 Items are rated on a 6-point scale (1 = none of the time; 6 = all of the time). Overall score for each domain is obtained by summing the item responses then rescaling to a 0- to 100-point scale with higher scores indicative of better quality of life | Validity: Support had been demonstrated for the construct and known-groups validity when compared to other headache-related and HRQoL instruments in patients with EM and CM.22,24,25 Reliability: Internal consistency and test-retest reliability were adequate in patients with EM and CM.22,24,25 Responsiveness: Support had been demonstrated for the responsiveness to change in patients with EM and CM.24,25 | In patients with 3 to 12 migraines per month but not more than 15 HDPM: |
HIT-6 | A 6-item questionnaire used to quantify the impact of headaches on a patient’s daily life.31 Each item is rated on a 5-point Likert scale based on the following responses: never, rarely, sometimes, very often, or always, which are assigned 6, 8, 10, 11, or 13 points, respectively. Total HIT-6 scores range from 36 to 78 where a higher score indicates a greater impact of headache on daily life.14,15 The scores may also be interpreted as follows: 36 to 49 points indicate little or no impact, 50 to 55 points for some impact, 56 to 59 indicate substantial impact, and 60 to 78 points reflect severe impact.15 | Validity: Support had been demonstrated for the construct validity when compared to other headache-related assessments in patients with EM, CM, and nonmigraine headaches.18 Support had been demonstrated for the construct and convergent validity in patients with CM.19 Support had been demonstrated for the convergent and known-groups validity in patients with CM.20 Reliability: Internal consistency20 and test-retest reliability were adequate in patients with CM, EM, and nonmigraine headaches.18,19 Responsiveness: Responsiveness to change was demonstrated in patients with CM.19,20 | Estimated within-patient MID was 2.5 points and 6 points in patients with migraine.16 Estimated within-patient MID (responder definition) was 6 points in patients with CM.17 Estimated between-group MID was 1.5 points in patients with migraine.16 |
MBS | During the baseline visit, the MBS associated with the patient’s migraine was collected by the investigator. Patients rated improvement in this MBS from baseline on a 7-point scale that ranged from “very much improved” to “very much worse,” with a higher score indicating worsening.5 | Studies determining the validity, reliability, and responsiveness to change of MBS in patients with migraine were not identified in the literature. | Studies determining the MID in MBS was not identified in patients with migraine. |
WPAI:M | A 6-item questionnaire used to assess the impact of migraine on work productivity and activity impairment. Items were (1) employment status, (2) work-hours missed due to migraine, (3) work-hours missed due to other reasons, (4) hours worked, (5) impact of migraine on productivity at work, and (6) impact of migraine on daily activity performance, other than work.5 | Studies determining the validity, reliability, and responsiveness to change of WPAI:M in patients with migraine were not identified in the literature. | Studies determining the MID in WPAI:M was not identified in patients with migraine. |
CM = chronic migraines; EM = episodic migraines; EQ-5D-5L = 5-Level EQ-5D questionnaire; HDPM = headache days per month; HIT-6 = Headache Impact Test 6-item; HRQoL = health-related quality of life; MID = minimal important difference; MBS = most bothersome symptom; MSQ v2.1 = Migraine-Specific Quality of Life questionnaire, version 2.1; PGIC = Patient Global Impression of Change; VAS = visual analogue scale; WPAI:M = Work Productivity and Activity Impairment: Migraine.
Patient Global Impression of Change
PGIC consisted of a single item used to reflect the impression that patients have of the overall change in the disease status (activity limitations, symptoms, emotions, and overall quality of life) since the study initiated. Patients were asked to rate their impression on a 7-point scale that ranged from “very much improved” to “very much worse,” with a higher score indicating worsening.5
The Clinical Global Impression scales are among the most widely used, rapidly administered, and accessible measures for evaluating psychiatric outcomes in clinical trials. Despite wide acceptance, little psychometric validation of these scales has been performed, especially outside of specific disorders such as schizophrenia, depression, and social anxiety. The scales have been criticized for lacking consistency, reliability, validity, scoring anchors, and responsiveness. It has been argued that CGI measures may not lend themselves to the establishment of a clinically important change as they are too simple to precisely measure treatment effects, especially as new drugs may only offer incremental benefits.32-34
Studies determining the validity, reliability, responsiveness to change, and MID in patients with migraine were not identified in the literature.
EQ-5D-5L Questionnaire
The EQ-5D-5L is a generic, patient-reported outcome measure that is applicable to a wide range of health conditions and treatments used to assess health status.21,28,29 The instrument consists of a descriptive system questionnaire and the EQ visual analogue scale (VAS).21 The descriptive system comprises of 5 dimensions: mobility, self-care, usual activities, pain or discomfort, and anxiety or depression. Patients respond to each dimension using 5 levels where 1 = no problems, 2 = slight problems, 3 = moderate problems, 4 = severe problems, and 5 = extreme problems or unable to perform. Respondents are asked to choose the level that reflects their health state. In terms of measurement properties, these are ordinal data; they do not have interval properties and therefore, are not used to produce an individual dimension score. Results from the EQ-5D-5L descriptive system can be converted into a single, country-specific index value using a scoring algorithm taking the local patient and population preferences into account. A health state index score of 0 represents the health state dead and 1.0 reflects perfect health. Negative scores are also possible for health states that society, not the patient, considers to be worse than dead. The EQ VAS records the respondent’s self-rated health on a vertical VAS where the end points are labelled 0 (the worst health imaginable) and 100 (the best health imaginable). Respondents are asked to mark an “X” on the scale that best represents their health on that day.21
No literature that assessed the validity, reliability, or responsiveness to change of EQ-5D-5L in patients with migraine was identified.
A Canada-specific estimate of a MID for the EQ-5D-5L (descriptive system only) was generated by simulating the effects of single-level transitions in each dimension.35 The results yielded MIDs with a summarized mean of 0.056 (SD = 0.011), and a summarized median of 0.056 (interquartile range = 0.049 to 0.063). After exclusion of the maximum-valued scoring parameter (a single-level transition that results in a change in the index score that is larger than the estimate MID), the results yielded MIDs with a summarized mean of 0.037 (SD = 0.001), and a summarized median of 0.037 (interquartile range = 0.037 to 0.038). No literature that assessed the MID in patients with migraine was identified.
Migraine-Specific Quality of Life Questionnaire, Version 2.1
MSQ v2.1 is a 14-item questionnaire used to assess quality of life in patients with migraine across 3 domains: role function restrictive (7 items assessing how migraines limit daily activities related to social and work life), role function preventive (4 items assessing how migraines prevent said activities), and emotional function (3 items assessing the emotions associated with migraines).22 The recall period is 4 weeks and items are rated on a 6-point Likert scale where 1 = none of the time, 2 = a little bit of the time, 3 = some of the time, 4 = a good bit of the time, 5 = most of the time, and 6 = all of the time. The overall score for each domain is obtained by summing the item responses then rescaling to a 0- to 100-point scale with higher scores indicative of better quality of life.
Bagley et al.22 evaluated the validity and reliability of MSQ v2.1 in patients with EM or CM. The study was a web-based, cross-sectional survey conducted in 8,726 patients with EM (< 15 headache days per month [HDPM]) or CM (15 HDPM) across 9 countries. Construct validity was assessed using Pearson’s correlation coefficients (r) of the MSQ v2.1 scores and other HRQoL instruments. Based on the overall study population of both EM and CM, correlations were moderate to strong between MSQ v2.1 and the Headache Impact Test 6-item(HIT-6) (r = –0.60 to –0.71), weak to moderate for MSQ v2.1 and the 4-item Patient Health Questionnaire (PHQ-4) (r = –0.31 to –0.42), and weak for MSQ v2.1 and the MIDAS (r = –0.38 to –0.39) and HDPM (r = –0.17 to –0.24).22,36 Overall, this provided some support for the convergent and discriminant validity of MSQ v2.1. Similar results were observed in the EM and CM groups separately.22 Known-groups validity was demonstrated using the same HRQoL measures; a statistically significant difference was observed for the mean MSQ v2.1 scores between different migraine frequency groups. Internal consistencies were measured with a Cronbach alpha for the overall study population for RR, RP, and EF (0.96, 0.90, and 0.87, respectively), and was acceptable based on a threshold of 0.70. Internal consistency was also adequate for each of the EM and CM populations with a Cronbach alpha of 0.86 or greater for each domain.
Speck et al.24 assessed the validity, reliability, and responsiveness of the electronic MSQ v2.1 using data from EVOLVE-1, EVOLVE-2, and REGAIN which were studies in adult patients with EM or CM. For convergent validity, they found moderate to strong correlations between each of the 3 domains of MSQ v2.1 when compared to MIDAS and the Patient Global Impression of Severity of Illness (PGI-S). Spearman rank correlations ranged from 0.46 to 0.57 for RR, from 0.35 to 0.57 for RP, and from 0.38 to 0.51 for EF domain and the correlations were stronger with MIDAS than with PGI-S. The correlations between each domain and the number of monthly migraine headache days at baseline were determined to be weak. The correlations ranged from 0.22 to 0.27 for RR, 0.13 to 0.22 for RP, and 0.17 to 0.22 for EF. Spearman rank correlations across the domains (RR, RP, and EF) compared to HDPM were also stronger for patients with CM versus those with EM (–0.60, –0.48, and –0.47 versus –0.47, –0.35, and –0.35), respectively. Internal consistency and test-retest reliability (assessed 1 month apart) were adequate for all 3 domains of MSQ v2.1 (Cronbach alpha ranged from 0.83 to 0.93 and intraclass correlation coefficient [ICC] ranged from 0.77 to 0.92). Patients who had a ≥1 level of improvement on the MIDAS, PGI-S, or the Patient Global Impression of Improvement (PGI-I) and/or at least a 50% reduction in HDPM during the first 3 months of treatment also had a significant improvement in all 3 MSQ v2.1 domains compared to those who did not have such improvements, thereby demonstrating responsiveness. Lastly, the investigators observed no significant floor or ceiling effects from the data in any of the studies.
Rendas-Baum et al.25 provided further support for the validity, reliability, and responsiveness of MSQ v2.1 in patients with CM undergoing prophylactic treatment. Data were pooled from 2 clinical trials of onabotulinum toxin A, PREEMPT-1 and PREEMPT-2, and included 1,376 patients. MSQ v2.1 and HIT-6 scores were moderately to strongly correlated,36 Pearson correlation values ranged from –0.59 (EF) to –0.75 (RR) at baseline and –0.74 (EF and RP) and –0.86 (RR) at week 24, thereby demonstrating adequate validity.25 Internal consistency at baseline was acceptable according to the Cronbach alpha of 0.80 for all 3 domains, varying between 0.80 (EF) and 0.93 (RR). At 24 weeks, the Cronbach alpha remained acceptable and ranged from 0.90 to 0.97 across all domains in both studies. MSQ v2.1 change scores showed large and moderate effect sizes for patients who experienced ≥50% improvement and 30% to 50% improvement, respectively, indicating acceptable responsiveness.
Cole et al.23 estimated the MID at the group level and individual level for each MSQ v2.1 domain. The analyses were performed on the pooled data from 2 clinical trials of topiramate for migraine prophylaxis (N = 916) and the QualityMetric National Headache Survey (N = 1,016). The trials were randomized, double-blind, and placebo-controlled, and were conducted in Canada and US. Patients were 12 to 65 years of age and had 3 to 12 migraines per month (but not more than 15 HDPM during the 28-day baseline period). The QualityMetric database included adults aged 18 to 65 years in the US and experienced a headache at least once in the past 4 weeks prior to the phone interview. No study intervention was administered to the survey participants. Using a distribution-based method with Cohen d effect sizes from the pooled topiramate trial data, group-level MIDs were estimated to be 3.2, 4.6, and 7.5 for RR, RP, and EF, respectively.
Cole et al.23 also estimated the individual-level MIDs with anchor-based versus distribution-based methods. The anchors were average monthly migraine rate (30%, 40%, or 50% reduction), migraine status (yes/no), MIDAS, a difference in the frequency of headaches compared to 3 months prior (yes/no), bothered by headaches more now compared to 3 months prior (yes/no), and impact of migraine on day-to-day life (daily physical activities, feelings of frustration or irritability, limitations in daily activities, and overall quality of life). The individual-level MIDs according to the anchor-based techniques were 5.0 and 4.9 for RR, 5.0 and 7.9 for RP, and 8.0 and 10.6 for EF, based on the QualityMetric and pool topiramate trial dataset, respectively. Using the distribution-based method, the MIDs were calculated from one-half of the SD of each MSQ v2.1 domain from the pooled topiramate trial dataset and the QualityMetric dataset separately. In a second distribution-based technique, the MIDs were calculated from the SE of the mean (SEM) of the MSQ v2.1 domains in the pooled clinical trial dataset. The MIDs were 4.8, 8.3, and 8.6 for RR, 7.9, 8.5, and 9.9 for RP, and 10.6, 11.5, and 12.4 for EF. The authors suggested the within-group responder MID should be 5.0 for RR, between 5.0 and 8.0 for RP, and between 8.0 and 10.0 for EF. It is important to note that the datasets used by Cole et al.23 included patients with a maximum of 15 HDPM, meaning patients would be below the threshold for the classification of CM.
Dodick et al.30 estimated MIDs based on a multicentre, double-blind, randomized trial of 328 adults with CM who received either topiramate or placebo for 16 weeks. The mean age was 38.2 years (range = 18 to 74) and 85% of the study population was female. An anchor-based approach was used to estimate the MIDs based on within-group differences with the Subject Global Impression of Change (SGIC) serving as the anchor. The MID was estimated as the change in MSQ v2.1 domain score that corresponded to a unit improvement on the SGIC (the beta coefficient of the regression equation of MSQ domain with SGIC was the MID). The MIDs for the RR, RP, and EF were 10.9 (95% CI, 9.4 to 12.4), 8.3 (95% CI, 6.7 to 9.9), and 12.2 (95% CI, 10.2 to 14.3), respectively.
Six-item Headache Impact Test
HIT-6 is a 6-item questionnaire used to quantify the impact of headaches on a patient’s daily life.31 The items relate to pain, social functioning, role functioning, vitality, cognitive functioning, and psychological distress.15 Each item is rated on a 5-point Likert scale based on the following responses: never, rarely, sometimes, very often, or always, which are assigned 6, 8, 10, 11, or 13 points, respectively. Total HIT-6 scores range from 36 to 78 where a higher score indicates a greater impact of headache on daily life.14,15 The scores may also be interpreted using 4 groupings: 36 to 49 points indicate little or no impact, 50 to 55 points for some impact, 56 to 59 indicate substantial impact, and 60 to 78 points reflect severe impact.15
The validity and reliability of HIT-6 were first assessed by conducting an internet-based survey of 1,103 adults who had experienced a headache in the past 4 weeks that was not due to the common cold, flu, head injury, or hangover.31 A follow-up survey of 540 of the original adults was conducted 14 days after the first survey. HIT-6 demonstrated good internal consistency (Cronbach alpha was 0.89 and 0.90 for the first and second survey, respectively) and test-retest reliability (ICC = 0.78). For construct validity, correlation between HIT-6 scores and the Short Form (8) Health Survey (SF-8) scales and summary scores were obtained. Weak correlations were observed between HIT-6 and the role-physical and social functioning scales (r = –0.36 and r = –0.38, respectively) and with the bodily pain and mental health scales (r = –0.25 and r = –0.27, respectively).31,36,37 HIT-6 demonstrated a weak correlation with physical summary score (r = –0.35) and mental summary score (r = –0.31). The authors of the study suggested that the weak correlations with other instruments may be due to the heterogeneity of the HIT-6 content. HIT-6 was responsive to self-reported changes in headache impact. Scores improved for respondents who self-reported improved headache impact, whereas scores declined for respondents who self-reported worsening headache impact.31
The validity and reliability of HIT-6 was further assessed by Kawata et al.15 in patients with chronic daily headaches (≥15 HDPM). New patients at a headache clinic were asked to complete a set of questions at their first visit (N = 309). All patients were mailed a follow-up survey 4 months after their baseline assessment. The instrument showed good internal consistency (Cronbach alpha = 0.87). For construct validity, the correlations between HIT-6 scores and SF-36 domain scores were obtained. Moderate correlations were observed between HIT-6 scores and role-physical (r = –0.52) and social functioning subscales (r = –0.57). Correlations were weak with the mental health (r = –0.22) and general health (r = –0.29) subscales of SF-36.15
The validity and reliability of HIT-6 was assessed by Yang et al.18 in 2,049 patients with EM, CM, or nonmigraine headaches. Adult patients who had been participants of the National Survey of Headache Impact study and the HIT-6 validation study were selected. Both studies had similar inclusion and exclusion criteria, and data were pooled. A total of 6.4% of respondents had CM, 42.1% of respondents had EM, and 51.5% of respondents had nonmigraine headaches. The instrument showed strong37 internal consistency (Cronbach alpha = 0.83 and 0.90 for the first and second interview, respectively, in the total sample) and test-retest reliability (ICC = 0.77 for HIT-6 validation study respondents). Correlations between HIT-6 scores and other scores (MIDAS, headache pain severity, and number of HDPM) were also obtained. A moderate correlation was observed between HIT-6 scores and total MIDAS scores (r = 0.56), demonstrating construct validity. Correlation was moderate (r = 0.46) and weak (r = 0.29) with headache pain intensity and number of HDPM, respectively. For discriminant validity, HIT-6 scores differed significantly between subgroups of CM (mean score was 62.5 [SD = 7.8]), EM (mean score was 60.2 [SD = 7.8]), and nonmigraine headaches (mean score was 49.1 [SD = 8.7]) (p < 0.01); however, the sample size of the CM subgroup was relatively smaller in comparison to the other subgroups, and this may have affected the findings. The authors stated that patients with CM were more likely to have an increased impact severity level than patients with EM and nonmigraine headaches, in that order.18
Rendas-Baum et al.19 further validated the HIT-6 in 1,384 patients with CM using pooled data from 2 studies, PREEMPT-1 and PREEMPT-2, which investigated onabotulinum toxin A for the treatment of migraine. The correlation between HIT-6 and MSQ was determined; if correlation coefficients were less than –0.40, then HIT-6 was deemed as having convergent validity. Construct validity was examined by comparing mean scores across subgroups known to differ in the number of headache days within a 28-day period (< 10, 10 to 14, and ≥ 15) and cumulative hours of headache within a 28-day period (< 140, 140 to 279, 280 to 419, and ≥ 420) at week 24. Test-retest reliability was assessed with the ICC among a stable subsample at weeks 8 and 12. Internal consistency was assessed with Cronbach alpha, the average inter-item correlation, and the item-total correlation at baseline and week 24. Ability to detect change was evaluated by the difference in HIT-6 scores among patients who were “much improved” (≥ 50% decrease in headache frequency), “moderately improved” (≥ 30% to < 50% decrease in headache frequency), or “not improved or worsening” (< 30% decrease in headache frequency or worsening). HIT-6 correlated moderately to strongly36 with MSQ (–0.86 to –0.59) and discriminated between prespecified known subgroups, demonstrating convergent and construct validity. Test-retest reliability was demonstrated with an ICC of 0.76 to 0.80. HIT-6 also demonstrated internal consistency with a Cronbach alpha of 0.75 to 0.92, and average inter-item correlation and item-total correlation was above the threshold of 0.40. HIT-6 change scores were significantly higher for patients with greater improvement in headache frequency and cumulative hours of headache, demonstrating responsiveness to change.
Houts et al.20 further validated the HIT-6 in 1,072 patients with CM using data from the PROMISE-2 study. This was a randomized, double-blind, placebo-controlled, phase III clinical trial conducted to determine the safety and efficacy of eptinezumab for the prevention of CM. For convergent validity, Pearson correlations were reported for HIT-6 total score and reference measures with continuous variables, while Spearman correlations were reported for categorical/ordinal variables at baseline and week 12. At baseline, correlation was weak (r = 0.12 to 0.29) with EQ-5D-5L mobility and usual activities and the number of MMDs. At baseline, correlation was moderate (r = -0.34 to -0.42) with SF-36 bodily pain, physical role functioning, and emotional role functioning. At week 12, correlation was weak (r = 0.14) with EQ-5D-5L mobility; moderate (r = 0.38 to -0.40) with EQ-5D-5L usual activities and SF-36 emotional role functioning; and strong (r = 0.51 to -0.56) with SF-36 physical role functioning and bodily pain and the number of MMD. Known-groups validity was determined at week 12 for HIT-6 total scores according to the following subgroups of patients: the “improved group” was based on PGIC item responses with “very much improved” and “much improved” and the “not improved group” was based on PGIC item responses with “minimally improved,” “no change,” “minimally worse,” and “much worse.” Additionally, subgroups were defined by the frequency of headaches according to ≥15 HDPM versus < 15 HDPM. The “improved group” and < 15 HDPM group demonstrated lower HIT-6 total scores in comparison to the “non-improved group” and ≥15 HDPM (effect sizes were 1.09 and 0.88, respectively). Internal consistency at baseline was acceptable (Pearson correlation was 0.82, above the prespecified threshold of 0.70) for the total score, while the item-total correlations were variable (Pearson correlation ranged from 0.42 to 0.72). Test-retest reliability between screening and baseline did not meet the prespecified threshold of 0.70 (ICC = 0.65) for the total score. Change in HIT-6 total score was weakly37 correlated with change scores in EQ-5D-5L mobility and usual activities (r = 0.12 and 0.20, respectively) between baseline to week 12. Change in HIT-6 total score was moderately37 correlated with change scores in the number of MMDs and SF-36 emotional role functioning, physical role functioning, and bodily pain (r = 0.48 to −0.35 to −0.49, and -0.47, respectively). Change in HIT-6 total score was strongly37 correlated with change scores in PGIC (r = 0.57).
A MID in the HIT-6 score was estimated by Coeytaux et al.14 based on a study of 71 patients with chronic daily headaches defined as ≥ 15 HDPM. Patients were randomly assigned to 10 acupuncture sessions administered over 6 weeks and usual medical care (n = 34) or to usual medical care alone (n = 37). The mean age of the study population was 46 years (range, 19 to 83) and 80% were female. Patients suffered from a mean of 24.2 headaches (SD = 5.8) in the month prior to study enrolment. The mean pain severity was 6.4 (SD = 2.0) on an 11-point scale. Before randomization, HIT-6 was administered at baseline and again at week 6. The follow-up test included 1 additional question to determine the patient’s perceived clinical change to define a meaningful clinical difference: “Compared to 6 weeks ago, my headache condition is a) much better; b) somewhat better; c) about the same; d) somewhat worse; or e) much worse.”14 The MID was estimated using an anchor-based approach that compared HIT-6 scores of patients who reported clinical improvement to HIT-6 scores of patients who reported no clinical change. Four different anchors were used: Method 1 related HIT-6 change scores to levels of perceived improvement in clinical status; Method 2 compared HIT-6 change scores associated with some perceived clinical change to scores associated with no change; Method 3 compared HIT-6 follow-up scores between 2 levels of clinical improvement; and Method 4 compared HIT-6 change scores associated with each level of change to scores associated with no perceived clinical change, using a linear regression model. Similar MID estimates were obtained using different anchors; a between-group difference in the HIT-6 of 2.3 units suggests an improvement in a patient’s headache condition that may be considered clinically important. The authors also suggested a within-patient MID of 3.7 units based on the data obtained in patients who reported feeling “somewhat better.” Accuracy of recall may have been a limitation in the study given that patients had to recall their headache condition of 6 weeks before.
Smelt et al.16 estimated the within-patient and between-group MIDs for HIT-6 in patients with migraine. The dataset consisted of 490 patients with migraine who had participated in a pragmatic trial that compared a proactive approach by general practitioners to usual standard of care in the Netherlands. The mean age of patients was 47.9 years (SD = 10.1), 86% were female, and patients experienced a mean HDPM of 5.9 (SD = 3.9). The diagnosis of migraine, however, was not based on the International Headache Society criteria. Change scores on HIT-6 from baseline to month 3 (n = 368) were compared with 2 anchor questions: “(1) Compared to 3 months ago, how is your headache condition? a) much better; b) somewhat better; c) about the same; d) somewhat worse; e) much worse” and “(2) Compared to 3 months ago, how often do headaches limit your usual daily activities? a) a lot less often now; b) somewhat less often now; c) about the same; d) somewhat more often now; e) a lot more often now.” A within-patient MID was suggested by a mean change approach, which defines the MID as the mean change in HIT-6 score of the group of patients who reported being “somewhat better.” The between-group MID was estimated by subtracting the mean change score in the group that reported to be “about the same” from the mean change score of the group that reported to be “somewhat better.” An additional, receiver operating characteristic curve analysis was conducted to determine the within-patient MID. The within-patient MID was estimated to be –2.5 points based on the mean change approach and –6 points based on the receiver operating characteristic curve approach. The between-group MID was estimated to be –1.5 points.16
Houts et al.17 estimated a meaningful difference within-patients in the HIT-6 total and item-specific scores in patients with CM. The dataset consisted of adult patients (n = 1,072) with CM who participated in the PROMISE-2 study. Distribution- and anchor-based approaches were used to determine the threshold for a meaningful change within-patients over time for the HIT-6 total score and anchor-based approaches were used for the item-specific scores. Distribution-based approaches were based on the one-half SD of baseline scores and the SE of measurement at baseline. The anchor-based approaches were based on “improved” and “not improved” at week 12 relative to baseline according to the PGIC, EQ-5D-5L VAS, and the number of MMDs. To determine the final clinically meaningful change in HIT-6 total score and item-specific scores, the cumulative distribution function of change from baseline to week 12 were plotted against the anchor groups. In addition to the data from PROMISE-2 trial, values from existing literature were considered as well. According to the distribution-based approach, a clinically meaningful change in the HIT-6 total score was approximately -3.0 points and according to the anchor-based approach, it was estimated to be –10.0 and –11.0 points. Based on both PROMISE-2 data analyses results and previous literature findings, a clinically meaningful change in the HIT-6 total score to discriminate between patients with CM who have a meaningful change over time versus patients who have not was estimated to be –6.0 points. According to the anchor-based approaches, a clinically meaningful change was found to be a reduction of 1 severity step in items 1 to 3 and a reduction of 2 severity steps in items 4 to 6.17
According to the American Headache Society Consensus Statement,38 a reduction of greater than or equal to 5 points was considered to be a clinically meaningful improvement in the HIT-6. Of note, this was in the context of criteria for the continuation of monoclonal antibodies to calcitonin gene–related peptide or its receptor or neuromodulation therapy in patients with migraines.
Most Bothersome Symptom
At baseline, the MBS associated with the patient’s migraine was verbally collected by the investigator. Patients were asked to rate the improvement in this MBS from baseline on a 7-point scale that ranged from “very much improved” to “very much worse,” with a higher score indicating worsening. The areas of MBS included nausea, vomiting, sensitivity to light, sensitivity to sound, mental cloudiness, fatigue, pain with activity, mood changes, and other symptoms.5
Studies determining the validity, reliability, responsiveness to change, and MID in patients with migraine were not identified in the literature.
WPAI Questionnaire
The WPAI instrument is a 6-item questionnaire used to assess the impact of migraine on work productivity and activity impairment. The recall period was the preceding 7 days. The 6 items were (1) employment status, (2) work-hours missed due to migraine, (3) work-hours missed due to other reasons, (4) hours actually worked, (5) impact of migraine on productivity at work, and (6) impact of migraine on daily activity performance, other than work.5
Studies determining the validity, reliability, responsiveness to change, and MID in patients with migraine were not identified in the literature.
Pharmacoeconomic Review
Abbreviations
AE
adverse event
BIA
budget impact analysis
CM
chronic migraine
CGRP
calcitonin gene–related peptides
EM
episodic migraine
ICER
incremental cost-effectiveness ratio
NMA
network meta-analysis
MMD
monthly migraine day
QALY
quality-adjusted life-year
Executive Summary
The executive summary comprises 2 tables (Table 1 and Table 2) and a conclusion.
Item | Description |
|---|---|
Drug product | Eptinezumab (Vyepti), IV infusion |
Submitted price | Eptinezumab, 100 mg/mL solution vial: $1,665.00 per single-use vial |
Indication | For the prevention of migraine in adults who have at least 4 migraine days per month |
Health Canada approval status | NOC |
Health Canada review pathway | Standard |
NOC date | January 11, 2021 |
Reimbursement request | For the prevention of migraine in adults who have at least 4 migraine days per month and have experienced an inadequate response, intolerance, or contraindication to at least 2 oral prophylactic migraine medications |
Sponsor | Lundbeck Canada Inc. |
Submission history | Previously reviewed: No |
NOC = Notice of Compliance.
Table 2: Summary of Economic Evaluation
Component | Description |
|---|---|
Type of economic evaluation | Cost-utility analysis 12-week decision tree followed by Markov model |
Target population |
|
Treatments |
|
Comparators |
|
Perspective | Canadian publicly funded health care payer |
Outcomes | QALYs, life-years |
Time horizon | 5.1 years (66 cycles, including the initial 12-week decision tree) |
Key data source |
|
Submitted results |
|
Key limitations |
|
CADTH reanalysis results |
|
CDEC = CADTH Canadian Drug Expert Committee; CM = chronic migraine; CGRP = calcitonin gene–related peptide; EM = episodic migraine; ICER = incremental cost-effectiveness ratio; MMD = monthly migraine day; NMA = network meta-analysis; QALY = quality-adjusted life-year.
Conclusions
The CADTH clinical review concluded that eptinezumab 100 mg and 300 mg were superior to placebo for the preventive treatment of migraines in episodic migraine (EM) and chronic migraine (CM) adults who have at least 4 migraine days per month. In the absence of direct comparative evidence for eptinezumab versus other calcitonin gene–related peptide (CGRP) antagonists, the sponsor submitted a network meta-analysis (NMA) to inform comparative efficacy. The CADTH clinical review noted some limitations in the sponsor-submitted NMA in the form of wide 95% credible intervals due to heterogeneity in the included studies and a lack of reporting for model statistics. The CADTH clinical review of the NMA suggested that, for active comparators, ||||||||||||||||||||||||||||||||||||||||||||||||||||||||||||||||||||||||||||||||||||||||||||||||||||||||||||||||||||||||||||||||||||||||||||||||||||||||||||. For all other outcomes, |||||||||||||||||||||||||||||||||||||||||||||||||||||||||||||||||||||||||||||||||||||||||||||||||||||||||||||||||||||||||||||||||||||||||||||||||||||||||||||||||||||||| in both EM and CM.
Due to the limitations with the available comparative evidence, the CADTH reanalysis assumed no difference in treatment effect (i.e., equal quality-adjusted life-years [QALYs]) for eptinezumab 100 mg and 300 mg versus all other anti-CGRP drugs for the preventive treatment of migraine in adults who have at least 4 migraine days per month and have experienced an inadequate response, intolerance, or contraindication to at least 2 oral prophylactic migraine medications. A cost comparison focused on assessing annual drug costs was conducted. The annual drug cost of eptinezumab per patient is $7,240 when considering the 100 mg dose, which is more costly than all other anti-CGRPs, based on publicly available prices. The submitted price of eptinezumab 100 mg would need to be reduced by at least 11% to be equivalent to the lowest-priced reimbursed anti-CGRP (fremanezumab). When considering linear pricing for the 300 mg dose of eptinezumab, the submitted price would need to be reduced by 70%. The available anti-CGRPs have varying administration frequencies that would also affect the cost comparison to eptinezumab as eptinezumab is associated with fewer annual administrations, with the exception of fremanezumab 675 mg administrated every 3 months.
Based on the CADTH clinical and economic reviews, there is insufficient evidence to support a price premium for eptinezumab in comparison with other available anti-CGRPs for the prevention of migraine in the indicated population. The cost-comparison analysis does not consider potential treatment sequencing or combination use of eptinezumab with other drugs. Uncertainty remains with the comparative efficacy of eptinezumab with other relevant compactors such as onabotulinum toxin A for patients with CM.
Stakeholder Input Relevant to the Economic Review
This section is a summary of the feedback received from the patient groups, registered clinicians, and drug plans that participated in the CADTH review process.
Patient input was received from Migraine Canada and Migraine Québec through 2 online surveys. A total of 1,165 adults in Canada with migraine and their caregivers responded to the first survey, and 132 individuals (111 in Canada) responded to the second. A majority (68% and 71% in the first and second surveys, respectively) reported living with CM for 15 or more days. Many respondents indicated that migraines negatively affect all aspects of their life, including their ability to maintain schedules, employment, sleep, mental health, and burdens on family. More than 78% of respondents have taken a prescription medication to prevent migraine; however, 53% reported they were not satisfied with the current treatments available, with 73% believing there is a need for additional treatments in Canada. A majority (66%) of patients indicated that side effects lead to discontinuation and 33% of patients noted they would prefer an infusion every 3 months rather than monthly injections or daily medications. Of the respondents, 13 participants from the US had previous experience with eptinezumab. Six individuals noted that, compared to previous therapies, they experienced a 50% benefit, whereas 3 individuals experienced a 75% benefit. When asked about side effects, 67% reported they did not experience side effects. Those who experienced side effects described them as tolerable, and 1 person had to discontinue treatment. Furthermore, 83% of respondents stated that eptinezumab was easier and more convenient to use than other therapies.
No clinician input was received for this review.
Drug plans commented on the need for available infusion clinics and trained health care professionals to administer eptinezumab and asked whether the sponsor would introduce flat pricing for the 300 mg dose. Last, the plans inquired if patients should be able to receive a 300 mg dose immediately without first trying the 100 mg dose and whether there was any evidence to support the combination use of eptinezumab and onabotulinum toxin A.
The sponsor’s model addressed the concern that the clinical effectiveness of preventive migraine therapies was based on number of monthly migraine days (MMDs), with higher frequencies associated with reduced health-related quality of life and higher costs.
Two aspects were not directly addressed in the sponsor’s model and could not be adequately addressed by CADTH due to structural or data limitations:
effects of treatment on migraine severity
the iterative nature of treatment (i.e., patients are unlikely to remain off treatment after discontinuing a preventive therapy that is ineffective or not tolerated) and treatment sequencing.
Economic Review
The current review is for eptinezumab (Vyepti) for the prevention of migraines in adult patients with EM or CM who have at least 4 migraine days per month and have failed 2 or more prior preventive treatments.
Economic Evaluation
Summary of Sponsor’s Economic Evaluation
Overview
Eptinezumab is indicated for the prevention of migraine in adults who have had at least 4 MMDs.1 The sponsor submitted a 12-week decision tree plus a Markov model to assess the cost-effectiveness of eptinezumab 100 mg and 300 mg compared to fremanezumab and galcanezumab for the treatment of patients with EM (< 15 headache days and ≥ 4 migraine days per month) or CM (≥ 15 headache days per month for ≥ 3 months, in which ≥ 8 days per month meet the criteria for migraine [with or without aura] or respond to treatment specifically for migraine) who have previously failed 2 or more preventive treatments. This modelled population deviates from the Health Canada indication but aligns with the DELIVER trial and represents the reimbursement request.2 Analyses were conducted separately for EM and CM.
Eptinezumab is available in single-use vials of a 100 mg/mL solution.1 The recommended dosage of eptinezumab is 100 mg every 12 weeks; however. some patients may benefit from 300 mg administered every 12 weeks.1 The cost for eptinezumab is $1,665 per 100 mg/mL single-use vial; the cost per 12 cycles assumed by the sponsor is therefore $6,660 for 100 mg and $19,980 for 300 mg.2
The sponsor’s base-case analysis compared eptinezumab 100 mg and 300 mg to fremanezumab 225 mg, fremanezumab 675 mg, and galcanezumab 120 mg.2 These anti-CGRPs are all indicated for the prevention of migraine in patients with 4 or more MMD,3,4 and both fremanezumab and galcanezumab have received positive recommendations from CADTH for patients with EM or CM who do not respond to at least 2 oral preventive migraine medications.5,6 Erenumab was not considered as a comparator as its sponsor concluded pan-Canadian Pharmaceutical Alliance negotiations without an agreement.7 Although onabotulinum toxin A received a positive recommendation from CADTH for the prophylaxis of headaches in adults with CM experiencing an inadequate response, intolerance, or contraindication to at least 3 oral prophylactic migraine medications, it is not widely listed by CADTH-participating drug plans and was only explored in a scenario analysis.2
Outcomes of the model included QALYs and life-years over a 66-cycle time horizon (i.e., 5.1 years, including the 12-week decision tree). Discounting at 1.5% per year was applied to both costs and outcomes, and a cycle length of 28 days was used with a half-cycle correction.
Model Structure
The economic analysis was conducted using a 12-week decision tree plus a Markov model (Figure 1 in Appendix 3).2 All patients entered the model receiving active treatment. After 12 weeks, patients transitioned into 1 of 3 possible health states of the Markov model: on treatment, off treatment, or death. Patients transitioned to the off-treatment health state, for which no treatment effect was applied, due to an adverse event (AE) or lack of treatment response (defined as a < 50% change from baseline in MMDs), whereas those who remained alive, did not discontinue due to an AE, and had a treatment response at week 12 (i.e., ≥ 50% reduction in MMDs from baseline) entered the Markov model in the on-treatment health state.2 Once in the Markov model, patients could transition from the on-treatment health state to the off-treatment health state for non-AE reasons. At the end of each Markov cycle (week 13 and after), patients could transition from any alive health state to the death state.
Model Inputs
Data from the DELIVER8 study (a phase II, multinational, multicentre, randomized, double-blind, placebo-controlled trial) were used to inform the demographic characteristics of patients with EM or CM who have failed 2 or more prior preventive migraine therapies (EM: mean age = |||||| years, % female = ||||||%, mean MMDs = ||||||; CM: mean age = |||||| years, % female = ||||||%, mean MMDs = ||||||).2
The primary efficacy measure in the DELIVER trial was the mean change from baseline in MMDs over weeks 1 to 12 relative to placebo.8 Comparative efficacy estimates were obtained from the sponsor-provided NMA (separate NMAs for patients with EM or CM in the DELIVER trial) and were modelled as estimates of the odds of achieving a change of 50% or greater from baseline in MMDs for weeks 1 to 12.2 An additional NMA was conducted for the scenario analysis comparing eptinezumab to onabotulinum toxin A for patients with CM who have failed 2 or more prior preventive therapies. AEs were modelled as a 1-time occurrence at the end of a 12-week decision tree for which rates were informed from each treatment from pooled EM and CM studies.9
Mortality was based on general population mortality obtained from life tables available from Statistics Canada10 and was weighted by the proportion of females in the model. The model used the sex-weighted per-cycle probability of death based on the mean patient age in each cycle.2
Treatment discontinuations were incorporated as either AE-related or non–AE-related.2 At the end of week 12 of the decision tree, the model assumed a percentage of patients discontinued treatment due to AEs informed by the percentage of patients in the DELIVER trial who withdrew from eptinezumab treatment (1.2%).2 In the Markov model, patients could discontinue treatment for non-AE reasons, for which rates were derived from the pooled eptinezumab 100 mg and 300 mg arm from the 24-week double-blind phase of the DELIVER trial (||||||%; ||||||% probability per 28-day cycle).2 It was assumed that all treatments had the same discontinuation rates due to their similar safety profiles (AE-related discontinuation) and low rates (non–AE-related discontinuation).2
Health-state utility values were applied to each health state in the model informed by data from the Migraine-Specific Quality of Life questionnaire version 2.1 (MSQ v2.1) from DELIVER trial mapped to 3-Level EQ-5D questionnaire–based utilities using UK-specific preference weights.2 As patients on eptinezumab experienced significantly fewer migraines of severe intensity than did patients on placebo, a treatment effect was incorporated into the disutility function of the base-case analysis (utility of ||||||).2 This treatment-effect utility was applied to all preventive treatments.2 Additionally, it was assumed that each MMD reduction was associated with an average utility increase of ||||||. Disutilities for AEs were informed by the literature11-13 and AE durations were based on assumptions validated by sponsor-consulted clinical experts.
Costs included drug acquisition costs for eptinezumab at the submitted price.2 It was assumed that the 300 mg dose of eptinezumab was priced linearly with the 100 mg dose; however, a scenario analysis assumed flat pricing for the 300 mg dose. Other drug costs were obtained from the Ontario Drug Benefit Formulary,14 Patented Medicine Prices Review Board,15 and IQVIA Delta PA database.16 Drug dispensing fees or markups were not included in the drug acquisition costs.2 The model further included health care resource use costs for family physician visits, neurologist visits, psychiatrist visits, emergency department visits, and hospitalizations reported by the Ontario Schedule of Benefits for Physicians Services17 and Ontario Case Costing Initiative.18 Resource use frequency was informed by reweighed data from Stokes (2011) to exclude patients who did not report on specific resource use.19 The cost of AEs was applied as a 1-time cost during the 12-week decision tree based on data from the Ontario Case Costing Initiative.18 All costs were reported in 2022 Canadian dollars.2
Summary of Sponsor’s Economic Evaluation Results
The sponsor-submitted probabilistic analysis aligned with the reimbursement request for patients with EM or CM. The sponsor’s analyses were based on 500 iterations and are presented in the following section. Additional results from the sponsor’s submitted economic evaluation base case are presented in Appendix 3.
Base-Case Results
In the sponsor’s base-case analysis for patients with EM, eptinezumab 100 mg was associated with estimated costs of $16,282 and 3.27 QALYs over a 5.1-year time horizon. Eptinezumab 100 mg was dominated by fremanezumab 225 mg (i.e., it was more costly and less effective) and was less costly and less effective versus fremanezumab 675 mg and eptinezumab 300 mg. Compared with galcanezumab 120 mg, eptinezumab 100 mg had an incremental cost-effectiveness ratio (ICER) of $48,325. Eptinezumab 300 mg was associated with estimated costs of $56,855 and 3.33 QALYs over a 5.1-year time horizon. Eptinezumab 300 mg had ICERs of $707,229 compared to eptinezumab 100 mg, $893,816 compared to fremanezumab 225 mg, $2,528,628, compared to fremanezumab 675 mg, and $348,554 compared to galcanezumab 120 mg. In sequential analysis, eptinezumab 100 mg was dominated by fremanezumab 225 mg whereas eptinezumab 300 mg had an ICER of $2,528,628 versus fremanezumab 675 mg.
In the sponsor’s base-case analysis for patients with CM, eptinezumab 100 mg was less costly and less effective compared to all other treatments. Eptinezumab 300 mg was dominated compared to fremanezumab 225 mg, fremanezumab 675 mg, and galcanezumab 120 mg, and was associated with an ICER of $1,723,336 compared to eptinezumab 100 mg. In the sequential analysis, eptinezumab 300 mg was dominated by fremanezumab 675 mg, fremanezumab 225 mg, and galcanezumab 120 mg, whereas eptinezumab 100 mg is a cost-effective option.
Table 3: Summary of the Sponsor’s Economic Evaluation Results
Drug | Total costs ($) | Total QALYs | Incremental costs ($ vs. reference) | Incremental QALYs (% vs. reference) | ICER ($ vs. reference) | Sequential ICER ($ per QALY) |
|---|---|---|---|---|---|---|
Episodic migraine, 2 or more failed preventive therapies | ||||||
Galcanezumab 120 mg | 12,970 | 3.21 | 0 | 0.00 | Reference | Reference |
Fremanezumab 225 mg | 16,239 | 3.29 | 3,270 | 0.08 | 40,633 | 40,633 |
Fremanezumab 675 mg | 18,016 | 3.32 | 5,046 | 0.11 | 45,645 | 59,054 |
Eptinezumab 300 mg | 56,855 | 3.33 | 43,886 | 0.13 | 348,554 | 2,528,628 |
Eptinezumab 100 mg | 16,282 | 3.27 | 3,312 | 0.07 | 48,325 | Dominated by fremanezumab 225 mg |
Chronic migraine, 2 or more failed preventive therapies | ||||||
Eptinezumab 100 mg | 15,933 | 2.88 | 0 | 0.00 | Reference | Reference |
Fremanezumab 675 mg | 16,815 | 2.92 | 881 | 0.04 | 22,392 | 22,392 |
Fremanezumab 225 mg | 17,444 | 2.94 | 1,510 | 0.06 | 25,236 | 30,699 |
Galcanezumab 120 mg | 18,293 | 2.92 | 2,360 | 0.05 | 50,799 | Dominated by fremanezumab 225 mg |
Eptinezumab 300 mg | 43,878 | 2.89 | 27,945 | 0.02 | 1,723,336 | Dominated by fremanezumab 675 mg, fremanezumab 225 mg, galcanezumab 120 mg |
ICER = incremental cost-effectiveness ratio; QALY = quality-adjusted life-year.
Source: Sponsor’s pharmacoeconomic submission.2
Sensitivity and Scenario Analysis Results
The sponsor provided scenario and sensitivity analyses. These included varying the time horizon; varying the discount rate for costs and outcomes, including drug administration costs; excluding acute treatment costs; excluding and using alternative resource use costs; excluding AEs; informing placebo response with data from the submitted NMA; using alternative utility values; including spontaneous remission; including positive discontinuation; conducting analysis from various societal perspectives; and including resource use costs and indirect costs.
Additionally, the sponsor conducted several key scenario analyses including an analysis in which eptinezumab 300 mg was assumed to have the same treatment-acquisition price as eptinezumab 100 mg, and onabotulinum toxin A 155 U to 195 U was included as a comparator (for patients with CM only).
In the scenario analysis in which eptinezumab 300 mg had the same acquisition price as eptinezumab 100 mg, among patients with EM, eptinezumab 100 mg results remained aligned with the sponsor’s base case against other anti-CGRPs. Compared to other anti-CGRPs, eptinezumab 300 mg was associated with a cost of $19,673 and 3.33 QALYs, resulting in an ICER of $107,934 versus fremanezumab 675 mg in the sequential analysis. Among patients with CM, eptinezumab 100 mg results remained aligned with the sponsor’s base case against other anti-CGRPs. Compared to other anti-CGRPs, eptinezumab 300 mg was associated with a cost of $16,603 and 2.89 QALYs and was extendedly dominated by fremanezumab 675 mg and fremanezumab 225 mg in the sequential analysis.
In the scenario for patients with CM in which onabotulinum toxin A 155 U to 195 U was included as a comparator, eptinezumab 100 mg and 300 mg were associated with more incremental QALYs (0.09 and 0.11, respectively) and higher incremental costs ($8,693 and $36,638, respectively). In the sequential analysis, eptinezumab 100 mg was extendedly dominated by fremanezumab 675 mg and fremanezumab 225 mg, whereas eptinezumab 300 mg was dominated by fremanezumab 675 mg, fremanezumab 225 mg, and galcanezumab 120 mg.
CADTH Appraisal of the Sponsor’s Economic Evaluation
CADTH identified several key limitations to the sponsor’s analysis that have notable implications on the economic analysis:
The clinical effectiveness of eptinezumab compared to other preventive migraine treatments is uncertain. There is no direct head-to-head evidence comparing eptinezumab with other anti-CGRPs, onabotulinum toxin A, or oral preventive migraine treatments. The sponsor used the results of its submitted NMA to estimate the odds of achieving a reduction of 50% or greater in MMDs over weeks 1 to 12 with eptinezumab versus comparators (i.e., fremanezumab, galcanezumab, erenumab, and onabotulinum toxin A). As noted in the CADTH clinical review, the sponsor’s NMA findings are limited by heterogeneity, resulting in wide 95% credible intervals and a lack of reporting of model statistics, making it difficult to determine the appropriateness of using a fixed-effect model. The incremental QALYs predicted by the model based on the NMA contribute to additional uncertainty on the cost-effectiveness of eptinezumab.
In the CADTH base-case analysis, efficacies between eptinezumab and other anti-CGRPs were assumed to be equal as the NMA is not sufficient to conclude whether eptinezumab is superior or inferior to other comparators. CADTH also conducted a scenario analysis against best supportive care.
Relevant comparators were excluded from the CM base case. In the base-case analysis for the CM population, the sponsor compared eptinezumab (100 mg and 300 mg) to fremanezumab 225 mg, fremanezumab 675 mg, and galcanezumab 120 mg. Onabotulinum toxin A was not considered a relevant comparator despite a positive recommendation from the CADTH Canadian Drug Expert Committee for the prophylaxis of headaches in adults with CM who have had an inadequate response, intolerance, or contraindication to at least 3 oral prophylactic migraine medications. The sponsor justified this exclusion by citing its limited availably within CADTH-participating drug plans, and the expectation that, once a physician decides to use an anti-CGRP instead of onabotulinum toxin A, only other drugs within the same class would be considered.2,20
While the sponsor did include onabotulinum toxin A as a comparator in a scenario analysis, the comparative clinical efficacy of eptinezumab to onabotulinum toxin A was uncertain; while the secondary analysis results indicated that eptinezumab 300 mg was favoured over onabotulinum toxin A for a 50% migraine response rate, there was no difference in change from baseline in MMDs.
The sponsor also excluded erenumab from its submitted base case, despite receiving a positive recommendation from the CADTH Canadian Drug Expert Committee. This exclusion was justified by noting that there did not appear to be a negotiated price for reimbursement through the drug plans, suggesting that patients are not currently able to receive erenumab from public plans. Erenumab was not considered in scenario analysis.
CADTH conducted a pairwise analysis of eptinezumab versus onabotulinum toxin A but was unable to address comparator efficacy limitation due to limited data availability informing the comparative efficacy of eptinezumab to onabotulinum toxin A. The cost-effectiveness of eptinezumab relative to onabotulinum toxin A is therefore uncertain. CADTH included erenumab in its cost-comparison analysis for completeness, making the same assumption about equal efficacy that was made for other anti-CGRP treatments.
The model structure does not adequately reflect the clinical management of migraine or capture the complete spectrum of health states that are meaningful to patients. After the 12-week decision-tree period, the health states used by the sponsor to assess the cost-effectiveness of eptinezumab were used to classify patients either on treatment or off treatment due to an AE or lack of treatment response (defined as < 50% change from baseline in MMDs). Patients can further transition from health states at the end of each Markov cycle for non-AE reasons. Patients who are off treatment (i.e., discontinue eptinezumab or other anti-CGRP) are assumed to receive best supportive care (acute migraine treatment only), with no additional preventive therapy.
Clinical effects in the sponsor’s model were based on the number of migraine days experienced by the patients and does not capture other clinically meaningful aspects of the condition, such as headache severity. According to clinical expert feedback received by CADTH, the management of migraine is informed by factors beyond migraine frequency. Patients may find a reduction in the severity of their migraine headaches without a reduction in the frequency of headaches to be a clinically meaningful outcome. Additionally, a reduction in the frequency of migraines may not necessarily be associated with a reduction in severity.
o CADTH was unable to address the limitations associated with model structure. The direction and magnitude of the impact on the cost-effectiveness results for eptinezumab are unknown.
The long-term treatment efficacy of eptinezumab is uncertain. In the sponsor’s model, patients who responded to eptinezumab after 12 weeks were implicitly assumed to maintain their improved frequency of MMDs for the remainder of their time on treatment, up to the analysis time horizon. This assumption was not justified. Clinical expert feedback indicated that patients may not indefinitely continue successful preventive therapy as initiated, but instead may have their preventive treatment removed or reduced to test whether improvement in MMDs, severity, and response to triptans can be maintained without it.
CADTH was unable to address the limitations associated with the model structure. Uncertainty remains in the maintenance of treatment effect in patients who continue anti-CGRP therapy.
Additional limitations were identified but not considered to be key limitations.
Stratification of MMDs by response status is uncertain. The sponsor’s model stratified patients as on or off treatment based on their reduction in MMDs, defined as achieving a reduction of 50% or greater in MMDs over weeks 1 to 12 as reported in the DELIVER trial. Clinical expert feedback sought by CADTH noted that, for patients with CM, the threshold should be lower (e.g., ≥ 40%) as the patients with CM in the DELIVER trial have less-severe CM compared to those in the real world and therefore would not be generalizable to patients in clinical practice. However, clinical expert feedback received by CADTH suggested there is no biological reason why using a lower threshold would disproportionately change the comparative efficacy of eptinezumab versus that of other anti-CGRP inhibitors. Nevertheless, a degree of uncertainty remains surrounding the magnitude of reduction in MMDs associated with treatment in the model.
CADTH was unable to address the limitation associated with response status due to limitations in the available data. The direction and magnitude of impact on the cost-effectiveness of eptinezumab are unknown.
Utility values associated with the number of MMDs are uncertain. In the sponsor’s submission, utility values were based on the number of MMDs. The utilities were estimated based on MSQ v2.1 data from the DELIVER trial that were then mapped to the 3-Level EQ-5D. The mapping approach was not transparently described in the sponsor’s submission. Additionally, the mapping was based on utilities using UK-specific preference weights, which do not reflect Canadian preferences.2 Although 5-Level EQ-5D data were available from the DELIVER trial, the sponsor justified using the mapped utilities as follows: “The analyses used the mapped MSQ v2.1 data because it is a validated and reliable questionnaire demonstrated to differentiate the functional impact between EM and CM, in addition to providing important measures of treatment effectiveness beyond headache frequency… EQ-5D-5L is a generic instrument shown to produce different results when measured as part of a chronic migraine condition than during an acute migraine.”
The use of mapping algorithms is common within economic evaluations. Given that utilities are specified based on health state and are not treatment-specific, the use of a different mapping algorithm is only expected to affect the amount of uncertainty around the mean estimate of the ICER.
The effect of incorporating the natural history of migraine disease course in the model is uncertain. The sponsor conducted a scenario analysis incorporating the functionality to consider a spontaneous remission health state at the end of the 12-week decision tree or the end of each Markov cycle. Although it is appropriate to consider the natural history of migraine disease course, the sponsor’s implementation of spontaneous remission may not accurately capture the true migraine disease course as previous clinical expert feedback received by CADTH noted that some patients may show a natural improvement or worsening in the frequency of migraines over time, regardless of treatment, transitioning between EM and CM.
The true effect of this assumption on the model results is unknown but it is not expected to meaningfully affect the ICER as this phenomenon would be biased neither for nor against any particular treatment.
Additionally, the following key assumptions were made by the sponsor and have been appraised by CADTH (Table 4).
Table 4: Key Assumptions of the Submitted Economic Evaluation (Not Noted as Limitations to the Submission)
Sponsor’s key assumption | CADTH comment |
|---|---|
5-year time horizon | Appropriate. |
Equal treatment discontinuation between anti-CGRPs | Reasonable. The clinical expert feedback received by CADTH noted that all anti-CGRPs would have similar treatment discontinuation. |
No migraine-related mortality was assumed | Reasonable. According to experts consulted by CADTH in previous previews, migraine patients are not at a higher risk of death than the general population. |
Patients remain on 1 dose of eptinezumab for the duration of treatment | Uncertain. The sponsor-submitted model did not consider dose-switching for eptinezumab. According to the clinical expert feedback received by CADTH, patients could switch between the 100 mg and 300 mg doses of eptinezumab due to lack of response and patient- and/or client-specific preferences. The effect of dose-switching on the model results is unknown and would further depend on the pricing strategy of both treatments. |
Migraine frequency does not change except due to treatment effect | Uncertain. The model does not consider changes in the frequency of migraine that are unrelated to treatment (i.e., no patients naturally improve or decline). According to the clinical expert feedback received by CADTH, some patients may show a natural improvement or worsening in the frequency of migraines over time, regardless of treatment, transitioning between EM and CM. The effect of this assumption on the model results is unknown but is not expected to meaningfully affect the incremental cost-effectiveness ratio as this phenomenon would not be biased in favour of or against any particular treatment. |
Subsequent therapies were excluded from the model | Unreasonable. According to clinical expert feedback sought by CADTH, patients who discontinue eptinezumab would continue to receive preventive migraine treatment. However, inclusion of subsequent therapies in the model is expected to have no meaningful impact on the cost-effectiveness of eptinezumab as rates between anti-CGRPs are expected to be similar. |
5% of AEs are treated inpatients for AE costs | Unreasonable. Patients with migraine in Canada are rarely admitted to treatment for migraine. However, given that this set of costs had a smaller impact (i.e., its incremental costs contributed less when compared to other costs categories), assumptions regarding AE costs are unlikely to change the conclusion regarding the cost-effectiveness of eptinezumab. |
No administration costs were applied for eptinezumab | Reasonable. The sponsor has detailed that they will cover all IV injection administration costs associated with eptinezumab. |
No administration costs were applied for fremanezumab and galcanezumab | Reasonable. Subcutaneous anti-CGRPs are assumed to be self-administered by the patient and would not incur additional health care costs. |
Repeat education for self-administration (when including administration costs for subcutaneous anti-CGRPs) | Unreasonable. The sponsor conducted a scenario analysis exploring the inclusion of subcutaneous anti-CGRP administration costs. However, clinical expert feedback received by CADTH noted that patients would not have to undergo education annually for self-administration. Given that this cost had a smaller impact (i.e., its incremental costs contributed less when compared to other costs categories), assumptions about education costs for self-administration are unlikely to change the conclusion regarding the cost-effectiveness of eptinezumab. |
AE = adverse event, CGRP = calcitonin gene–related peptides, CM = chronic migraine, EM = episodic migraine.
CADTH Reanalyses of the Economic Evaluation
Base-Case Results
The CADTH clinical appraisal of the clinical evidence concluded that there was generally no difference between eptinezumab (100 mg or 300 mg) and other anti-CGRPs (i.e., erenumab, fremanezumab, galcanezumab) available in Canada in both EM and CM populations. The CADTH reanalysis therefore assumed equal efficacies for all anti-CGRPs and compared annual drug costs in its reanalysis.
In the CADTH reanalysis of eptinezumab, the annual cost of other anti-CGRPs ranged from $6,384 to $7,293 per patient, whereas the annual cost of eptinezumab ranged from $7,240 to $21,719 per patient, depending on the dose. All other anti-CGRPs were less expensive than eptinezumab, with the exception of year 1 galcanezumab versus the annual cost of eptinezumab 100 mg. Annual costs of each treatment, along with the difference in annual drug cost in comparison with eptinezumab can be found in Table 5.
Table 5: CADTH Cost-Comparison Table of Eptinezumab Compared With Other Anti-CGRPs
Price-reduction scenarios for each anti-CGRP | Annual treatment cost of eptinezumab ($) | Reduction needed (%) | Reduced annual treatment cost of eptinezumab ($) | Savings in treatment cost ($) |
|---|---|---|---|---|
Fremanezumab 225 mg once monthly or 675 mg every 3 months | 7,240 to 21,719 | 11% to 70% | 6,429 | 811 to 15,291 |
Galcanezumab 240 mg initial loading dose, then 120 mg once a month | 7,240 to 21,719 | 0% to 69% | 6,732 to 7,293 | 0 to 14,988 |
Erenumab 70 mg or 140 mg once monthly | 7,240 to 21,719 | 12% to 71% | 6,384 | 856 to 15,335 |
CGRP = calcitonin gene–related peptides.
Note: Erenumab is included in this table for completeness of information. Erenumab is not currently funded by any participating drug plan, but has received a recommendation for reimbursement (with conditions) from the CADTH Canadian Drug Expert Committee.
Scenario Analysis Results
A scenario analysis was conducted using the CADTH base case to investigate the impact of comparing eptinezumab to best supportive care. Results of this scenario analysis are presented in Appendix 4. This analysis resulted in ICERs for eptinezumab 100 mg of $64,260 and $40,339 per QALY for the EM and CM population, respectively, when compared to best supportive care. CADTH’s price-reduction analyses based on this scenario analysis suggested a price reduction of approximately 21% would be required for eptinezumab 100 mg to be cost-effective at a willingness-to-pay threshold of $50,000 per QALY against best supportive care in the EM population (Table 12). In the CM population, no price reduction would be required to achieve cost-effectiveness of eptinezumab 100 mg at a willingness-to-pay threshold of $50,000 per QALY versus best supportive care.
A scenario analysis was conducted investigating the impact of comparing eptinezumab to onabotulinum toxin A in the CM population. Results of this scenario analysis are presented in Appendix 4, with eptinezumab 100 mg associated with an ICER of $92,581 compared to onabotulinum toxin A in the CM population. CADTH additionally undertook a price-reduction analysis based on this scenario; the results suggest a price reduction of approximately 32% is required for eptinezumab 100 mg to be cost-effective at a willingness-to-pay threshold of $50,000 per QALY against onabotulinum toxin A in the CM population (Table 14).
Issues for Consideration
Availability of anti-CGRP comparators. Three additional anti-CGRPs have been approved by Health Canada (erenumab, fremanezumab, and galcanezumab) for the prevention of migraine in adults,3,4,21 atogepant is currently under suspended review at CADTH, and erenumab’s sponsor concluded pan-Canadian Pharmaceutical Alliance negotiations without an agreement.7,22
Different mode of administration: Some patients may prefer an IV injection treatment, such as eptinezumab, over subcutaneous injectable treatments (i.e., fremanezumab and galcanezumab).
Comparison to galcanezumab and fremanezumab pharmacoeconomic reviews: CADTH previously reviewed galcanezumab and fremanezumab for migraine prophylaxis.5,6 However, due to differences in model structure, clinical effectiveness parameters, health-state utility values, and cost inputs, the estimates of the ICER for these 3 submissions may not be directly comparable.
Loss of productivity as patient-important outcome: Input from patient groups identified loss of productivity at work as an outcome of concern. Productivity was measured in the DELIVER trial, and was considered by the sponsor in a scenario analysis. Given the similarity in outcomes between eptinezumab and other anti-CGRP treatments, CADTH does not anticipate any meaningful differences in productivity loss and did not conduct additional cost-comparison scenario analyses.
Flat pricing for eptinezumab 300 mg and 100 mg. At the time of submission, the only unit strength available of eptinezumab is 100 mg. A 300 mg stock-keeping unit is ||||||||||||||||||||||||||||||||||||||||||||||||||||||||||||||||||||||||||||||||||||||||||||||||||||||||||||||||||||||||||||||||||||||||||||||||||||||||||||||||||||||||||||||||||||||||||||||||||||||||||||||||||||||||||||||||||||||||||||||||||||||.9 In this case, the submitted price of eptinezumab |||||||||||||||||||||||| would require a 11% price reduction to be equivalent to the lowest-cost reimbursed comparator (i.e., fremanezumab).
Overall Conclusions
The CADTH clinical review concluded eptinezumab 100 mg and 300 mg were superior to placebo for the preventive treatment of migraines in EM and CM adults who have at least 4 migraine days per month. In the absence of direct comparative evidence for eptinezumab versus other anti-CGRPs, the CADTH clinical review team concluded that the sponsor-submitted NMA suggested that for active comparators, ||||||||||||||||||||||||||||||||||||||||||||||||||||||||||||||||||||||||||||||||||||||||||||||||||||||||||||||||||||||||||||||||||||||||||||||||||||||||||||||||||||||||||||||||||||||||||||||||||||||||||||||||||||||||||||||||||||||||||||||||||||||||||||||||||||||||||||||||||||||||||||||||||||||||||||||||||||||||. For all other outcomes, |||||||||||||||||||||||||||||||||||||||||||||||||||||||||||||||||||||||||||||||||||||||||||||||||||||| in both EM and CM.
Due to the limitations with the available comparative evidence, the CADTH reanalysis assumed no difference in treatment effect (i.e., equal QALYs) for eptinezumab 100 mg and 300 mg versus all other anti-CGRP agents for the preventive treatment of migraine in adults who have at least 4 migraine days per month and have experienced an inadequate response, intolerance, or contraindication to at least 2 oral prophylactic migraine medications. A cost comparison was conducted focusing on the annual drug costs. The annual drug cost per patient of the 100 mg dose of eptinezumab is $7,240, which is more costly than the publicly available prices of all other anti-CGRPs available in Canada. The submitted price of eptinezumab 100 mg would need to be reduced by at least 11% to be equivalent to the lowest-priced reimbursed anti-CGRP (fremanezumab). The submitted linear pricing for the 300 mg dose of eptinezumab would need to be reduced by 70%. The price reduction needed to be equivalent to the public list price of erenumab was similar to that for fremanezumab (11% versus 12%, respectively, for the 100 mg dose of eptinezumab).
Compared to other available anti-CGRPs, eptinezumab is associated with fewer annual administrations, with the exception of fremanezumab 675 mg administrated every 3 months. It is not clear how administrations would affect the cost comparison of eptinezumab and other anti-CGRPs. An additional scenario analysis conducted by CADTH of eptinezumab 100 mg versus best supportive care resulted in ICERs of $64,448 and $40,339 per QALY for the EM and CM populations, respectively. A scenario analysis with eptinezumab 100 mg versus onabotulinum toxin A in the CM population found that eptinezumab 100 mg was associated with an ICER of $92,581.
Based on the CADTH clinical and economic reviews, there is insufficient evidence to support a price premium for eptinezumab in comparison with other available anti-CGRPs for the prevention of migraine in adults who have had at least 4 migraine days per month and have experienced an inadequate response, intolerance, or contraindication to at least 2 oral prophylactic migraine medications. The cost-comparison analysis does not consider potential treatment sequencing or combination use of eptinezumab and other drugs, and uncertainty remains with the efficacy of eptinezumab compared with other relevant comparators, such as onabotulinum toxin A, for patients with CM. In the submitted model, eptinezumab 300 mg was assumed to cost 3 times that of the 100 mg dose. ||||||||||||||||||||||||||||||||||||||||||||||||||||||||||||||||||||||||||||||||||||||||||||||||||||||||||||||||||||||||||||||||||||||||||||||||||||||||||||||||||||||||||||||||||||||||||||||||||||||||||||. Compared to best supportive care, eptinezumab 100 mg (||||||||||||||||||||||||||||||||||||) would need a price reduction of at least 24% to be cost-effective at a willingness-to-pay threshold of $50,000 per QALY, whereas a price reduction of approximately 32% would be required to achieve cost-effectiveness of eptinezumab 100 mg at a willingness-to-pay threshold of $50,000 per QALY against onabotulinum toxin A in the CM population.
References
1.Vyepti (eptinezumab for injection): 100 mg/mL, solution for infusion [product monograph]. Saint-Laurent (QC): Lundbeck Canada Inc; 2021 Aug 20.
2.Pharmacoeconomic evaluation [internal sponsor's report]. In: Drug Reimbursement Review sponsor submission: Vyepti (eptinezumab), 100 mg/mL, solution for infusion. Montreal (QC): Lundbeck Canada Inc; 2022 Jun 8.
3.Ajovy (fremanezumab solution for subcutaneous injection): 225 mg in 1.5 mL (150 mg/mL) solution for subcutaneous injection [product monograph]. Toronto (ON): Teva Canada Limited; 2022 Jan 19: https://pdf.hres.ca/dpd_pm/00064373.PDF. Accessed 2022 Jul 7.
4.Emgality (galcanezumab injection): 100 mg/Ml or 120 mg/Ml solution for subcutaneous injection [product monograph]. Toronto (ON): Eli Lilly Canada Inc.; 2020 Sept 17: https://pdf.hres.ca/dpd_pm/00058039.PDF. Accessed 2022 Jul 7.
5.Drug Reimbursement Review: fremanezumab (Ajovy) for the prevention of migraine in adults who have at least 4 migraine days per month. Ottawa (ON): CADTH; 2021: https://www.cadth.ca/fremanezumab. Accessed 2022 Jul 26.
6.Drug Reimbursement Review: galcanezumab (Emgality) for the prevention of migraine in adults who have at least four migraine days per month and have experienced an inadequate response, intolerance, or contraindication to at least two oral prophylactic migraine medications. Ottawa (ON): CADTH; 2022: https://www.cadth.ca/galcanezumab. Accessed 2022 Jul 26.
7.pan-Canadian Pharmaceutical Alliance (pCPA). Aimovig (erenumab). 2022; https://www.pcpacanada.ca/negotiation/21286. Accessed 2022 Jul 14.
8.Ashina M, Lanteri-Minet M, Pozo-Rosich P, et al. Safety and efficacy of eptinezumab for migraine prevention in patients with two-to-four previous preventive treatment failures (DELIVER): a multi-arm, randomised, double-blind, placebo-controlled, phase 3b trial. Lancet Neurol. 2022;21(7):597-607. PubMed
9.Drug Reimbursement Review sponsor submission: Vyepti (etinezumab) 100 mg/mL, solution for infusion [internal sponsor's package]. Saint-Laurent (QC): Lundbeck Canada Inc.; 2022 Jun 8.
10.Table: 13-10-0114-01. Life expectancy and other elements of the life table, Canada, all provinces except Prince Edward Island. Ottawa (ON): Statistics Canada; 2022: https://www150.statcan.gc.ca/t1/tbl1/en/tv.action?pid=1310011401. Accessed 2022 Feb 1.
11.Matza LS, Deger KA, Vo P, Maniyar F, Goadsby PJ. Health state utilities associated with attributes of migraine preventive treatments based on patient and general population preferences. Qual Life Res. 2019;28(9):2359-2372. PubMed
12.Parkinson B, Gumbie M, Cutler H, Gauld N, Mumford V, Haywood P. Cost-effectiveness of reclassifying triptans in Australia: application of an economic evaluation approach to regulatory decisions. Value Health. 2019;22(3):293-302. PubMed
13.Chirikov V, Ma I, Joshi N, et al. Cost-effectiveness of alemtuzumab in the treatment of relapsing forms of multiple sclerosis in the United States. Value Health. 2019;22(2):168-176. PubMed
14.Ontario Ministry of Health, Ontario Ministry of Long-Term Care. Ontario drug benefit formulary/comparative drug index. 2022; https://www.formulary.health.gov.on.ca/formulary/. Accessed 2022 Apr 1.
15.Patented Medicine Prices Review Board. Voluntary compliance undertaking of Teva Canada Innovation to the Patented Medicine Prices Review Board. 2022 Feb 25; http://www.pmprb-cepmb.gc.ca/view.asp?ccid=1495&lang=en. Accessed 2022 Jul 19.
16.DeltaPA. [Ottawa (ON)]: IQVIA; 2022: https://www.iqvia.com/. Accessed 2022 Apr 1.
17.Schedule of benefits for physician services under the Health Insurance Act: effective October 1, 2021. Toronto (ON): Ontario Ministry of Health; 2022: https://www.health.gov.on.ca/en/pro/programs/ohip/sob/physserv/sob_master.pdf. Accessed 2022 Apr 1.
18.Ontario Case Costing Initiative (OCCI). Toronto (ON): Ontario Health and Long-Term Care; 2017: https://data.ontario.ca/dataset/ontario-case-costing-initiative-occi. Accessed 2021 Jan 1.
19.Stokes M, Becker WJ, Lipton RB, et al. Cost of health care among patients with chronic and episodic migraine in Canada and the USA: results from the International Burden of Migraine Study (IBMS). Headache. 2011;51(7):1058-1077. PubMed
20.Drug Reimbursement Review: onabotulinumtoxinA (Botox) for the prophylaxis of headaches in adults with chronic migraine (15 days per month with headache lasting 4 hours a day or longer). Ottawa (ON): CADTH; 2020: https://www.cadth.ca/onabotulinumtoxina-2. Accessed 2022 Jul 26.
21.Aimovig (erenumab injection): 70 mg/mL or 140 mg/mL solution for injection, for subcutaneous use [product monograph]. Dorval (QC): Novartis Pharmaceuticals Canada Inc; 2022 Apr 12: https://pdf.hres.ca/dpd_pm/00065486.PDF. Accessed 2022 Jul 21.
22.Drug Reimbursement Review: Atogepant (TBC) for the prevention of episodic migraine in adults with less than 15 migraine days per month who have experienced an inadequate response, intolerance or contraindication to at least two oral prophylactic migraine medications. Ottawa (ON): CADTH; 2022: https://www.cadth.ca/atogepant. Accessed 2022 Jul 26.
23.Botox (onabotulinumtoxinA for injection Ph. Eur): sterile vacuum-dried concentrate powder for solution for injection, 50, 100 and 200 Allergan units per vial [product monograph]. Markham (ON): Allergan Inc.; 2021 Mar 11: https://pdf.hres.ca/dpd_pm/00060199.PDF. Accessed 2022 Jul 14.
24.Flunarizine (flunarizine hydrochloride): capsules, 5 mg, oral [product monograph]. Vaughan (ON): AA Pharma Inc.; 2022 Feb 15: https://pdf.hres.ca/dpd_pm/00064788.PDF. Accessed 2022 Jul 4.
25.Sandomigran and Sandomigran DS (pizotifen hydrogen malate): 0.5 mg and 1 mg tablets [product monograph]. Montreal (QC): Paladin Labs Inc.; 2012 Oct 30: https://pdf.hres.ca/dpd_pm/00018281.PDF. Accessed 2022 Jul 4.
26.ACH-Topiramate (topiramate): 25 mg, 100 mg and 200 mg oral tablets [product monograph]. Kirkland (QC): Accord Healthcare Inc.; 2022 Mar 7: https://pdf.hres.ca/dpd_pm/00064988.PDF. Accessed 2022 Jul 4.
27.Exceptional Access Program (EAP). Toronto (ON): Ontario Ministry of Health; Ontario Ministry of Long-Term Care; 2022: https://www.health.gov.on.ca/en/pro/programs/drugs/odbf/odbf_except_access.aspx. Accessed 2022 Jul 4.
28.Pringsheim T, Davenport W, Mackie G, et al. Canadian Headache Society guideline for migraine prophylaxis. Can J Neurol Sci. 2012;39(2 Suppl 2):S1-59. PubMed
29.Osman N, Worthington I, Lagman-Bartolome AM. Headache in adults. In: Compendium of therapeutic choices. Ottawa (ON): Canadian Pharmacists Association; 2021: https://www.pharmacists.ca. Accessed 2021 Aug 16.
30.Saskatchewan Drug Plan: search formulary. 2022; https://formulary.drugplan.ehealthsask.ca/SearchFormulary. Accessed 2022 Jul 4.
31.Table: 17-10-0057-01 Projected population, by projection scenario, age and sex, as of July 1 (x 1,000). Ottawa (ON): Statistics Canada; 2022: https://www150.statcan.gc.ca/t1/tbl1/en/tv.action?pid=1710005701. Accessed 2022 May 1.
32.Dodick DW, Loder EW, Manack Adams A, et al. Assessing barriers to chronic migraine consultation, diagnosis, and treatment: results From the Chronic Migraine Epidemiology and Outcomes (CaMEO) Study. Headache. 2016;56(5):821-834. PubMed
33.Lipton RB, Serrano D, Holland S, Fanning KM, Reed ML, Buse DC. Barriers to the diagnosis and treatment of migraine: effects of sex, income, and headache features. Headache. 2013;53(1):81-92. PubMed
34.Buse DC, Manack AN, Fanning KM, et al. Chronic migraine prevalence, disability, and sociodemographic factors: results from the American Migraine Prevalence and Prevention Study. Headache. 2012;52(10):1456-1470. PubMed
35.Non-Insured Health Benefits program: First Nations and Inuit Health Branch: Annual Report 2016-2017. Gatineau (QC): Indigenous Services Canada; 2021: https://www.sac-isc.gc.ca/eng/1580856446382/1580857815920. Accessed 2022 Apr 1.
36.Non-Insured Health Benefits program: First Nations and Inuit Health Branch: Annual Report 2017-2018. Gatineau (QC): Indigenous Services Canada: https://www.sac-isc.gc.ca/eng/1581294869253/1581294905909. Accessed 2022 Apr 1.
37.Non-Insured Health Benefits program: First Nations and Inuit Health Branch: Annual Report 2018 to 2019. Gatineau (QC): Indigenous Services Canada; 2020: https://www.sac-isc.gc.ca/eng/1584392581890/1584393350542. Accessed 2022 Apr 1.
38.Non-Insured Health Benefits program: First Nations and Inuit Health Branch: Annual Report 2019 to 2020. Gatineau (QC): Indigenous Services Canada; 2021: https://www.sac-isc.gc.ca/eng/1624462613080/1624462663098. Accessed 2022 Apr 1.
39.Non-Insured Health Benefits program: First Nations and Inuit Health Branch: Annual Report 2020 to 2021. Gatineau (QC): Indigenous Services Canada; 2022: https://www.sac-isc.gc.ca/eng/1645718409378/1645718500555. Accessed 2022 Apr 1.
40.Ramage-Morin PL, Gilmour H. Prevalence of migraine in the Canadian household population. Health Rep. 2014;25(6):10-16. PubMed
41.Burrell ER, Mues KE, Xue F, Buse DC, Lipton RB, Chia VM. Sizing of the migraine population treated with preventive medications for migraine. Value Health. 2018;21:S204.
42.Ajovy: migraine. Avis transmis au ministre en mars 2021. Québec (QC): Institut national d'excellence en santé et en services sociaux; 2021: https://www.inesss.qc.ca/fileadmin/doc/INESSS/Inscription_medicaments/Avis_au_ministre/Mars_2021/Ajovy_2021_03.pdf. Accessed 2022 Apr 1.
43.Emgality: migraine. Avis transmis au ministre en févier 2022. Québec (QC): Institut national d'excellence en santé et en services sociaux; 2022: https://www.inesss.qc.ca/fileadmin/doc/INESSS/Inscription_medicaments/Avis_au_ministre/Mars_2022/Emgality_2022_02.pdf. Accessed 2022 Apr 1.
44.Dinh T, Sutherland G. Understanding the gap: a pan-Canadian analysis of prescription drug insurance coverage. Ottawa (ON): The Conference Board of Canada; 2017: https://www.conferenceboard.ca/e-library/abstract.aspx?did=9326. Accessed 2022 May 1.
Appendix 1: Cost-Comparison Table
Note that this appendix has not been copy-edited.
The comparators presented in the following table have been deemed to be appropriate based on feedback from the clinical expert(s). Comparators may be recommended (appropriate) practice or actual practice. Existing Product Listing Agreements are not reflected in the table and, as such, the table may not represent the actual costs to public drug plans.
Table 6: CADTH Cost-Comparison Table for Prevention of Migraines
Treatment | Strength / concentration | Form | Price ($) | Recommended dosagea | Daily cost ($) | Annual cost ($) |
|---|---|---|---|---|---|---|
Eptinezumab (Vyepti) | 100 mg/mL | Vial | 1,665.0000b | 100 mg or 300 mg every 12 weeks | 19.82 to 59.46 | 7,240 to 21,720 |
Anti–calcitonin gene–related peptide monoclonal antibodies | ||||||
Erenumab (Aimovig) | 70 mg/mL 140 mg/mL | Prefilled syringe or prefilled autoinjector | 532.0000c | 70 mg or 140 mg subcutaneously once monthly | 17.48 | 6,384 |
Fremanezumab (Ajovy) | 225 mg/1.5 mL | Prefilled syringe or prefilled autoinjector | 535.7240d | 225 mg once a month or 675 mg every 3 months | 17.60 | 6,429 |
Galcanezumab (Emgality) | 120 mg/mL | 1 mL prefilled syringe or pen | 560.9800c | 240 mg initial loading dose, then 120 mg once monthly | Maintenance: 18.43 | Year 1: 7,293 Year 2+: 6,731 |
Other treatments indicated for migraine prophylaxis | ||||||
Flunarizine (generics) | 5 mg | Cap | 0.7348 | 10 mg daily | 1.47 | 537 |
Onabotulinum toxin A (Botox) | 50 U 100 U 200 U | Injection vial | 178.5000 357.0000 714.0000 | 155 U to 195 U every 12 weeks | 6.59 to 8.29 | 2,406 to 3,027 |
Pizotyline/Pizotifen (Sandomigran) | 0.5 mg 1 mg | Tab | 0.3972 0.9588 | 1.0 to 6 mg daily | 0.79 to 4.77 | 290 to 1,741 |
Topiramate (generics) | 25 mg 100 mg 200 mg | Tab | 0.2433 0.4583 0.6748 | 100 mg per daye | 0.46 | 167 |
Note: All prices are from the Ontario Drug Benefit Formulary (accessed July 2022)14 unless otherwise indicated, and do not include dispensing fees. An average year is assumed to comprise 365.25 days.
aRecommended dosages are from the respective product monographs, unless otherwise stated.3,4,21,23-26
bSponsor-submitted price.9
cIQVIA Delta PA wholesale price, accessed July 2022.16
dOntario Exceptional Access Program.27
eDaily and annual drug costs assume post-titration maintenance dose.
Table 7: CADTH Cost-Comparison Table for Prophylaxis of Migraine (Off-Label Medications)
Drug/comparator | Strength | Dosage form | Price ($) | Recommended dose | Average daily drug cost ($) | Average annual drug cost ($) |
|---|---|---|---|---|---|---|
Anti-epileptics | ||||||
Divalproex sodiumab (generics) | 125 mg 250 mg 500 mg | Ent tab | 0.1539 0.2767 0.5537 | 500 mg to 1,500 mg per dayab | 0.55 to 1.66 | 202 to 607 |
Valproic acidab (generics) | 250 mg | Cap | 0.2905 | 500 mg to 1,500 mg per dayab | 0.58 to 1.74 | 212 to 637 |
50 mg/mL | Oral sol | 0.0398 | 0.40 to 1.19 | 145 to 436 | ||
500 mg | Ent cap | 0.8102 | 0.81 to 2.43 | 296 to 887 | ||
Gabapentina (generics) | 100 mg 300 mg 400 mg | Cap | 0.0416 0.1012 0.1206 | 1,200 mg to 1,800 mg per day in 3 dosesa | 0.36 to 0.61 | 132 to 222 |
Antidepressants | ||||||
Amitriptylineab (generics) | 10 mg 25 mg 50 mg | Tab | 0.0435 0.0829 0.1540 | 20 mg to 150 mg per dayab | 0.09 to 0.46 | 32 to 169 |
Doxepinb (Sinequan) | 10 mg 25 mg 50 mg 75 mg 100 mg | Cap | 0.3835 0.4705 0.8728 1.1648c 1.5319c | 25 mg to 100 mg per dayb | 0.47 to 1.53 | 172 to 560 |
Nortriptylineab (Aventyl) | 10 mg 25 mg | Cap | 0.2819 0.5697 | 20 mg to 150 mg per dayab | 0.56 to 3.42 | 206 to 1,248 |
Venlafaxineab (generics) | 37.5 mg 75 mg 150 mg | ER Cap | 0.0913 0.1825 0.1927 | 150 mg per dayab | 0.19 | 70 |
Antihypertensives | ||||||
Atenolol (generics) | 50 mg 100 mg | Tab | 0.0938 0.1543 | 100 to 150 mg per dayb | 0.15 to 0.24 | 56 to 91 |
Metoprolol (generics) | 50 mg 100 mg | Tab | 0.0624 0.1361 | 100 mg to 200 mg per dayab | 0.12 to 0.25 | 46 to 91 |
100 mg 200 mg | SR tab | 0.1415 0.2568 | 0.14 to 0.26 | 52 to 94 | ||
Nadolol (generics) | 40 mg 80 mg 160 mg | Tab | 0.2375 0.3410 1.2046 | 80 mg to 160 mg per dayab | 0.34 to 0.68 | 125 to 249 |
Propranolol (generics) | 10 mg 20 mg 40 mg 80 mg | Tab | 0.0689 0.1107 0.1225 0.2034 | 80 mg to 160 mg per day in 2 dosesab | 0.24 to 0.41 | 89 to 149 |
Verapamil (generics) | 80 mg 120 mg | Tab | 0.2735 0.4250 | 240 mg to 320 mg per dayab | 0.82 to 1.09 | 300 to 400 |
120 mg 180 mg 240 mg | SR tab | 0.5078c 0.5204 1.7143 | 1.71d | 626 | ||
Candesartan (generics) | 4 mg 8 mg 16 mg 32 mg | Tab | 0.1700 0.2281 0.2281 0.2281 | Up to 16 mg per dayab | 0.17 to 0.23 | 62 to 83 |
Lisinopril (generics) | 5 mg 10 mg 20 mg | Tab | 0.1347 0.1619 0.1945 | 20 mg per daya | 0.19 | 71 |
Antimanic/Mood stabilizer | ||||||
Lithium carbonate (generics) | 150 mg 300 mg 600 mg | Cap | 0.0667 0.0657 0.1988d | 300 mg 3 times dailyb | 0.20 | 72 |
Lithium carbonate (Lithmax) | 300 mg | SR tab | 0.2880c | 0.86 | 316 | |
Cap = capsule; Ent cap = enteric coated capsule; Ent tab = enteric coated tablet; ER cap = extended release capsule; Oral sol = oral solution; SR tab = sustained release tablet; Tab = tablet.
Notes: All prices are from the Ontario Drug Benefit Formulary (accessed July 2022)14 unless otherwise indicated and do not include dispensing fees. All recommended doses sourced from respective product monographs, unless otherwise stated. An average year is assumed to comprise 365.25 days.
aSourced from 2012 Canadian Headache Society Guidelines for Migraine Prophylaxis.28
bSourced from CPhA Therapeutic Choices: Headache in Adults, Drugs Used for Migraine Prophylaxis.29
cSaskatchewan Formulary list price (accessed July 2022).30
dAssumes 240 mg, as 320 mg is not a possible dose with SR tablets.
Appendix 2: Submission Quality
Note that this appendix has not been copy-edited.
Description | Yes/no | Comments |
|---|---|---|
Population is relevant, with no critical intervention missing, and no relevant outcome missing | Yes | No comment |
Model has been adequately programmed and has sufficient face validity | Yes | No comment |
Model structure is adequate for decision problem | No | Refer to CADTH appraisal section |
Data incorporation into the model has been done adequately (e.g., parameters for probabilistic analysis) | Yes | No comment |
Parameter and structural uncertainty were adequately assessed; analyses were adequate to inform the decision problem | Yes | No comment |
The submission was well organized and complete; the information was easy to locate (clear and transparent reporting; technical documentation available in enough details) | Yes | No comment |
Appendix 3: Additional Information on the Submitted Economic Evaluation
Note that this appendix has not been copy-edited.
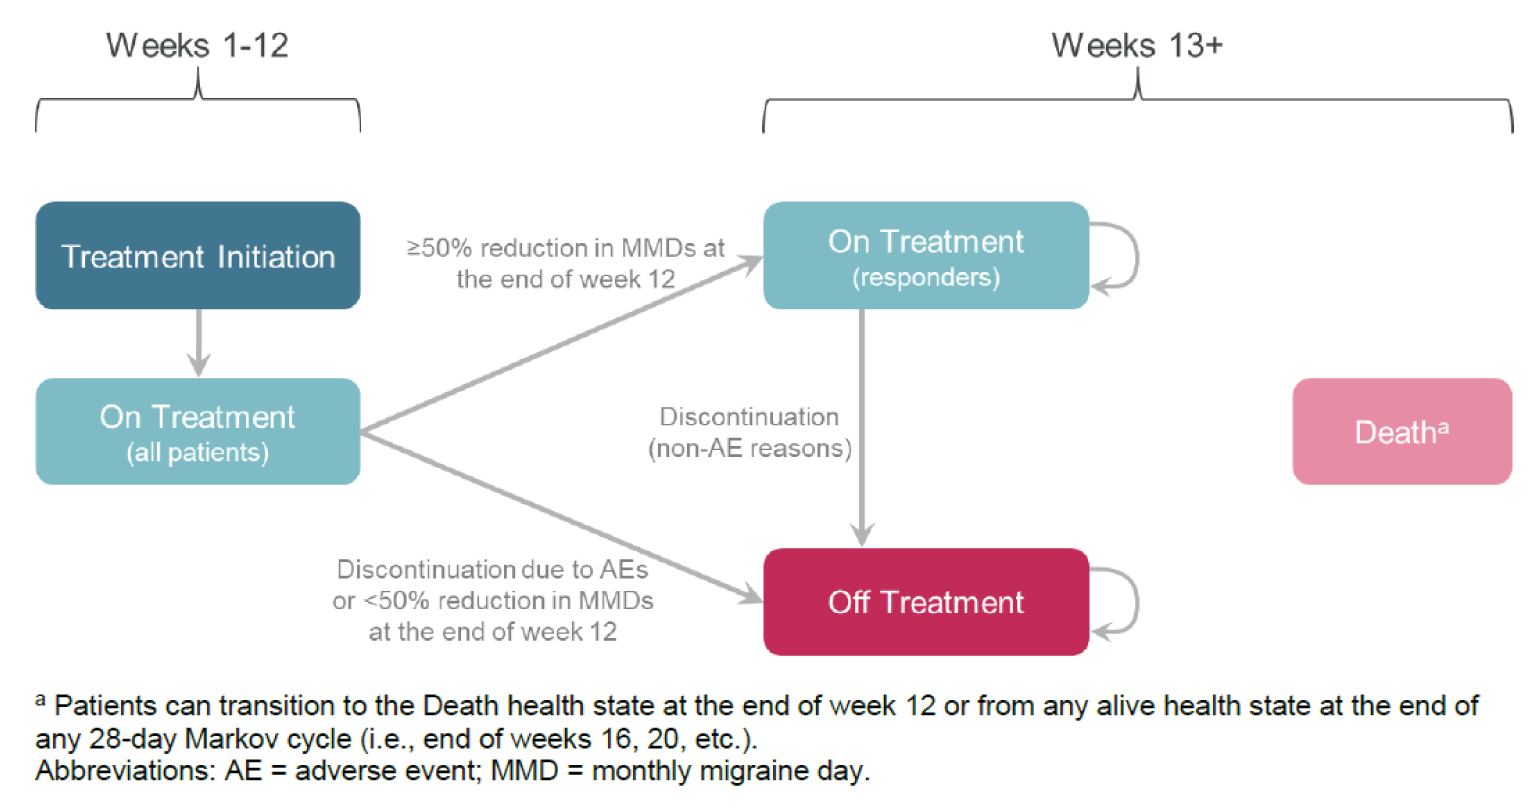
Detailed Results of the Sponsor’s Base Case
Table 9: Disaggregated Summary of the Sponsor’s Economic Evaluation Results — Episodic Migraine
Parameter | Eptinezumab 100 mg | Eptinezumab 300 mg | Fremanezumab 225 mg | Fremanezumab 675 mg | Galcanezumab 120 mg |
|---|---|---|---|---|---|
Discounted LYs | |||||
Total | 4.85 | 4.85 | 4.85 | 4.85 | 4.85 |
On treatment | 2.09 | 2.55 | 2.18 | 2.42 | 1.55 |
Off treatment | 2.76 | 2.30 | 2.67 | 2.43 | 3.30 |
Discounted QALYs | |||||
Total | 3.27 | 3.33 | 3.29 | 3.32 | 3.21 |
On treatment | 1.56 | 1.90 | 1.62 | 1.80 | 1.15 |
Off treatment | 1.72 | 1.43 | 1.66 | 1.51 | 2.05 |
Discounted costs ($) | |||||
Total | 16,282 | 56,855 | 16,239 | 18,016 | 12,970 |
Drug acquisition | 15,245 | 55,773 | 15,258 | 17,021 | 11,931 |
Acute treatment | 330 | 330 | 330 | 330 | 330 |
Resource use | 559 | 559 | 559 | 559 | 559 |
Adverse event | 147 | 193 | 92 | 105 | 149 |
LY = life-year; QALY = quality-adjusted life-year.
Source: Sponsor’s pharmacoeconomic submission.2
Table 10: Disaggregated Summary of the Sponsor’s Economic Evaluation Results — Chronic Migraine
Parameter | Eptinezumab 100 mg | Eptinezumab 300 mg | Fremanezumab 225 mg | Fremanezumab 675 mg | Galcanezumab 120 mg |
|---|---|---|---|---|---|
Discounted LYs | |||||
Total | 4.85 | 4.85 | 4.85 | 4.85 | 4.85 |
On treatment | 1.78 | 1.87 | 2.10 | 1.99 | 2.03 |
Off treatment | 3.08 | 2.98 | 2.75 | 2.86 | 2.82 |
Discounted QALYs | |||||
Total | 2.88 | 2.89 | 2.94 | 2.92 | 2.92 |
On treatment | 1.25 | 1.31 | 1.48 | 1.40 | 1.43 |
Off treatment | 1.63 | 1.58 | 1.46 | 1.52 | 1.49 |
Discounted costs ($) | |||||
Total | 15,933 | 43,878 | 17,444 | 16,815 | 18,293 |
Drug acquisition | 12,955 | 40,913 | 14,726 | 14,014 | 15,475 |
Acute treatment | 1,218 | 1,191 | 1,124 | 1,156 | 1,144 |
Resource use | 1,613 | 1,581 | 1,502 | 1,540 | 1,525 |
Adverse event | 147 | 193 | 92 | 105 | 149 |
LY = life-year; QALY = quality-adjusted life-year.
Source: Sponsor’s pharmacoeconomic submission.2
Appendix 4: Additional Details on the CADTH Reanalyses and Sensitivity Analyses of the Economic Evaluation
Note that this appendix has not been copy-edited.
Scenario Analyses
Table 11: Summary of CADTH Scenario Analysis, Compared to Best Supportive Care
Drug | Total costs | Total QALYs | ICER vs. reference | Sequential ICER |
|---|---|---|---|---|
Episodic migraine | ||||
Best supportive care | $1,044 | 3.04 | Reference | Reference |
Eptinezumab 100 mg | $16,265 | 3.27 | $64,260 | $64,260 |
Eptinezumab 300 mg | $46,805 | 3.27 | $193,690 | Dominated by eptinezumab 100 mg |
Chronic migraine | ||||
Best supportive care | $3,612 | 2.57 | Reference | Reference |
Eptinezumab 100 mg | $15,925 | 2.88 | $40,339 | $40,339 |
Eptinezumab 300 mg | $41,870 | 2.88 | $125,643 | Dominated by eptinezumab 100 mg |
ICER = incremental cost-effectiveness ratio; QALY = quality-adjusted life-year.
Note: The CADTH base case assumes that eptinezumab 300 mg is equally effective to eptinezumab 100 mg; no other changes were made to the sponsor’s submitted model. Analyses were conducted probabilistically.
Table 12: CADTH Price-Reduction Analyses for the Episodic Migraine Population (Scenario Versus Best Supportive Care)
Analysis | ICERs for eptinezumab 100 mg versus best supportive care |
|---|---|
Price reduction | CADTH reanalysis |
No price reduction | $63,546 |
10% | $57,188 |
20% | $50,829 |
21.3% | $50,000 |
30% | $44,471 |
40% | $38,113 |
ICER = incremental cost-effectiveness ratio.
Table 13: Summary of CADTH Scenario Analysis, Compared to Onabotulinum Toxin A
Drug | Total costs | Total QALYs | ICER vs. reference | Sequential ICER |
|---|---|---|---|---|
Chronic migraines | ||||
Onabotulinum toxin A 155U-195U | $ 7,261 | 2.78 | Reference | Reference |
Eptinezumab 100 mg | $ 15,954 | 2.88 | $92,985 | $92,985 |
Eptinezumab 300 mg | $ 41,918 | 2.88 | $373,634 | Dominated by Eptinezumab 100 mg |
ICER = incremental cost-effectiveness ratio, QALY = quality-adjusted life-year.
Note: the CADTH base case assumes that eptinezumab 300 mg is equally effective to eptinezumab 100 mg; no other changes were made to the sponsor’s submitted model. Analyses were conducted probabilistically.
Table 14: CADTH Price-Reduction Analyses for the Chronic Migraine Population (Scenario Versus Onabotulinum Toxin A)
Analysis | ICERs for eptinezumab 100 mg vs. Onabotulinum toxin A |
|---|---|
Price reduction | CADTH reanalysis |
No price reduction | $96,722 |
10% | $82,311 |
20% | $67,900 |
30% | $53,489 |
32.4% | $50,000 |
40% | $39,078 |
ICER = incremental cost-effectiveness ratio.
Appendix 5: Submitted Budget Impact Analysis and CADTH Appraisal
Note that this appendix has not been copy-edited.
Table 15: Summary of Key Take-Aways
Key take-aways of the budget impact analysis |
|---|
|
Summary of Sponsor’s Budget Impact Analysis
The sponsor submitted a BIA to estimate the 3-year budget impact of reimbursing eptinezumab for the prevention of migraine in adults who have had at least 4 migraine days per month and have experienced inadequate response, intolerance, or contraindication to at least 2 oral prophylactic migraine medications. The analysis was taken from the perspective of the Canadian public drug plan. A 3-year tie horizon was used from 2023 to 2026, with 2022 as the base year.
The sponsor estimated the eligible population using an epidemiological approach. The target population size was estimated using the pan-Canadian population followed up further specifications of the population size based on patients diagnosed with EM or CM receiving preventives and having failed 2 or more prior preventive therapies.
The in the base-case analysis, the sponsor included drug acquisition costs only (i.e., no markup or dispensing fees). Wastage was not considered for eptinezumab or onabotulinum toxin A. Data for the model were obtained from various sources including: Statistics Canada,31 published literature,32-41 PMPRB,15 Institut national d'excellence en santé et services sociaux (INESSS) reviews of previous anti-CGRPs,42,43 the Ontario Drug Benefit Formulary,14 the IQVIA Delta PA database,16 and the sponsor’s internal data.
Key inputs to the BIA are documented in Table 15.
Key assumptions included:
no prevalence growth for the target population of the analysis
galcanezumab will be available for public funding in year 1
eptinezumab will only take market share from fremanezumab and galcanezumab; patients on BSC will not switch.
Table 16: Summary of Key Model Parameters
Parameter | Sponsor’s estimate (reported as year 1 / year 2 / year 3 if appropriate) |
|---|---|
Target population | |
Adult Population (18 to 64 / ≥ 65) Public Coverage (18 to 64 / ≥ 65) Migraine Prevalence (18 to 64 / ≥ 65) Migraine type (EM / CM) On preventives (EM / CM) Failed 2+ preventives | 18,892,181 / 5,585,58531,35-39 27.4% / 98.7%44 8.8% / 5.1%40 92.3% / 7.7%34 18.0%41 |
Number of patients eligible for drug under review Episodic Chronic | 32,950 / 33,609 / 34,289 4,641 / 4,733 / 4,829 |
Market uptake (3 years) | |
Uptake (reference scenario) Eptinezumab Fremanezumab Galcanezumab Onabotulinum toxin A BSC | Episodic Chronic ||||||% / ||||||% / ||||||% ||||||% / ||||||% / ||||||% ||||||% / ||||||% / ||||||% ||||||% / ||||||% / ||||||% ||||||% / ||||||% / ||||||% ||||||% / ||||||% / ||||||% ||||||% / ||||||% / ||||||% ||||||% / ||||||% / ||||||% ||||||% / ||||||% / ||||||% ||||||% / ||||||% / ||||||% |
Uptake (new drug scenario) Eptinezumab Fremanezumab Galcanezumab Onabotulinum toxin A BSC | Episodic Chronic ||||||% / ||||||% / ||||||% ||||||% / ||||||% / ||||||% ||||||% / ||||||% / ||||||% ||||||% / ||||||% / ||||||% ||||||% / ||||||% / ||||||% ||||||% / ||||||% / ||||||% ||||||% / ||||||% / ||||||% ||||||% / ||||||% / ||||||% ||||||% / ||||||% / ||||||% ||||||% / ||||||% / ||||||% |
Cost of treatment (per patient) over one year | |
Eptinezumab Fremanezumab Galcanezumab Onabotulinum toxin A BSC | $11,576 $6,429 $6,732 $3,103 $0 |
BSC = best supportive care; CM = chronic migraine; EM = episodic migraine.
Summary of the Sponsor’s BIA Results
Results of the sponsor’s base case suggest that the reimbursement of eptinezumab for the prevention of migraine in adults who have had at least 4 migraine days per month and have experienced inadequate response, intolerance, or contraindication to at least 2 oral prophylactic migraine medications is associated with an incremental cost of $961,199 in year 1, $4,169,910 in year 2, and $7,061,793 in year 3. Therefore, the cumulative incremental budget impact over 3 years is expected to be $12,192,901.
The sponsor conducted several sensitivity analyses around market share, flat pricing for 300 mg eptinezumab and no market share capture from onabotulinum toxin A. Overall, the 3-year total incremental budget impact ranges from $1,709,167 (flat pricing) to $24,424,166 (2 times the market share for eptinezumab).
CADTH Appraisal of the Sponsor’s BIA
CADTH identified several key limitations to the sponsor’s analysis that have notable implications on the results of the BIA:
Market share of onabotulinum toxin A may be underestimated. In the sponsor’s base case, onabotulinum toxin A for the CM population had a market share of ||||||% in Alberta and Ontario decreasing to ||||||% over the course of the time horizon. Clinical expert feedback received by CADTH noted that onabotulinum toxin A usage was likely higher, particularly in Alberta where administration costs are covered.
CADTH conducted a scenario analysis exploring the impact of the market share of onabotulinum toxin A for the CM population in Alberta and Ontario where its market share was set to 15% in base year and decreased 30% over the duration of the time horizon (i.e., over 3 years) with patients proportionally split between the available therapies of the reference and new drug scenario.
CADTH Reanalyses of the BIA
Clinical expert feedback received by CADTH noted that the sponsor-submitted BIA utilized values and assumptions that were reflective of Canadian clinical practice; therefore, no reanalysis was conducted.
The scenario analysis exploring the impact of a higher market share for onabotulinum toxin A in Alberta and Ontario in the CM population suggests that eptinezumab is associated with an incremental cost of $945,030 in year 1, $4,153,560 in year 2, and $7,032,656 in year 3. Therefore, the budget impact is expected to be $12,131,246 over the 3-year time horizon. The scenario analysis where the price of eptinezumab was set equal to the lowest-cost reimbursed anti-CGRP comparator (i.e., fremanezumab) resulted in a 3-year budget impact of $9,077,859. In a similar scenario where the price of eptinezumab was set equal to the lowest-cost reimbursed anti-CGRP comparator and flat pricing for eptinezumab doses was assumed, the 3-year budget was –$237,734.
Table 17: Detailed Breakdown of the CADTH Reanalyses of the Budget Impact Analysis
Stepped analysis | Scenario | Year 0 (current situation) | Year 1 | Year 2 | Year 3 | 3-year total |
|---|---|---|---|---|---|---|
Submitted base case | Reference | $33,321,161 | $68,765,318 | $91,427,475 | $115,055,129 | $275,247,921 |
New drug | $33,321,161 | $69,726,516 | $95,597,384 | $122,116,921 | $287,440,822 | |
Budget impact | $0 | $961,199 | $4,169,910 | $7,061,793 | $12,192,901 | |
CADTH scenario analysis: price no greater than least-costly reimbursed anti-CGRP comparatora | Reference | $33,321,161 | $68,765,318 | $91,427,475 | $115,055,129 | $275,247,921 |
New drug | $33,321,161 | $69,481,261 | $94,532,675 | $120,311,944 | $284,325,780 | |
Budget impact | $0 | $715,943 | $3,105,200 | $5,256,716 | $9,077,859 | |
CADTH scenario analysis: flat pricing for eptinezumab 300 mg | Reference | $33,321,161 | $68,765,318 | $91,427,475 | $115,055,129 | $275,247,921 |
New drug | $33,321,161 | $68,901,105 | $92,014,083 | $116,041,899 | $276,957,088 | |
Budget impact | $0 | $135,788 | $586,609 | $986,771 | $1,709,167 | |
CADTH scenario analysis: price no greater than least-costly reimbursed anti-CGRP comparator and flat pricing for eptinezumab 300 mg | Reference | $33,321,161 | $68,765,318 | $91,427,475 | $115,055,129 | $275,247,921 |
New drug | $33,321,161 | $68,747,821 | $91,348,640 | $114,913,726 | $275,010,187 | |
Budget impact | $0 | –$17,497 | –$78,835 | –$141,402 | –$237,734 | |
CADTH scenario analysis: increased onabotulinum toxin A market share | Reference | $33,799,974 | $69,023,381 | $91,561,973 | $115,085,450 | $275,670,804 |
New drug | $33,799,974 | $69,968,411 | $95,715,533 | $122,118,106 | $287,802,050 | |
Budget impact | $0 | $945,030 | $4,153,560 | $7,032,656 | $12,131,246 |
aEptinezumab 100 mg price set equal to fremanezumab; eptinezumab 300 mg price assumed to be 3 times that of eptinezumab 100 mg.
Stakeholder Input
Patient Input
Migraine Canada and Migraine Quebec
About Migraine Canada and Migraine Quebec
Migraine Canada is a national federally registered charity, founded in late fall of 2018, with a mission to provide support and education as well as raise awareness about how migraine impacts people’s lives. We advocate for equitable and optimal care for those living with migraines and support research to find a cure. With the help of dedicated physicians and contributors, Migraine Canada delivers evidence based, up-to-date disease and treatment information to Canadian living with migraine, including patients and caregivers, as well as healthcare professionals. We educate patients, caregivers, and healthcare professionals by researching, developing, and sharing electronic and print materials containing the most current migraine information. We drive awareness and education through our website, social media channels and forums. We have a growing community of over 2,500 individuals subscribing to our email list. We provide patient support through participation in regional on-line support groups, with close to 4,000 members on our Facebook page.
Migraine Quebec is a provincial non-profit patient organization founded in 2014 whose mission is to provide support and information to people with the disease and those close to them, as well as to educate the public about the repercussions of migraine. We advocate for optimal care for migraine sufferers and support research to find cures to improve the quality of life of patients with this chronic disease. We educate patients, caregivers and healthcare professionals by researching, developing and sharing electronic and print documents containing the most recent data on migraine. We promote awareness and education through our website, social media, workshops and forums. We help patients by offering regional on-line support groups (with more than 5,000 members on our Facebook page) for the province of Quebec).
Both organizations have a broader reach by interacting with several other on-line Canadian and International groups and leverage traditional and social media channels to empower patients to share stories and experiences to advocate for the supports needed to live full and active lives while coping with migraines.
Website (English): www.migrainecanada.org
Website (French): www.migrainequebec.com
Information Gathering
The information provided in this submission was collected through an on-line Quality-of-Life survey that was launched by Migraine Canada in late fall of 2021. It was promoted across Canada in both French and English through Migraine Canada’s digital and social media channels with promotion support by Migraine Quebec. In total, 1,165 Canadian adults with migraine and their caregivers responded to the online survey. Of our total respondents, 19% live with low frequency migraine, 28% live with 8-14 days / month with migraine and 52% live with chronic migraine 15 or mores days. The spectrum of representation was national with the majority (68%) participating between the age of 30-59.
Migraine Canada launched a second national online survey in June 2022 to gather additional insights to support our submission and seek input from patients with experience on eptinezumab. It was promoted across Canada through Migraine Canada’s digital and social media channels with promotion support by Migraine Quebec. In total, 132 individuals (114 Canadian and 18 American) with migraine responded to the survey. Of our total respondents, close to 11% live with low frequency migraine, 20% live with 8-14 days / month with migraine and 70% live with chronic migraine 15 or mores days. The spectrum of representation was national with the majority (71%) participating between the age of 30-59
Migraine Canada also received input from 13 patients who reside in the United States with experience taking eptinezumab that has been included in the submission.
Disease Experience
Migraines are not just headaches but a neurological disease. Migraine impacts 1 billion people worldwide, or about 1 in 7 people. Migraine is most common between the ages of 25 and 55 but it can impact people of all ages including children (10%) but it affects three-times as many women as men (8%).
Migraines are classified according to their monthly frequency. Episodic Migraine is defined as impacting less than 15 days per month and 12% of adults living with migraine fall into this group; Chronic Migraine impacts more than 15 days per month and 2% of the adult migraine populations. Migraines often present with severe, throbbing, recurring pain, usually on one side of the head (or both sides or no pain at all). Nausea, vomiting, dizziness, extreme sensitivity to sound, light, touch, and smell, and tingling or numbness in the extremities or face are also common symptoms. About 25% of migraine sufferers also have a visual disturbance called an aura, which usually lasts less than an hour. Attacks usually last between 4 and 72 hours.
Migraine is usually categorized according to accompanying symptoms (aura, vestibular, hemiplegic) but also according to monthly frequency of attacks. Episodic migraine refers to attacks occurring 14 days or less and is now further separated in low-frequency (1-6 days) and high frequency (7-14 days). Chronic migraine is diagnosed when patients have 15 or more headache days per month. Chronic migraine is associated with increased disability and co-morbidities. It is also associated with medication overuse headache (MOH), a complication of frequent use of acute treatments that induce even more frequent and intractable headaches. The estimated prevalence of MOH varies according to countries but is usually between 0.5% and 2% of the global population (GBD 2015). Medication overuse feeds the headache cycle and patients are trapped in a vicious cycle, unable to get adequate pain relief.
There are two main states of life for a migraine patient: the active attack (ictal state) and in-between attacks (interictal state). During the attack itself, symptoms may prevent the person’s ability to accomplish their tasks, work and interact with others. The pain is at least moderate and often severe, throbbing, and diffuse. The nausea and vomiting are obviously disruptive and may prevent oral medications efficiency. The sensory hypersensitivity forces many patients to isolate themselves in a dark room and stop all activities. Auras are neurological deficits that can accompany migraines (including loss of vision, speech, and sensation, even muscle strength) which can last for hours. Some migraines are also accompanied with dizziness, vertigo, and loss of balance. People generally experience reduced cognition during a migraine, with slowed thinking, lack of focus, and difficulty reading and speaking. This typically disrupts most activities involving a computer or interacting with other people. A controlled migraine attack managed with effective treatment can be brief, but uncontrolled attacks may last multiple days in a row.
The negative impact for a large percentage of people is significant. Participants in both the quality-of-life and our most recent survey both indicated all aspects of their life is negatively impacted and range from regularly needing to change or cancel plans or avoid interacting with people altogether (67%).
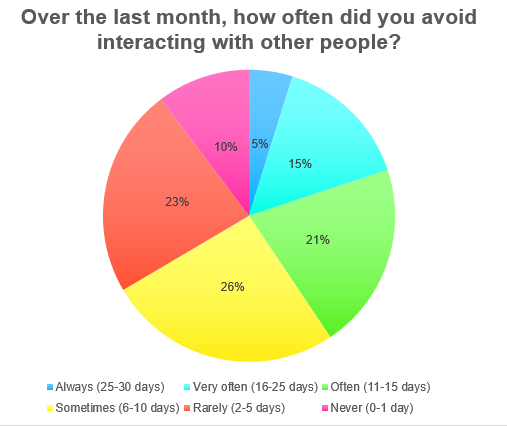
When asked, over the last month, how often was it difficult to keep a daily routine or schedule, over 52% had difficulty. 39% of patients were unable to do usual household chores. Many people reported that although their migraine was excruciating, they learn to push through it because they have no other choice.
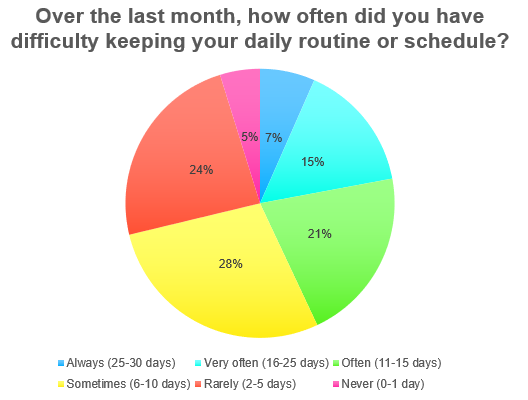
Approximately 30% did not have concentration affected while 29% noted they sometimes had trouble (6-10 days) and 68% were regularly unable to do activities that required concentration.
The majority (73%) of survey respondents indicated they live in fear of the next attack and have difficulty planning ahead. Only 9% they didn’t worry about their next attack.
A significant number of people (55%) experience feeling lack control of their life because of migraine ranging from always (25-30 days/month) to often (11-15 days/month).
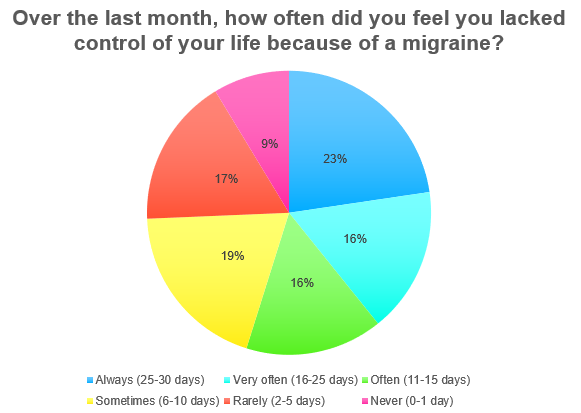
Employment
Only 46% of patients reported to work full time and 11% are able to work part-time. For many who indicated they work part time, they are also on CPP disability. Over 20% are on short or long term disability or retired early due to their condition (migraine). There were many people (3%) who shared they were unemployed and not able to have any support through disability programs.
For the patients who are on short-term or long-term disability, 81% reported it was due to their migraines and 66% have been on disability more than 18 months.
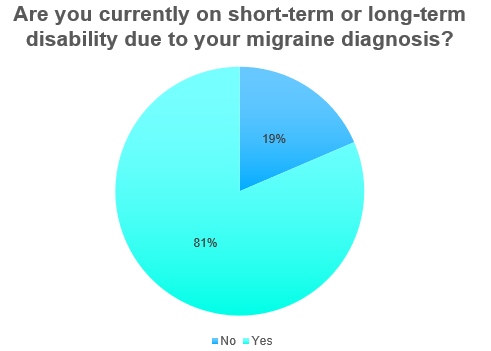
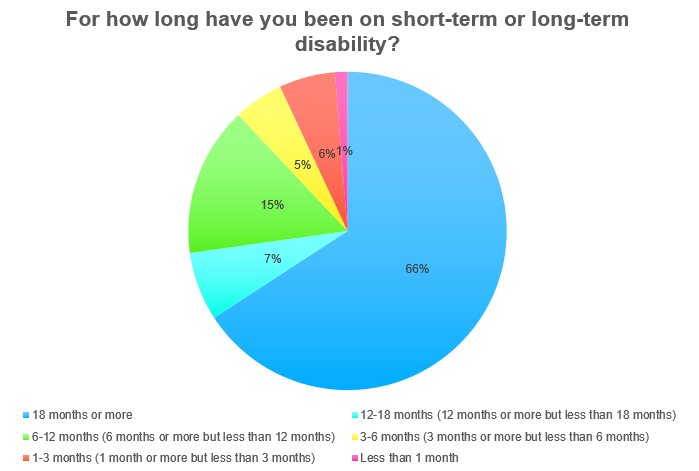
The following graph illustrates the impact migraine has on people’s work / career.
13% reported migraine has had no impact on career
20% reported migraine has impacted education journey
22% reported migraine has impacted career choice
11% reported migraine has limited ability to find work
25% reported migraine has limited ability to remain in a work position.
Impact on Work
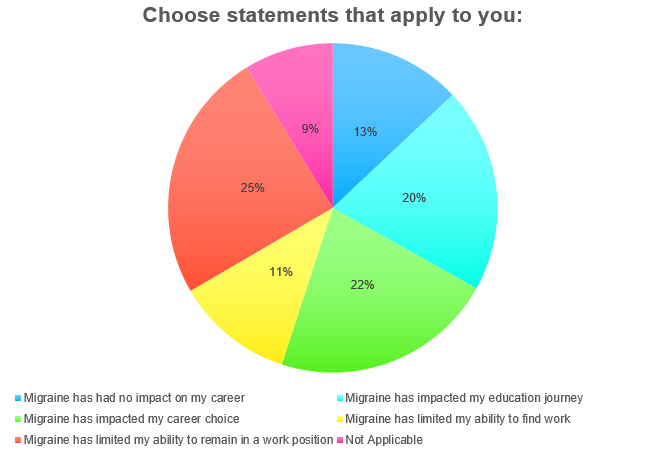
June 2022 Survey - Patient Testimonials
“I am no longer able to work at my job as an elementary school teacher and I’m not sure when I will be able to go back. It is very hard for me to be the mom I want to be to my children because I am almost constantly in pain”.
“I exist. I don’t live. Headaches control every aspect of my life. I don’t plan things because most often I have non-functioning headache. I have a headache every day. I classify them as functioning and non- functioning. Functioning headaches are exhausting, and non-functioning are a nightmare. I’M AT THE END OF MY ROPE TRYING TO GET HELP. The healthcare system treats you as a number, in the end you are alone in this health issues. Exhausted by headaches”.
“Migraine has severely impacted every aspect of my life. I went from a happily married career woman with a big circle of friends to someone with a very different life. I have now been approved for medical retirement from a career I love. I am divorced (migraine having a huge part in that). And my ability to socialize with friends has been severely impacted. One of the few things that keeps me going is knowing there is ongoing research in the area of migraine treatment and prevention. And that new therapies are going to be made available to us. I ask you to please facilitate the introduction of as many treatments as possible so that more people be helped”.
“Migraine affects all aspects of my life and I’m constantly worried when the next thing I will have to cancel will be. Missing work has the biggest negative impact on my life and the most sigma even though I work in healthcare.
“Without meds, migraine impact me every single day. With meds, I am able to work full time and completed graduate school. That said, I have a lot of tough days”.
“Migraine has a significant impact on my quality of life. There are few treatment options that work and no other available that I’ve yet to try. There are not enough migraine specialists. I feel there needs to be specific migraine treatment centres with full scope approach to treatment and patient care. We need more new approved treatments especially for people with chronic/intractable migraine. I am eagerly awaiting the approval Vyepti”.
“I don’t have a life. I’m in survival mode 100% of the time”.
“Chronic migraine has completely changed my life. It has impacted my ability to work and function as a member of society. I live my life around migraines and need to cancel plans or call in sick due to the impact. Aimovig worked for 2 years then stopped. I have switched to Ajovy but fear of happens when that stops working? Vyepti needs to be approved in Canada to give us other alternatives for medication that is migraine specific”.
“My migraines became very unmanageable during my pregnancy. I had a migraine the entire pregnancy making it unbearable. This has stopped me from having a 2nd child as I do not want to experience that again. My migraines also impact my ability to parent in a way that I would like to”.
“Migraine has completely devastated my ability to have a “normal” life. Living with high-frequency/ chronic migraine has taken away my ability to work for the past four years, taking me away from my career in a job that I absolutely loved and spent years going to school for. On top of that, it has significantly impacted my ability to make any type of plans with family/friends, and even limits my ability to do normal activities of daily living (showering, easting, etc). Imagine a life where you have to spend half of the of a month alone, in a dark room, in severe pain. It’s not much of a life”.
Impact on Sleep
Issues with sleep is significant ranging from 7% having no issues with sleep to 38% always or regularly have sleep disrupted due to their migraine.
Sleep disruption reported by patients caused by migraine over the past month was significant for respondents. Close to 20% reported 16-30 days as always or very often disrupted, followed by 19% who reported 11-15 days of disrupted sleep.
Patients rated their quality of sleep as very poor (17%), often disrupted (37%) and sometimes disrupted (30%). Only 16% rated their sleep as “good”. When as specifically if migraine impacts sleep, 84% of patients attribute their migraine as having a negative impact.
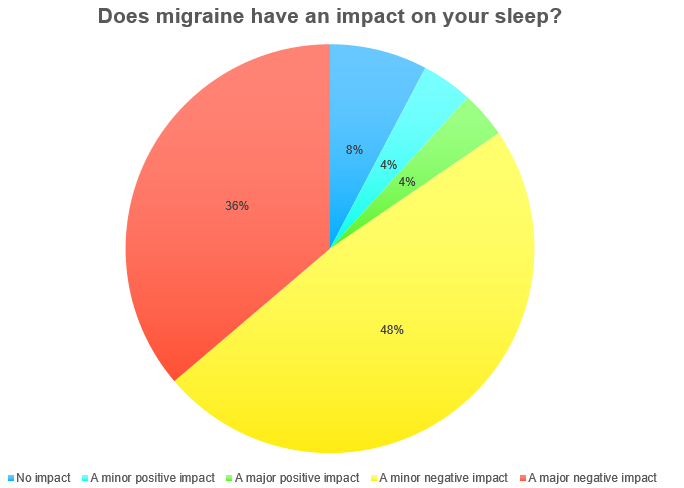
Mental Health
When asked if migraine has led to the development of depression and anxiety, 39% reported that migraine has caused the individual to be depressed and/or anxious (moderate to severe) requiring counselling and/or medication. Approximately 48% said migraine has caused them to become depressed and/or anxious but not to the point counselling or medication was required. Only 13% reported migraine has had no significant impact.
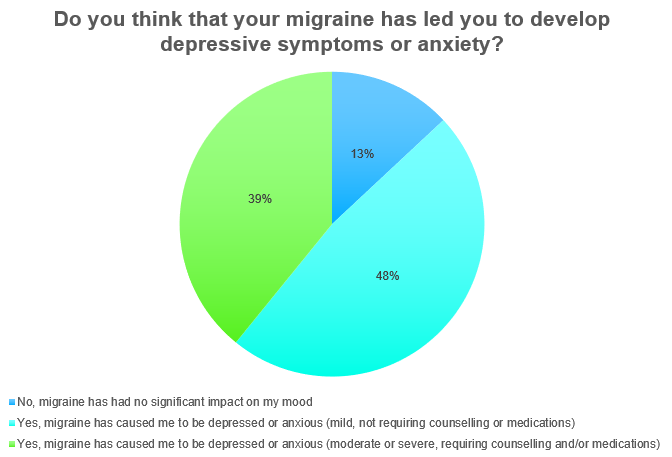
The second survey had similar responses related to migraine causing depression and anxiety. About 48% reported that migraine has caused the individual to be depressed and/or anxious (moderate to severe) requiring counselling and/or medication and 47% said migraine has caused them to become depressed and/or anxious but not to the point counselling or medication was required. Approximately 5% reported migraine has had no significant impact mental health.
Burden on Family
When asked how often individuals felt they were a burden on others, only 14% responded with never and 21% rarely (2-5 days). The majority felt they were a burden (31% 16-30 days/month) and 35% between 6-15 days/month.
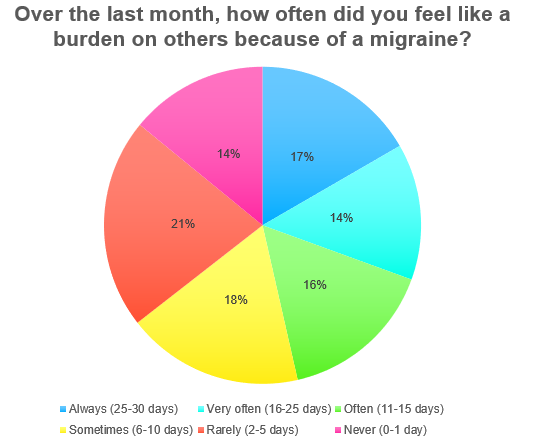
Respondents reported (39%) that they always or very often feel a lack of control over their life because of migraine. Only 9% did not feel migraine impacts control over their life.
When asked, over the last month, how often did the participants partner have to take over the parenting activities, only 30% had no impact. 60% had some degree of impact (10% noted their partner had to take over between 12-30 days/month.
Over the last month, although the patients reported to rarely or never (56%) miss a family activity, 23% missed activities 6-10 days/month and 14% between 11-15 days/month.
Approximately 37% of respondents agreed they would be a better parent if they didn’t have migraine and only 7% feel their migraine has no influence on parenting.
Because of their migraine 50% worry about their family’s financial stability.
The majority of people (54%) indicated migraine has a negative impact on their relationship with their partners. Only 15% disagreed with the statement.
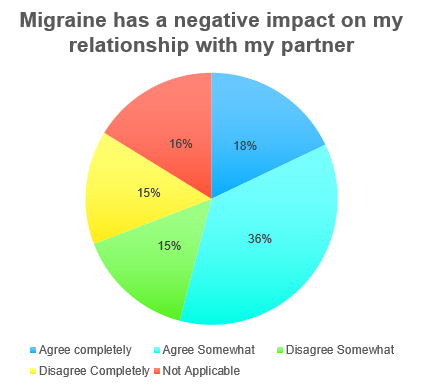
Patient testimonials from Quality-of-Life Survey:
“I’ve had chronic migraine for about 10 years. It has impacted every aspect of my life. I’m not able to earn a consistent income, I’m not able to look after my kids or my home in any regular way and more often than not, I have to cancel plans with my spouse, family and friends because of my migraines. It’s very isolating and discouraging, and there have been times when I’ve felt like it’s just not worth living like this”.
“I’m not a mother or a wife anymore. I am a shell. I take up space in my home but don’t contribute. This is not a life”.
“My children see a much more angry, frustrated mom because of migraine. They also experience more anxiety and fear not knowing if I will be able to do things with them or seeing me violently throwing up or going to emerge. The impact on my kids is huge”.
“I cannot be there for my family because I’m not physically or emotional available for them, even if I try my hardest. I know my family loves me but just being unavailable to do my job as a mom and wife. I also become a huge burden as they to adapt their needs to accommodate mine, not to mention the INCREDIBLY big expense just to have me able a little bit more functional. I feel I’m watching life go by without being able to participate in it. Like a by-stander. This is no way to live, specifically if we are not supported or recognized as disabled, or even worse, dismissed”.
“My ex-husband was not able to understand the level of pain that I had and was not able to understand the limitations that it gave me some days. It put a huge strain on our relationship and it probably was a part of the demise of the marriage along with other issues”.
"With how bad my migraines have become, I am not the partner or parent that I once was. A lot of my day is spent in the bedroom. My husband must pick up the slack on my bad days after he has worked really hard all day. It is hard to explain to my family that even with meds and some treatments, none of it is a long-term fix. I try to push thru a lot but feel like I am letting them down a lot. I feel like emotionally I am wrecked. I am so tired of pain”.
Experiences With Currently Available Treatments
When asked, at this point in time, if the care patients have received so far has led to an improvement in quality of life, 25% report no improvement and 49% has a mild improvement. Only 24% has experienced a marked improvement.
We also learned that in the past 6 months 57% of people did not fill their prescription due to cost and lack of coverage.
Over 78% of respondents have taken a prescriptions medication to prevent migraines. Close to 53% reported they were not satisfied with the current preventative medication treatment available that they have access to.
Close to 45% of people have not found an effective and tolerated way to control the majority of their migraine attacks. When asked how satisfied patients are with the current preventative prescriptions that are available in Canada, 53% are not satisfied. Only 21% reported they were satisfied with the options available.
Respondents (74%) from the June 2022 survey reported taking more than 5 preventatives. Approximately 24% have found a preventative providing >50% improvement in frequency and intensity with no significant side effects and close to 12% of respondents have found a preventative that provided a >75% improvement.
Patient testimonials on satisfaction of current medications from Quality-of-Life and June 2022 Survey:
“Helps reduce frequency but has side effects”.
“I have only tried one CGRP. It worked better in the beginning; it seems to be growing less effective. I am also disturbed that what I have tried to report as side effects are discounted by my neurologist. And although I answered "yes" to the previous question (have you found an effective and tolerated way to control the majority of your migraines - the answer is not really. I used to get more than 20 per month, now I usually get about half that BUT - they seem to be increasing in frequency”.
“I have a prescription that helps prevent one type of migraine symptoms….haven’t found anything that prevents the migraines which feel like an axe is in my head.”
“CGRP has reduced me from 19.6/month on average to 10-12”.
“I'm not completely dissatisfied. The med I'm on lowers the severity but I'm still living with daily constant headaches/migraine”.
“I still have migraine symptoms daily but the intensity of the symptoms are markedly less severe than without my medication protocol”.
“I’ve tried everything. Nothing has worked for me. I feel at times its hopeful and this is my death sentence and punishment. I would like to try some of the newer products”.
“Everything I have tried has moderate to significant side effects and risks. So I’d like that to improve”.
“So many medications are contraindicated for people with hypertension. As well, more benefits, and fewer side effects. Off label drugs have horrid side effects”.
Overall, the patients who responded to the quality-of-life survey indicated they have tried the following treatments, when given the option to choose all that apply:
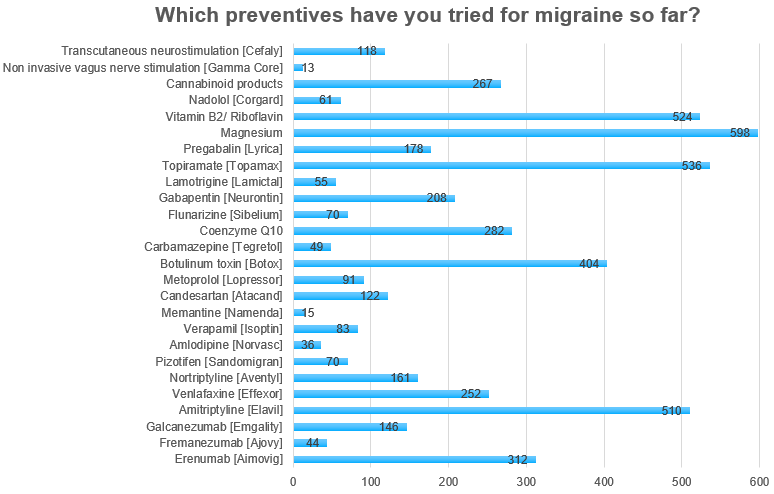
For respondents who have had experience on new treatments (CGRP’s) many have had notable improvements in ability to work. Close to 10% were able to work 20 or more days per month and 20% were able to work 10-19 more days per month.
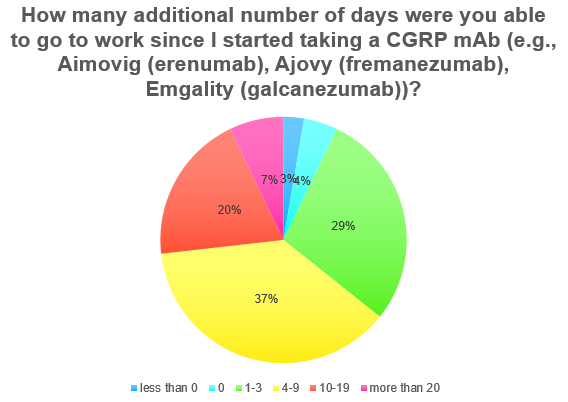
Need for More Medication Options in Canada
When asked if patients had found an effective and tolerated way to control their migraines, 45% they have not.
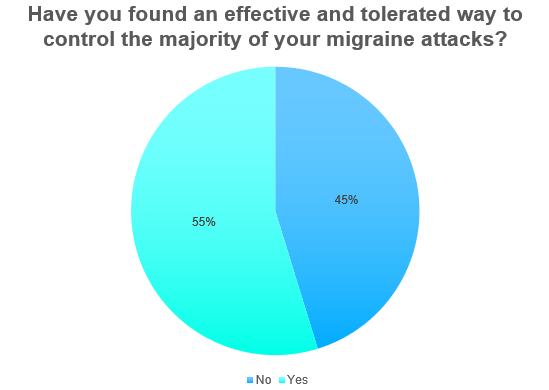
Most respondents (73%) believe there is a need for additional new treatment options in Canada. And 19% were unsure. For those who answered “it depends”, there were several comments specific to side effects and efficacy.
Patient testimonials “it depends”:
“There is always need for new medications and more medications. They wear off and people need to know there are more to try.”
“I have tried almost everything. My doctor doesn’t know what else do to. Yes, more medication are needed if they have less side effects and work”.
“We need more medication. We also need to be able to get them. The new ones are expensive, and I can’t afford to pay and I don’t have private insurance. I hear from many people they work really well”.
“Only if they are safe and have fewer side effects”.
“I agree Canadians need to have more options but with less side effects”.
When asked if people have found a preventative providing >50% improvement in frequency and/or intensity of migraines with NO significant side effects, close to 30% have found a treatment.
Patient Testimonials on currently available treatments:
“The side effects are horrible”.
“They made symptoms more manageable, but I still struggle with side effects”.
“CGRP’s have changed my life for the better”.
“CGRP has reduced my migraine from 20 times/month to 8 times/month”.
“It has recently stopped working and I’ve tried all the others, but I don’t have private insurance and can’t access new medications”.
“I have been on three and after 11-14 months, they all stop working. So far, the one I am now on is starting to work. I pray it continues”.
When asked about side effects experienced from the current preventative medication for migraine, 66% responded side effects lead to discontinuation of the prescribed medication and close to 25% had side effects but tolerated them.
In the June 2022 survey we asked which mode of administration would be preferred and 33% indicated they would prefer infusion every 3 months.
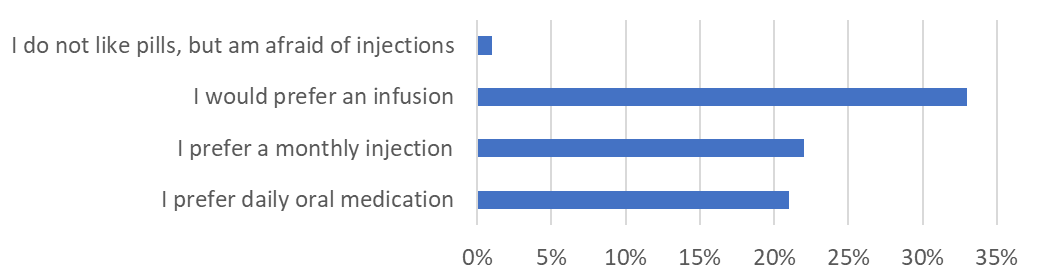
Comments from the June 2022 survey included:
“I don’t care, anything that would help”.
“I am open to any of these methods, as long as I get a more effective treatment. The key for me will be that it is covered by my insurance. They all have been to date”.
“Whatever has the most efficacy with least side effects”.
“I would be open to any route of administration if it works”.
Improved Outcomes
Canadians diagnosed with migraine expect to have access to new innovative medicines that address the unmet needs in the current treatment options available that could improve their quality of life. Many of the therapies currently available are not effective and have intolerable side effects.
In both surveys, the three outcomes that would be most valuable to patients when trying a preventative were:
Decrease in headache intensity
Decrease in headache frequency
Decrease in symptoms other than pain (sensitivity to light, sound, nausea, brain fog, etc)
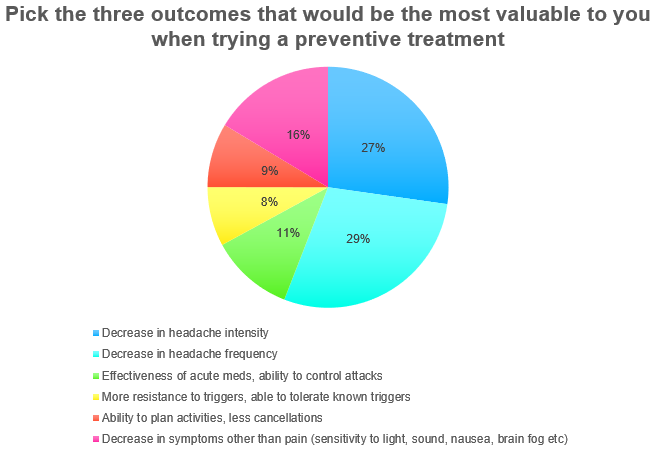
Patient Testimonials from the Quality-of-Life and June 2022 Survey
“Treatment specific to migraine not off label use. Recently tried ketamine/lidocaine infusions which got cancelled due to OHIP refusing to cover them any longer, forcing an excellent pain management clinic to have to close down leaving me in limbo. I was starting to see improvement with migraine from this treatment.
“Efficacy with fewer side effects”.
“The gap that I have experienced with the novel migraine-specific preventative treatments are their ability to have long-term effects on reducing my migraines. Having tried two different CGRPs that gave me a 50% reduction, I was overjoyed, however, both of these drugs on provided good results for 8-12 months. After a year, my migraines started to increase again to the point where I was back to being chronic. The older preventatives that were not migraine specific all had terrible side-effect profiles and provided little relief to the frequency of my attacks, so I ended up more sick than I was when I was taking nothing. Finding a novel treatment that can reduce the frequency of my attacks, provide long-term results, with little/no side effects would be my absolute ideal. I have been fortunate enough to find good results from my triptans to treat the intensity of my attaches, but I am limited to taking 10/month. When you have 15+ attacks like I do, that is not feasible, which why my main emphasis is on finding a preventative that can reduce the frequency of my migraine attacks.
“I could have my life back and participate more fully in life and enjoy time with family and friends”.
I could be more predictable and reliable for work, family and friends. I could have a life that doesn’t consists of me being in my dark room 75% of the time”.
“In so many ways. An effective treatment could improve every aspect of my life. Since every aspect of my life is currently negatively impacted by my daily migraines
“Go back to work, even if part-time. More intimacy with my husband. Being able to do social activities and day to day chores without triggering migraine or feeling completely drained”.
In my case, finding a reliable preventative treatment would allow me to return to work and potentially start a family. In other words, it would allow me to actually have a life worth living. Without any treatment, I am stuck in an isolated world with no purpose, waking daily wondering if I’ll have enough energy to shower or make dinner. That’s not a life”.
“Especially for chronic migraine patients, decreased incidence would mean more delays with capacity to function normally in social and work contexts.
When asked about what trade-offs are considered when choosing a therapy, people from the June 2022 survey responded with:
“Side effects vs efficacy”.
“Covered by insurance, manageable side effects”.
“Side effects vs benefits. Also whether cost is covered by insurance”.
“There shouldn’t be a trade-off. Paying bills or getting a medication/therapy. Migraine discomfort over side effects
“I’m desperate for anything to work”.
“Cost and effectiveness”.
“Lower intensity migraines, taking meds every day”.
“I will take some mild side effects as long as the intense pain from my migraine is gone”.
“Benefits need to outweigh the negatives.
“If it improves pain management, length of time between migraines etc it’s worth it even if minor side effects of it allows more normal levels of activity in daily life”.
“At this point - anything”.
Experience With Drug Under Review
There was a total of 13 people from the United States who have had experience on eptinezumab.
Compared to any previous therapy’s respondents have used, 6 out of 13 people (42%) had a 50% benefit and 3 out of 13 people (17%) experienced a 75% benefit.
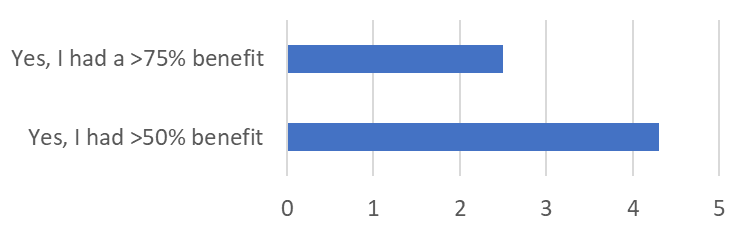
There were 4 people who did not improve or haven’t been on medication long enough to comment.
“It didn’t help with my untreatable chronic migraines. Nothing else has worked either”.
“I’ve only recently started and can’t answer this yet”.
“Didn’t work due to the complexities of my migraines”.
When asked to provide comments about any disadvantages of taking Vyepti, respondents said:
“Definitely improved but not quite where I’d like to be just yet”.
“So far it’s been great”.
“Have to go to an infusion center”.
“Severe joint aches. I had to discontinue”.
When asked how the benefits and disadvantages impact your life, respondents answered:
“Able to go out a little, clean, cook. Better state of mind when migraines are less intense”.
“Benefits overrule disadvantages. Vyepti has made a huge difference in my life and reduced frequency and intensity. I would rather be uncomfortable for about 30 minutes”.
“I have to pay more for to get Vyepti than I did with Botox, but Vyepti works better for me. The benefits were that I have less migraines and can do more things”.
“Have to take time to go get it done but it cut my migraine days down by about half so the tradeoff is worth it”.
“Less baseline pain. Better management of attacks”.
“The benefits are less spikes within a week and the pain level has stayed below a 6”.
When asked about side effects, 67% report they did not experience side effects. Those that experienced side effects mentioned they were tolerable, and one person had to discontinue treatment.
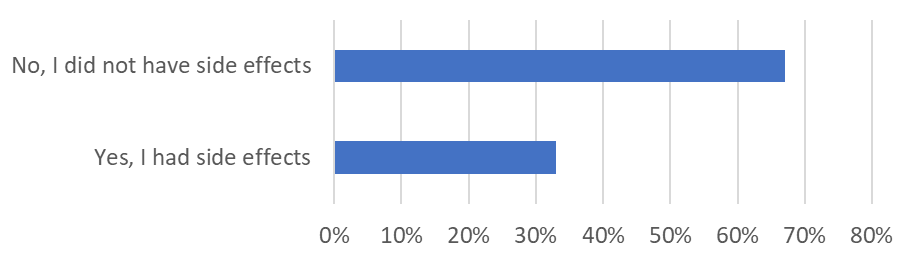
Some side effects that were mentioned included: insomnia, hypersensitivity reaction and a sore throat for 24-48 hours following infusion.
When asked if Vyepti was/is easier and more convenient to use than other therapies, 83% of the respondents reported it was.
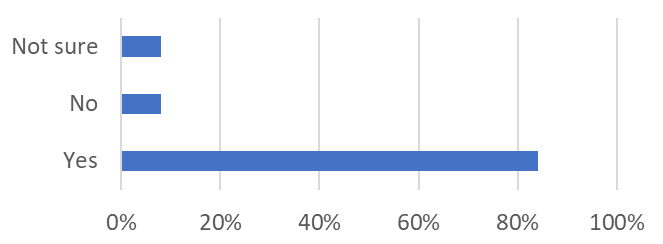
Comments included:
“It only takes about 40 minutes to get the treatment and then you are good”.
“You only need it every 3 months”.
“No daily pill or monthly self-administered shot”.
“Overall yes except for having to go to the infusion center”.
“It takes more time to use than just a pill I take at night, however, I’ve tried nearly all medication classes for migraine that have pills and have minimal to no response, and often negative side effects. I’ve also tried injectable CGRP’s (all – Ajovy, Aimovig and Emgality) and had no response or severe side effects and had to stop. While this takes more time and effort (have to schedule an appointment at an infusion center, get IV placed, and wait for infusion to finish) it was easier for me as I notice a positive impact on my migraine disease.
Companion Diagnostic Test
Not Applicable
Anything Else?
Migraine affects children, women, and men worldwide. It is a life altering and debilitating condition characterized by severe, often “pounding”, head pain, nausea and/or vomiting and sensory hypersensitivity. In the case of aura, neurological deficits occur. Dizziness, vertigo and cognitive difficulties and neck pain are frequently associated with migraine attacks. Migraine significantly impacts quality of life, mental health, relationships, social interactions, and workplace productivity.
For some Canadian patients’ current therapies are sufficient in managing their condition, however for many others, current therapies are ineffective or poorly tolerated leaving patients suffering and without hope. Struggling with 8, 14, or even 28 days of migraine per month is not living and significantly impacts quality of life. Although people will not die from migraine, it steals life away, one day in the dark room at a time. The stigma associated with migraine (it’s all in your head) makes this suffering worse. People with migraine need access to effective treatments to get back to living life and be productive.
There is currently no cure for migraine, but years of research have led to the development of the CGRP antibody specific for migraine prevention. For the first time, preventative treatments based on the biological understanding of migraine mechanisms are now available. For many Canadians living with chronic migraine, new innovative medications like eptinezumab have been life changing, giving back days of normal function. eptinezumab is the first infusion medication approved by Health Canada indicated to treat migraine and provides another option and unique mode of administration and dosing frequency.
It is important Canadians and clinicians have options. Canadians living with migraine are desperate to find a treatment that may improve their quality of life. Until a cure is found, patients are looking for improved outcomes. Many are desperate to have any degree of normalcy returned to their lives. New treatment options may allow patients the ability to return to work, interact with their family and friends and feel like they are contributing to society.
Patient Testimonials From June 2022 Survey - When asked about the need for new medications in Canada, patients shared the following comments:
“We are lacking resources and medicine to adequately treat. Doctors cycle through the same meds hoping you will react better when it has failed in the past. They are promoting MAID as an easy way out not to give care to patients because they crush people who are at the end of their rope and have tried everything by saying…. “it looks like we have run out of options””.
“I have tried almost all of the options available and have had little long-term success. The effectiveness is lessoning, and more options need to be tried. The delay of approval and provinces recognizing new options is not helping migraine sufferers”.
“So many people suffer from migraine. There needs to be better accessibility to these important, possibly life changing medications”.
“We need access to more migraine specific medications in Canada. There are not enough to meet the need compared to other countries”.
“For those like me, who have tried essentially everything under the sun, there needs to be more options. Going to another country to try treatments is not feasible, and in a “first world” country, that shouldn’t be something we have to face”.
“There is lack of access to medications in Canada, restrictions on combining treatment that are affecting quality of life”.
“There just needs to be more options in Canada. I’m almost out of options”.
“We need as many options as possible because we are all different and respond differently. Options are crucial”.
“In Canada we have so many less options for treating/preventing migraines than in other countries. It makes it difficult for people like me (and there are a lot of us!). I personally have tried 47 different medications with minimal success/relief. We desperately need a new class of medications. Doctors I’ve seen also cannot wait until we have more options”.
“Everyone deserves to have access to medications that could change their lives in a positive way. It’s humane. Having people well creates more productivity in the workplace, which means less expensive for employers. Its means better relationships. I believe that is we can do to can you. I feel Canada would want to help its citizens for better quality of life.
“This medication has really improved my daily life living with migraine”.
“Vyepti is an astoundingly good drug which can change people’s lives”.
“Please make this available. I, and so many other patients, are absolutely desperate”.
“I have yet to find anything that works but I know there are great strides being made in migraine research. We need access to more options as migraine is not the same for everyone. The same solution will not work for everyone. Migraine negatively affects the quality of life of millions of Canadians – lost days at work and lost joy in living. We deserve more options.
To learn more about migraine, please see our Quality-of-Life survey report that will be posted in the near future on our website (www.migrainecanada.org)
Conflict of Interest Declaration — Migraine Canada and Migraine Quebec
To maintain the objectivity and credibility of the CADTH reimbursement review process, all participants in the drug review processes must disclose any real, potential, or perceived conflicts of interest. This Patient Group Conflict of Interest Declaration is required for participation. Declarations made do not negate or preclude the use of the patient group input. CADTH may contact your group with further questions, as needed.
Did you receive help from outside your patient group to complete this submission? If yes, please detail the help and who provided it.
This submission was summarized and written solely by the staff at Migraine Canada and reviewed by Migraine Quebec, free from consultation, advice, influence or financial support from any outside individual, group or company.
Did you receive help from outside your patient group to collect or analyze data used in this submission? If yes, please detail the help and who provided it.
Migraine Canada worked with a third party to create the on-line Quality of Life survey. Analysis was completed internally.
Migraine Canada independently developed and analyzed the second survey circulated for feedback on eptinezumab.
List any companies or organizations that have provided your group with financial payment over the past 2 years AND who may have direct or indirect interest in the drug under review.
Table 1: Financial Disclosures for Migraine Canada
Company | $0 to 5,000 | $5,001 to 10,000 | $10,001 to 50,000 | In Excess of $50,000 |
|---|---|---|---|---|
Abbvie Canada | — | — | — | X |
Novartis Canada | — | — | — | X |
Lundbeck Canada | — | — | — | X |
Teva Canada | — | — | — | X |
Eli Lilly Canada | — | — | X | — |
Miravo Canada | — | — | X | — |
Table 2: Financial Disclosures for Migraine Quebec
Company | $0 to 5,000 | $5,001 to 10,000 | $10,001 to 50,000 | In Excess of $50,000 |
|---|---|---|---|---|
Novartis Pharma Canada | — | — | — | X |
Eli Lilly Canada | — | — | X | — |
Aralez/Novo/Miravo | — | — | X | — |
Teva Canada Innovation | — | — | — | X |
Upjohn | X | — | — | — |
Allergan/Abbvie | — | — | X | — |
Viatris (Upjohn/Pfizer) | — | X | — | — |
Lundbeck | — | — | X | — |
ISSN: 2563-6596
Disclaimer: The information in this document is intended to help Canadian health care decision-makers, health care professionals, health systems leaders, and policy-makers make well-informed decisions and thereby improve the quality of health care services. While patients and others may access this document, the document is made available for informational purposes only and no representations or warranties are made with respect to its fitness for any particular purpose. The information in this document should not be used as a substitute for professional medical advice or as a substitute for the application of clinical judgment in respect of the care of a particular patient or other professional judgment in any decision-making process. The Canadian Agency for Drugs and Technologies in Health (CADTH) does not endorse any information, drugs, therapies, treatments, products, processes, or services.
While care has been taken to ensure that the information prepared by CADTH in this document is accurate, complete, and up-to-date as at the applicable date the material was first published by CADTH, CADTH does not make any guarantees to that effect. CADTH does not guarantee and is not responsible for the quality, currency, propriety, accuracy, or reasonableness of any statements, information, or conclusions contained in any third-party materials used in preparing this document. The views and opinions of third parties published in this document do not necessarily state or reflect those of CADTH.
CADTH is not responsible for any errors, omissions, injury, loss, or damage arising from or relating to the use (or misuse) of any information, statements, or conclusions contained in or implied by the contents of this document or any of the source materials.
This document may contain links to third-party websites. CADTH does not have control over the content of such sites. Use of third-party sites is governed by the third-party website owners’ own terms and conditions set out for such sites. CADTH does not make any guarantee with respect to any information contained on such third-party sites and CADTH is not responsible for any injury, loss, or damage suffered as a result of using such third-party sites. CADTH has no responsibility for the collection, use, and disclosure of personal information by third-party sites.
Subject to the aforementioned limitations, the views expressed herein are those of CADTH and do not necessarily represent the views of Canada’s federal, provincial, or territorial governments or any third party supplier of information.
This document is prepared and intended for use in the context of the Canadian health care system. The use of this document outside of Canada is done so at the user’s own risk.
This disclaimer and any questions or matters of any nature arising from or relating to the content or use (or misuse) of this document will be governed by and interpreted in accordance with the laws of the Province of Ontario and the laws of Canada applicable therein, and all proceedings shall be subject to the exclusive jurisdiction of the courts of the Province of Ontario, Canada.
The copyright and other intellectual property rights in this document are owned by CADTH and its licensors. These rights are protected by the Canadian Copyright Act and other national and international laws and agreements. Users are permitted to make copies of this document for non-commercial purposes only, provided it is not modified when reproduced and appropriate credit is given to CADTH and its licensors.
Redactions: Confidential information in this document may be redacted at the request of the sponsor in accordance with the CADTH Drug Reimbursement Review Confidentiality Guidelines
Stakeholder Input: The views expressed in each submission are those of the submitting organization or individual; not necessarily the views of CADTH or of other organizations. As such, they are independent of CADTH and do not necessarily represent or reflect the view of CADTH. No endorsement by CADTH is intended or should be inferred. By filing with CADTH, the submitting organization or individual agrees to the full disclosure of the information. CADTH does not edit the content of the submissions.
CADTH does use reasonable care to prevent disclosure of personal information in posted material; however, it is ultimately the submitter’s responsibility to ensure no identifying personal information or personal health information is included in the submission. The name of the submitting organization or individual and all conflict of interest information are included in the submission; however, the name of the author, including the name of an individual patient or caregiver submitting the patient input, are not posted.
Accessibility: CADTH is committed to treating people with disabilities in a way that respects their dignity and independence, supports them in accessing material in a timely manner, and provides a robust feedback process to support continuous improvement. All materials prepared by CADTH are available in an accessible format. Where materials provided to CADTH by a submitting organization or individual are not available in an accessible format, CADTH will provide a summary document upon request. More details on CADTH’s accessibility policies can be found here.
About CADTH: CADTH is an independent, not-for-profit organization responsible for providing Canada’s health care decision-makers with objective evidence to help make informed decisions about the optimal use of drugs, medical devices, diagnostics, and procedures in our health care system.
Funding: CADTH receives funding from Canada’s federal, provincial, and territorial governments, with the exception of Quebec.