CADTH Reimbursement Review
Faricimab (Vabysmo)
Sponsor: Hoffmann-La Roche Canada
Therapeutic area: Diabetic macular edema
This multi-part report includes:
Clinical Review
Pharmacoeconomic Review
Stakeholder Input
Clinical Review
Abbreviations
AE
adverse event
Ang-2
angiopoietin-2
BCVA
best corrected visual acuity
CDEC
CADTH Canadian Drug Expert Committee
CI
confidence interval
CMH
Cochran-Mantel-Haenszel
CrI
credible interval
CRT
central retinal thickness
CST
central subfield thickness
DIC
diagnostic information criterion
DME
diabetic macular edema
DR
diabetic retinopathy
DRS
diabetic retinopathy severity
DRSS
Diabetic Retinopathy Severity Scale
ETDRS
Early Treatment Diabetic Retinopathy Study
HRQoL
health-related quality of life
ICE
intercurrent event
ILM-BM
distance between internal limiting membrane and Bruch's membrane
IRF
intraretinal fluid
ITC
indirect treatment comparison
ITT
intention-to-treat
IVT
intravitreal
MAR
missing at random
MID
minimal important difference
MMRM
mixed model repeated measures
NEI VFQ-25
National Eye Institute Visual Functioning Questionnaire-25
NMA
network meta-analysis
OCT
optical coherence tomography
PDR
proliferative diabetic retinopathy
PRN
pro re nata (as needed)
PRP
panretinal photocoagulation
PTI
personalized treatment interval
RCT
randomized controlled trial
SAE
serious adverse events
SD-OCT
spectral-domain optical coherence tomography
SE
standard error
SRF
subretinal fluid
VEGF
vascular endothelial growth factor
Executive Summary
An overview of the submission details for the drug under review is provided in Table 1.
Item | Description |
|---|---|
Drug product | Faricimab (Vabysmo) 6 mg (6 mg/0.05 mL solution) for intravitreal injection |
Indication | For the treatment of diabetic macular edema |
Reimbursement request | Per indication |
Health Canada approval status | NOC |
Health Canada review pathway | Standard review pathway |
NOC date | May 27, 2022 |
Sponsor | Hoffmann-La Roche Ltd. |
NOC = Notice of Compliance.
Introduction
Diabetic macular edema (DME) is vision-threatening complication of diabetic retinopathy (DR) that occurs when damaged capillaries in the eye leak fluid into the centre of the retina (the macula) causing it to thicken.1 Generally, DME manifests as slowly progressive vision loss in people with either type 1 or type 2 diabetes mellitus. Untreated DME is a leading cause of visual loss, visual disability, and legal blindness in people with diabetes.2-4 An estimated 60,000 adults with DME in Canada experience vision impairment that requires treatment.5
In Canada, the current first-line standard of care for patients with DME and central macular thickening are anti–vascular endothelial growth factor (anti-VEGF) drugs, which include ranibizumab (Lucentis), aflibercept (Eylea), and bevacizumab (Avastin) (off-label).6 Anti-VEGFs have been shown to be more effective than the previous standard of care (i.e., laser therapy) for centre-involved DME. These drugs can delay and, in some cases, reverse the progression of DME or retinopathy, as well as improve vision-related and general health-related quality of life (HRQoL). Anti-VEGFs are administered as intravitreal (IVT) injections on an ongoing basis; the interval between injections ranges from every 1 to 3 months after completion of loading doses. As adjunctive therapies, patients may receive focal laser therapy or vitrectomy (for eyes with vitreomacular traction). For patients who have had cataract extraction with lens implants (i.e., pseudophakic), IVT steroids may be used as a second-line adjunctive treatment.
Faricimab is a bispecific antibody that inhibits both VEGF-A and angiopoietin-2 (Ang-2), 2 disease pathways involved in the development of DME.7 It is indicated for the treatment of DME in patients 18 years and older.8 The recommended dose of faricimab for patients with DME is either 6 mg (0.05 mL) given intravitreally for 6 loading doses every 4 weeks, followed by injections every 8 weeks; or 6 mg (0.05 mL) given intravitreally every 4 weeks for at least the first 4 doses, followed by dosing using the treat-and-extend approach, with dosing intervals of up to every 16 weeks, depending on patient outcome.8 This is the second CADTH review for faricimab. Faricimab was initially submitted to CADTH for the treatment of neovascular age-related macular degeneration. Faricimab received a Notice of Compliance for that indication on May 27, 2022, after undergoing standard review.
The objective of this report was to perform a systematic review of the beneficial and harmful effects of faricimab 6 mg IVT injection for the treatment of DME in adults.
Stakeholder Perspectives
The information in this section is a summary of input provided by the patient and clinician groups that responded to CADTH’s call for input and from the clinical expert consulted by CADTH for the purpose of this review.
Patient Input
CADTH received patient input submitted jointly from the following patient groups: Fighting Blindness Canada, Canadian Council of the Blind, CNIB, Vision Loss Rehabilitation Canada, and Diabetes Canada. People living in Canada with DME indicated that the condition had a “substantial and life-altering” impact on their lives, as the condition causes vision loss that can affect daily activities, such as reading, using a phone, and driving. Patients also mentioned experiencing emotional, psychological, and social impacts from the condition related to worries about the condition worsening and the need for help to get to appointments. Further, patients also must cope with the common symptoms of diabetes, including extreme fatigue, weight changes, and frequent urination. Patients indicated a need for treatment that reduces the physical (e.g., pain from injection), psychological (e.g., anxiety or fear about the injection), and logistical (e.g., frequency of appointments) burden of current treatments. Patients expressed interest in a treatment that is less invasive or similarly invasive but administered less frequently, requiring less travel to appointments and less dependence on caregivers. Patients living outside of Canada’s urban centres and members of vulnerable populations may experience greater burdens (e.g., increased challenges attending appointments).
Clinician Input
Input From the Clinical Experts Consulted by CADTH
The clinical expert consulted by CADTH indicated that the treatment goals of DME are to delay and, in some cases, reverse the progression of DME or DR, as well as to improve vision-related and general quality of life. Because most patients are currently required to attend treatment visits once every 1 to 3 months, the clinical expert noted that there is an unmet need for effective treatments that can be administered at longer treatment intervals, reducing the burden on patients and caregivers associated with frequent treatment visits and increasing adherence with treatment regimens.
The clinical expert noted that faricimab is expected to have a place as a first-line or later-line treatment in patients with DME, similar to other anti-VEGF drugs. The clinical expert indicated that if faricimab is reimbursed, a shift in the treatment paradigm is likely, given that faricimab is the first anti-VEGF approved for an extended interval of up to 16 weeks, which could help address the burden of frequent treatment visits. The clinical expert noted that the dual mechanism of faricimab, which targets both the VEGF-A and Ang-2 pathways, is particularly relevant to DR.
The clinical expert noted that patients with DR associated with vision loss secondary to centre-involved DME are suitable candidates for faricimab. The clinical expert indicated that faricimab can be used in patients who are treatment-naive or who require a change in therapy due to inadequate responses to other anti-VEGF drugs. Patients who may not be suitable for treatment include those who present with major structural damage to the macular retina (e.g., macular atrophy or fibrosis), according to the expert.
The clinical expert noted that clinical evaluation and optical coherence tomography (OCT) should be performed at dosing visits to determine prognosis and follow-up. Key assessment outcomes include change in visual acuity, retinal thickness, and the presence of retinal fluid. According to the expert, an optimal response to anti-VEGFs is generally achieved 6 to 12 months after the initiation of therapy.
The clinical expert indicated that faricimab should be discontinued in patients with treatment futility and proof of irreversible anatomic or functional damage, such as those with macular atrophy (schema) and fibrosis.
Regarding prescribing conditions, the clinical expert recommended retina subspecialty care as the most appropriate setting for the prescription and administration of faricimab in urban areas; in rural settings, trained comprehensive ophthalmologists with experience and expertise in the management of DME would be sufficient.
Clinician Group Input
CADTH received input from 1 clinician group: the Canadian Retina Society.
The clinician group input was consistent with the clinical expert CADTH consulted with respect to the unmet need for a durable treatment with fewer injections that could reduce treatment burden while maintaining maximal vision gain. The clinical group also noted the importance of minimizing side effects, such as injection-related complications, including inflammation, infection, bleeding, retinal detachment, cataract, and glaucoma.
Clinician group input was consistent with the clinical expert input regarding the potential place in therapy for faricimab and the suitable patient population. The clinician group also noted that patients without centre-involved DME should not be treated with faricimab, and those without vision loss secondary to DME (pre-symptomatic patients) should be monitored as long as very close follow-up can be maintained.
Clinician group input generally aligned with the clinical expert input on the assessment of response to treatment and discontinuation of treatment. The clinician group noted that clinically meaningful outcomes include improvement in vision, reduction or resolution of macular edema, regression in Diabetic Retinopathy Severity Scale (DRSS) score, and reduction in the frequency of treatment (intervals of 4 months or longer between treatments).
The clinician group broadly identified the setting for treatment administration as ophthalmology offices in the community setting and/or hospital setting.
Drug Program Input
The drug programs noted an interest in understanding the following: the potential usefulness of the inclusion of active comparators, in addition to aflibercept, in pivotal trials of faricimab; the adequacy of indirect treatment comparisons (ITCs); potential initiation criteria; the frequency of bilateral treatment (in both eyes); faricimab’s potential place in therapy; and criteria for treatment discontinuation. The clinical expert consulted by CADTH did not identify any particular concerns with the sole use of aflibercept as a comparator in the trials. Apart from hemoglobin A1C, the clinical expert noted that it would be reasonable to align the criteria for therapy initiation with the inclusion criteria of pivotal trials, and stated that it is quite common for patients with DME to require treatment in both eyes. The expert thought it would be very likely that faricimab would be used as a first-line treatment and would not be restricted to patients who failed previous anti-VEGF treatment. According to the expert, treatment with faricimab would be discontinued in cases of extensive retinal atrophy (ischemia) and/or retinal fibrosis in the macula (making improvement of vision impossible), and in cases of traction retinal detachment.
Other considerations of interest to the drug programs included the expected proportions of patients receiving faricimab at the various treatment intervals, whether those receiving faricimab at shorter intervals (8 weeks or less) would likely be switched to another anti-VEGF, the appropriate setting for treatment with faricimab, and pricing. The clinical expert expected that the percentage of patients receiving faricimab at various intervals in practice would align with the results of the pivotal trials (around 70% of patients were on either 12- or 16-week intervals at 1 year). The clinical expert also noted that a switch to another drug could be considered for patients on 4-week intervals, but those on 8-week intervals would most likely continue on faricimab. According to the clinical expert, retina subspecialist offices and hospital clinics, where available, are the most appropriate setting for the administration of faricimab, but in nonurban settings, trained comprehensive ophthalmologists with experience and expertise in the management of DME may suffice.
Clinical Evidence
Pivotal Studies and Protocol Selected Studies
Description of Studies
The YOSEMITE and RHINE studies met the inclusion criteria for the systematic review. They were identically designed phase III, multi-centre, randomized, double-blind, active-controlled, noninferiority trials that compared faricimab with aflibercept in patients with DME (YOSEMITE, n = 940; RHINE, n = 951) over 100 weeks. Patients were randomized in a 1:1:1 ratio to 1 of 3 arms: fixed-dose faricimab every 8 weeks; faricimab dosing on a personalized treatment interval (PTI); and fixed-dose aflibercept every 8 weeks. Patients in the 8-week faricimab arm received faricimab 6 mg intravitreally every 4 weeks for 6 loading doses, followed by maintenance doses every 8 weeks. Patients in the PTI faricimab arm received faricimab 6 mg intravitreally every 4 weeks for 4 loading doses, after which maintenance doses could be administered every 4, 8, 12, or 16 weeks, depending on patient outcome, determined by a predefined algorithm. Patients in the aflibercept arm received aflibercept 2 mg intravitreally every 4 weeks for 5 loading doses, followed by a fixed maintenance interval of every 8 weeks.
Both studies aimed to establish the noninferiority of faricimab to aflibercept for the primary outcome, which was change from baseline in best corrected visual acuity (BCVA) (measured using the Early Treatment Diabetic Retinopathy Study [ETDRS] chart) averaged over weeks 48, 52, and 56 in the intention-to-treat (ITT) population. The noninferiority margin was specified as 4 letters on the ETDRS chart. The proportion of patients with improvement from baseline of 2 or more steps on the ETDRS DRSS score at week 52 was a key secondary end point. The noninferiority margin for this outcome was specified as a difference of 10% between treatment arms. Other secondary outcomes included the frequency of administration for faricimab at a PTI, retinal thickness, presence of retinal fluids, and measures of HRQoL and vision-related function, all of which were analyzed without control for multiplicity. The primary analysis was conducted at week 56, and secondary analysis data were available up to week 100.
The baseline demographic and ocular characteristics of patients were, overall, balanced in the treatment arms in each study. The baseline characteristics were generally similar in the 2 studies, except median months since DME diagnosis was shorter for patients in the YOSEMITE trial than in the RHINE trial (3.1 months versus 6.6 months) and mean baseline central subfield thickness (CST) was slightly higher for patients in YOSEMITE than in RHINE (487.5 µm versus 471.6 µm). In both studies, the median age of patients at baseline was 62 to 64 years, and the majority were male (> 57%) and White (> 76%). At the start of the studies, most patients (around 70% to 75%) had DRSS scores of 35 to 47 (mild to moderately severe nonproliferative DR with an anti-VEGF drug.
Efficacy Results
A summary of the key efficacy results is provided in Table 2.
Change in Visual Acuity
The primary outcome of both studies was the change from baseline in BCVA (ETDRS letters) averaged over weeks 48, 52, and 56 in the ITT population. In the YOSEMITE trial, the mean difference in change between the 8-week faricimab group and the aflibercept group was –0.2 letters (97.5% confidence interval [CI], –2.0 to 1.6 letters), and between the PTI faricimab group and the aflibercept group was 0.7 letters (97.5% CI, –1.1 to 2.5 letters). In the RHINE trial, the mean difference in change between the 8-week faricimab group and the aflibercept group was 1.5 letters (97.5% CI, –0.1 to 3.2 letters), and between the PTI faricimab group and the aflibercept group was 0.5 letters (97.5% CI, –1.1 to 2.1 letters). The CIs for all these estimates did not cross the pre-established noninferiority margin of 4 letters. All the CIs in these comparisons crossed the line of no effect and, therefore, neither faricimab arm was superior to aflibercept for the change in BCVA. Results of the sensitivity analyses, the supplemental analyses, and the per-protocol population were congruent with the primary analysis.
The proportion of patients gaining 15 or more ETDRS letters in BCVA from baseline averaged over weeks 48, 52, and 56 (a secondary outcome) was comparable across treatment arms and studies: 29.2%, 35.5%, and 31.9% in the 8-week faricimab, PTI faricimab, and aflibercept groups, respectively, in YOSEMITE; and 33.6%, 28.3%, and 30.5%, respectively, in RHINE. Most patients (> 95% across treatment arms) avoided a loss of 15 or more ETDRS letters in BCVA from baseline during the studies. Comparable results were seen across all 3 treatment arms for patients gaining 10 or more, 5 or more, or 0 or more letters, and for patients avoiding a loss of 10 or more or 5 or more letters in BCVA from baseline in the 2 studies; these end points were other secondary outcomes in the trials.
Results were mostly congruent at year 2 and year 1 for these BCVA secondary outcomes, except a numerically lower adjusted proportion of patients in the PTI faricimab arm than in the aflibercept arm in RHINE gained 15 or more ETDRS letters in BCVA from baseline averaged over weeks 92, 96, and 100.
Table 2: Summary of Key Results From Pivotal and Protocol Selected Studies
Key results | YOSEMITE | RHINE | ||||
|---|---|---|---|---|---|---|
Faricimab 6 mg q.8.w., N = 315 | Faricimab 6 mg PTI, N = 313 | Aflibercept 2 mg q.8.w., N = 312 | Faricimab 6 mg q.8.w., N = 317 | Faricimab 6 mg PTI, N = 319 | Aflibercept 2 mg q.8.w., N = 315 | |
Primary efficacy outcome, ITT population | ||||||
Change from baseline in BCVA (ETDRS letters), averaged over weeks 48, 52, and 56, MMRM approach (primary estimand) | ||||||
Number of patients contributing to the analysis | 271 | 276 | 276 | 268 | 293 | 279 |
Baseline BCVA, in letters, mean (SD) | 62.0 (9.9) | 61.9 (10.2) | 62.2 (9.5) | 61.9 (10.1) | 62.5 (9.3) | 62.1 (9.4) |
Change from baseline, in letters, meana (SE) | 10.7 (0.56) | 11.6 (0.56) | 10.9 (0.56) | 11.8 (0.52) | 10.8 (0.51) | 10.3 (0.52) |
Difference in means,a in letters (97.5% CI) | –0.2 (–2.0 to 1.6) | 0.7 (–1.1 to 2.5) | Reference | 1.5 (–0.1 to 3.2) | 0.5 (–1.1 to 2.1) | Reference |
P value for superiority testb | 0.7967 | 0.3772 | Reference | 0.0361 | 0.4930 | Reference |
Secondary efficacy outcomes, ITT population | ||||||
Proportion of patients gaining ≥ 15 ETDRS letters in BCVA from baseline, averaged over weeks 48, 52, and 56, CMH method | ||||||
Number of patients contributing to the analysis | 271 | 276 | 276 | 268 | 293 | 279 |
Number of patients gaining ≥ 15 letters in BCVA (%) | 79 (29.2) | 98 (35.5) | 88 (31.9) | 90 (33.6) | 83 (28.3) | 85 (30.5) |
Difference in proportions,c % (95% CI) | –2.6 (–10.0 to 4.9) | 3.5 (–4.0 to 11.1) | Reference | 3.5 (–4.0 to 11.1) | –2.0 (–9.1 to 5.2) | Reference |
Change from baseline in CST (ILM-BM), averaged over weeks 48, 52, and 56, MMRM approach | ||||||
Number of patients contributing to the analysis | 271 | 275 | 272 | 265 | 291 | 276 |
Baseline CST, in letters, meana (SD) | 492.3 (135.8) | 485.8 (130.8) | 484.5 (131.1) | 466.2 (119.4) | 471.3 (127.0) | 477.3 (129.4) |
Change from baseline, in letters, meana (SE) | –206.6 (4.15) | –196.5 (4.13) | –170.3 (4.16) | –195.8 (4.22) | –187.6 (4.12) | –170.1 (4.19) |
Difference in means,a in letters (95% CI) | –36.2 (–47.8 to –24.7) | –26.2 (–37.7 to –14.7) | Reference | –25.7 (–37.4 to –14.0) | –17.6 (–29.2 to –6.0) | Reference |
Proportion of patients in the PTI faricimab arm on a q.4.w., q.8.w., q.12.w., and q.16.w. injection interval at week 52 | ||||||
Number of patients contributing to the analysis | NA | 286 | NA | NA | 308 | NA |
q.4.w. proportion, % (95% CI) | NA | 10.8 (7.2 to 14.4) | NA | NA | 13.3 (9.5 to 17.1) | NA |
q.8.w. proportion, % (95% CI) | NA | 15.4 (11.2 to 19.6) | NA | NA | 15.6 (11.5 to 19.6) | NA |
q.12.w. proportion, % (95% CI) | NA | 21.0 (16.3 to 25.7) | NA | NA | 20.1 (15.6 to 24.6) | NA |
q.16.w. proportion, % (95% CI) | NA | 52.8 (47.0 to 58.6) | NA | NA | 51.0 (45.4 to 56.6) | NA |
Proportion of patients with a ≥ 2-step DRS improvement from baseline on the ETDRS DRSS at week 52, CMH method | ||||||
Number of patients contributing to the analysis | 237 | 242 | 229 | 231 | 251 | 238 |
≥ 2-step DRSS improvement, n (%) | 108 (45.6) | 102 (42.1) | 84 (36.7) | 102 (44.2) | 109 (43.4) | 113 (47.5) |
Difference in proportions,c % (97.5% CI) | 10.2 (0.3 to 20.0) | 6.1 (–3.6 to 15.8) | Reference | –2.6 (–12.6 to 7.4) | –3.5 (–13.4 to 6.3) | Reference |
P value, CMH test for superiorityb | 0.0237 | 0.1677 | Reference | 0.5757 | 0.4293 | Reference |
Harms, during entire study period, safety-evaluable population | ||||||
n | 313 | 313 | 311 | 317 | 319 | 314 |
Patients with ≥ 1 ocular AE,d n (%) | 147 (47.0) | 146 (46.6) | 144 (46.3) | 166 (52.4) | 165 (51.7) | 140 (44.6) |
Patients with ≥ 1 ocular SAE,d n (%) | 12 (3.8) | 14 (4.5) | 7 (2.3) | 14 (4.4) | 20 (6.3) | 13 (4.1) |
Patients with ≥ 1 nonocular SAE, n (%) | 99 (31.6) | 97 (31.0) | 84 (27.0) | 76 (24.0) | 64 (20.1) | 89 (28.3) |
Patients who discontinued treatment due to AE, n (%) | 8 (2.6) | 9 (2.9) | 5 (1.6) | 7 (2.2) | 9 (2.8) | 5 (1.6) |
Patients who discontinued study due to AE, n (%) | 22 (7.0) | 27 (8.6) | 18 (5.8) | 16 (5.0) | 14 (4.4) | 16 (5.1) |
Deaths, n (%) | 16 (5.1) | 21 (6.7) | 13 (4.2) | 12 (3.8) | 9 (2.8) | 10 (3.2) |
Notable harms | ||||||
Endophthalmitis | 0 | 3 (1.0) | 0 | 2 (0.6) | 1 (0.3) | 1 (0.3) |
Intraocular inflammatione | 6 (1.9) | 7 (2.2) | 5 (1.6) | 3 (0.9) | 4 (1.3) | 2 (0.6) |
Cataract | 55 (17.6) | 36 (11.5) | 45 (14.5) | 46 (14.5) | 50 (15.7) | 31 (9.9) |
Retinal detachment | 2 (0.6) | 2 (0.6) | 2 (0.6) | 1 (0.3) | 1 (0.3) | 0 |
Retinal tear | 0 | 1 (0.3) | 0 | 0 | 2 (0.6) | 0 |
Increased intraocular pressure | 14 (4.5) | 9 (2.9) | 6 (1.9) | 18 (5.7) | 12 (3.8) | 10 (3.2) |
Glaucoma | 1 (0.3) | 0 | 3 (1.0) | 1 (0.3) | 2 (0.6) | 2 (0.6) |
Conjunctival hemorrhage | 21 (6.7) | 26 (8.3) | 20 (6.4) | 31 (9.8) | 18 (5.6) | 21 (6.7) |
Retinal hemorrhage | NR | NR | NR | NR | NR | NR |
Vitreous floaters | 17 (5.4) | 9 (2.9) | 6 (1.9) | 16 (5.0) | 7 (2.2) | 12 (3.8) |
ATE,f nonocular | 34 (10.9) | 24 (7.7) | 27 (8.7) | 22 (6.9) | 22 (6.9) | 25 (8.0) |
Retinal vascular occlusive disease | 1 (0.3) | 2 (0.6) | 1 (0.3) | 1 (0.3) | 4 (1.3) | 3 (1.0) |
Ocular discomfort | 4 (1.3) | 2 (0.6) | 2 (0.6) | 1 (0.3) | 2 (0.6) | 0 |
Eye pain | 9 (2.9) | 7 (2.2) | 9 (2.9) | 4 (1.3) | 12 (3.8) | 12 (3.8) |
Eye irritation | 2 (0.6) | 1 (0.3) | 2 (0.6) | 3 (0.9) | 1 (0.3) | 3 (1.0) |
Blurred vision | 5 (1.6) | 2 (0.6) | 3 (1.0) | 1 (0.3) | 0 | 4 (1.3) |
AE = adverse event; ATE = arterial thromboembolic event; BCVA = best corrected visual acuity; CI = confidence interval; CMH = Cochran-Mantel-Haenszel; CST = central subfield thickness; DRS = ; DRSS = Diabetic Retinopathy Severity Scale; ETDRS = Early Treatment Diabetic Retinopathy Study; ILM-BM = distance between internal limiting membrane and Bruch's membrane; ITT = intention-to-treat; MMRM = mixed model repeated measures; NA = not applicable; NR = not reported; PTI = personalized treatment interval (from every 4 weeks to every 16 weeks); q.4.w. = every 4 weeks; q.8.w. = every 8 weeks; q.12.w. = every 12 weeks; q.16.w. = every 16 weeks; SAE = serious adverse events; SD = standard deviation; SE = standard error.
aAdjusted mean. The primary end point was analyzed using MMRM, with the change from baseline in BCVA as the dependent variable. The model was adjusted for categorical covariates of treatment group, visit, visit-by-treatment-group interaction, baseline BCVA (continuous), as well as randomization stratification factors as fixed effects (day 1 BCVA ETDRS letter score [64 letters or better vs. 63 letters or worse], prior IVT anti-VEGF therapy [yes vs. no], and region [US and Canada, Asia, and the rest of the world]).
bP value estimate was not adjusted for multiple testing and does not account for a failure to meet superiority in previous testing in the treatment-naive population.
cCMH weighted estimate. The observed proportions and the differences in observed proportions were obtained by applying CMH weight, stratified by the following randomization stratification factors: day 1 BCVA ETDRS letter score (64 letters or better vs. 63 letters or worse), prior IVT anti-VEGF therapy (yes vs. no), and region (US and Canada, Asia, and the rest of the world).
dIn study eye.
eIntraocular inflammation events include anterior chamber flare, anterior chamber inflammation, chorioretinitis, choroiditis, cyclitis, eye inflammation, iridocyclitis, iritis, keratic precipitates, keratouveitis, noninfective chorioretinitis, noninfectious endophthalmitis, ocular vasculitis, post-procedural inflammation, retinal vasculitis, uveitis, and vitritis.
fATEs include nonocular events from the following categories: myocardial infarction; ischemic central nervous system vascular conditions; other ischemic heart disease; embolic and thrombotic events, arterial.
Sources: YOSEMITE Primary and Final Clinical Study Reports,9,10 RHINE Primary and Updated Clinical Study Reports.11,12
Change in CST
In both YOSEMITE and RHINE, reductions in CST from baseline to weeks 48, 52, and 56 were numerically greater in the faricimab arms (8-week and PTI) than in the aflibercept arm (a secondary outcome). In YOSEMITE, the difference in mean adjusted change between the 8-week faricimab arm and the aflibercept arm was –36.2 µm (95% CI, –47.8 µm to –24.7 µm) and the difference between the PTI faricimab arm and the aflibercept arm was –26.2 µm (95% CI, –37.7 µm to –14.7 µm); in RHINE, and differences were –25.7 µm (95% CI, –37.4 µm to –14.0 µm) and–17.6 µm (95% CI, –29.2 µm to –6.0 µm), respectively.
A numerically higher proportion of patients had an absence of DME (CST < 325 µm for Spectralis spectral-domain [SD]-OCT) averaged over weeks 48, 52, and 56 in the 8-week faricimab arm and in the PTI faricimab arm than in the aflibercept arm. In YOSEMITE, the difference in the adjusted proportion between the 8-week faricimab arm and the aflibercept arm was 16.0% (95% CI, 8.9% to 23.1%) and the difference between the PTI faricimab arm and the aflibercept arm was 12.7% (95% CI, 5.4% to 20.0%); in RHINE, the differences were 12.3% (95% CI, 5.7% to 18.9%) and 8.2% (95% CI, 1.5% to 14.9%), respectively.
The differences between the faricimab arm and the aflibercept arm for both CST-related outcomes (CST reduction and absence of DME) were less pronounced at year 2 than at year 1 in the 2 studies (Table 13).
Frequency of Faricimab Injections
The studies measured the proportion of patients in the PTI faricimab arm on 4-, 8-, 12-, and 16-week injection intervals as a secondary outcome. In YOSEMITE at week 52, the proportion of patients on 4-, 8-, 12-, and 16-week intervals was 10.8%, 15.4%, 21.0%, and 52.8%, respectively, and in RHINE at week 52, the proportions were 13.3%, 15.6%, 20.1%, and 51.0%, respectively. In YOSEMITE at week 96, the proportion of patients in the PTI faricimab arm on 4-, 8-, 12-, and 16-week intervals was 7.0%, 14.8%, 18.1%, and 60.0%, respectively, and in RHINE at week 96, the proportions were 10.1%, 11.8%, 13.6%, and 64.5%, respectively.
HRQoL and Vision-Related Function
Mean changes from baseline in National Eye Institute Visual Functioning Questionnaire-25 (NEI VFQ-25) composite scores at week 24, week 52, and week 100 were comparable in patients treated with faricimab (8-week or PTI) and in those treated with aflibercept in the 2 studies (a secondary outcome). At week 52, the difference in the adjusted mean change from baseline in NEI VFQ-25 composite score between the 8-week faricimab arm and the aflibercept arm in YOSEMITE was –0.2 points (95% CI, –2.1 to 1.7 points) and between the PTI arm and the aflibercept arm was 0.5 points (95% CI, –1.5 to 2.4 points); in RHINE, the differences were–0.8 points (95% CI,–-2.7 to 1.1 points) and –1.0 points (95% CI, –2.9 to 0.8 points), respectively. At week 24, around half the patients (46.0% to 52.5%) in all treatment groups had an improvement from baseline in NEI VFQ-25 composite score (an exploratory outcome) of at least 4 points in the 2 studies (Table 15).
A comparable proportion of patients, around 2-thirds of patients (68.8% to 77.2%) in all treatment groups in the 2 studies, had a BCVA Snellen equivalent of 20/40 or better averaged over weeks 48, 52, and 56 (a secondary outcome and a common visual acuity standard used for driver licencing in the US), with consistent results at year 2 in the studies (Table 15).
The number of patients progressing to legal blindness (a secondary outcome, defined as a BCVA Snellen equivalent of 20/200 or worse) was small in all treatment arms in the 2 studies over the study periods (1.5% to 2.1% per arm).
Absence of Retinal Fluids
Over the course of both studies, a numerically higher proportion of patients in the 8-week faricimab arm than in the aflibercept arm had an absence of intraretinal fluid (IRF) at week 52 (a secondary outcome), with a difference in the adjusted proportion of 16.6% (95% CI, 8.7% to 24.5%) in YOSEMITE and 10.7% (95% CI, 2.8% to 18.6%) in RHINE. Differences in the adjusted proportion of patients with an absence of IRF between the PTI faricimab and aflibercept groups at week 52 were less pronounced, at 13.4% (95% CI, 5.4% to 21.3%) in YOSEMITE and 7.2% (95% CI, –0.5% to 14.9%) in RHINE. After week 48, the vast majority of patients (> 94% across treatment arms) in the 2 studies had an absence of subretinal fluid (SRF) (a secondary outcome).
Improvement From Baseline on the ETDRS DRSS
There were conflicting results between YOSEMITE and RHINE for the proportion of patients with a change on the ETDRS DRSS score from baseline of at least 2 steps at week 52, the key secondary end point in the studies (Table 17). In YOSEMITE, noninferiority for this end point was met, with the difference in the adjusted proportion between the 8-week faricimab arm and the aflibercept arm of 10.2% (97.5% CI, 0.3% to 20.0%) and between the PTI faricimab arm and the aflibercept arm of 6.1% (97.5% CI, –3.6% to 15.8%). However, in RHINE, noninferiority was not met for this outcome, as the lower bound of the 97.5% CI for the difference from baseline in the adjusted proportion was less than –10%; at week 52, the difference between the 8-week faricimab arm and the aflibercept arm was –2.6% (97.5% CI, –12.6% to 7.4%) and the difference between the PTI faricimab arm and the aflibercept arm was –3.5% (97.5% CI, –13.4% to 6.3%). At week 96, the proportion of patients who achieved an improvement on the ETDRS DRSS score of at least 2 steps from baseline was generally comparable in the 8-week faricimab arm, the PTI faricimab arm, and the aflibercept arm in the 2 studies.
The proportion of patients who achieved an improvement of at least 3 steps on the ETDRS DRSS score from baseline at week 52, a secondary outcome, was comparable across treatment arms (14.8% to 19.5%) in both studies. Few patients (< 3%) developed new proliferative diabetic retinopathy (PDR) in the study eye up to week 96 (a secondary outcome) in any treatment arm in the 2 studies. Similarly, few patients in any treatment arm in either study experienced a worsening of at least 2 steps or at least 3 steps at week 52, received vitrectomy, or received panretinal photocoagulation (PRP) (< 1.5% per arm for each of these exploratory outcomes; refer to Table 17).
Harms Results
A summary of the key harms results is provided in Table 2.
Over 100 weeks in the safety-evaluable population in the YOSEMITE trial, the proportion of patients reporting at least 1 ocular adverse event (AE) in the study eye was comparable across treatment arms (47.0% in the 8-week faricimab arm, 46.6% in the PTI faricimab arm, and 46.3% in the aflibercept arm). In the RHINE study, a higher proportion of patients in the 8-week faricimab and PTI faricimab arms reported an ocular AE than in the aflibercept arm (52.4%, 51.7%, and 44.6%, respectively). In the RHINE study, the ocular AEs that occurred at a higher incidence in the 2 faricimab arms than in the aflibercept arm include cataract, dry eye, and blepharitis, and the ocular AEs that were numerically more common in the 8-week faricimab arm than in the aflibercept arm include conjunctival hemorrhage, increased intraocular pressure, vitreous floaters, cataract subcapsular, posterior capsule opacification, eye pruritis, and conjunctivitis allergic. The most common ocular AEs in both studies were cataract (9.9% to 17.6% in each treatment arm) and conjunctival hemorrhage (5.6% to 9.8% in each arm).
Ocular serious adverse events (SAEs) were reported with low frequency in both trials; however, there was a slightly higher frequency of ocular SAEs in the PTI faricimab arm than in the aflibercept arm in both YOSEMITE and RHINE, and the 8-week and PTI faricimab arms were somewhat higher than the aflibercept arm in YOSEMITE (3.8%, 4.5%, and 2.3%, respectively) and in RHINE (4.4%, 6.3%, and 4.1%, respectively). The most common ocular SAE reported in both studies was cataract (0.6% to 2.2% across treatment arms). The frequency of nonocular SAEs in any arm of the studies ranged from 20.1% to 31.6%, with COVID-19 (1.3% to 3.2%) and pneumonia (1.3% to 2.6%) being the most frequently reported.
In both studies, a small proportion of patients in all arms discontinued treatment due to AEs (1.6% to 2.9% per arm). The most common AE (≥ 1% in any arm) related to treatment discontinuation was uveitis (3 patients in the PTI faricimab arm of YOSEMITE). The proportion of patients in all arms that discontinued the study due to AEs ranged from 4.4% to 8.6% across treatment arms. The most common reason for study discontinuation was death (9 patients in the faricimab arms and 1 patient in aflibercept arm) and COVID-19 (8 patients in the faricimab arms and 1 patient in aflibercept arm).
In the pooled YOSEMITE and RHINE population, 81 patients died (4.4%, 4.7%, 3.7% in the 8-week faricimab arm, PTI faricimab arm, and aflibercept arm, respectively). The most common primary causes of death included gunshot wounds, falls, natural causes, advanced hepatocellular carcinoma with metastases to the bone, head injury, and unexplained death (3 patients, 6 patients, and 1 patient in the 8-week faricimab arm, PTI faricimab arm, and aflibercept arm, respectively). Study investigators did not consider any of the deaths to be related to the study treatment.
Cataract was the most common notable harm, occurring in 9.9% to 17.6% of patients across all treatment arms in the 2 studies. Over the course of both studies, 6 patients in the faricimab arms and 1 patient in the aflibercept arm reported endophthalmitis. Uveitis and iritis were the most commonly reported intraocular inflammation events. Uveitis occurred in 7 patients in the faricimab arms and no patients in the aflibercept arm. The occurrence of iritis was comparable across treatment arms. Nonocular arterial thromboembolic events were reported in 6.9% to 10.9% of patients across both studies, with comparable frequencies in the treatment arms. Vitreous floaters were reported in 1.9% to 5.4% of patients, and these events were numerically higher in the 8-week faricimab arm than in the aflibercept arm of both studies. Retinal detachment, retinal tear, glaucoma, retinal vascular occlusive disease events, eye irritation, ocular discomfort, and blurred vision occurred infrequently (< 2% for each harm across all treatment arms in both studies). A small number of patients in the faricimab arms reported retinal detachments (6 in the 2 studies) and retinal tears (3 in the 2 studies); in the aflibercept arm, there were 2 retinal detachments and no retinal tears in either study. There were no reports of retinal hemorrhage in either study.
Critical Appraisal
Internal Validity
The overall study designs of YOSEMITE and RHINE were appropriate for the objectives of the studies. There were no major concerns with the methods of randomization, allocation concealment, or blinding. The noninferiority of faricimab to aflibercept was concluded from an ITT analysis of the primary outcome. For a conservative approach in the context of noninferiority studies, it is generally preferred that the claim of noninferiority be based on agreement between both the ITT population and the per-protocol population. Nonetheless, the results of a supplementary per-protocol analysis of the studies and several sensitivity analyses conducted by the sponsor and the FDA were consistent with those of the primary ITT analysis. Although there was a large proportion of patients with at least 1 major protocol deviation (around 50%) in both studies (most frequently missed visits), the sensitivity and supplemental analyses were consistent with the primary estimand. The noninferiority margin of 4 ETDRS letters was considered reasonable by the clinical expert. The studies were adequately powered for the assessment of the primary outcome. Intercurrent events (ICEs) were reported in approximately 9% to 10% of patients in both studies, and most were COVID-19–related. A key limitation of the statistical analysis was the lack of adjustment for multiplicity for secondary outcomes and subgroup analyses, and no sensitivity analyses were conducted to assess the impact of missing data on the secondary outcomes. As such, these findings were considered exploratory. Another limitation is the different dosing schedules used in the treatment arms. In the maintenance phase, the treatment interval could be modified after randomization in the PTI faricimab arm, using pre-specified criteria based on a patient’s BCVA and CST outcomes, to either every 4-, 8-, 12-, or 16-week intervals; intervals in the aflibercept arm, however, were fixed throughout the study period.
External Validity
In terms of generalizability, a strength of the trials is that they included patients who had previously received another anti-VEGF and patients who were treatment-naive. A limitation to note is that the studies excluded some patients who would typically receive treatment in clinical practice; patients with hemoglobin A1C greater than 10% were excluded, as were patients with high-risk PDR. The generalizability of trial results to these patient populations is unclear. In addition, aflibercept was given at a fixed dosing interval in the maintenance phase, which does not align with the treat-and-extend protocol commonly used in clinical practice, so the generalizability of the results is limited. There is also some uncertainty about the impact of the frequency of faricimab injections on outcomes, because the method of interval assignment for PTI faricimab in the maintenance phase may be more rigid than what would be used in clinical practice, although the expert noted that simplified thresholds for BCVA and OCT from the algorithm could be applied by clinicians in practice. In the trials, patients were monitored monthly, but in clinical practice, monitoring would typically only occur at treatment visits during the maintenance phase, according to the clinical expert. Furthermore, although the length of assessment in the primary analysis was adequate to determine the efficacy and safety of faricimab in the context of a noninferiority trial, according to the clinical expert, longer-term data are required to determine the durability and long-term safety of faricimab. In addition, there is no direct evidence comparing faricimab to ranibizumab (at Health Canada–approved dosages) or with bevacizumab, which is an important evidence gap in the evaluation of anti-VEGFs.
Indirect Comparisons
Description of Studies
One ITC was submitted by the sponsor and is included in this review. No additional ITCs were identified in the literature. The sponsor performed a Bayesian network meta-analysis (NMA) to estimate the efficacy of faricimab and of other anti-VEGFs in patients with DME.
Efficacy Results
For the outcome of BCVA at 1 year, 23 trials were analyzed using a random-effects model. In the ITC, no treatment ||||||||||||||||||||||||||||||||||||||||||||||||||||||||||||||||||||||||||||||||||||||||||||||||||||||||||||||||||||||||||||||||||||||||||||||||||||||||||||||||||||||||||||||||||||||||||||||||||||||||||||||||||||||||||||||||||||||||||||||||||||||||||||||||||||||||||||||||||||||||||||||||||||||||||||||||||||||||||||||||||||||||||||||||||||||||||||||||||||||||||||||||||||||||||||||||||||||||||||||||||||||||||||||||||||||||||||||||||||||||||||||||||||||||||||||||||||||||||||||||||||||||||||||||||||||||||||||
For the outcome of number of injections at 1 year, 11 trials were analyzed under a random-effects model. The ITC showed that that |||||||||||||||||||||||||||||||||||||||||||||||||||||||||||||||||||||||||||||||||||||||||||||||||||||||||||||||||||||||||||||||||||||||||||||||||||||||||||||||||||||||||||||||||||||||||||||||||||||||||||||||||||||||||||||||||||||||||||||||||||||||||||||||||||||||||||||||||||||||||||||||||||||||||||||||||||||||||||||||||||||||||||||||||||||||||||||||||||||||||||||||||||||||||||||||||||||||||||||||||||||||||||||||||||||||||||||||||||||||||||||||||||||||||||||||||||||||||||||||||||||||||||||||||||||||||||||| these data are impacted by the administration of therapies with fixed intervals in clinical trials, according to protocols within the 1-year time frame of the randomized controlled trials (RCTs).
For the outcome of retinal thickness at 1 year, 23 RCTs were analyzed using a random-effects model. The results of |||||||||||||||||||||||||||||||||||||||||||||||||||||||||||||||||||||||||||||||||||||||||||||||||||||||||||||||||||||||||||||||||||||||||||||||||||||||||||||||||||||||||||||||||||||||||||||||||||||||||||||||||||||||||||||||||||||||||||||||||||||||||||||||||||||||||||||||||||||||||||||||||||||||||||||||||||||||||||||||||||||||||||. However, 95% credible intervals (CrIs) are wide and heterogeneity in the methods to assess retinal thickness across studies adds considerable uncertainty to the results for this analysis and limit conclusions about the relative effect of faricimab on central retinal thickness (CRT).
The outcome of the proportion of patients gaining or losing 10 or 15 ETDRS letters at 1 year was analyzed, but poor model fit precludes conclusions about the effect of faricimab, compared with comparators, for this outcome.
Harms Results
There were limited data available for the NMAs conducted for ocular adverse effects and for discontinuation; therefore, fixed-effects models were used for these end points and there was a high degree of uncertainty in these models. Limitations of the NMAs preclude conclusions about ocular adverse effects and overall treatment discontinuation.
Critical Appraisal
There may be important sources of bias related to different study or patient characteristics that could impact conclusions about this ITC. The limitations described may pose a considerable challenge when trying to come to conclusive decisions about the validity of the results that can inform clinical practice. There were many trials with missing information about study and baseline characteristics and there was considerable heterogeneity among these characteristics. Most notably, there was heterogeneity in the methods used to assess retinal thickness and in the availability of information related to the presence of significant diabetic macular ischemia or systemic comorbidities. Additionally, there was a weak connection between faricimab and the rest of the network through aflibercept.
Although PTI faricimab may be more favourable than ranibizumab pro re nata (PRN) (i.e., as needed), treat and extend, every 4 weeks, and bevacizumab PRN for the outcome of BCVA, CrIs were very close to the null value for this analysis. The results of the analysis related to the number of injections will have been affected by the administration of therapies with fixed intervals in clinical trials, according to study protocols. Limitations to the NMA preclude conclusions about the proportion of patients gaining or losing 10 or 15 ETDRS letters and about retinal thickness.
There were limited data available for the NMAs conducted for ocular adverse effects and for treatment discontinuation; therefore, fixed-effects models were used for these end points and there was a high degree of statistical uncertainty in these models. Therefore, there are limited data from which to draw any conclusions about the effect of faricimab, compared with comparators, on ocular adverse effects and treatment discontinuation.
Other Relevant Evidence
No other relevant evidence was identified for inclusion.
Conclusions
Faricimab, at 8-week intervals or PTI dosing, was shown to be noninferior, but not superior, to aflibercept for the mean change in BCVA from baseline after 1 year of treatment in adults with DME, based on evidence from 2 double-blind phase III RCTs. The results of other BCVA outcomes, anatomic outcomes, vision-related functions, and HRQoL did not contradict the findings of the primary analysis, but their interpretation is limited by the lack of a noninferiority margin and the lack of adjustment for multiple testing. There is no direct evidence on faricimab compared with other anti-VEGFs at dosages approved in Canada. The safety profile of faricimab was generally comparable to that of aflibercept in the trials. The long-term safety of faricimab is not known.
Evidence from 1 NMA suggests ||||||||||||||||||||||||||||||||||||||||||||||||||||||||||||||||||||||||||||||||||||||||||||||||||||||||||||||||||||||||||||||||||||||||||||||||||||||||||||||||||||||||||||||||||||||||||||||||||||||||||||||||||||||||||||||||||||||||||||||||||||||||||||||||||||||||||||||||||||||||||||||||||||||||||||||||||||||||||||||. The NMA suggests |||||||||||||||||||||||||||||||||||||||||||||||||||||||||||||||||||||||||||||||||||||||||||||||||||||||||||||||||||||||||||||||||||||||||||||||||||||||||||||||||||||||||||||||||||||||||||||||||||||||||||||||||||||||||||||||||||||||||||||||||||||||||||||||||||||||||||||||||||||||||||||||||||||||||||||||||||||||||||||||||||||||||||||||||||||||||||||||||||||||||||||||||||||||||||||||||||||||||||||||||||||||||||||||||||||||||||||||||||||||||||||||||||||||||||||||||||||||||||||||||||||||||||||||||||||||||||||||||||||||||||||||||| these data are impacted by the administration of therapies with fixed intervals in clinical trials, according to protocols within the 1-year time frame of the RCTs. However, the heterogeneity in study design and patient characteristics may limit conclusions that can be drawn from the NMA. No conclusions on ocular adverse effects could be drawn from the NMA because of limited data, and the long-term risk of harm with aflibercept relative to other treatments is not known.
Introduction
Disease Background
DME is a vision-threatening complication of diabetes mellitus (both type 1 and type 2). The persistent elevation of blood glucose in persons with diabetes causes damage to the smallest blood vessels (capillaries), such as those in the eye, resulting in DR.13 Some patients with DR, especially those with continued poorly managed blood glucose, can experience swelling in the retina, which is known as DME.3 Generally, DME manifests as a slowly progressive loss of vision. The degree of vision loss can vary considerably and depends on the severity, duration, and location of IRF, among other factors. Clinically significant macular edema can be defined by retinal thickening at or within 500 µm of the centre of the macula.6,14,15 Signs of DME include blurred vision, retinal hemorrhage, retinal detachment, colours appearing washed out or faded, changes in contrast sensitivity, impaired colour vision, gaps in vision (scotomas), and potentially permanent vision loss. Untreated DME is considered to be the leading cause of visual loss, visual disability, and legal blindness in people with DR.2-4
The Eye Diseases Prevalence Research Group reported in 2004 that the prevalence of DR in adults in the US was 40.3%, and that sight-threatening retinopathy occurred in 8.2% of such individuals.16 The prevalence of macular edema in patients with type 1 diabetes, patients with type 2 diabetes treated with insulin therapy, and patients treated with antihyperglycemic therapies have been estimated to be 11%, 15%, and 4%, respectively.17 A Canadian retrospective study using records from the Southwestern Ontario database estimated the prevalence of DME in adults with diabetes to be 15.70% and the prevalence of vision loss due to DME to be 2.56%.14 In this study, more than 50% of patients with DME experiencing vision loss were older than 60 years and more than 22% of patients with DME experiencing vision loss were members of First Nations communities.14 Indigenous populations in Canada are disproportionally affected by diabetes,6 and prevalence rates of DR are higher than in the general population,18,19 although accurate data on vision loss in this population are limited.6 Based on the Ontario study’s estimates14 and a 2020 Statistics Canada estimate of 2.3 million adults in Canada with diabetes, there are approximately 60,000 adults with DME in Canada who experience vision impairment that requires treatment.5 The incidence and prevalence of diabetes in Canada are projected to increase in coming years in tandem with an aging population and rising rates of obesity, and this rise in diabetes cases is expected to lead to corresponding increases in DR and DME.6
Generally, vision loss is associated with significant morbidity, including increased falls, hip fracture, and mortality.20 In addition, it has been suggested that amputation and visual loss due to DR are independent predictors of early death among patients with type 1 diabetes.21 Such progressive visual impairment typically results in significant decrements in daily functioning and quality of life, and indirect costs due to lost productivity are high if the condition is left untreated.22-24 Therefore, early detection and treatment of DME is vital.25,26
Standards of Therapy
Current therapies for DME in Canada include nonpharmacological interventions (laser therapy and vitrectomy) and pharmacological interventions (IVT anti-VEGF drugs and IVT steroids). Health Canada–approved anti-VEGF drugs for DME include ranibizumab and aflibercept, and approved IVT steroids include dexamethasone.
Macular laser photocoagulation (including focal, grid laser, and panretinal therapy) for DME was the standard of care for more than 25 years before the introduction of anti-VEGF drugs and is still widely used, either alone or in combination with anti-VEGF treatment.15 Laser therapy has been shown to slow and/or stabilize vision loss, but is minimally effective in restoring vision.27 Laser therapy also has the disadvantage of causing permanent damage to retinal tissue during treatment.28-30 Clinical studies have shown robust efficacy and safety for frequent (e.g., monthly or bimonthly) anti-VEGF injections for the treatment of DME.31-34 The results from these trials demonstrate that treatment with anti-VEGF drugs substantially improves visual and anatomic outcomes, compared with laser photocoagulation, and eliminates the ocular side effects associated with laser treatment. Canadian evidence-based guidelines and clinical treatment algorithms recommend anti-VEGF injections as therapy (alone or in conjunction with focal laser therapy) for most patients with clinically significant DME that involves central macular thickening. For eyes without central macular thickening, focal laser is recommended, and for eyes with vitreomacular traction and macular edema, vitrectomy is recommended.6
The first of the anti-VEGF drugs to be approved in Canada for the treatment of DME was ranibizumab (a humanized recombinant monoclonal antibody fragment with anti-VEGF activity).35 The recommended dose of ranibizumab is 0.5 mg injected intravitreally once a month and continued until maximum visual acuity is achieved, confirmed by stable visual acuity in 3 consecutive monthly assessments performed while the patient is on the treatment.35 Other anti-VEGF therapies include aflibercept at the recommended dose of 2.0 mg administered by IVT injection monthly for the first 5 consecutive doses, followed by 1 injection every 2 months.36 After the first year, injections of aflibercept may extended by up to 2-week increments, based on disease activity, although data on intervals longer than 4 months are limited.36 Bevacizumab, another anti-VEGF drug approved for the treatment of cancers, such as colorectal and lung cancer,37 has been used off-label as an IVT treatment for macular edema in some Canadian jurisdictions. Although not approved for use in patients with DME in Canada, a 2016 CADTH Therapeutic Review examined the evidence on age-related macular degeneration, DME, retinal vein occlusion, and choroidal neovascularization due to pathologic myopia. Subsequently, the CADTH Canadian Drug Expert Committee (CDEC) issued a recommendation suggesting bevacizumab as the preferred initial anti-VEGF therapy because its clinical effectiveness is similar to other anti-VEGF treatments and its cost is lower.38
Although anti-VEGF therapies are widely accepted as the standard of care for patients with DME, they require frequent injections (8 to 12 per eye per year) to achieve desirable outcomes, creating a high treatment burden for patients and caregivers. Anti-VEGF therapies are also associated with an increased risk of cerebrovascular and cardiovascular events, such as thromboembolic events; therefore, they may not be appropriate for all patients with DME, especially those who have had a previous stroke or who have other cardiovascular comorbidities. Some patients have an inadequate response to anti-VEGF treatment, although the frequency of suboptimal response is unclear. According to the clinical expert consulted for this review, around 10% of patients may have an inadequate response, although some studies have reported a suboptimal response rate as high as 25%39 to 40%40 in patients on anti-VEGF therapy, depending on how suboptimal response is defined.40 There is limited evidence of the benefit and risk of continuous anti-VEGF injections among patients who did not respond well to prior anti-VEGF therapy.40
IVT steroids may be required as a second-line treatment especially for patients who have artificial lens implants (i.e., pseudophakia). In Canada, IVT dexamethasone implants are indicated for use in patients with DME who are pseudophakic. However, in October 2018, CDEC recommended that dexamethasone not be reimbursed for this indication, given its uncertain efficacy and safety compared with other available therapies.41 Triamcinolone acetonide monotherapy administered as an IVT steroid injection is considered for off-label use in Canada for the treatment of macular edema, according to the clinical expert consulted for this CDR review, as a second-line treatment in pseudophakic patients.
Drug
Faricimab is a humanized bispecific immunoglobulin G1 antibody that selectively binds to and neutralizes VEGF-A and Ang-2, which are key mediators in the pathogenesis of DME.8 VEGF-A promotes endothelial cell proliferation, leading to increased neovascularization and vascular permeability. Ang-2 promotes endothelial destabilization, pericyte loss, and pathological angiogenesis, and sensitizes blood vessels to the activity of VEGF-A. Through the inhibition of Ang-2 and VEGF-A, faricimab reduces vascular permeability and inflammation, inhibits pathological angiogenesis, and restores vascular stability.7 Faricimab received FDA approval in January 2022 for the treatment of DME and neovascular age-related macular degeneration.
This is the second CADTH review for faricimab. The drug was initially submitted to CADTH for the treatment of neovascular age-related macular degeneration. The faricimab dossiers were submitted to CADTH as a pre-Notice of Compliance submission. During the review process, on May 27, 2022, faricimab received a NOC from Health Canada. The approved indication related to the current review is for the treatment of DME in patients 18 years and older. Per the faricimab product monograph,8 1 of these 2 dose regimens is recommended for DME:
faricimab 6 mg (0.05 mL) administered by IVT injection every 4 weeks (approximately every 28 ± 7 days) for the first 6 doses, followed by 6 mg (0.05 mL) every 8 weeks
faricimab 6 mg (0.05 mL) administered by IVT injection every 4 weeks (approximately every 28 ± 7 days) for at least 4 doses or until macular edema is resolved, based on the CST of the macula, measured by OCT. Thereafter, the dosing interval may be modified using a treat-and- extend approach based on anatomic and visual acuity outcomes at dosing visits. The dosing interval may be extended up to every 16 weeks (4 months) in up to 4-week increments. If anatomic and/or visual outcomes deteriorate, the treatment interval should be shortened accordingly.
Patients should be assessed regularly. Monitoring between the dosing visits should be scheduled based on the patient's status and at the physician's discretion.8
The sponsor is seeking reimbursement of faricimab, per the Health Canada–approved indication, for the treatment of DME.7
The key characteristics of commonly used anti-VEGF treatments for DME are presented in Table 3.
Table 3: Key Characteristics of Faricimab, Aflibercept, Ranibizumab, and Bevacizumab
Characteristic | Faricimab | Aflibercept | Ranibizumab | Bevacizumaba |
|---|---|---|---|---|
Mechanism of action | VEGF inhibitor (mAb, targets Ang-2 and VEGF-A) | VEGF inhibitor (Soluble decoy receptor, targets VEGF-A and PIGF) | VEGF inhibitor (mAb, targets VEGF-A isoforms) | VEGF inhibitor (mAb, targets VEGF) |
Indicationb | For the treatment of DME | For the treatment of DME | For the treatment of DME | None (off-label) |
Route of administration | IVT | IVT | IVT | IVT |
Recommended dose | 6 mg q.4.w. for 6 doses, then q.8.w.; or 6 mg q.4.w. for 4 doses, which may be extended to up to q.16.w. in increments of up to 4 weeks based on disease activity No requirement for monthly monitoring between injections | 2 mg q.4.w. for 5 doses, then q.8.w. (after the first year, may be extended by up to 2-week increments based on disease activity) There are limited data for treatment intervals longer than 4 months | 0.5 mg q.4.w. until maximum VA is achieved and is stable for 3 months Thereafter, monitor monthly and resume monthly injections if VA is lost | None Off-label: 1.25 mg q.4.w. for approximately 6 loading doses, after which the interval may be extended based on disease activityc |
Serious adverse effects or safety issues |
|
|
|
|
Ang-2 = angiopoietin-2; ATE = arterial thromboembolic events (includes nonfatal stroke, nonfatal myocardial infarction, and vascular death); DME: diabetic macular edema; IOP = intraocular pressure; IVT = intravitreal; mAb = monoclonal antibody; PIGF = placental growth factor; q.4.w. = every 4 weeks; q.8.w. = every 8 weeks; q.16.w. = every 16 weeks; VA = visual acuity; VEGF = vascular endothelial growth factor.
aBevacizumab is used off-label in the treatment of DME.
bHealth Canada–approved indication.
cBased on expert opinion.
Sources: Vabysmo product monograph,8 Eylea product monograph,36 Lucentis product monograph,35 Avastin product monograph.37
Stakeholder Perspectives
Patient Group Input
The information in this section is a summary of input provided by the patient groups who responded to CADTH’s call for patient input and from clinical expert(s) consulted by CADTH for the purpose of this review.
Patient Input
Five patient groups contributed jointly to the patient group input: Fighting Blindness Canada (with input from an independent consultant and a research and consulting firm), the Canadian Council of the Blind, CNIB, Vision Loss Rehabilitation Canada, and Diabetes Canada. Fighting Blindness Canada is involved in vision research for treatments and cures for blinding eye diseases. The Canadian Council of the Blind engages in social, recreational, and community activities to enhance quality of life for and increase awareness of people with seeing disabilities. CNIB delivers programs and advocacy to empower people affected by blindness. Vision Loss Rehabilitation Canada is a rehabilitation and health services organization that provides blind and partially sighted people with training, on a referral basis, in homes and communities. And Diabetes Canada provides education, services, and advocacy, and supports research for people living with diabetes. The submitted input, which was collected during the first months of 2020, was part of a larger research project (Valuation and Interpretation of Experiences with Diabetic Retinopathy/Diabetic Macular Edema). A total of 67 people in Canada living with DR and DME responded to the survey. Additionally, the Canadian Council of the Blind conducted a separate survey in April 2020 to focus exclusively on the pandemic and its effects on people with age-related macular edema and DR. This additional survey result is not summarized.
According to more than 50% of respondents (n = 55 to 59) to the Valuation and Interpretation of Experiences with Diabetic Retinopathy/Diabetic Macular Edema survey, DR and DME have a “substantial and life-altering” impact on patients’ activities of daily life, such as reading, using a phone, and driving. Also, DR and DME create an emotional, psychological, and social burden. For example, 80.3% of 61 respondents reported worries about their condition worsening, 45.9% reported needing help for activities such as getting to appointments, and 36.1% reported that explaining their condition to family and friends was a burden. A majority of the 61 patients (> 60%) reported feeling lonely or isolated in the previous month. In addition, patients still have to cope with common symptoms of diabetes, including extreme fatigue, weight changes, and frequent urination. Patients want treatment that reduces the physical (pain from injection), psychological (anxiety or fear about the injection), and logistical strain, and expressed an interest in treatment that is less invasive or similarly invasive but administered less frequently, requiring less travel for appointments and less dependence on caregivers. Patients living outside of Canada’s urban centres and members of vulnerable populations experience greater burdens. Moreover, the number of people living with diabetes continues to increase. Therefore, more patients in rural communities will need options that are less complex but effective for the treatment of DR and DME.
Clinician Input
Input From the Clinical Expert Consulted by CADTH
All CADTH review teams include at least 1 clinical specialist with expertise in the diagnosis and management of the condition for which the drug is indicated. Clinical experts are a critical part of the review team and are involved in all phases of the review process (e.g., providing guidance on the development of the review protocol, assisting in the critical appraisal of clinical evidence, interpreting the clinical relevance of the results, and providing guidance on the potential place in therapy). The following input was provided by 1 clinical specialist with expertise in the diagnosis and management of DME.
Unmet Needs
The clinical expert consulted by CADTH indicated that the treatment goals of current therapies are to delay DME and, in some cases, to reverse the progression of DME and/or retinopathy, as well as to improve vision-related and general quality of life. Although current anti-VEGF treatments for DME have been useful for the treatment of DME over the past 10 to 15 years, they need to be given intravitreally by trained clinicians once every 1 to 3 months on an ongoing basis, often for years. This frequent administration poses a significant burden to patients and caregivers, especially in Canada where travel distances can be long and challenging in the winter. The clinical expert noted that longer-acting treatments would fill a significant unmet medical need by improving convenience of the treatment regimen and reducing the burden on patients and caregivers. As well, they could improve outcomes, in part, by increasing adherence with treatment regimens. Additionally, the expert noted that not all patients respond to available treatments and, in some cases, patients may become refractory to current treatment options.
Place in Therapy
As faricimab is the first anti-VEGF to target the Ang-2 pathway in addition to the VEGF pathway, the expert noted that its mechanism of action is a rational approach, given the underlying disease process. The expert noted that the Ang-2 pathway of angiogenesis is relevant in DR. According to the clinical expert, faricimab is expected to have a place in therapy, along with other anti-VEGFs, as a first-line or later-line treatment in patients with DME. The clinical expert indicated that if faricimab is reimbursed, a shift in the treatment paradigm is likely, given that faricimab is the first anti-VEGF approved for an extended interval of up to 16 weeks, which could potentially address the unmet need related to frequent treatment visits.
In the clinical expert’s opinion, there are no clinical reasons to make patients try other treatments before faricimab is initiated. Faricimab is expected to be prescribed as a first-line (or later-line) treatment for DME and, as with any of the existing treatments, early initiation is important for the best clinical outcomes.
Patient Population
Patients with DR associated with vision loss secondary to centre-involved macular edema are the best candidates for faricimab, according to the clinical expert. The clinical expert indicated that faricimab can be used in patients who are treatment-naive or who require a change in therapy due to inadequate responses to other anti-VEGF drugs. Patients with better baseline visual acuity, centre-involved edema of recent onset, and better control of diabetes and comorbid conditions may be more likely to benefit from treatment. Patients who present with major structural damage to the macular retina (e.g., macular atrophy or fibrosis) may not be suitable for treatment. Suitability for treatment would be assessed using a clinical exam, IV fluorescein angiography and OCT, potentially with the addition of OCT angiography. In current clinical practice, OCT is unlikely to lead to misdiagnosis. OCT is used not only for diagnosis, but also for prognosis and follow-up.
Assessing Response to Treatment
The clinical expert noted that clinical evaluation and OCT should be performed at almost every dosing visit to assess treatment response, with a treat-and-extend approach to achieve the longest sustainable interval without recurrence, and that monitoring between dosing visits would not be required. Key assessment outcomes include change in visual acuity, retinal thickness, injection frequency, and the presence of retinal fluid.
The clinical expert reported that the optimal response to anti-VEGFs is generally achieved at least 6 to 12 months after initiation of therapy. In the experience of the expert, the majority of patients can achieve stabilized vision and improved quality of life, and about 50% to 65% of patients can achieve visual acuity improvement.
The clinical expert noted that when assessing the magnitude of change in visual acuity, it is crucial to keep in mind that patients with better vision at baseline generally have less room for improvement than those with poor vision at baseline. As such, the clinical expert reported that there is not an agreed-upon threshold that is indicative of a clinically meaningful change in visual acuity in patients with DME.
The clinical expert indicated that the presence of SRF or IRF is an indicator of active disease, which should prompt modification of the treatment plan (often a reduction in injection interval).
Discontinuing Treatment
The clinical expert indicated that faricimab should be discontinued in patients with treatment futility with proof of irreversible anatomic or functional damage, such as macular atrophy (ischemia) or fibrosis.
Prescribing Conditions
The clinical expert recommended retina subspecialty care as the most appropriate treatment setting for the prescription and administration of faricimab, especially in urban areas. In rural settings, trained comprehensive ophthalmologists with experience and expertise in the management of DME may be able to provide care.
Clinician Group Input
This section was prepared by CADTH staff based on the input provided by clinician groups.
Five clinicians associated with the Canadian Retina Society, which represents ophthalmologists who specialize in the surgical and/or medical treatment of vitreoretinal disease, jointly submitted their clinical group input, based on phase III randomized controlled clinical trials, systematic reviews, meta-analyses, and presentations.
Unmet Needs
Even though the current standard of therapy (i.e., anti-VEGF) is more effective than the previous standard of care (i.e., laser) for centre-involved DME, the clinician group stated that durability and a robust safety profile that improves long-term outcomes are unmet needs. Durability reduces treatment burden (with less frequent dosing) and maintains maximal vision gain (with improved compliance and monitoring). Durability will be translated into improved quality of life and independence, and will reduce the risk of falls, depression, and surgical intervention (vitrectomy). The minimization of side effects, such as injection-related complications like inflammation, infection, bleeding, retinal detachment, cataract, and glaucoma, is also important because side effects can compromise visual outcomes and result in blindness. The clinician group stated that all patients with DME have these unmet needs.
Place in Therapy
The clinician group said that faricimab can be considered a first-line treatment and/or a rescue treatment for patients who do not respond to the current therapies available for DME. The clinician group said that there is currently no standard of care in cases of treatment failure. Moreover, the clinician group noted that the vision of treatment-naive patients and of patients previously treated with other anti-VEGF drugs can benefit from a switch to faricimab. According to the clinician group, it is not necessary for patients to try other therapies before faricimab is initiated.
Patient Population
According to the clinician group, all patients with centre-involved DME will be suitable for treatment with faricimab. The clinician group stated that eligible patients can be identified with clinical exams and diagnostic tests (OCT, OCT angiography, IV fluorescein angiography) in the routine clinical practice setting. The clinician group said that patients without centre-involved DME should not be treated with faricimab and that those without vision loss secondary to DME (pre-symptomatic patients) should be monitored, as long as very close follow-up can be maintained. The clinician group also noted that patients with good baseline vision are likely to maintain good vision in the long term, although patients with all levels of vision would benefit from faricimab.
Assessing Response to Treatment
The clinician group said that response to treatment can be measured with visual acuity testing (subjective outcome), fluid can be measured with OCT testing (objective outcome), and macular thickening can be assessed with a clinical exam. According to the clinician group, improvement in vision, a reduction or resolution of macular edema, a regression in DRSS score, and a reduction in the frequency of treatment (4 months or longer between treatments) are considered clinically meaningful responses. Last, the clinician group said that response to treatment should be assessed at every clinical visit, which is determined by treatment need.
Discontinuing Treatment
The clinician group said that in the case of end-stage disease with significant atrophy, fibrosis, and/or no improvement despite regular treatments, discontinuation of faricimab should be considered.
Prescribing Conditions
The clinician group stated that ophthalmology offices in the community and/or hospital setting are appropriate for the administration of faricimab. The group added that an ophthalmologist is required to accurately diagnose, treat, and monitor patients being treated with faricimab.
Drug Program Input
Drug programs provide input on each drug being reviewed through CADTH’s reimbursement review processes by identifying issues that may affect their ability to implement a recommendation. The implementation questions and corresponding responses from the clinical expert consulted by CADTH are summarized in Table 4.
Table 4: Summary of Drug Plan Input and Clinical Expert Response
Implementation issues | Clinical expert response |
|---|---|
Relevant comparators | |
The active comparator in the pivotal trials of faricimab (YOSEMITE and RHINE) was aflibercept, which is appropriate; however, would it have been helpful to have a different active comparator or more than 1 active comparator? | The clinical expert noted that although it would be ideal to have direct comparative evidence for ranibizumab and bevacizumab as well, it was reasonable to include only aflibercept in the trial design because it is likely the most appropriate comparator among the anti-VEGF drugs available at the time the study was conducted. |
IVT bevacizumab could be considered a comparator in this population; however, its use is off-label. It was considered in the ITC, which looked at ranibizumab, aflibercept, brolucizumab, and bevacizumab. The NMA demonstrated faricimab to be associated with comparable visual outcomes in terms of BCVA, with an injection frequency lower than or similar to current options available in Canada. Was the ITC sufficient or adequate? | For CDEC consideration. Addressed in Indirect Evidence section of the Clinical Report. |
Considerations for initiation of therapy | |
The Health Canada indication is for the treatment of DME. The inclusion criteria in the pivotal trials of faricimab (YOSEMITE and RHINE) considered participants with hemoglobin A1C ≤ 10%; a BCVA of 73 to 25 letters, inclusive (Snellen equivalent of 20/40 to 20/320); and a CST ≥ 325 mm (Spectralis SD-OCT) or ≥ 315 mm (Cirrus SD-OCT or Topcon SD-OCT). If CDEC recommended to reimburse faricimab, should the initiation criteria specify these characteristics? Current public drug plan criteria for ranibizumab and aflibercept commonly outline such characteristics, and it would be helpful to drug plans if this type of information is specified in the criteria. | The clinical expert noted that it would be reasonable to align the criteria for therapy initiation with the inclusion criteria of the pivotal trials, but would not recommend using hemoglobin A1C as a criterion to restrict access to a potential treatment. |
How likely is it that patients will require treatment in 2 eyes instead of just 1 eye? | The clinical expert stated that it is quite common for patients to require treatment in both eyes, and reported that about 40% to 50% of patients with DME seen in the expert’s practice receive bilateral therapy. In some cases, one of the eyes will respond better to treatment than the other and, after a period of bilateral treatment, continued treatment may only be needed unilaterally, in the eye that is responding poorly. |
The 2 pivotal trials of faricimab (YOSEMITE and RHINE) included participants who were treatment-naive and those who had previously been treated with an anti-VEGF. Would consideration be given to a requirement of failure or intolerance to an anti-VEGF before initiation of faricimab? How likely is it that patients would be prescribed faricimab as first-line treatment for DME? | The clinical expert would not reserve faricimab for patients with treatment failure or intolerance to an anti-VEGF before initiation, but would, if it proves to be safe and effective, offer it to treatment-naive patients, especially those with visual acuity < 6/15. The clinical expert said it would be very likely that patients would be prescribed faricimab as a first-line treatment for DME. |
The CADTH recommendation for the treatment of DME with ranibizumab and aflibercept were finalized in 2012 and 2015, respectively. For the most part, drug plan coverage criteria for both anti-VEGF drugs do not align with the CADTH recommendations. In the case of a positive recommendation that outlines specific criteria (such as hemoglobin A1C, BCVA, CST), it would be helpful if the recommendation referenced the tools used in Canadian clinical practice. Some drug plans may have issues aligning criteria with currently listed anti-VEGF drugs. The CADTH recommendation for aflibercept listed criteria similar to those for ranibizumab. Some of the criteria (e.g., hemoglobin A1C) faced push back from prescribers. The prescribers commented that it was inappropriate to control metabolic parameters before the initiation of therapy and would have no effect on treatment. The drug plans wonder if CDEC could take into consideration the clinical expert’s opinion on some of these issues (the criteria for ranibizumab are quite old now). | For CDEC consideration. |
Consideration for discontinuation of therapy | |
Are there are any points at which treatment would be discontinued? | The clinical expert stated that treatment would be discontinued in cases of extensive retinal atrophy (ischemia) and/or retinal fibrosis in the macula that make improvement of vision impossible, or in the case of traction retinal detachment. |
If there is evidence to suggest discontinuation in certain circumstances, it would be helpful to the drug plans to have specific discontinuation criteria in the recommendation. | For CDEC consideration. |
Considerations for prescribing of therapy | |
Dosing of faricimab for DME is 6 mg administered by IVT injection every 4 weeks for the first 4 doses, after which the dosing interval may be extended up to every 16 weeks, in increments of 4 weeks, depending on physician’s judgment (PTI dosing). What is the expected percentage of patients receiving treatment with faricimab who would be on a PTI of 16 weeks, 12 weeks, and 8 weeks? | The clinical expert expects the percentage of patients receiving faricimab at various intervals in practice to align with the results of the pivotal trials. Percentages from YOSEMITE and RHINE:
|
Presuming progression of the disease over time, would it be likely that a patient would be switched from faricimab to a different anti-VEGF should the PTI increase to every 8 weeks or every 4 weeks? Or would it be more likely that faricimab be continued? | According to the clinical expert, a switch might be made if a patient was on a q.4.w. interval, but if a patient was on a q.8.w. interval, the patient would most likely continue on treatment with faricimab. |
System and economic issues | |
A number of jurisdictions reimburse bevacizumab as an off-label therapy for DME. Should the pricing recommendation for reimbursement recommend that the drug plan cost not exceed the least costly treatment reimbursed for DME? | For CDEC consideration. |
The drug plans noted that confidential negotiated prices exist for comparators. | For CDEC consideration. |
Some jurisdictions (e.g., Manitoba and Saskatchewan) provide aflibercept and ranibizumab through a centralized service (provincial eye centres). What is the appropriate setting to administer faricimab? | The clinical expert noted that retina subspecialist offices and hospital clinics, where available, are the most appropriate setting for faricimab treatment. In rural settings, trained comprehensive ophthalmologists with experience and expertise in the management of DME may suffice. |
Compared with bevacizumab, faricimab resulted in an incremental cost-effectiveness ratio of $218,846 per QALY gained. Given that some provinces reimburse the off-label use of bevacizumab for DME and there is batching of doses using vial-sharing, what is the price reduction needed to meet the $50,000 willingness-to-pay threshold per QALY? | Addressed in the Pharmacoeconomic Review report. |
anti-VEGF = anti–vascular endothelial growth factor; BCVA = best corrected visual acuity; CDEC = CADTH Canadian Drug Expert Committee; CST = central subfield thickness DME = diabetic macular edema; ITC = indirect treatment comparison; IVT = intravitreal; NMA = network meta-analysis; PTI = personalized treatment interval (from every 4 weeks up to every 16 weeks); q.4.w. = every 4 weeks; q.8.w. = every 8 weeks; q.12.w. = every 12 weeks; q.16.w. = every 16 weeks; SD-OCT = spectral-domain optical coherence tomography; QALY = quality-adjusted life-year.
Clinical Evidence
The clinical evidence included in the review of faricimab is presented in 3 sections. The first section, the systematic review, includes pivotal studies provided in the sponsor’s submission to CADTH and Health Canada, as well as those studies that were selected according to an a priori protocol. The second section includes indirect evidence from the sponsor and indirect evidence selected from the literature that met the selection criteria specified in the review.
Systematic Review (Pivotal and Protocol Selected Studies)
Objectives
To perform a systematic review of the beneficial and harmful effects of faricimab 6 mg/0.05 mL solution for IVT injection for the treatment of DME in adults.
Methods
Studies selected for inclusion in the systematic review will include pivotal studies provided in the sponsor’s submission to CADTH and Health Canada, as well as those meeting the selection criteria presented in Table 5. Outcomes included in the CADTH review protocol reflect outcomes considered to be important to patients, clinicians, and drug plans.
Of note, the systematic review protocol was established before the granting of a Notice of Compliance from Health Canada.
Table 5: Inclusion Criteria for the Systematic Review
Criteria | Description |
|---|---|
Patient population | Adults with DME Subgroups:
|
Intervention | Faricimab 6 mg (0.05 mL) administered by IVT injection q.4.w. for the first 6 doses, followed by a q.8.w. dosing interval OR Faricimab 6 mg (0.05 mL) administered by IVT injection q.4.w. for the first 4 doses, after which the dosing interval may be extended up to q.16.w., in increments of up to 4 weeks, based on the individual patient’s anatomic and/or visual outcomes |
Comparators | VEGF inhibitors (e.g., aflibercept, ranibizumab, bevacizumaba) |
Outcomes | Efficacy outcomes:
Harms outcomes:
|
Study design | Published and unpublished phase III and IV RCTs |
AE = adverse event; CRT = central retinal thickness; DME = diabetic macular edema; DR = diabetic retinopathy; DRS = diabetic retinopathy severity; DRSS = Diabetic Retinopathy Severity Scale; ETDRS = Early Treatment Diabetic Retinopathy Study; HRQoL = health-related quality of life; IRF = subretinal fluid. IVT = intravitreal; NEI VFQ-25 = National Eye Institute Visual Functioning Questionnaire-25; q.4.w. = every 4 weeks; q.8.w. = every 8 weeks; q.16.w. = every 16 weeks; RCT = randomized controlled trial; SAE = serious adverse event; SRF = subretinal fluid; VEGF = vascular endothelial growth factor; WDAE = withdrawal due to adverse event.
aOff-label treatment. No Health Canada–approved indication for the treatment of DME.
The literature search for clinical studies was performed by an information specialist using a peer-reviewed search strategy, according to the PRESS Peer Review of Electronic Search Strategies checklist.42
Published literature was identified by searching the following bibliographic databases: MEDLINE All (1946–) via Ovid and Embase (1974–) via Ovid. All Ovid searches were run simultaneously as a multi-file search. Duplicates were removed using Ovid deduplication for multi-file searches, followed by manual deduplication in Endnote. The search strategy comprised both controlled vocabulary, such as the National Library of Medicine’s MeSH (Medical Subject Headings), and keywords. The main search concept was faricimab. The following clinical trials registries were searched: the US National Institutes of Health’s clinicaltrials.gov, WHO’s International Clinical Trials Registry Platform (ICTRP) search portal, Health Canada’s Clinical Trials Database, and the European Union Clinical Trials Register.
No filters were applied to limit the retrieval by study type. Retrieval was not limited by publication date or by language. Conference abstracts were excluded from the search results. Refer to Appendix 1 for the detailed search strategies.
The initial search was completed on April 20, 2022. Regular alerts updated the search until the meeting of the CADTH CDEC on August 24, 2022.
Grey literature (literature that is not commercially published) was identified by searching relevant websites from the Grey Matters: A Practical Tool For Searching Health-Related Grey Literature resource.43 Included in this search were the websites of regulatory agencies (FDA and European Medicines Agency). Google was used to search for additional internet-based materials. Refer to Appendix 1 for more information on the grey literature search strategy.
These searches were supplemented by reviewing bibliographies of key papers and through contacts with appropriate experts. In addition, the manufacturer of the drug was contacted for information regarding unpublished studies.
Two CADTH clinical reviewers independently selected studies for inclusion in the review based on titles and abstracts, according to the predetermined protocol. Full-text articles of all citations considered potentially relevant by at least 1 reviewer were acquired. Reviewers independently made the final selection of studies to be included in the review, and differences were resolved through discussion.
Findings From the Literature
A total of 7 reports9-12,44-46 presenting data from 2 unique studies (YOSEMITE and RHINE) were identified from the literature for inclusion in the systematic review (Figure 1). The included studies are summarized in Table 6. A list of excluded studies is presented in Appendix 2.
Table 6: Details of Included Studies
Study details | YOSEMITE | RHINE |
|---|---|---|
Designs and populations | ||
Study design | Phase III, multi-centre, randomized, double-blind, active-controlled, noninferiority study | |
Locations | 179 sites in 16 countries, including the US (83 sites), Poland (8), Hungary (6), Israel (5), Spain (9), Bulgaria (5), Slovakia (3), Mexico (4), Italy (6), Peru (4), Russian Federation (3), Austria (4), France (4), Germany (5), Turkey (3), and Japan (27) | 174 sites in 24 countries, including the US (50 sites), Canada (10), Argentina (6), Poland (8), Czech Republic (5), the UK (18), Brazil (9), Spain (9), Hungary (4), Australia (7), Russian Federation (4), Portugal (4), Italy (5), Turkey (4), Germany (7), France (3), Denmark (3), Switzerland (1), Republic of Korea (5), Taiwan (3), Thailand (3), Hong Kong (2), Singapore (3), and China (1) |
Patient enrolment dates | September 5, 2018, to September 19, 2019 | October 9, 2018, to September 20, 2019 |
Patients randomized (N) | 940 | 951 |
Inclusion criteria |
| |
Exclusion criteria | General exclusion criteria:
Ocular exclusion criteria for study eye:
Ocular exclusion criteria for nonstudy eye:
Exclusion criteria for both eyes:
Exclusion criteria for concurrent ocular conditions:
| |
Drugs | ||
Intervention | Arm A: Faricimab solution for IVT injection, 6 mg (0.05 mL) q.4.w. to week 20, followed by 6 mg faricimab IVT injections q.8.w. Arm B: Faricimab solution for IVT injection, 6 mg (0.05 mL) q.4.w. to at least week 12, followed by PTI dosing of 6 mg faricimab IVT injections q.4.w., q.8.w., q.12.w., or q.16.w. | |
Comparator | Aflibercept solution for IVT injection, 2 mg (0.05 mL) q.4.w. to week 16, followed by 2 mg IVT aflibercept injections q.8.w. to week 96 | |
Sham procedure | The sham procedure mimics an IVT injection and involves the blunt end of an empty syringe (without a needle) being pressed against the anesthetized eye. It was administered to participants in all 3 treatment arms at applicable clinic visits to maintain the masking of treatment | |
Duration | ||
Phase | ||
Run in | Up to 4 weeks | |
Double-blind | 100 weeks | |
Follow-up | NA | |
Outcomes | ||
Primary end point | Change from baseline in BCVA (measured on the ETDRS chart at a starting distance of 4 m) averaged over week 48, 52, and 56 visits (tested for noninferiority) | |
Secondary and exploratory end points | Key secondary end point:
Other secondary BCVA end points:
Other secondary DR end points:
Other secondary treatment interval end points:
Other secondary anatomic end points:
Other secondary quality of life end points:
Other secondary safety end points:
Exploratory DR end points:
Exploratory anatomic end points:
Exploratory quality of life end points:
Exploratory PK end points:
Exploratory immunogenicity end points:
Exploratory PK, pharmacodynamic, and biomarker end points:
| |
Notes | ||
Publications | Wykoff et al. (2022)46 | |
ADA = anti-drug antibody; AE = adverse event; Ang-2 = angiopoietin-2; BCVA = best corrected visual acuity; CRC = central reading centre; CST = central subfield thickness; DME = diabetic macular edema; DR = diabetic retinopathy; DRS = diabetic retinopathy severity; DRSS = Diabetic Retinopathy Severity Scale; ETDRS = Early Treatment Diabetic Retinopathy Study; IR = subretinal fluid; IVT = intravitreal; NA = not applicable; NEI VFQ-25 = National Eye Institute Visual Functioning Questionnaire-25; OCT = optical coherence tomography; PDR = proliferative diabetic retinopathy; PK = pharmacokinetic; PRP = panretinal photocoagulation; PTI = personalized treatment interval (every 4 weeks to every 16 weeks); q.4.w. = every 4 weeks; q.8.w. = every 8 weeks; q.12.w. = every 12 weeks; q.16.w. = every 16 weeks; SD-OCT = spectral-domain optical coherence tomography; SRF = subretinal fluid; VEGF-A = vascular endothelial growth factor-A.
aAs defined by the American Diabetes Association or per WHO criteria and current regular use of insulin or other injectable drugs (e.g., dulaglutide and liraglutide) for the treatment of diabetes and/or current regular use of oral anti-hyperglycemic agents for the treatment of diabetes.
bIf a patient’s initial reading exceeded these values, a second reading could be obtained later the same day or on another day during the screening period. If the patient’s blood pressure was controlled by antihypertensive medication, the patient had to be taking the same medication continuously for at least 30 days before day 1.
cAny of the following: any vitreous or pre-retinal hemorrhage; neovascularization elsewhere affecting at least half the disc area in an area equivalent to mydriatic ETDRS 7-field imaging on clinical examination or on colour fundus photography; neovascularization affecting at least one-third of the disc area on clinical examination.
dRetina dryness is defined per CST when estimated in the absence of qualitative fluid compartment outputs on OCT (achieving a CST of < 280 mm)
eThe total retinal area is defined as modified 7-field or 4-widefield or ETDRS 7-field mask overlay on ultra-widefield (Optos) images in all study patients and as the entire ultra-widefield image, including peripheral areas, in a subset of patients with Optos fluorescein fundus angiography.
Note: Two additional reports were included: FDA medical review44 and FDA statistical review.45
Sources: YOSEMITE Primary and Final Clinical Study Reports,9,10 RHINE Primary and Updated Clinical Study Reports.11,12
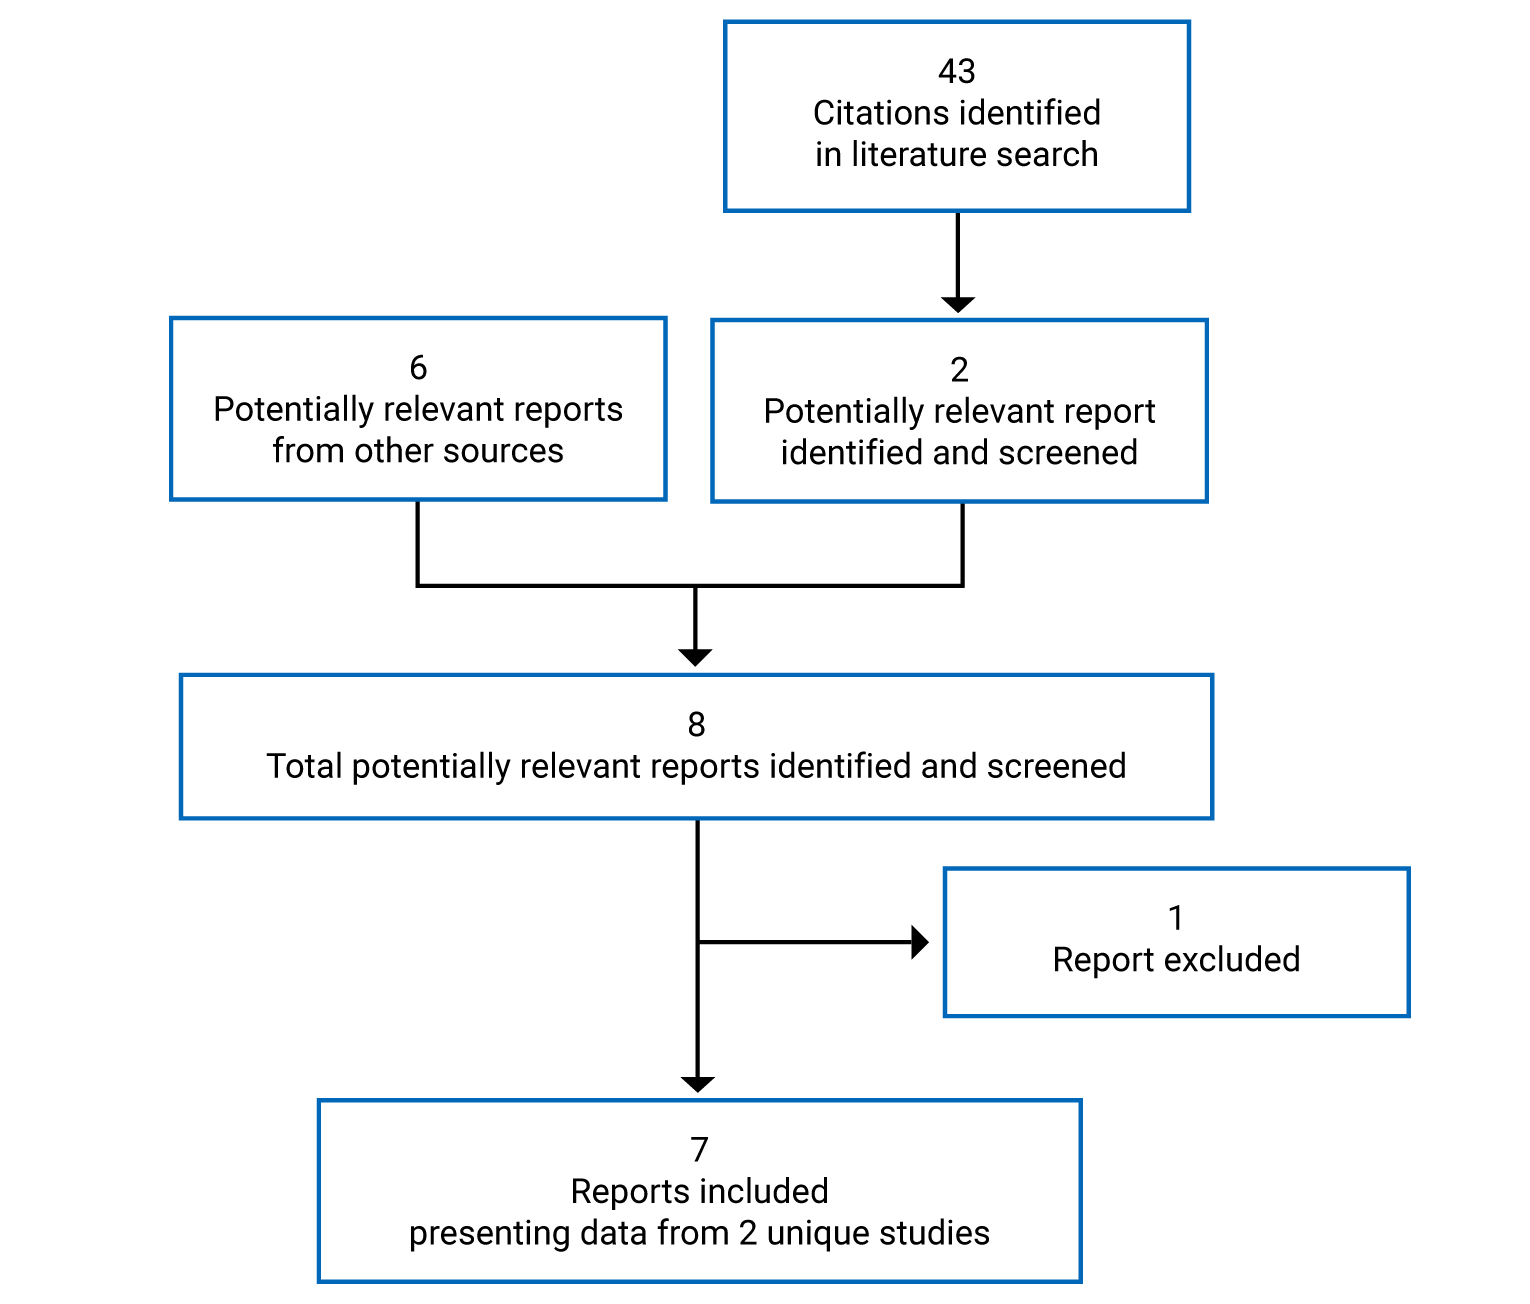
Description of Studies
Two studies were included in the systematic review: YOSEMITE and RHINE.46 They were identically designed phase III, multi-centre, randomized, double-blind, active-controlled, noninferiority trials that aimed to evaluate the efficacy, safety, durability, and pharmacokinetics of faricimab compared with aflibercept in patients with DME (both treatment-naive and previously treated with an anti-VEGF). There were 2 treatment arms for faricimab with different administration schedules. Both studies were funded by Hoffmann-La Roche.
YOSEMITE (N = 940) was conducted at 179 sites in 16 countries (Canada not included) and RHINE (N = 951) was conducted at 174 sites in 24 countries (and included 10 Canadian sites). Both trials consisted of screening period of up to 28 days (days –28 to –1), followed by a 100-week double-blind phase. During the screening phase, patients were assessed for study eligibility based on pre-specified inclusion and exclusion criteria. Patients who failed an initial screening could be eligible for re-screening up to 2 additional times during the study’s enrolment period. On day 1 of the double-blind phase, eligible patients were assigned a randomization identification number by an Interactive Voice/Web Response System, then randomized on a 1:1:1 basis to 1 of 3 treatment arms: 6 mg IVT faricimab injections every 4 weeks to week 20, followed by 6 mg IVT faricimab injections every 8 weeks; 6 mg IVT faricimab injections every 4 weeks to at least week 12, followed by PTI dosing; 2 mg IVT aflibercept injections every 4 weeks to week 16, followed by 2 mg IVT aflibercept injections every 8 weeks. Randomization was stratified by 3 baseline factors: baseline BCVA ETDRS letter score (64 letters or better versus 63 letters or worse); prior IVT anti-VEGF therapy (yes or no); and region (US and Canada, Asia, and the rest of the world). Patients in all arms received the assigned treatment up to and including week 96 and returned for a final visit at week 100 in the double-masked period. Study visits occurred every 4 weeks until the end of the study period in both studies. Patients in all arms received a sham procedure at study visits when they were not receiving treatment with either faricimab or aflibercept. The study design of both studies is illustrated in Figure 2. The data cut-off for the primary end point analysis at year 1 was October 20, 2020, for YOSEMITE and October 19, 2020, for RHINE. For the 2-year results, the last patient visit was September 3, 2021, for YOSEMITE and August 27, 2021, for RHINE.
Figure 2: Study Design Schematic for YOSEMITE and RHINE
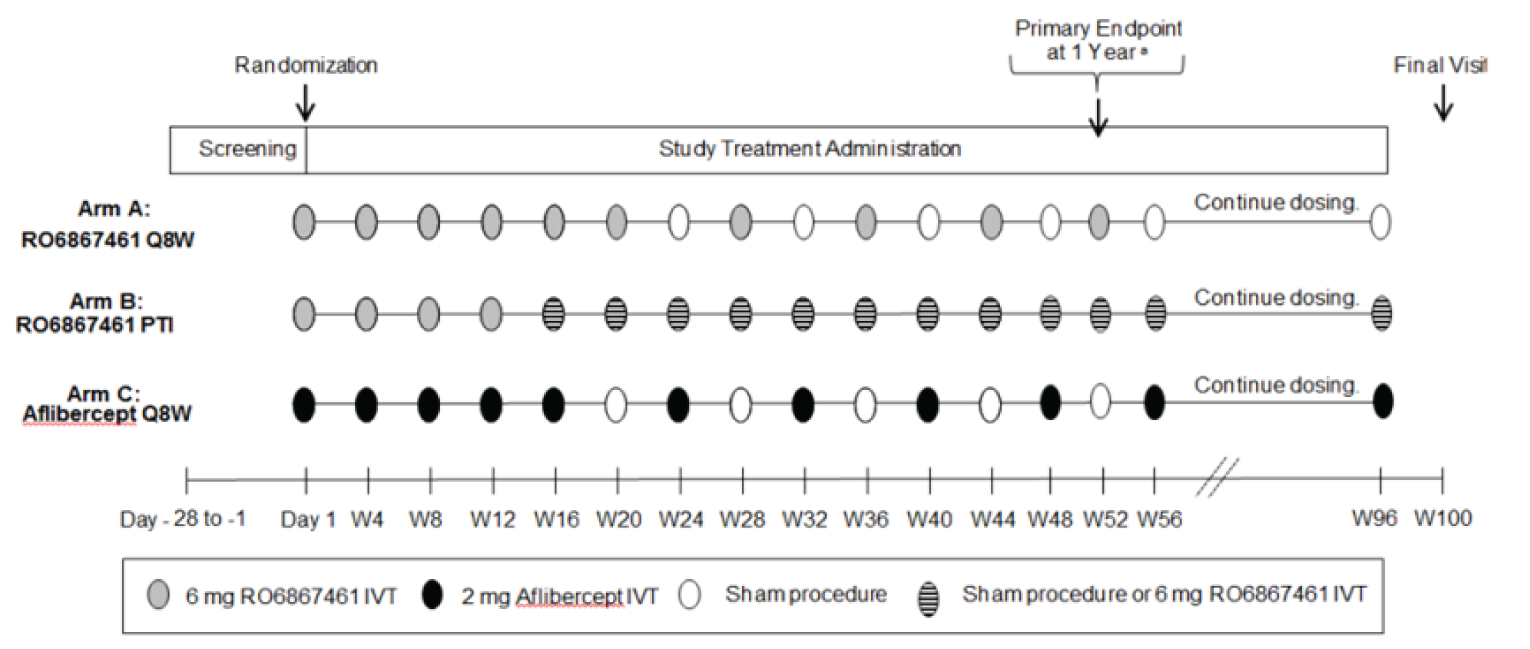
IVT = intravitreal; q.8.w. = every 8 weeks; PTI = personalized treatment interval (every 4 weeks to up to every 16 weeks); q.8.w. = every 8 weeks; RO687461 = faricimab; W = week.
aThe definition of 1 year used for the primary efficacy end point (the change from baseline in BCVA, as measured on the ETDRS chart at a starting distance of 4 m at 1 year) is the average of week 48, 52, and 56 visits.
Sources: YOSEMITE Clinical Study Report,9 RHINE Clinical Study Report.11
Populations
Inclusion and Exclusion Criteria
The key inclusion criteria for both studies included macular thickening secondary to DME involving the centre of the fovea (CST ≥ 325 µm on Spectralis SD-OCT or ≥ 315 µm on Cirrus SD-OCT or Topcon SD-OCT) in patients 18 years and older; current use of oral or injectable antidiabetic medication for the treatment of type 1 or type 2 diabetes, with a hemoglobin A1C level of 10% or less; and BCVA scores of 73 to 25 letters using the ETDRS protocol (20/40 to 20/320 Snellen equivalent). Patients could have been previously treated with an anti-VEGF in the study eye or could be treatment-naive. Enrolment of participants with anti-VEGF experience was capped at a maximum 25%. Key exclusion criteria were untreated diabetes, uncontrolled blood pressure, stroke or myocardial infarction in the previous 6 months, high-risk PDR in the study eye, use of medicated intraocular implants in the previous 6 months, any previous use of Iluvien implants, PRP, or macular laser treatment in the previous 3 months, and concurrent ocular conditions that could affect vision in the study eye. The key inclusion and exclusion criteria for the 2 trials are shown Table 6. Only 1 eye was assigned as the study eye in the studies. If both eyes were eligible, the eye with the worst BCVA at baseline was selected (unless the other eye was deemed by investigators to be more suitable for treatment).
Baseline Characteristics
A summary of baseline characteristics of the ITT population in both studies is shown in Table 7. The baseline demographic and ocular characteristics of patients were, overall, balanced in the treatment arms within each study. The baseline characteristics were generally similar across the studies, except months since DME diagnosis was shorter in YOSEMITE than in RHINE (median [minimum to maximum] months = 3.1 [0 to 304] months and 6.6 [0 to 380] months, respectively) and baseline CST was slightly higher in YOSEMITE than in RHINE (mean [standard deviation] = 487.5 [132.5] µm and 471.6 [125.3] µm, respectively). In both studies, patients had a median age of 62 to 64 years and the majority were male (> 57%) and White (> 76%). Macular ischemia (nonperfusion) was present at baseline in more than 1-third of patients (37% to 43%), and most patients had macular leakage (> 93%). At the start of the studies, most patients (approximately 70% to 75%) had a diabetic retinopathy severity (DRS) level of 35 to 47 (mild to moderately severe nonproliferative DR), with mean baseline BCVA scores of around 62 letters. Slightly more than 1 in 5 patients had been previously treated with an anti-VEGF (20.4% in RHINE; 22.9% in YOSEMITE).
Table 7: Summary of Baseline Characteristics in the YOSEMITE and RHINE Trials (ITT Population)
Characteristic | YOSEMITE | RHINE | ||||
|---|---|---|---|---|---|---|
Faricimab 6 mg q.8.w., N = 315 | Faricimab 6 mg PTI, N = 313 | Aflibercept 2 mg q.8.w., N = 312 | Faricimab 6 mg q.8.w., N = 317 | Faricimab 6 mg PTI, N = 319 | Aflibercept 2 mg q.8.w., N = 315 | |
Age, years | ||||||
Mean (SD) | 61.6 (9.5) | 62.8 (10.0) | 62.2 (9.6) | 62.5 (10.1) | 61.6 (10.1) | 62.3 (10.1) |
Median (range) | 62 (26 to 85) | 64 (24 to 85) | 63 (28 to 84) | 63 (27 to 91) | 63 (26 to 87) | 63 (28 to 86) |
Male, n (%) | 187 (59.4) | 197 (62.9) | 178 (57.1) | 194 (61.2) | 199 (62.4) | 186 (59.0) |
Race, n (%) | ||||||
White | 241 (76.5) | 240 (76.7) | 253 (81.1) | 250 (78.9) | 249 (78.1) | 253 (80.3) |
Asian | 31 (9.8) | 26 (8.3) | 27 (8.7) | 34 (10.7) | 36 (11.3) | 32 (10.2) |
Black or African American | 22 (7.0) | 25 (8.0) | 12 (3.8) | 18 (5.7) | 23 (7.2) | 24 (7.6) |
American Indian or Alaska Native | 6 (1.9) | 5 (1.6) | 7 (2.2) | 0 | 0 | 1 (0.3) |
Native Hawaiian or other Pacific Islander | 2 (0.6) | 0 | 3 (1.0) | 2 (0.6) | 0 | 0 |
Multiple | 0 | 1 (0.3) | 0 | 2 (0.6) | 1 (0.3) | 0 |
Unknown | 13 (4.1) | 16 (5.1) | 10 (3.2) | 11 (3.5) | 10 (3.1) | 5 (1.6) |
Months since DME diagnosis | ||||||
n | 297 | 292 | 296 | 275 | 277 | 273 |
Mean (SD) | 14.0 (21.7) | 17.6 (36.2) | 17.5 (27.6) | 18.9 (32.2) | 20.7 (33.0) | 20.3 (37.1) |
Median (range) | 3.4 (0 to 134) | 2.3 (0 to 304) | 3.4 (0 to 180) | 6.4 (0 to 380) | 6.6 (0 to 242) | 6.8 (0 to 365) |
Unknown | 18 | 21 | 16 | 42 | 42 | 42 |
BCVA, letters | ||||||
n | 315 | 313 | 312 | 316 | 317 | 315 |
Mean (SD) | 62.0 (9.9) | 61.9 (10.2) | 62.2 (9.5) | 61.9 (10.1) | 62.5 (9.3) | 62.1 (9.4) |
Median (range) | 64 (28 to 81) | 65 (25 to 73) | 64 (27 to 73) | 65 (27 to 73) | 65 (30 to 86) | 65 (33 to 79) |
Missing or invalid | 0 | 0 | 0 | 1 | 2 | 0 |
CST, ILM-BM, µm | ||||||
n | 312 | 312 | 308 | 314 | 316 | 312 |
Mean (SD) | 492.3 (135.8) | 485.8 (130.8) | 484.5 (131.1) | 466.2 (119.4) | 471.3 (127.0) | 477.3 (129.4) |
Median (range) | 476.5 (291 to 1,172) | 461.5 (270 to 1,043) | 458.0 (208 to 982) | 445.0 (273 to 936) | 442.0 (285 to 980) | 448.0 (266 to 1,209) |
Missing or ungradable | 3 | 1 | 4 | 3 | 3 | 3 |
Macular ischemic nonperfusion, n (%) | 127 (40.3) | 117 (37.4) | 122 (39.1) | 126 (39.7) | 138 (43.3) | 132 (41.9) |
Macular leakage, n (%) | 305 (96.8) | 301 (96.2) | 293 (93.9) | 300 (94.6) | 309 (96.9) | 299 (94.9) |
Previously treated with anti-VEGF, n (%) | 77 (24.4) | 68 (21.7) | 70 (22.4) | 63 (19.9) | 64 (20.1) | 67 (21.3) |
Prior PRP therapy | 43 (13.7) | 41 (13.1) | 43 (13.8) | 45 (14.2) | 51 (16.0) | 61 (19.4) |
Prior non-PRP laser therapy | 42 (13.3) | 45 (14.4) | 46 (14.7) | 54 (17.0) | 58 (18.2) | 52 (16.5) |
Prior steroid therapy | 26 (8.3) | 14 (4.5) | 23 (7.4) | 12 (3.8) | 17 (5.3) | 17 (5.4) |
DR status, n (%) | ||||||
1. DRS level 10, 12 (DR absent) | 2 (0.6) | 3 (1.0) | 4 (1.3) | 2 (0.6) | 4 (1.3) | 1 (0.3) |
2. DRS level 14A, 14B, 14C, 14Z, 15, 20 (DR questionable/microaneurysms only) | 4 (1.3) | 6 (1.9) | 10 (3.2) | 3 (0.9) | 10 (3.1) | 6 (1.9) |
3. DRS level 35A, 35B, 35C, 35D, 35E, 35F (mild NPDR]) | 84 (26.7) | 92 (29.4) | 83 (26.6) | 90 (28.4) | 92 (28.8) | 94 (29.8) |
4. DRS level 43A, 43B (moderate NPDR) | 84 (26.7) | 86 (27.5) | 85 (27.2) | 88 (27.8) | 72 (22.6) | 79 (25.1) |
5. DRS level 47A, 47B, 47C, 47D (moderately severe NPDR) | 67 (21.3) | 59 (18.8) | 54 (17.3) | 59 (18.6) | 63 (19.7) | 54 (17.1) |
6. DRS level 53A, 53B, 53C, 53D, 53E (severe NPDR) | 46 (14.6) | 40 (12.8) | 49 (15.7) | 50 (15.8) | 36 (11.3) | 51 (16.2) |
7. DRS level 61A, 61B (mild PDR) | 16 (5.1) | 11 (3.5) | 9 (2.9) | 12 (3.8) | 26 (8.2) | 11 (3.5) |
8. DRS level 65A, 65B, 65C (moderate PDR) | 6 (1.9) | 9 (2.9) | 7 (2.2) | 6 (1.9) | 10 (3.1) | 6 (1.9) |
9. DRS level 71A, 71B, 71C, 71D (high-risk PDR) | 0 | 1 (0.3) | 2 (0.6) | 2 (0.6) | 1 (0.3) | 3 (1.0) |
10. DRS level 75 (high-risk PDR) | 0 | 0 | 0 | 0 | 0 | 0 |
11. DRS level 81 (advanced PDR) | 0 | 0 | 0 | 0 | 0 | 0 |
12. DRS level 85A, 85B (advanced PDR) | 0 | 0 | 0 | 0 | 0 | 0 |
90. DRS level 90 (cannot grade) | 4 (1.3) | 5 (1.6) | 7 (2.2) | 2 (0.6) | 5 (1.6) | 5 (1.6) |
Missing | 2 (0.6) | 1 (0.3) | 2 (0.6) | 3 (0.9) | 0 | 5 (1.6) |
Bilateral eligibility, n (%) | 25 (7.9) | 33 (10.5) | 26 (8.3) | 31 (9.8) | 30 (9.4) | 33 (10.5) |
Eye with worst BCVA selected | 17 (5.4) | 22 (7.0) | 14 (4.5) | 20 (6.3) | 19 (6.0) | 21 (6.7) |
Eye with best BCVA selected | 7 (2.2) | 9 (2.9) | 12 (3.8) | 9 (2.8) | 9 (2.8) | 8 (2.5) |
No difference in BCVA between eyes | 1 (0.3) | 2 (0.6) | 0 | 2 (0.6) | 2 (0.6) | 4 (1.3) |
Lens status, n (%) | ||||||
Phakic | 242 (76.8) | 230 (73.5) | 229 (73.4) | 234 (73.8) | 244 (76.5) | 239 (75.9) |
Pseudophakic | 70 (22.2) | 80 (25.6) | 80 (25.6) | 83 (26.2) | 74 (23.2) | 74 (23.5) |
Aphakic | 0 | 0 | 0 | 0 | 0 | 0 |
Other | 3 (1.0) | 3 (1.0) | 3 (1.0) | 0 | 1 (0.3) | 2 (0.6) |
Baseline hemoglobin A1C, n (%) | ||||||
< 6.5% | 53 (16.8) | 46 (14.7) | 46 (14.7) | 59 (18.6) | 48 (15.0) | 55 (17.5) |
≥ 6.5% to < 8.0% | 157 (49.8) | 146 (46.6) | 156 (50.0) | 133 (42.0) | 145 (45.5) | 133 (42.2) |
≥ 8.0% | 104 (33.0) | 118 (37.7) | 109 (34.9) | 122 (38.5) | 121 (37.9) | 122 (38.7) |
Missing | 1 (0.3) | 3 (1.0) | 1 (0.3) | 3 (0.9) | 5 (1.6) | 5 (1.6) |
Type 1 diabetes, n (%) | 24 (7.6) | 16 (5.1) | 13 (4.2) | 20 (6.3) | 19 (6.0) | 17 (5.4) |
Type 2 diabetes, n (%) | 291 (92.4) | 299 (95.5) | 299 (95.8) | 297 (93.7) | 300 (94.0) | 298 (94.6) |
BCVA = best corrected visual acuity; CST = central subfield thickness; DME = diabetic macular edema; DR = diabetic retinopathy; DRS = diabetic retinopathy severity; ILM-BM = distance between internal limiting membrane and Bruch's membrane; ITT = intent-to-treat; NPDR = nonproliferative diabetic retinopathy; PDR = proliferative diabetic retinopathy; PRP = panretinal photocoagulation; PTI = personalized treatment interval (from every 4 weeks up to every 16 weeks); q.8.w. = every 8 weeks; SD = standard deviation; VEGF = vascular endothelial growth factor.
Note: Baseline is the last available value taken on or before randomization.
Sources: YOSEMITE Clinical Study Report,9 RHINE Clinical Study Report.11
Interventions
In the YOSEMITE and RHINE studies, eligible patients were randomized in a 1:1:1 ratio to 1 of 3 treatment arms — faricimab 6 mg every 8 weeks, faricimab 6 mg PTI, or aflibercept 2 mg every 8 weeks — for a duration of 100 weeks.
In the 8-week faricimab arm, patients received faricimab 6 mg intravitreally every 4 weeks for 6 loading doses (day 1, week 4, week 8, week 12, week 16, week 20), followed by 9 maintenance injections of faricimab 6 mg IVT every 8 weeks to week 96, with a final study visit at week 100.
In the PTI faricimab arm, patients received faricimab 6 mg intravitreally every 4 weeks for 4 loading doses (day 1, week 4, week 8, and week 12) or until CST met the predefined reference threshold (CST < 325 µm for Spectralis SD-OCT or < 315 µm for Cirrus SD-OCT or Topcon SD-OCT), after which a PTI was used until week 96, with a final visit at week 100. Once a patient’s initial reference CST was established, their study drug dosing interval was increased by 4 weeks, to an initial 8-week dosing interval. From that point forward, the study drug dosing interval was extended, reduced, or maintained based on assessments made at study drug dosing visits. Adjustments to the study drug dosing interval were made in 4-week increments to a maximum of 16 weeks and a minimum of 4 weeks. These decisions on the treatment interval were made through an Interactive Voice/Web Response System, which automatically calculated dosing intervals according to a pre-established algorithm (refer to Figure 3). The algorithm’s criteria were based on relative change in CST and BCVA, compared with reference CST and reference BCVA, as follows:
Interval extended by 4 weeks:
if the CST value increased or decreased by no more than 10% without an associated BCVA decrease 10 letters or more
Interval maintained:
if the CST value decreased by more than 10%, or
if the CST value increased or decreased by 10% or less with an associated BCVA decrease of 10 letters or more, or
if the CST value increased by more than 10% to 20% or less without an associated BCVA decrease of 5 letters or more
Interval reduced by 4 weeks:
if the CST value increased by more than 10% to 20% or less with an associated BCVA decrease of 5 letters or more to fewer than 10 letters, or
if the CST value increased by more than 20% without an associated BCVA decrease of 10 letters or more
Interval reduced by 8 weeks:
if the CST value increased by more than 10% with an associated BCVA decrease of 10 letters or more
In the aflibercept arm, patients received aflibercept 2 mg intravitreally every 4 weeks for 5 loading doses (day 1, week 4, week 8, week 12, week 16), followed by 10 maintenance injections of 2 mg at a fixed interval of every 8 weeks until week 96, with a final visit at week 100.
Patients in all 3 treatment arms completed scheduled study visits every 4 weeks for the duration of the study. A sham procedure, which involved a needle-less syringe being pressed against the anesthetized eye to mimic an IVT injection, was performed on patients in all treatment arms at study visits when no treatment was scheduled to preserve masking.
Treatment assignments were masked to all patients, assessors, and investigators, but not to treatment administrators.
Patients were permitted to continue using maintenance therapies (e.g., treatments for glaucoma, ocular hypertension, cataracts, or PRP for the treatment of DR). Treatment of the nonstudy eye with an anti-VEGF therapy licensed for ocular use was also permitted. The following therapies were prohibited during both studies: systemic anti-VEGF therapy; systemic drugs known to cause macular edema (fingolimod, tamoxifen); IVT anti-VEGF drugs in the study eye (other than the assigned study intervention); IVT, periocular (subtenon), steroid implants (i.e., Ozurdex, Iluvien) and chronic topical (ocular) corticosteroids in the study eye; treatment with verteporfin (Visudyne) in the study eye; administration of micropulse and focal or grid laser in the study eye; and other experimental therapies (except vitamins and minerals).
Figure 3: Algorithm for IxRS-Determined PTI Study Drug Dosing
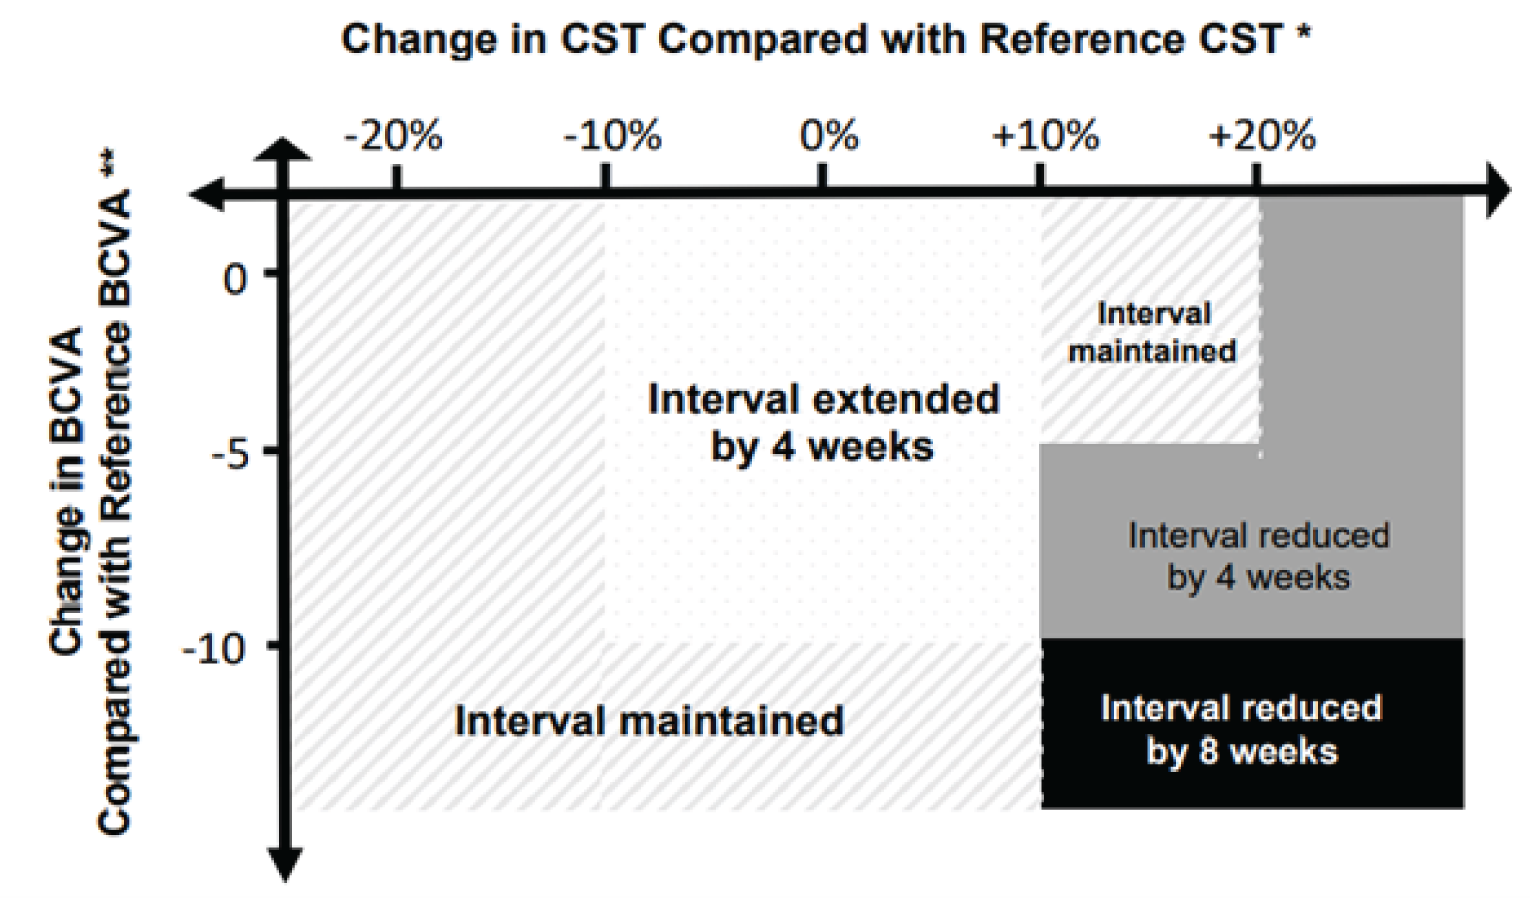
BCVA = best corrected visual acuity; CST = central subfield thickness; IxRS = Interactive Voice/Web Response System; PTI = personalized treatment interval (every 4 weeks up to every 16 weeks).
* Reference CST is the CST value when the initial CST threshold criteria are met. Reference CST was adjusted if CST decreased by > 10% from the previous reference CST at 2 consecutive study drug dosing visits and the values obtained were within 30 µm. The CST value obtained at the latter visit served as the new reference CST, starting immediately at that visit.
** Reference BCVA is the mean of the 3 best BCVA scores obtained at any prior study drug dosing visit.
Sources: YOSEMITE Clinical Study Report,9 RHINE Clinical Study Report.11
Outcomes
A list of efficacy end points identified in the CADTH review protocol that were assessed in the clinical trials included in this review is provided in Table 8. These end points are further summarized in the text that follows the table. A detailed discussion and critical appraisal of the outcome measures are provided in Appendix 4.
Table 8: Summary of Outcomes of Interest Identified in the CADTH Review Protocol
Outcome measure | YOSEMITE | RHINE | Outcomes included in YOSEMITE and RHINE |
|---|---|---|---|
Change from baseline in visual acuity | Primary |
| |
Secondary |
| ||
Change in CRT | Secondary |
| |
Frequency of injection | Secondary |
| |
HRQoL | Secondary or exploratory | Secondary:
Exploratory:
| |
Vision-related function
| — | ||
Presence of SRF or IRF | Secondary |
| |
Change from baseline in DRS | Secondary |
| |
Exploratory |
| ||
AEs, SAEs, WDAEs, and mortality | Secondary |
| |
AE = adverse event; BCVA = best corrected visual acuity; CRT = central retinal thickness; CST = central subfield thickness; DME = diabetic macular edema; DRS = diabetic retinopathy severity; DRSS = Diabetic Retinopathy Severity Scale; ETDRS = Early Treatment Diabetic Retinopathy Study; HRQoL = health-related quality of life; IRF = subretinal fluid; NEI VFQ-25 = National Eye Institute Visual Functioning Questionnaire-25; PDR = proliferative diabetic retinopathy; PRP = panretinal photocoagulation; PTI = personalized treatment interval (from every 4 weeks up to every 16 weeks); q.4.w. = every 4 weeks; q.8.w. = every 8 weeks; q.12.w. = every 12 weeks; q.16.w. = every 16 weeks; SAE = serious adverse events; SD-OCT = spectral-domain optical coherence tomography; SRF = subretinal fluid; WDAE = withdrawal due to adverse event.
Note: Only outcomes pre-specified in the protocol are included in this table.
Sources: YOSEMITE Clinical Study Report,9 RHINE Clinical Study Report.11
Efficacy Outcomes
Change From Baseline in Visual Acuity
The change from baseline in BCVA (ETDRS letters) averaged over weeks 48, 52, and 56 was the primary end point in both studies. Secondary end points of visual acuity change included the proportion of patients gaining greater than or equal to 15, 10, 5, or 0 ETDRS letters in BCVA from baseline; the proportion of patients avoiding a loss of greater than or equal to 15, 10, or 5 ETDRS letters in BCVA from baseline averaged over weeks 48, 52, and 56. These outcomes were also assessed over time (i.e., at all assessment time points through week 100). The proportion of patients gaining greater or equal to 15 letters or achieving BCVA of greater or equal 84 letters over time and the proportion of patients with a BCVA Snellen equivalent of 20/40 or better were assessed at similar time points.
The BCVA score was measured with the ETDRS visual acuity chart at a starting distance of 4 m. The ETDRS charts consist of 70 letters distributed across 14 rows. Each row contains a series of 5 letters of equal difficulty, with standardized spacing between letters and rows. The level of difficulty increases with successive rows as the size of the characters decreases. The BCVA score corresponds to the number of letters a person can read from the ETDRS chart. The maximum score is 100. Reading more lines (i.e., more letters) indicates better visual acuity.47 Generally, 2 to 3 lines (10 to 15 letters) is considered a clinically important difference.48,49 The FDA has recommended a mean change of 15 letters or more on an ETDRS chart or a statistically significant difference in the proportion of patients with a change in visual acuity of at least 15 letters as clinically relevant outcome measures in trials of interventions for macular edema.50,51 For more information regarding the ETDRS, refer to Appendix 4.
ETDRS results can be converted to Snellen fractions, another common measure of visual acuity, in which the numerator indicates the distance at which the chart was read and the denominator indicates the distance at which a person can discern letters of a particular size. A larger denominator indicates worse vision. For example, a person with 20/100 vision can read letters at 20 feet that a person with 20/20 vision can read at 100 feet.52
Change in CRT
Retinal thickness was measured using OCT of the study eye. The change from baseline in CST averaged over weeks 48, 52, and 56 was a secondary outcome in both studies. CST was measured as the distance between the internal limiting membrane and Bruch’s membrane (ILM-BM). The change from baseline in CST (ILM-BM) over time and the proportion of patients with an absence of DME (CST < 325 µm for Spectralis SD-OCT or < 315 µm for Cirrus SD-OCT or Topcon SD-OCT) averaged over weeks 48, 52, and 56 and over time were also reported as secondary outcomes. A reduction in CST is considered a favourable outcome in the treatment of DME; however, a minimal important difference (MID) has not been established. For more information on the use of OCT to measure changes in retinal thickness, refer to Appendix 4.
Frequency of Injection
The proportion of patients in the PTI faricimab arm at 4-, 8-, 12-, and 16-week treatment intervals at 1 year and 2 years, as well as the treatment intervals in this arm over time, were secondary outcomes of the studies.
HRQoL and Vision-Related Function
NEI VFQ-25
Both studies measured the change from baseline in NEI VFQ-25 composite score at week 52 (and over time) as a secondary end point. Additionally, change from baseline in the NEI VFQ-25 Near Activities, Distance Activities, and Driving subscales at year 1 (averaged over weeks 48, 52, and 56), as well as the proportion of patients with a greater or equal to 4-point improvement from baseline in the NEI VFQ-25 composite score at 1 year (averaged over weeks 48, 52, and 56), were assessed as exploratory end points. NEI VFQ-25 was administered masked site staff on day 1, week 24, week 52, and week 100 visits. NEI VFQ-25 is a questionnaire developed to measure vision-targeted quality of life. The questionnaire consists of 25 items relevant to 11 vision-related constructs and a single-item, general health component. The overall composite score ranges from 0 to 100, with 0 representing the worst vision-related function and 100 representing the best vision-related function. In addition, there are 12 subscale scores (e.g., near vision, distance vision, driving). The questionnaire has a reported MID of 3.3 to 6.13 points for the overall composite score. A psychometric validation study of the NEI VFQ-25 specifically in patients with DME showed that the MID for each NEI VFQ-25 domain ranged from 8.80 (general vision) to 14.40 (role difficulties) and produced a composite score MID of 6.13 points.53 For more information on the properties of the NEI VFQ-25, refer to Appendix 4.
Minimum Vision Required for Driving
The visual acuity eligibility standard for obtaining a noncommercial driving licence in Canada is defined by the Canadian Council of Motor Transport Administrators as BCVA not less than 20/50 (6/15) with both eyes open and examined together.54 The proportion of patients meeting or not meeting this visual acuity standard needed for driving was not assessed in the included studies as an outcome. However, a corresponding minimal BCVA required for driver licencing used in most regions of the US (i.e., visual acuity not less than 20/40)55 was assessed. The proportion of patients with a BCVA Snellen equivalent of 20/40 or worse over time was measured in both studies as a secondary outcome.
Blindness (Legal)
Legal blindness is defined as a BCVA of 20/200 or less in both eyes measured with a Snellen chart and/or a visual field of 20 degrees or narrower.56 The proportion of patients with a BCVA Snellen equivalent of 20/200 or worse averaged over weeks 48, 52, and 56 (and over time) was measured in both studies as a secondary outcome.
Presence of IRF and/or SRF
The proportion of patients with an absence of IRF and/or with an absence of SRF at week 52 and over time were measured as secondary end points. SRF and IRF specifically in the central subfield (within the 1 mm diameter centre of the macula) were of interest.
Change From Baseline in DRS
The proportion of patients with an improvement in DRS of 2 steps or more from baseline on the ETDRS DRSS at week 52 was the key secondary end point in both studies. Other end points included an improvement of 2 steps or more or at least 3 steps (secondary) or worsening (exploratory) from baseline over time on the ETDRS DRSS. The ETDRS DRSS is a scale that consists of 13 levels of graded photographic characteristics defined to categorize the severity of DR for individual eyes, ranging from no retinopathy to severe vitreous hemorrhage. Higher scores on the scale indicate worsening of DR. Each of the 13 levels on the scale is defined by a set of criteria based on presence and/or severity of abnormalities, rated from 10 to 85 in order of increasing severity. Step progression refers to an increase in photographic level that can be used to describe change (improvement or worsening) in DR over time.57,58 In the ETDRS, the proportion of eyes with progression of 2 or more levels at follow-up was relatively similar among all severity categories at the 1-year follow-up time point, establishing 2-step progression as a reasonable outcome measure for all baseline retinopathy levels.57 An improvement of 3 or more steps is associated with a clinically meaningful improvement of 15 ETDRS letters in visual acuity and has been accepted by the FDA as an efficacy end point for the assessment of improvement in DR.59 For more information regarding the DRSS, refer to Appendix 4.
Other outcomes related to DRS included the proportion of patients who develop new PDR at week 52 and over time (secondary outcome), defined as the achievement of an ETDRS DRSS score of 61 or greater in the assessment of 7-field colour fundus photography images using only people without PDR at baseline (DRSS score of 53 or better), and the proportion of patients who received vitrectomy or PRP over time during the study (exploratory outcomes).
Harms Outcomes
The safety analysis included the incidence and severity of ocular and nonocular AEs that occurring during the study period. The occurrence of AEs was assessed at all assessment time points.
Statistical Analysis
Noninferiority Margin
In the YOSEMITE and RHINE studies, a noninferiority margin of 4 ETDRS letters was used in the primary outcome analysis, where noninferiority would be demonstrated if the lower limit of the 97.5% CI of the difference in change in adjusted mean BCVA from baseline between the faricimab arms (8-week and PTI) and the active comparator (aflibercept) was greater than –4 ETDRS letters. The noninferiority margin of 4 ETDRS letters was selected based on data from the VISTA and VIVID trials, which compared aflibercept with laser control in patients with DME. A margin of 4 ETDRS letters represents approximately 50% of the least estimated benefit of aflibercept over laser control at week 52 in the VISTA study (10.7 letters for aflibercept versus 0.2 for control) and the VIVID study (10.7 letters for aflibercept versus 1.2 for control). The investigators also considered that a loss of 5 letters (1 ETDRS line) between treatments is generally clinically relevant, and therefore inferred that the noninferiority margin of 4 ETDRS letters, being smaller than a loss of 5 letters, would be small enough to allow the conclusion that the new treatment is not inferior to active control to an unacceptable extent. If the noninferiority of faricimab (8-week or PTI) to aflibercept for the primary end point was met in the ITT population, tests for superiority would be conducted, first in the treatment-naive population and then in the overall ITT population. Further details on the order of testing are provided in Figure 4.
In the key secondary efficacy analysis, a noninferiority margin of 10% was used, in which noninferiority would be demonstrated if the lower limit of the 97.5% CI for the difference in weighted proportions of patients with an improvement in DRS of at least 2 steps from baseline on the ETDRS DRSS between the treatment group (8-week or PTI faricimab) and the active comparator group (aflibercept) at week 52 was greater than –10%. No justification was provided for this noninferiority margin. In the case that noninferiority of faricimab (8-week or PTI) to aflibercept for the key secondary end point was met in the ITT population, tests for superiority would be conducted, first in the treatment-naive population, then in the overall ITT population.
Type I Error Control
The noninferiority and superiority hypotheses for the primary end point were tested at an overall significance level of alpha of 0.0496, using a graph-based testing procedure to control for the overall type I error rate. Pairwise comparisons between each dose of faricimab and aflibercept were conducted according to the testing procedure order illustrated in Figure 4. If the tests for 1 treatment sequence were all positive at the alpha/2 ( = 0.0248) level, then alpha/2 was propagated to the beginning of the other treatment sequence, which was tested at a significance level of alpha of 0.0496.
Sample Size Calculation
A sample size calculation determined that approximately 300 patients per treatment arm were required to demonstrate noninferiority between faricimab and aflibercept in the ITT population (using pairwise comparisons between the active comparator and each of the faricimab arms) with respect to the change in BCVA from baseline averaged over weeks 48, 52, and 56 at a 1-sided type I error rate of 1.25% with a power of 90% using a 2-sample t-test, assuming a noninferiority margin of 4 ETDRS letters, a standard deviation of ETDRS 11 letters, and a 10% dropout rate.
Figure 4: Graph-Based Testing Procedure for the Primary End Point
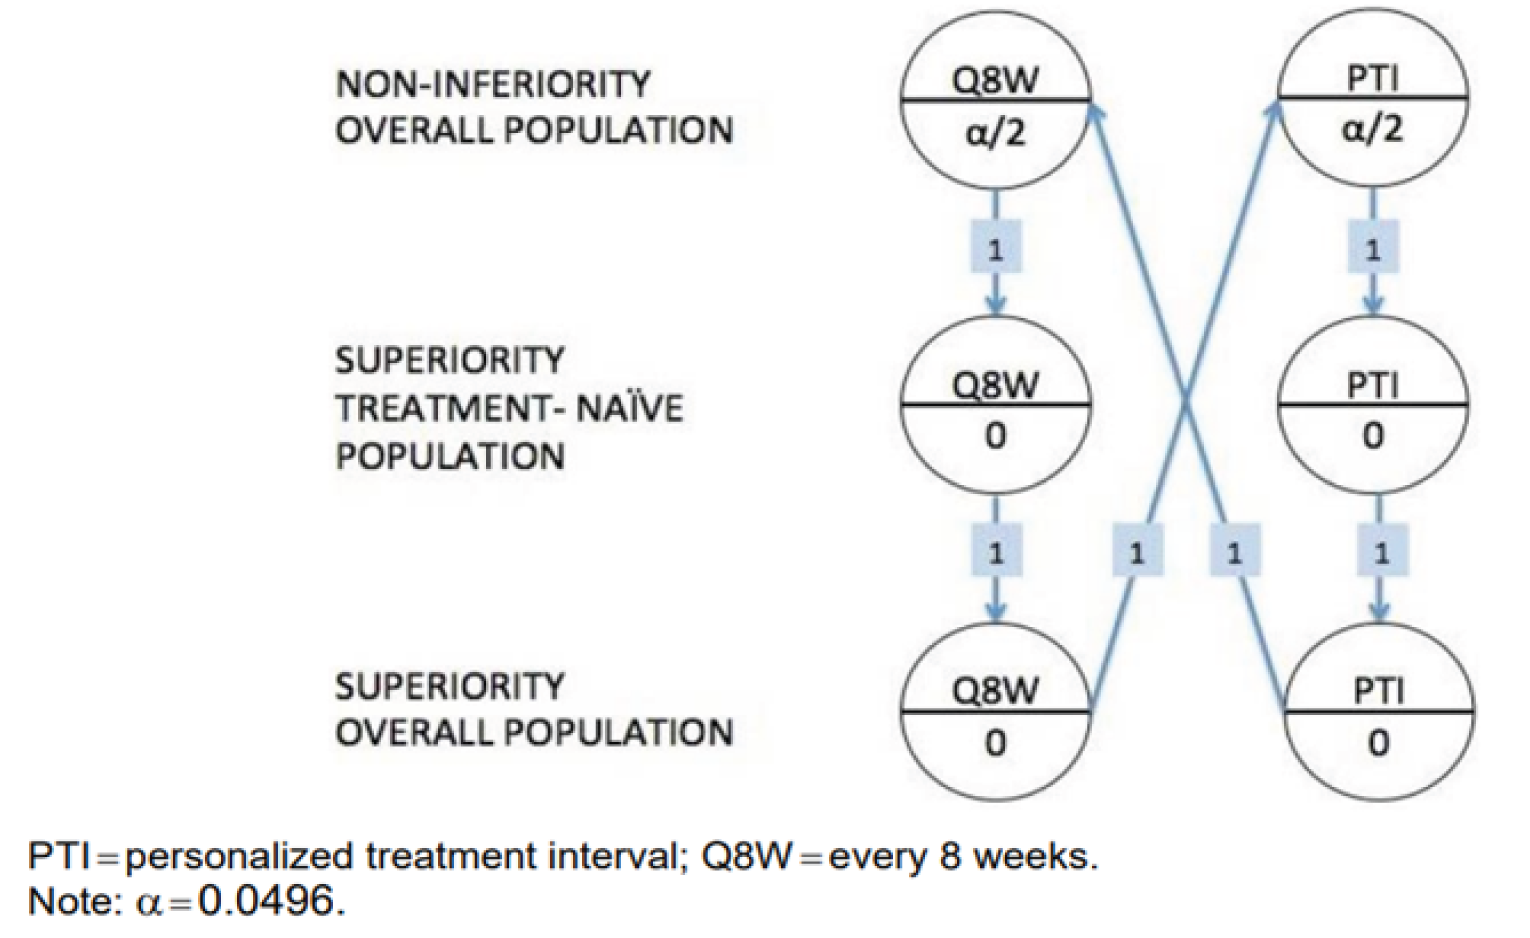
Sources: YOSEMITE Clinical Study Report,9 RHINE Clinical Study Report.11
Statistical Analysis for Efficacy Outcomes
The primary outcome was change from baseline in BCVA averaged over weeks 48, 52, and 56. The primary analysis was based on the ITT population (and the treatment-naive population for the initial superiority test) and was performed using a mixed model for repeated measures (MMRM), which included the change from baseline at weeks 4 to 56 as the response variable and was adjusted for treatment group, visit, visit-by-treatment-group interaction, baseline BCVA (continuous), as well as randomization stratification factors as fixed effects (day 1 BCVA ETDRS letter score [64 letters or better versus 63 letters or worse], prior IVT anti-VEGF therapy [yes or no], and region [US and Canada, Asia, and the rest of the world]), assuming an unstructured covariance structure. In the primary estimand, ICEs not due to COVID-19 (study treatment discontinuation due to AEs or lack of efficacy, use of prohibited systemic treatment or therapy in the study eye) were handled using a treatment policy strategy where all observed values were used regardless of the occurrence of the ICE, whereas ICEs due to COVID-19 (study drug discontinuation, use of prohibited therapy, missed doses with a potentially major impact on efficacy, or death due to COVID-19) were handled with a hypothetical strategy in which all values were censored after the ICE. Missing data for continuous outcomes were implicitly imputed with the MMRM model, based on the assumption that data were missing at random (MAR). Nonstandard BCVA data (e.g., assessed by ETDRS BCVA testing with prior visit refraction, test performed by unmasked certified ETDRS BCVA assessor or by uncertified experienced ETDRS BCVA assessor) were excluded from the analyses.
Pre-specified subgroup analyses were conducted with respect to the primary end point and key secondary end point. Baseline BCVA subgroup (≥ 64 letters and ≤ 63 letters), prior IVT anti-VEGF therapy (yes and no), baseline DRS (< 47, 47 to 53 and > 53 ETDRS DRSS), and baseline hemoglobin A1C (≤ 8% and > 8%) were relevant to this review. Other subgroups identified as relevant to the systematic review in the protocol were not assessed in the studies, including history of ischemic (cerebrovascular or cardiovascular) disease, hypertension, dyslipidemia, and proliferative and nonproliferative DR.
A pre-specified sensitivity analysis was performed using the same estimand and analysis method as the primary analysis, except that a last observation carried forward imputation approach was used to account for missing BCVA data, as well as for BCVA assessments that were censored after COVID-19-related ICEs. Six supplementary analyses using the per-protocol population, a multiple imputation method, and different analysis methods (analysis of covariance, trimmed mean) and strategies for handling ICEs (treatment policy strategy only, hypothetical strategy only) were performed to further evaluate the robustness of the evidence from the primary analysis.
A summary of the statistical analyses of efficacy end points in both studies is shown in Table 9. The analysis for secondary outcomes assessed data in the ITT population (and the treatment-native population for the superiority test of the key secondary end point). Continuous secondary end points that were of interest in this review were analyzed using the same approach as the primary analysis, except that no sensitivity analysis was performed. Binary secondary end points that assessed the proportion of patients in each treatment group and the difference in proportion between treatment groups were calculated by applying Cochran-Mantel-Haenszel (CMH) weights and stratified by the following randomization stratification factors: day 1 BCVA ETDRS letter score (64 letters or better versus 63 letters or worse), prior IVT anti-VEGF therapy (yes versus no), and region (US and Canada, Asia, and the rest of the world). CIs for the proportion of patients in each treatment arm and the overall difference in proportions between treatment arms will be calculated using the normal approximation to the weighted proportions. Missing data were not imputed for secondary outcomes. Exploratory outcomes were analyzed using descriptive statistics (mean, standard deviation, median, and range for continuous end points, and counts and percentages for categorical end points).
Statistical Analysis for Harms Outcomes
The safety analysis was based on AEs recorded through week 100 and were summarized using descriptive statistics.
Table 9: Statistical Analysis of Efficacy End Points in the YOSEMITE and RHINE Trials
End point | Statistical model | Adjustment factors | Sensitivity analyses |
|---|---|---|---|
Change from baseline in BCVA averaged over weeks 48, 52, and 56 | MMRM for ITT population | Categorical covariates of treatment group, visit, visit-by-treatment-group interaction, baseline BCVA (continuous), as well as randomization stratification factors as fixed effects (day 1 BCVA ETDRS letter score [≥ 64 letters vs. ≤ 63 letters], prior IVT anti-VEGF therapy [yes vs. no], and region [US and Canada, Asia, and the rest of the world]) | MMRM (LOCF) |
Change from baseline in BCVA over time | MMRM for ITT population | Categorical covariates of treatment group, visit, visit-by-treatment-group interaction, baseline BCVA (continuous), as well as randomization stratification factors as fixed effects (baseline BCVA, prior anti-VEGF therapy, region) | MMRM (LOCF) |
Proportion of patients gaining ≥ 15, ≥ 10, ≥ 5, or ≥ 0 ETDRS letters in BCVA from baseline averaged over weeks 48, 52, and 56, and over time | CMH weights for ITT population | Stratified by randomization stratification factors (baseline BCVA, prior anti-VEGF therapy, region) | Not performed |
Proportion of patients avoiding loss of ≥ 15, ≥ 10 or ≥ 5 ETDRS letters in BCVA from baseline averaged over weeks 48, 52, and 56, and over time | CMH weights for ITT population | Stratified by randomization stratification factors (baseline BCVA, prior anti-VEGF therapy, region) | Not performed |
Proportion of patients gaining ≥ 15 letters or achieving BCVA of ≥ 84 letters averaged over weeks 48, 52, and 56, and over time | CMH weights for ITT population | Stratified by randomization stratification factors (baseline BCVA, prior anti-VEGF therapy, region) | Not performed |
Change from baseline in CST averaged over weeks 48, 52, and 56, and over time | MMRM for ITT population | Categorical covariates of treatment group, visit, visit-by-treatment-group interaction, baseline BCVA (continuous), as well as randomization stratification factors as fixed effects (baseline BCVA, prior anti-VEGF therapy, region) | Not performed |
Proportion of patients with absence of DME (CST < 325 µm for Spectralis SD-OCT or < 315 µm for Cirrus SD-OCT or Topcon SD-OCT) averaged over weeks 48, 52, and 56, and over time | CMH weights for ITT population | Stratified by randomization stratification factors (baseline BCVA, prior anti-VEGF therapy, region) | Not performed |
Proportion of patients in the PTI arm on a q.4.w., q.8.w., q.12.w., or q.16.w. treatment interval at 1 year and 2 years | Descriptive statistics (counts and percentages) | NA | Not performed |
Treatment intervals in the PTI arm over time | Descriptive statistics (counts and percentages) | NA | Not performed |
Change from baseline in NEI VFQ-25 composite score at week 52 and over time | MMRM for ITT population | Categorical covariates of treatment group, visit, visit-by-treatment-group interaction, baseline BCVA (continuous), as well as randomization stratification factors as fixed effects (baseline BCVA, prior anti-VEGF therapy, region) | Not performed |
Change from baseline in the NEI VFQ-25 Near Activities, Distance Activities, and Driving subscales averaged over weeks 48, 52, and 56, and over time | Descriptive statistics (mean, SD, median, and range) | NA | Not performed |
Proportion of patients with a ≥ 4-point improvement from baseline in NEI VFQ-25 composite score averaged over weeks 48, 52, and 56, and over time | Descriptive statistics (counts and percentages) | NA | Not performed |
Proportion of patients with a BCVA Snellen equivalent of 20/200 or worse averaged over weeks 48, 52, and 56, and over time | CMH weights for ITT population | Stratified by randomization stratification factors (baseline BCVA, prior anti-VEGF therapy, region) | Not performed |
Proportion of patients with a BCVA Snellen equivalent of 20/40 or better averaged over weeks 48, 52, and 56, and over time | CMH weights for ITT population | Stratified by randomization stratification factors (baseline BCVA, prior anti-VEGF therapy, region) | Not performed |
Proportion of patients with absence of IRF and/or SRF at week 52, and over time | CMH weights for ITT population | Stratified by randomization stratification factors (baseline BCVA, prior anti-VEGF therapy, region) | Not performed |
Proportion of patients with a ≥ 2-step improvement in DRS from baseline on the ETDRS DRSS at week 52 | CMH weights for ITT population | Stratified by randomization stratification factors (baseline BCVA, prior anti-VEGF therapy, region) | Not performed |
Proportion of patients with a ≥ 2-step or ≥ 3-step DRS improvement from baseline on the ETDRS DRSS over time | CMH weights for ITT population | Stratified by randomization stratification factors (baseline BCVA, prior anti-VEGF therapy, region) | Not performed |
Proportion of patients who develop new PDR at week 52 and over time | CMH weights for ITT population | Stratified by randomization stratification factors (baseline BCVA, prior anti-VEGF therapy, region) | Not performed |
Proportion of patients with a ≥ 2-step or ≥ 3-step DRS worsening from baseline on ETDRS DRSS over time | Descriptive statistics (counts and percentages) | NA | Not performed |
Proportion of patients who receive vitrectomy or PRP during the study | Descriptive statistics (counts and percentages) | NA | Not performed |
anti-VEGF = anti–vascular endothelial growth factor; BCVA = best corrected visual acuity; CMH = Cochran-Mantel-Haenszel; CST = central subfield thickness; DME = diabetic macular edema; DRS = diabetic retinopathy severity; DRSS = Diabetic Retinopathy Severity Scale; ETDRS = Early Treatment Diabetic Retinopathy Study; IRF = subretinal fluid; ITT = intention-to-treat; LOCF = last observation carried forward; MMRM = mixed-effect model repeated measure; NA = not applicable; NEI VFQ-25 = National Eye Institute Visual Function Questionnaire-25 ; PDR = proliferative diabetic retinopathy; PRP = panretinal photocoagulation; PTI = personalized treatment interval (from every 4 weeks up to every 16 weeks); q.4.w. = every 4 weeks; q.8.w. = every 8 weeks; q.12.w. = every 12 weeks; q.16.w. = every 16 weeks; SD = standard deviation; SD-OCT = spectral-domain optical coherence tomography; SRF = subretinal fluid.
Sources: YOSEMITE Clinical Study Report,9 RHINE Clinical Study Report.11
Analysis Populations
Results are reported for the ITT, treatment-naive, per-protocol, and safety-evaluable populations in YOSEMITE9 and RHINE.11
ITT population: All patients who were randomized in the study were included. Patients were assessed according to the treatment assigned at randomization. This analysis population served as the primary analysis set for all efficacy analyses.
Treatment-naive population: All patients who were randomized in the study who had not received any IVT anti-VEGF drugs in the study eye before day 1 were included. For analyses based on this population, patients were grouped according to the treatment assigned at randomization. This population was used in the initial test of superiority of faricimab over aflibercept.
Per-protocol population: All patients randomized in the study who received at least 1 dose of study treatment and who did not have a major protocol violation that affected the efficacy evaluation or treatment interval determination were included. Patients were assessed according to the actual treatment received. If a patient received a combination of different active treatments (faricimab and aflibercept) in the study eye, the patient’s treatment group was assessed as randomized. This population was used for supplementary analysis of the primary efficacy end point.
Safety-evaluable population: All patients who received at least 1 injection of either faricimab or aflibercept in the study eye were included. Patients were assessed according to the actual treatment received. If a patient received a combination of different active treatments (faricimab and aflibercept) in the study eye, the patient’s treatment group was as randomized. This population was used for safety analyses.
For this review, noninferiority will be assessed using the results from both the ITT and per-protocol analyses.
Results
Patient Disposition
A summary of patient disposition is shown in Table 10.
Of the 1,532 patients screened in the YOSEMITE trial, 940 were randomized (315 patients in the 8-week faricimab arm, 313 patients in the PTI faricimab arm, and 312 patients in the aflibercept arm). Of the 1,715 patients screened in the RHINE trial, 951 were randomized (317 patients in the 8-week faricimab arm, 319 patients in the PTI faricimab arm, and 315 patients in the aflibercept arm). Both trials had a large percentage of patients who failed screening and were not randomized; 38.6% of patients failed to meet the eligibility criteria in YOSEMITE and 44.5% failed to meet the eligibility criteria in RHINE. In both trials, the main reasons for screening failure were not having a BCVA in the 73 to 25 letter, inclusive (20/40 to 20/320), range; having a concurrent exclusionary ocular diagnosis, such as tractional retinal detachment, pre-retinal fibrosis, or epiretinal membrane involving the fovea or disrupting the macular architecture in the study eye; and failing to meet the criterion for macular thickening secondary to DME involving the centre of the fovea.
In YOSEMITE, the proportion of patients who discontinued the study treatment before week 56 was comparable in the treatment arms (range = 8.4% to 9.9%), whereas in RHINE, the proportion was lower in the PTI faricimab arm (3.4%) than in both the 8-week faricimab arm (7.6%) and the aflibercept arm (6.1%). The proportion of patients who discontinued study treatment any time during the study had similar patterns. Withdrawal by the patient was the most frequently reported reason for discontinuation from study treatment in both studies (2.3% in YOSEMITE; 1.7% in RHINE).
Exposure to Study Treatments
The mean duration of exposure to the study treatment was similar among treatment arms in the 2 studies, and ranged from 52.9 weeks to 54.5 weeks at week 56, and from 87.6 weeks to 91.6 weeks at week 100. The number of injections administered through week 56 (reported in the safety-evaluable population) was somewhat lower, numerically, in the PTI faricimab arms than in the other treatment arms in both studies, with a median of 8 injections in the PTI faricimab arm and of 10 injections in the 8-week faricimab and aflibercept arms in both studies. During the 100-week study period, patients in the PTI faricimab arm had a median of 10 injections in YOSEMITE and 11 injections in RHINE, whereas patients in the 8-week faricimab and aflibercept arms had a median of 15 injections and 14 injections, respectively (Table 11).
The proportion of faricimab-treated patients on an injection interval of 4-, 8-, 12-, and 16-weeks at week 56 and week 96 was a secondary efficacy outcome of the studies. Refer to the efficacy section – frequency of injection and Table 12 for details.
Disposition | YOSEMITE | RHINE | ||||
|---|---|---|---|---|---|---|
Faricimab, 6 mg q.8.w. | Faricimab, 6 mg PTI | Aflibercept, 2 mg q.8.w. | Faricimab, 6 mg q.8.w. | Faricimab, 6 mg PTI | Aflibercept, 2 mg q.8.w. | |
Screened, n | 1,532 | 1,715 | ||||
Screen failures, n (%) | 592 (38.6) | 764 (44.5) | ||||
Randomized, n | 315 | 313 | 312 | 317 | 319 | 315 |
Treated, n (%) | 313 (99.4) | 313 (100.0) | 311 (99.7) | 317 (100.0) | 319 (100.0) | 314 (99.7) |
Discontinued study treatment before week 56, n (%) | 31 (9.9) | 30 (9.6) | 26 (8.4) | 24 (7.6) | 11 (3.4) | 19 (6.1) |
Death | 7 (2.2) | 9 (2.9) | 4 (1.3) | 5 (1.6) | 0 | 5 (1.6) |
Lost to follow-up | 7 (2.2) | 7 (2.2) | 4 (1.3) | 6 (1.9) | 4 (1.3) | 3 (1.0) |
Withdrawal by patient | 6 (1.9) | 5 (1.6) | 11 (3.5) | 7 (2.2) | 4 (1.3) | 5 (1.6) |
AEs | 6 (1.9) | 7 (2.2) | 3 (1.0) | 4 (1.3) | 3 (0.9) | 4 (1.3) |
Protocol deviation | 0 | 0 | 1 (0.3) | 0 | 0 | 0 |
Physician decision | 3 (1.0) | 1 (0.3) | 1 (0.3) | 1 (0.3) | 0 | 1 (0.3) |
Lack of efficacy | 1 (0.3) | 0 | 1 (0.3) | 0 | 0 | 0 |
Other | 1 (0.3) | 0 | 1 (0.3) | 1 (0.3) | 0 | 1 (0.3) |
ITT population,a n | 315 | 313 | 312 | 317 | 319 | 315 |
Per-protocol populationb through week 56, n | 251 | 275 | 274 | 258 | 271 | 273 |
Treatment-naive population,a n | 238 | 245 | 242 | 254 | 255 | 248 |
Safety-evaluable population,b n | 313 | 313 | 311 | 317 | 319 | 314 |
Discontinued study treatment during the study period,b n (%) | 52 (16.6) | 47 (15.0) | 52 (16.7) | 44 (13.9) | 34 (10.7) | 47 (15.0) |
AE = adverse event; ITT = intention-to-treat; PTI = personalized treatment interval (from every 4 weeks up to every 16 weeks); q.8.w. = every 8 weeks.
aAs randomized.
bAs treated.
Sources: YOSEMITE Primary and Final Clinical Study Reports,9,10 RHINE Primary and Updated Clinical Study Reports.11,12
Table 11: Summary of Study Treatment Exposure in the Study Eye (Safety-Evaluable Population)
Treatment exposure | YOSEMITE | RHINE | ||||
|---|---|---|---|---|---|---|
Faricimab 6 mg q.8.w., N = 313 | Faricimab 6 mg PTI, N = 313 | Aflibercept 2 mg q.8.w., N = 311 | Faricimab 6 mg q.8.w., N = 317 | Faricimab 6 mg PTI, N = 319 | Aflibercept 2 mg q.8.w., N = 314 | |
Through week 56 | ||||||
Treatment duration in weeks, mean (SD) | 53.1 (9.75) | 52.9 (10.43) | 53.2 (9.54) | 53.1 (10.00) | 54.5 (7.45) | 53.7 (8.65) |
Number of study drug administrations | ||||||
Mean (SD) | 9.5 (1.41) | 8.4 (2.45) | 9.2 (1.47) | 9.3 (1.52) | 8.7 (2.50) | 9.3 (1.36) |
Median (range) | 10 (1 to 11) | 8 (2 to 15) | 10 (1 to 10) | 10 (1 to 10) | 8 (1 to 15) | 10 (1 to 10) |
Through entire study | ||||||
Treatment duration in weeks, mean (SD) | 87.6 (21.54) | 88.2 (22.03) | 88.5 (20.56) | 88.5 (21.06) | 91.6 (15.88) | 89.3 (19.16) |
Number of study drug administrations | ||||||
Mean (SD) | 13.6 (2.87) | 11.5 (3.98) | 13.3 (2.75) | 13.5 (2.87) | 12.1 (4.12) | 13.4 (2.66) |
Median (range) | 15 (1 to 16) | 10 (2 to 25) | 14 (1 to 15) | 15 (1 to 15) | 11 (1 to 25) | 14 (1 to 16) |
PTI = personalized treatment interval (from every 4 weeks up to every 16 weeks); q.8.w. = every 8 weeks; SD = standard deviation.
Sources: YOSEMITE Primary and Final Clinical Study Reports,9,10 RHINE Primary and Updated Clinical Study Reports.11,12
Outcome | YOSEMITE | RHINE | ||||
|---|---|---|---|---|---|---|
Faricimab 6 mg q.8.w., N = 315 | Faricimab 6 mg PTI, N = 313 | Aflibercept 2 mg q.8.w., N = 312 | Faricimab 6 mg q.8.w., N = 317 | Faricimab 6 mg PTI, N = 319 | Aflibercept 2 mg q.8.w., N = 315 | |
Change from baseline in BCVA (ETDRS letters) averaged over weeks 48, 52, and 56 (MMRM approach, primary estimand) | ||||||
Primary analysis, ITT population | ||||||
Number of patients contributing to the analysis | 271 | 276 | 276 | 268 | 293 | 279 |
Change from baseline, in letters, meana (SE) | 10.7 (0.56) | 11.6 (0.56) | 10.9 (0.56) | 11.8 (0.52) | 10.8 (0.51) | 10.3 (0.52) |
Difference in means,a in letters, (97.5% CI) | –0.2 (–2.0 to 1.6) | 0.7 (–1.1 to 2.5) | Reference | 1.5 (–0.1 to 3.2) | 0.5 (–1.1 to 2.1) | Reference |
P value (for superiority test)b | 0.7967 | 0.3772 | Reference | 0.0361 | 0.4930 | Reference |
Primary analysis, treatment-naive population | ||||||
Number of patients contributing to the analysis | 200 | 215 | 212 | 208 | 231 | 213 |
Change from baseline, in letters, meana (SE) | 10.6 (0.68) | 11.4 (0.66) | 11.3 (0.67) | 11.7 (0.58) | 11.2 (0.57) | 10.5 (0.58) |
Difference in means,a in letters, (97.5% CI) | –0.7 (–2.8 to 1.4) | 0.0 (–2.1 to 2.2) | Reference | 1.1 (–0.7 to 3.0) | 0.6 (–1.2 to 2.4) | Reference |
P value (for superiority test) | 0.4699 | 0.9650 | Reference | 0.1718 | 0.4602 | Reference |
Supplementary analysis, per-protocol population | ||||||
Number of patients contributing to the analysis | 235 | 256 | 256 | 241 | 264 | 262 |
Change from baseline, in letters, meana (SE) | 10.8 (0.61) | 11.8 (0.58) | 11.2 (0.59) | 11.9 (0.58) | 10.7 (0.56) | 10.4 (0.56) |
Difference in means,a in letters, (97.5% CI) | –0.4 (–2.3 to 1.5) | 0.7 (–1.2 to 2.5) | Reference | 1.5 (–0.3 to 3.3) | 0.3 (–1.4 to 2.1) | Reference |
Change from baseline in BCVA (ETDRS letters) averaged over weeks 92, 96, and 100 (MMRM approach, ITT population) | ||||||
Number of patients contributing to the analysis | 262 | 270 | 259 | 259 | 282 | 254 |
Change from baseline, in letters, meana (SE) | 10.7 (0.68) | 10.7 (0.68) | 11.4 (0.68) | 10.9 (0.73) | 10.1 (0.71) | 9.4 (0.73) |
Difference in means,a in letters, (95% CI) | –0.7 (–2.6 to 1.2) | –0.7 (–2.5 to 1.2) | Reference | 1.5 (–0.5 to 3.6) | 0.7 (–1.3 to 2.7) | Reference |
Proportion of patients gaining ≥ 15, ≥ 10, ≥ 5, or ≥ 0 ETDRS letters in BCVA from baseline averaged over weeks 48, 52, and 56 (ITT population, CMH method) | ||||||
Number of patients contributing to the analysis | 271 | 276 | 276 | 268 | 293 | 279 |
≥ 15 letters gain, n (%) | 79 (29.2) | 98 (35.5) | 88 (31.9) | 90 (33.6) | 83 (28.3) | 85 (30.5) |
Difference in proportions,c % (95% CI) | –2.6 (–10.0 to 4.9) | 3.5 (–4.0 to 11.1) | Reference | 3.5 (–4.0 to 11.1) | –2.0 (–9.1 to 5.2) | Reference |
≥ 10 letters gain, n (%) | 155 (57.2) | 161 (58.3) | 159 (57.6) | 158 (59.0) | 155 (52.9) | 151 (54.1) |
Difference in proportions,c % (95% CI) | –0.4 (–8.6 to 7.9) | 0.7 (–7.4 to 8.8) | Reference | 5.4 (–2.5 to 13.4) | –1.1 (–8.9 to 6.8) | Reference |
≥ 5 letters gain, n (%) | 214 (79.0) | 220 (79.7) | 225 (81.5) | 219 (81.7) | 227 (77.5) | 218 (78.1) |
Difference in proportions,c % (95% CI) | –2.5 (–9.1 to 4.1) | –2.0 (–8.5 to 4.5) | Reference | 3.8 (–2.7 to 10.3) | –0.7 (–7.3 to 5.9) | Reference |
≥ 0 letters gain, n (%) | 248 (91.5) | 261 (94.6) | 252 (91.3) | 247 (92.2) | 267 (91.1) | 255 (91.4) |
Difference in proportions,c % (95% CI) | 0.1 (–4.6 to 4.8) | 3.3 (–1.0 to 7.5) | Reference | 0.7 (–3.8 to 5.2) | –0.3 (–4.9 to 4.2) | Reference |
Proportion of patients avoiding loss of ≥ 15, ≥ 10, or ≥ 5 ETDRS letter in BCVA from baseline averaged over weeks 48, 52, and 56 (ITT population, CMH method) | ||||||
Number of patients contributing to the analysis | 271 | 276 | 276 | 268 | 293 | 279 |
Avoid ≥ 15 letters loss, n (%) | 266 (98.2) | 272 (98.6) | 273 (98.9) | 265 (98.9) | 289 (98.6) | 275 (98.6) |
Difference in proportions,c % (95% CI) | –0.8 (–2.8 to 1.3) | –0.3 (–2.2 to 1.5) | Reference | 0.3 (–1.6 to 2.1) | 0.0 (–1.8 to 1.9) | Reference |
Avoid ≥ 10 letters loss, n (%) | 261 (96.3) | 271 (98.2) | 271 (98.2) | 263 (98.1) | 287 (98.0) | 274 (98.2) |
Difference in proportions,c % (95% CI) | –1.8 (–4.6 to 0.9) | 0.0 (–2.2 to 2.2) | Reference | –0.1 (–2.3 to 2.1) | –0.3 (–2.4 to 1.9) | Reference |
Avoid ≥ 5 letters loss, n (%) | 258 (95.2) | 267 (96.7) | 266 (96.4) | 259 (96.6) | 284 (96.9) | 266 (95.3) |
Difference in proportions,c % (95% CI) | –1.1 (–4.5 to 2.2) | 0.4 (–2.6 to 3.4) | Reference | 1.3 (–1.9 to 4.5) | 1.6 (–1.5 to 4.6) | Reference |
Proportion of patients gaining ≥ 15 letters or achieving a BCVA Snellen equivalent of 20/20 or better (BCVA ≥ 84 letters) in the study eye averaged over weeks 48, 52 and 56 (ITT population, CMH method) | ||||||
Number of patients contributing to the analysis | 271 | 276 | 276 | 268 | 294 | 279 |
≥ 15 letters gain or achieved 20/20 or better, n (%) | 87 (32.1) | 108 (39.1) | 102 (37.0) | 102 (38.1) | 95 (32.3) | 94 (33.7) |
Difference in proportions,c % (95% CI) | –4.9 (–12.6 to 2.9) | 2.0 (–5.9 to 9.8) | Reference | 4.8 (–3.1 to 12.7) | –1.3 (–8.8 to 6.2) | Reference |
BCVA = best corrected visual acuity; CI = confidence interval; CMH = Cochran-Mantel-Haenszel; ETDRS = Early Treatment Diabetic Retinopathy Study; ITT = intention-to-treat; MMRM = mixed model repeated measures; PTI = personalized treatment interval (from every 4 weeks up to every 16 weeks); q.8.w. = every 8 weeks; SE = standard error.
aAdjusted mean. The primary end point was analyzed using MMRM, with the change from baseline in BCVA as the dependent variable. The model was adjusted for categorical covariates of treatment group, visit, visit-by-treatment-group interaction, baseline BCVA (continuous), as well as randomization stratification factors as fixed effects (day 1 BCVA ETDRS letter score [64 letters or better vs. 63 letters or worse], prior IVT anti-VEGF therapy [yes vs. no], and region [US and Canada, Asia, and the rest of the world]).
bP value estimate was not adjusted for multiple testing. It does not account for the failure to meet superiority in previous testing in the treatment-naive population.
cCMH weighted estimate. The observed proportions and the differences in observed proportions were obtained by applying CMH weight, stratified by randomization stratification factors: day 1 BCVA ETDRS letter score (64 letters or better vs. 63 letters or worse), prior IVT anti-VEGF therapy (yes vs. no), and region (US and Canada, Asia, and the rest of the world).
Sources: YOSEMITE Primary and Final Clinical Study Reports,9,10 RHINE Primary and Updated Clinical Study Reports.11,12
Efficacy
Only efficacy outcomes and analyses of subgroups identified in the review protocol are reported here. Refer to Appendix 3 for further details on efficacy data.
Change From Baseline in Visual Acuity
Change From Baseline in BCVA (Primary End Point)
For the change from baseline in BCVA averaged over weeks 48, 52, and 56, the mean difference in ETDRS letters between the 8-week faricimab arm and the aflibercept arm was –0.2 (97.5% CI, –2.0 to 1.6) letters and between the PTI faricimab arm and the aflibercept arm was 0.7 (97.5% CI, –1.1 to 2.5) letters in YOSEMITE, and in RHINE was 1.5 (97.5% CI, –0.1 to 3.2) letters and 0.5 (97.5% CI, –1.1 to 2.1) letters, respectively (Table 12), both of which met the primary end point of noninferiority (ITT population). Superiority for the primary end point was not met in either study; the mean change from baseline in BCVA averaged over weeks 48, 52, and 56 in the 8-week faricimab arm was not superior to that in the aflibercept arm, nor was the mean change in the PTI faricimab arm.
Similar results were found in the analysis of the treatment-naive population (Table 12). Results of a supplementary analysis of the per-protocol population aligned with the ITT analysis (Table 12). Results of the sensitivity analysis and other supplementary analyses were also consistent with the primary analysis (Table 31 in Appendix 3).
Pre-specified subgroup analyses for baseline BCVA (≥ 64 ETDRS letters and ≤ 63 ETDRS letters), baseline hemoglobin A1C (≤ 8% and > 8%), prior anti-VEGF use (yes or no), and baseline DRS (< 47, 47 to 53, and > 53 ETDRS DRSS) were mostly consistent with overall study population results for the change from baseline BCVA averaged over weeks 48, 52, and 56 between the faricimab arms (8-week and PTI) and the aflibercept arm, as outlined in Table 32, Table 33, Table 34, and Table 35 in Appendix 3. However, in the subgroup of patients with hemoglobin A1C levels above 8% for the mean difference in ETDRS letters between the 8-week faricimab arm and the aflibercept arm, the lower bound of the 95% CI extended beyond the noninferiority threshold in the YOSEMITE study (–1.7 [95% CI, –5.0 to 1.5] letters) (Table 33).
Changes from baseline in BCVA were comparable in the 2 faricimab arms (8-week and PTI) and the aflibercept arm through week 100 in both studies, as shown in Figure 11 and Figure 12 in Appendix 3. For the change from baseline BCVA averaged over weeks 92, 96, and 100, the mean difference in ETDRS letters between the 8-week faricimab arm and the aflibercept arm was –0.7 (95% CI, –2.6 to 1.2) letters and between the PTI faricimab arm and the aflibercept arm was –0.7 (95% CI, –2.5 to 1.2) letters in YOSEMITE; in RHINE, the mean differences were 1.5 (95% CI, –0.5 to 3.6) letters and 0.7 (95% CI, –1.3 to 2.7) letters, respectively (Table 12).
Proportion of Patients Gaining or Avoiding Loss of 15, 10, 5, or 0 ETDRS Letters or more in BCVA From Baseline
The between-group differences in the adjusted proportion of patients who gained 15 or more ETDRS letters in BCVA from baseline over weeks 48, 52, and 56 between the 8-week faricimab arm and the aflibercept arm was –2.6% (95% CI, –0.0% to 4.9%) and between the PTI faricimab arm and the aflibercept arm was 3.5% (95% CI, –4.0% to 11.1%) in YOSEMITE; in RHINE, the differences were 3.5% (95% CI, –4.0% to 11.1%) and –2.0% (95% CI, –9.1% to 5.2%), respectively (Table 12).
Most patients (> 95%) across treatment arms avoided a loss of 15 or more ETDRS letters in BCVA from baseline during the studies. The between-group differences in the adjusted proportion of patients who avoided a loss of 15 or more ETDRS letters in BCVA from baseline over weeks 48, 52, and 56 between the 8-week faricimab arm and the aflibercept arm was –0.8% (95% CI, –2.8% to 1.3%) and between the PTI faricimab arm and the aflibercept arm was –0.3% (95% CI, –2.2% to 1.5%) in YOSEMITE; in RHINE, the differences were 0.3% (95% CI, –1.6% to 2.1%) and 0.0% (95% CI, –1.8% to 1.9%), respectively (Table 12).
Comparable results were seen in all 3 treatment arms for patients gaining 10 or more, 5 or more, or more than 0 letters in BCVA from baseline, and for patients avoiding a loss of 10 or more or 5 or more letters in both studies (Table 12).
Proportion of Patients Gaining 15 or More ETDRS Letters in BCVA or Achieving a BCVA Snellen Equivalent of 20/20 or Better From Baseline
Results for the proportion of patients either gaining 15 or more letters or achieving a BCVA Snellen equivalent of 20/20 or better (BCVA ≥ 84 letters) were also comparable across treatment arms in both studies (Table 12).
Results at year 2 were mostly consistent with those at year 1 for the BCVA outcomes (Table 12 and, in Appendix 3, Table 36, Figure 11, and Figure 12), except in RHINE, the adjusted proportion of patients who gained at least 15 ETDRS letters in BCVA from baseline was numerically lower in the PTI faricimab arm than in the aflibercept arm (–8.0%; 95% CI, –15.7% to –0.3%), and the proportion of patients who gained at least 15 ETDRS letters in BCVA or achieved a BCVA Snellen equivalent of 20/20 or better from baseline averaged over weeks 92, 96, and 100 was numerically lower in the faricimab PTI arm than in the aflibercept arm (–9.0%; 95% CI, –16.8% to –1.1%) (Table 36 in Appendix 3).
Change in CRT
Change in CST From Baseline
In both YOSEMITE and RHINE, reductions in CST (ILM-BM) from baseline to weeks 48, 52, and 56 were numerically greater in the faricimab arms (8-week and PTI) than in the aflibercept arm. The difference in the adjusted mean change from baseline in CST averaged over weeks 48, 52, and 56 between the 8-week faricimab arm and the aflibercept arm was –36.2 µm (95% CI, –47.8 µm to –24.7 µm) and between the PTI faricimab arm and the aflibercept arm was –26.2 µm (95% CI, –37.7 µm to –14.7 µm) in YOSEMITE; in RHINE, the differences were –25.7 µm (95% CI, –37.4 µm to –14.0 µm) and –17.6 µm (95% CI, –29.2 µm to –6.0 µm), respectively (Table 13). These differences between each faricimab treatment arm and the aflibercept arm were smaller at year 2 (Table 13).
Absence of DME (CST < 325 µm)
The proportion of patients with an absence of DME (CST < 325 µm for Spectralis SD-OCT) averaged over weeks 48, 52, and 56 was numerically higher in the 8-week faricimab arm than in the aflibercept arm, with a difference in the adjusted proportion of 16.0% (95% CI, 8.9% to 23.1%), and in the PTI faricimab arm than in the aflibercept arm, with a difference in the adjusted proportion of 12.7% (95% CI, 5.4% to 20.0%) in YOSEMITE; in RHINE, the differences were 12.3% (95% CI, 5.7% to 18.9%) and 8.2% (95% CI, 1.5% to 14.9%), respectively. These differences in the proportion of patients with an absence of DME between the faricimab treatment arms and the aflibercept arm were smaller at year 2 (Table 13).
Frequency of Injection
In YOSEMITE, the proportion of patients in the faricimab PTI arm on a 4-, 8-, 12-, and 16-week treatment interval at week 52, a secondary outcome, was 10.8%, 15.4%, 21.0%, and 52.8%, respectively; in RHINE, the proportions were 13.3%, 15.6%, 20.1%, and 51.0%, respectively (Table 14). An analysis of the number of patients in the PTI faricimab arm on 4-, 8-, 12-, and 16-week dosing at each monthly visit through week 52, prepared by FDA statistical reviewers, is presented in Figure 13 in Appendix 3.
Table 13: Change From Baseline in CST (ILM-BM) at 1 and 2 Years (ITT Population)
Change in CST | YOSEMITE | RHINE | ||||
|---|---|---|---|---|---|---|
Faricimab 6 mg q.8.w., N = 315 | Faricimab 6 mg PTI, N = 313 | Aflibercept 2 mg q.8.w., N = 312 | Faricimab 6 mg q.8.w., N = 317 | Faricimab 6 mg PTI, N = 319 | Aflibercept 2 mg q.8.w., N = 315 | |
Change from baseline in CST (ILM-BM) in the study eye, MMRM approach | ||||||
Weeks 48, 52 and 56, averaged | ||||||
Number of patients contributing to the analysis | 271 | 275 | 272 | 265 | 291 | 276 |
Change from baseline in CST, µm, meana (SE) | –206.6 (4.15) | –196.5 (4.13) | –170.3 (4.16) | –195.8 (4.22) | –187.6 (4.12) | –170.1 (4.19) |
Difference in means,a µm (95% CI) | –36.2 (–47.8 to –24.7) | –26.2 (–37.7 to –14.7) | Reference | –25.7 (–37.4 to –14.0) | –17.6 (–29.2 to –6.0) | Reference |
Weeks 92, 96, and 100, averaged | ||||||
Number of patients contributing to the analysis | 260 | 269 | 256 | 255 | 279 | 252 |
Change from baseline in CST, µm, meana (SE) | –216.0 (4.08) | –204.5 (4.04) | –196.3 (4.09) | –202.6 (4.29) | –197.1 (4.18) | –185.6 (4.30) |
Difference in means,a µm (95% CI) | –19.7 (–31.1 to –8.3) | –8.2 (–19.5 to 3.1) | Reference | –17.0 (–29.0 to –5.1) | –11.5 (–23.3 to 0.3) | Reference |
Proportion of patients with absence of DME (CST < 325 µm for Spectralis SD-OCT), CMH method | ||||||
Weeks 48, 52 and 56 (averaged) | ||||||
Number of patients contributing to the analysis | 272 | 276 | 275 | 268 | 294 | 279 |
Absence of DME, n (%) | 221 (81.3) | 215 (77.9) | 179 (65.1) | 229 (85.4) | 240 (81.6) | 204 (73.1) |
Difference in proportions,b % (95% CI) | 16.0 (8.9 to 23.1) | 12.7 (5.4 to 20.0) | Reference | 12.3 (5.7 to 18.9) | 8.2 (1.5 to 14.9) | Reference |
Weeks 92, 96, and 100, averaged | ||||||
Number of patients contributing to the analysis | 261 | 270 | 259 | 258 | 282 | 254 |
Absence of DME, n (%) | 228 (87.4) | 229 (84.8) | 204 (78.8) | 231 (89.5) | 236 (83.7) | 200 (78.7) |
Difference in proportions,b % (95% CI) | 8.3 (1.9 to 14.6) | 6.2 (–0.3 to 12.6) | Reference | 10.6 (4.5 to 16.8) | 4.7 (–1.8 to 11.3) | Reference |
CI = confidence interval; CMH = Cochran-Mantel-Haenszel; CST = central subfield thickness; DME = diabetic macular edema; ILM-BM = distance between internal limiting membrane and Bruch's membrane; ITT = intention-to-treat; MMRM = mixed model repeated measures; PTI = personalized treatment interval (from every 4 weeks up to every 16 weeks); q.8.w. = every 8 weeks; SE = standard error.
Note: Bolded numbers indicate that the 95% CI excludes the null value.
aAdjusted mean. The primary end point was analyzed using MMRM, with the change from baseline in BCVA as the dependent variable. The model was adjusted for categorical covariates of treatment group, visit, visit-by-treatment-group interaction, baseline BCVA (continuous), as well as randomization stratification factors as fixed effects (day 1 BCVA ETDRS letter score [64 letters or better vs. 63 letters or worse], prior IVT anti-VEGF therapy [yes vs. no], and region [US and Canada, Asia, and the rest of the world]).
bCMH weighted estimate. The observed proportions and the differences in observed proportions were obtained by applying CMH weight, stratified by randomization stratification factors: day 1 BCVA ETDRS letter score (64 letters or better vs. 63 letters or worse), prior IVT anti-VEGF therapy (yes vs. no), and region (US and Canada, Asia, and the rest of the world).
Sources: YOSEMITE Primary and Final Clinical Study Reports,9,10 RHINE Primary and Updated Clinical Study Reports.11,12
Table 14: Frequency of Injection Outcomes (ITT Population)
Injection outcome | YOSEMITE, Faricimab 6 mg PTI, N = 313 | RHINE, Faricimab 6 mg PTI, N = 319 |
|---|---|---|
Week 52 | ||
Number of patients contributing to the analysis | 286 | 308 |
q.4.w. proportion, % (95% CI) | 10.8 (7.2 to 14.4) | 13.3 (9.5 to 17.1) |
q.8.w. proportion, % (95% CI) | 15.4 (11.2 to 19.6) | 15.6 (11.5 to 19.6) |
q.12.w. proportion, % (95% CI) | 21.0 (16.3 to 25.7) | 20.1 (15.6 to 24.6) |
q.16.w. proportion, % (95% CI) | 52.8 (47.0 to 58.6) | 51.0 (45.4 to 56.6) |
Week 96 | ||
Number of patients contributing to the analysis | 270 | 287 |
q.4.w. proportion, % (95% CI) | 7.0 (4.0 to 10.1) | 10.1 (6.6 to 13.6) |
q.8.w. proportion, % (95% CI) | 14.8 (10.6 to 19.1) | 11.8 (8.1 to 15.6) |
q.12.w. proportion, % (95% CI) | 18.1 (13.5 to 22.8) | 13.6 (9.6 to 17.6) |
q.16.w. proportion, % (95% CI) | 60.0 (54.1 to 65.9) | 64.5 (58.9 to 70.0) |
CI = confidence interval; ITT = intention-to-treat; PTI = personalized treatment interval (from every 4 weeks up to every 16 weeks); q.4.w. = every 4 weeks; q.8.w. = every 8 weeks; q.12.w. = every 12 weeks; q.16.w. = every 16 weeks.
Sources: YOSEMITE Primary and Final Clinical Study Reports,9,10 RHINE Primary and Updated Clinical Study Reports.11,12
At week 96, the proportion of patients in the PTI faricimab arm on a 4-, 8-, 12-, and 16-week treatment interval was 7.0%, 14.8%, 18.1%, and 60.0%, respectively, in YOSEMITE; in RHINE, the proportions were 10.1%, 11.8%, 13.6%, and 64.5%, respectively (Table 14).
Results are descriptive and between-group analyses were not reported in either study.
HRQoL and Vision-Related Function
Change From Baseline in NEI VFQ-25 Composite Score
Mean changes from baseline in the NEI VFQ-25 composite score at week 24, week 52, and week 100 were comparable in all treatment arms in both studies (Table 15). At week 52, the difference in the adjusted mean change from baseline in NEI VFQ-25 composite score between the 8-week faricimab arm and the aflibercept arm was –0.2 (95% CI, –2.1 to 1.7) points and between the PTI faricimab arm and the aflibercept arm was 0.5 (95% CI, –1.5 to 2.4) points in YOSEMITE; in RHINE, the differences were –0.8 (95% CI, –2.7 to 1.1) points and –1.0 (95% CI, –2.9 to 0.8) points, respectively (Table 15).
Proportion of Patients With a 4-Point or More Improvement From Baseline in NEI VFQ-25 Composite Score
The proportion of patients with an improvement of 4 points or more from baseline in NEI VFQ-25 composite score was an exploratory outcome and only descriptive results were reported. As summarized in Table 15 at week 24, around half of the patients (from 46.0% to 52.5% per arm) in all treatment groups had an improvement of 4 points or more from baseline in NEI VFQ-25 composite score in both studies.
Change From Baseline in the NEI VFQ-25 Near Activities, Distance Activities, and Driving Subscales Over Time
Change from baseline in the NEI VFQ-25 Near Activities, Distance Activities, and Driving Subscales over time was an exploratory outcome and results were only analyzed descriptively. Generally, the descriptive results for the subscales were consistent with findings for the NEI VFQ-25 composite score and are not presented in this report.
Proportion of Patients With a BCVA Snellen Equivalent of 20/40 or Better (Vision Standard for Driving in Most US States)
In both studies, a comparable proportion of patients had a BCVA Snellen equivalent of 20/40 or better (BCVA ≥ 69 letters) averaged at week 48, 52, and 56, with a difference in the adjusted proportion between the 8-week faricimab arm and the aflibercept arm of –3.2% (95% CI, –10.2% to 3.8%) and a difference between the PTI faricimab arm and the aflibercept arm of 2.4% (95% CI, –4.3% to 9.2%) in YOSEMITE; in RHINE, the differences were 4.7% (95% CI, –2.4% to 11.8%) and 2.8% (95% CI, –4.1% to 9.8%), respectively (Table 15). Results at weeks 92, 96, and 100 were consistent with year 1 results (Table 15).
Proportion of Patients With a BCVA Snellen Equivalent of 20/200 or Worse (Legal Blindness)
The number of patients progressing to legal blindness (BCVA Snellen equivalent of 20/200 or worse [BCVA ETDRS ≤ 38 letters]) was small in all treatment arms in both studies (between 0 and 6 patients per arm), and the difference in the proportion of patients who progressed to legal blindness or worse was small (< 1%) between each faricimab arm and the aflibercept arm in both studies at 1 and 2 years (Table 15).
Table 15: NEI VFQ-25 and Other Vision Function Outcomes (ITT Population)
Vison function outcome | YOSEMITE | RHINE | ||||
|---|---|---|---|---|---|---|
Faricimab 6 mg q.8.w., N = 315 | Faricimab 6 mg PTI, N = 313 | Aflibercept 2 mg q.8.w., N = 312 | Faricimab 6 mg q.8.w., N = 317 | Faricimab 6 mg PTI, N = 319 | Aflibercept 2 mg q.8.w., N = 315 | |
NEI VFQ-25 composite score | ||||||
Baseline: NEI VFQ-25 composite score | ||||||
Number of patients contributing to the analysis | 314 | 310 | 308 | 314 | 319 | 313 |
Mean (SE) | 72.6 (0.99) | 73.2 (1.03) | 74.5 (1.00) | 74.2 (1.02) | 74.6 (0.98) | 75.0 (1.04) |
Week 24: change from baseline in NEI VFQ-25 composite score | ||||||
Number of patients contributing to the analysis | 291 | 297 | 290 | 291 | 309 | 300 |
Change from baseline, mean pointsa (SE) | 6.0 (0.61) | 6.9 (0.61) | 6.0 (0.61) | 5.7 (0.59) | 6.5 (0.57) | 7.0 (0.58) |
Difference in means,a in letters (95% CI) | 0.1 (–1.6 to 1.8) | 1.0 (–0.7 to 2.7) | REF | –1.3 (–2.9 to 0.3) | –0.5 (–2.1 to 1.1) | REF |
Week 52: change from baseline in NEI VFQ-25 composite score | ||||||
Number of patients contributing to the analysis | 269 | 266 | 251 | 267 | 284 | 268 |
Change from baseline, mean pointsa (SE) | 7.3 (0.68) | 7.9 (0.69) | 7.5 (0.70) | 6.8 (0.68) | 6.6 (0.66) | 7.6 (0.67) |
Difference in means,a in letters (95% CI) | –0.2 (–2.1 to 1.7) | 0.5 (–1.5 to 2.4) | REF | –0.8 (–2.7 to 1.1) | –1.0 (–2.9 to 0.8) | REF |
Week 100: change from baseline in NEI VFQ-25 composite score | ||||||
Number of patients contributing to the analysis | 256 | 255 | 246 | 251 | 271 | 234 |
Change from baseline, mean pointsa (SE) | 8.0 (0.72) | 7.4 (0.72) | 7.6 (0.73) | 8.8 (0.75) | 7.3 (0.73) | 6.9 (0.77) |
Difference in means,a in letters (95% CI) | 0.5 (–1.6 to 2.5) | –0.2 (–2.2 to 1.9) | REF | 1.9 (–0.2 to 4.0) | 0.4 (–1.7 to 2.5) | REF |
Proportion of patients with ≥ 4-point improvement from baseline in NEI VFQ-25 composite score over time, descriptive summary | ||||||
Week 24 | ||||||
Number of patients contributing to the analysis | 291 | 297 | 290 | 291 | 309 | 300 |
≥ 4-point gain, n (%) | 151 (51.9) | 156 (52.5) | 145 (50.0) | 134 (46.0) | 161 (52.1) | 142 (47.3) |
Difference in proportions, % (95% CI) | 1.9 (–6.3 to 10.0) | 2.5 (–5.6 to 10.6) | REF | –1.3 (–9.3 to 6.8) | 4.8 (–3.2 to 12.7) | REF |
Week 52 | ||||||
Number of patients contributing to the analysis | 269 | 266 | 251 | 267 | 284 | 268 |
≥ 4-point gain, n (%) | 156 (58.0) | 161 (60.5) | 143 (57.0) | 139 (52.1) | 147 (51.8) | 135 (50.4) |
Difference in proportions, % (95% CI) | 1.0 (–7.5 to 9.5) | 3.6 (–4.9 to 12.1) | REF | 1.7 (–6.8 to 10.2) | 1.4 (–7.0 to 9.7) | REF |
Week 100 | ||||||
Number of patients contributing to the analysis | 256 | 255 | 246 | 251 | 271 | 234 |
≥ 4-point gain, n (%) | 146 (57.0) | 145 (56.9) | 137 (55.7) | 149 (59.4) | 158 (58.3) | 127 (54.3) |
Difference in proportions, % (95% CI) | 1.3 (–7.4 to 10.0) | 1.2 (–7.5 to 9.9) | REF | 5.1 (–3.7 to 13.9) | 4.0 (–4.7 to 12.7) | REF |
Proportion of patients with a BCVA Snellen equivalent of 20/40 (BCVA ETDRS ≥ 69 letters) or better (vision standard for driving in most US states) | ||||||
Weeks 48, 52 and 56, averaged | ||||||
Number of patients contributing to the analysis | 271 | 276 | 276 | 268 | 293 | 279 |
BCVA Snellen equivalent of 20/40 or better, n (%) | 195 (72.0) | 213 (77.2) | 206 (74.6) | 196 (73.1) | 210 (71.7) | 192 (68.8) |
Difference in proportions,b % (95% CI) | –3.2 (–10.2 to 3.8) | 2.4 (–4.3 to 9.2) | Reference | 4.7 (–2.4 to 11.8) | 2.8 (–4.1 to 9.8) | Reference |
Weeks 92, 96, and 100, averaged | ||||||
Number of patients contributing to the analysis | 262 | 270 | 259 | 259 | 282 | 254 |
BCVA Snellen equivalent of 20/40 or better, n (%) | 194 (74.0) | 199 (73.7) | 195 (75.3) | 191 (73.7) | 201 (71.3) | 185 (72.8) |
Difference in proportions,b % (95% CI) | –2.0 (–9.1 to 5.2) | –2.1 (–9.2 to 5.0) | Reference | 0.9 (–6.5 to 8.3) | –2.0 (–9.2 to 5.2) | Reference |
Proportion of patients with a BCVA Snellen equivalent of 20/200 (BCVA ETDRS ≤ 38 letters) or worse (legal blindness) | ||||||
Weeks 48, 52 and 56, averaged | ||||||
Number of patients contributing to the analysis | 271 | 276 | 276 | 268 | 294 | 279 |
BCVA Snellen equivalent of 20/200 or worse, n (%) | 6 (2.2) | 5 (1.8) | 5 (1.8) | 2 (0.7) | 0 (0.0) | 2 (0.7) |
Difference in proportions,b % (95% CI) | 0.6 (–1.8 to 2.9) | 0.0 (–2.2 to 2.3) | Reference | 0.1 (–1.4 to 1.5) | –0.7 (–1.6 to 0.2) | Reference |
Weeks 92, 96, and 100, averaged | ||||||
Number of patients contributing to the analysis | 262 | 270 | 259 | 260 | 283 | 254 |
BCVA Snellen equivalent of 20/200 or worse, n (%) | 5 (1.9) | 5 (1.9) | 4 (1.5) | 5 (1.9) | 6 (2.1) | 5 (2.0) |
Difference in proportions,b % (95% CI) | 0.4 (–1.9 to 2.7) | 0.4 (–1.9 to 2.6) | Reference | 0.0 (–2.4 to 2.3) | 0.2 (–2.2 to 2.6) | Reference |
BCVA = best corrected visual acuity; CI = confidence interval; ETDRS = Early Treatment Diabetic Retinopathy Study; ITT = intention-to-treat; NEI VFQ-25 = National Eye Institute Visual Functioning Questionnaire-25; PTI = personalized treatment interval (from every 4 weeks up to every 16 weeks); q.8.w. = every 8 weeks; SE = standard error.
aAdjusted mean. The primary end point was analyzed using MMRM, with the change from baseline in BCVA as the dependent variable. The model was adjusted for categorical covariates of treatment group, visit, visit-by-treatment-group interaction, baseline BCVA (continuous), as well as randomization stratification factors as fixed effects (day 1 BCVA ETDRS letter score [64 letters or better vs. 63 letters or worse], prior IVT anti-VEGF therapy [yes vs. no], and region [US and Canada, Asia, and the rest of the world]).
bCMH weighted estimate. The differences in observed proportions were obtained by applying CMH weight, stratified by randomization stratification factors: day 1 BCVA ETDRS letter score (64 letters or better vs. 63 letters or worse), prior IVT anti-VEGF therapy (yes vs. no), and region (US and Canada, Asia, and the rest of the world).
Sources: YOSEMITE Primary and Final Clinical Study Reports,9,10 RHINE Primary and Updated Clinical Study Reports.11,12
Intraretinal Fluid and/or Subretinal Fluid
Absence of IRF
Over the course of both studies, the proportion of patients with an absence of IRF in the ETDRS central subfield was numerically higher in the 8-week faricimab arm than in the aflibercept arm, with a difference in the adjusted proportion of 16.6% (95% CI, 8.7% to 24.5%) at week 52 and of 23.8% (95% CI, 15.1% to 32.4%) at week 100 in YOSEMITE; in RHINE, the differences were 10.7% (95% CI, 2.8% to 18.6%) at week 52 and 11.6% (95% CI, 2.7% to 20.4%) at week 100. The differences in the adjusted proportion of patients with an absence of IRF between the PTI faricimab arm and aflibercept arm were less pronounced, at 13.4% (95% CI, 5.4% to 21.3%) at week 52 and 6.9% (95% CI, –1.7% to 15.5%) at week 100 in YOSEMITE; in RHINE, the differences were 7.2% (95% CI, –0.5% to 14.9%) at week 52 and 7.0% (95% CI, –1.7% to 15.8%) at week 100 (Table 16).
Absence of SRF
In both studies, the proportion of patients with an absence of SRF in the ETDRS central subfield from baseline through week 100 was comparable in the 8-week faricimab arm, the PTI faricimab arm, and the aflibercept arm. At week 52, the difference in the adjusted proportion in patients without SRF between the 8-week faricimab arm and the aflibercept arm was –2.2% (95% CI, –5.2% to 0.8%) and between the PTI faricimab arm and the aflibercept arm was –2.5% (95% CI, –5.6% to 0.5%) in YOSEMITE; in RHINE, the differences were –3.1% (95% CI, –6.3% to 0.1%) and –2.0% (95% CI, –4.9% to 0.9%), respectively (Table 16).
Given the inconsistency between the results for absence of IRF and the results for absence of SRF individually, the proportion of patients with an absence of both IRF and SRF is not presented here.
Table 16: Proportion of Patients With an Absence of IRF or SRF Over Time (ITT Population, CMH Method)
Absence of IRF or SRF | YOSEMITE | RHINE | ||||
|---|---|---|---|---|---|---|
Faricimab 6 mg q.8.w., N = 315 | Faricimab 6 mg PTI, N = 313 | Aflibercept 2 mg q.8.w., N = 312 | Faricimab 6 mg q.8.w., N = 317 | Faricimab 6 mg PTI, N = 319 | Aflibercept 2 mg q.8.w., N = 315 | |
Proportion of patients with absence of IRF (ITT population, CMH method) | ||||||
Baseline | ||||||
Number of patients contributing to the analysis | 314 | 309 | 305 | 315 | 316 | 312 |
IRF absent, n (%) | 4 (1.3) | 6 (1.9) | 4 (1.3) | 4 (1.3) | 1 (0.3) | 2 (0.6) |
Week 48 | ||||||
Number of patients contributing to the analysis | 262 | 261 | 263 | 246 | 276 | 269 |
IRF absent, n (%) | 120 (45.8) | 87 (33.3) | 57 (21.7) | 101 (41.1) | 90 (32.6) | 61 (22.7) |
Difference in proportions,a % (95% CI) | 23.7 (15.9 to 31.4) | 11.4 (3.9 to 19.0) | Reference | 18.4 (10.6 to 26.2) | 9.4 (2.0 to 16.7) | Reference |
Week 52 | ||||||
Number of patients contributing to the analysis | 262 | 261 | 249 | 262 | 280 | 269 |
IRF absent, n (%) | 111 (42.4) | 101 (38.7) | 63 (25.3) | 103 (39.3) | 101 (36.1) | 77 (28.6) |
Difference in proportions,a % (95% CI) | 16.6 (8.7 to 24.5) | 13.4 (5.4 to 21.3) | Reference | 10.7 (2.8 to 18.6) | 7.2 (–0.5 to 14.9) | Reference |
Week 56 | ||||||
Number of patients contributing to the analysis | 254 | 256 | 254 | 260 | 277 | 258 |
IRF absent,a n (%) | 126 (49.6) | 109 (42.6) | 60 (23.6) | 111 (42.7) | 111 (40.1) | 71 (27.5) |
Difference in proportions,a % (95% CI) | 25.6 (17.7 to 33.6) | 19.2 (11.3 to 27.1) | Reference | 15.1 (7.2 to 23.1) | 12.3 (4.4 to 20.1) | Reference |
Week 92 | ||||||
Number of patients contributing to the analysis | 242 | 251 | 241 | 240 | 259 | 234 |
IRF absent, n (%) | 142 (58.7) | 109 (43.4) | 81 (33.6) | 135 (56.3) | 117 (45.2) | 92 (39.3) |
Difference in proportions,a % (95% CI) | 25.2 (16.7 to 33.7) | 9.9 (1.5 to 18.4) | Reference | 16.7 (8.0 to 25.5) | 5.6 (–3.0 to 14.2) | Reference |
Week 96 | ||||||
Number of patients contributing to the analysis | 232 | 254 | 241 | 239 | 256 | 231 |
IRF absent, n (%) | 147 (63.4) | 121 (47.6) | 84 (34.9) | 149 (62.3) | 122 (47.7) | 90 (39.0) |
Difference in proportions,a % (95% CI) | 28.5 (19.9 to 37.0) | 12.8 (4.3 to 21.3) | Reference | 23.3 (14.6 to 32.0) | 8.5 (–0.2 to 17.2) | Reference |
Week 100 | ||||||
Number of patients contributing to the analysis | 238 | 251 | 237 | 238 | 261 | 229 |
IRF absent, n (%) | 147 (61.8) | 112 (44.6) | 90 (38.0) | 135 (56.7) | 137 (52.5) | 103 (45.0) |
Difference in proportions,a % (95% CI) | 23.8 (15.1 to 32.4) | 6.9 (–1.7 to 15.5) | Reference | 11.6 (2.7 to 20.4) | 7.0 (–1.7 to 15.8) | Reference |
Proportion of patients with absence of SRF (ITT population, CMH method) | ||||||
Baseline | ||||||
Number of patients contributing to the analysis | 314 | 309 | 305 | 315 | 315 | 311 |
IRF absent, n (%) | 197 (62.7) | 188 (60.8) | 188 (61.6) | 218 (69.2) | 201 (63.8) | 196 (63.0) |
Week 48 | ||||||
Number of patients contributing to the analysis | 263 | 266 | 261 | 251 | 280 | 272 |
SRF absent, n (%) | 255 (97.0) | 254 (95.5) | 251 (96.2) | 244 (97.2) | 268 (95.7) | 259 (95.2) |
Difference in proportions,a % (95% CI) | 0.8 (–2.2 to 3.9) | –0.7 (–4.0 to 2.7) | Reference | 1.9 (–1.3 to 5.1) | 0.5 (–2.9 to 3.9) | Reference |
Week 52 | ||||||
Number of patients contributing to the analysis | 263 | 264 | 252 | 267 | 281 | 271 |
SRF absent, n (%) | 252 (95.8) | 252 (95.5) | 247 (98.0) | 253 (94.8) | 269 (95.7) | 265 (97.8) |
Difference in proportions,a % (95% CI) | –2.2 (–5.2 to 0.8) | –2.5 (–5.6 to 0.5) | Reference | –3.1 (–6.3 to 0.1) | –2.0 (–4.9 to 0.9) | Reference |
Week 56 | ||||||
Number of patients contributing to the analysis | 258 | 260 | 255 | 266 | 283 | 263 |
SRF absent, n (%) | 250 (96.9) | 252 (96.9) | 248 (97.3) | 258 (97.0) | 271 (95.8) | 252 (95.8) |
Difference in proportions,a % (95% CI) | –0.3 (–3.1 to 2.5) | –0.2 (–3.1 to 2.6) | Reference | 1.2% (–1.9 to 4.3) | 0.0 (–3.3 to 3.2) | Reference |
Week 92 | ||||||
Number of patients contributing to the analysis | 246 | 255 | 243 | 245 | 264 | 241 |
SRF absent, n (%) | 234 (95.1) | 241 (94.5) | 235 (96.7) | 233 (95.1) | 254 (96.2) | 231 (95.9) |
Difference in proportions,a % (95% CI) | –1.9 (–5.5 to 1.7) | –2.3 (–5.8 to 1.3) | Reference | –0.9 (–4.6 to 2.7) | 0.3 (–3.1 to 3.6) | Reference |
Week 96 | ||||||
Number of patients contributing to the analysis | 237 | 256 | 242 | 244 | 263 | 238 |
SRF absent, n (%) | 230 (97.0) | 241 (94.1) | 234 (96.7) | 235 (96.3) | 254 (96.6) | 229 (96.2) |
Difference in proportions,a % (95% CI) | 0.3 (–2.8 to 3.4) | –2.6 (–6.2 to 1.0) | Reference | 0.1 (–3.2 to 3.5) | 0.4 (–2.8 to 3.7) | Reference |
Week 100 | ||||||
Number of patients contributing to the analysis | 246 | 257 | 244 | 247 | 266 | 233 |
SRF absent, n (%) | 232 (94.3) | 250 (97.3) | 237 (97.1) | 237 (96.0) | 256 (96.2) | 223 (95.7) |
Difference in proportions,a % (95% CI) | –2.8 (–6.4 to 0.7) | 0.2 (–2.7 to 3.1) | Reference | 0.1 (–3.4 to 3.5) | 0.5 (–2.9 to 3.9) | Reference |
CI = confidence interval; CMH = Cochran-Mantel-Haenszel; IRF = intraretinal fluid; ITT = intention-to-treat; PTI = personalized treatment interval (from every 4 weeks up to every 16 weeks); q.8.w. = every 8 weeks; SRF = subretinal fluid.
aCMH weighted estimate. The differences in observed proportions were obtained by applying CMH weight, stratified by randomization stratification factors: day 1 BCVA ETDRS letter score (64 letters or better vs. 63 letters or worse), prior IVT anti-VEGF therapy (yes vs. no), and region (US and Canada, Asia, and the rest of the world). Note: Bolded numbers indicate that the 95% CI excludes the null value.
Sources: YOSEMITE Final Clinical Study Reports,10 RHINE Updated Clinical Study Reports.12
Change From Baseline in DRS
Proportion of Patients With a DRS Improvement of 2 Steps or More From Baseline on the ETDRS DRSS
There were conflicting results between YOSEMITE and RHINE in the proportion of patients with a change of 2 steps or more on the ETDRS DRSS from baseline at week 52, the key secondary end point in the studies. In YOSEMITE, noninferiority for this end point was met, with the difference in the adjusted proportion between the 8-week faricimab arm and the aflibercept arm at week 52 of 10.2% (97.5% CI, 0.3% to 20.0%) and between the PTI faricimab arm and the aflibercept arm of 6.1% (97.5% CI, –3.6% to 15.8%). However, in RHINE, noninferiority was not met for this outcome, as the lower bound of the 97.5% CI for the difference in the adjusted proportion between the faricimab and aflibercept arms was less than –10% for both the 8-week faricimab arm and the PTI faricimab arm at week 52, at –2.6% (97.5% CI, –12.6% to 7.4%) and –3.5% (97.5% CI, –13.4% to 6.3%), respectively. Similar results were found in each study for the per-protocol and treatment-naive populations, with noninferiority not being met in the RHINE study for these populations for the difference in the adjusted proportion between either the 8-week faricimab arm or the PTI faricimab arm and the aflibercept arm (Table 17).
At week 96, there was a generally comparable proportion of patients in the 8-week faricimab arm, the PTI faricimab arm, and the aflibercept arm in both studies who achieved an improvement of 2 steps or more on the ETDRS DRSS from baseline (Table 17).
Proportion of Patients With a DRS Improvement of 3 Steps or More From Baseline on the ETDRS DRSS
At 52 weeks, a comparable proportion of patients in the 3 treatment arms achieved an improvement of 3 steps or more on the ETDRS DRSS from baseline, with a difference in adjusted proportions between the 8-week faricimab arm and the aflibercept arm of 2.8% (95% CI, –3.5% to 9.1%) and between the PTI faricimab arm and the aflibercept arm of 0.8% (95%, –5.4% to 7.0%) in YOSEMITE; in RHINE, the differences were –3.0% (95% CI, –9.6% to 3.7%) and –0.4% (95% CI, –7.3% to 6.4%), respectively. Results were mostly consistent at week 96 in both studies (Table 17).
Proportion of Patients With a DRS Worsening of 2 or 3 Steps or More From Baseline on ETDRS DRSS Over Time
Very few patients in any treatment arm across both studies had a worsening of 2 steps or more on the ETDRS DRSS (< 1.5% at week 52 and < 2.5% at week 96 per treatment arm) or a worsening of 3 steps or more on the ETDRS DRSS (< 1% at week 52 and < 1.5% at week 96 per treatment arm). This outcome was exploratory and only descriptive results were provided.
Proportion of Patients Who Develop New PDR Over Time
Few patients who did not have PDR at baseline developed new PDR in the study eye over time (up to week 96) in the 2 studies (< 3% in any treatment arm). A comparable proportion of patients in the 8-week faricimab arm, the PTI faricimab arm, and the aflibercept arm had developed new PDR in YOSEMITE and RHINE at week 52 and week 96 (Table 17).
Table 17: Change in DRS From Baseline Over Time (CMH Method)
Change in DRS | YOSEMITE | RHINE | ||||
|---|---|---|---|---|---|---|
Faricimab 6 mg q.8.w., N = 315 | Faricimab 6 mg PTI, N = 313 | Aflibercept 2 mg q.8.w., N = 312 | Faricimab 6 mg q.8.w., N = 317 | Faricimab 6 mg PTI, N = 319 | Aflibercept 2 mg q.8.w., N = 315 | |
Proportion of patients with a ≥ 2-step DRS improvement from baseline on the ETDRS DRSS | ||||||
Week 52, ITT population | ||||||
Number of patients contributing to the analysis | 237 | 242 | 229 | 231 | 251 | 238 |
≥ 2-step DRSS improvement, n (%) | 108 (45.6) | 102 (42.1) | 84 (36.7) | 102 (44.2) | 109 (43.4) | 113 (47.5) |
Difference in proportions,a % (97.5% CI) | 10.2 (0.3 to 20.0) | 6.1 (–3.6 to 15.8) | Reference | –2.6 (–12.6 to 7.4) | –3.5 (–13.4 to 6.3) | Reference |
P value (CMH test for superiority)b | 0.0237 | 0.1677 | Reference | 0.5757 | 0.4293 | Reference |
Week 52, treatment-naive population | ||||||
Number of patients contributing to the analysis | 173 | 187 | 179 | 179 | 198 | 184 |
≥ 2-step DRSS improvement, n (%) | 86 (49.7) | 89 (47.6) | 77 (43.0) | 84 (46.9) | 90 (45.5) | 97 (52.7) |
Difference in proportions,a % (97.5% CI) | 7.2 (–4.6 to 18.9) | 4.8 (–6.7 to 16.3) | Reference | –5.4 (–16.9 to 6.1) | –6.9 (–18.3 to 4.4) | Reference |
P value (CMH test for superiority) | 0.1761 | 0.3539 | Reference | 0.3009 | 0.1735 | Reference |
Week 52, per-protocol population | ||||||
Number of patients contributing to the analysis | 215 | 226 | 211 | 215 | 233 | 224 |
≥ 2-step DRSS improvement, n (%) | 99 (46.0) | 97 (42.9) | 81 (38.4) | 98 (45.6) | 106 (45.5) | 106 (47.3) |
Difference in proportions,a % (97.5% CI) | 9.1 (–1.2 to 19.3) | 4.9 (–5.2 to 15.0) | Reference | –1.0 (–11.4 to 9.4) | –1.6 (–11.8 to 8.6) | Reference |
P value (CMH test for superiority) | 0.0545 | 0.2876 | Reference | 0.8309 | 0.7239 | Reference |
Week 96, ITT population | ||||||
Number of patients contributing to the analysis | 220 | 234 | 221 | 214 | 228 | 203 |
≥ 2-step DRSS improvement, n (%) | 112 (50.9) | 99 (42.3) | 95 (43.0) | 114 (53.3) | 101 (44.3) | 90 (44.3) |
Difference in proportions,a % (95% CI) | 9.1 (0.0 to 18.2) | 0.0 (–8.9 to 8.9) | Reference | 9.7 (0.4 to 19.1) | 0.3 (–8.9 to 9.5) | Reference |
Proportion of patients with a ≥ 3-step DRS improvement from baseline on the ETDRS DRSS, ITT population | ||||||
Week 52 | ||||||
Number of patients contributing to the analysis | 249 | 253 | 236 | 249 | 261 | 246 |
≥ 3-step DRSS improvement, n (%) | 41 (16.5) | 38 (15.0) | 35 (14.8) | 40 (16.1) | 50 (19.2) | 48 (19.5) |
Difference in proportions,a % (95% CI) | 2.8 (–3.5 to 9.1) | 0.8 (–5.4 to 7.0) | Reference | –3.0 (–9.6 to 3.7) | –0.4 (–7.3 to 6.4) | Reference |
Week 96 | ||||||
Number of patients contributing to the analysis | 220 | 234 | 221 | 214 | 228 | 203 |
≥ 3-step DRSS improvement, n (%) | 49 (22.3) | 34 (14.5) | 48 (21.7) | 53 (24.8) | 44 (19.3) | 45 (22.2) |
Difference in proportions,a % (95% CI) | 1.5 (–6.0 to 9.0) | –6.7 (–13.6 to 0.1) | Reference | 3.3 (–4.6 to 11.3) | –2.7 (–10.2 to 4.8) | Reference |
Proportion of patients who developed new PDRc over time, ITT Population | ||||||
Baseline | ||||||
Number of patients contributing to the analysis | 287 | 286 | 285 | 292 | 277 | 285 |
PDR, n (%) | 0 (0.0) | 0 (0.0) | 0 (0.0) | 0 (0.0) | 0 (0.0) | 0 (0.0) |
Week 52 | ||||||
Number of patients contributing to the analysis | 230 | 234 | 221 | 231 | 230 | 229 |
New PDR, n (%) | 2 (0.9) | 2 (0.9) | 1 (0.5) | 2 (0.9) | 2 (0.9) | 1 (0.4) |
Difference in proportions,a % (95% CI) | 0.4 (–1.1 to 1.9) | 0.4 (–1.1 to 1.9) | Reference | 0.3 (–1.0 to 1.7) | 0.5 (–1.0 to 1.9) | Reference |
Week 96 | ||||||
Number of patients contributing to the analysis | 208 | 216 | 208 | 198 | 206 | 192 |
New PDR, n (%) | 1 (0.5) | 3 (1.4) | 2 (1.0) | 0 (0.0) | 6 (2.9) | 3 (1.6) |
Difference in proportions,a % (95% CI) | –0.5 (–2.0 to 1.0) | 0.5 (–1.5 to 2.4) | Reference | –1.6 (–3.4 to 0.1) | 1.4 (–1.5 to 4.3) | Reference |
Proportion of patients who received vitrectomy in the study eye, descriptive summary, ITT population | ||||||
Number of patients contributing to the analysis | 315 | 313 | 312 | 317 | 319 | 315 |
Received vitrectomy, n (%) | 3 (1.0) | 4 (1.3) | 0 (0.0) | 1 (0.3) | 1 (0.3) | 2 (0.6) |
Difference in proportions, % (95% CI) | 1.0 (–0.1 to 2.0) | 1.3 (0.0 to 2.5) | Reference | –0.3 (–1.4 to 0.8) | –0.3 (–1.4 to 0.8) | Reference |
Proportion of patients who received PRP in the study eye, descriptive summary, ITT population | ||||||
Number of patients contributing to the analysis | 315 | 313 | 312 | 317 | 319 | 315 |
Received PRP, n (%) | 1 (0.3) | 2 (0.6) | 2 (0.6) | 2 (0.6) | 2 (0.6) | 1 (0.3) |
Difference in proportions, % (95% CI) | –0.3 (–1.4 to 0.8) | –0.0 (–1.3 to 1.3) | Reference | 0.3 (–0.8 to 1.4) | 0.3 (–0.8 to 1.4) | Reference |
CI = confidence interval; CMH = Cochran-Mantel-Haenszel; DRS = diabetic retinopathy severity; DRSS = Diabetic Retinopathy Severity Scale; ETDRS = Early Treatment Diabetic Retinopathy Study; ITT = intention-to-treat; PDR = proliferative diabetic retinopathy; PTI = personalized treatment interval (from every 4 weeks up to every 16 weeks); PRP = panretinal photocoagulation; q.8.w. = every 8 weeks; vs. = versus.
aThe differences in observed proportions were obtained by applying CMH weight, stratified by randomization stratification factors: day 1 baseline BCVA score (≥ 64 letters vs. ≤ 64 letters), prior IVT anti-VEGF therapy (yes vs. no), and region (US and Canada vs. the rest of the world). Asia and the rest of the world regions are combined due to a small number of enrolled patients.
bP value estimate was not adjusted for multiple testing. It does not account for the failure to meet superiority in treatment-naive population.
cNew PDR is defined as the achievement of an ETDRS DRSS score of 61 or greater in the assessment of 7-field colour fundus photography images using only patients who did not have PDR (DRSS score of 53 or better) at baseline.
Note: Bolded numbers indicate that the CI excludes the null value.
Sources: YOSEMITE Primary and Final Clinical Study Reports,9,10 RHINE Primary and Updated Clinical Study Reports.11,12
Proportion of Patients Who Received Vitrectomy or PRP During the Study
Few patients received vitrectomy or PRP in the study eye during the course of the study (less than 1.5% and 1.0% for each outcome, respectively, across all treatment arms). Both outcomes were exploratory and only descriptive results were presented (Table 17).
Harms
Only harms identified in the review protocol are reported here. Refer to Table 18 for detailed harms data.
Adverse Events
The proportion of patients reporting at least 1 ocular AE in the study eye during the study period was comparable across treatment arms in the YOSEMITE trial (47.0%, 46.6%, and 46.3% in the 8-week faricimab, PTI faricimab, and aflibercept arms, respectively). However, in the RHINE study, a higher proportion of patients in the 8-week faricimab arm and the PTI faricimab arm reported an ocular AE than in the aflibercept arm (52.4%, 51.7%, and 44.6%, respectively). The most common ocular AEs in both studies were cataract, conjunctival hemorrhage, vitreous detachment, vitreous floaters, elevated intraocular pressure, diabetic retinal edema, dry eye, eye pain, posterior capsule opacification, and punctate keratitis. In the RHINE study, conjunctivitis, blepharitis, cataract subcapsular, medication error, and DR were common ocular AEs (≥ 2% in any treatment arm). In the RHINE study, AEs likely contributing to the higher occurrence of ocular AEs in both faricimab arms than in the aflibercept arm include cataract, dry eye, and blepharitis. The frequency of cataract in the 8-week faricimab, PTI faricimab, and aflibercept arms, respectively, was 14.5%, 15.7%, and 9.9%; the frequency of dry eye was 5.7%, 6.0%, and 3.5%, respectively; and the frequency of blepharitis was 4.4%, 2.2%, 0.6%, respectively. The frequency (8-week faricimab, PTI faricimab, and aflibercept arms, respectively) of conjunctival hemorrhage (9.8%, 5.6%, and 6.7%), elevated intraocular pressure (5.7%, 3.8%, and 3.2%), vitreous floaters (5.0%, 2.2%, and 3.8%), subcapsular cataract (3.2%, 1.9%, and 1.3%), posterior capsule opacification (2.8%, 0.6%, and 0.6%), eye pruritis (1.6%, 0.6%, and 0.6%), and allergic conjunctivitis (1.6%, 0.3%, and 0.6%) was higher in the 8-week faricimab arm than in the aflibercept arm, which also contributed to the higher rate of ocular AEs in the 8-week faricimab arm in the RHINE study (Table 18).
In both the YOSEMITE and RHINE studies, A comparable proportion of patients reported at least 1 nonocular AE in the 8-week faricimab, PTI faricimab, and aflibercept arms in YOSEMITE (76.7%, 80.2%, and 77.8%, respectively) and in RHINE (69.4%, 68.3%, and 73.6%, respectively). The proportion of nonocular AEs suspected by the investigators to be related to treatment was low and comparable in the 8-week faricimab, PTI faricimab, and aflibercept arms in YOSEMITE (1.0%, 0.6%, and 1.3%, respectively) and in RHINE (0.3%, 0.9%, and 1.0%, respectively).
Serious Adverse Events
Ocular SAEs were reported at a low frequency in both trials; however, in both YOSEMITE and RHINE, there was a slightly higher frequency of ocular SAEs in the PTI faricimab arm than in the aflibercept arm, and in YOSEMITE, there was a slightly higher frequency of ocular SAEs in the 8-week faricimab and PTI faricimab arms than in the aflibercept arm (YOSEMITE: 3.8%, 4.5%, and 2.3%, respectively; RHINE: 4.4%, 6.3%, and 4.1%, respectively). The most common (≥ 1% in any treatment arm) ocular SAE reported during the studies was cataract. In YOSEMITE, endophthalmitis and uveitis were also common (≥ 1% in any treatment arm) ocular SAEs (3 patients each [1.0%] in the faricimab PTI arm) (Table 18).
In YOSEMITE, there were numerically more nonocular SAEs in the 8-week faricimab and PTI faricimab arms than in the aflibercept arm (31.6%, 31.0%, and 27.0%, respectively), whereas in RHINE, there were numerically fewer (24.0%, 20.1%, and 28.3%, respectively). The most common (≥ 2% in any treatment arm) nonocular SAEs in the trials across treatment arms were COVID-19 (1.3% to 3.2%), pneumonia (1.3% to 2.6%), cellulitis (0.3% to 2.5%), sepsis (0% to 2.3%), and osteomyelitis (0.3% to 2.3%).
Withdrawals Due to Adverse Events
In both studies, a small proportion of patients in all arms discontinued treatment due to AEs. In YOSEMITE, 2.6% of patients in the 8-week faricimab arm and 2.9% in the PTI faricimab arm discontinued treatment due to AEs, whereas in RHINE, 2.2% and 2.8%, respectively, did. In both YOSEMITE and RHINE, 1.6% of patients in the aflibercept arm discontinued treatment due to AEs. The most common reason for treatment discontinuation was uveitis (3 patients in the PTI faricimab arm in YOSEMITE) (Table 18).
A high proportion of patients in the 8-week faricimab, PTI faricimab, and aflibercept arms discontinued the study due to AEs in YOSEMITE (7.0%, 8.6%, and 5.8%, respectively) and in RHINE (5.0%, 4.4%, and 5.1%, respectively). The most common reasons for study discontinuation due to AE was death (9 patients in the faricimab arms, 1 patient in the aflibercept arm) and COVID-19 (8 patients in the faricimab arms, 1 patient in the aflibercept arm) (Table 18).
Mortality
Of the 50 patients who died during the YOSEMITE study, 16 were in the 8-week faricimab arm, 21 were in the PTI faricimab PTI arm, and 13 were in the aflibercept arm. Of the 31 patients who died during the RHINE study, 12 were in the 8-week faricimab arm, 9 were in the PTI faricimab arm, and 10 were in the aflibercept arm (Table 18). When data for the 81 deaths that occurred during the the 2 studies were pooled, they accounted for 4.4%, 4.7%, 3.7% of patients in the 8-week faricimab, PTI faricimab, and aflibercept arms, respectively. The most common primary causes of death were the reported term of death (a category that included gunshot wounds, falls, natural causes, advanced hepatocellular carcinoma with metastases to the bone, head injury, and unexplained death) (reported in 3 patients, 6 patients, and 1 patient in the 8-week faricimab, PTI faricimab, and aflibercept arms, respectively); COVID-19 (reported in 3 patients, 4 patients, and 1 patient, respectively); and myocardial infarction (reported in 2 patients, 2 patients, and 4 patients, respectively). According to the sponsor, none of the deaths were suspected by the investigator to be related to study treatment.60
Table 18: Summary of Harms During the Study (to Week 100 in the Safety-Evaluable Population)
Harms | YOSEMITE | RHINE | ||||
|---|---|---|---|---|---|---|
Faricimab 6 mg q.8.w., N = 313 | Faricimab 6 mg PTI, N = 313 | Aflibercept 2 mg q.8.w., N = 311 | Faricimab 6 mg q.8.w., N = 317 | Faricimab 6 mg PTI, N = 319 | Aflibercept 2 mg q.8.w., N = 314 | |
Patients with ≥ 1 ocular AE in the study eye during the study | ||||||
n (%) | 147 (47.0) | 146 (46.6) | 144 (46.3) | 166 (52.4) | 165 (51.7) | 140 (44.6) |
Most common events,a n (%) | ||||||
Cataract | 55 (17.6) | 36 (11.5) | 45 (14.5) | 46 (14.5) | 50 (15.7) | 31 (9.9) |
Conjunctival hemorrhage | 21 (6.7) | 26 (8.3) | 20 (6.4) | 31 (9.8) | 18 (5.6) | 21 (6.7) |
Vitreous detachment | 15 (4.8) | 15 (4.8) | 10 (3.2) | 16 (5.0) | 13 (4.1) | 16 (5.1) |
Vitreous floaters | 17 (5.4) | 9 (2.9) | 6 (1.9) | 16 (5.0) | 7 (2.2) | 12 (3.8) |
Elevated intraocular pressure | 14 (4.5) | 9 (2.9) | 6 (1.9) | 18 (5.7) | 12 (3.8) | 10 (3.2) |
Diabetic retinal edema | 7 (2.2) | 10 (3.2) | 9 (2.9) | 4 (1.3) | 7 (2.2) | 5 (1.6) |
Dry eye | 11 (3.5) | 8 (2.6) | 6 (1.9) | 18 (5.7) | 19 (6.0) | 11 (3.5) |
Eye pain | 9 (2.9) | 7 (2.2) | 9 (2.9) | 4 (1.3) | 12 (3.8) | 12 (3.8) |
Posterior capsule opacification | 3 (1.0) | 5 (1.6) | 9 (2.9) | 9 (2.8) | 2 (0.6) | 2 (0.6) |
Punctate keratitis | 6 (1.9) | 4 (1.3) | 7 (2.3) | 6 (1.9) | 6 (1.9) | 3 (1.0) |
Subcapsular cataract | 4 (1.3) | 4 (1.3) | 4 (1.3) | 10 (3.2) | 6 (1.9) | 4 (1.3) |
Conjunctivitis | 2 (0.6) | 4 (1.3) | 4 (1.3) | 8 (2.5) | 9 (2.8) | 7 (2.2) |
DR | 1 (0.3) | 6 (1.9) | 3 (1.0) | 3 (0.9) | 7 (2.2) | 4 (1.3) |
Medication error | 4 (1.3) | 0 | 1 (0.3) | 5 (1.6) | 9 (2.8) | 4 (1.3) |
Blepharitis | 2 (0.6) | 2 (0.6) | 2 (0.6) | 14 (4.4) | 7 (2.2) | 2 (0.6) |
Patients with ≥ 1 ocular SAE in the study eye during the study | ||||||
n (%) | 12 (3.8) | 14 (4.5) | 7 (2.3) | 14 (4.4) | 20 (6.3) | 13 (4.1) |
Events, n (%) | ||||||
Cataract | 4 (1.3) | 2 (0.6) | 3 (1.0) | 4 (1.3) | 7 (2.2) | 5 (1.6) |
Diabetic retinal edema | 2 (0.6) | 2 (0.6) | 1 (0.3) | 2 (0.6) | 1 (0.3) | 0 |
Endophthalmitis | 0 | 3 (1.0) | 0 | 2 (0.6) | 1 (0.3) | 1 (0.3) |
Uveitis | 0 | 3 (1.0) | 0 | NR | NR | NR |
DR | 1 (0.3) | 0 | 1 (0.3) | 0 | 1 (0.3) | 2 (0.6) |
Reduced visual acuity | NR | NR | NR | 0 | 1 (0.3) | 1 (0.3) |
Visual impairment | NR | NR | NR | 0 | 2 (0.6) | 0 |
Angle-closure glaucoma | 1 (0.3) | 0 | 0 | 0 | 1 (0.3) | 0 |
Nuclear cataract | NR | NR | NR | 1 (0.3) | 0 | 1 (0.3) |
Subcapsular cataract | 0 | 0 | 1 (0.3) | 1 (0.3) | 1 (0.3) | 1 (0.3) |
Chemical burn of the eye | NR | NR | NR | 0 | 0 | 1 (0.3) |
Chorioretinitis | 0 | 1 (0.3) | 0 | NR | NR | NR |
Device dislocation | 1 (0.3) | 0 | 0 | NR | NR | NR |
Diabetic eye disease | NR | NR | NR | 0 | 1 (0.3) | 0 |
Glaucoma | 1 (0.3) | 0 | 0 | NR | NR | NR |
Dry eye | NR | NR | NR | 1 (0.3) | 0 | 0 |
Influenza | NR | NR | NR | 1 (0.3) | 0 | 0 |
Elevated intraocular pressure | NR | NR | NR | 1 (0.3) | 0 | 0 |
Iridocyclitis | NR | NR | NR | 0 | 0 | 1 (0.3) |
Keratouveitis | 0 | 1 (0.3) | 0 | NR | NR | NR |
Macular fibrosis | NR | NR | NR | 0 | 0 | 1 (0.3) |
Macular edema | 1 (0.3) | 0 | 0 | NR | NR | NR |
Myocardial ischemia | NR | NR | NR | 0 | 1 (0.3) | 0 |
Narrow anterior chamber angle | 1 (0.3) | 0 | 0 | NR | NR | NR |
Ocular hypertension | 0 | 1 (0.3) | 0 | NR | NR | NR |
Ocular ischemic syndrome | 0 | 1 (0.3) | 0 | NR | NR | NR |
Open angle glaucoma | NR | NR | NR | 0 | 1 (0.3) | 0 |
Posterior capsule rupture | 0 | 1 (0.3) | 0 | NR | NR | NR |
Posterior capsule opacification | NR | NR | NR | 0 | 1 (0.3) | 0 |
Retinal artery occlusion | 0 | 0 | 1 (0.3) | 0 | 1 (0.3) | 1 (0.3) |
Retinal tear | 0 | 1 (0.3) | 0 | 0 | 2 (0.6) | 0 |
Retinal vein occlusion | 0 | 1 (0.3) | 0 | 0 | 2 (0.6) | 0 |
Rhegmatogenous retinal detachment | 1 (0.3) | 0 | 0 | NR | NR | NR |
Uveitic glaucoma | 0 | 1 (0.3) | 0 | NR | NR | NR |
Viral keratouveitis | 1 (0.3) | 0 | 0 | NR | NR | NR |
Vitreous hemorrhage | 1 (0.3) | 0 | 0 | 1 (0.3) | 0 | 0 |
Patients with ≥ 1 nonocular SAE during the study | ||||||
n (%) | 99 (31.6) | 97 (31.0) | 84 (27.0) | 76 (24.0) | 64 (20.1) | 89 (28.3) |
Most common events,b n (%) | ||||||
Infections and infestations | ||||||
COVID-19 | 5 (1.6) | 10 (3.2) | 4 (1.3) | 6 (1.9) | 7 (2.2) | 4 (1.3) |
Pneumonia | 8 (2.6) | 4 (1.3) | 7 (2.3) | 7 (2.2) | 6 (1.9) | 5 (1.6) |
Cellulitis | 4 (1.3) | 5 (1.6) | 4 (1.3) | 3 (0.9) | 1 (0.3) | 8 (2.5) |
Sepsis | 6 (1.9) | 0 | 7 (2.3) | 5 (1.6) | 0 | 2 (0.6) |
Osteomyelitis | 3 (1.0) | 1 (0.3) | 7 (2.3) | 2 (0.6) | 1 (0.3) | 3 (1.0) |
COVID-19 pneumonia | 1 (0.3) | 3 (1.0) | 3 (1.0) | 3 (0.9) | 1 (0.3) | 3 (1.0) |
Gangrene | 1 (0.3) | 4 (1.3) | 2 (0.6) | 2 (0.6) | 2 (0.6) | 1 (0.3) |
Urinary tract infection | 3 (1.0) | 1 (0.3) | 1 (0.3) | 1 (0.3) | 1 (0.3) | 5 (1.6) |
Diabetic foot infection | 0 | 1 (0.3) | 3 (1.0) | 4 (1.3) | 0 | 0 |
Cardiac disorders | ||||||
Congestive cardiac failure | 7 (2.2) | 3 (1.0) | 5 (1.6) | 8 (2.5) | 4 (1.3) | 2 (0.6) |
Acute myocardial infarction | 5 (1.6) | 3 (1.0) | 4 (1.3) | 1 (0.3) | 1 (0.3) | 3 (1.0) |
Myocardial infarction | 2 (0.6) | 5 (1.6) | 5 (1.6) | 5 (1.6) | 3 (0.9) | 4 (1.3) |
Coronary artery disease | 2 (0.6) | 5 (1.6) | 4 (1.3) | 1 (0.3) | 1 (0.3) | 1 (0.3) |
Cardiac failure | 0 | 3 (1.0) | 1 (0.3) | 2 (0.6) | 3 (0.9) | 4 (1.3) |
Nervous system disorders | ||||||
Cerebrovascular accident | 2 (0.6) | 4 (1.3) | 4 (1.3) | 1 (0.3) | 1 (0.3) | 4 (1.3) |
Ischemic stroke | 4 (1.3) | 2 (0.6) | 2 (0.6) | 1 (0.3) | 1 (0.3) | 3 (1.0) |
Syncope | 2 (0.6) | 1 (0.3) | 3 (1.0) | 1 (0.3) | 1 (0.3) | 2 (0.6) |
Cerebral infarction | 3 (1.0) | 0 | 0 | 1 (0.3) | 1 (0.3) | 0 |
Renal and urinary disorders | ||||||
Acute kidney injury | 3 (1.0) | 2 (0.6) | 4 (1.3) | 4 (1.3) | 4 (1.3) | 4 (1.3) |
Renal failure | 5 (1.6) | 1 (0.3) | 3 (1.0) | 0 | 0 | 3 (1.0) |
Chronic kidney disease | 2 (0.6) | 0 | 4 (1.3) | 4 (1.3) | 0 | 3 (1.0) |
End-stage renal disease | 3 (1.0) | 0 | 2 (0.6) | 3 (0.9) | 1 (0.3) | 0 |
Other disorders | ||||||
Death | 3 (1.0) | 5 (1.6) | 1 (0.3) | 0 | 1 (0.3) | 0 |
Hyperglycemia | 3 (1.0) | 1 (0.3) | 1 (0.3) | 0 | 0 | 0 |
Hypoglycemia | 0 | 4 (1.3) | 1 (0.3) | 2 (0.6) | 3 (0.9) | 1 (0.3) |
Acute respiratory failure | 4 (1.3) | 1 (0.3) | 3 (1.0) | 2 (0.6) | 2 (0.6) | 2 (0.6) |
Dyspnea | NR | NR | NR | 2 (0.6) | 4 (1.3) | 0 |
Hypertension | 1 (0.3) | 1 (0.3) | 3 (1.0) | 2 (0.6) | 0 | 1 (0.3) |
Adenocarcinoma of the colon | 0 | 2 (0.6) | 3 (1.0) | 0 | 0 | 0 |
Diabetic foot | 1 (0.3) | 3 (1.0) | 3 (1.0) | 0 | 2 (0.6) | 2 (0.6) |
Patients who stopped treatment due to AE | ||||||
n (%) | 8 (2.6) | 9 (2.9) | 5 (1.6) | 7 (2.2) | 9 (2.8) | 5 (1.6) |
Most common events,b n (%) | ||||||
Uveitis | 0 | 3 (1.0) | 0 | NR | NR | NR |
Patients who discontinued the study due to AE | ||||||
n (%) | 22 (7.0) | 27 (8.6) | 18 (5.8) | 16 (5.0) | 14 (4.4) | 16 (5.1) |
Most common events,b n (%) | ||||||
Death | 3 (1.0) | 5 (1.6) | 1 (0.3) | 0 | 1 (0.3) | 0 |
COVID-19 | 0 | 3 (1.0) | 1 (0.3) | 3 (0.9) | 2 (0.6) | 0 |
Deaths during the study | ||||||
n (%) | 16 (5.1) | 21 (6.7) | 13 (4.2) | 12 (3.8) | 9 (2.8) | 10 (3.2) |
Acute myocardial infarction | 1 (0.3) | 1 (0.3) | 1 (0.3) | 0 | 0 | 1 (0.3) |
Acute respiratory failure | 1 (0.3) | 0 | 0 | NR | NR | NR |
Adenocarcinoma of the colon | 0 | 0 | 1 (0.3) | NR | NR | NR |
Anemia | 0 | 1 (0.3) | 0 | NR | NR | NR |
Bladder cancer | 1 (0.3) | 0 | 0 | 1 (0.3) | 0 | 0 |
COVID-19 | 0 | 3 (1.0) | 1 (0.3) | 3 (0.9) | 1 (0.3) | 0 |
COVID-19 pneumonia | 0 | 1 (0.3) | 1 (0.3) | 1 (0.3) | 1 (0.3) | 0 |
Cardiac arrest | NR | NR | NR | 2 (0.6) | 0 | 1 (0.3) |
Cardiac failure | 0 | 2 (0.6) | 0 | 0 | 1 (0.3) | 0 |
Congestive cardiac failure | NR | NR | NR | 1 (0.3) | 0 | 0 |
Cardiopulmonary failure | 0 | 1 (0.3) | 0 | NR | NR | NR |
Cardiorespiratory arrest | NR | NR | NR | 0 | 0 | 1 (0.3) |
Cerebral hemorrhage | 0 | 1 (0.3) | 0 | 1 (0.3) | 0 | 0 |
Chronic kidney disease | 0 | 0 | 1 (0.3) | 1 (0.3) | 0 | 0 |
Circulatory collapse | 0 | 0 | 1 (0.3) | NR | NR | NR |
Completed suicide | 0 | 0 | 1 (0.3) | NR | NR | NR |
Congestive cardiomyopathy | 1 (0.3) | 0 | 0 | NR | NR | NR |
Coronary artery disease | 0 | 0 | 0 | 0 | 0 | 1 (0.3) |
Coronavirus infection | 1 (0.3) | 0 | 0 | NR | NR | NR |
Death | 3 (1.0) | 5 (1.6) | 1 (0.3) | 0 | 1 (0.3) | 0 |
Diabetic complication | 1 (0.3) | 0 | 0 | NR | NR | NR |
Dyspnea | 0 | 0 | 0 | 0 | 1 (0.3) | 0 |
Embolism | 1 (0.3) | 0 | 0 | NR | NR | NR |
General physical health deterioration | 1 (0.3) | 0 | 0 | NR | NR | NR |
Hemorrhage intracranial | 0 | 1 (0.3) | 0 | NR | NR | NR |
Hemorrhagic stroke | 1 (0.3) | 0 | 0 | NR | NR | NR |
Obstructive hernia | NR | NR | NR | 0 | 1 (0.3) | 0 |
Hypertensive heart disease | NR | NR | NR | 0 | 0 | 1 (0.3) |
Hypotension | NR | NR | NR | 0 | 0 | 1 (0.3) |
Ischemic stroke | NR | NR | NR | 0 | 1 (0.3) | 0 |
Intestinal ischemia | 0 | 0 | 1 (0.3) | 0 | 0 | 0 |
Left ventricular failure | 1 (0.3) | 0 | 0 | 0 | 0 | 0 |
Leukemia | 0 | 1 (0.3) | 0 | 0 | 0 | 0 |
Myocardial infarction | 1 (0.3) | 1 (0.3) | 2 (0.6) | 1 (0.3) | 1 (0.3) | 2 (0.6) |
Metastatic pancreatic carcinoma | 0 | 1 (0.3) | 0 | 0 | 0 | 1 (0.3) |
Pneumonia | NR | NR | NR | 1 (0.3) | 1 (0.3) | 0 |
Pneumonia aspiration | 0 | 1 (0.3) | 0 | NR | NR | NR |
Pulmonary fibrosis | 0 | 1 (0.3) | 0 | NR | NR | NR |
Renal failure | 1 (0.3) | 0 | 0 | NR | NR | NR |
Respiratory failure | 0 | 0 | 1 (0.3) | NR | NR | NR |
Sepsis | 1 (0.3) | 0 | 0 | NR | NR | NR |
Suspected COVID-19 | 0 | 0 | 1 (0.3) | NR | NR | NR |
Type 1 diabetes mellitus | NR | NR | NR | 0 | 0 | 1 (0.3) |
Notable harms | ||||||
Endophthalmitis | 0 | 3 (1.0) | 0 | 2 (0.6) | 1 (0.3) | 1 (0.3) |
Intraocular inflammationc | 6 (1.9) | 7 (2.2) | 5 (1.6) | 3 (0.9) | 4 (1.3) | 2 (0.6) |
Uveitis | 3 (1.0) | 3 (1.0) | 0 | 0 | 1 (0.3) | 0 |
Iritis | 1 (0.3) | 2 (0.6) | 1 (0.3) | 0 | 2 (0.6) | 1 (0.3) |
Post-procedural inflammation | 0 | 1 (0.3) | 2 (0.6) | 1 (0.3) | 0 | 0 |
Vitritis | 1 (0.3) | 0 | 2 (0.6) | 1 (0.3) | 0 | 0 |
Iridocyclitis | 1 (0.3) | 1 (0.3) | 0 | 1 (0.3) | 2 (0.6) | 1 (0.3) |
Chorioretinitis | 0 | 1 (0.3) | 0 | NR | NR | NR |
Keratic precipitates | 0 | 1 (0.3) | 0 | NR | NR | NR |
Keratouveitis | 0 | 1 (0.3) | 0 | NR | NR | NR |
Cataract | 55 (17.6) | 36 (11.5) | 45 (14.5) | 46 (14.5) | 50 (15.7) | 31 (9.9) |
Retinal detachment | 2 (0.6) | 2 (0.6) | 2 (0.6) | 1 (0.3) | 1 (0.3) | 0 |
Retinal tear | 0 | 1 (0.3) | 0 | 0 | 2 (0.6) | 0 |
Elevated Intraocular pressure | 14 (4.5) | 9 (2.9) | 6 (1.9) | 18 (5.7) | 12 (3.8) | 10 (3.2) |
Glaucoma | 1 (0.3) | 0 | 3 (1.0) | 1 (0.3) | 2 (0.6) | 2 (0.6) |
Conjunctival hemorrhage | 21 (6.7) | 26 (8.3) | 20 (6.4) | 31 (9.8) | 18 (5.6) | 21 (6.7) |
Retinal hemorrhage | NR | NR | NR | NR | NR | NR |
Vitreous floaters | 17 (5.4) | 9 (2.9) | 6 (1.9) | 16 (5.0) | 7 (2.2) | 12 (3.8) |
ATE,d nonocular | 34 (10.9) | 24 (7.7) | 27 (8.7) | 22 (6.9) | 22 (6.9) | 25 (8.0) |
Retinal vascular occlusive disease | 1 (0.3) | 2 (0.6) | 1 (0.3) | 1 (0.3) | 4 (1.3) | 3 (1.0) |
Retinal vein occlusion | 1 (0.3) | 2 (0.6) | 0 | 0 | 2 (0.6) | 0 |
Retinal artery occlusion | 0 | 0 | 1 (0.3) | 1 (0.3) | 2 (0.6) | 1 (0.3) |
Arterial occlusive disease | NR | NR | NR | 0 | 0 | 1 (0.3) |
Retinal artery embolism | NR | NR | NR | 0 | 0 | 1 (0.3) |
Ocular discomfort | 4 (1.3) | 2 (0.6) | 2 (0.6) | 1 (0.3) | 2 (0.6) | 0 |
Eye pain | 9 (2.9) | 7 (2.2) | 9 (2.9) | 4 (1.3) | 12 (3.8) | 12 (3.8) |
Eye irritation | 2 (0.6) | 1 (0.3) | 2 (0.6) | 3 (0.9) | 1 (0.3) | 3 (1.0) |
Blurred vision | 5 (1.6) | 2 (0.6) | 3 (1.0) | 1 (0.3) | 0 | 4 (1.3) |
AE = adverse event; ATE = arterial thromboembolic event; DR = diabetic retinopathy; NR = not reported; PTI = personalized treatment interval (from every 4 weeks up to every 16 weeks); q.8.w. = every 8 weeks; SAE = serious adverse event.
aFrequency of ≥ 2% of patients in any treatment group.
bFrequency of ≥ 1% of patients in any treatment group.
cIntraocular inflammation events include anterior chamber flare, anterior chamber inflammation, chorioretinitis, choroiditis, cyclitis, eye inflammation, iridocyclitis, iritis, keratic precipitates, keratouveitis, noninfectious chorioretinitis, noninfectious endophthalmitis, ocular vasculitis, post-procedural inflammation, retinal vasculitis, uveitis, and vitritis.
dATEs include nonocular events from the following categories: myocardial infarction; ischemic central nervous system vascular conditions; other ischemic heart disease; and arterial embolic and thrombotic events.
Sources: YOSEMITE Final Clinical Study Report,10 RHINE Updated Clinical Study Report.12
Notable Harms
Cataract was the most commonly occurring notable harm, occurring in 9.9% to 17.6% of patients across treatment arms during both studies, followed by nonocular arterial thromboembolic events (6.9% to 10.9% per arm) and conjunctival hemorrhage (6.4% to 9.8% per arm). Over the course of both studies, 7 patients reported endophthalmitis: 3 in the PTI faricimab arm in YOSEMITE; and 2 in the 8-week faricimab arm, 1 in the PTI faricimab arm, and 1 in the aflibercept arm in RHINE. Intraocular inflammation was reported in 0.6% to 2.2% of patients across treatment arms in both studies, with uveitis being the most commonly reported intraocular inflammation event, occurring in 7 patients in the faricimab arms (6 in YOSEMITE and 1 in RHINE) and no patients in the aflibercept arm. There were 2 events of intraocular inflammation associated with a vision loss of at least 15 letters and 2 events associated with a loss of at least 30 letters during the YOSEMITE study in the PTI faricimab arm. In RHINE, 1 patient in the 8-week faricimab arm experienced mild and nonserious vitritis that was related to the study drug.
Retinal detachment, retinal tear, glaucoma, retinal vascular occlusive disease events (defined as arterial occlusive disease, retinal artery embolism, retinal vein occlusion, retinal artery occlusion, or venous occlusion), eye irritation, ocular discomfort, and blurred vision occurred infrequently (< 2% across all treatment arms in both studies). There were no reports of retinal hemorrhage as an AE in either study. A small number of patients in the faricimab arms experienced retinal detachment (6 patients in the 2 studies) and retinal tears (3 patients in the 2 studies); in the aflibercept arm, there were 2 retinal detachments and no retinal tears. Vitreous floaters, reported in 1.9% to 5.4% of patients, were numerically higher in the 8-week faricimab arm than in the aflibercept arm of the studies. Nonocular arterial thromboembolic events (including nonfatal stroke, nonfatal myocardial infarction, and vascular death) were reported in 6.9% to 10.9% of patients across treatment arms in the 2 studies, with comparable frequencies between treatment arms.
There was generally no discernable imbalance in other notable harms across treatment arms or studies (Table 18).
Critical Appraisal
Internal Validity
YOSEMITE and RHINE were identically designed randomized, double-blind, active-controlled, noninferiority phase III trials that compared 2 dosing regimens of faricimab (8-week and PTI) with aflibercept (8-week). The overall trial design was appropriate for the objectives of the YOSEMITE and RHINE studies. There were no major concerns about the method of randomization, which involved stratification by baseline BCVA, prior anti-VEGF treatment, and geographic region, as well as the use of an interactive web-based response system for randomized assignment. The baseline characteristics of the study population were generally well balanced across treatment arms and studies, except that time since DME diagnosis was, on average, shorter in RHINE than in YOSEMITE, and CST was slightly lower CST at baseline; however, the clinical expert thought that these differences were unlikely to have an impact on the results of the studies. The methods of allocation concealment and blinding were appropriate. The use of sham injections to preserve blinding in patients was likely successful, according to the clinical expert, considering that the procedure was done on anesthetized eyes and patients were unlikely to feel the difference between the sham injection with the blunt end of a syringe and a real injection. Treatment assignment was inadvertently unmasked for a small number of patients (8 patients in YOSEMITE and 2 patients in RHINE) and, in some cases, a masked physician performed an unmasked physician task (16 in YOSEMITE) or an examiner of visual acuity was unmasked to a patient’s study eye (1 instance in YOSEMITE and 3 instances in RHINE); however, these numbers were infrequent, and there is no information indicative of wider issues with blinding in the studies.
Approximately half the patients in the studies had at least 1 major protocol deviation (46.3% to 50.5% across treatment arms at 56 weeks). The most common major protocol deviation was missed visits at weeks 44, 48, 52, or 56 (21.6% to 25.3% of patients across treatment arms in both studies), followed by major issues with images (e.g., missed images) (5.8% to 10.3% across treatment arms in both studies). These deviations were likely higher than expected given the COVID-19 pandemic, as 32% of deviations in YOSEMITE and 39% in RHINE were deemed to be related to COVID-19. Although the number of major protocol deviations is a limitation, these events were generally balanced between treatment arms within each study, and results of the sensitivity and supplementary analyses (including the per-protocol analysis) were consistent with the primary estimand.
Per the study design, different dosing schedules were used in the treatment arms in both the loading and maintenance phases. In the loading phase, patients in the aflibercept arm received 5 monthly doses, patients in the 8-week faricimab arm received 6 monthly doses, and patients in the PTI faricimab arm received 4 monthly doses. In the maintenance phase, the treatment interval could be modified after randomization for patients in the PTI faricimab arm, using pre-specified criteria, to 4-, 8-, 12-, or 16-weeks. Intervals in the aflibercept arm could not be adjusted in this way after randomization, and patients received doses at fixed 8-week intervals. Protocol-based differences in the dosing schedule should be taken into account when considering the number and frequency of injections patients received. The ability to reduce the dosing interval to every 4 weeks could potentially create a bias in favour of PTI faricimab for efficacy outcomes; however, treatment intervals longer than 8 weeks in the PTI faricimab arm could have the opposite effect. Around 11% to 13% patients in the PTI faricimab arm were on a 4-week dosing schedule at 1 year. However, according to the clinical expert, a certain proportion of patients with DME (approximately 10%) would be expected to have an inadequate response to anti-VEGF treatment in general.
The studies established the noninferiority of faricimab to aflibercept based on primary outcome analyses in the ITT population. A supplementary per-protocol analysis confirmed the noninferiority in the primary ITT population. As well, several sensitivity analyses conducted by the sponsor and by the FDA confirmed the findings of each study.45
The noninferiority margin of 4 ETDRS letters for the primary end point, which was determined by the sponsor based on prior clinical trial data and clinical reasoning, aligned with recommended approaches. The clinical rationale was considered reasonable by the clinical expert consulted by CADTH. No rationale was provided for the noninferiority margin for the key secondary end point analysis, in which a margin of 10% was used to demonstrate noninferiority in the difference weighted proportions of patients with an improvement in DRS of 2 steps or more from baseline on the ETDRS DRSS; however, the clinical expert consulted by CADTH indicated that the 10% margin is a reasonable choice.
The enrolled sample sizes were adequate for the assessment of the primary outcome. Subgroup analyses were pre-specified, although, because of the lack of sample size considerations, control for multiplicity, and statistical testing for treatment-by-subgroup interaction, no conclusions related to subgroup effects can be drawn. Similarly, the secondary and exploratory end points should be interpreted in light of the lack of both sample size considerations and control for type I error.
The proportion of patients who discontinued the study treatment before week 56 was approximately 9% and 6% in YOSEMITE and RHINE, respectively, and the proportions were generally balanced in the treatment arms within each study, except the PTI faricimab arm in RHINE had a lower proportion of patients who discontinued treatment than the other arms (3.4%). ICEs occurred in approximately 9% and 10% of patients YOSEMITE and RHINE, respectively, through week 56, the majority of which were missed doses related to COVID-19, which could have had a potentially major impact on efficacy at weeks 44, 48, and 52. The proportion of missed doses was higher in the 8-week faricimab arm than in the PTI faricimab and aflibercept arms in YOSEMITE (9.8%, 5.4%, 4.8%, respectively) and in RHINE (10.4%, 6.6%, 7.0%, respectively), which could potentially create a bias against 8-week faricimab treatment. The few ICEs not related to COVID-19 were comparable in the treatment arms. Treatment policy strategy and hypothetical strategy were used to address non-COVID-19-related and COVID-19-related ICEs, respectively, in the primary estimand of the primary efficacy end point. The strategies were consistent with the approaches recommended by the FDA for ICEs.61
Although the hypothetical strategy (i.e., ICEs due to COVID-19 were censored and imputed using MMRM modelling and missing data were assumed to be MAR) is 1 of the approaches identified in the FDA guidance, the treatment policy strategy (i.e., including all data, regardless of ICEs) is the preferred approach to ensure that all data were used and because it is not clear that the MAR assumption would be met. The FDA statistical review of the faricimab studies, likewise, considered the treatment policy strategy to be the better of the 2.45 However, results of the supplementary analyses confirmed those of the primary estimand, suggesting the approach used to handle ICEs unlikely introduced bias.
The studies used implicit imputation by MMRM that assumed a MAR mechanism to account for missing data for continuous outcomes, while observed data with no imputation were used on missing binary outcomes, including for change in DRSS, which was a key secondary end point in the studies. No sensitivity analyses were conducted to assess the impact of missing data on the secondary outcomes, thereby making unsubstantiated assumptions about the secondary analyses. The FDA statistical review also noted this as a limitation and conducted additional analyses.45 The results of these additional analyses confirmed the original secondary results.
External Validity
Ten of the 174 RHINE study sites and none of the 179 YOSEMITE study sites were in Canada. The studies included patients who had been previously treated with an anti-VEGF and those who were treatment-naive. The inclusion and exclusion criteria were generally reflective of the eligibility criteria for anti-VEGF treatment in clinical practice; however, the expert consulted by CADTH noted that, in clinical practice, patients with less well controlled diabetes and/or a wider range of comorbidities would still be considered for treatment with faricimab. Treatment would not normally be withheld based only on a high level of hemoglobin A1C. Patients with high-risk PDR (excluded in the studies) would also receive treatment in practice, as would patients receiving tamoxifen (a prohibited therapy in the studies). However, the expert did not think that the inclusion or exclusion criteria would limit the generalizability of the studies’ results to the patient population seen in real-world settings. Patients with uncontrolled diabetes might have different response to treatment, but there is no direct evidence currently available for faricimab in this population.
A large percentage of patients failed to meet the eligibility criteria during the screening phase (38.6% in YOSEMITE and 44.5% in RHINE). The expert noted this was to be expected, given the patient population, and confirmed that the baseline characteristics of the study populations were similar to those of patients with DME in Canada.
The clinical expert indicated that aflibercept is an appropriate comparator, as it is the most commonly prescribed on-label anti-VEGF in Canada. Although direct comparative evidence against ranibizumab and bevacizumab would have been useful, the choice of aflibercept was seen as reasonable. The dosing regimen of aflibercept in the studies up to week 56 aligns with the product monograph dosing, but after year 1, the Canadian product monograph allows for a treat-and-extend approach, with treatment intervals extended by up to 2-week increments, based upon disease activity. However, aflibercept was given at a fixed interval of 8 weeks for the entire maintenance phase, which does not align with the treat-and-extend approach approved for the treatment of DME in Canada in year 2. This might bias the year 2 results, and the direction of the bias for efficacy would most likely favour aflibercept, given that an 8-week dosing interval would likely result in fewer injections than treat-and-extend dosing.
In terms of the clinical relevance of the outcomes assessed in the studies, BCVA change, retinal thickness measured by OCT, and the presence of retinal fluid are routinely assessed to evaluate treatment response in clinical practice, according to the clinical expert. The clinical group input also noted regression in DRSS as a clinically important outcome. Further, frequency of injection was identified as an outcome of key interest in both patient and clinical input. Although NEI VFQ-25 scores are infrequently measured outside of clinical research, HRQoL and vision function, which are partly captured in the questionnaire, are important outcomes to patients.
In the studies, patients were monitored monthly, but monthly monitoring is not mandated in the product monograph for faricimab, and the expert agreed that monitoring would only be required at dosing visits. The expert noted that the algorithm used to determine whether to reduce, maintain, or extend intervals of faricimab treatment was fairly rigid and would likely be applied in a more simplified manner in clinical practice, with more responsiveness to individual treatment outcomes based on CST and OCT measurements. It is unclear how different approaches to decision-making about treatment intervals would affect results.
The length of assessment in the primary analysis (56 weeks) was adequate for the assessment of efficacy and safety of faricimab in the context of a noninferiority trial, and data for up to 100 weeks were available. Longer-term studies may be needed to gain confidence on the durability of faricimab, and studies with a larger sample size would be needed to identify potential rare AEs.
YOSEMITE and RHINE are the only phase III studies to date that have provided direct evidence comparing faricimab with other anti-VEGF drugs in patients with DME. There is no direct evidence comparing faricimab with anti-VEGF drugs, other than aflibercept, currently used in Canadian practice (i.e., ranibizumab and bevacizumab), which represents an evidence gap.
The FDA review of faricimab noted that the impact of faricimab on corneal endothelial health has not been evaluated, and stated a need for a phase IV trial evaluating the corneal endothelial health of eyes treated with faricimab.44
Indirect Evidence
Objectives and Methods for the Summary of Indirect Evidence
An ITC was sought by the CADTH review team because of a lack of studies directly comparing faricimab with treatments other than aflibercept (refer to the Systematic Review section).
Search Methods
A focused literature search was performed by CADTH for NMAs dealing with faricimab and was run in MEDLINE All (1946–) on April 20, 2022. No limits were applied.
No published ITCs were identified in the CADTH literature search, but 1 report was provided by the sponsor.
Description of Indirect Comparison
One report that included ITCs was supplied by the sponsor.62 An overview of the submitted ITC is presented in Table 19.
Methods of Sponsor-Submitted ITC
Objectives
The objective of the ITC was to assess the efficacy and safety of PTI faricimab compared with relevant interventions (listed in Table 20) given as monotherapy.
Study Selection Methods
A strategy was developed and a search was conducted of MEDLINE, EMBASE, the Cochrane Library, abstracts of relevant conferences, and relevant health technology assessment agencies, clinical trial registries, and key government or international bodies. The population of interest was patients with DME older than 18 years. Studies of both treatment-naive and treatment-experienced patients were included. The main intervention was defined as PTI faricimab dosing (6 mg IVT every 4 weeks to every 16 weeks).
Table 19: Study Selection Criteria and Methods for the Sponsor-Submitted ITC
Characteristic | Sponsor-submitted ITC, systematic review portion | Sponsor-submitted ITC, NMA portion |
|---|---|---|
Population | Adults with DME Subgroup of interest: previous treatment status (treatment-naive vs. treatment-experienced patients) | Patients > 18 years with DME |
Intervention | Faricimab | |
Comparator | Interventions administered as monotherapy or as combination therapies (licensed and/or standard doses only of):
| Licensed and/or standard doses only of:
|
Outcome | Vision outcomes
Anatomic outcomes For each, record procedure and/or equipment used to measure:
Other
Safety outcomes
| Time point: 12 months Vision outcomes
Anatomic outcomes
Other
Safety outcomes
|
Study design | RCTs (phase II to IV)
| |
Publication characteristics | Full publications to October 2020 (search updated September 2021), conference abstracts published between January 2017 and November 2020 | |
Exclusion criteria | Not matching the inclusion criteria | |
Databases searched | EMBASE, MEDLINE, Cochrane Central Register of Controlled Trials, Cochrane Database of Systematic reviews, Database of Abstracts of Reviews of Effects, relevant conference abstracts | |
Selection process | Two independent reviewers | |
Data extraction process | Conducted by a single reviewer, with quality checked by a second reviewer; disputes were referred to a third party (strategic advisor) | |
Quality assessment | NICE single technology appraisal user guide, 7-criteria checklist | |
AE = adverse event; BCVA = best corrected visual acuity; CST = centre subfield thickness; DME = diabetic macular edema; ETDRS = Early Treatment Diabetic Retinopathy Study; IOP = Intraocular pressure; ITC = indirect treatment comparison; IVT = intravitreal; NEI VFQ-25 = National Eye Institute Visual Functioning Questionnaire-25; NICE = National Institute for Health and Care Excellence; NMA = network meta-analysis; q.8.w. = every 8 weeks; q.12.w. = every 12 weeks; q.16.w. = every 16 weeks; RCT = randomized controlled trial; SAE = serious adverse event; vs. = versus.
Source: Sponsor-submitted ITC.62
Table 20: Treatment Doses Considered in the ITC
Treatment | Dose | Regimen, with or without > 1 loading dose |
|---|---|---|
Aflibercept | 2 mg IVT | PRN; q.4.w.; q.8.w. |
Bevacizumab | 1.25 mg IVT | PRN |
Faricimab | 6 mg IVT | q.4.w. to q.16.w.; q.8.w. |
Ranibizumab | 0.3 mg/0.5 mga IVT | PRN; q.4.w.; q.8.w.; treat and extend |
Dexamethasone IVT implants | 0.7 mg | PRN |
Laser therapy | NA | PRN |
ITC = indirect treatment comparison; IVT = intravitreal; NA = not applicable; PRN = as needed; q.4.w. = every 4 weeks; q.8.w. = every 8 weeks; q.16.w. = every 16 weeks.
aAlthough the dose approved by Health Canada is 0.5 mg, in the NMA, ranibizumab 0.3 mg and 0.5 mg doses were pooled to allow greater connectivity in the network.
Source: Sponsor-submitted ITC.62
The criteria included studies published before the cut-off date of October 21, 2020; this search was updated in September 2021 (but no new trial data were added). Two reviewers independently screened the retrieved reports at 2 stages (titles and abstracts, and then full papers), and any disagreements were adjudicated by a third party. Final citations were verified by the project lead. Reasons for exclusion were documented. Data extraction was conducted by a single reviewer and quality was checked by a second reviewer. Details of the methods used to extract data from the included studies were described.
Quality assessment of the selected studies was carried out by 2 reviewers, and any disagreements were resolved by discussion or additional referees. A quality (risk-of-bias) assessment of studies was conducted using the 7-criteria checklist provided in section 2.5 of the National Institute for Health and Care Excellence single technology appraisal user guide.
Treatment doses considered in the ITC are listed in Table 20. Different dosing regimens and schedules were treated as different treatment arms in the NMA. Any arms that had the same regimen were pooled. PRN regimens were treated as similar treatment arms without regard for the number of loading doses.
Outcomes were considered at 12 months and are listed in Table 19. Visual acuity outcomes were defined as the mean change from baseline in BCVA, according to ETDRS letters. In addition, the proportion of patients gaining or losing 10 or more or 15 or more letters on the ETDRS scale from baseline was captured. This was defined as the proportion of patients in mutually exclusive letter categories (≥ –15; > –15 to ≥ –10; > –10 to ≥ –5; > –5 to < 5; ≥ 5 to < 10; ≥ 10 to < 15; ≥ 15). Anatomic outcomes included the mean change in retinal thickness, measured by CST. If the CST was missing from a study but 1 or more anatomic outcomes were reported, the other value was used in the following order: CST, central point thickness, CRT. Injection frequency was the mean number of injections given; this end point was considered at 12 months. Safety outcomes included overall ocular AEs, ocular SAEs, systemic AEs, and overall treatment discontinuation. No specific definition for overall treatment discontinuation, injection frequency, or AEs (overall ocular AEs and SAEs, or systemic adverse effects) was specified beyond the standard reporting in each trial.
The sponsor’s ITC reported outcomes at 12 months. Any result reported from week 48 to week 56, 12 months, or 1 year was classified as a 12-month outcome.
ITC Analysis Methods
An overview of the submitted ITC analysis methods is presented in Table 21.
The ITC compared faricimab with comparators for the available end points of visual acuity (BCVA and the proportion of patients gaining or losing ≥ 10 or ≥ 15 ETDRS letters) and anatomic outcomes (retinal thickness), number of injections, adverse effects, and overall treatment discontinuation at 12 months.
The ITC was an NMA performed using a Bayesian approach. The model was a Bayesian comparison using a generalized linear model framework; BCVA, retinal thickness, and number of injections used the identity link, the proportion of patients gaining or losing 10 or more or 15 or more ETDRS letters was modelled using the probit link, and all other end points were modelled using the logit link. Noninformative (vague) priors were planned for all parameters, and alternative priors were considered if the planned priors did not give sensible results or were too informative. Models generally used 10,000 iterations as a burn-in, with 40,000 iterations with a thinning parameter of 10; however, this was increased by 10 times for ocular adverse effects, serious ocular adverse effects, meta-regressions on patient characteristics for BCVA, and the number of injections and serious ocular AEs to improve convergence. There were at least 2 parallel chains run in all model fits. Convergence of the model was assessed using Brooks-Gelman-Rubin diagnostics.
Model fit was assessed using the diagnostic information criterion (DIC) (a 5-point difference was considered meaningful) and residual deviance. Laser PRN or ranibizumab 0.3 mg/0.5 mg IVT PRN was used as the reference treatment for computational efficiency, based on the best-connected nodes, depending on the network.
Table 21: Analysis Methods for ITC
Characteristic | Description of methods |
|---|---|
ITC methods | Bayesian NMA |
Priors | Noninformative (vague) |
Assessment of model fit | DIC for relative fit and total residual deviance for absolute fit |
Assessment of consistency | Consistency in model fits was assessed for every pairwise comparison using DIC and residual deviance and reported using methods per the NICE Decision Support Unit Technical Support Document This analysis was performed for the change from baseline in BCVA score in the overall population, and further inconsistency assessments were planned for other outcomes and populations if there was evidence of inconsistency |
Assessment of convergence | Trace plots and Brooks-Gelman-Rubin diagnostics |
Outcomes |
|
Follow-up time points | Any result reported from week 48 to week 56, 12 months, or 1 year was classified as a 12-month outcome |
Construction of nodes | Each treatment and schedule were separate arms |
Sensitivity analyses | Bayesian fixed-effects models Studies in which laser rescue therapy could potentially have influenced BCVA outcomes (mean change and proportion of patients gaining or losing ≥ 10 or ≥ 15 letters) were excluded, including DA VINCI, DRCR Network Protocol T, RESOLVE, RIDE, RISE, and TREX-DME |
Subgroup analysis | Anti-VEGF treatment-naive and anti-VEGF-experienced; networks for treatment-naive patients could be formed for BCVA score change and a gain or loss of ≥ 10 or ≥ 15 ETDRS letters |
AE = adverse event; anti-VEGF = anti–vascular endothelial growth factor; BCVA = best corrected visual acuity; CST = central subfield thickness; DIC = diagnostic information criterion; ETDRS = Early Treatment Diabetic Retinopathy Study; ITC = indirect treatment comparison; NICE = National Institute for Health and Care Excellence; NMA = network meta-analysis; SAE = serious adverse event.
Source: Sponsor-submitted ITC.62
Meta-regression was conducted to investigate whether the treatment effect varied by the level of covariate. Patient characteristics of BCVA and CST (or, if not reported, CRT, central foveal thickness, central macular thickness) at baseline were investigated using standard network meta-regression methods to determine whether treatment effect varied by covariate. These covariates were investigated in separate models first, as they are correlated, and a model with all patient characteristics was considered only if both were important. In the meta-regression of BCVA and CST, aflibercept was used as the reference treatment for the interaction effects.
Different dosing schedules were treated as different treatment arms in the NMA.
Results of ITC
Summary of Included Studies
Of the 135 publications from 83 unique studies included in the feasibility assessment, 33 were excluded for treatment-related reasons, 4 studies did not connect to faricimab through the network, 13 studies were excluded because they investigated unlicensed combination regimens, and 4 studies were excluded for other reasons. Of the remaining 29 studies considered for inclusion in the NMA, another 3 were excluded for reasons such as not reporting relevant data for outcomes at the time point of interest. Therefore, 26 trials were included in the NMA.
Table 22: Assessment of Homogeneity for the Sponsor-Submitted ITC
Characteristic | Description and handling of potential effect modifiers |
|---|---|
Disease severity |
|
Treatment history | Prior therapy for DME was assessed. A subgroup analysis in which only treatment-naive patients were included is reported. |
Dosing of comparators | Each dose and regimen combination were considered separate interventions and/or comparators. The number of injections per year affected by administration of therapies with fixed intervals in clinical trials, according to protocols. |
Placebo response | Two of the included trials had a sham or placebo arm. |
Definitions of end points | Considerable heterogeneity was identified in retinal thickness, methods of measurement. |
Timing of end point evaluation or trial duration | Twelve-month outcomes included any result reported from week 48 to week 56. |
Withdrawal frequency | Overall treatment discontinuation was reported for 14 trials, within a study arm this ranged from 3.5% to 27.2%. |
Study design |
|
BCVA = best corrected visual acuity; CRT = central retinal thickness; CST = central subfield thickness; DME = diabetic macular edema; ITC = indirect treatment comparison.
Source: Sponsor-submitted ITC.62
An overview of the assessment of homogeneity for the ITC is presented in Table 22. A total of 12 of the 26 trials were head-to-head trials with active anti-VEGF comparators, 4 trials compared anti-VEGF drugs to dexamethasone, 1 trial compared anti-VEGF drugs to sham IVT, 1 trial compared immediate to deferred argon, and 10 trials compared anti-VEGF to laser therapy. A total of 11 of the 26 trials were double-masked, 3 were open-label, 6 were single-masked, and 6 did not report masking. Twelve of the 26 studies were phase III, 3 were phase II, 1 was phase IV, 3 were phase I/II, and 7 studies did not report phase. Eight of the 26 trials were multi-centre trials, 9 were muti-centre international trials, 7 were single-centre trials, and this information was not reported for 2 trials. Study size ranged from 20 to 2,244 patients randomized; 8 trials had fewer than 100 patients and 5 trials had more than 1,000 patients. Years of study ranged from 1985 to 2020.
Baseline patient characteristics were presented by treatment arm. Mean age at baseline ranged from 55 years to 69 years. The proportion of males in the study treatment arms ranged from 33.0% to 64.4%, although this information was not recorded for 5 trials. The proportion of study participants who were White ranged from 0.0% to 98.4%, although this information was not recorded for 5 trials. Mean BCVA (letters, ETDRS letters, ETDRS chart, ETDRS letter score, or ETDRS-like visual acuity) at baseline ranged from 29.2 to 70.4 letters. There was heterogeneity in the way retinal thickness was measured and defined in the trials, which included central foveal thickness, central macular thickness, CRT, and CST. There was also heterogeneity in the type of measurement used for retinal thickness. Retinal thickness at baseline ranged from 394 μm (CST) to 540 μm (CRT). The mean number of years with diabetes ranged from 11.1 years to 19.7 years (although there was 1 outlier at 1.31 years), but this was not reported for 13 trials. Mean intraocular pressure ranged from 14.9 mm Hg to 19.2 mm Hg; however, it was only reported for 6 trials. Mean hemoglobin A1C ranged from 7.3% to 8.4%, but this was not reported for 11 trials. The proportion of patients with type 2 diabetes ranged from 79.5% to 100%, but this was not reported in 8 trials. Mean time since diagnosis of DME was only reported for 5 trials, and ranged from 1.1 years to 20.7 years. Prior therapy for DME was reported as mixed for 15 trials, as previous treatment for 4 trials (of these, 2 were prior anti-VEGF), as treatment-naive for 5 trials, and was not reported in 2 trial.
Results
Comparators
Overall, the ITC included trials with relevant comparators. However, for trials that included the dexamethasone intraocular implants, results for that treatment arm are not reported in this summary because it is not a treatment that was pre-specified as relevant to the review of faricimab. As well, pairwise results comparing faricimab with sham or placebo or with laser therapy are not reported in this summary.
Risk of Bias
A quality-assessment diagram was reported for the 83 studies considered for inclusion in the feasibility assessment. Overall, included studies were rated to be of moderate to high quality. However, a quality assessment specifically for the 26 studies that were included in the NMA was not reported.
Figure 5: Network Diagram for the Outcome of Mean Change in BCVA at 12 Months
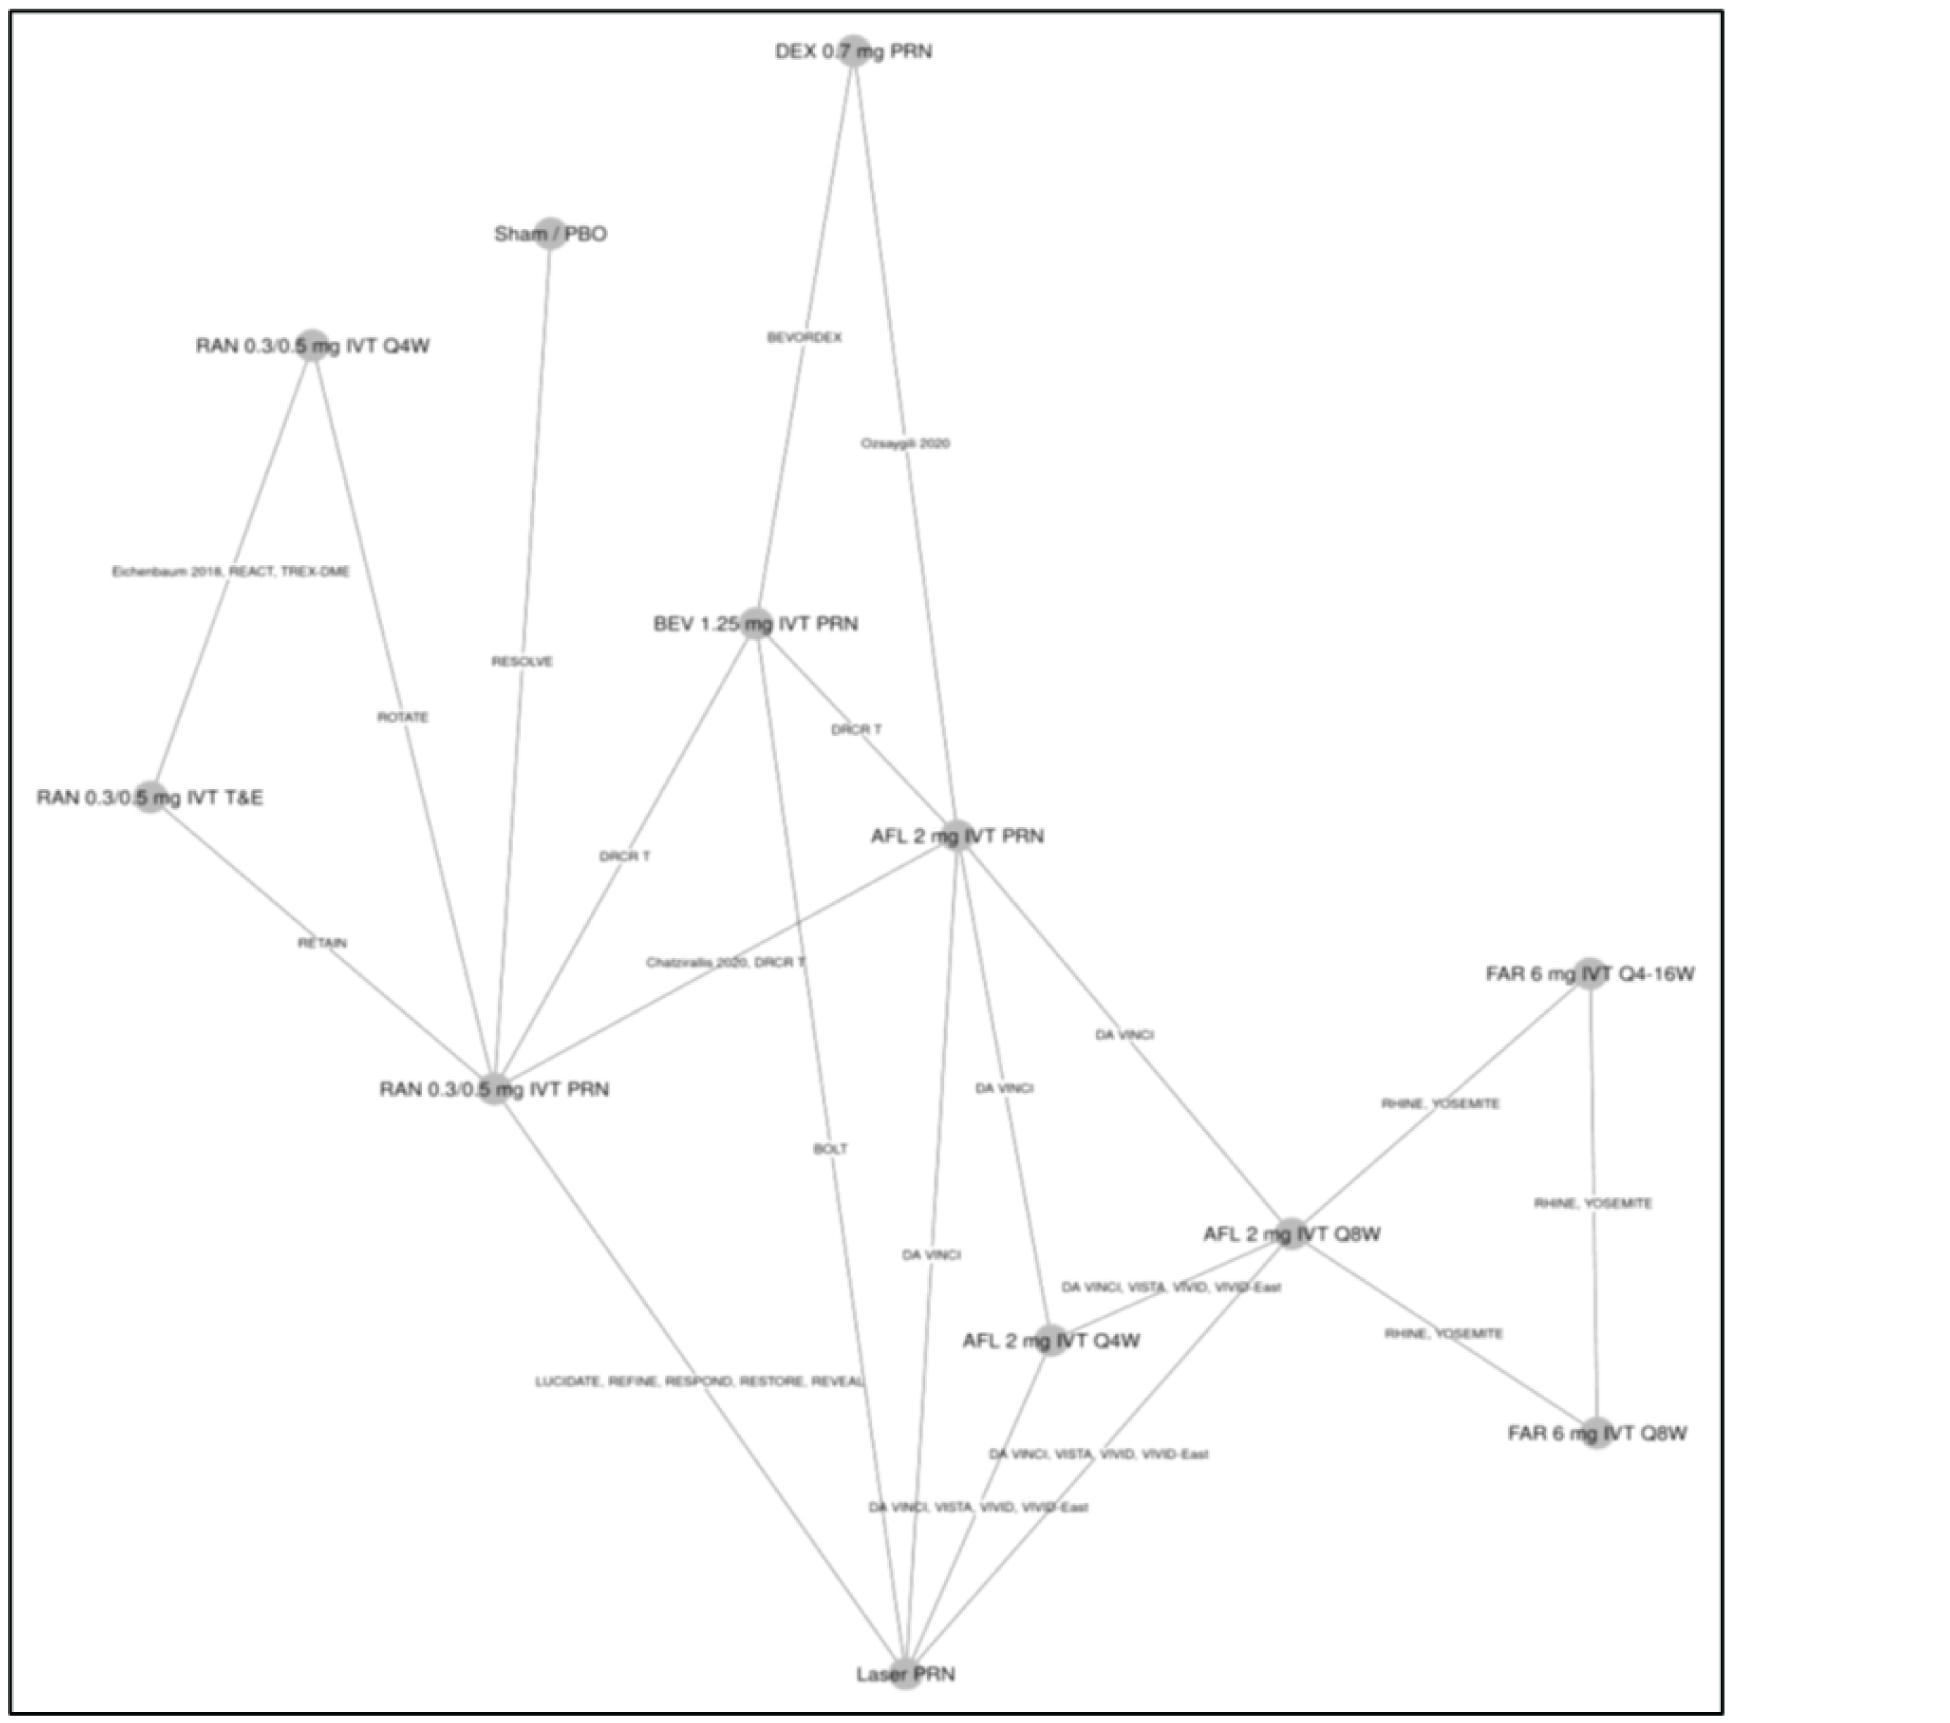
AFL = aflibercept; BCVA = best corrected visual acuity; BEV = bevacizumab; DEX = dexamethasone; FAR = faricimab; IVT = intravitreal; PBO = placebo; PRN = as needed; q.4.w. = every 4 weeks; q.8.w. = every 8 weeks; q.16.w. = every 16 weeks; RAN = ranibizumab; T&E = treat and extend.
Source: Sponsor-submitted ITC.62
BCVA
For the outcome of BCVA at 12 months, 22 trials were included in the analysis, which was conducted under a random-effects model, as this model had a lower DIC than the fixed-effects model (DIC not reported). A graphic representation of the evidence network is presented in Figure 5. Most trials compared active treatments, but the network did include 1 closed loop involving faricimab as an intervention.
||||||||||||||||||||||||||||||||||||||||||||||||||||||||||||||||||||||||||||||||||||||||||||||||||||||||||||||||||||||||||||||||||||||||||||||||||||||||||||||||||||||||||||||||||||||||||||||||||||||||||||||||||||||||||||||||||||||||||||||||||||||||||||||||||||||||||||||||||||||||||||||||||||||||||||||||||||||||||||||||||||||||||||||||||||||||||||||||||||||||||||||||||||||||||||||||||||||||||||||||||||||||||||||||||||||||||||||||||||||||||||||||||||||||||||||||||||||||||||||||||||||||||||||||||||||||||||||||||||||||||||||||||||||||||||||||||||||||||||||||||||||||||||||||||||||||||||||||||||||||||||||||||||||||||||||||||||||||||||
The comparative results are outlined in Table 23. There was no evidence of inconsistency from the comparison of the consistency and inconsistency model fits (DIC, mean residual deviance were compared).
Table 23: Mean Change in BCVA — ITC Results
|||||||||||||||||||||||||||||||||||||||||||||||||||||||| | |||||||||||||||||||||||||||||||||||||||||||||||||||||||| |
|---|---|
|||||||||||||||||||||||||||||||||||||| | |
|||||||||||||||||||||||||||||||||||||| | |||||||||||||||||||||||||||||||||| |
|||||||||||||||||||||||||||||||||||||| | |||||||||||||||||||||||||||||||||||||| |
|||||||||||||||||||||||||||||||||||||| | |||||||||||||||||||||||||||||||||||||| |
|||||||||||||||||||||||||||||||||||||| | |||||||||||||||||||||||||||||||||||||| |
|||||||||||||||||||||||||||||||||||||| | |||||||||||||||||||||||||||||||||||||| |
AFL = aflibercept; BCVA = best corrected visual acuity score mean change from baseline at 12 months; BEV = bevacizumab; CrI = credible interval; FAR = faricimab; ITC = indirect treatment comparison; IVT = intravitreal; PRN = as needed; PTI = personalized treatment interval – refers to faricimab 6 mg IVT q.4.w. to q.16.w.; Q4/6/8/12/16W = every 4/6/8/12/16/24 week; RAN = ranibizumab; T&E = treat and extend.
Note: Bolded numbers indicate that the 95% CrI excludes the null value. Positive differences indicate a larger vision gain for faricimab.
Source: Sponsor-submitted ITC.62
Retinal Thickness
For the mean change in retinal thickness at 12 months, 23 RCTs were included in the analysis, which was conducted with a random-effects model (the DIC for the random-effects model was larger than for the fixed-effects model but was not considered to be meaningful, as this difference was less than 5 points). A graphic representation of the evidence network is presented in Figure 6. The results ||||||||||||||||||||||||||||||||||||||||||||||||||||||||||||||||||||||||||||||||||||||||||||||||||||||||||||||||||||||||||||||||||||||||||||||||||||||||||||||||||||||||||||||||||||||||||||||||||||||||||||||||||||||||||||||||||||||||||||||||||||||||||||||||||||||||||||||||||||||||||||||||||||||||||||||||. However, 95% CrIs are wide. Results are outlined in Table 24. There was variability in the way retinal thickness was measured and reported in trials. If the CST was missing from a study but 1 or more anatomic outcomes were reported, the other value was used, in the following order: CST, central point thickness, CRT. It is not clear from the sponsor’s report how the values for this outcome compared across the trials. This variability in the way retinal thickness was defined, measured, and reported may contribute considerable heterogeneity to the ITC.
Table 24: Retinal Thickness — ITC Results
|||||||||||||||||||||||||||||||||||||||||||||||||||||||| | |||||||||||||||||||||||||||||||||||||||||||||||||||||||| |
|---|---|
|||||||||||||||||||||||||||||||||||||| | |
|||||||||||||||||||||||||||||||||||||| | |||||||||||||||||||||||||||||||||||||| |
|||||||||||||||||||||||||||||||||||||| | |||||||||||||||||||||||||||||||||||||| |
|||||||||||||||||||||||||||||||||||||| | |||||||||||||||||||||||||||||||||||||| |
|||||||||||||||||||||||||||||||||||||| | |||||||||||||||||||||||||||||||||||||| |
|||||||||||||||||||||||||||||||||||||| | |||||||||||||||||||||||||||||||||||||| |
AFL = aflibercept; BCVA = best corrected visual acuity score mean change from baseline at 12 months; BEV = bevacizumab; CrI = credible interval; FAR = faricimab; ITC = indirect treatment comparison; IVT = intravitreal; PTI = personalized treatment interval – refers to faricimab 6 mg IVT q.4.w. to q.16.w.; Q4/6/8/12/16W = every 4/6/8/12/16 weeks; RAN = ranibizumab; T and E = treat and extend
Note: Bolded numbers indicate that the 95% CrI excludes the null value. Negative differences indicate a better drying activity for faricimab.
Source: Sponsor-submitted ITC.62
Number of Injections at 12 Months
For the number of injections at 12 months, 11 RCTs were included in the analysis, which was conducted with a random-effects model, as the DIC for this model was lower than for the fixed-effects model. A graphic representation of the evidence network is presented in Figure 7. For the number-of-injections networks, ranibizumab 0.3 mg/0.5 mg IVT PRN was used as the computational reference, rather than laser PRN, as the network was formed without laser PRN. The ITC showed that |||||||||||||||||||||||||||||||||||||||||||||||||||||||||||||||||||||||||||||||||||||||||||||||||||||||||||||||||||||||||||||||||||||||||||||||||||||||||||||||||||||||||||||||||||||||||||||||||||||||||||||||||||||||||||||||||||||||||||||||||||||||||||||||||||||||||||||||||||||||||||||||||||||||||||||||||||||||||||||||||||||||||||||||||||||||||||||||||||||||||||||||||||||||||||| these data are affected by the administration of therapies with fixed intervals in clinical trials, according to protocols within the 1-year time frame of the RCTs. Results are outlined in Table 25.
Figure 6: Network Diagram for the Outcome of Retinal Thickness at 12 Months

AFL = aflibercept; BEV = bevacizumab; DEX = dexamethasone; FAR = faricimab; IVT = intravitreal; PBO = placebo; PRN = as needed; q.4.w. = every 4 weeks; q.8.w. = every 8 weeks; q.16.w. = every 16 weeks; RAN = ranibizumab; T&E = treat and extend.
Source: Sponsor-submitted ITC.62
Patients Gaining or Losing at Least 10 or 15 ETDRS Letters
For the outcome of patients gaining or losing 10 or more or 15 or more ETDRS letters at 12 months, 22 trials were included in this analysis, which was conducted with a random-effects model, as the DIC for this model was lower than for the fixed-effects model. A graphic representation of the evidence network is presented in Figure 8. The results show that no treatment was favoured (95% CrI included the null value). Results are outlined in Table 26.
The technical report noted that various assessments showed the model for this outcome had a poor fit, likely because of limited data and heterogeneity. Various methods were used to adjust for the limitations, but these did not improve the model fit. This precludes the ability to draw conclusions from these data on the effect of faricimab, compared with comparators, on patients gaining or losing at least 10 or 15 ETDRS letters.
Table 25: Number of Injections 12 Months — ITC Results
|||||||||||||||||||||||||||||||||||||||||||||||||||||||| | |||||||||||||||||||||||||||||||||||||||||||||||||||||||| |
|---|---|
|||||||||||||||||||||||||||||||||||||| | |
|||||||||||||||||||||||||||||||||||||| | |||||||||||||||||||||||||||||||||||||| |
|||||||||||||||||||||||||||||||||||||| | |||||||||||||||||||||||||||||||||||||| |
|||||||||||||||||||||||||||||||||||||| | |||||||||||||||||||||||||||||||||||||| |
|||||||||||||||||||||||||||||||||||||| | |||||||||||||||||||||||||||||||||||||| |
|||||||||||||||||||||||||||||||||||||| | |||||||||||||||||||||||||||||||||||||| |
|||||||||||||||||||||||||||||||||||||| | |||||||||||||||||||||||||||||||||||||| |
|||||||||||||||||||||||||||||||||||||| | |||||||||||||||||||||||||||||||||||||| |
AFL = aflibercept; BEV = bevacizumab; CrI = credible interval; FAR = faricimab; ITC = indirect treatment comparison; IVT = intravitreal; PRN = as needed; PTI = personalized treatment interval – refers to faricimab 6 mg IVT q.4.w. to q.16.w.; Q4/6/8/12/16W = every 4/6/8/12/16 weeks; RAN = ranibizumab; T&E = treat and extend.
Note: Bolded numbers indicate that the 95% CrI excludes the null value. Negative differences indicate fewer injections for faricimab.
Source: Sponsor-submitted ITC.62
Figure 7: Network Diagram for the Outcome of Mean Number of Injections at 12 Months
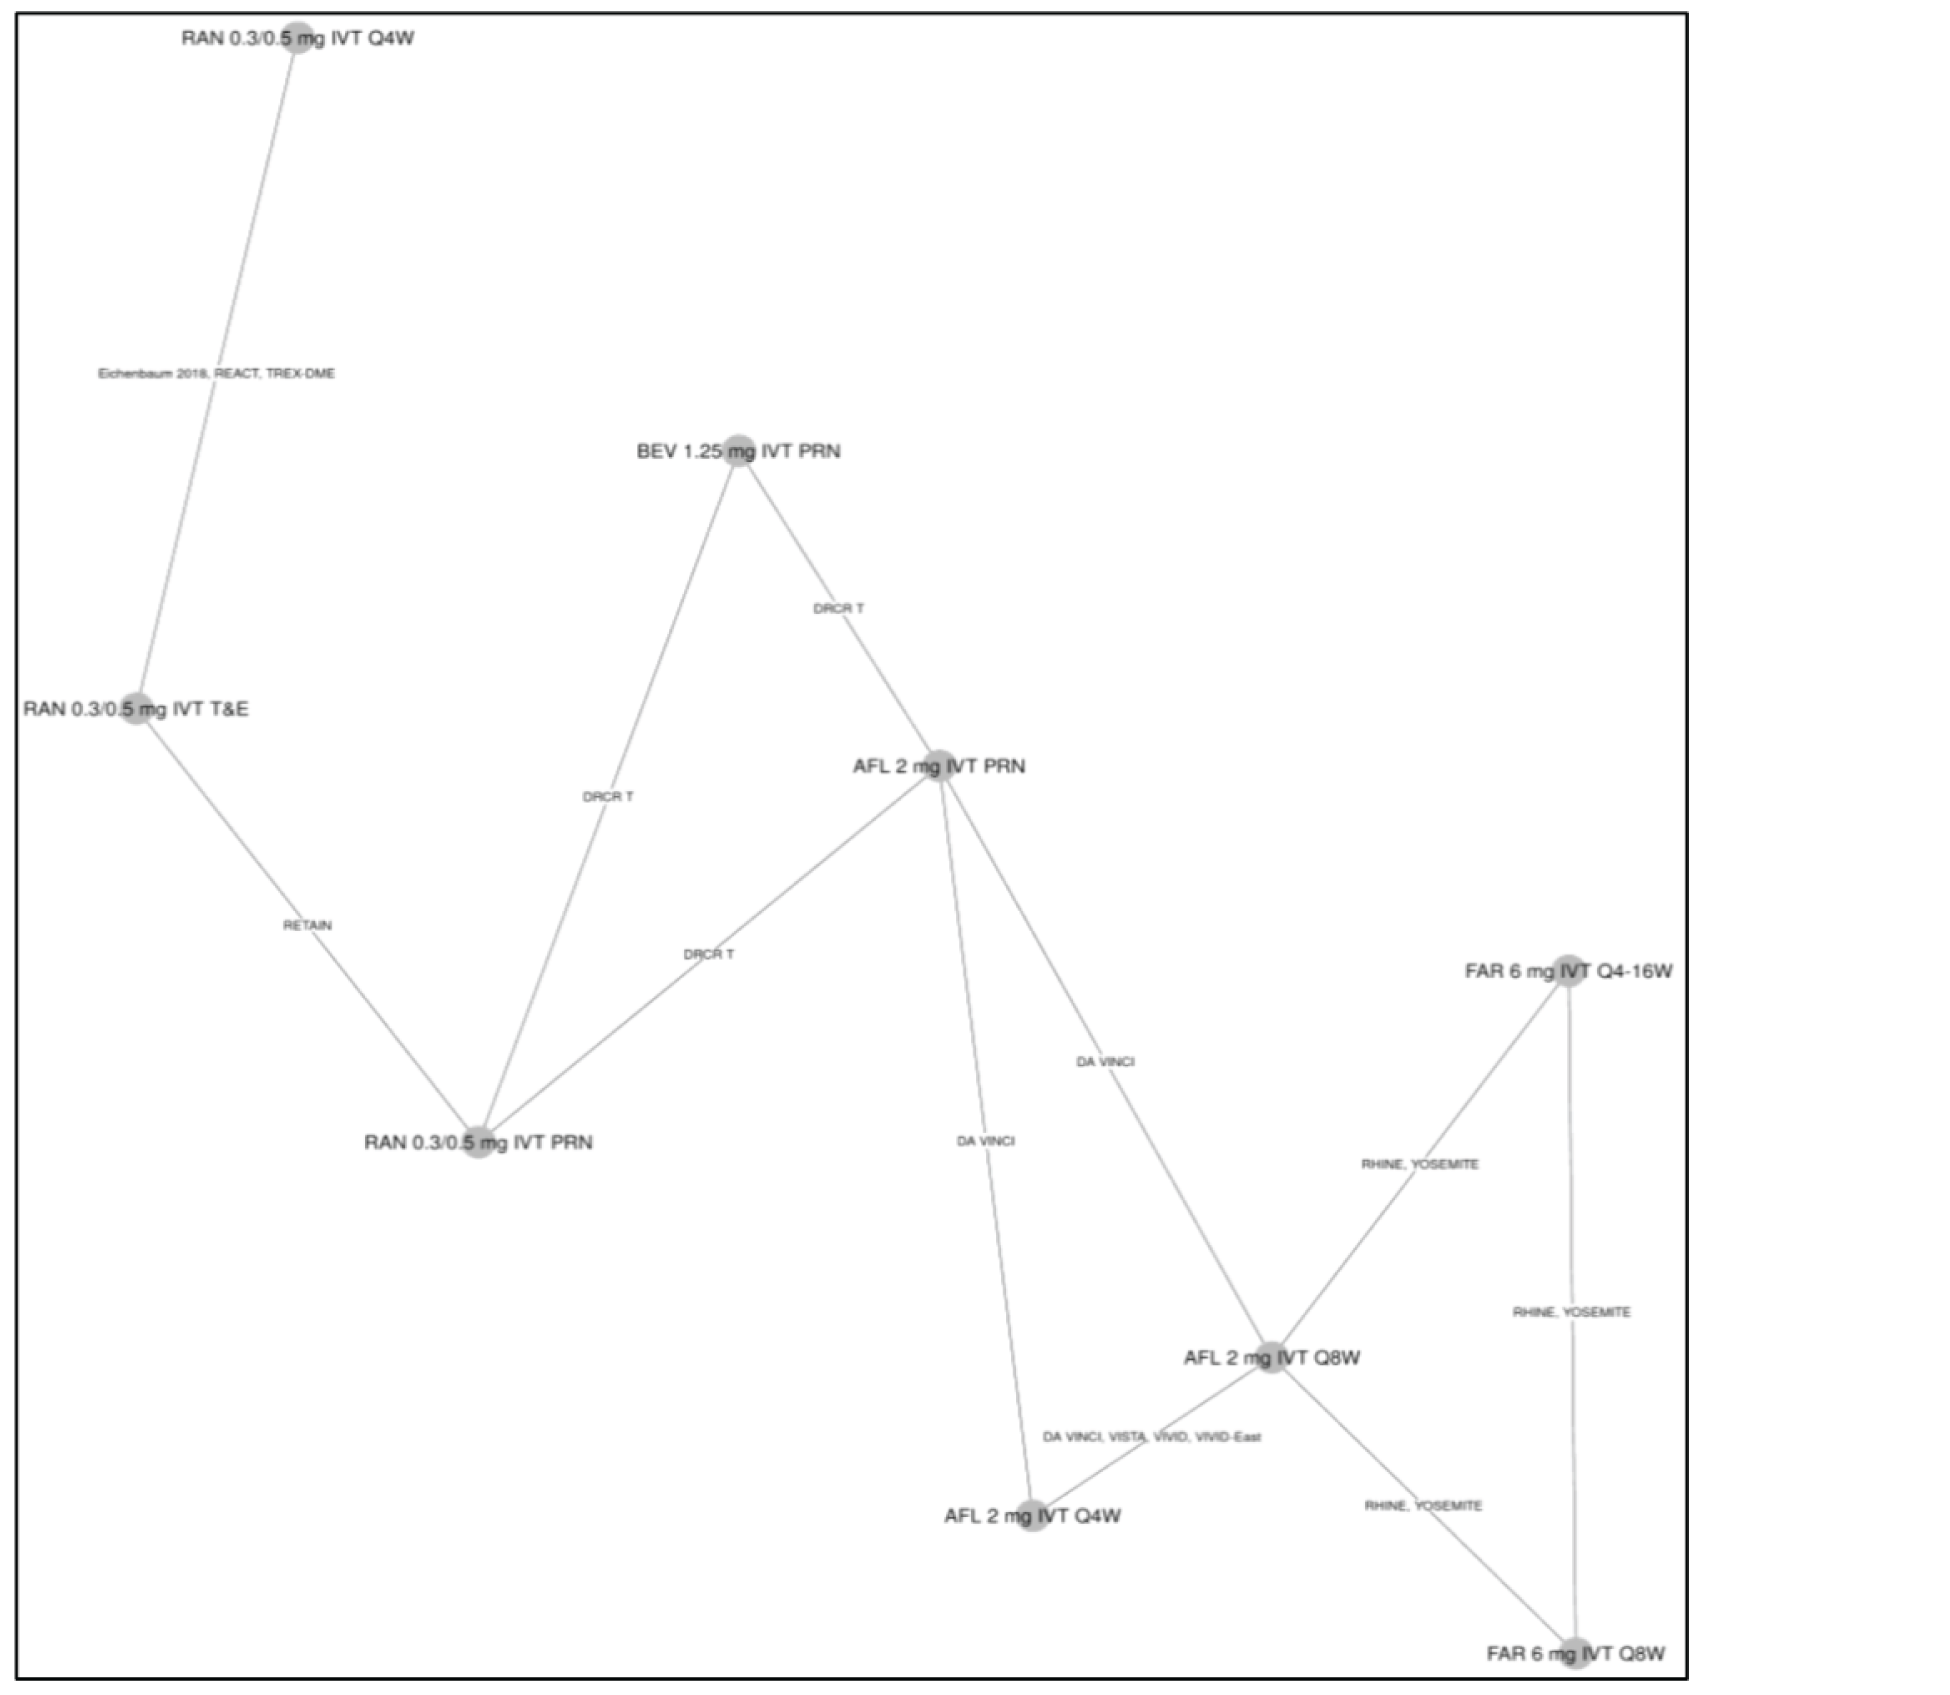
AFL = aflibercept; BEV = bevacizumab; FAR = faricimab; IVT = intravitreal; PRN = as needed; q.4.w. = every 4 weeks; q.8.w. = every 8 weeks; q.16.w. = every 16 weeks; RAN = ranibizumab; T&E = treat and extend.
Source: Sponsor-submitted ITC.62
Figure 8: Network Diagram for the Outcome of Proportion of Patients Gaining or Losing at Least 10 or 15 ETDRS Letters at 12 Months
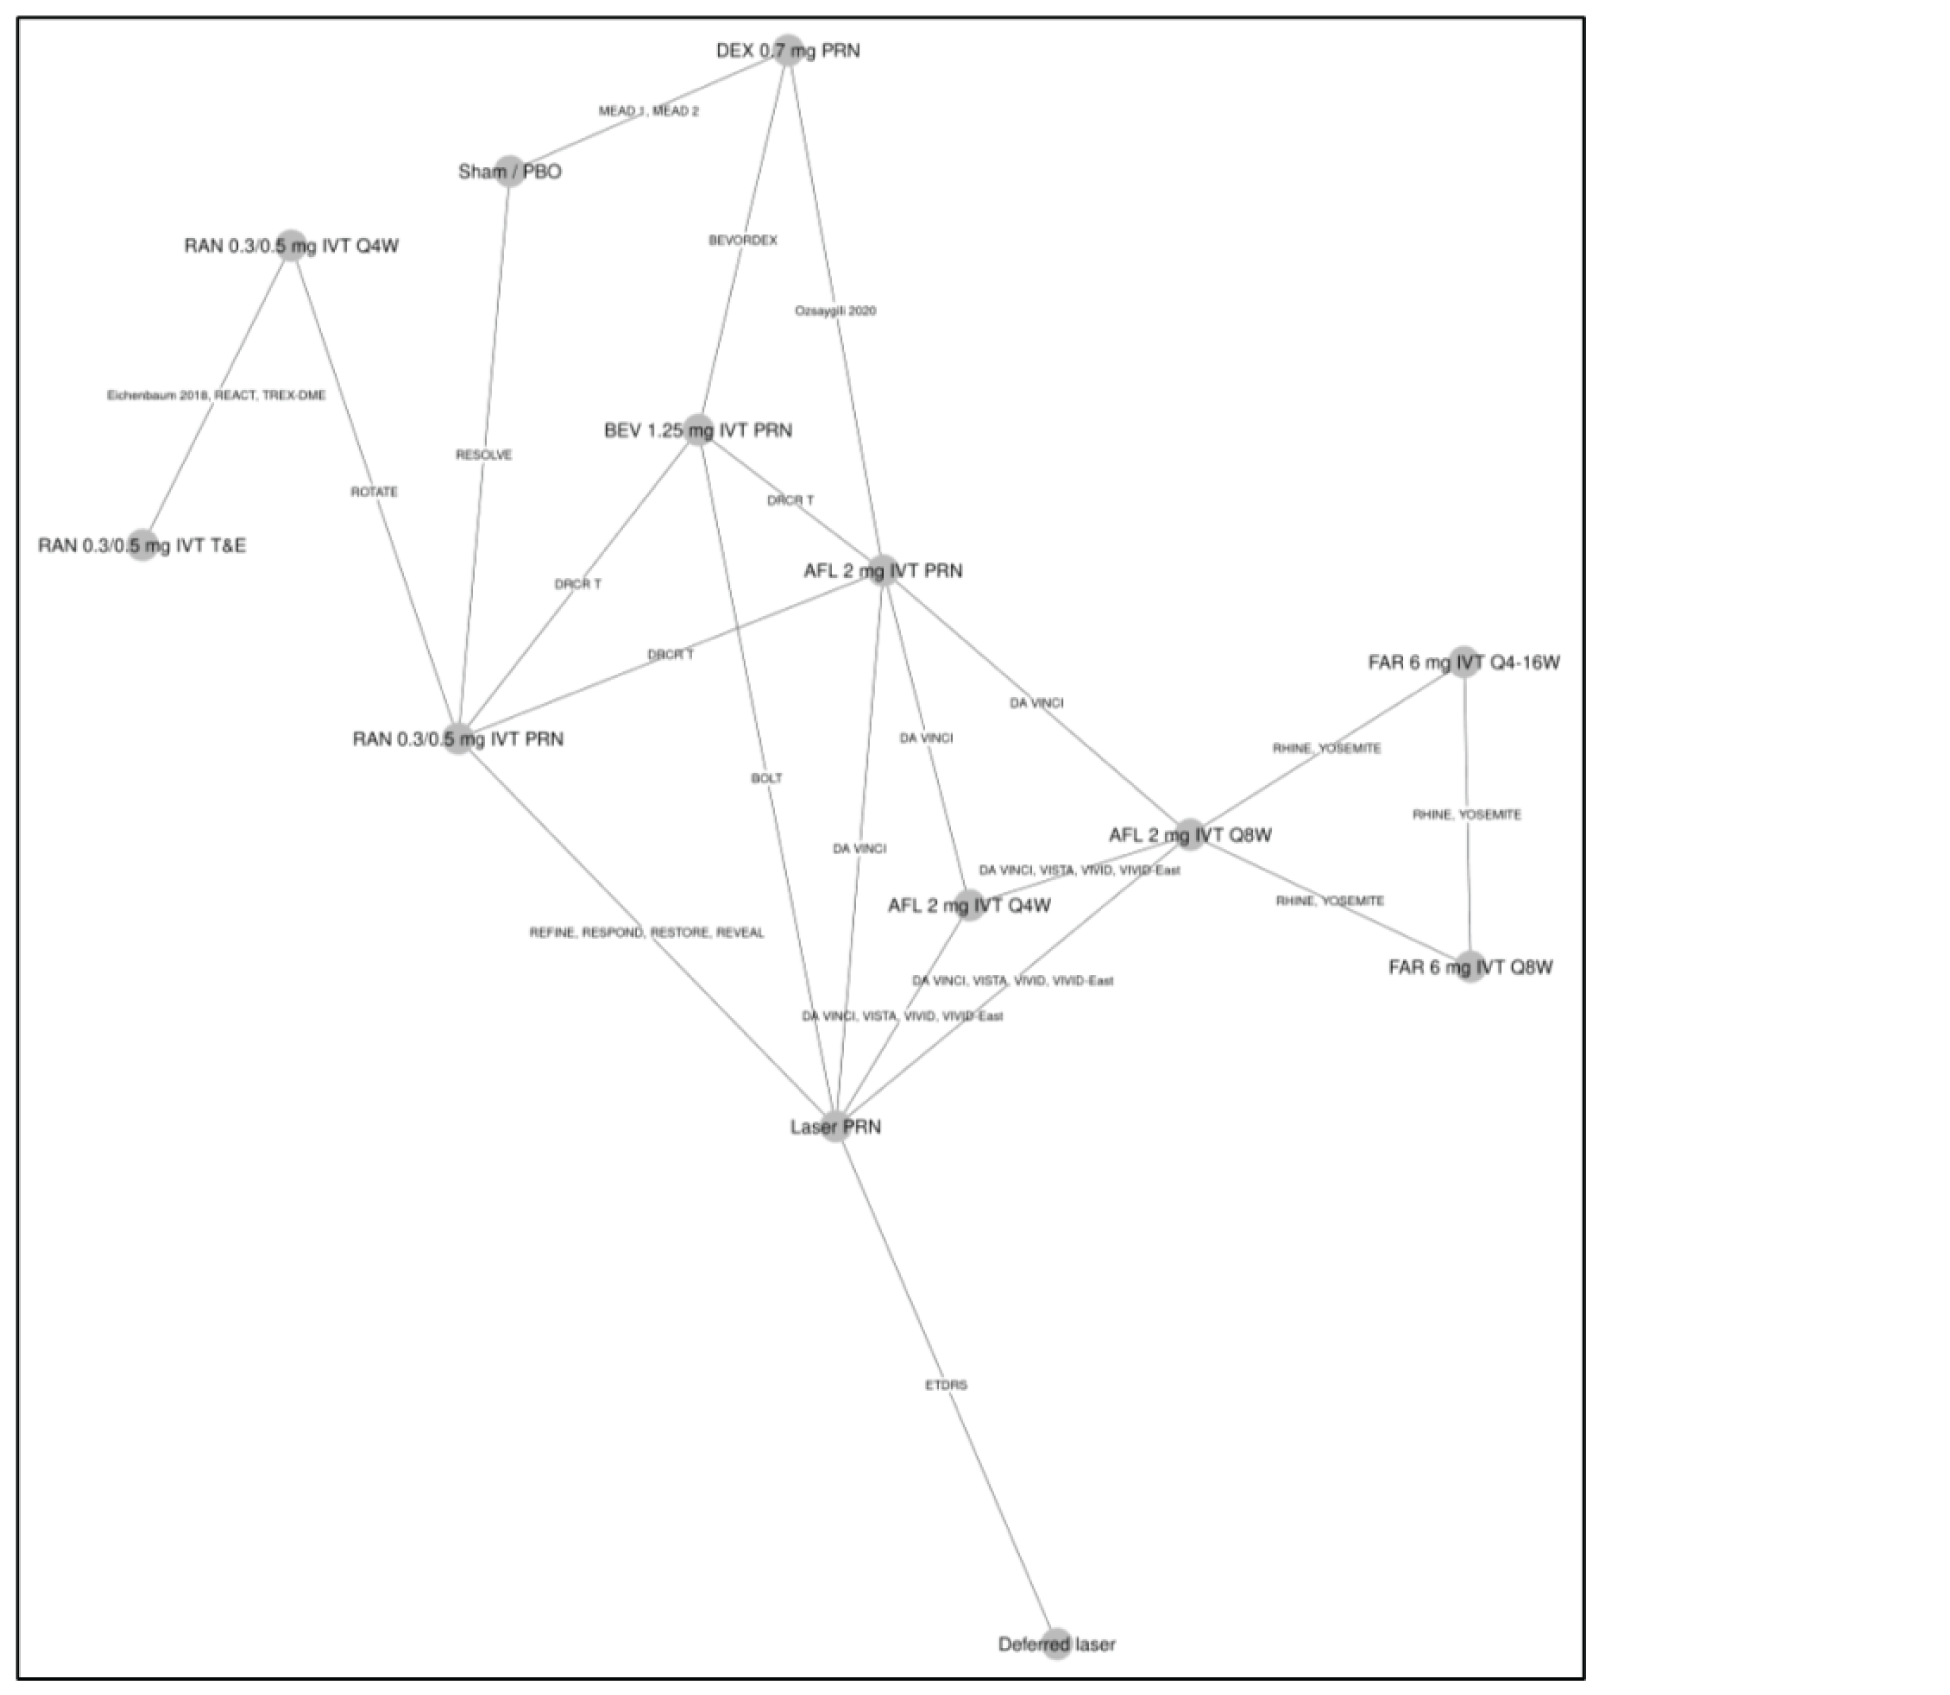
AFL = aflibercept; BEV = bevacizumab; DEX = dexamethasone; ETDRS = Early Treatment Diabetic Retinopathy Study; FAR = faricimab; IVT = intravitreal; PBO = placebo; PRN = as needed; q.4.w. = every 4 weeks; q.8.w. = every 8 weeks; q.16.w. = every 16 weeks; RAN = ranibizumab; T&E = treat and extend.
Source: Sponsor-submitted ITC.62
Table 26: Patients Gaining or Losing 10 or More or 15 or More Letters ETDRS — ITC Results
Comparator | Probit scale treatment differences (95% CrI) at 12 months, compared with PTI faricimab |
|---|---|
Number of studies, model | 22 RCTs included, random-effects model |
Bevacizumab 1.25 mg IVT PRN | –0.06 (–1.10 to 1.00) |
Aflibercept 2 mg IVT q.8.w. | –0.01 (–0.68 to 0.68) |
Faricimab 6 mg IVT q.8.w. | 0.03 (–0.65 to 0.72) |
Ranibizumab 0.3 mg/0.5 mg IVT PRN | 0.03 (–0.90 to 0.96) |
Ranibizumab 0.3 mg/0.5 mg IVT q.4.w. | 0.13 (–1.49 to 1.68) |
Aflibercept 2 mg IVT PRN | 0.18 (–0.81 to 1.19) |
Ranibizumab 0.3 mg/0.5 mg IVT T&E | 0.26 (–1.54 to 1.99) |
Aflibercept 2 mg IVT q.4.w. | 0.30 (–0.52 to 1.15) |
Comment | As the inconsistency assessment for BCVA did not show any inconsistency, an inconsistency assessment was not reported for this end point. The technical report indicated that the posterior for tau is truncated at the upper limit of the uniform prior (5), suggesting it is not well estimated. This was not resolved by increasing the upper limit, suggesting that there may be insufficient data to estimate between-study heterogeneity and there is uncertainty in these results. |
BCVA = best corrected visual acuity; CrI = credible interval; ETDRS = Early Treatment Diabetic Retinopathy Study, ITC = indirect treatment comparison; IVT = intravitreal; PRN = as needed; PTI = personalized treatment interval (refers to faricimab 6 mg IVT q.4.w. to q.16.w.); q.4.w. = every 4 weeks; q.8.w. = every 8 weeks; RCT = randomized controlled trial; T&E = treat and extend.
Note: Negative differences indicate a larger probability of gaining vision with faricimab.
Source: Sponsor-submitted ITC.62
Ocular AEs
For the outcome of all ocular AEs at 12 months, 10 trials were included in the analysis, which was conducted with a fixed-effects model, as this model had a lower DIC than the random-effects model, despite not being considered meaningful in the technical report (DIC not reported). A graphic representation of the evidence network is presented in Figure 9. The results show that no treatment was favoured (95% CrIs included 1 for the odds ratio of ocular adverse effects) for ocular AEs for most comparators. In addition, PTI faricimab may be favourable (95% CrIs included 1 for the odds ratio of ocular adverse effects) for ocular adverse effects, compared with bevacizumab 1.25 mg IVT PRN and ranibizumab 0.3 mg/0.5 mg IVT PRN. However, the CrIs were close to the null value for these results. The comparative results are outlined in Table 27.
A NMA for serious ocular adverse effects or systemic adverse effects was not reported because there were limited data available for these events.
Figure 9: Network Diagram for the Outcome of Ocular Adverse Effects at 12 Months
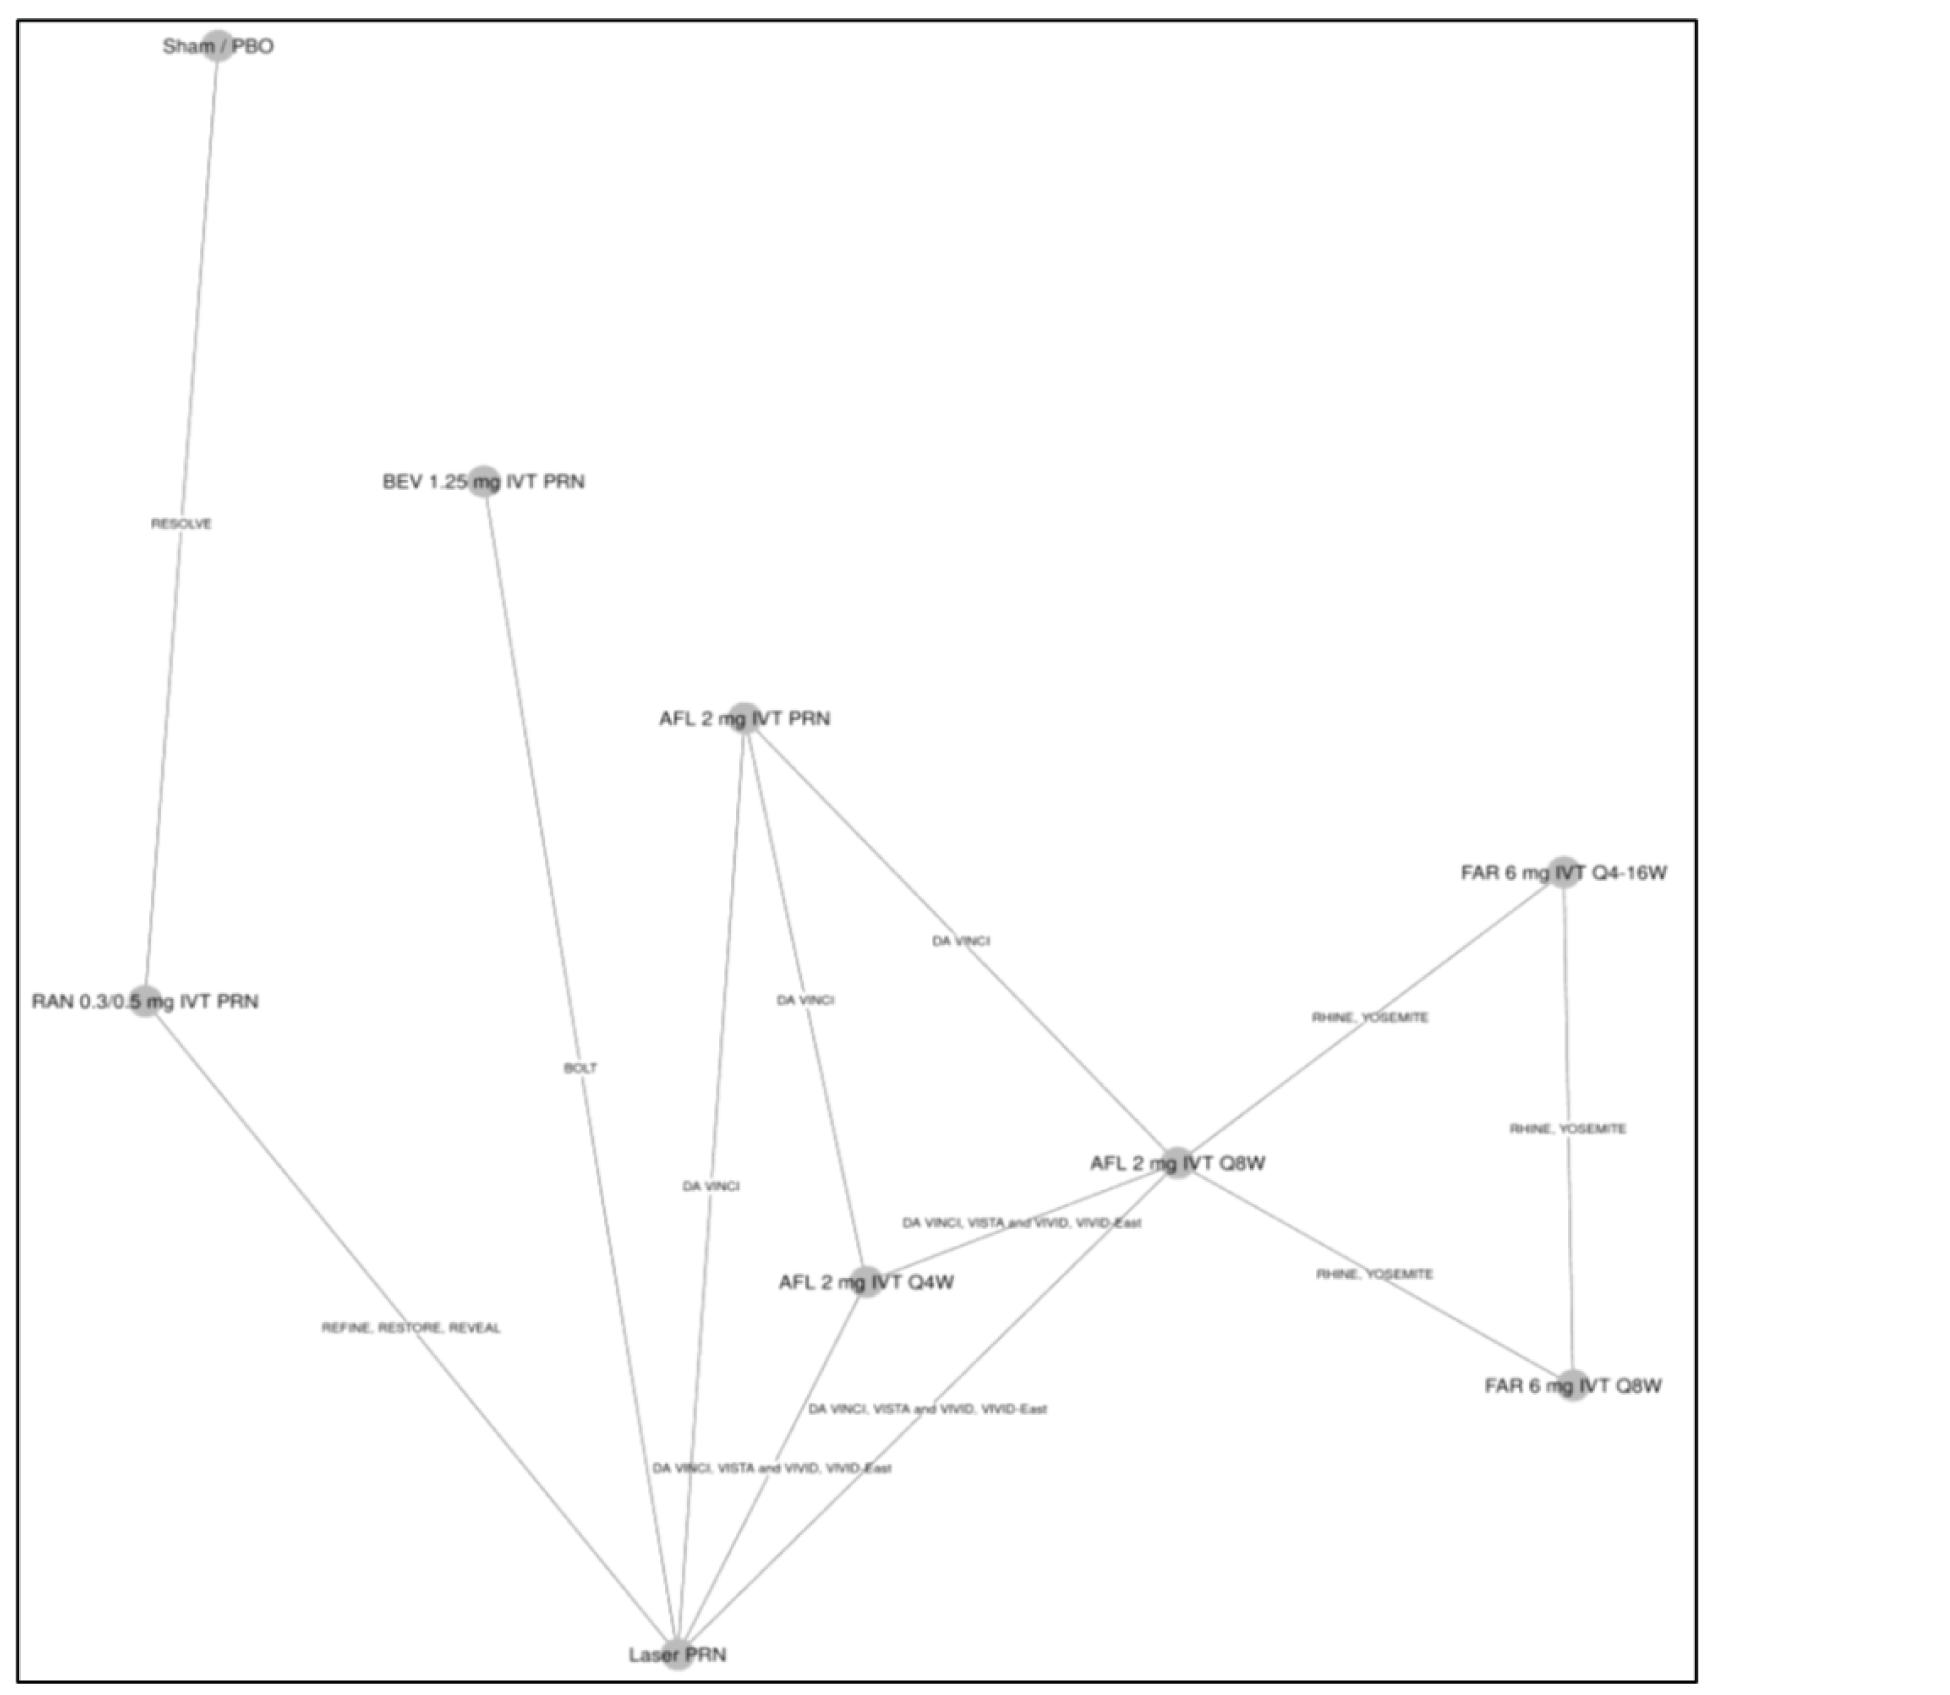
AFL = aflibercept; BEV = bevacizumab; FAR = faricimab; IVT = intravitreal; PBO = placebo; PRN = as needed; q.4.w. = every 4 weeks; q.8.w. = every 8 weeks; q.16.w. = every 16 weeks; RAN = ranibizumab.
Source: Sponsor-submitted ITC.62
Table 27: Ocular Adverse Effects — ITC Results
Comparator | Odds ratioa (95% CrI), ocular AEs at 12 months, compared with PTI faricimab |
|---|---|
Number of studies, model | 10 RCTs included, fixed-effects model |
Bevacizumab 1.25 mg IVT PRN | 0.23 (0.07 to 0.64) |
Ranibizumab 0.3 mg/0.5 mg IVT PRN | 0.54 (0.33 to 0.87) |
Aflibercept 2 mg IVT PRN | 0.86 (0.40 to 1.85) |
Faricimab 6 mg IVT q.8.w. | 0.93 (0.73 to 1.17) |
Aflibercept 2 mg IVT q.4.w. | 1.01 (0.71 to 1.45) |
Aflibercept 2 mg IVT q.8.w. | 1.06 (0.84 to 1.33) |
Comment | As the inconsistency assessment for BCVA did not show any inconsistency, an inconsistency assessment was not reported for this end point |
AE = adverse event; CrI = credible interval; IVT = intravitreal; PRN = as needed; PTI = personalized treatment interval (refers to faricimab 6 mg IVT q.4.w. to q.16.w.); q.4.w. = every 4 weeks; q.8.w. = every 8 weeks; q.16.w. = every 16 weeks; RCT = randomized controlled trial.
aOdds ratio < 1 favours faricimab.
Note: Bolded numbers indicate that the 95% CrI excludes 1.
Source: Sponsor-submitted ITC.62
Overall Treatment Discontinuation
For the outcome of overall treatment discontinuation at 12 months, the sponsor included 14 trials in the analysis, which was conducted with a fixed-effects model, as this model had a lower DIC than the random-effects model, despite not being considered meaningful in the technical report (DIC not reported). A graphic representation of the evidence network is presented in Figure 10. The results show that no treatment was favoured (95% CrIs include 1 for odds of overall treatment discontinuation), although CrIs were wide for some comparisons. The comparative results are outlined in Table 28. The authors highlight the fact that a significant share of overall treatment discontinuation events in the YOSEMITE and RHINE trials were due to patient deaths, which were not considered to be treatment-related.
Table 28: Overall Treatment Discontinuation — ITC Results
Comparator | Odds ratioa (95% CrI), overall treatment discontinuation at 12 months, compared with PTI faricimab |
|---|---|
Number of studies, model | 14 RCTs included, fixed-effects model |
Faricimab 6 mg IVT q.8.w. | 0.72 (0.47 to 1.10) |
Aflibercept 2 mg IVT q.8.w. | 0.89 (0.58 to 1.39) |
Aflibercept 2 mg IVT q.4.w. | 1.10 (0.57 to 2.08) |
Aflibercept 2 mg IVT PRN | 1.33 (0.58 to 3.09) |
Ranibizumab 0.3 mg /0.5 mg IVT PRN | 1.67 (0.81 to 3.40) |
Bevacizumab 1.25 mg IVT PRN | 1.74 (0.65 to 4.92) |
Comment | As the inconsistency assessment for BCVA did not show any inconsistency, an inconsistency assessment was not reported for this end point |
BCVA = best corrected visual acuity; CrI = credible interval; ITC = indirect treatment comparison; IVT = intravitreal; PRN = as needed; PTI = personalized treatment interval (refers to faricimab 6 mg IVT q.4.w. to q.16.w.); q.4.w. = every 4 weeks; q.8.w. = every 8 weeks; q.16.w. = every 16 weeks; RCT = = randomized controlled trial.
aOdds ratio < 1 favours faricimab.
Source: Sponsor-submitted ITC.62
Figure 10: Network Diagram for the Outcome of Overall Treatment Discontinuation at 12 Months
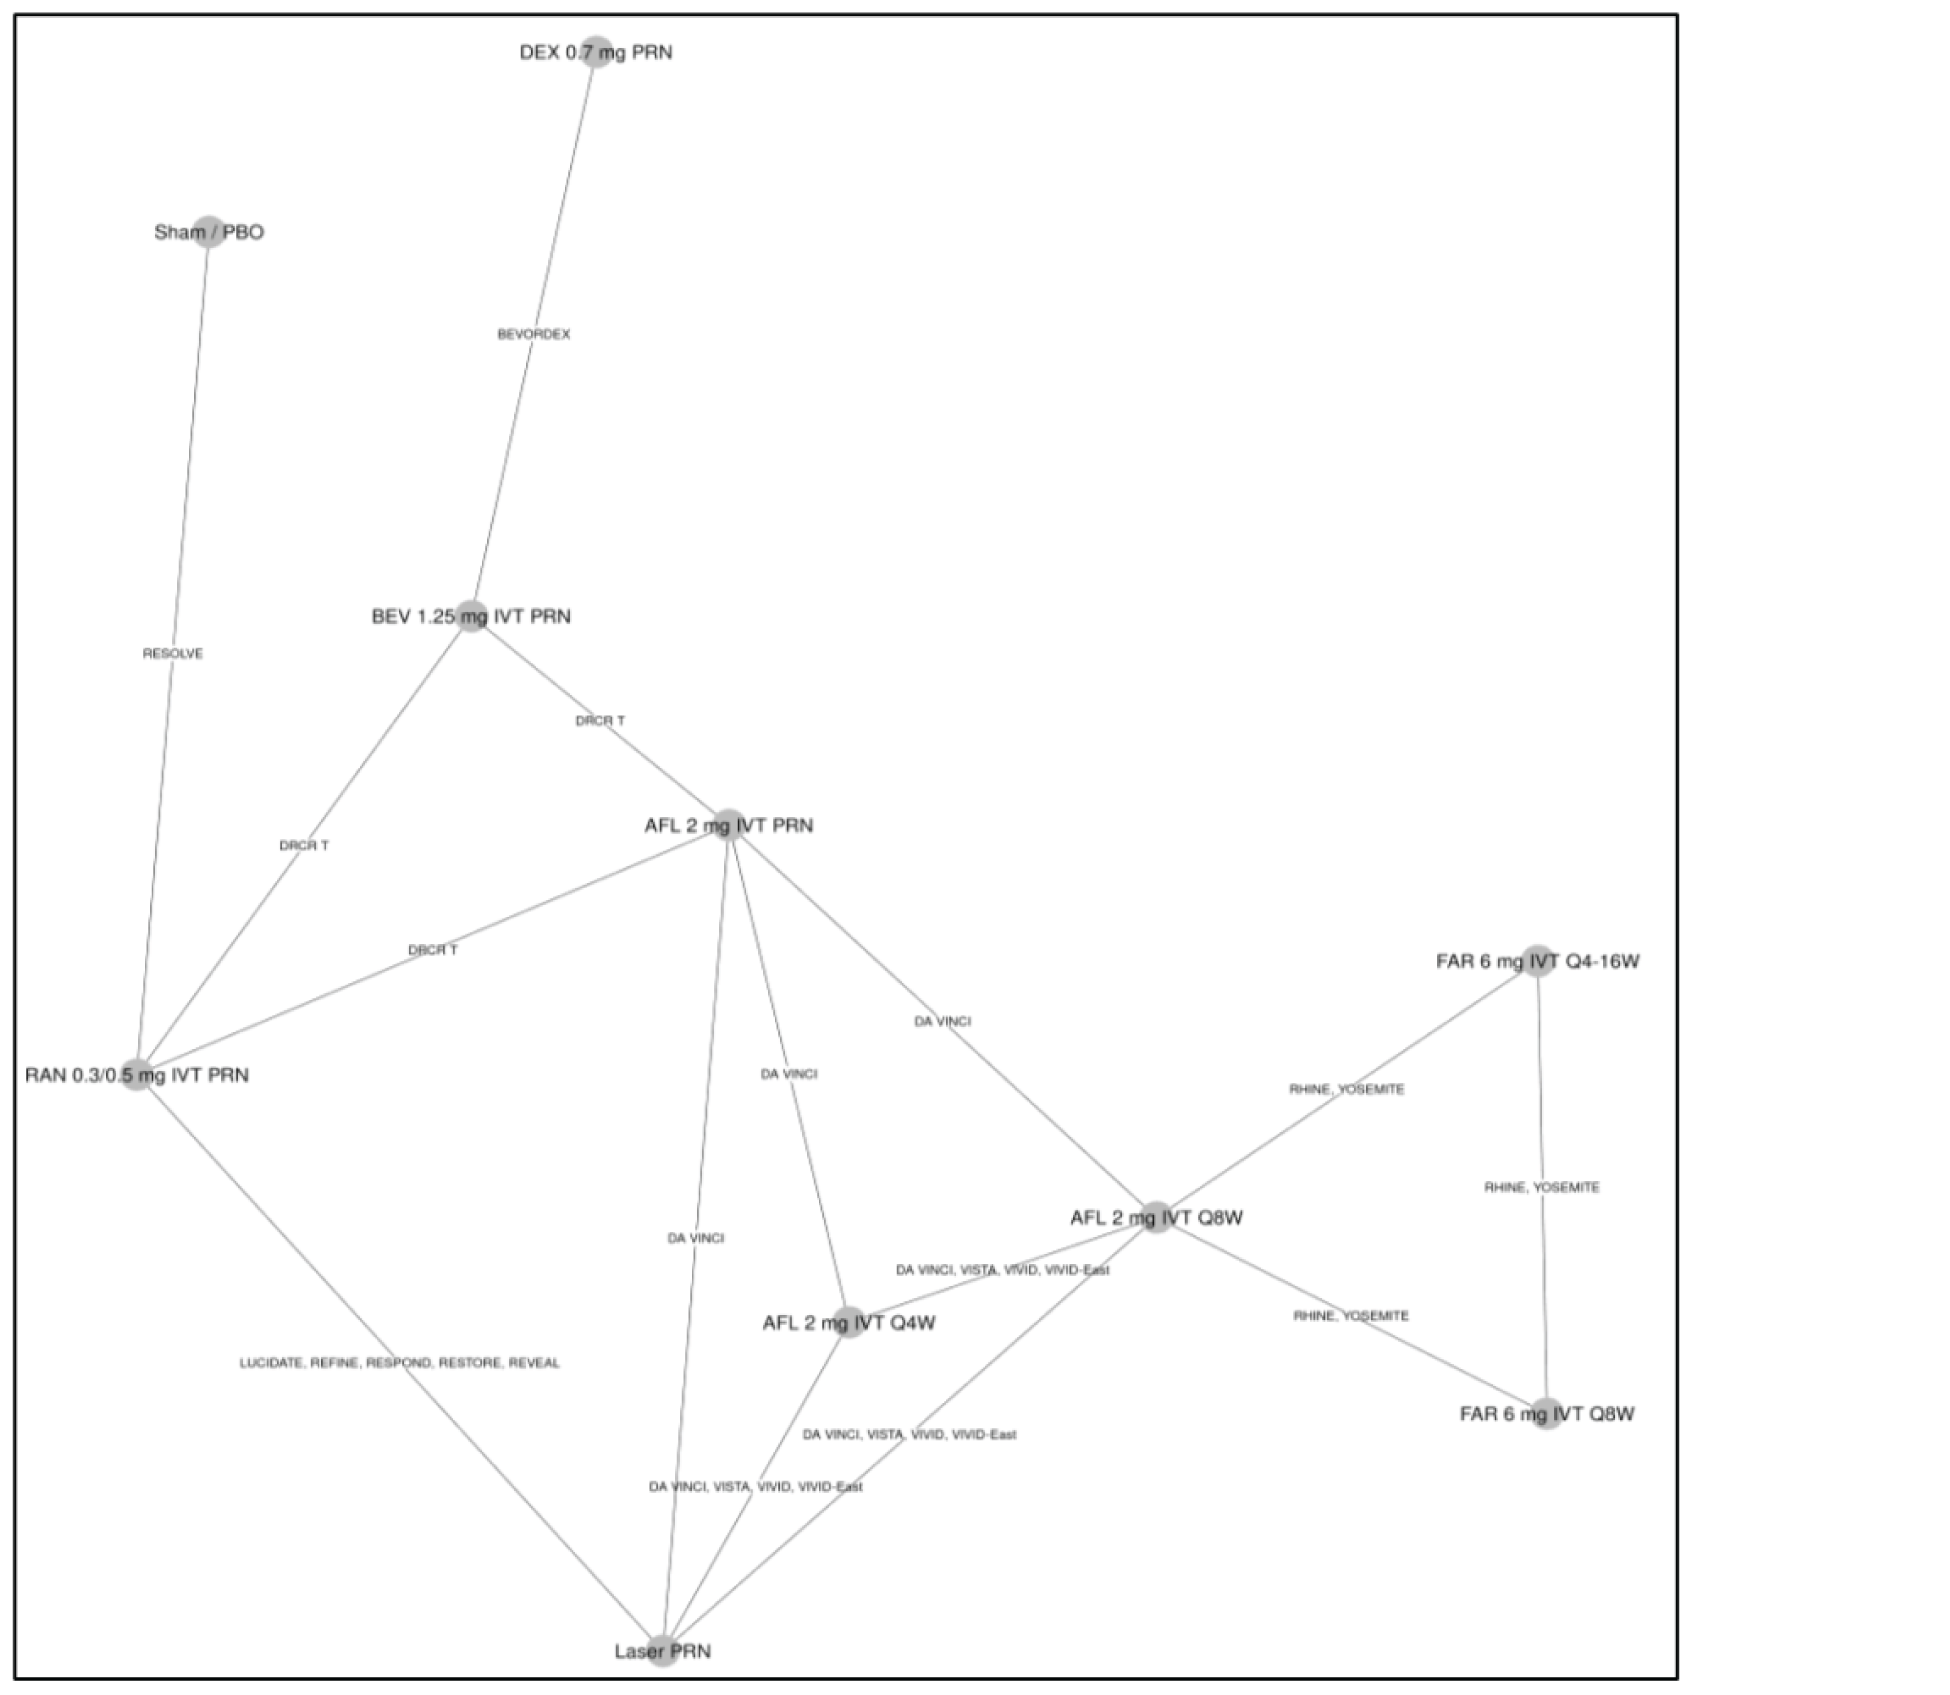
AFL = aflibercept; BEV = bevacizumab; DEX = dexamethasone; FAR = faricimab; IVT = intravitreal; PBO = placebo; PRN = as needed; q.4.w. = every 4 weeks; q.8.w. = every 8 weeks; q.16.w. = every 16 weeks; RAN = ranibizumab.
Source: Sponsor-submitted ITC.62
Subgroup
The sponsor reports that networks for the anti-VEGF treatment-naive population could be formed for BCVA score change and BCVA letter categories. The results for the anti-VEGF treatment-naive population are consistent with the base-case analysis and demonstrate that faricimab is associated with efficacy that is not different than all comparators in terms of mean change in BCVA from baseline to 12 months. Results were not reported.
Sensitivity Analyses
The sponsor reports that general random and fixed-effects models were consistent and did not show differences in model fit or results; however, these results were not included in the technical report.
A sensitivity analysis was conducted for mean change in BCVA score without studies that allowed laser rescue therapy (DA VINCI, DRCR Network Protocol T, RESOLVE, RIDE, RISE, TREX-DME). The results are consistent with the base case, and show that PTI faricimab was not different (95% CrIs contain the null value) than aflibercept 2 mg IVT at 4-week and 8-week intervals, bevacizumab PRN, or 8-week faricimab for the outcome of BCVA. In addition, PTI may be favourable (95% CrIs did not include the null value) to ranibizumab treat and extend, PRN, and 4-week intervals, and to aflibercept PRN for the outcome of BCVA.
Critical Appraisal of Sponsor-Submitted ITC
The research question and inclusion criteria for the systematic review were reported in the ITC and feasibility assessment. The ITC was based on a systematic literature review that identified studies according to pre-specified inclusion criteria. A comprehensive and transparent approach to their systematic review was provided, including the search strategy, and the search was conducted of several databases. The literature search was comprehensive and involved multiple databases. The literature search was well reported, with a complete copy of the search strategy included in the report. Study selection was performed by 2 reviewers. Data extraction was performed by 1 reviewer and verified by a second reviewer independently. Any disagreements were resolved through consensus. A comprehensive list of inclusion and exclusion criteria for the studies included in the systematic literature review was included. A risk-of-bias evaluation for the studies included in the systematic literature review was performed, based on a tool that considered the appropriateness of randomization and allocation concealment, for the similarity at baseline of prognostic factors across treatment groups, masking, imbalances in dropouts, outcomes reporting, and ITT analysis. It was not reported whether the risk-of-bias assessments were performed in duplicate. However, the risk-of-bias assessment for the studies ultimately included in the NMA was not presented, and it was not reported how the results of the quality appraisal factored into the NMA (e.g., sensitivity analyses excluding studies rated with a high risk of bias).
The inclusion criteria would allow a population that is relevant to Canadian settings. The comparisons reported in this ITC have generally incorporated treatments relevant to Canadian settings, including treatments that have extensive clinical use but lack a formal review from Health Canada, such as bevacizumab, which is commonly used in Canada.
The degree of heterogeneity among the included studies was difficult to assess because of incomplete reporting of study characteristics. Description of trial design, sample size and duration, and country were reported. However, the ITC failed to report information related to allocation concealment and methods used for handling missing data. There was considerable variability in study design, year of conduct, and sample size. There is variability in ranibizumab dosing in the included trials, which included doses of 0.3 mg IVT, 0.5 mg IVT, 0.3 mg to 0.6 mg IVT PRN, and 0.5 mg to 1.0 mg IVT PRN. The technical report indicates that these trials included arms that were pooled for the NMA for increased network connectivity. The degree of similarity in these trials was not reported. A sensitivity analysis that addressed the effect of pooling these doses was not presented. Phase II trials were included; however, a sensitivity analysis that addressed the effect of pooling these types of trials was not presented.
Similarly, inadequate information about the baseline patient characteristics and the variability in baseline patient characteristics that are reported contribute to heterogeneity in the studies included in the ITC. Clinical trial eligibility criteria were described for the trials ultimately included in the NMA. However, many individual studies failed to report or inadequately reported patient characteristics, resulting in gaps in the extracted ITC data. There was a lack of information about key baseline characteristics, such as the presence of significant diabetic macular ischemia, IRF, and systemic comorbidities, including hypertension, chronic kidney disease, obesity, and cardiac conditions.
In addition to the lack of reporting of certain factors, of those that were reported, baseline values were heterogeneous across studies. There was heterogeneity in baseline patient characteristics, including age, sex distribution, race, duration of diabetes mellitus, hemoglobin A1C, and duration of DME. There was also heterogeneity in the reporting of methods for measuring and in results of changes in retinal thickness. The apparent heterogeneity, based on factors that were reported in combination with the inability to assess those that were not reported, means that there is considerable uncertainty about whether the assumptions related to homogeneity were met. The clinical expert that CADTH consulted agreed that patient populations and study methodologies were heterogenous. The technical report provides no evidence that the treatment effect differed by patient characteristics or that model fit was improved with the patient characteristic meta-regressions; however, meta-regression was only performed for baseline BCVA and CST. Furthermore, the technical report notes that for the outcome of the proportion of patients gaining or losing 10 or more or 15 or more ETDRS letters at 12 months, there was insufficient data to compare heterogeneity between studies, making the models unstable and the results uninterpretable. Despite an acknowledgement of the degree of heterogeneity, the technical report did not provide sufficient information of assessments of heterogeneity (e.g., graphic representation of baseline characteristics, statistical tests) to fully understand the sources of heterogeneity. Therefore, the potential that heterogeneity could have influenced the comparative efficacy and safety estimates is plausible, and it is not possible to quantify or identify the direction of the bias. The analytical method used for the ITC was well reported. The authors provided a description of which studies were included in each of the analyses. Study outcomes in the ITC were of interest for the CADTH systematic review protocol. The analysis of the extracted data followed the framework suggested by the National Institute for Health and Care Excellence, including the use of noninformative priors. The sponsor’s ITC reported on the number of burn-ins and convergence characteristics.
The authors describe the lack of evidence that the treatment effect differed by patient characteristic or that model fit was improved with patient characteristic (BCVA and CST) meta-regressions, although these results were not provided. The meta-regression NMA is the base case for efficacy outcomes. The convergence diagnostics and model fit were good in most cases and, where fit was poor, it was described in the relevant section.
Additional limitations to the ITC include the following:
There was a weak connection between faricimab and the rest of the network; faricimab is only connected to the network through aflibercept in the YOSEMITE and RHINE trials. This may contribute to uncertainty in the models. The networks consider a large number of interventions, as every dosing regimen explored was considered as a separate node. Although there are some closed loops for some networks, overall, the nodes were connected by few trials. The geometry of the networks likely contributed to uncertainty in the estimates for models of the level of imprecision in certain comparisons, as evidenced by wider CrIs.
The ITC suggests that ||||||||||||||||||||||||||||||||||||||||||||||||||||||||||||||||||||||||||||||||||||||||||||||||||||||||||||||||||||||||||||||||||||||||||||||||||||||||||||||||||||||||||||||||||||||||||||||||||||||||||||||||||||||||||||||||||||||||||||||||||||||||||||||||||||||||||||||||||||||||||||||||||||||||||||||||||||||||||||||||||||||||||||||||||||||||||||||||||||||||||||||||||||||||||||||||||||||||||||||||||||||||||||||||||||||||||||||||||||||||||||||||||||||||. These results were consistent with the sensitivity analysis, which excluded trials in which rescue laser therapy was allowed.
The results show that faricimab ||||||||||||||||||||||||||||||||||||||||||||||||||||||||||||||||||||||||||||||||||||||||||||||||||||||||||||||||||||||||||||||||||||||||||||||||||||||||||||||||||||||||||||||||||||||||||||||||||||||||||||||||||||||||||||||||||||||||||||||||||||||||||||||||||||||||||. However, 95% CrIs are wide. In addition, heterogeneity in the methods used to assess retinal thickness across studies adds considerable uncertainty to the results for this analysis and limits the conclusions about the relative effect of faricimab on retinal thickness. A sensitivity analysis addressing different methods used to measure retinal thickness was not presented.
The results show |||||||||||||||||||||||||||||||||||||||||||||||||||||||||||||||||||||||||||||||||||||||||||||||||||||||||||||||||||||||||||||||||||||||||||||||||||||||||||||||||||||||||||||||||||||||||||||||||||||||||||||||||||||||||||||||||||||||||||||||||||||||||||||||||||||||||||||||||||||||||||||||||||||||||||||||| these data are affected by administration of therapies with fixed intervals in clinical trials, according to protocols within the 1-year time frame of the RCTs. In addition, the point estimate and CrIs for aflibercept and 8-week faricimab 6 mg were very close to the null value. The clinical expert stated that once patients are stabilized, most are treated with a treat-and-extend protocol, so regimens with frequent fixed dosing may not be the most appropriate comparators.
Poor model fit precludes the ability to draw conclusions from the data on the effect of faricimab, compared with comparators, on the gain or loss of 10 or more or 15 or more ETDRS letters.
There were limited data available for the NMAs that were conducted for ocular adverse effects and for overall treatment discontinuation, so fixed-effects models were used for these end points. Therefore, there are limited data from which to draw any conclusions about the effect of faricimab, compared with comparators, on ocular adverse effects and overall treatment discontinuation.
Other Relevant Evidence
No studies providing additional relevant evidence were identified for this review.
Discussion
Summary of Available Evidence
This report summarizes the evidence on faricimab for patients with DME from 2 phase III RCTs and 1 ITC.
Two studies, YOSEMITE and RHINE, met the inclusion criteria for the systematic review section. They were identically designed phase III RCTs that evaluated the noninferiority of faricimab (8-week or PTI) to aflibercept through the change from baseline in BCVA (ETDRS letter) averaged over weeks 48, 52, and 56 in the ITT population as a primary end point. The mean age of enrolled patients at baseline in these studies was about 62 years, and the majority were male (> 57%) and White (> 76%). The median time since the diagnosis of DME was 3.1 months in YOSEMITE and 6.6 months in RHINE; mean baseline CST was 487.5 µm in YOSEMITE and 471.6 µm in RHINE; and the mean baseline BCVA scores was approximately 62 letters in both studies. Slightly more than 1 in 5 patients had been previously treated with an anti-VEGF (20% in RHINE and 23% in YOSEMITE). Outcomes included changes in BCVA, anatomic outcomes, DRS, vision-related function, HRQoL, and harms, with a primary analysis at 56 weeks and data up to 100 weeks.
One sponsor-submitted ITC was summarized and critically appraised. The sponsor performed a NMA to estimate the effectiveness and safety of faricimab in patients with DME compared with other anti-VEGFs (aflibercept, bevacizumab, ranibizumab), dexamethasone IVT implants, laser therapy, and placebo or sham. The outcomes of the NMA included change from baseline in BCVA, proportion of patients with a gain or loss of at least 10 or at least 15 ETDRS letters, retinal thickness (CST), number of injections, treatment discontinuation, ocular AEs, and ocular or systemic SAEs.
Interpretation of Results
Efficacy
The results of YOSEMITE and RHINE support the noninferiority, but not superiority, of 2 dosing regimens for faricimab 6 mg (the 8-week faricimab arm consisted of 6 monthly loading doses followed by maintenance injections every 8 weeks, and the PTI faricimab arm consisted of 4 monthly loading doses followed by dosing at 4-, 8-, 12-, or 16-week intervals during the maintenance phase, based on patient outcomes), compared with aflibercept 2 mg (which consisted of 5 monthly loading doses followed by injections every 8 weeks). Patients with DME treated with either 8-week or PTI faricimab had a mean change in BCVA from baseline averaged over weeks 48, 52, and 56 that was noninferior aflibercept, based on an ITT analysis. A supplementary per-protocol analysis confirmed the conclusion of noninferiority in the primary ITT population. As well, several sensitivity analyses conducted by the sponsor and by the FDA confirmed the findings of each study. Results were consistent for change from baseline BCVA averaged over weeks 92, 96, and 100. The superiority of 8-week or PTI faricimab over aflibercept was not established in either the treatment-naive or the ITT population for the primary end point.
Results of pre-specified subgroup analyses based on baseline BCVA (≥ 64 ETDRS letters and ≤ 63 ETDRS letters), prior IVT anti-VEGF use (yes or no), baseline hemoglobin A1C (≤ 8% and > 8%), and baseline DRS (< 47, 47 to 53 and > 53 ETDRS DRSS), were mostly consistent with results from the overall study population for change from baseline BCVA averaged over weeks 48, 52, and 56 between the 2 faricimab (8-week and PTI) arms and the aflibercept arm. Because of the lack of sample size considerations, control for multiplicity, and statistical testing for treatment-by-subgroup interaction, no conclusions related to subgroup effects can be drawn.
For the secondary outcomes of patients with a gain or loss of at least 15, at least 10, at least 5, or at least 0 ETDRS letters averaged over weeks 48, 52, and 56, proportions were numerically comparable in all treatment arms in both studies. The majority of patients in all treatment groups were able to gain vision at 1 year (around 30% gained at least 15 letters and more than 50% gained at least 10 letters) or avoid a loss of vision (95% or more avoiding a loss of 5 or more letters), which are clinically important outcomes in the treatment of DME. According to the clinical expert, a gain of 15 letters on ETDRS chart reflects a large clinical improvement, a halving of the visual angle. Results for these outcomes at year 2 were mostly consistent with those at year 1. No conclusion, however, can be made regarding the comparative effects between faricimab and aflibercept for these secondary outcomes, given that the study was not adequately designed for these comparisons and results were based on observed data only, with no imputation for missing data. Therefore, the secondary and exploratory results for the additional BCVA outcomes are only supportive of the efficacy of faricimab, and should be interpreted in light of the limitations in the analysis.
The change in CST (ILM-BM) from baseline and the absence of DME (CST < 325 µm for Spectralis SD-OCT) were secondary outcomes in the studies. In both YOSEMITE and RHINE, reductions in CST (ILM-BM) from baseline to weeks 48, 52, and 56, as well as a the proportion of patients with an absence of DME at weeks 48, 52, and 56, were numerically greater in the 8-week and PTI faricimab arms than in the aflibercept arm. However, the numerical difference in CST between the faricimab and aflibercept arms did not reflect a meaningful change, according to the clinical expert consulted by CADTH. The expert thought the difference in proportion of patients with an absence of DME could be more meaningful, as this measure could potentially be used in practice to help determine when to extend dosing intervals. At weeks 92, 96, and 100, the change in CST and the proportion of patients without DME were comparable in the PTI faricimab arm and the aflibercept arm of the 2 studies. Although these results are supportive of the efficacy of faricimab, no conclusion can be made regarding the comparative effects of faricimab and aflibercept, given that the studies did not adjust for multiple comparisons for secondary outcomes and given that there is an increased risk of type I error.
The frequency of injection was noted to be an important outcome of interest by both patient and clinician groups, as it has implications for the frequency of AEs, HRQoL, and burden of treatment. The mean number of treatment injections was reported descriptively in the studies in the summary of treatment exposure. The mean number of injections was numerically lower in the PTI faricimab arm than in the aflibercept arm by approximately 0.6 to 0.8 injections (median = 2 injections) at 56 weeks and by approximately 1.3 to 1.8 injections (median = 3 to 4 injections) over the 100-week study period in both YOSEMITE and RHINE. The proportion of patients at different dosing intervals in the PTI faricimab arm was a secondary outcome. At 52 weeks, slightly more than 50% of patients in the PTI faricimab arm of the 2 studies were on a 16-week dosing interval, which rose to slightly more than 60% at 96 weeks. However, some patients were also on 4-week intervals at week 52 (11% to 13%) and week 96 (7% to 10%). Differences in the number and frequency of injections among study arms must be interpreted in light of the study design, as patients in the PTI faricimab arm could have their dosing interval extended, reduced, or maintained after randomization, depending on assessments made at study drug dosing visits, using a pre-established algorithm, based on relative change in CST and BCVA, whereas patients in the aflibercept arm remained on a fixed 8-week interval during the maintenance phase. It is unknown how faricimab and aflibercept would compare if both were dosed with a treat-and-extend approach. The Canadian product monograph for aflibercept allows for a treat-and-extend approach after the first year of treatment, which was not applied in the studies, although the clinical expert CADTH consulted stated that it is uncommon to extend the interval for aflibercept beyond 9 weeks. Further, the clinical importance of the between-group difference in the number of injections is difficult to determine. It is unknown how many injections avoided in 1 or 2 years would have had a meaningful impact on HRQoL or reduced the burden of disease for patients. However, the expert noted that differences in injection frequency were expected to be small in the first year, given the standard loading doses, and greater differences may not be seen until subsequent years of use.
The change from baseline in NEI VFQ-25 composite score, which measures vision-related functions and some aspects of HRQoL, was a secondary outcome in YOSEMITE and RHINE. Many subscales of NEI VFQ-25 reflected vision-related functions that were noted to be highly relevant to the functioning of patients with DME in the patient group input (general vision, mental health, social functioning, dependence, and driving). The validity of the NEI VFQ-25 in patients with DME has been evaluated. In the YOSEMITE and RHINE studies, improvements in the composite score were observed in all treatment arms (6.6 to 7.9 point improvement in score from baseline at week 52 per arm), with the magnitude of change meeting the estimated MID range reported in the literature at week 56 and week 100 (i.e., between 3.3 and 6.13 points).63 As with other outcomes, no conclusion could be drawn from the results available for between-group comparisons.
The proportion of patients who met standard for driving eligibility commonly used in the US and the definition of legal blindness measured with BCVA scores averaged over weeks 48, 52, and 56 were secondary outcomes in the pivotal studies. The proportions for both outcomes were comparable in the treatment arms within and across studies. Approximately 69% to 77% across treatment arms in YOSEMITE and RHINE met the 20/40 standard for driving (or better), whereas very few patients (6 or fewer in each treatment arm) had vision acuity at or below the standard for legal blindness (20/200). The aforementioned limitations for the other secondary outcomes also apply to these findings.
The pivotal trials measured the proportion of patients with an absence of IRF and SRF as secondary outcomes. IRF and SRF, indicators of active disease, are noted with care by clinicians for the qualitative assessment of OCT. According to the clinical expert consulted by CADTH, IRF is a more relevant outcome than SRF in patients with DME, noting that SRF is uncommon in DME and is a marker for severe DME. The proportion of patients with an absence of IRF was numerically higher in the faricimab arms than in the aflibercept arm in both studies at week 56; however, the differences between the PTI faricimab arm and the aflibercept arm were smaller than those between the 8-week faricimab arm and the aflibercept arm, and the absence of IRF was comparable in the PTI faricimab arm and the aflibercept arm at week 100. At week 56, more than 95% of patients across treatment arms in both studies had an absence of SRF. No conclusion can be made about between-treatment differences because of the lack of control for type I error.
The clinical group input named regression on DRSS as a clinically meaningful outcome. There were conflicting results between YOSEMITE and RHINE in the proportion of patients with a change of at least 2 steps on the ETDRS DRSS from baseline at week 52, which was a key secondary end point in the studies. In YOSEMITE, noninferiority for this end point was met; however, in RHINE, noninferiority was not met for this outcome as the lower bound of the 97.5% CI for the difference in the adjusted proportion between the faricimab and aflibercept arms was less than –10% for both the 8-week and PTI faricimab arms. No rationale was provided for the choice of –10% as the noninferiority margin; however, it was considered reasonable by the clinical expert consulted by CADTH. Results of the per-protocol were similar to those of the main analysis, although at week 96, there was a generally comparable proportion of patients in the faricimab and aflibercept arms of both studies achieving an improvement of 2 or more steps on the ETDRS DRSS from baseline. Reasons for the different results on this outcome between YOSEMITE and RHINE at week 52 are unclear. A comparable proportion of patients in the 8-week faricimab arm, the PTI faricimab arm, and the aflibercept arm achieved an improvement of 3 or more steps on the ETDRS DRSS from baseline at week 52, whereas very few patients across treatment arms in both studies experienced a worsening of at least 2 steps or at least 3 steps on the ETDRS DRSS, developed new PDR, or received vitrectomy or PRP (other secondary or exploratory outcomes of the trial, which were not adjusted for multiple comparisons).
The sponsor-submitted NMA provided indirect comparative evidence for faricimab and other anti-VEGF drugs. After including 22 trials in an NMA, ||||||||||||||||||||||||||||||||||||||||||||||||||||||||||||||||||||||||||||||||||||||||||||||||||||||||||||||||||||||||||||||||||||||||||||||||||||||||||||||||||||||||||||||||||||||||||||||||||||||||||||||||||||||||||||||||||||||||||||||||||||||||||||||||||||||||||||||||||||||||||||||||||||||||||||||||||||||||||||||||||||||||||||||||||||||||||||||||||||||||||||||||||||||||||||||||||||||||||||||||||||||||||||||||||||||||||||||||||||||||||||||||||||||||||||||||||||||||||||||||||||||||||||||||||||||||||||||||||||||||||||||||||||||||||||||||||||||||||||||||||||||||||||||||||||||||||||||||||||||||||||||||||||||||||||||||||||||||||||||||||||||||||||||||||||||||||||||||||||||||||||||||||||||||||||||||||||||||||||||||||||||||||||||||||||||||||||||||||||||||||||||||||||||||||||||||||||||||||||||||||||||||||||||||||||||||||||||||||||||||||||||||||||||||||||||||||||||||||||||||||||||||||||||||||||||||||||||||||||||||||||||||||||||||||||||||||||||||||||||||||||||||||||||||||||||||||||||||||||||||||||||||||||||||||||||||||. However, there may be important sources of bias related to different study or patient characteristics that could have affected the conclusions that can be drawn about this ITC. For the outcome of retinal thickness at 12 months, 23 RCTs were analyzed with a random-effects model ||||||||||||||||||||||||||||||||||||||||||||||||||||||||||||||||||||||||||||||||||||||||||||||||||||||||||||||||||||||||||||||||||||||||||||||||||||||||||||||||||||||||||||||||||||||||||||||||||||||||||||||||||||||||||||||||||||||||||||||||||||||||||||||||||||||||||||||||||||||||||||||||||||||||||||||||. However, the CrIs are wide. In addition, heterogeneity in the methods used to assess retinal thickness across studies adds considerable uncertainty to the results for this analysis and limits the conclusions about the relative effect of faricimab on retinal thickness. The outcome of the proportion of patients with a gain or loss of at least 10 or at least 15 ETDRS letters at 12 months was analyzed, but poor model fit precludes the ability to draw conclusions about the effect of faricimab, compared with comparators, for this outcome. There were many trials with missing information about study and baseline characteristics, and there was considerable heterogeneity in these characteristics. Most notably, there was heterogeneity in the methods used to assess retinal thickness and in the availability of information about the presence of significant diabetic macular ischemia or systemic comorbidities. Overall, the limitations of the NMA described, including the presence of heterogeneity in the study design and patient characteristics, may limit conclusions that can be drawn about these results.
Harms
The safety profile of faricimab, at 8-week and PTI dosing, was generally consistent with that of aflibercept in YOSEMITE and RHINE, although in RHINE, a higher proportion of patients in the 8-week faricimab and PTI faricimab arms reported an ocular AE than in the aflibercept arm, with cataract, dry eye, and blepharitis being the AEs likely contributing to the higher incidence of ocular AEs in the faricimab arms. Overall, the most frequently reported ocular AEs were cataract, conjunctival hemorrhage, and vitreous detachment. Ocular SAEs were reported at a low frequency in both trials; however, in both YOSEMITE and RHINE, there was a higher occurrence of ocular SAEs in the PTI faricimab arm than in the aflibercept arm. The most common ocular SAE reported in the 2 studies was cataract, which was anticipated because of the age of patients in the study population. The occurrence of nonocular AEs was comparable across treatment arms in both studies. Pooled data showed that 81 patients died during the from YOSEMITE and RHINE study periods; the proportion of deaths was numerically higher in the PTI faricimab arm in YOSEMITE than in the other treatment arms, but not in the RHINE trial. No deaths were considered to be related to the study treatment by the investigators. Although the number deaths in the YOSEMITE PTI faricimab arm seemed high and might require further study with post-marketing surveillance, according to the clinical expert, the number of deaths across the studies reflected what would be expected, given the age and medical history of the patients enrolled. Over the course of the 2 studies, 6 patients treated with faricimab reported endophthalmitis, compared with 1 patient treated with aflibercept. Intraocular inflammation was reported at a low frequency (≤ 2.2%) in both studies, with uveitis, the most commonly reported intraocular inflammation event, occurring in 7 patients treated with faricimab and no patients treated with aflibercept. Vitreous floaters were numerically higher in the 8-week faricimab arm than in the aflibercept arm in both studies. There were generally no discernable imbalances in other notable harms across treatments and studies. The FDA review stated a need for a phase IV trial evaluating the impact of faricimab on corneal endothelial health, given the lack of data on this topic.44
There were limited data available for the NMAs conducted for ocular adverse effects and for discontinuation; therefore, fixed effects models were used for these end points, and there was a high degree of uncertainty in these models. Limitations to the NMA preclude the ability to draw conclusions about the relative risk of harm with faricimab, compared withs other treatments.
Conclusions
Faricimab, at 8-week intervals or PTI dosing, was shown to be noninferior, but not superior, to aflibercept for the mean change in BCVA from baseline after 1 year of treatment in adults with DME, based on evidence from 2 double-blind phase III RCTs. The results of other BCVA outcomes, anatomic outcomes, vision-related functions, and HRQoL did not contradict the findings of the primary analysis, but their interpretation is limited by the lack of a noninferiority margin and the lack of adjustment for multiple testing. There is no direct evidence on faricimab compared with other anti-VEGFs at dosages approved in Canada. The safety profile of faricimab was generally comparable to that of aflibercept in the trials. The long-term safety of faricimab is not known.
Evidence from 1 NMA suggests ||||||||||||||||||||||||||||||||||||||||||||||||||||||||||||||||||||||||||||||||||||||||||||||||||||||||||||||||||||||||||||||||||||||||||||||||||||||||||||||||||||||||||||||||||||||||||||||||||||||||||||||||||||||||||||||||||||||||||||||||||||||||||||||||||||||||||||||||||||||||||||||||||||||||||||||||||||||||||||||||||||||||||||||||||||||. The NMA suggests |||||||||||||||||||||||||||||||||||||||||||||||||||||||||||||||||||||||||||||||||||||||||||||||||||||||||||||||||||||||||||||||||||||||||||||||||||||||||||||||||||||||||||||||||||||||||||||||||||||||||||||||||||||||||||||||||||||||||||||||||||||||||||||||||||||||||||||||||||||||||||||||||||||||||||||||| these data are impacted by the administration of therapies with fixed intervals in clinical trials, according to protocols within the 1-year time frame of the RCTs. However, the heterogeneity in study design and patient characteristics may limit conclusions that can be drawn from the NMA. No conclusions on ocular adverse effects could be drawn from the NMA because of limited data, and the long-term risk of harm with aflibercept relative to other treatments is not known.
References
1.Fraser CE, D'Amico DJ. Diabetic retinopathy: classification and clinical features. In: Post TW, ed. Waltham (MA): UpToDate; 2020: http://www.uptodate.com. Accessed 2022 Mar 15.
2.Ciulla TA, Amador AG, Zinman B. Diabetic retinopathy and diabetic macular edema: pathophysiology, screening, and novel therapies. Diabetes Care. 2003;26(9):2653-2664. PubMed
3.Mohamed Q, Gillies MC, Wong TY. Management of diabetic retinopathy: a systematic review. JAMA. 2007;298(8):902-916. PubMed
4.Williams R, Airey M, Baxter H, Forrester J, Kennedy-Martin T, Girach A. Epidemiology of diabetic retinopathy and macular oedema: a systematic review. Eye (Lond). 2004;18(10):963-983. PubMed
5.Advocating for improved treatment and outcomes for diabetic macular edema in Canada: A report based on the Canadian National Multi-Stakeholder Expert Summit for Diabetic Macular Edema convened in Toronto, January 2015. Cambridge (MA): The Angiogenesis Foundation; 2015: https://angio.org/wp-content/uploads/2016/01/Canada-DME-WP.pdf. Accessed 2022 May 12.
6.Hooper P, Boucher MC, Cruess A, et al. Excerpt from the Canadian Ophthalmological Society evidence-based clinical practice guidelines for the management of diabetic retinopathy. Can J Ophthalmol. 2017;52 Suppl 1:S45-s74. PubMed
7.Drug Reimbursement Review sponsor submission: Vabysmo, 6mg/0.05mL solution for intravitrial injection [internal sponsor's package]. Mississauga (ON): Hoffmann-La Roche Ltd; 2022.
8.Vabysmo (faricimab injection): single use vials, 6mg/0.05mL solution for intravitrial injection [product monograph]. Mississauga (ON): Hoffmann-La Roche Ltd; 2022 May 27.
9.Clinical Study Report: GR40349 (YOSEMITE). A Phase III, Multicenter, Randomized, Double-Masked, Active Comparator-Controlled Study to Evaluate the Efficacy and Safety of Faricimab (RO6867461) in Patients with Diabetic Macular Edema. [internal sponsor's report]. Mississauga (ON): Hoffmann-La Roche Ltd; 2021 May.
10.Final Clinical Study Report: GR40349, (YOSEMITE). A Phase III, Multicenter, Randomized, Double-Masked, Active Comparator-Controlled Study to Evaluate the Efficacy and Safety of Faricimab (RO6867461) in Patients with Diabetic Macular Edema. Report No.1111791. [internal sponsor's report]. Mississauga (ON): Hoffmann-La Roche Ltd; 2022 Jan.
11.Clinical Study Report: GR40398 (RHINE): A Phase III, Multicenter, Randomized, Double-Masked, Active Comparator-Controlled Study to Evaluate the Efficacy and Safety of Faricimab in Patients with Diabetic Macular Edema. [internal sponsor's report]. Mississauga (ON): Hoffmann-La Roche Ltd; 2021 May.
12.Updated Clinical Stuy Report: GR40398, (RHINE). A Phase III, Multicenter, Randomized, Double-Masked, Active Comparator-Controlled Study to Evaluate the Efficacy and Safety of Faricimab (RO6867461) in Patients with Diabetic Macular Edema. Report No.1112142. [internal sponsor's report]. Mississauga (ON): Hoffmann-La Roche Ltd; 2022 Jan.
13.Cade WT. Diabetes-related microvascular and macrovascular diseases in the physical therapy setting. Phys Ther. 2008;88(11):1322-1335. PubMed
14.Petrella RJ, Blouin J, Davies B, Barbeau M. Prevalence, demographics, and treatment characteristics of visual impairment due to diabetic macular edema in a representative Canadian cohort. J Ophthalmol. 2012;2012:159167. PubMed
15.Tennant MT. Ocular treatment of diabetic macular edema in Canada: where are we going? Can J Ophthalmol. 2011;46(3):221-224. PubMed
16.Kempen JH, O'Colmain BJ, Leske MC, et al. The prevalence of diabetic retinopathy among adults in the United States. Arch Ophthalmol. 2004;122(4):552-563. PubMed
17.Klein R, Klein BE, Moss SE, Davis MD, DeMets DL. The Wisconsin epidemiologic study of diabetic retinopathy. IV. Diabetic macular edema. Ophthalmology. 1984;91(12):1464-1474. PubMed
18.Kaur H, Maberley D, Chang A, Hay D. The current status of diabetes care, diabetic retinopathy screening and eye-care in British Columbia's First Nations communities. Int J Circumpolar Health. 2004;63(3):277-285. PubMed
19.Maberley D, Walker H, Koushik A, Cruess A. Screening for diabetic retinopathy in James Bay, Ontario: a cost-effectiveness analysis. CMAJ. 2003;168(2):160-164. PubMed
20.Vu HT, Keeffe JE, McCarty CA, Taylor HR. Impact of unilateral and bilateral vision loss on quality of life. Br J Ophthalmol. 2005;89(3):360-363. PubMed
21.Cusick M, Meleth AD, Agron E, et al. Associations of mortality and diabetes complications in patients with type 1 and type 2 diabetes: early treatment diabetic retinopathy study report no. 27. Diabetes Care. 2005;28(3):617-625. PubMed
22.Davidov E, Breitscheidel L, Clouth J, Reips M, Happich M. Diabetic retinopathy and health-related quality of life. Graefes Arch Clin Exp Ophthalmol. 2009;247(2):267-272. PubMed
23.Gonder JR, Walker VM, Barbeau M, et al. Costs and Quality of Life in Diabetic Macular Edema: Canadian Burden of Diabetic Macular Edema Observational Study (C-REALITY). J Ophthalmol. 2014;2014:939315. PubMed
24.Happich M, Reitberger U, Breitscheidel L, Ulbig M, Watkins J. The economic burden of diabetic retinopathy in Germany in 2002. Graefes Arch Clin Exp Ophthalmol. 2008;246(1):151-159. PubMed
25.Kaiser PK. Prospective evaluation of visual acuity assessment: a comparison of Snellen versus ETDRS charts in clinical practice (An AOS Thesis). Trans Am Ophthalmol Soc. 2009;107:311-324.
26.Sander B, Thornit DN, Colmorn L, et al. Progression of diabetic macular edema: correlation with blood retinal barrier permeability, retinal thickness, and retinal vessel diameter. Invest Ophthalmol Vis Sci. 2007;48(9):3983-3987. PubMed
27.Photocoagulation for diabetic macular edema. Early Treatment Diabetic Retinopathy Study report number 1. Early Treatment Diabetic Retinopathy Study research group. Arch Ophthalmol. 1985;103(12):1796-1806. PubMed
28.Antithrombotic Trialists Collaboration. Collaborative meta-analysis of randomised trials of antiplatelet therapy for prevention of death, myocardial infarction, and stroke in high risk patients. BMJ. 2002;324(7329):71-86. PubMed
29.Goatman KA. A reference standard for the measurement of macular oedema. Br J Ophthalmol. 2006;90(9):1197-1202. PubMed
30.Jain A, Varshney N, Smith C. The evolving treatment options for diabetic macular edema. Int J Inflam. 2013:689276.
31.Diabetic Retinopathy Clinical Research Network, Wells JA, Glassman AR, et al. Aflibercept, bevacizumab, or ranibizumab for diabetic macular edema. N Engl J Med. 2015;372(13):1193-1203. PubMed
32.Korobelnik JF, Do DV, Schmidt-Erfurth U, et al. Intravitreal aflibercept for diabetic macular edema. Ophthalmology. 2014;121(11):2247-2254. PubMed
33.Mitchell P. Three-year safety and efficacy of ranibizumab in patients with visual impairment due to diabetic macular edema: The RESTORE Extension Study. Abstract presented at: American Academy of Ophthalmology Annual Meeting; 2012 Nov 12; Chicago IL. 2017.
34.Mitchell P, Bandello F, Schmidt-Erfurth U, et al. The RESTORE study: ranibizumab monotherapy or combined with laser versus laser monotherapy for diabetic macular edema. Ophthalmology. 2011;118(4):615-625. PubMed
35.Lucentis (ranibizumab injection): single use vials. Single use pre-filled syringes. 10 mg/mL solution for injection [product monograph]. Dorval (QC): Novartis Pharmaceuticals Canada Inc.; 2021 Dec 21: https://pdf.hres.ca/dpd_pm/00064117.PDF. Accessed 2022 Apr 26.
36.Eylea (aflibercept injection): single use pre-filled syringes and single use vials for the treatment of a single eye. 2 mg / 0.05 mL solution for intravitreal injection [product monograph]. Mississauga (ON): Bayer Inc; 2022 Feb 10: https://pdf.hres.ca/dpd_pm/00064757.PDF. Accessed 2022 Apr 26.
37.Avastin (bevacizumab for injection): 100 mg and 400 mg vials (25 mg/mL solution for injection) [product monograph]. Mississauga (ON): Hoffmann-La Roche Limited; 2021 Jan 14: https://pdf.hres.ca/dpd_pm/00059621.PDF.
38.Anti-vascular endothelial growth factor drugs for the treatment of retinal conditions - recommendations report. (CADTH Therapeutic review vol. 3, no. 2c). Ottawa: CADTH; 2016: https://www.cadth.ca/sites/default/files/pdf/TR0009_Anti-VEGFs_Recs_Report.pdf. Accessed 2017 Dec 6.
39.Regillo CD, Callanan DG, Do DV, et al. Use of Corticosteroids in the Treatment of Patients With Diabetic Macular Edema Who Have a Suboptimal Response to Anti-VEGF: Recommendations of an Expert Panel. Ophthalmic Surg Lasers Imaging Retina. 2017;48(4):291-301. PubMed
40.Gonzalez VH, Campbell J, Holekamp NM, et al. Early and long-term responses to anti-vascular endothelial growth factor therapy in diabetic macular edema: analysis of protocol I data. Am J Ophthalmol. 2016;172:72-79. PubMed
41.CADTH Canadian Drug Expert Committee (CDEC) final recommendation: Dexamethasone (Ozurdex — Allergan Canada Inc.). Ottawa (ON): CADTH; 2018: https://www.cadth.ca/sites/default/files/cdr/complete/SR0535_Ozurdex_Oct-26-18.pdf. Accessed 2022 Jun 2.
42.McGowan J, Sampson M, Salzwedel DM, Cogo E, Foerster V, Lefebvre C. PRESS Peer Review of Electronic Search Strategies: 2015 guideline statement. J Clin Epidemiol. 2016;75:40-46. PubMed
43.Grey matters: a practical tool for searching health-related grey literature. Ottawa (ON): CADTH; 2019: https://www.cadth.ca/grey-matters. Accessed 2022 Feb 16.
44.Center for Drug Evaluation and Research. Medical review(s). Vabysmo (faricimab) intravitrial injection. Company: Genetech Inc. Application No.:761235. Approval date: 01/28/2022 (FDA approval package). Silver Spring (MD): U.S. Food and Drug Administration (FDA); 2022: https://www.accessdata.fda.gov/drugsatfda_docs/nda/2022/761235Orig1s000MedR.pdf. Accessed 2022 Apr 14.
45.Center for Drug Evaluation and Research. Statistical review(s). Vabysmo (faricimab) intravitrial injection. Company: Genetech Inc. Application No.:761235. Approval date: 01/28/2022 (FDA approval package). Silver Spring (MD): U.S. Food and Drug Administration (FDA); 2022: https://www.accessdata.fda.gov/drugsatfda_docs/nda/2022/761235Orig1s000StatR.pdf. Accessed 2022 Apr 14.
46.Wykoff CC, Abreu F, Adamis AP, et al. Efficacy, durability, and safety of intravitreal faricimab with extended dosing up to every 16 weeks in patients with diabetic macular oedema (YOSEMITE and RHINE): two randomised, double-masked, phase 3 trials. Lancet. 2022;399(10326):741-755. PubMed
47.Shamir RR, Friedman Y, Joskowicz L, Mimouni M, Blumenthal EZ. Comparison of Snellen and Early Treatment Diabetic Retinopathy Study charts using a computer simulation. Int J Ophthalmol. 2016;9(1):119-123. PubMed
48.Beck RW, Moke PS, Turpin AH, et al. A computerized method of visual acuity testing: adaptation of the early treatment of diabetic retinopathy study testing protocol. Am J Ophthalmol. 2003;135(2):194-205. PubMed
49.Beck RW, Maguire MG, Bressler NM, Glassman AR, Lindblad AS, Ferris FL. Visual Acuity as an Outcome Measure in Clinical Trials of Retinal Diseases. Ophthalmology. 2007;114(10):1804-1809. PubMed
50.Center for Drug Evaluation and Research. Statistical review(s). Ozurdex (dexamethasone implant). Company: Allergan, Inc. Application no.: 022315. Approval date: 6/17/2009 (FDA drug approval package). . Rockville (MD): U.S. Food and Drug Administration (FDA); 2009: https://www.accessdata.fda.gov/drugsatfda_docs/nda/2009/022315_ozurdex_toc.cfm. Accessed 2022 Jun 1.
51.Center for Drug Evaluation and Research. Medical review. Lucentis (ranibizumab) injection. Company: Genentech Inc. Application no.: 125156. Approval date: 06/30/2006 (FDA drug approval package). Rockville (MD): U.S. Food and Drug Administration (FDA); 2006: https://www.accessdata.fda.gov/drugsatfda_docs/nda/2006/125156s0000_LucentisTOC.cfm?msclkid=4347785ecfa611ec9d8762763eaf760e. Accessed 2022 Jun 1.
52.Kniestedt C, Stamper RL. Visual acuity and its measurement. Ophthalmology clinics of North America. 2003;16(2):155-170, v. PubMed
53.Lloyd AJ, Loftus J, Turner M, Lai G, Pleil A. Psychometric validation of the Visual Function Questionnaire-25 in patients with diabetic macular edema. Health Qual Life Outcomes. 2013;11:10. PubMed
54.National safety code standard 6: Determining driver fitness in Canada. Ottawa (ON): Canadian Council of Motor Transport Administrators (CCMTA); 2021: https://ccmta.ca/web/default/files/PDF/National%20Safety%20Code%20Standard%206%20-%20Determining%20Fitness%20to%20Drive%20in%20Canada%20-%20February%202021%20-%20Final.pdf. Accessed 2022 May 4.
55.Beketova T, Igbinoba R. Driving restrictions per state. In: Reddy V, ed. EyeWiki. San Francisco: American Academy of Ophthalmology; 2020: https://eyewiki.aao.org/Driving_Restrictions_per_State. Accessed 2022 Jun 3.
56.CNIB. What is blindness? Legal blindness. 2022; https://cnib.ca/en/sight-loss-info/blindness/what-blindness. Accessed 2022 Apr 27.
57.Fundus photographic risk factors for progression of diabetic retinopathy. ETDRS report number 12. Early Treatment Diabetic Retinopathy Study Research Group. Ophthalmology. 1991;98(5 Suppl):823-833. PubMed
58.Klein R, Klein BE, Moss SE. How many steps of progression of diabetic retinopathy are meaningful? The Wisconsin epidemiologic study of diabetic retinopathy. Arch Ophthalmol. 2001;119(4):547-553. PubMed
59.Ip MS, Zhang J, Ehrlich JS. The Clinical Importance of Changes in Diabetic Retinopathy Severity Score. Ophthalmology. 2017;124(5):596-603. PubMed
60.Hoffmann-La Roche Limited response to April 27, 2022 DRR request for additional information regarding faricimab DME DRR review: Health Canada clarifaxes and responses [internal sponsor's report]. Mississauga (ON): Hoffmann-La Roche Ltd; 2022 Apr 29.
61.Center for Drug Evaluation and Research, Center for Biologics Evaluation and Research. E9(R1) statistical principles for clinical trials: addendum: estimands and sensitivity analysis in clinical trials: guidance for industry Silver Spring (MD): U.S. Food and Drug Administration (FDA); 2021 May: https://www.fda.gov/media/148473/download. Accessed 2022 May 12.
62.Network meta-analysis of treatments for diabetic macular edema (DME) [internal sponsor's report]. In: Drug Reimbursement Review sponsor submission: Vabysmo, 6mg/0.05 mL solution for intravitreal injection. Mississauga (ON): Hoffmann-La Roche Ltd; 2022 Mar 24.
63.Suner IJ, Kokame GT, Yu E, Ward J, Dolan C, Bressler NM. Responsiveness of NEI VFQ-25 to changes in visual acuity in neovascular AMD: validation studies from two phase 3 clinical trials. Invest Ophthalmol Vis Sci. 2009;50(8):3629-3635. PubMed
64.Grading Diabetic Retinopathy from Stereoscopic Color Fundus Photographs - An Extension of the Modified Airlie House Classification: ETDRS Report Number 10. Ophthalmology. 2020;127(4s):S99-s119. PubMed
65.Klein R, Knudtson MD, Lee KE, Gangnon R, Klein BE. The Wisconsin Epidemiologic Study of Diabetic Retinopathy: XXII the twenty-five-year progression of retinopathy in persons with type 1 diabetes. Ophthalmology. 2008;115(11):1859-1868. PubMed
66.Davis MD, Bressler SB, Aiello LP, et al. Comparison of time-domain OCT and fundus photographic assessments of retinal thickening in eyes with diabetic macular edema. Invest Ophthalmol Vis Sci. 2008;49(5):1745-1752. PubMed
67.Nunes S, Pereira I, Santos A, Bernardes R, Cunha-Vaz J. Central retinal thickness measured with HD-OCT shows a weak correlation with visual acuity in eyes with CSME. Br J Ophthalmol. 2010;94(9):1201-1204. PubMed
68.Lammer J, Scholda C, Prünte C, Benesch T, Schmidt-Erfurth U, Bolz M. Retinal thickness and volume measurements in diabetic macular edema: a comparison of four optical coherence tomography systems. Retina. 2011;31(1):48-55. PubMed
69.Bressler SB, Edwards AR, Chalam KV, et al. Reproducibility of spectral-domain optical coherence tomography retinal thickness measurements and conversion to equivalent time-domain metrics in diabetic macular edema. JAMA Ophthalmol. 2014;132(9):1113-1122. PubMed
70.Tangelder GJ, Van der Heijde RG, Polak BC, Ringens PJ. Precision and reliability of retinal thickness measurements in foveal and extrafoveal areas of healthy and diabetic eyes. Invest Ophthalmol Vis Sci. 2008;49(6):2627-2634. PubMed
71.Revicki DA, Rentz AM, Harnam N, Thomas VS, Lanzetta P. Reliability and validity of the National Eye Institute Visual Function Questionnaire-25 in patients with age-related macular degeneration. Invest Ophthalmol Vis Sci. 2010;51 2:712-717. PubMed
72.Marella M, Pesudovs K, Keeffe JE, O'Connor PM, Rees G, Lamoureux EL. The psychometric validity of the NEI VFQ-25 for use in a low-vision population. Invest Ophthalmol Vis Sci. 2010;51(6):2878-2884. PubMed
73.Pesudovs K, Gothwal VK, Wright T, Lamoureux EL. Remediating serious flaws in the National Eye Institute Visual Function Questionnaire. J Cataract Refract Surg. 2010;36(5):718-732. PubMed
74.Reeve BB, Wyrwich KW, Wu AW, et al. ISOQOL recommends minimum standards for patient-reported outcome measures used in patient-centered outcomes and comparative effectiveness research. Qual Life Res. 2013;22(8):1889-1905. PubMed
75.Orr P, Rentz AM, Margolis MK, et al. Validation of the National Eye Institute Visual Function Questionnaire-25 (NEI VFQ-25) in age-related macular degeneration. Invest Ophthalmol Vis Sci. 2011;52(6):3354-3359. PubMed
76.Tewari HK, Kori V, Sony P, Venkatesh P, Garg SP. Snellen chart may be preferable over early treatment diabetic retinopathy study charts for rapid visual acuity assessment. Indian J Ophthalmol. 2006;54 3:214.
77.Recommended stardard procedures for the clinical measurement and specification of visual acuity. Report of working group 39. Committee on vision. Assembly of Behavioral and Social Sciences, National Research Council, National Academy of Sciences, Washington, D.C. Adv Ophthalmol. 1980;41:103-148. PubMed
78.Ricci F, Cedrone C, Cerulli L. Standardized measurement of visual acuity. Ophthalmic Epidemiol. 1998;5(1):41-53. PubMed
79.Rosser DA, Cousens SN, Murdoch IE, Fitzke FW, Laidlaw DAH. How Sensitive to Clinical Change are ETDRS logMAR Visual Acuity Measurements? Invest Ophthalmol Vis Sci. 2003;44(8):3278-3281. PubMed
80.Agelis LE, Peh KK, Chen FK. ETDRS letter score equivalents of Snellen fractions in 158 patients. Invest Ophthalmol Vis Sci. 2012;53(14):4787-4787.
81.Falkenstein IA, Cochran DE, Azen SP, et al. Comparison of visual acuity in macular degeneration patients measured with snellen and early treatment diabetic retinopathy study charts. Ophthalmology. 2008;115(2):319-323. PubMed
82.Early Treatment Diabetic Retinopathy Study Research Group. Grading Diabetic Retinopathy from Stereoscopic Color Fundus Photographs - An Extension of the Modified Airlie House Classification: ETDRS Report Number 10. Ophthalmology. 2020;127(4S):S99-S119. PubMed
83.Matt G, Sacu S, Buehl W, et al. Comparison of retinal thickness values and segmentation performance of different OCT devices in acute branch retinal vein occlusion. Eye (Lond). 2011;25(4):511-518. PubMed
84.Mangione CM, Berry S, Spritzer K, et al. Identifying the content area for the 51-item National Eye Institute Visual Function Questionnaire: results from focus groups with visually impaired persons. Arch Ophthalmol. 1998;116(2):227-233. PubMed
85.Mangione CM, Lee PP, Pitts J, Gutierrez P, Berry S, Hays RD. Psychometric properties of the National Eye Institute Visual Function Questionnaire (NEI-VFQ). NEI-VFQ Field Test Investigators. Arch Ophthalmol. 1998;116(11):1496-1504. PubMed
86.Mangione CM, Lee PP, Gutierrez PR, Spritzer K, Berry S, Hays RD. Development of the 25-item National Eye Institute Visual Function Questionnaire. Arch Ophthalmol. 2001;119(7):1050-1058. PubMed
87.Dougherty BE, Bullimore MA. Comparison of scoring approaches for the NEI VFQ-25 in low vision. Optom Vis Sci. 2010;87(8):543-548. PubMed
Appendix 1: Literature Search Strategy
Note that this appendix has not been copy-edited.
Clinical Literature Search
Overview
Interface: Ovid
Databases:
MEDLINE All (1946-present)
Embase (1974-present)
Note: Subject headings and search fields have been customized for each database. Duplicates between databases were removed in Ovid.
Date of search: April 20, 2022
Alerts: Bi-weekly search updates until project completion
Search filters applied: None.
Limits:
Conference abstracts: excluded
Syntax | Description |
|---|---|
/ | At the end of a phrase, searches the phrase as a subject heading |
MeSH | Medical Subject Heading |
.fs | Floating subheading |
exp | Explode a subject heading |
* | Before a word, indicates that the marked subject heading is a primary topic; or, after a word, a truncation symbol (wildcard) to retrieve plurals or varying endings |
# | Truncation symbol for one character |
? | Truncation symbol for one or no characters only |
adj# | Requires terms to be adjacent to each other within # number of words (in any order) |
.ti | Title |
.ot | Original title |
.ab | Abstract |
.hw | Heading word; usually includes subject headings and controlled vocabulary |
.kf | Keyword heading word |
.dq | Candidate term word (Embase) |
.pt | Publication type |
.mp | Mapped term |
.rn | Registry number |
.nm | Name of substance word (MEDLINE) |
.yr | Publication year |
.jw | Journal title word (MEDLINE) |
.jx | Journal title word (Embase) |
freq=# | Requires terms to occur # number of times in the specified fields |
medall | Ovid database code: MEDLINE All, 1946 to present, updated daily |
oemezd | Ovid database code; Embase, 1974 to present, updated daily |
cctr | Ovid database code; Cochrane Central Register of Controlled Trials |
Multi-Database Strategy
(faricimab* or Vabysmo* or rg7716 or rg 7716 or ro6867461 or ro 6867461 or WHO 10563 or QC4F7FKK7I).ti,ab,kf,ot,hw,nm,rn.
1 use medall
*faricimab/ or (faricimab* or Vabysmo* or rg7716 or rg 7716 or ro6867461 or ro 6867461 or WHO 10563).ti,ab,kf,dq.
3 use oemezd
4 not (conference review or conference abstract).pt.
2 or 5
remove duplicates from 6
Clinical Trials Registries
ClinicalTrials.gov
Produced by the U.S. National Library of Medicine. Targeted search used to capture registered clinical trials.
[Search -- Studies with results | faricimab]
WHO ICTRP
International Clinical Trials Registry Platform, produced by the World Health Organization. Targeted search used to capture registered clinical trials.
[Search terms -- faricimab]
Health Canada’s Clinical Trials Database
Produced by Health Canada. Targeted search used to capture registered clinical trials.
[Search terms -- faricimab]
EU Clinical Trials Register
European Union Clinical Trials Register, produced by the European Union. Targeted search used to capture registered clinical trials.
[Search terms -- faricimab]
Grey Literature
Search dates: April 8 – April 15, 2022
Keywords: faricimab, diabetes, macular edema
Limits: No limits applied
Updated: Search updated prior to the completion of stakeholder feedback period
Relevant websites from the following sections of the CADTH grey literature checklist Grey Matters: A Practical Tool for Searching Health-Related Grey Literature were searched:
Health Technology Assessment Agencies
Health Economics
Clinical Practice Guidelines
Drug and Device Regulatory Approvals
Advisories and Warnings
Drug Class Reviews
Clinical Trials Registries
Databases (free)
Health Statistics
Internet Search
Open Access Journals
Appendix 2: Excluded Studies
Note that this appendix has not been copy-edited.
Reference | Reason for exclusion |
|---|---|
Sahni J, Patel SS, Dugel PU, et al. Simultaneous inhibition of angiopoietin-2 and vascular endothelial growth factor-A with faricimab in diabetic macular edema: BOULEVARD phase 2 randomized trial. Ophthalmology. 2019 Aug;126(8):1155-1170. | Study design |
Appendix 3: Detailed Outcome Data
Note that this appendix has not been copy-edited.
Table 31: Change from Baseline in BCVA (ETDRS letters) Averaged Over Weeks 48, 52, and 56 — Sensitivity and Supplementary Analyses
Baseline BCVA Subgroups | YOSEMITE | RHINE | ||||
|---|---|---|---|---|---|---|
Faricimab 6 mg q.8.w. (N=315) | Faricimab 6 mg PTI (N=313) | Aflibercept 2 mg q.8.w. (N=312) | Faricimab 6 mg q.8.w. (N=317) | Faricimab 6 mg PTI (N=319) | Aflibercept 2 mg q.8.w. (N=315) | |
Sensitivity Analysis | ||||||
ITT population (MMRM – LOCF) | ||||||
Number of patients contributing to the analysis | 313 | 313 | 311 | 315 | 317 | 314 |
Change from baseline (letter), meana (SE) | 10.6 (0.55) | 11.3 (0.55) | 10.7 (0.55) | 11.7 (0.50) | 10.7 (0.50) | 10.1 (0.50) |
Difference in meansa (letters), (97.5% CI) | -0.1 (-1.9 to 1.6) | 0.6 (-1.1 to 2.4) | Reference | 1.6 (0.0 to 3.2) | 0.6 (-1.0 to 2.2) | Reference |
Supplementary Analysis | ||||||
ITT population (MMRM [Treatment policy estimand for all ICEs]) | ||||||
Number of patients contributing to the analysis | 287 | 287 | 285 | 284 | 305 | 290 |
Change from baseline (letter), meana (SE) | 10.6 (0.56) | 11.5 (0.56) | 10.8 (0.56) | 11.7 (0.52) | 10.7 (0.51) | 10.2 (0.51) |
Difference in meansa (letters), (97.5% CI) | -0.3 (-2.0 to 1.5) | 0.6 (-1.1 to 2.4) | Reference | 1.5 (-0.2 to 3.1) | 0.5 (-1.2 to 2.1) | Reference |
ITT population (MMRM [Hypothetical estimand for all ICEs]) | ||||||
Number of patients contributing to the analysis | 269 | 275 | 274 | 267 | 291 | 279 |
Change from baseline (letter), meana (SE) | 10.8 (0.56) | 11.6 (0.55) | 10.9 (0.55) | 11.9 (0.52) | 10.8 (0.51) | 10.3 (0.51) |
Difference in meansa (letters), (97.5% CI) | -0.1 (-1.9 to 1.6) | 0.7 (-1.1 to 2.5) | Reference | 1.6 (-0.0 to 3.2) | 0.5 (-1.1 to 2.1) | Reference |
ITT population (ANOCOVA —Trimmed mean analysis) | ||||||
Number of patients contributing to the analysis | 248 | 252 | 251 | 243 | 264 | 254 |
Change from baseline (letter), meanb | 11.08 | 11.90 | 11.42 | 12.62 | 11.68 | 11.60 |
Difference in meansb (letters), (97.5% CI) | -0.3 (-1.8 to 1.2) | 0.5 (-1.0 to 2.0) | Reference | 1.0 (-0.5 to 2.5) | 0.1 (-1.4 to 1.6) | Reference |
ITT population (ANOCOVA – Multiple imputation analysis) | ||||||
Number of patients contributing to the analysis | 315 | 313 | 312 | 316 | 317 | 315 |
Change from baseline (letter), meanb (SE) | 9.8 (0.69) | 10.8 (0.69) | 10.1 (0.70) | 11.0 (0.60) | 10.1 (0.59) | 9.5 (0.60) |
Difference in meansb (letters), (97.5% CI) | -0.3 (-1.9 to 1.2) | 0.6 (-0.9 to 2.2) | Reference | 1.5 (0.1 to 3.0) | 0.6 (-0.8 to 2.0) | Reference |
ITT population (ANOCOVA) | ||||||
Number of patients contributing to the analysis | 271 | 276 | 276 | 268 | 293 | 279 |
Change from baseline (letter), meanb (SE) | 9.7 (0.70) | 10.8 (0.70) | 10.2 (0.70) | 11.1 (0.62) | 10.1 (0.61) | 10.0 (0.62) |
Difference in meansb (letters), (97.5% CI) | -0.5 (-2.3 to 1.4) | 0.7 (-1.2 to 2.5) | Reference | 1.1 (-0.6 to 2.8) | 0.2 (-1.5 to 1.8) | Reference |
ANOCOVA = analysis of covariance; BCVA = best corrected visual acuity; CI = confidence interval; ETDRS = Early Treatment Diabetic Retinopathy Study; ICE = intercurrent event; ITT = intention-to-treat; LOCF = last observation carried forward; MMRM = mixed model repeated measures; PTI = personalized treatment interval (from every 4 weeks up to every 16 weeks); q.8.w. = every 8 weeks; SE = standard error.
aadjusted mean. The primary end point was analyzed using an MMRM, with the change from baseline in BCVA as the dependent variable, The model was adjusted for categorical covariates of treatment group, visit, visit-by-treatment-group interaction, baseline BCVA (continuous), as well as randomization stratification factors as fixed effects (Day 1 BCVA ETDRS letter score [64 letters or better versus 63 letters or worse], prior IVT anti-VEGF therapy (yes vs. no), and region [US and Canada, Asia, and the rest of the world]).
badjusted mean. In the ANCOVA analysis, the model uses the average of non-missing values for change from baseline in BCVA at week 48, 52 and 56 as the dependent variables adjusted categorical covariates of treatment group, visit, visit-by-treatment-group interaction, baseline BCVA (continuous), as well as randomization stratification factors as fixed effects (Day 1 BCVA ETDRS letter score [64 letters or better versus 63 letters or worse], prior IVT anti-VEGF therapy (yes vs. no), and region [US and Canada, Asia, and the rest of the world]).
Source: YOSEMITE Clinical Study Report9; RHINE Clinical Study Report11
Table 32: Change From Baseline in BCVA (ETDRS letter) Averaged Over Weeks 48, 52, and 56 by Baseline BCVA Subgroup (≥ 64 letters and ≤ 63 letters) (ITT Population, MMRM)
Baseline BCVA Subgroups | YOSEMITE | RHINE | ||||
|---|---|---|---|---|---|---|
Faricimab 6 mg q.8.w. | Faricimab 6 mg PTI | Aflibercept 2 mg q.8.w. | Faricimab 6 mg q.8.w. | Faricimab 6 mg PTI | Aflibercept 2 mg q.8.w. | |
Baseline BCVA ≥ 64 ETDRS letters | ||||||
N, subgroup | 168 | 175 | 168 | 174 | 174 | 174 |
Number of patients contributing to the analysis | 150 | 157 | 147 | 145 | 161 | 151 |
Change from baseline (letter), meana (SE) | 9.5 (0.67) | 9.1 (0.66) | 8.9 (0.68) | 8.9 (0.62) | 7.9 (0.60) | 8.4 (0.61) |
Difference in meansa (letters), (95% CI) | 0.6 (-1.2 to 2.5) | 0.3 (-1.6 to 2.1) | Reference | 0.5 (-1.2 to 2.2) | -0.4 (-2.1 to 1.3) | Reference |
Baseline BCVA ≤ 63 ETDRS letters | ||||||
N, subgroup | 147 | 138 | 144 | 142 | 143 | 141 |
Number of patients contributing to the analysis | 121 | 119 | 129 | 123 | 132 | 128 |
Change from baseline (letter), meana (SE) | 12.2 (0.92) | 14.7 (0.94) | 13.3 (0.91) | 15.4 (0.86) | 14.2 (0.84) | 12.5 (0.85) |
Difference in meansa (letters), (95% CI) | -1.1 (-3.6 to 1.5) | 1.4 (-1.2 to 4.0) | Reference | 2.9 (0.5 to 5.3) | 1.7 (-0.6 to 4.1) | Reference |
BCVA = best corrected visual acuity; CI = confidence interval; ETDRS = Early Treatment Diabetic Retinopathy Study; ITT = intention-to-treat; MMRM = mixed model repeated measures; PTI = personalized treatment interval (from every 4 weeks up to every 16 weeks); q.8.w. = every 8 weeks; SE = standard error.
aadjusted mean. The primary end point was analyzed using an MMRM, with the change from baseline in BCVA as the dependent variable, The model was adjusted for categorical covariates of treatment group, visit, visit-by-treatment-group interaction, baseline BCVA (continuous), as well as randomization stratification factors as fixed effects (Day 1 BCVA ETDRS letter score [64 letters or better versus 63 letters or worse], prior IVT anti-VEGF therapy (yes vs. no), and region [US and Canada, Asia, and the rest of the world]).
Source: YOSEMITE Clinical Study Report9; RHINE Clinical Study Report11
Table 33: Change from Baseline in BCVA (ETDRS letter) Averaged Over Weeks 48, 52, and 56 by Baseline Hemoglobin A1C (≤ 8% and > 8%) (ITT Population, MMRM)
Baseline BCVA Subgroups | YOSEMITE | RHINE | ||||
|---|---|---|---|---|---|---|
Faricimab 6 mg q.8.w. | Faricimab 6 mg PTI | Aflibercept 2 mg q.8.w. | Faricimab 6 mg q.8.w. | Faricimab 6 mg PTI | Aflibercept 2 mg q.8.w. | |
Baseline hemoglobin A1C >8% | ||||||
N, subgroup | 96 | 110 | 105 | 114 | 111 | 117 |
Number of patients contributing to the analysis | 82 | 101 | 90 | 99 | 102 | 104 |
Change from baseline (letter), meana (SE) | 9.2 (1.20) | 11.4 (1.10) | 10.9 (1.14) | 10.5 (0.94) | 11.2 (0.94) | 10.5 (0.92) |
Difference in meansa (letters), (95% CI) | -1.7 (-5.0 to 1.5) | 0.5 (-2.6 to 3.6) | Reference | 0.0 (-2.6 to 2.6) | 0.7 (-1.9 to 3.3) | Reference |
Baseline hemoglobin A1C £ 8% | ||||||
N, subgroup | 218 | 200 | 206 | 200 | 203 | 193 |
Number of patients contributing to the analysis | 189 | 172 | 186 | 168 | 186 | 171 |
Change from baseline (letter), meana (SE) | 11.4 (0.60) | 11.8 (0.63) | 11.0 (0.61) | 12.5 (0.62) | 10.5 (0.60) | 9.8 (0.62) |
Difference in meansa (letters), (95% CI) | 0.4 (-1.3 to 2.1) | 0.8 (-0.9 to 2.6) | Reference | 2.7 (0.9 to 4.4) | 0.7 (-1.0 to 2.4) | Reference |
BCVA = best corrected visual acuity; CI = confidence interval; ETDRS = Early Treatment Diabetic Retinopathy Study; hemoglobin A1C = Hemoglobin A1c; ITT = intention-to-treat; MMRM = mixed model repeated measures; PTI = personalized treatment interval (from every 4 weeks up to every 16 weeks); q.8.w. = every 8 weeks; SE = standard error.
aadjusted mean. The primary end point was analyzed using an MMRM, with the change from baseline in BCVA as the dependent variable, The model was adjusted for categorical covariates of treatment group, visit, visit-by-treatment-group interaction, baseline BCVA (continuous), as well as randomization stratification factors as fixed effects (Day 1 BCVA ETDRS letter score [64 letters or better versus 63 letters or worse], prior IVT anti-VEGF therapy (yes vs. no), and region [US and Canada, Asia, and the rest of the world]).
Source: YOSEMITE Clinical Study Report9; RHINE Clinical Study Report11
Table 34: Change From Baseline in BCVA (ETDRS letter) Averaged Over Weeks 48, 52, and 56 by Baseline DR Severity (< 47, 47 to 53, and > 53 ETDRS DRSS) (ITT Population, MMRM)
Baseline BCVA Subgroups | YOSEMITE | RHINE | ||||
|---|---|---|---|---|---|---|
Faricimab 6 mg q.8.w. | Faricimab 6 mg PTI | Aflibercept 2 mg q.8.w. | Faricimab 6 mg q.8.w. | Faricimab 6 mg PTI | Aflibercept 2 mg q.8.w. | |
Baseline DR Severity <47 ETDRS DRS Scale | ||||||
N, subgroup | 174 | 187 | 182 | 183 | 178 | 180 |
Number of patients contributing to the analysis | 147 | 165 | 157 | 153 | 165 | 154 |
Change from baseline (letter), meana (SE) | 10.1 (0.70) | 10.6 (0.66) | 10.5 (0.68) | 10.8 (0.68) | 9.7 (0.67) | 9.7 (0.68) |
Difference in meansa (letters), (95% CI) | -0.4 (-2.3 to 1.5) | 0.0 (-1.9 to 1.9) | Reference | 1.1 (-0.8 to 3.0) | -0.0 (-1.9 to 1.9) | Reference |
Baseline DR Severity 47-53 ETDRS DRS Scale | ||||||
N, subgroup | 113 | 99 | 103 | 109 | 99 | 105 |
Number of patients contributing to the analysis | 101 | 88 | 93 | 94 | 89 | 97 |
Change from baseline (letter), meana (SE) | 11.0 (0.97) | 13.6 (1.04) | 12.2 (1.01) | 13.0 (0.88) | 12.0 (0.92) | 11.6 (0.88) |
Difference in meansa (letters), (95% CI) | -1.1 (-3.9 to 1.6) | 1.5 (-1.4 to 4.3) | Reference | 1.4 (-1.0 to 3.9) | 0.4 (-2.1 to 2.9) | Reference |
Baseline DR Severity >53 ETDRS DRS Scale | ||||||
N, subgroup | 22 | 21 | 18 | 20 | 37 | 20 |
Number of patients contributing to the analysis | 19 | 18 | 17 | 17 | 34 | 20 |
Change from baseline (letter), meana (SE) | 15.1 (3.16) | 13.2 (3.20) | 6.8 (3.45) | 13.3 (2.29) | 13.2 (1.66) | 8.2 (2.26) |
Difference in meansa (letters), (95% CI) | 8.3 (-1.2 to 17.9) | 6.4 (-3.1 to 15.9) | Reference | 5.1 (-1.4 to 11.6) | 5.0 (-0.6 to 10.6) | Reference |
BCVA = best corrected visual acuity; CI = confidence interval; DRS= diabetic retinopathy severity; ETDRS = Early Treatment Diabetic Retinopathy Study; ITT = intention-to-treat; MMRM = mixed model repeated measures; PTI = personalized treatment interval (from every 4 weeks up to every 16 weeks); q.8.w. = every 8 weeks; SE = standard error.
aadjusted mean. The primary end point was analyzed using an MMRM, with the change from baseline in BCVA as the dependent variable, The model was adjusted for categorical covariates of treatment group, visit, visit-by-treatment-group interaction, baseline BCVA (continuous), as well as randomization stratification factors as fixed effects (Day 1 BCVA ETDRS letter score [64 letters or better versus 63 letters or worse], prior IVT anti-VEGF therapy (yes vs. no), and region [US and Canada, Asia, and the rest of the world]).
Source: YOSEMITE Clinical Study Report,9 RHINE Clinical Study Report.11
Table 35: Change From Baseline in BCVA (ETDRS letter) Averaged Over Weeks 48, 52, and 56 by Prior IVT Anti-VEGF Therapy (Yes and No) (ITT Population, MMRM)
Baseline BCVA Subgroups | YOSEMITE | RHINE | ||||
|---|---|---|---|---|---|---|
Faricimab 6 mg q.8.w. | Faricimab 6 mg PTI | Aflibercept 2 mg q.8.w. | Faricimab 6 mg q.8.w. | Faricimab 6 mg PTI | Aflibercept 2 mg q.8.w. | |
Prior IVT Anti-VEGF Therapy – No (Treatment-Naive) | ||||||
N, subgroup | 238 | 245 | 242 | 254 | 255 | 248 |
Number of patients contributing to the analysis | 200 | 215 | 212 | 208 | 231 | 213 |
Change from baseline (letter), meana (SE) | 10.6 (0.68) | 11.4 (0.66) | 11.3 (0.67) | 11.7 (0.58) | 11.2 (0.57) | 10.5 (0.58) |
Difference in meansa (letters), (95% CI) | -0.7 (-2.6 to 1.2) | 0.0 (-1.8 to 1.9) | Reference | 1.1 (-0.5 to 2.8) | 0.6 (-1.0 to 2.2) | Reference |
Prior IVT Anti-VEGF Therapy – Yes | ||||||
N, subgroup | 77 | 68 | 70 | 63 | 64 | 67 |
Number of patients contributing to the analysis | 71 | 61 | 64 | 60 | 62 | 66 |
Change from baseline (letter), meana (SE) | 10.9 (0.93) | 12.5 (0.99) | 9.5 (0.98) | 12.2 (1.15) | 9.1 (1.14) | 9.1 (1.11) |
Difference in meansa (letters), (95% CI) | 1.4 (-1.2 to 4.1) | 3.0 (0.3 to 5.7) | Reference | 3.0 (-0.1 to 6.2) | -0.1 (-3.2 to 3.1) | Reference |
BCVA = best corrected visual acuity; CI = confidence interval; ETDRS = Early Treatment Diabetic Retinopathy Study; ITT = intention-to-treat; MMRM = mixed model repeated measures; PTI = personalized treatment interval (from every 4 weeks up to every 16 weeks); q.8.w. = every 8 weeks; SE = standard error.
aadjusted mean. The primary end point was analyzed using an MMRM, with the change from baseline in BCVA as the dependent variable, The model was adjusted for categorical covariates of treatment group, visit, visit-by-treatment-group interaction, baseline BCVA (continuous), as well as randomization stratification factors as fixed effects (Day 1 BCVA ETDRS letter score [64 letters or better versus 63 letters or worse], prior IVT anti-VEGF therapy (yes vs. no), and region [US and Canada, Asia, and the rest of the world]). Source: YOSEMITE Clinical Study Report9; RHINE Clinical Study Report11
Table 36: BCVA Outcomes Averaged Over Weeks 92, 96, and 100 (ITT Population, CMH Method)
Baseline BCVA Subgroups | YOSEMITE | RHINE | ||||||
|---|---|---|---|---|---|---|---|---|
Faricimab 6 mg q.8.w. (N=315) | Faricimab 6 mg PTI (N=313) | Aflibercept 2 mg q.8.w. (N=312) | Faricimab 6 mg q.8.w. (N=317) | Faricimab 6 mg PTI (N=319) | Aflibercept 2 mg q.8.w. (N=315) | |||
Proportion of patients gaining ≥ 15, ≥ 10, ≥ 5, or ≥ 0 ETDRS letters in BCVA from baseline averaged over Weeks 92, 96, and 100 | ||||||||
Number of patients contributing to the analysis | 262 | 270 | 259 | 259 | 282 | 254 | ||
≥ 15 letters gain, n (%) | 96 (36.6) | 103 (38.1) | 98 (37.8) | 102 (39.4) | 87 (30.9) | 100 (39.4) | ||
Difference in proportionsa (%) (95% CI) | -0.2 (-8.2 to 7.8) | 0.2 (-7.6 to 8.1) | Reference | 0.8 (-7.4 to 9.0) | -8.0 (-15.7 to -0.3) | Reference | ||
≥ 10 letters gain, n (%) | 156 (59.5) | 157 (58.1) | 160 (61.8) | 157 (60.6) | 148 (52.5) | 151 (59.4) | ||
Difference in proportionsa (%) (95% CI) | -1.7 (-9.9 to 6.6) | -3.4 (-11.5 to 4.7) | Reference | 2.2 (-5.9, 10.4) | -6.5 (-14.6, 1.7) | Reference | ||
≥ 5 letters gain, n (%) | 213 (81.3) | 215 (79.6) | 216 (83.4) | 199 (76.8) | 211 (74.8) | 191 (75.2) | ||
Difference in proportionsa (%) (95% CI) | -2.3 (-8.9 to 4.2) | -3.7 (-10.1 to 2.8) | Reference | 2.1 (-5.2 to 9.4) | -0.2 (-7.5 to 7.0) | Reference | ||
≥ 0 letters gain, n (%) | 232 (88.5) | 240 (88.9) | 237 (91.5) | 223 (86.1) | 246 (87.2) | 229 (90.2) | ||
Difference in proportionsa (%) (95% CI) | -3.3 (-8.4 to 1.9) | -2.6 (-7.6 to 2.4) | Reference | -3.9 (-9.5 to 1.6) | -2.8 (-8.1 to 2.5) | Reference | ||
Proportion of patients avoiding loss of ≥ 15, ≥ 10, or ≥ 5 ETDRS letters in BCVA from baseline averaged over Weeks 92, 96, and 100 | ||||||||
Number of patients contributing to the analysis | 262 | 270 | 259 | 259 | 282 | 254 | ||
Avoid ≥ 15 letters loss, n (%) | 256 (97.7) | 264 (97.8) | 254 (98.1) | 250 (96.5) | 273 (96.8) | 248 (97.6) | ||
Difference in proportions a (%) (95% CI) | -0.4 (-2.9 to 2.2) | -0.2 (-2.6 to 2.2) | Reference | -1.0 (-3.9 to 1.9) | -0.7 (-3.5 to 2.0) | Reference | ||
Avoid ≥ 10 letters loss, n (%) | 252 (96.2) | 260 (96.3) | 252 (97.3) | 246 (95.0) | 271 (96.1) | 246 (96.9) | ||
Difference in proportions a (%) (95% CI) | -1.2 (-4.3 to 1.9) | -0.9 (-3.9 to 2.1) | Reference | -1.8 (-5.2 to 1.6) | -0.6 (-3.8 to 2.5) | Reference | ||
Avoid ≥ 5 letters loss, n (%) | 246 (93.9) | 252 (93.3) | 248 (95.8) | 238 (91.9) | 258 (91.5) | 241 (94.9) | ||
Difference in proportions a (%) (95% CI) | -1.9 (-5.8 to 1.9) | -2.4 (-6.2 to 1.4) | Reference | -2.9 (-7.2 to 1.4) | -3.3 (-7.5 to 1.0) | Reference | ||
Proportion of patients gaining 3 15 letters or achieving BCVA Snellen equivalent of 20/20 or better (BCVA 3 84 Letters) in the study eye averaged over weeks 92, 96, and 100 | ||||||||
Number of patients contributing to the analysis | 262 | 270 | 259 | 260 | 283 | 254 | ||
Proportion: n (%) | 103 (39.3) | 107 (39.6) | 104 (40.2) | 107 (41.2) | 95 (33.6) | 109 (42.9) | ||
Difference in proportions a (%) (95% CI) | -0.1 (-8.3 to 8.1) | -0.7 (-8.7 to 7.2) | Reference | -1.0 (-9.3 to 7.4) | -9.0 (-16.8 to -1.1) | Reference | ||
BCVA = best corrected visual acuity; CI = confidence interval; CMH = Cochran-Mantel-Haenszel; ETDRS = Early Treatment Diabetic Retinopathy Study; ITT = intention-to-treat; MMRM = mixed model repeated measures; PTI = personalized treatment interval (from every 4 weeks up to every 16 weeks); q.8.w. = every 8 weeks; SE = standard error.
aCMH weighted estimate. The observed proportions and the differences in observed proportions were obtained by applying Cochran-Mantel-Haenszel weight, stratified by randomization stratification factors: day 1 BCVA ETDRS letter score (64 letters or better versus 63 letters or worse), prior IVT anti-VEGF therapy (yes vs. no), and region (US and Canada, Asia, and the rest of the world).
Note: Bold text are for the outlier results.
Source: YOSEMITE Final Clinical Study Report9; RHINE Updated Clinical Study Report11
Figure 11: Change From Baseline in BCVA (ETDRS Letter) in the Study Eye Through Week 100 (MMRM [Primary Estimand]) — ITT Population in YOSEMITE
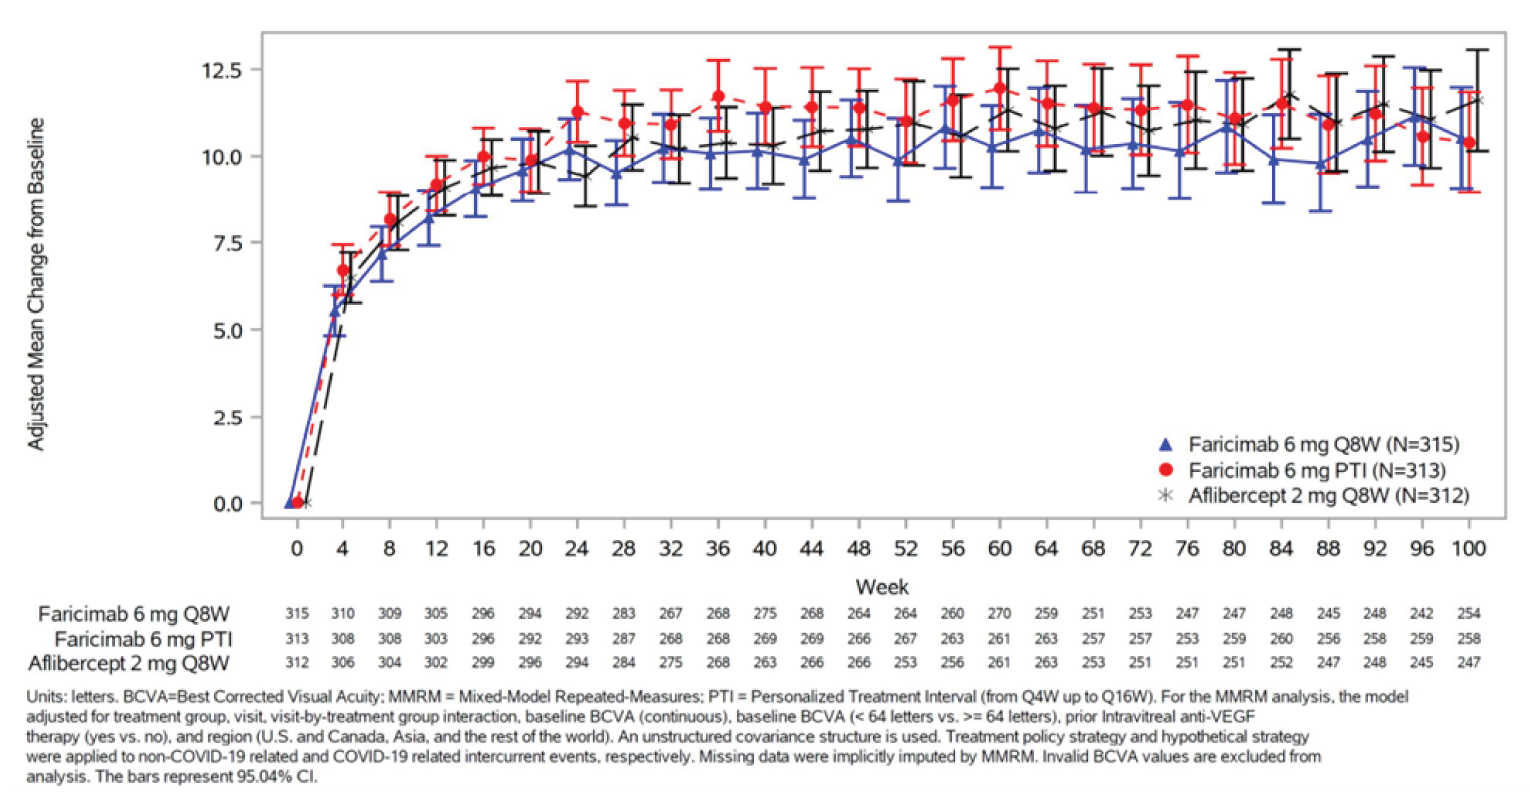
Source: YOSEMITE Final Clinical Study Report10
Figure 12: Change From Baseline in BCVA (ETDRS Letter) in the Study Eye Through Week 100 (MMRM [Primary Estimand]) — ITT Population in RHINE
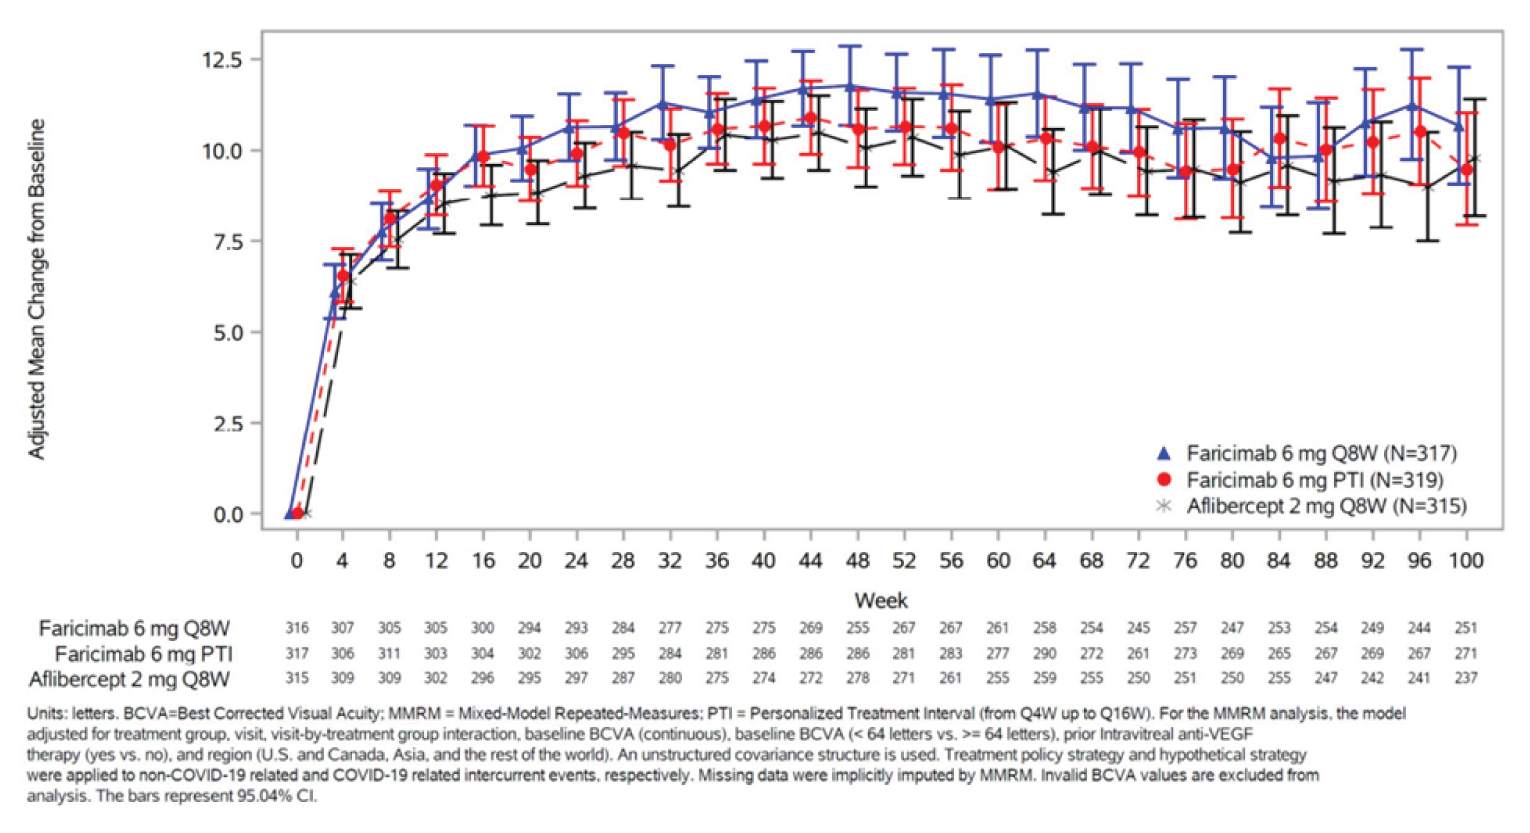
Source: RHINE Updated Clinical Study Report12
Figure 13: Number of Subjects in the Faricimab PTI Group on q.4.w., q.8.w., q.12.w., and q.16.w. Dosing at Each Visit Through Week 52 (ITT Population)
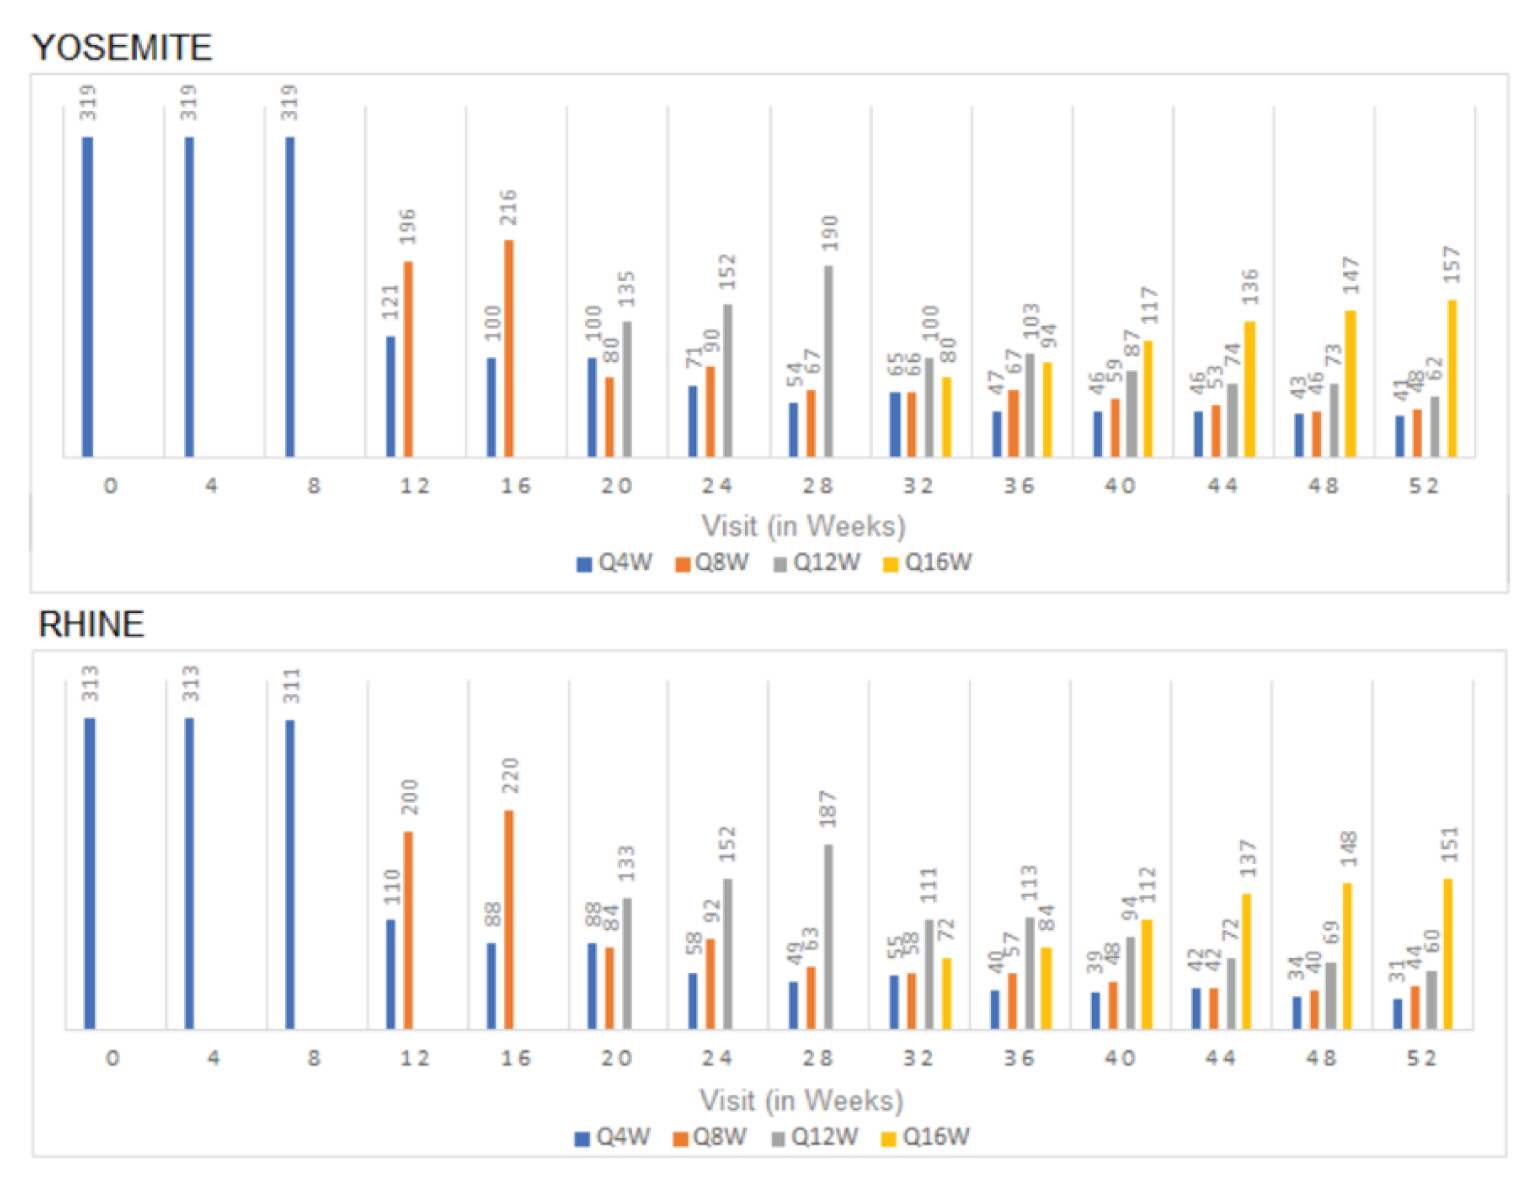
Source: Reproduced from FDA Statistical Review,45 Figure 19 page 63
Appendix 4: Description and Appraisal of Outcome Measures
Note that this appendix has not been copy-edited.
Aim
To describe the following outcome measures and review their measurement properties (validity, reliability, responsiveness to change, and MID):
Primary efficacy end point: Best corrected visual acuity (BCVA) measurement with the Early Treatment Diabetic Retinopathy Study (ETDRS) letter score.
Key secondary efficacy end point: Diabetic retinopathy severity (DRS) as measured by the ETDRS Diabetic Retinopathy Severity Scale (DRSS).
Secondary or exploratory efficacy end point: Central subfield thickness (CST) assessed by spectral domain optical coherence tomography (SD-OCT)
Secondary or exploratory efficacy end point: Health quality of life end points measured with National Eye Institutional Visual Functional Questionnaire-25 (NEI VFQ-25).
Findings
Table 37: Summary of Outcome Measures and Their Measurement Properties
Outcome Measure | Type | Conclusions about Measurement Properties | MID |
|---|---|---|---|
ETDRS letters | A chart that measures visual acuity. Represents a series of 5 letters of equal difficulty of reading on each row, with standardized spacing between letters and rows; a total of 14 lines (70 letters). A maximum score is 100.49 | Validity, reliability, and responsiveness have not been assessed in patient with DME. | |
DRSS | A fundus photography-based scale. Photographs of 7 standard fields in each eye are examined for abnormalities associated with DR. Each of the 13 levels on the scale is defined by a set of criteria based on presence and/or severity of abnormalities: from 10 to 85 in the order of increasing severity. | Reliability: On an individual eye basis, the unweighted kappa statistics was 0.42 and the weighted kappa was 0.65; on a patient basis, The unweighted kappa statistics was 0.31 and the weighted kappa was 0.71.64 Responsiveness: DRSS has shown to consistently measure worsening changes in the eyes over 1-year period64 and predict the severity of DR changes in 10 year period.65 | 3-step progression59 |
OCT | An instrument to create cross-sectional maps of the retinal structures and quantify retina thickness in patients with macular edema. | Validity: A moderate correlation between visual acuity and OCT centre point thickness has been observed (r = 0.52),57 as confirmed by other studies.66,67 Reliability: Four different OCT devices demonstrated good intra-device repeatability, but statistically significant differences in retinal thickness were found.68 SD-OCT was found to be less variable between tests than TD-OCT.69 Responsiveness: In DEM treated with photocoagulation, changes in centre point thickness were associated with changes in visual acuity over a period of 12 months.70 | Unknown |
NEI VFQ-25 | A shortened version of the NEI VFQ, a vision-targeted scale for quality of life, including 25 items relevant to 11 vision-related constructs and a single-item general health component. Items are rated on a 5- or 6-point ordinal scale. | Validity: VFQ-25 distinguished different visual acuity groups based on ETDRS letters. VFQ-25 correlates poorly to moderately with EQ-5D VAS.53 Issues with multidimensionality have been found rendering composite score questionable.71-73 Reliability: Internal consistency was acceptable (Cronbach’s alpha α ≥ 0.774) for 6 of the 8 multi-item subscales. Limitations of internal consistency due to the presence of single-item domains were noted53 Responsiveness: All but 2 subscale scores (general health and ocular pain) have been shown to be responsive to changes in visual acuity in the better-seeing eye.71,75 | 3.33 (SEM-based method) - 6.13 (0.5 SD-based method) for composite score53 |
CST = central subfield thickness; DME = diabetic macular edema; DR = diabetic retinopathy; DRSS = Diabetic Retinopathy Severity Scale; EQ-5D = EuroQol 5 dimensions; ETDRS = Early Treatment Diabetic Retinopathy Study; MID = minimal important difference; NEI VFQ-25 = National Eye Institutional Visual Functional Questionnaire-25; SD = standard deviation; SD-OCT = spectral domain optical coherence tomography; SEM = standard error of mean; TD-OCT = time-domain optical coherence tomography; VAS = visual analogue scale.
Early Treatment Diabetic Retinopathy Study
The ETDRS charts, a modified version of the Snellen chart, are based on a design by Bailey and Lovie, and are commonly used in clinical research.76 ETDRS charts present a series of 5 letters of equal difficulty of reading in each row, with standardized spacing between letters and rows; a total of 14 lines (70 letters). Letters range from 58.18 mm to 2.92 mm in height, corresponding to Snellen visual acuity fractions of 20/200 to 20/10, respectively. Letter size increases geometrically and equivalently in every line by a factor of 1.2589 (or 0.1 log unit) moving up the chart. Charts are used in a standard light box, with a background illumination of approximately 150 cd/m2,52,77 Luminance of the chart can affect visual acuity score and should be reported.52,76
Scores are based on the number of letters correctly read by a patient. The patient reads each letter on each row down the chart and is allowed one attempt for each letter. The test continues until the patient reads all of the letters on the chart or cannot read any of the letters on a line. An ETDRS letter score can be calculated when 20 or more letters are read correctly at 4.0 metres, i.e., the visual acuity letter score is equal to the total number of letters read correctly at 4.0 m plus 30. Shorter distances may be used when vision is severely impaired. If fewer than 20 letters are read correctly at 4.0 m, the visual acuity letter score is equal to the total number of letters read correctly at 4.0 m (the number recorded online 1.0), plus the total number of letters read correctly at 1.0 m in the first 6 lines. The ETDRS letter score could result in a maximum score of 100.49
Scoring for ETDRS charts is designed to produce a logarithmic minimal angle of resolution score (logMAR) suitable for statistical analysis in which individual letters score 0.02 log units. ETDRS results can be converted to Snellen fractions, another common measure of visual acuity, in which the numerator indicates the distance at which the chart was read, and the denominator the distance at which a person may discern letters of a particular size. A larger denominator indicates worsening vision. For example, a person with 20/100 vision can read letters at 20 feet that a person with 20/20 vision can read at 100 feet.52,78
A loss of ≥ 3 lines (≥ 15 letters) on an ETDRS chart corresponds to a doubling of the visual angle and is considered moderate visual loss, while a loss of ≥ 6 lines (≥ 30 letters) corresponds to a quadrupling of the visual angle and is considered severe.79
The limitation of ETDRS charts is that it may reliably identify changes in visual acuity of 2 lines (10 letters) or more, but not changes of 1 line (5 letters) or less.79 Also, the reliability of ETDRS charts depends on the baseline visual acuity. For eyes with acuity better than 20/100, a change in visual acuity of 5 or more letters has a greater than 90% probability of being a real change, while for eyes worse than 20/100, a change of 10 or more letters is required for the same reliability.49 Lastly, a floor and ceiling effect of the ETDRS and Snellen charts have been reported when patients are unable to read all letters on the 6/24 lines, or, able to read all the letters on the 6/4 line, respectively.80
Minimal Clinically Important Difference
To our knowledge, there has been no derivation of a minimal clinically important difference (MCID) for the ETDRS in DME. The FDA recommends a mean change of 15 letters or more on an ETDRS chart, or a statistically significant difference in the proportion of patients with ≥ 15 letter change in visual acuity, as clinically relevant outcomes in studies of DME.50,51 The 15-letter reference point is still a topic of discussion for the FDA.
The test–retest variability (TRV) of the measure can help guide what would be considered a clinically meaningful change. Literature-based estimates of TRV range from ± 0.07 to ± 0.19 logMAR.79 This suggests that any change in score between baseline and follow-up of approximately 4 to 10 letters results in insufficient certainty that the difference in letters is not just due to chance alone. When TRV is high, the ability to detect a real change in score is low. For example, for a TRV of ± 0.19, the sensitivity of a 0.1 logMAR change (5 letters) was 4% (0% to 14%). If the TRV is lowered to ± 0.11, the sensitivity of the test increases to 38% (25% to 53%). If the TRV remains at ± 0.11, and the threshold for change increases to a 0.2 logMAR change (10 letters), the sensitivity of the scale increases to 100% (93% to 100%). The baseline visual acuity of a sample population will affect the TRV of ETDRS letter scores49 and as a result will also affect what would reasonably be considered an MCID. A TRV of ± 0.11 has been found in healthy participants,79 while higher variability (± 0.15 to ± 0.20) has been cited for individuals with pathological changes in vision.81 For eyes with acuity better than 20/100, a change in visual acuity of ≥ 5 letters has > 90% probability of being a real change, while for eyes worse than 20/100, a change of ≥ 10 letters is required for the same reliability.49 A threshold for clinically meaningful change in patients with advanced eye disease should be higher than in healthy individuals, and has been suggested to range between 10 and 15 letters.25
Diabetic Retinopathy Severity Scale
The ETDRS Research Group modified the Airlie House classification of diabetic retinopathy (DR) to create a DR grading system based on stereoscopic fundus photographs.82 Seven standard fields in each eye covering the macula, optic disc, and surrounding areas are examined on fundus photographs and compared against standard reference photographs. The characteristics used in the DRSS were chosen based on the associations of baseline fundus photographic characteristics in patients with nonproliferative DR and progression over 1 and 3 years to proliferative DR in the ETDRS.51,82 Assessments of the following characteristics contribute to the determination of severity on the Diabetic Retinopathy Severity Scale (DRSS) for each eye: microaneurysms, hard exudates, soft exudates, intraretinal microvascular abnormalities, hemorrhages, venous loops, venous beading, fibrous proliferations, new vessels, periretinal hemorrhage, and vitreous hemorrhage.82 These abnormalities are graded independently from single or multiple fields.82
The DRSS consists of 13 levels of severity ranging from no retinopathy (level 10) to severe vitreous hemorrhage or retinal detachment at the macula (level 85).82 Each level is associated with a set of criteria, with each criterion based on overall presence of a characteristic or the number of fields in which a characteristic is present at a specific level of severity (questionable, definitely present, moderate, or severe).82 DRSS level of an eye is the level at which the set of criteria is met, and the definition of any higher level is not met.82 A single overall grade can also be assigned to a patient that consists of a level assigned to the worse eye and an indicator of whether severity is symmetrical or asymmetrical.82 The patient-based scale has double the number of levels compared to the eye-based scale since symmetrical severity is rated higher than asymmetrical severity for a given level in the worse eye.82
Reliability
On an individual eye basis, complete inter-rater agreement on DRSS level in the ETDRS was observed in 53% of eyes and agreement within one level occurred in 88% of eyes.82 The unweighted kappa statistic was 0.42, which increased to 0.65 with a weighting of 1 for exact agreement, 0.75 for one-level disagreement, and 0 for all other disagreements.82 On a patient basis, there was complete inter-rater agreement in 38% of patients, agreement within one level in 71% of patients, and agreement within 2 levels in 87% of patients.82 The unweighted kappa statistics was 0.31 and the weighted kappa was 0.71 with a weight of 1 for exact agreement and weights of 0.9375 and 0.75 for disagreements of 1 and 2 levels, respectively.82
Responsiveness to Change
Step progression refers to an increase in photographic level that can be used to describe change in DR over time.65,82 In the ETDRS, the proportion of eyes with worsening of 2 or more levels was similar among all severity categories at the 1 year follow-up time point, but not for longer follow-up periods.82
The Wisconsin Epidemiology Study of Diabetic Retinopathy evaluated whether fewer than 3 steps of ETDRS DRSS worsening using the patient-based scale were clinically meaningful by conducting a population-based study of patients with diabetes in 10 years of follow-up.65 The results indicated that patients with 1 or more and 2 or more steps of ETDRS DRSS worsening over the first 4 years were significantly more likely to develop proliferative diabetic retinopathy in the last 6 years than those without ETDRS DRSS step progression.65
Minimal (Clinically) Important Difference
An improvement of 3 or more steps is associated with a clinically meaningful improvement of 15 ETDRS letters in visual acuity59 and has previously been accepted by the FDA as an efficacy end point for assessing improvement in diabetic retinopathy.
Optical Coherence Tomography
OCT is a fast, non-invasive instrument used to create cross-sectional maps of the retinal structures and to quantify retinal thickness in patients with macular edema.29 OCT uses lasers centred on infrared wavelengths to record light reflected from interfaces between materials with different refractive indices, and from materials that scatter light. OCT machines can differentiate 3 reflecting layers thought to be the vitreous/retina, inner/outer photoreceptor segments, and the retinal pigment epithelium/choriocapillaris interfaces. Ultra-high-resolution machines can differentiate a fourth layer. During the OCT scan, a series of intersecting, radial cross-sections of the retina are measured. Resolution depends on the software as well as the hardware used and is better around the central axis than lateral areas.29,83 A recent advancement in OCT device technology has been the shift from time-domain OCT (TD-OCT) to spectral domain OCT (SD-OCT), as the latter can acquire data at a higher speed with better image resolution and reduced motion artefact.69
In a previous meta-analysis of the diagnostic test accuracy of OCT-measured foveal thickness for the diagnosis of DME, the pooled estimates of sensitivity and specificity were 0.79 and 0.85, respectively, for a thickness threshold of 250 µm for time-domain OCT and 300 µm for newer spectral-domain OCT.70 Additionally, the presence of macular edema can influence OCT measurement precision. In one study, the 95% limits of agreement (the scale at which an instrument can detect changes in a patient) for average foveal thickness in healthy eyes was 8 µm, whereas in patients with DME it was 36 µm.70
Reliability
Intra-device repeatability and inter-device reproducibility of measurements depend on a number of factors including retinal pathology, retinal region, region size, OCT model, equipment settings, manual or automated analysis, and operator experience.29 In eyes with diabetic macular edema (DME), a comparison of measurements with 4 different OCT devices found good intra-device repeatability, but statistically significant differences in retinal thickness values across different devices.68 Another study that compared the reproducibility of retinal thickness measurements from OCT images of eyes with DME obtained by TD-OCT and SD-OCT instruments found that SD-OCT devices demonstrated less TRV.69
Validity
In patients with DME, the association between OCT-measured retinal thickness and BCVA has been evaluated. A moderate correlation between visual acuity and OCT centre point thickness has been observed (r = 0.52).57 For every 100 µm decrease in centre point thickness, visual acuity increased by 4.4 letters (95% confidence interval [CI], 3.5 to 5.3).57 Other studies have shown similarly modest correlations between visual acuity and central retinal thickness determined by OCT.66,67
Responsiveness to Change
In eyes with DME treated by laser photocoagulation, changes in centre point thickness were associated with changes in visual acuity, with correlation coefficients of 0.44, 0.30, and 0.43 at 3, 5, 8, and 12 months, respectively.70
Minimal (Clinically) Important Difference
MCID for OCT has not been estimated in patient population with DME.
National Eye Institute Visual Function Questionnaire – 25
The NEI VFQ was developed to assess the influence of visual impairment on health-related quality of life. The original 51-item questionnaire was developed based on focus groups consisting of persons with a number of common eye conditions (e.g., age-related cataracts, age-related macular edema, and diabetic retinopathy), and thus may be used to assess quality of life in a broad range of eye conditions.84 The original 51-item questionnaire consists of 12 subscales related to general vision, ocular pain, near vision, distance vision, social functioning, mental health, role functioning, dependency, driving, peripheral vision, colour vision, and expectations for future vision. In addition, the questionnaire includes 1 general health subscale.85
A shorter version of the original instrument, the VFQ-25, was subsequently developed, which retained the multidimensional nature of the original and is more practical and efficient to administer.86 With the exception of the expectations for future vision, all the constructs listed above were retained in the shortened version, with a reduced number of items within each. Thus, the VFQ-25 includes 25 items relevant to 11 vision-related constructs, in addition to a single-item general health component. VFQ-25 is administered in an interview format with a self-administered version of the survey available.
Each item has 5 or 6 response categories and responses for each item are converted to a 0 to 100 scale, with 0 representing the worst and 100 the best visual functioning. Items within each construct, or subscale, are averaged to create 12 subscale scores, and averaging of the subscale scores produces the overall composite score. Different scoring approaches for the VFQ-25 have been proposed.87 Rasch modelling is used to obtain measurements from categorical data. When comparing standard scoring to Rasch analysis and an algorithm to approximate Rasch scores, all methods were highly correlated. However, standard scoring is subject to floor and ceiling effects whereby the ability of the least visually able is overestimated and the ability of the most visually able is underestimated.87
Reliability
Both versions of the NEI VFQ were reported to be valid and reliable measures of health-related quality of life among patients with a wide range of eye conditions, including DME.53,75,85,86 Internal consistency reliability was acceptable (Cronbach’s alpha α ≥ 0.774) for 6 of the 8 multi-item subscales. The internal consistency for peripheral vision and colour vision subscales was not available.85,86 The near vision and distance vision subscales are 3-item domains on the NEI VFQ-25; their internal reliability as represented by Cronbach’s alpha was reported as 0.73 and 0.58, respectively. Limitations of internal consistency due to the presence of single-item domains were noted in a validation study specific for DME population.53
Validity
Known groups validity was demonstrated by the higher mean VFQ-25 composite score in the quartile of patients with the best visual acuity (measured by ETDRS letters) compared with the quartile of patients with the worse visual acuity (mean ± SD: 72.1 ± 17.9 versus 56.1 ± 18.0, P < 0.001). Statistically significant differences were also demonstrated within all the subscales, except for ocular pain and colour vision.53
Concurrent validity was assessed though correlations of the VFQ-25 subscales with the EQ-5D visual analogue scale (ranging from worse imaginable health to best imaginable health) and Pearson correlation coefficients ranged from 0.16 to 0.43. The correlation coefficient for the composite score and the EQ-5D visual analogue scale was 0.38.53
Assessment of convergent validity yielded similar results, with correlations of the subscales with ETDRS letter score ranging from 0.10 to 0.41 in the study eye and from 0.01 to 0.51 in the fellow eye. In convergent validity analysis, the NEI VFQ-25 domains collectively showed low to moderate correlations with ETDRS visual acuity score for both the study and untreated eyes. The Pearson correlation with ETDRS total letters in the study eye was reported as 0.35 for the near vision subscale and 0.34 for the distance vision subscale. A slightly stronger correlation was observed between the NEI VFQ-25 and the EQ-5D Visual Analogue Scale (VAS), and the EQ-5D VAS along with ETDRS was a significant predictor of near and distance vision subscale scores, suggesting that general health-related quality of life was captured by the NEI VFQ-25 more so than strictly vision-related information. However, in support of known group validity, patients who saw more ETDRS letters also scored higher on the NEI VFQ-25 near and distance subscales as well as on the NEI VFQ-25 composite. Overall, the authors concluded that despite its documented limitations and the need for an improved instrument, the NEI VFQ-25 demonstrated a degree of validity to measure health-related quality of life in patients with DME.53
Assessments of the psychometric validity of the NEI VFQ-25 using Rasch scoring and principal component analysis have identified issues with multidimensionality (measurement of more than 1 construct) and poor performance of the subscales.71,72,73 The NEI VFQ-25 subscales were found to have too few items and were unable to discriminate among the population under measurement, and thus were not valid.72,73 Re-engineering the NEI VFQ into 2 constructs (visual functioning and socio-emotional factors) and removing misfit items (e.g., pain around eyes, general health, and driving in difficult conditions) improved the psychometric validity of the scale in individuals with low vision.72,73 Considering this recent evidence of multidimensionality, the validity of the single composite score of the NEI VFQ may be questioned.
Responsiveness to Change
All but 2 subscale scores (general health and ocular pain) have been shown to be responsive to changes in visual acuity in the better-seeing eye.71,75
Minimal (Clinically) Important Difference
Determination of what constitutes a clinically meaningful change in the NEI VFQ appears to be linked to its correlation with visual acuity. A psychometric validation study of the NEI VFQ-25 specifically in patients with DME has more recently been conducted, and 2 distribution-based methods were employed to determine a minimal clinically important difference (MCID) from baseline to week 54.53 Using a half-standard deviation–based approach, the MCID for each VFQ-25 domain ranged from 8.80 (general vision) to 14.40 (role difficulties), producing a composite score MCID of 6.13 points. A standard error of measurement (SEM) approach yielded similar MCID estimates from 8.79 (driving) to 14.04 (role difficulties), with a composite score MCID estimate of 3.33 points.53 The MCID for the near vision and distance vision subscales were 10.24 and 11.07, respectively. A standard error of measurement (SEM) approach yielded similar MCID estimates from 8.79 (driving) to 14.04 (role difficulties), with a composite score MCID estimate of 3.33 points. This technique lowered the MCID estimates for the near and distance vision domains, which were reported as 9.17 and 10.19, respectively.
Pharmacoeconomic Review
Abbreviations
AE
adverse event
BCVA
best corrected visual acuity
DME
diabetic macular edema
ETDRS
Early Treatment for Diabetic Retinopathy Study
HRQoL
health-related quality of life
ICER
incremental cost-effectiveness ratio
IVT
intravitreal
NICE
National Institute for Health and Care Excellence
NMA
network meta-analysis
OCT
optical coherence test
QALY
quality-adjusted life-year
VA
visual acuity
VEGF
vascular endothelial growth factor
WTP
willingness to pay
Executive Summary
The executive summary comprises 2 tables (Table 1 and Table 2) and a conclusion.
Item | Description |
|---|---|
Drug product | Faricimab (Vabysmo), solution for intravitreal injection |
Submitted price | Faricimab, 28.8 mg per 0.24 mL, single-use vial: $1,350.00 |
Indication | For the treatment of DME |
Health Canada approval status | NOC |
Health Canada review pathway | Standard review |
NOC date | May 27, 2022 |
Reimbursement request | As per indication |
Sponsor | Hoffman-La Roche Ltd. |
Submission history | Previously reviewed: in progress Indication: neovascular (wet) age-related macular degeneration Recommendation: TBD |
DME = diabetic macular edema; NOC = Notice of Compliance; TBD = to be determined.
Table 2: Summary of Economic Evaluation
Component | Description |
|---|---|
Type of economic evaluation | Cost-utility analysis Markov model |
Target population | People with DME |
Treatment | Faricimab |
Comparators |
|
Perspective | Canadian publicly funded health care payer |
Outcomes | QALYs, LYs |
Time horizon | Lifetime (25 years) |
Key data source |
|
Submitted results |
|
Key limitations |
|
CADTH reanalysis results |
|
AE = adverse event; BCVA = best corrected visual acuity; DME = diabetic macular edema; ICER = incremental cost-effectiveness ratio; LY = life-year; NMA = network meta-analysis; QALY = quality-adjusted life-year; vs. = versus.
Conclusions
Based on the CADTH clinical review, data from the YOSEMITE and RHINE noninferiority trials indicate that faricimab may be noninferior, but not superior, to aflibercept (administered every 8 weeks) for the mean change in best corrected visual acuity (BCVA) from baseline after 1 year of treatment. Faricimab may also be noninferior to aflibercept for other outcomes (i.e., other BCVA outcomes, anatomic outcomes, vision-related functions, health-related quality of life [HRQoL]); however, there is uncertainty due to the identified methodological limitations with these trials. Results of the sponsor’s network meta-analysis (NMA) ||||||||||||||||||||||||||||||||||||||||||||||||||||||||||||||||||||||||||||||||||||||||||||||||||||||||||||||||||||||||||||||||||||||||||||||||||||||||||||||||||||||||||||||||||||||||||||||||||||||||||||||||||||||||||||||||||||||||||||||||||||||||||||||||||||||||||||||||||||||||||||||||||||||||||||||||||||||||||||||||||||||||||||||||||||||||||||||||||||||||. However, CADTH clinical reviewers identified important sources of bias related to study and patient characteristics that may have an impact on the conclusions that can be drawn from the sponsor’s NMA.
CADTH undertook reanalyses that assumed that multiple administrations of bevacizumab would be drawn from each vial and adopted alternative health state utility values. CADTH additionally corrected an error in the pharmacoeconomic model and increased the number of probabilistic iterations. CADTH was unable to address limitations related to uncertainty in the comparative clinical data.
The results of the CADTH reanalysis were in line with those submitted by the sponsor: faricimab is not a cost-effective treatment for diabetic macular edema (DME) at a willingness-to-pay (WTP) threshold of $50,000 per quality-adjusted life-year (QALY), compared with bevacizumab. Based on CADTH sequential reanalysis, faricimab is more costly and more effective than bevacizumab (incremental costs = $58,130; incremental QALYs = 0.353), resulting in an incremental cost-effectiveness ratio (ICER) of $164,743 per QALY. A price reduction of 68% would be required for faricimab to be considered cost-effective compared to bevacizumab at a WTP threshold of $50,000 per QALY. However, a price reduction of greater than 98% would be required if there is no difference in the frequency of administrations and efficacy regarding visual acuity (VA). Although the CADTH reanalysis suggests that faricimab is dominant (i.e., produces more QALYs at a lower cost) compared with aflibercept and ranibizumab, there is uncertainty regarding this finding given the limitations identified in the sponsor’s NMA. The CADTH probabilistic analysis suggests that faricimab produces fewer QALYs than comparators in a proportion of simulations, which reflects imprecision associated with the NMA results. This finding should also be viewed in the context of the YOSEMITE and RHINE trials, which showed faricimab to be noninferior, but not superior, to aflibercept for change in BCVA.
Evidence to inform the relative treatment effect (i.e., improvements in BCVA, number of administrations per year) across comparators is uncertain, given the limitations of the sponsor’s NMA and a lack of direct evidence for most comparators, and it is unclear whether faricimab will result in an improvement in BCVA or fewer administrations per year. To ensure cost-effectiveness, faricimab should therefore be priced no more per administration than the lowest cost comparator that is funded.
Stakeholder Input Relevant to the Economic Review
This section is a summary of the feedback received from the patient groups, registered clinicians, and drug plans that participated in the CADTH review process.
Patient input was received from 5 groups: Fighting Blindness Canada, Canadian Council of the Blind, CNIB, Vision Loss Rehabilitation Canada, and Diabetes Canada. A total of 67 people in Canada living with diabetic retinopathy or DME completed the survey. Most respondents indicated that they were receiving injections for the treatment of DR or DME, including ranibizumab, aflibercept, and bevacizumab, as well as dexamethasone intravitreal implants. Many respondents reported receiving their most recent injection 1 to 5 years ago, which may suggest poor adherence to intravitreal injections. Of the respondents, more than half indicated that they were satisfied with their injections and that they helped prevent loss of eyesight. None of the respondents had experience with faricimab. Patients noted that an ideal treatment would reduce the physical pain and anxiety and fear associated with the injection, and the logistical strain, such as a treatment that is less invasive, similarly invasive but administered less frequently, requires fewer appointments, and reduces dependency on caregivers. In addition, patient input noted that those living outside of Canada’s urban centres and vulnerable people experience greater burden.
Clinician input was provided by the Canadian Retina Society. Clinicians indicated that the current standard of care for centre-involved DME is anti–vascular endothelial growth factor (VEGF) therapy administered by intravitreal injection. Clinicians noted that there is a need for DME treatments that have better durability and reduced treatment frequency, and noted that safety is an important consideration, as injection-related complications (e.g., inflammation, infection, bleeding, retinal detachment, cataract, and glaucoma) can compromise visual outcomes and result in blindness. Finally, clinicians noted that faricimab may be used in both treatment-naïve (i.e., as first-line treatment for DME) and treatment-experienced patients, including those who have received rescue treatment for an inadequate response to current treatment, and by those who wish to switch to faricimab to reduce treatment burden or the number of monitoring and/or treatment visits.
CADTH participating drug plans noted considerations related to relevant comparators and potential implementation factors. The plans noted that the pivotal faricimab trials included both treatment-naïve and treatment-experienced patients and questioned the place of faricimab in therapy (e.g., whether faricimab should be used in the first- or later-line setting). The plans noted that bevacizumab is used off-label in the treatment of DME and is an appropriate comparator for faricimab. The plans raised questions about switching from faricimab to another anti-VEGF drug should the treatment interval decrease because of disease progression. Finally, the plans noted the presence of confidential negotiated prices for comparators and the prevalence of batch dosing for bevacizumab involving vial sharing.
Several of these concerns were addressed in the sponsor’s model:
The frequency of injections with each comparator was considered in the model.
Bevacizumab was included as a comparator.
A societal perspective was included as a scenario analysis.
In addition, CADTH addressed some of these concerns as follows:
As part of the base case, CADTH assumed that 1 vial of bevacizumab could be used for multiple administrations.
CADTH was unable to address the following concerns raised from stakeholder input:
Dexamethasone intravitreal implants were not considered a comparator in the analysis.
Treatment switching was not considered in the sponsor’s model.
Reanalyses are based on publicly available prices and do not consider confidential negotiated prices.
Economic Review
The current review is for faricimab (Vabysmo) for DME.
Economic Evaluation
Summary of Sponsor’s Economic Evaluation
Overview
The sponsor submitted a cost-utility analysis that compared faricimab (a bispecific angiopoietin-2 and VEGF inhibitor) with other VEGF inhibitors (aflibercept, ranibizumab, and bevacizumab) in patients with DME.1 The modelled population is consistent with the Health Canada indication2 and the reimbursement request, and the modelled population is aligned with those in the YOSEMITE and RHINE trials.3
Faricimab is supplied in single-use vials containing 28.8 mg of faricimab in 0.24 mL of solution (120 mg/mL), with a single dose of 0.05 mL providing 6 mg of faricimab.2 The recommended dose of faricimab is 6 mg administered by intravitreal (IVT) injection every 4 weeks (monthly) for the first 4 doses, followed by 6 mg at a dosing interval of up to every 16 weeks (4 months), depending on the physician’s judgment of the individual patient’s anatomic and/or visual outcomes.2 Monitoring between dosing visits should be based on the patient’s status and at the physician’s discretion.2 The sponsor’s submitted price for faricimab is $1,350.00 per vial. The sponsor calculated the annual per-patient cost of faricimab to be $11,367 in the first year (based on 8.42 injections) and $6,899 in subsequent years (based on 5.11 injections per year). For all comparators, the sponsor assumed that 5 loading doses would be given (at 4-week intervals), followed by administration according to a pro re nata approach in which the interval between injections could be increased up to 8 or 12 weeks. The first-year annual costs estimated by the sponsor were $5,114 for bevacizumab ($2,855 in subsequent years), $13,272 for aflibercept ($7,090 in subsequent years), and $15,390 for ranibizumab ($8,729 in subsequent years).1 These costs were based on the assumption that all vials were single-use and that any unused product would be wasted.
The clinical outcomes of interest were QALYs and life-years over a lifetime horizon (25 years). Discounting (1.5% per annum) was applied to both costs and outcomes, and a cycle length of 4 weeks was used without half-cycle correction. The base-case perspective was that of the publicly funded health care payer in Canada.
Model Structure
The sponsor submitted a Markov model that consisted of 6 health states defined by VA, based on Early Treatment for Diabetic Retinopathy Study (ETDRS) letter score (Figure 1) — VA of more than 85 letters, VA of 85 to 71 letters, VA of 70 to 56 letters, VA of 55 to 41 letters, VA of 40 to 26 letters, VA of 25 or fewer letters (Figure 1) — plus a death state. DME in the second eye was modelled independent of the first, resulting in 36 possible combinations of VA health states. All patients entered the model receiving DME treatment in at least 1 eye, and a proportion of patients were assumed to have second-eye DME at baseline. In each model cycle, a patient’s VA could remain stable, improve, or worsen. Patients who entered the model with DME in only 1 eye were at risk of developing DME in the second eye, and the sponsor assumed that second-eye DME with a VA of 70 or fewer letters would receive treatment. In the model, a patient’s treatment status was simultaneously tracked for each eye. In each cycle, a proportion of patients were assumed to discontinue treatment and to be at risk of disease progression. In the sponsor’s base case, patients were assumed to receive treatment for a maximum of 5 years, after which time they would receive no additional treatment for DME. A summary of the sponsor’s model structure is available in Appendix 3 (Figure 1 and Figure 2).
Model Inputs
The baseline characteristics in the model were based on pooled data from the YOSEMITE and RHINE trials (62.0 years of age, 60% male), which enrolled patients with DME.3 Both the YOSEMITE and RHINE studies enrolled adults with centre-involved macular edema secondary to diabetes with a BCVA of 25 to 73 ETDRS letters. Other inclusion criteria included a glycated hemoglobin A1C level of 10% or less. The baseline distribution of patients across VA health states (based on first-eye DME) was, similarly, based on a pooled analysis of the YOSEMITE and RHINE studies: VA of more than 85 letters = 0.1%; VA of 85 to 71 letters = 18.4%; VA of 70 to 56 letters = 60.6%; VA of 55 to 41 letters = 16.0%; VA of 40 to 26 letters = 4.8%; and VA of 25 letters or fewer = 0.2%.3 At baseline, 46% of patients were assumed to have DME in both eyes based on IQVIA chart review and expert opinion.3 A per-cycle incidence of DME in the second eye of 0.80% was also employed in the model, based on an annual incidence of 10% suggested by the National Institute for Health and Care Excellence (NICE).4
The clinical efficacy and safety inputs for the pharmacoeconomic model (i.e., change in BCVA score, number of injections, treatment discontinuation rates, and rates of adverse events [AEs]) were derived from a sponsor-commissioned NMA.5
Transition probabilities for movement between model health states were derived from various sources. The treatment effect (i.e., change of BCVA from baseline) for faricimab in the first year of treatment was modelled based on data from the YOSEMITE and RHINE trials. For all other comparators, the efficacy in the first year was sourced from the NMA, based on the mean change in BCVA from baseline to 1 year. During the second year of treatment, efficacy data for all treatments were assumed to be equal to that of faricimab, based on the extrapolation of data from the YOSEMITE and RHINE trials. This extrapolation resulted in an average annual mean change in BCVA of –0.133 letters in the second year for faricimab;5 the sponsor assumed that this change of –0.133 letters would be equal across comparators in the second year and in all subsequent years in which a patient remained on treatment. Following guidelines from NICE, mean changes in BCVA were converted to annual probabilities of a gain or loss of up to 30 letters, assuming a normal distribution, which corresponded to transition probabilities between states of the Markov model described earlier.4,5 To estimate transition probabilities for comparators, the relative effect observed in the NMA was added to the mean BCVA change for faricimab and similar calculations to derive each comparator’s distribution of transition probabilities per cycle were conducted. Discontinuation rates were assumed to be equal for faricimab and all comparators, and were based on all-cause discontinuation for faricimab observed in the YOSEMITE and RHINE trials.3
Age- and sex-specific mortality rates were based on general population data from Statistics Canada.6 The sponsor applied a diabetes-specific mortality multiplier of 1.93 to the entire modelled population7 and an additional mortality multiplier of 1.36 for patients with VA less than 25 in both eyes (i.e., blindness).8
The following AEs were also included in the model: cataract, endophthalmitis, gastrointestinal disorder, intraocular inflammation, retinal detachment, retinal pigment epithelial tear, and stroke. Rates of these events for faricimab were derived from pooled data from the YOSEMITE and RHINE trials, and the sponsor assumed that the rate of AEs for all comparators would be equal to the rate with faricimab.3
Utility values for each VA-based health state were identified from a published study that fitted healthy patients with custom contact lenses to simulate visual impairment associated with age-related macular degeneration.9 Health valuation was derived using time trade-off, and the analysis used regression models to relate VA to utility after controlling for baseline vision and a possible ordering effect.9 Using this information, the sponsor calculated utility values for each combination of VA states in the best- and worst-seeing eyes.1 Disutilities associated with AEs and IVT injection were considered in the base case and were obtained from published sources.1 Additionally, it was assumed that half of all patients would experience zero utility on an injection day.
The economic model included costs related to drugs (acquisition, administration), AEs, disease management (i.e., visits to primary care providers, dermatologists, emergency rooms, and hospitalizations), monitoring, and subsequent treatment. The dosing used in the model was informed by the YOSEMITE and RHINE trials for faricimab and followed a treat-and-extend approach, with 12.1% of patients on a 4-week dosing interval, 15.5% on an 8-week interval; 20.5% on a 12-week interval, and 51.9% on a 16-week interval.3 Annual dosing frequency for all other comparators was informed by the NMA.5 Drug-acquisition costs for faricimab were based on the sponsor’s submitted price1; acquisition costs for comparators were obtained from IQVIA Delta PA data. All other costs were converted to 2021 Canadian dollars. Administration costs were modelled per injection and included use of an IVT injection and optical coherence tomography, an ophthalmology consultation, and nursing wages.10 Costs for AEs were obtained from the Ontario Case Costing Initiative, Ontario Schedule of Benefits for Physician Services, and the pharmacoeconomic report published by CADTH in 2020 for brolucizumab for the treatment of age-related macular degeneration.11,12
Summary of Sponsor’s Economic Evaluation Results
All analyses were run probabilistically (500 iterations for the base case and scenario analyses). The absolute QALYs in the deterministic analysis were higher than in the probabilistic analysis, whereas the ICER for faricimab compared with bevacizumab was much lower in deterministic analysis than in the probabilistic analysis. The probabilistic findings are presented in the following.
Base-Case Results
In the sponsor’s base case, faricimab was associated with an estimated cost of $77,000 and 10.97 QALYs over a lifetime horizon (Table 3). Faricimab was dominant over aflibercept and ranibizumab; that is, faricimab was less costly and more effective than these treatments. In sequential analysis, faricimab was associated with an ICER of $218,846 compared to bevacizumab (incremental cost = $33,856, incremental QALYs = 0.155, incremental life-years = –0.533). In the sponsor’s sequential analysis, faricimab had a 6% probability of being cost-effectiveness at a WTP threshold of $50,000 per QALY. Additional results from the sponsor’s submitted economic evaluation base case are available in Appendix 3.
Results were driven by increased drug-acquisition costs associated with faricimab (incremental costs = $33,856) and the small predicted differences in total QALYs between faricimab and bevacizumab (incremental QALYs = 0.155) (Appendix 3). The sponsor’s model estimated 0.02 incremental QALYs with faricimab in the first 96 weeks, indicating that approximately 86% of the incremental benefits were accrued in the post-trial period. At the end of the 25-year time horizon, the percentage of patients estimated to remain alive ranged from 68% for faricimab to 71% for bevacizumab.
Table 3: Summary of the Sponsor’s Economic Evaluation Results
Drug | Total costs ($) | Total QALYs | Sequential ICER ($/QALY) |
|---|---|---|---|
Bevacizumab | 43,145 | 10.82 | Reference |
Faricimab | 77,000 | 10.97 | 218,846 |
ICER = incremental cost-effectiveness ratio; QALY = quality-adjusted life-year.
Note: The submitted analyses are based on publicly available prices of comparators and may not reflect confidential negotiated prices. Only treatments on the cost-effectiveness frontier are reported in this table (See Appendix 4 for full results).
Source: Sponsor’s pharmacoeconomic submission.1
Sensitivity and Scenario Analyses Results
The sponsor conducted several scenario analyses, which included adopting a societal perspective, assuming equal efficacy for all treatments, adopting alternative health state utility values, assuming vial sharing for bevacizumab, assuming no additional visits for monitoring, adopting treatment-specific AE rates, and assuming alternative treatment practices for a second affected eye. None had an important effect on the ICER, with the following exceptions: when equal efficacy (year 1) was assumed, faricimab was associated with an ICER of $7,168,599 per QALY compared with bevacizumab; and when vial sharing was incorporated for bevacizumab (15 injections per vial), faricimab was associated with an ICER of $381,820 per QALY compared with bevacizumab.
CADTH Appraisal of the Sponsor’s Economic Evaluation
CADTH identified several key limitations to the sponsor’s analysis that have notable implications on the economic analysis:
The comparative effectiveness and safety of faricimab is uncertain. The relative effectiveness and safety of faricimab is uncertain for several reasons. First, there have been no head-to-head trials of faricimab to key comparators other than aflibercept. In the absence of comparative evidence from clinical trials for most comparators, the sponsor conducted an NMA to inform various parameters (e.g., change in BCVA score, number of injections) in their pharmacoeconomic model. The results of this NMA ||||||||||||||||||||||||||||||||||||||||||||||||||||||||||||||||||||||||||||||||||||||||||||||||||||||||||||||||||||||||||||||||||||||||||||||||||||||||||||||||||||||||||||||||||||||||||||||||||||||||||||||||||||||||||||||||||||||||||||||||||||||||||||||||||||||||||||||||||||||||||||||||||. As indicated by clinical experts consulted by CADTH, all anti-VEGF therapies would ideally follow a treat-and-extend approach, there is considerable uncertainty as to whether faricimab would result in ||||||||||||||||||||||||||||||||||||||||||||||||||||||||||||||||||||||||||||||||. However, as noted in the CADTH clinical review, heterogeneity in study design and patient characteristics limits conclusions that can be made about these results.
Second, although direct evidence exists for faricimab compared with aflibercept, this evidence was not directly used in the sponsor’s pharmacoeconomic submission (i.e., all comparative estimates in the sponsor’s pharmacoeconomic model were based on the NMA findings). As noted previously, limitations of the sponsor’s NMA affect the validity and interpretation of the NMA results.
Third, the sponsor was inconsistent with regard to the use of NMA results in the pharmacoeconomic model. In some cases, the sponsor assumed that the inputs for all comparators would be equal to faricimab, given that the “NMA results suggested similarity of all comparators to faricimab.”1 However, for other inputs, the sponsor incorporated estimates from the NMA despite similar estimates across comparators. Specifically, BCVA and annual injection frequency were based on estimates from the NMA, whereas discontinuation and AE rates were assumed to be equal for all treatments (despite these parameters being included as outcomes in the NMA). The inconsistent use of NMA data and assumptions around equivalence were not justified by the sponsor and lack face validity.
Given the lack of head-to-head evidence for faricimab relative to other relevant comparators and concerns about the interpretation of the sponsor’s submitted comparative efficacy data, it is uncertain whether faricimab provides a net benefit above any comparator. The sponsor’s model predicts that faricimab is more effective (i.e., higher QALYs) than aflibercept; however, the YOSEMITE and RHINE trials showed that faricimab was noninferior, but not superior, to aflibercept in terms of BCVA. In scenario analyses, CADTH explored the impact of assuming equal efficacy and equal administration frequency for all comparators to reflect this uncertainty.
Drug-acquisition costs of bevacizumab may be overestimated. The sponsor assumed that, for all comparators, all vials would be single-use and no vial sharing would occur. For bevacizumab, although the product monograph indicates that it is supplied in single-use vials,13 the recommended dose (1.25 mg per administration) is well below the smallest vial size (100 mg). Clinical experts consulted by CADTH for this review, as well as CADTH participating drug plans, indicated that in practice multiple doses of bevacizumab can be obtained from a single vial and that vial sharing occurs. CADTH notes that, in their budget impact analysis (BIA), the sponsor assumed that multiple administrations would be obtained from each vial of bevacizumab.14
In the CADTH base case, a 100 mg vial of bevacizumab was assumed to be used for 30 administrations (1.25 mg each). In scenario analysis, CADTH adopted a lower estimated number of administrations of bevacizumab per vial.
Utility values were overestimated and their applicability to DME is uncertain. The sponsor incorporated health state utility values derived from the study by Czoski-Murray et al. (2009),9 who developed regression models that relate VA to utility. However, this study was not performed in a DME population but in a group of healthy participants wearing custom contact lenses to simulate VA states similar to age-related macular degeneration.9 The applicability of these utility values to patients with DME is unknown. In their derivation of the health state utility values, the sponsor used a scaling factor to account for vision in the worst-seeing eye, based on technical guidance from NICE.4 However, the utility values resulting from this adjustment ranged from 0.326 for patients with both eyes reading 25 letters or fewer to 0.919 for patients reading more than 85 letters in both eyes. These values lack face validity, given that the general mean population in Canada utility value for patients 60 to 64 years is 0.842.15 Clinical experts consulted by CADTH for this review indicated that patients with DME are expected to have lower HRQoL than the general population.
In the CADTH base case, CADTH adopted an alternative set of health state utility values provided by the sponsor, which had a maximum observed utility of 0.896 for patients in the highest VA state.16 CADTH notes that although the maximum health state utility value is lower in this analysis, it is higher than in the mean population in Canada for similarly aged patients and may still overestimate the health state utility values.
The sponsor’s base-case results are not reproducible. The results from the sponsor’s base-case analysis were not reproducible across multiple runs of the model, owing to small differences in QALYs between treatments and a low number of probabilistic iterations. In tests done by CADTH, the ICER for faricimab versus bevacizumab ranged from $262,856 to $312,527. Although the sponsor’s pharmacoeconomic report indicated that the costs and QALYs predicted by the model were stable at 500 iterations, no data were provided to support this statement, and probabilistic unseeded runs conducted by CADTH using the sponsor’s base case produced meaningfully different ICERs. CADTH additionally identified an error in the sponsor’s model that led to inappropriate survival probabilities for some health states. This error was fixed in CADTH reanalysis.
Based on testing performed by CADTH, at least 1,500 iterations are required for the sponsor’s model to produce consistent ICERs across model runs. CADTH used 1,500 iterations for all probabilistic reanalyses, which was sufficient to achieve stability across multiple unseeded model runs.
Poor modelling practices were employed. The sponsor’s submitted model included numerous IFERROR statements, which may lead to situations in which the parameter value is overwritten with an alternative value without alerting the user to the automatized overwriting. The systematic use of IFERROR statements makes thorough auditing of the sponsor’s model impractical, as it remains unclear whether the model is running inappropriately by overriding errors. CADTH additionally notes that, for many parameters, a standard error of 20% from the mean was assumed. Given that there are available data from epidemiologic studies and clinical trials, assuming an arbitrary 20% of the mean is unnecessary and does not reflect uncertainty in the available information.
CADTH was unable to address these limitations and notes that a thorough validation of the sponsor’s model was not possible.
Additional limitations were identified but were not considered to be key limitations:
Patients were assumed to require additional ophthalmologist visits for monitoring. In the sponsor’s base case, it was assumed that patients would require additional monitoring visits between visits for treatment administration. For each visit, the sponsor included the cost of an outpatient ophthalmologist visit and an optical coherence test (OCT). Clinical experts consulted by CADTH for this review indicated that, in practice, patients would be monitored during their scheduled injection visit, at which time an OCT would be performed. Given that the sponsor assumed an OCT would also be done as part of the injection visit, costs related to OCT may be double-counted in the sponsor’s analysis.
In scenario analysis, CADTH assumed that patients would be monitored during their injection visits such that no additional monitoring visits between injections would be required.
Additionally, the following key assumptions were made by the sponsor and have been appraised by CADTH (Refer to Table 4).
CADTH Reanalyses of the Economic Evaluation
Base-Case Results
CADTH undertook reanalyses that addressed limitations in the model, as summarized in Table 5. The CADTH base case was derived by making changes in model parameters and assumptions, in consultation with clinical experts. All CADTH probabilistic reanalyses were based on 1,500 iterations.
CADTH undertook a stepped analysis (Table 6), incorporating each change proposed in Table 5 to the sponsor’s base case to highlight the impact of each change (disaggregated results are presented in Table 12 in Appendix 4).
Table 4: Key Assumptions of the Submitted Economic Evaluation (Not Noted as Limitations to the Submission)
Sponsor’s key assumption | CADTH comment |
|---|---|
At baseline, 46% of patients were assumed to have DME in the second eye | Uncertain but likely appropriate based on clinical expert feedback |
Patients with disease in their second eye would only be treated once their VA fell to below 70 letters | The clinical experts consulted by CADTH noted that, in real-world practice, this would vary by patient but is likely appropriate as a modelling assumption |
The sponsor assumed a maximum treatment duration of 5 years with anti-VEGF therapies, based on the resolving nature of DME | Appropriate, according to clinical experts |
DME progression was assumed to be independent in each eye | Uncertain; clinical experts suggested there would likely be a high correlation in disease progression between eyes |
DME = diabetic macular edema; VA = visual acuity; VEGF = vascular endothelial growth factor.
Table 5: CADTH Revisions to the Submitted Economic Evaluation
Stepped analysis | Sponsor’s value or assumption | CADTH value or assumption |
|---|---|---|
Corrections to sponsor’s base case | ||
1. Error in the sponsor’s pharmacoeconomic model | Incorrectly referenced an empty cell | Cell value set to 1 to reinstate appropriate survival probabilities according to Canadian life tables |
Changes to derive the CADTH base case | ||
1. Number of administrations of bevacizumab | 1 administration per 100 mg vial | 30 administrations per 100 mg vial |
2. Health state utility values | Czoski-Murray et al. (2009)9 | Hodgson et al. (2017)16 |
CADTH base case | — | Reanalysis 1 + 2 |
Note: The CADTH base case was performed using 1,500 iterations in the probabilistic base case.
Table 6: Summary of the Stepped Analysis of the CADTH Reanalysis Results
Stepped analysis | Drug | Total costs ($) | Total LYs | Total QALYs | ICER ($/QALYs) |
|---|---|---|---|---|---|
Sponsor’s base case (deterministic)a | Bevacizumab | 43,932 | 18.273 | 11.256 | Reference |
Faricimab | 79,388 | 17.870 | 11.525 | 132,148 | |
Sponsor’s base case (corrected; deterministic)b | Bevacizumab | 42,153 | 14.830 | 9.425 | Reference |
Faricimab | 77,184 | 14.836 | 9.840 | 84,337 | |
CADTH reanalysis 1 (deterministic): bevacizumab administrations | Bevacizumab | 16,532 | 14.830 | 9.425 | Reference |
Faricimab | 77,184 | 14.836 | 9.840 | 146,022 | |
CADTH reanalysis 2 (deterministic): utilities | Bevacizumab | 42,153 | 14.830 | 9.727 | Reference |
Faricimab | 77,184 | 14.836 | 10.108 | 91,972 | |
CADTH base case: reanalysis 1 + 2 (deterministic) | Bevacizumab | 16,532 | 14.830 | 9.727 | Reference |
Faricimab | 77,184 | 14.836 | 10.108 | 159,240 | |
CADTH base case: reanalysis 1 + 2 (probabilistic) | Bevacizumab | 16,008 | 14.092 | 9.233 | Reference |
Faricimab | 74,138 | 14.097 | 9.586 | 164,743 |
ICER = incremental cost-effectiveness ratio; LY = life-year; QALY = quality-adjusted life-year.
Note: In all stepwise analyses and the base case, aflibercept and ranibizumab were dominated and, as such, do not appear on the efficiency frontier. Full results are available in Appendix 4.
aProbabilistic ICER in the sponsor’s base case was $218,846 per QALY.1
bProbabilistic ICER in the corrected sponsor’s base case was $87,671 per QALY. Probabilistic and deterministic ICERs were more closely aligned after correction of the sponsor’s base case.
The results of the CADTH base case were consistent with the sponsor’s base case: faricimab is associated with higher costs and QALYs compared with bevacizumab, and lower costs and higher QALYs compared with aflibercept and ranibizumab (Appendix 4). In sequential analysis, faricimab was dominant (lower costs and higher QALYs) compared with aflibercept and ranibizumab, and associated with an ICER of $164,743 compared with bevacizumab (incremental costs = $58,130; incremental QALYs = 0.353). In the CADTH base case, faricimab had a 0% probability of being cost-effective at a WTP threshold of $50,000 per QALY.
CADTH notes that, although aflibercept and ranibizumab are dominated by faricimab owing to a predicted higher number of QALYs at a lower cost, there is uncertainty associated with this finding. As can be found in Figure 3 in Appendix 4 (scatter plot showing the incremental QALYs and costs for each comparator relative to faricimab), some simulations show faricimab producing fewer QALYs compared with aflibercept (< 1%) and ranibizumab (11%).
In the CADTH base case, results were driven by the drug-acquisition costs for faricimab compared with bevacizumab.
Scenario Analysis Results
CADTH undertook price-reduction analyses based on the sponsor’s and CADTH’s base case. The CADTH base case suggested that a price reduction of 68% would be required to achieve cost-effectiveness of faricimab relative to bevacizumab at a $50,000 per QALY threshold (refer to Table 7).
Table 7: CADTH Price Reduction Analyses
Analysis | ICERs for faricimab vs. bevacizumab ($/QALY) | |
|---|---|---|
Price reduction | Sponsor base case | CADTH reanalysis |
No price reduction | 218,846 | 164,743 |
10% | 178,688 | 147,777 |
20% | 138,533 | 130,809 |
30% | 98,378 | 113,842 |
40% | 58,222 | 96,874 |
43% | 46,176 | 91,784 |
50% | 18,067 | 79,906 |
60% | Dominant | 62,939 |
68% | Dominant | 49,365 |
ICER = incremental cost-effectiveness ratio; QALY = quality-adjusted life-year; vs. = versus.
Note: Bold text reflects the price reduction at which the ICER falls below $50,000 per QALY.
CADTH undertook several scenario analyses to determine the impact of alternative assumptions on the cost-effectiveness of faricimab in the base case, which are outlined as follows:
The efficacy of all comparators was assumed to be equal to that of faricimab in terms of mean change in BCVA and the resulting transition probabilities. The annual number of administrations remained unchanged from the sponsor’s base case.
The efficacy of all comparators was assumed to be equal to that of faricimab in terms of mean change in BCVA and the resulting transition probabilities. The annual number of administrations was equal to faricimab for all comparators.
Each 100 mg vial of bevacizumab could be used for 15 administrations.
It was assumed that patients would be monitored during injection visits and that no additional monitoring costs would be incurred.
The results of these analyses are presented in Appendix 4 (Table 14). The scenarios involving equal efficacy of all comparators resulted in an ICER for faricimab of $12,856,565 per QALY versus compared with bevacizumab. In the scenario in which equal administration frequency was also assumed, faricimab was dominated (i.e., equal QALYs at a higher cost). The scenarios involving the number of bevacizumab administrations and monitoring visits did not substantially influence the ICER.
Issues for Consideration
The sponsor did not include dexamethasone IVT implants (Ozurdex) or brolucizumab as comparators. Dexamethasone implants is approved by Health Canada for the treatment of DME in patients who are pseudophakic and has recently been submitted to CADTH’s reimbursement review process.17 Patient input received by CADTH for this review indicated that some patients with DME had prior experience with dexamethasone IVT implants, although clinical experts consulted by CADTH indicated that dexamethasone implants are not commonly used for this indication. Brolucizumab is available in Canada for the treatment of neovascular (wet) age-related macular degeneration,18 and clinical experts consulted by CADTH for this review indicated that brolucizumab is used off-label for the treatment of DME. At the time of CADTH’s review, a submission of brolucizumab to CADTH was expected in June 2022. The cost-effectiveness of faricimab compared with dexamethasone IVT implants or brolucizumab is unknown.
Patients with a hemoglobin A1C of greater than 10% were excluded from the YOSEMITE and RHINE trials. Clinical experts consulted by CADTH noted that these patients would still be eligible for faricimab. Owing to a lack of clinical data, the cost-effectiveness of faricimab among patients with hemoglobin A1C of greater than 10% is unknown.
A biosimilar for ranibizumab (Byooviz) has been recently approved by Health Canada19 and may affect the cost-effectiveness of faricimab compared with ranibizumab, depending on the list price.
Overall Conclusions
Based on the CADTH clinical review, data from the YOSEMITE and RHINE noninferiority trials indicate that faricimab may be noninferior, but not superior, to aflibercept (administered every 8 weeks) for the mean change in BCVA from baseline after 1 year of treatment. Faricimab may also be noninferior to aflibercept for other outcomes (i.e., other BCVA outcomes, anatomic outcomes, vision-related functions, HRQoL); however, there is uncertainty due to the methodological limitations identified in these trials. Results of the sponsor’s NMA ||||||||||||||||||||||||||||||||||||||||||||||||||||||||||||||||||||||||||||||||||||||||||||||||||||||||||||||||||||||||||||||||||||||||||||||||||||||||||||||||||||||||||||||||||||||||||||||||||||||||||||||||||||||||||||||||||||||||||||||||||||||||||||||||||||||||||||||||||||||||||||||||||. However, CADTH clinical reviewers identified important sources of bias related to study and patient characteristics that may have an impact on the conclusions that can be drawn from the sponsor’s NMA.
CADTH undertook reanalyses that assumed that multiple administrations of bevacizumab would be drawn from each vial and adopted alternative health state utility values. CADTH additionally corrected an error in the pharmacoeconomic model and increased the number of probabilistic iterations. CADTH was unable to address limitations related to uncertainty in the comparative clinical data.
The results of the CADTH reanalysis were in line with those submitted by the sponsor: faricimab is not a cost-effective treatment for DME at a WTP threshold of $50,000 per QALY compared with bevacizumab. Based on the CADTH sequential reanalysis, faricimab is more costly and more effective than bevacizumab (incremental costs = $58,130; incremental QALYs = 0.353), resulting in an ICER of $164,743 per QALY. A price reduction of 68% would be required for faricimab to be considered cost-effective compared with bevacizumab at a WTP threshold of $50,000 per QALY. However, a price reduction of greater than 98% would be required if there is no difference in the frequency of administrations and in efficacy regarding VA. Although the CADTH reanalysis suggests that faricimab is dominant (i.e., produces more QALYs at a lower cost) compared with aflibercept and ranibizumab, there is uncertainty regarding this finding, given the limitations identified in the sponsor’s NMA. The CADTH probabilistic analysis suggests that faricimab produces fewer QALYs than comparators in a proportion of simulations, which reflects the imprecision associated with the NMA results. This finding should also be viewed in the context of the YOSEMITE and RHINE trials, which showed faricimab to be noninferior, but not superior, to aflibercept for change in BCVA.
Evidence to inform the relative treatment effect (i.e., improvements in BCVA, number of administrations per year) across comparators is uncertain, given limitations of the sponsor’s NMA and a lack of direct evidence for most comparators, and it is unclear whether faricimab will result in an improvement in BCVA or fewer administrations per year. To ensure cost-effectiveness, faricimab should therefore be priced no more per administration than the lowest cost comparator that is funded.
References
1.Pharmacoeconomic evaluation [internal sponsor's report]. In: Drug Reimbursement Review sponsor submission: Vabysmo, 6mg/0.05mL solution for intravitrial injection. Mississauga (ON): Hoffmann-La Roche Ltd; 2022 Mar 24.
2.Vabysmo, 6mg/0.05mL solution for intravitrial injection [product monograph]. Mississauga (ON): Hoffmann-La Roche Ltd; 2022.
3.Wykoff C, Abreu F, Adamis A, Basu K, Eichenbaum D, Haskova Z. Efficacy, durability, and safety of intravitreal faricimab with extended dosing up to every 16 weeks in patients with diabetic macular oedema (YOSEMITE and RHINE): two randomised, double-masked, phase 3 trials. The Lancet. 2022;399(10326):741-755. PubMed
4.Age-related macular degeneration: NICE guidelines [NG82]. Appendix J: Health Economics. London (UK): National Institute for Health and Care Excellence; 2018: https://www.nice.org.uk/guidance/ng82/evidence/appendix-j-health-economics-pdf-170036251093. Accessed 2022 May 30.
5.Sponsor's NMA report title [internal sponsor's report]. In: Drug Reimbursement Review sponsor submission: Vabysmo, 6mg/0.05mL solution for intravitrial injection. Mississauga (ON): Hoffmann-La Roche Ltd; 2022 Mar 24.
6.Table: 13-10-0114-01. Life expectancy and other elements of the life table, Canada, all provinces except Prince Edward Island. Ottawa (ON): Statistics Canada; 2022: https://www150.statcan.gc.ca/t1/tbl1/en/tv.action?pid=1310011401. Accessed 1800 Jan 1.
7.Mulnier H, Seaman H, Raleigh V, Soedamah-Muthu S, Colhoun H, Lawrenson R. Mortality in people with Type 2 diabetes in the UK. Diabet Med. 2006;23(5):516-521. PubMed
8.Zhang T, al. e. The association between visual impairment and the risk of mortality: a meta-analysis of prospective studies. J Epidemiol Community Health. 2016;70(8):836-842. PubMed
9.Czoski-Murray C, Carlton J, Brazier J, Young T, Papo N, Kang H. Valuing condition-specific health states using simulation contact lenses. Value in Health. 2009;12(5):793-799. PubMed
10.Schedule of benefits for laboratory services: effective July 1, 2020. Toronto (ON): Ontario Ministry of Health; 2020: https://www.health.gov.on.ca/en/pro/programs/ohip/sob/lab/lab_mn2020.pdf. Accessed 2022 May 20.
11.Ontario Case Costing Initiative (OCCI). Toronto (ON): Ontario Health and Long-Term Care; 2017: https://data.ontario.ca/dataset/ontario-case-costing-initiative-occi. Accessed 2022 May 20.
12.CADTH Common Drug Review: Pharmacoeconomic Report for Brolucizumab (BEOVU). Ottawa (ON): CADTH; 2020: https://www.cadth.ca/sites/default/files/cdr/pharmacoeconomic/sr0632-beovu-pharmacoeconomic-review-report.pdf.
13.AVASTIN (bevacizumab): 100mg and 400mg (25mg/mL solution for injection) [product monograph]. 2022; https://pdf.hres.ca/dpd_pm/00065643.PDF. Accessed 2022 Jun 15.
14.Budget Impact Analysis [internal sponsor's report]. In: Drug Reimbursement Review sponsor submission: Vabysmo, 6mg/0.05mL solution for intravitrial injection. Mississauga (ON): Hoffmann-La Roche Ltd; 2022 Mar 24.
15.Guertin J, Feeny D, Tarride J. Age- and sex-specific Canadian utility norms, based on the 2013-2014 Canadian Community Health Survey. CMAJ. 2018;12(190):E155-161. PubMed
16.Hodgson R, Reason T, Trueman D, Wickstead R, Kusel J, Jasilek A, et al. Challenges associated with estimating utility in wet age-related macular degeneration: a novel regression analysis to capture the bilateral nature of the disease. Adv Ther. 2017;34(10):2360-2370. PubMed
17.CADTH reimbursement review: dexamethasone intravitreal implant. Ottawa (ON): CADTH; 2022: https://www.cadth.ca/dexamethasone-intravitreal-implant-0. Accessed 2022 Jun 8.
18.Novartis Pharmaceuticals Canada Inc. Beovu brolucizumab product monograph. 2022; https://pdf.hres.ca/dpd_pm/00064837.PDF. Accessed May 6, 2022.
19.Jeremias S. Health Canada Approves First Ranibizumab Biosimilar. 2022; https://www.centerforbiosimilars.com/view/health-canada-approves-first-ranibizumab-biosimilar. Accessed 2022 Apr 12.
20.Ontario Ministry of Health, Ontario Ministry of Long-Term Care. Ontario drug benefit formulary/comparative drug index. 2022; https://www.formulary.health.gov.on.ca/formulary/. Accessed 2022 May 20.
21.Eylea (aflibercept): 2 mg/0.05 mL solution for intravitreal injection [product monograph]. 2022; https://pdf.hres.ca/dpd_pm/00064757.PDF. Accessed 2022 May 6.
22.Lucentis (ranibizumab): 10 mg/mL solution for injection [product monograph]. 2021; https://pdf.hres.ca/dpd_pm/00064117.PDF. Accessed 2022 May 6.
23.BEOVU® (brolucizumab-dbll) injection, for intravitreal use Initial U.S. Approval: 2019. https://www.novartis.us/sites/www.novartis.us/files/beovu.pdf. Accessed June 6, 2022.
24.Table: 17-10-0057-01 Projected population, by projection scenario, age and sex, as of July 1 (x 1,000). Ottawa (ON: Statistics Canada; 2022: https://www150.statcan.gc.ca/t1/tbl1/en/tv.action?pid=1710005701. Accessed 2022 May 20.
25.Diabetes, by age group. Ottawa (ON): Statistics Canada; 2022: https://www150.statcan.gc.ca/t1/tbl1/en/tv.action?pid=1310009607&pickMembers%5B0%5D=1.1&pickMembers%5B1%5D=3.1&cubeTimeFrame.startYear=2015&cubeTimeFrame.endYear=2020&referencePeriods=20150101%2C20200101. Accessed 2022 Jun 6.
26.Petrella R, et al. Prevalence, Demographics, and Treatment Characteristics of Visual Impairment due to Diabetic Macular Edema in a Representative Canadian Cohort. J Ophthalmol. 2012;2012:159167. PubMed
Appendix 1: Cost Comparison Table
Note that this appendix has not been copy-edited.
The comparators presented in the following table have been deemed to be appropriate based on feedback from clinical experts. Comparators may be recommended (appropriate) practice or actual practice. Existing Product Listing Agreements are not reflected in the table and as such, the table may not represent the actual costs to public drug plans.
Table 8: CADTH Cost Comparison Table for Diabetic Macular Edema
Treatment | Strength/ concentration | Form (vial size if single-use) | Price ($) | Recommended dosagea | Daily cost ($) | Annual cost ($) |
|---|---|---|---|---|---|---|
Faricimab | 120 mg/mL | 0.05 mL Solution for intravitreal injection | 1,350.0000b | 6 mg every 4 weeks for the first 4 doses followed by 6 mg at a dosing interval of up to every 16 weeks | Year 1: 22.18 to 51.75 to Subsequent: 11.09 to 48.05 | Year 1: 8,100 to 18,900 (6 to 14 inj.) Subsequent: 4,050 to 17,550 (3 to 13 inj.) |
Anti-VEGF inhibitors | ||||||
Aflibercept (Eylea) | 40 mg/mL | 0.05 mL Solution for intravitreal injection | 1,418.0000 | 2 mg every 4 weeks for the first 5 doses followed by 2 mg every 8 weeks. After 12 months the treatment interval may be extended in 2-week increments | Year 1: 34.94 Subsequent: 27.18 | Year 1: 12,762 (9 inj.) Subsequent: 9,926 (7 inj.) |
Bevacizumab (Avastin) | 25 mg/mL | 4 mL 16 mL Solution for intravitreal injection | 519.1800 2,076.7104 | 1.25 mg every 4 weeks for the first 3 doses followed by 1.25 mg every 8 to 12 weeksc | Year 1: 0.28 to 0.38d Subsequent: 0.19 to 0.33d | Year 1: 104 to 138 (6 to 8 inj.)d Subsequent: 69 to 121 (4 to 7 inj.)d |
Bevacizumab (Mvasi) | 25 mg/mL | 4 mL 16 mL Solution for intravitreal injection | 347.0000 1,388.0000 | 1.25 mg every 4 weeks for the first 3 doses followed by 1.25 mg every 8 to 12 weeksc | Year 1: 0.19 to 0.25d Subsequent: 0.13 to 0.22d | Year 1: 69 to 93 (6 to 8 inj.)d Subsequent: 46 to 81 (4 to 7 inj.)d |
Brolucizumab (Beovu) | 120 mg/mL | 0.05 mL Solution for intravitreal injection | 1,390.0000 | 6 mg every 6 weeks for the first 5 doses followed by 6 mg every 8 to 12 weeks | Year 1: 34.25 Subsequent: 26.64 | Year 1: 9,730 to 11,120 (7 to 9 inj.) Subsequent: 5,560 to 9,730 (4 to 7 inj.) |
Ranibizumab (Lucentis) | 10 mg/mL | 0.23 mL Solution for intravitreal injection | 1,616.5500 | 0.5 mg every 4 weeks for the first 3 doses followed by 0.5 mg up to every 12 weeks | Year 1: 39.83 Subsequent: 30.98 | Year 1: 14,549 (9 inj.) Subsequent: 11,316 (7 inj.) |
inj. = injections; VEGF = vascular endothelial growth factor.
Note: All prices are from the Ontario Drug Benefit Formulary (accessed March 2022),20 unless otherwise indicated, and do not include dispensing fees. Annual costs are based on 52 weeks per year.
aRecommended doses are from the respective product monographs, unless otherwise indicated.21-23 Brolucizumab dosing is based on the FDA product monograph.23
bSponsor submitted price.1
cBevacizumab is used off-label in this population and, as such, does not have a recommended dosage for DME in the product monograph. Dosing for bevacizumab was based on clinical expert input received by CADTH for this review.
dCosts for bevacizumab were calculated based on the assumption that 30 doses could be obtained per 100 mg (4 mL) vial. This assumption was validated by clinical experts and the drug plans.
Appendix 2: Submission Quality
Note that this appendix has not been copy-edited.
Description | Yes/No | Comments |
|---|---|---|
Population is relevant, with no critical intervention missing, and no relevant outcome missing | No | Brolucizumab was identified as a potentially relevant comparator by clinical experts consulted by CADTH but was not included in the sponsor’s PE analysis or BIA. |
Model has been adequately programmed and has sufficient face validity | No | An error in the sponsor’s model led to inappropriate survival assumptions for patients in some health states. |
Model structure is adequate for decision problem | Yes | No comment. |
Data incorporation into the model has been done adequately (e.g., parameters for probabilistic analysis) | No | The sponsor arbitrarily chose standard error values of 20% for most parameters. This does not adequately reflect parameter uncertainty. |
Parameter and structural uncertainty were adequately assessed; analyses were adequate to inform the decision problem | No | The sponsor’s probabilistic results differed meaningfully from the deterministic results before correction of the modelling error. The sponsor’s base case results were not stable owing to an insufficient number of iterations. |
The submission was well organized and complete; the information was easy to locate (clear and transparent reporting; technical documentation available in enough details) | No | The model did not permit the reviewer to trace the formulas through the model, making validation difficult. The reviewer was unable to easily navigate to named cells and parameters as is generally possible. In addition, hidden sheets, cells, and headings further complicated the validation process. The model also included numerous IFERROR statements. |
BIA = budget impact analysis; PE = pharmacoeconomic.
Appendix 3: Additional Information on the Submitted Economic Evaluation
Note that this appendix has not been copy-edited.
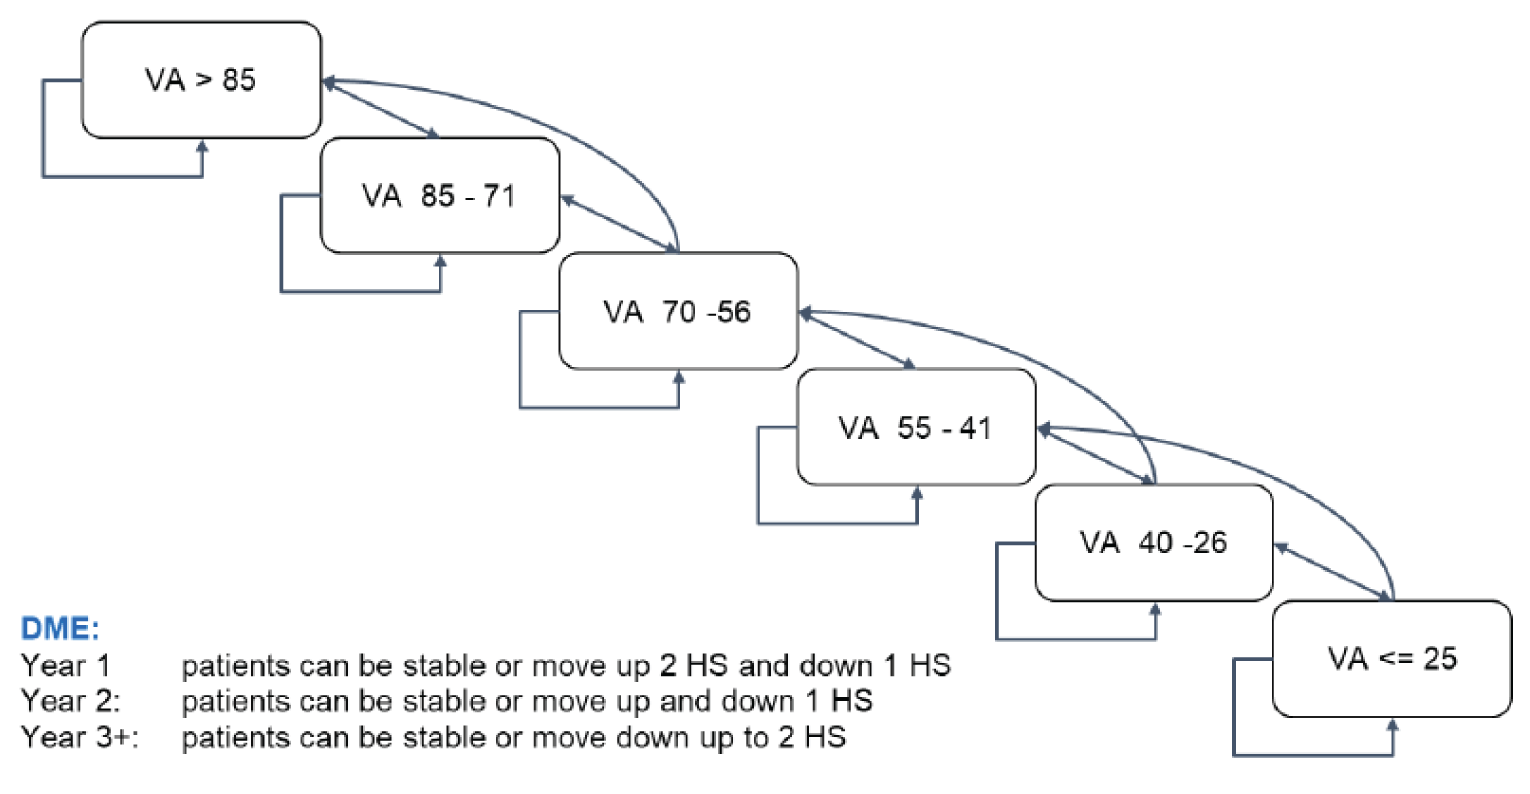
DME = diabetic macular edema; HS = health state; VA = visual acuity.
Source: Sponsor’s pharmacoeconomic submission.1
Figure 2: Treatment-Related States and Transitions
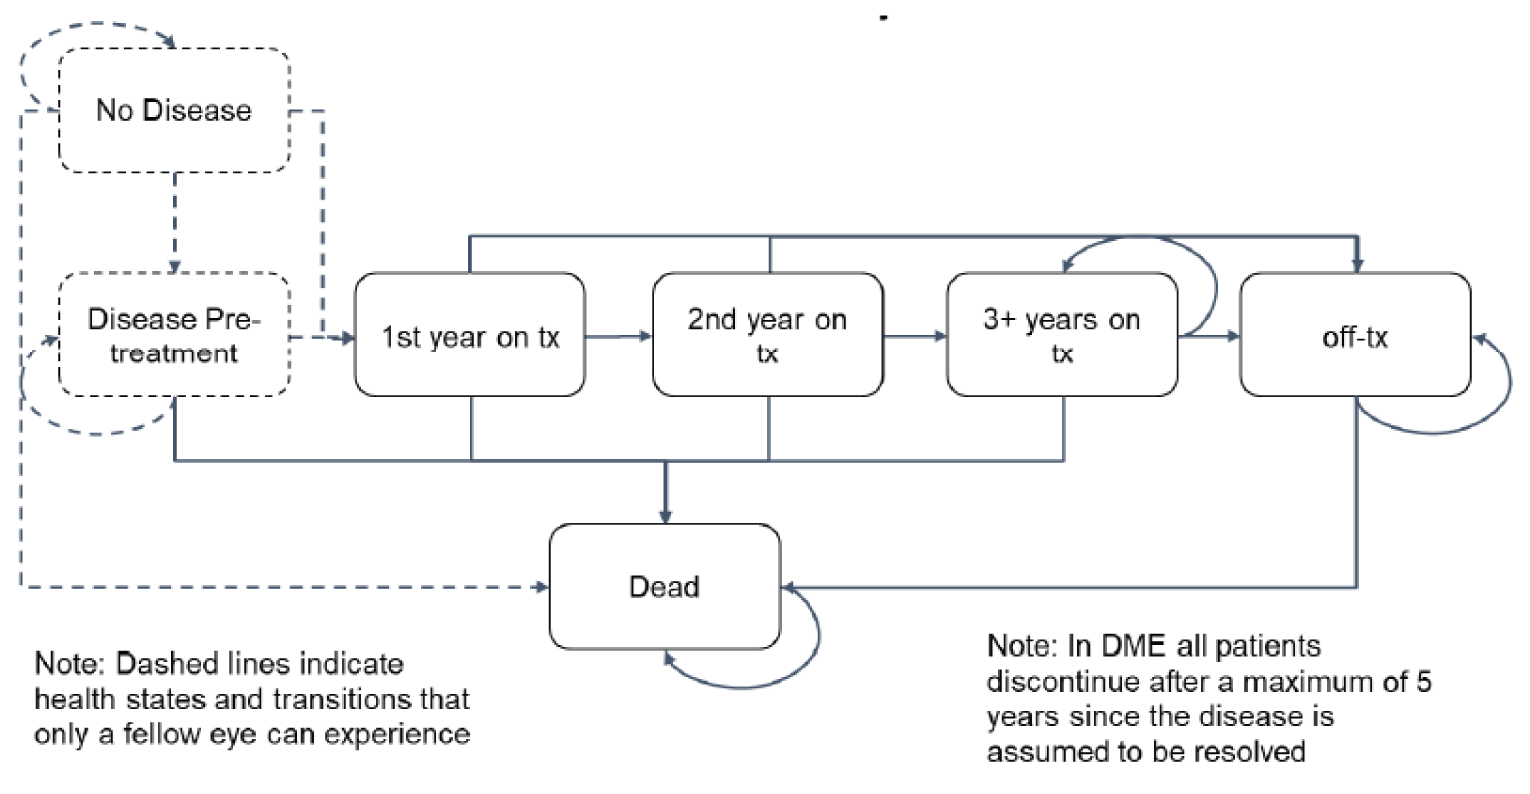
DME = diabetic macular edema; Tx = treatment.
Source: Sponsor’s pharmacoeconomic submission.1
Detailed Results of the Sponsor’s Base Case
Table 10: Disaggregated Results of the Sponsor’s Base Case
Parameter | Faricimab | Ranibizumab | Aflibercept | Bevacizumab |
|---|---|---|---|---|
Discounted LYs | ||||
Total | 16.981 | 17.479 | 17.195 | 17.513 |
Discounted QALYs | ||||
Total | 10.970 | 10.837 | 10.896 | 10.815 |
First eye VA >85 | 2.083 | 1.539 | 1.799 | 1.506 |
First eye VA 85-71 | 3.346 | 2.715 | 3.032 | 2.659 |
First eye VA 70-56 | 3.188 | 3.254 | 3.251 | 3.221 |
First eye VA 55-41 | 1.525 | 2.148 | 1.832 | 2.195 |
First eye VA 40-26 | 0.489 | 0.761 | 0.608 | 0.799 |
First eye VA ≤25 | 0.339 | 0.420 | 0.373 | 0.435 |
Mean number of injections | ||||
Total | 48.99 | 53.68 | 50.30 | 55.47 |
First eye only | 25.26 | 27.40 | 25.86 | 28.26 |
Discounted costs ($) | ||||
Total | 77,000 | 97,303 | 82,603 | 43,145 |
Drug acquisition | 62,128 | 81,419 | 67,041 | 27,013 |
Administration | 10,030 | 10,987 | 10,321 | 11,337 |
Monitoring | 3,594 | 3,557 | 3,953 | 3,441 |
AE management | 1,055 | 1,074 | 1,063 | 1,076 |
Costs of visual impairment | 193 | 266 | 225 | 277 |
Pairwise ICER of faricimab vs. comparator ($/QALY) | NA | Dominant | Dominant | 218,846 |
ICER = incremental cost-effectiveness ratio; LY = life-year; NA = not applicable; QALY = quality-adjusted life-year; VA = visual acuity.
Table 11: Summary of the Sponsor’s Economic Evaluation Results
Treatment | Cost ($) | QALYs | Sequential ICER ($/QALY) |
|---|---|---|---|
Bevacizumab | 43,145 | 10.815 | Ref. |
Faricimab | 77,000 | 10.970 | 218,846 |
Aflibercept | 82,603 | 10.896 | Dominated by faricimab |
Ranibizumab | 97,303 | 10.837 | Dominated by faricimab, aflibercept |
ICER = incremental cost-effectiveness ratio; QALY = quality-adjusted life-year; Ref. = reference.
Appendix 4: Additional Details on the CADTH Reanalyses and Sensitivity Analyses of the Economic Evaluation
Note that this appendix has not been copy-edited.
Detailed Results of CADTH Base Case
Table 12: Disaggregated Summary of CADTH’s Economic Evaluation Results
Parameter | Faricimab | Ranibizumab | Aflibercept | Bevacizumab |
|---|---|---|---|---|
Discounted LYs | ||||
Total | 14.097 | 14.092 | 14.095 | 14.092 |
Discounted QALYs | ||||
Total | 9.586 | 9.266 | 9.435 | 9.233 |
First eye VA >85 | 1.868 | 1.370 | 1.616 | 1.339 |
First eye VA 85-71 | 3.034 | 2.438 | 2.747 | 2.385 |
First eye VA 70-56 | 2.896 | 2.925 | 2.935 | 2.898 |
First eye VA 55-41 | 1.165 | 1.640 | 1.399 | 1.677 |
First eye VA 40-26 | 0.344 | 0.544 | 0.431 | 0.573 |
First eye VA ≤25 | 0.278 | 0.348 | 0.307 | 0.361 |
Mean number of injections | ||||
Total | 47.01 | 50.69 | 47.81 | 52.10 |
First eye only | 24.92 | 26.90 | 25.40 | 27.65 |
Discounted costs ($) | ||||
Total | 74,138 | 92,348 | 78,834 | 16,008 |
Drug acquisition | 59,876 | 77,361 | 64,048 | 851 |
Administration | 9,655 | 10,424 | 9,839 | 10,707 |
Monitoring | 3,458 | 3,361 | 3,776 | 3,239 |
AE management | 1,014 | 1,014 | 1,014 | 1,014 |
Costs of visual impairment | 134 | 188 | 158 | 197 |
Pairwise ICER of faricimab vs. comparator ($/QALY) | NA | Dominant | Dominant | 164,743 |
ICER = incremental cost-effectiveness ratio; LY = life-year; NA = not applicable; QALY = quality-adjusted life-year; VA = visual acuity.
Table 13: Summary of the CADTH Base Case
Treatment | Cost ($) | QALYs | Sequential ICER ($/QALY) |
|---|---|---|---|
Bevacizumab | 16,008 | 9.233 | Ref. |
Faricimab | 74,138 | 9.586 | 164,743 |
Aflibercept | 78,834 | 9.435 | Dominated by faricimab |
Ranibizumab | 92,348 | 9.266 | Dominated by faricimab, aflibercept |
ICER = incremental cost-effectiveness ratio; QALY = quality-adjusted life-year; Ref. = reference
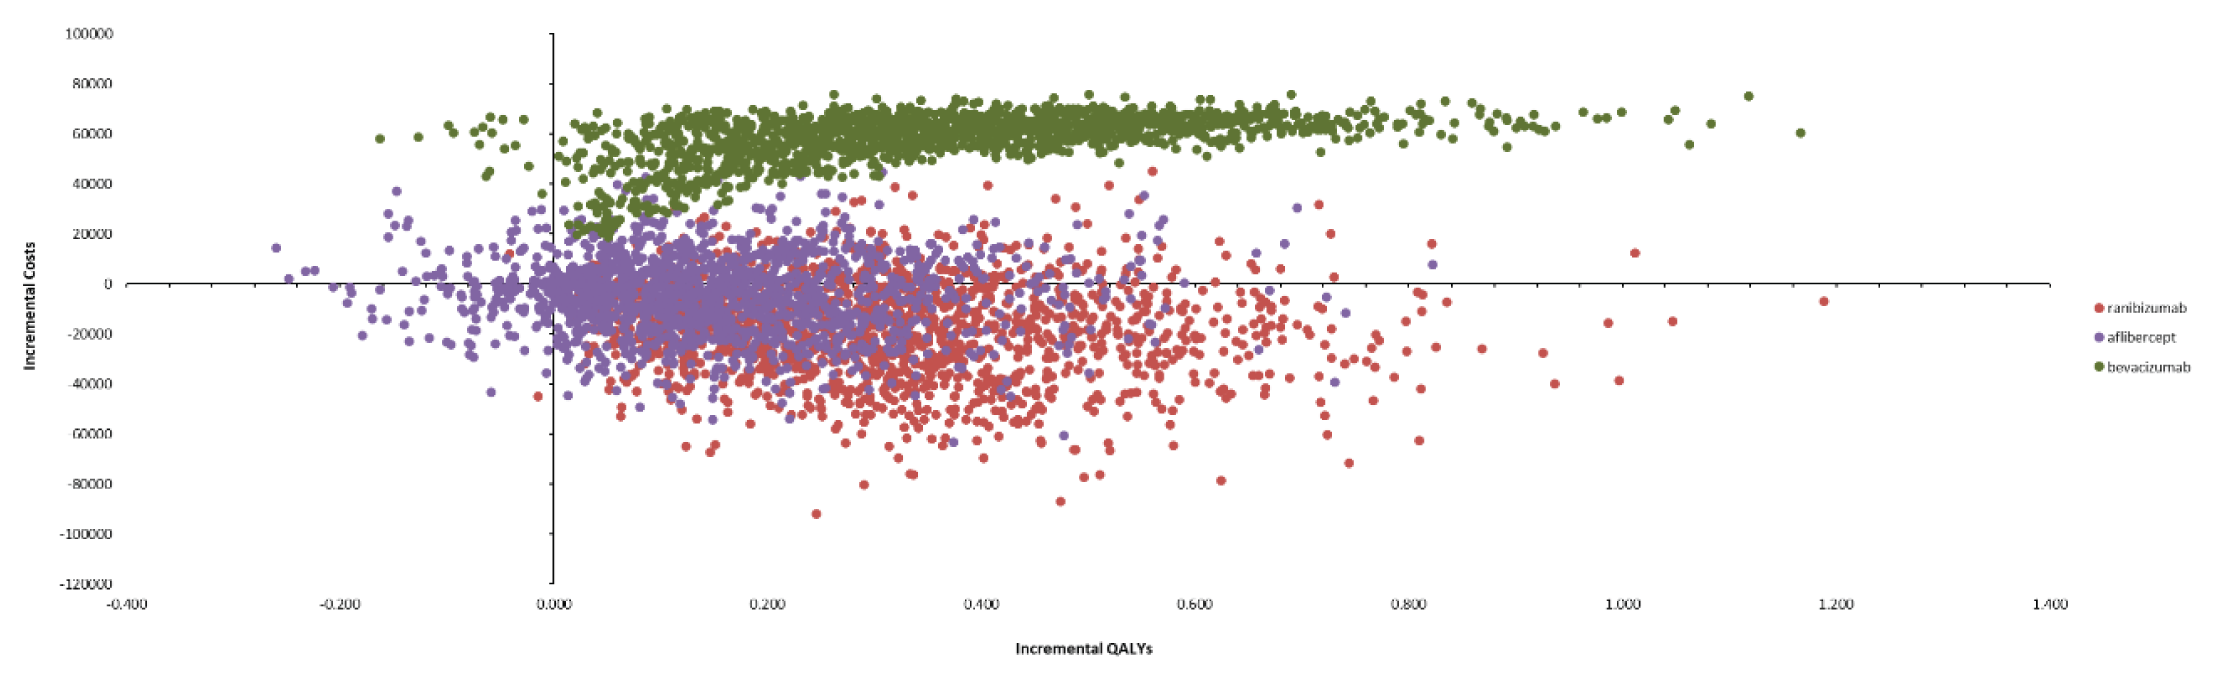
Scenario Analyses
Table 14: Summary of Scenario Analyses Conducted on CADTH Base Case
Stepped analysis | Drug | Total costs ($) | Total LYs | Total QALYs | ICER ($/QALYs) |
|---|---|---|---|---|---|
CADTH base case | Bevacizumab | 16,008 | 14.092 | 9.233 | Ref. |
Faricimab | 74,138 | 14.097 | 9.586 | 164,743 | |
1. Equal efficacy of all comparators | Bevacizumab | 15,946 | 14.097 | 9.581 | Ref. |
Faricimab | 74,138 | 14.097 | 9.586 | 12,856,565 | |
2. Equal efficacy of all comparators and equal frequency of administrations | Bevacizumab | 15,311 | 14.097 | 9.586 | Ref. |
Faricimab | 74,500 | 14.097 | 9.586 | Dominated | |
3. 15 administrations bevacizumab per vial | Bevacizumab | 16,859 | 14.092 | 9.233 | Ref. |
Faricimab | 74,138 | 14.097 | 9.586 | 162,330 | |
4. No additional monitoring visits | Bevacizumab | 12,769 | 14.092 | 9.233 | Ref. |
Faricimab | 70,680 | 14.097 | 9.586 | 164,120 |
AE = adverse event; ICER = incremental cost-effectiveness ratio; QALY = quality-adjusted life-year; Ref. = reference.
Appendix 5: Submitted BIA and CADTH Appraisal
Note that this appendix has not been copy-edited.
Table 15: Summary of Key Take-Aways
Key Take-aways of the BIA |
|---|
|
Summary of Sponsor’s BIA
The submitted BIA assessed the introduction of faricimab for the treatment of diabetic macular edema (DME) in adults.14 The analysis was taken from the perspective of the Canadian public drug plans using an epidemiology-based approach, with only drug acquisition costs included in the base case. A 3-year time horizon was used, from 2023 to 2025, with 2022 as the base year. The population size was derived starting with a prevalence estimate of diabetes, followed by a series of attritions. Population size and prevalence of diabetes were estimated using data from Statistics Canada.24,25 The prevalence of vision loss due to DME was obtained from the literature.26 The diagnosis rate and proportion of patients receiving anti-VEGF therapy were sponsor assumptions.14 Finally, the estimate of public coverage was informed by IQVIA claims data. A summary of the derivation of the population size is available in Figure 4.
The reference case included aflibercept, bevacizumab, and ranibizumab. The market share estimates for these product were informed by the sponsor’s internal market share estimates, claims data, and key opinion leader feedback.14 In the new drug scenario, faricimab was assumed to displace aflibercept and ranibizumab, while the market shares for bevacizumab remained unchanged. Key inputs to the BIA are documented in Table 16.
Figure 4: Sponsor’s Estimation of the Size of the Eligible Population
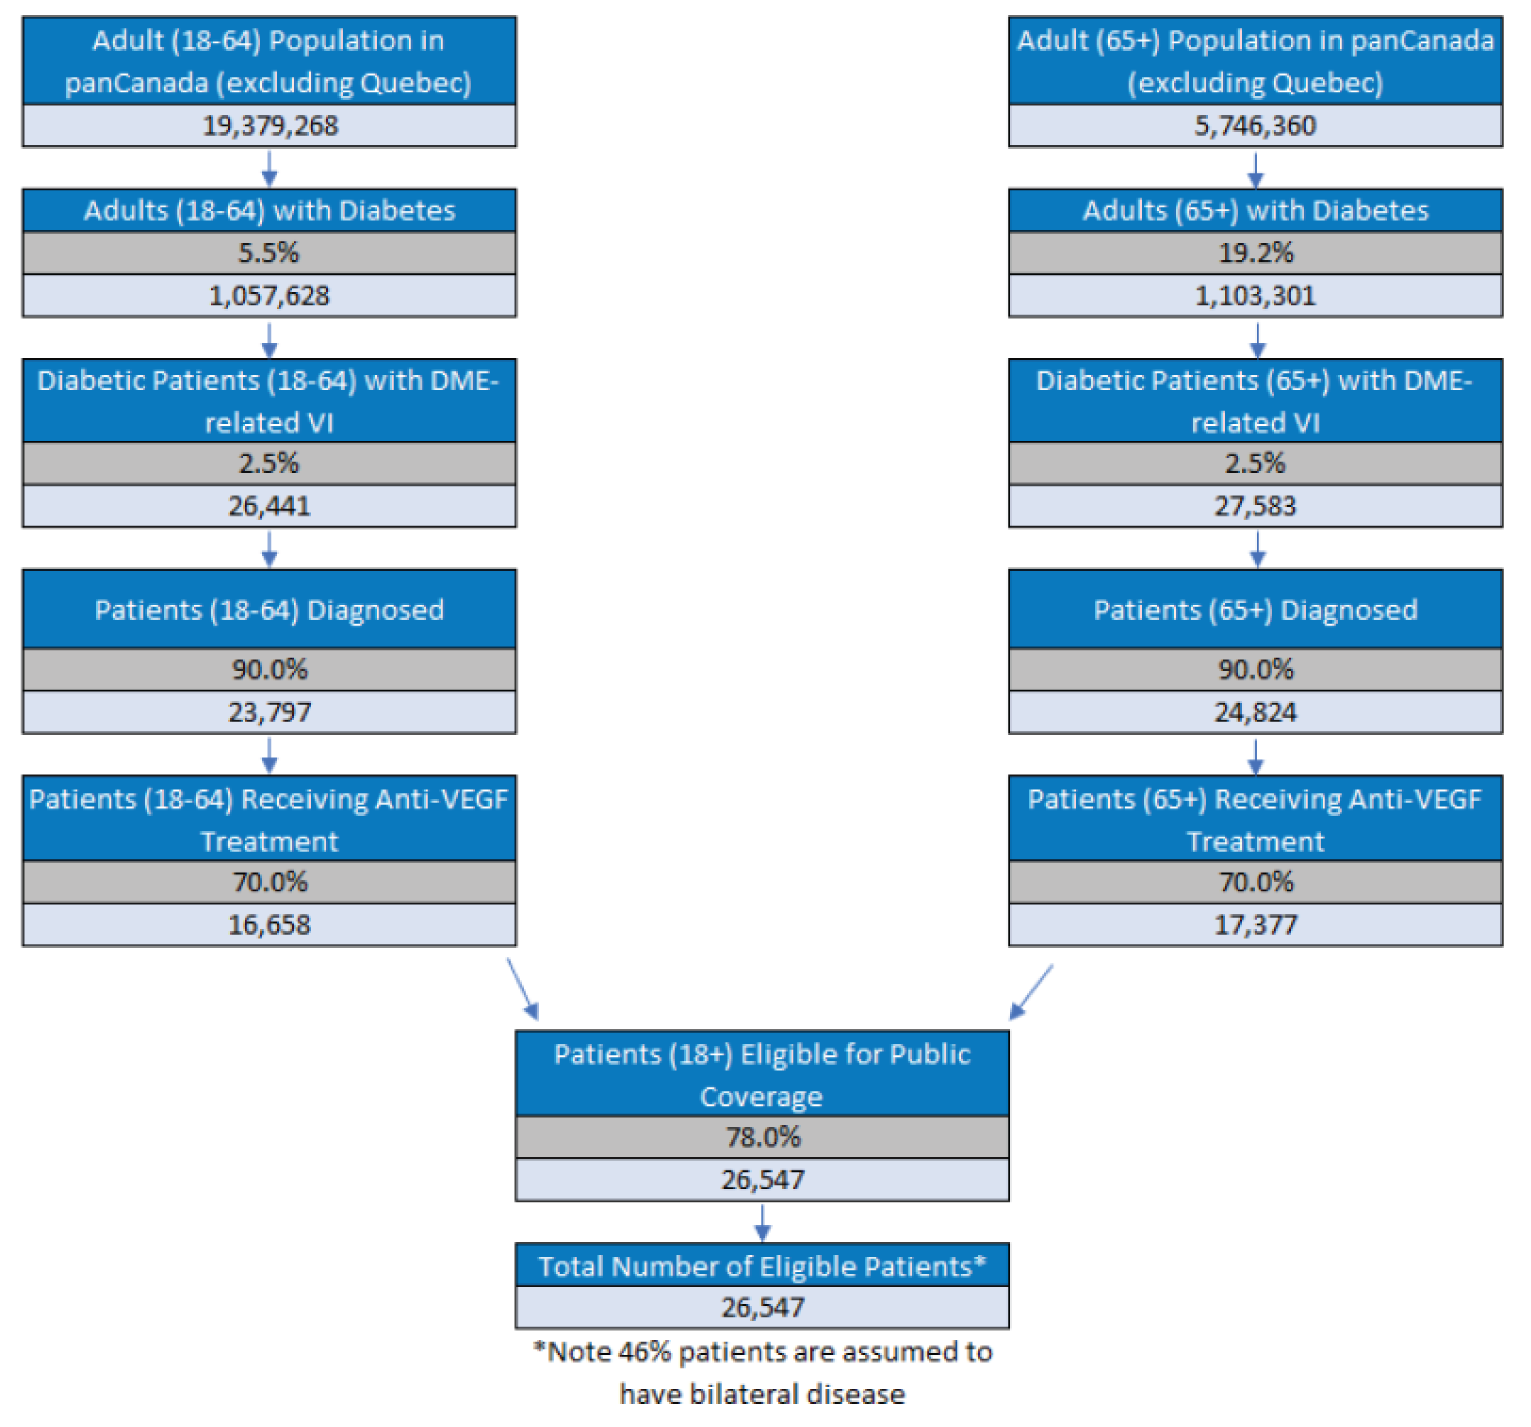
Source: Sponsor’s budget impact submission.14
Table 16: Summary of Key Model Parameters
Parameter | Sponsor’s estimate (Year 1 / Year 2 / Year 3) |
|---|---|
Target Population | |
Number of patients eligible for drug under review | 26,888 / 27,230 / 27,578 |
Number of eyes eligible for drug under review | 39,256 / 39,756 / 40,265 |
Market Uptake (3 years) | |
Uptake (reference scenario) Aflibercept Bevacizumab Ranibizumab | |||||% / |||||% / |||||% |||||% / |||||% / |||||% |||||% / |||||% / |||||% |
Uptake (new drug scenario) Faricimab Aflibercept Bevacizumab Ranibizumab | |||||% / |||||% / |||||% |||||% / |||||% / |||||% |||||% / |||||% / |||||% |||||% / |||||% / |||||% |
Cost of treatment (per patient) | |
Cost of treatment in Year 1 / Year 2+ annuallya Faricimab Aflibercept Bevacizumab Ranibizumab | $11,367 / $6,899 $13,272 / $7,090 $5,114 / $2,855 $15,390 / $8,729 |
aAnnual cost was calculated by multiplying the cost per dose by the annual number of administrations predicted by the sponsor’s NMA.5
Summary of the Sponsor’s BIA Results
The estimated cost savings of funding faricimab for the treatment of adults with DME was $900,476 in year 1, $3,612,809 in year 2, and $7,318,001 in year 3, for a cumulative cost savings of $11,831,285 over the 3-year time horizon.
CADTH Appraisal of the Sponsor’s BIA
CADTH identified several key limitations to the sponsor’s analysis that have notable implications on the results of the BIA:
Proportion of patients diagnosed is overestimated. The sponsor assumed that 90% of patients with DME would be diagnosed based on input from key opinion leaders. Clinical experts consulted by CADTH for this review noted that, while diagnosis rates have improved in recent years, 90% would represent the best-case scenario of diagnosis rates in a large urban centre. Especially in rural areas, the rate of diagnosis is expected to be lower, and a pan-Canadian estimate of the diagnosis rates would consequently be expected to be lower as well.
As part of the base case, CADTH assumed the proportion of patients diagnosed with DME to be 80% based on clinical expert opinion.
Uncertainty regarding the frequency of administration. In the BIA, the annual cost of faricimab and comparators was estimated by using the number of annual injections predicted by the sponsor’s network meta-analysis (NMA). As noted in the CADTH Appraisal of the Sponsor’s Economic Evaluation, the sponsor’s NMA found no significant difference between the number of injections of faricimab compared to other treatments administered following a treat-and-extend approach. To align with the pharmacoeconomic analysis, a scenario was conducted in which the administration frequency of all comparators was set equal to faricimab.
As part of a scenario analysis, CADTH assumed equal administration frequency of all comparators.
Potentially relevant comparators were omitted. As noted in the CADTH Issues for Consideration, the sponsor did not include brolucizumab or dexamethasone implants (Ozurdex) as comparators in their analysis. Ozurdex is under review by CADTH, and a submission of brolucizumab is expected in June 2022. Clinical experts consulted by CADTH for this review indicated that, although currently off-label for DME, brolucizumab may account for up to 20% of the market share in the treatment of DME as an alternative anti-VEGF therapy, while dexamethasone implants are not commonly used for this indication at this time.
As part of a scenario analysis, CADTH assumed that brolucizumab would capture 10%, 15%, and 20% of the DME market in year 1, 2, and 3, respectively, with the market shares for comparators being reduced proportionally. Assumptions about displacement of comparators by faricimab in the new drug scenario were not modified.
The market uptake of faricimab is uncertain. In the sponsor’s base case, faricimab was assumed to displace aflibercept and ranibizumab, but not bevacizumab (i.e., 0% of the faricimab market share would come from bevacizumab); this assumption was not justified. Despite its off-label use, bevacizumab is a relevant comparator for the treatment of DME according to clinical expert and drug plan input, and was included as a comparator in the sponsor’s pharmacoeconomic evaluation. The assertion that faricimab would not capture market share from bevacizumab is uncertain in the absence of other justification, especially given the sponsor’s assumptions that faricimab would lead to fewer injections than bevacizumab, making it a potentially desirable option for patients or clinicians.
In a scenario analysis, CADTH assumed that faricimab would capture market share equally from aflibercept, ranibizumab, and bevacizumab.
The price of drugs paid by public drug plans is uncertain. Both the sponsor’s and CADTH’s analyses are based on publicly available list prices for all comparators. The drug plan feedback for this review indicated there are confidential negotiated prices for the comparators. Thus, the actual costs paid by public drug plans for aflibercept and ranibizumab are unknown. Depending on the negotiated prices, faricimab may lead to lower or no cost savings compared to other available anti-VEGFs.
CADTH was unable to incorporate the presence of confidential negotiated prices in reanalysis.
One additional limitation was identified but was not considered to be a key limitation. In alignment with the pharmacoeconomic report, CADTH also assumed that one vial of bevacizumab could be used for 30 administrations. This did not have an effect on the incremental results in the CADTH base case; however, this was owing to the sponsor’s assumption that faricimab would not displace bevacizumab (i.e., the market share of bevacizumab was unchanged between the reference and new drug scenarios); the impact of bevacizumab displacement was explored in scenario analyses.
CADTH Reanalyses of the BIA
Based on the identified limitations, CADTH’s base case included a change to the proportion of patients diagnosed and number of administrations of bevacizumab obtained from each vial.
Table 17: CADTH Revisions to the Submitted BIA
Stepped analysis | Sponsor’s value or assumption | CADTH value or assumption |
|---|---|---|
Changes to derive the CADTH base case | ||
1. Proportion of patients diagnosed | 90% | 80% |
2. Number of doses of bevacizumab | 15 | 30 |
CADTH base case | Reanalysis 1 + 2 | |
BIA = budget impact analysis.
The results of the CADTH stepwise reanalysis are presented in summary format in Table 18 and a more detailed breakdown is presented in Table 19. Based on the CADTH base case, the estimated cost savings of the reimbursement of faricimab for the treatment of adult patients with DME are expected to be $800,423 in year 1, $3,211,386 in year 2, $6,504,889 in year 3, for a 3-year total cost savings of $10,516,698. The predicted cost savings associated with the reimbursement of faricimab for DME are predicated on the assumption that faricimab will not displace bevacizumab.
Scenario analyses conducted by CADTH indicate that the BIA results are sensitive to the administration frequency of each drug and whether brolucizumab is included as a comparator. Results of these analyses suggested reduced cost savings ($7.7 million to $8.7 million over 3 years), indicating that the cost savings associated with the reimbursement of faricimab may have been overestimated in the sponsor’s base case.
In addition, the results of scenario analyses suggest that if faricimab captures a proportion of its market share from bevacizumab, the reimbursement of faricimab for DME will not result in cost savings. In this scenario, which assumed equal market share capture from bevacizumab, aflibercept, and ranibizumab, 3-year budget impact of reimbursing faricimab for DME is anticipated to be $18,182,088 (added costs). Thus, the budget impact of reimbursing faricimab for DME is sensitive to assumptions about market uptake and displacement, and its reimbursement may lead to additional costs to the health care system rather than cost savings.
Table 18: Summary of the CADTH Reanalyses of the BIA
Stepped analysis | Three-year total |
|---|---|
Submitted base case | -$11,831,285 |
CADTH reanalysis 1 – proportion diagnosed | -$10,516,698 |
CADTH reanalysis 2 – bevacizumab administrations | -$11,831,285 |
CADTH base case (reanalysis 1+2) | -$10,516,698 |
BIA = budget impact analysis.
Table 19: Detailed Breakdown of the CADTH Reanalyses of the BIA
Stepped analysis | Scenario | Year 0 (current situation) | Year 1 | Year 2 | Year 3 | Three-year total |
|---|---|---|---|---|---|---|
Submitted base case | Reference | $182,975,286 | $185,324,052 | $187,685,173 | $190,084,803 | $563,094,028 |
New drug | $182,975,286 | $184,423,576 | $184,072,364 | $182,766,802 | $551,262,743 | |
Budget impact | $0 | -$900,476 | -$3,612,809 | -$7,318,001 | -$11,831,285 | |
CADTH base case | Reference | $161,102,978 | $163,170,980 | $165,249,860 | $167,362,645 | $495,783,485 |
New drug | $161,102,978 | $162,370,557 | $162,038,474 | $160,857,756 | $485,266,787 | |
Budget impact | $0 | -$800,423 | -$3,211,386 | -$6,504,889 | -$10,516,698 | |
CADTH scenario analysis 1: equal administration frequency | Reference | $157,623,914 | $159,647,257 | $161,681,242 | $163,748,402 | $485,076,901 |
New drug | $157,623,914 | $159,063,383 | $159,338,676 | $159,003,367 | $477,405,426 | |
Budget impact | $0 | -$583,874 | -$2,342,567 | -$4,745,034 | -$7,671,475 | |
CADTH scenario analysis 2: brolucizumab included as a comparator | Reference | $161,102,978 | $174,839,887 | $182,976,222 | $191,299,980 | $549,116,089 |
New drug | $161,102,978 | $174,119,507 | $180,246,544 | $186,096,068 | $540,462,118 | |
Budget impact | $0 | -$720,381 | -$2,729,678 | -$5,203,912 | -$8,653,970 | |
CADTH scenario analysis 3: displacement of bevacizumaba | Reference | $161,102,978 | $163,170,980 | $165,249,860 | $167,362,645 | $495,783,485 |
New drug | $161,102,978 | $164,554,813 | $170,801,954 | $178,608,805 | $513,965,572 | |
Budget impact | $0 | $1,383,833 | $5,552,094 | $11,246,160 | $18,182,088 |
BIA = budget impact analysis.
aIn this scenario, faricimab was assumed to displace aflibercept, ranibizumab, and bevacizumab at an equal rate.
Stakeholder Input
Patient Input
Fighting Blindness Canada, The Canadian Council of the Blind, CNIB, Vision Loss Rehabilitation Canada, Diabetes Canada
About Fighting Blindness Canada, The Canadian Council of the Blind, CNIB, Vision Loss Rehabilitation Canada, Diabetes Canada
Fighting Blindness Canada (FBC) is the largest charitable funder of vision research in Canada.
Over our 48-year history, FBC has contributed critical funding for the development of sight-saving treatments and cures for blinding eye diseases. By raising and stewarding funds, FBC is helping drive forward research that supports our goal of understanding why vision loss occurs, how it can be slowed and how sight can be restored.
We are an invaluable resource for individuals and families impacted by blindness, providing accurate eye health information through our website and educational events, as well as engaging with government and other stakeholders to advance better vision health policies.
The Canadian Council of the Blind (CCB) was founded in 1944 by schools of the blind and by returning blind Canadian war veterans and is recognized as the Voice of the Blind™ in Canada. The CCB is a membership-based not-for-profit, that brings together Canadians who are living with vision loss, those who are blind, deaf-blind, and the partially sighted. In doing so the Council maintains a vibrant network of active members in 80 chapters across Canada. Each chapter is unique to its geographic area and engages in a variety of social, recreational and community activities based on the interests of their local members.
A tireless advocate of the vision loss community the CCB works to promote a sense of purpose and self-esteem along with enabling the efforts of each member to achieve an enhanced quality of life. The Council through its lived experience constituency is proud of its efforts to break down barriers and remains dedicated to building public awareness and improving the well-being of people with seeing disabilities.
The Canadian Council of the Blind offers numerous programs to assist people living with vision loss, increase accessibility in all areas of vision loss life and bring awareness of vision issues to the public and government. The CCB leads initiatives that call for the provision of the very best in available medical treatments, research, and the fostering of patients’ rights without limitation or discrimination. It does this all while recognizing that vision loss and blindness are preventable.
Founded in 1918, CNIB is a non-profit organization driven to change what it is to be blind today. We deliver innovative programs and powerful advocacy that empower people impacted by blindness to live their dreams and tear down barriers to inclusion. Our work as a blind foundation is powered by a network of volunteers, donors and partners from coast to coast to coast.
Vision Loss Rehabilitation Canada (VLRC) is a health services organization. We provide training that enables people who are blind or partially sighted to develop or restore key daily living skills, helping enhance their independence, safety and mobility. Our certified specialists work closely with ophthalmologists, optometrists and other health care professionals, providing essential care on a referral basis in homes and communities.
The Vision of VLRC is to maximize health and independence for Canadians impacted by vision loss and our mission is to provide high-quality, integrated and accessible rehabilitation and health care services that enable Canadians impacted by vision loss to live the lives they choose.
Diabetes Canada (DC) is a national health charity representing millions of Canadians affected by diabetes. Diabetes Canada leads the fight against diabetes by helping people live healthy lives, preventing the onset and consequences of diabetes, and discovering a cure. It has a heritage of excellence and leadership, and its co-founder, Dr. Charles Best, along with Dr. Frederick Banting, is credited with the co-discovery of insulin. Diabetes Canada is supported in its efforts by a community-based network of volunteers, employees, health care professionals, researchers, and partners. By providing education and services, advocating on behalf of people living with diabetes, supporting research and translating it into practical applications, Diabetes Canada is delivering on its mission. Diabetes Canada will continue to change the world for those affected by diabetes through healthier communities, exceptional care, and high-impact research.
Information Gathering
Data shared in this submission were collected through an online survey made available to Canadians living with diabetic retinopathy (DR) or diabetic macular edema (DME) during the first months of 2020. Shared across networks associated with the submitting organizations, the survey is part of a larger research project titled VIEW DR/DME (Valuation and Interpretation of Experiences with DR/DME) that received ethics approval from Advarra, one of the largest independent providers of institutional review board (IRB) services in Canada.
The intent of the survey was to learn more about the lived experiences of Canadians living with DR and DME. The goal was not to learn more about experiences of faricimab or any other specific treatment (though we did gather data and insights related to experiences of injections in general).
Instead, the data and analysis that follows provide insights into the lives of those who live with DR and DME, and who must manage and navigate the often-daily barriers and burdens that accompany these diseases. Our belief is that these perspectives are crucial, and that they can be used to guide decision-making related to treatments that can address the physical, psychological, and socioeconomic burdens associated with DR and DME.
Overview of Respondents
A total of 67 Canadians responded to the survey. Seeing as DR affects approximately 500,000 Canadians (Ballios BG, Park T, Chaudhary V, Hurley B, et al. Identifying gaps in patient access to diabetic screening eye examinations in Ontario: a provincially representative cross-sectional study. Can J Ophthalmol. 2021;56(4):223-230. https://doi.org/10.1016/j.jcjo.2020.10.018), this number may seem small, but it is difficult locating and engaging with individuals with DR and DME, at least partially as a result of low disease awareness. These challenges have been discussed in various research efforts, including an article published recently by researchers associated with FBC (Andrews C, Yoganathan P, Pereira JA. Blind Spots: Gaps in Disease Knowledge and the Role of Patient Education for Canadians with Diabetic Macular Edema. Can J Diabetes. 2021;45(4):375-378. doi: 10.1016/j.jcjd.2020.10.001)
Out of these respondents, most were between either 61 and 80 (44.4%) or 41 and 60 (37%), with a mean age of 56.8 (SD = 13.2). Most were either working full time (38.9%) or retired (33.3%), and a majority resided in urban regions within Ontario (41.8%), British Columbia (14.9%), Alberta (13.4%), and Quebec (11.9%), followed by smaller groups within other provinces.
Table 1: Baseline Characteristics of Respondents (n = 67)
Characteristic | n (%) |
|---|---|
Age (n = 54) | |
Mean age (SD) | 56.8 (13.2) |
18 - 40 years | 9 (16.7) |
41 - 60 years | 20 (37.0) |
61 - 80 years | 24 (44.4) |
Over 80 years | 1 (1.9) |
Biological Sex (n = 54) | |
Female | 23 (42.6) |
Male | 31 (57.4) |
Intersex | 0 (0.0) |
Province (n = 67) | |
Ontario | 28 (41.8) |
British Columbia | 10 (14.9) |
Alberta | 9 (13.4) |
Quebec | 8 (11.9) |
Manitoba | 3 (4.5) |
Nova Scotia | 3 (4.5) |
Newfoundland | 2 (3.0) |
Yukon | 2 (3.0) |
New Brunswick | 1 (1.5) |
Saskatchewan | 1 (1.5) |
Location (n = 67) | |
Urban | 62 (92.5) |
Rural | 5 (7.5) |
DME/DR in one eye or both eyes (n = 67) | |
Both eyes | 51 (76.1) |
One eye | 10 (14.9) |
I don’t know | 6 (9.0) |
Other household members (n = 60) | |
Partner/spouse | 43 (71.7) |
My child(ren) | 16 (26.7) |
No one | 9 (15.0) |
Family member(s) other than partner and child | 3 (5.0) |
I live in a retirement home | 2 (3.3) |
Roommate/friend | 2 (3.3) |
I live in a nursing home/long-term care facility | 1 (1.7) |
Employment Status (n = 54) | |
Retired | 18 (33.3) |
Employed, working full-time | 21 (38.9) |
Employed, working part-time | 0 (0.0) |
Not employed, looking for work | 2 (3.7) |
Student | 1 (1.9) |
Unemployed due to illness or disability | 8 (14.8) |
Homemaker | 0 (0.0) |
Parental leave | 0 (0.0) |
Taking care of a family member | 1 (1.9) |
Other: Employed but on disability (2), self-employed (1) | 3 (5.6) |
Disease Experience
Respondents made it clear that both DR and DME have substantial and life-altering impacts on daily life. When asked which activities are most impact by their disease, they emphasized effects on reading, using a phone, and driving, activities that many individuals take for granted.
These difficulties were also framed in terms of “challenges.” When asked about the kinds of challenges they face as a result of DR or DME, a significant majority of respondents selected “worry that my condition might worsen in the future” (80.3%), followed by “not being able to do the daily activities I used to” (45.9%) and “explaining my condition to family and friends” (36.1%).
The strong emphasis on worry in relation to the condition worsening implies the existence of emotional and psychological burdens as well; DR and DME may affect daily life as a result of lower visual acuity, but they may also lead to significant psychological strain in the form of a generalized anxiety related to the future. Following up on this notion, respondents were asked to specify their concerns over the last month, with many selecting that they are concerned about their eyesight worsening “all the time” or “a lot of the time.” Respondents also emphasized “coping with everyday life” and “general safety when out of the home” as notable concerns.
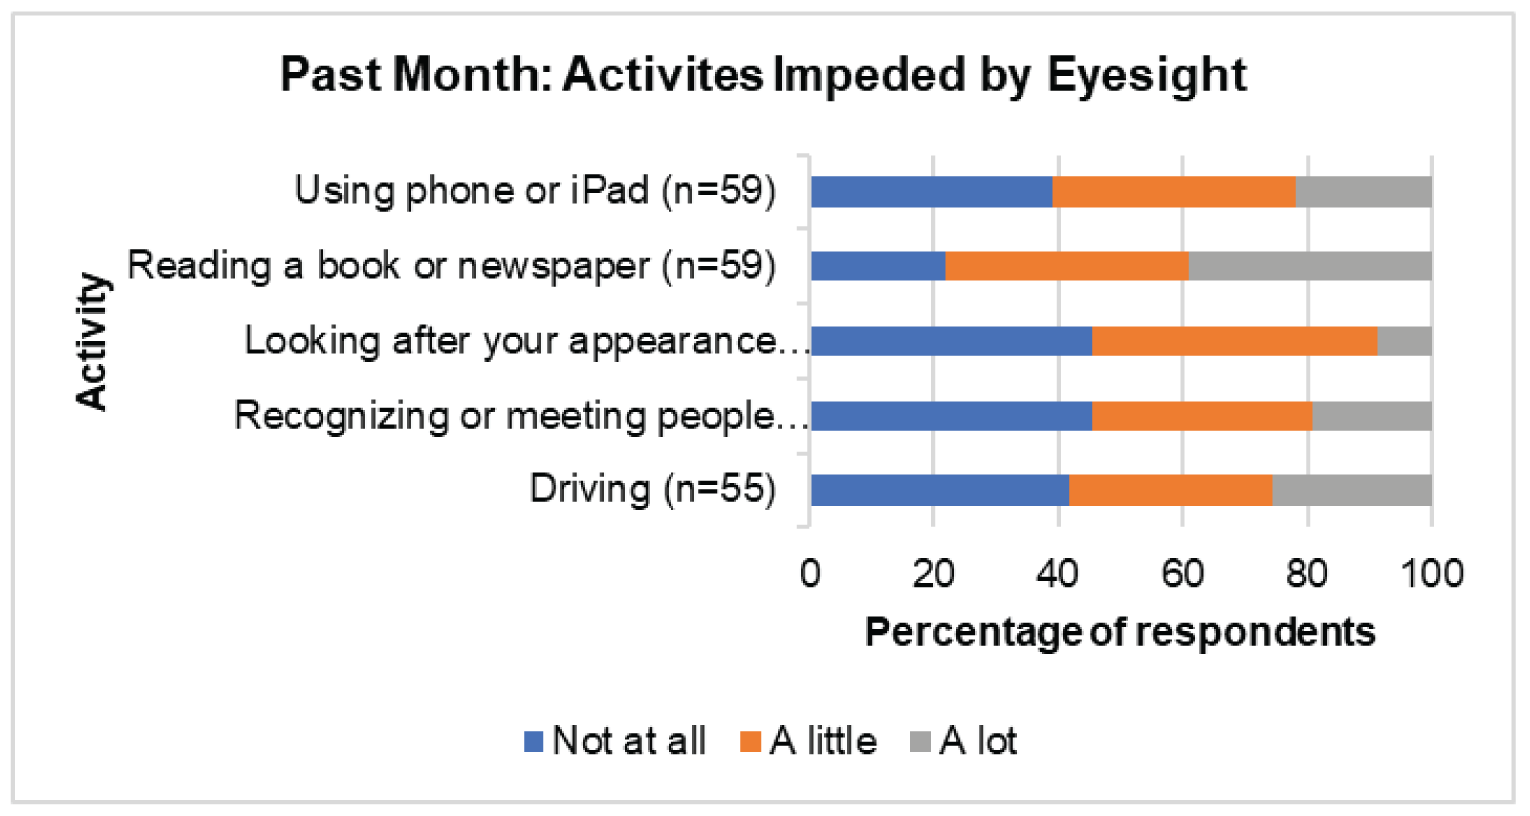
Table 2: Challenges With DMR/DR (n = 61)
Challenges | n (%) |
|---|---|
Worry that my condition might worsen in the future | 49 (80.3) |
Not being able to do the daily activities I used to | 28 (45.9) |
The long wait times for appointments | 18 (29.5) |
Explaining my condition to family and friends | 22 (36.1) |
Lack of social support | 14 (23.0) |
Finding answers to my questions about my condition | 18 (29.5) |
Socializing | 19 (31.1) |
Other* | 5 (8.2) |
*Getting the test I need prior to injections, working/finding work, no funding for technology or training, how long it takes to learn technology, getting appointments with my very busy retinologist.
Recognizing that both DR and DME are complications of diabetes, it is useful to frame these considerations within the broader experiences of diabetes as a complex and impactful disease. Common symptoms of diabetes include extreme fatigue, unusual thirst, frequent urination and weight change (gain or loss). Diabetes requires considerable self-management, including eating well, engaging in regular physical activity, maintaining a healthy body weight, taking medication as prescribed, monitoring blood glucose, and managing stress. When Diabetes Canada asked Canadian diabetes patients how the disease impacts their lives, several described diabetes as a condition that must be dealt with 24 hours a day, 7 days a week, 365 days a year with no breaks and no holidays or time off. It is physically and mentally exhausting.
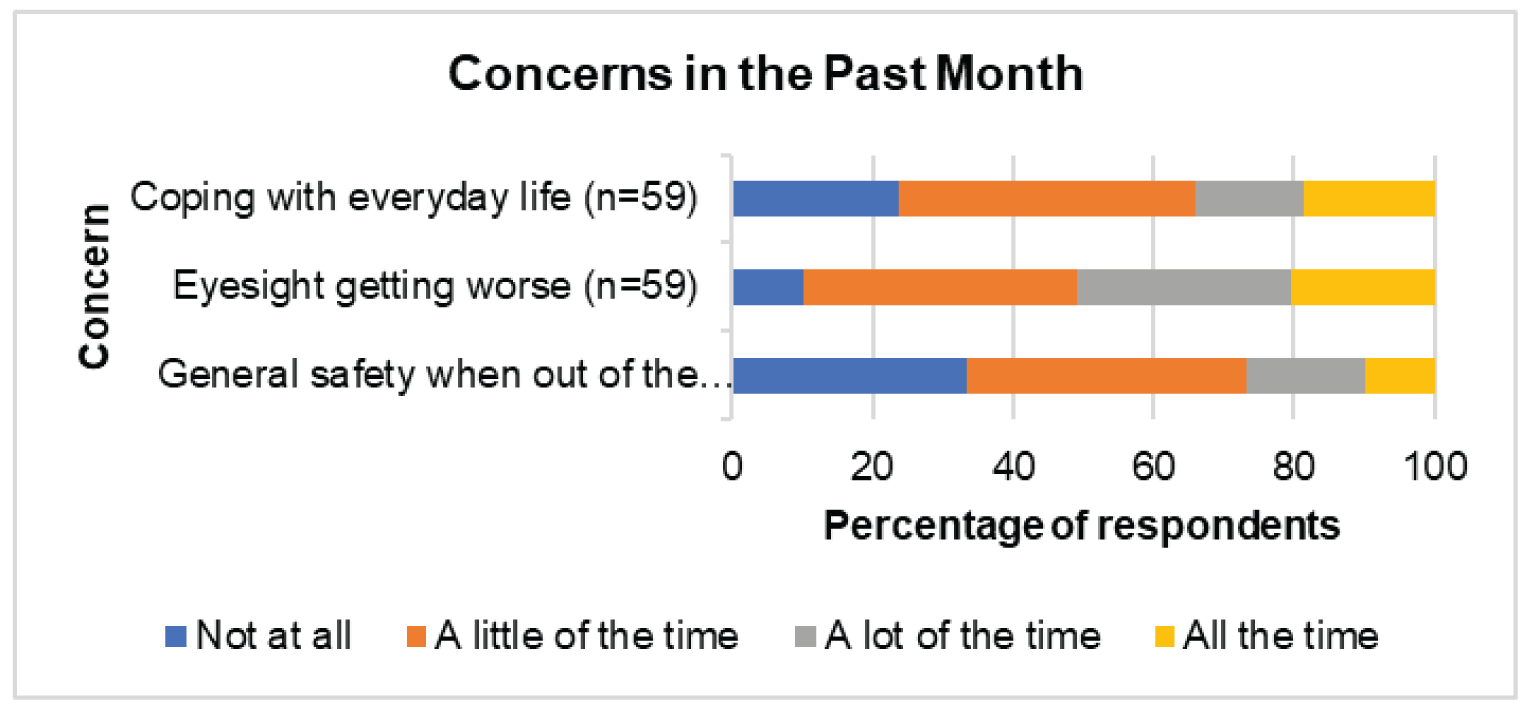
It is clear that DR and DME weigh heavily on the minds of affected individuals, here shown as persistent emotional and psychological factors. This notion was again carried forward in relation to both requiring assistance as well as feelings of loneliness and isolation. In both cases, a majority of respondents replied that they had both experiences (needing assistance and feelings of isolation) at least “a little of the time.”
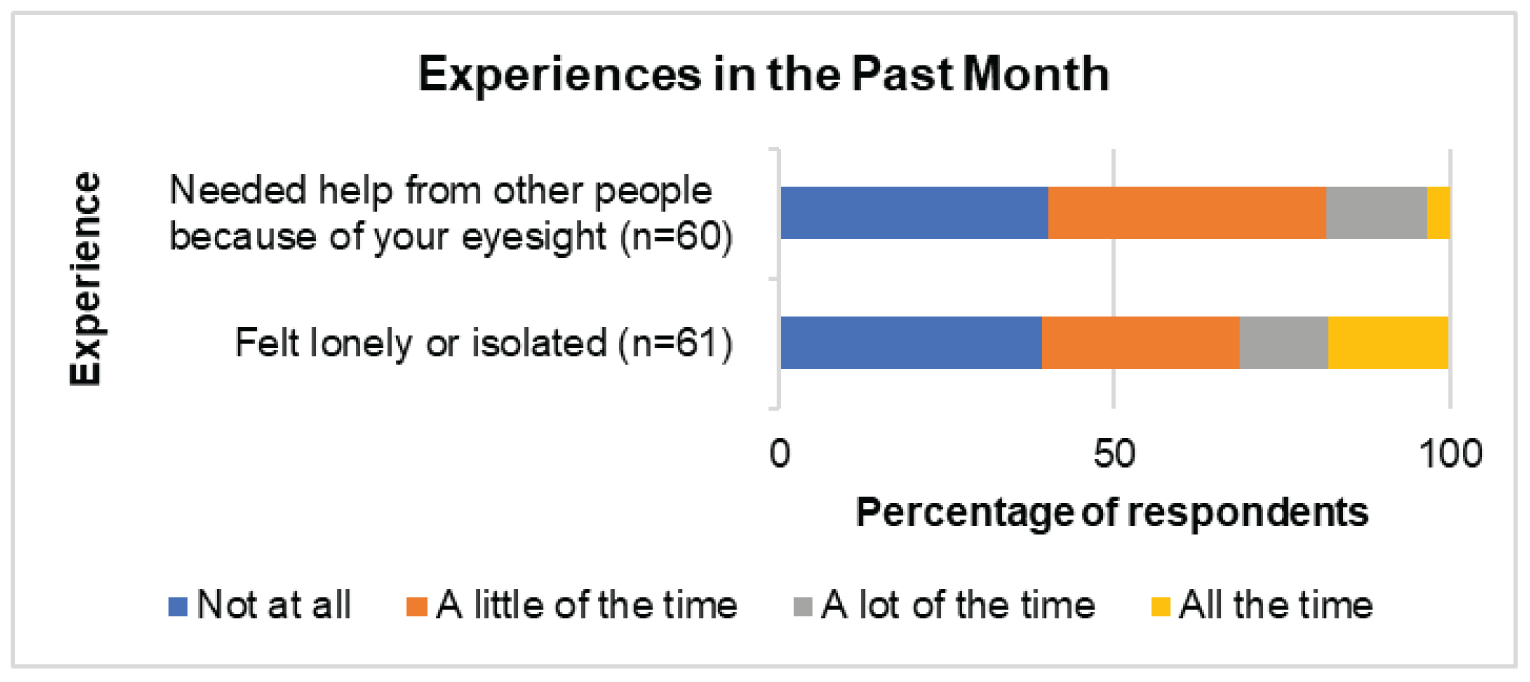
The experience of needing help also highlights the social dimensions of DR and DME, implying that the impacts of the diseases extend beyond one’s personal life to touch on friends and family members. Any analysis of these diseases should take into account the social dimensions of lived experience that are common across eye disease that affect visual acuity and make daily life more challenging.
Overall, it is clear that DR and DME have significant and life-altering impacts on the lives of those who are affected by them. Whether it be in relation to reading or worrying or relying on others, the diseases tend to affect the details and complexities of everyday living in a pervasive manner (as opposed to being a secondary or background consideration). For this reason, it is reasonable to conceptualize DR and DME as considerable burdens on the daily lives of patients. Importantly, it is also reasonable to assume that these impacts have been more intensely felt during the COVID-19 pandemic, especially in relation to loneliness and isolation. This survey collected information before the full scale of the pandemic was known (or even possible to conceptualize)—as a result, the responses do not reflect the full impact of COVID-19 on the lives of patients with DR and DME. That said, the CCB conducted a separate survey in April of 2020 that was exclusively focused on the pandemic and its effects; it showed that fear, anxiety, loneliness, and other psychosocial impacts were intensified for patients with age-related macular edema (AMD) and DR during the pandemic. A follow-up study showed that almost 70,000 fewer eye injections for AMD and DR were performed in 2020 compared to 2019, and that 1,500 fewer patients received injections for AMD and 458 fewer patients received injections for DR in 2020 compared with 2019. A summary of these findings is below:
CCB Summary of the Impacts of COVID-19 for Patients Living with Vision Loss
In April 2020, the CCB conducted a survey on the impact of the COVID-19 pandemic on Canadians who are blind, deafblind or partially sighted (Gordon K. “The impact of the COVID-19 pandemic on Canadians who are blind, deaf-blind, and partially-sighted” (2020). Available at: https://ccbnational.net/shaggy/wp-content/uploads/2020/05/COVID-19-Survey-Report-Final-wb.pdf). What we discovered was a community experiencing loneliness and living with considerable stress. Almost half the 572 respondents to the CCB survey (46%) said they hadn’t felt safe going outside the home since the initial lockdown. 47% of respondents said that they needed a sighted guide to assist them when they left home. Respondents said they were concerned about maintaining social distancing and having others maintain social distancing with them. Since most hospitals and doctors’ offices were not permitting anyone to accompany their patient, this meant that a substantial barrier existed for anyone requiring a sighted guide to access their doctor. This undoubtedly resulted in many people missing their regular appointments for anti-VEGF injections.
Furthermore, 42% of respondents were worried about their ability to have someone accompany them to a doctor and almost half (49%) were worried about their ability to get transportation to a doctor, hospital, or testing site. About one third of respondents (36%) said that they had had an important medical appointment cancelled as a result of the COVID-19 pandemic. Many also expressed special concerns about treatment for their eye condition and were afraid that they may lose more vision as a result of missing appointments.
A subsequent study, commissioned by CCB and FBC (Deloitte Access Economics, Addendum to the cost of vision loss and blindness in Canada. The impact of COVID-19. [report commissioned by the Canadian Council of the Blind], August 2021. Available at: https://ccbnational.net/shaggy/2021/10/12/the-impact-of-covid-19-an-addendum-to-the-cost-of-vision-loss-in-canada-study/) reported the extent of the cancelled appointments for anti-VEGF injections. This report estimated that almost 70,000 fewer eye injections for the treatment of age-related macular degeneration (AMD) and diabetic retinopathy/DME were performed in 2020 compared with 2019.
This study also reported that 458 fewer patients received injections for diabetic retinopathy and 1,500 fewer patients received injections for AMD in 2020 compared with 2019. When combined with other delayed or cancelled eye examinations and treatments it was estimated that an additional 1,437 people experienced vision loss due to the pandemic.
Any anti-VEGF medication that can extend the time between required injections can be expected to be a great advantage to people living with vision loss who are not venturing out of their homes for medical appointments. Such a medication would carry significant potential to minimize unnecessary vision loss.
Experiences With Currently Available Treatments
A majority of survey participants (56.4%) indicated that they currently receive injections as a treatment for DR or DME, with the most common brand being Lucentis (29.4%), followed by Eylea (24.6%), Avastin (20.2%), and Ozurdex (13.5%). The remainder of patients indicated that they did not know the brand of their injection.
Most respondents selected that their last injection was 1-5 years ago (26.9%), followed by more than 5 years ago (16.4%), 3-11 months ago (10.4%), and less than 3 months ago (4.5%).
Table 3: Timing of First Injection (n = 67)
First Injection | n (%) |
|---|---|
Less than 3 months ago | 3 (4.5) |
3-11 months ago | 7 (10.4) |
1-5 years ago | 18 (26.9) |
More than 5 years ago | 11 (16.4) |
I’ve never received injections for DME or DR | 28 (41.8) |
The low number of respondents (4.5%) who received injections more recently is disconcerting, potentially indicating high drop-off and nonadherence in relation to injections. If this is the case, it aligns with existing research showing that nonadherence to intravitreal injections is quite high (Okada M, Mitchell P, Finger RP, Eldem B, et al. Nonadherence and Nonpersistence to Intravitreal Injection Therapy for Neovascular Age-Related Macular Degeneration: A Mixed-Methods Systematic Review. Ophthalmology. 2021;128;2;234-247. https://doi.org/10.1016/j.ophtha.2020.07.060)
Satisfaction, Adherence, and Assistance
The largest number of respondents showed that they are “satisfied” with their injections (54.5%) and that “they helped me avoid losing more eyesight” (63.6%).
Table 4: Level of Satisfaction with Injections (n = 22)
Satisfaction | n (%) |
|---|---|
Very dissatisfied | 1 (4.5) |
Dissatisfied | 1 (4.5) |
Neither satisfied nor dissatisfied | 7 (31.8) |
Satisfied | 12 (54.5) |
Very satisfied | 1 (4.5) |
Table 5: How the Injections Have Helped (n = 22)
Results | n (%) |
|---|---|
They helped me avoid losing more eyesight | 14 (63.6) |
They dried up fluid/blood in my eye(s) | 10 (45.4) |
They improved my eyesight | 7 (31.8) |
They have had no effect, but I receive injections because my doctor recommends them | 3 (13.6) |
I don't know | 1 (4.5) |
Other* | 3 (13.6) |
*Think it’s helping, stopped proliferation of blood vessels, have tunnel vision in one eye but it started to get tightened much more than last year
A majority of respondents who receive injections also indicated that they have not missed an injection in the last year (68.2%). Despite this, the number of patients who have missed injections is sizeable (31.8%) and deserving of attention. Further, in a similar study on AMD conducted by our groups, the percentage of missed appointments was just below 20%. It is worth considering why patients with DR and DME appear to be missing more appointments that those with AMD. Additionally, since this data were collected before COVID, it is safe to assume that more appointments are being missed today then at the beginning of 2020. This notion is supported by findings from the CCB COVID study, which is referenced at the end of the Disease Experience section in this submission: “This study also reported that 1,500 fewer patients received injections for AMD and 458 fewer patients received injections for diabetic retinopathy in 2020 compared with 2019. When combined with other delayed or cancelled eye examinations and treatments it was estimated that an additional 1,437 people experienced vision loss due to the pandemic.” Clearly, missed injection appointments—and by extension all forms of nonadherence and non-persistence—require serious attention when developing policies and treatments for DR and DME and support the development and approval of new treatments which can reduce treatment burden.
Following up on this, our survey asked respondents why they have cancelled or delayed appointments in the past. Although the response rate for this question was quite low, most respondents indicated that they were too busy to attend the appointment (50%), followed by not feeling well (33.3%), being “unable to find someone to take me to the appointment” (16.7%), and being “scared to receive the injection” (16.7%).
Regarding the inability to find someone to assist with travel, our questions did uncover a significant reliance on assistance in this area. When asked who helps them attend their injections appointments, over 80% of participants indicating receiving travel from either a spouse, family member, or friend. These individuals helped in a number of ways, including with travel (93.3%), with waiting at the appointment (80%), and with assistance in everyday tasks after the injection (33.3%).
Table 6: Reason for Cancellation or Delay (n = 6)
Reason | n (%) |
|---|---|
Unable to find someone to take me to the appointment | 1 (16.7) |
Unable to travel to appointment | 0 (0.0) |
Could not afford attending the appointment | 0 (0.0) |
Too busy to attend appointment | 3 (50.0) |
Did not know how important the injection was to my sight | 0 (0.0) |
Scared to receive the injection | 1 (16.7) |
Did not find previous injections helpful | 0 (0.0) |
I forgot about the appointment | 0 (0.0) |
I was not feeling well | 2 (33.3) |
Other | 0 (0.0) |
Table 7: Type of Help Provided (n = 15)
Type of help | n (%) |
|---|---|
Help me after the injections with everyday tasks | 5 (33.3) |
Wait with me at the appointment | 12 (80.0) |
Travel with me or drive me to/from the appointment | 14 (93.3) |
Take care of things at home while I am away | 1 (6.7) |
Physical support at my appointment | 4 (26.7) |
Other | 1 (6.7) |
These responses once again underscore the degree to which DR and DME lead to a reliance on family and friends for caregiving and other forms of assistance, most commonly for travel to and from appointments.
Travel and Time Commitment
Almost half of the respondents indicating facing travel time of less than 30 minutes (45.5%) to get to their injection appointment, followed by 31 - 60 minutes (40.9%) and 1 - 2 hours (9.1%).
When asked how long they spend at their injection appointments, the largest group reported less than 1 hour (42.9%), followed by 1 - 2 hours (33.3%) and 2 - 4 hours (14.3%).
In terms of the ease or difficulty of travel, responses were varied but skewed towards the easy end of the spectrum, with most respondents selecting that travel is either very easy (27.3%), easy (27.3%), or neither easy nor difficult (27.3%).
That said, 4 individuals did report difficulty related to their travel, and when asked about the reasons, they selected distance from home (50%), poor condition of vehicle (25%), cost (25%), and difficultly related to taking public transit (25%).
Table 8: Travel Time (One-Way) to Injection Appointment (n = 22)
Time | n (%) |
|---|---|
Less than 30 minutes | 10 (45.5) |
31-60 minutes | 9 (40.9) |
More than 1 hour, and less than 2 hours | 2 (9.1) |
More than 2 hour, and less than 4 hours | 0 (0.0) |
4 hours or longer | 1 (4.5) |
Table 9: Total Time Spent Per Appointment at Office of Doctor/Clinician for Injection Appointment (n = 21)
Time | n (%) |
|---|---|
Less than 1 hour | 9 (42.9) |
More than 1 hour, and less than 2 hours | 7 (33.3) |
2 hours or more, but less than 4 hours | 3 (14.3) |
4 hours or more, but less than 6 hours | 1 (4.8) |
More than 6 hours | 1 (4.8) |
Table 10: What Is it Like to Travel to Your Injection Appointments (n = 22)?
Ease of travel | n (%) |
|---|---|
Very difficult | 0 (0.0) |
Difficult | 4 (18.2) |
Neither easy nor difficult | 6 (27.3) |
Easy | 6 (27.3) |
Very easy | 6 (27.3) |
Table 11: What Makes it Difficult for You to Travel to Your Injection Appointments (n = 4)
Reason | n (%) |
|---|---|
It is far from home | 2 (50.0) |
My vehicle is in poor condition | 1 (25.0) |
Poor road conditions | 0 (0.0) |
It is expensive to travel | 1 (25.0) |
Other* | 1 (25.0) |
*Alone it is impossible to take the metro, but with my daughter, difficulty is when I don’t hold her arm
Interestingly, although in these responses both travel and waiting appear as somewhat minimal concerns, both are flagged as the most difficult aspects of the injection routine in data from a different question. When asked what makes it difficult to travel to injection appointments, half of the respondents selected long wait times, while the remainder selected difficulties such as “finding someone to drive me to/from the appointment” (31.8%) and “taking time off work to attend” (27.3%).
Table 12: Most Difficult Part of Eye Injection Appointments (n = 22)
Reason | n (%) |
|---|---|
Anxiety or fear about the injection | 6 (27.3) |
Long waiting time at the appointment | 11 (50.0) |
Cost of travel to/from the appointment | 0 (0.0) |
Finding someone to drive me to/from the appointment | 7 (31.8) |
Finding someone to help me with my daily tasks after the injection | 0 (0.0) |
I don't find any part difficult | 4 (18.2) |
Scratchiness or pain in my eye after the appointment | 4 (18.2) |
Taking time off work to attend | 6 (27.3) |
Other* | 3 (13.6) |
*Spouse must take time off work to drive me, if I didn’t have my daughter, I’d find difficulties in everything, hotel stay required (travel from Yukon to Vancouver) which is expensive
When framed or conceptualized in terms of what is most difficult, then, both travel and waiting emerge as central concerns. It is also worth considering whether these issues are exacerbated in rural parts of Canada. Although a regional sub-analysis has not be conducted for this study, it is entirely possible that travel, waiting, and strain on caregivers are even more challenging for Canadians living in rural and remote parts of the country. This is certainly a factor that needs to be considered in the development of new treatments for these diseases.
Emotional and Physical Effects
In response to the question about difficulty, a significant number of patients also selected “anxiety or fear about the injection” (27.3%), highlighting the fact that injections into the eye are emotionally burdensome for some patients. This is interesting, considering that many patients also indicated being “satisfied” with their injections, as well as appreciative of the impact on their sight. It may show that those with DR or DME tend to manage their fear and anxiety in relation to injections as a matter of course. Injections still carry an emotional or psychological impact, but this has become internally managed in such a way as to be common or matter of fact.
The physical burdens of injections are not to ignored either. In response to the same question about the difficult aspects of injections, 18.2% of patients indicated “scratchiness or pain in the back of my eye” as a difficulty worth noting. It is clear that physical impacts are a factor for some patients, then. This is supported to some degree by the number of patients who experience some pain during the injection: when asked to indicate their pain level, a significant majority selected that the injections are “slightly painful” (81.8%). The remainder selected “not painful at all” (9.1%) and “painful” (9.1%).
Moving into the evening after the injection, our respondents showed an overall transition into a more painful experience. While 45.5% of patients indicated that the evenings are “not painful at all,” 40.9% selected “slightly painful” and 13.6% chose “painful.” As a result, over half of respondents indicated some form of eye pain lingering into the evening.
Vision was shown to be impacted post-injection as well, with the largest group of respondents selecting that their vision stayed blurry “until I go to sleep that night” (31.6%). This was followed by vision being blurry for 1 - 3 hours (26.3%) and for 4 - 6 hours (21.1%).
Given the prevalence of blurry vision among the cohort, it is unsurprising that they indicated a number of daily activities that become difficult or impossible post-injection. When asked about which activities they can longer do after an injection, the largest groups chose “watch TV” (57.1%) and “read” (57.1%), followed by “drive” (28.6%), “work” (21.4%), and “prepare meals (14.3%). All respondents to this question choose at least one activity that they can no longer do.
Table 13: How Painful Is the Injection for You (n = 22)?
Reason | n (%) |
|---|---|
Not painful at all | 2 (9.1) |
Slightly painful | 18 (81.8) |
Painful | 2 (9.1) |
Extremely painful | 0 (0.0) |
Table 14: How Painful Is the Injection for You in the Evening After (n = 22)?
Reason | n (%) |
|---|---|
Not painful at all | 10 (45.5) |
Slightly painful | 9 (40.9) |
Painful | 3 (13.6) |
Extremely painful | 0 (0.0) |
Table 15: After an Injection, for How Long Is Your Vision Blurry (n = 19)?
Frequency | n (%) |
|---|---|
Less than 1 hour | 3 (15.8) |
1-3 hours | 5 (26.3) |
4-6 hours | 4 (21.1) |
For at least 24 hours | 1 (5.3) |
Until I go to sleep that night | 6 (31.6) |
Table 16: Which of the Following Are You Unable to Do After an Injection (n = 14)?
Activity | n (%) |
|---|---|
Watch TV | 8 (57.1) |
Read | 8 (57.1) |
Drive | 4 (28.6) |
Prepare meals | 2 (14.3) |
Provide care to family members | 0 (0.0) |
Work | 3 (21.4) |
None of the above activities | 0 (0.0) |
These responses emphasize the emotional and physical impacts of living with and treating DR and DME, making it clear that the diseases exact a physical and psychological toll that exists alongside the logistical and financial challenges associated with travel and time.
Improved Outcomes
Our survey did not ask patients for their views on improving their experiences and outcomes. That said, the responses to our survey make it clear that any treatment that reduces the physical, psychological, and logistical strain on patients would be preferred. In terms of physical and psychological strain, this could take the form of a treatment that is less invasive, or one that is similarly invasive but that is administered less frequently. The frequency of the treatment could play a role in the reduction of logistical demands as well: a treatment that is taken or received less often would require fewer travel appointment, would decrease dependency on caregivers, and potentially more.
Experience With Drug Under Review
None of the respondents indicated using faricimab.
Companion Diagnostic Test
Not applicable.
Anything Else?
Researchers, health practitioners, policy experts, and others agree that diabetes is a growing and evolving epidemic, both globally and in Canada. As the incidence of diabetes grow, DR and DME will grow as well. A patient’s life is impacted by these diseases through a range of factors: life changes, loss of productivity, missed work/school hours, and more. As our data shows, DR and DME are diseases that weigh heavily on a patient’s mind, suggesting a strong psychological burden. Caregivers are impacted by the diseases as well, and in complex ways that are not always easy to measure or quantify.
DR and DME have these impacts, surely, but it is safe to assume that those impacts and associated burdens are more pronounced among vulnerable populations and those living outside of Canada’s urban centres. And during the COVID pandemic, it is also safe to assume that the burdens and challenges highlighted in patient responses have only become more pronounced. As the number of people living with diabetes in Canada increases, more patients in rural communities will need options that are effective, that help them comply with treatment programs, and that reduce the psychological toll of the disease.
In the context of diabetes, different people with diabetes require different medications and treatment modalities to help them effectively manage their disease. Their unique clinical profile, preferences and tolerance of therapy should direct prescribers to the most appropriate choice and combination of treatments for disease management. Health care providers must be supported in prescribing evidence-based therapies and, through public and private drug plans, patients should have access to a range of treatments that will allow them to optimize their health outcomes. For those paying out-of-pocket, costs should not be so high as to prohibit medication procurement. While current therapies have generally led to improvement for many people with diabetes in blood glucose and hemoglobin A1c control, respondents hope for additional affordable agents that they can access equitably, in a timely manner, and with good result to help them lead a normal life. "X medication" may help people to achieve better glycemic control, which could potentially improve lives and save millions in direct health care costs. For this reason, "X medication" should be an option for people living with diabetes.
This submission is a snapshot of the experiences of a small number of DR and DME patients in Canada—not a complete or final one, of course, because no overview can be, but nevertheless one that is grounded in the lived experiences of patients who offered their time, expertise, and insights to participate in this process. The focus of this submission has been on expanding our understanding of how these individuals perceive their diseases and treatments; the burdens that impact their lives; the barriers they face as a result of vision loss and other factors; and the psychological and emotional tolls of the diseases. As organizations that represent patients with DR, DME, and other eye diseases, our overarching goal is to contribute meaningfully to the discussion and potential implementation of new treatments in this space—in particular, to guide that discussion along lines that are patient-centered, that focus on optimal and equitable outcomes, and that recognize the expertise of patients with lived experience of DR/DME and their value in the review process of new treatments.
We look forward to continuing to work with CADTH to support Canadians living with DR and DME, and to advance our collective understanding of how the diseases impact their lives.
Patient Group Conflict of Interest Declaration — Fighting Blindness Canada, The Canadian Council of the Blind, CNIB, Vision Loss Rehabilitation Canada, Diabetes Canada
Did you receive help from outside your patient group to complete this submission? If yes, please detail the help and who provided it.
FBC contracted Dr. Chad Andrews as an independent consultant with expertise in patient centered research to draft this submission.
Did you receive help from outside your patient group to collect or analyze data used in this submission? If yes, please detail the help and who provided it.
FBC contracted JRL Research & Consulting to program and test the survey, perform qualitative interviews and clean and analyze the data.
List any companies or organizations that have provided your group with financial payment over the past 2 years AND who may have direct or indirect interest in the drug under review.
Table 17: Conflict of Interest Declaration for Fighting Blindness Canada
Company | $0 to 5,000 | $5,001 to 10,000 | $10,001 to 50,000 | In Excess of $50,000 |
|---|---|---|---|---|
Bayer | — | — | — | X |
Novartis | — | — | — | X |
Roche | — | — | — | X |
Abbvie-Allergan | — | — | — | X |
Table 18: Conflict of Interest Declaration for The Canadian Council of the Blind
Company | $0 to 5,000 | $5,001 to 10,000 | $10,001 to 50,000 | In Excess of $50,000 |
|---|---|---|---|---|
Bayer | — | — | — | X |
Novartis | — | — | — | X |
Table 19: Conflict of Interest Declaration for CNIB
Company | $0 to 5,000 | $5,001 to 10,000 | $10,001 to 50,000 | In Excess of $50,000 |
|---|---|---|---|---|
Astra Zeneca (CNIB) | — | — | X | — |
Bausch Foundation (CNIB) | — | — | X | — |
Bayer (CNIB) | — | — | — | X |
Johnson & Johnson (CNIB) | — | — | X | — |
Novartis (CNIB) | — | — | — | X |
Table 20: Conflict of Interest Declaration for Vision Loss Rehabilitation Canada
Company | $0 to 5,000 | $5,001 to 10,000 | $10,001 to 50,000 | In Excess of $50,000 |
|---|---|---|---|---|
No COI | — | — | — | — |
Table 21: Conflict of Interest Declaration for Diabetes Canada
Company | $0 to 5,000 | $5,001 to 10,000 | $10,001 to 50,000 | In Excess of $50,000 |
|---|---|---|---|---|
Novo Nordisk | — | — | — | X |
AstraZeneca | — | — | — | X |
Janssen | — | — | — | X |
Sanofi | — | — | — | X |
Bayer | — | — | X | — |
Clinician Input
Canadian Retina Society
About the Canadian Retina Society
The Canadian Retina Society (CRS) represents the Ophthalmologists in Canada whose primary area of patient care is surgical and/or medical vitreoretinal disease. The CRS website is www.crsscr.ca.
Information Gathering
Publications including Phase 3 randomized controlled trials, systematic reviews and meta-analyses and podium presentations at scientific meetings.
Current Treatments
In Canada, the estimated prevalence of diabetic macular edema (DME) is 15.7% in patients with diabetes. The prevalence of visual impairment due to DME is 2.6% [R.J.Petrella et al, Journal of Ophthlamology, vol 2012]. Composite scores for vision-related quality of life declined with increased visual acuity loss in a study of 145 Canadian patients with DME [Gonder J et al, Journal of Ophthalmology, vol 2014].
The recommended standard for treatment of center-involving DME (CI-DME) is anti-vascular endothelial growth factor (anti-VEGF) agents that are delivered by intravitreal injection. A Cochrane network meta-analysis of randomized controlled trials (RCTs) evaluating patients with DME (n= 6007 patients) demonstrated anti-VEGF agents were more effective than previous standard of care (laser) for improving vision after one year with high-certainty evidence (Virgili G et al, Cochrane Database Syst Rev. 2018;(10)). Risk Ratio (RR) for vision gain for aflibercept versus laser was 3.66 (95% CI 2.79 to 4.79), RR for bevacizumab versus laser was 2.47 (95% CI 1.81 to 3.37) and RR for ranibizumab versus laser was 2.76 (95% CI 2.12 to 3.59). As such, clinically anti-VEGF therapy has become the standard of care for treatment of DME. As per the evidence in the literature, anti-VEGF treatment are the 1st line of treatment for CI-DME across Canada.
The current anti-VEGF treatments do modify the underlying disease mechanism. This is supported by regression in Diabetic Retinopathy Severity Score (DRSS) with anti-VEGF treatment (RISE, RIDE, VIVID, VISTA trials). In addition, there is evidence that anti-VEGF treatment can slow progression of retinal non-perfusion (RECOVERY trial / post-hoc analysis of RISE/RIDE and VISTA trials). In addition, clinical trials including Protocol I and Protocol T and their associated extension studies have demonstrated a significant reduction in number of treatments after year 1 supporting a disease modifying aspect to anti-VEGF treatment.
Treatment Goals
One of the most important unmet needs in DME treatment is durability and reduced treatment frequency. Reducing treatment burden and allowing a fluid-free retina for a longer duration should allow for maintenance of maximal vision gains over the lifetime of the patient. This translates into improved quality of life, increased independence, reduce risk of falls, reduced depression and a myriad of other improved quality of life metrics that have been associated with vision loss secondary to DME in the literature over the past many decades. In addition, safety is vital to ensure minimal risk of ocular complications. Injection related complications including inflammation, infection, bleeding, retinal detachment, cataract and glaucoma are important side effects that can severely compromise visual outcomes and result in blindness for patients. Newer agents with increased durability and a robust safety profile will be vital to improve long term outcomes for Canadians living with DME.
Treatment Gaps (Unmet Needs)
Considering the treatment goals, please describe goals (needs) that are not being met by currently available treatments.
Treatment Burden: To date, all published phase 3 pivotal RCTs involving eyes with DME achieved statistically significant, and clinically important, vision gains with at least one treatment group receiving regular fixed intravitreal injections of anti-VEGF agents. These protocols included giving anti-VEGF agents monthly (every 4 weeks) or every 2 months (every 8 weeks) for 2 years; however, fixed dosing regimens can be burdensome for patients and physicians, as well as the healthcare system and in most situations result in overtreatment. Evidence from RCTs may also not be generalizable to routine clinical practice due to high treatment and monitoring standards resulting in under-treatment and under-monitoring in the real-world.4 This has led to a gap between real world outcomes and pivotal clinical trial results. Phase 3 results at year 1 and year 2 have demonstrated a very significant reduction in treatment burden with Faricimab while maintaining non-inferior visual results compared to current gold standard of fixed dosing with aflibercept in DME management. Approximately 65% of patients were a q16 week dosing at week 96 compared to q8 week dosing with gold standard fixed dosing with aflibercept. The mean number of injections in year 2 for the personalized treatment arm was 3 injections which is a significant reduction in treatment burden and monitoring burden compared to current standard of care.
Long Term Outcomes: Anti-VEGF agents in DME are very effective at improving vision during an intense loading phase of typically month injections given for 5 months in most clinical trials. Maintaining these vision gains over the following years has been challenging. In the context of a clinical trial setting and very regular monitoring and treatment schedule, Protocol T demonstrated that patients had gained on average 2 lines of vision from baseline to month 24. However, during the extension phase of the study, from year 3 to 5, patients lost 1 line of vision likely secondary to reduced monitoring and treatment frequency. This loss of vision in extension studies has been seen across the board including open label extension studies from RISE and RIDE trials. Moreover, all these studies have demonstrated other markers for under treatment including regression of Diabetic Retinopathy Severity Score which suggests that in addition to functional vision outcomes, important anatomic outcomes also demonstrate a negative trend in long term follow-up. Therapeutics that reduce treatment and monitoring burden will be vital to help mitigate the long-term vision loss in DME.
Safety: Newer agents including brolucizumab have demonstrated increased durability than previous agents. However, the safety profile of brolucizumab has been a limiting factor due to concerns regarding inflammation and occlusive retinal vasculitis. As such, newer agents must not only be more durable, but also demonstrate high safety profile that is in line with the currently used drugs.
Additional benefits may include compliance, reduced surgical intervention (vitrectomy), maintaining vision at a level for driving, reading and occupational needs.
Which patients have the greatest unmet need for an intervention such as the drug under review?
All patients in Canada with DME will benefit from a safe, efficacious, and durable therapeutic agent similar to the one under review. New patients will benefit from effective disease control and reduced burden. Patients currently under treatment could potentially reduce their treatment burden and reduce number of monitoring and treatment visits by switching to a newer, more durable agent.
This drug will help address many of the key unmet needs for Canadians living with DME.
Place in Therapy
How would the drug under review fit into the current treatment paradigm?
This agent builds on our current treatment strategy. All our current treatments address the VEGF pathway in DME. The drug under review is the first bispecific antibody designed for the eye. It will not only target the VEGF-A pathway, but also block angiopoietin-2 (Ang-2) that has been established as a critical player in retinal and choroidal vascular disease. As such, the dual mechanism of action for this drug is unique and different than any other agent currently in use for the treatment of DME
This agent has demonstrated non-inferior vision results with less frequent treatments compared to the current gold standard treatment in head-to-head Phase III pivotal trials. As such, this agent can be considered as first-line treatment and as rescue treatment for patients not responding well to current drugs that are available for DME treatment.
The phase 3 trials for this agent recruited 25% of patients who had previously been treated with other agents but still had active disease. The results demonstrated positive anatomic and visual outcomes for patients suggesting that not only previously untreated patients but also patients who have previously been treated with other anti-VEGF agents can be switched to this agent and experience further vision benefit.
The durability for this agent will allow clinicians the confidence to extend patients longer between treatments than our current gold standard. That reduction in treatment burden will be an important paradigm shift.
Please indicate whether or not it would be appropriate to recommend that patients try other treatments before initiating treatment with the drug under review. Please provide a rationale from your perspective.
This agent has demonstrated greater durability and equivalence safety profile than current gold standards. As such, recommending that patients try another agent first is not supported by any evidence in the literature.
How would this drug affect the sequencing of therapies for the target condition?
There is currently no standard of care in terms of treatment failure. This is an area of evidence gap and requires further prospective work to guide clinical care. However, the phase 3 trials with this agent are the first studies in any phase 3 program that recruited up to 25% of patients who had previously been treated with other anti-VEGF agents. As such, there is evidence that switching patients from other agents to this agent maybe beneficial for further enhancing visual outcomes in addition to treating previously untreated patients.
Which patients would be best suited for treatment with the drug under review?
The phase 3 program assessed treatment naïve and previously treated patients and demonstrated clinically meaningful improvements. As such, all patients with CI-DME will be suited for treatment with this agent.
How would patients best suited for treatment with the drug under review be identified?
Patients will be identified using clinical exams and an array of diagnostic tests (OCT, OCT-A, IVFA). This condition is diagnosed in routine clinical practice. There are no issues related to diagnosis. As with any condition, there will be cases of misdiagnosis or underdiagnosis; however, this is likely a very small percentage given the very significant advances in imaging modalities in the recent years. There is no evidence to support treatment of pre-symptomatic patients. Patients with no vision loss from DME can be monitored as per results from Protocol V as long as very close follow up can be maintained.
Which patients would be least suitable for treatment with the drug under review?
Patients who do not have CI-DME should not be treated.
Is it possible to identify those patients who are most likely to exhibit a response to treatment with the drug under review?
Patients with good baseline vision are likely to maintain good vision in the long-term. However, all patients with all levels of vision benefited from treatment in the Phase III clinical trials with this agent.
What outcomes are used to determine whether a patient is responding to treatment in clinical practice?
Subjective outcomes – Visual acuity test.
Objective Outcomes – Fluid on OCT testing.
Clinical exam – Presence of macular thickening on exam.
What would be considered a clinically meaningful response to treatment?
Improvement in vision.
Reduction or resolution of macular edema.
Regression in DRSS. Reduction in frequency of treatment.
Patients extended to 4-month (or longer) interval between treatments.
How often should treatment response be assessed?
At every clinical visit which is determined by treatment need.
What factors should be considered when deciding to discontinue treatment?
End stage disease with significant atrophy and fibrosis and no improvement despite regular treatments.
What settings are appropriate for treatment with the drug under review?
All settings. Ophthalmology offices in the community and in hospital setting
For non-oncology drugs, is a specialist required to diagnose, treat, and monitor patients who might receive the drug under review?
An ophthalmologist is required to accurately diagnose, treat, and monitor patients under treatment.
Conflict of Interest Declarations — Canadian Retina Society
To maintain the objectivity and credibility of the CADTH drug review programs, all participants in the drug review processes must disclose any real, potential, or perceived conflicts of interest. This conflict of interest declaration is required for participation. Declarations made do not negate or preclude the use of the clinician group input. CADTH may contact your group with further questions, as needed. Please see the Procedures for CADTH Drug Reimbursement Reviews (section 6.3) for further details.
Did you receive help from outside your clinician group to complete this submission? If yes, please detail the help and who provided it.
No.
Did you receive help from outside your clinician group to collect or analyze any information used in this submission? If yes, please detail the help and who provided it.
No.
List any companies or organizations that have provided your group with financial payment over the past two years AND who may have direct or indirect interest in the drug under review. Please note that this is required for each clinician who contributed to the input — please add more tables as needed (copy and paste). It is preferred for all declarations to be included in a single document.
Declaration for Clinician 1
Name: Varun Chaudhary
Position: Immediate Past Co-Chair, Scientific Planning Committee, Canadian Retina Society
Date: 14-04-2022
Table 22: Conflict of Interest Declaration for the Canadian Retina Society — Clinician 1
Company | Check appropriate dollar range | |||
|---|---|---|---|---|
$0 to $5,000 | $5,001 to $10,000 | $10,001 to $50,000 | In excess of $50,000 | |
Bayer | — | X | — | — |
Novartis | — | X | — | — |
Roche | — | X | — | — |
Declaration for Clinician 2
Name: Amin Kherani
Position: President, Canadian Retina Society
Date: 14-04-2022
Table 23: Conflict of Interest Declaration for the Canadian Retina Society — Clinician 2
Company | Check appropriate dollar range | |||
|---|---|---|---|---|
$0 to $5,000 | $5,001 to $10,000 | $10,001 to $50,000 | In excess of $50,000 | |
None | — | — | — | — |
Declaration for Clinician 3
Name: James Whelan
Position: Past President, Canadian Retina Society
Date: 14-04-2022
Table 24: Conflict of Interest Declaration for the Canadian Retina Society — Clinician 3
Company | Check appropriate dollar range* | |||
|---|---|---|---|---|
$0 to $5,000 | $5,001 to $10,000 | $10,001 to $50,000 | In excess of $50,000 | |
Bayer | X | — | — | — |
Novartis | X | — | — | — |
Allergan | X | — | — | — |
Declaration for Clinician 4
Name: Arif Samad
Position: Secretary-Treasurer, Canadian Retina Society
Date: 14-04-2022
Table 25: Conflict of Interest Declaration for the Canadian Retina Society — Clinician 4
Company | Check appropriate dollar range | |||
|---|---|---|---|---|
$0 to $5,000 | $5,001 to $10,000 | $10,001 to $50,000 | In excess of $50,000 | |
Novartis | — | — | X | — |
Bayer | — | — | X | — |
Abbvie | X | — | — | — |
Roche | X | — | — | — |
Declaration for Clinician 5
Name: Bernard Hurley
Position: CPD Director, Canadian Retina Society
Date: 14-04-2022
Table 26: Conflict of Interest Declaration for the Canadian Retina Society — Clinician 5
Company | Check appropriate dollar range | |||
|---|---|---|---|---|
$0 to $5,000 | $5,001 to $10,000 | $10,001 to $50,000 | In excess of $50,000 | |
Novartis | X | — | — | — |
Bayer | — | — | X | — |
Alcon | X | — | — | — |
Allergan | X | — | — | — |
ISSN: 2563-6596
Disclaimer: The information in this document is intended to help Canadian health care decision-makers, health care professionals, health systems leaders, and policy-makers make well-informed decisions and thereby improve the quality of health care services. While patients and others may access this document, the document is made available for informational purposes only and no representations or warranties are made with respect to its fitness for any particular purpose. The information in this document should not be used as a substitute for professional medical advice or as a substitute for the application of clinical judgment in respect of the care of a particular patient or other professional judgment in any decision-making process. The Canadian Agency for Drugs and Technologies in Health (CADTH) does not endorse any information, drugs, therapies, treatments, products, processes, or services.
While care has been taken to ensure that the information prepared by CADTH in this document is accurate, complete, and up-to-date as at the applicable date the material was first published by CADTH, CADTH does not make any guarantees to that effect. CADTH does not guarantee and is not responsible for the quality, currency, propriety, accuracy, or reasonableness of any statements, information, or conclusions contained in any third-party materials used in preparing this document. The views and opinions of third parties published in this document do not necessarily state or reflect those of CADTH.
CADTH is not responsible for any errors, omissions, injury, loss, or damage arising from or relating to the use (or misuse) of any information, statements, or conclusions contained in or implied by the contents of this document or any of the source materials.
This document may contain links to third-party websites. CADTH does not have control over the content of such sites. Use of third-party sites is governed by the third-party website owners’ own terms and conditions set out for such sites. CADTH does not make any guarantee with respect to any information contained on such third-party sites and CADTH is not responsible for any injury, loss, or damage suffered as a result of using such third-party sites. CADTH has no responsibility for the collection, use, and disclosure of personal information by third-party sites.
Subject to the aforementioned limitations, the views expressed herein are those of CADTH and do not necessarily represent the views of Canada’s federal, provincial, or territorial governments or any third party supplier of information.
This document is prepared and intended for use in the context of the Canadian health care system. The use of this document outside of Canada is done so at the user’s own risk.
This disclaimer and any questions or matters of any nature arising from or relating to the content or use (or misuse) of this document will be governed by and interpreted in accordance with the laws of the Province of Ontario and the laws of Canada applicable therein, and all proceedings shall be subject to the exclusive jurisdiction of the courts of the Province of Ontario, Canada.
The copyright and other intellectual property rights in this document are owned by CADTH and its licensors. These rights are protected by the Canadian Copyright Act and other national and international laws and agreements. Users are permitted to make copies of this document for non-commercial purposes only, provided it is not modified when reproduced and appropriate credit is given to CADTH and its licensors.
Redactions: Confidential information in this document may be redacted at the request of the sponsor in accordance with the CADTH Drug Reimbursement Review Confidentiality Guidelines
Stakeholder Input: The views expressed in each submission are those of the submitting organization or individual; not necessarily the views of CADTH or of other organizations. As such, they are independent of CADTH and do not necessarily represent or reflect the view of CADTH. No endorsement by CADTH is intended or should be inferred. By filing with CADTH, the submitting organization or individual agrees to the full disclosure of the information. CADTH does not edit the content of the submissions.
CADTH does use reasonable care to prevent disclosure of personal information in posted material; however, it is ultimately the submitter’s responsibility to ensure no identifying personal information or personal health information is included in the submission. The name of the submitting organization or individual and all conflict of interest information are included in the submission; however, the name of the author, including the name of an individual patient or caregiver submitting the patient input, are not posted.
Accessibility: CADTH is committed to treating people with disabilities in a way that respects their dignity and independence, supports them in accessing material in a timely manner, and provides a robust feedback process to support continuous improvement. All materials prepared by CADTH are available in an accessible format. Where materials provided to CADTH by a submitting organization or individual are not available in an accessible format, CADTH will provide a summary document upon request. More details on CADTH’s accessibility policies can be found here.
About CADTH: CADTH is an independent, not-for-profit organization responsible for providing Canada’s health care decision-makers with objective evidence to help make informed decisions about the optimal use of drugs, medical devices, diagnostics, and procedures in our health care system.
Funding: CADTH receives funding from Canada’s federal, provincial, and territorial governments, with the exception of Quebec.