CADTH Reimbursement Review
Faricimab (Vabysmo)
Sponsor: Hoffmann-La Roche Ltd.
Therapeutic area: Macular degeneration, age-related
This multi-part report includes:
Clinical Review
Pharmacoeconomic Review
Stakeholder Input
Clinical Review
Abbreviations
AE
adverse event
AMD
age-related macular degeneration
Ang-2
angiopoietin-2
BCVA
best corrected visual acuity
BM
Bruch’s membrane
CI
confidence interval
CNV
choroidal neovascularization
CrI
credible interval
CPT
centre point thickness
CRT
central retinal thickness
CrI
credible interval
CST
central subfield thickness
DIC
deviance information criterion
ETRDS
Early Treatment Diabetic Retinopathy Study
HRQoL
health-related quality of life
ICE
intercurrent event
IRF
intraretinal fluid
ITC
indirect treatment comparison
ILM
internal limiting membrane
ITT
intention-to-treat
LLD
low luminance deficit
MAR
missing at random
MMRM
mixed model for repeated measures
NEI VFQ-25
National Eye Institute Visual Functioning Questionnaire 25
nAMD
neovascular age-related macular degeneration
NMA
network meta-analysis
OCT
optical coherence tomography
PED
pigment epithelial detachment
RCT
randomized controlled trial
RPE
retinal pigment epithelium
SAE
serious adverse event
SD
standard deviation
SRF
subretinal fluid
VEGF
vascular endothelial growth factor
VEGF-A
human vascular endothelial growth factor-A
Executive Summary
An overview of the submission details for the drug under review is provided in Table 1.
Item | Description |
|---|---|
Drug product | Faricimab (Vabysmo) 6 mg (6 mg per 0.05 mL of solution) for intravitreal injection |
Indication | Neovascular (wet) age-related macular degeneration (proposed) |
Reimbursement request | As per indication |
Health Canada approval status | Notice of Compliance |
Health Canada review pathway | Standard review pathway |
NOC date | May 27, 2022 |
Sponsor | Hoffmann-La Roche Ltd. |
NOC = Notice of Compliance.
Introduction
Age-related macular degeneration (AMD) is a chronic eye disease caused by degeneration of the macula.1 It is a leading cause of central vision loss in people 50 years of age or older.2 The disease is classified into dry or wet forms. Wet AMD, also known as neovascular AMD (nAMD), is characterized by abnormal formation of new blood vessels beneath the macula,2 leading to accumulation of blood and other factors, and resulting in severe and irreversible impairment of central vision, and potentially blindness. In Canada, it is estimated that nAMD affects more than 150,000 individuals.2
The standard of care for nAMD in Canada is anti–vascular endothelial growth factors (VEGFs). Such drugs, which include ranibizumab, aflibercept, brolucizumab, and (off-label) bevacizumab,3 have been shown to limit the progression of nAMD, and stabilize or reverse vision loss.4 Anti-VEGF drugs are administered as intravitreal injections on an ongoing basis at intervals of between 1 and 3 months after completion of loading doses.3,5-7
Faricimab is a bispecific form of immunoglobulin G1 that inhibits human vascular endothelial growth factor-A (VEGF-A) and angiopoietin-2 (Ang-2), the key mediators in the development of nAMD.2 Faricimab is indicated for the treatment of nAMD.8 The recommended dose of faricimab is 6 mg (0.05 mL) administered by intravitreal injection every 4 weeks (approximately every 28 ± 7 days) for the first 4 doses, followed by anatomic and visual acuity evaluations at week 20 and week 24 to inform dosing faricimab at intervals of 8, 12, or 16 weeks through week 60.8
The objective of this report was to perform a systematic review of the beneficial and harmful effects of faricimab 6 mg intravitreal injections for the treatment of nAMD in adults. The systematic review protocol for the current review was developed before the issuance of the Health Canada Notice of Compliance for faricimab on May 27, 2022.
Stakeholder Perspectives
The information in this section is a summary of input provided by the patient and clinician groups that responded to CADTH’s call for input and from a clinical expert consulted by CADTH for the purpose of this review.
Patient Input
CADTH received 1 joint input from Fighting Blindness Canada, the Canadian Council of the Blind, the CNIB Foundation, and Vision Rehabilitation Canada. Canadians with AMD (wet or dry) indicated that AMD had physical, psychological, and social impacts on their daily lives. Patients indicated that vision loss could affect daily activities such as their ability to use electronic devices, read, administer self-care, recognize or meet people, and drive. The patients reported that having to think about their disease frequently and worry about their condition worsening in the future created psychological stress. Patients indicated that the need for assistance and feelings of isolation and loneliness also had social impacts.
Most patients receiving anti-VEGF injection indicated that the treatment had helped them avoid losing more eyesight, while some noted no beneficial effect or were unsure if the treatments had any effect. Missing injection appointments, most commonly due to the lack of assistance, was reported to be a challenge by some patients. Anxiety and fear about the injections were noted by the patients to be the most difficult parts of the appointment. Most patients reported experiencing some pain into the evening after the appointment. Post-injection visual complications (e.g., blurry vision) and the resulting need for more frequent assistance were also reported.
Most patients expressed a preference for new treatments that can be taken less frequently.
Clinician Input
Input From Clinical Experts Consulted by CADTH
The clinical expert consulted by CADTH indicated the treatment goals of nAMD are to delay and/or reverse disease progression, reduce symptom severity, minimize adverse events (AEs), preserve and/or enhance health-related quality of life (HRQoL), and maintain patient independence. Given that most patients are currently required to attend treatment visits once every 1 to 3 months, the clinical expert noted that there is an unmet need for treatments that can be given at longer treatment intervals without recurrence of disease to reduce the burden of care associated with frequent treatment visits. This must be balanced with a promising safety profile.
The clinical expert noted that faricimab is expected to have a place of therapy similar to that of other anti-VEGFs, as a first-line treatment in patients with nAMD. The clinical expert pointed out that, if faricimab is reimbursed, a shift in the treatment paradigm will be likely, as faricimab is the first anti-VEGF therapy approved for administration at an extended interval of 16 weeks, which could potentially address the unmet need related to frequent treatment visits.
The clinical expert noted that patients with nAMD who have early and small neovascular lesions and 1 or more signs of active choroidal neovascularization (CNV) are suitable candidates for faricimab. The clinical expert indicated that faricimab can be used in patients who are treatment-naive or require a change in therapy due to inadequate response to other anti-VEGF drugs. The clinical expert indicated that patients with extensive subretinal fibrosis and macular tissue damage, very poor baseline visual acuity, long disease duration, or a history of unsuccessful therapy with an anti-VEGF drug for more than 2 years may not be suitable for treatment.
The clinical expert added that a clinical evaluation and optical coherence tomography (OCT) should be performed every 6 to 8 weeks at follow-up visits after the completion of loading doses to assess treatment response. Key assessment outcomes include a change in visual acuity and the presence of intraretinal fluid (IRF) or subretinal fluid (SRF), and blood accumulation in the macula. The clinical expert reported that an optimal response to anti-VEGFs is generally achieved at least 4 to 6 months after initiation of therapy.
The clinical expert indicated that faricimab should be discontinued in patients with extensive subretinal fibrosis (disciform scarring) accompanied by vision loss to counting fingers or worse, those in whom disease progression could not be modified with faricimab therapy, or those with end stage disease.
Clinician Group Input
CADTH received input from 1 clinician group, the Canadian Retina Society.
The clinician group noted that the current intravitreal anti-VEGF therapies used to treat nAMD are subject to limitations. The clinician group indicated that there has been an efficacy gap in real-world treatment outcomes compared to the outcomes observed in clinical trials due to the intense treatment burden associated with anti-VEGF therapy. The clinician group reported that, the visual outcomes in real-world practice are suboptimal, and the recent COVID-19 pandemic and other limitations on health care delivery have made it more difficult for patients to receive regular and intense treatment.
The clinician group described durability and reduced treatment frequency as the most important unmet needs in nAMD treatment. Because patients need to be treated with current anti-VEGF therapy every 7 to 8 weeks after an intensive monthly loading treatment cycle, the clinician group reported that this puts a high burden on patients and their caregivers in the form of time off work to attend appointments. The clinician group indicated that new treatments that require less-frequent injections would help reduce the treatment burden for these patients. Another unmet need associated with nAMD treatment identified by the clinician group is development of fibrosis and atrophy due to poor disease control in the long-term, which can eventually result in vision loss. According to the clinician group, improving long-term visual outcomes will require drugs that can effectively dry the retina for a longer period and reduce the nAMD treatment burden. Last, the clinician group noted the need for drugs that can also maintain a high safety profile to minimize the risk of ocular complications.
The clinician group mentioned that the dual mechanism of faricimab, which targets both the VEGF-A and Ang-2 pathways, which are critical in the development of retinal and choroidal vascular disease, is different from that of other available drugs. The clinician group agreed that this drug can be considered a first-line treatment or a rescue therapy for patients not responding to current nAMD treatment, while potentially reducing the treatment burden with the option of using longer treatment intervals than existing drugs.
Drug Program Input
The drug programs expressed an interest in understanding the appropriateness of study design (comparator, masking, and inclusion and exclusion criteria) of the pivotal trials of faricimab, the proportion of patients on extended intervals of anti-VEGFs in clinical practice, and whether there is experience with using faricimab beyond every 16 weeks. The clinical expert consulted by CADTH did not identify any particular concerns with regard to the study design elements noted by the drug programs. The clinical expert was unable to comment on the proportion of patients on extended treatment intervals as it varies by drug and is affected by multiple factors. The clinical expert noted that clinicians are generally reluctant to extend the treatment interval for existing anti-VEGF drugs beyond 16 weeks due to concerns with disease recurrence.
Other considerations of interest to the drug programs included the use of faricimab in treatment-experienced patients, the appropriate dosing interval for faricimab, and pricing. The clinical expert indicated that they would not hesitate to switch patients from another anti-VEGF drug to faricimab if a switch was deemed medically necessary. The expert expected that most patients would receive faricimab every 8 weeks to every 16 weeks in the maintenance phase if reimbursed.
Clinical Evidence
Pivotal Studies and Protocol-Selected Studies
Description of Studies
The TENAYA and LUCERNE studies met the inclusion criteria for the systematic review. They were identically designed, phase III, multi-centre, randomized, double-blind, active-controlled, noninferiority trials that evaluated the use of faricimab in comparison with aflibercept in treatment-naive nAMD patients (TENAYA, n = 671; LUCERNE, n = 658) for 112 weeks. Patients were randomized to either the faricimab or aflibercept arm on a 1:1 ratio. Patients in the faricimab arm were given faricimab 6 mg intravitreally every 4 weeks for 4 loading doses followed by maintenance doses every 8, 12, or 16 weeks. Patients in the aflibercept arm received aflibercept 2 mg intravitreally every 4 weeks for 3 doses then at a fixed maintenance interval of 8 weeks.
Both pivotal studies aimed to establish the noninferiority of faricimab to aflibercept through the primary outcome, which was the change from baseline in best corrected visual acuity (BCVA) as measured by Early Treatment Diabetic Retinopathy Study [ETDRS] charts averaged over weeks 40, 44, and 48 in the intention-to-treat (ITT) population. The noninferiority margin was specified as 4 letters on the ETDRS chart. Secondary outcomes included the frequency of administration of faricimab, retinal thickness, retinal fluids, pigment epithelial detachment (PED), and vision-related function, all of which were measured without control for multiplicity. At the time of this review, the studies were ongoing and data from the primary analysis at week 48 were available.
In both studies, the mean age of patients at baseline was between 74 and 77 years, and the majority were female (57.2% to 62.6%) and White (82.6% to 90.7%). The mean time since the diagnosis of nAMD was between 1.5 and 3.2 months and the majority had a baseline BCVA of 73 to 55 letters on ETDRS charts.
Efficacy Results
A summary of the key efficacy results is provided in Table 2.
Change in Visual Acuity
The primary outcome of both studies was the change from baseline in BCVA (ETDRS letters) averaged over weeks 40, 44, and 48 in the ITT population. The mean difference between the faricimab and aflibercept arms was 0.7 ETDRS letters (95% C, −1.1 to 2.5) in the TENAYA study, and 0.0 ETDRS letter (95% confidence interval [CI], −1.7 to 1.8) in the LUCERNE study in the ITT populations, both of which fell within the noninferiority margin.
The proportion of patients gaining 15 or more ETDRS letters in BCVA from baseline averaged over weeks 40, 44, and 48 was a secondary outcome. The proportions were 20.0% and 15.7% in the faricimab arm and aflibercept arm, respectively, of the TENAYA study, and 20.2% and 22.2% in the respective arms of the LUCERNE study. In the TENAYA study, the proportions of patients avoiding a loss of 15 or more ETDRS letters in BCVA from baseline averaged over weeks 40, 44, and 48 were 95.4% and 94.1% in the faricimab and aflibercept arms, respectively, while in the LUCERNE study, the proportions were 95.8% and 97.3% in the respective arms.
Frequency of Faricimab Injections
In the TENAYA study, the mean numbers of treatment injections given through week 48, a secondary outcome, were 6.9 (standard deviation [SD] = 0.63) in the faricimab arm and 7.8 (SD = 0.45) in the aflibercept arm. In the LUCERNE study, the mean numbers of study treatment injections given through week 48 were 7.0 (SD = 0.53) in the faricimab arm and 7.9 (SD = 0.32) in the aflibercept arm.
The studies measured the proportion of patients in the faricimab arm on an injection interval of 8, 12, or 16 weeks as a secondary outcome. The proportions of patients who received faricimab every 8, 12, or 16 weeks at week 48 were 20.3%, 34.0% and 45.7%, respectively, in the TENAYA study, and 22.2%, 32.9%, and 44.9%, respectively, in the LUCERNE study.
Vision-Related Function
In the TENAYA study, the change from baseline in National Eye Institute Visual Functioning Questionnaire 25 (NEI VFQ-25) composite score at week 48 (exploratory outcome), was 4.82 points (SD = 10.81) and 2.54 points (SD = 10.93) in the faricimab and aflibercept arms, respectively. In the LUCERNE study, the composite scores increased from baseline at week 48 by 4.35 points (SD = 10.65) and 5.55 points (SD = 11.17) in the faricimab and aflibercept arms, respectively.
Legal Blindness
The proportions of patients with legal blindness averaged over weeks 40, 44, and 48 (a secondary outcome) were 6.4% and 7.0% in the faricimab and aflibercept arms, respectively, in the TENAYA study, while in the LUCERNE study, the proportions were 7.9% and 7.5% in the respective arms.
Anatomic Outcomes
The change from baseline in central subfield thickness (CST), which is the distance between the internal limiting membrane (ILM) and retinal pigment epithelium (RPE), was a secondary end point. A reduction in CST (ILM-RPE) was observed in both treatment arms in both trials.
The proportions of patients with absence of IRF, SRF, and PED (secondary outcomes) at week 48 were in the ranges of 74.4% to 84.1%, 62.1% to 75.7%, and 3.0% to 7.7%, respectively.
Harms Results
A summary of the key harms results is provided in Table 2.
As of the primary analysis (follow-up until week 48), ocular AEs were reported in 36.2% and 38.1% of patients who received faricimab and aflibercept, respectively, in the TENAYA study. In the LUCERNE study, 40.2% of patients who received faricimab and 36.2% of patients who received aflibercept reported at least 1 ocular AE. The most common ocular AE was conjunctival hemorrhage (5.7% to 8.9%). The frequencies of ocular serious adverse events (SAEs) were 1.2% and 1.8% in the faricimab and aflibercept arms, respectively, in the TENAYA study, and 2.1% in both arms in the LUCERNE study. The most common ocular SAE was worsening of nAMD (up to 0.9%). In both studies, approximately half of the study populations reported non-ocular AEs. Nasopharyngitis (4.9% to 8.3%) was the most frequently reported non-ocular AE. The frequency of non-ocular SAEs in either arm of the studies was within a range of 9.0% to 14.7%, with cardiac failure being the most frequently reported SAE. The frequency of treatment discontinuation due to AEs was 2.4% in the faricimab arm and 0.3% in the aflibercept arm of the LUCERNE study, and 0.9% in both treatment arms of the TENAYA study. Death was reported in 0.3% to 2.1% of patients across treatment arms.
In terms of notable harms, 1 patient reported endophthalmitis in the aflibercept arm of the LUCERNE study, while none reported this AE in the faricimab arms of either trial. No incidence of retinal vasculitis was reported. Intraocular inflammation was reported in 0.6% to 2.4% of patients, and vitreous floaters were reported in 1.2% to 3.9% of patients. Arterial thromboembolic events were reported in 0.9% to 1.2% of patients.
Table 2: Summary of Key Results From the Pivotal Studies
Results | TENAYA Faricimab N = 334 | TENAYA Aflibercept N = 337 | LUCERNE Faricimab N = 331 | LUCERNE Aflibercept N = 327 |
|---|---|---|---|---|
Primary efficacy outcome | ||||
Change from baseline in BCVA (ETDRS letters) averaged over weeks 40, 44, and 48 for the ITT population — MMRM (primary estimand) | ||||
Patients contributing to the analysis, n (%) | 292 (87.4) | 300 (89.0) | 302 (91.2) | 291 (89.0) |
Baseline BCVA letters, meana (SE) | 61.3 (0.69) | 61.5 (0.7) | 58.7 (14.0) | 58.9 (13.3) |
Change from baseline letters, meana (SE) | 5.8 (0.64) | 5.1 (0.64) | 6.6 (0.64) | 6.6 (0.64) |
Difference in letters, meana (95% CI) | 0.7 (−1.1 to 2.5) | Reference | 0.0 (−1.7 to 1.8) | Reference |
Secondary efficacy outcomes | ||||
Proportion of patients gaining ≥ 15 ETDRS letters in BCVA from baseline averaged over weeks 40, 44, and 48 for the ITT population — CMH | ||||
Patients contributing to the analysis, n (%) | 292 (87.4) | 300 (89.0) | 302 (91.2) | 291 (89.0) |
Patients gaining ≥ 15 letters in BCVA, n (%b) | 58 (20.0) | 48 (15.7) | 60 (20.2) | 65 (22.2) |
Difference in proportions,b % (95% CI) | 4.3 (−1.6 to 10.1) | Reference | −2.0 (−8.3 to 4.3) | Reference |
Proportion of patients avoiding loss of ≥ 15 ETDRS letters in BCVA from baseline averaged over weeks 40, 44 and 48 for the ITT population — CMH | ||||
Patients contributing to the analysis, n (%) | 292 (87.4) | 300 (89.0) | 302 (91.2) | 291 (89.0) |
Patients avoiding loss of ≥ 15 letters in BCVA, n (%b) | 278 (95.4) | 283 (94.1) | 289 (95.8) | 283 (97.3) |
Difference in proportions,b % (95% CI) | 1.3 (−2.2 to 4.8) | Reference | −1.5 (−4.4 to 1.3) | Reference |
Proportion of patients in the faricimab arm on a q.8.w., q.12.w., and q.16.w. injection interval at week 48 (ITT population) | ||||
Patients contributing to the analysis, n (%) | 315 (94.3) | — | 316 (95.5) | — |
q.8.w. proportion, % (95% CI) | 20.3 (15.9 to 24.8) | — | 22.2 (17.6 to 26.7) | — |
q.12.w. proportion, % (95% CI) | 34.0 (28.7 to 39.2) | — | 32.9 (27.7 to 38.1) | — |
q.16.w. proportion, % (95% CI) | 45.7 (40.2 to 51.2) | — | 44.9 (39.4 to 50.4) | — |
Proportion of patients with legal blindness averaged over weeks 40, 44 and 48 for the ITT population — CMH | ||||
Patients contributing to the analysis, n (%) | 292 (87.4) | 300 (89.0) | 302 (91.2) | 291 (89.0) |
Snellen equivalent of 20/200 or worse (ETDRS ≤ 38 letters), n (%b) | 19 (6.4) | 21 (7.0) | 23 (7.9) | 23 (7.5) |
Difference in proportions, %b (95% CI) | −0.5 (−4.2 to 3.3) | Reference | 0.4 (−3.6 to 4.4) | Reference |
Harms, n (%) for the safety-evaluable population | ||||
Patients with ≥ 1 ocular AE, n (%) | 121 (36.3) | 128 (38.1) | 133 (40.2) | 118 (36.2) |
Patients with ≥ 1 non-ocular AE, n (%) | 174 (52.3) | 174 (51.8) | 172 (52.0) | 189 (58.0) |
Patients with ≥ 1 ocular SAE, n (%) | 4 (1.2) | 6 (1.8) | 7 (2.1) | 7 (2.1) |
Patients with ≥ 1 non-ocular SAE, n (%) | 30 (9.0) | 23 (10.1) | 38 (11.5) | 48 (14.7) |
Patients who discontinued treatment due to AE, n (%) | 3 (0.9) | 3 (0.9) | 8 (2.4) | 1 (0.3) |
Deaths, n (%) | 5 (1.5) | 1 (0.3) | 4 (1.2) | 7 (2.1) |
Notable harms | ||||
Endophthalmitis, n (%) | 0 (0.0) | 0 (0.0) | 0 (0.0) | 1 (0.3) |
Retinal vasculitis, n (%) | 0 (0.0) | 0 (0.0) | 0 (0.0) | 0 (0.0) |
Intraocular inflammation, n (%) | 5 (1.5) | 2 (0.6) | 8 (2.4) | 6 (1.8) |
Conjunctival hemorrhage, n (%) | 19 (5.7) | 22 (6.5) | 26 (7.9) | 29 (8.9) |
Retinal hemorrhage, n (%) | NR | NR | NR | NR |
Rhegmatogenous retinal detachment, n (%) | 0 (0.0) | 0 (0.0) | 0 (0.0) | 0 (0.0) |
Retinal tear, n (%) | 0 (0.0) | 0 (0.0) | 0 (0.0) | 0 (0.0) |
Vitreous floaters, n (%) | 13 (3.9) | 7 (2.1) | 7 (2.1) | 4 (1.2) |
Increase in intraocular pressure, n (%) | 8 (2.4) | 8 (2.4) | 9 (2.7) | 7 (2.1) |
Glaucoma, n (%) | 0 (0.0) | 1 (0.3) | 2 (0.6) | 3 (0.9) |
Arterial thromboembolic events,c n (%) | 3 (0.9) | 3 (0.9) | 4 (1.2) | 3 (0.9) |
AE = adverse event; BCVA = best corrected visual acuity; CI = confidence interval; CMH = Cochran-Mantel-Haenszel; ETRDS = Early Treatment Diabetic Retinopathy Study; ITT = intention-to-treat; MMRM = mixed model for repeated measures; NR = not reported; q.8.w. = every 8 weeks; q.12.w. = every 12 weeks; q.16.w. = every 16 weeks; SAE = serious adverse event; SD = standard deviation; SE = standard error.
aAdjusted mean. The primary end point was analyzed using an MMRM, with the change from baseline in BCVA as the dependent variable, considering all available observations of BCVA score at all visits. The model was adjusted for treatment group, visit, visit-by-treatment-group interaction, baseline BCVA (continuous), baseline BCVA (≥ 74 letters, 73 to 55 letters, and ≤ 54 letters), baseline low luminance deficit (< 33 letters and ≥ 33 letters), and region (US and Canada, Asia, and the rest of the world).
bCMH-weighted estimate. The observed proportions and the differences in observed proportions were obtained by applying CMH weight, stratified by baseline BCVA score (≥ 74 letters, 73 to 55 letters, and ≤ 54 letters), low luminance deficit (< 33 letters and ≥ 33 letters), and region (US and Canada, Asia, and the rest of the world).
cAnti-Platelet Trialists’ Collaboration–defined arterial thromboembolic events, defined as nonfatal strokes or nonfatal myocardial infarctions, or vascular deaths (including deaths of unknown causes).
Source: TENAYA Clinical Study Report9 and LUCERNE Clinical Study Report.10
Critical Appraisal
The overall designs of the TENAYA and LUCERNE studies were appropriate for the objectives of the studies. There was no particular concern with the methods of randomization, allocation concealment, or blinding. While imbalances were identified in 2 baseline characteristics in the LUCERNE study, including time since diagnosis of nAMD and proportion of patients with occult CNV lesions, these imbalances were unlikely to bias the results in favour of the faricimab arm according to the clinical expert consulted by CADTH. The conclusion of noninferiority of faricimab to aflibercept was based on an ITT analysis of the primary outcome. It is generally preferred that a claim of noninferiority be based on agreement between the ITT population and the per-protocol population for a more conservative approach in the context of noninferiority studies. Nonetheless, the results of a supplementary per-protocol analysis in the studies, and several sensitivity analyses conducted by the sponsor and the FDA, were consistent with those of the primary ITT analysis. The noninferiority margin of 4 ETDRS letters was justified, and the clinical rationale was considered reasonable by the clinical expert. The studies were adequately powered for the assessment of the primary outcome. The dropout rate of 4.3% in both studies was acceptable according to the clinical expert. Intercurrent events (ICEs), most of which were related to COVID-19, were reported in approximately 10% of patients in both studies, and the approach used to handle ICEs was considered appropriate by the CADTH review team. A key limitation in the statistical analysis was the lack of adjustment for multiplicity for secondary outcomes and subgroup analyses. As such, the findings were considered exploratory.
In terms of generalizability, because the studies included only treatment-naive patients, the applicability of the trial results to treatment-experienced patients is unclear. In addition, aflibercept was given at a fixed dosing interval in the maintenance phase, which does not align with the “treat-and-extend” protocol commonly used in clinical practice, further limiting the generalizability of the results. The outcome of the frequency of faricimab injections is also uncertain, given that the method of interval assignment for faricimab in the maintenance phase until the primary analysis at week 48 was more rigid than what is seen in clinical practice. However, keeping the dosing consistent may have helped reduce internal validity issues in the studies. The clinical expert consulted by CADTH anticipated that later analysis may have more generalizability value, given the implementation of a personalized treatment-interval algorithm from week 60 and onward involves routine adjustment of intervals based on disease activity. Furthermore, while the length of assessment in the primary analysis was adequate for assessing the efficacy and safety of faricimab in the context of a noninferiority trial, the clinical expert expected that at least 2 to 3 years of clinical data would be required to assess the durability of faricimab. Last, the lack of direct evidence comparing faricimab to brolucizumab or bevacizumab represents an important evidence gap in the evaluation of anti-VEGFs.
Indirect Comparisons
Description of Studies
One indirect treatment comparison (ITC) was submitted by the sponsor and included in this review. No additional ITCs were identified in the literature. The sponsor performed a Bayesian network meta-analysis (NMA) to estimate the efficacy of faricimab in patients with nAMD compared to other anti-VEGFs.
Efficacy Results
For the outcome of BCVA at 1 year, 35 trials were analyzed in a random-effects model. In the ITC, faricimab 6 mg intravitreal every 8 to 16 weeks was not different (95% credible intervals [CrIs] include the null) to comparators for BCVA. For the outcome of number of injections at 1 year, 27 trials were analyzed in a random-effects model. |||||||||||||||||||||||||||||||||||||||||||||||||||||||||||||||||||||||||||||||||||||||||||||||||||||||||||||||||||||||||||||||||||||||||||||||||||||||||||||||||||||||||||||||||||||||||||||||||||||||||||||||||||||||||||||||||||||||||||||||||||||||||||||||||||||||||||||||||||||||||||||||||||||||||||||||||||||||||||||||||||||||||| For the outcome of retinal thickness, at 1 year, 25 randomized controlled trials (RCTs) were analyzed using a random-effects model. The ITC suggests that faricimab may be favourable (95% CrIs exclude the null) to bevacizumab regimens, ranibizumab 0.5 mg intravitreal every 8 weeks for the outcome of mean change in retinal thickness (CST). Additionally, brolucizumab 6 mg intravitreal every 8 to 12 weeks may be favourable (95% CrI excludes the null) to faricimab for this outcome. The outcome of proportion of patients gaining or losing 10 or 15 EDTRS letters at 1 year was analyzed, but poor model fit precludes making conclusions about the effect of faricimab versus comparators for this outcome.
Harms Results
Limited data were available for the NMAs conducted for ocular AEs and for discontinuation. Fixed-effects models were therefore used for these end points, and there was a high degree of uncertainty in these models.
Critical Appraisal
Limitations to the sponsor’s ITC include considerable heterogeneity in the study and some baseline characteristics (most notably the heterogeneity in the methods to assess retinal thickness and in the method of assessing retinal thickness) and the availability of information about prognostic factors such as presence of SRF or IRF. Additionally, there was a weak connection between faricimab and the rest of the network through aflibercept via the LUCERNE and TENEYA trials, and through ranibizumab in a phase II trial.
The results of the analysis related to the number of injections may have been affected by protocol-driven administration of therapies with fixed intervals in clinical trials. Limitations to the NMA preclude making conclusions about the proportion of patients gaining or losing 10 or 15 EDTRS letters and retinal thickness.
As limited data were available for the NMAs conducted for ocular AEs and treatment discontinuation, fixed-effects models were used for these end points, and there was a high degree of statistical uncertainty in these models. Limited data are therefore available to draw conclusions about the effect of faricimab versus comparators on ocular AEs and treatment discontinuation.
Other Relevant Evidence
Description of Studies
The STAIRWAY (N = 76) and AVENUE (N = 273) studies were phase II, multi-centre, randomized, double-blind, active-controlled trials that did not meet the inclusion criteria of the systematic review. However, because they are the only head-to-head comparisons between faricimab and ranibizumab to date, they are summarized and critically appraised in this review.
In the STAIRWAY study, patients were assigned to either faricimab 6 mg (4 monthly loading doses then 1 maintenance dose every 12 weeks), faricimab 6 mg (4 monthly loading doses then 1 maintenance dose every 16 weeks.), or ranibizumab 0.5 mg (every 4 weeks) in a 2:2:1 ratio over a 48-week double-blind period. The primary outcome was the mean change from baseline in BCVA (ETDRS letters) at week 40 in the ITT population. Data were analyzed descriptively.
In the AVENUE study, patients were assigned to either ranibizumab 0.5 mg (every 4 weeks; arm A), faricimab 1.5 mg (every 4 weeks; arm B), faricimab 6 mg (every 4 weeks; arm C), faricimab 6 mg (4 monthly loading doses then 1 maintenance dose every 8 weeks.; arm D), or ranibizumab 0.5 mg for 3 monthly doses then faricimab 6 mg every 4 weeks (arm E), in a 3:2:2:2:3 ratio over a 32-week double-blind period. Arm B does not align with the recommended dose in the product monograph and therefore was not summarized in this review. The primary objective of the AVENUE study was to evaluate the efficacy of faricimab compared to ranibizumab monotherapy in treatment-naive patients from baseline to week 36, and in treatment-experienced patients (switched from ranibizumab to faricimab in the study after an incomplete response) from week 12 to week 36. The primary outcome was the mean change in BCVA (ETDRS letters) from baseline to week 36 in the comparisons of arms A, C, and D (treatment-naive population). In the comparison of arms A and E (treatment-experienced population), the primary outcome was the mean change in BCVA (ETDRS letters) from week 12 to week 36 in patients with a BCVA of less than or equal to 68 ETDRS letters at week 12.
Efficacy Results
STAIRWAY
In the STAIRWAY trial, the mean differences between the faricimab and ranibizumab arms in BCVA were −2.1 ETDRS letters (80% CI, −6.8 to 2.6) for faricimab every 12 weeks, and 1.1 letters (80% CI, −3.4 to 5.5) for faricimab every 16 weeks, at week 40, and 0.5 letters (80% CI, −4.3 to 5.3) for faricimab every 12 weeks, and 1.8 letters (80% CI, −2.7 to 6.4) for faricimab every 16 weeks, at week 52. Because the trial was not designed to test a hypothesis, the results were considered exploratory.
AVENUE
In the AVENUE trial, the mean differences between the faricimab and ranibizumab arms in the change in BCVA from baseline to week 36 were −1.6 letters (80% CI, −4.9 to 1.7) in arm C, and −1.5 letters (80% CI, −4.6 to 1.6) in arm D, of the treatment-naive population, The mean difference between the faricimab and ranibizumab arms in the change in BCVA from week 12 to week 36 was −1.7 (80% CI, −3.8 to 0.4) in the treatment-experienced population C in AVENUE trial. No statistically significant difference between the faricimab and ranibizumab treatment groups was identified for the primary end point in either analysis subpopulation. Overall, superiority of faricimab to ranibizumab was inconclusive, based on the results of the primary outcomes.
Harms Results
The harms and notable harms reported in both phase II trials were generally similar and consistent with the TENAYA and LUCERNE trials. The proportion of patients who experienced at 1 or more AEs in the STAIRWAY trial was 81.3% in the ranibizumab arm compared to between 74.2% and 75% in the faricimab arms. However, the proportions of patients who experienced SAEs were between 9.7% and 16.7%, and the proportions of patients who died were between 4.2% and 6.5% in the faricimab arm, with no events occurring in the ranibizumab arm. In the faricimab arms, the SAEs were non–ocular-related (cardiac disorders), and the 3 deaths were associated with ischemic stroke, sepsis, and metastatic neoplasm.
In the AVENUE trial, the proportions of patients with AEs were 84.8% and 84.4% in arms D and E, respectively, compared with 76.1% in arm A and 79.5% in arm C. One death (in arm E) was related to cardiorespiratory arrest.
Critical Appraisal
In both studies, trial eligibility criteria were appropriate for the indication, and the trial populations were generally representative of the Canadian patient population, based on baseline characteristics. While the dropout rates due to an AE were similar for all arms in the STAIRWAY trial, it was highest (7.8%) in arm E in the AVENUE trial. In terms of harms and notable harms, all these groups had small sample sizes and few events, making it difficult to draw any conclusions in either trial.
The study designs and planned analyses were the key limitations to the studies. The phase II designs were not appropriate for testing the superiority of faricimab versus ranibizumab. As the STAIRWAY trial was designed as an exploratory study that did not test a hypothesis, no conclusions can be drawn by the CADTH review team regarding the relative efficacy and safety of faricimab compared to ranibizumab based on this study. The AVENUE study was designed to test an a priori hypothesis that faricimab was superior to ranibizumab. The primary objective of AVENUE was not met as no statistically significant difference between the faricimab treatment groups and ranibizumab were identified for the primary end point in either analysis subpopulation.
Conclusions
Based on evidence from the pivotal trials, faricimab is noninferior to aflibercept in the change in BCVA from baseline over 48 weeks of treatment in treatment-naive adult patients with nAMD. The evidence regarding comparative efficacy in other BCVA outcomes, anatomic outcomes, vision-related function, and HRQoL was supportive of noninferiority but associated with some uncertainties due to limitations with the design of the studies and analyses. Neither the reviewed phase II studies nor the NMA submitted by the sponsor provides clear evidence that faricimab is superior to other anti-VEGFs for BCVA outcomes. Most patients received faricimab at an extended interval of 12 or 16 weeks at week 48 in the pivotal studies. ||||||||||||||||||||||||||||||||||||||||||||||||||||||||||||||||||||||||||||||||||||||||||||||||||||||||||||||||||||||||||||||||||||||||||||||||||||||||||||||||||||||||||||||||||||||||||||||||||||||||||||||||||||||||||||||||||||||||||||||||||||||||||; however, the heterogeneity in study design and patient characteristics may limit the usefulness of conclusions that can be made about these results. Overall, the safety profile of faricimab was similar to that of aflibercept in the pivotal trials, with a low occurrence of intraocular inflammation and no reports of retinal vasculitis or endophthalmitis.
Introduction
Disease Background
AMD is a chronic eye disease caused by degeneration of the macula.1 It is a leading cause of central vision loss in people aged 50 years or older2 and is classified into dry or wet forms. Wet AMD, also known as nAMD, is characterized by CNV, which refers to abnormal formation of new blood vessels underneath the macula.2,3 The accumulation of fluid, lipids, and blood resulting from leakage from these new blood vessels can lead to impairment of central vision. The symptoms of nAMD include visual distortion, a scotoma (blind spot), and blurred vision.2 Due to the progressive nature of nAMD, severe and irreversible vision loss can occur. In Canada, it is estimated that nAMD affects more than 150,000 individuals.2
The diagnosis of nAMD is based upon the presence of characteristic findings (e.g., SRF and/or IRF, retinal and subretinal hemorrhage, retinal thickening, or PED) on eye examination using imaging techniques such as OCT, OCT-angiography, and fundus fluorescein angiography.1,2
Standards of Therapy
The standard of care for patients with nAMD is intravitreal injection of an anti-VEGF drug.11,12 Ranibizumab, aflibercept, and brolucizumab are anti-VEGF drugs approved by Health Canada, and bevacizumab is commonly used off-label.3 A “treat-and-extend” protocol is commonly used in the management of nAMD in Canada, where clinicians adjust the interval of anti-VEGF injections based upon clinical findings after initial treatments and stabilization.1,3 Interval reduction is considered in the presence of disease activity (e.g., retinal fluid or a hemorrhage) in the macula, and interval extension or maintenance in the absence of disease activity.1
Other therapies include photodynamic therapy with verteporfin, which may be indicated in patients with a suitable CNV lesion from rare forms of nAMD, but it is not routinely prescribed for most forms of nAMD.3 Supplementation with zinc and antioxidant vitamins is also encouraged.3
The clinical expert consulted by CADTH indicated that the treatment goals of nAMD are to delay and/or reverse disease progression, reduce symptom severity, minimize AEs, preserve and/or enhance HRQoL, and maintain patient independence.
Drug
Faricimab is a humanized bispecific immunoglobulin G1 that selectively blinds to and neutralizes VEGF-A and Ang-2, which are mediators in the pathogenesis of nAMD.8 Endothelial cell proliferation is promoted by VEGF-A, leading to increased neovascularization and vascular permeability, whereas Ang-2 promotes endothelial destabilization, pericyte loss, and pathological angiogenesis and sensitizes blood vessels to the activity of VEGF-A. Through the inhibition of Ang-2 and VEGF-A, faricimab is expected to reduce vascular permeability and inflammation, inhibit pathological angiogenesis, and restore vascular stability.
This is the first CADTH review for faricimab. Faricimab was granted a Health Canada Notice of Compliance for the indication of treatment of nAMD on May 27, 2022, at a recommended dose of 6 mg (0.05 mL) by intravitreal injection every 4 weeks (approximately every 28 ± 7 days) for the first 4 doses, followed by anatomic and visual acuity evaluations at week 20 and week 24 to inform dosing at intervals of 8, 12, or 16 weeks through week 60. Patients should be assessed regularly and monitored between dosing visits, which should be scheduled based on the patient's status and at the physician's discretion. Faricimab has received FDA approval for the treatment of nAMD and diabetic macular edema.
The sponsor is seeking reimbursement of faricimab according to the approved indication, which is for the treatment of nAMD.
The key characteristics of faricimab and the comparator drugs are summarized in Table 3.
Table 3: Key Characteristics Of Faricimab, Aflibercept, Ranibizumab, Brolucizumab, and Bevacizumab
Characteristics | Faricimab | Aflibercept | Ranibizumab | Brolucizumab | Bevacizumaba |
|---|---|---|---|---|---|
Mechanism of action | VEGF inhibitor (mAb, targets Ang-2 and VEGF-A) | VEGF inhibitor (soluble decoy receptor, targets VEGF-A and PIGF) | VEGF inhibitor (mAb, targets VEGF-A isoforms) | VEGF inhibitor (mAb, targets VEGF-A isoforms) | VEGF inhibitor (mAb, targets VEGF) |
Indicationb | For the treatment of nAMD | For the treatment of nAMD | For the treatment of nAMD | For the treatment of nAMD | None (off-label) |
Route of administration | Intravitreal | Intravitreal | Intravitreal | Intravitreal | Intravitreal |
Recommended dosage | 6 mg q.4.w. for 4 doses then may extend to up to q.16.w. based upon disease activity | 2 mg q.4.w. for 3 doses then q.8.w. (may extend to up to q.12.w. in the first year of treatment and to q.16.w. after the first year based on disease activity) | 0.5 mg q.4.w. for 3 doses then may extend to up to q.12.w. based on disease activity | 6 mg q.4.w. for 3 doses then q.8.w. to q.12.w. based on disease activity | Off-label: 1.25 mg q.4.w. then may extend interval based on disease activity |
Serious adverse effects or safety issues |
|
|
|
|
|
Ang-2 = angiopoietin-2; ATE = arterial thromboembolic events (includes nonfatal stroke, nonfatal myocardial infarction, or vascular death); IOP = intraocular pressure; mAb = monoclonal antibody; nAMD = neovascular age-related macular degeneration; PIGF = placental growth factor; q.4.w. = every 4 weeks; q.8.w. = every 8 weeks; q.12.w. = every 12 weeks; q.16.w. = every 16 weeks; VEGF = vascular endothelial growth factor.
aBevacizumab is used off-label in the treatment of nAMD.
bHealth Canada–approved indication.
Source: Vabysmo product monograph,8 Eylea product monograph,6 Lucentis product monograph,7 Beovu product monograph,5 Avastin product monograph,13 Canadian Pharmacists Association: Therapeutic Choices – Age-related Macular Degeneration.3
Stakeholder Perspectives
Patient Group Input
This section was prepared by CADTH staff based on the input provided by patient groups.
Four patient advocacy groups (Fighting Blindness Canada, the Canadian Council of the Blind, the CNIB Foundation, and Vision Loss Rehabilitation Canada), provided 1 joint input for the treatment of AMD. These groups gathered information from Canadians living with wet or dry AMD through an online survey during the first months of 2020. Overall, 337 participants responded to this survey.
Patients reported that AMD had physical, psychological, and social impacts on their daily lives. Sight loss due to AMD affected daily activities of patients, such as using phones and tablets, reading books and newspapers, looking after their appearance, recognizing or meeting people, and driving. In addition, AMD was reported to impart significant psychological burden on patients, such as frequently thinking about their disease and its impacts, and worrying that their condition might worsen. When asked about the social implications of AMD, patients mentioned the need for assistance due to limited eyesight and feelings of isolation and loneliness.
The majority of respondents (75.4%) were currently being treated with anti-VEGF injections at the time of the survey. While describing their experiences with injections to treat the AMD, 72.7% participants expressed their satisfaction by stating that “they helped me avoid losing more eyesight.” Although most patients were satisfied with their injections, almost 20% of respondents indicated that they thought the injections have no beneficial effect or were unsure if there is an effect. Some patients reported missing injection appointments, with “unable to find someone to take me to the appointment” the most common reason. The most difficult part of the eye injection appointments was reported to be anxiety and fear about the injection, and approximately 4 out of 5 patients reported experiencing at least some pain into the evening after their appointments. In addition, visual complications (e.g., blurry vision) were reported post-injection, as well as the need for more frequent assistance due to post-injection complications.
When asked about their preferences for a new treatment for AMD, most patients indicated they would prefer a treatment that can be taken less frequently. However, the survey did not capture information on which outcomes were important to patients.
Clinician Input
Input From Clinical Experts Consulted by CADTH
All CADTH review teams include at least 1 clinical specialist with expertise in the diagnosis and management of the condition for which the drug is indicated. Clinical experts are a critical part of the review team and are involved in all phases of the review process (e.g., providing guidance on the development of the review protocol, assisting in the critical appraisal of clinical evidence, interpreting the clinical relevance of the results, and providing guidance on the potential place in therapy). The following input was provided by 1 clinical specialist with expertise in the diagnosis and management of nAMD.
Unmet Needs
The clinical expert consulted by CADTH noted that the treatment goals of nAMD are to delay and/or reverse disease progression, reduce symptom severity, minimize AEs, preserve and/or enhance HRQoL, and maintain patient independence. The clinical expert reported that there is an unmet need for treatments that can be given at longer treatment intervals without recurrence of disease. According to the clinical expert, while existing anti-VEGFs are effective in managing nAMD, they are given intravitreally on an ongoing basis by trained clinicians every 4 to 12 weeks, in most cases. The clinical expert reported that in some cases, the duration of treatment can be as long as a decade and treatment adherence is crucial to achieving favourable outcomes in the treatment of nAMD. In the clinical expert’s experience, some patients who cannot adhere to the regimen due to the burden of frequent visits ultimately lose vision after discontinuing treatment. The clinical expert suggested that having new treatments with an extended injection interval would imply a reduction in the number of treatment visits, which could alleviate the burden on patients and caregivers. The clinical expert suggested an extended injection interval could also mean that clinicians may have spare capacity to provide timely diagnosis and treatment for new patients.
Place in Therapy
The clinical expert noted that, unlike other currently available treatments, and in addition to VEGF inhibition, faricimab also targets Ang-2. The clinical expert expected faricimab to be a first-line therapy in the treatment of nAMD, similar to existing anti-VEGF drugs. The expert added that a shift in the current treatment paradigm will be likely with the introduction of faricimab, given that faricimab is the first anti-VEGF with an approved maintenance interval of up to every 16 weeks, which can potentially fulfill unmet needs with regard to frequency of visits.
In the clinical expert’s opinion, it is not appropriate to recommend that patients try other treatments before initiating faricimab. Faricimab is expected to be prescribed as a first-line treatment for nAMD, and, as with any of the existing treatments, the earliest initiation is crucial to achieve the best clinical outcomes.
Patient Population
The clinical expert noted that patients with nAMD who have early and small neovascular lesions and signs of active CNV (evidence of IRF or SRF and blood accumulation in the macula) based on clinical assessment, OCT, and OCT-angiography are suitable candidates for faricimab. Faricimab can be used in patients who are treatment-naive or require a change in therapy due to inadequate response to other anti-VEGF drugs.
The clinical expert noted that patients with acute symptoms of visual loss and signs of active nAMD have the greatest need for treatment. However, based on the evidence available currently, the expert did not expect that a specific subpopulation of nAMD patients would be more likely to benefit from faricimab compared with other populations. Patients with extensive subretinal fibrosis and macular tissue damage, very poor baseline visual acuity, long disease duration, or unsuccessful therapy with an anti-VEGF for more than 2 years may not be suitable for treatment.
The clinical expert noted that misdiagnosis and underdiagnosis can occur in clinical practice, more often in non-subspecialty clinics where resources may be limited.
Assessing Response to Treatment
According to the clinical expert consulted by CADTH, after completion of the loading doses, follow-up assessments are performed every 6 to 8 weeks with a treat-and-extend approach to achieving the longest sustainable interval without recurrence as determined by clinical and OCT evaluations. Key assessment outcomes include change in visual acuity, as well as presence of IRF or SRF, and blood accumulation in the macular.
The clinical expert noted that, when assessing the magnitude of change in visual acuity, it is crucial to keep in mind that patients with better vision at baseline generally have less room for improvement than those with poor baseline vision. The clinical expert reported that there is no agreed-upon threshold that is indicative of a clinically meaningful change in visual acuity in all patients with nAMD. The clinical expert also noted that a realistic goal in patients who have structural tissue damage in the central macula from nAMD is to achieve visual acuity stabilization, rather than improvement.
The clinical expert indicated that the presence of IRF or SRF, and blood accumulation in the macula are indicators of active disease that prompt modification of treatment plans, and often involve reduction in injection interval.
The clinical expert noted that it generally takes at least 4 to 6 months to achieve an optimal response to therapy. Based on the clinical expert’s experience, the majority of patients can achieve stabilized vision and improved quality of life, and about 30% to 40% of patients can achieve visual acuity improvement.
Discontinuing Treatment
The clinical expert indicated that faricimab should be discontinued in patients with extensive subretinal fibrosis (disciform scarring) that occurred with vision loss to counting fingers or worse, in patients in whom disease progression could not be modified with faricimab therapy, or with end stage disease.
Prescribing Conditions
The clinical expert indicated that it would be most appropriate for retina specialists to prescribe and administer faricimab. However, in rural settings where access to a retinal specialist is challenging, trained ophthalmologists with experience and expertise in managing nAMD will allow for timely access to care and reduce caregiver burden.
Clinician Group Input
This section was prepared by CADTH staff based on the input provided by clinician groups.
CADTH received input from 1 clinician group, the Canadian Retina Society.
The clinician group noted that there have been limitations in the current intravitreal anti-VEGF therapies used to treat nAMD. The clinician group identified an efficacy gap in real-world treatment outcomes compared to the outcomes observed in clinical trials due to the intense treatment burden associated with anti-VEGF therapy. The clinician group reported that visual outcomes in real-world practice are suboptimal, and the recent pandemic and other limitations to health care delivery have made it more difficult for patients to receive regular and intense treatment.
The clinician group identified durability and reduced treatment frequency as the most important unmet needs in nAMD treatment. Because patients need to be treated with current anti-VEGF therapy every 7 to 8 weeks after an intensive monthly loading treatment cycle, the clinician group reported that this puts a high burden on patients and their caregivers, who need time off work to attend appointments. The clinician group indicated that new treatments that require less-frequent injections would help reduce the treatment burden for these patients. Another unmet need for nAMD treatment identified by the clinician group is the development of fibrosis and atrophy due to poor disease control, which can result in vision loss in the long-term. To improve the long-term visual outcomes, the clinician group mentioned the need for drugs that can effectively dry the retina for a longer period and reduce the nAMD treatment burden. Last, the clinician group mentioned the need for drugs that could also maintain a high safety profile to minimize the risk of ocular complications.
The clinician group mentioned that the dual mechanism of faricimab, which targets both the VEGF-A and Ang-2 pathways that are critical in the development of retinal and choroidal vascular disease, differs from that other available drugs. The clinician group agreed that this drug can be considered a first-line treatment or rescue therapy for patients not responding to current nAMD treatment, while potentially reducing the treatment burden and providing an option to use longer treatment intervals than those associated with existing drugs.
Drug Program Input
The drug programs provide input on each drug being reviewed through CADTH’s reimbursement review processes by identifying issues that may affect their ability to implement a recommendation. The implementation questions and corresponding responses from the clinical experts consulted by CADTH are summarized in Table 4.
Table 4: Summary of Drug Plan Input and Clinical Expert Response
Implementation issues | Clinical expert response |
|---|---|
Relevant comparators | |
Aflibercept appears to be an appropriate comparator, but do clinical experts believe a more appropriate comparator could have been selected? | Aflibercept was likely the most appropriate comparator among the anti-VEGF drugs available at the time of study conduct, as aflibercept was the most commonly prescribed drug. |
The study protocol mentions the administration of a sham treatment to maintain masking among arms. Given the titration schedule for faricimab, is it realistic to expect that masking was successful? | Based on the expert’s experience in conducting clinical trials, it is unlikely that patients would be able to differentiate between a sham injection and an actual intravitreal injection, given the study eye is anesthetized. |
Should aflibercept have been dosed according to the “treat-and-extend” regimen? | The use of a fixed q.8.w. interval for aflibercept in the maintenance phase was reasonable considering the study objective was to demonstrate durability of faricimab when given at longer intervals than aflibercept. The clinical expert further noted that, in his clinical experience, q.8.w. to q.10.w. is the most commonly prescribed maintenance regimen for aflibercept in patients who are in the first few years of treatment. |
What percentage of patients treated with ranibizumab, bevacizumab, aflibercept, and brolucizumab dosed according to the “treat-and-extend” regimen receive therapy q.12.w or q.16.w.? | The percentage of patients on an extended treatment-interval varies by drug and is affected by many factors. The duration of follow-up, for example, may have more influence on certain drugs (patients on ranibizumab or aflibercept tend to withstand a longer interval with time), and less so on others. As such, it is challenging to ascertain the percentage for each drug. |
Is there any discussion or experience with administering faricimab longer than q.16.w.? | Clinicians are generally reluctant to extend the treatment interval of existing anti-VEGF drugs beyond 16 weeks due to concerns with hemorrhagic recurrence, which can result in severe vision loss. There is no experience with administering faricimab beyond q.16.w. intervals. |
Considerations for initiation of therapy | |
Are there any inclusion or exclusion criteria that seem inappropriate? | The inclusion and exclusion criteria were appropriate. |
Are there any inclusion or exclusion criteria that need to be specified in the initiation criteria (if the drug receives a positive recommendation)? | For CDEC consideration. |
One inclusion criterion for the study was to be treatment-naïve. Is there any hesitancy in switching patients from another anti-VEGF therapy to faricimab? | Clinicians should not hesitate to switch patients from another anti-VEGF therapy to faricimab if a switch is deemed medically necessary. |
The last therapy reviewed for nAMD was brolucizumab (May 2020).
What criteria for therapy initiation would be ideal for clinical practice? | It would be appropriate to align the criteria for therapy initiation with the inclusion and exclusion criteria of the pivotal trials. |
Should new criteria proposed for faricimab be based on feedback from retinal specialists rather than specific to clinical trials? | For CDEC consideration. |
If BCVA is included in criteria, could the method and/or chart that would be used be specified? | For CDEC consideration. |
Consideration for discontinuation of therapy | |
What criteria for discontinuation of faricimab therapy would be ideal for clinical practice? | Faricimab should be discontinued in patients experiencing severe structural macular damage (e.g., fibrosis) that occurred with vision loss to counting fingers or worse, in patients for whom disease progression could not be modified with faricimab, or with end stage disease. |
Considerations for prescribing of therapy | |
How frequently should faricimab be administered? | Most patients will receive faricimab q.8.w. to q.16.w. following completion of loading doses. |
Special implementation issues | |
A number of jurisdictions reimburse bevacizumab (Avastin) as an off-label therapy. Should the pricing for reimbursement align with those given for brolucizumab (i.e., the drug plan cost should not exceed the least costly treatment reimbursed for nAMD)? | For CDEC consideration. |
Manitoba and Saskatchewan provide Eylea/Lucentis through centralized service (provincial eye centres). | For CDEC consideration. |
When compared with bevacizumab, the incremental cost per QALY gained is $289,315, according to the sponsor’s economic model. Batching of doses does occur in British Columbia through dedicated pharmacies that prepare the drug for physician office use:
What is the percentage price reduction to meet a $50,000 per QALY threshold? | Addressed in the Pharmacoeconomic Review report. |
AMD = age-related macular degeneration, VEGF = vascular endothelial growth factor; BCVA = best corrected visual acuity; CDEC = CADTH Canadian Drug Expert Committee; CEDAC = Canadian Expert Drug Advisory Committee; nAMD = neovascular aged-related macular degeneration; q.8.w. = every 8 weeks; q.10.w. = every 10 weeks; q.12.w. = every 12 weeks; q.16.w. = every 16 weeks; QALY = quality-adjusted life-year.
Clinical Evidence
The clinical evidence included in the review of faricimab is presented in 3 sections. The first section, the systematic review, includes pivotal studies provided in the sponsor’s submission to CADTH and Health Canada, as well as those studies that were selected according to an a priori protocol. The second section includes indirect evidence from the sponsor and indirect evidence selected from the literature that met the selection criteria specified in the review. The third section includes additional relevant studies that were considered to address important gaps in the evidence included in the systematic review.
Systematic Review (Pivotal and Protocol-Selected Studies)
Objectives
To perform a systematic review of the beneficial and harmful effects of faricimab 6 mg intravitreal injections for the treatment of nAMD in adults.
Methods
Studies selected for inclusion in the systematic review included pivotal studies provided in the sponsor’s submission to CADTH and Health Canada, as well as those meeting the selection criteria presented in Table 5. Outcomes included in the CADTH review protocol reflect outcomes considered to be important to patients, clinicians, and drug plans.
The systematic review protocol was established before the granting of a Notice of Compliance from Health Canada.
Table 5: Inclusion Criteria for the Systematic Review
Criteria | Description |
|---|---|
Population | Adults with nAMD Subgroup: baseline visual acuity |
Intervention | Faricimab 6 mg intravitreal injection at an interval of up to every 16 weeks after 4 initial doses every 4 weeks |
Comparators | Aflibercept, brolucizumab, ranibizumab, and bevacizumaba |
Outcomes | Efficacy outcomes:
Harms outcomes:
|
Study designs | Published and unpublished phase III and IV randomized controlled trials |
AE = adverse event; ATE = arterial thromboembolic event; CRT = central retinal thickness; HRQoL = quality of life; IOP = intraocular pressure; nAMD = neovascular age-related macular degeneration; NEI VFQ-25 = National Eye Institute Visual Functioning Questionnaire 25; SAE = serious adverse event; WDAE = withdrawal due to adverse event.
aBevacizumab is an off-label treatment for nAMD.
The literature search was performed by an information specialist using a peer-reviewed search strategy according to the PRESS Peer Review of Electronic Search Strategies checklist.14
Published literature was identified by searching the following bibliographic databases: MEDLINE All (1946 to February 21, 2022) via Ovid and Embase (1974 to February 21, 2022) via Ovid. All Ovid searches were run simultaneously as a multi-file search. Duplicates were removed using Ovid deduplication for multi-file searches, followed by manual deduplication in EndNote. The search strategy comprised both controlled vocabulary, such as the National Library of Medicine’s MeSH (Medical Subject Headings), and keywords. The main search concept was Vabysmo (faricimab). Clinical trials registries searched included the US National Institutes of Health’s clinicaltrials.gov, WHO’s International Clinical Trials Registry Platform (ICTRP) search portal, Health Canada’s Clinical Trials Database, and the European Union Clinical Trials Register.
No filters were applied to limit the retrieval by study type. Retrieval was not limited by publication date or by language. Conference abstracts were excluded from the search results. Appendix 1 provides detailed search strategies.
The initial search was completed on February 22, 2022. Regular alerts updated the search until the meeting of the CADTH Canadian Drug Expert Committee on June 22, 2022.
Grey literature (literature that is not commercially published) was identified by searching relevant websites from the Grey Matters: A Practical Tool For Searching Health-Related Grey Literature checklist.15 Included in this search were the websites of regulatory agencies (US FDA and European Medicines Agency). Google was used to search for additional internet-based materials. Appendix 1 provides more information on the grey literature search strategy. These searches were supplemented by reviewing bibliographies of key papers and through contacts with appropriate experts. In addition, the manufacturer of the drug was contacted for information regarding unpublished studies.
Two CADTH clinical reviewers independently selected studies for inclusion in the review based on titles and abstracts, according to the pre-determined protocol. Full-text articles of all citations considered potentially relevant by at least 1 reviewer were acquired. Reviewers independently made the final selection of studies to be included in the review, and differences were resolved through discussion.
A focused literature search for NMAs dealing with Vabysmo (faricimab) and AMD was run in MEDLINE All (1946–) on February 22, 2022. No limits were applied.
Findings From the Literature
Three reports presenting data from 2 unique studies were identified from the literature for inclusion in the systematic review (Figure 1). The included studies are summarized in Table 6. A list of excluded studies is presented in Appendix 2.
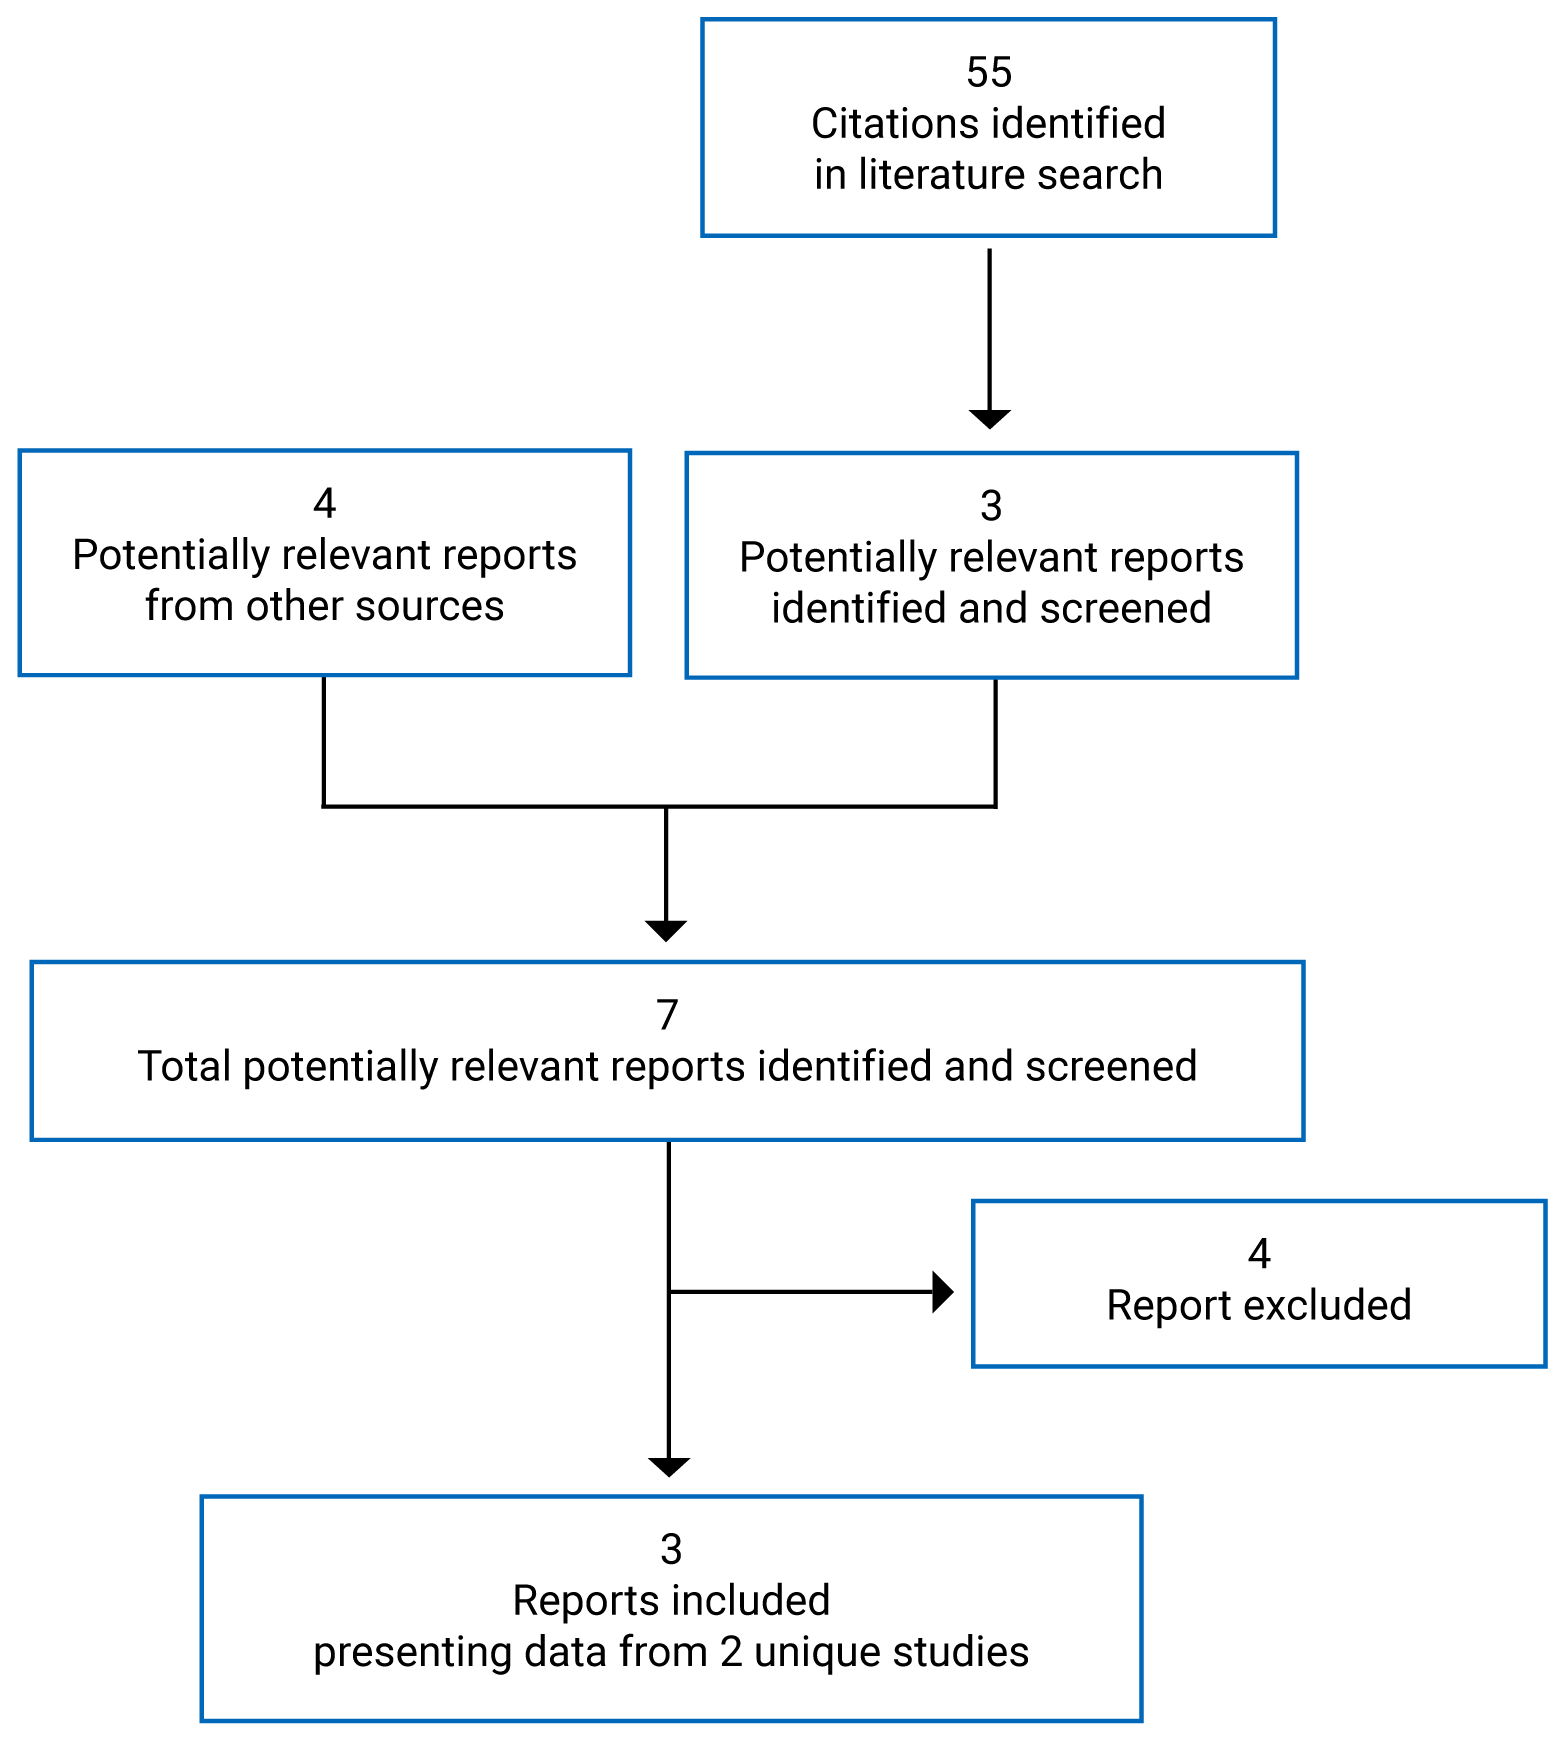
Table 6: Details of Included Studies
Study detail | TENAYA | LUCERNE |
|---|---|---|
Designs and populations | ||
Study design | Phase III, multi-centre, randomized, double-blind, active-controlled, noninferiority study | |
Locations | 65 sites in North America, 34 sites in Asia, and 50 sites in Europe | 41 sites in North America, 15 sites in Asia, 48 sites in Europe, 9 sites in Australia, 9 sites in South America |
Patient enrolment dates | Between February 19, 2019, and November 19, 2019 | Between March 11, 2019, and November 1, 2020 |
Randomized (N) | 671 | 658 |
Inclusion criteria |
| |
Exclusion criteria |
| |
Drugs | ||
Intervention | Faricimab solution for intravitreal injection, 6 mg (0.05 mL) every 4 weeks for 4 loading doses followed by maintenance doses at 8-, 12-, or 16-week intervals | |
Comparator | Aflibercept solution for intravitreal injection, 2 mg (0.05 mL) every 4 weeks for 3 loading doses followed by maintenance doses at 8-week intervals | |
Duration | ||
Phase | ||
Screening | 4 weeks | |
Double-blind | 112 weeks | |
Follow-up | NA | |
Outcomes | ||
Primary end point | Change from baseline in BCVA (as measured on the ETDRS chart) averaged over weeks 40, 44, and 48 | |
Secondary and exploratory end points | Secondary:
Exploratory:
Safety:
Immunogenicity:
| |
Notes | ||
Publications | Heier (2022)16 | |
ADA = anti-drug antibody; AE = adverse event; Ang-2 = angengenesis-2; BCVA = best corrected visual acuity; BM = Bruch’s membrane; CFP = colour fundus photograph; CNV = choroidal neovascularization; CST = central subfield thickness; ETDRS = Early Treatment Diabetic Retinopathy Study; ILM = internal limiting membrane; LLD = low luminescence deficit; nAMD = neovascular age-related macular degeneration; NEI VFQ-25 = National Eye Institute Visual Functioning Questionnaire 25; OCT-A = optical coherence tomography–angiography; PED = pigment epithelial detachment; PK = pharmacokinetic; q.8.w. = every 8 weeks; q.12.w. = every 12 weeks; q.16.w. = every 16 week; RPE = retinal pigment epithelial; VEGF-A = vascular endothelial growth factor A.
aCNV activity was defined as showing evidence of subretinal fluid, subretinal hyperreflective material, or leakage.
bCorresponds to 20/32 to 20/320 approximate Snellen equivalent.
cExcept for appropriately treated carcinoma in situ of the cervix, non-melanoma skin carcinoma, and prostate cancer with a Gleason score of 6 or lower and a stable prostate-specific antigen for more than 12 months.
Source: TENAYA Clinical Study Report9 and LUCERNE Clinical Study Report.10
Description of Studies
Two studies were included in the systematic review, TENAYA and LUCERNE.16 They were identically designed, phase III, multi-centre, randomized, double-blind, active-controlled, noninferiority trials that aimed to evaluate the efficacy, safety, durability, and pharmacokinetics of faricimab compared with aflibercept in treatment-naive patients with nAMD.
The TENAYA study (N = 671) was conducted in 149 sites in 15 countries (9 sites in Canada) and the LUCERNE study (N = 658) was conducted in 122 sites in 20 countries (Canada not included). Both trials consisted of a 28-day screening period, followed by a 112-week double-blind treatment period. On day 1 of the double-blind phase, eligible patients were assigned a randomization identification letter by an interactive web-based response system, then randomized to either the faricimab or aflibercept arm (1:1). Randomization was stratified by 3 baseline factors: baseline BCVA ETDRS letter (≥ 74 letters, 73 to 55 letters, and ≤ 54 letters), low luminance deficit (LLD; < 33 letters, and ≥ 33 letters), and region (US and Canada, Asia, and the rest of the world). Patients in both arms received assigned treatment up to and including week 108, and returned for a final visit at week 112 in the double-masked period. Study visits occurred every 4 weeks until the end of the study in both studies. The study design of both studies is illustrated in Figure 2. Note that both studies are ongoing and the primary analysis that included data up to week 48 (data cut-off for the TENAYA study was October 26, 2020, and for the LUCENRE study, October 5, 2020) was reviewed in this submission. The final analysis is planned to occur after week 112 (anticipated study completion date for the TENAYA study was August 2022, and for the LUCERNE study, September 2023).
Figure 2: Study Design Schematic for TENAYA and LUCERNE
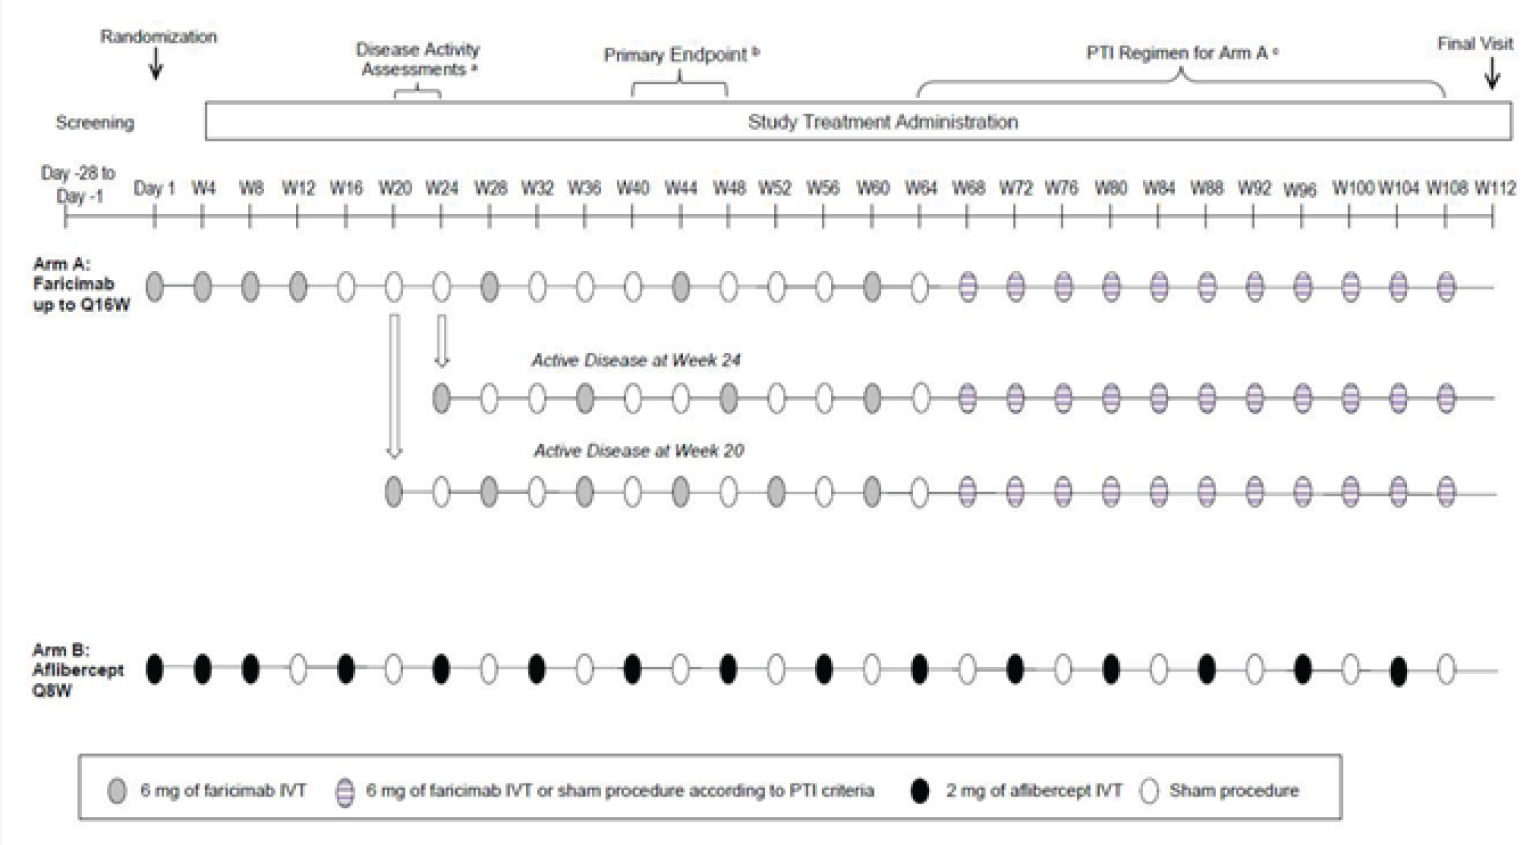
IVT = intravitreal; Q8W = every 8 weeks; Q16W = every 16 weeks; PTI = personalized treatment interval; W = week.
Source: TENAYA Clinical Study Report9 and LUCERNE Clinical Study Report.10
Populations
Inclusion and Exclusion Criteria
The key inclusion criteria of both studies included patients aged 50 years or older with treatment-naive, active CNV lesions (of any subtype) secondary to nAMD; BCVA scores of 78 to 24 letters using the ETDRS protocol (20/32 to 20/320 Snellen equivalent); a total CNV lesion size of less than or equal to 9 disc areas; and a CNV component area of greater than or equal to 50% of the total lesion size. The key inclusion and exclusion criteria of the trials are shown in Table 6. Only 1 eye was assigned as the study eye in the studies. If both eyes were eligible, the eye with the worse BCVA at baseline was selected.
Baseline Characteristics
A summary of baseline characteristics of the ITT population in both studies is shown in Table 7. The baseline characteristics of patients were balanced overall between the treatment arms within each study, except in the LUCERNE study, in which the mean time since diagnosis of nAMD was longer in the faricimab arm (3.2 months [SD = 14.5]) than in the aflibercept arm (1.7 months [SD = 4.5]), and the proportion of patients with an occult CNV lesion was higher in the faricimab arm (51.7%) than in the aflibercept arm (42.8%). The baseline characteristics were generally similar across the studies. Patients had a median age of 74 to 77 years, and the majority were female (> 57%), and White (> 82%). Most patients had occult CNV lesions (42.8% to 52%) in the subfoveal area (55.2% to 63.1%), with baseline BCVA scores of 73 to 55 letters (54.7% to 59.9%). Evidence of SRF and PED was present at baseline in the majority of patients (approximately 65% and 90%, respectively), while IRF was present in about half of patients.
Table 7: Summary of Baseline Characteristics in the TENAYA and LUCERNE Studies (ITT Population)
Characteristic | TENAYA | LUCERNE | ||
|---|---|---|---|---|
Faricimab 6 mg (N = 334) | Aflibercept 2 mg (N = 337) | Faricimab 6 mg (N = 331) | Aflibercept 2 mg (N = 327) | |
Age (years), mean (SD) | 75.9 (8.6) | 76.7 (8.8) | 74.8 (8.4) | 76.1 (8.6) |
Male, n (%) | 143 (42.8) | 126 (37.4) | 128 (38.7) | 139 (42.5) |
Race, n (%) | ||||
White | 303 (90.7) | 302 (89.6) | 278 (84.0) | 270 (82.6) |
Asian | 26 (7.8) | 28 (8.3) | 38 (11.5) | 34 (10.4) |
American Indian or Alaska Native | 1 (0.3) | 2 (0.6) | 1 (0.3) | 0 (0) |
Black or African-American | 0 (0) | 3 (0.9) | 2 (0.6) | 5 (1.5) |
Multiple | 1 (0.3) | 0 (0) | 0 (0) | 1 (0.3) |
Unknown | 3 (0.9) | 2 (0.6) | 12 (3.6) | 17 (5.2) |
Unilateral vs. bilateral nAMD, n (%) | ||||
Unilateral | 327 (97.9) | 327 (99.7) | 318 (96.1) | 320 (97.9) |
Bilateral | 7 (2.1) | 10 (3.0) | 13 (3.9) | 7 (2.1) |
Time since nAMD diagnosis | ||||
Mean months (SD) | 1.5 (4.8) | 1.1 (2.7) | 3.2 (14.5) | 1.7 (4.5) |
Median months (minimum to maximum) | 0.6 (0 to 62) | 0.6 (0 to 32) | 0.6 (0 to 187) | 0.7 (0 to 51) |
BCVA (ETDRS letters read) | ||||
Mean (SD) | 61.3 (12.5) | 61.5 (12.9) | 58.7 (14.0) | 58.9 (13.3) |
≥ 74 (20/32 or better), n (%) | 47 (14.1) | 52 (15.4) | 45 (13.6) | 39 (11.9) |
73 to 55 (between 20/40 and 20/80), n (%) | 200 (59.9) | 201 (59.6) | 181 (54.7) | 183 (56.0) |
≤ 54 (20/80 or worse),n (%) | 87 (26.0) | 84 (24.9) | 105 (31.7) | 105 (32.1) |
Low luminance deficit (ETDRS letters) | ||||
Mean (SD) | 25.3 (12.9) | 26.1 (13.2) | 25.0 (12.6) | 25.8 (13.5) |
< 33, n (%) | 236 (70.7) | 235 (69.7) | 238 (71.9) | 234 (71.6) |
≥ 33, n (%) | 95 (28.4) | 98 (29.1) | 89 (26.9) | 93 (28.4) |
Missing or invalid, n (%) | 3 (0.9) | 4 (1.2) | 4 (1.2) | 0 (0) |
CNV location,a n (%) | ||||
Subfoveal | 201 (60.2) | 186 (55.2) | 209 (63.1) | 191 (58.4) |
Juxtafoveal | 88 (26.3) | 88 (26.1) | 73 (22.1) | 84 (25.7) |
Extrafoveal | 41 (12.3) | 55 (16.3) | 42 (12.7) | 44 (13.5) |
Missing/not identified | 4 (1.2) | 8 (2.4) | 7 (2.1) | 8 (2.4) |
CNV lesion type,a n (%) | ||||
Occult | 177 (53.0) | 174 (51.6) | 171 (51.7) | 140 (42.8) |
Classic | 84 (25.1) | 73 (21.7) | 98 (29.6) | 109 (33.3) |
Minimally classic | 32 (9.6) | 30 (8.9) | 30 (9.1) | 31 (9.5) |
RAP | 14 (4.2) | 27 (8.0) | 14 (4.2) | 15 (4.6) |
Predominantly classic | 17 (5.1) | 19 (5.6) | 6 (1.8) | 16 (4.9) |
Missing or not identified | 4 (1.2) | 8 (2.4) | 7 (2.1) | 8 (2.4) |
PCV | 6 (1.8) | 6 (1.8) | 5 (1.5) | 8 (2.4) |
Total CNV lesion areaa in mm2, mean (SD) | 4.7 (4.8) | 4.5 (4.1) | 4.7 (4.7) | 4.3 (4.3) |
Presence of IRF, n (%) | ||||
Yes | 146 (43.7) | 157 (46.6) | 142 (42.9) | 154 (47.1) |
No | 181 (54.2) | 177 (52.5) | 184 (55.6) | 171 (52.3) |
Presence of SRF, n (%) | ||||
Yes | 216 (64.7) | 225 (66.8) | 221 (66.8) | 222 (67.9) |
No | 113 (33.8) | 107 (31.8) | 107 (32.3) | 103 (31.5) |
Presence of PED, n (%) | ||||
Yes | 300 (89.8) | 308 (91.4) | 304 (91.8) | 298 (91.1) |
No | 29 (8.7) | 26 (7.7) | 23 (6.9) | 27 (8.3) |
BCVA = best corrected visual acuity; CNV = choroidal neovascularization; ETRDS = Early Treatment Diabetic Retinopathy Study; IRF = intraretinal fluid; ITT = intention-to-treat; nAMD = neovascular aged-related macular degeneration; PCV = polypoidal choroidal vasculopathy; PED = pigment epithelial detachment; RAP = retinal angiomatous proliferation; SRF = subretinal fluid; SD = standard deviation.
aMeasured by fundus fluorescein angiography.
Source: TENAYA Clinical Study Report9 and LUCERNE Clinical Study Report.10
Interventions
In the TENAYA and LUCERNE studies, eligible patients were randomized in a 1:1 ratio to faricimab 6 mg or aflibercept 2 mg for a duration of 112 weeks.
In the faricimab arm, patients received faricimab 6 mg intravitreally every 4 weeks for 4 doses (day 1, week 4, week 8, and week 12) followed by maintenance doses of 6 mg at up to 16-week intervals (either every 8, 12, or 16 weeks). The maintenance doses between week 20 to week 60 were given at a fixed dosing interval, which was determined by disease severity assessments pre-determined to occur at week 20 and 24. Patients were considered to have active disease if any of the following criteria was met:
increase of greater than 50 µm in CST compared with the average CST value over the previous 2 scheduled visits (weeks 12 and 16 for the week 20 assessment and weeks 16 and 20 for the week 24 assessment)
increase equal to or greater than 75 µm in CST compared with the lowest CST value recorded at either of the previous 2 scheduled visits
decrease of 5 or more ETDRS letters in BCVA compared with the average BCVA value over the previous 2 scheduled visits, due to nAMD disease activity
decrease of 10 or more ETDRS letters in BCVA compared with the highest BCVA value recorded at either of the previous 2 scheduled visits, owing to nAMD disease activity
presence of new macular hemorrhage, due to nAMD activity.
At week 20, patients with active disease received faricimab at that visit then every 8 weeks until week 60. At week 24, patients with active disease (excluding those with active disease at week 20) received faricimab at that visit then every 12 weeks until week 60. Some exceptions were given to patients who had significant nAMD disease activity at week 24 but did not meet the criteria of active disease, if the investigator deemed that treatment was warranted. A definition of “significant nAMD disease activity” was not reported. These patients received a faricimab injection at week 24 and continued with a fixed dosing interval of every 12 weeks until week 60. Patients who did not have active disease at weeks 20 or 24 received faricimab at week 28 and continued with a 16-week dosing interval until week 60. From week 60, faricimab was dosed according to a personalized treatment-interval algorithm (Table 8). Dosing intervals were maintained, extended, or reduced based on OCT, BCVA, and clinical assessment at drug dosing visits.
In the aflibercept arm, patients received aflibercept 2 mg intravitreally every 4 weeks for 3 doses (day 1, week 4, and week 8), followed by maintenance doses of 2 mg at a fixed interval of every 8 weeks until the end of the study.
Treatment assignments were masked to all patients, assessors, and investigators, except treatment administrators. A sham procedure, which involved pressing a needle-free syringe against the anesthetized eye to mimic an intravitreal injection, was performed on patients in both treatment arms at study visits (every 4 weeks) when no treatment was scheduled to preserve masking.
The following therapies were prohibited during both studies: systemic anti-VEGF therapy; systemic drugs known to cause macular edema (fingolimod and tamoxifen); intravitreal anti-VEGF drugs in the study eye; intravitreal, periocular (subtenon), steroid implants, chronic topical (ocular) corticosteroids in the study eye; concurrent use of any macular photocoagulation or photodynamic therapy with verteporfin in the study eye; and other experimental therapies (except vitamins and minerals).
Outcomes
A list of efficacy end points identified in the CADTH review protocol that were assessed in the clinical trials included in this review is provided in Table 9. These end points are further summarized in the following section. A detailed discussion and critical appraisal of the outcome measures is provided in Appendix 4.
Table 8: Personalized Treatment-Interval Algorithm (Week 60 to Week 108) in the TENAYA and LUCERNE Studies
Dosing interval adjustments (starting at week 60) | Criteria |
|---|---|
Interval extended by 4 weeks (to a maximum of every 16 weeks) | All of the following criteria had to be met:
|
Interval reduced (to a minimum of every 8 weeks) | If 1 of the following criteria was met, the interval was reduced by 4 weeks. If 2 or more of the following criteria were met or 1 criterion included new macular hemorrhage, the interval was reduced to an 8-week interval.
|
Interval maintained | If extension or reduction criteria were not met |
BCVA = best corrected visual acuity; CST = central subfield thickness; ETRDS = Early Treatment Diabetic Retinopathy Study.
aWhere stability is defined as a change of CST of less than 30 µm.
bChange in BCVA should be attributable to nAMD disease activity (as determined by investigator).
cRefers to macular hemorrhage owing to nAMD activity (as determined by investigator).
Note: Patients whose treatment interval is reduced by 8 weeks from every 16 weeks to every 8 weeks will not be allowed to return to a every 16 weeks interval during the study.
Source: TENAYA Study Protocol2 and LUCERNE Study Protocol.2
Table 9: Summary of Outcomes of Interest Identified in the CADTH Review Protocol
Outcome measure | TENAYA | LUCERNE | Outcomes in the TENAYA and LUCERNE studies |
|---|---|---|---|
Change from baseline in visual acuity | Primary |
| |
Secondary |
| ||
Frequency of Injection | Secondary |
| |
Health-related quality of life | Extrapolatory |
| |
Vision-related function (e.g., NEI VFQ-25) | — | ||
Blindness (legal) | Secondary |
| |
Change in CRT | Secondary |
| |
Exploratory |
| ||
SRF, IRF, or PED | Secondary |
| |
AEs, SAEs, WDAEs, and mortality | Secondary |
| |
AE = adverse event; BCVA = best corrected visual acuity; CRT = central retinal thickness; CST = central subfield thickness; ETRDS = Early Treatment Diabetic Retinopathy Study; ILM = internal limiting membrane; IRF = intraretinal fluid; NEI VFQ-25 = National Eye Institute Visual Functioning Questionnaire 25; PED = pigment epithelial detachment; q.8.w. = every 8 weeks; q.12.w. = every 12 weeks; q.16.w. = every 16 weeks; RPE = retinal pigment epithelium; SAE = serious adverse event; withdrawal due to adverse event.
Source: TENAYA Clinical Study Report9 and LUCERNE Clinical Study Report.10
Efficacy Outcomes
Change From Baseline in Visual Acuity
The change from baseline in BCVA (ETDRS letters) averaged over weeks 40, 44, and 48 was the primary end point in both studies. Secondary end points of visual acuity change included: proportion of patients gaining greater than or equal to 15, 10, 5, or 0 ETDRS letters in BCVA from baseline; and proportion of patients avoiding loss of greater than or equal to 15, 10, or 5 ETDRS letters in BCVA from baseline, all of which were reported as an average over weeks 40, 44, and 48. These outcomes were also assessed over time (i.e., at all assessment time points through week 48).
The BCVA score was measured based on the ETDRS visual acuity chart assessed at a starting distance of 4 m. ETDRS charts consist of 70 letters that are distributed across 14 rows. Each row contains 5 uniformly spaced characters of the same size. The level of difficulty increases between successive rows as the size of characters decreases. The BCVA score corresponds to the number of letters an individual can read from the ETDRS chart. The higher the BCVA score the better the visual acuity.17 Clinical trials supporting regulatory approval of previous anti-VEGF treatments for nAMD had the proportion of patients with a loss of fewer than 15 letters on the ETDRS charts (considered to be vision maintenance) as the primary end point.18,19
Frequency of Injection
The mean number of injections received in the study eye through week 48, as well as the proportion of patients in the faricimab arm on an 8-, 12- or 16-week treatment interval among patients completing weeks 20 and 24, and week 48, were secondary outcomes of the studies.
Health-Related Quality of Life and Vision-Related Function
Both studies measured the change from baseline in NEI VFQ-25 composite scores over time as an exploratory end point. The NEI VFQ-25 measures vision-targeted quality of life and was administered by the interviewer in both studies. The questionnaire consisted of 25 items relevant to 11 vision-related constructs, as well as a single-item, general-health component. The overall composite score ranges between 0 to 100, with 0 representing worst vision-related function and 100 representing best vision-related function. A 15-letter change in visual acuity in the study eye (typically the worse-seeing eye) corresponds to a change of 3.90 to 4.34 points in the composite score.20 For the better-seeing eye, the clinically relevant difference for the NEI VFQ-25 composite score based on a 3-line change is 7.35 to 8.18 points.20
Blindness (Legal)
Legal blindness is defined as a BCVA of 20/200 or less measured with a Snellen chart.21 The proportion of patients with a BCVA Snellen equivalent of 20/200 (BCVA ETDRS ≤ 38 letters) or worse averaged over weeks 40, 44, and 48, and over time was measured in both studies.
Change in Central Retinal Thickness
The change from baseline in CST (ILM-RPE) averaged over weeks 40, 44, and 48 was a secondary outcome in both studies. The change from baseline in CST (ILM-RPE) over time (up to week 48) was also reported as a secondary outcome. This outcome was measured based on the distance between the ILM and RPE, whereas the change from baseline in CST (ILM-BM) over time, as measured by the distance between the ILM and Bruch’s membrane (BM), was an exploratory outcome of the studies. A reduction in CST is considered a favourable outcome in the treatment of nAMD; however, a minimal important difference has not been established.
Subretinal Fluid, IRF, and Pigment Epithelial Detachment
The proportions of patients with an absence of IRF, SRF, or PED over time (through week 48) were measured as secondary end points. The presence of IRF, SRF, and PED specifically in the central subfield (within 1 mm diameter centre of macular) were of interest. Both IRF and SRF are indicators of active disease that are routinely measured in clinical practice to evaluate clinical responses, according to the clinical expert consulted by CADTH. An absence of IRF has been shown to be associated with a better prognosis in nAMD,22-24 while the prognostic values of SRF and PED have not been established.
Harms Outcomes
The safety analysis included AEs (ocular and non-ocular), SAEs (ocular and non-ocular), and AEs of special interest (infection transmitted by study drug and sight-threatening AE) that occurred through week 48. The occurrence of AEs was assessed at all assessment time points.
Statistical Analysis
Noninferiority Margin
In the TENAYA and LUCERNE studies, a noninferiority margin of 4 ETDRS letters was used in the primary outcome analysis, in which noninferiority would be demonstrated in the lower limit of the 95% CI of the difference in change in BCVA from baseline between the 2 treatment groups was greater than −4 ETDRS letters. The noninferiority margin of 4 ETDRS letters was determined based on data from nAMD studies comparing ranibizumab with a sham control (the MARINA study), verteporfin photodynamic therapy (the ANCHOR study), and aflibercept (the VIEW1 and VIEW2 studies). In the MARINA study, a noninferiority margin of 4 preserved about 70% of the least estimated benefit of ranibizumab over sham. The investigators also considered a loss of 5 letters (1 ETDRS line) between treatments to be generally clinically relevant, and therefore inferred that the noninferiority margin was fewer than 5 ETDRS letters.
Sample-Size Calculation
A sample-size calculation determined that 320 patients per treatment arm was required to demonstrate noninferiority between faricimab and aflibercept with respect to the change in BCVA from baseline averaged over weeks 40, 44, and 48 at an 1-sided significance level of 0.025 with a power of 90% using a 2-sample t-test, assuming a noninferiority margin of 4 ETDRS letters, equal efficacy between faricimab and aflibercept, an SD of ETDRS 14 letters, and a 10% dropout rate.
Statistical Analysis for Efficacy Outcomes
The primary outcome was change from baseline in BCVA averaged over weeks 40, 44, and 48. The primary analysis was based on the ITT population and performed using an MMRM, which included the change from baseline at weeks 4 to 48 as the response variable and was adjusted for treatment group, visit, visit-by-treatment group interaction, baseline BCVA (continuous), and stratification factors (baseline BCVA [≥ 74 ETDRS letters, 73 to 55 letters, and ≤ 54 letters], baseline LLD < 33 ETDRS letters and ≥ 33 letters], and region [US and Canada, Asia, and the rest of the world]), assuming an unstructured covariance structure. In the primary estimand, ICEs due to COVID-19 (study drug discontinuation, use of prohibited therapy, missed dose, and death) were handled using a hypothetical strategy in which all values were censored after the ICE, while ICEs not due to COVID-19 (study drug discontinuation due to AEs or lack of efficacy and use of prohibited therapy) were handled with a treatment policy strategy in which all observed values were used regardless of the occurrence of the ICE. Missing data for continuous outcomes were implicitly imputed by the MMRM model based on the assumption that data were missing at random (MAR). Missing data for categorical outcomes were not imputed.
Pre-specified subgroup analyses were conducted with respect to the primary outcome. The baseline BCVA subgroup (≥ 74 ETDRS letters, 73 to 55 ETDRS letters, and ≤ 54 ETDRS letters) was relevant to this review. No statistical testing was performed for treatment-by-subgroup interactions.
A pre-specified sensitivity analysis was performed using the same estimand and analysis method as the primary analysis, with the exception that a last observation carried forward imputation approach was used to account for missing BCVA data, as well as BCVA assessments that were censored after COVID-19–related ICEs. Six supplementary analyses using the per-protocol population, a multiple imputation method, and different analysis methods (analysis of covariance and trimmed mean) and strategies for handling ICEs (treatment policy strategy only and hypothetical strategy only) were performed to further evaluate the robustness of the evidence from the primary analysis. A summary of the statistical analyses of efficacy end points in both studies is shown in Table 10.
The analysis for secondary outcomes assessed data in the ITT population through week 48. Continuous secondary end points of interest in this review were analyzed using the same approach as the primary analysis. Binary secondary end points that assessed the proportion of patients in each treatment group and the difference in proportions between treatment groups were calculated by applying Cochran-Mantel-Haenszel (CMH) weights, stratified by baseline BCVA (≥ 74 letters, 73 to 55 letters, and ≤ 54 letters), baseline LLD (< 33 letters and ≥ 33 letters), and region (US and Canada, Asia, and the rest of the world). Change from baseline in NEI VFQ-25 composite scores over time (through week 48), an exploratory outcome, was analyzed using descriptive statistics (mean, SD, median, and range).
No adjustments were made for multiplicity for secondary end points and subgroup analyses.
Statistical Analysis for Harms Outcomes
The safety analysis was based on AEs recorded through week 48 and were summarized using descriptive statistics.
Table 10: Statistical Analysis of Efficacy End Points in the TENAYA and LUCERNE Studies
End point | Statistical model | Adjustment factors | Sensitivity analyses |
|---|---|---|---|
Change from baseline in BCVA averaged over weeks 40, 44, and 48 | MMRM for ITT population | Adjusted for treatment group, visit, visit-by-treatment group interaction, baseline BCVA (continuous), and stratification factors (baseline BCVA [≥ 74 ETDRS letters, 73 to 55 ETDRS letters, and ≤ 54 ETDRS letters], baseline LLD [< 33 ETDRS letters and ≥ 33 ETDRS letters], and region [US and Canada, Asia, and the rest of the world]) | MMRM (LOCF) |
Change from baseline in BCVA over time | MMRM for ITT population | Adjusted for treatment group, visit, visit-by-treatment group interaction, baseline BCVA (continuous), and stratification factors (baseline BCVA, baseline LLD, and region) | MMRM (LOCF) |
Proportion of patients gaining ≥ 15, ≥ 10, ≥ 5, or ≥ 0 ETDRS letters in BCVA from baseline averaged over weeks 40, 44, and 48, and over time | CMH for ITT population | Stratified by baseline BCVA, baseline LLD, and region | Not performed |
Proportion of patients avoiding loss of ≥ 15, ≥ 10, or ≥ 5 ETDRS letters in BCVA from baseline averaged over weeks 40, 44, and 48, and over time | CMH for ITT population | Stratified by baseline BCVA, baseline LLD, and region | Not performed |
Number of injections received in the study eye over time through week 48 | Descriptive statistics (mean, SD, median, and range) | NA | Not performed |
Proportion of patients in the faricimab arm on an 8-, 12-, or 16-week treatment interval | CMH for ITT population | Stratified by baseline BCVA, baseline LLD, and region | Not performed |
Change from baseline in NEI VFQ-25 composite score over time | Descriptive statistics (mean, SD, median, and range) | NA | Not performed |
Proportion of patients with BCVA Snellen equivalent of 20/200 (BCVA ETDRS ≤ 38 letters) or worse averaged over weeks 40, 44, and 48, and over time | CMH for ITT population | Stratified by baseline BCVA, baseline LLD, and region | Not performed |
Change from baseline in central CST (ILM-RPE) based on an average at weeks 40, 44, and 48, and over time | MMRM for ITT population | Adjusted for treatment group, visit, visit-by-treatment group interaction, baseline CST (continuous), and stratification factors (baseline BCVA, baseline LLD, and region) | Not performed |
Change from baseline in CST (ILM-BM) based on an average at weeks 40, 44, and 48, and over time | MMRM for ITT population | Adjusted for treatment group, visit, visit-by-treatment group interaction, baseline BCVA (continuous), and stratification factors (baseline BCVA, baseline LLD, and region) | Not performed |
Proportion of patients with absence of:
| CMH for ITT population | Stratified by baseline BCVA, baseline LLD, and region | Not performed |
BCVA = best corrected visual acuity; CMH = Cochran-Mantel-Haenszel; CST = central subfield thickness; ETRDS = Early Treatment Diabetic Retinopathy Study; ILM = internal limiting membrane; ITT = intention-to-treat; LLD = low luminance deficit; LOCF = last observation carried forward; MMRM = mixed model for repeated measures; NA = not applicable; NEI VFQ-25; RPE = retinal pigment epithelium; SD = standard deviation.
Source: TENAYA Clinical Study Report9 and LUCERNE Clinical Study Report.10
Analysis Populations
Results are reported for the following populations in the TENAYA and LUCERNE studies:
ITT: All patients who were randomized in the study were included. Patients were assessed according to the treatment assigned at randomization. This analysis population served as the primary analysis set for all efficacy analyses.
Per-protocol: All patients randomized in the study who received at least 1 dose of study treatment and who did not have a major protocol violation that affected the efficacy evaluation or the treatment-interval determination were included. Patients were assessed according to the actual treatment received. This analysis population was used for supplementary analysis for the primary efficacy end point.
Safety-evaluable population: All patients who received at least 1 injection of either faricimab or aflibercept in the study eye were included. Patients were assessed according to the actual treatment received. This analysis population was used for safety analyses.
For this review, noninferiority will be assessed using the results from both the ITT and per-protocol analyses.
Results
Patient Disposition
A summary of patient disposition is shown in Table 11.
Of 989 screened patients in the TENAYA study, 671 patients were randomized: 334 patients (49.7%) and 361 patients (50.1%) to the faricimab and aflibercept arms, respectively. In the LUCERNE study, of 1,012 screened patients, 658 patients were randomized; 331 patients (50.3%) and 327 patients (49.7%) to the faricimab arm and aflibercept arm, respectively.
In the TENAYA study, the proportions of patients who discontinued the study before week 48 were comparable between treatment arms (4.5% in faricimab arm versus 4.2% in aflibercept arm), while in the LUCERNE study, the proportion was numerically higher in the aflibercept arm (5.5%) than in the faricimab arm (3.0%). The proportion of patients who discontinued study treatment before week 48 was numerically higher in the faricimab arm (7.8%) than in the aflibercept arm (4.5%) in the TENAYA study, while in the LUCERNE study, the proportions were similar in both arms. Withdrawal by patient was the most frequently reported reason for study discontinuation and study treatment discontinuation in both studies.
Disposition | TENAYA | LUCERNE | ||
|---|---|---|---|---|
Faricimab | Aflibercept | Faricimab | Aflibercept | |
Screened, n | 989 | 1,012 | ||
Randomized, n (%) | 334 (49.8) | 337 (50.2) | 331 (50.3) | 327(49.7) |
Treated, n (%) | 333 (99.7) | 336 (99.7) | 331 (100) | 326 (99.7) |
Discontinued the study before week 48, n (%) | 15 (4.5) | 14 (4.2) | 10 (3.0) | 18 (5.5) |
Adverse events | 0 (0) | 3 (0.9) | 2 (0.6) | 0 (0) |
Death | 4 (1.2) | 1 (0.3) | 2 (0.6) | 5 (1.5) |
Lost to follow-up | 2 (0.6) | 3 (0.9) | 0 (0) | 1 (0.3) |
Protocol deviation | 0 (0) | 0 (0) | 1 (0.3) | 1 (0.3) |
Withdrawal by patient | 7 (2.1) | 6 (1.8) | 5 (1.5) | 8 (2.4) |
Physician decision | 2 (0.6) | 1 (0.3) | 0 (0) | 2 (0.6) |
Other | 0 (0) | 0 (0) | 0 (0) | 1 (0.3) |
Discontinued the study treatment before week 48, n (%) | 26 (7.8) | 15 (4.5) | 18 (5.4) | 22 (6.7) |
Adverse events | 2 (0.6) | 3 (0.9) | 7 (2.1) | 1 (0.3) |
Death | 4 (1.2) | 1 (0.3) | 2 (0.6) | 5 (1.5) |
Lack of efficacy | 1 (0.3) | 0 (0) | 0 (0) | 2 (0.6) |
Lost to follow-up | 4 (1.2) | 3 (0.9) | 1 (0.3) | 1 (0.3) |
Protocol deviation | 1 (0.3) | 0 (0) | 1 (0.3) | 1 (0.3) |
Withdrawal by patient | 10 (3.0) | 8 (2.4) | 6 (1.8) | 8 (2.5) |
Physician decision | 2 (0.6) | 0 (0) | 0 (0) | 4 (1.2) |
Other | 2 (0.6) | 0 (0) | 1 (0.3) | 0 (0) |
Intention-to-treat, n | 334 (100) | 337 (100) | 331 (100) | 327 (100) |
Per-protocol, n | 284 (85.0) | 295 (87.5) | 286 (86.4) | 291 (90.0) |
Safety-evaluable population, n | 333 (99.7) | 336 (99.7) | 331 (100) | 326 (99.7) |
Source: TENAYA Clinical Study Report9 and LUCERNE Clinical Study Report.10
Exposure to Study Treatments
The mean duration of exposure was similar between treatment arms in both studies, ranging from 46.0 weeks to 46.4 weeks. The mean number of injections, and the proportion of faricimab-treated patients who were on an injection interval of 8, 12, or 16 weeks at week 48 were secondary efficacy outcomes of the studies. Table 13 provides additional details on frequency of injections.
Efficacy
Only those efficacy outcomes and analyses of subgroups identified in the review protocol are reported below. Appendix 3 provides detailed efficacy data.
Change From Baseline in Visual Acuity
Change From Baseline in BCVA (Primary End Point)
The change from baseline in BCVA averaged over weeks 40, 44, and 48 was the primary outcome in both studies. The mean differences between the faricimab and aflibercept arms were 0.7 ETDRS letters (95% CI, −1.1 to 2.5) in the TENAYA study and 0.0 ETDRS letters (95% CI, −1.7 to 1.8) in the LUCERNE study (Table 12), both of which met the primary end point of noninferiority. A supplementary analysis in the per-protocol population found that the results aligned with those of the ITT analysis. The results of a sensitivity analysis and other supplementary analyses were also consistent with those of the primary analysis (Table 41).
A pre-specified subgroup analysis based on baseline BCVA suggested a similar mean change in visual acuity from baseline averaged over weeks 40, 44, and 48 between the faricimab and aflibercept arms in all subgroups of baseline BCVA (≥ 74 ETDRS letters, 73 to 55 ETDRS letters, and ≤ 54 ETDRS letters), as outlined in Table 42 in Appendix 3.
Proportion of Patients Who Gained 15 or More ETDRS Letters in BCVA From Baseline
The between-group differences in the proportions of patients who gained 15 or more ETDRS letters in BCVA from baseline over weeks 40, 44, and 48 with faricimab versus aflibercept were 4.3% (95% CI, −1.6% to 10.1%) in the TENAYA study and −2.0% (95% CI, −8.3% to 4.3%) in the LUCERNE study (Table 12).
Proportion of Patients who Avoided Losing 15 or More ETDRS Letters in BCVA From Baseline
The between-group differences in the proportions of patients who avoided losing 15 or more ETDRS letters in BCVA from baseline over weeks 40, 44, and 48 with faricimab versus aflibercept were 1.3% (95% CI, −2.2% to 4.8%) in the TENAYA study and −1.5% (95% CI, −4.4% to 1.3%) in the LUCERNE study (Table 12).
Other BCVA Outcomes
Other secondary outcomes of visual acuity change including the proportion of patients who gained 10 or more, 5 or more, or 0 or more ETDRS letters in BCVA; and the proportion of patients who avoided losing 10 or more, or 5 or more ETDRS letters in BCVA from baseline averaged over weeks 40, 44, 48, were generally comparable between treatment arms (Table 12).
Table 12: BCVA Outcomes Averaged Over Weeks 40, 44, and 48
Outcomes | TENAYA | LUCERNE | ||
|---|---|---|---|---|
Faricimab (N = 334) | Aflibercept (N = 337) | Faricimab (N = 331) | Aflibercept (N = 327) | |
Change from baseline in BCVA (ETDRS letters) averaged over weeks 40, 44 and 48 (MMRM [primary estimand]) | ||||
Primary analysis — ITT population | ||||
Patients contributing to analysis, n (%) | 292 (87.4) | 300 (89.0) | 302 (91.2) | 291 (89.0) |
Change in letters from baseline, meana (SE) | 5.8 (0.64) | 5.1 (0.64) | 6.6 (0.64) | 6.6 (0.64) |
Difference in mean number of lettersa (95% CI) | 0.7 (−1.1 to 2.5) | Reference | 0.0 (−1.7 to 1.8) | Reference |
Supplementary analysis — per-protocol population | ||||
Patients contributing to analysis, n (%) | 272 (81.4) | 284 (84.3) | 280 | 279 |
Change from baseline mean, number of lettersa (SE) | 5.9 (0.69) | 5.6 (0.68) | 6.6 (0.68) | 6.7 (0.68) |
Difference in mean number of lettersa (95% CI) | 0.3 (−1.6 to 2.2) | Reference | −0.1 (−2.0 to 1.8) | Reference |
Proportion of patients gaining ≥ 15, ≥ 10, ≥ 5, or ≥ 0 ETDRS letters in BCVA from baseline averaged over weeks 40, 44 and 48 (ITT population — CMH) | ||||
Patients contributing to analysis, n (%) | 292 (87.4) | 300 (89.0) | 302 (91.2) | 291 (89.0) |
≥ 15 letters gained, n (%b) | 58 (20.0) | 48 (15.7) | 60 (20.2) | 65 (22.2) |
Difference in proportions,b % (95% CI) | 4.3 (−1.6 to 10.1) | Reference | −2.0 (−8.3 to 4.3) | Reference |
≥ 10 letters gained, n (%b) | 108 (37.1) | 96 (31.7) | 117 (39.2) | 104 (35.8) |
Difference in proportions,b % (95% CI) | 5.4 (−2.0 to 12.7) | Reference | 3.4 (−3.9 to 10.7) | Reference |
≥ 5 letters gained, n (%b) | 172 (59.2) | 175 (58.0) | 182 (60.5) | 173 (59.4) |
Difference in proportions,b % (95% CI) | 1.2 (−6.6 to 8.9) | Reference | 1.0 (−6.6 to 8.6) | Reference |
≥ 0 letters gained, n (%b) | 219 (75.6) | 231 (76.8) | 248 (82.2) | 229 (79.1) |
Difference in proportions,b % (95% CI) | −1.2 (−7.9 to 5.4) | Reference | 3.1 (−3.1 to 9.3) | Reference |
Proportion of patients avoiding a loss of ≥ 15, ≥ 10, or ≥ 5 ETDRS letter in BCVA from baseline averaged over weeks 40, 44 and 48 (ITT population — CMH) | ||||
Patients contributing to analysis, n (%) | 292 (87.4) | 300 (89.0) | 302 (91.2) | 291 (89.0) |
Avoid ≥ 15 letters loss, n (%b) | 278 (95.4) | 283 (94.1) | 289 (95.8) | 283 (97.3) |
Difference in proportions,b % (95% CI) | 1.3 (−2.2 to 4.8) | Reference | −1.5 (−4.4 to 1.3) | Reference |
Avoid ≥ 10 letters lost, n (%b) | 267 (91.6) | 277 (92.0) | 283 (93.8) | 275 (94.6) |
Difference in proportions,b % (95% CI) | −0.4 (−4.6 to 3.9) | Reference | −0.9 (−4.5 to 2.8) | Reference |
Avoid ≥ 5 letters lost, n (%b) | 256 (88) | 261 (86.8) | 275 (91.2) | 257 (88.5) |
Difference in proportions,b % (95% CI) | 1.2 (−4.0 to 6.4) | Reference | 2.6 (−2.1 to 7.3) | Reference |
BCVA = best corrected visual acuity; CI = confidence interval; CMH = Cochran-Mantel-Haenszel; ETDRS = Early Treatment Diabetic Retinopathy Study; ITT = intention-to-treat; LLD = low luminance deficit; MMRM = mixed model for repeated measures; SE = standard error.
aAdjusted mean. The primary end point was analyzed using an MMRM, with the change from baseline in BCVA as the dependent variable, considering all available observations of BCVA score at all visits. The model was adjusted for treatment group, visit, visit-by-treatment group interaction, baseline BCVA (continuous), baseline BCVA (≥ 74 letters, 73 to 55 letters, and ≤ 54 letters), baseline LLD (< 33 letters and ≥ 33 letters), and region (US and Canada, Asia, and the rest of the world).
bCMH-weighted estimate. The observed proportions and the differences in observed proportions were obtained by applying the CMH weight, stratified by baseline BCVA score (≥ 74 letters, 73 to 55 letters, and ≤ 54 letters), LLD (< 33 letters and ≥ 33 letters), and region (US and Canada, Asia, and the rest of the world).
Source: TENAYA Clinical Study Report9 and LUCERNE Clinical Study Report.10
Frequency of Injection
In the TENAYA study, the mean number of treatment injections given through week 48, a secondary outcome, was 6.9 (SD = 0.63) in the faricimab arm and 7.8 (SD = 0.45) in the aflibercept arm. In the LUCERNE study, the mean number of treatment injections given through week 48 was 7.0 (SD = 0.53) in the faricimab arm and 7.9 (SD = 0.32) in the aflibercept arm.
In the TENAYA study, the proportions of patients in the faricimab arm on an 8-, 12-, or 16-week interval at week 48, a secondary outcome, were 20.3%, 34.0%, and 45.7% respectively, while in the LUCERNE study, the respective proportions were 22.2%, 32.9%, and 44.9% (Table 13).
Between-group analyses were not reported in either study.
Health-Related Quality of Life and Vision-Related Function
The change from baseline in NEI VFQ-25 composite scores was an exploratory outcome and no between-group comparisons were reported. As summarized in Table 14 at weeks 24 and 48, the mean composite scores were increased from baseline in both treatment groups in both studies.
Blindness (Legal)
The difference between treatment groups in the proportion of patients who progressed to legal blindness (BCVA Snellen equivalent of 20/200 or worse [BCVA ETDRS less than or equal to 38 letters] averaged over weeks 40, 44 and 48) (Table 15) was −0.5% (95% CI, −4.2% to 3.3%) in the TENAYA study, and 0.4% (95% CI, −3.6% to 4.4%) in the LUCERNE study.
Change in Central Retinal Thickness
The mean change from baseline in CST (ILM-RPE) was a secondary outcome, while the mean change from baseline in CST (ILM-BM) was an exploratory outcome.
As outlined in Table 16, the difference between treatment groups in the mean change from baseline in CST (ILM-RPE) averaged over weeks 40, 44, and 48 was −7.4 µm (95% CI, −15.7 to 0.8) in the TENAYA study and −6.4 µm (95% CI, −14.8 to 2.1) in the LUCERNE study. The differences between treatment groups in the mean change from baseline in CST (ILM-BM) averaged over weeks 40, 44, and 48 were −9.7 µm (95% CI, −22.7 to 3.4) and −6.9 µm (95% CI, −21.1 to 7.4) in the TENAYA and LUCERNE studies, respectively.
Subretinal Fluid, IRF, and Pigment Epithelial Detachment
The proportions of patients with absence of IRF, SRF, and PED were secondary outcomes of the studies (Table 17).
In the TENAYA study, the differences between treatment groups in the proportion of patients with absence of IRF at weeks 40, 44, and 48 between-treatment groups were 4.9% (95% CI, −1.5% to 11.3%), −9.5% (95% CI, −15.9% to −3%), and 8.7% (95% CI, 1.0% to 14.4%) respectively, while in the LUCERNE study, the differences between treatments groups were 7.0% (95% CI, 0.6% to 13.3%), −6.0% (95% CI, −12.4% to 0.4%), and 6.4% (95% CI, −0.0% to 12.9%), respectively.
In the TENAYA study, the differences between treatment groups in the proportions of patients with absence of SRF at weeks 40, 44, and 48 between-treatment groups were 11.2% (95% CI, 4.1% to 18.3%), −8.4% (95% CI, −15.6% to −1.2%), and 10.0% (95% CI, 2.6% to 17.3%) respectively, while in the LUCERNE study, the differences in proportions between treatment groups were 13.3% (95% CI, 6.1% to 20.6%), −10.7% (95% CI, −18.0% to 3.4%), and 10.4% (95% CI, 2.9% to 17.9%) respectively.
In the TENAYA study, the differences between treatment groups in the proportion of patients with absence of PED at weeks 40, 44 and 48 between-treatment groups were −1.8% (95% CI, −6.3% to 2.8%), −5.2% (95% CI, −9.2% to −1.2%), and −4.6% (95% CI, −8.3% to −1.0%) respectively, while in the LUCERNE study, the differences between treatment groups were −1.1% (95% CI, −5.3% to 3.0%), −5.0% (95% CI, −8.9% to −1.0%), and −3.2% (95% CI, −6.7% to 0.2%), respectively.
Table 13: Frequency of Injection Outcomes (Intention-to-Treat Population)
Outcomes | TENAYA | LUCERNE | ||
|---|---|---|---|---|
Faricimab (N = 334) | Aflibercept (N = 337) | Faricimab (N = 331) | Aflibercept (N = 327) | |
Number of treatment injections given through week 48 | ||||
Patients contributing to analysis, n (%) | 83 (24.8) | 249 (73.9) | 104 (31.4) | 254 (77.7) |
Injections, n (SD) | 6.9 (0.63) | 7.8 (0.45) | 7.0 (0.53) | 7.9 (0.32) |
Proportion of patients in the faricimab arm on an 8-, 12, or 16-week injection interval at weeks 20, 24, and 48 | ||||
Weeks 20 and 24 | ||||
Patients contributing to analysis, n (%) | 325 (97.3) | — | 326 (98.5) | — |
q.8.w. proportion, % (95% CI) | 20.9 (16.5 to 25.4) | — | 23.0 (18.4 to 27.6) | — |
q.12.w. proportion, % (95% CI) | 33.5 (28.4 to 38.7) | — | 33.7 (28.6 to 38.9) | — |
q.16.w. proportion, % (95% CI) | 45.5 (40.1 to 51.0) | — | 43.3 (37.9 to 48.6) | — |
Week 48 | ||||
Patients contributing to analysis, n (%) | 315 (94.3) | — | 316 (95.5) | — |
q.8.w. proportion, % (95% CI) | 20.3 (15.9 to 24.8) | — | 22.2 (17.6 to 26.7) | — |
q.12.w. proportion, % (95% CI) | 34.0 (28.7 to 39.2) | — | 32.9 (27.7 to 38.1) | — |
q.16.w. proportion, % (95% CI) | 45.7 (40.2 to 51.2) | — | 44.9 (39.4 to 50.4) | — |
CI = confidence interval; q.8.w. = every 8 weeks; q.12.w. = every 12 weeks; q.16.w. = every 16 weeks.
Source: TENAYA Clinical Study Report9 and LUCERNE Clinical Study Report10
Table 14: Change from Baseline in NEI VFQ-25 Composite Score Over Time (ITT Population)
Study detail | TENAYA | LUCERNE | ||
|---|---|---|---|---|
Faricimab (N = 334) | Aflibercept (N = 337) | Faricimab (N = 331) | Aflibercept (N = 327) | |
Week 24 | ||||
Patients contributing to analysis, n (%) | 286 (85.6) | 295 (87.5) | 301 (90.9) | 283 (86.5) |
Baseline NEI VFQ-25, points (SD) | 78.47 (15.36) | 80.33 (14.84) | 76.67 (16.22) | 77.71 (15.42) |
Change from baseline, mean points (SD) | 4.10 (9.58) | 3.10 (9.93) | 3.76 (10.17) | 4.07 (11.56) |
Week 48 | ||||
Patients contributing to analysis, n (%) | 272 (81.4) | 277 (82.8) | 276 (82.8) | 273 (83.5) |
Baseline NEI VFQ-25, mean points (SD) | 78.47 (15.36) | 80.33 (14.84) | 76.67 (16.22) | 77.71 (15.42) |
Change from baseline, mean points (SD) | 4.82 (10.81) | 2.54 (10.93) | 4.35 (10.65) | 5.55 (11.17) |
ITT = intention-to-treat; NEI VFQ-25 = National Eye Institute Visual Functioning Questionnaire 25; SD = standard deviation.
Source: TENAYA Clinical Study Report9 and LUCERNE Clinical Study Report.10
Table 15: Proportion of Patients With BCVA Snellen Equivalent of 20/200 (38 or Fewer BCVA ETDRS Letters) or Worse Averaged Over Weeks 40, 44 and 48 (ITT Population — CMH)
Study detail | TENAYA | LUCERNE | ||
|---|---|---|---|---|
Faricimab (N = 334) | Aflibercept (N = 337) | Faricimab (N = 331) | Aflibercept (N = 327) | |
Number of patients contributing to the analysis (%) | 292 (87.4) | 300 (89.0) | 302 (91.2) | 291 (89.0) |
Snellen equivalent of 20/200 or worse (ETDRS ≤ 38 letters), N (%a) | 19 (6.4) | 21 (7.0) | 23 (7.9) | 23 (7.5) |
Difference in proportions, %a (95% CI) | −0.5 (−4.2 to 3.3) | Reference | 0.4 (−3.6 to 4.4) | Reference |
BCVA = best corrected visual acuity; CI = confidence interval; CMH = Cochran-Mantel-Haenszel; ETRDS = Early Treatment Diabetic Retinopathy Study; ITT = intention-to-treat; LLD = low luminance deficit.
aCMH-weighted estimate. The observed proportions and the differences in observed proportions were obtained by applying Cochran-Mantel-Haenszel weight, stratified by baseline BCVA score (≥ 74 letters, 73 to 55 letters, and ≤ 54 letters), LLD (< 33 letters and ≥ 33 letters), and region (US and Canada, Asia, and the rest of the world)
Source: TENAYA Clinical Study Report9 and LUCERNE Clinical Study Report.10
Table 16: Change From Baseline in CST (ILM-RPE) and CST (ILM-BM) Averaged Over Weeks 40, 44, and 48 (ITT Population — MMRM)
Study detail | TENAYA | LUCERNE | ||
|---|---|---|---|---|
Faricimab (N = 334) | Aflibercept (N = 337) | Faricimab (N = 331) | Aflibercept (N = 327) | |
CST (ILM-RPE) | ||||
Patients contributing to analysis, n (%) | 291 (87.1) | 297 (88.1) | 299 (90.3) | 287 (87.8) |
Change from baseline in CST (ILM-RPE) in µm, meana (SE) | −136.8 (2.97) | −129.4 (2.96) | −137.1 (3.02) | −130.8 (3.05) |
Difference in means,a µm (95% CI) | −7.4 (−15.7 to 0.8) | Reference | −6.4 (−14.8 to 2.1) | Reference |
CST (ILM-BM) | ||||
Patients contributing to analysis, n (%) | 290 (86.8) | 298 (88.4) | 300 (90.6) | 289 (88.4) |
Change from baseline in CST (ILM-BM) in µm, meana (SD) | −175.9 (4.71) | −166.2 (4.69) | −179.7 (5.09) | −172.9 (5.13) |
Difference in means,a µm (95% CI) | −9.7 (−22.7 to 3.4) | Reference | −6.9 (−21.1 to 7.4) | Reference |
BM = Bruch’s membrane; CI = confidence interval; CST = central subfield thickness; ILM = internal limiting membrane; ITT = intention-to-treat; LLD = low luminance deficit; MMRM = mixed model for repeated measures; RPE = retinal pigment epithelium; SD = standard deviation; SE = standard error.
aAdjusted mean. This secondary end point was analyzed using an MMRM, with the change from baseline in CST as the dependent variable, considering all available observations of BCVA score at all visits. The model was adjusted for treatment group, visit, visit- by-treatment-group interaction, baseline CST (continuous), baseline BCVA score (≥ 74 letters, 73 to 55 letters, and ≤ 54 letters), LLD (< 33 letters and ≥ 33 letters), and region (US and Canada, Asia, and the rest of the world).
Source: TENAYA Clinical Study Report9 and LUCERNE Clinical Study Report.10
Table 17: Proportion of Patients With Absence of Intraretinal Fluid, Subretinal Fluid, or Pigment Epithelial Pigment Over Time (Intention-to-Treat Population — CMH)
Study details | TENAYA | LUCERNE | ||
|---|---|---|---|---|
Faricimab (N = 334) | Aflibercept (N = 337) | Faricimab (N = 331) | Aflibercept (N = 327) | |
Proportion of patients with absence of intraretinal fluid (ITT population — CMH) | ||||
Week 40 | ||||
Patients contributing to analysis, n (%) | 276 (82.6) | 285 (84.6) | 277 (83.7) | 278 (85.0) |
IRF absent, n (%a) | 226 (82.1) | 220 (77.2) | 234 (84.5) | 215 (77.5) |
Difference in proportions,a % (95% CI) | 4.9 (−1.5 to 11.3) | Reference | 7.0 (0.6 to 13.3) | Reference |
Week 44 | ||||
Patients contributing to analysis, n (%) | 273 (81.7) | 264 (78.3) | 276 (83.4) | 257 (78.6) |
Intraretinal fluid absent, n (%a) | 206 (75.5) | 224 (84.9) | 216 (78.2) | 216 (84.2) |
Difference in proportions,a % (95% CI) | −9.5 (−15.9 to −3) | Reference | −6.0 (−12.4 to 0.4) | Reference |
Week 48 | ||||
Patients contributing to analysis, n (%) | 263 (78.7) | 267 (79.2) | 274 (82.8) | 269 (82.3) |
Intraretinal fluid absent, n (%a) | 215 (82.1) | 199 (74.4) | 231 (84.1) | 208 (77.7) |
Difference in proportions,a % (95% CI) | 7.7 (1.0 to 14.4) | Reference | 6.4 (−0.0 to 12.9) | Reference |
Proportion of patients with absence of subretinal fluid (ITT population — CMH) | ||||
Week 40 | ||||
Patients contributing to analysis, n (%) | 284 (85.0) | 288 (85.5) | 283 (85.5) | 285 (87.2) |
Subretinal fluid absent, n (%a) | 222 (78.5) | 194 (67.3) | 220 (77.6) | 184 (64.3) |
Difference in proportions,a % (95% CI) | 11.2 (4.1 to 18.3) | Reference | 13.3 (6.1 to 20.6) | Reference |
Week 44 | ||||
Patients contributing to analysis, n (%) | 277 (82.9) | 274 (81.3) | 281 (84.9) | 268 (82.0) |
Subretinal fluid absent, n (%a) | 192 (69.6) | 214 (78.0) | 185 (65.8) | 205 (76.4) |
Difference in proportions,a % (95% CI) | −8.4 (−15.6 to −1.2) | Reference | −10.7 (−18.0 to −3.4) | Reference |
Week 48 | ||||
Patients contributing to analysis, n (%) | 268 (80.2) | 279 (82.8) | 278 (84.0) | 274 (83.8) |
Subretinal fluid absent, n (%a) | 203 (75.7) | 184 (65.8) | 202 (72.5) | 171 (62.1) |
Difference in proportions,a % (95% CI) | 10.0 (2.6 to 17.3) | Reference | 10.4 (2.9 to 17.9) | Reference |
Proportion of patients with absence of PED (ITT population — CMH) | ||||
Week 40 | ||||
Patients contributing to analysis, n (%) | 284 (85.0) | 290 (86.1) | 284 (85.8) | 286 (87.5) |
Pigment epithelial detachment absent, n (%a) | 22 (7.8) | 28 (9.6) | 18 (6.3) | 21 (7.3) |
Difference in proportions,a % (95% CI) | −1.8 (−6.3 to 2.8) | Reference | −1.1 (−5.1 to 3.0) | Reference |
Week 44 | ||||
Patients contributing to analysis, n (%) | 277 (82.0) | 273 (81.0) | 283 (85.5) | 268 (82.0) |
Pigment epithelial detachment absent, n (%a) | 10 (3.6) | 24 (8.8) | 11 (3.9) | 24 (8.9) |
Difference in proportions,a % (95% CI) | −5.2 (−9.2 to −1.2) | Reference | −5.0 (−8.9 to V1.0) | Reference |
Week 48 | ||||
Patients contributing to analysis, n (%) | 269 (80.5) | 279 (82.8) | 280 (84.6) | 275 (84.1) |
Pigment epithelial detachment absent, n (%a) | 8 (3.0) | 21 (7.7) | 9 (3.3) | 18 (6.5) |
Difference in proportions,a % (95% CI) | −4.6 (−8.3 to −1.0) | Reference | −3.2 (−6.7 to 0.2) | Reference |
CI = confidence interval; CMH = Cochran-Mantel-Haenszel; ITT = intention-to-treat.
aCMH-weighted estimate. The observed proportions and the differences in observed proportions were obtained by applying Cochran-Mantel-Haenszel weight, stratified by baseline BCVA score (≥ 74 letters, 73 to 55 letters, and ≤ 54 letters), LLD (< 33 letters and ≤ 33 letters), and region (US and Canada, Asia, and the rest of the world).
Source: TENAYA Clinical Study Report9 and LUCERNE Clinical Study Report.10
Harms
Only those harms identified in the review protocol are reported in the following section. Table 18 provides detailed harms data.
Adverse Events
In the TENAYA study, the proportions of patients reporting at least 1 ocular AE were 36.3% in the faricimab arm and 38.1% in the aflibercept arm, while in the LUCERNE study, the proportions were 40.2% and 36.2%, respectively. The most common ocular AEs were conjunctival hemorrhage, worsening nAMD, and dry eye. The proportions of patients who reported at least 1 non-ocular AE in the TENAYA study were 52.3% in the faricimab arm and 51.8% in the aflibercept arm. In the LUCERNE study, the proportions were 52.0% and 58.0%, in the respective treatment arms. The most common non-ocular AE was nasopharyngitis (4.9% to 8.3%) and urinary tract infection (3.0% to 5.1%)
Serious Adverse Events
Ocular SAEs were infrequently reported in both trials. In the TENAYA study, 1.2% of patients in the faricimab arm and 1.8% of patients in the aflibercept arm reported ocular SAEs, while in the LUCERNE study, 2.1% of patients in both arms reported ocular SAEs. The most common ocular SAE was worsening nAMD. In the LUCERNE study, non-ocular serious AEs were reported in 11.5% of patients in the faricimab arm and 14.7% of patients in the aflibercept arm, in comparison to 9.0% in the faricimab arm and 10.1% in the aflibercept arm in the TENAYA study. Congestive cardiac failure (0.3% to 1.2%) was reportedly the most common non-ocular SAE in the trials.
Treatment Discontinuation Due to Adverse Events
In the TENAYA and LUCERNE studies, 0.9% and 2.5% of patients treated with faricimab discontinued treatment due to AEs, respectively. In the TENAYA and LUCERNE studies, 2.4% and 0.3% of patients treated with aflibercept discontinued treatment due to AEs, respectively. No specific AE was identified to account for the majority of treatment discontinuations.
Mortality
Six deaths occurred in the TENAYA study, 5 of which involved patients who received faricimab and 1 involved a patient who received aflibercept. Eleven deaths occurred in the LUCERNE study: 4 in the faricimab arm and 7 in the aflibercept arm. No specific AE was identified to account for the majority of deaths in either arm.
Notable Harms
One patient (0.3%) reported endophthalmitis in the aflibercept arm of the LUCERNE study and none in the faricimab arms of either study. There was no report of retinal vasculitis in either study. Intraocular inflammation was reported in 1.5% and 0.6% in the faricimab and aflibercept arms, respectively, of the TENAYA study; and 2.4% and 1.8% in the respective arms of the LUCERNE study. Vitreous floaters were reported in 3.9% and 2.1% in the faricimab and aflibercept arms, respectively, of the TENAYA study; and 2.1% and 1.2% in the respective arms of the LUCERNE study. Arterial thromboembolic events were reported in 0.9% to 1.2% of patients.
Table 18: Summary of Harms (Safety-Evaluable Population)
Harms | TENAYA | LUCERNE | ||
|---|---|---|---|---|
Faricimab (N = 333) | Aflibercept (N = 336) | Faricimab (N = 331) | Aflibercept (N = 326) | |
Patients with ≥ 1 ocular adverse event | ||||
n (%) | 121 (36.3) | 128 (38.1) | 133 (40.2) | 118 (36.2) |
Most common events,a n (%) | ||||
Conjunctival hemorrhage | 19 (5.7) | 22 (6.5) | 26 (7.9) | 29 (8.9) |
Neovascular age-related macular degenerationb | 14 (4.2) | 18 (5.4) | 24 (7.3) | 20 (6.1) |
Dry eye | 7 (2.1) | 14 (4.2) | 6 (1.8) | 8 (2.5) |
Vitreous detachment | 11 (3.3) | 10 (3.0) | 11 (3.3) | 10 (3.1) |
Vitreous floaters | 13 (3.9) | 7 (2.1) | 7 (2.1) | 4 (1.2) |
Eye pain | 7 (2.1) | 11 (3.3) | 10 (3.0) | 9 (2.8) |
Cataract | 10 (3.0) | 7 (2.1) | 10 (3.0) | 7 (2.1) |
Intraocular pressure increased | 8 (2.4) | 8 (2.4) | 9 (2.7) | 7 (2.1) |
Retinal pigment epithelial tear | 9 (2.7) | 6 (1.8) | 10 (3.0) | 3 (0.9) |
Dry age-related macular degeneration | 5 (1.5) | 7 (2.1) | 3 (0.9) | 1 (0.3) |
Punctate keratitis | 5 (1.5) | 5 (1.5) | 4 (1.2) | 8 (2.5) |
Foreign body sensation in eyes | 5 (1.5) | 6 (1.8) | 5 (1.5) | 7 (2.1) |
Patients with ≥ 1 non-ocular adverse event | ||||
n (%) | 174 (52.3) | 174 (51.8) | 172 (52.0) | 189 (58.0) |
Most common events,a n (%) | ||||
Nasopharyngitis | 18 (5.4) | 28 (8.3) | 24 (7.3) | 16 (4.9) |
Urinary tract infection | 17 (5.1) | 10 (3.0) | 10 (3.0) | 11 (3.4) |
Hypertension | 16 (4.8) | 7 (2.1) | 8 (2.4) | 9 (2.8) |
Arthralgia | 11 (3.3) | 6 (1.8) | 9 (2.7) | 5 (1.5) |
Back pain | 7 (2.1) | 10 (3.0) | 5 (1.5) | 1 (0.3) |
Fall | 4 (1.2) | 10 (3.0) | 8 (2.4) | 9 (2.8) |
Bronchitis | 9 (2.7) | 4 (1.2) | 8 (2.4) | 5 (1.5) |
Dizziness | 8 (2.4) | 4 (1.2) | 3 (0.9) | 4 (1.2) |
Headache | 7 (2.1) | 5 (1.5) | 8 (2.4) | 6 (1.8) |
Diarrhea | 2 (0.6) | 9 (2.7) | 4 (1.2) | 2 (0.6) |
Upper respiratory tract infection | 6 (1.8) | 6 (1.8) | 9 (2.7) | 11 (3.4) |
Sinusitis | 6 (1.8) | 5 (1.5) | 7 (2.1) | 6 (1.8) |
Influenza | 3 (0.9) | 5 (1.5) | 8 (2.4) | 4 (1.2) |
Patients with ≥ 1 ocular serious adverse event | ||||
n (%) | 4 (1.2) | 6 (1.8) | 7 (2.1) | 7 (2.1) |
Most common events,b n (%) | ||||
Neovascular age-related macular degenerationc | 1 (0.3) | 3 (0.9) | 1 (0.3) | 0 (0.0) |
Retinal pigment epithelial tear | 2 (0.6) | 0 (0.0) | 2 (0.6) | 0 (0.0) |
Vitritis | 0 (0.0) | 0 (0.0) | 2 (0.6) | 0 (0.0) |
Patients with ≥ 1 non-ocular serious adverse event | ||||
n (%) | 30 (9.0) | 34 (10.1) | 38 (11.5) | 48 (14.7) |
Most common events,d n (%) | ||||
Cardiac failure congestive | 1 (0.3) | 1 (0.3) | 2 (0.6) | 4 (1.2) |
Patients who stopped treatment due to adverse events | ||||
n (%) | 3 (0.9) | 3 (0.9) | 8 (2.4) | 1 (0.3) |
Deaths | ||||
n (%) | 5 (1.5) | 1 (0.3) | 4 (1.2) | 7 (2.1) |
Most common events,b n (%) | ||||
Cardiac failure | 0 (0.0) | 0 (0.0) | 0 | 2 (0.6) |
Notable harms | ||||
Endophthalmitis, n (%) | 0 (0.0) | 0 (0.0) | 0 (0.0) | 1 (0.3) |
Retinal vasculitis, n (%) | 0 (0.0) | 0 (0.0) | 0 (0.0) | 0 (0.0) |
Intraocular inflammation, n (%) | 5 (1.5) | 2 (0.6) | 8 (2.4) | 6 (1.8) |
Conjunctival hemorrhage, n (%) | 19 (5.7) | 22 (6.5) | 26 (7.9) | 29 (8.9) |
Retinal hemorrhage, n (%) | NR | NR | NR | NR |
Rhegmatogenous retinal detachment, n (%) | 0 (0.0) | 0 (0.0) | 0 (0.0) | 0 (0.0) |
Retinal tear, n (%) | 0 (0.0) | 0 (0.0) | 0 (0.0) | 0 (0.0) |
Vitreous floaters, n (%) | 13 (3.9) | 7 (2.1) | 7 (2.1) | 4 (1.2) |
Increase in intraocular pressure, n (%) | 8 (2.4) | 8 (2.4) | 9 (2.7) | 7 (2.1) |
Glaucoma, n (%) | 0 (0.0) | 1 (0.3) | 2 (0.6) | 3 (0.9) |
Arterial thromboembolic events,d n (%) | 3 (0.9) | 3 (0.9) | 4 (1.2) | 3 (0.9) |
NR = not reported.
aFrequency of 2% or greater in at least 1 treatment arm.
bExperienced by 1 or more patients in at least 1 treatment arm.
cRefers to worsening of neovascular age-related macular degeneration.
dAnti-Platelet Trialists’ Collaboration–defined arterial thromboembolic events, defined as nonfatal strokes or nonfatal myocardial infarctions, or vascular deaths (including deaths of unknown causes).
Source: TENAYA Clinical Study Report9 and LUCERNE Clinical Study Report.10
Critical Appraisal
Internal Validity
The TENAYA and LUCERNE studies were identically designed, randomized, double-blind, active-controlled, noninferiority, phase III trials comparing faricimab and aflibercept. The overall trial designs of the TENAYA and LUCERNE studies were appropriate for the objectives of the studies. There was no concern with regard to the method of randomization, which involved stratification by baseline BCVA, LLD, and geographic region, as well as the use of an interactive web-based response system for randomized assignment. The baseline characteristics of the study population were generally balanced between treatment arms and across studies, except in the LUCERNE study, in which longer mean times since diagnosis and higher proportions of patients with occult CNV lesions were observed in the faricimab arm than in the aflibercept arm. The clinical expert consulted by CADTH commented that the distribution of the CNV lesion type is not expected to confound the results. According to the clinical expert, the difference in mean time since diagnosis could cause results to favour the aflibercept arm, rather than the faricimab arm, and is therefore unlikely to affect the interpretation of the outcomes in the context of the studies. The methods of allocation concealment and blinding were appropriate. The use of sham injections to preserve blinding in patients was likely successful, according to the clinical expert, considering the procedure was done on anesthetized eyes.
The studies concluded faricimab was noninferior to aflibercept based on primary outcome analyses of the ITT population. It is generally preferred that a claim of noninferiority be based on agreement between both the ITT population and the per-protocol population for a more conservative approach in the context of noninferiority trials. However, a supplementary per-protocol analysis confirmed the conclusion of noninferiority in the primary ITT population. In addition, several sensitivity analyses by the sponsor and by the FDA confirmed the findings of each study.
The noninferiority margin of 4 ETDRS letters, which was chosen by the sponsor based on clinical trial data and clinical reasoning, aligned with recommended approaches. The clinical rationale was considered reasonable by the clinical expert consulted by CADTH. The enrolled sample sizes were adequate for the assessment of the primary outcome. Subgroup analyses were pre-specified; however, due to the lack of sample-size considerations, control for multiplicity, and statistical testing for treatment-by-subgroup interaction, no conclusions related to subgroup effects can be drawn. Similarly, the secondary and exploratory end points should be interpreted based on the lack of sample-size considerations and control for type I error.
According to the protocol, patients in the faricimab arms were assigned a maintenance treatment interval of every 12 weeks, if they had protocol-defined active disease at week 24. Exceptions were made for patients who did not fulfill the criteria of active disease but were deemed by the investigators to have significant nAMD disease activity. A fixed maintenance dosing interval of 12 weeks was assigned to these patients. The definition of “significant nAMD disease activity” was not reported in the studies and the proportion of patients in this category in each group was not specified, making it impossible to determine the impact on the results.
The proportion of patients who discontinued before week 48 was 4.3% in the TENAYA and LUCERNE studies, and the proportions were generally balanced between treatment arms within each study. Intercurrent events occurred in approximately 10% of patients in both studies, and the majority involved a missed dose related to COVID-19. Treatment policy strategy and hypothetical strategy were used to address non–COVID-19–related and COVID-19–related ICEs, respectively, in the primary estimand of the primary efficacy end point. The strategies were consistent with the approaches recommended by the FDA for ICEs.25 Although the hypothetical strategy (i.e., ICEs due to COVID-19 were censored and imputed using the MMRM modelling and assuming missing data were MAR) is 1 of the approaches identified in the FDA guidance, the treatment policy strategy (i.e., including all data regardless of ICEs) would be the preferred approach to ensure all data were used and because it is not clear that the MAR assumption would be met. The FDA statistical review of the studies for faricimab likewise considered the treatment policy strategy to be the better of the 2 that were used.26 However, the results of the supplementary analyses confirmed those of the primary estimand, suggesting the approach to handling ICEs was unlikely to have introduced bias.
The studies used implicit imputation by MMRM that assumed an MAR mechanism to account for missing data for continuous outcomes, while observed data with no imputation were used on missing categorical outcomes. No sensitivity analyses were conducted to assess the impact of ICEs and missing data on the secondary outcomes, resulting in unsubstantiated assumptions about the secondary analyses. The FDA statistical review also noted this as a limitation and conducted additional analyses.26 The results of these additional analyses confirmed the original secondary results.
External Validity
Nine of 149 study sites included in the TENAYA study and none in the LUCERNE study were in Canada. The clinical expert consulted by CADTH considered the inclusion and exclusion criteria reflective of the eligibility criteria for anti-VEGF treatment in clinical practice. The studies included only treatment-naive patients, whom the clinical expert noted would likely be the majority of patients eligible for faricimab; however, a switch in anti-VEGF may be warranted in some cases. The efficacy of faricimab in treatment-experienced patients was not explored in these studies and is therefore unclear. The clinical expert commented that the baseline characteristics of the study populations were similar to those of patients with nAMD in Canada.
In consultation with the clinical expert, aflibercept was considered an appropriate comparator, representing the most commonly prescribed on-label anti-VEGF in Canada. The dosing regimen of aflibercept in the studies aligns with the product monograph dosing. However, aflibercept was given at a fixed interval of 8 weeks in the maintenance phase, which does not align with the treat-and-extend approach used by most clinicians for the treatment of nAMD in Canada. The clinical expert added that most patients receive aflibercept at 8-week intervals in clinical practice, which may lessen the uncertainty of the generalizability of study results.
In terms of clinical relevance of the outcomes assessed in the studies, BCVA change and disease activity indicated by the presence of IRF, SRF, and/or PED, were routinely assessed to evaluate treatment response in clinical practice, according to the clinical expert. Other outcomes such as CST and NEI VFQ-25 were infrequently measured outside of clinical research.
An outcome of key interest to clinicians and patients was the frequency of injections, which was measured as the proportion of patients in the faricimab arm on an 8-, 12-, or 16-week injection interval. The generalizability of this outcome in the primary analysis was uncertain because the method of interval assignment for faricimab in the maintenance phase has limited resemblance to the approach in clinical practice. The maintenance doses for faricimab were given at a fixed interval of either 8, 12, or 16 weeks between week 20 and week 60. Although the treatment interval was assigned based on disease activity at week 20 and week 24 using an approach that is intended to mimic the treat-and-extend protocol, the fact that intervals were fixed until week 60 is more rigid than would be expected in practice, according to the clinical expert. The dosing of faricimab was informed by phase II studies, according to the sponsor. The lack of flexibility to adjust the dosing interval increases the uncertainty of the generalizability of the frequency of injection outcomes presented, although it may have helped reduce internal validity issues by keeping the dosing consistent.
The clinical expert noted that the length of assessment in the primary analysis (48 weeks) was adequate for assessing the efficacy and safety of faricimab in the context of a noninferiority trial. However, the clinical expert indicated that at least 2 to 3 years of results are needed to gain confidence on the durability of faricimab.
The TENAYA and LUCERNE studies were the only phase III trials available to date that provide direct evidence comparing faricimab to other anti-VEGF drugs in patients with nAMD. There is no direct evidence comparing faricimab to some of the other anti-VEGF drugs currently used in Canadian practice (i.e., brolucizumab or bevacizumab), which represents an evidence gap.
Indirect Evidence
Objectives and Methods for the Summary of Indirect Evidence
An ITC was required because of a lack of studies directly comparing faricimab with treatments other than aflibercept (as discussed in the Systematic Review section) and ranibizumab (Other Relevant Evidence) currently in use in the Canadian setting for nAMD.
Search Methods
A focused literature search for NMAs dealing with faricimab and AMD was run in MEDLINE All (1946–) on February 22, 2022. No limits were applied. No published NMAs were identified.
Description of Indirect Comparison
One report that included ITCs was supplied by the sponsor.
An overview of the submitted ITC is presented in Table 19.
Table 19: Study Selection Criteria and Methods for the Sponsor-Submitted ITC
Criteria | Sponsor-submitted ITC systematic review portion | Sponsor-submitted ITC network |
|---|---|---|
Population | Adult patients (18 years and older) undergoing treatment for nAMD Subgroups of interest:
| Adult patients (18 years and older) with nAMD |
Intervention | Faricimab | |
Comparator |
| |
Outcome | Vision outcomes:
Anatomic outcomes:
Other:
Safety:
| Time points: 12 months Vision outcomes:
Anatomic outcomes:
Other:
Safety:
|
Study design |
| |
Publication characteristics | Full publications to July 2020, conference abstracts published between January 2017 and June 2020 (search updated September 2021) | |
Exclusion criteria | Not matching the inclusion criteria | |
Databases searched | EMBASE, MEDLINE, Cochrane library, Database of Abstracts of Reviews of Effects, relevant conference abstracts | |
Selection process | Two independent reviewers | |
Data extraction process | Conducted by a single reviewer and quality checked by a second reviewer. Disputes were referred to a third party (strategic advisor). | |
Quality assessment | NICE single-technology appraisal user guide 7-criteria checklist | |
AE = adverse event, BCVA = best corrected visual acuity, CNV = choroidal neovascularization, CPT = centre point thickness, CST = centre subfield thickness, EDTRS = Early Treatment Diabetic Retinopathy Study, nAMD = neovascular age-related macular degeneration, HRQoL = health-related quality of life; Mac-TSQ = Macular Disease Treatment Satisfaction Questionnaire; NEI VFQ-25 = National Eye Institute Visual Functioning Questionnaire 25; NICE = National Institute for Health and Care Excellence; SAE = serious adverse event, VEGF = vascular endothelial growth factor.
Source: Sponsor-submitted NMA.27
Methods of Sponsor-Submitted Indirect Treatment Comparison
Objectives
The objective of the ITC was to assess the comparative efficacy and safety of faricimab with the interventions listed in Table 20.
Study Selection Methods
A strategy was developed, and the search was conducted in MEDLINE, Embase, the Cochrane library, and abstracts of relevant conferences, and an internet search was made of relevant health technology assessment agencies, clinical trial registries, and key government or international bodies. The population of interest was adult patients (> 18 years of age) with nAMD. Studies of both treatment-naive and -experienced patients were included. The main intervention was defined as faricimab 6 mg by intravitreal injection every 8 to 16 weeks.
Table 20: Treatment Doses and Regimens Considered in the Indirect Treatment Comparison
Treatment | Dose | Regimen (with or without more than 1 loading dose) |
|---|---|---|
Aflibercept | 2 mg IVT |
|
Bevacizumab | 1.25 mg IVT |
|
Brolucizumab | 6 mg IVT |
|
Faricimab | 6 mg IVT |
|
Ranibizumab | 0.5 mg IVT |
|
Ranibizumab | PDS |
|
Sham/placebo/ST | NA |
|
IVT = intravitreal; PDS = port delivery system; PRN = as needed; PRNX = as needed and extend; q.4.w. = every 4 weeks; q.6.w. = every 6 weeks; q.8.w. = every 8 weeks; q.12.w. = every 12 weeks; q.16.w. = every 16 weeks; q.24.w. = every 24 weeks; ST = standard treatment of photodynamic treatment with verteporfin for predominantly classic-type neovascular age-related macular degeneration, or intravitreal pegaptanib or sham treatment for occult or minimally classic-type neovascular age-related macular degeneration, pooled with sham arms. TREX = treat and extend.
Source: Sponsor-submitted NMA.27
The criteria included studies published before the cut-off date of July 1, 2020; this search was updated in September of 2021 (no new trial data were added). Two reviewers independently screened the retrieved reports at 2 stages (titles and abstracts, and then full papers), and any disagreement was adjudicated by a third party. Final citations were verified by the project lead. Reasons for exclusion were documented. Data extraction was conducted by a single reviewer and quality was checked by a second reviewer. Details of the methods used to extract data from the included studies were described.
Quality assessment of the selected studies was carried out by 2 reviewers, with any disagreements resolved by discussion or additional referees. The quality (risk of bias) assessment of studies was conducted using the 7-criteria checklist provided in section 2.5 of the National Institute for Health and Care Excellence single-technology appraisal user guide.
Outcomes of interest are listed in Table 19. Visual acuity outcomes were defined as mean change from baseline in BCVA according to ETDRS letters. In addition, the proportion of patients gaining or losing 10 or more, or 15 or more letters on the ETDRS scale from baseline was captured. This was defined as the proportion of patients in mutually exclusive categories (≥ −15, > −15 to ≥ −10, > −10 to ≥ −5, > −5 to < 5, ≥ 5 to < 10, ≥ 10 to < 15, and ≥ 15). Anatomic outcomes included the mean change in retinal thickness as measured by CST. If the CST was missing from a study, but 1 or more anatomic outcomes were reported, the other value was used in the following order: CST, centre point thickness (CPT), and central retinal thickness (CRT). |||||||||||||||||||||||||||||||||||||||||||||||||||||||||||||||||||||||||||||||||||||||||||||||||||||||||||||||||||||||||||||||||||||||||||||||||||||||||||||||||||||||||||||||||||||||||||||||||||||||||||||||||||||||||||| Safety outcomes included overall ocular AEs and ocular SAEs and discontinuation. No specific definitions for overall discontinuation, injection frequency, and AEs (overall ocular AEs and SAEs) were specified beyond the standard reporting in each trial.
The sponsor’s ITC reported outcomes at 2 end points: 12 months and 24 months. The 12-month outcome included any results reported between weeks 48 and 56, with 12 months or 1 year classified as 12 months. The 24-month outcome included any result reported between week 96 and week 104, 24 months, or 2 years.
Indirect Treatment Comparison Analysis Methods
An overview of the submitted ITC analysis methods is presented in Table 21.
The ITC compared faricimab with comparators for the available end points of visual acuity (BCVA and proportion of patients gaining or losing 10 or more, or 15 or more ETDRS letters), anatomic outcomes (retinal thickness), number of injections, ocular AEs, and all-cause treatment discontinuation at 12 months. The feasibility of pooling to create a network for analysis was pre-assessed based on study and patient characteristics.
The ITC was an NMA performed with a Bayesian approach. The model was a Bayesian comparison using a generalized linear model framework, with BCVA, retinal thickness, and number of injections using the identity link and proportion of patients gaining or losing 10 or more, or 15 or more ETDRS letters modelled using the probit and all other end points modelled using the logit link. Non-informative (vague) priors were planned for all parameters and alternative priors were considered if the planned priors did not produce sensible results or were too informative. A total of 10,000 iterations were used as burn-in followed by 40,000 iterations with a thinning parameter of 10; however, this was increased by a factor of 10 for ocular AEs, serious ocular AEs, meta-regressions on patient characteristics for BCVA, scheduled meta-regressions for CST, and number of injections to improve convergence. At least 2 parallel chains were run in all model fits. Convergence of the model was assessed using Brooks-Gelman-Rubin diagnostics.
Model fit was assessed using the deviance information criterion (DIC), for which a 5-point difference was considered meaningful, and residual deviance. However, random-effects models were planned for all end points given the anticipated heterogeneity between included studies. Ranibizumab 0.5 mg by intravitreal injection every 4 weeks was the reference treatment.
Sensitivity analyses were conducted with Bayesian fixed-effects models and standard NMA models.
Two types of meta-regression were conducted to investigate the effect of drug administration schedule and patient characteristics. The impact of pooling arms with the same treatment and dose for the following dose schedules were investigated using:
as needed versus routine monthly schedules
loading yes versus no for as-needed schedules (loading)
treat-and-extend versus a monthly schedule
as needed with potential to extend versus routine monthly schedule
the interval between injections (coded to a continuous month variable)
combinations of this list.
Different dosing schedules were treated as different treatment arms in the initial NMA (“split model”), and the impact of pooling arms with the same treatment and dose and applying shared effects for dosing schedules was investigated in a pooled model. Patient age, gender, race, and BCVA at baseline were investigated using standard network meta-regression methods to determine if the treatment effect varied according to covariate. These were modelled in a split model; they were planned to be investigated in the pooled model along with chosen schedule covariates.
As a sensitivity analysis, a standard NMA was conducted for BCVA, CST, and proportion of patients gaining or losing 10 or 15 letters.
Every dosing regimen explored was considered as a separate node in the evidence network.
Table 21: Analysis Methods for Indirect Treatment Comparison
Characteristic | Description of methods |
|---|---|
ITC methods | Bayesian network meta-analysis |
Priors | Non-informative |
Assessment of model fit | Diagnostic information criterion for relative fit and total residual deviance for absolute fit. |
Assessment of consistency | Consistency in model fits were assessed for every pairwise comparison using deviance information criterion and residual deviance and reported using methods per the NICE Decision Support Unit Technical Support Document; this analysis was performed for the change from baseline in BCVA score in the overall population, and further inconsistency assessments were planned for other outcomes and populations if there was evidence for inconsistency |
Assessment of convergence | Trace plots and Brooks-Gelman-Rubin diagnostics |
Outcomes |
|
Follow-up time points | 12-month outcomes included any result reported between week 48 and week 56, 12 months, or 1 year were classified as 12 months; 24-month outcomes included any result reported between week 96 to week 104, 24 months or 2 years |
Construction of nodes | Each treatment and schedule were a separate node |
Sensitivity analyses | Bayesian fixed-effects model |
Subgroup analysis | None; there were insufficient trials with a treatment-experienced population to perform this planned subgroup analysis |
BCVA = best corrected visual acuity, CST = central subfield thickness; ETRDS = Early Treatment Diabetic Retinopathy Study; ITC = indirect treatment comparison; NICE = National Institute for Health and Care Excellence.
Source: Sponsor-submitted NMA.27
Results of Indirect Treatment Comparison
Summary of Included Studies
A total of 67 RCTs were included in the feasibility assessment; 14 were excluded due to treatment-related reasons. Five studies were excluded as they did not report outcomes at the time points of interest, 1 was not a RCT, and 2 included polypoidal choroidal vasculopathy. Therefore, 45 studies were considered for inclusion in the NMA. A further 8 trials were excluded for reasons including not reporting outcomes at the time point of interest (1 trial), dosing outside the approved range (4), a dose schedule that was not of interest (1), and a study end point that was not of interest (1), for a total of 37 trials that were included in the NMA. Additionally, 1-year and 2-year analyses of the CATT trial were considered separate studies in some analyses, and a combined analysis of the VIEW 1 and VIEW 2 trials was considered a separate study in some analyses, for a total of 39 separate studies in the NMA.
An overview of the assessment of homogeneity for the ITC is presented in Table 22. Most (32 of the 37 trials) were head-to-head trials, except 5 trials that compared active treatments to sham intravitreal injections (1 study included standard therapy of photodynamic therapy with verteporfin, pegylated intravitreal injection or sham). Most of the trials (18 of 37) were double-masked, 11 were open-label, 5 were single-masked, and 3 did not report masking. Most (17 of 37) were phase III studies, 3 were phase II, 6 were phase IV, 1 was a phase I and II study, and 10 studies did not report phase. Most (23 of 37) were multi-centre trials, with another 8 muti-centre international trials and 6 single-centre trials. Study size ranged from 23 to 1,240 patients; there were 9 trials with fewer than 100 patients and 5 trials with more than 1,000 patients. The study year ranged from 2003 to 2022, with 4 trials not reporting dates.
Mean age at baseline in a study treatment arm ranged from 63.5 years old to 84 years old. The proportion of males across the study treatment arms ranged from 25% to 66%. The proportion of study participants who were White ranged from 0% to 100%. Mean BCVA at baseline ranged from 32.7 to 75.5 ETDRS letters. There was heterogeneity in the way retinal thickness was measured and defined in the included trials (central foveal thickness; CRT; CST, CPT, retinal thickness, and foveal thickness). The retinal thickness at baseline varied widely, from 176 μm (CPT) to 533 μm (CRT). Time since diagnosis was available for only 6 trials. Information about the presence of IRF data was available for 12 trials (37.7% to 100%) and information about the presence of SRF was available for 11 trials (58% to 90.9%). Prior therapy for nAMD was reported as 0 for 21 trials, not reported in 10 trials, and included various therapies (e.g., laser photocoagulation, supplements, and photodynamic therapy) for 4 trials and anti-VEGF medication for 2 trials of the ranibizumab port delivery system. It was noted in the systematic literature review that many studies reported the mean number of injections, although limited variance data were available.
Table 22: Assessment of Homogeneity for Sponsor-Submitted ITC
Characteristic | Description and handling of potential effect modifiers |
|---|---|
Disease severity |
|
Treatment history | Prior therapy for nAMD was assessed; only 6 trials reported prior therapy, (e.g., laser therapy); 2 trials included prior anti-VEGF; a subgroup analysis was planned in which only treatment-naive patients are included; however, this analysis was not conducted due to insufficient data |
Dosing of comparators | Each dose and regimen combination was considered as a separate intervention/comparator; the number of injections per year may have been protocol-driven through fixed dosing in trials |
Placebo response | 5 of the included trials had sham/placebo as an arm |
Definitions of end points | Reporting changes in retinal thickness and methods of measuring exhibited considerable heterogeneity |
Timing of end point evaluation or trial duration |
|
Withdrawal frequency | Treatment discontinuation was reported for 25 trials; within study arms this ranged from 0 to 33.3% |
Study design |
|
BCVA = best corrected visual acuity; CRT = central retinal thickness; CST = central subfield thickness; ITC = indirect treatment comparison; nAMD = neovascular age-related macular degeneration; VEGF = vascular endothelial growth factor; vs. = versus.
Source: Sponsor-submitted NMA.27
Results
Comparators
Overall, the ITC included trials with relevant comparators. However, results for trials that included the ranibizumab port delivery system are not reported in this summary because it is not a treatment that was pre-specified as relevant to the review of faricimab. In addition, pairwise results between faricimab and sham/placebo or “standard therapy” as a comparator are not reported in this summary.
Risk of Bias
The quality of the 69 studies considered for inclusion in the feasibility assessment was reported. Overall, included studies were rated to be of moderate to high quality. However, a quality assessment specifically for the 37 studies that were included in the NMA was not reported.
Best Corrected Visual Acuity
For the outcome of BCVA at 12 months, 35 trials were included in the analysis, which was conducted under a random-effects model as this model had a lower DIC than the fixed-effects model (DIC not reported). A graphic representation of the evidence network is presented in Figure 3. Most trials compared active treatments; the network did include closed loops involving faricimab as an intervention.
All comparisons included the null in the 95% CrI. The comparative results are outlined in Table 23. There was no evidence of inconsistency from the comparison of the consistency and inconsistency model fits (DIC and mean residual deviance were compared).
Number of Injections at 12 Months
For the number of injections at 12 months, 27 RCTs were included in the analysis, which was conducted with a random-effects model. A graphic representation of the evidence network is presented in Figure 4. |||||||||||||||||||||||||||||||||||||||||||||||||||||||||||||||||||||||||||||||||||||||||||||||||||||||||||||||||||||||||||||||||||||||||||||||||||||||||||||||||||||||||||||||||||||||||||||||||||||||||||||||||||||||||||||||||||||||||||||||||||||||||| Results are outlined in Table 24.
Table 23: Mean Change in BCVA — Indirect Treatment Comparison Results
Faricimab 6 mg IVT 8- and 16-week intervals vs. | Mean difference in BCVA mean change from baseline at 12 months (95% CrI) between faricimab and comparator |
|---|---|
RAN 0.5 mg IVT q.8.w. | −0.27 (−3.4 to 2.81) |
RAN 0.5 mg IVT q.4.w. | −0.21 (−3.47 to 3.04) |
BEV 1.25 mg IVT q.8.w. | −0.03 (−3.46 to 3.57) |
BEV 1.25 mg IVT q.4.w. | 0.03 (−3.64 to 3.68) |
RAN 0.5 mg IVT TREX | 0.12 (−3.26 to 3.73) |
AFL 2 mg IVT q.8.w. | 0.33 (−2.09 to 2.75) |
BEV 1.25 IVT TREX | 0.38 (−3.65 to 4.45) |
AFL 2 mg IVT q.4.w. | 0.39 (−2.46 to 3.21) |
AFL 2 mg IVT TREX | 0.73 (−2.44 to 3.88) |
BRO 6 mg IVT q.12.w. and q.8.w. | 0.81 (−2.71 to 4.26) |
RAN 0.5 mg IVT PRN | 0.84 (−3.11 to 4.58) |
BEV 1.25 mg IVT PRN | 1.10 (−3.14 to 5.17) |
AFL 2 mg IVT PRN | 1.45 (−2.14 to 4.87) |
AFL = aflibercept; BCVA = best corrected visual acuity score mean change from baseline at 12 months; BEV = bevacizumab; BRO = brolucizumab; CrI = credible interval; IVT = intravitreal; NMA = network meta-analysis; PRN = as needed; q.4.w. = every 4 weeks; q.8.w. = every 8 weeks; RAN = ranibizumab; TREX = treat and extend; vs. = versus.
Note: The sponsor reports that sensitivity analyses with standard NMA showed similar results; no evidence of inconsistency was observed from comparison of consistency and inconsistency models
Source: Sponsor-submitted NMA.27
Table 24: Number of Injections at 12 Months — Indirect Treatment Comparison Results [Redacted]
Results | |||||||||||||||||||||||||||||||||||||||||||||||||||||||||||||||||||||||||||||||||||||||||||||||||||||||||||||| |
|---|---|
|||||||||||||||||||||||||||||||||||||||||||||||||||||||||||| | |
|||||||||||||||||||||||||||||| | |||||||||||||||||||||||||||||||||||||||||||||||||| |
|||||||||||||||||||||||||||||| | |||||||||||||||||||||||||||||| |
|||||||||||||||||||||||||||||| | |||||||||||||||||||||||||||||| |
|||||||||||||||||||||||||||||| | |||||||||||||||||||||||||||||| |
AFL = aflibercept; BCVA = best corrected visual acuity score mean change from baseline at 12 months; BEV = bevacizumab; BRO = brolucizumab; CrI = credible interval; FAR = faricimab; IVT = intravitreal; NMA = network meta-analysis; PBO = placebo; PRN = as needed; PRNX = as needed and extend; q.4.w. = every 4 weeks; q.8.w. = every 8 weeks; q.4.w. = every 12 weeks; q.16.w. = every 16 weeks; q.24.w. = every 24 weeks; RAN = ranibizumab; TREX = treat and extend.
Note: Redacted rows have been deleted.
Source: Sponsor-submitted NMA.27
Figure 3: Network Diagram for the Outcome Mean Change in BCVA at 12 Months
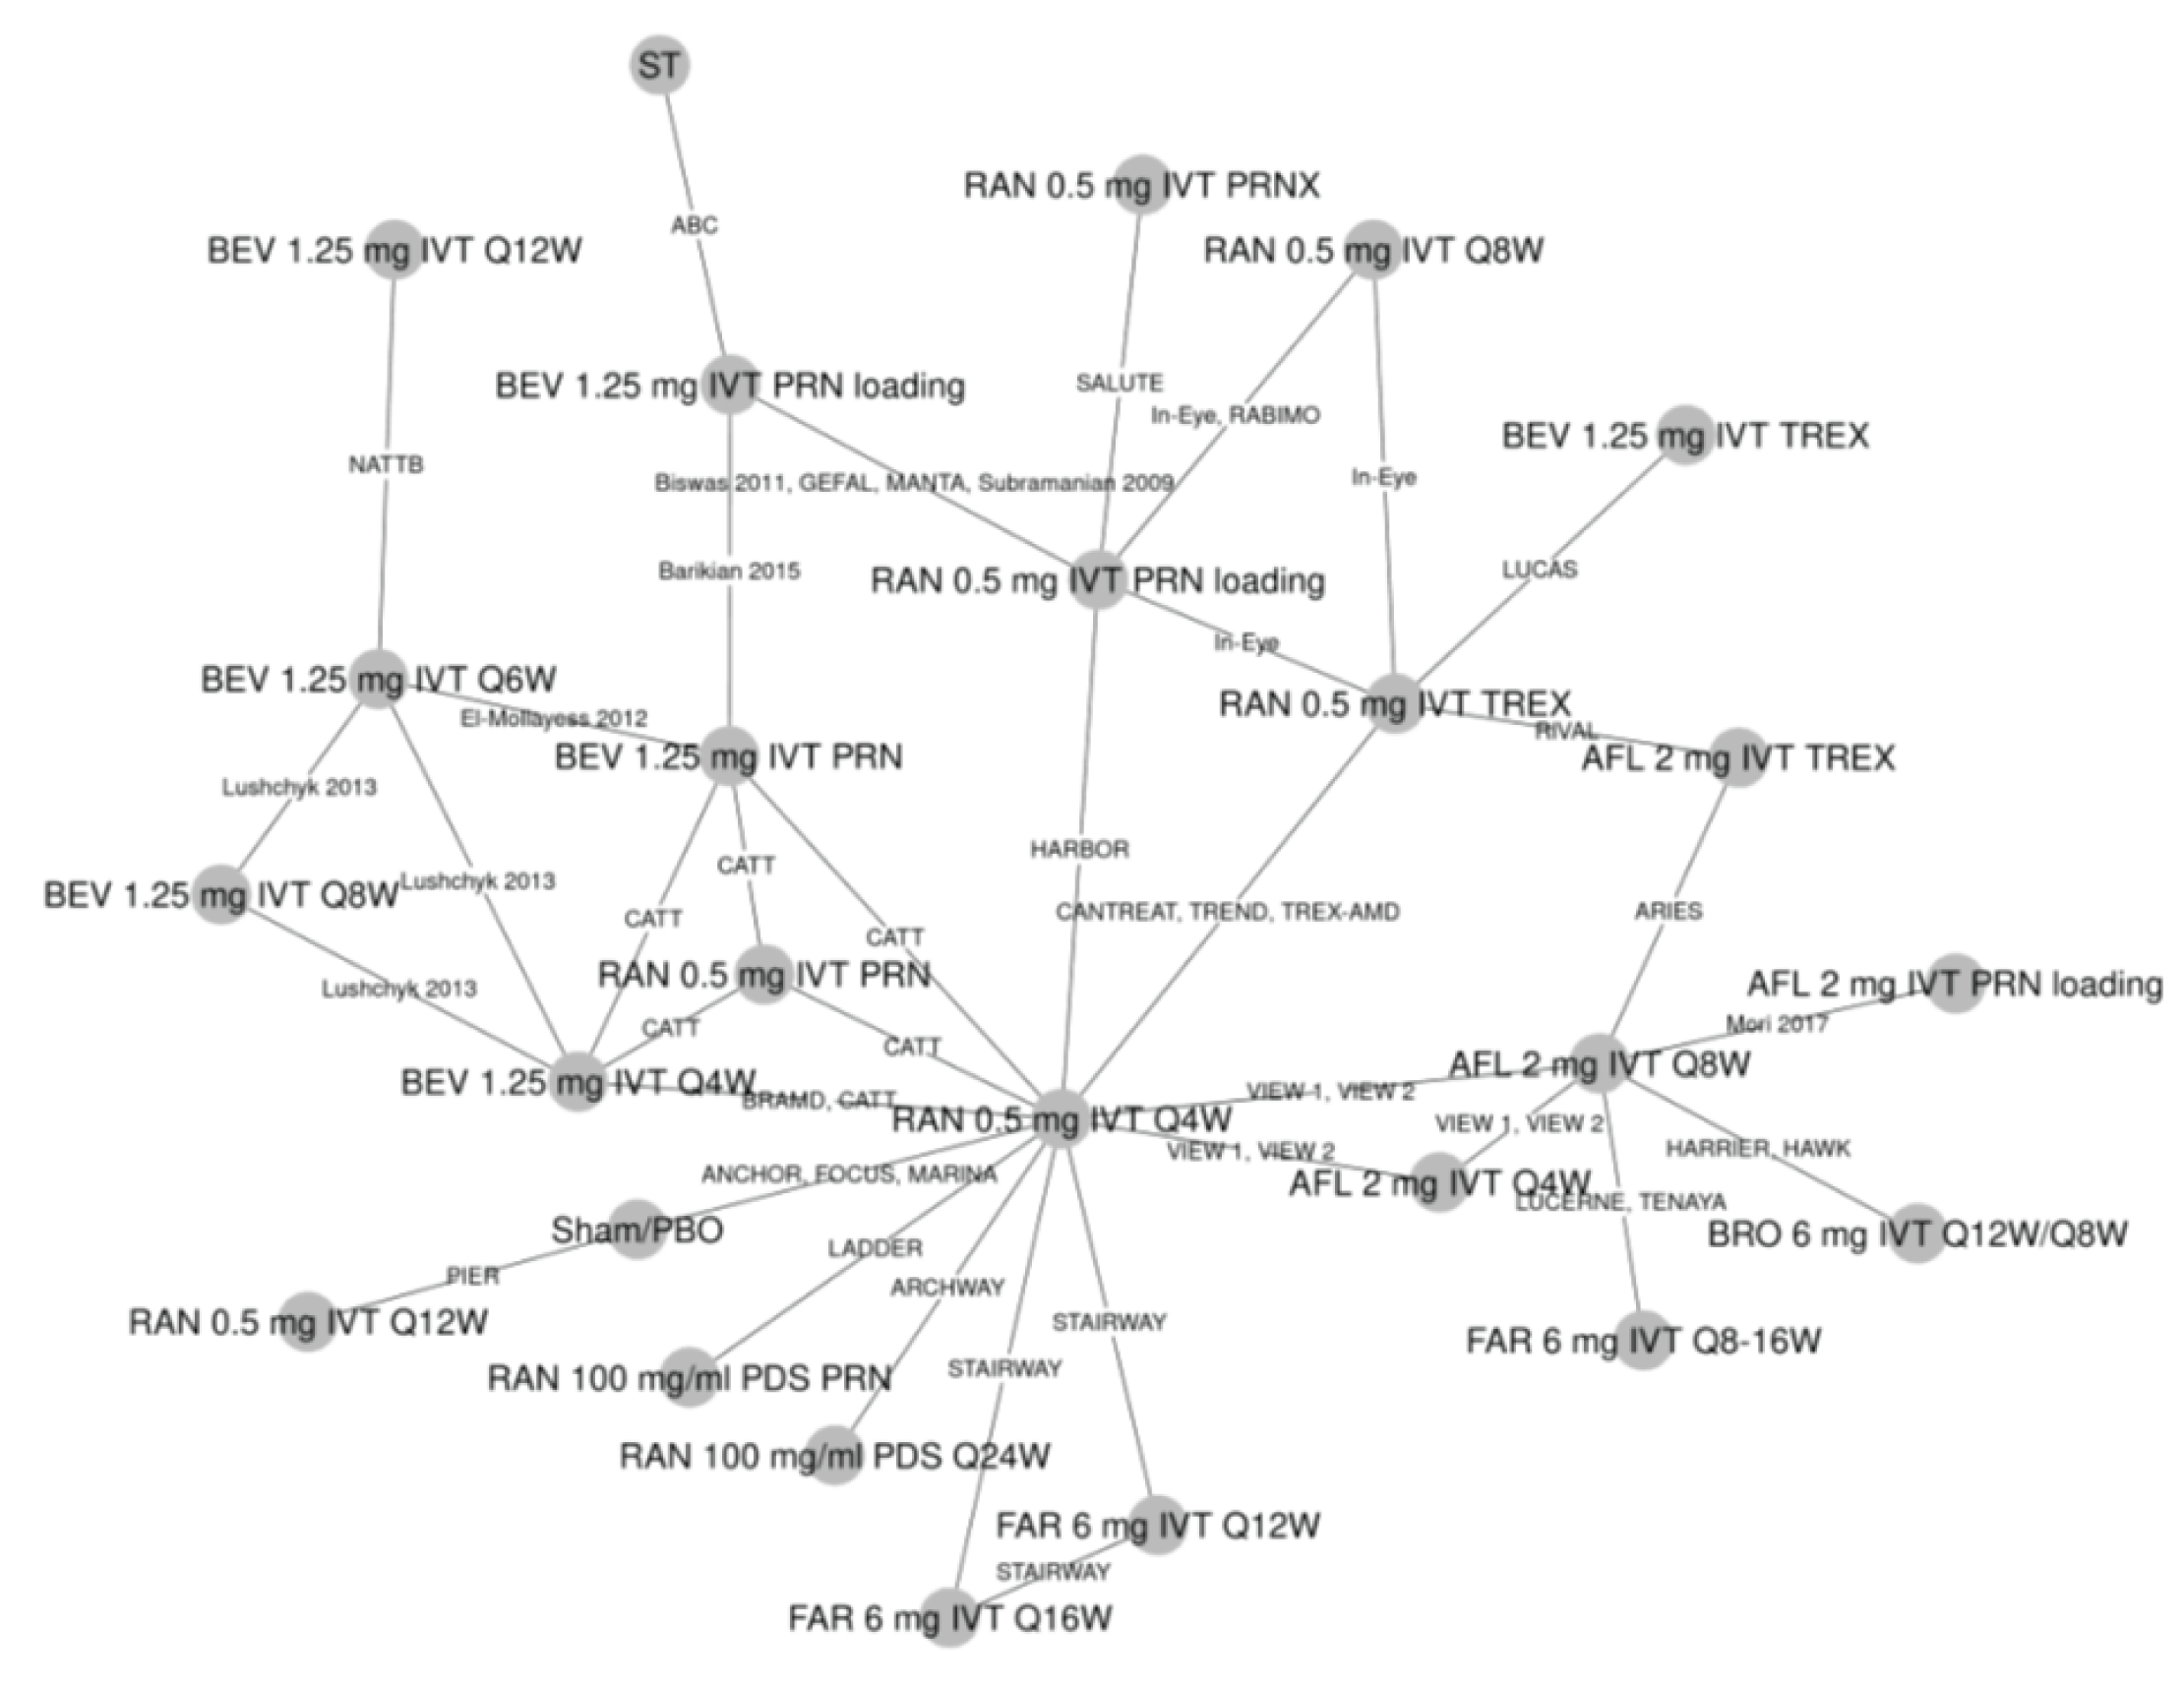
AFL = aflibercept; BEV = bevacizumab; BRO = brolucizumab; FAR = faricimab; IVT = intravitreal; PDS = port delivery system; PBO = placebo; PRN = as needed; PRNX = as needed and extend; Q4W = every 4 weeks; Q6W = every 6 weeks; Q8W = every 8 weeks; Q12W = every 12 weeks; Q16W = every 16 week; Q24W = every 24 weeks; RAN = ranibizumab; ST = standard treatment of photodynamic treatment with verteporfin for predominantly classic-type neovascular age-related macular degeneration, or intravitreal pegaptanib or sham treatment for occult or minimally classic-type neovascular age-related macular degeneration, pooled with sham arms. TREX = treat and extend.
Source: Sponsor-submitted NMA.27
Figure 4: Network Diagram for the Outcome Mean Number of Injections at 12 Months
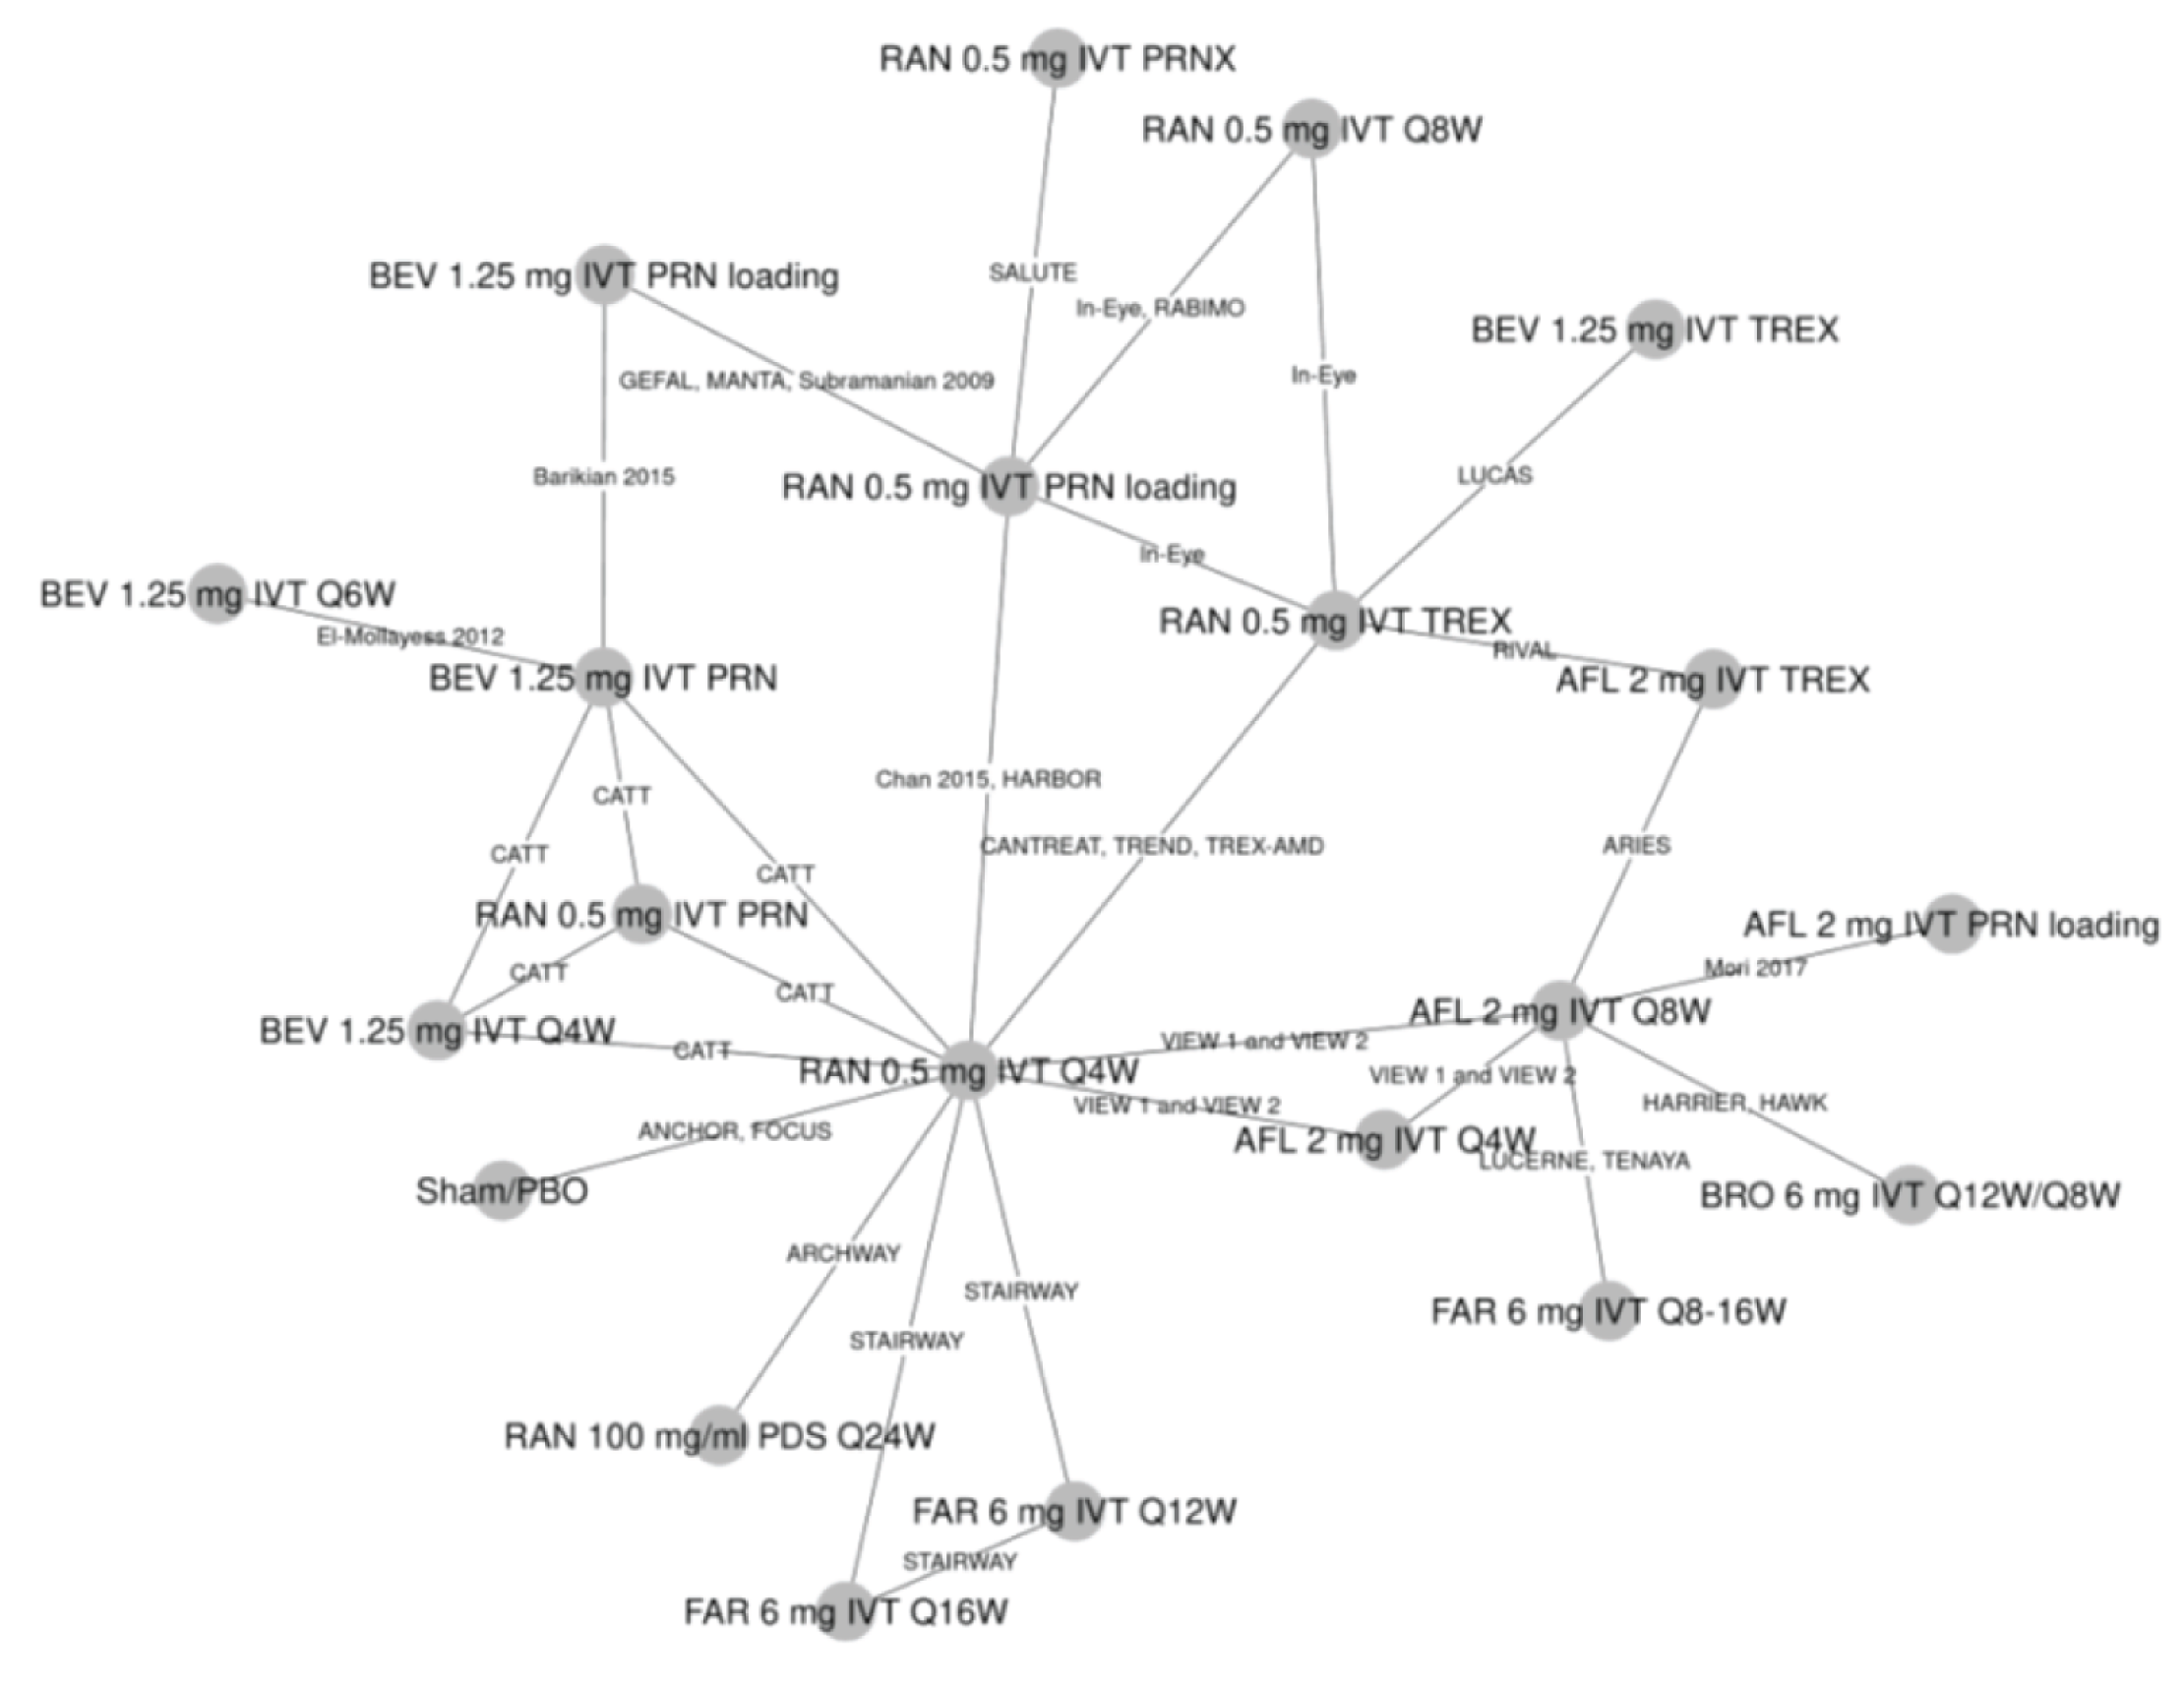
AFL = aflibercept; BEV = bevacizumab; BRO = brolucizumab; FAR = faricimab; IVT = intravitreal; PDS = port delivery system; PBO = placebo; PRN = as needed; PRNX = as needed and extend; Q4W = every 4 weeks; Q6W = every 6 weeks; Q8W = every 8 weeks; Q12W = every 12 weeks; Q16W = every 16 weeks; Q24W = every 24 weeks; RAN = ranibizumab; TREX = treat and extend.
Source: Drug Reimbursement Review submission: Vabysmo (faricimab single-use pre-filled syringe, 6 mg/0.05 mL solution for intravitreal injection) [CONFIDENTIAL sponsor’s submission].2
Retinal Thickness
For retinal thickness at 12 months, the sponsor included 25 RCTs in the analysis, which was conducted with a random-effects model. A graphic representation of the evidence network is presented in Figure 5. The results showed faricimab 6 mg intravitreal every 8 to 16 weeks may have had greater effect on retinal thickness (the 95% CrI did not include the null) when compared to bevacizumab regimens and ranibizumab 0.5 mg intravitreal every 8 weeks. Brolucizumab 6 mg intravitreal every 8 or 12 weeks was found to have a mean difference in retinal thickness of 32.86 (95% CrI, 9.71 to 55.61), which was greater than that of faricimab. Results are outlined in Table 25.
Patients Gaining or Losing at least 10 or 15 ETDRS Letters
For the outcome of patients gaining or losing at least 10 or 15 ETDRS letters at 12 months, 31 trials were included for this analysis, which was conducted with a random-effects model. A graphic representation of the evidence network is presented in Figure 6. The results showed faricimab 6 mg intravitreal every 8 to 16 weeks was associated with vision change that was not different to all regimens (the 95% CrI included the null). Results are outlined in Table 26.
The technical report noted that various assessments showed the model for this outcome had poor fit, likely due to limited data and heterogeneity. Various methods were used to adjust for the limitations, but these did not improve the model fit. This precludes using these data to make conclusions about the effect of faricimab versus comparators on patients gaining or losing at least 10 or 15 EDTRS letters.
Table 25: Retinal Thickness — Indirect Treatment Comparison Results
Faricimab 6 mg IVT 8- and 16-week intervals vs. | Mean difference in Retinal thickness mean change from baseline at 12 months (95% CrI) between faricimab and comparator |
|---|---|
BEV 1.25 mg IVT q.8.w. | −37.43 (−62.54 to –13.33) |
BEV 1.25 mg IVT TREX | −33.72 (−62.79.3 to –4.22) |
BEV 1.25 mg IVT PRN | −32.53 (−62.57 to –0.93) |
BEV 1.25 mg IVT q.4.w. | −25.56 (−49.41 to –0.07) |
RAN 0.5 mg IVT q.8.w. | −23.79 (−45.18 to –4.72) |
RAN 0.5 mg IVT TREX | −20.21 (−46.71 to −5.37) |
RAN 0.5 mg IVT PRN | −19.16 (−45.59 to 8.66) |
RAN 0.5 mg IVT q.4.w. | −12.01 (−31.92 to 9.34) |
AFL 2 mg IVT q.8.w. | −7.03 (−21.22 to 6.98) |
AFL 2 mg IVT TREX | −3.32 (−26.38 to 20.19) |
AFL 2 mg IVT PRN | −2.21 (−25.51 to 24.73) |
AFL 2 mg IVT q.4.w. | 4.77 (−11.53 to 25.24) |
BRO 6 mg IVT q.12.w. and q.8.w. | 32.86 (9.71 to 55.61) |
AFL = aflibercept; BCVA = best corrected visual acuity score mean change from baseline at 12 months; BEV = bevacizumab; BRO = brolucizumab; CrI = credible interval; IVT = intravitreal; NMA = network meta-analysis; PRN = as needed; q.4.w. = every 4 weeks; q.8.w. = every 8 weeks; q.12.w. = every 12 weeks; RAN = ranibizumab; TREX = treat and extend; vs. = versus.
Notes: Bolded numbers indicate that the 95% CrI excludes the null.
Sensitivity analysis with various definition of retinal thickness was not reported; sensitivity analyses with standard NMA showed similar results; as the inconsistency assessment for BCVA did not show any inconsistency, an inconsistency assessment was not reported for this end point
Source: Sponsor-submitted NMA.27
Table 26: Patients Losing or Gaining at Least 10 or 15 Letters ETDRS — ITC Results
Faricimab 6 mg IVT 8- and 16-week intervals vs. | Probit scale treatment differences (95% CrI) at 1 year between faricimab and comparator |
|---|---|
RAN 0.5 mg IVT PRN | −0.09 (−1.07 to 0.88) |
AFL 2 mg IVT PRN | −0.08 (−0.97 to 0.81) |
RAN 0.5 mg IVT q.8.w. | −0.04 (−0.87 to 0.77) |
AFL 2 mg IVT q.8.w. | −0.04 (−0.69 to 0.62) |
BEV 1.25 mg IVT PRN | −0.04 (−1.11 to 1.02) |
BEV 1.25 mg IVT q.8.w. | 0.00 (−0.92 to 0.92) |
RAN 0.5 mg IVT TREX | 0.00 (−0.95 to 0.96) |
AFL 2 mg IVT TREX | 0.01 (−0.82 to 0.87) |
RAN 0.5 mg IVT q.4.w. | 0.02 (−0.81 to 0.86) |
AFL 2 mg IVT q.4.w. | 0.03 (−0.68 to 0.75) |
BEV 1.25 mg IVT TREX | 0.05 (−0.99 to 1.09) |
BRO 6 mg IVT q.12.w. and q.8.w. | 0.05 (−0.86 to 0.99) |
BEV 1.25 mg IVT q.4.w. | 0.07 (−0.85 to 0.99) |
AFL = aflibercept; BCVA = best corrected visual acuity score mean change from baseline at 12 months; BEV = bevacizumab; BRO = brolucizumab; CrI = credible interval; IVT = intravitreal; NMA = network meta-analysis; PRN = as needed; q.4.w. = every 4 weeks; q.8.w. = every 8 weeks; q.12.w. = every 12 weeks; RAN = ranibizumab; TREX = treat and extend; vs. = versus.
Notes: Sensitivity analyses with standard NMA showed similar results; as the inconsistency assessment for BCVA did not show any inconsistency, an inconsistency assessment was not reported for this end point.
The technical report indicated the posterior for tau is truncated at the upper limit of the uniform prior (5) suggesting it is not well estimated; this was not resolved by increasing the upper limit, suggesting that there may be insufficient data to estimate between-study heterogeneity and there is uncertainty in these results
Source: Sponsor-submitted NMA.27
Figure 5: Network Diagram for the Retinal Thickness Outcome at 12 Months
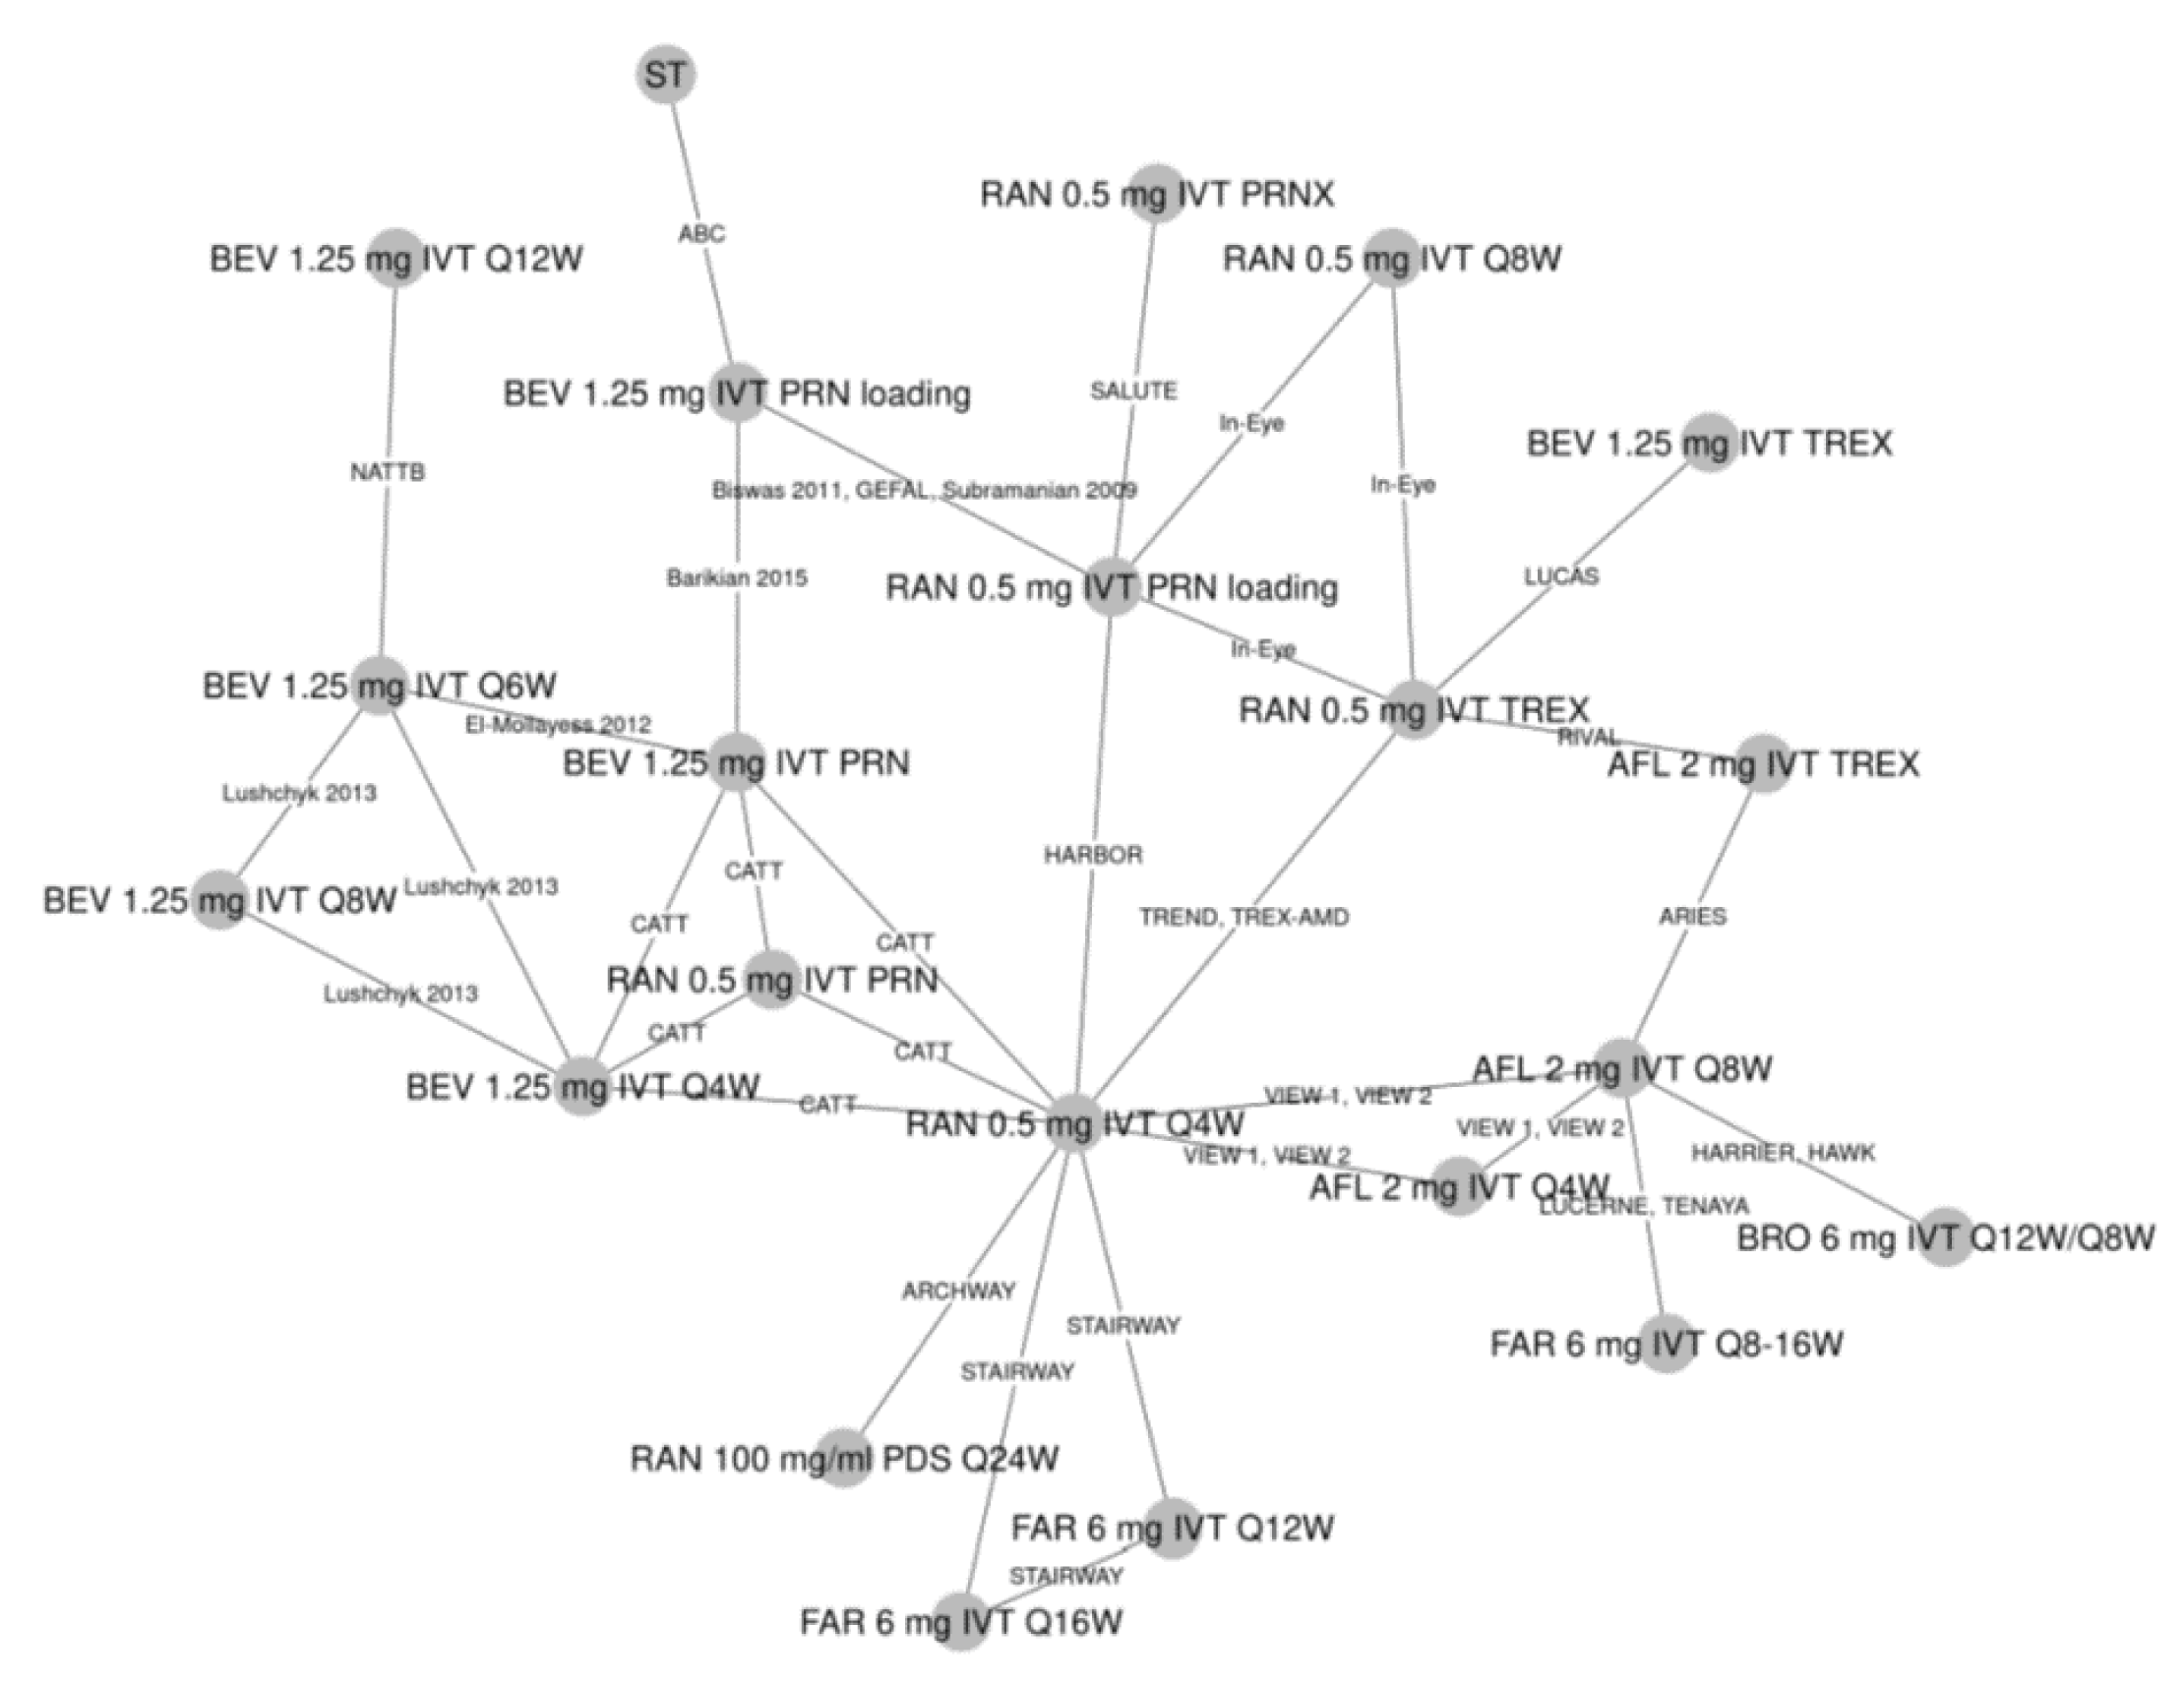
AFL = aflibercept; BEV = bevacizumab; BRO = brolucizumab; FAR = faricimab; IVT = intravitreal, loading = with loading phase; PDS = port delivery system; PRN = as needed; PRNX = as needed and extend; Q4W = every 4 weeks; Q6W = every 6 weeks; Q8W = every 8 weeks; Q12W = every 12 weeks; Q16W = every 16 weeks; Q24W = every 24 weeks; RAN = ranibizumab; ST = standard treatment of photodynamic treatment with verteporfin for predominantly classic-type nAMD, or intravitreal pegaptanib or sham treatment for occult or minimally classic-type neovascular age-related macular degeneration, pooled with sham arms. TREX = treat and extend.
Source: Sponsor-submitted NMA.27
Figure 6: Network Diagram for the Outcome of Proportion of Patients Losing or Gaining at Least 10 or 15 Letters ETDRS at 12 Months
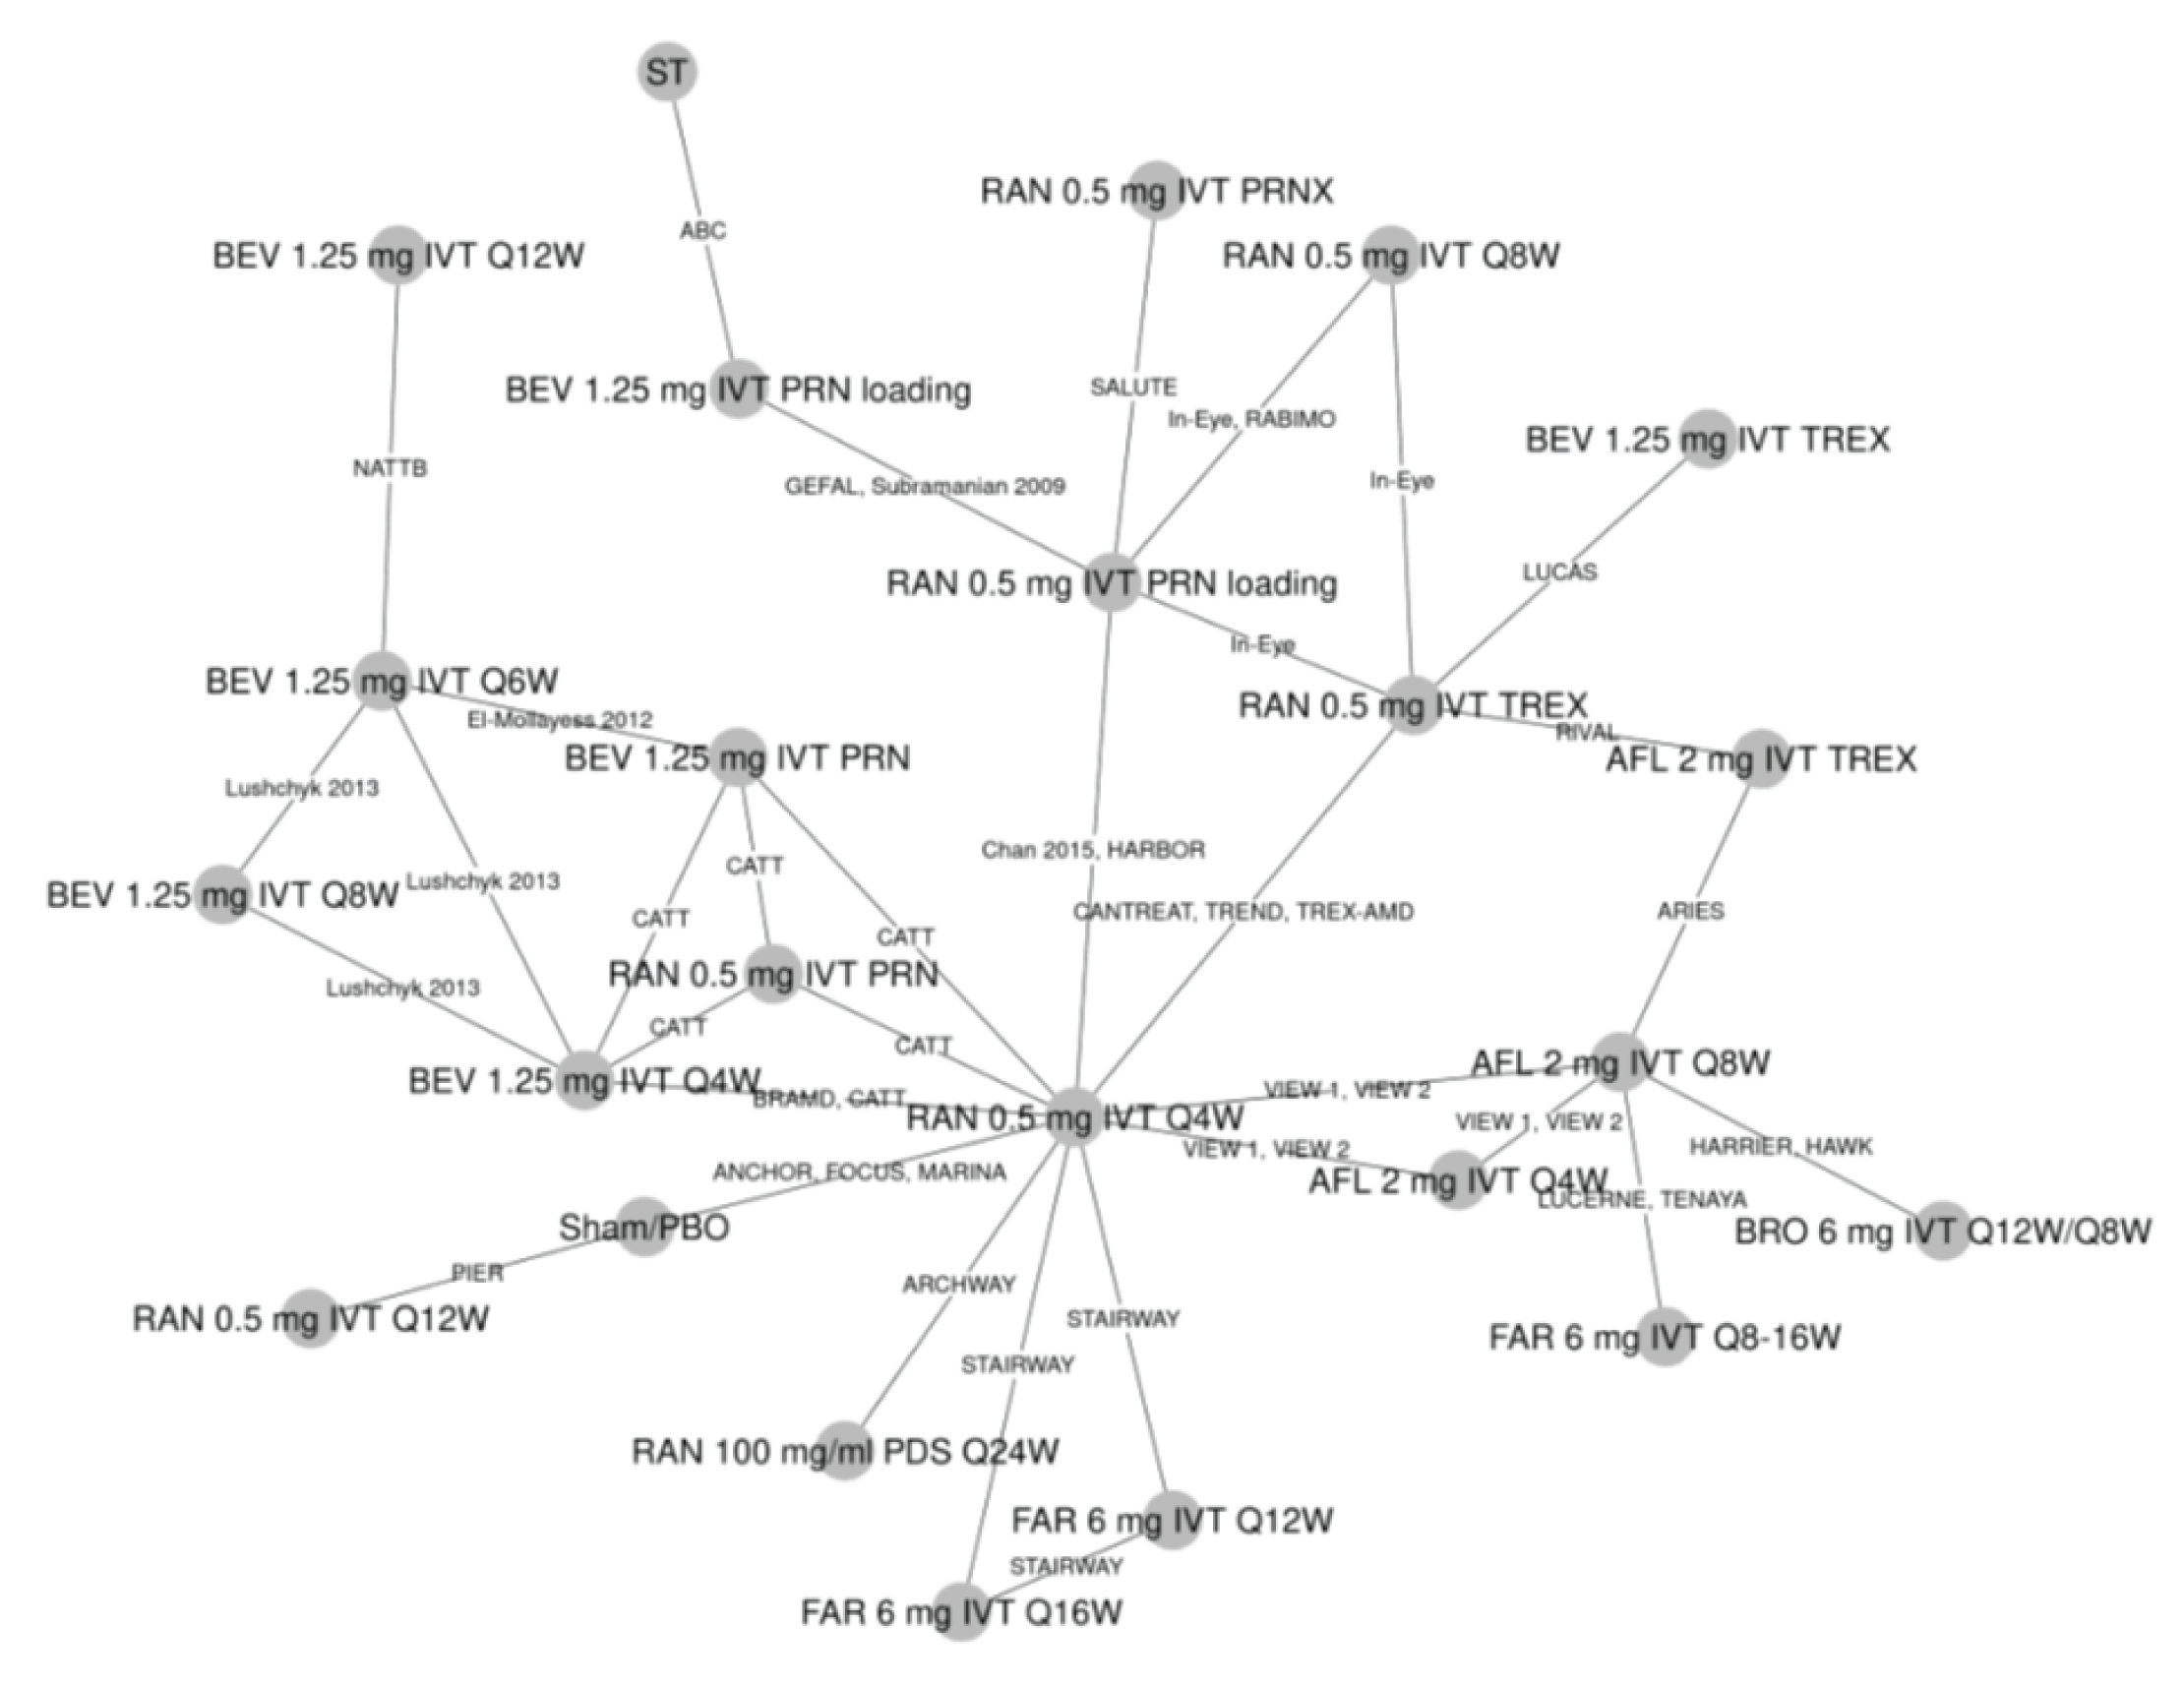
AFL = aflibercept; BEV = bevacizumab; BRO = brolucizumab; FAR = faricimab; IVT = intravitreal; PDS = port delivery system; PBO = placebo; PRN = as needed; PRNX = as needed and extend; Q4W = every 4 weeks; Q6W = every 6 weeks; Q8W = every 8 weeks; Q12W = every 12 weeks; Q16W = every 16 weeks; Q24W = every 24 weeks; RAN = ranibizumab; ST = standard treatment of photodynamic treatment with verteporfin for predominantly classic-type neovascular age-related macular degeneration, or intravitreal pegaptanib or sham treatment for occult or minimally classic-type neovascular age-related macular degeneration, pooled with sham arms. TREX = treat and extend.
Source: Sponsor-submitted NMA.27
Ocular Adverse Events
For the outcome of all ocular AEs at 12 months, 14 trials were included in the analysis, which was conducted with a fixed-effects model as this model had a lower DIC compared with the random-effects model, despite not being considered meaningful in the technical report (DIC not reported). A graphic representation of the evidence network is presented in Figure 7. The results showed that faricimab 6 mg intravitreal every 8 to 16 weeks had ocular AEs that were not different to comparators (95% CrIs included 1 for the odds ratio of ocular AEs), although credible intervals were wide for some of the comparisons. It was reported that, due to events resulting in sparse data, a normal likelihood model on the odds ratio scale with continuity correction was applied for all AE analysis. The comparative results are outlined in Table 27.
An NMA for serious ocular AEs was not reported because limited data were available for these events.
Treatment Discontinuation
For the outcome of treatment discontinuation at 12 months, 25 trials were included in the analysis, which was conducted with a fixed-effects model as this model had a lower DIC than the random-effects model, despite not being considered meaningful in the technical report (DIC not reported). A graphic representation of the evidence network is presented in Figure 8. The results showed that faricimab 6 mg intravitreal every 8 to 16 weeks had discontinuation rates that were not different (95% CrIs include 1 for odds of discontinuation) to comparators, although the CrIs were wide for some comparisons. The comparative results are outlined in Table 28. A normal likelihood model was applied to this analysis due to sparse data from infrequent events.
Table 27: Ocular Adverse Events at 12 Months — Indirect Treatment Comparison Results
Faricimab 6 mg IVT 8- and 16-week intervals vs. | Odds ratioa (95% CrI) |
|---|---|
RAN 0.5 mg IVT q.4.w. | 0.50 (0.14 to 1.30) |
RAN 0.5 mg IVT PRN loading | 0.62 (0.21 to 1.76) |
BEV 1.25 mg IVT PRN loading | 0.63 (0.01 to 35.28) |
RAN 0.5 mg IVT TREX | 0.96 (0.38 to 1.94) |
BRO 6 mg IVT q.12.w. and q.8.w. | 0.98 (0.55 to 1.76) |
RAN 0.5 mg IVT q.4.w. | 0.99 (0.55 to 1.77) |
AFL 2 mg IVT q.8.w. | 1.05 (0.70 to 1.60) |
AFL 2 mg IVT q.4.w. | 1.22 (0.68 to 2.21) |
FAR 6 mg IVT q.12.w. | 1.64 (0.37 to 7.30) |
FAR 6 mg IVT q.16.w. | 1.77 (0.40 to 7.52) |
AFL = aflibercept; BCVA = best corrected visual acuity score mean change from baseline at 12 months; BEV = bevacizumab; BRO = brolucizumab; CrI = credible interval; FAR = faricimab; IVT = intravitreal; PRN = as needed; q.4.w. = every 4 weeks; q.8.w. = every 8 weeks; q.12.w. = every 12 weeks; q.16.w. = every 16 weeks; RAN = ranibizumab; TREX = treat and extend.
Note: As the inconsistency assessment for BCVA did not show any inconsistency, an inconsistency assessment was not reported for this end point.
aOdds ratio greater than 1 favours faricimab.
Source: Sponsor-submitted NMA.27
Figure 7: Network Diagram for the Outcome Ocular Adverse Effects at 12 Months
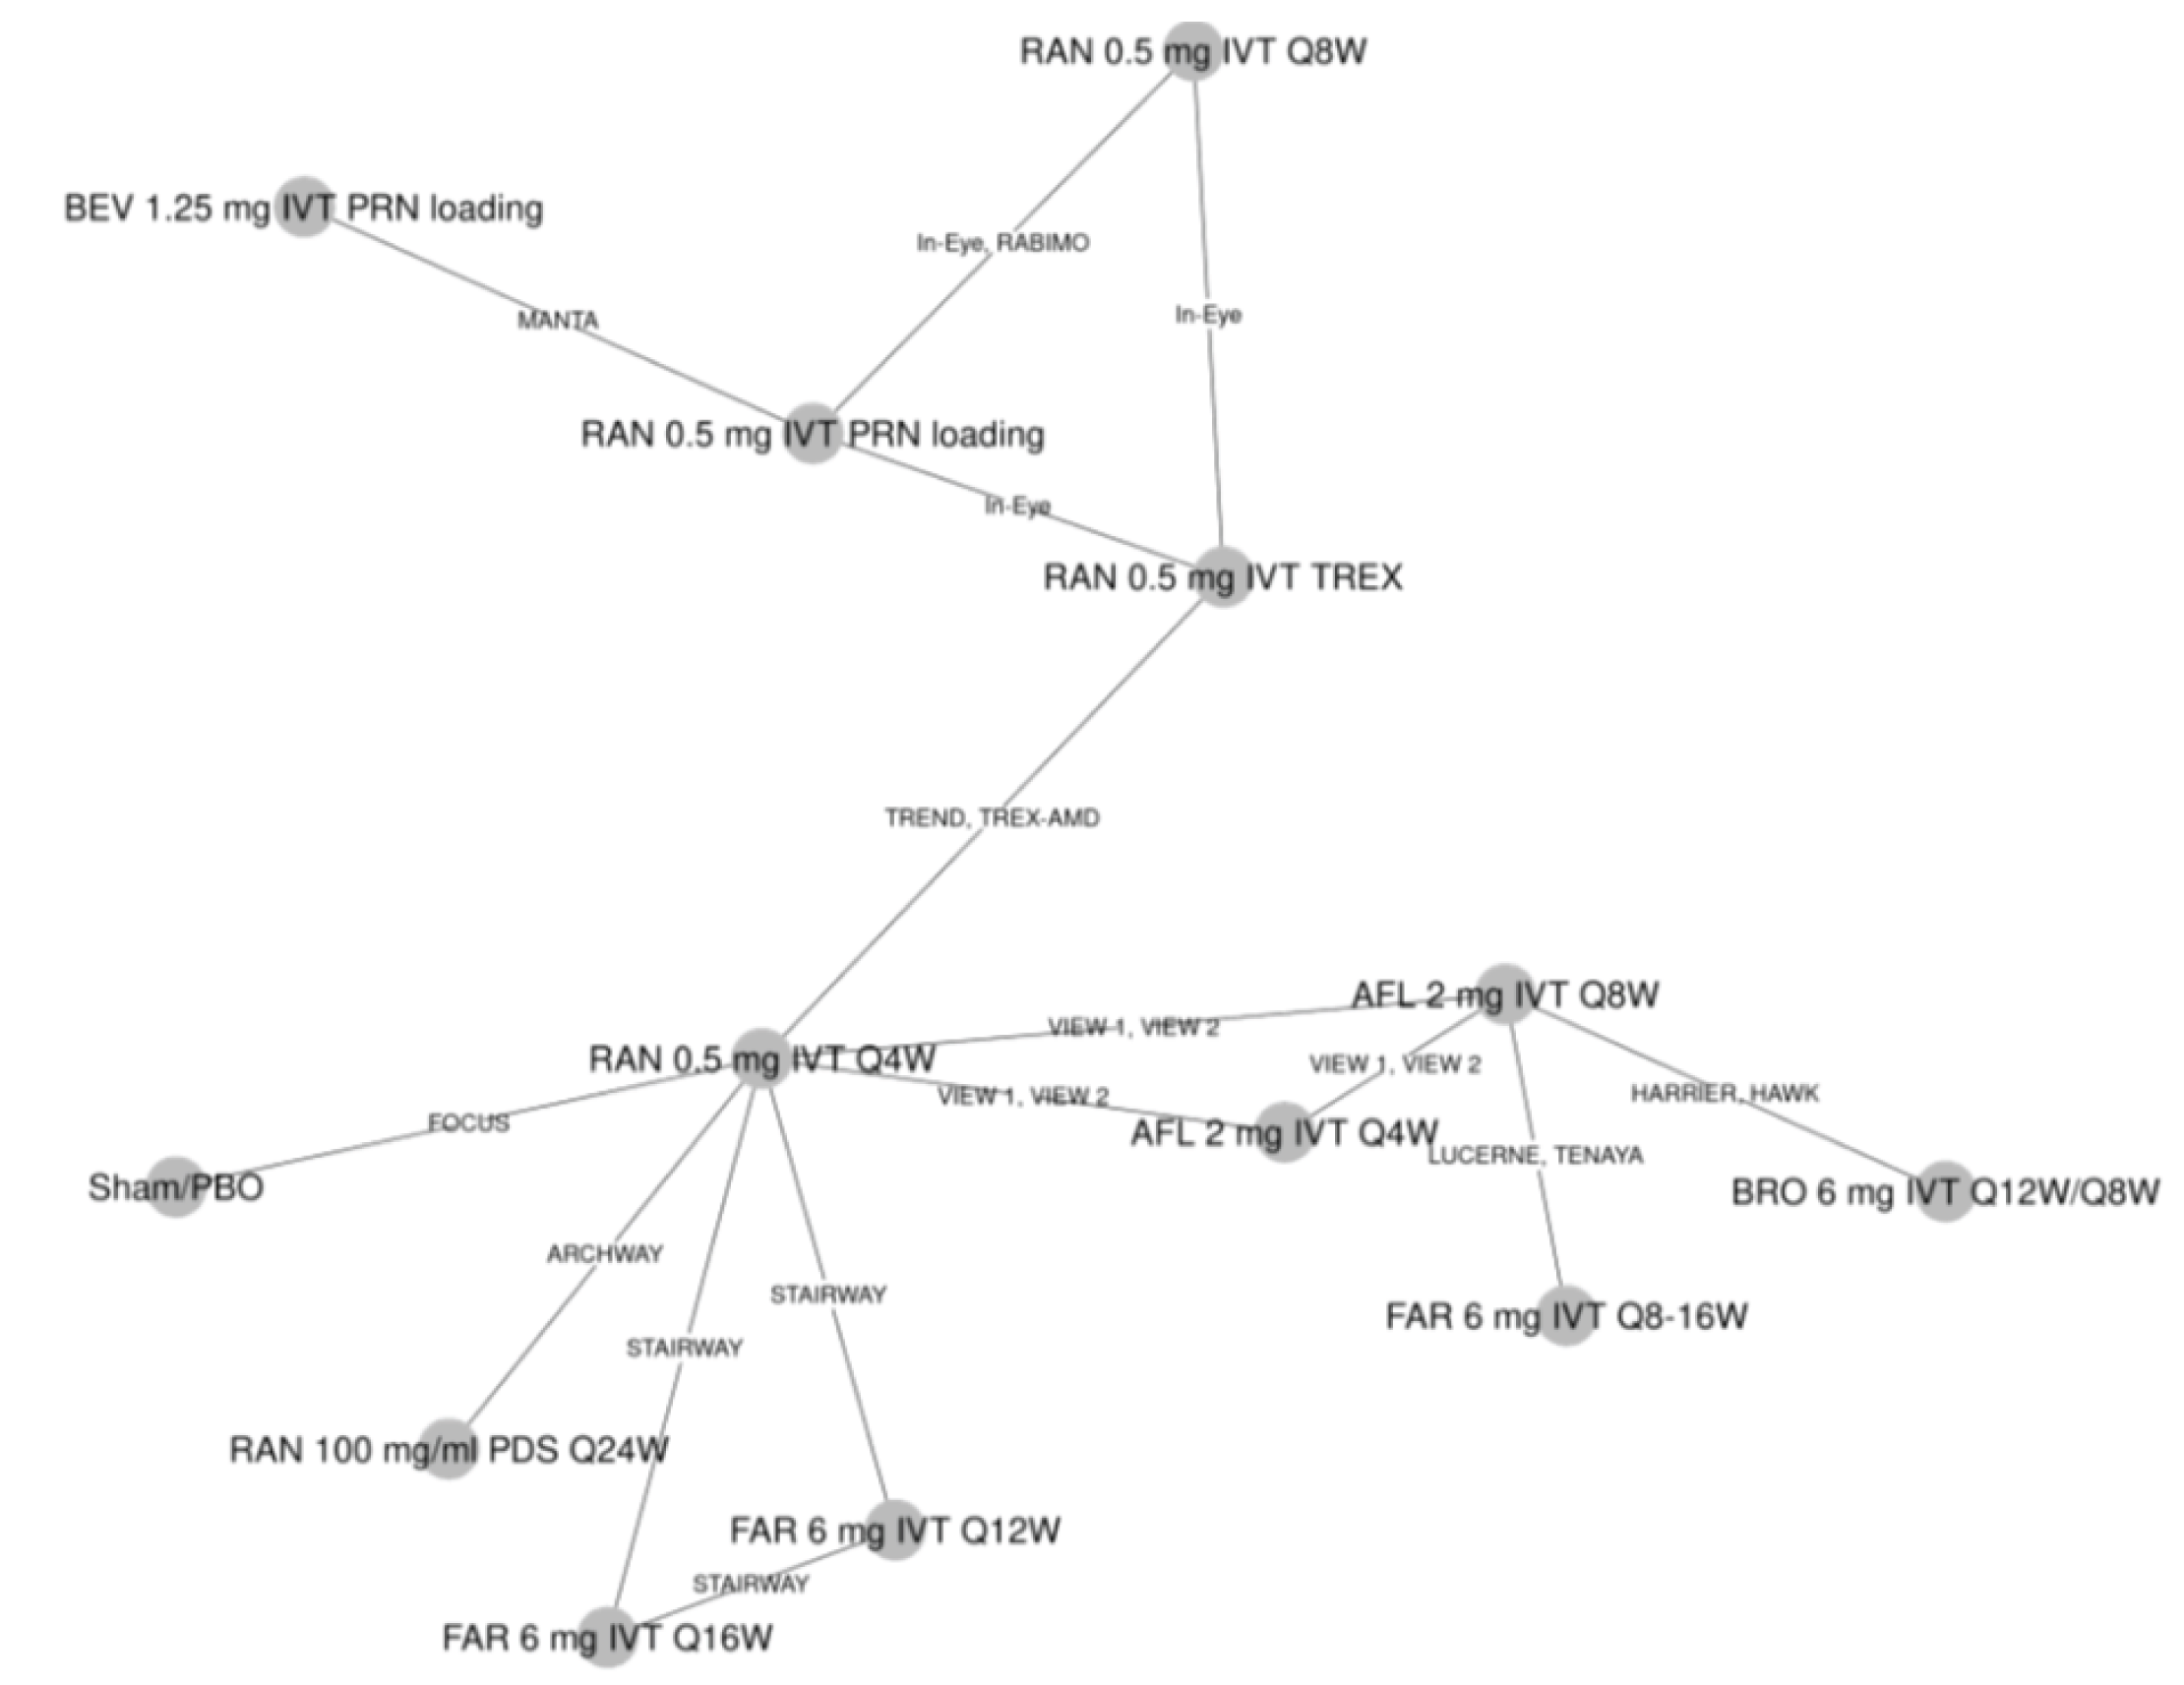
AFL = aflibercept; BEV = bevacizumab; FAR = faricimab; IVT = intravitreal; PDS = port delivery system; PBO = placebo; PRN = as needed; Q4W = every 4 weeks; Q6W = every 6 weeks; Q8W = every 8 weeks; Q12W = every 12 weeks; Q16W = every 16 weeks; Q24W = every 24 weeks; RAN = ranibizumab; TREX = treat and extend.
Source: Sponsor-submitted NMA.27
Figure 8: Network Diagram for Outcome Treatment Discontinuation at 12 Months
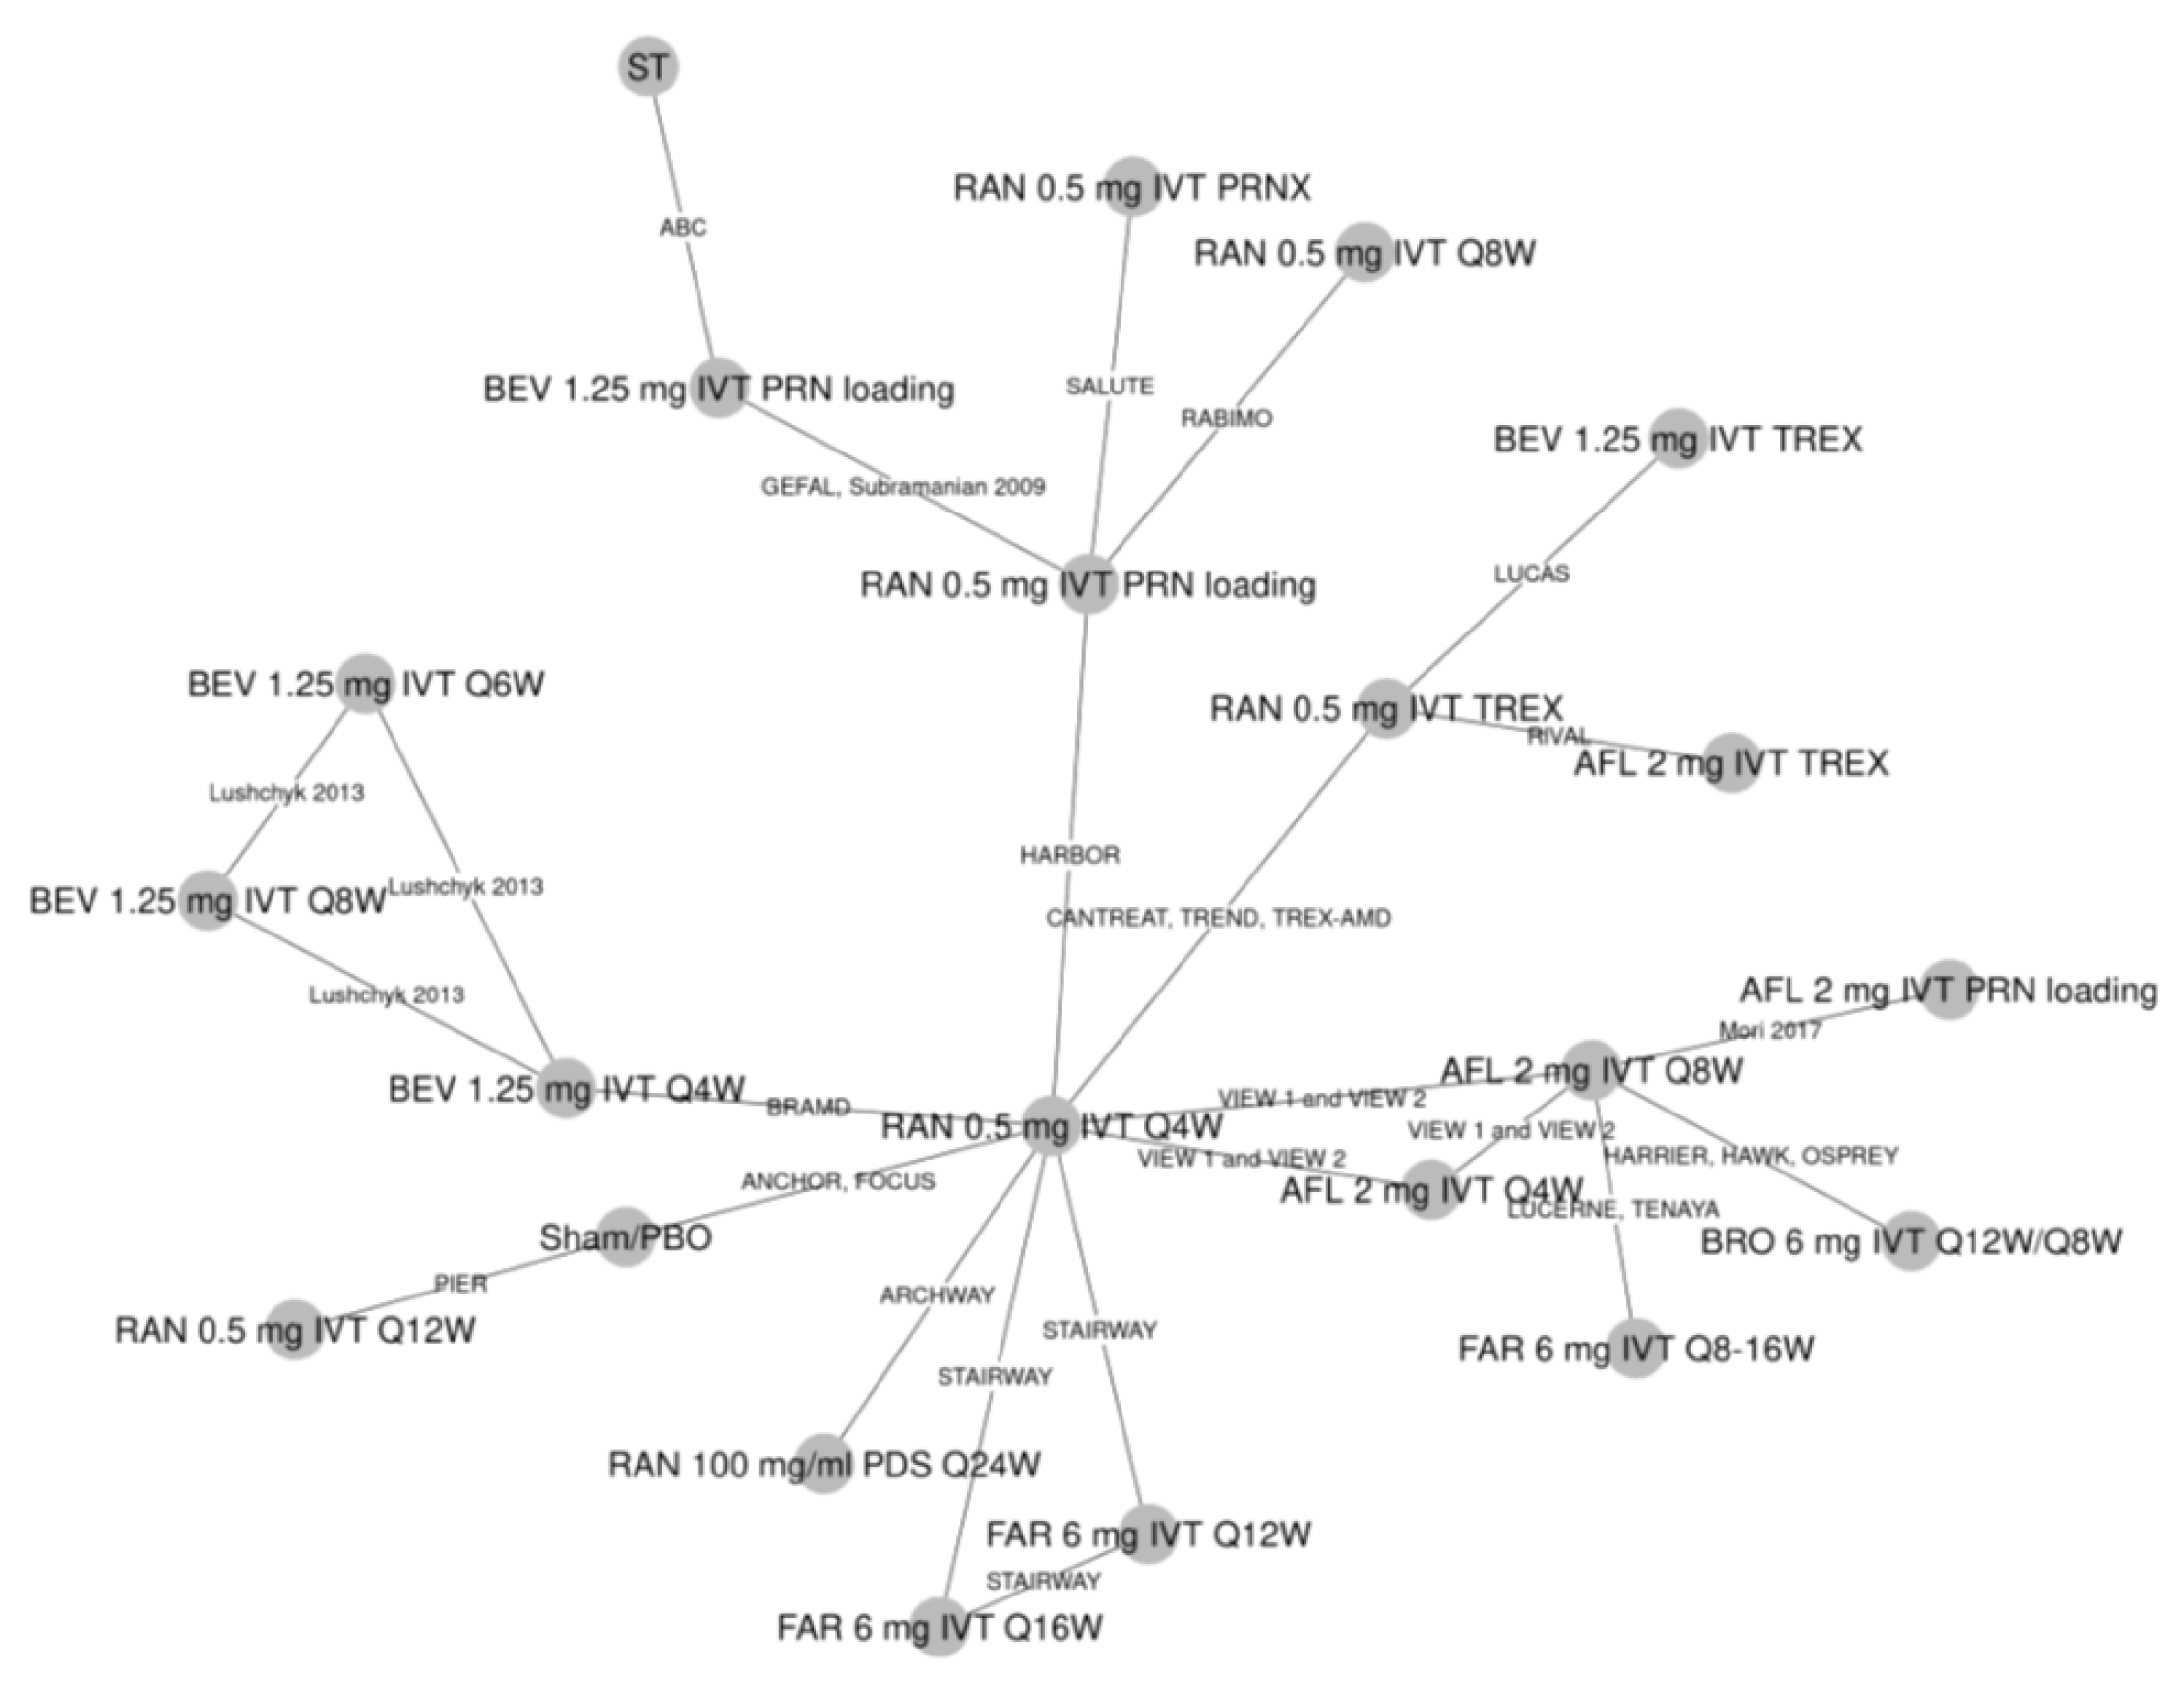
AFL = aflibercept; BEV = bevacizumab; BRO = brolucizumab; FAR = faricimab; IVT = intravitreal; PDS = port delivery system; PBO = placebo; PRN = as needed; PRNX = as needed and extend; Q4W = every 4 weeks; Q6W = every 6 weeks; Q8W = every 8 weeks; Q12W = every 12 weeks; Q16W = every 16 weeks; Q24W = every 24 weeks; RAN = ranibizumab; ST = standard treatment of photodynamic treatment with verteporfin for predominantly classic-type neovascular age-related macular degeneration, or intravitreal pegaptanib or sham treatment for occult or minimally classic-type neovascular age-related macular degeneration, pooled with sham arms. TREX = treat and extend.
Source: Sponsor-submitted NMA.27
Table 28: Treatment Discontinuation at 12 Months — ITC Results
Faricimab 6 mg IVT 8- and 16-week intervals vs. | Odds ratioa (95% CrI) |
|---|---|
FAR 6 mg IVT q.16.w. | 0.27 (0.01 to 8.03) |
FAR 6 mg IVT q.12.w. | 0.35 (0.01 to 10.64) |
AFL 2 mg IVT PRN loading | 0.85 (0.13 to 5.81) |
BEV 1.25 mg IVT q.4.w. | 1.08 (0.16 to 7.42) |
RAN 0.5 mg IVT PRNX | 1.16 (0.10 to 13.02) |
AFL 2 mg IVT q.8.w. | 1.19 (0.49 to 2.85) |
BRO 6 mg IVT q.12.w. and q.8.w. | 1.34 (0.41 to 4.16) |
RAN 0.5 mg IVT q.4.w. | 1.38 (0.31 to 5.96) |
AFL 2 mg IVT TREX | 1.47 (0.17 to 11.40) |
AFL 2 mg IVT q.4.w. | 1.60 (0.36 to 7.27) |
RAN 0.5 mg IVT TREX | 1.75 (0.29 to 8.92) |
BEV 1.25 mg IVT PRN loading | 1.86 (0.19 to 14.26) |
BEV 1.25 mg IVT TREX | 1.92 (0.21 to 13.80) |
RAN 0.5 mg IVT PRN loading | 2.01 (0.29 to 13.68) |
BEV 1.25 mg IVT q.8.w. | 2.33 (0.23 to 22.89) |
BEV 1.25 mg IVT q.6.w. | 4.21 (0.36 to 46.34) |
RAN 0.5 mg IVT q.12.w. | 4.32 (0.29 to 59.52) |
RAN 0.5 mg IVT q.8.w. | 6.06 (0.36 to 108.55) |
AFL = aflibercept; BEV = bevacizumab; BRO = brolucizumab; CrI = credible interval; IVT = intravitreal; PRN = as needed; PRNX = as needed and extend; q.4.w. = every 4 weeks; q.6.w. = every 6 weeks; q.8.w. = every 8 weeks; q.12.w. = every 12 weeks; q.16.w. = every 16 weeks; RAN = ranibizumab; TREX = treat and extend.
Note: As the assessment for BCVA did not show any inconsistency, an inconsistency assessment was not reported for this end point; a normal likelihood on the odds ratio scale with continuity correction was applied due to rare events; this may be a source of bias.
aOdds ratio greater than 1 favours faricimab.
Source: Sponsor-submitted NMA.27
Critical Appraisal of Sponsor-Submitted Indirect Treatment Comparison
The research question and inclusion criteria for the systematic review were reported in the ITC and feasibility assessment. The ITC NMA was based on a systematic literature review that identified studies according to pre-specified inclusion criteria. A comprehensive and transparent approach to the systematic review was provided, including the search strategy and the use of several databases. The literature search was comprehensive, involving multiple databases (i.e., Embase, the Cochrane Register of Controlled Trials, MEDLINE, clinical trial registries (e.g., clinicaltrials.gov), and conferences). The literature search was well reported, with a complete copy of the search strategy included in the report. Overall, study selection and data extraction methods were appropriate. Study selection was performed by 2 reviewers. Data extraction was performed by 1 reviewer and verified by a second reviewer independently. Any disagreements were resolved through consensus. A comprehensive list of inclusion and exclusion criteria for the studies in the systematic literature review was included. A risk of bias evaluation for the studies included in the systematic literature review was performed, based on tools that considered the appropriateness of randomization and allocation concealment, similarity at baseline across treatment groups in prognostic factors, masking, imbalances in dropouts, outcomes reporting, and ITT analysis. Whether risk of bias assessments were performed in duplicate was not reported. However, the risk of bias assessment for the studies ultimately included in the NMA was not presented and how the results of the quality appraisal factored into the NMA (e.g., sensitivity analyses excluding studies rated with a high risk of bias) was also not reported.
The inclusion criteria would allow for a population that is relevant to Canadian settings. The comparisons reported in this ITC have generally incorporated relevant treatments for Canadian settings, including treatments that have extensive clinical use but lack a formal review from Health Canada, such as bevacizumab, which is commonly used in Canada. However, the ranibizumab port delivery system was included, which was not considered relevant to the review of faricimab.
The degree of heterogeneity between the included studies was difficult to assess because of incomplete reporting of study and patient characteristics. Some study characteristics were inadequately reported in the ITC. Description of trial design, sample size and duration, and country were reported. However, the ITC failed to report on allocation concealment, methods used for handling missing data, and eligibility (inclusion and exclusion). There was considerable variability in study design, year of conduct, and sample size. Four phase II trials were included in the NMA; these trials included arms that were pooled with phase III trials. The degree of similarity between these trials was not reported, nor were the results of a sensitivity analysis examining the effects of pooling reported.
Baseline patient characteristics were reported in the ITC for all 37 studies that were included in the ITC. Clinical trial eligibility criteria were not described for the trials ultimately included in the NMA. Many individual studies failed to report or inadequately reported patient characteristics, resulting in gaps in the extracted ITC data. Information about key baseline characteristics, such as the presence of IRF and SRF, duration of nAMD and use of prior therapies, was lacking. Of those factors that were reported, baseline values were heterogeneous across studies. There was also heterogeneity in baseline patient characteristics, including age, sex distribution, race, and geographic location, and in the reporting of methods for measuring and in results of changes in retinal thickness. The apparent heterogeneity of the factors that were reported combined with the inability to assess those that were not reported means there is considerable uncertainty as to whether the assumptions related to homogeneity were met. The clinical expert consulted by CADTH agreed that patient populations and study methodologies were heterogenous. The technical report notes that there was no evidence that the treatment effect differed by patient characteristics (age, sex, ethnicity, and baseline BCVA) or that model fit was improved by patient characteristic meta-regressions. However, meta-regression was not performed for all relevant patient and study characteristics. In addition, the technical report states that “random-effects models were used as the principal analyses for all end points as absence of heterogeneity is implausible.” Furthermore, the technical report notes that, for some outcomes, such as the proportion of patients gaining or losing at least 10 or 15 ETDRS letters at 12 months, there were insufficient data to estimate between-study heterogeneity, making the models unstable and the results uninterpretable. Despite acknowledging the degree of heterogeneity, the technical report did not provide sufficient information of assessments of heterogeneity (e.g., graphic representation of baseline characteristics, and statistical tests) to fully understand the sources of heterogeneity. Heterogeneity may therefore have influenced the comparative efficacy and safety estimates, and it is not possible to quantify or identify the direction of the bias.
The technical report notes that there was no evidence that the treatment effect differed by patient characteristics or that model fit was improved with the patient characteristic meta-regressions, although these results were not provided. The schedule meta-regression using all schedule covariates had a lower DIC compared to the base-case separate-treatments model, but a poorer fit. Consequently, analyses of other outcomes used both the separate-treatments model (each treatment and schedule were treated as a separate node) and (for efficacy outcomes) the meta-regression with all schedule covariates. The meta-regression NMA is the base case for efficacy outcomes. The model fit was good in most cases, and where fit was poor (patients gaining or losing at least 10 or 15 ETDRS letters at 12 months), it is described in the relevant section.
Additional limitations to the ITC include the following:
The connection between faricimab and the rest of the network was weak: faricimab is only connected to the network through aflibercept via the LUCERNE and TENEYA trials, and through ranibizumab in a phase II trial.
The networks include a large number of interventions, as every dosing regimen explored was considered a separate node. Although there are some closed loops for some networks, overall, the nodes were connected by few trials.
The geometry of the networks likely contributed to uncertainty in the estimates for models the level of imprecision in certain comparisons as evidenced by wider credible intervals.
||||||||||||||||||||||||||||||||||||||||||||||||||||||||||||||||||||||||||||||||||||||||||||||||||||||||||||||||||||||||||||||||||||||||||||||||||||||||||||||||||||||||||||||||||||||||||||||||||||||||||||||||||||||||||||||||||||||||||||||||||||||||||||||||||||||||||||||||||||||||||||||||||||||||||||||||||||||||||||||||||||||||||||||||||||||||||||||||||| However, the results of the analysis related to number of injections may have been affected by protocol-driven administration of therapies with fixed intervals in clinical trials. In addition, there were minimal data on the variance for the number of injections.
The ITC suggests that faricimab 6 mg intravitreal every 8 to 16 weeks may be favourable (the 95% CrIs exclude the null) to bevacizumab regimens and ranibizumab 0.5 mg intravitreal every 8 weeks for the outcome of mean change in retinal thickness (CST). Additionally, brolucizumab 6 mg intravitreal every 8 to 12 weeks may be favourable (the 95% CrI excludes the null) to faricimab for this outcome. It is not clear from the sponsor’s report how the values for this outcome compared across the trials. This variability in how retinal thickness was defined, measured, and reported may contribute considerable heterogeneity to the ITC. However, heterogeneity in the methods to assess retinal thickness across studies adds considerable uncertainty to the results for this analysis and limits conclusions about the relative effect of faricimab on CRT.
As limited data were available for the NMAs conducted for ocular AEs and for treatment discontinuation, fixed-effects models were used for these end points, and there was a high degree of statistical uncertainty in these models. Limited data are therefore available from which to draw any conclusions about the effect of faricimab versus comparators on ocular AEs and treatment discontinuation.
Other Relevant Evidence
This section includes 2 phase II studies, which are summarized and appraised because they provide the only head-to-head comparisons between faricimab and ranibizumab.
Sponsor-Submitted Phase II Studies (STAIRWAY and AVENUE)
Description of Studies
The characteristics of the STAIRWAY and AVENUE studies are presented in Table 29. The STAIRWAY trial had 3 treatment arms, whereas the AVENUE trial had 5 arms. Results for arm B of the AVENUE study will not be presented in this report because the dosing regimen is outside the Health Canada–recommended dose for faricimab. The primary objective of the STAIRWAY trial was to evaluate the efficacy of faricimab compared to ranibizumab on visual acuity from baseline to week 40. The primary objective of the AVENUE study was to evaluate the efficacy of faricimab compared to ranibizumab monotherapy in treatment-naive patients from baseline to week 36, and in anti-VEGF incomplete-responder patients from week 12 to week 36.
Overviews of the study designs for the STAIRWAY and AVENUE trials are shown in Figure 9 and Figure 10, respectively.
Table 29: Details of STAIRWAY and AVENUE Studies
Details | STAIRWAY | AVENUE |
|---|---|---|
Designs and populations | ||
Study design | Phase II, multi-centre, randomized, double-blind active comparator-controlled trial | Phase II, multi-centre, randomized, active comparator-controlled, double-blind, parallel group trial |
Locations | 25 sites in the US | 58 sites in the US |
Patient enrolment dates | Between January 27, 2017, and March 29, 2017 | Between August 11, 2015, and January 12, 2017 |
Randomized (n) | 76 | 273 |
Inclusion criteria |
| |
Exclusion criteria |
| |
Drugsd | ||
Intervention |
|
|
Comparator | 0.5 mg ranibizumab IVT q.4.w. for 48 weeks (13 injections) | |
Duration | ||
Phase | ||
Screening | 4 weeks | 4 weeks |
Double-blind | 48 weeks | 32 weeks |
Follow-up | 4 weeks | 4 weeks |
Outcomes | ||
Primary end point | Mean change in BCVA, as measured on the ETDRS chart. from baseline to week 36 (measured in the treatment-naive population, defined as population A; all patients randomized to arms A, B, C, and D) Mean change in BCVA, as measured on the ETDRS chart, from week 12 to week 36 (measured in the anti-VEGF-incomplete-responder population, defined as population C; all patients randomized to arms A and E with a BCVA ≤ 68 at week 12) | |
Secondary and exploratory end points | Secondary:
Exploratory:
Safety:
Immunogenicity:
| Secondary:
Safety:
|
Notes | ||
Publications | Khanani et al. (2020),28 Dugel et al. (2018),29 NCT03038880 trial30 | Sahni et al. (2020),31 Dugel et al. (2018),29 NCT02484690 trial32 |
ADA = anti-drug antibody; AE = adverse event; AMD = age-related macular degeneration; BCVA = best corrected visual acuity; CFT = central foveal thickness; CNV = choroidal neovascularization; CST = central subfield thickness; ETDRS = Early Treatment Diabetic Retinopathy Study; FFA = fundus fluorescein angiography; IVT = intravitreal; OCT = optical coherence tomography; q.4.w. = every 4 weeks; q.12.w. = every 12 weeks; q.16.w. = every 16 weeks; nAMD = neovascular age-related macular degeneration; VEGF = vascular endothelial growth factor.
aCNV activity was defined as showing evidence of subretinal fluid, subretinal hyperreflective material, or leakage.
bCorresponds to 20/40 to 20/320 approximate Snellen equivalent.
cOther causes include ocular histoplasmosis, pathological myopia, trauma, choroidal rupture, angioid streaks, or uveitis.
dOnly 1 eye was chosen as the study eye in each trial.
Source: STAIRWAY Clinical Study Report33 and AVENUE Clinical Study Report.34
Figure 9: Study Design Schematic for STAIRWAY Trial
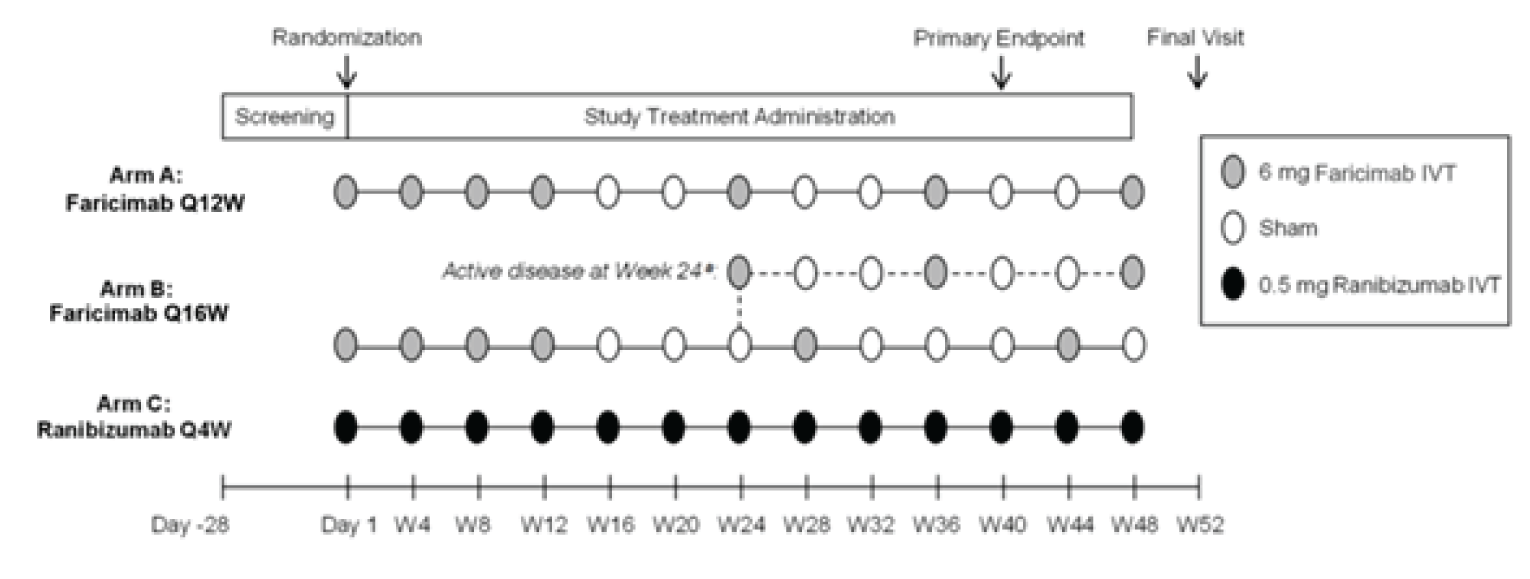
IVT = intravitreal; Q4W = every 4 weeks; Q12W = every 12 weeks; Q16W = every 16 weeks; W = week.
Source: STAIRWAY Clinical Study Report.33
Figure 10: Study Design Schematic for AVENUE Trial
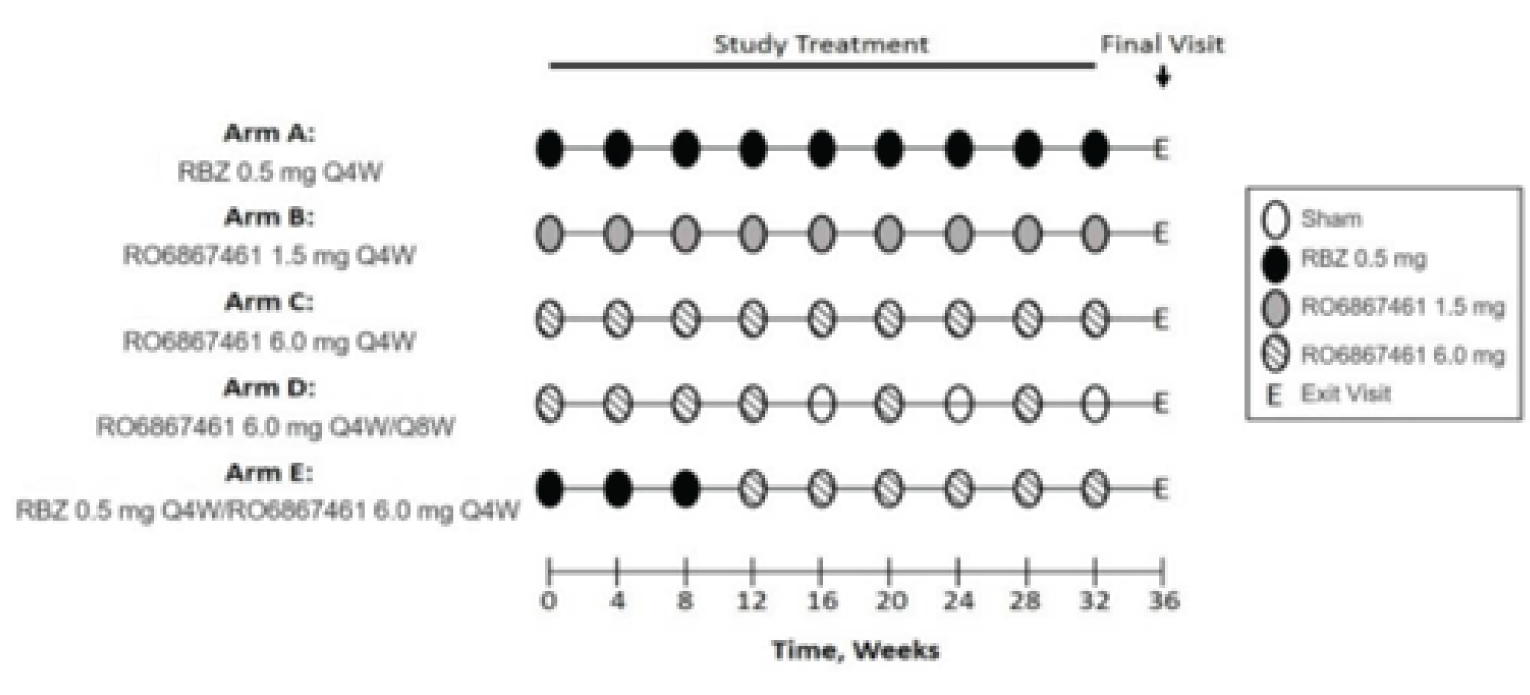
E = exit visit; IVT = intravitreal; Q4W = every 4 weeks; Q8W = every 8 weeks; RBZ = ranibizumab.
Source: AVENUE Clinical Study Report.34
Baseline Characteristics
The baseline characteristics of the studies are presented in Table 30 and Table 31. Characteristics were generally similar between treatment groups in each study and between studies.
Table 30: Summary of Baseline Characteristics in STAIRWAY (ITT Population)
Characteristic | Arm A Faricimab 6 mg q.12.w. (N = 24) | Arm B Faricimab 6 mg q.16.w. (N = 31) | Arm C Ranibizumab 0.5 mg q.4.w. (N = 16) |
|---|---|---|---|
Age in years, mean (SD) | 80.3 (7.23) | 77.7 (8.38) | 77.3 (10.29) |
Sex | |||
Male, n (%) | 11 (45.8) | 13 (41.9) | 6 (37.5) |
Female, n (%) | 13 (54.2) | 18 (58.1) | 10 (62.5) |
Race, n (%) | |||
White | 23 (95.8) | 30 (96.8) | 16 (100.0) |
Asian | 0 | 1 (3.2) | 0 |
Black or African-American | 1 (3.2) | 0 | 0 |
BCVA (ETDRS letters read) | |||
Mean (SD) | 57.8 (10.5) | 60.4 (10.8) | 55.3 (12.1) |
Central foveal thickness (µm) | |||
Mean (SD) | 290.8 (118.6) | 280.8 (99.0) | 375.6 (159.4) |
Central subfield thickness (µm) | |||
Mean (SD) | 417.9 (84.3) | 382.2 (80.9) | 443.1 (125.0) |
CNV location,a n (%) | |||
Subfoveal | 24 (100.0) | 29 (93.5) | 16 (100.0) |
Juxtafoveal | 0 | 2 (6.5%) | 0 |
CNV lesion type,a n (%) | |||
Occult | 15 (62.5) | 20 (64.5) | 8 (50.0) |
Classic and occult | 9 (37.5) | 9 (29.0) | 6 (37.5) |
Classic CNV | 0 | 2 (6.5) | 2 (12.5) |
Total area of CNV lesiona in mm2, mean (SD) | 7.1 (3.9) | 5.9 (3.8) | 7.3 (2.9) |
Presence of IRF, n (%) | |||
Yes | 23 (95.8) | 22 (71.0) | 13 (81.3) |
No | 1 (4.2) | 9 (29.0) | 3 (18.8) |
Presence of SRF, n (%) | |||
Yes | 19 (79.2) | 27 (87.1) | 12 (75.0) |
No | 5 (20.8) | 4 (12.9) | 4 (25.0) |
Presence of PED, n (%) | |||
Yes | 22 (91.7) | 22 (71.0) | 14 (87.5) |
No | 2 (8.3) | 9 (29.0) | 2 (12.5) |
BCVA = Best corrected visual acuity; CNV = choroidal neovascularization; ETRDS = Early Treatment Diabetic Retinopathy Study; IRF = intraretinal fluid; ITT = intention-to-treat; PED = pigment epithelial detachment; q.4.w. = every 4 weeks; q.12.w. = every 12 weeks; q.16.w. = every 16 weeks; SRF = subretinal fluid; SD = standard deviation.
aMeasured by fundus fluorescein angiography.
Source: STAIRWAY Clinical Study Report.33
Table 31: Summary of Baseline Characteristics in AVENUE (All Patients)
Characteristic | Arm A Ranibizumab 0.5 mg q.4.w. (N = 68) | Arm C Faricimab 6 mg q.4.w. (N = 39) | Arm D Faricimab 6 mg q.4.w. (week 12), q.8.w. (week 28) (N = 46) | Arm E Ranibizumab 0.5 mg q.4.w. (week 8), faricimab 6 mg q.4.w. (week 32) (N = 64) |
|---|---|---|---|---|
Age in years, mean (SD) | 76.4 (8.9) | 78.0 (9.1) | 80.0 (8.0) | 79.2 (8.3) |
Sex | ||||
Male, n (%) | 29 (42.6) | 12 (30.8) | 12 (26.1) | 24 (37.5) |
Female, n (%) | 39 (57.4) | 27 (69.2) | 34 (73.9) | 40 (62.5) |
Race, n (%) | ||||
White | 66 (97.1) | 39 (100.0) | 44 (95.7) | 64 (100.0) |
Black or African-American | 1 (1.5) | 0 | 0 | 0 |
Multiple | 1 (1.5) | 0 | 0 | 0 |
Unknown | 0 | 0 | 1 (2.2) | 0 |
BCVA (ETDRS letters read) | ||||
Mean (SD) | 55.2 (12.7) | 56.2 (12.2) | 56.3 (11.5) | 55.7 (11.6) |
≤ 54, n (%) | 22 (32.8) | 15 (38.5) | 21 (45.7) | 26 (40.6) |
> 54, n (%) | 45 (67.2) | 24 (61.5) | 25 (54.3) | 38 (59.4) |
Low luminance deficit categories | ||||
< 26, n (%) | 34 (50.7) | 18 (46.2) | 16 (35.6) | 32 (50.0) |
≥ 26, n (%) | 33 (49.3) | 21 (53.8) | 29 (64.4) | 32 (50.0) |
CNV lesion type,a n (%) | ||||
Classic and occult | 26 (38.8) | 12 (30.8) | 20 (44.4) | 21 (32.8) |
Classic CNV | 8 (11.9) | 7 (17.9) | 6 (13.3) | 10 (15.6) |
Occult | 33 (49.3) | 20 (51.3) | 19 (42.2) | 33 (51.6) |
PCV | 7 (10.8) | 3 (7.9) | 5 (11.6) | 7 (11.1) |
RAP | 22 (33.8) | 9 (23.7) | 14 (32.6) | 16 (25.4) |
Dry AMD, n (%) | ||||
Present | 25 (36.8) | 13 (33.3) | 19 (41.3) | 33 (51.6) |
Absent | 43 (63.2) | 26 (66.7) | 27 (58.7) | 31 (48.4) |
AMD = aged-related macular degeneration; BCVA = best corrected visual acuity; CNV = choroidal neovascularization; ETRDS = Early Treatment Diabetic Retinopathy Study; PCV = polypoidal choroidal vasculopathy; q.4.w. = every 4 weeks; q.8.w. = every 8 weeks; RAP = retinal angiomatous proliferation; SD = standard deviation.
aMeasured by fundus fluorescein angiography.
Source: AVENUE Clinical Study Report.34
Statistical Analysis
The analysis for the AVENUE study was based on a hypothesis test of superiority between faricimab and ranibizumab, with a null hypothesis of no difference between each of the faricimab treatment groups and the ranibizumab control group. The STAIRWAY study was not hypothesis-based, but focused on estimation of treatment effects between the 2 faricimab treatment schedules and ranibizumab. Both trials used an MMRM for primary efficacy analyses of the change in BCVA and generalized estimating equations for the difference in the proportion of patients who gained or lost 15 or more letters in BCVA. All measures of treatment effect were reported with 80% CIs in both trials.
Analyses in the AVENUE study were conducted on 2 populations: the treatment-naive population (population A, comprising treatment arms A, B, C, and D) and the anti-VEGF incomplete-responder population, also referred to as the treatment-experienced population (population C, comprising treatment arms A and E).
Results
Patient Disposition
Table 32 summarizes the disposition of patients for the STAIRWAY trial. A total of 137 patients were screened, and 76 (55.5%) were randomized into the trial in 3 arms. Table 33 summarizes the disposition of patients for the AVENUE trial. A total of 507 patients were screened, and 68 (25.9%), 42 (16.0%), 47 (17.9%), and 69 (26.2%) patients were randomized to arms A, C, D, and E, respectively.
Efficacy
Given the designs and planned analyses of the trials, the summary of results in this report focuses on the studies’ primary objectives to assess the effects of treatment on BCVA (Table 34, Table 35, and Table 36).
In the STAIRWAY trial, the mean differences between the faricimab and ranibizumab arms in BCVA were −2.1 ETDRS letters (80% CI, −6.8 to 2.6) in arm A and 1.1 letters (80% CI, −3.4 to 5.5) in arm B at week 40, and 0.5 letters (80% CI, −4.3 to 5.3) in arm A and 1.8 letters (80% CI, −2.7 to 6.4) in arm B at week 52. In the AVENUE trial, the mean differences between the faricimab and ranibizumab arms in BCVA were −1.6 letters (80% CI, −4.9 to 1.7) in arm C and 1.5 letters (80% CI, −4.6 to 1.6) in arm D in the treatment-naive population A, and −1.7 (80% CI, −3.8 to 0.4) in the treatment-experienced population C in the AVENUE trial.
Table 32: Patient Disposition for the STAIRWAY Trial
Disposition | Arm A Faricimab 6 mg q.12.w. (N = 24) | Arm B Faricimab 6 mg q.16.w. (N = 31) | Arm C Ranibizumab 0.5 mg q.4.w. (N = 16) |
|---|---|---|---|
Screened, n | 137 | ||
Randomized, n (%) | 29 (38.2) | 31 (40.8) | 16 (21.0) |
Treated, n (%) | 24 (82.8) | 31 (100.0) | 16 (100.0) |
Discontinued study before week 52, n (%) | 3 (12.5) | 3 (9.7) | 0 |
Physician decision | 2 (8.3) | 1 (3.2) | 0 |
Death | 1 (4.2) | 2 (6.5) | 0 |
q.4.w. = every 4 weeks; q.12.w. = every 12 weeks; q.16.w. = every 16 weeks.
Source: STAIRWAY Clinical Study Report.33
Table 33: Patient Disposition for the AVENUE Trial
Disposition | Arm A Ranibizumab 0.5 mg q.4.w. (N = 68) | Arm C Faricimab 6 mg q.4.w. (N = 39) | Arm D Faricimab 6 mg q.4.w. (week 12), q.8.w. (week 28) (N = 46) | Arm E Ranibizumab 0.5 mg q.4.w. (week 8), faricimab 6 mg q.4.w. (week 32) (N = 64) |
|---|---|---|---|---|
Screened, n | 507 | |||
Randomized, n (%) | 68 (25.9) | 42 (16.0) | 47 (17.9) | 69 (26.2) |
Treated, n (%) | 68 (100.0) | 39 (92.9) | 46 (97.9) | 64 (92.8) |
Discontinued the study, n (%) | 4 (5.9) | 3 (7.7) | 2 (4.3) | 6 (9.4) |
Physician decision | 2 (2.9) | 1 (2.6) | 0 | 0 |
Withdrawal by patients | 1 (1.5) | 1 (2.6) | 2 (4.3) | 0 |
Lost to follow-up | 0 | 1 (2.6) | 0 | 0 |
Death | 0 | 0 | 0 | 1 (1.6) |
Adverse events | 1 (1.5) | 0 | 0 | 5 (7.8) |
q.4.w. = every 4 weeks; q.8.w. = every 8 weeks.
Source: AVENUE Clinical Study Report.34
Table 34: BCVA Outcomes in STAIRWAY Trial
Outcomes | Arm A Faricimab 6 mg q.12.w. (N = 24) | Arm B Faricimab 6 mg q.16.w. (N = 31) | Arm C Ranibizumab 0.5 mg q.4.w. (N = 16) |
|---|---|---|---|
Mean change in letters from baseline in BCVA at week 40 (ITT population; primary end point) | |||
Patients contributing to analysis, n (%) | 21 (87.5) | 28 (90.3) | 15 (93.8) |
Observed mean (SD) | 9.8 (10.8) | 13.1 (11.7) | 11.9 (12.8) |
Least squares mean (80% CI)a | 9.3 (6.4 to 12.3) | 12.5 (9.9 to 15.1) | 11.4 (7.8 to 15.0) |
Difference in letters, mean (80% CI) | −2.1 (−6.8 to 2.6) | 1.1 (−3.4 to 5.5) | Reference |
Mean change in letters from baseline in BCVA at week 52 (ITT population; primary end point) | |||
Patients contributing to analysis, n (%) | 21 (87.5) | 28 (90.3) | 16 (100.0) |
Observed mean (SD) | 10.0 (10.0) | 12.3 (12.1) | 10.1 (12.8) |
Least squares mean (80% CI)a | 10.1 (7.1 to 13.1) | 11.4 (8.8 to 14.1) | 9.6 (5.9 to 13.3) |
Difference in letters, mean (80% CI) | 0.5 (−4.3 to 5.3) | 1.8 (−2.7 to 6.4) | Reference |
Proportion of patients gaining ≥ 15 letters in BCVA from baseline at week 52 (observed data; secondary end point) | |||
Patients contributing to analysis, n (%) | 21 (87.5) | 28 (90.3) | 16 (100.0) |
Proportion, % (80% CI) | 33.3 (20.2 to 46.5) | 46.4 (34.4 to 58.5) | 37.5 (22.0 to 53.0) |
Difference in proportions, % (80% CI) | −4.2 (−24.5 to 16.2) | 8.9 (−10.7 to 28.6) | Reference |
Proportion of patients avoiding loss of ≥ 15 letters in BCVA from baseline at week 52 (observed data; secondary end point) | |||
Patients contributing to analysis, n (%) | 21 (87.5) | 28 (90.3) | 16 (100.0) |
Proportion, % (80% CI) | 100 (100 to 100) | 96.4 (91.9 to 100) | 100 (100 to 100) |
Difference in proportions, % (80% CI) | 0 | −3.6 (−8.1 to 0.9) | Reference |
BCVA = best corrected visual acuity; CI = confidence interval; ITT = intention-to-treat; MMRM = mixed model for repeated measures; q.4.w. = every 4 weeks; q.12.w. = every 12 weeks; q.16.w. = every 16 weeks; SD = standard deviation.
aMean BCVA change from baseline generated using a mixed model for repeated measures. Model includes categorical covariates of treatment group, visit, and visit-by-treatment-group interaction, and the continuous covariate of baseline BCVA.
Source: STAIRWAY Clinical Study Report.33
Table 35: BCVA Outcomes in Treatment-Naive Population A of the AVENUE Trial (ITT Population)
Outcomes | Arm A Ranibizumab 0.5 mg q.4.w. (N = 68) | Arm C Faricimab 6 mg q.4.w. (N = 39) | Arm D Faricimab 6 mg q.4.w. (week 12), q.8.w. (week 28) (N = 46) |
|---|---|---|---|
Mean change in letters from baseline to week 36 (ITT population; primary end point) | |||
Patients contributing to analysis, n (%) | 64 (94.1) | 37 (94.9) | 44 (95.7) |
Observed mean (SD) | 8.5 (10.8) | 5.9 (15.2) | 6.3 (11.6) |
Least squares mean (80% CI) | 7.6 (5.4 to 9.8) | 6.0 (3.2 to 8.8) | 6.1 (3.6 to 8.6) |
Difference in letters, mean (80% CI) | Reference | −1.6 (−4.9 to 1.7) | −1.5 (−4.6 to 1.6) |
Proportion of patients gaining ≥ 15 letters in BCVA from baseline at week 36 (ITT population; secondary end point) | |||
Observed % of patients | 31.3 | 27.0 | 22.7 |
Least squares mean (80% CI)a | 31.0 (24.1 to 38.8) | 27.9 (19.6 to 38.0) | 23.7 (16.5 to 32.7) |
Difference in proportions, % (80% CI) | Reference | −3.1 (−15.0 to 8.8) | −7.3 (−18.3 to 3.7) |
BCVA = best corrected visual acuity; CI = confidence interval; ITT = intention-to-treat; q.4.w. = every 4 weeks; q.8.w. = every 8 weeks; SD = standard deviation.
aProportions were estimated using a longitudinal generalized estimating equation model. Categorical time (visits), study arm, and their interaction were used as predictors in the model.
Source: AVENUE Clinical Study Report.34
Table 36: BCVA Outcomes in the Treatment-Experienced Population C for AVENUE Trial (ITT population)
Outcomes | Arm A Ranibizumab 0.5 mg q.4.w. (N = 37) | Arm E Ranibizumab 0.5 mg q.4.w. (week 8), faricimab 6 mg q.4.w. (week 32) (N = 38) |
|---|---|---|
Mean change in letters from week 12 baseline to week 36 (ITT population; primary end point) | ||
Patients contributing to analysis, n (%) | 35 (94.6) | 37 (97.4) |
Observed mean (SD) | 2.1 (7.0) | 0.6 (6.5) |
Least squares mean (80% CI) | 1.7 (−0.7 to 4.1) | 0.04 (−2.3 to 2.4) |
Difference in letters, mean (80% CI) | Reference | −1.7 (−3.8 to 0.4) |
Proportion of patients gaining ≥ 15 letters in BCVA from week 12 baseline to week 36 (ITT population; secondary end point) | ||
Observed % of patients | 5.7 | 0 |
Difference in proportionsa, % (80% CI) | Reference | −5.7 (−10.7 to −0.7) |
BCVA = best corrected visual acuity; CI = confidence interval; ITT = intention-to-treat; q.4.w. = every 4 weeks; SD = standard deviation.
Note: Baseline is defined as the last non-missing assessment before week 12 dosing. P values for differences of proportions computed using the Fisher exact test.
aProportions were estimated using a longitudinal generalized estimating equation model. Categorical time (visits), study arm, and their interaction were used as predictors in the model.
Source: AVENUE Clinical Study Report.34
Harms
The frequencies of AEs in the STAIRWAY and AVENUE studies are shown in Table 37 and Table 38, respectively. The harms and notable harms were similar across both phase II trials and in the pivotal trials. The total percentage of patients who experienced an AE in the STAIRWAY trial was higher in the ranibizumab arm than in the faricimab arms. However, the percentages of patients who experienced SAEs and who died were higher in the faricimab arms, with no events occurring in the ranibizumab arm. In the faricimab arms, the SAEs were non–ocular-related (cardiac disorders) and the 3 deaths were associated with ischemic stroke, sepsis, and metastatic neoplasm.
In the AVENUE trial, the total percentage of patients with AEs was higher in arms D and E than in arms A and C. One death, which occurred in arm E, was related to cardiorespiratory arrest.
Table 37: Safety Summary for STAIRWAY Trial (Safety-Evaluable Patients)
Safety-related events | Arm A Faricimab 6 mg q.12.w. (N = 24) | Arm B Faricimab 6 mg q.16.w. (N = 31) | Arm C Ranibizumab 0.5 mg q.4.w. (N = 16) |
|---|---|---|---|
Total deaths, n (%) | 1 (4.2) | 2 (6.5) | 0 |
Total patients withdrawn from study due to AE, n (%) | 0 | 0 | 0 |
Total patients with ≥ 1 AE, n (%) | 18 (75.0) | 23 (74.2) | 13 (81.3) |
Ocular AEs in the study eye | 9 (37.5) | 11 (35.5) | 8 (50.0) |
Non-ocular AEs | 14 (58.3) | 20 (64.5) | 9 (56.3) |
SAEs | 4 (16.7) | 3 (9.7) | 0 |
Serious ocular AEs | 0 | 0 | 0 |
Serious non-ocular AEs | 4 (16.7) | 3 (9.7) | 0 |
Notable harms | |||
Endophthalmitis, n (%) | 0 | 0 | 0 |
Retinal vasculitis, n (%) | NR | NR | NR |
Intraocular inflammation, n (%) | 1 (4.2) | 1 (0.3) | 0 |
Conjunctival hemorrhage, n (%) | 5 (20.8) | 4 (12.9) | 4 (25.0) |
Retinal hemorrhage, n (%) | NR | NR | NR |
Rhegmatogenous retinal detachment, n (%) | 0 | 0 | 0 |
Retinal tear, n (%) | NR | NR | NR |
Vitreous floaters, n (%) | 0 | 0 | 1 (6.3) |
Increase in IOP, n (%) | 0 | 0 | 1 (6.3) |
Glaucoma, n (%) | 3 (12.5) | 2 (6.5) | 3 (18.8) |
ATE,a n (%) | 0 | 0 | 0 |
AE = adverse event; ATE = arterial thromboembolic events; IOP = intraocular pressure; NR = not reported; q.4.w. = every 4 weeks; q.12.w. = every 12 weeks; q.16.w. = every 16 weeks; SAE = serious adverse events.
aAnti-Platelet Trialists’ Collaboration–defined ATEs, defined as nonfatal strokes or nonfatal myocardial infarctions, or vascular deaths (including deaths of unknown causes).
Source: STAIRWAY Clinical Study Report.33
Table 38: Safety Summary for the AVENUE Trial (Safety-Evaluable Patients)
Characteristic | Arm A Ranibizumab 0.5 mg q.4.w. (N = 67) | Arm C Faricimab 6 mg q.4.w. (N = 39) | Arm D Faricimab 6 mg q.4.w. (week 12), q.8.w. (week 28) (N = 46) | Arm E Ranibizumab 0.5 mg q.4.w. (week 8), faricimab 6 mg q.4.w. (week 32) (N = 64) |
|---|---|---|---|---|
Total deaths, n (%) | 0 | 0 | 0 | 1 (1.6) |
Total patients with ≥ 1 AE, n (%) | 51 (76.1) | 31 (79.5) | 39 (84.8) | 54 (84.4) |
Ocular AEs in the study eye | 28 (41.8) | 21 (53.8) | 27 (58.7) | 28 (43.8) |
Non-ocular AEs | 37 (55.2) | 23 (59.0) | 30 (65.2) | 43 (67.2) |
SAEs | 9 (13.4) | 7 (17.9) | 5 (10.9) | 8 (12.5) |
Serious systemic AEs | 9 (13.4) | 7 (17.9) | 4 (8.7) | 6 (9.4) |
Notable harms | ||||
Endophthalmitis, n (%) | 0 | 0 | 0 | 1 (1.6) |
Retinal vasculitis, n (%) | NR | NR | NR | NR |
Intraocular inflammation, n (%) | 0 | 0 | 0 | 0 |
Conjunctival hemorrhage, n (%) | 13 (19.4) | 6 (15.4) | 6 (13.0)) | 6 (9.4) |
Retinal hemorrhage, n (%) | 1 (1.5) | 0 | 0 | 1 (1.6) |
Rhegmatogenous retinal detachment, n (%) | NR | NR | NR | NR |
Retinal tear (fellow eye), n (%) | 0 | 1 (2.6) | 0 | 0 |
Vitreous floaters, n (%) | 2 (3.0) | 4 (10.3) | 2 (4.3) | 0 |
Increase in IOP, n (%) | 0 | 0 | 0 | 1 (1.6) |
Glaucoma, n (%) | 0 | 0 | 0 | 1 (1.6) |
ATE,a n (%) | NR | NR | NR | NR |
AE = adverse event; ATE = arterial thromboembolic events; IOP = intraocular pressure; NR = not reported; q.4.w. = every 4 weeks; q.8.w. = every 8 weeks; SAEs = serious adverse event.
aAnti-Platelet Trialists’ Collaboration–defined ATEs, defined as nonfatal strokes or nonfatal myocardial infarctions, or vascular deaths (including deaths of unknown causes).
Source: AVENUE Clinical Study Reporty.34
Critical Appraisal
The phase II STAIRWAY and AVENUE studies were the only identified head-to-head studies between faricimab and ranibizumab. Ranibizumab was identified as a relevant comparator in the CADTH systematic review protocol. Both the STAIRWAY and AVENUE studies were double-blinded to minimize bias. The primary end point of the studies (change from baseline in BCVA as measured on the ETDRS chart) was appropriate and considered an important outcome by patients and clinicians. The treatment arms were generally well balanced. The trial eligibility criteria were appropriate for the indication, and the trial populations were representative of the Canadian patient population, based on baseline characteristics. While the dropout rates due to AEs were similar for all arms in the STAIRWAY trial, they were highest (7.8%) in arm E of the AVENUE trial. Because the duration of the double-blind treatment period was relatively short, we cannot draw conclusions about long-term outcomes. The dose and treatment intervals for faricimab for all treatment arms except for arm B in the AVENUE trial were aligned with the Health Canada product monograph. In terms of harms and notable harms, all treatment arms had small sample sizes and few events, making it difficult to draw any conclusions from either trial.
The study designs and planned analyses were the key limitations to the STAIRWAY and AVENUE studies. The phase II designs were not appropriate for testing the superiority of faricimab versus ranibizumab. As the STAIRWAY trial was only designed as an exploratory study that did not test a hypothesis, the CADTH review team was unable to draw conclusions about the relative efficacy and safety of faricimab compared to ranibizumab. Furthermore, the STAIRWAY trial sample size was small, consisting of 73 patients. The AVENUE study was designed to test an a priori hypothesis that faricimab was superior to ranibizumab. The primary objective of the AVENUE study was not met, as no statistically significant difference between the faricimab and ranibizumab treatment groups was identified for the primary end point in either analysis subpopulation.
Discussion
Summary of Available Evidence
This report summarizes the evidence on faricimab based on 2 phase III RCTs, a single ITC, and 2 phase II RCTs.
Two studies, TENAYA and LUCERNE, met the inclusion criteria for the systematic review. They were identically designed phase III, RCTs that evaluated the noninferiority of faricimab to aflibercept through the change from baseline in BCVA (ETDRS letter) averaged over weeks 40, 44, and 48 in the ITT population. The mean age of enrolled patients at baseline in these studies was between 74 and 77 years, and the majority were female and White. The mean time since the diagnosis of nAMD was between 1.5 and 3.2 months, and the majority has a baseline BCVA of 73 to 55 letters on an ETDRS chart. Patients were required to be treatment-naive to therapies for nAMD.
The STAIRWAY and AVENUE studies were also summarized and appraised as supportive evidence based on the phase II designs. These phase II RCTs provided the only head-to-head comparisons between faricimab and ranibizumab to date.
One sponsor-submitted ITC was summarized and critically appraised. The sponsor performed an NMA to estimate the comparative effectiveness and safety of faricimab in patients with nAMD compared to those of other anti-VEGFs (aflibercept, brolucizumab, bevacizumab, and ranibizumab) and placebo and/or sham. The outcomes of the NMA included BCVA, number of injections, retinal thickness, proportion of patients gaining or losing 10 or 15 EDTRS letters, ocular AEs, and treatment discontinuation.
Interpretation of Results
Efficacy
The results of the TENAYA and LUCERNE trials support the noninferiority of faricimab 6 mg (4 monthly loading doses then 1 dose every 8, 12 or 16 weeks in the maintenance phase) to aflibercept 2 mg (3 monthly loading doses then 1 dose every 8 weeks) for the mean change from baseline in BCVA averaged over weeks 40, 44, and 48 in treatment-naive patients with nAMD based on an ITT analysis. While it would have been preferred if the claim of noninferiority was based on agreement between both the ITT population and the per-protocol population for a more conservative approach in the context of noninferiority trials, a supplementary per-protocol analysis confirmed the conclusion of noninferiority in the primary ITT population. Several sensitivity analyses by the sponsor and the FDA confirmed the findings of each study.
A secondary outcome in the pivotal studies was the proportion of patients who gained 15 or more ETDRS letters from baseline averaged over weeks 40, 44, and 48. The proportion was numerically higher in the faricimab arm than in the aflibercept arm in the TENAYA study, but similar between treatments in the LUCERNE study. The proportion of patients who avoided a loss of 15 or more ETDRS letters in BCVA from baseline averaged over weeks 40, 44, and 48 was numerically similar between treatment arms in both studies. The clinical expert noted these results, along with the results using other ETDRS cut-offs (a gain or loss of 10 or more, 5 or more, or 0 or more ETDRS letters) indicated the majority of patients in both treatment groups was able to gain vision or avoid loss of vision, which are clinically important outcomes in the treatment of nAMD. However, no conclusion can be made regarding the comparative effects between faricimab and aflibercept for these outcomes because the study was not adequately designed for these comparisons and the results were based on observed data only with no imputation for missing data. The secondary and exploratory results for the additional BCVA outcomes are therefore only supportive of the efficacy of faricimab and should not be used as a basis for decision-making.
Frequency of injection was noted to be an important outcome of interest by patients and clinicians as it has implications for the frequency of AEs and HRQoL, among others that patients report as burdensome. The mean number of treatment injections was numerically lower in the faricimab arm than the aflibercept arm by close to 1 injection in the 48 week-period in both the TENAYA and LUCERNE trials. The studies administered faricimab after 20 or 24 weeks based on protocol-defined disease activity criteria, in which 45% of patients were on an every-16-weeks regimen, 35% received an every-12-weeks regimen, and 20% continued an every-8-weeks regimen. The same approach was not applied to aflibercept. The generalizability of the results is also uncertain as the method of interval assignment for faricimab in the maintenance phase up until the conduct of primary analysis (week 48) was more rigid than the treat-and-extend protocol commonly used in clinical practice. Deviation from study findings (under a controlled treatment setting) could arise in clinical practice as a result of the differential approach. Analyses that are conducted later on with longer treatment and follow-up times may provide more generalizability as they will account for the effect of the personalized treatment-interval algorithm (week 60 and onward), which is more reflective of the treat-and-extend protocol, according to the clinical expert consulted by CADTH. The clinical expert noted that longer-term data of at least 2 to 3 years are needed to gain confidence on the durability of faricimab. Last, the clinical significance of the between-group difference in injection frequency is difficult to determine. Whether the avoidance of almost 1 injection over 48 weeks would have a meaningful impact on HRQoL for patients, or meet their expectations, is unknown.
The change from baseline in NEI VFQ-25 composite scores, a measure of vision-related functions, was an exploratory outcome in the TENAYA and LUCERNE studies. Many subscales (general vision, mental health, social functioning, dependency, and driving) of the NEI VFQ-25 reflected vision-related functions that were noted by the patient group to be highly relevant to the functioning of patients with nAMD. The validity of the NEI VFQ-25 in patients with nAMD has been established. While improvements in the composite score were observed in both arms of the TENAYA and LUCERNE studies, the magnitude of change did not consistently meet the minimal important difference established in the literature.20 The difference between treatment arms was not statistically tested and no conclusion could be drawn from the results available.
The proportion of patients with legal blindness measured based on BCVA averaged over weeks 40, 44, and 48 was a secondary outcome in the pivotal studies. The proportions were similar between treatments and across studies. The clinical expert noted that a small proportion of patients does not respond to anti-VEGF treatments in clinical practice and the proportions shown in the studies were in line with the expert’s expectation. However, the limitations for the other BCVA outcome results also apply to this outcome.
The change in CST (ILM-RPE) from baseline was a secondary outcome, and the change in CST (ILM-BM) from baseline was an exploratory outcome in the pivotal studies. The level of CST reduction was numerically similar between treatment arms in both studies, which is supportive of the efficacy of faricimab. However, the clinical expert indicated that CST is rarely measured in clinical practice, and the clinical relevance of this outcome is therefore unclear.
The pivotal trials measured the proportions of patients with an absence of IRF, SRF, or PED as secondary outcomes. Both IRF and SRF are indicators of active disease routinely measured in clinical practice to evaluate clinical response. The proportion of patients with an absence of IRF at weeks 40, 44, and 48 was approximately 80% in the faricimab arms of both trials, which was considered favourable by the clinical expert, considering an absence of IRF has been shown to be associated with better prognosis in patients with nAMD. The proportions of patients without SRF and PED in the faricimab arm were 70% and 5%, respectively, in both studies; however, the prognostic value of these outcomes has not been established. Overall, there were no discernable differences in these outcomes between treatment arms and across studies. No conclusion about between-treatment differences can be made due to the lack of control for type I error.
The inclusion of only treatment-naive patients in the trials presents an evidence gap. While these patients likely represent the majority of patients eligible for treatment in clinical practice, the clinical expert noted that some patients may require a switch to faricimab from other anti-VEGFs for reasons such as inadequate treatment response and compliance. Because treatment-experienced patients were not enrolled in the studies, it is unclear if the results of the TENAYA and LUCERNE trials can be generalized to this patient population.
The phase II STAIRWAY and AVENUE trials provided direct evidence comparing faricimab to ranibizumab, although multiple limitations to these studies were noted by the CADTH review team. A key limitation of the STAIRWAY trial was that the trial was not designed to test a hypothesis, which precludes the CADTH review team from drawing any conclusions about the relative efficacy and safety of faricimab compared with ranibizumab. The phase II STAIRWAY trial suggested that the mean change from baseline in BCVA at week 40 was numerically similar between faricimab 6 mg (maintenance interval of 12 or 16 weeks after 4 monthly loading doses) and ranibizumab 0.5 mg (every 4 weeks). However, because the trial was not designed to test a hypothesis, the results were considered exploratory. The AVENUE trial showed that the mean change from baseline in BCVA at week 36 in faricimab 6 mg (maintenance interval of 8 weeks. after 4 monthly loading doses, or a fixed interval of 4 weeks throughout the study) was not statistically different from ranibizumab 0.5 mg (every 4 weeks). In addition, the AVENUE trial indicated that the mean change from week 12 in BCVA at week 36 in the trial arm in which patients received ranibizumab 0.5 mg (loading) plus faricimab 6 mg (maintenance), and in which a switch to faricimab 6 mg (every 4 weeks) occurred after completion of 3 monthly ranibizumab doses, was not statistically significant from ranibizumab 0.5 mg (every 4 weeks) in patients who had an incomplete response to ranibizumab at week 12. Overall, the results of the primary outcomes did not conclusively establish that faricimab is superior to ranibizumab. Furthermore, the small sample sizes of both trials make it difficult to draw any meaningful conclusions from the results.
The sponsor-submitted NMA provided indirect comparative evidence for faricimab versus other anti-VEGF drugs, including brolucizumab and bevacizumab. The systematic review conducted by the sponsor to identify trials for inclusion in the NMA was well conducted, well documented, and used appropriate methods. After including up to 35 trials in an NMA, the sponsor’s ITC suggests that faricimab 6 mg injected intravitreally every 8 to 16 weeks is not different (the 95% CrIs include the null) from comparators for BCVA at 12 months. ||||||||||||||||||||||||||||||||||||||||||||||||||||||||||||||||||||||||||||||||||||||||||||||||||||||||||||||||||||||||||||||||||||||||||||||||||||||||||||||||||||||||||||||||||||||||||||||||||||||||||||||||||||||||||||||||||||||||||||||||||||||||||||||||||||||||||||||||||||||||||||||||||||||||||||||||||||||||||||||||||||||||||||||||||||||||||||||||||||||||||||||||||||||||||||||||||||||. However, important sources of bias related to different study or patient characteristics may affect the conclusions that can be drawn about this ITC.
The ITC suggested that faricimab may be favourable (the 95% CrIs exclude the null) to bevacizumab regimens and ranibizumab 0.5 mg intravitreal every 8 weeks for the outcome of mean change in retinal thickness (CST). Additionally, brolucizumab 6 mg intravitreal every 8 to 12 weeks may be favourable (the 95% CrIs exclude the null) to faricimab for this outcome. For the outcome of the proportion of patients gaining or losing 10 or 15 EDTRS letters at 1 year, the ITC suggests that faricimab does not have a different proportion of patients (the 95% CrIs include the null) gaining or losing 10 or 15 EDTRS letters than do the comparators, although the poor fit in this model precludes making conclusions about on the effect of faricimab versus comparators for this outcome. Limitations in the sponsor’s ITC included considerable heterogeneity in study design and some baseline characteristics (most notable is the heterogeneity in the methods to assess retinal thickness) and the availability of information around prognostic factors such as the presence of SRF or IRF. Additionally, the connection between faricimab and the rest of the network through aflibercept in the LUCERNE and TENEYA trials, and through ranibizumab in a phase II trial, was weak. Overall, limitations to the NMA preclude the CADTH review team from drawing conclusions about the proportion of patients gaining or losing 10 or 15 EDTRS letters and retinal thickness. These limitations may pose a considerable challenge to making a conclusive decision regarding the validity of the results to inform clinical practice.
Harms
Overall, the safety profile of faricimab was consistent with that of aflibercept in the pivotal trials, with the most frequently reported ocular AEs being conjunctival hemorrhage, worsening nAMD, and dry eye. There was no report of endophthalmitis or retinal vasculitis, and there was a low frequency (2.4% or less) of intraocular inflammation in the faricimab arms of both pivotal trials. The clinical expert noted that intraocular inflammation and retinal vasculitis were important safety concerns with brolucizumab, which can also be administered with extended treatment intervals.
No notable differences in the harms of faricimab and ranibizumab were evident in the phase II trials. Limited data were available from the trials in the NMAs conducted for ocular AEs and for treatment discontinuation. Although the analyses did not show a clear difference in AEs between faricimab and other anti-VEGFs (including brolucizumab), the limited data, between-trial heterogeneity, and imprecision in the estimates mean there is a high degree of uncertainty about the results.
Conclusions
Based on evidence from the pivotal trials, faricimab is noninferior to aflibercept in the change in BCVA from baseline over 48 weeks of treatment in treatment-naive adult patients with nAMD. The evidence regarding comparative efficacy in other BCVA outcomes, anatomic outcomes, vision-related function, and HRQoL was supportive of noninferiority but associated with some uncertainties due to limitations with the design of the studies and analyses. Neither the reviewed phase II studies nor the NMA submitted by the sponsor provides clear evidence that faricimab is superior to other anti-VEGFs for BCVA outcomes. Most patients received faricimab at an extended interval of 12 or 16 weeks at week 48 in the pivotal studies. ||||||||||||||||||||||||||||||||||||||||||||||||||||||||||||||||||||||||||||||||||||||||||||||||||||||||||||||||||||||||||||||||||||||||||||||||||||||||||||||||||||||||||||||||||||||||||||||||||||||||||||||||||||||||||||||||||||||||||||||||||||||||||||||||||||||||||||||||||||||||||||||||||||||||||||; however, the heterogeneity in study design and patient characteristics may limit the usefulness of conclusions that can be made about these results. Overall, the safety profile of faricimab was similar to that of aflibercept in the pivotal trials, with a low occurrence of intraocular inflammation and no reports of retinal vasculitis or endophthalmitis.
References
1.Arroyo JG. Age-related macular degeneration: clinical presentation,etiology, and diagnosis. In: Post TW, ed. UpToDate. Waltham (MA): UpToDate; 2020: www.uptodate.com. Accessed 2022 Feb 17.
2.Drug Reimbursement Review sponsor submission: Vabysmo (faricimab), 6 mg/0.05 mL solution for intravitreal injection [internal sponsor's package]. Mississauga (ON): Hoffman-La Roche Limited; 2022 Jan 31.
3.Potter MJ. Age-Related Macular Degeneration. e-CPS. Ottawa (ON): Canadian Pharmacist Association; 2021: http://www.myrxtx.ca. Accessed 2022 April 07.
4.Solomon SD, Lindsley K, Vedula SS, Krzystolik MG, Hawkins BS. Anti-vascular endothelial growth factor for neovascular age-related macular degeneration. Cochrane Database Syst Rev. 2014;8:CD005139. PubMed
5.Beovu (brolucizumab): 6 mg / 0.05 mL solution for intravitreal injection [product monograph]. Dorval (QC): Novartis Pharmaceuticals Canada Inc.; 2022 Feb 17: https://pdf.hres.ca/dpd_pm/00064837.PDF. Accessed 2022 Apr 12.
6.Eylea (aflibercept): 2 mg / 0.05 mL solution for intravitreal injection in single use pre-filled syringes and single use vials [product monograph]. Missisauga (ON): Bayer Inc.; 2022 Feb 10: https://pdf.hres.ca/dpd_pm/00064757.PDF. Accessed 2022 Apr 12.
7.Lucentis (ranibizumab): 10 mg/mL solution for injection in single use vials and single use pre-filled syringes [product monograph]. Dorval (QC): Novartis Pharmaceuticals Canada Inc.; 2021 Dec 21: https://pdf.hres.ca/dpd_pm/00064117.PDF. Accessed 2022 April 12.
8.Vabysmo (faricimab): 6 mg/0.05 mL solution for intravitreal injection, single-use vials [product monograph]. Mississauga (ON): Hoffmann-La Roche Limited; 2022 May 27.
9.Clinical Study Report: GR40306 [TENAYA]. A phase III, multicenter, randomized, double-masked, active comparator-controlled study to evaluate the efficacy and safety of faricimab (RO6867461) in patients with neovascular age-related mascular degeneration (nAMD) [internal sponsor's report]. Basel (CH): F. Hoffmann-La Roche Ltd; 2021 May 25.
10.Clinical Study Report: GR40844 [LUCERNE]. A phase III, multicenter, randomized, double-masked, active comparator-controlled study to evaluate the efficacy and safety of faricimab (RO6867461) in patients with neovascular age-related mascular degeneration (nAMD) [internal sponsor's report]. Basel (CH): F. Hoffmann-La Roche Ltd; 2021 May 25.
11.McKay BR, Berger AR, Canadian Retina Society Executive. Canadian Retina Society (CRS) Position Paper on the Necessity of Sustained Funding to Ensure Continued Access to Anti-Vascular Endothelial Growth Factor Drugs to Preserve Vision for Canadians living with Retinal Diseases. Ottawa (ON): Canadian Opthalmological Society; 2020: https://www.cos-sco.ca/wp-content/uploads/2020/08/Access-AVEGF-drugs_en.pdf. Accessed 2020 Mar 03.
12.Guidelines for the Collaborative Management of Persons with Age-Related Macular Degeneration by Health- and Eye-Care Professionals. Can J Optom. 2015;77(1).
13.Avastin (bevacizumab): 100 mg and 400 mg vials (25 mg/mL solution for injection) [product monograph]. Missisauga (ON): Hoffmann-La Roche Limited; 2021 Feb 02: https://pdf.hres.ca/dpd_pm/00065643.PDF. Accessed 2022 Apr 12.
14.McGowan J, Sampson M, Salzwedel DM, Cogo E, Foerster V, Lefebvre C. PRESS Peer Review of Electronic Search Strategies: 2015 guideline statement. J Clin Epidemiol. 2016;75:40-46. PubMed
15.Grey matters: a practical tool for searching health-related grey literature. Ottawa (ON): CADTH; 2019: https://www.cadth.ca/grey-matters. Accessed 2022 Feb 18.
16.Heier JS, Khanani AM, Quezada Ruiz C, et al. Efficacy, durability, and safety of intravitreal faricimab up to every 16 weeks for neovascular age-related macular degeneration (TENAYA and LUCERNE): two randomised, double-masked, phase 3, non-inferiority trials. Lancet. 2022;399(10326):729-740. PubMed
17.Shamir RR, Friedman Y, Joskowicz L, Mimouni M, Blumenthal EZ. Comparison of Snellen and Early Treatment Diabetic Retinopathy Study charts using a computer simulation. Int J Ophthalmol. 2016;9(1):119-123. PubMed
18.Heier JS, Brown DM, Chong V, et al. Intravitreal aflibercept (VEGF trap-eye) in wet age-related macular degeneration. Ophthalmology. 2012;119(12):2537-2548. PubMed
19.Brown DM, Kaiser PK, Michels M, et al. Ranibizumab versus verteporfin for neovascular age-related macular degeneration. N Engl J Med. 2006;355(14):1432-1444. PubMed
20.Suner IJ, Kokame GT, Yu E, Ward J, Dolan C, Bressler NM. Responsiveness of NEI VFQ-25 to changes in visual acuity in neovascular AMD: validation studies from two phase 3 clinical trials. Invest Ophthalmol Vis Sci. 2009;50(8):3629-3635. PubMed
21.Eye Physicians and Surgeons of Ontario. Legal Blindness. 2018; https://www.epso.ca/vision-health/general-interest/legal-blindness/. Accessed 2022 Mar 17.
22.Jaffe GJ, Ying GS, Toth CA, et al. Macular morphology and visual acuity in year five of the Comparison of Age-related Macular Degeneration Treatments Trials. Ophthalmology. 2019;126(2):252-260. PubMed
23.Chatziralli I, Nicholson L, Vrizidou E, et al. Predictors of outcome in patients with neovascular age-related macular degeneration switched from ranibizumab to 8-weekly aflibercept. Ophthalmology. 2016;123(8):1762-1770. PubMed
24.Tan CS, Lim LW, Ngo WK, et al. Predictors of persistent disease activity following anti-VEGF loading dose for nAMD patients in Singapore: the DIALS study. BMC Ophthalmol. 2020;20(1):324. PubMed
25.E9(R1) Statistical Principles for Clinical Trials: Addendum: Estimands and Sensitivity Analysis in Clinical Trials. Guidance for Industry. Silver Spring (MD): U.S. Food and Drug Administration (FDA); 2021: https://www.fda.gov/media/148473/download. Accessed 2022 Apr 17.
26.Center for Drug Evaluation and Research. Statistical review(s). Vabysmo (faricimab) injection for intravitreal use. Company: Genentech, Inc. Application No.:761235. Approval date: 1/28/2022 (FDA approval package). Silver Spring (MD): U.S. Food and Drug Administration (FDA); 2022: https://www.accessdata.fda.gov/drugsatfda_docs/nda/2022/761235Orig1s000TOC.cfm. Accessed 2022 Apr 27.
27.Network meta-analysis of treatments for neovascular age-related macular degeneration (nAMD). Roche compound of interest: faricimab [internal sponsor's report]. In: Drug Reimbursement Review sponsor submission: faricimab, 6mg/0.05mL solution, intravitreal injection. Missisauga (ON): Hoffmann-La Roche Limited; 2022 Jan 31.
28.Khanani AM, Patel SS, Ferrone PJ, et al. Efficacy of Every Four Monthly and Quarterly Dosing of Faricimab vs Ranibizumab in Neovascular Age-Related Macular Degeneration: The STAIRWAY Phase 2 Randomized Clinical Trial. JAMA Ophthalmol. 2020;138(9):964-972. PubMed
29.Dugel PU, Sahni J, Sadikhov S, et al. Anti-VEGF/Anti–Angiopoietin-2 Bispecific Antibody RG7716 in Neovascular AMD. Retina Society Annual Meeting, San Francisco (CA). Boston (MA): The Retina Society; 2018 Sep 12-15.
30.Hoffmann-La Roche. NCT03038880: Study to Evaluate Faricimab (RO6867461; RG7716) for Extended Durability in the Treatment of Neovascular Age Related Macular Degeneration (STAIRWAY). ClinicalTrials.gov. Bethesda (MD): U.S. National Library of Medicine; 2021: https://clinicaltrials.gov/ct2/show/NCT03038880. Accessed 2022 Apr 13.
31.Sahni J, Dugel PU, Patel SS, et al. Safety and Efficacy of Different Doses and Regimens of Faricimab vs Ranibizumab in Neovascular Age-Related Macular Degeneration: The AVENUE Phase 2 Randomized Clinical Trial. JAMA Ophthalmol. 2020;138(9):955-963. PubMed
32.Hoffmann-La Roche. NCT02484690: A Proof-of-Concept Study of Faricimab (RO6867461) in Participants With Choroidal Neovascularization (CNV) Secondary to Age-Related Macular Degeneration (AMD) (AVENUE). ClinicalTrials.gov. Bethesda (MD): U.S. National Library of Medicine; 2020: https://clinicaltrials.gov/ct2/show/NCT02484690. Accessed 2022 Apr 13.
33.Clinical Study Report: CR39521 [STAIRWAY]. Simultaneous blockade of angiopoietin-2 and VEGF-A with the bispecific antibody RO6867461 (RG7716) for extended durability in the treatment of neovascular age-related macular degeneration [internal sponsor's report]. Basel (CH): F. Hoffmann-La Roche Ltd.; 2018 Nov 29.
34.Clinical Study Report: BP29647 [AVENUE]. A multiple-center, multiple-dose and regimen, randomized, active comparator controlled, double masked, parallel group, 36-week study to investigate the safety, tolerability, pharmacokinetics, and efficacy of RO6867461 administered intravitreally in patients with choroidal neovascularization secondary to age-related macular degeneration [internal sponsor's report]. Basel (CH): F Hoffman-La Roche Ltd.; 2018 Sep 12.
35.Brown DM, Kaiser PK, Michels M, et al. Ranibizumab versus verteporfin for neovascular age-related macular degeneration. N Engl J Med. 2006;355(14):1432-1444. PubMed
36.Dong LM, Childs AL, Mangione CM, et al. Health- and vision-related quality of life among patients with choroidal neovascularization secondary to age-related macular degeneration at enrollment in randomized trials of submacular surgery: SST report no. 4. Am J Ophthalmol. 2004;138(1):91-108. PubMed
37.Kniestedt C, Stamper RL. Visual acuity and its measurement. Ophthalmol Clin North Am. 2003;16(2):155-170, v. PubMed
38.Rosenfeld PJ, Brown DM, Heier JS, et al. Ranibizumab for neovascular age-related macular degeneration. N Engl J Med. 2006;355(14):1419-1431. PubMed
39.Tewari H, Kori V, Sony P, Venkatesh P, Garg S. Snellen chart may be preferable over early treatment diabetic retinopathy study charts for rapid visual acuity assessment. Indian J Ophthalmol. 2006;54(3):214-214. PubMed
40.CATT: comparison of age-related macular degeneration treatment trials. ETDRS chart worksheet. Philadelphia (PA): University of Pennsylvania; 2014.
41.Beck RW, Moke PS, Turpin AH, et al. A computerized method of visual acuity testing: adaptation of the early treatment of diabetic retinopathy study testing protocol. Am J Ophthalmol. 2003;135(2):194-205. PubMed
42.Recommended stardard procedures for the clinical measurement and specification of visual acuity. Report of working group 39. Committee on vision. Assembly of Behavioral and Social Sciences, National Research Council, National Academy of Sciences, Washington, D.C. Adv Ophthalmol. 1980;41:103-148. PubMed
43.Rosser DA, Cousens SN, Murdoch IE, Fitzke FW, Laidlaw DA. How sensitive to clinical change are ETDRS logMAR visual acuity measurements? Invest Ophthalmol Vis Sci. 2003;44(8):3278-3281. PubMed
44.Beck RW, Maguire MG, Bressler NM, Glassman AR, Lindblad AS, Ferris FL. Visual acuity as an outcome measure in clinical trials of retinal diseases. Ophthalmology. 2007;114(10):1804-1809. PubMed
45.Joussen AM, Lehmacher W, Hilgers RD, Kirchhof B. Is significant relevant? Validity and patient benefit of randomized controlled clinical trials on age-related macular degeneration. Surv Ophthalmol. 2007;52(3):266-278. PubMed
46.Center for Drug Evaluation Research. Statistical review(s). Ozurdex (dexamethasone implant). Company: Allergan, Inc. Application no.: 022315. Approval date: 6/17/2009 (FDA drug approval package). Rockville (MD): U. S. Food and Drug Administration (FDA); 2009: https://www.accessdata.fda.gov/drugsatfda_docs/nda/2009/022315_ozurdex_toc.cfm. Accessed 2022 Apr 13.
47.Common Drug Review clinical guidance report: Eylea (aflibercept) for treatment of neovascular (wet) age-related macular degeneration (wAMD). Ottawa (ON): CADTH; 2015 https://www.cadth.ca/sites/default/files/cdr/clinical/SR0361_Eylea_CL_Report.pdf. Accessed 2022 Apr 13.
48.Slakter JS, Stur M. Quality of life in patients with age-related macular degeneration: impact of the condition and benefits of treatment. Surv Ophthalmol. 2005;50(3):263-273. PubMed
49.Mangione CM, Berry S, Spritzer K, et al. Identifying the content area for the 51-item National Eye Institute Visual Function Questionnaire: results from focus groups with visually impaired persons. Arch Ophthalmol. 1998;116(2):227-233. PubMed
50.Hazel CA, Petre KL, Armstrong RA, Benson MT, Frost NA. Visual function and subjective quality of life compared in subjects with acquired macular disease. Invest Ophthalmol Vis Sci. 2000;41(6):1309-1315. PubMed
51.Goatman KA. A reference standard for the measurement of macular oedema. Br J Ophthalmol. 2006;90(9):1197-1202. PubMed
52.Bressler SB, Edwards AR, Chalam KV, et al. Reproducibility of spectral-domain optical coherence tomography retinal thickness measurements and conversion to equivalent time-domain metrics in diabetic macular edema. JAMA Ophthalmol. 2014;132(9):1113-1122. PubMed
53.Mylonas G, Ahlers C, Malamos P, et al. Comparison of retinal thickness measurements and segmentation performance of four different spectral and time domain OCT devices in neovascular age-related macular degeneration. Br J Ophthalmol. 2009;93(11):1453-1460. PubMed
54.Giani A, Cigada M, Choudhry N, et al. Reproducibility of retinal thickness measurements on normal and pathologic eyes by different optical coherence tomography instruments. Am J Ophthalmol. 2010;150(6):815-824. PubMed
55.Yaylali SA, Akcakaya AA, Erbil HH, Candemir B, Mesci C, Acar H. The relationship between optical coherence tomography patterns, angiographic parameters and visual acuity in age-related macular degeneration. Int Ophthalmol. 2012;32(1):25-30. PubMed
56.Topal T, Kar T, Yıldırım Y, et al. Evaluation of Aflibercept Treatment Responses in Eyes with Bevacizumab/Ranibizumab-resistant Wet Age-related Macular Degeneration. Turk J Ophthalmol. 2017;47(3):133-137. PubMed
57.Simader C, Ritter M, Bolz M, et al. Morphologic parameters relevant for visual outcome during anti-angiogenic therapy of neovascular age-related macular degeneration. Ophthalmology. 2014;121(6):1237-1245. PubMed
58.Cohen J. A power primer. Psychol Bull. 1992;112(1):155-159. PubMed
59.Ou WC, Brown DM, Payne JF, Wykoff CC. Relationship between visual acuity and retinal thickness during anti-vascular endothelial growth factor therapy for retinal diseases. Am J Ophthalmol. 2017;180:8-17. PubMed
60.Ma C, Bai L, Lei C, et al. Predictors of visual and anatomical outcomes for neovascular age-related macular degeneration treated with bevacizumab. Biomed Rep. 2015;3(4):503-508. PubMed
61.Jaffe GJ, Martin DF, Toth CA, et al. Macular morphology and visual acuity in the Comparison of Age-Related Macular Degeneration Treatments Trials. Ophthalmology. 2013;120(9):1860-1870. PubMed
62.Eriksson U, Alm A, Larsson E. Is quantitative spectral-domain superior to time-domain optical coherence tomography (OCT) in eyes with age-related macular degeneration? Acta Ophthalmol. 2012;90(7):620-627. PubMed
63.Krebs I, Falkner-Radler C, Hagen S, et al. Quality of the threshold algorithm in age-related macular degeneration: Stratus versus Cirrus OCT. Invest Ophthalmol Vis Sci. 2009;50(3):995-1000. PubMed
64.Krebs I, Smretschnig E, Moussa S, Brannath W, Womastek I, Binder S. Quality and reproducibility of retinal thickness measurements in two spectral-domain optical coherence tomography machines. Invest Ophthalmol Vis Sci. 2011;52(9):6925-6933. PubMed
65.Hanumunthadu D, Ilginis T, Restori M, et al. Spectral-domain optical coherence tomography retinal and choroidal thickness metric repeatability in age-related macular degeneration. Am J Ophthalmol. 2016;166:154-161. PubMed
66.Parravano M, Oddone F, Boccassini B, et al. Reproducibility of macular thickness measurements using Cirrus SD-OCT in neovascular age-related macular degeneration. Invest Ophthalmol Vis Sci. 2010;51(9):4788-4791. PubMed
67.Mangione CM, Lee PP, Pitts J, Gutierrez P, Berry S, Hays RD. Psychometric properties of the National Eye Institute Visual Function Questionnaire (NEI-VFQ). NEI-VFQ Field Test Investigators. Arch Ophthalmol. 1998;116(11):1496-1504. PubMed
68.Mangione CM, Lee PP, Gutierrez PR, Spritzer K, Berry S, Hays RD. Development of the 25-item National Eye Institute Visual Function Questionnaire. Arch Ophthalmol. 2001;119(7):1050-1058. PubMed
69.Dougherty BE, Bullimore MA. Comparison of scoring approaches for the NEI VFQ-25 in low vision. Optom Vis Sci. 2010;87(8):543-548. PubMed
70.Orr P, Rentz AM, Margolis MK, et al. Validation of the National Eye Institute Visual Function Questionnaire-25 (NEI VFQ-25) in age-related macular degeneration. Invest Ophthalmol Vis Sci. 2011;52(6):3354-3359. PubMed
71.Revicki DA, Rentz AM, Harnam N, Thomas VS, Lanzetta P. Reliability and validity of the National Eye Institute Visual Function Questionnaire-25 in patients with age-related macular degeneration. Invest Ophthalmol Vis Sci. 2010;51(2):712-717. PubMed
72.Reeve BB, Wyrwich KW, Wu AW, et al. ISOQOL recommends minimum standards for patient-reported outcome measures used in patient-centered outcomes and comparative effectiveness research. Qual Life Res. 2013;22(8):1889-1905. PubMed
73.Pesudovs K, Gothwal VK, Wright T, Lamoureux EL. Remediating serious flaws in the National Eye Institute Visual Function Questionnaire. J Cataract Refract Surg. 2010;36(5):718-732. PubMed
74.Wilkinson CP, Ferris FL, 3rd, Klein RE, et al. Proposed international clinical diabetic retinopathy and diabetic macular edema disease severity scales. Ophthalmology. 2003;110(9):1677-1682. PubMed
75.Sitnilska V, Kersten E, Altay L, et al. Major Predictive Factors for Progression of Early to Late Age-Related Macular Degeneration. Ophthalmologica. 2020;243(6):444-452. PubMed
76.Schmidt-Erfurth U, Waldstein SM. A paradigm shift in imaging biomarkers in neovascular age-related macular degeneration. Prog Retin Eye Res. 2016;50:1-24. PubMed
77.Ritter M, Simader C, Bolz M, et al. Intraretinal cysts are the most relevant prognostic biomarker in neovascular age-related macular degeneration independent of the therapeutic strategy. Br J Ophthalmol. 2014;98(12):1629-1635. PubMed
78.Kodjikian L, Decullier E, Souied EH, et al. Predictors of One-Year Visual Outcomes after Anti-Vascular Endothelial Growth Factor Treatment for Neovascular Age-Related Macular Degeneration. Retina. 2018;38(8):1492-1499. PubMed
79.Waldstein SM, Philip AM, Leitner R, et al. Correlation of 3-Dimensionally quantified intraretinal and subretinal fluid with visual acuity in neovascular age-related macular degeneration. JAMA Ophthalmol. 2016;134(2):182-190. PubMed
80.Sharma S, Toth CA, Daniel E, et al. Macular morphology and visual acuity in the second year of the Comparison of Age-Related Macular Degeneration Treatments Trials. Ophthalmology. 2016;123(4):865-875. PubMed
81.Ying GS, Maguire MG, Pan W, et al. Baseline Predictors for Five-Year Visual Acuity Outcomes in the Comparison of AMD Treatment Trials. Ophthalmol Retina. 2018;2(6):525-530. PubMed
82.Guymer RH, Markey CM, McAllister IL, et al. Tolerating subretinal fluid in neovascular age-related macular degeneration treated with ranibizumab using a treat-and-extend regimen: FLUID study 24-month results. Ophthalmology. 2019;126(5):723-734. PubMed
83.Segal O, Barayev E, Nemet AY, Mimouni M. Predicting Response of Exudative Age-Related Macular Degeneration to Bevacizumab Based on Spectralis Optical Coherence Tomography. Retina. 2016;36(2):259-263. PubMed
84.Zandi S, Weisskopf F, Garweg JG, et al. Pre-Existing RPE Atrophy and Defects in the External Limiting Membrane Predict Early Poor Visual Response to Ranibizumab in Neovascular Age-Related Macular Degeneration. Ophthalmic Surg Lasers Imaging Retina. 2017;48(4):326-332. PubMed
85.Nagai N, Suzuki M, Uchida A, et al. Non-responsiveness to intravitreal aflibercept treatment in neovascular age-related macular degeneration: implications of serous pigment epithelial detachment. Sci Rep. 2016;6(1):29619. PubMed
86.Tarakcioglu HN, Ozkaya A, Kemer B, Taskapili M. Multimodal imaging based biomarkers predictive of early and late response to anti-VEGFs during the first year of treatment for neovascular age-related macular degeneration. J Fr Ophtalmol. 2019;42(1):22-31. PubMed
87.Young M, Forooghian F. Serous Index of Pigment Epithelial Detachments in Neovascular Age-Related Macular Degeneration Predicts Response to Anti-Vascular Endothelial Growth Factor Treatment. Ophthalmic Surg Lasers Imaging Retina. 2015;46(7):724-727. PubMed
88.Suzuki M, Nagai N, Izumi-Nagai K, et al. Predictive factors for non-response to intravitreal ranibizumab treatment in age-related macular degeneration. Br J Ophthalmol. 2014;98(9):1186-1191. PubMed
89.Lai TT, Hsieh YT, Yang CM, Ho TC, Yang CH. Biomarkers of optical coherence tomography in evaluating the treatment outcomes of neovascular age-related macular degeneration: a real-world study. Sci Rep. 2019;9(1):529. PubMed
90.Leitritz M, Gelisken F, Inhoffen W, Voelker M, Ziemssen F. Can the risk of retinal pigment epithelium tears after bevacizumab treatment be predicted? An optical coherence tomography study. Eye (Lond). 2008;22(12):1504-1507. PubMed
91.Guber J, Praveen A, Saeed MU. Retinal pigment epithelium rips after ranibizumab in neovascular age-related macular degeneration: incidence, risk factors and long-term outcome. Klin Monbl Augenheilkd. 2014;231(4):432-435. PubMed
92.Chan CK, Abraham P, Meyer CH, et al. Optical coherence tomography-measured pigment epithelial detachment height as a predictor for retinal pigment epithelial tears associated with intravitreal bevacizumab injections. Retina. 2010;30(2):203-211. PubMed
93.Penha FM, Rosenfeld PJ, Gregori G, et al. Quantitative imaging of retinal pigment epithelial detachments using spectral-domain optical coherence tomography. Am J Ophthalmol. 2012;153(3):515-523. PubMed
94.Moshfeghi DM, Hariprasad SM, Marx JL, et al. Effect of fluid status at week 12 on visual and anatomic outcomes at week 52 in the VIEW 1 and 2 trials. Ophthalmic Surg Lasers Imaging Retina. 2016;47(3):238-244. PubMed
95.Lanzetta P, Cruess AF, Cohen SY, et al. Predictors of visual outcomes in patients with neovascular age-related macular degeneration treated with anti-vascular endothelial growth factor therapy: post hoc analysis of the VIEW studies. Acta Ophthalmol. 2018;96(8):e911-e918. PubMed
96.Kodjikian L, Rezkallah A, Decullier E, Aulagner G, Huot L, Mathis T. Early Predictive Factors of Visual Loss at 1 Year in Neovascular Age-Related Macular Degeneration under Anti-Vascular Endothelial Growth Factor. Ophthalmol Retina. 2022;6(2):109-115. PubMed
97.Monés J, Biarnés M. Intravitreal aflibercept efficacy in neovascular age-related macular degeneration with suboptimal response to anti-vascular endothelial growth factor-A therapy. Eur J Ophthalmol. 2020;30(5):1082-1090. PubMed
98.Landis JR, Koch GG. The measurement of observer agreement for categorical data. Biometrics. 1977;33(1):159-174. PubMed
99.DeCroos FC, Toth CA, Stinnett SS, et al. Optical coherence tomography grading reproducibility during the Comparison of Age-related Macular Degeneration Treatments Trials. Ophthalmology. 2012;119(12):2549-2557. PubMed
100.Ritter M, Elledge J, Simader C, et al. Evaluation of optical coherence tomography findings in age-related macular degeneration: a reproducibility study of two independent reading centres. Br J Ophthalmol. 2011;95(3):381. PubMed
101.Patel PJ, Browning AC, Chen FK, Da Cruz L, Tufail A. Interobserver agreement for the detection of optical coherence tomography features of neovascular age-related macular degeneration. Invest Ophthalmol Vis Sci. 2009;50(11):5405-5410. PubMed
Appendix 1: Literature Search Strategy
Note that this appendix has not been copy-edited.
Clinical Literature Search
Overview
Interface: Ovid
Databases:
MEDLINE All (1946–)
Embase (1974–)
Note: Subject headings and search fields have been customized for each database. Duplicates between databases were removed in Ovid.
Date of search: February 22, 2022
Alerts: Weekly search updates until project completion
Search filters applied: No filters were applied to limit the retrieval by study type
Limits:
Publication date limit: none
Language limit: none
Conference abstracts: excluded
Syntax | Description |
|---|---|
/ | At the end of a phrase, searches the phrase as a subject heading |
MeSH | Medical Subject Heading |
exp | Explode a subject heading |
* | Before a word, indicates that the marked subject heading is a primary topic; or, after a word, a truncation symbol (wildcard) to retrieve plurals or varying endings |
.ti | Title |
.ot | Original title |
.ab | Abstract |
.hw | Heading word; usually includes subject headings and controlled vocabulary |
.kf | Keyword heading word |
.dq | Candidate term word (Embase) |
.pt | Publication type |
.rn | Registry number |
.nm | Name of substance word (MEDLINE) |
medall | Ovid database code: MEDLINE All, 1946 to present, updated daily |
oemezd | Ovid database code; Embase, 1974 to present, updated daily |
Multi-Database Strategy
(faricimab* or Vabysmo* or rg7716 or rg 7716 or ro6867461 or ro 6867461 or WHO 10563 or QC4F7FKK7I).ti,ab,kf,ot,hw,nm,rn.
1 use medall
*faricimab/ or (faricimab* or Vabysmo* or rg7716 or rg 7716 or ro6867461 or ro 6867461 or WHO 10563).ti,ab,kf,dq.
3 use oemezd
4 not (conference review or conference abstract).pt.
2 or 5
remove duplicates from 6
Clinical Trials Registries
ClinicalTrials.gov
Produced by the US National Library of Medicine. Targeted search used to capture registered clinical trials.
Search: Vabysmo (faricimab); age-related macular degeneration
WHO ICTRP
International Clinical Trials Registry Platform, produced by the World Health Organization. Targeted search used to capture registered clinical trials.
Search: Vabysmo (faricimab); age-related macular degeneration
Health Canada’s Clinical Trials Database
Produced by Health Canada. Targeted search used to capture registered clinical trials.
Search: Vabysmo (faricimab); age-related macular degeneration
EU Clinical Trials Register
European Union Clinical Trials Register, produced by the European Union. Targeted search used to capture registered clinical trials.
Search: Vabysmo (faricimab); age-related macular degeneration
Grey Literature
Search dates: February 17, 2022 – March 1, 2022
Keywords: Vabysmo (faricimab); age-related macular degeneration
Limits: Publication years: none
Updated: Search updated prior to the completion of stakeholder feedback period
Relevant websites from the following sections of the CADTH grey literature checklist Grey Matters: A Practical Tool for Searching Health-Related Grey Literature were searched:
Health Technology Assessment Agencies
Health Economics
Clinical Practice Guidelines
Drug and Device Regulatory Approvals
Advisories and Warnings
Drug Class Reviews
Clinical Trials Registries
Databases (free)
Internet Search
Open Access Journals
Appendix 2: Excluded Studies
Note that this appendix has not been copy-edited.
Reference | Reason for exclusion |
|---|---|
Khanani AM, Patel SS, Ferrone PJ, et al. Efficacy of Every Four Monthly and quarterly dosing of faricimab vs ranibizumab in neovascular age-related macular degeneration: the STAIRWAY phase II randomized clinical trial. JAMA Ophthalmology. 2020;138(9):964-972. | Study design |
Clinical Study Report: CR39521 [STAIRWAY]. Simultaneous blockade of angiopoietin-2 and VEGF-A with the bispecific antibody RO6867461 (RG7716) for extended durability in the treatment of neovascular age-related macular degeneration [internal sponsor's report]. 2018 November 29. | Study design |
Sahni J, Dugel PU, Patel SS, et al. Safety and efficacy of different doses and regimens of faricimab vs ranibizumab in neovascular age-related macular degeneration: the AVENUE phase II randomized clinical trial. JAMA Ophthalmology. 2020;138(9):955-963. | Study design |
Clinical Study Report: BP29647 [AVENUE]. A multiple-centre, multiple-dose and regimen, randomized, active comparator controlled, double masked, parallel group, 36-week study to investigate the safety, tolerability, pharmacokinetics, and efficacy of RO6867461 administered intravitreally in patients with choroidal neovascularization secondary to age-related macular degeneration [internal sponsor's report]. 2018 September 12. | Study design |
VEGF-A = vascular endothelial growth factor A.
Appendix 3: Detailed Outcome Data
Note that this appendix has not been copy-edited.
Table 41: Change From Baseline in BCVA (ETDRS letters) Averaged Over Weeks 40, 44, and 48 – Sensitivity and Supplementary Analyses
Analysis | TENAYA | LUCERNE | ||
|---|---|---|---|---|
Faricimab (N = 334) | Aflibercept (N = 337) | Faricimab (N = 331) | Aflibercept (N = 327) | |
Sensitivity analysis | ||||
ITT population (MMRM – LOCF) | ||||
Number of patients contributing to the analysis (%) | 333 | 336 | 331 | 325 |
Change from baseline (letter), meana (SE) | 5.9 (0.62) | 5.1 (0.62) | 6.8 (0.62) | 6.6 (0.63) |
Difference in meansa (letters), (95% CI) | 0.7 (-1.0 to 2.5) | REF | 0.1 (-1.6 to 1.9) | REF |
Supplementary analysis | ||||
ITT population (MMRM [Treatment policy estimand for all ICEs]) | ||||
Number of patients contributing to the analysis (%) | 306 | 316 | 315 | 306 |
Change from baseline (letter), meana (SE) | 5.7 (0.64) | 5.0 (0.64) | 6.4 (0.63) | 6.6 (0.64) |
Difference in meansa (letters), (95% CI) | 0.6 (-1.2 to 2.4) | REF | -0.1 (-1.9 to 1.6) | REF |
ITT population (MMRM [Hypothetical policy estimand for all ICEs]) | ||||
Number of patients contributing to the analysis (%) | 291 | 300 | 299 | 289 |
Change from baseline (letter), meana (SE) | 5.8 (0.64) | 5.1 (0.64) | 6.7 (0.63) | 6.5 (0.63) |
Difference in meansa (letters), (95% CI) | 0.7 (-1.1 to 2.5) | REF | 0.2 (-1.6 to 1.9) | REF |
ITT population (ANOCOVA —Trimmed mean analysis) | ||||
Number of patients contributing to the analysis (%) | 262 | 272 | 273 | 261 |
Change from baseline (letter), meanb (SE) | 7.87 | 7.51 | 9.22 | 9.38 |
Difference in meansb (letters), (95% CI) | 0.36 (-1.16 to 1.89) | REF | -0.16 (-0.7 to 1.39) | REF |
ITT population (ANOCOVA) | ||||
Number of patients contributing to the analysis (%) | 292 | 300 | 302 | 291 |
Change from baseline (letter), meanb (SE) | 4.61 (0.91) | 4.27 (0.91) | 6.27 (0.85) | 6.51 (0.89) |
Difference in meansc (letters), (95% CI) | 0.34 (-1.53 to 2.22) | REF | -0.24 (-2.10 to 1.62) | REF |
ITT population (ANOCOVA – Multiple imputation analysis) | ||||
Number of patients contributing to the analysis (%) | 334 | 337 | 331 | 327 |
Change from baseline (letter), meanb (SE) | 4.9 (0.87) | 3.9 (0.87) | 6.2 (0.84) | 6.5 (0.87) |
Difference in meansb (letters), (95% CI) | 1.0 (-0.8 to 2.8) | REF | -0.2 (-2.0 to 1.5) | REF |
ANOCOVA = analysis of covariance; BCVA = best corrected visual acuity; CI = confidence interval; ETRDS = Early Treatment Diabetic Retinopathy Study; ICE = intercurrent event; ITT = intention-to-treat; LOCF = last observation carried forward; MMRM = mixed model repeated measures; REF = reference; SE = standard error
aAdjusted mean. The primary end point was analyzed using an MMRM, with the change from baseline in BCVA as the dependent variable, considering all available observations of BCVA score at all visits. The model was adjusted for treatment group, visit, visit-by-treatment group interaction, baseline BCVA (continuous), baseline BCVA (≥74 letters, 73 – 55 letters, and ≤54 letters), baseline LLD (<33 letters and ≥33 letters), and region (US and Canada, Asia, and the rest of the world).
bAdjusted mean. In the ANCOVA analysis, the model uses the average of non-missing change from baseline in BCVA at week 40, 44 and 48 as the response variables adjusted for the treatment group, baseline BCVA score (continuous), baseline BCVA (≥74 letters, 73 - 55 letters, and ≤ 54 letters), baseline LLD (<33 letters and ≥33 letters), and region (US and Canada, Asia, and the rest of the world).
Source: TENAYA Clinical Study Report9 and LUCERNE Clinical Study Report.10
Table 42: Change From Baseline in BCVA (ETDRS Letter) Averaged Over Weeks 40, 44, and 48 by Baseline BCVA Subgroup (ITT Population)
Baseline BCVA subgroups | TENAYA | LUCERNE | ||
|---|---|---|---|---|
Faricimab (N = 334) | Aflibercept (N = 337) | Faricimab (N = 331) | Aflibercept (N = 327) | |
Baseline BCVA ≥ 74 ETDRS letters | ||||
N | 42 | 48 | 45 | 37 |
Change from baseline in BCVA averaged over week 40, 44 and 48, meana (letter) | 1.9 | 3.2 | 1.9 | 2.1 |
Difference in means (letter), (95% CI) | -1.3 (-4.3 to 1.6) | REF | -0.2 (-4.0 to 3.6) | REF |
Baseline BCVA between 55 and 74 ETDRS letters | ||||
N | 177 | 174 | 164 | 160 |
Change from baseline in BCVA averaged over week 40, 44 and 48, meana (letter) | 5.3 | 4.6 | 5.8 | 6.4 |
Difference in means (letter), (95% CI) | 0.7 (-1.6 to 2.9) | REF | -0.5 (-2.9 to 1.8) | REF |
Baseline BCVA ≤ 54 ETDRS letters | ||||
N | 73 | 78 | 93 | 94 |
Change from baseline in BCVA averaged over week 40, 44 and 48, meana (letter) | 9.6 | 7.5 | 9.8 | 8.7 |
Difference in means (letter), (95% CI) | 2.1 (-2.2 to 6.5) | REF | 1.1 (-2.4 to 4.6) | REF |
BCVA = best corrected visual acuity; CI = confidence interval; ETRDS = Early Treatment Diabetic Retinopathy Study; ITT = intention-to-treat; MMRM = mixed model repeated measures; REF = reference.
aAdjusted mean. The primary end point was analyzed using an MMRM, with the change from baseline in BCVA as the dependent variable, considering all available observations of BCVA score at all visits. The MMRM included treatment group, visit, visit-by-treatment group interaction, baseline BCVA (continuous), baseline BCVA (≥74 letters, 73 – 55 letters, and ≤54 letters), baseline LLD (<33 letters and ≥33 letters), and region (US and Canada, Asia, and the rest of the world).
Source: TENAYA Clinical Study Report9 and LUCERNE Clinical Study Report.10
Appendix 4: Description and Appraisal of Outcome Measures
Note that this appendix has not been copy-edited.
Aim
To describe the following outcome measures in Table 28 and review their measurement properties (validity, reliability, responsiveness to change, and minimal important difference).
Table 43: Outcome Measures Included in Each Study
Outcome measure | TENAYA/LUCERNE |
|---|---|
BCVA using ETDRS chart | Primary |
CST using SD-OCT | Secondary |
NEI VFQ-25 | Exploratory |
Presence of SRF and/or IRF | Secondary |
Presence of PED | Secondary |
BCVA = best corrected visual acuity; CST = central subfield thickness; ETDRS = Early Treatment of Diabetic Retinopathy Scale; IRF = intraretinal fluid; VFQ-25 = 25-Item Visual Function Questionnaire; PED = pigment epithelial detachment; SD-OCT = spectral-domain optical coherence tomography; SRF = subretinal fluid.
Findings
Table 44: Summary of Outcome Measures and Their Measurement Properties
Outcome measure | Type | Conclusions about measurement properties | MID |
|---|---|---|---|
BCVA using ETDRS charts | The ETDRS charts were developed to measure visual acuity in clinical trials. Patients are presented a series of 5 letters of equal difficulty on each row, with standardized spacing between letters and rows (total of 14 lines [70 letters]). A greater number of letters means better visual acuity. Gain of letter corresponds to an improvement in visual acuity whereas a loss of letters corresponds to worsening. | Validity: While the ETDRS charts are a commonly accepted method used in clinical trials for measuring visual acuity, overall visual function also depends upon variables such as contrast sensitivity, near vision, colour vision, and sensitivity to glare. The various components of visual function will affect the performance of different vision-related tasks by varying degrees. Reliability: ETDRS charts may reliably identify changes in visual acuity of 2 lines (10 letters) or more, but not changes of one line (5 letters) or fewer. Responsiveness: A loss or gain of 3 lines (15 letters) is considered a moderate degree of change and is commonly used as an outcome in clinical trials. | A loss or gain of 3 lines (15 letters) is considered a moderate degree of change and is commonly used as an outcome in clinical trials. Clinical trials supporting regulatory approval of previous anti-VEGF treatments for nAMD (ranibizumab and aflibercept) had the proportion of patients with a loss of less than 15 letters on the ETDRS charts (considered to be vision maintenance) as the primary end point. |
CST using SD-OCT | A technique used to create cross-sectional maps of the retinal structures and to quantify retinal thickness. CST is the average retinal thickness within a 1-mm diameter centred on the fovea. Per the clinical expert, overall reduction in CST is considered a favourable outcome. Since the distance between the ILM and the baseline membrane will be greater than the distance between the ILM and RPE in case of RPE elevation, the level of decrease in these distances could indicate effectiveness of any treatment among nAMD patients. | Validity: The evidence in nAMD patients for a linear relationship between OCT-measured CST and visual acuity, as well as between changes over time in the 2 measures, is inconsistent. In pooled data taken from 4, 12, and 24 weeks after initiation of anti-VEGF treatment for nAMD, eyes with CST of less than 120 µm or greater than 212 µm had worse visual acuity than eyes with a CST in the range of 120 µm to 212 µm. Reliability: With manual correction or exclusion of exams with automatic segmentation errors, values of 12 µm to 18 µm have been reported for the coefficient of repeatability (1.96 × square root of the within-subject variance of the differences between each pair of measurements) for intra-session repeatability. For inter-session reproducibility, a coefficient of repeatability of 26 µm was reported for separate imaging sessions conducted on the same day and a coefficient of repeatability of 44 µm to 47 µm was reported for separate sessions on different days when automatic segmentation errors were excluded or manually corrected. | Unknown |
NEI VFQ-25 | Questionnaire developed as a means to measure vision-targeted quality of life. It includes 25 items relevant to 11 vision-related constructs, in addition to a single-item general-health component. Responses for each item are converted to a 0 to 100 scale, with 0 representing the worst, and 100 the best visual functioning. | Validity: The original 51-item VFQ was developed based on focus groups composed of people with a number of common eye conditions (including AMD); thus, the questionnaire may be used to assess quality of life for a broad range of eye conditions. Aside from expectations for future vision, all the original constructs were retained in the shortened version, the VFQ-25. There is evidence for convergent validity of the VFQ-25 composite score and most of the subscale scores as demonstrated by correlations with visual acuity in patients with various chronic eye diseases, including AMD. The composite score has also shown correlations with the SF-36 (a generic HRQoL instrument) component summary scores. Correlations of subscale and composite scores with visual acuity were weaker overall in the worse-seeing eye than in the better-seeing eye. Rasch and component analysis has shown issues with multidimensionality (measurement of more than one construct) and poor performance of the subscales. Reliability: While acceptable internal consistency has been demonstrated for the composite score and most subscale scores in patients with AMD, evidence for test-retest reliability was not found. Responsiveness: A change in 9.61 to 10.57 points in the composite score corresponded to a medium effect size in patients with nAMD. | In patients with nAMD, a 15-letter change in visual acuity in the worse- and better-seeing eye corresponded to a 4-point and 7- to 8-point change in the composite score, respectively. |
Presence of IRF and/or SRF and/or PED on SD-OCT | The presence of IRF or SRF is detected on OCT exam. IRF appears as diffuse retinal thickening or as hyporeflective cystoid spaces (also referred to as intraretinal cysts [IRC]). SRF appears as hyporeflective areas between the retina and retinal pigment epithelium. IRF, SRF, and PED specifically in the central subfield (within 1 mm diameter centre of macular) were of interest in the pivotal studies. PED height is defined as RPE+PED thickness at the foveal centre, as measured in µm. Presence of PED is a known biomarker of progression from early/intermediate to advanced AMD. IRF and SRF are indicators of active disease routinely measured in clinical practice to evaluate clinical response. | Validity: The presence of IRF has been shown to have an association with worse visual acuity in eyes with nAMD both at baseline (treatment-naive) as well as following anti-VEGF treatment. In addition, it has been shown to be a prognostic factor for worsening visual acuity. The presence of SRF appears to have no association with visual acuity in treatment-naive eyes and potentially an association with better visual acuity at 2 years following anti-VEGF treatment (with no association at one and 5 years of follow-up). SRF was not found to be a prognostic factor for visual acuity. Due to the potentially conflicting associations of IRF and SRF with visual acuity, the association of a combined IRF and SRF status with visual acuity is unclear. In a post hoc analysis of the VIEW studies comparing aflibercept and ranibizumab treatment for nAMD, visual acuity outcomes at week 52 were no different between eyes with IRF, IRC, and/or SRF and eyes with no retinal fluid at week 12. Studies showed negative association between BCVA improvement at 1 year and PED at baseline, and between response and initial fibrovascular PED as well as serous PED, judged by BCVA. Another study showed a positive correlation between serous index of PED and the response to anti-VEGF treatment. Reliability: Studies of inter-rater reliability have found almost perfect agreement in identifying IRF presence using SD-OCT and good agreement using TD-OCT. For identifying SRF presence, there was substantial agreement using both SD-OCT and TD-OCT. In a retrospective study of patients with AMD undergoing OCT imaging of the macula, lowest reproducibility was found for PED with a Kappa statistic value of 0.51 (moderate), while a Kappa statistic value 0.78 was obtained for the presence of SRF. Another cross-sectional interobserver agreement study using OCT scans found moderate agreement for both SRF (Kappa statistic of 0.62) and PED (Kappa statistic of 0.78). In a prospective study of patients with AMD, the reproducibility of area and volume measurements of retinal PED was assessed using SD-OCT imaging and a novel automated, quantitative algorithm. The qualitative appearance of the RPE deformation maps and the quantitative measurements of PED area and volume were found highly reproducible over the 5 different datasets obtained from each eye. The intraclass correlation coefficient was > 0.99 for both area and volume measurements obtained using the entire dataset. The correlation between lesion size and test-retest standard deviations was evaluated using the Pearson linear correlation approach, which was found to be statistically significant for volume (r = 0.59, P ≤ 0.001), but not for area (r = 0.17, P = 0.23). | Not applicable |
AMD = age-related macular degeneration; BCVA = best corrected visual acuity; CSFT = central subfield thickness; ETDRS = Early Treatment of Diabetic Retinopathy Study; HRQoL = health-related quality of life; IRF = intraretinal fluid; MID = minimal important difference; nAMD = neovascular age-related macular degeneration; PED = pigment epithelial detachment; RPE = retinal pigment epithelium; SD-OCT = spectral-domain optical coherence tomography; SF-36 = 36-Item Short Form Survey; SRF = subretinal fluid; TD-OCT = time-domain optical coherence tomography; VEGF = vascular endothelial growth factor; VFQ-25 = 25-Item Visual Function Questionnaire.
Early Treatment Diabetic Retinopathy Study Charts
Early Treatment Diabetic Retinopathy Study charts are based on a design by Bailey and Lovie and are commonly used in clinical research.35-39 ETDRS charts present a series of 5 letters of equal difficulty on each row, with standardized spacing between letters and rows, for a total of 14 lines (70 letters). ETDRS letter score can be calculated when 20 or more letters are read correctly at 4.0 metres; the visual acuity letter score is equal to the total number of letters read correctly at 4.0 metres plus 30. If fewer than 20 letters are read correctly at 4.0 metres, the visual acuity letter score is equal to the total number of letters read correctly at 4.0 metres (number of letters recorded online 1.0), plus the total number of letters in the first 6 lines read correctly at 1.0 metre. Therefore, the ETDRS letter score could result in a maximum score of 100. A greater number of letters means better visual acuity; gain of letter corresponds to an improvement in visual acuity whereas a loss of letters corresponds to worsening.40,41
Charts are used in a standard light box with a background illumination of approximately 150 cd/m2. Standard chart testing distance is 4 metres; however, shorter distances may be used when vision is severely impaired.37,42 ETDRS results can be converted to Snellen fractions, another common measure of visual acuity, in which the numerator indicates the distance at which the chart was read, and the denominator the distance at which a person may discern letters of a particular size. A larger denominator indicates worsening vision. ETDRS letters range from 58.18 mm to 2.92 mm in height, corresponding to Snellen visual acuity fractions of 20/200 to 20/10, respectively. Further, letter size increases geometrically and equivalently in every line by a factor of 1.2589 (or 0.1 log unit), moving up the chart. Scoring for ETDRS charts is designed to produce a logarithmic score (logarithmic minimal angle of resolution [logMAR]), suitable for statistical analysis, in which individual letters score 0.02 log units.
ETDRS charts may reliably identify changes in visual acuity of 2 lines (10 letters) or more, but not changes of one line (5 letters) or fewer.43 The reliability of ETDRS charts depends on the baseline visual acuity. For eyes with acuity better than 20/100, a change in visual acuity of 5 or more letters has a greater than 90% probability of being a real change, while for eyes worse than 20/100, a change of 10 or more letters is required for the same reliability.44 A loss or gain of 3 lines (15 letters) is considered a moderate degree of change and is commonly used as an outcome in clinical trials.45 For macular edema, the FDA recommends a mean change of 15 letters or more on an ETDRS chart, or a statistically significant difference in the proportion of patients with a greater than or equal to 15-letter change in visual acuity as clinically relevant outcome measures in trials of interventions.46 Pivotal trials of previous anti-VEGF treatments for nAMD (ranibizumab and aflibercept) had as the primary end point the proportion of patients with a loss of less than 15 letters on the ETDRS charts (considered to be vision maintenance).47
With regard to the relationship between visual acuity measurement and visual function, a loss of 3 or more lines (greater than or equal to 15 letters) on an ETDRS chart corresponds to a doubling of the visual angle and is considered moderate visual loss, while a loss of 6 or more lines (greater than or equal to 30 letters) corresponds to a quadrupling of the visual angle and is considered severe. However, visual acuity is only one component contributing to overall visual function and the ability to perform everyday visual tasks (e.g., reading, recognizing faces, driving, and using the telephone). Overall visual function also depends upon variables such as contrast sensitivity, near vision, colour vision, and sensitivity to glare.48 The various components of visual function will affect the performance of different vision-related tasks by varying degrees. For example, the use of distance acuity to measure the success of treatments for AMD is not optimal, given that distance vision is usually 2 ETDRS lines better than reading vision,45 and difficulties with reading is a common complaint among people with eye disease.49 Rather, contrast sensitivity is a more important contributor to reading performance.45,50
Central Subfield Thickness Using Spectral-Domain Optical Coherence Tomography
Optical coherence tomography is a fast, non-invasive imaging technique that can be used to create cross-sectional maps of the retinal structures and to quantify retinal thickness in patients with retinal disease.51 OCT uses lasers centred on infrared wavelengths to record light reflected from interfaces between materials with different refractive indices, and from materials that scatter light. A recent advancement in OCT device technology has been the shift from time-domain (TD-OCT) to spectral-domain OCT (SD-OCT), as the latter can acquire data at a higher speed with better image resolution and reduced motion artifact.52 While TD-OCT systems typically acquire 2-dimensional images in a radial pattern, retinal scanning protocols in SD-OCT systems tend to acquire a stack of 2-dimensional images in a raster pattern.53 OCT systems have segmentation algorithms that automatically delineate the boundaries of the retina and calculate retinal thickness parameters.53
In the HAWK and HARRIER studies, CST was measured on SD-OCT images at central reading centres. CST was defined in the studies as the average thickness of the retina between the inner limiting membrane and BM within a 1 mm diameter centred on the fovea. This measurement is often referred to as CRT in the literature, and the tissue layer used as outer boundary for retinal thickness can vary.53,54
The change in CST (ILM-RPE) from baseline was a secondary outcome and the change in CST (ILM-BM) from baseline was an exploratory outcome. CST(ILM-BM) is defined as the distance between ILM and BM as assessed by the Central Reading Center (CRC). CST(ILM-RPE) is defined as the distance between ILM and RPE as assessed by the CRC. The measurement of ILM-RPE and ILM-BM is important as it takes into account the possible presence of PED. If there is RPE elevation, the distance between the ILM and the baseline membrane will be greater than the distance between the ILM and RPE. The measurement gives a sense of how the drugs work across the nAMD patients who have associated PED. Per the clinical expert consulted by CADTH, overall reduction in CST is considered a favourable outcome. The flattening of pigment epithelial alleviations in association with the treatment of neovascularization has been an important consideration and is of interest for nAMD treatment. Since the distance between the ILM and the baseline membrane will be greater than the distance between the ILM and RPE in case of RPE elevation, the level of decrease in these distances could indicate effectiveness of any treatment among nAMD patients.
In a retrospective study of 50 eyes of 49 patients with exudative AMD, a significant correlation was found (r = 0.321, p < 0.05) between VAlogMAR and central foveal thickness (CFT) by OCT for all patients, assessed by Pearsons correlation coefficient and linear regression test.55 In a retrospective study of 22 eyes of 22 patients with nAMD resistant to treatment with at least 6 injections of bevacizumab or ranibizumab, significant improvement in CRT was observed after switching patients from intravitreal bevacizumab or ranibizumab treatment to aflibercept.56 A significant correlation had been observed during the loading phase between a reduction in CRT and an increase in BCVA (P < 0.001) among 353 treatment-naive patients with CNV receiving ranibizumab, however, the correlation decreased during the maintenance phase in all treatment arms.57
The evidence in neovascular AMD (nAMD) patients for a linear relationship between OCT-measured CRT and visual acuity, as well as between changes over time in the 2 measures, is inconsistent. In one study that pooled 2 trials of anti-VEGF treatment in patients with nAMD (N = 149 at baseline and N = 134 at month 12), there was a weak, negative correlation58 (Pearson correlation coefficient of –0.24) between BCVA measured as a letter score and CRT at baseline and no correlation between changes in BCVA and CRT from baseline to month 12.59 CRT was measured on SD-OCT images using automatic segmentation and manual error correction, and P values were adjusted to control for type I error. In a study in Chinese patients with nAMD receiving anti-VEGF treatment (N = 113), there was a moderate correlation58 between change from baseline to month 9 in CRT measured with SD-OCT and BCVA measured in logMAR units (Pearson correlation coefficient of 0.34).60 In a prospective cohort study (N = 1,142) within the Comparison of AMD Treatments Trials (CATT), a non-linear relationship was observed between TD-OCT-measured CRT and visual acuity assessed with a computerized version of the ETDRS.61 In pooled data taken from 4, 12, and 24 weeks after initiation of treatment, eyes with CRT of less than 120 µm or greater than 212 µm had worse visual acuity than eyes with a CRT in the range of 120 µm to 212 µm (i.e., the range of values within 2 standard deviations of the mean measured for healthy eyes). This non-linear relationship was confirmed with follow-up results from 5 years after baseline.22
Intra-session repeatability and inter-session reproducibility of SD-OCT-measured CRT in patients with nAMD depends on whether segmentation errors by the system’s automated segmentation software are corrected manually by readers. Segmentation errors can arise from the software’s misplacement of the foveal centre62 or inaccurate delineation of the retinal layer boundaries.63,64 The percentage of cross-sectional, 2-dimensional images acquired with SD-OCT with boundary delineation errors (in the central 1-mm diameter portion of the retina) in eyes with nAMD has been reported to range from 18% to 32%.63,64 Manual correction of these errors62 or exclusion of exams with segmentation errors65,66 has been shown to improve intra-session repeatability (between 2 consecutive exams in the same session, performed and analyzed by a single reader)62,65 and test-retest reproducibility (between 2 exams performed in different sessions, performed and analyzed by a single reader).62,66 With manual correction or exclusion of exams with automatic segmentation errors, values of 12 µm to 18 µm have been reported for the coefficient of repeatability (1.96 × square root of the within-subject variance of the differences between each pair of measurements) for intra-session repeatability.62,65 For inter-session reproducibility, a coefficient of repeatability of 26 µm was reported for separate imaging sessions conducted on the same day66 and a coefficient of repeatability of 44 µm to 47 µm was reported for separate sessions on different days62 when automatic segmentation errors were excluded or manually corrected.
A minimally important difference was not identified for CST measured by SD-OCT in nAMD.
The National Eye Institute 25-Item Visual Function Questionnaire
The National Eye Institute (NEI) Visual Function Questionnaire (VFQ) was developed as a means to measure vision-targeted quality of life. The original 51-item questionnaire was developed based on focus groups composed of people with a number of common eye conditions (e.g., age-related cataracts, age-related macular degeneration, and diabetic retinopathy); thus, the questionnaire may be used to assess quality of life for a broad range of eye conditions.49 The original 51-item questionnaire comprises 12 subscales related to general vision, ocular pain, near vision, distance vision, social functioning, mental health, role functioning, dependency, driving, peripheral vision, colour vision, and expectations for future vision. In addition, the questionnaire includes 1 general-health subscale.67 A shorter version of the original instrument, the VFQ-25, was subsequently developed, which retained the multidimensional nature of the original and is more practical and efficient to administer.68 With the exception of the expectations for future vision, all the constructs listed previously were retained in the shortened version, with a reduced number of items within each subscale. Thus, the VFQ-25 includes 25 items relevant to 11 vision-related constructs, in addition to a single-item general-health component.
Responses for each item are converted to a 0 to 100 scale, with 0 representing the worst, and 100 the best visual functioning. Items within each construct, or subscale, are averaged to create 12 subscale scores, and averaging of the subscale scores produces the overall composite score. Alternative scoring approaches for the VFQ-25 have been proposed.69 Rasch modelling is used to obtain measurements from categorical data. When comparing standard scoring with Rasch analysis and using an algorithm to approximate Rasch scores, all methods were highly correlated.69 However, standard scoring is subject to floor and ceiling effects whereby the ability of the least visually able is overestimated and the ability of the most visually able is underestimated.69
Convergent validity of the VFQ-25 has been demonstrated in patients with nAMD (N = 1,13469 and N = 9270) and in patients with a variety of chronic eye diseases (N = 597 in total and N = 108 with AMD)68 using correlations with visual acuity68,70,71 and the 36-item Short Form Survey physical and mental component summary scores.71 In the better-seeing eye, Pearson and Spearman correlation coefficients showed no correlation or weak correlations (±0.1 to ±0.358) of the VFQ-25 general health and ocular pain subscale scores with visual acuity, weak to strong (greater than ±0.558) correlations of the VFQ-25 colour vision and peripheral vision subscale scores with visual acuity, moderate (±0.3 to ±0.558) to strong correlations of the remaining subscale scores with visual acuity, and strong correlations of the composite score with visual acuity. Correlations of subscale and composite scores with visual acuity were weaker overall in the worse-seeing eye than in the better-seeing eye. A weak correlation was found between the VFQ-25 composite score and the 36-Item Short Form Survey (SF-36) physical component summary score and a moderate correlation was found between the VFQ-25 composite score and the SF-36 mental component summary score.71
Acceptable internal consistency (Cronbach alpha of ≥ 0.772) has been demonstrated for all of the VFQ-25 subscale scores (for subscales with more than one item) and the composite score in a mixed population of patients with eye diseases,68 as well as for the composite score in patients with nAMD.71 Internal consistency is acceptable for most subscale scores in patients with nAMD, with values for Cronbach alpha ranging from 0.62 to 0.92.70,71 The subscale score for ocular pain did not have acceptable internal consistency.70,71 Test-retest reliability was not assessed in the above studies.
Determination of what constitutes a clinically meaningful change in the VFQ-25 appears to be linked to its correlation with visual acuity. A 3-line (15-letter) change in visual acuity has been used as the outcome of interest in clinical trials, and corresponding changes in the VFQ-25 are suggested as clinically meaningful end points. Using results from 2 trials in patients with nAMD (N = 716 and N = 423), a 15-letter change in visual acuity in the study eye (typically the worse-seeing eye) corresponded to a change in 3.90 to 4.34 points in the composite score.20 For the better-seeing eye, the clinically relevant difference for the VFQ-25 composite score based on a 3-line change was 7.35 to 8.18 points. In terms of responsiveness, a change in 9.61 to 10.57 points corresponded to a medium effect size.20
Some assessments of the psychometric validity of the VFQ-25 using Rasch scoring and principal component analysis in patients with various eye conditions have identified issues with multidimensionality (measurement of more than one construct) and poor performance of the subscales.71,73,74 The VFQ-25 subscales were found to have too few items and were unable to discriminate among the population under measurement, and thus were not valid.73,74 Re-engineering the VFQ-25 into 2 constructs (visual functioning and socio-emotional factors) and removing misfit items (e.g., pain around eyes, general health and driving in difficult conditions) improved the psychometric validity of the scale in individuals with low vision.73,74 Considering the evidence of multidimensionality, the validity of the single composite score of the VFQ-25 may be questioned.
Presence of Intraretinal Fluid and/or Subretinal Fluid and Pigment Epithelial Detachment
The diagnosis of nAMD is based upon the presence of some characteristic findings on eye examination using imaging techniques such as OCT, OCT-angiography, fundus fluorescein angiography. Among these characteristic findings, the presence or absence of SRF and/or IRF and PED plays important roles in the treatment of nAMD.1,2
The TENAYA and LUCERNE pivotal trials measured the proportions of patients with absence of IRF, SRF, or PED as secondary outcomes. IRF and SRF are indicators of active disease routinely measured in clinical practice to evaluate clinical response. Presence of PED is a known biomarker of progression from early/intermediate to advanced AMD. IRF, SRF, and PED specifically in the central subfield (within 1 mm diameter centre of macular) were of interest. PED height is defined as RPE+PED thickness at the foveal centre, as measured in micrometres.
According to the clinical expert consulted by CADTH, IRF has been known to have a poor prognosis with respect to visual acuity. The clinical expert indicated that when clinicians observe persistent IRF, they closely monitor it and may try to shorten treatment intervals. The clinical expert consulted by CADTH also added that SRF is not as critical in terms of losing visual acuity going forward. The expert also mentioned that the PED often persists, so it is possible to get rid of IRF and SRF, but it is not possible to get rid of PED completely. In the case of nAMD, there will be fibrovascular tissue in the PED, which is why the clinicians do not expect to get rid of PED completely, and if they do, they might not like the visual outcomes. Presence of PED is a known biomarker of progression from early/intermediate to advanced AMD.75
Intraretinal fluid can be detected using OCT and appears as diffuse retinal thickening or as hyporeflective cystoid spaces (also referred to as intraretinal cysts [IRC]).76 In treatment-naive as well as previously treated eyes with nAMD, the presence of IRF has shown a tendency to be associated with worse visual acuity.77,78 A strong, negative correlation (R2 = 0.51 from linear regression) was found between IRC area and BCVA in 38 patients with treatment-naive nAMD.79 Follow-up data from the CATT has also demonstrated worse visual acuity in eyes with IRF versus no IRF (and worse VA in eyes with foveal IRF versus extrafoveal IRF) at time points ranging from 1 to 5 years following initiation of anti-VEGF treatment.22,80,81 In addition, presence of IRF and/or IRC has been shown to be a prognostic factor for worsening visual acuity in eyes with nAMD. In follow-up analysis from the CATT, the development of or worsening of adverse features (which included foveal IRF) between 2 and 5 years after treatment initiation was associated with a 3-line worsening of visual acuity in multivariate analysis.22 In a retrospective study of 447 eyes with nAMD that were switched from ranibizumab to aflibercept treatment, presence of IRF alone and presence of combined IRF and SRF at baseline were associated in linear regression over 12 months of treatment with worse visual acuity compared with absence of IRF and SRF.23 In another retrospective real-world cohort study called DIALS with 281 nAMD patients reviewed at baseline and after 3 anti-VEGF injections, those with IRF at baseline had significantly worse final BCVA compared to those without IRF (0.62 vs. 0.43, p < 0.001).24
In contrast, SRF (fluid between the retina and retinal pigment epithelium) detected using OCT does not appear to be negatively associated with visual acuity in eyes with nAMD. In treatment-naive eyes with nAMD, presence of SRF or SRF area were not associated with visual acuity.77,79 Follow-up data from the CATT showed an association of foveal SRF presence with better visual acuity 2 years after treatment initiation, and no independent association between foveal SRF presence and visual acuity after one or 5 years of follow-up.22,80 In terms of predicting visual acuity, development of foveal SRF in the CATT was not associated with a 3-line worsening of visual acuity in multivariate analysis.22 In the above-mentioned retrospective study in patients switched from ranibizumab to aflibercept treatment, presence of SRF at baseline was not associated with visual acuity over 12 months of treatment.23 In the FLUID randomized controlled trial, visual acuity was compared between 2 groups following a 24-month treatment period using a treat-and-extend ranibizumab regimen: in the SRF-intolerant treatment group, the presence of IRF and/or SRF in any amount was sufficient to indicate disease activity (and no extension of the treatment interval) and in the SRF-tolerant group, SRF of up to 200 µm in height at the subfoveal centre on its own did not preclude treatment-interval extension.82 Visual acuity was found to be noninferior in the SRF-tolerant group compared with the SRF-intolerant group.82
In a retrospective cohort study with 105 eyes of 105 patients with exudative AMD, a significant positive correlation was found between SRF width and improved BCVA (R2 = 0.230, P = 0.018) through univariate analysis, while eyes with IRF (P = 0.020) and retinal pigment epithelial loss (P = 0.009) located in the subfoveal showed worst visual outcomes in response to bevacizumab injections. In addition, IRF location and SRF width were the only parameters that remained significant explaining 9.23% of the variation in delta BCVA scores, showcasing significant prognostic factors measured by OCT.83
In a group of 84 patients with choroidal neovascularization (CNV) secondary to AMD and matching the inclusion and exclusion criteria of MARINA and ANCHOR trials, no distinction was found in the distribution of IRF, SRF and PED between gainers and poor responders of visual acuity following first ranibizumab injection.84 In the retrospective study of 22 eyes of 22 patients with nAMD resistant to treatment with at least 6 injections of bevacizumab or ranibizumab, no significant changes were observed for BCVA improvement or decrease in PED height after switching patients from intravitreal bevacizumab or ranibizumab treatment to aflibercept. The long-term retinal damage due to persistent IRF and/or SRF was assumed to be a probable cause behind the BCVA result.56 In another study, the non-responsiveness to IV aflibercept treatment in 133 nAMD patients was found to be associated with serous PED through multivariate analyses, adjusted for age, gender, CRT and greatest linear dimension.85 In another retrospective, interventional, case-control study with nAMD patients going through intravitreal ranibizumab or aflibercept treatment, the presence of a peaked PED and larger CNV area appeared to be associated with short-term anatomical response to anti-VEGF treatment.86
A retrospective review of SD-OCT scans of 21 eyes of 21 nAMD patients with PED showed a correlation between serous index of PED and the response to anti-VEGF treatment (r = .69, P = .0005).87 Another retrospective study consisting of 141 eyes of 141 patients with visual loss due to nAMD demonstrated similar results, where an association was found between initial fibrovascular PED (OR 22.9, 95% CI 2.61 to 201) as well as serous PED (OR 4.12, 95% CI 1.08 to 15.8) and non-response, judged by BCVA.88 Another retrospective study with 126 eyes with nAMD and treated with ranibizumab or aflibercept showed negative association between BCVA improvement at 1 year and PED at baseline.89
A retrospective chart review study done by 2 independent observers in 393 nAMD patients revealed that the probability of a RPE tear exponentially increased with rising extent of PED, following a linear regression model.90 The relevance of PED height and RPE tears/rips had been observed in other studies as well.91,92 Strong concordance was observed between the height of the PED and the total lesion size (P < 0.001) and the CNV size (P < 0.001).90
In a prospective study of 63 eyes of 58 patients with AMD, the reproducibility of area and volume measurements of retinal PED was assessed using SD-OCT imaging and a novel automated, quantitative algorithm. The qualitative appearance of the RPE deformation maps and the quantitative measurements of PED area and volume were found highly reproducible over the 5 different datasets obtained from each eye. The intraclass correlation coefficient was > 0.99 for both area and volume measurements obtained using the entire dataset. The correlation between lesion size and test-retest standard deviations was evaluated using the Pearson linear correlation approach, which was found to be statistically significant for volume (r = 0.59, P ≤ 0.001), but not for area (r = 0.17, P = 0.23), while using the Spearman nonparametric correlation approach, a correlation was observed between the increase in both volume and area measurements and the increase in their test-retest standard deviations (area: ῤ = 0.38, P = 0.005, n = 62; volume: ῤ =0.66, P < 0.001, n = 62).93
In the HAWK and HARRIER studies, presence or absence of IRF and SRF were independently reported. However, hypothesis testing was only planned for combined fluid status (yes = the presence IRF and/or SRF; no = the absence of both types of fluid) in the HAWK study alone. Due to the potentially conflicting associations of IRF and SRF with visual acuity, the association of a combined IRF and SRF status with visual acuity is unclear. In a post hoc analysis of the VIEW studies comparing aflibercept and ranibizumab treatment for nAMD (n = 1,456 eyes), visual acuity outcomes at week 52 were no different between eyes with IRF, IRC, and/or SRF and eyes with no retinal fluid at week 12 following 3 loading doses.94 Another retrospective post hoc analysis of the VIEW studies with 1,815 nAMD patients showed an association between lower VA and smaller CNV size at baseline, and greater vision gain (≥15 letters, P < 0.001) over 52 weeks, indicating that lower BCVA score and smaller CNV size at baseline could be associated with better VA outcomes with anti-VEGF therapy over 52 weeks.95 On the other hand, a large CNV area at baseline was significantly associated with initial or secondary loss of VA (≥5 letters, P = 0.0412) after being treated with anti-VEGF injections.96 PED and high baseline BCVA were associated with less improvement in BCVA (P = 0.03, P = 0.05, respectively) after anti-VEGF treatment, which was found in the GEFAL study.78
In a prospective, single arm, multi-centre study with 46 nAMD patients undergoing aflibercept treatment for 3 months, 45.7% (95% CI, 31.5%–60.1%) presented no IRF or SRF on OCT imaging at week 12, and a clinically significant improvement was found for BCVA [mean (SD); +4.5 (5.8) P < 0.0001].97
In the retrospective study of patients with AMD switched from ranibizumab to aflibercept treatment, there was almost perfect agreement98 between raters for identifying presence of IRF on SD-OCT exams (Kappa statistic of 0.859) and substantial agreement98 between raters for SRF (Kappa statistic of 0.713).23 Another study99 using a sample of 270 TD-OCT exams from the CATT found good agreement98 between reading teams (with each team composed of 2 certified readers and one senior reader to reconcile discrepancies) at a reading centre for identifying presence of IRF (Kappa statistic of 0.48) and substantial agreement for identifying presence of SRF (Kappa statistic of 0.80).
In a retrospective study of patients with AMD undergoing OCT imaging of the macula, consensus readings were performed by 2 certified OCT readers to determine reproducibility of 2 centres for OCT images. Lowest reproducibility was found for PED with a Kappa statistic value of 0.51 (moderate), while a Kappa statistic value 0.78 was obtained for the presence of SRF.100 Another cross-sectional interobserver agreement study using OCT scans from 78 nAMD patients found moderate agreement for both SRF (Kappa statistic of 0.62) and PED (Kappa statistic of 0.78).101
Pharmacoeconomic Review
Abbreviations
AE
adverse event
AMD
age-related macular degeneration
BCVA
best corrected visual acuity
BIA
budget impact analysis
ETDRS
Early Treatment for Diabetic Retinopathy Study
ICER
incremental cost-effectiveness ratio
nAMD
neovascular age-related macular degeneration
NMA
network meta-analysis
QALY
quality-adjusted life-year
VA
visual acuity
VEGF
vascular endothelial growth factor
Executive Summary
The executive summary comprises 2 tables (Table 1 and Table 2) and a conclusion.
Item | Description |
|---|---|
Drug product | Faricimab (Vabysmo), solution for intravitreal injection |
Submitted price | Faricimab, 28.8 mg per 0.24 mL, single-use vial: $1,350.00 |
Indication | Proposed: For the treatment of neovascular (wet) age-related macular degeneration |
Health Canada approval status | Under review (pre-NOC) |
Health Canada review pathway | Standard review |
NOC date | Anticipated: May 30, 2022 |
Reimbursement request | As per indication |
Sponsor | Hoffman-La Roche Ltd. |
Submission history | Previously reviewed: in progress Indication: diabetic macular edema Recommendation: TBD |
NOC = Notice of Compliance; TBD = to be determined; vs. = versus.
Table 2: Summary of Economic Evaluation
Component | Description |
|---|---|
Type of economic evaluation | Cost-utility analysis Markov model |
Target population | People with neovascular age-related macular degeneration |
Treatment | Faricimab |
Comparators | Aflibercept, bevacizumab, brolucizumab, ranibizumab |
Perspective | Canadian publicly funded health care payer |
Outcomes | QALYs, life-years |
Time horizon | Lifetime (25 years) |
Key data sources |
|
Submitted results |
|
Key limitations |
|
CADTH reanalysis results |
|
BCVA = best corrected visual acuity; ICER = incremental cost-effectiveness ratio; NMA = network meta-analysis; QALY = quality-adjusted life-year.
Conclusions
The CADTH Clinical Review noted that no conclusion could be drawn regarding the relative efficacy and safety of faricimab and ranibizumab in the STAIRWAY study as the study was not designed to test a hypothesis and was therefore considered exploratory. The AVENUE study showed no statistically significant difference between the faricimab and ranibizumab arms in terms of the mean change in best corrected visual acuity (BCVA) from baseline at week 36. The safety of faricimab was similar to ranibizumab in the trials. Results from an indirect treatment comparison indicated ||||||||||||||||||||||||||||||||||||||||||||||||||||||||||||||||||||||||||||||||||||||||||||||||||||||||||||||||||||||||||||||||||||||||||||||||||||||||||||||||||||||||||||||||||||||||||||||||||||||||||||||||||||||||||||||||||||||.
CADTH identified several limitations in the sponsor’s pharmacoeconomic analysis that have notable implications on the cost-effectiveness of faricimab. The sponsor made an error in its model that resulted in unrealistic estimates of survival and absolute life-years for all treatments. Probabilistic uncertainty was not adequately characterized, and the results lacked face validity. Some elements of the sponsor’s analysis pertaining to the network meta-analysis (NMA) were unable to be validated due to a lack of transparency. Last, use of bevacizumab was assumed to be as a single vial (1 injection per administration per vial), whereas feedback from clinical experts and drug plans indicated that a single vial would be used across multiple administrations.
As part of the base case, CADTH corrected the error and increased the number of administrations of bevacizumab per vial. The CADTH reanalysis resulted in a deterministic incremental cost-effectiveness ratio (ICER) for faricimab versus bevacizumab of $695,839 per quality-adjusted life-year (QALY); incremental costs were $68,328, with 0.098 incremental QALYs. A 79% price reduction would be required for faricimab to be cost-effective relative to bevacizumab; however, this may need to be greater than 98% if there is no difference in the frequency of administrations and efficacy regarding visual acuity (VA). Relative to other comparators, the analysis showed that faricimab was dominant, producing more QALYs (0.018 to 0.047) at a lower cost. However, there is a substantial degree of uncertainty regarding this finding. Results from the probabilistic analysis showed faricimab producing fewer QALYs in a substantial number of simulations. This is reflective of the high level of imprecision associated with the NMA results.
The evidence from both direct and indirect sources that inform the relative treatment effect with regard to improvements in VA and difference in number of administrations per year across comparators is highly uncertain. There is insufficient evidence to determine whether faricimab will result in an improvement in VA or fewer administrations per year. To ensure cost-effectiveness, the cost of faricimab per administration should therefore be no more than that of the lowest-cost comparator that is funded.
Stakeholder Input Relevant to the Economic Review
This section is a summary of the feedback received from the patient groups, registered clinicians, and drug plans that participated in the CADTH review process.
CADTH received 1 joint patient input submission from 4 organizations: Fighting Blindness Canada, the Canadian Council of the Blind, the CNIB Foundation, and Vision Loss Rehabilitation Canada. These groups conducted an online survey in 2020 of 337 Canadians with age-related macular degeneration (AMD), 47% of whom reported having neovascular AMD (nAMD). A majority (75%) of survey participants indicated they were currently receiving injections to treat AMD, with bevacizumab being most common, followed by ranibizumab, aflibercept, and dexamethasone. No patients surveyed had experience with faricimab. The survey found that 78% of participants were satisfied with their injections, with 73% reporting that treatment prevented further loss of eyesight. However, 74% of patients indicated that injections are painful, with pain often lingering into the evening, and half of patients experience blurry vision for several hours following injection. Results from previous patient engagement efforts indicate that most patients would prefer a treatment or medication type that can be taken less frequently.
Clinician input was provided by the Canadian Retina Society. Clinicians indicated that the current gold-standard treatment for nAMD consists of intravitreal injections of drugs designed to inhibit vascular endothelial growth factor (VEGF). These drugs have demonstrated the ability to improve and maintain current vision but are associated with a high treatment burden due to the need for frequent injections. Clinicians noted that faricimab has demonstrated noninferiority with less-frequent treatments compared to the gold standard in head-to-head phase III trials (TENAYA and LUCERNE) and could be considered as a first-line treatment or rescue therapy for patients not responding well to other drugs. The durability of faricimab would allow for more time between injections, representing a paradigm shift.
Drug plan input was received for this review. The plans had questions about the ability of the other anti-VEGF comparators to be given at 12- and 16-week intervals. The plans were interested in knowing whether patients would switch from any therapy to faricimab given the inclusion criteria of a treatment-naive status in the pivotal trials. The plans also noted the prevalence of bevacizumab use, and that multiple doses would be obtained from a single vial.
One these concerns, the frequency of injections with each comparator, was addressed in the sponsor’s model.
In addition, as part of its base case, CADTH assumed 1 vial of bevacizumab could be used for multiple administrations.
CADTH was unable to address the concerns raised from stakeholder input regarding the failure of the sponsor’s model to consider treatment switching.
Economic Review
The current review is for faricimab (Vabysmo) for nAMD.
Economic Evaluation
Summary of Sponsor’s Economic Evaluation
Overview
The sponsor submitted a cost-utility analysis assessing faricimab (a bispecific angiopoietin-2 and VEGF inhibitor) compared to other VEGF inhibitors in patients with nAMD. This modelled population aligned with the TENAYA and LUCERNE trials1,2 on which the Health Canada indication was based and represents the reimbursement request.3
Faricimab is available in single-use vials containing 28.8 mg of faricimab in 0.24 mL of solution, which provides a usable amount to deliver a single dose of a 0.05 mL solution containing 6 mg of faricimab.3 The recommended dose of faricimab is 6 mg administered by intravitreal injection every 4 weeks (monthly) for the first 4 doses, followed by 6 mg at a dosing interval of up to every 16 weeks (4 months).3 Monitoring between the dosing visits should be scheduled based on the patient’s status and at the physician’s discretion.3 The cost for faricimab is $1,350.00 per single-use vial; the annual cost assumed by the sponsor is $9,167 (6.79 injections) in year 1 and $5,724 (4.24 injections) in subsequent years.1,2,4
The comparators for this analysis are aflibercept, brolucizumab, and ranibizumab, as well as bevacizumab, which is used off-label in the nAMD population. The recommended dose for all comparators consists of 3 loading doses separated by 4-week intervals. Thereafter, comparators were assumed to be administered via a “treat-and-extend” approach whereby the interval between injections could be increased to 8, 12, or 16 weeks. The annual costs assumed by the sponsor ranged from $5,223 for bevacizumab to $14,783 for ranibizumab in year 1, and from $4,102 for bevacizumab to $10,686 for ranibizumab in subsequent years.4 These costs were based on the assumption that all vials were single-use, and any unused product was wasted.
Outcomes of the model included QALYs and life-years over a lifetime horizon of 25 years. Discounting at 1.5% per year was applied to both costs and outcomes and a cycle length of 4 weeks was used without a half-cycle correction.
Model Structure
The sponsor submitted a Markov model consisting of 6 health states defined by VA, as measured by each patient’s Early Treatment for Diabetic Retinopathy Study (ETDRS) letter score (Figure 1). Patients could also experience nAMD in the second eye, which was modelled independently of the first. A total of 36 combinations of VA levels in each eye were possible as health states (e.g., first-eye VA = 85 to 71, second eye VA = 56 to 70). Patients entered the model with nAMD in at least 1 eye, and treatment began upon entering the model. In each cycle, a patient’s first-eye VA could change by 1 or 2 health states in either direction, causing them to move between health states. Patients were also able to develop nAMD in the second eye after baseline, and it was assumed that all instances of nAMD in the second eye with a VA less than or equal to 70 would be treated. Patients’ treatment status was simultaneously tracked for each eye, as patients could be on treatment for 1, 2, or 3 years or longer before transitioning to off-treatment or death. Discontinuation was considered in the model; once a patient discontinued treatment, they were assumed to experience disease progression based on best supportive care values (i.e., the placebo arm of the NMA). A summary of the sponsor’s model structure is available in Appendix 3 (Figure 1 and Figure 2).
Model Inputs
The target population was based on the phase III TENAYA and LUCERNE trials, which enrolled patients with nAMD (N = 1,329).5 The starting cohort age in the base-case analysis was 75.0 years and the proportion of males was 41%, based on pooled baseline characteristics.4
Patients entered the model with the first eye on treatment. Baseline distribution of patients in VA states was based on a pooled analysis from the TENAYA and LUCERNE trials as follows: VA greater than 85, 0%; VA of 85 to 71, 25%; VA of 70 to 56, 43%; VA of 55 to 41, 20%; VA of 40 to 26, 10%; and VA less than or equal to 25, 2%.5 At baseline, 23% of patients were assumed to have nAMD in both eyes.4 A per-cycle incidence of nAMD in the second eye of 1.38% was also employed in the model.6
The majority of clinical inputs were derived from a sponsor-commissioned NMA of studies of treatments for nAMD.7 Dosing schedules of the same drug and dose were pooled and the NMA used random-effects models with a Bayesian framework. End points of the NMA included mean change from baseline in BCVA score (by ETDRS letters), and the proportion of patients gaining or losing between 10 and 15 letters from baseline. Other outcomes included the mean number of injections given, treatment discontinuation rates, and safety outcomes such as rates of adverse events (AEs).7
Transition probabilities were derived from various sources. The treatment effect for faricimab and aflibercept (8-week dosing) in the first year of treatment was modelled using data from the TENAYA and LUCERNE studies. For all other comparators, the efficacy in the first year was sourced from the NMA, based on the mean change in BCVA from baseline to 1 year. In the second year of treatment, efficacy data for faricimab were extrapolated from the TENAYA and LUCERNE studies, resulting in an average annual mean change in BCVA of −0.543 letters per year.4 Mean changes in BCVA informed by either the clinical trials or the NMA were converted into annual probabilities of gaining or losing VA, assuming a normal distribution. Probabilities for gaining or losing vision were derived by assigning patients to 1 of 5 health states using a Markov state model, in which patients could gain or lose up to 30 letters, or remain stable.4 To estimate transition probabilities for comparators, a relative effect observed in the NMA was added to the mean change in BCVA of faricimab, and similar calculations to derive each comparator’s distribution of transition probabilities per cycle were conducted. Mortality was also included in the model based on age- and sex-specific mortality rates informed by Statistics Canada.8 An additional mortality multiplier of 1.36 was associated with blindness (VA of less than 25 in both eyes).9
Treatment discontinuation was considered in each year of the model, with rates for all comparators equal to that of faricimab. These rates were determined using annualized all-cause discontinuation probability data for faricimab from the TENAYA and LUCERNE studies. Patients who discontinued treatment remained off treatment for the remainder of the model time horizon and experienced transition probabilities associated with best supportive care. Annualized discontinuation rates were converted to 4-week per-cycle probabilities. The following AEs were also included in the model: cataracts, endophthalmitis, gastrointestinal disorders, intraocular inflammation, retinal detachment, retinal pigment epithelial tears, and strokes. Rates of these events for faricimab were derived from the TENAYA and LUCERNE studies, and the rates for all comparator therapies were set to equal those for faricimab.4
Utility values by VA state were identified from a published paper10 that used regression models to relate VA to utility. Using this information, the sponsor calculated utility values for each combination of VA state in the best- and worst-seeing eyes.4 Disutilities associated with AEs and intravitreal injection were considered in the base case and were obtained from published sources.4 Additionally, it was assumed that half of patients would experience a utility of 0 on an injection day.
The dosing for faricimab used in the model was informed by the TENAYA and LUCERNE studies. Annual dosing frequency of all other comparators was informed by the NMA (Appendix 3, Table 10).7 Drug acquisition costs for comparators were obtained from IQVIA Delta PA data.11 All other costs were converted to 2021 Canadian dollars. Administration costs were modelled per injection and included the use of an intravitreal injection, optical coherence tomography, an ophthalmology consultation, and nursing wages.12 Costs for AEs were obtained from the Ontario Case Costing Initiative.13
Summary of Sponsor’s Economic Evaluation Results
All analyses were run probabilistically (1,000 iterations for the base-case and scenario analyses). Absolute QALYs in the deterministic analysis were consistently lower than the absolute QALYs in the probabilistic analyses for all comparators. While faricimab dominated the same comparators in both sets of results, the ICER compared to bevacizumab was higher in the probabilistic analysis. The probabilistic findings follow.
Base-Case Results
The results of the sponsor’s analysis demonstrated that 2 comparators remained on the cost-effectiveness frontier: bevacizumab and faricimab (Table 3). Aflibercept, brolucizumab, and ranibizumab were dominated by faricimab (i.e., they produced fewer QALYs at a higher cost) (Table 12). Compared to bevacizumab, faricimab was associated with $12,726 in incremental costs and 0.044 in incremental QALYs, resulting in an ICER of $289,315 per QALY. The probability of cost-effectiveness of faricimab at a $50,000 per QALY willingness-to-pay threshold was 23%. Additional results from the sponsor’s submitted economic evaluation base case are available in Appendix 3.
Table 3: Summary of the Sponsor’s Economic Evaluation Results
Drug | Total costs ($) | Total QALYs | Sequential ICER ($ per QALY) |
|---|---|---|---|
Bevacizumab | 104,741 | 9.019 | Reference |
Faricimab | 117,468 | 9.063 | 289,315 |
ICER = incremental cost-effectiveness ratio; QALY = quality-adjusted life-year.
Note: The submitted analyses are based on the publicly available prices of comparators and may not reflect confidential, negotiated prices. Only treatments on the cost-effectiveness frontier are reported in this table.
Source: Sponsor’s pharmacoeconomic submission.4
Sensitivity and Scenario Analysis Results
The sponsor conducted several scenario analyses pertaining to indirect costs, comparative efficacy, VA state utilities, bevacizumab vial sharing, maximum treatment duration, and treatment-specific AE probabilities. The scenario in which a vial of bevacizumab was assumed to be used for 15 injections had the largest impact on the results, with an ICER of $1,789,314 per QALY for faricimab versus bevacizumab. All other scenarios produced results similar to those of the base case.
CADTH Appraisal of the Sponsor’s Economic Evaluation
CADTH identified several key limitations to the sponsor’s analysis that have notable implications on the economic analysis:
Life-years gained are overestimated in the sponsor’s base case. The sponsor’s base case predicts that the target population of adults with nAMD would achieve approximately 16 discounted life-years regardless of treatment received. Given a starting age of 75 years and a 41% male population (based on Statistics Canada life tables8), CADTH calculated the maximum possible discounted life-years to be approximately 13.3. The sponsor’s results therefore do not meet face validity. A review of the Markov trace reveals that the sponsor’s model predicts a median age of survival of 95 years for all treatments, which is much higher than the predicted Canadian life expectancy of 82 years.8
CADTH investigated this result and found an error in the sponsor’s model. The sponsor’s survival formulas incorrectly referenced a blank cell, leading to unexpected survival probabilities for some health states when exponentiated.
As part of the base case, CADTH corrected this error, leading to more realistic estimates for absolute life-years in the CADTH base case.
Uncertainty regarding the comparative effectiveness of faricimab. The sponsor conducted an NMA that informed transition probabilities, discontinuation rates, rates of AEs, and injection frequency. Specifically, mean annual number of administrations |||||||||||||||||||||||||||||||||||||||||||||||||||||||||||||||||||||| (Table 10). However, details regarding the derivation and incorporation of some of these parameters were lacking. CADTH requested additional information from the sponsor pertaining to the annual number of injections by comparator, which the sponsor provided. Despite this explanation, CADTH was unable to corroborate the sponsor’s calculations with the Clinical Study Report for the TENAYA and LUCERNE trials.1,2 This represents a source of uncertainty in the analysis given that the NMA suggests ||||||||||||||||||||||||||||||||||||||||||||||||||||||||||||||||||||||||||||||||||||||||||||||||||||||||||||||||||||||||||||||||||||||||||||||||||||||||||||||||||||||||||||||||||||||||||||||||||||||||||||||||||. The CADTH clinical team could not determine the degree to which the results of the analysis were affected by heterogeneity between clinical trials in treatment administration protocols (i.e., protocol-driven administration versus fixed interval administration). Nonetheless, faricimab treat and extend ||||||||||||||||||||||||||||||||||||||||||||||||||||||||||||||||||||||||||||||||||||||||||||||||||||||||||||||||||||||||||||||||||||||||||||||||||||||||||||||||||||||||||||||||||||||||||||||||||||||||||||||||||. As the clinical expert consulted by CADTH indicated that all anti-VEGF therapies would ideally follow a treat-and-extend approach (and this is how the sponsor presumed to model it), there is uncertainty as to whether faricimab would result in fewer injections than would other comparators in clinical practice.
In addition, the CADTH Clinical Review noted that important sources of bias related to different study or patient characteristics may affect the conclusions that can be drawn about this NMA. Limitations to the NMA preclude making conclusions about the proportion of patients gaining or losing 10 or 15 ETDRS letters, retinal thickness, ocular AEs, and discontinuation. Overall, the limitations described may pose a considerable challenge in making a conclusive decision regarding the validity of the results to inform clinical practice.
CADTH was unable to address this limitation as the frequency of injections could not be corroborated. As part of a scenario analysis, CADTH assumed the efficacy of all comparators was equal to that of faricimab, using the sponsor-provided option to do so.
An additional scenario analysis also set efficacy and administration frequency as the same across all comparators (equal to faricimab).
Vial sharing occurs in clinical practice with bevacizumab. In the sponsor’s base case, vial sharing was assumed not to occur for any comparator and all vials were single-use. However, the recommended dosing of bevacizumab is only 1.25 mg per administration while the smallest vial size is 100 mg. It is therefore possible to draw multiple doses of bevacizumab from a single vial. This fact was corroborated by both the clinical expert and the drug plans, who confirmed that batch dosing occurs with bevacizumab such that multiple administrations can be obtained from a single vial.
As part of the base case, CADTH assumed that a 100 mg vial of bevacizumab could be used for 30 administrations of 1.25 mg each, based on input from the clinical expert and a drug plan representative. A scenario analysis was conducted in which 15 administrations of bevacizumab per 100 mg vial were tested.
Feedback received for this review also suggested that multiple administrations could be obtained from a single vial of aflibercept or ranibizumab. This was explored in a scenario analysis. This could occur through batching doses through dedicated pharmacies that prepare the drug for physician office use.
Uncertainty has not been adequately specified in the probabilistic analysis, and other modelling limitations bring into question the probabilistic results. For the probabilistic analysis, a standard error of 20% from the mean was assumed for many parameters. Given the data from epidemiological studies and clinical trials, assuming an arbitrary 20% of the mean is unnecessary and not reflective of the available information.
CADTH notes that the deterministic and probabilistic results did not align. Specifically, absolute deterministic QALYs were consistently lower than probabilistic QALYs, while deterministic drug acquisition costs were consistently higher than probabilistic drug acquisition costs. This unexpected model behaviour persisted despite numerous attempts by CADTH to explain the discrepancies. Uncertainties around treatment effects, as derived from the NMA, are based on hard-coded outputs. For each iteration of uncertainty, the model selects from a pool of outputs that are taken directly from the NMA. This is a correct approach to maintain correlation between treatment-effect parameters. However, CADTH cannot validate whether this output is correct as it is taken directly from the NMA, which is analyzed separately from the submitted analysis. CADTH notes that, when the average is taken from the fixed sample of treatment effects, this sometimes deviates from the mean specified in the NMA output.
In addition, the model includes 9,784 uses of the IFERROR statement, which complicates the model validation process by overwriting cells in which an error would otherwise occur.
CADTH was unable to resolve these issues. Given the lack of transparency in the probabilistic analysis, CADTH has reported deterministic results for the base case and all scenario analyses, with the probabilistic base case presented separately in Appendix 4.
Additionally, the following key assumptions were made by the sponsor and have been appraised by CADTH (See Table 4).
Table 4: Key Assumptions of the Submitted Economic Evaluation (Not Noted as Limitations to the Submission)
Sponsor’s key assumption | CADTH comment |
|---|---|
23% of patients were assumed to have nAMD in the second eye at baseline. | Uncertain but likely appropriate. |
Patients with disease in their second eye would only be treated once their visual acuity fell below 70. | Uncertain. This assumption did not align with the experience of the clinical expert, who stated that, for both their first and second eyes, patients would be treated if there was evidence of nAMD in clinical imaging, even if vision was perfect. This is unlikely to meaningfully affect the results. |
Patients would be monitored during their IVT injection visits and would not require any additional visits dedicated solely to monitoring. | Appropriate, according to the clinical expert. |
Beyond year 2, many clinical inputs such as number of injections and mean change in BCVA were maintained throughout the model for patients who remained on treatment. | Appropriate. The clinical expert indicated that continued treatment with an anti-VEGF may lead to disease waning through a cumulative treatment benefit. Treatment efficacy is expected to be maintained. |
BCVA = best corrected visual acuity; IVT = intravitreal; nAMD = neovascular age-related macular degeneration; VEGF = vascular endothelial growth factor.
CADTH Reanalyses of the Economic Evaluation
Base-Case Results
The CADTH base case was derived by making 1 change and 1 correction, in consultation with clinical experts. These changes, summarized in Table 5, involved correcting an error and increasing the number of bevacizumab administrations obtained per vial. CADTH reported deterministic results as part of the base case.
In the CADTH base case, faricimab was associated with an estimated $96,970 in total costs and 6.650 QALYs, compared with total $28,642 and 6.552, respectively, for patients on bevacizumab. The deterministic ICER for faricimab compared to bevacizumab was $695,839 per QALY. In the CADTH base case, ranibizumab, aflibercept, and brolucizumab remained dominated by faricimab, producing fewer QALYs at a higher cost. However, this result is highly uncertain, as shown by the results from the probabilistic analysis in Figure 3, which presents the incremental QALYs and costs for each comparator relative to faricimab across 1,000 simulations. A substantial proportion of simulations show faricimab producing fewer QALYs, represented by points that fall to the left of the y-axis. Results of the stepped reanalysis are available in Table 6 with full disaggregated results for all comparators available in Appendix 4, Table 13.
Scenario Analysis Results
CADTH undertook a price-reduction analyses based on the sponsor’s and CADTH’s base cases. The CADTH base case suggested a price reduction of 79% would be required for faricimab to achieve cost-effectiveness at a willingness-to-pay threshold of $50,000 per QALY (Table 7).
Table 5: CADTH Revisions to the Submitted Economic Evaluation
Stepped analysis | Sponsor’s value or assumption | CADTH value or assumption |
|---|---|---|
Corrections to sponsor’s base case | ||
1. Error in model | Incorrectly referenced an empty cell | Cell value set to 1 to reinstate appropriate survival probabilities according to Canadian life tables |
Changes to derive the CADTH base case | ||
1. Number of administrations of bevacizumab | 1 administration per 100 mg vial | 30 administrations per 100 mg vial |
CADTH base case | — | Reanalysis 1 |
Table 6: Summary of the Stepped Analysis of the CADTH Reanalysis Results
Stepped analysis | Drug | Total costs ($) | Total LYs | Total QALYs | ICER ($ per QALY) |
|---|---|---|---|---|---|
Sponsor’s base case | Bevacizumab | 108,994 | 16.042 | 8.351 | Reference |
Faricimab | 127,155 | 15.979 | 8.443 | 195,847 | |
Sponsor’s base case (corrected) | Bevacizumab | 81,935 | 11.741 | 6.552 | Reference |
Faricimab | 96,970 | 11.746 | 6.650 | 153,114 | |
CADTH reanalysis 1 and base case | Bevacizumab | 28,642 | 11.741 | 6.552 | Reference |
Faricimab | 96,970 | 11.746 | 6.650 | 695,839 |
ICER = incremental cost-effectiveness ratio; LY = life-year; QALY = quality-adjusted life-year.
Note: In all stepwise analyses and the base case, aflibercept, brolucizumab, and ranibizumab were dominated and, as such, do not appear on the efficiency frontier. Full results are available in Appendix 4.
Table 7: CADTH Price-Reduction Analyses
Analysis | ICERs for faricimab vs. bevacizumab ($ per QALY) | |
|---|---|---|
Price reduction | Sponsor base case | CADTH reanalysis |
No price reduction | 289,315 | 695,839 |
10% | 67,939 | 614,053 |
11% | 45,809 | 605,871 |
20% | Dominant | 532,233 |
30% | Dominant | 450,412 |
40% | Dominant | 368,591 |
50% | Dominant | 286,771 |
60% | Dominant | 204,950 |
70% | Dominant | 123,129 |
79% | Dominant | 49,491 |
ICER = incremental cost-effectiveness ratio; QALY = quality-adjusted life-year; vs. = versus.
Note: Bold text reflects the price reduction at which the ICER falls below $50,000 per QALY.
CADTH undertook several scenario analyses to determine the impact of alternative assumptions on the cost-effectiveness of faricimab in the base case:
The efficacy of all comparators was assumed to be equal to that of faricimab in terms of mean change in BCVA and the resulting transition probabilities. The annual number of administrations remained unchanged from the sponsor’s base case.
The efficacy of all comparators was assumed to be equal to that of faricimab in terms of mean change in BCVA and the resulting transition probabilities. The annual number of administrations was equal to that of faricimab for all comparators.
Each 100 mg vial of bevacizumab could be used for 15 administrations.
Multiple administrations per vial were also assumed for aflibercept and ranibizumab (3 injections per vial in each case).
The results of these analyses are presented in Appendix 4, Table 16. The scenario in which equal efficacy was assumed resulted in an ICER of $2,331,245 per QALY for faricimab compared to bevacizumab. The scenario analysis assuming equal administration frequency and equal efficacy shows that the total costs associated with faricimab approach that of other alternatives, confirming that the degree of cost difference shown in the base-case analysis is derived from an assumed difference in administration frequency. The price reduction required for faricimab to achieve a $50,000 per QALY threshold compared to bevacizumab in this analysis is greater than 98%.
Issues for Consideration
A biosimilar for ranibizumab (Byooviz) recently approved by Health Canada14 may affect the cost-effectiveness of faricimab versus ranibizumab depending on the list price.
Brolucizumab has received a letter of intent from the pan-Canadian Pharmaceutical Alliance, with negotiations concluding in August 2021.15 The cost-effectiveness of faricimab compared to brolucizumab at this confidential price is unknown.
Overall Conclusions
The CADTH Clinical Review noted that no conclusions could be drawn regarding the relative efficacy and safety of faricimab and ranibizumab in the STAIRWAY study as the study was not designed to test a hypothesis and was therefore considered exploratory. The AVENUE study found no statistically significant difference between the faricimab and ranibizumab arms in terms of the mean change in BCVA from baseline at week 36. The safety of faricimab was similar to ranibizumab in the trials. Results from an indirect treatment comparison indicated ||||||||||||||||||||||||||||||||||||||||||||||||||||||||||||||||||||||||||||||||||||||||||||||||||||||||||||||||||||||||||||||||||||||||||||||||||||||||||||||||||||||||||||||||||||||||||||||||||||||||||||||||||||||||||||||||||||||||||||||||||||||||||||||||||||||||||.
CADTH identified several limitations in the sponsor’s pharmacoeconomic analysis that have notable implications on the cost-effectiveness of faricimab. An error in the sponsor’s model resulted in unrealistic estimates of survival and absolute life-years for all treatments. Probabilistic uncertainty was not characterized adequately, and results lacked face validity. Some elements of the sponsor’s analysis pertaining to the NMA could not be validated due to a lack of transparency. Last, use of bevacizumab was assumed to be as a single vial (1 injection per administration per vial), whereas feedback from clinical experts and drug plans indicated a single vial would be used across multiple administrations.
As part of the base case, CADTH corrected the error and increased the number of administrations of bevacizumab per vial. The CADTH reanalysis resulted in a deterministic ICER for faricimab versus bevacizumab of $695,839 per QALY (incremental costs: $68,328; incremental QALYs: 0.098). A 79% price reduction would be required for faricimab to be cost-effective relative to bevacizumab; however, the reduction may need to be greater than 98% if there is no difference in frequency of administrations and efficacy regarding VA. The analysis showed that faricimab was dominant relative to other comparators, producing more QALYs (0.018 to 0.047) at a lower cost. However, this finding is subject to a substantial degree of uncertainty. Results from the probabilistic analysis showed faricimab producing fewer QALYs in a substantial number of simulations due to the high level of imprecision of the NMA results.
The evidence from both direct and indirect sources informing the relative treatment effect with regard to improvements in VA and the difference in number of administrations per year across comparators are highly uncertain. There is insufficient evidence to determine whether faricimab will result in an improvement in VA or fewer administrations per year. To ensure cost-effectiveness, the price of faricimab per administration should therefore be no more than that of the lowest-cost comparator that is funded.
References
1.Clinical Study Report: GR40306 [TENAYA]. A phase III, multicenter, randomized, double-masked, active comparator-controlled study to evaluate the efficacy and safety of faricimab (RO6867461) in patients with neovascular age-related mascular degeneration (nAMD) [internal sponsor's report]. Basel (CH): F. Hoffmann-La Roche Ltd; 2021 May 25.
2.Clinical Study Report: GR40844 [LUCERNE]. A phase III, multicenter, randomized, double-masked, active comparator-controlled study to evaluate the efficacy and safety of faricimab (RO6867461) in patients with neovascular age-related mascular degeneration (nAMD) [internal sponsor's report]. Basel (CH): F. Hoffmann-La Roche Ltd; 2021 May 25.
3.Vabysmo (faricimab): 6 mg/0.05 mL solution for intravitreal injection, single-use vials [product monograph]. Mississauga (ON): Hoffmann-La Roche Limited; 2022 May 27.
4.Pharmacoeconomic evaluation [internal sponsor's report]. In: Drug Reimbursement Review sponsor submission: Vabysmo (faricimab), 6 mg/0.05 mL solution for intravitreal injection. Mississauga (ON): Hoffman-La Roche Limited; 2022 Jan 31.
5.Heier JS, Khanani AM, Quezada Ruiz C, et al. Efficacy, durability, and safety of intravitreal faricimab up to every 16 weeks for neovascular age-related macular degeneration (TENAYA and LUCERNE): two randomised, double-masked, phase 3, non-inferiority trials. Lancet. 2022;399(10326):729-740. PubMed
6.Zarranz-Ventura J, Liew G, Johnston RL, et al. The neovascular age-related macular degeneration database: report 2: incidence, management, and visual outcomes of second treated eyes. Ophthalmology. 2014;121(10):1966-1975. PubMed
7.Network meta-analysis of treatments for neovascular age-related macular degeneration (nAMD). Roche compound of interest: faricimab [internal sponsor's report]. In: Drug Reimbursement Review sponsor submission: faricimab, 6mg/0.05mL solution, intravitreal injection. Missisauga (ON): Hoffmann-La Roche Limited; 2021 Oct.
8.Table: 13-10-0114-01. Life expectancy and other elements of the life table, Canada, all provinces except Prince Edward Island. Ottawa (ON): Statistics Canada; 2022: https://www150.statcan.gc.ca/t1/tbl1/en/tv.action?pid=1310011401. Accessed 2022 Feb 16.
9.Zhang T, Jiang W, Song X, Zhang D. The association between visual impairment and the risk of mortality: a meta-analysis of prospective studies. J Epidemiol Community Health. 2016;70(8):836-842. PubMed
10.Czoski-Murray C, Carlton J, Brazier J, Young T, Papo N, Kang H. Valuing condition-specific health states using simulation contact lenses. Value Health. 2009;12(5):793-799. PubMed
11.DeltaPA. Ottawa (ON): IQVIA; 2021: https://www.iqvia.com/. Accessed 2022 Feb 16.
12.Schedule of benefits for physician services under the Health Insurance Act: effective November 1, 2021. Toronto (ON): Ontario Ministry of Health; 2022: https://www.health.gov.on.ca/en/pro/programs/ohip/sob/physserv/sob_master.pdf. Accessed 2022 Feb 16.
13.Ontario Case Costing Initiative (OCCI). Toronto (ON): Ontario Health and Long-Term Care; 2017: https://data.ontario.ca/dataset/ontario-case-costing-initiative-occi. Accessed 2022 Feb 16.
14.Jeremias S. Health Canada Approves First Ranibizumab Biosimilar. Cranbury (NJ): The Center for Biosimilars; 2022: https://www.centerforbiosimilars.com/view/health-canada-approves-first-ranibizumab-biosimilar. Accessed 2022 Apr 12.
15.Age-related macular degeneration. Toronto (ON): pan-Canadian Pharmaceutical Alliance (pCPA); 2021: https://www.pcpacanada.ca/negotiation/21223. Accessed 2022 Apr 26.
16.Ontario Ministry of Health, Ontario Ministry of Long-Term Care. Ontario drug benefit formulary/comparative drug index. 2021; https://www.formulary.health.gov.on.ca/formulary/. Accessed 2022 Feb 16.
17.Eylea (aflibercept): 2 mg / 0.05 mL solution for intravitreal injection in single use pre-filled syringes and single use vials [product monograph]. Missisauga (ON): Bayer Inc.; 2022: https://pdf.hres.ca/dpd_pm/00064757.PDF. Accessed 2022 Mar 29.
18.Lucentis (ranibizumab): 10 mg/mL solution for injection in single use vials and single use pre-filled syringes [product monograph]. Dorval (QC): Novartis Pharmaceuticals Canada Inc.; 2021 Dec 21: https://pdf.hres.ca/dpd_pm/00064117.PDF. Accessed 2022 Mar 29.
19.Beovu (brolucizumab): 6 mg / 0.05 mL solution for intravitreal injection [product monograph]. Dorval (QC): Novartis Pharmaceuticals Canada Inc.; 2022 Feb 17: https://pdf.hres.ca/dpd_pm/00064837.PDF. Accessed 2022 Mar 29.
20.Wong WL, Su X, Li X, et al. Global prevalence of age-related macular degeneration and disease burden projection for 2020 and 2040: a systematic review and meta-analysis. Lancet Glob Health. 2014;2(2):e106-116. PubMed
21.Budget Impact Analysis [internal sponsor's report]. In: Drug Reimbursement Review sponsor submission: Vabysmo (faricimab), 6 mg/0.05 mL solution for intravitreal injection. Mississauga (ON): Hoffman-La Roche Limited; 2022 Jan 31.
Appendix 1: Cost Comparison Table
Note that this appendix has not been copy-edited.
The comparators presented in the following table have been deemed to be appropriate based on feedback from clinical experts. Comparators may be recommended (appropriate) practice or actual practice. Existing product listing agreements are not reflected in the table and as such, the table may not represent the actual costs to public drug plans.
Table 8: CADTH Cost Comparison Table for Neovascular Age-Related Macular Degeneration
Treatment | Strength/ concentration | Form (vial size if single-use) | Price ($) | Recommended dosagea | Daily cost ($) | Annual cost ($) |
|---|---|---|---|---|---|---|
Faricimab | 120 mg/mL | 0.05 mL solution for intravitreal injection | 1,350.0000b | 6 mg every 4 weeks for the first 4 doses followed by 6 mg at a dosing interval of up to every 16 weeks | Year 1: 22.18 to 51.75 to Subsequent: 11.09 to 48.05 | Year 1: 8,100 to 18,900 (6 to 14 inj.) Subsequent: 4,050 to 17,550 (3 to 13 inj.) |
Anti-VEGF inhibitors | ||||||
Aflibercept (Eylea) | 40 mg/mL | 0.05 mL Solution for intravitreal injection | 1,418.0000 | 2 mg every 4 weeks for the first 3 doses followed by 2 mg every 8 to 16 weeks | Year 1: 19.41 to 31.06 Subsequent: 15.53 to 27.18 | Year 1: 7,090 to 11,344 (5 to 8 inj.) Subsequent: 5,672 to 9,926 (4 to 7 inj.) |
Bevacizumab (Avastin) | 25 mg/mL | 4 mL 16 mL Solution for intravitreal injection | 519.1800 2,076.7104 | 1.25 mg every 4 weeks for the first 3 doses followed by 1.25 mg every 8 to 12 weeksc | Year 1: 0.28 to 0.38d Subsequent: 0.19 to 0.33d | Year 1: 104 to 138 (6 to 8 inj.)d Subsequent: 69 to 121 (4 to 7 inj.)d |
Bevacizumab (Mvasi) | 25 mg/mL | 4 mL 16 mL Solution for intravitreal injection | 347.0000 1,388.0000 | 1.25 mg every 4 weeks for the first 3 doses followed by 1.25 mg every 8 to 12 weeksc | Year 1: 0.19 to 0.25d Subsequent: 0.13 to 0.22d | Year 1: 69 to 93 (6 to 8 inj.)d Subsequent: 46 to 81 (4 to 7 inj.)d |
Brolucizumab (Beovu) | 120 mg/mL | 0.05 mL Solution for intravitreal injection | 1,390.0000 | 6 mg every 4 weeks for the first 3 doses followed by 6 mg every 8 to 12 weeks | Year 1: 22.83 to 30.44 Subsequent: 15.22 to 26.64 | Year 1: 8,340 to 11,120 (6 to 8 inj.) Subsequent: 5,560 to 9,730 (4 to 7 inj.) |
Ranibizumab (Lucentis) | 10 mg/mL | 0.23 mL Solution for intravitreal injection | 1,616.5500 | 0.5 mg every 4 weeks for the first 3 doses followed by | Year 1: 26.56 to 61.96 Subsequent: 22.13 to 57.54 | Year 1: 9,699 to 22,632 (6 to 14 inj.) Subsequent: 8,083 to 21,015 (5 to 13 inj.) |
inj. = injections; nAMD = neovascular age-related macular degeneration; VEGF = vascular endothelial growth factor.
Note: All prices are from the Ontario Drug Benefit Formulary (accessed March 2022),16 unless otherwise indicated, and do not include dispensing fees. Annual costs are based on 52 weeks per year.
aRecommended doses are from the respective product monographs, unless otherwise indicated.17-19
bSponsor submitted price.4
cBevacizumab is used off-label in this population and, as such, does not have a recommended dosage for nAMD in the product monograph. Dosing for bevacizumab was obtained from the clinical expert.
dCosts for bevacizumab calculated based on the assumption that 30 doses could be obtained per 100 mg (4 mL) vial. This assumption was validated by clinical experts and the drug plans.
Appendix 2: Submission Quality
Note that this appendix has not been copy-edited.
Description | Yes/No | Comments |
|---|---|---|
Population is relevant, with no critical intervention missing, and no relevant outcome missing | Yes | No comment. |
Model has been adequately programmed and has sufficient face validity | No | Life-years gained were overestimated for all treatments compared to a general Canadian population. Life-years were the lowest for faricimab while QALYs were highest. |
Model structure is adequate for decision problem | Yes | No comment. |
Data incorporation into the model has been done adequately (e.g., parameters for probabilistic analysis) | No | The sponsor arbitrarily chose standard error values of 20% for most parameters without an evidence-based rationale. |
Parameter and structural uncertainty were adequately assessed; analyses were adequate to inform the decision problem | No | Probabilistic results were consistently different than deterministic despite considerable testing and did not meet face validity. |
The submission was well organized and complete; the information was easy to locate (clear and transparent reporting; technical documentation available in enough details) | No | The model did not permit the reviewer to trace the formulas through the model, making validation difficult. The reviewer was unable to easily navigate to named cells and parameters as is generally possible. In addition, hidden sheets, cells, and headings further complicated the validation process. |
QALY = quality-adjusted life-year.
Appendix 3: Additional Information on the Submitted Economic Evaluation
Note that this appendix has not been copy-edited.
Figure 1: Sponsor’s Model Structure
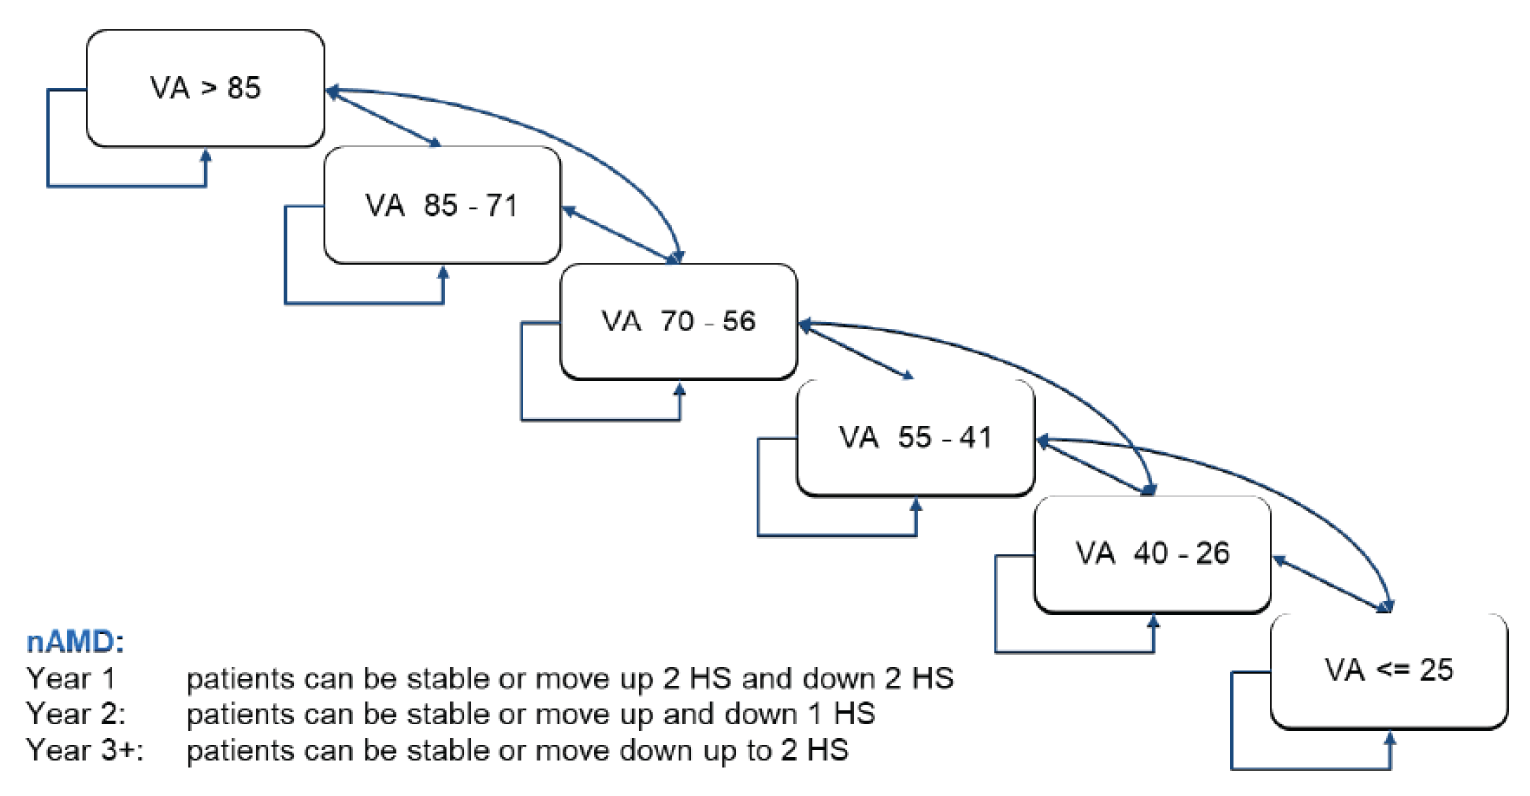
HS = health state; nAMD = neovascular age-related macular degeneration; VA = visual acuity.
Source: Sponsor’s pharmacoeconomic submission.4
Figure 2: Treatment-Related States and Transitions
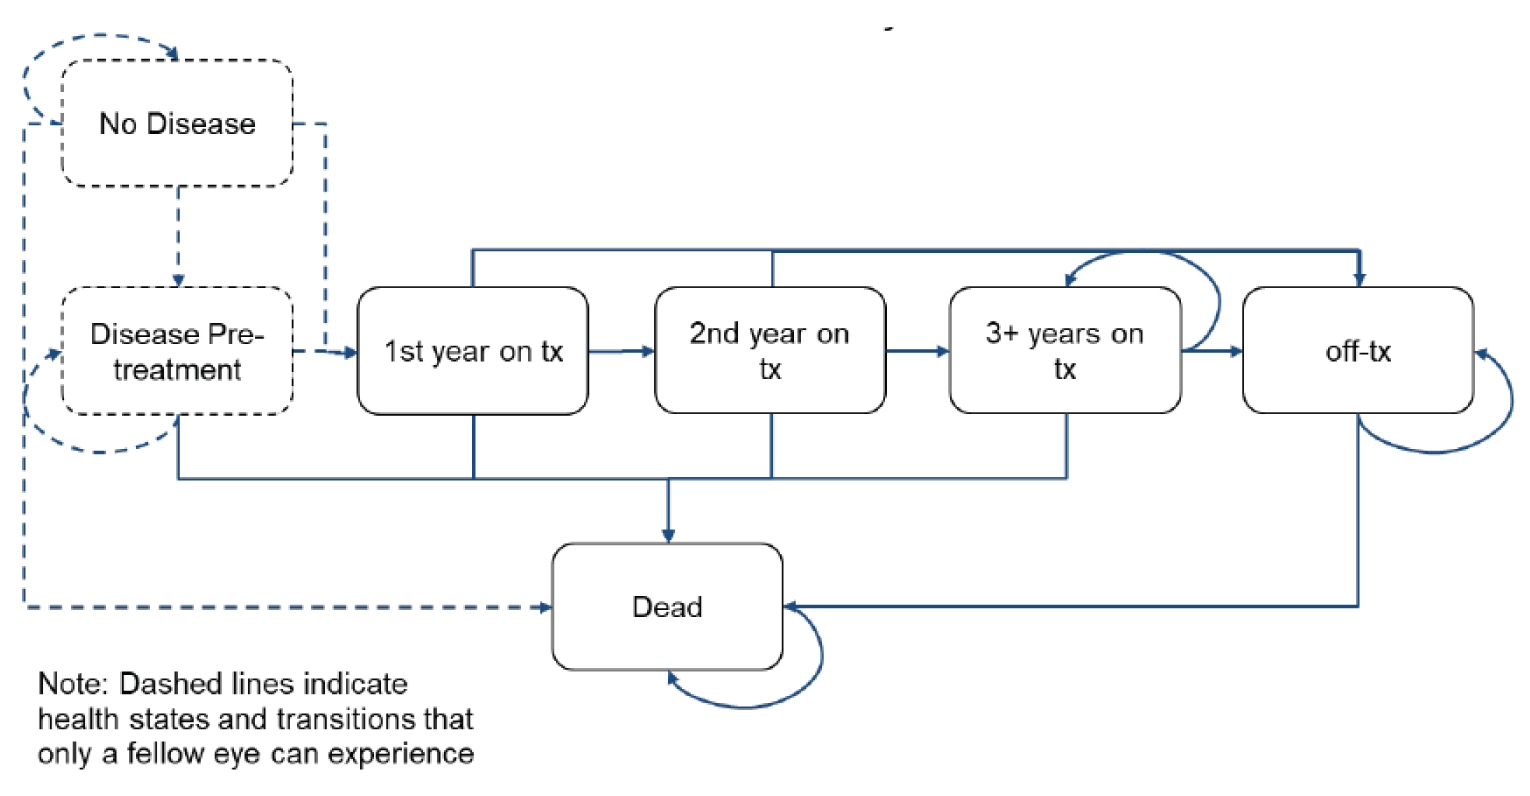
Tx = treatment.
Source: Sponsor’s pharmacoeconomic submission.4
Table 10: Treatment-Specific Annual Number of Administrations
Treatment | Year 1 administrations | Year 2+ administrations | Source |
|---|---|---|---|
Faricimab | |||||||||| | |||||||||| | TENAYA and LUCERNE5 |
Ranibizumab | |||||||||| | |||||||||| | NMA7 |
Aflibercept | |||||||||| | |||||||||| | NMA7 |
Brolucizumab | |||||||||| | |||||||||| | NMA7 |
Bevacizumab | |||||||||| | |||||||||| | NMA7 |
NMA = network meta-analysis.
Source: Sponsor’s pharmacoeconomic submission.4
Detailed Results of the Sponsor’s Base Case
Table 11: Disaggregated Results of the Sponsor’s Base Case
Parameter | Faricimab | Ranibizumab | Aflibercept | Brolucizumab | Bevacizumab |
|---|---|---|---|---|---|
Discounted LYs | |||||
Total | 16.134 | 16.160 | 16.217 | 16.226 | 16.183 |
Discounted QALYs | |||||
Total | 9.063 | 9.041 | 9.047 | 9.040 | 9.019 |
First-eye VA >85 | 0.564 | 0.542 | 0.523 | 0.523 | 0.532 |
First-eye VA 85-71 | 1.234 | 1.226 | 1.193 | 1.188 | 1.207 |
First-eye VA 70-56 | 1.766 | 1.779 | 1.758 | 1.754 | 1.764 |
First-eye VA 55-41 | 1.736 | 1.762 | 1.774 | 1.775 | 1.762 |
First-eye VA 40-26 | 1.310 | 1.317 | 1.339 | 1.340 | 1.324 |
First-eye VA ≤25 | 2.454 | 2.414 | 2.459 | 2.461 | 2.430 |
Discounted costs ($) | |||||
Total | 117,468 | 211,114 | 151,113 | 162,450 | 104,741 |
Drug acquisition | 97,378 | 182,191 | 127,170 | 136,637 | 70,694 |
Administration | 15,675 | 24,508 | 19,485 | 21,350 | 29,611 |
AE management | 3,172 | 3,177 | 3,190 | 3,192 | 3,182 |
Costs of visual impairment | 1,242 | 1,238 | 1,268 | 1,272 | 1,254 |
Pairwise ICER of faricimab vs. comparator ($/QALY) | NA | Dominant | Dominant | Dominant | 289,315 |
ICER = incremental cost-effectiveness ratio; LY = life-year; NA = not applicable; QALY = quality-adjusted life-year; VA = visual acuity.
Table 12: Probabilistic Cost-Effectiveness Sequential Analysis From Sponsor’s Base Case
Treatment | Cost | QALYs | Incremental Cost | Incremental QALYs | ICER ($/QALY) |
|---|---|---|---|---|---|
Bevacizumab | $104,741 | 9.019 | Reference | Reference | Reference |
Faricimab | $117,468 | 9.063 | $12,726 | 0.044 | $289,315 |
Aflibercept | $151,113 | 9.047 | $46,372 | 0.028 | Dominated by faricimab |
Brolucizumab | $165,203 | 9.040 | $60,461 | 0.021 | Dominated by faricimab, aflibercept |
Ranibizumab | $211,114 | 9.041 | $106,373 | 0.022 | Dominated by faricimab, aflibercept |
ICER = incremental cost-effectiveness ratio; QALY = quality-adjusted life-year.
Appendix 4: Additional Details on the CADTH Reanalyses and Sensitivity Analyses of the Economic Evaluation
Note that this appendix has not been copy-edited.
Detailed Results of CADTH Base Case
Table 13: Disaggregated Summary of CADTH’s Economic Evaluation Results (Deterministic)
Parameter | Faricimab | Ranibizumab | Aflibercept | Brolucizumab | Bevacizumab |
|---|---|---|---|---|---|
Discounted LYs | |||||
Total | 11.746 | 11.747 | 11.743 | 11.743 | 11.741 |
Discounted QALYs | |||||
Total | 6.650 | 6.632 | 6.612 | 6.604 | 6.552 |
First-eye VA >85 | 0.336 | 0.324 | 0.301 | 0.299 | 0.261 |
First-eye VA 85-71 | 1.201 | 1.184 | 1.152 | 1.147 | 1.104 |
First-eye VA 70-56 | 1.510 | 1.535 | 1.530 | 1.526 | 1.533 |
First-eye VA 55-41 | 1.130 | 1.134 | 1.145 | 1.144 | 1.176 |
First-eye VA 40-26 | 0.716 | 0.712 | 0.725 | 0.726 | 0.735 |
First-eye VA ≤25 | 1.758 | 1.743 | 1.759 | 1.761 | 1.743 |
Discounted costs ($) | |||||
Total | 96,970 | 168,706 | 119,821 | 130,222 | 28,642 |
Drug acquisition | 80,340 | 145,455 | 100,679 | 109,402 | 1,838 |
Administration | 12,944 | 19,571 | 15,443 | 17,119 | 23,096 |
AE management | 2,580 | 2,580 | 2,579 | 2,579 | 2,579 |
Costs of visual impairment | 1,106 | 1,100 | 1,119 | 1,122 | 1,129 |
Pairwise ICER of faricimab v comparator ($ per QALY) | NA | Dominant | Dominant | Dominant | 695,839 |
ICER = incremental cost-effectiveness ratio; LY = life-year; NA = not applicable; QALY = quality-adjusted life-year; VA = visual acuity; vs. = versus.
Table 14: Deterministic Cost-Effectiveness Sequential Analysis From CADTH Base Case
Treatment | Cost | QALYs | Incremental Cost | Incremental QALYs | ICER ($/QALY) |
|---|---|---|---|---|---|
Bevacizumab | $28,642 | 6.552 | Reference | Reference | Reference |
Faricimab | $96,970 | 6.650 | $68,328 | 0.098 | $695,839 |
Aflibercept | $119,821 | 6.612 | $91,179 | 0.059 | Dominated by faricimab |
Brolucizumab | $130,222 | 6.604 | $101,580 | 0.051 | Dominated by faricimab, aflibercept |
Ranibizumab | $168,706 | 6.632 | $140,064 | 0.080 | Dominated by faricimab |
ICER = incremental cost-effectiveness ratio; QALY = quality-adjusted life-year.
Table 15: Disaggregated Summary of CADTH’s Economic Evaluation Results (Probabilistic Scenario Analysis)
Parameter | Faricimab | Ranibizumab | Aflibercept | Brolucizumab | Bevacizumab |
|---|---|---|---|---|---|
Discounted LYs | |||||
Total | 11.927 | 11.928 | 11.926 | 11.925 | 11.927 |
Discounted QALYs | |||||
Total | 7.074 | 7.048 | 7.027 | 7.020 | 7.020 |
First-eye VA >85 | 0.541 | 0.521 | 0.502 | 0.501 | 0.511 |
First-eye VA 85-71 | 1.163 | 1.156 | 1.124 | 1.119 | 1.138 |
First-eye VA 70-56 | 1.636 | 1.649 | 1.626 | 1.623 | 1.634 |
First-eye VA 55-41 | 1.370 | 1.389 | 1.398 | 1.399 | 1.389 |
First-eye VA 40-26 | 0.887 | 0.889 | 0.905 | 0.906 | 0.894 |
First-eye VA ≤25 | 1.477 | 1.443 | 1.471 | 1.472 | 1.454 |
Discounted costs ($) | |||||
Total | 90,632 | 161,456 | 115,559 | 123,494 | 27,531 |
Drug acquisition | 75,315 | 139,496 | 97,418 | 104,032 | 1,792 |
Administration | 12,125 | 18,772 | 14,935 | 16,252 | 22,541 |
AE management | 2,420 | 2,420 | 2,420 | 2,420 | 2,420 |
Costs of visual impairment | 771 | 767 | 787 | 789 | 778 |
Pairwise ICER of faricimab vs. comparator ($ per QALY) | NA | Dominant | Dominant | Dominant | 1,173,169 |
ICER = incremental cost-effectiveness ratio; LY = life-year; NA = not applicable; QALY = quality-adjusted life-year; VA = visual acuity; vs. = versus.
Figure 3: Incremental Results Across 1,000 Probabilistic Iterations
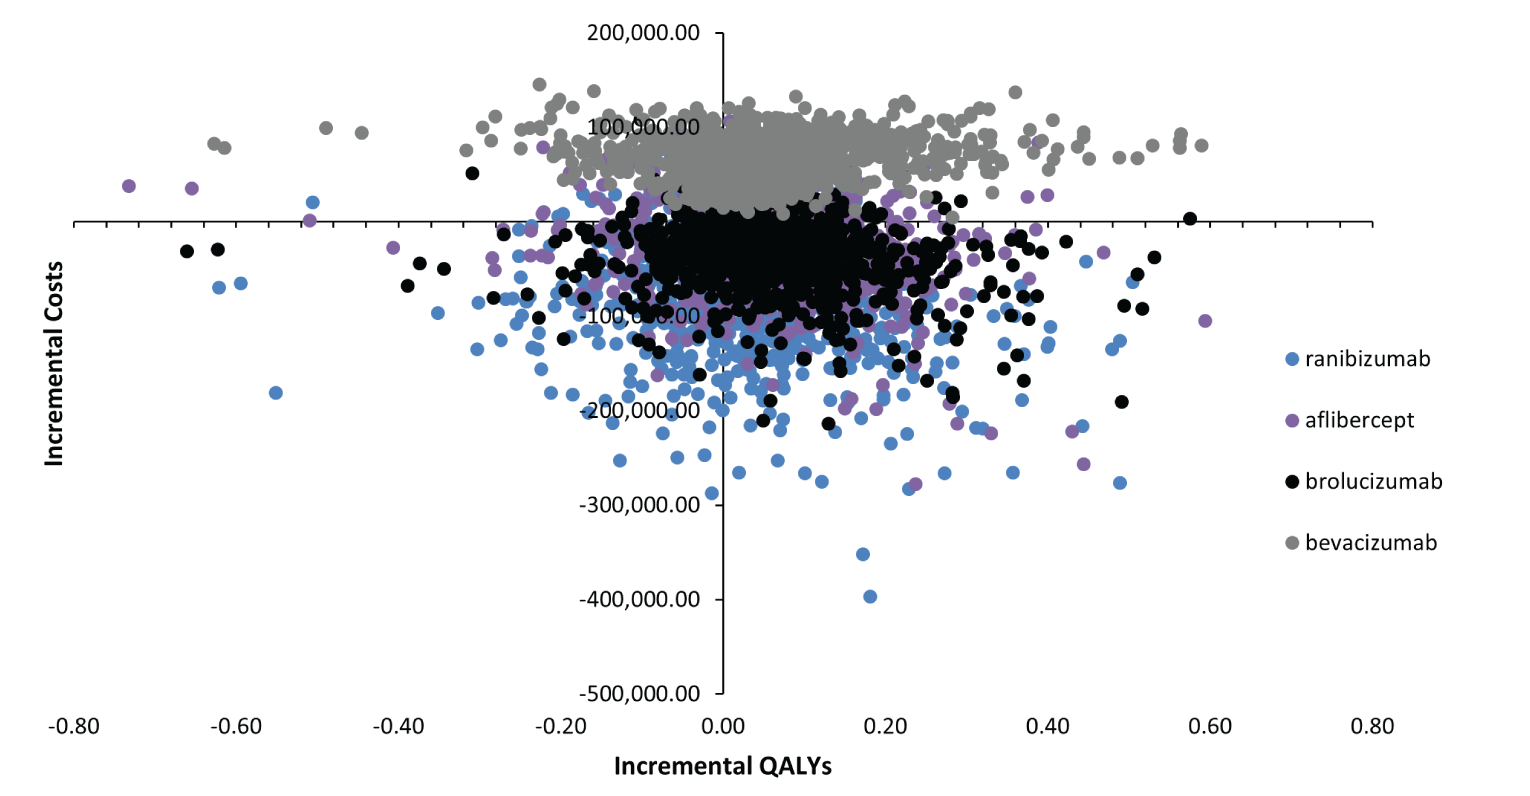
Source: Sponsor’s pharmacoeconomic model — CADTH base case.4
Scenario Analyses
Table 16: Summary of Scenario Analyses Conducted on CADTH Base Case
Scenario | Drug | Total costs ($) | Total LYs | Total QALYs | Sequential ICER |
|---|---|---|---|---|---|
CADTH base case | Bevacizumab | 28,642 | 11.741 | 6.552 | Reference |
Faricimab | 96,970 | 11.746 | 6.650 | 695,839 | |
Aflibercept | 119,821 | 11.743 | 6.612 | Dominated by faricimab | |
Brolucizumab | 130,222 | 11.743 | 6.604 | Dominated by faricimab, aflibercept | |
Ranibizumab | 168,706 | 11.747 | 6.632 | Dominated by faricimab | |
1. Equal efficacy of all comparators | Bevacizumab | 28,642 | 11.746 | 6.621 | Reference |
Faricimab | 96,970 | 11.746 | 6.650 | 2,331,245 | |
Aflibercept | 119,825 | 11.746 | 6.643 | Dominated by faricimab | |
Brolucizumab | 130,230 | 11.746 | 6.639 | Dominated by faricimab, aflibercept | |
Ranibizumab | 168,698 | 11.746 | 6.631 | Dominated by faricimab, aflibercept, brolucizumab | |
2. Equal efficacy of all comparators and equal frequency of administrations | Bevacizumab | 17,642 | 11.746 | 6.651 | Reference |
Faricimab | 96,853 | 11.746 | 6.651 | Dominated by bevacizumab | |
Brolucizumab | 99,230 | 11.746 | 6.651 | Dominated by bevacizumab, faricimab | |
Aflibercept | 100,895 | 11.746 | 6.651 | Dominated by bevacizumab, faricimab, brolucizumab | |
Ranibizumab | 112,696 | 11.746 | 6.651 | Dominated by bevacizumab, faricimab, brolucizumab, aflibercept | |
3. 15 administrations of bevacizumab per 100 mg | Bevacizumab | 30,480 | 11.741 | 6.552 | Reference |
Faricimab | 96,970 | 11.746 | 6.650 | 677,124 | |
Aflibercept | 119,821 | 11.743 | 6.612 | Dominated by faricimab | |
Brolucizumab | 130,222 | 11.743 | 6.604 | Dominated by faricimab, aflibercept | |
Ranibizumab | 168,706 | 11.747 | 6.632 | Dominated by faricimab | |
4. Multiple administrations of aflibercept and ranibizumab | Bevacizumab | 28,642 | 11.741 | 6.552 | Reference |
Aflibercept | 52,701 | 11.743 | 6.612 | Extendedly dominated by ranibizumab, faricimab | |
Ranibizumab | 71,736 | 11.747 | 6.632 | Extendedly dominated by faricimab | |
Faricimab | 96,970 | 11.746 | 6.650 | 695,839 vs bevacizumab | |
Brolucizumab | 130,222 | 11.743 | 6.604 | Dominated by faricimab |
Appendix 5: Submitted Budget Impact Analysis and CADTH Appraisal
Note that this appendix has not been copy-edited.
Table 17: Summary of Key Take-Aways
Key Take-aways of the Budget Impact Analysis |
|---|
|
Summary of Sponsor’s Budget Impact Analysis
The submitted budget impact analysis (BIA) assessed the introduction of faricimab for the treatment of adult patients with nAMD. The analysis was taken from the perspective of the Canadian public drug plans using an epidemiology-based approach with only drug acquisition costs included in the base case. A 3-year time horizon was used, from 2023 to 2025, with 2022 as a base year. The population size was derived starting with a prevalence estimate of AMD followed by a series of attritions. A summary of the derivation of the population size is available in Figure 4.
The reference case scenario included aflibercept, bevacizumab, brolucizumab, and ranibizumab. The market share estimates for these products were informed by the sponsor’s internal market estimates and key opinion leader feedback.4 The new drug scenario included faricimab along with the aforementioned comparators. Faricimab was assumed to displace aflibercept and ranibizumab in the new drug scenario while the market shares for bevacizumab and brolucizumab remained unchanged. Key inputs to the BIA are documented in Table 18.
Figure 4: Sponsor’s Estimation of the Size of the Eligible Population
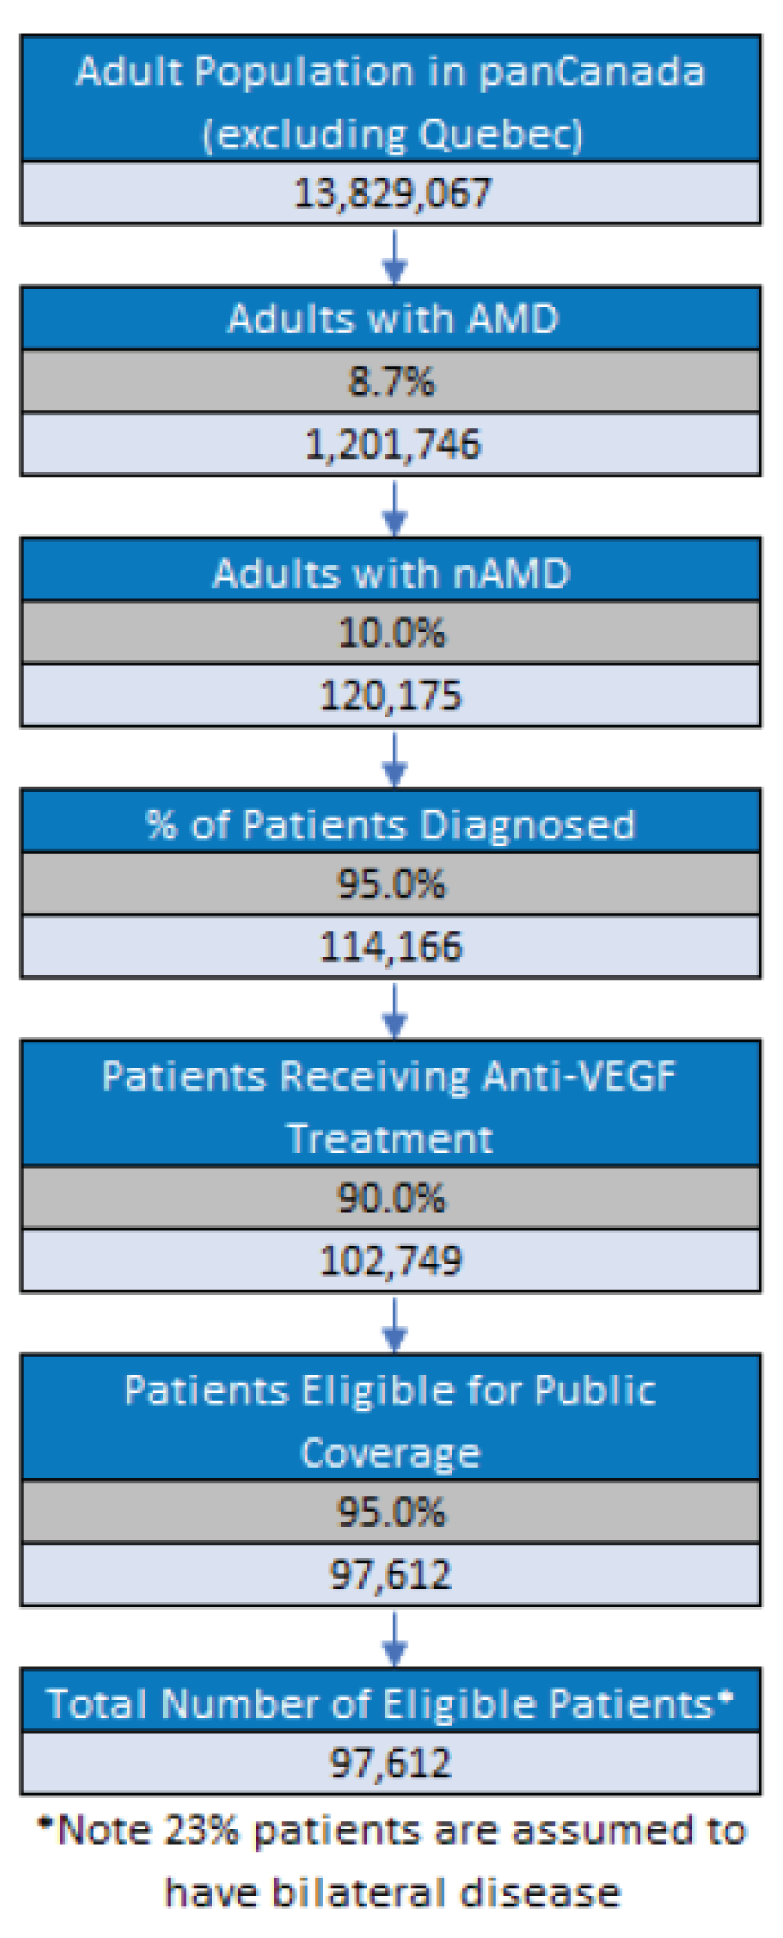
Note: The adult population refers only to those aged 45 and older to align with the prevalence estimate from Wong et al., (2014).20
Source: Sponsor’s budget impact submission.21
Table 18: Summary of Key Model Parameters
Parameter | Sponsor’s estimate |
|---|---|
Target population | |
Number of patients eligible for drug under review | 99,052 / 100,535, 102,080 |
Number of eyes eligible for drug under review | 121,834 / 123,657 / 125,558 |
Market Uptake (3 years) | |
Uptake (reference scenario) Aflibercept Bevacizumab Brolucizumab Ranibizumab | |||||||||| |||||||||| |||||||||| |||||||||| |
Uptake (new drug scenario) Faricimab Aflibercept Bevacizumab Brolucizumab Ranibizumab | |||||||||| |||||||||| |||||||||| |||||||||| |||||||||| |
Cost of treatment (per patient) | |
Cost of treatment in Year 1 / Year 2+ annually Faricimab Aflibercept Bevacizumab Brolucizumab Ranibizumab | $11,275 / $7,041 $13,953 / $8,878 $428 / $336 $12,464 / $10,053 $18,154 / $13,123 |
Summary of the Sponsor’s Budget Impact Analysis Results
The estimated cost savings of funding faricimab for the treatment of adults with nAMD was $7,200,765 in year 1, $28,971,522 in year 2, and $58,833,499 in year 3, for a cumulative cost savings of $95,005,786 over the 3-year time horizon.
CADTH Appraisal of the Sponsor’s Budget Impact Analysis
CADTH identified several key limitations to the sponsor’s analysis that have notable implications on the results of the BIA:
Proportion of patients diagnosed is overestimated. The sponsor assumed that 95% of patients with nAMD would be diagnosed based on key opinion leaders. The clinical expert consulted by CADTH noted that proportion was likely overestimated, citing that many patients in rural areas may not see their optometrist regularly and may actually develop nAMD without noticing. These patients would only be diagnosed incidentally if they presented for other reasons and would otherwise not be expected to receive an anti-VEGF therapy.
As part of the base case, CADTH assumed the proportion of patients diagnosed with nAMD to be 90% based on clinical expert opinion.
Multiple administrations from a single vial are possible for aflibercept and ranibizumab. As mentioned in the pharmacoeconomic report, multiple administrations from a single vial may be possible for aflibercept and ranibizumab. Given that the volume within a vial is greater than that required for a single dose, with the proper syringes multiple administrations can be obtained.
As part of a scenario analysis and to align with that conducted for the pharmacoeconomic analysis, CADTH assumed 3 administrations per vial of aflibercept and ranibizumab were possible.
Uncertainty regarding the frequency of administration. As noted in the pharmacoeconomic report, the sponsor’s NMA ||||||||||||||||||||||||||||||||||||||||||||||||||||||||||||||||||||||||||||||||||||||||||||||||||||||||||||||||||||||||||||||||||. To align with the pharmacoeconomic analysis, a scenario was conducted in which administration frequency was set equal to faricimab for all comparators.
As part of a scenario analysis, CADTH assumed equal administration frequency of all comparators.
Uncertain market uptake. In the sponsor’s submission faricimab is assumed to have higher market uptake than brolucizumab. Given recent negotiations with pan-Canadian Pharmaceutical Alliance concluded with a letter of intent for brolucizumab this may influence the level of market uptake seen with brolucizumab.15 CADTH also notes the sponsor expects market share to be taken mostly from ranibizumab but market share for ranibizumab may be impacted by approval of a biosimilar by Health Canada. It is unclear whether these factors have been accounted for in the sponsor’s submission.
As part of a scenario analysis CADTH reduced the market uptake of faricimab to match that of brolucizumab. CADTH notes a biosimilar for ranibizumab would likely result in a lower list price meaning the budget impact associated with faricimab would be substantially higher as that is the main comparator the sponsor assumes market share will be derived from.
One additional limitation was identified but was not considered to be a key limitation. In alignment with the pharmacoeconomic report, CADTH also assumed that one vial of bevacizumab could be used for 30 administrations in the BIA. This did not have an effect on the incremental results, however, as the market share for bevacizumab was not assumed to change between the reference and new scenarios.
CADTH Reanalyses of the Budget Impact Analysis
Based on the identified limitations, CADTH’s base case included a change to the proportion of patients diagnosed and number of administrations of bevacizumab assumed per vial.
Table 19: CADTH Revisions to the Submitted Budget Impact Analysis
Stepped analysis | Sponsor’s value or assumption | CADTH value or assumption |
|---|---|---|
Corrections to sponsor’s base case | ||
1. Number of doses of bevacizumab | 15 | 30 |
Changes to derive the CADTH base case | ||
1. Proportion of patients diagnosed | 95% | 90% |
CADTH base case | Reanalysis 1 | |
The results of the CADTH stepwise reanalysis are presented in summary format in Table 20 and a more detailed breakdown is presented in Table 21. Based on the CADTH base case, the estimated cost savings of the reimbursement of faricimab for the treatment of adults with nAMD are expected to be $6,821,777 in year 1, $27,446,705 in year 2, and $55,736,999 in year 3, for a 3-year total cost savings of $90,005,481.
A scenario analysis was conducted in which multiple administrations were assumed possible from one vial of aflibercept or ranibizumab. The budget impact from this analysis was $61,586,628 in additional costs (i.e., incremental costs) over 3 years. Thus, the budget impact is highly sensitive to assumptions about vial sharing. CADTH also performed separate scenario analyses in which administration frequency was set equal to faricimab and faricimab market shares were set equal to brolucizumab. Results of these analyses suggested cost savings of $21.1 million and $20.6 million, respectively, over 3 years.
Table 20: Summary of the CADTH Reanalyses of the Budget Impact Analysis
Stepped analysis | Three-year total (cost savings) |
|---|---|
Submitted base case (corrected) | $95,005,786 |
CADTH reanalysis 1 and base case | $90,005,481 |
Table 21: Detailed Breakdown of the CADTH Reanalyses of the Budget Impact Analysis
Stepped analysis | Scenario | Year 0 (current situation) | Year 1 | Year 2 | Year 3 | Three-year total |
|---|---|---|---|---|---|---|
Submitted base case (corrected) | Reference | $616,539,478 | $625,638,091 | $650,000,053 | $644,758,580 | $1,905,396,724 |
New drug | $616,539,478 | $618,437,326 | $606,028,531 | $585,925,081 | $1,810,390,938 | |
Budget impact | $0 | -$7,200,765 | -$28,971,522 | -$58,833,499 | -$95,005,786 | |
CADTH base case | Reference | $584,090,032 | $592,709,770 | $601,578,998 | $610,823,918 | $1,805,112,686 |
New drug | $584,090,032 | $585,887,993 | $574,132,292 | $555,086,919 | $1,715,107,205 | |
Budget impact | $0 | -$6,821,777 | -$27,446,705 | -$55,736,999 | -$90,005,481 | |
CADTH scenario analysis 1: multiple administrations of aflibercept and ranibizumab | Reference | $212,022,347 | $215,151,278 | $218,370,772 | $221,726,641 | $655,248,690 |
New drug | $212,022,347 | $219,819,107 | $237,151,295 | $259,864,916 | $716,835,318 | |
Budget impact | $0 | $4,667,830 | $18,780,523 | $38,138,275 | $61,586,628 | |
CADTH scenario analysis 2: equal administration frequency | Reference | $435,203,408 | $441,625,944 | $448,234,374 | $455,122,731 | $1,344,983,049 |
New drug | $435,203,408 | $440,029,456 | $441,811,072 | $442,078,703 | $1,323,919,231 | |
Budget impact | $0 | -$1,596,488 | -$6,423,302 | -$13,044,028 | -$21,063,818 | |
CADTH scenario analysis 3: market share for faricimab equals that of brolucizumab | Reference | $584,090,032 | $592,709,770 | $601,578,998 | $610,823,918 | $1,805,112,686 |
New drug | $584,090,032 | $585,934,419 | $594,702,261 | $603,841,501 | $1,784,478,182 | |
Budget impact | $0 | -$6,775,351 | -$6,876,736 | -$6,982,416 | -$20,634,504 |
PE = pharmacoeconomic.
Stakeholder Input
Patient Input
Fighting Blindness Canada, The Canadian Council of the Blind, CNIB, and Vision Loss Rehabilitation Canada
About Fighting Blindness Canada
Fighting Blindness Canada (FBC) is the largest charitable funder of vision research in Canada.
Over our 48-year history, FBC has contributed critical funding for the development of sight-saving treatments and cures for blinding eye diseases. By raising and stewarding funds, FBC is helping drive forward research that supports our goal of understanding why vision loss occurs, how it can be slowed and how sight can be restored.
We are an invaluable resource for individuals and families impacted by blindness, providing accurate eye health information through our website and educational events, as well as engaging with government and other stakeholders to advance better vision health policies.
Our community is diverse and thriving. FBC represents thousands of individuals and families affected by vision loss, volunteers, and scientists and clinicians seeking treatments and cures for blinding eye diseases.
About The Canadian Council of the Blind
The Canadian Council of the Blind (CCB) is a membership-based not-for-profit organization that brings together Canadians who are blind, deaf-blind or living with vision loss through chapters within their own local communities to share common interests and social activities.
CCB works to improve the quality of life for persons with vision loss through awareness, peer mentoring, socializing, sports, advocacy, health promotion and illness prevention.
Members participate as volunteers in the peer support, sports and recreation, book clubs, awareness, and educational activities of the CCB. Members manage the affairs of their own local chapters consistent with the National Canadian Council of the Blind and may be elected to executive functions locally, provincially and/or nationally. They serve on various committees at these levels as well as participating in many other community groups.
CCB chapter members may involve themselves at their own comfort level and may choose to learn new skills or sports, become involved in accessibility awareness, and educational activities or simply enjoy the company of others.
Membership provides inclusion, purpose, fellowship and social interaction with peers who understand and support each person’s unique strengths and abilities.
The CCB was founded in 1944 by blind Canadian war veterans and schools of the blind. The national office is located in Ottawa with over 80 chapters across Canada. The CCB is the largest membership-based organization for the blind in Canada and is known as the Voice of the Blind™.
The CCB’s offers programs to assist people living with vision loss, increase accessibility in all areas of life and bring awareness of vision issues to the public and government.
About CNIB
Founded in 1918, CNIB is a non-profit organization driven to change what it is to be blind today. We deliver innovative programs and powerful advocacy that empower people impacted by blindness to live their dreams and tear down barriers to inclusion. Our work as a blind foundation is powered by a network of volunteers, donors and partners from coast to coast to coast.
About Vision Loss Rehabilitation Canada
Vision Loss Rehabilitation Canada (VLRC) is a health services organization. We provide training that enables people who are blind or partially sighted to develop or restore key daily living skills, helping enhance their independence, safety and mobility. Our certified specialists work closely with ophthalmologists, optometrists and other health care professionals, providing essential care on a referral basis in homes and communities.
The Vision of VLRC is to maximize health and independence for Canadians impacted by vision loss and our mission is to provide high-quality, integrated and accessible rehabilitation and health care services that enable Canadians impacted by vision loss to live the lives they choose.
Information Gathering
Information that forms the basis of this document was collected through an online survey made available to Canadians living with age-related macular degeneration (wet or dry AMD) during the first months of 2020. Shared across networks associated with FBC and CCB, the survey is part of a larger research project titled VIEW AMD (Valuation and Interpretation of Experiences with AMD) that received ethics approval from Advarra, the largest independent provider of institutional review board (IRB) services.
Our goal with the survey was to learn more about lived experiences of AMD, particularly perceptions of the disease, its treatments, and the specific burdens associated with living with both wet and dry AMD. We did not aim to learn more about faricimab in comparison with other drugs, or to evaluate the effectiveness or safety of the drug in question (that is the precise role of RCTs); instead, we hope the following data and analysis provide insights into the lived experiences of Canadians with AMD, individuals who must navigate the often-daily barriers and burdens that accompany the disease. Our belief is that these perspectives are crucial, and that they should be used to guide decision-making related to any new treatment under consideration with the potential to address the disease’s physical, psychological, and socioeconomic burdens.
Overview of Respondents
A total of 337 Canadians responded to the survey. Out of these, most were between either 61 and 80 (36.6%) or 41 and 60 (35%) years of age, with a roughly equal split between male and female; most were also either retired (55.3%) or working full-time (21.1%). A majority of participants indicated residing in urban regions (89%) and were from Ontario (44.8%), British Columbia (20.2%), and Alberta (10.4%), followed by smaller groups within Canada’s other provinces and territories.
In terms of disease status, a significant number of patients indicated wet-AMD (47.1%), with the remainder indicating dry (37.7%); others selected either wet in one eye, dry in the other (12.8%) or that they are not sure of the type (2.4%).
Table 1: Baseline Characteristics of Respondents (n = 337)
Characteristic | n (%) |
|---|---|
Age (n = 320) | |
Mean age (SD) | 63.5 (16.5) |
18 to 40 years | 34 (10.6) |
41 to 60 years | 112 (35.0) |
61 to 80 years | 117 (36.6) |
Over 80 years | 57 (17.8) |
Biological sex (n = 322) | |
Female | 168 (52.2) |
Male | 153 (47.5) |
Intersex | 1 (0.3) |
Province (n = 337) | |
Ontario | 151 (44.8) |
British Columbia | 68 (20.2) |
Alberta | 35 (10.4) |
Quebec | 25 (7.4) |
Manitoba | 13 (3.9) |
Nova Scotia | 12 (3.6) |
Newfoundland | 11 (3.3) |
New Brunswick | 7 (2.1) |
Northwest Territories | 6 (1.8) |
Prince Edward Island | 4 (1.2) |
Saskatchewan | 4 (1.2) |
Nunavut | 1 (0.3) |
Location (n = 337) | |
Urban | 300 (89.0) |
Rural | 37(11.0) |
Type of AMD (n = 337) | |
Wet AMD in both eyes | 111 (32.9) |
Dry AMD in both eyes | 60 (17.8) |
Dry AMD in one eye | 67 (19.9) |
Wet AMD in one eye | 48 (14.2) |
Wet AMD in one eye and dry AMD in the other eye | 43 (12.8) |
Doesn’t know AMD type | 8 (2.4) |
Other household members (n = 337) | |
Partner/spouse | 212 (62.9) |
My child(ren) | 76 (22.6) |
No one | 56 (16.6) |
Family member(s) other than partner and child | 33 (9.8) |
I live in a retirement home | 23 (6.8) |
Roommate/friend | 12 (3.6) |
I live in a nursing home/long-term care facility | 2 (0.6) |
Employment Status (n = 322) | |
Retired | 178 (55.3) |
Employed, working full-time | 68 (21.1) |
Employed, working part-time | 40 (12.4) |
Homemaker | 18 (5.6) |
Not employed, looking for work | 9 (2.8) |
Unemployed due to illness or disability | 6 (1.9) |
Taking care of a family member | 2 (0.6) |
Other: In training for new career | 1 (7.7) |
Disease Experience
Perhaps more than anything else, respondents made it clear that the disease has a pronounced impact on their daily lives (manifesting as physical, psychological, and social impacts). When asked whether the sight loss resulting from AMD affects the daily activities of their lives, the majority (60 - 80%) reported that it does (Figure 1). They specified activities such as interacting with phones and tablets, reading books and newspapers, and more.
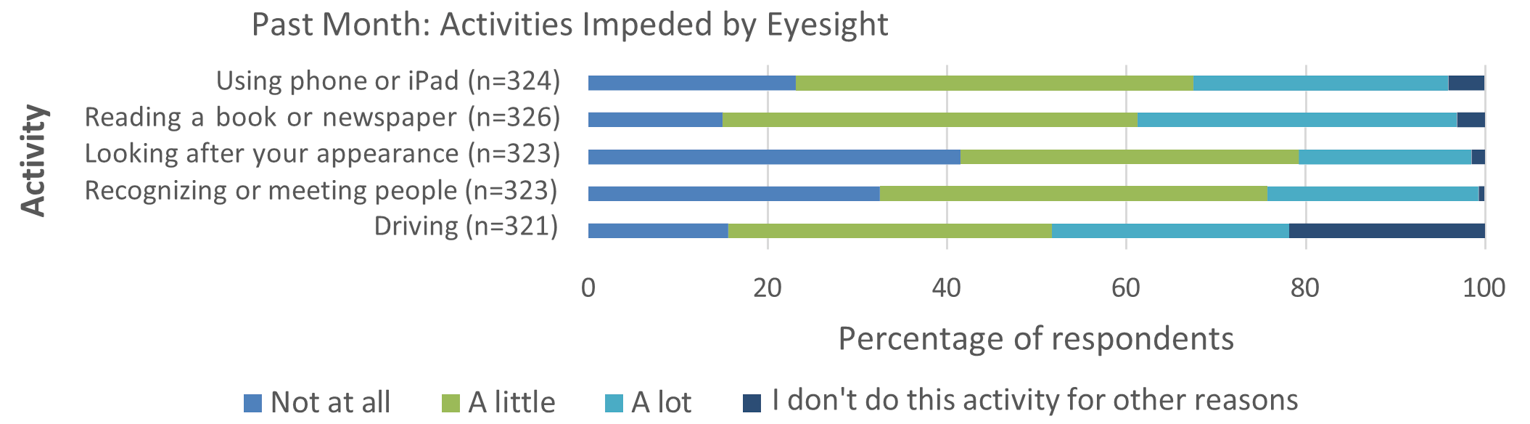
Beyond these largely physical impacts, it was also made clear that AMD affects the psychologies of those with lived experience in a meaningful way. For instance, approximately one-third of respondents showed that they think about their disease and its impacts either “all the time” or “a lot of the time,” implying that AMD carries a significant psychological burden (Figure 2).
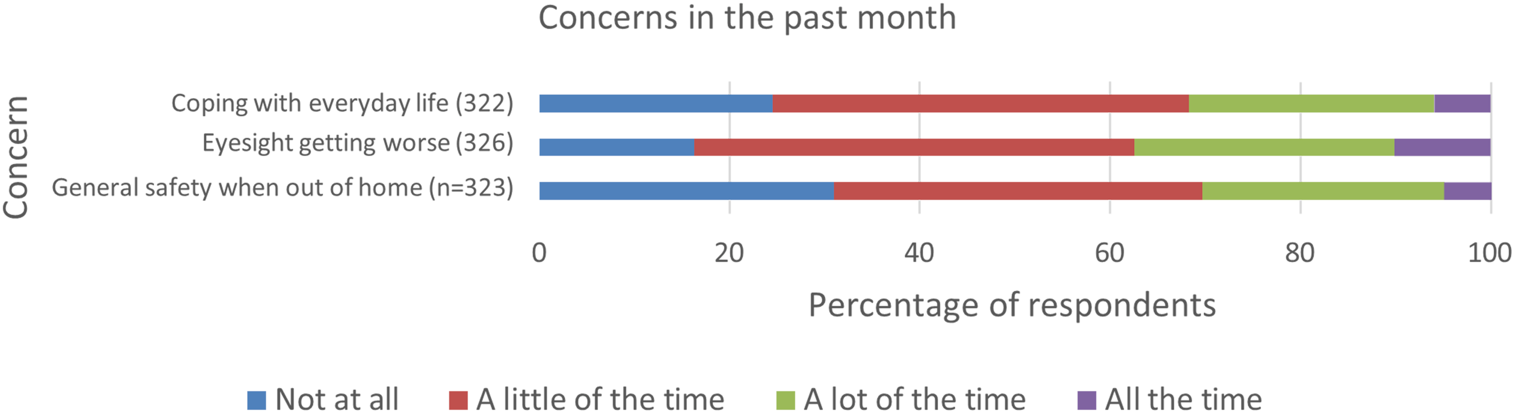
The notion of a psychological toll or burden was supported in relation to challenges as well. When asked to select from a list of challenges associated with sight loss and AMD, a significant majority indicated that they “worry that my condition might worsen in the future” (77%) (Table 2). AMD appears to weigh heavily on the mind in terms of frequent thinking, then, but also in a future- oriented manner when it comes to the deterioration of vision over time. Other challenges selected from the list include “not being able to do the daily activities I used to” (38.4%), “the long wait time for appointments” (31.2%), and more.
Table 2: Challenges with AMD (n = 330)
Challenges | n (%) |
|---|---|
Worry that my condition might worsen in the future (n=331) | 255 (77.0) |
Not being able to do the daily activities I used to (n=331) | 127 (38.4) |
The long wait times for appointments | 103 (31.2) |
Explaining my condition to family and friends | 103 (31.2) |
Lack of social support | 97 (29.4) |
Finding answers to my questions about my condition | 73 (22.1) |
Socializing | 68 (20.6) |
Other | 34 (10.3) |
The disease carries social implications as well. When asked about needing assistance and about feelings of isolation, respondents made it clear that they often rely on others because of their sight, and approximately 60% reported feeling lonely or isolated in the last month (Figure 3). This data was collected pre-COVID, and it is likely that loneliness and isolation are even more prominent within the context of the current pandemic.
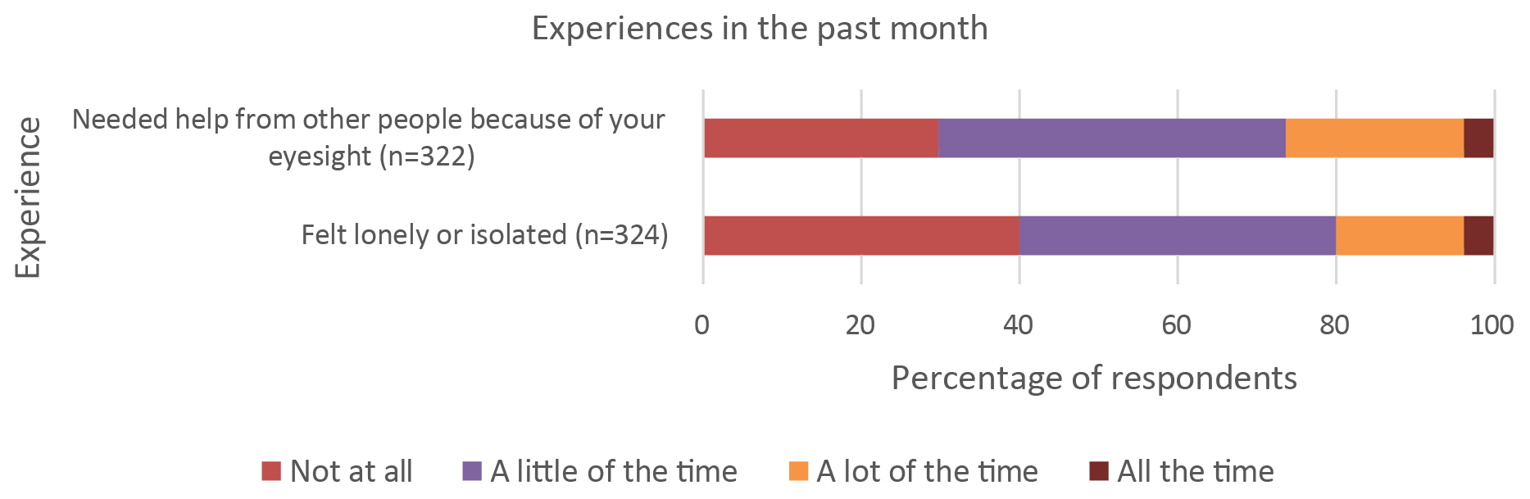
In fact, the need for assistance emerged as a recurring theme for respondents. For instance, in a separate question related to injection appointments, over 85% of those who receive injections indicated requiring help when they go to their appointments. The reliance on assistance may present a larger barrier to appointment attendance during the pandemic due to social distancing regulations and clinic rules that in many cases limit entry to patients only. Additional research would be helpful to explore this impact.
It is clear that AMD has a strong impact on the lives of those who are affected by it. Whether it be in relation to reading or worrying or relying on others, the disease tends to affect the details and complexities of everyday living in a pervasive manner (as opposed to being a secondary or background consideration). For this reason, it is reasonable to conceptualize AMD as a significant or considerable burden on the daily lives of patients. Importantly, it is also reasonable to assume that these impacts have been more intensely felt during the COVID-19 pandemic, especially in relation to loneliness and isolation. This survey collected information before the full scale of the pandemic was known (or even possible to conceptualize)—as a result, the responses do not reflect the full impact of COVID-19 on the lives of patients with AMD. That said, the CCB conducted a separate survey in April of 2020 that was exclusively focused on the pandemic and its effects; it showed that fear, anxiety, loneliness, and other psychosocial impacts were intensified for patients with AMD during the pandemic. A follow-up study showed that almost 70,000 fewer eye injections for AMD and diabetic retinopathy were performed in 2020 compared to 2019, and that 1,500 fewer patients received injections for AMD and 458 fewer patients received injections for diabetic retinopathy in 2020 compared with 2019. A summary of these findings is below:
CCB Summary of the Impacts of COVID-19 for Patients Living with AMD
In April 2020, the CCB conducted a survey on the impact of the COVID-19 pandemic on Canadians who are blind, deafblind or partially-sighted. (Keith D. Gordon, ‘The impact of the COVID-19 pandemic on Canadians who are blind, deaf-blind, and partially-sighted’, (2020), Available at: https://ccbnational.net/shaggy/wp-content/uploads/2020/05/COVID-19-Survey-Report-Final-wb.pdf. Accessed January 7 2022) What we discovered was a community experiencing loneliness and living with considerable stress. Almost half the 572 respondents to the CCB survey (46%) said they hadn’t felt safe going outside the home since the initial lockdown. 47% of respondents said that they needed a sighted guide to assist them when they left home. Respondents said they were concerned about maintaining social distancing and having others maintain social distancing with them. Since most hospitals and doctors’ offices were not permitting anyone to accompany their patient, this meant that a substantial barrier existed for anyone requiring a sighted guide to access their doctor. This undoubtedly resulted in many people missing their regular appointments for anti-VEGF injections.
Furthermore, 42% of respondents were worried about their ability to have someone accompany them to a doctor and almost half (49%) were worried about their ability to get transportation to a doctor, hospital, or testing site. About one third of respondents (36%) said that they had had an important medical appointment cancelled as a result of the COVID-19 pandemic.
Many also expressed special concerns about treatment for their eye condition and were afraid that they may lose more vision as a result of missing appointments.
A subsequent study, commissioned by CCB and FBC, (Deloitte Access Economics, Addendum to the cost of vision loss and blindness in Canada. The impact of COVID-19. (report commissioned by the Canadian Council of the Blind), August 2021. Available at: https://ccbnational.net/shaggy/2021/10/12/the-impact-of-covid-19-an-addendum-to-the-cost-of-vision-loss-in-canada-study/ Accessed January 7 2022) reported the extent of the cancelled appointments for anti-VEGF injections. This report estimated that almost 70,000 fewer eye injections for the treatment of AMD and Diabetic Retinopathy were performed in 2020 compared with 2019.
This study also reported that 1,500 fewer patients received injections for AMD and 458 fewer patients received injections for diabetic retinopathy in 2020 compared with 2019.
When combined with other delayed or cancelled eye examinations and treatments it was estimated that an additional 1,437 people experienced vision loss due to the pandemic.
Any anti-VEGF medication that can extend the time between required injections can be expected to be a great advantage to people living with vision loss who are not venturing out of their homes for medical appointments. Such a medication would carry significant potential to minimize unnecessary vision loss.
Experiences With Currently Available Treatments
A significant majority of our survey participants (75.4%) indicated that they currently receive injections as a treatment for their AMD, with the most common brand being Avastin (29.4%), followed by Lucentis (24.6%), Eylea (20.2%), and Ozurdex (13.5%). The remainder of patients indicated that they did not know the brand of their injection, were receiving multiple, or received the injection as part of a blind study.
Satisfaction and Adherence
The largest group of respondents showed that they are “satisfied” with their injections (46%) and that “they helped me avoid losing more eyesight” (72.7%) (Table 3, Table 4).
Table 3: Level of Satisfaction With Injections (n = 252)
Level of Satisfaction with Injections | n (%) |
|---|---|
Very dissatisfied | 1 (0.4) |
Dissatisfied | 8 (3.2) |
Neither satisfied nor dissatisfied | 46 (18.3) |
Satisfied | 116 (46.0) |
Very satisfied | 81 (32.1) |
Table 4: How the Injections Have Helped (n = 253)
How the Injections Have Helped | n (%) |
|---|---|
They helped me avoid losing more eyesight | 184 (72.7) |
They improved my eyesight | 112 (44.3) |
Dried up fluid/blood in my eye(s) (n=252) | 104 (41.3) |
They have had no effect but I receive injections because my doctor recommends them | 43 (17.0) |
I don't know | 7 (2.8) |
Other* | 8 (3.2) |
At the same time, it is worth noting that almost 20% of respondents who are currently receiving injections think that they have no beneficial effect or are unsure if there is an effect.
Although most respondents reported not missing an injection appointment in the last year (67.9%), a sizeable group did indicate missing at least one appointment (32.1%) (Table 5). Again, this data was collected pre-COVID, so it is reasonable to assume that the numbers skew higher today. The most common reason for missing an appointment was being “unable to find someone to take me to the appointment” (39.5%), recalling the earlier suggestion of dependence being a key aspect of the experience of AMD. This was followed closely by being “unable to travel to appointment” (34.6%) and “could not afford attending the appointment” (30.9%). It is clear in these responses that some of the difficulty in attending injection appointments is found not in the experience of the injection itself, but in the logistics of travel and payment.
Table 5: Reason for Cancellation or Delay (n = 81)
Reason for Cancellation or Delay | n (%) |
|---|---|
Unable to find someone to take me to the appointment | 32 (39.5) |
Unable to travel to appointment | 28 (34.6) |
Could not afford attending the appointment | 25 (30.9) |
Too busy to attend appointment | 20 (24.7) |
Did not know how important the injection was to my sight | 20 (24.7) |
Scared to receive the injection | 11 (13.6) |
Did not find previous injections helpful | 10 (12.3) |
I forgot about the appointment | 4 (4.9) |
I was not feeling well | 7 (8.6) |
Other | 11 (13.6) |
Travel and Time Commitment
Almost half of the respondents indicated facing a travel time of 31 - 60 minutes to get to their injection appointment, followed by under 30 minutes (29.4%) and between 1 and 2 hours (15.5%). While at the appointment, most respondents reported waiting for more than 1 hour but less than 2 (60.8%), followed by less than 1 hour (17.6%) and, at the other end of the spectrum, more than 2 hours but less than 4 (16%)—groups that are very close in size.
The experience of ease or difficulty related to travel was varied among respondents, with most selecting that travel is generally “easy” (39.3%) followed by “neither easy nor difficult” (31.3%) (Table 6). A smaller group selected “difficult” (7.1%) and, when asked what makes the travel challenging, reported that distance (50%) and vehicle condition (30%) are notable factors (Table 7).
Table 6: Experience of Travel to Injection Appointments? (n=252)
Ease of travel | n (%) |
|---|---|
Very difficult | 2 (0.8) |
Difficult | 18 (7.1) |
Neither easy nor difficult | 79 (31.3) |
Easy | 99 (39.3) |
Very easy | 54 (21.4) |
Table 7: Reasons for Difficult Travel to Your Injection Appointments (n=20)
Reason | n (%) |
|---|---|
It is far from home | 10 (50.0) |
My vehicle is in poor condition | 6 (30.0) |
Poor road conditions | 5 (25.0) |
It is expensive to travel | 5 (25.0) |
Other | 2 (10.0) |
Despite a smaller number of patients finding travel difficult, it is worth noting that wait times and travel still ranked high as difficult aspects of the injection appointment overall. When asked what is the most difficult part of the appointment, 30.5% of patients selected “long waiting time at the appointment,” 28.9% selected “cost of travel to/from the appointment,” and 27.7% selected “finding someone to drive me to/from the appointment” (Table 8). For these patients, the experiences of travel and waiting exist as significant hurdles or challenges. More research and analysis are needed to determine if there is an overlap between these experiences and non-adherence.
Table 8: Most Difficult Part of Eye Injection Appointments (n = 249)
Reason | n (%) |
|---|---|
Anxiety or fear about the injection | 95 (38.2) |
Long waiting time at the appointment | 76 (30.5) |
Cost of travel to/from the appointment | 72 (28.9) |
Finding someone to drive me to/from the appointment | 69 (27.7) |
Finding someone to help me with my daily tasks after the injection | 56 (22.5) |
I don't find any part difficult | 52 (20.9) |
Scratchiness or pain in my eye after the appointment | 46 (18.5) |
Taking time off work to attend | 31 (12.4) |
Other | 8 (3.2) |
Importantly—and perhaps unsurprisingly—respondents in rural parts of Canada were significantly more likely to travel more than 1 hour to attend appointments (30.3% for rural patients compared to 11% for those in urban regions). They were also more likely to describe their travel experience as “difficult” (18.2% compared to 5.5%). This underscores the fact that, despite whatever the overall experience may be, those patients facing more significant barriers to care need to be valued and considered in the development and approval of new drugs. In this case, treatments that lessen the burden on travel for rural and remote patients would likely be considered desirable.
Emotional and Physical Effects
Besides difficulty in relation to travel, cost, and waiting, the largest group of patients underscored “anxiety or fear about the injection” (38.2%) as the most difficult part of the appointment (see the above table). This is interesting, considering that many patients also indicated being “satisfied” with their injections, as well as appreciative of the impact on their sight. It may show that those with AMD tend to manage their fear and anxiety in relation to injections as a matter of course. Injections still carry an emotional or psychological impact, but this has become internally managed in such a way as to be common or matter of fact.
Results in the above table also make it clear that the physical effects of injections are not to be ignored—for instance, 18.5% of patients selected “scratchiness or pain in my eye after the appointment” as a difficulty. At the same time, when asked how painful the injections are during the appointment, although almost a quarter of patients selected “not painful at all” (24.3%), the largest group selected “slightly painful” (54.6%) and a sizeable number selected “painful” (19.5%) (Table 9). And for some, the emphasis on pain increases into the evening, with 56.9% of patients reporting their experience of pain as “slightly painful” into the evening, and 19% reporting a “painful” experience (Table 10). In total, approximately 4 out of 5 patients experience at least some pain lingering into the evening after their injection appointments.
Table 9: Painfulness of the Injection (n=251)
Reason | n (%) |
|---|---|
Not painful at all | 61 (24.3) |
Slightly painful | 137 (54.6) |
Painful | 49 (19.5) |
Extremely painful | 4 (1.6) |
Table 10: Experience of Pain Into the Evening After the Injection (n=248)
Reason | n (%) |
|---|---|
Not painful at all | 51 (20.6) |
Slightly painful | 141 (56.9) |
Painful | 47 (19.0) |
Extremely painful | 9 (3.6) |
Visual complications are also a factor for many patients, with many experiencing blurry vision for 1 - 3 hours after the injection (48.2%), followed by 4 - 6 hours (25.9%) (Table 11). For respondents, these complications made certain activities impossible post- injection—significantly, all respondents indicated that they were unable to conduct at least one regular activity after their injection, with the largest group selecting “watch TV” (49.1%), followed by “read” (42.1%) and “drive” (30.4%) (Table 12).
Table 11: Duration of Blurry Vision Post-Injection (n=247)
Frequency | n (%) |
|---|---|
Less than 1 hour | 26 (10.5) |
1-3 hours | 119 (48.2) |
4-6 hours | 64 (25.9) |
For at least 24 hours | 16 (6.5) |
Until I go to sleep that night | 22 (8.9) |
Table 12: Activities That Are Not Possible Post-Injection (n=214)
Activity | n (%) |
|---|---|
Watch TV | 105 (49.1) |
Read | 90 (42.1) |
Drive | 65 (30.4) |
Prepare meals | 60 (28.0) |
Provide care to family members* | 32 (15.0) |
Work | 26 (12.2) |
None of the above activities | 0 |
Respondents also made it clear that, due to these complications, they require assistance more frequently after their injections. When asked what kind of assistance they receive in general, the largest group indicated that they require help “after the injections with everyday tasks” (55.7%) (Table 13). This once again emphasizes the theme of a lack of independence experienced by those with AMD, who in many cases not only rely on friends and loved ones for travel to and from injection appointments, but for help with tasks afterwards as well.
Table 13: Type of Help Provided Post-Injection
Type of help provided post-injection | n (%) |
|---|---|
Help me after the injections with everyday tasks | 118 (55.7) |
Wait with me at the appointment | 116 (54.7) |
Travel with me or drive me to/from the appointment | 114 (53.4) |
Take care of things at home while I am away | 69 (32.5) |
Physical support at my appointment | 51 (24.1) |
Other | 3 (1.4) |
These responses emphasize the emotional and physical impacts of AMD, making it clear that the disease exacts a physical and psychological toll that exists alongside the logistical challenges associated with travel and time.
Improved Outcomes
Our survey did not ask patients for their views on improving their experiences and outcomes. In previous patient engagement efforts, however, we did learn that most patients would prefer a treatment or medication type that can be taken less frequently.
In a previous survey, when asked whether a treatment that can be taken less often would be preferred, the majority of patients with wet or dry AMD indicated “yes”: 64% for wet and 52% for dry. When asked whether they think the public health system should pay for better medication and treatments for AMD, “yes” was the most select option for both wet (61%) and dry (62%) participants. And, finally, the largest percentage of both groups indicated a relatively high level of comfort with clinical trials by responding favourably to a Likert scale regarding how comfortable they are with the idea of enrolling in a clinical trial for AMD: participants answered “very comfortable” (10% for wet, 12% for dry), “fairly comfortable” (28% wet, 31% dry), “neither comfortable nor uncomfortable” (21% wet, 23% dry), “fairly uncomfortable” (10% wet, 8% dry), “very uncomfortable” (16% wet, 14% dry), and “other” (16% wet, 12% dry).
Responses to both questions—regarding public payment and clinical trials—indicate that regardless of wet or dry, the surveyed AMD patients are supportive of public dollars advancing the AMD treatment space, and at the same time willing to participate in the trials that would lead to those advancements.
Experience With Drug Under Review
As discussed, none of the patients we surveyed indicated receiving faricimab as a treatment for their AMD. This is unsurprising, given that assessments of the drug by Canadian HTA agencies have not yet completed.
Companion Diagnostic Test
Not applicable
Anything Else?
AMD is a chronic disease that creates a range of challenges and burdens for patients. For many of the 337 Canadians that responded to our survey, their AMD leads to visual complications that render certain daily activities—such as reading or driving— either problematic or impossible. AMD is therefore physically and visually burdensome, and its corresponding emotional and psychological burdens are acute for patients as well. For example, many patients indicated that they think about their disease frequently, especially its impact on their future, and that they experience fear or anxiety in relation to their injection regimes.
Thanks to modern research, anti-VEGF injections are now the frontline treatment for patients with wet-AMD, replacing forms of surgery that once had significant drawbacks. While the various anti-VEGF drugs on the market have shown high levels of effectiveness in slowing or halting loss of vision, it is also the case that the need for regular—often monthly—injections directly into the eye have created challenges for many patients. This is borne out in our survey results, with groups of respondents emphasizing the painfulness of the injection, both during and after the procedure, and their difficulties managing travel to and from injection appointments. The issue of travel is especially pronounced for those living in rural and remote parts of Canada, who often travel significant distances to receive their injections. The challenges associated with AMD also lead to many patients relying on loved ones to assist them; they often receive aid in travelling to and from appointments, and in managing the tasks that are made difficult by AMD and by the short-term visual complications that result from injections. As a result, there is a common thread running through the responses that the disease leads to a certain lack of independence. Many patients would prefer a treatment that can be taken less frequently, are supportive of public funding being used in the advancement of such a treatment, and are open to participating in clinical trials.
More research is required to better understand the reasons for why certain patients with AMD miss their appointments or stop them altogether. That said, contemporary research has shown that both non-adherence and non-persistence are quite high with this group: for instance, a recent study showed that close to 50% of patients stop anti-VEGF treatments after 24 months. (Okada M, Mitchell P, Finger RP, Eldem B, et al. Nonadherence and Nonpersistence to Intravitreal Injection Therapy for Neovascular Age-Related Macular Degeneration: A Mixed-Methods Systematic Review. Ophthalmology. 2021;128;2;234-247. https://doi.org/10.1016/j.ophtha.2020.07.060) It is entirely possible that the impacts shown in this report—issues with travel and other logistical challenges, as well as physical and psychological effects—could play a significant role in this drop off. With this in mind, it is clear that treatments that lessen the burdens on this group could play an important role in countering the trend of non-compliance and under treatment.
This is a snapshot of the experiences of AMD patients in Canada—not a complete or final one, of course, because no overview can be, but nevertheless one that is grounded in the lived experiences of patients who offered their time, expertise, and insights to participate in this process. The focus of this submission has been on expanding our understanding of how these individuals perceive their diseases and treatments; the burdens that impact their lives; the barriers they face as a result of vision loss and other factors; and the psychological and emotional tolls of the disease. As organizations that represent patients with AMD and other eye diseases, our overarching goal is to contribute meaningfully to the discussion and potential implementation of new treatments in this space—in particular, to guide that discussion along lines that are patient-centered, that focus on optimal and equitable outcomes, and that recognize the expertise of patients with lived experience of AMD and their value in the review process of new treatments.
We look forward to continuing to work with CADTH to support Canadians living with AMD, and to advance our collective understanding of how the disease and its treatments impact their lives.
Patient Group Conflict of Interest Declarations
To maintain the objectivity and credibility of the CADTH reimbursement review process, all participants in the drug review processes must disclose any real, potential, or perceived conflicts of interest. This Patient Group Conflict of Interest Declaration is required for participation. Declarations made do not negate or preclude the use of the patient group input. CADTH may contact your group with further questions, as needed.
Did you receive help from outside your patient group to complete this submission? If yes, please detail the help and who provided it.
FBC contracted Dr. Chad Andrews as an independent consultant with expertise in patient centered research to draft this submission.
Did you receive help from outside your patient group to collect or analyze data used in this submission? If yes, please detail the help and who provided it.
FBC contracted JRL Research & Consulting to program and test the survey, perform qualitative interviews and clean and analyze the data.
List any companies or organizations that have provided your group with financial payment over the past 2 years AND who may have direct or indirect interest in the drug under review.
Table 14: Financial Disclosures — Fighting Blindness Canada
Company | $0 to 5,000 | $5,001 to 10,000 | $10,001 to 50,000 | In Excess of $50,000 |
|---|---|---|---|---|
Bayer | — | — | — | X |
Novartis | — | — | — | X |
Roche | — | — | — | X |
Table 15: Financial Disclosures — The Canadian Council of the Blind
Company | $0 to 5,000 | $5,001 to 10,000 | $10,001 to 50,000 | In Excess of $50,000 |
|---|---|---|---|---|
Bayer | — | — | — | X |
Novartis | — | — | — | X |
Table 16: Financial Disclosures — CNIB
Company | $0 to 5,000 | $5,001 to 10,000 | $10,001 to 50,000 | In Excess of $50,000 |
|---|---|---|---|---|
Astra Zeneca (CNIB) | — | — | X | — |
Bausch Foundation (CNIB) | — | — | X | — |
Bayer (CNIB) | — | — | — | X |
Johnson & Johnson (CNIB) | — | — | X | — |
Novartis (CNIB) | — | — | — | X |
Table 17: Financial Disclosures — Vision Loss Rehabilitation Canada
Company | $0 to 5,000 | $5,001 to 10,000 | $10,001 to 50,000 | In Excess of $50,000 |
|---|---|---|---|---|
None to Declare | — | — | — | — |
Clinician Input
Canadian Retina Society
About the Canadian Retina Society
The Canadian Retina Society (CRS) represents the Ophthalmologists in Canada whose primary area of patient care is surgical and/or medical vitreoretinal disease. The CRS website is www.crsscr.ca.
Information Gathering
LANCET. Tenaya & Lucerne Trials. Jan 24, 2022
Retina. Luminous study. 2020 Sept
Current Treatments
Age related macular degeneration (AMD) is one of the leading causes of blindness in Canada, affecting nearly 2 million Canadians at present. Neovascular AMD (nAMD) accounts for the vast majority of vision loss that patients with AMD experience.
The current gold standard treatment for neovascular AMD in Canada is intravitreal anti-VEGF therapy. This has been established by robust meta-analysis research (Solomon et al, Cochrane Database Syst Rev. 2019, Mar 4;3(3)) and by guidelines from major global ophthalmology societies (such as the American Academy of Ophthalmology and the European Retina Society). These agents have revolutionized the treatment for nAMD globally and within Canada. Although very effective at improving vision and maintaining vision in clinical trials, real world evidence from Canada suggests that visual outcomes are suboptimal due to the intense treatment burden for the current agents. The Luminous study, which included a Canadian subset of patients with nAMD undergoing anti-VEGF treatment, demonstrated that real-world treatment was associated with sub-optimal treatment intensity and subsequent vision loss over time when compared to outcomes from randomized clinical trials. The burden of frequent treatment with current anti-VEGF agents has led to an efficacy gap whereby clinical trial results have been very difficult to replicate in real world practice. In addition, recent challenges with the pandemic and limitations to health care delivery has further compromised the ability to provide regular and timely treatment for patients who require very regular and intense treatment.
The current treatments do modify the disease process by minimizing growth and exudation of the choroidal neovascular membrane in nAMD. This manifests as a fluid free retina and less or no fibrosis compared to natural history and older treatment modalities such as thermal laser or PDT laser. Nevertheless, fibrosis and atrophy remain the major causes for suboptimal long-term vision loss in patients with nAMD.
Treatment Goals
One of the most important unmet needs in nAMD treatment is durability and reduced treatment frequency. Reducing treatment burden and allowing a fluid-free retina for a longer duration should allow for maintenance of maximal vision gains over the lifetime of the patient. This translates into improved quality of life, increased independence, reduce risk of falls, reduced depression and a myriad of other improved quality of life metrics that have been associated with vision loss secondary to nAMD in the literature over the past many decades. In addition, safety is vital to ensure minimal risk of ocular complications. Ocular inflammation is an important side effect that can compromise visual outcomes for patients. Newer agents with increased durability and a robust safety profile will be vital to improve long term outcomes for Canadians living with nAMD.
Treatment Gaps (Unmet Needs)
Considering the treatment goals, please describe goals (needs) that are not being met by currently available treatments.
1) Treatment burden: Data from the IRIS registry in the US suggests that on average patients are being treated every 7 to 8 weeks after an intensive monthly loading treatment cycle for nAMD to maintain their vision. This represents a high burden for patients and family members who must take time off work to attend clinic appointments and the frequency of these appointments does not decrease with time. Those patients (approximately 50%) who need more frequent treatment than every 8 weeks have a very high treatment burden. With the drug under review, Phase III studies have demonstrated that approximately half the patients could extend treatment time to every four months. This type of durability has never been achieved in any previous nAMD clinical trial.
2) Improved long term outcomes: Results from the CATT trial demonstrated that at 5 years, about 50% of patients have visual acuity worse than 20/40. Thus, although patients gained vision on average in the CATT trial in the first 2 years whilst being treated by a strict protocol mandated regimen, in the long term follow up phase that is more reflective of the “real-world” scenario, patients actually lost vision at year 5. The main reasons for this were the development of atrophy and fibrosis which can develop when disease activity is poorly controlled. Patients with ongoing exudation and fluid fluctuation due to poor disease control are more likely to develop fibrosis and atrophy. As such, agents that are effective at drying the retina for a longer period of time and reducing treatment burden can theoretically provide improved long-term visual outcomes.
3) Safety: Newer agents including brolucizumab have demonstrated increased durability than previous agents. However, the safety profile of brolucizumab has been a limiting factor due to concerns regarding inflammation and occlusive retinal vasculitis. As such, newer agents must not only be more durable, but also demonstrate high safety profile that is in line with the currently used drugs.
Which patients have the greatest unmet need for an intervention such as the drug under review?
All patients with nAMD will benefit from a safe and durable therapeutic agent similar to the one under review. New patients will benefit from effective disease control and reduced burden. Patients currently under treatment could potentially reduce their treatment burden and reduce number of monitoring and treatment visits by switching to a newer, more durable agent.
This drug will help address many of the key unmet needs for Canadians living with nAMD.
Place in Therapy
How would the drug under review fit into the current treatment paradigm?
This agent builds on our current treatment strategy. All our current treatments address the VEGF pathway in nAMD. The drug under review is the first bispecific antibody designed for the eye. It will not only target the VEGF-A pathway, but also block angiopoietin-2 (Ang-2) that has been established as a critical player in retinal and choroidal vascular disease. As such, the dual mechanism of action for this drug is unique and different than any other agent currently in use for the treatment of nAMD.
This agent has demonstrated non-inferior vision results with less frequent treatments compared to the current gold standard treatment in head-to-head Phase III pivotal trials. As such, this agent can be considered as first-line treatment or as rescue treatment for patients not responding well to current drugs that are available for nAMD treatment.
The durability for this agent will allow clinicians the confidence to extend patients longer between treatments than our current gold standard. That reduction in treatment burden will be an important paradigm shift.
Please indicate whether or not it would be appropriate to recommend that patients try other treatments before initiating treatment with the drug under review. Please provide a rationale from your perspective.
Clinically, it would be appropriate to try other anti-VEGF agents prior to this drug as this drug has not demonstrated superiority in vision gain. However, this agent has demonstrated greater durability and equivalence safety profile than current gold standards. As such, recommending that patients try another agent first is not supported by any evidence in the literature. This agent has been tested in previously untreated patients and that is where we have the most robust data around the efficacy and safety of this drug.
How would this drug affect the sequencing of therapies for the target condition?
There is currently no standard of care in terms of treatment failure. This is an area of evidence gap and requires further prospective work to guide clinical care.
Which patients would be best suited for treatment with the drug under review?
As with all agents used in nAMD, treatment naïve patients would be the most likely to respond. That is what was assessed in the pivotal phase III trials. Other possible candidates would include patients with persistent disease activity despite aggressive treatment with other agents, or suboptimal response to other agents.
How would patients best suited for treatment with the drug under review be identified?
Patients will be identified using clinical exams and an array of diagnostic tests (OCT, OCT-A, IVFA) This condition is diagnosed in routine clinical practice.
There are no issues related to diagnosis.
As with any condition, there will be cases of misdiagnosis or underdiagnosis; however, this is likely a very small percentage given the very significant advances in imaging modalities in the recent years.
There is no evidence to support treatment of pre-symptomatic patients. Patients who have “non-exudative” choroidal neovascular membranes without symptoms and without evidence of disease activity on structural OCT imaging, should be monitored closely.
Which patients would be least suitable for treatment with the drug under review?
Patients who have end-stage disease with extensive fibrosis or atrophy and no potential for vision improvement.
Is it possible to identify those patients who are most likely to exhibit a response to treatment with the drug under review?
Patients with good baseline vision are likely to maintain good vision in the long-term. However, all patients with all levels of vision benefited from treatment in the Phase III clinical trials with this agent.
What outcomes are used to determine whether a patient is responding to treatment in clinical practice?
Subjective outcomes – Visual acuity test
Objective Outcomes – Fluid on OCT testing
Clinical exam – Presence of hemorrhage on exam
What would be considered a clinically meaningful response to treatment?
Improvement in vision.
Reduction in frequency of treatment. Patients extended to 3-month (or longer) interval between treatments.
How often should treatment response be assessed?
At every clinical visit which is determined by treatment need.
What factors should be considered when deciding to discontinue treatment?
End stage disease with significant atrophy and fibrosis and no improvement despite regular treatments.
What settings are appropriate for treatment with the drug under review?
All settings. Ophthalmology offices in the community and in hospital setting
For non-oncology drugs, is a specialist required to diagnose, treat, and monitor patients who might receive the drug under review?
An ophthalmologist is required to accurately diagnose, treat, and monitor patients under treatment.
Additional Information
None.
Conflict of Interest Declarations — Canadian Retina Society
To maintain the objectivity and credibility of the CADTH drug review programs, all participants in the drug review processes must disclose any real, potential, or perceived conflicts of interest. This conflict of interest declaration is required for participation.
Declarations made do not negate or preclude the use of the clinician group input. CADTH may contact your group with further questions, as needed. Please see the Procedures for CADTH Drug Reimbursement Reviews (section 6.3) for further details.
Did you receive help from outside your clinician group to complete this submission? If yes, please detail the help and who provided it.
No
Did you receive help from outside your clinician group to collect or analyze any information used in this submission? If yes, please detail the help and who provided it.
No
List any companies or organizations that have provided your group with financial payment over the past two years AND who may have direct or indirect interest in the drug under review. Please note that this is required for each clinician who contributed to the input — please add more tables as needed (copy and paste). It is preferred for all declarations to be included in a single document.
Declaration for Clinician 1
Name: Varun Chaudhary
Position: Continuing Professional Development Director, Canadian Retina Society
Date: 17-02-2022
Table 18: Conflict of Interest Declaration for Canadian Retina Society — Clinician 1
Company | Check Appropriate Dollar Range* | |||
|---|---|---|---|---|
$0 to $5,000 | $5,001 to $10,000 | $10,001 to $50,000 | In Excess of $50,000 | |
Bayer | — | X | — | — |
Novartis | — | X | — | — |
Roche | — | X | — | — |
Declaration for Clinician 2
Name: Robert Gizicki
Position: Continuing Professional Development Director, Canadian Retina Society
Date: 17-02-2022
Table 19: Conflict of Interest Declaration for Canadian Retina Society — Clinician 2
Company | Check Appropriate Dollar Range* | |||
|---|---|---|---|---|
$0 to $5,000 | $5,001 to $10,000 | $10,001 to $50,000 | In Excess of $50,000 | |
Allergan | — | X | — | — |
Novartis | X | — | — | — |
Roche | X | — | — | — |
Declaration for Clinician 3
Name: Jason Noble
Position: Past Continuing Professional Development Director, Canadian Retina Society
Date: 17-02-2022
Table 20: Conflict of Interest Declaration for Canadian Retina Society — Clinician 3
Company | Check Appropriate Dollar Range* | |||
|---|---|---|---|---|
$0 to $5,000 | $5,001 to $10,000 | $10,001 to $50,000 | In Excess of $50,000 | |
Novartis Pharmaceuticals Canada | X | — | — | — |
Bayer Inc | X | — | — | — |
Declaration for Clinician 4
Name: Amin Kherani
Position: President, Canadian Retina Society
Date: 17-02-2022
Table 21: Conflict of Interest Declaration for Canadian Retina Society — Clinician 4
Company | Check Appropriate Dollar Range* | |||
|---|---|---|---|---|
$0 to $5,000 | $5,001 to $10,000 | $10,001 to $50,000 | In Excess of $50,000 | |
None | — | — | — | — |
Declaration for Clinician 5
Name: Alan Berger
Position: Advocacy Director, Canadian Retina Society
Date: 17-02-2022
Table 22: Conflict of Interest Declaration for Canadian Retina Society — Clinician 5
Company | Check Appropriate Dollar Range* | |||
|---|---|---|---|---|
$0 to $5,000 | $5,001 to $10,000 | $10,001 to $50,000 | In Excess of $50,000 | |
Bayer | — | X | — | — |
Novartis | — | X | — | — |
Roche | — | X | — | — |
Declaration for Clinician 6
Name: Cynthia Qian
Position: Vice President, Canadian Retina Society
Date: 17-02-2022
Table 23: Conflict of Interest Declaration for Canadian Retina Society — Clinician 6
Company | Check Appropriate Dollar Range* | |||
|---|---|---|---|---|
$0 to $5,000 | $5,001 to $10,000 | $10,001 to $50,000 | In Excess of $50,000 | |
Bayer | — | X | — | — |
Novartis | — | X | — | — |
Roche | — | X | — | — |
Declaration for Clinician 7
Name: James Whelan
Position: Past President, Canadian Retina Society
Date: 17-02-2022
Table 24: Conflict of Interest Declaration for Canadian Retina Society — Clinician 7
Company | Check Appropriate Dollar Range* | |||
|---|---|---|---|---|
$0 to $5,000 | $5,001 to $10,000 | $10,001 to $50,000 | In Excess of $50,000 | |
Bayer | X | — | — | — |
Novartis | X | — | — | — |
Allergan | X | — | — | — |
ISSN: 2563-6596
Disclaimer: The information in this document is intended to help Canadian health care decision-makers, health care professionals, health systems leaders, and policy-makers make well-informed decisions and thereby improve the quality of health care services. While patients and others may access this document, the document is made available for informational purposes only and no representations or warranties are made with respect to its fitness for any particular purpose. The information in this document should not be used as a substitute for professional medical advice or as a substitute for the application of clinical judgment in respect of the care of a particular patient or other professional judgment in any decision-making process. The Canadian Agency for Drugs and Technologies in Health (CADTH) does not endorse any information, drugs, therapies, treatments, products, processes, or services.
While care has been taken to ensure that the information prepared by CADTH in this document is accurate, complete, and up-to-date as at the applicable date the material was first published by CADTH, CADTH does not make any guarantees to that effect. CADTH does not guarantee and is not responsible for the quality, currency, propriety, accuracy, or reasonableness of any statements, information, or conclusions contained in any third-party materials used in preparing this document. The views and opinions of third parties published in this document do not necessarily state or reflect those of CADTH.
CADTH is not responsible for any errors, omissions, injury, loss, or damage arising from or relating to the use (or misuse) of any information, statements, or conclusions contained in or implied by the contents of this document or any of the source materials.
This document may contain links to third-party websites. CADTH does not have control over the content of such sites. Use of third-party sites is governed by the third-party website owners’ own terms and conditions set out for such sites. CADTH does not make any guarantee with respect to any information contained on such third-party sites and CADTH is not responsible for any injury, loss, or damage suffered as a result of using such third-party sites. CADTH has no responsibility for the collection, use, and disclosure of personal information by third-party sites.
Subject to the aforementioned limitations, the views expressed herein are those of CADTH and do not necessarily represent the views of Canada’s federal, provincial, or territorial governments or any third party supplier of information.
This document is prepared and intended for use in the context of the Canadian health care system. The use of this document outside of Canada is done so at the user’s own risk.
This disclaimer and any questions or matters of any nature arising from or relating to the content or use (or misuse) of this document will be governed by and interpreted in accordance with the laws of the Province of Ontario and the laws of Canada applicable therein, and all proceedings shall be subject to the exclusive jurisdiction of the courts of the Province of Ontario, Canada.
The copyright and other intellectual property rights in this document are owned by CADTH and its licensors. These rights are protected by the Canadian Copyright Act and other national and international laws and agreements. Users are permitted to make copies of this document for non-commercial purposes only, provided it is not modified when reproduced and appropriate credit is given to CADTH and its licensors.
Redactions: Confidential information in this document may be redacted at the request of the sponsor in accordance with the CADTH Drug Reimbursement Review Confidentiality Guidelines
Stakeholder Input: The views expressed in each submission are those of the submitting organization or individual; not necessarily the views of CADTH or of other organizations. As such, they are independent of CADTH and do not necessarily represent or reflect the view of CADTH. No endorsement by CADTH is intended or should be inferred. By filing with CADTH, the submitting organization or individual agrees to the full disclosure of the information. CADTH does not edit the content of the submissions.
CADTH does use reasonable care to prevent disclosure of personal information in posted material; however, it is ultimately the submitter’s responsibility to ensure no identifying personal information or personal health information is included in the submission. The name of the submitting organization or individual and all conflict of interest information are included in the submission; however, the name of the author, including the name of an individual patient or caregiver submitting the patient input, are not posted.
Accessibility: CADTH is committed to treating people with disabilities in a way that respects their dignity and independence, supports them in accessing material in a timely manner, and provides a robust feedback process to support continuous improvement. All materials prepared by CADTH are available in an accessible format. Where materials provided to CADTH by a submitting organization or individual are not available in an accessible format, CADTH will provide a summary document upon request. More details on CADTH’s accessibility policies can be found here.
About CADTH: CADTH is an independent, not-for-profit organization responsible for providing Canada’s health care decision-makers with objective evidence to help make informed decisions about the optimal use of drugs, medical devices, diagnostics, and procedures in our health care system.
Funding: CADTH receives funding from Canada’s federal, provincial, and territorial governments, with the exception of Quebec.