CADTH Reimbursement Review
Anifrolumab (Saphnelo)
Sponsor: AstraZeneca Canada Inc.
Therapeutic area: Systemic lupus erythematosus
This multi-part report includes:
Clinical Review
Pharmacoeconomic Review
Stakeholder Input
Clinical Review
Abbreviations
ACE
Arthritis Consumer Experts
ACR
American College of Rheumatology
ADA
auto-antibody
ADL
activities of daily living
AE
adverse event
anti-dsDNA
anti–double-stranded DNA
BICLA
British Isles Lupus Assessment Group-based Composite Lupus Assessment
BILAG
British Isles Lupus Assessment Group
BILAG-2004
British Isles Lupus Assessment Group 2004
CaNIOS
Canadian Network for Improved Outcomes in Systemic Lupus Erythematosus
CI
confidence interval
CLASI
Cutaneous Lupus Erythematosus Disease Area and Severity Index
CMH
Cochran-Mantel-Haenszel
CNS
central nervous system
C-SSRS
Columbia Suicide Severity Rating Scale
EQ-5D-5L
5-Level EQ-5D
FACIT-F
Functional Assessment of Chronic Illness Therapy–Fatigue
FAS
full analysis set
HRQoL
health-related quality of life
IFNAR
interferon-alpha and -beta receptor subunit 1
LLDAS
lupus low disease activity state
LOCF
last observation carried forward
LTE
long-term extension study
MCS
mental component score
MID
minimal important difference
mITT
modified intention-to-treat
NRS
numerical rating scale
NSAID
nonsteroidal anti-inflammatory drug
OCS
oral corticosteroid
OR
odds ratio
PCS
physical component score
PGA
Physician’s Global Assessment
PHQ-8
8-item Patient Health Questionnaire
QoL
quality of life
RCT
randomized controlled trial
SAE
serious adverse event
SD
standard deviation
SDI
Systemic Lupus International Collaborating Clinics/American College of Rheumatology Damage Index
SELENA
Safety of Estrogens in Lupus Erythematosus National Assessment
SF-36
Short Form (36) Health Survey
SF-36v2
Short Form (36) Health Survey Version 2
SFI
Safety of Estrogens in Lupus Erythematosus National Assessment Flare Index
SLE
systemic lupus erythematosus
SLEDAI
Systemic Lupus Erythematosus Disease Activity Index
SLEDAI-2K
Systemic Lupus Erythematosus Disease Activity Index 2000
SLICC
Systemic Lupus International Collaborating Clinics
SRI
Systemic Lupus Erythematosus Responder Index
SRI-4
improvement of 4 points or greater on the Systemic Lupus Erythematosus Responder Index
TEAE
treatment-emergent adverse event
VAS
visual analogue scale
Executive Summary
An overview of the submission details for the drug under review is provided in Table 1.
Item | Description |
|---|---|
Drug product | Anifrolumab for IV injection solution, 150 mg/mL |
Indication | In addition to standard therapy for the treatment of adult patients with active, autoantibody-positive SLE |
Reimbursement request | In addition to standard therapy for patients with moderate to severe SLE (based on a SLEDAI-2K score ≥ 6) whose disease activity cannot be controlled despite an OCS dosage of ≥ 10 mg/day of prednisone or its equivalent |
Health Canada approval status | NOC |
Health Canada review pathway | Standard |
NOC date | November 2021 |
Sponsor | AstraZeneca Canada Inc. |
NOC = Notice of Compliance; OCS = oral corticosteroid; SLE = systemic lupus erythematosus; SLEDAI-2K = Systemic Lupus Erythematosus Disease Activity Index 2000.
Introduction
Lupus is an autoimmune disease that affects approximately 1 in 1,000 Canadians, and the most serious form of lupus is systemic lupus erythematosus (SLE).1,2 The precise etiology and pathophysiology are unknown; however, females are more commonly afflicted than males at a ratio of 9:1.2-4 Onset is primarily between the ages of 16 and 55, although the disease can present at any age.3 The symptoms of lupus can vary greatly.2,3 Patients can experience fatigue and joint pain, which can be disabling, as well as neurologic, renal, and cardiovascular sequelae, rash, and a variety of other symptoms.2 The disease has a variable course, and patients can cycle among a chronic state to flares (acute worsening of their condition) to remission.5 Long-term organ damage is the main risk factor for mortality and may occur from the disease pathology as well as during periods of low disease activity due to toxicity from treatment.6
SLE is treated with medications that are taken acutely on an as-needed basis, as well as chronically. The first-line drug among the chronically administered drugs is an antimalarial, which interferes with intracellular toll-like receptor signalling. Given that SLE is an autoimmune disorder, immunosuppressants also play an important role, and a variety are used (azathioprine, cyclophosphamide, methotrexate, mycophenolate, cyclosporine). Immunosuppressants are associated with multiple harms, including the risk of serious infection and malignancy, and they present significant tolerability issues for patients. Corticosteroids are used to reduce inflammation and pain.7 This treatment is well known for toxicities such as osteoporosis, psychiatric issues, cataracts, diabetes, hypertension, weight gain, hirsutism, glaucoma, among others, particularly when used chronically, and chronic use is avoided as much as possible, although immunosuppressants are relied on to treat flares.7
Anifrolumab is a human immunoglobulin G1 kappa monoclonal antibody that binds to the interferon-alpha and -beta receptor subunit 1 (IFNAR1).8 Anifrolumab also induces the internalization of IFNAR1, reducing the number of receptors available for binding and therefore reducing inflammation and immunological processes.8 Type I interferons play an important role in the pathogenesis of SLE.8 Approximately 60% to 80% of adult SLE patients have high levels of type I interferon–inducible genes, which are associated with increased disease activity and severity.8 Anifrolumab is administered as an IV infusion over 30 minutes every 4 weeks and is indicated in addition to standard therapy for the treatment of adult patients with active, autoantibody-positive SLE.8
The objective of this report is to perform a systematic review of the beneficial and harmful effects of anifrolumab 300 mg, administered as an IV infusion in addition to standard therapy for the treatment of adult patients with active, autoantibody-positive, SLE.
Stakeholder Perspectives
This section summarizes input provided by the patient groups who responded to CADTH’s call for patient input and from a clinical expert consulted by CADTH for the purpose of this review.
Patient Input
Four responses to CADTH’s call for patient input for the anifrolumab submission were received. These consisted of submissions from Arthritis Consumer Experts (ACE), Lupus Canada, Lupus Ontario, and a cooperative submission from the Canadian Arthritis Patient Alliance, Arthritis Society, and Canadian Skin Patient Alliance. Patient input was gathered from 148 responses to surveys of patients with lupus across Canada, including 34 respondents (88% female) from ACE, 112 (96.4% female) from Lupus Canada, and 2 respondents with SLE from Lupus Ontario. The cooperative submission conducted a focus group of 10 patients (90% female) with SLE. The submission from ACE also conducted an in-depth interview with 1 patient. None of the patients in the included submissions had experience with the treatment under review.
Patients reported that managing SLE was difficult given the severity of the physical symptoms, such as debilitating fatigue, pain, persistent headaches, and difficulty breathing. Respondents reported that current treatments are difficult to tolerate because of the many side effects, such as headaches, brain fog, additional fatigue, frequent infections, osteoporosis, gastric issues, insomnia, hair loss, weight gain or loss, mood swings, allergic reactions, nausea, anxiety, and tremors, as well as concerns about organ damage.
The key outcomes patients would like to see addressed by a new therapy are a reduction of side effects and the number of medications used; reduction in fatigue, flares, headaches, brain fog, joint and muscle pain, and rash and skin irritations; increased lifespan; overall improvement in quality of life (QoL); and improvement in sleep patterns. Patients would also like to see enhanced mobility, improved tolerance to UV light, productivity, and ability to work and carry out activities of daily living (ADLs) and social roles. Overall, it is clear that SLE significantly impairs health-related quality of life (HRQoL), impairs function, and elicits a number of serious symptoms.
Clinician Input
Input From Clinical Experts Consulted by CADTH
SLE is currently treated chronically with immune modulators such as high-dose corticosteroids, antimalarials, azathioprine, methotrexate, mycophenolate mofetil, cyclophosphamide, and cyclosporine and/or tacrolimus. The clinical expert consulted by CADTH identified side effects as the major limitation of current treatment, namely prednisone and immunosuppressants. Other unmet needs include nonresponse, lack of adherence, polypharmacy, chronic organ damage, and recurrent flares that cause progressive organ damage. Currently no treatments provide a long-term cure or long-term medication-free survival. According to the clinical expert, the current place in therapy for anifrolumab would be after nonresponse or toxicity with an antimalarial and an oral corticosteroid (OCS) or prednisone dependency. In patients with major organ involvement, anifrolumab could be used as a second-line therapy in combination with at least 1 immunosuppressive drug plus hydroxychloroquine after failure on standard of care. According to the clinical expert, the patients most likely to benefit from anifrolumab are those with moderately to severely active disease (e.g., active skin manifestations and polyarthritis), those who are prednisone-dependent or intolerant, and those for whom adherence to standard medication is an issue. In addition, the clinical expert noted that treatment effects with anifrolumab can be seen regardless of previous treatments, such as standard of care, and/or failure to successfully taper prednisone. The clinical expert identified those least likely to benefit from anifrolumab as patients with severe nephritis or a disease of the central nervous system (CNS); clinicians are less likely to use anifrolumab in place of standard of care because of the severity of illness in these cases.
In the opinion of the clinical expert, a clinically meaningful response to anifrolumab would be a meaningful reduction in disease activity as measured by clinical and laboratory outcomes such as autoantibodies, complement levels, hemoglobin levels, improvement in ADLs, reduction of signs and symptoms, and tapering of steroids. Treatment response should generally be assessed every 2 to 3 months for those with active disease. The rapidity of response depends on the treatment (e.g., corticosteroids are the most rapid). In the opinion of the clinical expert, treatment should be administered by a rheumatologist or physician with extensive experience in the diagnosis and management of SLE. Treatment should be discontinued in the case of nonresponse, life-threatening adverse events (AEs), or steroid dependency (e.g., an inability to taper prednisone after 4 to 6 months of treatment or an increased dose of prednisone for more than 3 months).
Clinician Group Input
The 20 clinicians who provided input for this review represented 2 clinician groups: the Canadian Network for Improved Outcomes for Systemic Lupus Erythematosus (CaNIOS) and the Toronto Lupus Program at the University of Toronto.
Over all, the views of the clinician groups were consistent with those of the clinical expert consulted by CADTH. The clinician groups indicated that an ideal treatment would have a meaningful impact on overall survival by reducing disease activity, risk of subsequent flares, use of an OCS, risk of AEs, and long-term complications, while inducing remission and improving HRQoL. The goal of treatment with anifrolumab should be the reduction of the daily prednisone dose to below 7.5 mg/day in the first 12 months of treatment or a 50% reduction of the initial baseline dose. Both clinician groups indicated that all patients with SLE would benefit from anifrolumab regardless of previous treatment history. According to the clinician groups, anifrolumab is expected to cause a shift in the current treatment paradigm as its novel interferon-blocking mechanism of action renders it most suitable for patients with serologically active disease, frequent flares, and “steroid dependence,” which is the population with the greatest unmet need.
Drug Program Input
The drug programs provide input on each drug being reviewed through CADTH’s reimbursement review processes by identifying issues that may affect their ability to implement a recommendation. The drug plans identified implementation issues related to considerations for initiation of therapy, continuation and/or renewal of therapy, discontinuation of therapy, prescribing, and generalizability. The clinical expert consulted by CADTH weighed evidence from 2 trials, TULIP-1 and TULIP-2, and other clinical considerations to provide responses to drug programs’ implementation questions. Table 4 provides more details.
Clinical Evidence
Pivotal Studies and Protocol-Selected Studies
Description of Studies
Two sponsor-submitted trials, TULIP-1 and TULIP-2,9,10 were included in this review. The TULIP-1 trial (123 sites in 18 countries, N = 457) and the TULIP-2 trial (119 sites in 16 countries, N = 365) are phase III, multicentre, randomized, double-blind, placebo-controlled studies that evaluated the efficacy and safety of an IV treatment regimen of anifrolumab 300 mg in adult patients (aged 18 to 70 years) with moderate to severe autoantibody-positive SLE while receiving standard-of-care treatment. The primary objective was to evaluate the effect of anifrolumab 300 mg compared to placebo on disease activity as measured by the difference in the proportion of patients who achieve an improvement of 4 points or greater on the Systemic Lupus Erythematosus Responder Index (SRI-4) at week 52 for the TULIP-1 trial or a British Isles Lupus Assessment Group-based Composite Lupus Assessment (BICLA) response at week 52 in the TULIP-2 trial. In the TULIP-1 trial, the key secondary objectives were to evaluate the effect of anifrolumab 300 mg compared to placebo on:
the proportion of patients with SRI-4 at week 52 who were in the subgroup with a high results from a type I interferon gene signature test
the proportion of patients who achieved an OCS dosage of no more than 7.5 mg/day at week 40, which was maintained through week 52 in the subgroup of patients with a baseline OCS dosage of 10 mg/day or higher
the proportion of patients with a 50% or greater reduction in the Cutaneous Lupus Erythematosus Disease Area and Severity Index (CLASI) activity score at week 12 in the subgroup of patients with baseline CLASI activity score of 10 or higher
the number of patients who achieved a SRI-4 at week 24
the annualized flare rate through 52 weeks.
The key secondary objectives in the TULIP-2 trial were the same as TULIP-1 with the addition of:
the proportion of patients with a BICLA response at week 52 (replaces SRI-4 response at week 52)
the proportion of patients with a BICLA response at week 52 in the type I interferon gene signature test high subgroup
the proportion of patients with a 50% or greater reduction in joint counts at week 52 in the subgroup of patients with at least 6 swollen and at least 6 tender joints at baseline (the number of patients who achieved an SRI-4 at week 24 was removed).
Patients who were automatically considered nonresponders included those who withdrew or discontinued the investigational product, those received concomitant medications beyond the protocol-allowed threshold, those who required OCS doses beyond their baseline maximum dose, and those who had missing data for a component for 2 or more consecutive visits. While there was some variance between trials in terms of the participating countries, most sites in both trials were based in the US (40.7% in the TULIP-1 trial and 36.5% in TULIP-2) and Europe (37.9% in the TULIP-1 trial and 26.8% in TULIP-2), with no Canadian sites in the TULIP-1 trial and 2 Canadian sites in TULIP-2. Except for different primary outcomes and some variance in key secondary outcomes, the trials were similar in terms of blinding, randomization, inclusion and exclusion criteria, and drug administration procedures. Baseline patient characteristics, including age, race, sex, height, weight, and body mass index, were balanced between groups in both trials. The median ages of enrolled patients were 41 and 43 years in the TULIP-1 and TULIP-2 trials, respectively, and patients were predominantly female (92.3% in the TULIP-1 trial and 93.4% in TULIP-2) and white (71.3% in the TULIP-1 trial and 59.9% in TULIP-2). The TULIP-2 trial had a larger proportion of missing data on race (4.4% versus 0) compared to the TULIP-1 trial. The majority of patients tested high for the type I interferon gene (approximately 82% across groups and studies). SLE measures, including the Systemic Lupus Erythematosus Disease Activity Index 2000 (SLEDAI-2K), British Isles Lupus Assessment Group 2004 (BILAG-2004), Physician’s Global Assessment (PGA), CLASI, and joint count, were balanced between treatment groups and similar between studies. The median time from initial SLE diagnosis to randomization was highest in patients in the treatment arm of the TULIP-2 trial (mean = 130.2 months; standard deviation [SD] = 109.28). Cushingoid features were higher in the TULIP-1 trial compared to TULIP-2 (39% versus 26%, respectively) and there was a slightly higher number of patients with a baseline dose of OCS of greater than 10 mg in the TULIP-1 trial (56.3%) than in TULIP-2 (47%). Overall previous medication use at baseline was balanced between groups and between studies.
Efficacy Results
The key outcomes from the TULIP-1 and TULIP-2 trials are summarized in Table 2. In the TULIP-1 trial, the primary end point, SRI-4 response at week 52, was not statistically significant (36.2% in the anifrolumab 300 mg group versus 40.4% in the placebo group; treatment difference of 4.2%; 95% confidence interval [CI], −14.2% to 5.8%; P value = 0.412) and the key secondary end points did not demonstrate statistical significance for the SRI-4 interferon-test high subgroup (P value for the between-group difference = 0.549), maintained OCS dose (P value for the between-group difference = 0.180), CLASI activity (P value for the between-group difference = 0.054), and annualized flare rate (P value for the between-group difference = 0.258).
In the TULIP-2 trial, the primary end point of a BICLA response at week 52 was statistically significant in favour of the anifrolumab 300 mg group (47.8% in the anifrolumab 300 mg group versus 31.5% in the placebo group; treatment difference = 16.3%; 95% CI, 6.3% to 26.3%; P value = 0.0013). In addition, statistically significant differences in favour of the anifrolumab 300 mg group were reported for the key secondary end points of BICLA in patients with a high result on an interferon test, a maintained OCS reduction with a baseline OCS of 10 mg/day or higher, and a CLASI response with a baseline CLASI activity score of 10 or higher. However, no statistically significant differences were seen in the proportion of patients with 50% or greater reduction in joint count (42.2% in the anifrolumab 300 mg group versus 37.5% in the placebo group; between-group difference = 4.7%; 95% CI, −13.5 to 17.6; P value = 0.5469) and annual flare rate (0.43 in the anifrolumab 300 mg group versus 0.64 in the placebo group; ratio difference = 0.67; 95% CI, 0.48 to 0.94; P value = 0.0809) in the TULIP-2 trial.
The primary and key secondary end points were also measured in the subgroup of patients with an OCS dose of 10 mg/day or higher at baseline. However, statistical analyses were not conducted for this subgroup, except for the key secondary end point of maintenance of OCS reduction. Overall, a numerically higher proportion of patients in the anifrolumab group compared with the placebo group for this subgroup of patients achieved the primary and key secondary end points (except joint count reduction) in the TULIP-2 trial. In the TULIP-1 trial, the results were mixed, with only the outcomes of CLASI activity and annualized flare rate showing an improved response in the anifrolumab group compared to placebo.
In both studies, the difference in responses between the treatment groups was minimal for HRQoL (measured by the Short Form (36) Health Survey [SF-36], Lupus QoL, and 5-Level EQ-5D [EQ-5D-5L] questionnaires) and symptom scores (measured by the pain numerical rating score [NRS], and Functional Assessment of Chronic Illness Therapy–Fatigue [FACIT-F]). The proportion of patients who exceeded the estimated minimal important difference (MID) were only provided for the SF-36 and FACIT-F. In the TULIP-1 trial, at week 52, the proportion of mental component summary (MCS) responders (defined as change from baseline of at least 4.6 points, the MID for MCS), was 20.9% in the anifrolumab 300 mg group, and 16.7% in the placebo group, with a between-group difference of 4.2% (95% CI, −4.1 to 12.6), and the proportion of physical component summary (PCS) responders (defined as change from baseline of at least 3.4 points, the MID for PCS) in the anifrolumab 300 mg group was lower compared with the placebo group by 25% versus 26.7%, with a between-group difference of −1.7% (95% CI, −10.9 to 7.5). In the TULIP-2 trial at week 52, the proportion of MCS responders in the anifrolumab 300 mg group compared with the placebo group was 27.4% versus 21.2%, respectively, with a between-group difference of 6.2%; (95% CI, −2.71 to 15.2) and the proportion of PCS responders in the anifrolumab 300 mg group compared with the placebo group was 32.8% versus 24.4%, respectively, with a between-group difference of 8.4% (95% CI, −1.1 to 17.8). In the TULIP-1 trial, a slightly higher proportion of patients in the anifrolumab 300 mg group had reduced fatigue at week 52, as measured by the FACIT-F responder rate (defined as improvement from baseline to week 52 of > 3 points), compared with the placebo group (29.3% versus 26.8%, respectively; between-group difference = 2.4%; 95% CI, −0.9 to 17.9). The TULIP-2 trial also had a numerically higher proportion of patients in the anifrolumab 300 mg group who had reduced fatigue at week 52, as measured by the FACIT-F responder rate, compared with the placebo group (33.2% versus 24.7% respectively; between-group difference = 8.5%; 95% CI, 6.9 to 11.8).
Harms Results
Key harms reported in the TULIP-1 and TULIP-2 trials are summarized in Table 2.
Rates of AEs were similar across treatment groups and across trials (approximately 85% to 90% prevalence). In the TULIP-1 and TULIP-2 trials, the most common AEs were nasopharyngitis (20.0% and 15.6% in the anifrolumab 300 mg group versus 12.0% and 11% in the placebo group, respectively), upper respiratory tract infection (12.2% and 21.7% versus 9.8% and 9.9%), and urinary tract infection (12.2% and 11.1% versus 14.7% and 13.7%). Serious adverse events (SAEs) were more common in the placebo group versus the anifrolumab group across the TULIP-1 and TULIP-2 trials (13.9% versus 16.3% and 8.3% versus 17%, respectively). In the TULIP-1 trial, the most common SAEs were SLE (1.7% and 1.6%) and pneumonia (1.7% and 0.5%). In the TULIP-2 trial, the most common SAEs were pneumonia (1.7% and 3.8%), followed by SLE (0.6% and 3.3%).
Withdrawals were greater in the anifrolumab group versus the placebo group in the TULIP-1 trial (6.7% versus 3.8%, respectively). Withdrawals were lower in the anifrolumab group compared to the placebo group in the TULIP-2 trial (2.8% versus 7.7%, respectively). In the TULIP-1 trial, the most common reason for withdrawal in the anifrolumab group was herpes zoster (1.1%). In the TULIP-2 trial, the most common reason for withdrawal in the placebo group was SLE (1.6%) followed by pneumonia (1.1%).
There was a total of 2 deaths during the TULIP-1 study and 1 death in the TULIP-2 study. One patient in the anifrolumab 300 mg group of each trial had a fatal SAE of pneumonia during the treatment period. In the TULIP-1 trial, 1 patient in the placebo group had a fatal SAE of encephalitis during the follow-up period. The study investigators determined that these deaths were not related to the investigational product.
In the TULIP-1 trial, notable harms included hypersensitivity reactions (6.1% anifrolumab 300 mg versus 1.1% placebo), infusion-related reaction (8.9% versus 7.1%), herpes zoster (5.6% versus 1.6%), serious, nonopportunistic infections (5.0% versus 4.3%), malignancies (1.7% versus 0.5%), depression (2.8% versus 2.7%), and suicidal ideation or behaviour (1.1% versus 1.6%). In the TULIP-2 trial, notable harms included infusion-related reactions (13.9% versus 7.7%), herpes zoster (7.2% anifrolumab 300 mg versus 1.1%, placebo), serious, nonopportunistic infections (2.8% versus 5.5%), hypersensitivity (1.1% versus 0.5%), malignancy (0% versus 0.5%), depression (2.8% versus 1.6%), and suicidal ideation or behaviour (1.7% versus 4.4%). Herpes zoster was more common among the anifrolumab group across both trials, but no cases were considered SAEs. Depression was measured by the 8-item Patient Health Questionnaire (PHQ-8), but no clinically meaningful changes were observed for any group across either trial. Suicidal ideation and behaviour were measured by the Columbia Suicide Severity Rating Scale (C-SSRS). Overall, few patients reported suicidal ideation or suicidal behaviour at any time during the studies, with no imbalance observed between treatment groups.
Table 2: Summary of Key Results from Pivotal and Protocol-Selected Studies
Characteristic | TULIP-1 Anifrolumab (N = 180) | TULIP-1 Placebo (N = 184) | TULIP-2 Anifrolumab (N = 180) | TULIP-2 Placebo (N = 182) |
|---|---|---|---|---|
BICLA at week 52a | ||||
N | 180 | 184 | 180 | 182 |
Responderb (%) | 67 (37.1) | 49 (27.0) | 86 (47.8) | 57 (31.5) |
Treatment-group difference vs. placebo (95% CI) | 10.1 (0.6 to 19.7) | 16.3 (6.3 to 26.3) | ||
P value | NR | 0.0013c | ||
Time to BICLA response, HR (95% CI) | NR | 1.55 (1.11 to 2.18)d | ||
BICLA response in interferon-test high subgroupa | ||||
N | 148 | 151 | 150 | 151 |
Responder (%) | 68 (45.9) | 41 (27.5) | 72 (48.0) | 46 (30.7) |
Treatment-group difference vs. placebo (95% CI) | 18.4 (7.7 to 29.1) | 17.3 (6.5 to 28.2) | ||
P value | NR | 0.0018c | ||
SRI-4 response at week 52a | ||||
N | 180 | 184 | 180 | 182 |
Respondere (%) | 65 (36.2) | 74 (40.4) | 100 (55.5) | 68 (37.3) |
Treatment-group difference vs. placebo (95% CI) | 4.2 (−14.2 to 5.8) | 18.2 (8.1 to 28.3) | ||
P value | 0.412c | NR | ||
SRI-4 response in interferon-test high subgroupa | ||||
N | 148 | 151 | 150 | 151 |
Responder (%) | 53 (35.9) | 59 (39.3) | 85 (56.6) | 55 (36.3) |
Treatment-group difference vs. placebo (95% CI) | −3.4 (−14.4 to 7.6) | 20.3 (9.2 to 31.3) | ||
P value | 0.549c | NR | ||
SLEDAI-2Kf | ||||
Baseline, N | 180 | 184 | 180 | 182 |
Mean score at baseline (SD) | 11.3 (4.04) | 11.5 (3.50) | 11.4 (3.64) | 11.5 (3.88) |
Week 52, N | 143 | 149 | 152 | 141 |
Mean change from baseline to week 52 (SE) | −6.0 (0.34) | −5.3 (0.33) | −6.0 (0.31) | −4.9 (0.32) |
Comparison with placebo, LSM difference (95% CI) | −0.7 (−1.6 to 0.2) | −1.2 (−2.0 to −0.3) | ||
Maintained OCS reduction to ≤ 7.5 mg/day from week 40 to week 52 in patients with OCS dose ≥ 10 mg at baseline | ||||
N | 103 | 102 | 87 | 83 |
Responderg (%) | 42 (41.0) | 33 (32.1) | 45 (51.5) | 25 (30.2) |
Treatment-group difference vs. placebo (95% CI) | 8.9 (−4.1 to 21.9) | 21.2 (6.8 to 35.7) | ||
P value | 0.180b | 0.0040b | ||
Adjusted P value | NA | 0.0135k | ||
SF-36 | ||||
PCS at baseline, n | 172 | 175 | 173 | 173 |
PCS at week 52, n | 132 | 139 | 140 | 125 |
Responder at week 52 (FAS)h % | 45 (25.0) | 49 (26.7) | 59 of 180 (32.8) | 44 of 125 (24.4) |
Treatment difference compared to placebo at week 52 (95% CI)i | −1.7 (−10.9 to 7.5) | 8.4 (−1.1 to 17.8) | ||
MCS at baseline, n | 172 | 175 | 173 | 173 |
MCS at week 52, n | 132 | 139 | 140 | 125 |
Responder at week 52 (FAS)h % | 38 (20.9) | 31 (16.7) | 50 (27.4) | 39 (21.2) |
Treatment difference compared to placebo (95% CI)i | 4.2 (−4.1 to 12.6) | 6.2 (−2.71 to 15.2) | ||
FACIT-F | ||||
Baseline, n | 171 | 174 | 170 | 175 |
Week 52, n | 131 | 138 | 137 | 126 |
Responder at week 52 (FAS)j | 53 (29.3) | 49 (26.8) | 60 (33.2) | 45 (24.7) |
Treatment difference compared to Placebo (95% CI) | 2.4 (−6.9 to 11.8) | 8.5 (−0.9 to 17.9) | ||
CLASI activity (≥ 50% reduction from baseline to week 12 in patients with baseline CLASI activity score ≥ 10) | ||||
N | 58 | 54 | 49 | 40 |
Responderk | 24 (41.9) | 14 (24.9) | 24 (49.0) | 10 (25.0) |
Treatment-group difference vs. placebo (95% CI) | 17.0 (−0.3 to 34.3) | 24 (4.3 to 43.6) | ||
P value | 0.054b | 0.0168b | ||
Adjusted P value | NR | 0.0392l | ||
Annual flare rate through week 52 (annualized flare rate) | ||||
N | 180 | 184 | 180 | 182 |
Responderm (rate ratio) | 65 (0.60) | 80 (0.72) | 56 (0.43) | 77 (0.64) |
Treatment-group ratio difference vs. placebo (95% CI) | 0.83m (0.60 to 1.14) | 0.67m (0.48 to 0.94) | ||
P value | 0.258b | 0.0202b | ||
Adjusted P value | NA | 0.0809k | ||
≥ 50% joint reduction at week 52 in patients with ≥ 6 swollen and ≥ 6 tender joints at baseline | ||||
N | 70 | 68 | 71 | 90 |
Respondern (%) | 33 (47.0) | 22 (32.3) | 30 (42.2) | 34 (37.5) |
Treatment-group difference vs. placebo (95% CI) | 14.7 (−1.4 to 30.8) | 4.7 (−10.6 to 20.0) | ||
P value | NR | 0.5469b | ||
Adjusted P value | NR | 0.5469k | ||
Response by subgroup of patients with baseline OCS dose > 10 mg/day | ||||
BICLA at week 52, n | NR | NR | 87 | 83 |
Responder | NR | NR | 40 (45.8) | 28 (33.8) |
Treatment-group difference vs. placebo (95% CI) | NR | 12.0 (−2.5 to 26.6) | ||
SRI-4 at week 52, n | 103 | 102 | 87 | 83 |
OCS dose at baseline ≥ 10 mg/day/N (%) | 40 (39.2) | 43 (42.3) | 50 (57.2) | 31 (37.3) |
Treatment-group difference vs. placebo (95% CI) | −3.1 (−16.5 to 10.3) | 19.9 (5.2 to 34.6) | ||
50% reduction from baseline to week 12 in patients with baseline CLASI activity score ≥ 10, n | 37 | 34 | 32 | 25 |
Responder (%) | 17 (45.9) | 10 (29.4) | 12 (37.5) | 7 (28.0) |
Treatment-group difference vs. placebo (95% CI) | 16.5 (−5.9 to 38.9) | 9.5 (−15.3 to 34.3) | ||
Annual flare rate, n | 103 | 102 | 87 | 83 |
Responder, rate ratio | 0.69 | 0.87 | 0.36 | 0.70 |
Rate ratio, treatment-group difference vs. placebo (95% CI) | 0.79 (0.53 to 1.18) | 0.52 (0.33 to 0.82) | ||
Joint reduction rate > 50% at week 52 among patients with at least 6 swollen and 6 tender joints at baseline, n | NR | NR | 29 | 43 |
Responder (%) | NR | NR | 11 (37.9) | 16 (37.2) |
Treatment-group difference vs. placebo (95% CI) | NR | 0.7 (−22.2 to 23.7) | ||
Harms, n (%) (FAS) | ||||
Adverse events | 161 (89.4) | 241 (88.3) | 162 (90.0) | 154 (84.6) |
Serious adverse events | 25 (13.9) | 30 (16.3) | 15 (8.3) | 31 (17.0) |
Withdrawal from study treatment due to adverse events | 12 (6.7) | 7 (3.8) | 5 (2.8) | 14 (7.7) |
Deathso | 1 (0.6) | 1 (0.5) | 1 (0.6) | 0 |
Pneumonia | 1 (0.6) | 0 | 1 (0.6) | 0 |
Acute meningoencephalitis | 0 | 1 (0.5) | NR | NR |
Notable harms | ||||
Herpes zoster | 10 (5.6) | 3 (1.6) | 13 (7.2) | 2 (1.1) |
Serious infection (nonopportunistic) | 9 (5.0) | 8 (4.3) | 5 (2.8) | 10 (5.5) |
Hypersensitivity | 11 (6.1) | 2 (1.1) | 2 (1.1) | 1 (0.5) |
Infusion-related reaction | 16 (8.9) | 13 (7.1) | 25 (13.9) | 14 (7.7) |
Depression | 5 (2.8) | 5 (2.7) | 5 (2.8) | 3 (1.6) |
Suicidal ideation or behaviour | 2 (1.1) | 3 (1.6) | 3 (1.7) | 8 (4.4) |
Malignancy | 3 (1.7) | 1 (0.5) | 0 | 1 (0.5) |
BICLA = British Isles Lupus Assessment Group-based Composite Lupus Assessment; BILAG-2004 = British Isles Lupus Assessment Group 2004; CI = confidence interval; CMH = Cochran-Mantel-Haenszel; CLASI = Cutaneous Lupus Erythematosus Disease Area and Severity Index; FACIT-F = Functional Assessment of Chronic Illness Therapy–Fatigue; FAS = full analysis set; HR = hazard ratio; LSM = least squares mean; MCS = mental component summary; NA = not applicable; NR = not reported; OCS = oral corticosteroids; PCS = physical component summary; PGA = Physician’s Global Assessment; SD = standard deviation; SE = standard error; SF-36 = Short Form (36) Health Survey; SLEDAI-2K = Systemic Lupus Erythematosus Disease Activity Index 2000; SRI-4 = improvement of 4 points or greater on the Systemic Lupus Erythematosus Responder Index; VAS = visual analogue scale; vs. = versus.
aThe responder and nonresponder rates (percentages), difference in estimates, and associated 95% CIs are weighted and calculated using a stratified CMH approach with stratification factors (SLEDAI-2K score at screening [< 10 points vs. ≥ 10 points], week 0 OCS dose [< 10 mg/day vs. ≥ 10 mg/day prednisone or equivalent] and type I interferon-test result at screening [high vs. low]).
bBICLA response is defined as a reduction of all baseline BILAG-2004 A and B scores and no worsening in other organ systems, no worsening from baseline in SLEDAI-2K, and no increase of 0.30 points or greater on a 3-point PGA VAS from baseline. Patients treated with restricted medication beyond protocol-allowed thresholds, and those who discontinued the investigational product, are regarded as nonresponders. Percentages are based upon all patients in the full analysis set.
cP value has not been adjusted for multiple testing (i.e., the type I error rate has not been controlled).
dHRs and 95% CIs for HRs are estimated using a Cox regression model with treatment groups and the stratification factors (SLEDAI-2K score at screening [< 10 points vs. ≥ 10 points], week 0 OCS dose [< 10 mg/day vs. ≥ 10 mg/day prednisone or equivalent] and type I interferon-test result at screening [high vs. low]) as covariates. Time to BICLA response sustained up to week 52 is defined as the visit of first BICLA response that is sustained up to, and including, week 52. A patient is considered to have achieved BICLA response sustained up to week 52 if the response is achieved at week 52 with “time to” defined as the first time point at which a BICLA response is achieved when maintained through week 52. Patients without a BICLA response sustained up to week 52 will be censored at the date of premature discontinuation of the investigational product, or week 52, whichever occurs earlier.
ePatients who discontinued the investigational product or used medications beyond protocol allowed threshold are considered nonresponders and not included in this category.
fA repeated measures model with fixed effects for baseline value, treatment group, visit, treatment-by-visit interaction and stratification factors (SLEDAI-2K score at screening [< 10 points vs. ≥ 10 points], week 0 OCS dose [< 10 mg/day vs. ≥ 10 mg/day prednisone or equivalent) and type I interferon-test result at screening [high vs. low]) was used.
gMaintained OCS reduction is defined as an OCS dosage of no more than 7.5 mg/day by week 40 without a dose increase between week 40 and week 52. Percentages are based upon all patients in the full analysis set with a baseline OCS dosage of 10 mg/day or higher. OCS are described as “prednisone or equivalent.” OCS administered pro re nata are not considered in the calculation of the daily dose. Patients treated with restricted medication beyond protocol-allowed thresholds, and those who discontinued the investigational product, are regarded as nonresponders.
hPatients were considered responders if they exhibited a meaningful change of least 3.4 and 4.6 points on the PCS and MCS, respectively, from baseline. The responder rates (percentages) were calculated using a stratified CMH approach with stratification factors (SLEDAI-2K score at screening [< 10 points vs. ≥ 10 points], week 0 OCS dose [< 10 mg/day vs. ≥ 10 mg/day prednisone or equivalent] and type I interferon gene signature test result at screening [high vs. low]). Percentages are based upon all patients in the FAS. Patients treated with restricted medication beyond protocol allowed threshold, and those discontinued the investigational product are regarded as nonresponders. If the respective score of SF-36 Version 2.0 (acute) cannot be evaluated, the patient is regarded as a nonresponder.
iThe difference in estimates and associated 95% CI, are weighted were calculated using a stratified CMH approach with stratification factors (SLEDAI-2K score at screening [< 10 points vs. ≥ 10 points], week 0 OCS dose [< 10 mg/day vs. ≥ 10 mg/day prednisone or equivalent] and type I interferon gene signature test result at screening [high vs. low]).
jA response in FACIT-F is defined as an improvement from baseline to week 52 of 3 or more points (i.e., change from baseline > 3). Patients treated with restricted medication beyond the protocol-allowed threshold, and those who discontinued the investigational product, are regarded as nonresponders. If the FACIT-F cannot be evaluated, the patient is regarded as a nonresponder.
kA responder is defined as a patient with at least a 50% reduction in CLASI activity score compared to baseline. Percentages are based on all patients in the FAS with a baseline CLASI activity score of 10 or higher. Patients treated with restricted medication beyond protocol-allowed thresholds, and those who discontinued the investigational product, are regarded as nonresponders.
lP values were adjusted for multiplicity using the Holm procedure. As prespecified in the statistical analysis plan, the TULIP-1 trial did not adjust secondary outcomes for multiplicity because the primary end point was not met.
mThis is a rate ratio rather than a rate difference, as with other end points. This is calculated as annualized rate of anifrolumab. A flare is defined as either 1 or more new BILAG-2004 A items or 2 or more new BILAG-2004 B items compared to the previous visit (i.e., a worsening from an E, D, or C score to a B score in at least 2 organ systems or a worsening from an E, D, C, or B score to an A score in any 1 organ system compared to the previous visit). The response variable in the model is the number of flares up to week 52 or early discontinuation visit. The model includes covariates of treatment group, and the stratification factors (SLEDAI-2K score at screening [< 10 points vs. ≥ 10 points], week 0 OCS dose [< 10 mg/day vs. ≥ 10 mg/day prednisone or equivalent] and type I interferon-test result at screening [high vs. low]). The logarithm (base e) of the follow-up time was used as an offset variable in the model to adjust for patients having different exposure times.
nResponders are patients with a 50% reduction from baseline in both swollen and tender joints. Patients treated with restricted medication beyond protocol-allowed thresholds, and those who discontinued the investigational product, are considered nonresponders. Percentages are based upon all patients in the FAS with at least 6 swollen and at least 6 tender joints at baseline.
oDeaths were not considered to be related to the investigational product according to the investigator.
Source: Clinical Study Reports.9,10
Critical Appraisal
A number of factors between the 2 pivotal trials contributed to bias or general uncertainty of the outcomes. The primary outcome for the TULIP-1 and TULIP-2 trials was the composite score of SRI-4 and BICLA, respectively. The decision to switch the primary end point in the TULIP-2 trial was based on the results of the TULIP-1 and MUSE trials, and this decision was made before the unblinding of the data in the TULIP-2 trial at week 52. The risk of operational bias is therefore low. Both trials followed the same procedures for blinding, database lock, unblinding, and data analysis, and concerns for potential investigator bias are low. The risk of confounding variables were accounted for through stratification (e.g., SLEDAI-2K score at screening, baseline OCS dose, and type I interferon gene signature test results). Baseline imbalances of these factors could affect efficacy and/or safety assessments of anifrolumab versus placebo. Overall baseline characteristics and disease activity scores (e.g., CLASI activity, SLEDAI-2K scores) were generally similar and balanced between groups across both trials; however, there was a greater percentage of patients with a CLASI damage score of 10 or higher in the treatment arm compared to placebo in the TULIP-2 trial (8.9% versus 4.4%, respectively), versus TULIP-1 (6.1% versus 4.3%), which may allow for greater leaps in improvement in patients with more severe disease for this outcome. Other concerns include potential ceiling effects for patients with lower disease activity scores (e.g., a patient with a baseline SLEDAI-2K score of 6 would be less likely to achieve a 4-point drop compared with someone who starts with a score of 12).
In the TULIP-1 trial, there were similar rates of withdrawal in both study arms (18.9% anifrolumab versus 19% placebo) while discontinuation was much lower in the treatment arm of TULIP-2 versus placebo (13.3% versus 25.3%, respectively). Discontinuations were primarily due to patient request, AE, lack of efficacy, and condition under investigation worsened. In the TULIP-2 trial, a slightly higher proportion of patients discontinued due to patient requests in the placebo group (10.4%) than in the anifrolumab group (6.1%) and more patients in the placebo group withdrew due to AEs (3.8% versus. 1.7%) and lack of efficacy (4.4% versus 1.1%) before the end of the study.
The sponsor adhered to its statistical testing hierarchy for the multiplicity adjustment, testing outcomes in sequence. Sensitivity analyses and multiplicity adjustments were only conducted in the TULIP-2 trial as the TULIP-1 trial did not meet its primary end point. The sponsor used a non-responder imputation approach in which patients who withdrew from the study or received restricted medications beyond the protocol-allowed threshold would be considered nonresponders. With this approach, when more patients withdraw in the placebo group, this may bias the results in favour of anifrolumab as these patients would be considered nonresponders whether or not they were responding at the time of withdrawal. The sensitivity analyses performed by the sponsor supports the findings of its primary analysis of the TULIP-2 trial, using approaches such as last observation carried forward (LOCF) as well as tipping-point analyses. LOCF was also used to impute missing data where individual components of the primary composite outcome were missing. Missing data rates were higher among the BILAG-2004 component for both studies.
The clinical expert consulted by CADTH agreed that the baseline patient characteristics of the TULIP-1 and TULIP-2 trials were reflective of patients they see in Canadian clinical practice for the present indication. Although the majority of patients in each study were enrolled in trial sites from the US and Europe, the population enrolled in the trial was consistent with the population expected to be treated in Canadian clinical practice. The clinical expert noted that prescribing patterns may differ between countries (e.g., higher use of nervous system medication, or use of mizoribine, which is not prescribed in Canada); however, no differences in treatment effects would be expected based on different disease-management practices. Additionally, American College of Rheumatology (ACR) criteria were used to identify patients with SLE in both trials, and these are rigorous criteria that are designed for use in clinical trials, rather than clinical practice. There is therefore a higher risk of misdiagnosis of SLE occurring in clinical practice, although the clinical expert consulted by CADTH for this review noted that diagnosis of SLE should be straightforward for clinicians with specialty training. Furthermore, the subgroup analyses (e.g., high versus low interferon-test results) had no statistical comparisons and even smaller sample sizes, which limits the generalizability to a broader population.
According to the clinical expert, improvements in organ damage or other longer-term outcomes (e.g., mortality) while on anifrolumab are unlikely to be detected during a 52-week double-blind treatment phase because of insufficient duration. The composite primary outcome, patients with an SRI-4 or BICLA response, would not be used routinely to assess patient status in clinical practice; however, the components of the composite would be an important part of the assessment of patients with SLE (e.g., clinical Systemic Lupus Erythematosus Disease Activity Index [SLEDAI] score). Given that anifrolumab has not been studied versus an active comparator, the efficacy and harms of this drug compared to the addition of other drugs used in the treatment of SLE is unknown. Although a variety of drugs are used chronically to manage SLE, none were specifically developed to manage this disease.
Other Relevant Evidence
Description of Studies (MUSE and Study 1145)
Two submitted studies provided in the sponsor’s submission to CADTH were considered to address the long-term efficacy of the treatment under review. These include a phase II, multinational, multicentre, randomized, double-blind, placebo-controlled study (MUSE)11 and a phase II, single-arm, open-label, long-term extension (LTE) study to evaluate the long-term safety of anifrolumab (Study 1145).12 Inclusion and exclusion criteria and baseline demographics were consistent with the TULIP-1 and TULIP-2 clinical trials. The primary efficacy end point for the MUSE study was the proportion of patients who at day 169 (week 24) achieved an SRI-4 response as defined in the TULIP-1 trial. Patients who were not able to taper their OCS dosage to less than 10 mg/day (prednisone or equivalent) or to a dosage equal to or less than their day 1 dosage by day 85 (week 12) and maintain this decrease until day 169 (week 24) were declared nonresponders for the primary end point. Subgroup analyses included the proportion of patients who tested positive on a type I interferon signature diagnostic test achieving an SRI-4 response with OCS tapering. Secondary efficacy end points included the proportion of patients achieving an SRI-4 response at day 365 and the proportion of patients on 10 mg/day or higher of oral prednisone (or equivalent) at baseline who were able to taper to no more than 7.5 mg/day at day 365 (week 52).
Study 114512 (N = 218) was a single-arm, open-label, long-term safety (up to 3 years; 70.6% of patients were treated for 30 months or longer) and tolerability study of anifrolumab 300 mg every 4 weeks by IV infusion in adult patients with chronic, moderate to severe SLE who were previously treated with any dose of anifrolumab or placebo in the MUSE trial. Safety assessments consisted of reporting all AEs, including treatment-emergent adverse events (TEAEs) and SAEs, as well as adverse events of special interest (AESIs). The primary end points of the study were the safety and tolerability of IV anifrolumab in adult patients with moderately to severely active SLE who were assessed primarily by summarizing TEAEs, SAEs, withdrawals due to adverse events, and AESIs. The secondary safety outcome included evaluating the immunogenicity results of anifrolumab by summarizing the proportion of patients who developed detectable antidrug antibodies (ADAs). Other outcomes were also assessed in the trial as exploratory efficacy outcomes; however, they are not reported further in this review. These included outcomes to evaluate the efficacy, pharmacokinetic, pharmacodynamic, and HRQoL impacts of anifrolumab.
Efficacy Results
In the MUSE study, A total of 34.3% of patients had an SRI-4 response with OCS tapering at week 24 in the anifrolumab group compared to 17.6% in the placebo group, with a statistically significant odds ratio (OR) of 2.38 (90% CI, 1.33 to 4.26; P value = 0.014). The proportion of patients with a high result on an type I interferon test who had an SRI-4 response with OCS tapering at week 24 was 36.0% for the anifrolumab group and 13.2% for the placebo group with an OR of 3.55 (90% CI, 1.72 to 7.32). The difference was statistically significant, with a P value of 0.004. For this secondary end point at week 52, a total of 51.5% of patients had an SRI-4 response with OCS tapering in the anifrolumab group compared to 25.5% in the placebo group, with an OR of 3.08 (90% CI, 1.86 to 5.09; P value < 0.001). For this secondary end point, a total of 56.4% of patients in the anifrolumab group on 10 mg/day or higher of oral prednisone (or equivalent) at baseline were able to taper to no more than 7.5 mg/day by week 52 compared to 26.6% in the placebo group, with an OR of 3.59 (90% CI, 1.87 to 6.89; P value = < 0.001).
Harms Results
In the MUSE trial, 84.8% of patients in the anifrolumab group and 77.2% of patients in the placebo group reported 1 or more TEAEs, the most common being headache, upper respiratory tract infection, nasopharyngitis, and urinary tract infection. Nasopharyngitis occurred at a higher frequency in the anifrolumab group (12.1%) than in the placebo group (4.0%).
The proportion of patients with 1 or more SAEs was similar between the anifrolumab and placebo groups, the most common being increased SLE activity and pneumonia. The most common AESIs were infusion, hypersensitivity, and anaphylactic reactions, which were reported in a greater proportion of the placebo group (5.9%) than in the anifrolumab group (2.0%). No deaths were reported in the anifrolumab 300 mg/day or placebo groups.
In the LTE (Study 1145) through to week 52, the total numbers of patient-years of exposure were 93.4 for the anifrolumab group and 84.3 for the placebo group. A higher proportion of patients in the anifrolumab group (65.7%) received the full course of treatment (13 doses) compared with those in the placebo group (53.5%). A total of 78% of patients (n = 170) experienced an AE, with the most common being nasopharyngitis (14.7%), bronchitis (13.8%), and upper respiratory tract infection (9.2%). A total of 22% (n = 48) of patients had a drug-related TEAE and 22.9% (n = 50) had 1 or more SAEs, with an exposure-adjusted SAE rate of 8.56 per 100 patient-years. The most common SAEs were increased SLE activity and pneumonia, each of which occurred in 2.3% of patients. The death of 1 patient from community-acquired pneumonia was determined by the investigator to be related to treatment. In terms of AESIs, 7 patients (3.2%) had infusion, hypersensitivity, or anaphylactic reactions, and 5 patients (2.3%) had latent tuberculosis. Five patients in Study 1145 had ADA-positive measurements at any time, 3 at baseline only and 2 persistently.
Critical Appraisal
In the MUSE study, a number of factors contributed to bias in favour of anifrolumab or general uncertainty. A higher proportion of patients in the placebo group used an OCS dosage of 10 mg/day or higher at baseline compared with those in the anifrolumab group (62.7% versus 55.6%, respectively). A risk of attrition bias may be present due to the greater number of withdrawals in the placebo group. The decision to classify discontinued patients as nonresponders in the primary analyses may have biased the results in favour of treatment. Furthermore, it was unclear whether the patients who discontinued were different from those who did not. The primary outcome, SRI-4, is a reliable and valid composite measure for disease activity and response in SLE. The primary outcome was measured at 24 and 56 weeks in the MUSE study, which provided data on long-term treatment effects. The clinical expert consulted for this review agreed that a treatment response is expected within 24 weeks. In terms of statistical analyses, multiplicity was not controlled across populations and there was no control for multiplicity in the secondary efficacy outcomes, which increases the likelihood of a type I error.
While baseline demographics of the patients in the MUSE trial were representative of moderately to severely active SLE in Canada, the high dropout rate in the placebo group may have led to patients who are less representative of the recruited population, decreasing the generalizability of the results of the study.
The extension study allowed for the investigation of long-term efficacy and harms. However, the absence of an active comparator limits the ability to draw causal conclusions. Furthermore, the analysis does not take account of the frequency or recurrence of AEs. As a greater proportion of patients in Study 1145 had previously been treated with anifrolumab in the MUSE study, observations based on frequencies of overall AEs in Study 1145 should be interpreted with caution. This could have resulted in a population of patients who were more tolerant of anifrolumab and therefore potentially less likely to experience harms. A high proportion of patients (36.2%) discontinued the study, which can increase the risk of attrition bias in favour of the intervention as patients who do not do well on an intervention tend to withdraw from studies. Although these patients were included in the safety analyses, their characteristics were not reported, making it unclear whether the patients who discontinued were different from those who did not.
Description of Study (TULIP LTE)
The TULIP LTE was a 3-year, double-blind, placebo-controlled study of adult patients who had moderately to severely active SLE at the start of the TULIP-1 and TULIP-2 studies. The TULIP LTE study enrolled patients who had completed the 52-week double-blind treatment period in either of the phase III studies (TULIP-1 or TULIP-2), met all TULIP LTE eligibility criteria, and were willing to continue into the extension study. Patients who received anifrolumab in the TULIP-1 or TULIP-2 trial and entered the LTE remained on anifrolumab. Patients who received placebo and entered the LTE were rerandomized 1:1 to receive either anifrolumab or placebo in the LTE. This resulted in an approximate ratio of 4:1 anifrolumab 300 mg (n = 435; of these, 257 patients treated with anifrolumab 300 mg continued on anifrolumab 300 mg) versus placebo (n = 112) in the LTE study. The primary objective was to characterize long-term safety and tolerability of IV anifrolumab in patients who completed the TULIP-1 or TULIP-2 trial (as measured by AESIs and SAEs, for example). The exploratory objectives were efficacy assessments of overall disease activity (SLEDAI-2K), OCS use, damage accrual (Systemic Lupus International Collaborating Clinics/American College of Rheumatology Damage Index [SDI]) and HRQoL. The LTE study consisted of a 156-week treatment period, after which patients continued in the study for another 8 weeks to complete a 12-week safety follow-up after receiving the last dose of the investigational product.13
Efficacy Results
The proportion of patients who achieved a reduction of 4 or more points in the SLEDAI-2K from baseline was consistently higher in the anifrolumab 300 mg group than in the placebo group. In the anifrolumab 300 mg group, 76.1% of patients who reached the week 52 visit and 90.0% of those who reached week 208 had a reduction of 4 or more points, compared with 69.5% and 81.8%, respectively, in the placebo group. In addition, greater improvements were seen from baseline to week 208 across all domains in the anifrolumab group compared to placebo.
In terms of OCS use, for each year of study, the mean OCS standardized area under the curve was lower for the anifrolumab 300 mg group compared to placebo.
In terms of organ damage, overall, 30% to 40% of patients had organ damage (i.e., SDI score ≥ 1), at baseline in the TULIP-1 and TULIP-2 trials. Organ damage remained stable in both groups throughout the LTE; at week 208 the mean SDI score in patients with a baseline SDI score of 1 or higher was 2.1 in the anifrolumab 300 mg and 2.0 in the placebo group.
HRQoL was measured by the SF-36 Version 2 (SF-36v2) and EQ-5D-5L. Larger improvements in HRQoL, as measured by SF-36v2 PCS and MCS response rates, were observed for the anifrolumab 300 mg group compared with patients in the placebo group. In terms of EQ-5D-5L, the improvements in QoL as measured by change from baseline were small but consistently higher for the anifrolumab 300 mg compared to the placebo group throughout the 4 years.
Harms Results
The safety profile for up to 4 years of exposure, including assessment of rare events, remains unchanged. In addition, there was no increase in malignancy, major adverse cardiac events, anaphylaxis, or active tuberculosis. During the 52-week period, 87.5% of patients in the anifrolumab group and 81.3% of patients in the placebo group reported 1 or more TEAEs, the most common being nasopharyngitis, urinary tract infection, upper respiratory tract infection, bronchitis, and headache.
The proportion of patients with 1 or SAEs was similar between the anifrolumab and placebo groups, the most common being infections and infestations. The most common AESI was nonopportunistic infection. Three deaths were reported in the anifrolumab group (1.2%) and 1 death was reported in the placebo group (0.9%). Overall, no new safety signals were identified.
Critical Appraisal
Demographics and baseline characteristics were generally well balanced between groups. At the start of the LTE study, fewer anifrolumab patients were on steroids compared to those on placebo. This may have contributed to bias in terms of reducing OCS use if a greater number of patients in the anifrolumab group were already not using an OCS. Approximately 72% and 68% of eligible anifrolumab and placebo patients, respectively, completing treatment in the predecessor studies (TULIP-1 and TULIP-2) were enrolled in the TULIP LTE. More patients on anifrolumab completed the 3-year extension (66% across all anifrolumab groups versus 48% in placebo). The differential dropout rate may have increased the risk of attrition bias in favour of anifrolumab.
Limitations regarding efficacy and HRQoL outcomes included the lack of formal statistical testing and were exploratory. Although a higher proportion of patients in the anifrolumab group had lower OCS use and improved SLEDAI-2K scores compared to those in placebo group, no firm conclusions can be drawn about the efficacy of anifrolumab and its steroid-sparing effect based on the presented data. Also, the ability to draw conclusions on the effectiveness of anifrolumab in preventing organ damage was limited due to the lack of statistical testing.
While the patient population was considered representative of patients with moderate to severe SLE in Canada, patients enrolled in the TULIP LTE had to have participated in the 52-week double-blind treatment period in 1 of the phase III studies (TULIP-1 or TULIP-2), making this a selective patient population as it included only those who were able to complete the TULIP studies and, while the baseline characteristics of the patients enrolled in the TULIP LTE might not differ from those enrolled in the TULIP-1 or TULIP-2 studies, results from the TULIP LTE cannot be generalized to all patients enrolled in the TULIP-1 and TULIP-2 trials.
Conclusions
The clinical expert consulted by CADTH, and the input received from the clinician groups for this review, indicated that the ideal treatment would have a meaningful impact on overall survival by reducing disease activity, risks of subsequent flares, use of an OCS, risks of AEs, and long-term complications, while inducing remission (low disease activity) and improving HRQoL. Two multinational, sponsored-submitted, double-blind, randomized controlled trials (RCTs), TULIP-1 and TULIP-2, were included in this review, along with 2 additional studies that provided long-term safety data. Results of the 2 pivotal RCTs were inconsistent with each other. In 1 study, anifrolumab statistically significantly reduced disease activity after 52 weeks compared to placebo, as measured by BICLA response. The second study showed no statistically significant difference in responses as measured by SRI-4. While 1 of the studies showed a difference in maintained reduction of OCS dosages to less than 7.5 mg/day and a reduction in cutaneous manifestations of lupus, the other did not. The inconsistent results contribute to uncertainty in forming conclusions regarding the impact of anifrolumab on disease activity, OCS dosage reduction, and CLASI reduction. Despite numerical improvements in symptoms and HRQoL across the included measures, these results were not tested statistically, and the improvements were generally the same between anifrolumab and placebo groups; the impact of anifrolumab on HRQoL is therefore unknown. The duration of the study was not sufficient to study the effects of anifrolumab on organ damage and survival. Data from the included studies do not raise any issues of tolerability or safety, although the extension study was limited by the lack of a control group.
Introduction
Disease Background
Lupus is an autoimmune disease characterized by inflammatory processes that can occur in various tissues and organs of the body.1,2 Approximately 1 in 1,000 Canadians is afflicted with lupus.2 The most common form is SLE.2,5 Estimated incidence rates are 1 to 25 per 100,000 in North America.3 The age of onset is primarily between 16 and 55 years, with females of childbearing age more commonly afflicted than males (9:1).3,4 Additionally, research suggests that people of African descent, in addition to Asian, Hispanic, and Indigenous peoples, are at increased risk for SLE and may exhibit more severe manifestations compared to white counterparts.3,4 The etiology and pathophysiology are unknown.3 Given that lupus affects so many systems, its symptoms can vary greatly from patient to patient. Patients can experience fatigue and joint pain, which can seriously affect ADLs.2 The most common manifestations are neurologic, renal, cardiovascular, rash, and a variety of other symptoms. Musculoskeletal (arthritis [e.g., joint involvement] and myositis) and mucocutaneous manifestations (severe skin rashes, hair loss, and ulcers in the oral and nasal cavities) occur in up to 95% and 80% of patients, respectively.14 The disease has a variable course, and patients can cycle among a chronic state, flares (acute worsening of their condition), and remission.5 Long-term organ damage is the main risk factor for mortality and may occur from the disease pathology as well as during periods of low disease activity due to toxicity from treatment. Aside from lupus nephritis, patients with lupus may develop early severe cardiovascular disease and have an increased risk of malignancy. Evidence suggests that SLE progression, organ damage, and death are a chain of events that can only be interrupted by better control of disease activity.6 The uncertainty of the disease course affects the HRQoL of patients, many of whom are unable to maintain a job or schooling because of their disease. Patients with SLE are diagnosed and treated primarily by rheumatologists, and in some cases, other specialties such as immunology. Diagnosis typically occurs through the presentation of key clinical manifestations and supporting laboratory tests.
Standards of Therapy
There is currently no long-term cure for SLE.2 Instead, SLE is treated with medications that are taken acutely on an as-needed basis, as well as chronically.2 Treatment varies from patient to patient and is generally guided by the predominant disease manifestation.3 The main treatments used are antimalarials, immunosuppressants, corticosteroids, and nonsteroidal anti-inflammatory drugs (NSAIDs). First-line chronically administered drugs are antimalarials, such as hydroxychloroquine, that interfere with intracellular toll-like receptor signalling. Given that SLE is an autoimmune disorder, immunosuppressants also play an important role, and a variety are used (e.g., methotrexate, azathioprine, mycophenolate, and cyclosporine). These drugs are all approved for other conditions and are used off-label for lupus. Immunosuppressants are well known for their toxic effects, such as serious infections (e.g., respiratory tract, urinary tract, and skin) and certain malignancies, and therefore present significant tolerability issues for patients. Opportunistic infections such as salmonella and herpes zoster are also common in SLE, given the altered immune status brought on by immunosuppressive and steroidal medications.15 OCS treatments are used to reduce pain and inflammation by decreasing the activity of overactive white blood cells. Prolonged and/or high doses of an OCS, namely prednisone, are also well known for toxic effects such as osteoporosis, psychiatric issues, cataracts, glaucoma, diabetes, hypertension, and many others, particularly when used chronically. Although they are relied upon for flares, the chronic use of an OCS is avoided as much as possible. B-lymphocyte–depleting therapies, such as belimumab and (off-label) rituximab, are also used in SLE given that B lymphocytes play a pivotal role in SLE. Belimumab is the only biologic approved for use in Canada, while rituximab is used off-label as a short-term treatment for acute flares (i.e., it is not suited for chronic management).16
The most important treatment goals are to minimize damage to major organs, most commonly the kidneys, prevent premature death; reduce symptom severity; improve HRQoL, and maintain independence and ADLs, such as employment.
Drug
Anifrolumab is a human immunoglobulin G1 kappa monoclonal antibody that binds to IFNAR1, blocking the activity of type I interferons such as interferon-alpha and interferon-beta.8 Anifrolumab also induces the internalization of IFNAR1, thereby reducing the number of receptors available for binding and reducing inflammation and immunological processes.8 Type I interferons play an important role in the pathogenesis of SLE.8 Approximately 60% to 80% of adult SLE patients have high levels of type I interferon–inducible genes, which are associated with increased disease activity and severity.8
Anifrolumab is indicated in addition to standard therapy for the treatment of adult patients with active, autoantibody-positive SLE.8 The Health Canada–recommended dose is 300 mg, administered as an IV infusion over a 30-minute period, every 4 weeks. The Health Canada–approved product monograph also states the infusion rate may be slowed or interrupted if the patient develops an infusion reaction. In the event of a serious infusion-related or hypersensitivity reaction (e.g., anaphylaxis), treatment should be discontinued immediately, and appropriate therapy should be administered. The sponsor-requested reimbursement indication for anifrolumab differs from the Health Canada indication. The sponsor’s reimbursement request is for anifrolumab in addition to standard therapy for patients with moderate to severe SLE (based on an SLEDAI-2K score ≥ 6), whose disease activity cannot be controlled despite an OCS dosage of 10 mg/day or higher of prednisone or its equivalent.
Anifrolumab was approved by the FDA on July 30, 2021, for the treatment of adult patients with moderate to severe SLE who are receiving standard therapy. It is currently under review by the National Institute for Health and Care Excellence and is authorized by the European Medicines Agency, the Therapeutics Goods Administration in Australia, and the Medicines and Health care products Regulatory Agency in the UK. Anifrolumab has not been reviewed previously by CADTH for any other indication.
Key characteristics of the biologic drugs used in the treatment of SLE are presented in Table 3.
Table 3: Key Characteristics of Anifrolumab, Belimumab, and Rituximab
Characteristic | Anifrolumab | Belimumab | Rituximab |
|---|---|---|---|
Mechanism of action | Type I interferon blocker | B-lymphocyte stimulator–specific inhibitor | Monoclonal antibody |
Indicationa | In addition to standard therapy for the treatment of adult patients with active autoantibody-positive SLE | In addition to standard therapy for reducing disease activity in adult patients with active, autoantibody-positive SLE; as well as for treatment of active lupus nephritis in adult patients |
|
Route of administration | IV | IV and subcutaneous injection | IV |
Recommended dose | 300 mg, administered as an IV infusion over a 30-minute period, every 4 weeks | 10 mg/kg at 2-week intervals for the first 3 doses and at 4-week intervals thereafter | Off-label use; the clinical expert consulted by CADTH noted that different centres use different doses, typically ranging from 500 mg/m2 every 2 weeks for 2 doses and 1 g every 2 weeks for 2 doses to 375 mg/m2 weekly for 4 doses |
Serious adverse effects or safety issues |
|
|
|
Other | None | None | Not indicated for SLE patients; used off-label |
SLE = systemic lupus erythematosus.
aHealth Canada–approved indication.
Source: Health Canada product monographs.
Stakeholder Perspectives
Patient Group Input
The information in this section is a summary of input provided by the patient groups who responded to CADTH’s call for patient input and from a clinical expert consulted by CADTH for the purposes of this review.
Patient Input
Four responses to CADTH’s call for patient input for the anifrolumab submission were received. These consisted of submissions from ACE, Lupus Canada, Lupus Ontario, and a cooperative submission from the Canadian Arthritis Patient Alliance, the Arthritis Society, and the Canadian Skin Patient Alliance. Patient input was gathered from 148 lupus patients across Canada, including 34 respondents (88% female) from ACE, 112 (96.4% female) from Lupus Canada, and 2 respondents with SLE from Lupus Ontario. The cooperative submission conducted a focus group of 10 patients (90% female) with SLE. ACE also conducted an in-depth interview with 1 patient. None of the patients in the included submissions had experience with the treatment under review.
Lupus was described as a chronic disease characterized by inflammation in 1 or more parts of the body. Those with lupus often experience flares — unpredictable bouts of increased disease activity resulting in symptoms such as debilitating fatigue, pain in muscles and joints, difficulty breathing, or persistent headaches. Respondents reported challenges in managing the physical symptoms of lupus, which can be severe and debilitating, particularly during disease episodes or flares. Treatments described in the submissions as those used to manage SLE include NSAIDs, antimalarial medications (hydroxychloroquine and chloroquine), corticosteroids, immunomodulation drugs (methotrexate, azathioprine, mycophenolate mofetil, and cyclophosphamide), rituximab, belimumab, and over-the-counter pain medications. Respondents indicated that current treatments are difficult to tolerate because of their many side effects, such as headaches, brain fog, additional fatigue, frequent infections, osteoporosis, gastric issues, insomnia, hair loss, weight gain or loss, and mood swings, allergic reactions, nausea, anxiety, and tremors, as well as concerns about organ damage.
According to the patient input received, respondents reported that they expect the following key outcomes from any new drug or treatment: reduction of side effects from medications such as weight gain; reduction in fatigue, joint and muscle pain, flares, rash and skin irritations, headaches, and brain fog; reduction in the number of medications used; increased lifespan; overall improvement in QoL; ability to engage in ADLs and social roles, improvement in sleep patterns; increased mobility and participation in physical activities; improvement in joint mobility; and improvement in tolerance to UV light.
Clinician Input
Input From Clinical Experts Consulted by CADTH
All CADTH review teams include at least 1 clinical specialist with expertise in the diagnosis and management of the condition for which the drug is indicated. Clinical experts are a critical part of the review team and are involved in all phases of the review process (e.g., providing guidance on the development of the review protocol, assisting in the critical appraisal of clinical evidence, interpreting the clinical relevance of the results, and providing guidance on the potential place in therapy). The following input was provided by 1 clinical specialist with expertise in the diagnosis and management of active, autoantibody-positive SLE.
Unmet Needs
According to the clinical expert, the major limitations of current treatments are the side effects of prednisone and immunosuppressants. Other unmet needs include nonresponse, noncompliance due to dosing schedules, polypharmacy, long-term organ damage, and recurrent flares that cause progressive organ damage (e.g., renal failure). Approximately 60% to 70% of patients do not have a positive long-term response to therapy without intermittent or continuous use of corticosteroids. This is a significant limitation due to the high burden of the side effects of this class of drugs. Patients are also frequently reluctant to increase corticosteroid doses during flares due to their awareness of these side effects. Nonadherence to therapy is a significant issue due to the serious consequences of flares, such as renal failure. No therapies provide a long-term cure or long-term medication-free survival in a majority of patients, and no therapies specifically address the underlying disease mechanisms in all patients.
Place in Therapy
The clinical expert noted that anifrolumab could lead to a paradigm shift, given its novel mechanism for treating SLE and preventing cytokine-induced inflammation. Anifrolumab would be used in combination with other treatments and potentially early in the disease course to control the disease with reduced side effects compared with standard of care. It is the clinical expert’s opinion that patients should begin treatment with antimalarials such as hydroxychloroquine and an OCS (e.g., prednisone) until nonresponse, toxicity, or prednisone dependency, at which point anifrolumab can be initiated. For patients with major organ involvement, anifrolumab can be offered after failure of standard of care to induce or maintain remission off prednisone with the use of at least an immunosuppressive drug plus hydroxychloroquine (if tolerant). The clinical expert added that anifrolumab treatment would likely assist patients for whom compliance with treatment is an issue.
Patient Population
Patients most suitable for treatment with anifrolumab would be those with active disease such active skin disease or polyarthritis because they are more likely to respond. The current therapy has not been studied in patients with severe nephritis or CNS disease and the clinical expert indicated that anifrolumab would not be considered standard of care in patients with these diseases until there is further evidence. Presymptomatic patients, or those who are not diagnosed with active skin disease or polyarthritis, should not be considered for treatment with anifrolumab until further evidence is available.
Patients with active disease are diagnosed based on their history, physical testing, and routine SLE lab testing such as antinuclear antibody tests. The clinical expert noted that patients diagnosed with active diseases are most likely to exhibit a response to treatment with anifrolumab regardless of previous treatments, such as standard of care and/or failure to successfully taper prednisone. The clinical expert also indicated that there are no issues related to diagnosis. However, active disease may be underdiagnosed if an SLE expert is not reviewing the patient.
Assessing Response to Treatment
According to the clinical expert, a clinically meaningful response to anifrolumab would be a meaningful reduction in disease activity as measured by clinical and laboratory outcomes. However, because each patient has target organ(s) for treatment, it is impossible to classify magnitudes of response to the treatment. The alternative is to monitor specific signs and assess symptoms to determine the response to treatment. Other indications of a clinically meaningful response include improvement of ADLs, stabilization of signs and symptoms, tapering steroid use, fatigue, and pain, which are important and significant issues for patients diagnosed with active disease. The clinical expert indicated that tapering steroid use without causing a disease flare is indicative of a positive response to treatment. Treatment response should be assessed every 2 to 3 months, generally.
Discontinuing Treatment
The decision to discontinue treatment should be based on an assessment of the treatment response. Specifically, treatment should be discontinued if there is failure to taper prednisone after 4 to 6 months of therapy; a prolonged increase in prednisone (greater than 3 months); disease flare after 3 to 6 months of remission; a lack of response to a short-term increase in prednisone (approximately 3 months); a life-threatening infection; or a severe infusion reaction that is unresponsive to conventional therapy and/or prophylaxis.
Prescribing Conditions
Rheumatologists should prescribe anifrolumab for patients, and if no local rheumatologist is available, another health care specialist may administer the drug after consulting a rheumatologist. An infusion centre is an appropriate setting for administering anifrolumab. Although no diagnostic test is required, a confirmed SLE diagnosis meeting the criteria outlined previously would be needed to permit treatment with anifrolumab.
Additional Considerations
The clinical expert indicated that there is a considerable need for new medications to decrease the side effects of current therapies, and the dependence on prednisone in particular. Prednisone not only has significant side effects, such as osteonecrosis, vertebral collapse, and cataracts, but significant psychological side effects that can affect all facets of life.
Clinician Group Input
Twenty clinicians representing the following 2 clinician groups provided input for this review: CaNIOS and the Toronto Lupus Program at the University of Toronto.
CaNIOS is a not-for-profit, group of Canadian clinicians and researchers in Ontario, Alberta, Manitoba, and Nova Scotia. Their overarching mission statement is to facilitate the care of Canadian lupus patients and to improve the outcome of lupus patients across Canada through collaborative research. CaNIOS members provide care for more than 4,000 SLE patients collectively.
The Toronto Lupus Program is lupus clinic that promotes expert care for patients with lupus, trains future rheumatologists, and facilitates research into the disease. More than 1,300 patients are registered in the lupus clinic, making it 1 of the largest centres for specialized lupus care and research internationally. Patients are referred to the clinic from all areas of Ontario.
Unmet Needs
According to clinician groups, existing standard-of-care treatment has failed to adequately control SLE disease activity. Patients with SLE have a higher mortality rate, particularly in the first 3 decades after diagnosis. SLE has a profound effect on HRQoL and is a significant cause of loss of work productivity, sick leave, and physical disability. SLE and its treatment, particularly steroids, lead to significant irreversible damage in multiple organs. The immunosuppressive drugs currently in use frequently fail to induce a complete remission or do so only after prolonged exposure. Recurrent flares are common and result in significant organ damage over the total disease duration, requiring prolonged use of immunosuppressive drugs. Newer medications that help induce remission more quickly and prevent flares are urgently needed.
SLE is associated with onerous health care costs, and no immunosuppressive treatments are currently available through special access programs. Current SLE treatment continues to rely heavily on steroids, which are major drivers of organ damage, increasing the burden on the health care system. Almost 80% of lupus patients exhibit a relapsing-remitting or persistent active disease course requiring large and chronic doses of steroids. Cohort studies have clearly demonstrated the failure of the current standard-of-care treatment to maintain remission in SLE patients. Often remission is induced by steroids and fails upon tapering the steroid dose. Aggressive use of steroids, along with the currently available immunosuppressants (methotrexate, azathioprine, cyclosporin, and mycophenolate mofetil), have been associated with recurrent infections in SLE patients, requiring multiple hospital admissions and imposing a significant health care burden. The lack of effective treatment has also been the culprit for multiple hospital admissions in many patients with SLE.
Place in Therapy
Anifrolumab employs a mechanism of action that targets the interferon pathway, which is central in lupus pathogenesis. The active interferon pathway characterizes 60% to 80% of patients with SLE. According to the clinician groups, anifrolumab is expected to cause a shift in the current treatment paradigm as its unique mechanism of action renders it most suitable for patients with unmet needs, including the subpopulation of patients with serologically active disease, frequent flares, and “steroid dependence.” The goal of treatment with anifrolumab should be the reduction of the daily prednisone dosage to below 7.5 mg/day in the first 12 months of treatment or a reduction by 50% of the initial (baseline) dose.
Based on current knowledge, anifrolumab should be used as an add-on treatment in combination with pre-existing drugs, antimalarials, glucocorticoids, and immunosuppressives. Specifically, it should be used in refractory cases in which treatment goals have not been achieved in a reasonable time. Clinician groups agree that it is reasonable to expect a meaningful impact on disease activity with anifrolumab for multiple organ systems, not just musculoskeletal and mucocutaneous systems. When a combination of antimalarials, low-dose glucocorticoids, and immunosuppressive therapy is not effective, or other factors (e.g., intolerance) are prohibitive, anifrolumab should be offered.
Patient Population
SLE affects more than 1 in every 1,000 Canadians, primarily women of childbearing age (the female-to-male patient ratio is 9:1), typically presenting between the ages of 14 and 45 years. People of different ethnicities can develop SLE but those of African descent and Hispanic and Indigenous populations are affected much more often compared with their white counterparts.
According to CaNIOS, patients with the greatest unmet need are those who have not reached remission within 3 to 6 months of initiating standard of care; patients dependent on steroids (e.g., those who cannot withdraw or reduce their daily prednisone dose to below 7.5 mg/day); patients who experience frequent flares from any organ or system; and patients for whom adherence is a major factor in treatment failure. These patients represent approximately 10% to 20% of the general SLE population. A significant proportion of such refractory patients can be expected to respond in the first 12 months. Patients who experience frequent flares (> 1 per year for more than 2 or 3 years) from any organ or system are the most likely to have an activated “interferon signature” as demonstrated by recent studies. In such patients, CaNIOS would recommend anifrolumab as an add-on to existing therapies with the goal of reducing the frequency and intensity of flares and optimize prognoses.
Patients best suited for treatment with anifrolumab include those intolerant to standard-of-care medication or who have failed this therapy, those who experience frequent flares from any organ system, and patients who are steroid-dependent. For patients without private access, there are currently no available options after treatment failure. Steroid-dependent patients will also incur significant costs to the health system. Anifrolumab should become available to such patients through public access. This is not a significant departure from current practice but addresses the management of patients who are refractory to current therapies. There should be an opportunity to treat patients with frequent flares or steroid dependency in a subsequent line of therapy.
Patients who are least suitable are sustained in remission under antimalarials alone or in combination with immunosuppressives and low-dose prednisone (< 7.5 mg/day) Patients may be identified by a physician with SLE expertise and assessed before receiving anifrolumab. SLE diagnosis can be challenging and may evade detection for years in cases that are nonspecific or involve spontaneously remitting symptoms. Most required diagnostic tests are available in Canada through hospital- or community-based laboratories. Underdiagnosis may occur, particularly in mild cases. Patients may be diagnosed using clinical as well as laboratory criteria. Serologic activity (increased anti–double-stranded DNA [anti-dsDNA] and/or decreased complement C3 and/or C4 proteins) can be assessed in most hospital- and community-based labs, and these tests are widely available in Canada.
Assessing Response to Treatment
According to the clinician groups, the outcomes used to determine response to treatment in academic centres are similar to those used in most clinical trials. These include structured indices such as the SLEDAI-2K and the British Isles Lupus Assessment Group (BILAG). Both indices assess a variety of manifestations from various organs and systems as well as laboratory parameters relevant to lupus activity. Other measures include the PGA, which relies on the physician’s impression as expressed on a standardized scale. Other outcomes include the decrease in the daily prednisone dose and the delay in damage accumulation, as well as the normalization of serologic activity.
A clinically meaningful response to treatment should include any of the following: reduction in the severity and frequency of symptoms (disease activity) as reflected by a SLEDAI-2K and/or BILAG score, reduction of the daily prednisone dosage to less than 7.5 mg/day, and a reduction of the frequency and intensity of flares.
These outcomes will lead to a significant improvement of the patients’ prognosis. Response to treatment should be assessed every 4 months. Sufficient time for outcomes to be observed would be at least 12 months.
Discontinuing Treatment
Treatment should be discontinued immediately in cases of allergy and/or intolerance and after 12 months if no response is demonstrated, if the daily prednisone dose exceeds 7.5 mg (or more than 50% from baseline) in steroid-dependent patients, and if severe flares requiring treatment escalation (particularly with glucocorticoids and/or immunosuppressives) continue to occur in patients with frequent flares.
Prescribing Conditions
Hospital and specialty infusion clinics with experience in the IV administration of biologic drugs are the most appropriate settings for anifrolumab infusion. Physicians with expertise in the management and treatment of patients with SLE would be required to monitor patients treated with anifrolumab.
Additional Considerations
The ideal treatment would have a meaningful impact on overall survival by reducing disease activity, risk of subsequent flares, use of an OCS, risk of AEs, and long-term complications, while inducing remission (low disease activity), and improving QoL.
Drug Program Input
The drug programs provide input on each drug being reviewed through CADTH’s reimbursement review processes by identifying issues that may affect their ability to implement a recommendation. The implementation questions and corresponding responses from the clinical experts consulted by CADTH are summarized in Table 4.
Table 4: Summary of Drug Plan Input and Clinical Expert Response
Drug program implementation questions | Clinical expert response |
|---|---|
Relevant comparators | |
Belimumab and rituximab could be considered comparators. However, belimumab was reviewed by CDEC, the recommendation was to not reimburse for SLE, this indication is off-label for rituximab, and access to rituximab is limited for SLE patients and reimbursed on case-by-case basis in some jurisdictions. | No response required. For CDEC consideration. |
Considerations for initiation of therapy | |
Is the subgroup from the sponsor’s reimbursement request (patients with moderate to severe SLE based on a SLEDAI-2K score ≥ 6) whose disease activity cannot be controlled despite an OCS dose of ≥ 10 mg/day of prednisone or its equivalent the subgroup with the highest unmet need? | Patients with moderate to severe SLE (based on a SLEDAI-2K score ≥ 6) whose disease cannot be controlled despite an OCS dose of ≥ 10 mg/day of prednisone or its equivalent is the subgroup of patients with the highest unmet need. |
How is standard therapy defined? | Standard therapy includes the use of antimalarial drugs (discontinuation after toxicity), an OCS (namely, prednisone), and immunosuppressants (at least until failure of at least 1). |
Could patients with lupus nephritis and neuropsychiatric lupus benefit be considered for therapy although they were excluded from the trials? | This population should be studied as further research is needed. |
Considerations for continuation or renewal of therapy | |
How would continued response to the therapy be assessed and how often? | If a response is seen after 1 year, a 2-year renewal with assessment every 3 to 4 months would be appropriate. |
Considerations for discontinuation of therapy | |
How is refractory disease defined? What parameters should be taken into consideration? | The following would be considered treatment failure or refractory disease:
|
Considerations for prescribing of therapy | |
Anifrolumab must be infused over 30 minutes, every 4 weeks, in an appropriate setting. Patients will need access and the ability to travel. | For CDEC consideration. The sponsor indicated that there will be a patient support program to support infusions. |
Should anifrolumab be prescribed by a rheumatologist or other specialist? Is there limited access to these specialists in some regions? | Only rheumatologists should be prescribing anifrolumab, even in areas that may be remote. Virtual appointments are acceptable for areas where geographic location is an issue. An internist should not prescribe without consulting a rheumatologist. The only alternative in the absence of a rheumatologist would be physicians with extensive experience with SLE. |
Could anifrolumab be prescribed alongside belimumab and rituximab? Should that be restricted in the criteria? | No biologics should be used in combination with another. However, it may be possible to follow up with a different biologic if a patient fails treatment with one of these medications. |
Generalizability | |
Pediatrics, and patients with lupus nephritis and neuropsychiatric lupus were excluded from the trial. Could pediatrics, and patients with lupus nephritis and neuropsychiatric lupus considered eligible for treatment? | For pediatric patients, anifrolumab could be used under the same circumstances as patients with adult-onset SLE. For severe, active cases of lupus nephritis or lupus with CNS complications, if anifrolumab is administered, it must be done in addition to standard of care and only in patients who have not responded or who are prednisone-dependent. |
Care provision issues | |
There is an increased chance of infections that will need treatment. | No response required. For CDEC consideration. |
Vaccinations are required before initiating therapy due to immune suppressive action. | No response required. For CDEC consideration. |
System and economic issues | |
Anifrolumab requires infusion in a health care setting. Locations and travel may not be the same in each province. | No response required. For CDEC consideration. |
CDEC = CADTH Canadian Drug Expert Committee; CNS = central nervous system; OCS = oral corticosteroids; SLE = systemic lupus erythematosus; SLEDAI-2K = Systemic Lupus Erythematosus Disease Activity Index 2000.
Clinical Evidence
The clinical evidence included in the review of anifrolumab is presented in 2 sections. The first section, the systematic review, includes pivotal studies provided in the sponsor’s submission to CADTH and Health Canada, as well as those studies that were selected according to an a priori protocol. The second section includes sponsor-submitted LTE studies and additional relevant studies that were considered to address important gaps in the evidence included in the systematic review.
Systematic Review (Pivotal and Protocol-Selected Studies)
Objectives
To perform a systematic review of the beneficial and harmful effects of anifrolumab 300 mg, administered as an IV infusion, in addition to standard therapy for the treatment of adult patients with active, autoantibody-positive SLE.
Methods
Studies selected for inclusion in the systematic review included pivotal studies provided in the sponsor’s submission to CADTH and Health Canada, as well as those meeting the selection criteria presented in Table 5. Outcomes included in the CADTH review protocol reflect those considered to be important to patients, clinicians, and drug plans.
Table 5: Inclusion Criteria for the Systematic Review
Criteria | Description |
|---|---|
Population | Adult patients with active, autoantibody-positive SLE Subgroups:
|
Intervention | Anifrolumab 300 mg, administered via IV infusion over a 30-minute period, every 4 weeks. |
Comparator | Standard treatment, including the following treatments as monotherapy or in combination:
|
Outcomes | Efficacy outcomes:
Harms outcomes: AEs, SAEs, WDAEs, notable harms such as hypersensitivity reactions, serious infection (e.g., pneumonia), herpes zoster, psychiatric issues (e.g., serious depression, suicidal ideation/behaviour), malignancy, serious infusion-related reactions |
Study designs | Published and unpublished phase III and IV randomized controlled trials |
AE = adverse event; BICLA = British Isles Lupus Assessment Group-based Composite Lupus Assessment; BILAG = British Isles Lupus Assessment Group; BILAG-2004 = British Isles Lupus Assessment Group 2004; CLASI = Cutaneous Lupus Erythematosus Disease Area and Severity Index; HRQoL = health-related quality of life; OCS = oral corticosteroid; SAE = serious adverse event; SELENA = Safety of Estrogens in Lupus Erythematosus National Assessment; SLE = systemic lupus erythematosus; SLEDAI = Systemic Lupus Erythematosus Disease Activity Index; SLEDAI-2K = Systemic Lupus Erythematosus Disease Activity Index 2000; SRI = Systemic Lupus Erythematosus Responder Index; WDAE = withdrawal due to adverse event.
aThese outcomes were identified as being of particular importance to patients in the input received by CADTH from patient groups.
The literature search was performed by an information specialist using a peer-reviewed search strategy. The literature search for clinical studies was performed by an information specialist using a peer-reviewed search strategy according to the PRESS Peer Review of Electronic Search Strategies checklist.17
Published literature was identified by searching the following bibliographic databases: MEDLINE All (1946—) via Ovid and Embase (1974—) via Ovid. All Ovid searches were run simultaneously as a multifile search. Duplicates were removed using Ovid deduplication for multifile searches, followed by manual deduplication in EndNote. The search strategy comprised both controlled vocabulary, such as the National Library of Medicine’s MeSH (Medical Patient Headings), and keywords. The main search concept was Saphnelo (anifrolumab). Clinical trials registries searched included the US National Institutes of Health’s clinicaltrials.gov, WHO’s International Clinical Trials Registry Platform (ICTRP) search portal, Health Canada’s Clinical Trials Database, and the European Union Clinical Trials Register.
No filters were applied to limit the retrieval by study type. Retrieval was not limited by publication date or by language. Conference abstracts were excluded from the search results. Appendix 1 provides detailed search strategies.
The initial search was completed on March 1, 2022. Regular alerts updated the search until the meeting of the CADTH Canadian Drug Expert Committee on June 22, 2022.
Grey literature (literature that is not commercially published) was identified by searching relevant websites from the Grey Matters: A Practical Tool For Searching Health-Related Grey Literature checklist.18 Included in this search were the websites of regulatory agencies (US FDA and European Medicines Agency). Google was used to search for additional internet-based materials. Appendix 1 provides more information on the grey literature search strategy.
In addition, the sponsor of the drug was contacted for information regarding unpublished studies.
Two CADTH clinical reviewers independently selected studies for inclusion in the review based on titles and abstracts, according to the predetermined protocol. Full-text articles of all citations considered potentially relevant by at least 1 reviewer were acquired. Reviewers independently made the final selection of studies to be included in the review, and differences were resolved through discussion.
Findings from the Literature
Two reports were identified from the literature for inclusion in the systematic review (Figure 1). The included studies are summarized in Table 6. A list of excluded studies is presented in Appendix 2.
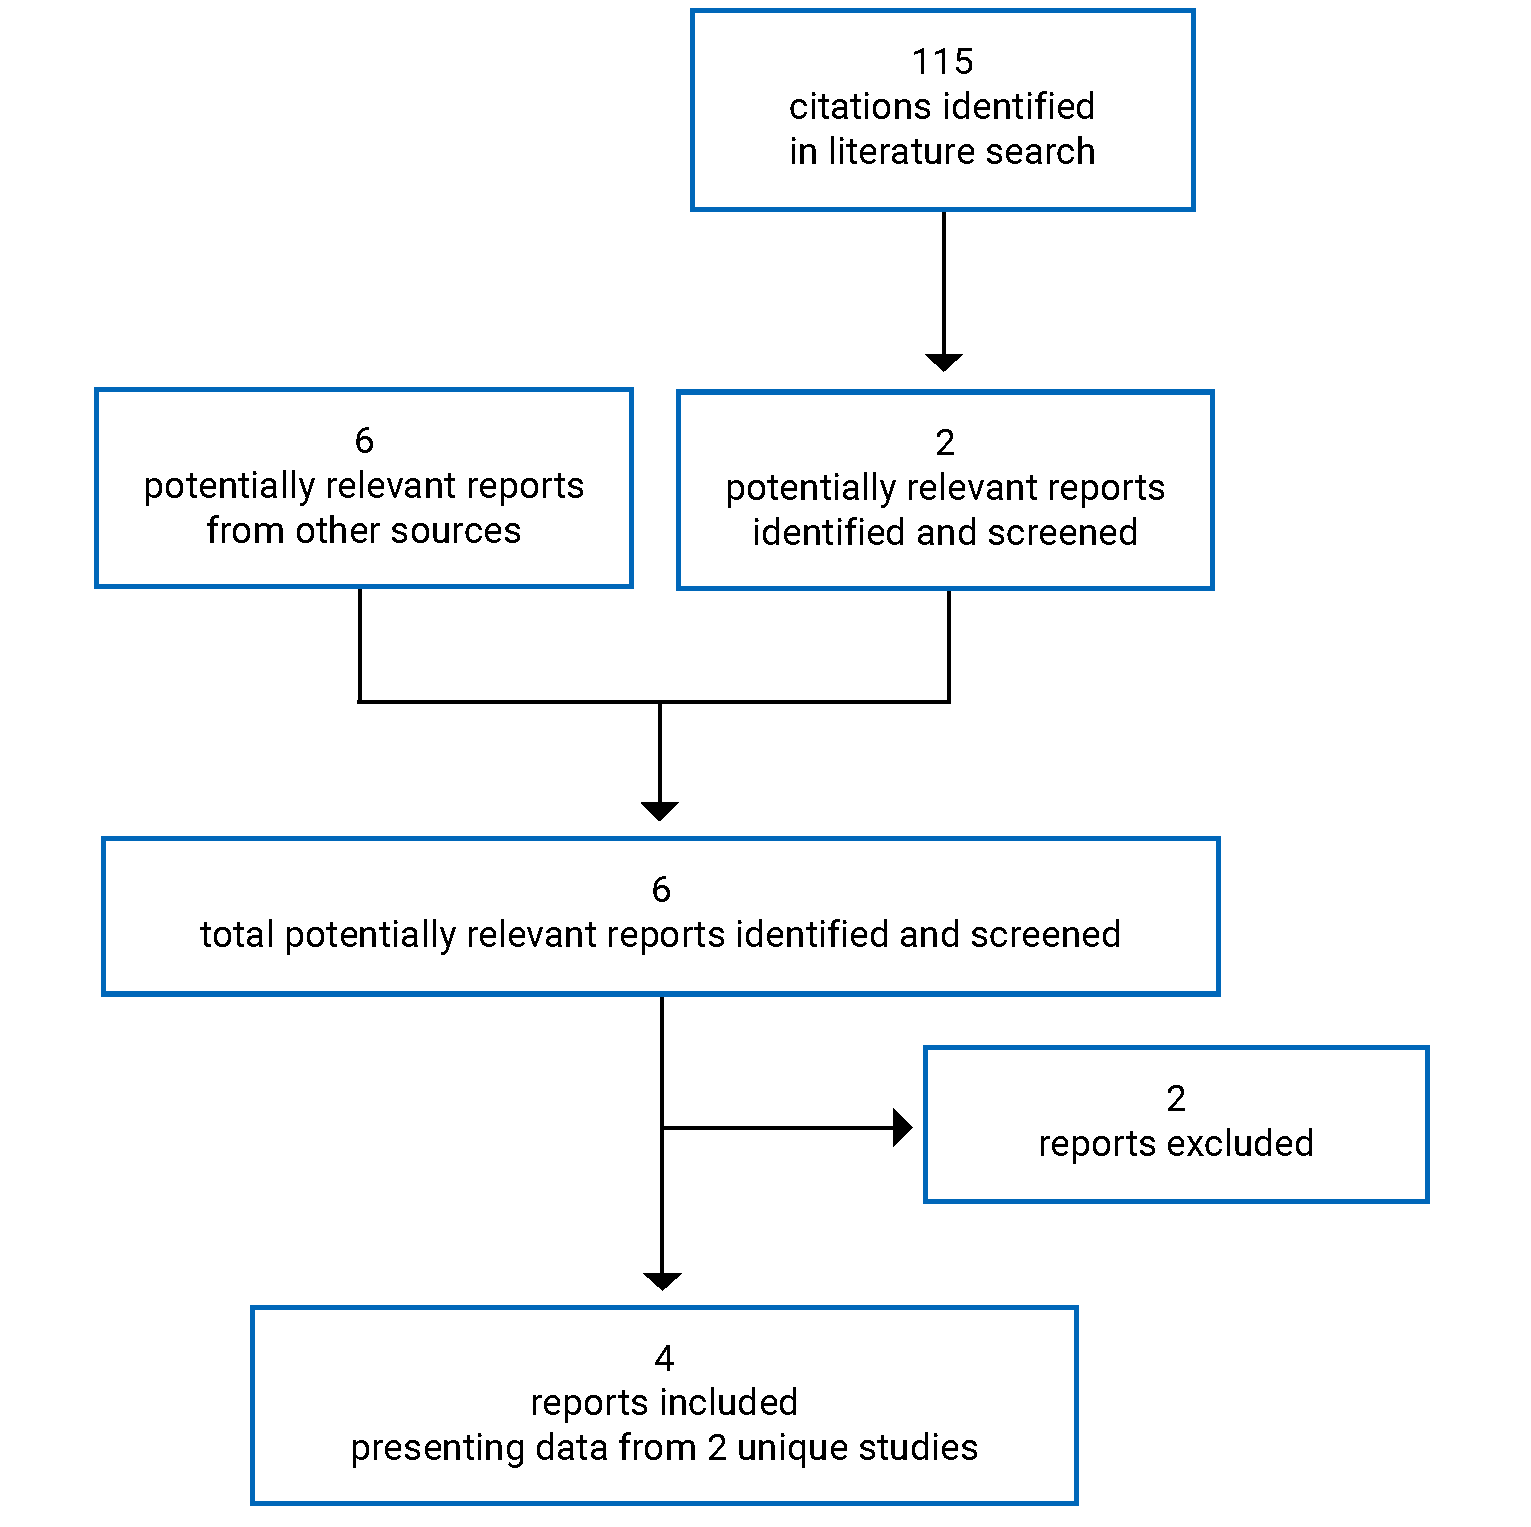
Table 6: Details of Included Studies
Study detail | TULIP-1 | TULIP2 |
|---|---|---|
Designs and populations | ||
Study design | Double-blind, randomized controlled trial | Double-blind, randomized controlled trial |
Locations | 123 sites in 18 countries (e.g., US, UK, Germany, Australia, New Zealand) | 119 sites in 16 countries (e.g., Canada, US, Europe, South Africa) |
Patient enrolment dates | June 9, 2015, to June 16, 2017 | July 9, 2015, to September 27, 2018 |
Randomized (N) | 457 | 365 |
Inclusion criteria |
|
|
Exclusion criteria |
SLE and other diseases:
Concomitant medications:
|
SLE and other diseases:
Concomitant medications:
|
Drugs | ||
Intervention | Anifrolumab 300 mg in addition to standard therapya; IV administration every 4 weeks from week 0 to week 48 for a total of 13 doses. Anifrolumab 150 mgb; IV administration every 4 weeks from week 0 to week 48 for a total of 13 doses | Anifrolumab 300 mg in addition to standard therapya; IV administration every 4 weeks from week 0 to week 48 for a total of 13 doses |
Comparator(s) | Placebo; IV administration every 4 weeks from week 0 to week 48 for a total of 13 doses | Placebo; IV administration every 4 weeks from week 0 to week 48 for a total of 13 doses |
Duration | ||
Phase | ||
Screening | Up to 30 days | Up to 30 days |
Double-blind | 52 weeks | 52 weeks |
Follow-up | 12-week safety follow-up after last dose of study treatment | 12-week safety follow-up after last dose of study treatment |
Outcomes | ||
Primary end point | Number of patients who achieved a SRI-4 at week 52 | Number of patients who achieved a BICLA response at week 52 |
Secondary and exploratory end points | Key secondary:
Other secondary:
Safety: Vital signs, physical examination, 12-lead ECG, hematology, clinical chemistry, urinalysis, Cushingoid features, C-SSRS, PHQ-8, modified SELENA Flare Index–based flares, and AEs (including AESIs). | Key secondary:
Other secondary:
Safety: Adverse events (including AESIs), vital signs, physical examination, 12-lead electrocardiograms, flares as defined by a modification of the SELENA Flare Index using the SLEDAI-2K, clinical laboratory tests (hematology, clinical chemistry, urinalysis), C-SSRS, and PHQ-8 |
Notes | ||
Publications | Furie et al. (2019)19 | Morand et al. (2020)20 |
ACR = American College of Rheumatology; AE = adverse event; AESI = adverse event of special interest; ALT = alanine transaminase; AST = aspartate transaminase; BICLA = British Isles Lupus Assessment Group-based Composite Lupus Assessment; BILAG-2004 = British Isles Lupus Assessment Group 2004; CLASI = Cutaneous Lupus Erythematosus Disease Area and Severity Index; C-SSRS = Columbia Suicide Severity Rating Scale; CIS = carcinoma in situ; ECG = electrocardiogram; EQ-5D-5L = 5-Level EQ-5D; FACIT-F = Functional Assessment of Chronic Illness Therapy–Fatigue; HRQoL = health-related quality of life; ICF = informed consent form; IM = intramuscular; LLDAS = lupus low disease activity state; MCR = major clinical response; NRS = numerical rating scale; NSAID = nonsteroidal anti-inflammatory drug; OCS = oral corticosteroid; PCR = partial clinical response; PGA = Physician’s Global Assessment; PHQ-8 = 8-item Patient Health Questionnaire; PtGA = Patient Global Assessment; PRO = patient-reported outcome; QoL = quality of life; SC = subcutaneous; SDI = Systemic Lupus International Collaborating Clinics/American College of Rheumatology Damage Index; SELENA = Safety of Estrogens in Lupus Erythematosus National Assessment; SF-36v2 = Short Form (36) Health Survey Version 2; SLE = systemic lupus erythematosus; SLEDAI-2K = Systemic Lupus Erythematosus Disease Activity Index 2000; SOC = standard of care; SRI = Systemic Lupus Erythematosus Responder Index; ULN = upper limit of normal; VAS = visual analogue scale; WPAI-Lupus = Work Productivity and Activity Impairment–Lupus.
aStandard therapy included either 1 or any combination of OCS, antimalarials, and/or immunosuppressants at baseline, with the exception of OCS (prednisone or equivalent) where tapering was part of the protocol.
bPatients receiving anifrolumab 150mg were not included in the evaluation of this CADTH review.
Source: Clinical Study Reports.9,10
Description of Studies
Two sponsor-submitted trials, TULIP-1 and TULIP-2, were included in this review. The TULIP-1 trial (123 sites in 18 countries) and the TULIP-2 trial (119 sites in 16 countries) are phase III, multicentre, randomized, double-blind, placebo-controlled studies evaluating the efficacy and safety of anifrolumab in adult patients (aged 18 to 70 years) with moderate to severe autoantibody-positive SLE while receiving standard-of-care treatment. Patients in both trials had severe to moderate disease, with a SLEDAI-2K score of 6 points or more; severe disease activity in 1 or more organs or moderate activity in 2 or more organs as measured by BILAG-2004 organ domain scores of 1 or more A items or 2 or more B items; and a PGA score of 1 or more. Patients continued to receive their existing SLE therapy, consisting of either 1 or any combination of OCSs, antimalarials, and/or immunosuppressants at baseline, with the exception of an OCS (prednisone or equivalent) with tapering as part of the protocol. The primary objective was to evaluate the effect of anifrolumab 300 mg compared to placebo on disease activity as measured by the difference in the proportion of patients who achieve an SRI-4 at week 52 for TULIP-1 or BICLA response at week 52 in TULIP-2. In the TULIP-1 trial, the key secondary objectives were to evaluate the effect of anifrolumab 300 mg compared to placebo on the following:
the proportion of patients with SRI-4 at week 52 in the type I interferon gene signature test high subgroup
the proportion of patients who achieved an OCS dosage of no more than 7.5 mg/day at week 40, which was maintained through week 52 in the subgroup of patients with baseline OCS dosage of 10 mg/day or higher
the proportion of patients with a 50% or greater reduction in CLASI activity score at week 12 in the subgroup of patients with baseline CLASI activity score of 10 or higher (moderate to severe disease)
the proportion of patients with SRI-4 at week 24
the annualized flare rate through 52 weeks.
The key secondary objectives in the TULIP-2 trial were the same as TULIP-1, with the addition of following objectives:
the proportion of patients with a BICLA response at week 52 in the type I interferon gene signature test high subgroup
the proportion of patients with a 50% or greater reduction in joint counts at week 52 in the subgroup of patients with at least 6 swollen and at least 6 tender joints at baseline.
The switching of the primary end point was based on the TULIP-1 and MUSE study results, which demonstrated that the BICLA had produced consistent results across time. This switch took place after data collection for the TULIP-2 trial was completed but before the unblinding of the results at week 52. Other major reasons for this switch included the ability of the BICLA to capture both partial and complete improvements; its required improvement in all organ systems affected at baseline; and equal weighting applied to all organs in its scoring.
While there was some variance between trials in terms of the participating countries, the majority of sites in both trials were based in the US and Europe, with no Canadian sites in the TULIP-1 trial and 2 Canadian sites in the TULIP-2 trial. Enrolment took place June 9, 2015, to June 16, 2017, for the TULIP-1 trial and July 9, 2015, to September 27, 2018, for the TULIP-2 trial. Both trials included a screening period of up to 30 days to confirm eligibility of patients and a 52-week double-blind treatment period. At week 52, patients either continued the study for another 8 weeks to complete a 12-week safety follow-up after the last dose of the investigational product (given at week 48) or, if eligible, enrolled in a separate LTE study (described in the Other Relevant Evidence section). The total study duration could be up to approximately 64 weeks (including screening period) for patients who did not enrol in the LTE study and up to approximately 56 weeks (including screening period) for those patients who enrolled in the LTE study.
A total of 457 eligible patients in the TULIP-1 trial were block-randomized in a 1:2:2 ratio to receive a fixed IV dose of 150 mg anifrolumab (N = 92), 300 mg anifrolumab (N = 180), or placebo (N = 184). This CADTH review focuses only on the 300 mg anifrolumab and placebo groups, as the 150 mg anifrolumab dose was not part of the requested reimbursement criteria to CADTH and not approved in the Health Canada Notice of Compliance and is therefore beyond the scope of this review. A total of 365 eligible patients in the TULIP-2 trial were block-randomized in a 1:1 ratio to receive a fixed IV dose of anifrolumab 300 mg (N = 180) or placebo (N = 182). Patients in both trials were stratified by disease severity (SLEDAI-2K score < 10 points versus ≥ 10 points), OCS dose at baseline (< 10 mg/day versus ≥ 10 mg/day prednisone or equivalent), and results of the type I interferon gene signature test (high versus low).
Patients in both trials received the investigational product every 4 weeks for a total of 13 doses (week 0 to week 48), with the primary end point evaluated at the week 52 visit (Figure 2 and Figure 3 depict study designs of the TULIP-1 and TULIP-1 studies, respectively). At the time of randomization, patients were taking either 1 or any combination of an OCS, antimalarial, and/or immunosuppressant. From week 0 (day 1) to week 12, patients were permitted only 1 burst of corticosteroids for an increase in SLE disease activity or to control non–SLE-related disease (e.g., asthma). Patients receiving more than 1 burst during the first 12 weeks of treatment were considered nonresponders for subsequent assessments of disease activity, regardless of the reason for the burst (SLE or non-SLE activity). Patients treated with concomitant medications beyond the protocol-allowed threshold (restricted medications) or who prematurely discontinued the investigational product were also considered nonresponders for any binary efficacy outcomes. Steroid tapering to a target OCS dose of no more than 7.5 mg/day was required to be attempted in all patients with a baseline OCS dose of 10 mg/day or higher. This commenced at week 8 and continued stepwise until the target dose was reached, except in the event of disease worsening as defined by changes to the SLEDAI-2K, CLASI, and number of active and/or swollen joints. Tapering the OCS dose beyond the target of 7.5 mg/day up to week 40 was permitted based on disease activity. Steroid tapering was not permitted after week 40.
The study was unblinded upon database lock after the last patient last visit. The analyses included all data captured during the study, regardless of whether the study treatment was prematurely discontinued, or delayed, and/or irrespective of protocol adherence. In both trials, the database lock occurred when the last patient reached the week-52 visit, at which point all available data were extracted, cleaned, coded, validated, and unblinded. Both trials were sponsored by AstraZeneca Inc.
Figure 2: Flow Chart of TULIP-1 Study Design
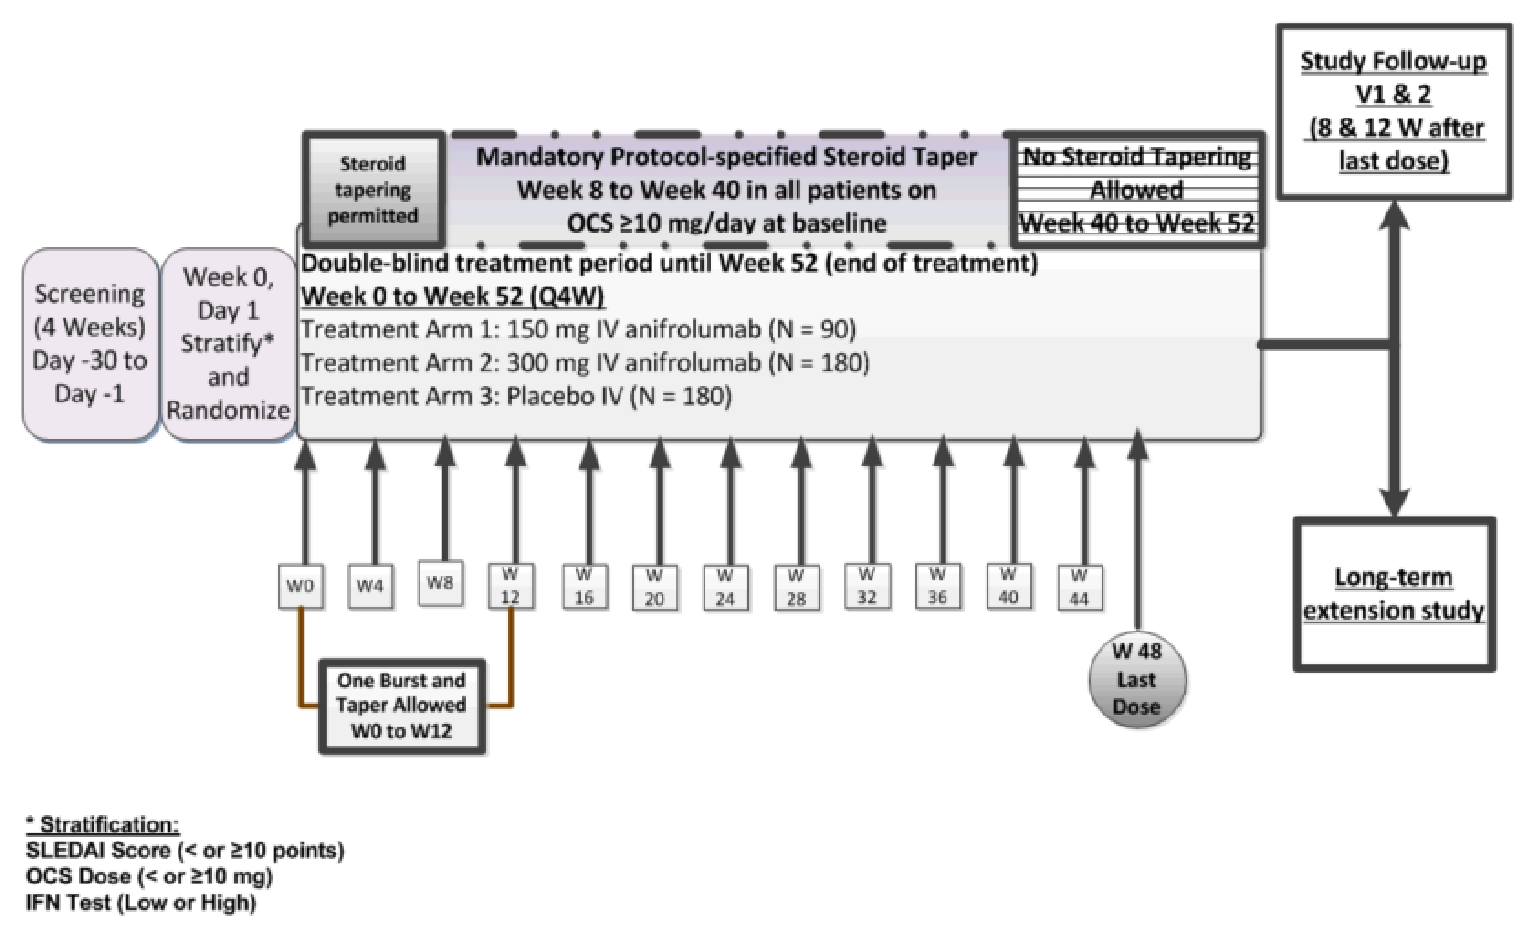
OCS = oral corticosteroids; IFN = interferon; Q4W = every 4 weeks; SLEDAI = Systemic Lupus Erythematosus Disease Activity Index; W = week.
TULIP-1 trial included a screening period of up to 30 days to confirm eligibility of patients, after which patients were randomized in to receive either a fixed IV dose of 150 mg anifrolumab, 300 mg anifrolumab, or placebo. The double-blind treatment period was 52-week. At week 52, patients either continued the study for another 8 weeks to complete a 12-week safety follow-up after the last dose of the investigational product (given at week 48) or, if eligible, enrolled in a separate LTE study. The total study duration could be up to approximately 64 weeks (including screening period) for patients who did not enroll in the LTE study and up to approximately 56 weeks (including screening period) for those patients who enrolled in the LTE study.
Figure 3: Flow Chart of TULIP-2 Study Design
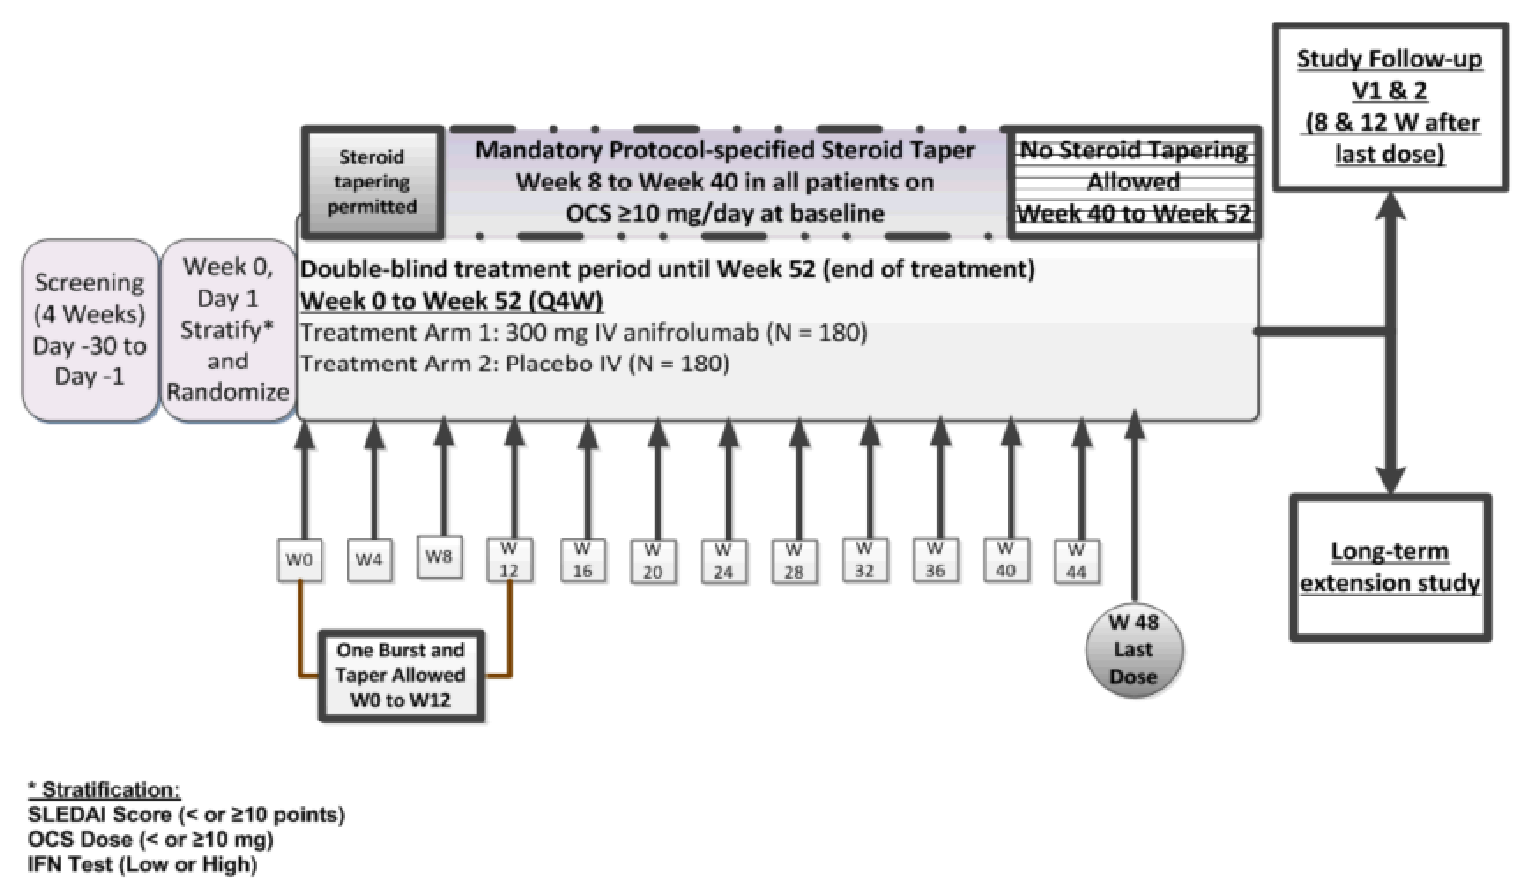
OCS = oral corticosteroids; IFN = interferon; Q4W = every 4 weeks; SLEDAI = Systemic Lupus Erythematosus Disease Activity Index; W = week.
TULIP-2 trial included a screening period of up to 30 days to confirm eligibility of patients, after which patients were randomized in to receive a fixed IV dose of 300 mg anifrolumab or placebo. The double-blind treatment period was 52-week. At week 52, patients either continued the study for another 8 weeks to complete a 12-week safety follow-up after the last dose of the investigational product (given at week 48) or, if eligible, enrolled in a separate LTE study. The total study duration could be up to approximately 64 weeks (including screening period) for patients who did not enroll in the LTE study and up to approximately 56 weeks (including screening period) for those patients who enrolled in the LTE study.
Amendments and Protocol Deviations
The study protocol of the TULIP-1 trial was amended 3 times and the TULIP-2 trial was amended 5 times after start of patient recruitment.
TULIP-1 amendments included:
Amendment 1 (April 9, 2015) — no substantial changes made
Amendment 2 (February 1, 2016) — the addition of HIV testing at screening
Amendment 3 (March 23, 2016) — updates to restricted medications washout periods to provide additional clarification; the washout periods for anakinra, apremilast, atacicept, belimumab, and blisibimod (AMG 623) were corrected; the order of restricted medications was made alphabetical
Amendment 4 (May 18, 2016) — clarification to the study design and the inclusion and exclusion criteria from Amendments 2 and 3 that were not incorporated.
TULIP-2 amendments included:
Amendment 5 (May 23, 2019) — BICLA response at week 52 replaced SRI-4 as the primary end point and 2 key secondary end points were updated: SRI-4 response at week 52 in the interferon-test high only subpopulation was replaced with the BICLA response; and SRI-4 at week 24 was replaced with an organ-specific assessment of joints. In addition, the statistical methodology regarding analysis of the primary and key secondary end points, the testing strategy, and power estimation were updated. The reason for the amendments were to better measure the efficacy of anifrolumab and inform clinicians about the specific effect of anifrolumab on joint disease. The use of prescription and nonprescription NSAIDs in the Japanese population was clarified and the modified BILAG-2004 disease activity scoring was added.
Two sites were closed over the course of both trials (1 site per trial) due to noncompliance with protocol procedures and specifications (i.e., blinding plan). Data from these sites were not included in analyses or summaries.
Populations
Inclusion and Exclusion Criteria
Key inclusions and exclusion criteria are listed in Table 6. The inclusion and exclusion criteria for the TULIP-1 and TULIP-2 trials were the same. Patients in both trials were 18 years of age or older, had severe to moderate disease, with a SLEDAI-2K score of 6 points or more; severe disease activity in 1 or more organs or moderate activity in 2 or more organs as measured by BILAG-2004 organ domain scores of 1 or more A items or 2 or more B items; and a PGA score of 1 or more. Patients continued to receive their existing SLE therapy, consisting of either 1 or any combination of OCS, antimalarials, and/or immunosuppressants at baseline, with the exception of OCS (prednisone or equivalent) for which tapering was part of the protocol.
Baseline Characteristics
Key demographic and disease baseline characteristics are presented in Table 7 for both trials. Baseline patient characteristics, including age, race, sex, height, weight, and body mass index were balanced between groups and were similar between the 2 studies. The TULIP-1 and TULIP-2 trials had median ages of 41 and 43 years, respectively, and were predominantly female (92.3% and 93.4%) and white (71.3% and 59.9%). The TULIP-2 trial had a greater percentage of Asian patients (60 of 362 [16.6%] versus 16 of 384 [4.4%]) and more missing data on race (4.4%) compared to the TULIP-1 trial (0). The proportion of patients aged older than 65 years was 6.1% in the anifrolumab 300 mg group, and 3.3% in the placebo group in the TULIP-1 trial, and 2.8% and 0.5% in the treatment and placebo groups of the TULIP-2 trial, respectively. In both trials, the largest proportions of patients were enrolled in the US (40.7% in the TULIP-1 trial and 36.5% in TULIP-2) and Europe (37.9% in the TULIP-1 trial and 26.8% in TULIP-2). In the TULIP-1 trial there were no Canadian sites, but in the TULIP-2 trial, 2 Canadian sites were added. Within each geographic region, the proportions of patients were generally balanced across treatment groups. The majority of patients had a high results on a type I interferon gene test (approximately 82% across groups and studies).
SLE characteristics (SLEDAI-2K, BILAG-2004, PGA scores, CLASI, and joint counts) were balanced between treatment groups and were similar between studies. The median time from initial SLE diagnosis to randomization was highest in patients in the treatment group of the TULIP-2 trial (mean = 130.2 months; SD = 109.28). Cushingoid features were higher in the TULIP-1 trial compared to TULIP-2 (39% versus 26%). There was a slightly higher number of patients with an OCS dose of 10 mg or higher at baseline in the TULIP-1 trial (56.3%) compared with the TULIP-2 trial (47%). Overall previous medication use at baseline was balanced between groups and between studies.
Table 7: Summary of Baseline Characteristics of Included Trials (Full Analysis Set)
Characteristic | TULIP1 | TULIP2 | ||
|---|---|---|---|---|
Anifrolumab 300 mg (N = 180) | Placebo (N = 184) | Anifrolumab 300 mg (N = 180) | Placebo (N = 182) | |
Age (years) | ||||
Mean | 42 | 41 | 43.1 | 41.1 |
SD | 11.99 | 12.30 | 11.95 | 11.47 |
Median | 40.5 | 41.0 | 44.0 | 42.0 |
Minimum | 18 | 18 | 18 | 19 |
Maximum | 68 | 69 | 69 | 66 |
Age subgroups, n (%) | ||||
< 18 | 0 | 0 | 0 | 0 |
≥ 18 to < 65 | 169 (93.9) | 178 (96.7) | 175 (97.2) | 181 (99.5) |
≥ 65 | 11 (6.1) | 6 (3.3) | 5 (2.8) | 1 (0.5) |
Sex n (%) | ||||
Female | 165 (91.7) | 171 (92.9) | 168 (93.3) | 170 (93.4) |
Male | 15 (8.3) | 13 (7.1) | 12 (6.7) | 12 (6.6) |
BMI (kg/m2), n (%) | ||||
≤ 28 | 98 (54.4) | 109 (59.2) | 107 (59.4) | 114 (62.6) |
> 28 | 82 (45.6) | 75 (40.8) | 73 (40.6) | 68 (37.4) |
Race, n (%) | ||||
White | 125 (69.4) | 137 (74.5) | 110 (61.1) | 107 (58.8) |
Black or African American | 29 (16.1) | 23 (12.5) | 17 (9.4) | 25 (13.7) |
Asian | 11 (6.1) | 5 (20.7) | 30 (16.7) | 30 (16.5) |
Native Hawaiian or other Pacific Islander | 0 | 0 | 0 | 0 |
American Indian or Alaska Native | 0 | 1 (0.5) | 4 (2.2) | 1 (0.5) |
Other | 15 (8.3) | 18 (9.8) | 11 (6.1) | 11 (6.0) |
Missing | NA | NA | 8 (4.4) | 8 (4.4) |
Ethnic group, n (%) | ||||
Hispanic or Latino | 32 (17.8) | 35 (19.0) | 54 (30.0) | 54 (29.7) |
Not Hispanic or Latino | 148 (82.2) | 149 (81.0) | 118 (65.6) | 120 (65.9) |
Missing | NA | NA | 8 (4.4) | 8 (4.4) |
Geographic region, n (%)a | ||||
Asia Pacific | 11 (6.1) | 6 (3.3) | 27 (15.0) | 26 (14.3) |
Europe | 64 (35.6) | 76 (41.3) | 51 (28.3) | 46 (25.3) |
Latin America | 24 (13.3) | 25 (13.6) | 35 (19.4) | 32 (17.6) |
US or Canada | 75 (41.7) | 72 (39.1) | 64 (35.6) | 68 (37.4) |
Rest of world | 6 (3.3) | 5 (2.7) | 3 (1.7) | 10 (5.5) |
Disease characteristics | ||||
SLEDAI-2K score at baseline | ||||
< 10 points n (%) | 55 (30.6) | 49 (26.6) | 51 (28.3) | 51 (28.0) |
≥ 10 points n (%) | 125 (69.4) | 135 (73.4) | 129 (71.7) | 131 (72.0) |
Mean (SD) | 11.3 (4.04) | 11.5 (3.50) | 11.4 (3.64) | 11.5 (3.88) |
Median (range) | 10.0 (4 to 32) | 10.5 (6 to 24) | 11.0 (6 to 25) | 10.0 (4 to 26) |
Clinical SLEDAI-2K score at baseline | ||||
Mean (SD) | 9.0 (2.93) | 8.9 (2.63) | 8.9 (2.94) | 8.9 (2.83) |
Median (range) | 8.0 (4 to 20) | 8.0 (4 to 18) | 8.0 (4 to 18) | 8.0 (4 to 18) |
Adjudication scoring (BILAG) at baseline | ||||
At least one A, n (%) | 93 (51.7) | 84 (45.7) | 81 (45.0) | 95 (52.2) |
No A and at least 2 Bs, n (%) | 79 (43.9) | 84 (45.7) | 91 (50.6) | 78 (42.9) |
No A and < 2 Bs, n (%) | 8 (4.4) | 16 (8.7) | 8 (4.4) | 9 (4.9) |
BILAG-2004 global score at baseline | ||||
Mean (SD) | 19.8 (6.28) | 18.9 (5.45) | 18.6 (4.72) | 19.0 (5.00) |
Median (range) | 18.0 (2 to 40) | 17.5 (4 to 33) | 17.0 (3 to 33) | 18.0 (9 to 33) |
PGA score at baseline | ||||
Mean (SD) | 1.87 (0.40) | 1.84 (0.38) | 1.68 (0.41) | 1.76 (0.40) |
Median (range) | 1.90 (1 to 2.7) | 1.90 (0.6 to 2.8) | 1.60 (0.8 to 2.8) | 1.70 (0.9 to 2.6) |
CLASI activity score at baseline | ||||
> 0, n (%) | 174 (96.7) | 178 (96.7) | 174 (96.7) | 170 (93.4) |
< 10, n (%) | 122 (67.8) | 130 (70.7) | 131 (72.8) | 142 (78.0) |
≥ 10, n (%) | 58 (32.2) | 54 (29.3) | 49 (27.2) | 40 (22.0) |
Mean (SD) | 8.5 (7.26) | 8.1 (6.66) | 8.3 (7.94) | 7.6 (7.75) |
Median (range) | 6.0 (0 to 41) | 6.0 (0 to 35) | 6.0 (0 to 51) | 5.5 (0 to 52) |
CLASI damage score at baseline | ||||
> 0, n (%) | 63 (35.0) | 64 (34.8) | 57 (31.7) | 63 (34.6) |
< 10, n (%) | 169 (93.9) | 176 (95.7) | 164 (91.1) | 174 (95.6) |
≥ 10, n (%) | 11 (6.1) | 8 (4.3) | 16 (8.9) | 8 (4.4) |
Mean (SD) | 2.0 (4.38) | 1.8 (4.08) | 2.3 (5.34) | 2.0 (4.63) |
Median (range) | 0 (0 to 30) | 0 (0 to 35) | 0.0 (0 to 29) | 0.0 (0 to 33) |
Joints at baseline | ||||
Swollen joints | ||||
> 0, n (%) | 164 (91.1) | 170 (92.4) | 160 (88.9) | 164 (90.1) |
Mean (SD) | 7.4 (5.79) | 7.0 (4.80) | 6.2 (5.65) | 7.4 (6.55) |
Median (range) | 6.0 (0 to 25) | 6.0 (0 to 23) | 5.0 (0 to 28) | 6.0 (0 to 28) |
Tender joints | ||||
0, n (%) | 11 (6.1) | 8 (4.3) | 12 (6.7) | 10 (5.5) |
> 0, n (%) | 169 (93.9) | 176 (95.7) | 168 (93.3) | 172 (94.5) |
Mean (SD) | 11.7 (7.50) | 10.6 (7.17) | 9.0 (7.07) | 11.0 (7.89) |
Median (range) | 10.5 (0 to 28) | 10.0 (0 to 28) | 7.0 (0 to 28) | 10.0 (0 to 28) |
Active jointsb | ||||
0, n (%) | 18 (10.0) | 15 (8.2) | 22 (12.2) | 19 (10.4) |
> 0, n (%) | 162 (90.0) | 169 (91.8) | 158 (87.8) | 163 (89.6) |
Mean (SD) | 7.1 (5.74) | 6.3 (4.49) | 5.7 (5.58) | 7.1 (6.49) |
Median (range) | 6.0 (0 to 25) | 6.0 (0 to 23) | 4.0 (0 to 28) | 5.0 (0 to 28) |
SDI global score at baseline | ||||
0 (no damage), n (%) | 119 (66.1) | 110 (59.8) | 126 (70.0) | 122 (67.0) |
≥ 1 (damage), n (%) | 60 (33.3) | 71 (38.6) | 54 (30.0) | 60 (33.0) |
Mean (SD) | 0.7 (1.16) | 0.6 (0.98) | 0.5 (0.91) | 0.5 (0.79) |
Median (range) | 0 (0 to 5) | 0 (0 to 5) | 0 (0 to 5) | 0 (0 to 3) |
Time from initial SLE diagnosis to randomization (months) | ||||
Mean (SD) | 116.2 (97.00) | 103.4 (90.29) | 130.2 (109.28) | 107.7 (99.16) |
Median (range) | 88.0 (0 to 450) | 79.5 (4 to 503) | 94.5 (6 to 555) | 78.0 (6 to 494) |
Cushingoid features | ||||
Any feature, n (%) | 68 (37.8) | 74 (40.2) | 40 (22.2) | 53 (29.1) |
Buffalo hump, n (%) | 15 (8.3) | 14 (7.6) | 13 (7.2) | 10 (5.5) |
Moon face, n (%) | 32 (17.8) | 34 (18.5) | 25 (13.9) | 32 (17.6) |
Purple or violaceous striae, n (%) | 17 (9.4) | 13 (7.1) | 10 (5.6) | 15 (8.2) |
Easy bruising, n (%) | 38 (21.1) | 35 (19.0) | 15 (8.3) | 17 (9.3) |
Hirsutism, n (%) | 10 (5.6) | 8 (4.3) | 10 (5.6) | 4 (2.2) |
Acne, n (%) | 13 (7.2) | 9 (4.9) | 11 (6.1) | 7 (3.8) |
Central obesity, n (%) | 28 (15.6) | 33 (17.9) | 22 (12.2) | 21 (11.5) |
Fragile skin, n (%) | 25 (13.9) | 24 (13.0) | 10 (5.6) | 19 (10.4) |
Type I interferon gene signature test | ||||
High, n (%) | 148 (82.2) | 151 (82.1) | 150 (83.3) | 151 (83.0) |
Low, n (%) | 32 (17.8) | 33 (17.9) | 30 (16.7) | 31 (17.0) |
Anti-dsDNA levels at baseline | ||||
Positive n (%) | 81 (45.0) | 82 (44.6) | 86 (47.8) | 73 (40.1) |
Negative n (%) | 99 (55.0) | 102 (55.4) | 94 (52.2) | 109 (59.9) |
ANA at baseline | ||||
Normal (titre < 1:80), n (%) | 11 (6.1) | 14 (7.6) | 12 (6.7) | 12 (6.6) |
Abnormal (titre ≥ 1:80), n (%) | 164 (91.1) | 165 (89.7) | 160 (88.9) | 165 (90.7) |
Missing, n (%) | 5 (2.8) | 5 (2.7) | 8 (4.4) | 5 (2.7) |
SLE-related treatments at baseline | ||||
OCS use, n (%)c | 150 (83.3) | 153 (83.2) | 141 (78.3) | 151 (83.0) |
OCS dosage (mg/day)d | ||||
< 10, n (%) | 77 (42.8) | 82 (44.6) | 93 (51.7) | 99 (54.4) |
≥ 10, n (%) | 103 (57.2) | 102 (55.4) | 87 (48.3) | 83 (45.6) |
Mean (SD) | 10.69 (11.91) | 9.89 (8.33) | 8.32 (7.15) | 8.90 (8.04) |
Median (range) | 10.0 (0.0 to 99.0) | 10.0 (0.0 to 40.0) | 7.8 (0.0 to 40.0) | 7.5 (0.0 to 40.0) |
OCS dosage (mg/day) excluding patients not taking OCSc | ||||
N | 150 | 153 | 141 | 151 |
< 10, n (%) | 47 (26.1) | 51 (27.7) | 54 (30.0) | 68 (37.4) |
≥ 10, n (%) | 103 (57.2) | 102 (55.4) | 87 (48.3) | 83 (45.6) |
Mean (SD) | 12.83 (11.95) | 11.89 (7.71) | 10.62 (6.38) | 10.73 (7.63) |
Median (range) | 10.0 (2.0 to 99.0) | 10.0 (2.5 to 40.0) | 10.0 (1.0 to 40.0) | 10.0 (1.0 to 40.0) |
Time on OCS up to randomization, dayse | ||||
n | 150 | 153 | 141 | 151 |
Mean (SD) | 712.49 (1,460.78) | 646.82 (1,131.22) | 808.30 (1,583.55) | 710.97 (1,458.82) |
Median (range) | 196.5 (13.0 to 9,421.0) | 189.0 (13.0 to 6,212.0) | 190.0 (0.0 to 10,147.0) | 231.0 (0.0 to 12,106.0) |
Antimalarials, n (%) | 124 (68.9) | 134 (72.8) | 119 (66.1) | 133 (73.1) |
Immunosuppressants, n (%) | 85 (47.2) | 91 (49.5) | 88 (48.9) | 86 (47.3) |
Azathioprine, n (%) | 32 (17.8) | 34 (18.5) | 30 (16.7) | 27 (14.8) |
Methotrexate, n (%) | 22 (12.2) | 38 (20.7) | 34 (18.9) | 35 (19.2) |
Mycophenolate,f n (%) | 31 (17.2) | 22 (12.0) | 23 (12.8) | 23 (12.6) |
Mizoribine, n (%) | 0 | 0 | 4 (2.2) | 3 (1.6) |
NSAIDS, n (%) | 31 (17.2) | 35 (19.0) | 41 (22.8) | 45 (24.7) |
Other SLE medicationg | 74 (41.1) | 68 (37.0) | 73 (40.6) | 85 (46.7) |
ANA = antinuclear antibody; anti-dsDNA = anti–double-strand DNA; BILAG = British Isles Lupus Assessment Group; BILAG-2004 = British Isles Lupus Assessment Group 2004; CLASI = Cutaneous Lupus Erythematosus Disease Area and Severity Index; OCS = oral corticosteroid; PGA = Physician’s Global Assessment; SD = standard deviation; SDG = Standardized Drug Grouping; SDI = Systemic Lupus International Collaborating Clinics/American College of Rheumatology Damage Index; SLE = systemic lupus erythematosus; SLEDAI-2K = Systemic Lupus Erythematosus Disease Activity Index 2000; WHO-DD = WHO Drug Dictionary.
Note: Baseline is defined as the last measurement before randomization and dose administration on day 1. Only patients with baseline positive anti-dsDNA and abnormal complement level are included in the summary statistics for the respective variables.
aFor TULIP-1 results: Asia Pacific: Australia, New Zealand, South Korea, Taiwan; Europe: Germany, Hungary, Italy, Poland, Romania, Ukraine, UK; Latin America: Argentina, Brazil, Chile, Colombia, Peru; rest of world: Israel. For TULIP-2: Asia Pacific: Japan and South Korea; Europe: Belgium, Bulgaria, Czech Republic, France, Germany, Lithuania, Russian Federation, and Spain; Latin America: Argentina, Brazil, Mexico; rest of world: South Africa.
bAn active joint for the joint count assessment is defined as a joint with both tenderness and swelling.
cOCS contains prednisone or equivalent. It is defined as oral medications listed in the WHO-DD SDG “Corticosteroids.”
dIncludes patients not taking OCS at baseline. Their dose is considered to be 0 mg/day at baseline.
eConsidering only the OCS dose used at the time of randomization.
fMycophenolate or mycophenolic acid.
gExamples of other SLE medication are paracetamol, folic acid, ASA.
Source: Clinical Study Reports.9,10
Interventions
Both pivotal trials were similar in terms of design (e.g., blinding, randomization, and drug administration procedures). Block randomization using an interactive voice or web response system was used to randomize patients in a 2:2 ratio (TULIP-1) or a 1:1 ratio (TULIP-2) to receive a fixed IV dose of 300 mg anifrolumab or placebo. The investigational products, anifrolumab 300 mg or placebo, were administered via a controlled IV infusion pump into a peripheral vein over at least 30 minutes every 4 weeks. The preparation of anifrolumab and placebo was performed by an unblinded qualified person (e.g., study nurse or pharmacist) at the site. When diluted, anifrolumab and placebo appeared identical and were administered by blinded study-site personnel. There was no mention of allowable dose reductions, interruptions, or delays for tolerability from the sponsor.
In addition to the investigational product, all patients were receiving standard-of-care treatment at the start of the study in concordance with European Alliance of Associations for Rheumatology and ACR management guidelines. Permitted medications included OCS, intramuscular and intra-articular corticosteroids, antimalarial medication, immunosuppressants, prescription and nonprescription NSAIDs, acetaminophen, low-dose Aspirin, and topical therapy. Patients were allowed to adjust their concomitant medication use under certain circumstances (described in the Concomitant Medications section).
For both trials, the total study duration could be up to approximately 64 weeks for patients who were not enrolled in the LTE study (including screening period) and up to approximately 56 weeks (including screening period) for those patients who were enrolled in the LTE study. Exposure to treatment was defined as the number of days between the start and the end dates of administration of the investigational product plus the dosing frequency time: duration of exposure (days) = (last dosing date + 28 days) – first dosing date + 1.The total number of patient-years of exposure was the sum of duration of exposure (in days) of all patients in the respective treatment group divided by 365.25 (days/year).
Database lock and unblinding occurred after the last patient completed week 52 (visit 14 or early discontinuation visit) in both trials. Blinding of patients and investigators was maintained after the database lock at week 52 until the last patient visit in the LTE study.
Steroid Burst and Tapering
In both trials, from baseline to week 12, patients were allowed to receive only 1 burst of corticosteroids for an increase in SLE disease activity or to control non–SLE-related disease (e.g., asthma or chronic obstructive pulmonary disease exacerbation). Patients receiving more than 1 burst during the first 12 weeks of treatment were considered nonresponders for subsequent assessments of disease activity, regardless of the reason for the burst (SLE or non-SLE activity). Beginning at week 8, tapering to a target OCS dosage of no more than 7.5 mg/day was attempted in all patients with a baseline OCS dosage of 10 mg/day or higher. Tapering continued stepwise until the target was reached, unless at least 1 of the following criteria were met:
SLEDAI-2K activity that worsened compared to baseline in major organ systems (renal, CNS, cardiopulmonary, vasculitis, fever, thrombocytopenia, or hemolytic anemia, or gastrointestinal activity)
newly-affected organ system(s) based on the SLEDAI-2K, excluding serological abnormalities (double-stranded DNA antibodies, hypocomplementemia)
moderate to severe skin disease as reflected by a CLASI activity score of 10 or higher
moderate to severe arthritis disease as reflected by an active joint count of at least 8 tender and/or swollen joints.
Investigators had the option to continue tapering the OCS dosage beyond the target of 7.5 mg/day up to week 40 based on disease activity. If a patient had an increase in disease activity secondary to OCS tapering, the dose could be increased up to a maximum of the baseline OCS therapy dose from week 8 up to week 40 without the patient being considered a nonresponder for subsequent assessments of disease activity. Patients who required an OCS dose above their baseline level could continue in the study but were considered nonresponders for subsequent assessments of disease activity.
Concomitant Medications
All patients in both trials received at least 1 concomitant medication, including SLE-related treatment. Within the TULIP-1 trial the most common concomitant medications were:
hormonal preparations (excluding sex hormones) (92.3%)
alimentary tract and metabolism medications (79.9%)
antiparasitic products, insecticides, and repellents (74.0%)
nervous system medications (63.0%).
Within the TULIP-2 trial, the most common concomitant medications were:
systemic hormonal preparations (excluding sex hormones) (92.3%)
antiparasitic products, insecticides and/or repellent medications (83.4%; namely, hydroxychloroquine)
antineoplastic and immunomodulating drugs (71.5%)
alimentary tract and metabolism medications (65.2%).
Use of nervous system medication (and oxycodone and Vicodin in particular,) was higher in the placebo group compared with the anifrolumab 300 mg group (57.7% versus 49.4%, respectively).
Within the TULIP-2 trial, during the investigational product administration and after investigational product discontinuation, a higher proportion of beyond-protocol concomitant medication use was reported in the placebo group versus the anifrolumab group (25.3% versus 16.7% and 14.3% versus 5.0%, respectively). This was driven primarily by the use of prednisone or prednisone equivalents. As mentioned, these patients were considered nonresponders for binary end points in the efficacy analysis at subsequent visits. More patients in the placebo group (≥ 10%) received medications for the nervous system, and antiparasitic and insecticide and/or repellent medications (e.g., hydroxychloroquine) compared with those in the treatment group.
Medications considered necessary for the patient’s safety and well-being could be given at the discretion of the investigator. Permitted medications were allowed adjustments.
Medications that led to immediate discontinuation of the investigational product were cyclophosphamide, interferon therapy (alpha 2a and 2b, beta 1a and 1b, and pegylated interferons alpha 2a and 2b), investigational drugs, biologic immunomodulators (including, but not limited to, belimumab, abatacept, or rituximab), live or attenuated vaccines (the sponsor recommended that investigators ensure all patients were up to date on required vaccinations before entry into the study), plasmapheresis, Bacille Calmette-Guéri vaccine, any immunoglobulin therapy, and IV corticosteroids exceeding 1 g of methylprednisolone or equivalent.
Outcomes
A list of efficacy end points identified in the CADTH review protocol that were assessed in the clinical trials included in this review is provided in Table 8 and summarized in the following section. A detailed discussion and critical appraisal of the outcome measures is provided in Appendix 4.
Table 8: Summary of Outcomes of Interest Identified in the CADTH Review Protocol
Outcome measure | TULIP1 | TULIP2 |
|---|---|---|
Disease activity
| Key primary | Key secondary |
Disease activity
| Secondary | Key primary |
Disease activity
| Key secondary | Key secondary |
Disease activity
| Secondary | Secondary |
Reduction in background corticosteroid use | Key secondary | Key secondary |
HRQoL
| Secondary | Secondary |
Mortality | NR | NR |
Morbidity (e.g., SDI) | Secondary | Secondary |
Reduction in symptoms (e.g., rash, pain, fatigue, cognitive impairment, depression) | Key secondary | Key secondary |
Achievement of remission or low disease activity (e.g., LLDAS) | Secondary | Secondary |
Disease flare frequency and severity | Key secondary | Key secondary |
BICLA = British Isles Lupus Assessment Group-based Composite Lupus Assessment; BILAG-2004 = British Isles Lupus Assessment Group 2004; CLASI = Cutaneous Lupus Erythematosus Disease Area and Severity Index; FACIT-F = Functional Assessment of Chronic Illness Therapy–Fatigue; LLDAS = low lupus disease activity state; MCS = mental component summary; PCS = physical component summary; SDI = Systemic Lupus International Collaborating Clinics/American College of Rheumatology Damage Index; SF-36 = Short Form (36) Health Survey; SLEDAI-2K = Systemic Lupus Erythematosus Disease Activity Index 2000; SRI = Systemic Lupus Erythematosus Responder Index; SRI-4 = improvement of 4 points or greater on the Systemic Lupus Erythematosus Responder Index NR = not reported.
Disease Activity
Disease activity is measured by several SLE instruments such as the SRI-4 and BICLA and their components (e.g., SLEDAI-2K, BILAG-2004, and PGA). Assessments of disease activity and organ damage were performed at baseline and every 4 weeks until the end of each trial. Details of how each scale was calculated are outlined in the following sections. Evaluation of disease activity and organ damage across study sites were completed by trained investigators and designated site personnel. The Disease Activity Adjudication Group (also known as the Central Review Group) determined eligibility during screening and throughout the study to confirm SLEDAI-2K, BILAG-2004, and PGA scoring and the quality and accuracy of efficacy assessments completed by the investigators. The Disease Activity Adjudication Group consists of medically qualified individuals and support staff who assisted in the ongoing central review of disease activity assessments in the pivotal trials. For all measures, baseline was defined as the last measurement before randomization and dose administration on day 1.
Improvement of 4 points or Greater on the Systemic Lupus Erythematosus Responder Index
The SRI-4 response at week 52 was the primary composite end point of the TULIP-1 trial and a secondary end point of the TULIP-2 trial. SRI-4 was assessed at baseline and every 4 weeks until week 52 in both trials. The Systemic Lupus Erythematosus Responder Index (SRI) is a composite outcome that is rated dichotomously: whether a patient has or has not achieved response. The end point is designed to detect improvements without worsening in disease manifestations and disease activity. The SRI composite index comprises the SLEDAI-2K, BILAG-2004, and PGA measurement tools for SLE. Organ systems are weighted unequally with the Systemic Lupus Erythematosus Disease Activity Index (SLEDAI) scale (e.g., arthritis improvement considered greater than rash improvement), and only complete improvements are captured. A score of 6 or higher is considered moderate to severe disease activity. The SRI-4 is achieved when all 5 of the following components are met:
reduction of 4 or more points from baseline in the SLEDAI-2K
no new organ systems affected as defined by 1 or more new BILAG-2004 A item or 2 or more new BILAG-2004 B items compared to baseline
no worsening from baseline in patients’ lupus disease activity (where worsening is defined by an increase of 0.30 points or more on a 3-point PGA visual analogue scale [VAS])
no permanent premature discontinuation of the investigational product
no use of restricted medications beyond the protocol-allowed threshold on or before the date of last week-52 assessment used to derive SRI-4.
The SRI-4 has been correlated with other measures of disease activity, biomarkers, and HRQoL measures.21 However, the SRI-4 has been shown to be less responsive to change than the BILAG or PGA for musculoskeletal SLE.22
British Isles Lupus Assessment Group-based Composite Lupus Assessment
A BICLA response at week 52 was the primary composite end point of the TULIP-2 trial and a secondary end point of the TULIP-1 trial. BICLA was assessed at baseline and every 4 weeks until week 52 in both trials. In contrast to the SRI, improvement in the BICLA is guided by the BILAG-2004 and worsening is assessed using the BILAG-2004, SLEDAI-2K, and PGA.23 The BILAG-2004 can discern inactive disease, partial or complete improvement, and deterioration of disease activity, while the SLEDAI- 2K requires complete resolution of disease activity of the specific element to capture improvement.23 With this end point, organ systems are weighted equally. Any improvement (partial or complete) had to be achieved in all BILAG-2004 organ systems affected by the disease from baseline. BICLA was achieved when all 5 of the following components were met:
improvement in involved BILAG organs (A [severe] and B [moderate]) at baseline (e.g., reduction of all baseline BILAG-2004 A to B, C, or D and baseline BILAG-2004 B to C or D, and no BILAG) with no worsening (where worsening is defined as 1 or more new BILAG-2004 A items or 2 or more new BILAG-2004 B items)
no worsening from baseline in SLEDAI-2K, with worsening defined as an increase from baseline of greater than 0 points in SLEDAI-2K
no worsening from baseline in the patients’ lupus disease activity, with worsening defined by an increase 0.30 points or more on PGA VAS (scale of 0 to 3)
no discontinuation of investigational product
no use of restricted medications beyond the protocol-allowed threshold before assessment.
The difference between anifrolumab and placebo in the proportion of patients achieving a BICLA response was assessed longitudinally over time up to week 52.
In addition, time to a BICLA response sustained up to week 52 was measured in TULIP-2. Time to a BICLA response was defined as the first BICLA response visit that is sustained up to, and including, week 52. A patient was considered to have achieved a BICLA response sustained up to week 52 if response was achieved at week 52 with “time to” defined as the first time point where a BICLA response was achieved when maintained through week 52.
British Isles Lupus Assessment Group 2004
The BILAG-2004 is a component of both the SRI-4 and BICLA. Individual assessment of the BILAG-2004 was a secondary end point in both trials. The BILAG-2004 was also used to evaluate the annualized flare rate, which was defined as either 1 or more new BILAG-2004 A items or 2 or more new BILAG-2004 B items compared to the previous visit; these are defined as severe and moderate flares in the literature, respectively.24 BILAG-2004 assessments took place every 4 weeks starting from baseline to week 52. BILAG-2004 grades were presented by organ system and global scores were also provided. BILAG index scoring (BILAG-2004 version September 1, 2009)25 was used in the central review process. BILAG system scores were assigned scores of A, B, C, D, or E at all study visits by strictly following this index scoring. BILAG-2004 global scores were derived by summing the numerical-score equivalents for each organ system, with A = 12, B = 8, C = 1, D = 0, and E = 0. Results from the original scores are used to calculate the primary efficacy end points in both trials. Although the BILAG was developed based on the principle of physicians’ intention to treat, the treatment had no bearing on the scoring index within the trials and was based solely on active manifestations.
The BILAG-2004 is an updated version of the original BILAG that grades clinical features as being new, the same, worse or improving, and incorporates severity in the scoring.26 The classic BILAG had 8 domains and consisted of fewer items that were more related to damage than to disease activity and did not properly include disease activity in the gastrointestinal or ophthalmic systems.24 The BILAG-2004 is an ordinal scale of 97 clinical and laboratory variables covering 9 organ systems (general, mucocutaneous, neuropsychiatric, musculoskeletal, cardiorespiratory, gastrointestinal, ophthalmic, renal, and hematologic), with scores ranging from A (severe disease) to E (never involved) for each organ system. BILAG-2004 records disease activity across the different organ systems by comparing the immediate past 4 weeks to the 4 weeks preceding them. The first 7 organ systems (except renal and hematologic) contain clinical parameters that are assessed by the treating physician as new (4), worse (3), the same (2), improving (1) and not present (0). The assessment is based on disease manifestation, the physician’s intention to treat, and categorization of disease activity (e.g., grades A to E, where A is most severe and E is never present). The renal and hematologic scoring is based on laboratory values. A total score is not usually calculated. The BILAG-2004 gives equal weight to all affected body systems and can measure incremental improvements or worsening within a body system, unlike the SLEDAI-2K, which can only record clinical manifestations as absent or present. The BILAG-2004 requires improvement in all baseline manifestations within a system to result in a change in that system’s BILAG-2004 level. For example, a patient with skin eruption and severe mucosal ulceration at baseline must show improvement in both symptoms to result in a change in the BILAG-2004 mucocutaneous index level.27 Appendix 4 provides further details.
The BILAG-2004 tool has been found to be valid, reliable, and sensitive to change over time.27-29 The BILAG-2004 index is a valid measure of disease activity and was recommended for use in clinical trials and outcome studies.29 It has been found to be more responsive to change than the SLEDAI-2K.27 In terms of clinically meaningful difference, a minor improvement is considered a change from grade A to B or grade B to C; Minor deterioration is considered a change from grade C to B.30 In terms of flare index, the BILAG-2004 had better inter-rater reliability than did the Safety of Estrogens in Lupus Erythematosus National Assessment flare index and PGA; however, agreement was less consistent with mild and moderate flares than with severe flares.24
Modified BILAG-2004
In the TULIP-2 trial, modified BILAG rules were used in the sensitivity analyses for the primary end point of BICLA, and for flares. The modified BILAG assessment utilizes modified BILAG-2004 index scoring rules. The modified BILAG uses an algorithm that eliminates categories, such as BILAG A and BILAG B, which result from manifestations assessed as “same” when there is neither improvement nor worsening from the last visit’s assessments. The Disease Activity Adjudication Group differentiated these A and B scores by reviewing all BILAG-2004 index scores for each patient’s visits, using the modified BILAG-2004 index scoring rules. According to the sponsor, the resulting categories from the modified BILAG are more clinically relevant in a clinical trial setting when measuring disease activity that remained at the “same” level of improvement compared to previous visits. The modified BILAG rules and the review process and scoring as well as references used that justify the modification are detailed in a charter; however, these were not provided to CADTH.
Systemic Lupus Erythematosus Disease Activity Index 2000
The SLEDAI-2K is a component of both the SRI-4 and BICLA. In both trials, individual assessment of the SLEDAI-2K was a secondary end point. SLEDAI-2K assessments took place at baseline and every 4 weeks (28 days) until week 52. A certified investigator or designated physician assessed each manifestation as being either “present” or “absent” in the previous 4 weeks. The assessment also includes blood and urine sampling for assessment of the SLEDAI-2K laboratory categories. SLEDAI-2K scores were derived from the sum of the scores for all items and evaluated using the difference in mean change from baseline longitudinally over time to week 52. Scores for the SLEDAI organ systems were derived in the same way as SLEDAI-2K but using the scores for the respective items only. For each SLEDAI organ system, the proportion of patients with an improvement (i.e., a SLEDAI organ system score less than the corresponding score at baseline) at week 24 and week 52, respectively, will be assessed for patients with an organ system involvement at baseline (i.e., a SLEDAI organ system score greater than 0).
The SLEDAI-2K is a 24-item weighted score of lupus activity that ranges from 0 to 105, with higher scores indicating greater disease activity and 0 indicating inactivity.31 It is a modified version of the original SLEDAI that allows for persistent active disease in alopecia, mucous membrane ulcers, rash, and proteinuria to be scored.32 The SLEDAI-2K is based on the presence of 24 descriptors in 9 organ systems that are defined by the investigator as “present” or “absent” in the patient in the past 4 weeks and incudes the use of laboratory samples. It is a weighted instrument, in which descriptors are multiplied by a particular organ’s “weight.” For example, renal descriptors are multiplied by 4 and CNS descriptors by 8, and these weighted organ manifestations are totalled into a final score.
SLEDAI-2K scores are valid and reliable assessments of lupus disease activity, but less responsive to change compared with other measures such as the BILAG-2004 and PGA.27,33 Clinically meaningful responses are + 3 to + 4 points for worsening, −1 to −2 points for improvement,34 and + 3 points for associated flares.35 More details are provided in Appendix 4.
Clinical Systemic Lupus Erythematosus Disease Activity Index 2000
Clinical SLEDAI-2K scores were secondary end points in both trials. In both trials, the clinical SLEDAI-2K score was the sum of the scores for the SLEDAI-2K vasculitis, arthritis, myositis, rash, alopecia, mucosal ulcers, pleurisy, and pericarditis items. Measurement of clinical SLEDAI-2K followed the same schedule as the SLEDAI-2K. The “clinical” SLEDAI-2K score is the SLEDAI-2K assessment score without the inclusion of points attributable to any urine or laboratory results, including immunologic measures.9,10 Its use could permit earlier clinical decisions to be made without waiting for immunologic measures. In both trials, in any circumstance in which the clinical SLEDAI-2K score was used, sites had to subsequently update the SLEDAI-2K assessment when laboratory data became available so that the full SLEDAI-2K score was made available to the sponsor.
Physician’s Global Assessment
Individual assessments of the PGA were secondary end points in both trials. The difference between anifrolumab and placebo in the mean change from baseline in PGA (measured on a VAS ranging from 0 to 3) were assessed by visit every 4 weeks until week 52.
The PGA uses a VAS scored between 0 and 3, with physicians asked the following question: How do you assess your patient’s current disease activity?” Possible answers are 0 = none, 1 = mild, 2 = moderate, and 3 = severe. When scoring the PGA, the score from the previous visit is reviewed and the mark moved relative to the score from the previous visit. This is a global assessment, factoring in all aspects of the patient’s lupus disease activity. It does not reflect medical conditions not associated with lupus. Any disease rated greater than 2.5 is very severe. The instrument is similar to a logarithmic scale, with greater distances or demarcations possible among milder to moderate symptoms.
The threshold for “no worsening” on the PGA is a change of less than 0.3 points based on the SRI-4.36 In a trial for epratuzumab, a significant improvement was considered a 20% decrease in PGA score evaluated after 12 months of treatment.37
Maintenance of OCS Dose of No More Than 7.5 mg From Week 40 to 52 in Patients With a Baseline Dose of 10 mg or Greater
In both trials, a key secondary end point was the difference in the proportion of patients with a baseline OCS dosage of 10 mg/day or higher of prednisone or equivalent in the anifrolumab group versus the placebo group who maintained OCS reduction to no more than 7.5 mg from week 40 to week 52. Patients who achieved the reduction and were able to maintain it to week 52 were considered responders. A maintained OCS reduction is defined as meeting all the following criteria:
achieve an OCS dosage of no more than 7.5 mg/day prednisone or equivalent by week 4
maintain an OCS dosage of no more than 7.5 mg/day prednisone or equivalent from week 40 to week 52 (a maintained OCS dose is defined as no dose increase (i.e., no dose greater than the dose at week 40 plus 1 day) between week 40 plus 2 days and week 52, inclusive
the date of last assessment used for efficacy analysis (SLEDAI-2K, PGA, and BILAG-2004) in the time window of week 52 will be used as the date of week 52; if no such assessment falls into the respective time window, then the target date for the time point will be used instead
no permanent premature discontinuation of the investigational product
no use of restricted medications beyond the protocol-allowed threshold on or before the date of week 52.
If any of these conditions were not fulfilled or could not be evaluated at week 52 (e.g., due to missing values) the patient was defined as a nonresponder.
Health-Related Quality of Life
Measures of HRQoL were secondary end points in both trials. HRQoL assessments that aligned with this CADTH review included the Short Form (36) Health Survey Version 2 (SF-36v2), the Lupus QoL scale; and the EQ-5D-5L. The difference between anifrolumab and placebo in the mean change from baseline in HRQoL measures were analyzed using descriptive statistics.
Short Form 36-item Health Survey
The SF-36 was administered at baseline, every 8 weeks, and at week 52. The SF-36 is a generic, self-reported health assessment questionnaire that has been used in clinical trials to study the impact of chronic disease on HRQoL.38 It yields scale scores for 8 health domains, and 2 summary measures of physical and mental health: the PCS and the MCS. Only the PCS and MCS will be reviewed for this CADTH review. According to the sponsor, the meaningful change threshold was defined as 3.4 points on the PCS and 4.6 points on the MCS.
According to a literature review of 8 studies,39 anchor-based MIDs for improvement were estimated to be from 2.1 to 2.4 for summary scores in patients with SLE. These estimates are consistent with estimates from other rheumatological conditions (2.5 to 5 points for summary scores).
Lupus Quality of Life
The Lupus QoL was assessed at baseline and every 12 weeks till week 52. The Lupus QoL is a 34-item SLE-specific HRQoL measure.40 The instrument consists of 8 domains: physical health (8 items), pain (3 items), planning (3 items), intimate relationships (2 items), burden to others (3 items), emotional health (6 items), body image (5 items), and fatigue (4 items). Domain scores were derived when at least 50% of the items were answered. The mean raw domain score was the total of the item response scores of the answered items divided by the number of answered items. A nonapplicable response was treated as unanswered. The mean raw domain scores were transformed to domain scores (ranging from 0 as worst QoL to 100 as best QoL) as mean raw domain score divided by 4 and multiplied by 100.
Anchor-based MIDs ranged from 2.4 to 8.7 for deterioration and from 3.5 to 7.3 for improvement. MIDs derived using distribution-based approaches based on an SD of 0.5 ranged from 12.9 to 16.7.39
EQ-5D-5-Level
The EQ-5D-5L was assessed at baseline and every 12 weeks till week 52. The EQ-5D-5L comprises 5 dimensions: mobility, self-care, usual activities, pain/discomfort and anxiety/depression, and includes 5 response levels of severity (no problems, slight problems, moderate problems, severe problems, and unable to/extreme problems) in each of the dimensions.41 The UK value was used for all patients in the study. The EQ-5D-5L health states were converted into a single index value using values sets from the EQ-5D-5L Crosswalk Project. The questionnaire also includes a VAS (the EQ VAS), in which the patients were asked to rate their health on a scale of 0 to 100, with 0 being worst imaginable health state and 100 being best imaginable health state.
The EQ-5D-3L has been shown to be a valid measure that can discriminate between patients with higher disease activity (SLEDAI score > 5) versus lower disease activity (SLEDAI score ≤ 5). However, it is not able to discriminate between patients with higher disease damage versus those with lower damage and is not responsive to longitudinal changes in disease activity based on SLEDAI scores. In addition, multiple studies have shown that the EQ VAS was not responsive to self-reported changes in health.39,42 SLE-specific MIDs for the EQ-5D-5L have not been reported.
Mortality
Mortality was documented in the TULIP-1 and TULIP-2 trials as the number of patients who died by the end of the study period as part of the safety analysis.
Morbidity: Organ Damage
The SDI was a secondary end point in both trials. The difference in mean change in SDI global score from baseline to week 52 was used to evaluate the effect of anifrolumab 300 mg versus placebo on irreversible damage in SLE patients.
The SDI was developed to assess irreversible damage in SLE patients independently of its cause (SLE activity, therapy, comorbidities) but occurring after disease onset. Damage is usually defined as a clinical feature that must be continuously present for at least 6 months to receive a score. The SDI consists of 42 items in 12 domains, with a maximum score of 46 (higher scores denote more damage). At SLE diagnosis, the SDI score is 0. Damage according to the SDI score is defined as an SDI global score of 1 or higher, while no damage is defined as an SDI global score of 0.43 The SDI is defined for 12 organ systems (possible scores): peripheral vascular (0 to 5), ocular (0 to 2), neuropsychiatric (0 to 6), renal (0 to 3), pulmonary (0 to 5), cardiovascular (0 to 6), gastrointestinal (0 to 6), musculoskeletal (0 to 7), skin (0 to 3), endocrine (diabetes) (0 to 1), gonadal (0 to 1), and malignancies (0 to 2). The SDI global score is the sum of the damage scores for all 12 organ systems. Postbaseline categories used for the presentation of change in damage are “no change,” “+1 point,” “+2 points,” and “+3 or more points.”
An SDI score of 1 or higher indicates worsening.43 The SDI is a valid and reliable instrument.44,45 The SDI was found to be a predictor of mortality and SDI scores have been shown to increase with disease duration.46 Correlation with the SLEDAI and BILAG was low, although 1 study found strong correlation with the SLEDAI.44
Reduction in Symptoms
Cutaneous Lupus Erythematosus Disease Area and Severity Index
The CLASI was a key secondary end point in both trials. The difference in the proportion of patients with a 50% or greater reduction in CLASI activity score at week 12 in the subgroup of patients with a baseline CLASI activity score of 10 or higher from baseline to week 52 was used to evaluate the effect of anifrolumab 300 mg versus placebo on skin lesions. The CLASI describes the extent of cutaneous disease in terms of the intensity of involvement measured in 13 different anatomic locations. It has 2 scores, 1 for disease activity (scored from 0 to 70) and 1 for disease damage (scored from 0 to 80).47,48 The activity score considers erythema, scale and/or hypertrophy, mucous membrane lesions, recent hair loss, and nonscarring alopecia. The damage score represents dyspigmentation; scarring, atrophy, and/or panniculitis; and scarring of the scalp. Patients were asked if their dyspigmentation lasted 12 months or longer, in which case the dyspigmentation score was doubled. Each of the above parameters was measured in 13 different anatomic locations that were included specifically because they are most often involved in cutaneous lupus erythematosus. The most severe lesion in each area was measured.
The CLASI is a validated and reliable index to assess SLE patients.48,49 A clinically important improvement in the CLASI was found to be a mean of 3 points or an 18% decrease in the CLASI activity score.50
Joint Reduction Rate
In the TULIP-1 trial, the difference in the proportion of patients with at least 8 swollen and at least 8 tender joints at baseline who achieve at least a 20% or at least 50% reduction from baseline in both the number of swollen and tender joints at week 52 was a supporting secondary end point; In the TULIP-2 trial, the difference in the proportion of patients with a 50% or greater reduction in joint counts at week 52 in the subgroup of patients with at least 6 swollen and at least 6 tender joints at baseline was a key secondary end point.
In both trials, an active joint is defined as a joint with swelling and tenderness. In the TULIP-1 trial, at least 20% reduction and at least 50% reduction are reached if the percentage of change is no more than −20% and no more than −50%, respectively. No restricted medications beyond the protocol-allowed threshold were used on or before the assessment, and there was no permanent premature discontinuation of the investigational product. To achieve at least a 20% reduction and at least a 50% reduction, respectively, the reduction in the number of joints needs to be reached in swollen and tender joints separately. In the TULIP-2 trial, an at least 50% reduction is reached if all the following criteria are met: the percentage reduction from baseline in both the number of swollen joints and the number of tender joints, separately, is 50% or greater; no permanent premature discontinuation of investigational product; and no use of restricted medications beyond the protocol-allowed threshold on or before the assessment.
In both trials, the swollen and tender joint count was based on the left and right shoulder, elbow, wrist, all metacarpophalangeal and proximal interphalangeal joints of the upper extremities and the left and right knees of the lower extremities. An active joint for the SLEDAI-2K calculation is defined as a joint with pain and tenderness and at least 1 of the following (warmth, erythema, swelling, or effusion). However, in the TULIP-1 and TULIP-2 trials, an active joint for the joint count assessment was defined as a joint with tenderness and swelling only. Each of 28 joints was then evaluated separately for tenderness (by palpating the joint) and swelling. Joints with intra-articular injections within 4 weeks were not evaluable for the assessment. The joint count assessment included questions regarding limitation of range of movements and effects of joint symptoms on basic and functional ADLs.
Functional Assessment of Chronic Illness Therapy–Fatigue
The FACIT-F was a secondary end point in both trials. The FACIT-F was assessed at baseline and every 4 weeks until week 52. The FACIT-F is completed by patients to assess fatigue. Patients were presented with a list of 13 statements (i.e., “I am too tired to eat”) and asked to rate each on a 4-point Likert scale (0 = not at all, 1 = a little bit, 2 = somewhat, 3 = quite a bit, and 4 = very much), to indicate how true the statement was during the past 7 days.9,10 Final scores are the sum of the responses from the 13 items and range from 0 to 52; items are reverse-scored, with higher scores indicating better QoL. According to the sponsor, a clinically meaningful response was considered a change from baseline of more than 3 points, with no restricted medication use beyond the protocol-allowed thresholds on or before the assessment, and no permanent premature discontinuation of IP.
The FACIT-F is a valid and reliable instrument for use in patients with SLE. The FACIT-F is responsive to clinical improvement but not clinical deterioration. It can differentiate groups defined on the BILAG general and musculoskeletal domains. It is correlated with the SF-36 and Patient Global Assessment, with weak to moderate correlation with the PGA, BILAG, and Safety of Estrogens in Lupus Erythematosus National Assessment (SELENA) SLEDAI.51 According to the evidence, the anchor-based MIDs ranged from 2.5 to 8.4 points.51 The distribution-based MIDs fell within 3.8 to 4.6 points (based on an SD of 0.33) and 5.8 to 6.8 points (based on an SD of 0.5; standard error of the mean = 2.7 to 2.9 points).51
Pain Numerical Rating Scale
The pain NRS is a secondary end point in both trials to capture patient-reported pain. The pain NRS is an 11-point Likert scale to capture overall patient-reported pain (0 = no pain; 10 = worst pain imaginable) with a 1-week recall period. The pain NRS has acceptable test-retest reliability.52
Achievement of Low Disease Activity
Low disease activity state (LLDAS) is a secondary end point in both trials. LLDAS is a state that, if sustained, is “associated with a low likelihood of adverse outcome, considering disease activity and medication safety.”53 This is a binary end point used to evaluate the difference in the proportion of patients with response in LLDAS at week 52. Patients were considered LLDAS responders at a specific visit if they met the following criteria:
SLEDAI-2K score of no higher than 4, with no activity in major organ systems (renal, CNS, cardiopulmonary, vasculitis, fever) and no hemolytic anemia or gastrointestinal activity
no new lupus disease activity compared with the previous assessment as measured by the SLEDAI-2K, BILAG-2004, PGA 1 or lower (scale 0 to 3); current prednisone (or equivalent) dosage of no more than 7.5 mg/day
no discontinuation of investigational product
well-tolerated standard maintenance doses of immunosuppressive drugs and approved biologic drugs (i.e., no use of restricted medications beyond the protocol-allowed threshold before assessment).
The LLDAS has good criterion validity; according to the literature, patients who spent 50% or more of their observed time in LLDAS had significantly reduced organ damage accrual and were less likely to have an SDI increase of 1 or greater.53
Disease Flare Frequency and Severity
In both trials, the difference in annualized flare rates through week 52 was a key secondary end point. Flares were defined as either 1 or more new BILAG-2004 A items or 2 or more new BILAG-2004 B items compared to the previous visit (i.e., a worsening from an E, D, or C score to a B score in at least 2 organ systems or a worsening from an E, D, C, or B score to an A score in any 1 organ system compared to the previous visit). The occurrence of a new flare was checked for each available visit versus the previously available visit up to week 52. If no flare occurred, the number of flares was set to 0. Otherwise, all flares were counted, leading to a maximum number of 13 flares. The annualized flare rate is the number of flares divided by the flare exposure time in days multiplied by 365.25. The flare exposure time is the time up to week 52 (date of BILAG-2004 assessment at week 52) or up to the date of last-available BILAG-2004 assessment, up to and including week 52 in cases of premature study discontinuation and was derived as the date of week 52 divided by the date of the last BILAG-2004 assessment minus the date of the first administration of the investigational product plus 1.
The BILAG-2004 can easily distinguish between severe flares and no flare, but mild and moderate flares are more difficult to distinguish. Overall, the BILAG-2004 appears to be a reliable instrument for measuring flares, and studies have shown that it is better at capturing flares than the Safety of Estrogens in Lupus Erythematosus National Assessment Flare Index (SFI).24 The BILAG-2004 had better inter-rater reliability than the SFI and PGA; however, agreement was less consistent with mild and moderate flares than with severe flares.24
Safety Assessments
Key safety assessments were AEs (including AESIs), safety laboratory tests, vital signs, electrocardiograms, and physical examination (including assessment of Cushingoid features). In addition, the C-SSRS and PHQ-8 were utilized as safety assessments for depression in both trials. A modified SFI was used to assess flares.
The PHQ-8 assesses symptoms of depression over the last 2 weeks. There are 8 item scores that range from 0 to 3; a total score higher than 10 is considered indicative of major depression and greater than 20 is considered indicative of severe major depression.54 The difference between anifrolumab and placebo in the mean change from baseline in PHQ-8 total score will be assessed by visit up to week 52. The PHQ-8 is completed by the patient and scored by the investigator. No evidence related to the validity, reliability, responsiveness, or MID of the instrument among SLE patients was identified.
The C-SSRS is an assessment tool that evaluates suicidal ideation and behaviour. It is made up of 10 categories, all of which maintain binary responses (yes or no) to indicate the presence or absence of behaviour that is significantly predictive of completed suicide.55 The outcome of the C‐SSRS is a numerical score obtained from the aforementioned categories. Two different versions of the questionnaire were used in the pivotal trials9,10: 1 assessing the last 12 months before the assessment and a second assessing the time since last visit. The score will be derived at each assessment for each patient up to week 52. Suicidal ideation was defined as a “yes” answer at any time in the respective study period to any 1 of the 5 (re-ordered) suicidal ideation questions, ranging from category 1 (“wish to be dead”) to category 5 (“active suicidal ideation with specific plan and intent”) on the C-SSRS. Suicidal behaviour was defined as a “yes” answer at any time in the respective study period, to any 1 of the 5 (re-ordered) suicidal behaviour questions, ranging from category 6 (“preparatory acts or behaviour”) to category 10 (“completed suicide”) on the C-SSRS. Nonsuicidal self-injurious behaviour is assigned if no ideation or behaviour is present. No evidence related to the validity, reliability, responsiveness or MID of the instrument among SLE patients was identified.
The pivotal trials used a modified version of the SFI, with the SLEDAI-2K used instead of the SELENA SLEDAI to identify flares and severity for the safety analysis.9,10 This is a disease-specific composite measure that classifies flares as mild to moderate or severe, based on criteria of clinical activity, need for additional treatment, or PGA score.46 In the pivotal trials, a mild to moderate flare and a severe flare were defined according to the following criteria:
Mild to moderate flare:
change in SLEDAI-2K score of 3 or more points but less than 7 points compared to previous visit, or
new or worse discoid, photosensitive, profundus, cutaneous vasculitis, or bullous lupus, or
nasopharyngeal ulcers, pleuritis, pericarditis, arthritis, or SLE fever, or
increase of 1.0 or greater in PGA score (but not greater than 2.5).
Severe flare:
change in SLEDAI-2K score of 7 points or greater compared to previous visit, or
new or worse CNS-SLE, vasculitis, nephritis, myositis, hemolytic anemia (hemoglobin less than 70 g/L) or
decrease in hemoglobin of greater than 30 g/L with positive Coombs) and at least 1 of the following: decreased haptoglobin, increased total bilirubin not due to Gilbert’s disease, increased reticulocyte count, or
hospitalization for SLE, or
AEs and SAEs were collected from the time of informed consent, throughout the treatment period and including the follow-up period until follow-up visit 2 (12 weeks after the final dose) or week 52 for the patients who enrolled in the LTE study. Any AEs that were unresolved at the patient’s last visit in the study were to be followed up by the study staff for as long as medically indicated. An AE was defined as the development of an undesirable medical condition or the deterioration of a pre-existing medical condition following or during exposure to the investigational product, regardless of whether or not the event was considered causally related to the product. An undesirable medical condition could be symptoms (e.g., nausea, chest pain), signs (e.g., tachycardia, enlarged liver) or the abnormal results of an investigation (e.g., laboratory findings, electrocardiogram).
An SAE was defined as an AE that fulfilled 1 or more of the following criteria:
resulted in death
was immediately life-threatening
required inpatient hospitalization or prolongation of existing hospitalization
resulted in persistent or significant disability/incapacity or substantial disruption of the ability to conduct normal life functions
was a congenital abnormality or birth defect
was an important medical event that could jeopardize the patient or may have required medical intervention to prevent 1 of the earlier outcomes listed.
Statistical Analysis
Sample Size Determination and Power Calculation
TULIP-1
The sample size was primarily driven by the need to acquire a sufficiently large safety database, as well as the ability to assess key secondary end points. In the TULIP-1 trial, assuming that 39% and 63% of patients in the placebo and anifrolumab 300 mg groups, respectively, achieve SRI-4, treatment groups of 180 patients would yield more than 99% power to reject the hypothesis of no difference using a 2-sided alpha of 0.05. This sample size provides a minimal detectable difference of approximately 10% in SRI-4 between anifrolumab 300 mg versus placebo.
In the TULIP-1 trial, estimates of power for 2 key secondary end points were calculated. For the type I interferon gene signature test high subgroup, assuming that 75% of patients are type I interferon gene signature test high, and the proportions of SRI-4 in the type I interferon gene signature test high subgroup were 35% and 61% in the placebo and anifrolumab groups, respectively, a 2-sided alpha of 0.04 yields 98% power. For the OCS dosage of no more than 7.5 mg/day at week 40, which is maintained through week 52 in the subgroup of patients with a baseline OCS dosage of 10 mg/day or higher, a 2-sided alpha of 0.004 yields 87% power, assuming that 60% of patients have an OCS dose of 10 mg or more at baseline and the proportion of patients were 32% and 59% in the placebo and anifrolumab groups, respectively. Power calculations for these 2 key secondary outcomes assumed that the primary end point was met, and testing of the key secondary end points was therefore allowed. Each end point was tested using a weighted Holm procedure, and the alpha was given by the assigned weight in the first step of the algorithm. The assumptions of the effect sizes and sizes of subgroups used for these calculations were based on results from an interim analyses of the MUSE study.
TULIP-2
The power calculation for the TULIP-2 trial was updated from the TULIP-1 trial due to the modified primary end point (BICLA at week 52); however, these calculations yielded no changes to the study sample size. The purpose of the power calculations was to justify updates to the primary and key secondary end points. Assuming that 30% and 46% of patients in the placebo and anifrolumab 300 mg groups, respectively, achieve BICLA, 180 patients per study group yields approximately 88% power to reject the hypothesis of no difference using a 2-sided alpha of 0.05. Effect sizes were based on observed results from the TULIP-1 trial. The minimal detectable difference in BICLA response between anifrolumab 300 mg versus placebo is approximately 10% with this sample size. Calculations are based on a 2-group chi-square test of equal proportions.
Analysis Populations
Both pivotal trials utilized a full analysis set (FAS) for reporting efficacy and safety data. The FAS included all patients randomized into the study who receive at least 1 dose of the investigational product. The FAS was analyzed according to randomized treatment, modified intention-to-treat approach.
Statistical Test or Model
For both pivotal trials, descriptive statistics (number, mean, SD, median, minimum, and maximum) were provided for continuous variables, and counts and percentages were presented for categorical variables. For treatment comparisons, 95% CIs were presented. If a model was used to estimate the treatment difference, the corresponding CI according to the model was presented.
Primary Outcome of the Studies
The main components of the statistical test and model for both trials are discussed in Table 9. The primary outcome for both trials utilized the Cochran-Mantel-Haenszel (CMH) approach. The CMH estimates were stratified by SLEDAI-2K score at screening (< 10 points versus ≥ 10 points, baseline OCS dosage (< 10 mg/day versus ≥ 10 mg/day prednisone or equivalent), and results of a type I interferon test (high versus low).
Key Secondary Outcomes of the Studies
In both trials, the same CMH approach as described for the primary end point was used for 4 key secondary end points of SRI-4 (TULIP-1) or BICLA (TULIP-2) at week 52 in the subgroup of patients with high results on an interferon test; maintained OCS reduction to no more than 7.5 mg in the subgroup of patients with a baseline OCS dose of greater than 10 mg; CLASI reduction in patients with a baseline CLASI activity score of 10 or higher; and joint count reduction by at least 50% in patients with at least 8 swollen and at least 8 tender joints at baseline (TULIP-1), and at least 6 swollen and at least 6 tender joints at baseline (TULIP-2). The analysis was repeated for patients achieving an reduction of at least 20% in swollen and tender joints. For maintenance of OCS reduction, stratification factors were reduced to SLEDAI-2K score at screening and results of the type I interferon gene signature test.
The final key secondary outcome, annualized flare rate through week 52, was analyzed using a negative binomial regression model in both trials. The response variable in the model was the number of flares over the 52-week treatment period The model included covariates of treatment group and the stratification factors. The logarithm (base e) of the follow-up time (flare exposure time) was used as an offset variable in the model to adjust for patients with different exposure times.
Other Secondary Outcome Variables of the Studies
Change from baseline and observed values in SDI global score will be presented by visit with descriptive statistics. Change from baseline in SLEDAI-2K and PGA was analyzed using a repeated measures model with fixed effects for baseline value, treatment group, visit, treatment-by-visit interaction and stratification factors. Covariance parameters were estimated using a restricted maximum likelihood method and Kenward-Rogers denominator degrees of freedom was used for the tests of fixed effects. An unstructured covariance matrix was used. In case of convergence issues, the following alternative structures were used for fitting (in this order): heterogeneous Toeplitz, heterogeneous autoregressive (1), heterogeneous compound symmetry, homogeneous compound symmetry. This analysis was repeated for other supportive outcome variables, including HRQoL measures and symptom scores (e.g., SF-36v2 [acute] domain scores, PCS and MCS, pain NRS, FACIT-F, and Lupus QoL). LLDAS followed the same CMH approach as the primary end point.
Table 9: Statistical Analysis of Key Efficacy End Points (TULIP-1 and TULIP-2)
End point | Statistical model | Adjustment factors | Sensitivity analyses |
|---|---|---|---|
TULIP-1 | |||
SRI-4 (primary end point) Defined as the difference in the number of patients in the anifrolumab and placebo groups achieving SRI-4 response at week 52 | CMH (95% CI; the weighted proportion was generated using normal approximation) | Stratified by:
| Tipping-point analyses to assess impact of premature discontinuation of IP (e.g., Pearson chi-square test) Sensitivity analysis with multiple imputations to assess the impact of intermediate missing data |
Maintained an OCS dosage of ≤ 7.5 mg/day. Defined as the difference in proportion of patients between the anifrolumab and placebo groups with a maintained OCS dosage of ≤ 7.5 mg/day from week 40 to 52, in the subgroup of patients with a baseline OCS ≥ 10 mg/day | Same as primary end point | Stratified by:
| Tipping-point analyses to assess impact of premature discontinuation of IPd |
CLASI activity score (key secondary end point) Defined as the difference in the number of patients with a ≥ 50% reduction in CLASI activity score at week 12 in the subgroup of patients with baseline CLASI activity score ≥ 10 | Same as primary end point | Same as primary end point | Tipping-point analyses to assess impact of premature discontinuation of IPd If at least 10 patients burst and taper OCS in the treatment arm, a CMH analysis will be repeated at week 12e |
Annualized flare rate through 52 weeks Defined as either 1 or more new BILAG-2004 A or 2 or more new BILAG-2004 B items compared to the previous visit | Negative binomial regression model | Adjustment for different exposure times: the logarithm (base e) of the follow-up time (flare exposure time) will be used as an offset variable in the model | Tipping-point analysis to assess the impact of premature discontinuation of IPd Controlled multiple-imputation methodf Flares based on modified BILAG |
SRI-4 at week 52 in the interferon-test high subgroup | Same as primary end point | Same as primary end point | Tipping-point analysis to assess the impact of premature discontinuation of IPd |
Other secondary variables: Change in SLEDAI-2K; PGA; change from baseline in the number of active, swollen, and tender joints; change from baseline in CLASI activity score; CLASI damage score; HRQoL measures; and symptom scores (e.g., SF-36v2 [acute] domain scores PCS and MCS, the pain NRS, FACIT-F, and Lupus QoL) | Repeated measures model with fixed effects for baseline value, treatment group, visit, treatment*visit interaction and stratification factors | Restricted maximum likelihood method and Kenward-Roger denominator degrees of freedom will be used for the tests of fixed effects; an unstructured covariance matrix was used. Heterogeneous Toeplitz, heterogeneous AR(1), heterogeneous CS, homogeneous CS was used for fitting in cases of convergence issues | NA |
LLDAS | Same as primary end point | Same as primary end point | Same as primary end point |
TULIP-2 | |||
BICLA at week 52 (primary end point) Defined as the difference in the number of patients in the anifrolumab and placebo groups achieving BICLA response at week 52 | CMH (95% CI, for the weighted proportion was generated using normal approximation) | Stratified by:
| Tipping-point analysis to assess the impact of premature discontinuation of IP and missing data (e.g., Pearson chi-square test) Sensitivity analysis assessing the impact of the following:
|
Time to BICLA response (secondary) | Cox proportional hazard models (using a profile likelihood approach with ties = Efron), estimated HRs and corresponding Cis will be presented for the effect of the treatment group; Kaplan-Meier plot will be presented | Same as primary end point | NA |
BICLA at week 52 in the interferon-test high subgroup (key secondary end point) | Same as primary end point | Same as primary end point | Tipping-point analysis to assess the impact of premature discontinuation of IPd |
Maintained OCS dosage reduction of ≤ 7.5 mg/day (key secondary end point) Defined as the difference in proportion of patients between the anifrolumab and placebo groups with a maintained OCS dosage of ≤ 7.5 mg/day from week 40 to 52, in the subgroup of patients with a baseline OCS dosage ≥ 10 mg/day | Same as primary end point | Stratified by:
| Tipping-point analysis to assess the impact of premature discontinuation of IPd |
CLASI activity score (key secondary end point) Defined as the difference in the number of patients with a ≥ 50% reduction in CLASI activity score at week 12 in the subgroup of patients with baseline CLASI activity score ≥ 10 | Same as primary end point | Same as primary end point | Tipping-point analysis to assess the impact of premature discontinuation of IPd If at least 10 patients burst and taper OCS in the treatment arm, a CMH analysis will be repeated for the at least 50% reduction in CLASI activity score (including all criteria) at week 12 excluding patients administered a burst and taper of OCS or IM steroids during the first 12 weeks of treatment |
Annualized flare rate through 52 weeks (key secondary end point) Defined as either 1 or more new BILAG-2004 A or 2 or more new BILAG-2004 B items compared to the previous visi | Negative binomial regression model | Adjustment for different exposure times: The logarithm (base e) of the follow-up time (flare exposure time) will be used as an offset variable in the model | Tipping-point analysis to assess the impact of premature discontinuation of IPd Controlled multiple-imputation methode,56 Flares while on treatment using a negative binomial regression model. Flares based on modified BILAG |
Joint reduction rate (key secondary end point) Defined as the difference in proportion of patients with at least 6 swollen and at least 6 tender joints at baseline who achieve at least 50% reduction in swollen and tender joints, respectively, at week 52 | Same as primary end point | Same as primary end point | Tipping-point analysis to assess the impact of premature discontinuation of IPd |
Other secondary variables: Change in SLEDAI-2K; PGA; change from baseline in the number of active, swollen, and tender joints; change from baseline in CLASI activity score; CLASI damage score; HRQoL measures; and symptom scores (e.g., SF-36v2 [acute] domain scores PCS and MCS, the pain NRS, FACIT-F, and Lupus QoL) | Repeated measures model with fixed effects for baseline value, treatment group, visit, treatment-by-visit interaction and stratification factors | Restricted maximum likelihood method and Kenward-Roger denominator degrees of freedom will be used for the tests of fixed effects; an unstructured covariance matrix was used. Heterogeneous Toeplitz, heterogeneous AR(1), heterogeneous CS, homogeneous CS was used for fitting in cases of convergence issues | NA |
LLDAS | Same as primary end point | Same as primary end point | Same as primary end point |
AR = autoregressive; BICLA = British Isles Lupus Assessment Group-based Composite Lupus Assessment; BILAG = British Isles Lupus Assessment Group; CI = confidence interval; CLASI = Cutaneous Lupus Erythematosus Disease Area and Severity Index; CMH = Cochran-Mantel-Haenszel; CS = compound symmetry; FACIT-F = Functional Assessment of Chronic Illness Therapy–Fatigue; HR = hazard ratio; HRQoL = health-related quality of life; IM = intramuscular; IP = investigational product; LLDAS = lupus low disease activity state; MCS = mental component score; NA = not applicable; OCS = oral corticosteroid; PCS = physical component score; PGA = Physician’s Global Assessment; QoL = quality of life; SF-36v2 = Short Form (36) Health Survey Version 2; SLEDAI-2K = Systemic Lupus Erythematosus Disease Activity Index 2000; SRI-4 = improvement of 4 points or greater on the Systemic Lupus Erythematosus Responder Index; VAS = visual analogue scale.
aFor the SLEDAI-2K score, if different measurements were available for re-screened patients, the value at rescreening was used.
bFor the classification, the derived OCS dose rounded to 1 decimal place will be used.
cType I interferon test stratum was recorded at randomization by the interactive voice/web response system. Within the stratum, substrata would be pooled together if the numbers in individual substrata were too low.
dOnly conducted if the nominal unadjusted P value is less than 0.05 for the outcome.
eExcluding patients administered a burst and taper of OCS or IM steroids during the first 12 weeks of treatment.
fThe method involves first fitting the main analysis (i.e., negative binomial regression model as described above) to the observed data. For each imputed dataset, first an independent sample is drawn from the approximate posterior distribution of the model parameters. This consists of sampling new regression coefficients from a multivariate normal distribution, with a mean equal to the observed data maximum likelihood estimate, and a covariance matrix corresponding to the maximum likelihood covariance estimate. A new (log) shape parameter is drawn from a normal distribution in the same way, which is exponentiated to give a draw of the shape of parameter k.56.
Source: Statistical Analysis Plan.13
Data Imputation Methods
For binary efficacy responder end points, any criteria with a missing value were imputed using the LOCF; however, this was only done if the missing data point was for a single visit for that component. Nonresponders were asked to continue to attend scheduled assessments through week 52 in both trials. In the event of 2 or more consecutive visits with missing data for the same component, the LOCF will be used for the first missing value of each sequence, after which the data will be imputed as nonresponders for the specific responder end point. If a component (e.g., SLEDAI-2K) is based on several data points, the LOCF will be used for the single data points. Missing safety data were generally not imputed.
For the primary outcome of both studies, if any of the criteria could not be evaluated at week 52 due to a missing value, that criterion was imputed using the LOCF and the primary end points were derived based on the complete data. This applies only if week 48 data are not missing, otherwise the patient will be defined as not achieving the primary end point at week 52.
Censoring Rules for Time-to-Event Analyses
In the TULIP-2 trial, for the outcome of time to BICLA response, patients without a BICLA response sustained up to week 52 were censored at the date of premature discontinuation of IP, or week 52, whichever occurred earlier. If patient did not prematurely discontinue treatment, but also did not have a week 52 assessment, then the date of the last-available BICLA assessment (latest of BILAG, SLEDAI and PGA date) before week 52 was used as the censoring date.
Subgroup Analyses
Subgroup analyses were planned a priori in the statistical analysis plan for groups of patients in both the TULIP-1 and TULIP-2 trials. For each subgroup the respective outcome and 95% CI was provided. Subgroup analyses were conducted for the primary outcomes of SRI-4 and BICLA in the TULIP-1 and TULIP-2 trials, respectively, and key secondary outcome of maintaining OCS dose reduction of no more than 7.5 mg between weeks 40 and 52 for the subgroup of patients with an OCS dose of 10 mg or higher at baseline. Subgroup analyses were conducted for the following factors:
SLEDAI-2K score at screening (< 10 points, ≥ 10 points)
OCS dose at baseline (< 10 mg/day, ≥ 10 mg/day prednisone or equivalent)
result of type I interferon gene signature test (high, low)
sex (female, male)
age (≥ 18 to 65 years, ≥ 65 years)
onset of disease (pediatric, adult)
BMI (≤ 30 kg/m2, > 30 kg/m2)
race (white, Black or African American, Asian, native Hawaiian or other Pacific Islander, American Indian or Alaska native, other)
ethnicity (Hispanic or Latino, non–Hispanic or Latino)
ADA result (positive at any time, negative, persistently positive, ADA-positive with a titre > median of maximum titre)
baseline anti-dsDNA positive or abnormal complement 3 and/or abnormal complement 4 proteins versus complementary group (≥ 1 positive/abnormal, all negative/normal).
Subgroup analyses were suppressed if any of the subpopulations in any treatment group consisted of fewer than 25 patients.
The following subgroups, planned a priori in the statistical analyses plan, aligned with the subgroups prespecified in the protocol for this CADTH review: SLEDAI-2K score at screening (< 10 points, ≥ 10 points); OCS dose at baseline (< 10 mg/day, ≥ 10 mg/day prednisone or equivalent); and type I interferon gene signature test (high, low). Only the subgroups identified in the CADTH review protocol are reported in the following efficacy section. The subgroup of OCS dose of 10 mg or higher is of importance to this CADTH review as the sponsor is requesting reimbursement for this subgroup of patients.
Sensitivity Analyses
Sensitivity analyses were performed using LOCF imputation on the responding population and tipping-point analyses were performed to examine the impact of missing data and nonresponder imputations (e.g., permanent discontinuation of the investigational product) on the primary and key secondary end points. Tipping-point analyses are intended to identify the point at which the results would tip from statistically significant to not statistically significant. Tipping-point analyses were only performed for the primary and key secondary end points that achieved a nominally statistically significant result (a P value < 0.05). These analyses varied the assumptions about outcomes among the subgroup of patients in the trials groups who prematurely discontinued the investigational product. Because the proportions of patients achieving the primary objective and key secondary end points were analyzed using a Pearson chi-square test, the stratification factors used in the main (CMH) analysis were disregarded. In addition, patients who prematurely discontinued the investigational product were altered from nonresponder to responder in an iterative manner.
For the primary end points of each trial, an extra sensitivity analysis was performed to examine the impact of intermediate missing data. Intermediate missing values of SRI-4 in the TULIP-1 trial and BICLA in TULIP-2 were imputed using multiple imputations based on the imputed values of the BILAG-2004, PGA, and SLEDAI-2K components. In addition, the primary end point of the TULIP-2 trial would be repeated using the modified BILAG-2004.
In terms of CLASI score for both trials, a further sensitivity analysis would be provided if at least 10 patients in the anifrolumab 300 mg or placebo treatment group have a burst and taper of OCS or intramuscular steroids during the first 12 weeks of treatment.
For flares in both trials, to examine the sensitivity of the results of the main analysis to deviations from the underlying assumptions, an additional analysis was performed using the controlled multiple-imputation method.56 As with the main analysis, the sensitivity analysis includes all data until patients complete or withdraw from the study regardless of whether they discontinue from randomized treatment. For this method, the number of flares after withdrawal from study will be imputed according to the observed number of flares before the withdrawal, a post withdrawal model assumption, the baseline covariates included in the main analysis model, and the time the patient would have remained in the study if not withdrawn (i.e., date of first administration of the investigational product + 364 days – date of last-available BILAG-2004 assessment).
Multiplicity Testing
If the primary end point was statistically significant, the 5 key secondary end points would be tested using the weighted Holm procedure57,58 to strongly control the familywise error rate at the 2-sided 5% level. The procedure applies alpha recycling according to the weights given in Figure 4 and Figure 5. The weights were chosen based on a combination of estimated power for the individual key secondary end points and their relative clinical importance. If any key secondary end point achieved statistical significance (i.e., had a 2-sided P value of less than or equal to the corresponding alpha level in the weighted Holm procedure), a statistically significant difference between the treatment groups for the key secondary end point would be declared.
Figure 4: Alpha Recycling Strategy for SRI-4 (TULIP-1)
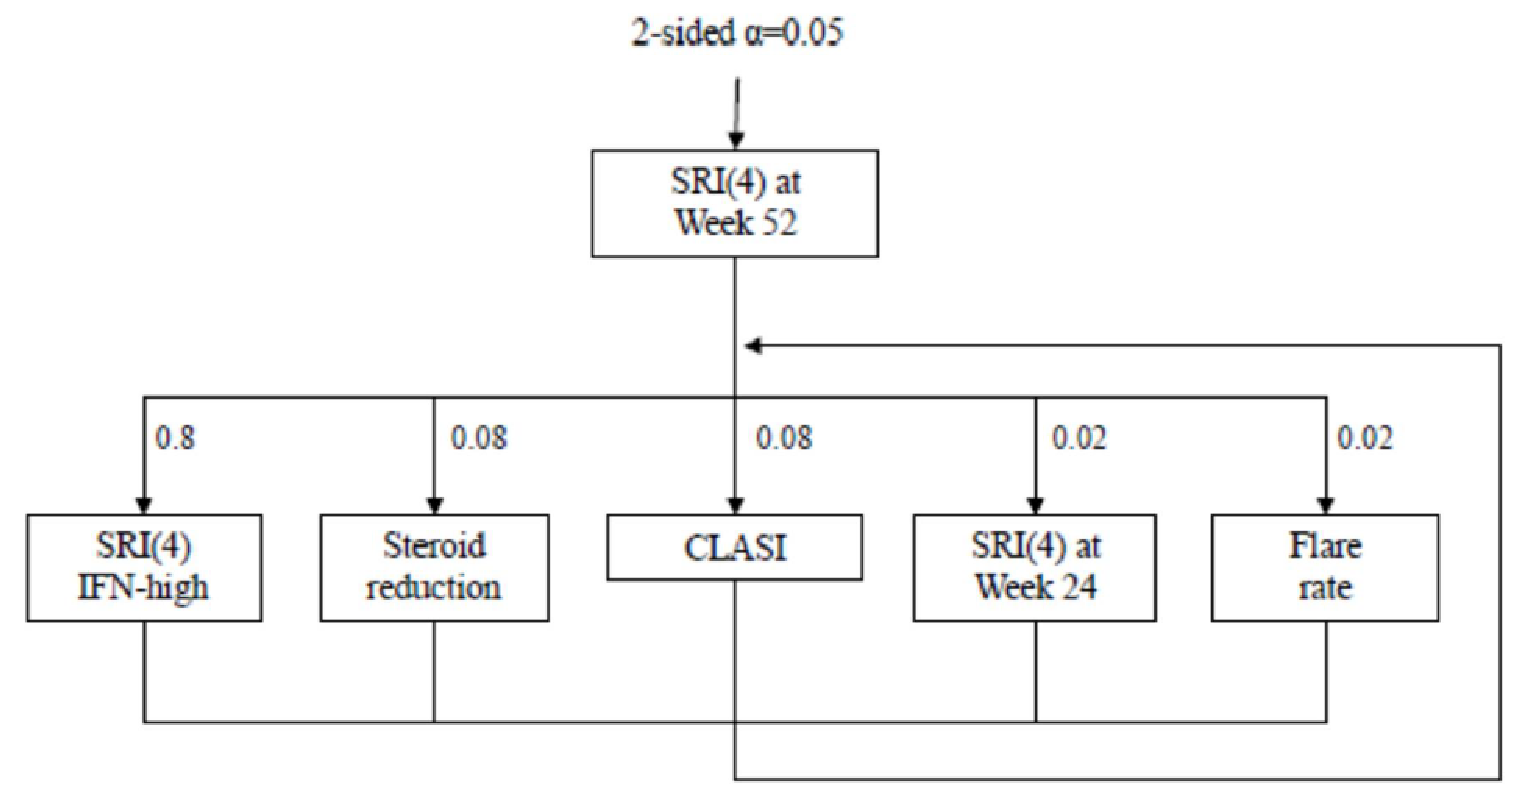
CLASI = Cutaneous Lupus Erythematosus Disease Area and Severity Index; IFN = interferon; SRI(4) = improvement of 4 points or greater on the Systemic Lupus Erythematosus Responder Index.
Figure 5: Alpha Recycling Strategy for BICLA (TULIP-2)
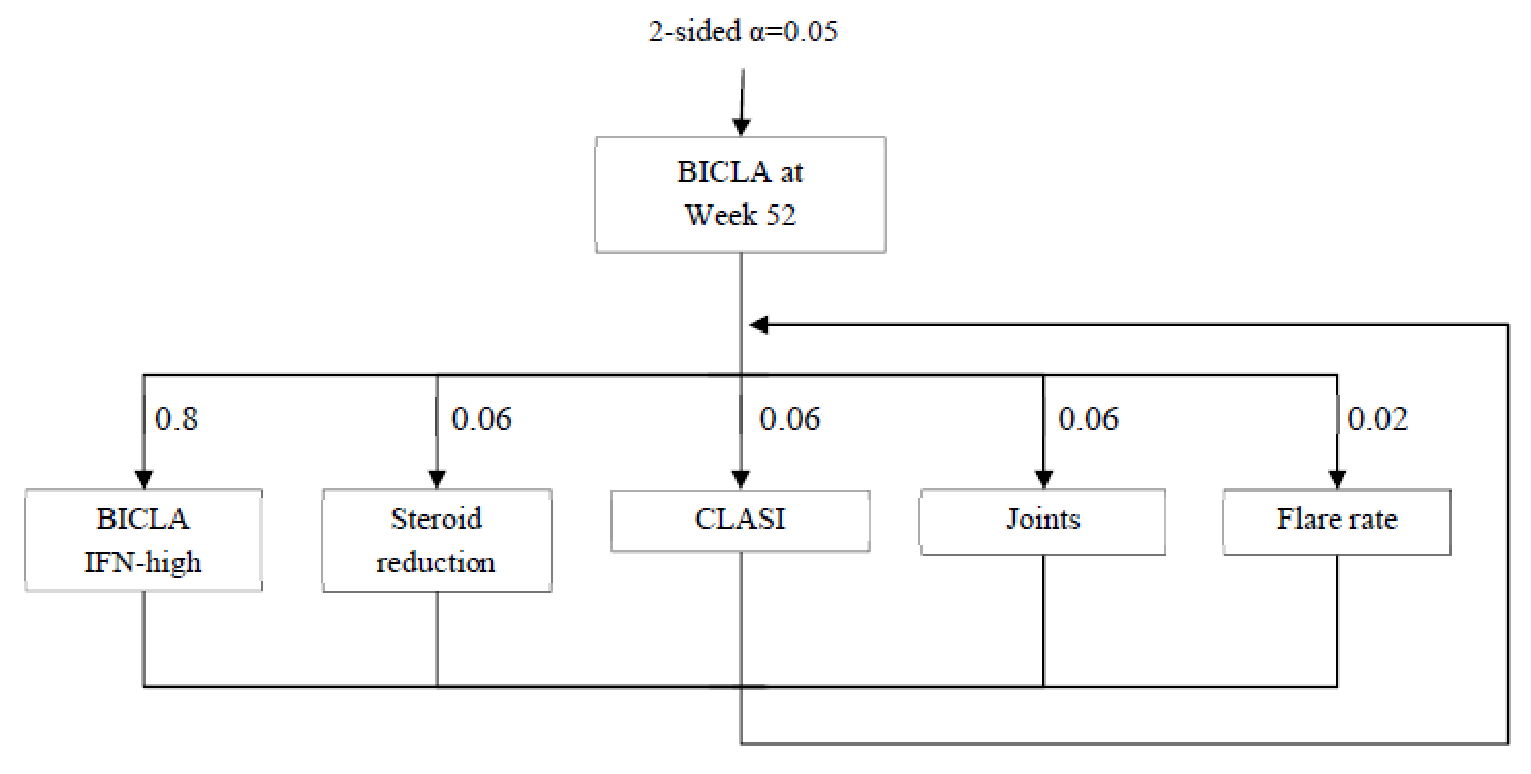
BICLA = British Isles Lupus Assessment Group-based Composite Lupus Assessment; CLASI = Cutaneous Lupus Erythematosus Disease Area and Severity Index; IFN = interferon.
Results
Patient Disposition
A summary of patient disposition in the pivotal trials is provided in Table 10. In the TULIP-1 and TULIP-2 trials, 847 and 649 patients respectively, were screened for eligibility into the trial. In total, the TULIP-1 trial had 180 and 184 patients who met eligibility and were randomized into the anifrolumab 300 mg and placebo groups, respectively (N = 384). In the TULIP-2 trial, 181 and 184 patients were randomized, respectively; however, 1 patient in the treatment group and 2 patients in placebo group were not treated because of an AE and failure to meet randomization criteria, respectively. In total 382 patients were randomized into the TULIP-2 trial. In the TULIP-1 trial, the rate of study discontinuation was similar between treatment groups — 18.9% and 19% in the anifrolumab and placebo groups, respectively. In the TULIP-2 trial, there were fewer discontinuations in the treatment group (13.3%) versus the placebo group (25.3%). In the TULIP-1 trial, the major reason for discontinuation was withdrawal by patient (8.3% and 8.2% in the anifrolumab and placebo groups, respectively) followed by AEs (6.7% and 2.7%, respectively). Similarly in the TULIP-2 trial, the major reason for discontinuation was withdrawal by patients (6.1% and 10.3%), followed by AEs (1.7% and 3.8%), and lack of efficacy (1.1% and 4.4%).
Table 10: Patient Disposition (Full Analysis Set)
Study detail | TULIP-1 | TULIP-2 | ||
|---|---|---|---|---|
Anifrolumab | Placebo | Anifrolumab | Placebo | |
Enrolled,a N | 847 | 649 | ||
Randomized, N (%)b | 180 | 184 | 181 | 184 |
Randomized but not treated with IPc | NA | NA | 1 (0.2) | 2 (0.3) |
Adverse event | NA | NA | 1 (0.2) | 0 |
Failure to meet randomized criteria | NA | NA | 0 | 2 (0.3) |
Completed the study, N (%) | 145d (80.6) | 144d (78.3) | 156 (86.7) | 136 (74.7) |
Discontinued from study, N (%) | 34 (18.9) | 35 (19.0) | 24 (13.3) | 46 (25.3) |
Reason for discontinuation, N (%) | ||||
Withdrawal by patient | 15 (8.3) | 15 (8.2) | 11 (6.1) | 19 (10.4) |
Adverse event | 12 (6.7) | 5 (2.7) | 3 (1.7) | 7 (3.8) |
Lack of efficacy | 4 (2.2) | 7 (3.8) | 2 (1.1) | 8 (4.4) |
Other | 2 (1.1) | 4 (2.2) | 5 (2.8) | 4 (2.2) |
Condition under investigation worsened | 1 (0.6) | 1 (0.5) | 1 (0.6) | 4 (2.2) |
Lost to follow-up | 0 | 2 (1.1) | 1 (0.6) | 3 (1.6) |
Severe noncompliance to protocol | 0 | 1 (0.5) | 0 | 1 (0.5) |
Development of study-specific withdrawal criteria | 0 | 0 | 1 (0.6) | 0 |
Completed study treatment | 144 (80.0) | 146 (79.3) | 153 (85.0) | 130 (71.4) |
Full analysis set, N | 180 | 184 | 180 | 182 |
Enrolled in the LTE study, N (%) | 126 (70.0) | 129 (70.1) | 133 (73.9) | 104 (57.1) |
IP = investigational product; LTE = long-term extension; NA = not applicable.
Note: Completion of the study is based upon the number of patients completing week 52 (visit 14) and either enrolled in the LTE or completed follow-up visit 2.
aInformed consent was received.
bPercentages are based upon all enrolled patients.
cWithdrawn from study according to analysis visit window. If applicable, measurements of follow-up visits are remapped to the respective analysis visit window up to week 52.
dThe sponsor did not provide explanation for the remaining patient in each of the treatment and placebo groups who neither completed nor discontinued from the study.
Source: Clinical Study Reports.9,10
Exposure to Study Treatments
Exposure data from the TULIP-1 and 2 trials are summarized in Table 11. In the TULIP-1 trial, exposure to the investigational product was similar, but slightly higher on average in the placebo group than in the anifrolumab group throughout the 52 weeks. However, in the case of the TULIP-2 trial, more patients in the anifrolumab 300 mg group were exposed to at least 48 weeks of the investigational product compared with those in the placebo group (85.6% versus 73.1%). Similarly, in the TULIP-2 trial, the total number of patient-years of treatment exposure was higher in the anifrolumab group compared with the placebo group (166.2 versus 155.5 patient-years of exposure, respectively). In addition, more patients in the anifrolumab group of the TULIP-2 trial received 13 infusions in total (70.0% versus 57.1% for the placebo group) compared to those in the TULIP-1 (62.8% versus 70.7%, respectively). For both studies, most patients were on some form of combination therapy for SLE as background, in addition to the study drugs. Missed infusions were not counted. Dose reductions or delays were not discussed in either pivotal trial.
Table 11: Duration of Exposure and Number of Infusions (Full Analysis Set)
Time points | TULIP1 | TULIP-2 | ||
|---|---|---|---|---|
Anifrolumab 300 mg (N = 180) | Placebo (N = 184) | Anifrolumab 300 mg (N = 180) | Placebo (N = 182) | |
Exposure ≥ 12 weeks | 170 (94.4) | 177 (96.2) | 177 (98.3) | 175 (96.2) |
Exposure ≥ 24 weeks | 160 (88.9) | 168 (91.3) | 166 (92.2) | 159 (87.4) |
Exposure ≥ 36 weeks | 152 (84.4) | 157 (85.3) | 159 (88.3) | 144 (79.1) |
Exposure ≥ 48 weeks | 146 (81.1) | 149 (81.0) | 154 (85.6) | 133 (73.1) |
Exposure ≥ 52 weeks | 127 (70.6) | 124 (67.4) | 127 (70.6) | 112 (61.5) |
Total number of infusions | ||||
1 infusion | 3 (1.7) | 4 (2.2) | 2 (1.1) | 4 (2.2) |
2 infusions | 5 (2.8) | 3 (1.6) | 1 (0.6) | 2 (1.1) |
3 infusions | 6 (3.3) | 4 (2.2) | 3 (1.7) | 6 (3.3) |
4 infusions | 3 (1.7) | 3 (1.6) | 3 (1.7) | 7 (3.8) |
5 infusions | 3 (1.7) | 4 (2.2) | 4 (2.2) | 4 (2.2) |
6 infusions | 4 (2.2) | 2 (1.1) | 3 (1.7) | 5 (2.7) |
7 infusions | 1 (0.6) | 6 (3.3) | 3 (1.7) | 7 (3.8) |
8 infusions | 2 (1.1) | 1 (0.5) | 1 (0.6) | 5 (2.7) |
9 infusions | 5 (2.8) | 4 (2.2) | 3 (1.7) | 8 (4.4) |
10 infusions | 2 (1.1) | 4 (2.2) | 5 (2.8) | 4 (2.2) |
11 infusions | 6 (3.3) | 5 (2.7) | 6 (3.3) | 8 (4.4) |
12 infusions | 27 (15.0) | 14 (7.6) | 20 (11.1) | 18 (9.9) |
13 infusions | 113 (62.8) | 130 (70.7) | 126 (70.0) | 104 (57.1) |
Total patient-years of exposure | 160.9 | 165.1 | 166.2 | 155.5 |
Note: Duration of exposure (days) = (last dosing date + 28 days) – first dosing date + 1.
Source: Clinical Study Reports.9,10
Protocol Deviations
Important protocol deviations in both the TULIP-1 and TULIP-2 trials are summarized in Table 12. Overall, rates of protocol deviations were similar in 2 trials and balanced across groups. Between the 2 studies, the treatment arm of the TULIP-2 trial had the fewest number of deviations (2.8%) while the placebo arm had the greatest number of deviations (4.9%).
Table 12: Important Protocol Deviations — TULIP-1 and TULIP-2 (Full Analysis Set)
Important protocol deviation, N (%) | TULIP-1 | TULIP-2 | ||
|---|---|---|---|---|
Anifrolumab (N = 180) | Placebo (N = 184) | Anifrolumab (N = 180) | Placebo (N = 182) | |
Number of patients with at least 1 important deviation | 7 (3.9) | 8 (4.3) | 5 (2.8) | 9 (4.9) |
Inclusion criteria | 1 (0.6) | 2 (1.1) | 0 | 0 |
Exclusion criteria | 0 | 1 (0.5) | 0 | 0 |
Lab data | 0 | 0 | 0 | 5 (2.7) |
Investigational product | 1 (0.6) | 2 (1.1) | 2 (1.1) | 1 (0.5) |
Visit window | 0 | 0 | 0 | 0 |
Informed consent | 1 (0.6) | 0 | 1 (0.6) | 1 (0.5) |
Concomitant medication | 0 | 1 (0.5) | 0 | 0 |
Principal investigator oversight | 2 (1.1) | 0 | 2 (1.1) | 2 (1.1) |
Othera | 2 (1.1) | 2 (1.1) | 0 | 0 |
aNot classified.
Note: The same patient may have had more than 1 important protocol deviation.
Source: Clinical Study Reports.9,10
Efficacy
Only those efficacy outcomes and analyses of subgroups identified in the review protocol are reported here. Results of the subgroup analysis, specifically the subgroup of patients with a high interferon-test result and the subgroup of patients with a baseline OCS dosage of 10 mg/day or higher (i.e., the population matching the reimbursement request), were available for certain end points and will be presented under each respective efficacy outcome. Detailed efficacy data are available in Appendix 3.
Disease Activity
British Isles Lupus Assessment Group-based Composite Lupus Assessment
A summary of BICLA responses for both pivotal trials is presented in Table 13.
In the TULIP-1 trial, BICLA was a secondary end point, and it was not tested for statistical significance. Despite this, treatment response was numerically greater among the anifrolumab group versus placebo group (10.1% treatment difference; 95% CI, 0.6 to 19.7) and this remained true for the individual components of the BICLA as well.
In the TULIP-2 trial, BICLA was the primary end point. There was a statistically significant improvement in BICLA response in the anifrolumab 300 mg group versus the placebo group (47.8% versus 31.5%;16.3% treatment difference; 95% CI, 6.3% to 26.3%; P value = 0.0013). The difference between groups was apparent as early as week 4 of the trial (Figure 6). The hazard ratio for time to BICLA response was 1.55 (95% CI, 1.11 to 2.18). All components of the BICLA contributed to the treatment effect, with a numerically larger proportion of patients in the treatment group meeting each component of the composite outcome compared to the placebo group (Table 13).
Results of the TULIP-2 sensitivity analyses are available in Appendix 3. The results were consistent with the results of the primary efficacy analysis and support the strength of the primary efficacy results. The tipping-point analysis, which examined the impact of nonresponder imputations due to discontinuation of the investigational product, found that 29% of nonresponders (12 of 41) in the placebo group needed to have been altered to responders to tip the conclusion from statistically significant to nonsignificant. The placebo response rate is a likely scenario assuming no additional patient on anifrolumab is considered a responder. However, because it is likely that more than 7 nonresponders could be altered to responders among the 26 discontinued patients in the anifrolumab group, it is unlikely that the results would tip from clinically significant to nonsignificant based on this analysis.
Subgroup Analysis by BICLA Response
A summary of BICLA response stratified by subgroups is presented in Table 14. A key secondary end point of the TULIP-2 trial was achievement of BICLA response through week 52 in the type I interferon high-status subgroup. BICLA response rates were higher in the subgroup of interferon high patients treated with anifrolumab 300 mg compared with placebo (17.3% treatment difference; 95% CI, 6.5 to 28.2, adjusted P value = 0.0022). A tipping-point analysis was used to assess the impact of patients who discontinued the investigational product. In the TULIP-2 trial, 24 and 32 patients in the anifrolumab and placebo groups, respectively, discontinued the product. Based on the tipping-point analysis, 31.3% nonresponders (10 of 32) in the placebo group would need to be altered to responders to tip the conclusion from statistically significant to nonsignificant, if no additional patient in the anifrolumab group is considered a responder. However, because more than 5 responders are likely to be observed among the 24 discontinued patients, it is unlikely for the response to tip from statistically significant to nonsignificant based on this analysis.
In the TULIP-2 trial, a numerically larger proportion of the subgroup of patients with an OCS dosage of 10 mg/day or higher in the anifrolumab group achieved a BICLA response compared to placebo (12% treatment difference; 95% CI, −2.5 to 26.6). Overall, the subgroup analyses (interferon-test result; SLEDAI-2K score at screening) support the results seen in the main analysis of the TULIP-2 trial. In the TULIP-1 trial, high BICLA interferon-test results were consistent with the TULIP-2 trial; other subgroups were not evaluated for BICLA response in the TULIP-1 trial.
Table 13: Summary of Key Response Variables in TULIP-1 and TULIP-2
Characteristic | TULIP-1 Anifrolumab (N = 180) | TULIP-1 Placebo (N = 184) | TULIP-2 Anifrolumab (N = 180) | TULIP-2 Placebo (N = 182) | |
|---|---|---|---|---|---|
BICLA at week 52a | |||||
N | 180 | 184 | 180 | 182 | |
Responderb (%) | 67 (37.1) | 49 (27.0) | 86 (47.8) | 57 (31.5) | |
Treatment-group difference vs. placebo (95% CI) | 10.1 (0.6 to 19.7) | 16.3 (6.3 to 26.3) | |||
P value | NR | 0.0013c | |||
Time to BICLA response, HR (95% CI) | NR | 1.55 (1.11 to 2.18)d | |||
BICLA response in interferon-test high subgroupa | |||||
N | 148 | 151 | 150 | 151 | |
Responder (%) | 68 (45.9) | 41 (27.5) | 72 (48.0) | 46 (30.7) | |
Treatment-group difference vs. placebo (95% CI) | 18.4 (7.7 to 29.1) | 17.3 (6.5 to 28.2) | |||
P value | NR | 0.0018c | |||
SRI-4 response at week 52a | |||||
N | 180 | 184 | 180 | 182 | |
Respondere (%) | 65 (36.2) | 74 (40.4) | 100 (55.5) | 68 (37.3) | |
Treatment-group difference vs. placebo (95% CI) | 4.2 (−14.2 to 5.8) | 18.2 (8.1 to 28.3) | |||
P value | 0.412c | NR | |||
SRI-4 response in interferon-test high subgroupa | |||||
N | 148 | 151 | 150 | 151 | |
Responder (%) | 53 (35.9) | 59 (39.3) | 85 (56.6) | 55 (36.3) | |
Treatment-group difference vs. placebo (95% CI) | −3.4 (−14.4 to 7.6) | 20.3 (9.2 to 31.3) | |||
P value | 0.549c | NR | |||
Individual components of BICLA at week 52 | |||||
BILAG improvementf | 67 (37.2) | 51 (27.7) | 88 (48.9) | 59 (32.4) | |
No worsening of SLEDAI-2Kf | 98 (54.4) | 96 (52.2) | 122 (67.8) | 94 (51.6) | |
No worsening of PGAf | 94 (52.2) | 96 (52.2) | 122 (67.8) | 95 (52.2) | |
No discontinuation of IP | 144 (80.0) | 146 (79.3) | 153 (85.0) | 130 (71.4) | |
No use of medication beyond protocol-allowed threshold | 114 (63.3) | 113 (61.4) | 144 (80.0) | 123 (67.6) | |
BICLA responder | 67 (37.1) | 49 (27.0) | 86 (47.8) | 57 (31.5) | |
Individual components of the SRI-4 at week 52 | |||||
≥ 4-point reduction in SLEDAI-2Kf | 66 (36.7) | 75 (40.8) | 101 (56.1) | 71 (39.0) | |
No worsening of BILAGf | 96 (53.3) | 96 (52.2) | 125 (69.4) | 94 (51.6) | |
No worsening of PGAf | 94 (52.2) | 96 (52.2) | 122 (67.8) | 95 (52.2) | |
No discontinuation of IP | 144 (80.0) | 146 (79.3) | 153 (85.0) | 130 (71.4) | |
No use of medication beyond protocol allowed threshold | 114 (63.3) | 113 (61.4) | 144 (80.0) | 123 (67.6) | |
SRI-4 responder | 65 (36.2) | 74 (40.4) | 100 (55.5) | 68 (37.3) | |
BILAG-2004 global | |||||
Baseline, N | 180 | 184 | 180 | 182 | |
Mean score at baseline (SD) | 19.8 (6.28) | 18.9 (5.45) | 18.6 (4.72) | 19.0 (5.00) | |
Week 52, N | 143 | 147 | 153 | 141 | |
Mean score at week 52 (SD) | 6.8 (7.18) | 8.3 (6.89) | 6.1 (6.28) | 7.9 (6.72) | |
Mean change from baseline to week 52 (SD) | −13.0 (8.01) | −10.7 (7.72) | −12.4 (7.43) | −10.9 (7.58) | |
SLEDAI-2Kg | |||||
Baseline, N | 180 | 184 | 180 | 182 | |
Mean score at baseline (SD) | 11.3 (4.04) | 11.5 (3.50) | 11.4 (3.64) | 11.5 (3.88) | |
Week 52, N | 143 | 149 | 152 | 141 | |
Mean change from baseline to week 52 (SE) | −6.0 (0.34) | −5.3 (0.33) | −6.0 (0.31) | −4.9 (0.32) | |
Comparison with placebo, LSM difference (95% CI) | −0.7 (−1.6 to 0.2) | −1.2 (−2.0 to −0.3) | |||
PGA, VAS scoreg | |||||
Baseline, N | 180 | 184 | 180 | 182 | |
Mean score at baseline (SD) | 1.87 (0.40) | 1.84 (0.38) | 1.68 (0.41) | 1.76 (0.40) | |
Week 52, N | 143 | 149 | 153 | 141 | |
Mean score at week 52 | NR | NR | NR | NR | |
LSM at week 52 (SE) | −1.11 (0.05) | −0.89 (0.05) | −0.90 (0.05) | −0.76 (0.05) | |
Comparison with placebo, LSM difference (95% CI) | −0.22 (−0.36 to −0.08) | −0.15 (−0.28 to −0.01) | |||
BICLA = British Isles Lupus Assessment Group-based Composite Lupus Assessment; BILAG-2004 = British Isles Lupus Assessment Group 2004; CI = confidence interval; CMH = Cochran-Mantel-Haenszel; HR = hazard ratio; LSM = least squares mean; NR = not reported; OCS = oral corticosteroid; PGA = Physician’s Global Assessment; SD = standard deviation; SE = standard error; SLEDAI-2K = Systemic Lupus Erythematosus Disease Activity Index 2000; SRI-4 = improvement of 4 points or greater on the Systemic Lupus Erythematosus Responder Index; VAS = visual analogue scale; vs. = versus.
Note: Baseline is defined as the last measurement before randomization and dose administration on day 1.
aThe responder and nonresponder rates (percentages), the difference in estimates, and associated 95% CIs are weighted and calculated using a stratified CMH approach, with stratification factors (SLEDAI-2K score at screening [< 10 points vs. ≥ 10 points], week 0 OCS dose [< 10 mg/day vs. ≥ 10 mg/day prednisone or equivalent] and type I interferon-test result at screening [high vs. low]).
bBICLA response is defined as a reduction of all baseline BILAG-2004 A and B scores and no worsening in other organ systems, no worsening from baseline in SLEDAI-2K, and no increase of 0.30 points or more on a 3-point PGA VAS from baseline. Patients treated with restricted medication beyond protocol allowed thresholds, and those who discontinued investigational product, are regarded as nonresponders. Percentages are based on all patients in the full analysis set.
cP value has not been adjusted for multiple testing (i.e., the type I error rate has not been controlled).
dHRs and 95% CIs for HRs are estimated using a Cox regression model with treatment groups and the stratification factors (SLEDAI-2K score at screening (< 10 points vs. ≥ 10 points), week 0 OCS dose (< 10 mg/day vs. ≥ 10 mg/day prednisone or equivalent) and type I interferon-test result at screening (high vs. low)) as covariates. Time to BICLA response sustained up to week 52 is defined as the visit of first BICLA response sustained up to and including week 52. A patient is considered to have achieved BICLA response sustained up to week 52 if response is achieved at week 52 with “time to” defined as the first time point where a BICLA response is achieved when maintained through week 52. Patients without a BICLA response sustained up to week 52 will be censored at the date of premature discontinuation of IP, or week 52, whichever occurs earlier.
eSRI-4 response is defined as a reduction from baseline of 4 or more points in the SLEDAI-2K, no new BILAG-2004 organ systems affected (defined as 1 or more new A items or 2 or more new B items compared to baseline) and no increase of 0.30 or more points on a 3-point PGA VAS. Patients treated with restricted medication beyond protocol-allowed threshold, and those who discontinued investigational product, are regarded as nonresponders. Percentages are based upon all patients in the full analysis set.
fPatients who discontinued the investigational product or used medications beyond protocol allowed threshold are considered nonresponders and not included in this category.
gA repeated measures model with fixed effects for baseline value, treatment group, visit, treatment*visit interaction and stratification factors (SLEDAI-2K score at screening (< 10 points vs. ≥ 10 points), week 0 OCS dose (< 10 mg/day vs. ≥ 10 mg/day prednisone or equivalent) and type I interferon-test result at screening (high vs. low) was used.
Source: Clinical Study Reports.9,10
Table 14: BICLA Response by Subgroup at Week 52 — Interferon-Test High, SLEDAI Greater Than 10, and OCS Dosage of 10 mg/day or Higher (Full Analysis Set)
Characteristic | TULIP-1 Anifrolumab (N = 180) | TULIP-1 Placebo (N = 184) | TULIP-2 Anifrolumab (N = 180) | TULIP-2 Placebo (N = 182) |
|---|---|---|---|---|
BICLA response at week 52 in interferon-test high vs. low patientsa | ||||
Interferon-test high responder/N (%) | 68/148 (45.9) | 41/151 (27.5) | 72/150 (48.0) | 46/151 (30.7) |
Treatment-group difference vs. placebo (95% CI) | 18.4 (7.7 to 29.1) | 17.3 (6.5 to 28.2) | ||
P value | NR | 0.0018b | ||
Adjusted P value | NR | 0.0022c | ||
Interferon-test low responder/N (%) | NR | 14/30 (46.7) | 11/31 (35.5) | |
Treatment-group difference vs. placebo (95% CI) | NR | 11.2 (−13.5 to 35.8) | ||
P value | NR | NR | ||
BICLA response by SLEDAI-2K score at screening | ||||
< 10 points n (%) | NR | 28/54 (51.8) | 19/52 (36.5) | |
Treatment-group difference vs. placebo (95% CI) | NR | 15.3 (−3.3 to 33.9) | ||
≥ 10 points n (%) | NR | 58/126 (46.2) | 38/130 (29.5) | |
Treatment-group difference vs. placebo (95% CI) | NR | 16.7 (4.9 to 28.5) | ||
P value | NR | NR | ||
BICLA response by OCS dose at screening | ||||
OCS dose at baseline < 10 mg/day | NR | 46/93 (49.5) | 29/99 (29.4) | |
Treatment-group difference vs. placebo (95% CI) | NR | 20.1 (6.5 to 33.7) | ||
OCS dose at baseline ≥ 10 mg/day | NR | 40/87 (45.8) | 28/83 (33.8) | |
Treatment-group difference vs. placebo (95% CI) | NR | 12.0 (−2.5 to 26.6) | ||
P value | NR | NR | ||
BICLA = British Isles Lupus Assessment Group-based Composite Lupus Assessment; CI = confidence interval; NR = not reported; OCS = oral corticosteroid; SLEDAI = Systemic Lupus Erythematosus Disease Activity Index; SLEDAI-2K = Systemic Lupus Erythematosus Disease Activity Index 2000; vs. = versus.
aThe responder and nonresponder rates (percentages), the difference in estimates, and associated 95% CIs are weighted and calculated using a stratified Cochran-Mantel-Haenszel approach with stratification factors (SLEDAI-2K score at screening [< 10 points vs. ≥ 10 points], baseline OCS dose [< 10 mg/day vs. ≥ 10 mg/day prednisone or equivalent] and type I interferon-test result at screening [high vs. low]).
bP value has not been adjusted for multiple testing (i.e., the type I error rate has not been controlled).
cP values were adjusted for multiplicity using the Holm procedure. As prespecified in the statistical analysis plan, the TULIP-1 trial did not adjust secondary outcomes for multiplicity because the primary end point was not met.
Source: Clinical Study Reports and appendices.9,10
Figure 6: Time to BICLA Response TULIP-2 (Full Analysis Set)
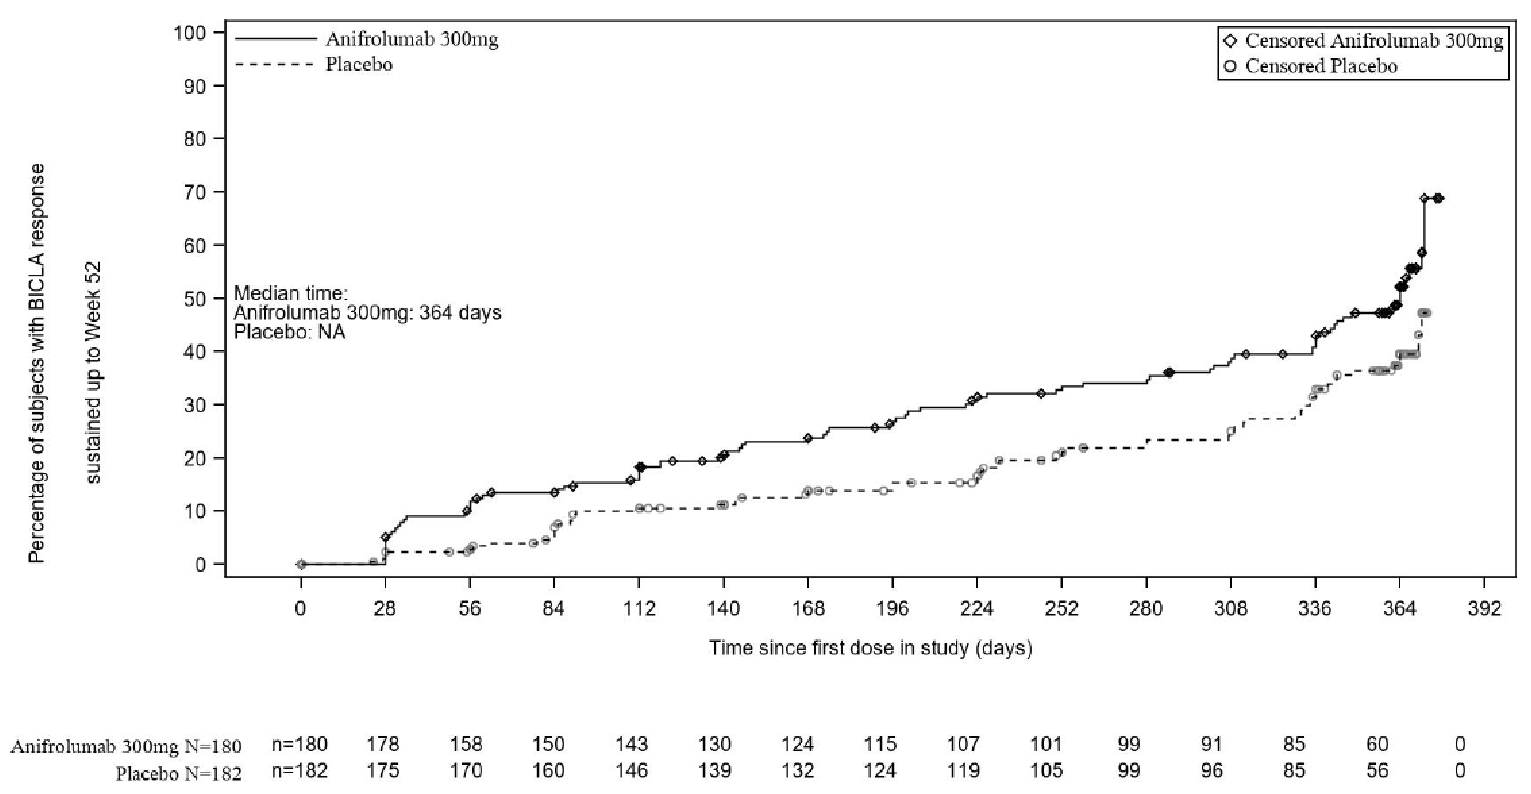
BICLA = British Isles Lupus Assessment Group-based Composite Lupus Assessment; NA = not applicable.
Improvement of 4 points or Greater on the Systemic Lupus Erythematosus Responder Index
Key summary results from the pivotal trials are presented in Table 13. SRI-4 response at week 52, the primary end point of the TULIP-1 trial, did not demonstrate statistical significance (4.2% treatment difference; 95% CI, −14.2% to 5.8%; P value = 0.412). Overall, disease activity as measured by SRI-4 response at week 52 in the TULIP-1 trial was similar between patients receiving anifrolumab 300 mg and placebo, as well as the individual components of the SRI-4 response. In the TULIP-2 trial, an SRI-4 at week 52 was a secondary end point and was not tested for statistical difference. Despite this, a numerically larger proportion of patients in the treatment group versus the placebo group achieved an SRI-4 at week 52 (18.2% treatment difference; 95% CI, 8.1 to 28.3).
Improvements by 5, 6, 7, or 8 points on the SRI were not tested for statistical significance in either study; however, results for these end points were variable in the TULIP-1 and TULIP-2 trials (Appendix 3). In the TULIP-1 trial the results of these analysis were variable, while in the TULIP-2 trial, the results of these end points were consistent with the SRI-4 response, with a greater number of patients achieving a response in the anifrolumab group for all SRI values (Table 39).
Results of the TULIP-1 sensitivity analyses are available in Appendix 3. The results for multiple imputations showed a larger proportion of patients in the placebo group achieving an SRI-4 at week 52 compared to the anifrolumab 300 mg group (Table 40). In contrast, the TULIP-2 sensitivity analyses supported the finding that SRI-4 responses was more common in the anifrolumab group (18.5% treatment difference; 95% CI, 8.3 to 28.7) compared to placebo (Table 41).
Subgroup Analysis by SRI-4 Response
A summary of SRI-4 response stratified by subgroups is presented in Table 15. A key secondary end point of the TULIP-1 trial was the achievement of SRI-4 response through week 52 in the type I interferon high-status subgroup. Results were nonsignificant in the TULIP-1 trial (−3.4% treatment difference; 95% CI, −14.4 to 7.6, P = 0.549). In the subgroup of patients with an OCS dosage at baseline of 10 mg/day or higher (i.e., the subgroup matching the reimbursement request), there was a 5.3% higher SRI-4 response in the placebo group versus the anifrolumab group (95% CI, −20.2 to 9.6). Overall, a numerically higher proportion of patients in the placebo group compared to anifrolumab 300 mg achieved an SRI-4 response across all subgroups in the TULIP-1 trial.
The TULIP-2 trial did not statistically assess SRI-4 responses in interferon high patients as it was a secondary end point; however, a larger proportion of patients in the anifrolumab group achieved an SRI-4 response versus the placebo group (20.3% treatment difference; 95% CI, 9.2 to 31.3). In the subgroup of patients with an OCS dosage at baseline of 10 mg/day or higher there was a 16.5% higher response in SRI-4 in the treatment group versus the placebo group (95% CI, 2.6 to 30.4). Overall, the subgroup analysis was consistent with the results from the SRI-4 FAS analysis of the TULIP-2 trial, with a greater response achieved in the anifrolumab group.
Table 15: SRI-4 Response by Subgroup at Week 52 — Interferon-Test High, SLEDAI 10 or Greater, and OCS Dosage 10 mg/day or Higher (Full Analysis Set)
Characteristica | TULIP-1 Anifrolumab (N = 180) | TULIP-1 Placebo (N = 184) | TULIP-2 Anifrolumab (N = 180) | TULIP-2 Placebo (N = 182) | |
|---|---|---|---|---|---|
SRI-4 response in interferon-test high and low patients | |||||
Interferon-test high/N(%) | 53/148 (35.9) | 59/151 (39.3) | 85/150 (56.6) | 55/151 (36.3) | |
Treatment-group difference vs. placebo (95% CI) | −3.4 (−14.4 to 7.6) | 20.3 (9.2 to 31.3) | |||
P value | 0.549b | NR | |||
Interferon-test low/N (%) | 12/32 (37.5) | 15/33 (45.5) | 15/30 (50.0) | 13/31 (41.9) | |
Treatment-group difference vs. placebo (95% CI) | −8.0 (−31.9 to 16.0) | 8.1 (−16.9 to 33.0) | |||
SRI-4 response by SLEDAI-2K score at screening | |||||
< 10 points/N (%) | 19/55 (34.9) | 19/54 (35.9) | 26/54 (48.1) | 16/52 (30.7) | |
Treatment-group difference vs. placebo (95% CI) | −1.1 (−19.1 to 17.0) | 17.4 (−1.1 to 35.8) | |||
≥ 10 points/N (%) | 46/125 (36.8) | 55/130 (42.4) | 74/126 (58.6) | 52/130 (40.0) | |
Treatment-group difference vs. placebo (95% CI) | −5.6 (−17.6 to 6.4) | 18.6 (6.5 to 30.7) | |||
SRI-4 response by OCS dose at screening | |||||
OCS dose at baseline < 10 mg/day/N (%) | 25/77 (32.7) | 31/82 (38.0) | 50/93 (53.8) | 37/99 (37.3) | |
Treatment-group difference vs. placebo (95% CI) | −5.3 (−20.2 to 9.6) | 16.5 (2.6 to 30.4) | |||
OCS dose at baseline ≥ 10 mg/day/N (%) | 40/103 (39.2) | 43/102 (42.3) | 50/87 (57.2) | 31/83 (37.3) | |
Treatment-group difference vs. placebo (95% CI) | −3.1 (−16.5 to 10.3) | 19.9 (5.2 to 34.6) | |||
CI = confidence interval; NR = not reported; OCS = oral corticosteroids; SLEDAI = Systemic Lupus Erythematosus Disease Activity Index; SLEDAI-2K = Systemic Lupus Erythematosus Disease Activity Index 2000; SRI-4 = improvement of 4 points or greater on the Systemic Lupus Erythematosus Responder Index; vs. = versus.
aThe responder and nonresponder rates (percentages), the difference in estimates, and associated 95% CIs are weighted and calculated using a stratified Cochran-Mantel-Haenszel approach with stratification factors (SLEDAI-2K score at screening [< 10 points vs. ≥ 10 points], baseline OCS dose [< 10 mg/day vs. ≥ 10 mg/day prednisone or equivalent] and type I interferon-test result at screening [high vs. low]).
bP value has not been adjusted for multiple testing (i.e., the type I error rate has not been controlled). As prespecified in the statistical analysis plan, the TULIP-1 trial did not adjust secondary outcomes for multiplicity because the primary end point was not met.
Source: Clinical Study Reports and appendices.9,10
SLEDAI-2K
Key summary results from the pivotal trials are presented in Table 13. In the TULIP-1 and TULIP-2 trials, the mean total SLEDAI-2K scores at baseline were 11.5 (SD = 3.5) and 11.5 (SD = 3.88), respectively, in the placebo group, and 11.3 (SD = 4.04) and 11.4 (SD = 3.64), respectively, in the anifrolumab group. In the TULIP-1 trial, there was virtually no difference in the change from baseline in total SLEDAI-2K score across the anifrolumab and placebo groups at week 52 (0.7% treatment difference; 95% CI, −1.6 to 0.2). The same result was seen in the TULIP-2 trial (−1.2% treatment difference; 95% CI, −2.0 to −0.3). Generally higher improvement rates were observed across the individual domains of the SLEDAI-2K in the anifrolumab 300 mg group compared with the placebo group for both trials (Appendix 3).
British Isles Lupus Assessment Group 2004
Key summary results from the pivotal trials are presented in Table 13. Both trials saw similar improvements from baseline to week 52 in BILAG global scores. In the TULIP-1 trial, the mean changes (improvements) at week 52 from baseline in the BILAG global score were −13.0 (SD = 8.01) and −10.7 (SD = 7.72) in the anifrolumab 300 mg and placebo groups, respectively. In the TULIP-2 trial, the mean changes from baseline were −12.4 (SD = 7.43) and −10.9 (SD = 7.58) in the anifrolumab 300 mg and placebo groups, respectively.
Detailed information on BILAG by A/B versus C/D at baseline and week 52, are presented in Table 42 and Table 43 in Appendix 3. In both trials, the most frequently involved organ systems at baseline were the musculoskeletal and mucocutaneous organ systems, then cardiovascular and renal, in both groups. Numerically higher proportions of patients in the anifrolumab 300 mg group showed improvements in BILAG A, B, or C scores compared with the placebo group starting at week 4 in the musculoskeletal organ system and at week 16 in the mucocutaneous organ systems.
Physician’s Global Assessment
Key summary results from the pivotal trials are presented in Table 13. Mean change in PGA global scores from baseline to week 52 was similar across both study in both trials. In the TULIP-1 trial, the improvements in PGA were slightly higher in the anifrolumab group compared to the placebo group (−0.22 treatment difference; 95% CI, −0.36 to −0.08). In the TULIP-2 trial, the results were the same (−0.15 treatment difference; 95% CI, −0.28 to −0.01).
Maintenance of Oral Corticosteroid Reduction
Results of the key secondary end point of a maintained OCS reduction of up to 7.5 mg/day between week 40 and 52 from the pivotal trials are presented in Table 16. In the TULIP-1 trial, for patients with a baseline OCS dosage of 10 mg/day or higher, there was no statistically significant difference between the anifrolumab (N = 103) and placebo groups (N = 102) (8.9% treatment difference; 95% CI, −4.1% to 21.9%; P value = 0.180) on maintained OCS dose reduction. In the TULIP-2 trial, a statistically significant difference was observed in the anifrolumab group (N = 87), with 51.5% of patients able to taper their OCS dosage from 10 mg/day or higher to 7.5 mg/day or lower at week 40 and maintain this lower dosage through week 52 versus 30.2% in the placebo group (N = 83) (21.2% treatment difference; 95% CI, 6.8 to 35.7; adjusted P value = 0.0135). The mean changes from baseline in OCS dosage to week 52 are portrayed in Figure 7.
A tipping-point analysis was conducted to examine the impact of nonresponders (e.g., patients treated with restricted medication beyond protocol-allowed thresholds, including those with an increase in their OCS dose after week 40, and those who discontinued the investigational product) on the results. Given that the TULIP-1 trial did not have a statistically significant result, sensitivity analyses were not performed on this key secondary end point. In the TULIP-2 trial, 13 and 26 patients in the anifrolumab and placebo groups, respectively, discontinued the investigational product, without having received restricted medication before discontinuation. The tipping-point analysis shows that 23.1% (6 of 26) of these discontinued placebo patients would have to be altered from nonresponders to responders to tip the conclusion from statistical significance to nonsignificance, assuming that no additional patient on anifrolumab is considered a responder. The placebo response rate is likely, and it is also likely to observe more than 8 responders among the 13 discontinued patients in the anifrolumab group. A shift to nonsignificance may occur with ease based on this analysis.
Subgroup Analysis by Maintained Oral Corticosteroid Dose Reduction
A summary of maintained OCS dose reduction stratified by subgroups is presented in Table 16. In the subgroup of patients with a high result on an interferon test in the TULIP-1 trial, the number of patients who maintained an OCS dosage reduction to no more than 7.5 mg/day in the subgroup of patients with an OCS dosage of 10 mg/day or higher was 10% higher (95% CI, 3.8 to 23.9) in the anifrolumab group (N = 90) versus the placebo group (N = 86). In the TULIP-2 trial, maintained OCS dosage reduction was 21.2% higher in the anifrolumab group (N = 78) versus the placebo group (N = 73). However, given the small sample sizes and exploratory nature of this analysis, the results should be interpreted with caution. Subgroups of patients with SLEDAI-2K below 10 points and 10 points or higher had a higher proportion of patients (5.8% treatment difference; 95% CI, −20.4 to 31.9; and 10.1% treatment difference, 95% −4.8 to 25.1, respectively) maintaining OCS dosage reduction in the anifrolumab group (N = 29 and 74 respectively) versus the placebo group (N = 25 and 77 respectively). The results were similar in the TULIP-2 trial, with a higher number of patients in the anifrolumab group maintaining an OCS dosage reduction for both subgroups of SLEDAI-2K at screening.
Table 16: Maintained OCS Reduction of 7.5mg/day or Lower from Week 40 to Week 52 in Patients With OCS Dosage of 10 mg/day or Higher at Baseline Results in TULIP-1 and TULIP
Characteristic | TULIP-1 Anifrolumab (N = 180) | TULIP-1 Placebo (N = 184) | TULIP-2 Anifrolumab (N = 180) | TULIP-2 Placebo (N = 182) |
|---|---|---|---|---|
N | 103 | 102 | 87 | 83 |
Respondera (%) | 42 (41.0) | 33 (32.1) | 45 (51.5) | 25 (30.2) |
Treatment-group difference vs. placebo (95% CI) | 8.9 (−4.1 to 21.9) | 21.2 (6.8 to 35.7) | ||
P value | 0.180b | 0.0040b | ||
Adjusted P value | NA | 0.0135c | ||
Subgroup (interferon-test high vs. low patients)d | ||||
Interferon-test high responder/N (%) | 34/90 (37.8) | 24/86 (27.8) | 43 /78 (55.1) | 23/73 (31.5) |
Treatment-group difference vs. placebo (95% CI) | 10.0 (−3.8 to 23.9) | 23.6 (8.2 to 39.1) | ||
Interferon-test low responder/N (%) | 8/13 (61.5) | 9/15 (60.0) | 2/9 (22.2) | 2/10 (20.0) |
Treatment-group difference vs. placebo (95% CI) | 1.5 (−35.1 to 38.1) | 2.2 (−38.9 to 43.4) | ||
Subgroup (SLEDAI-2K score at screening) | ||||
Responder < 10 points/N (%) | 12/29 (41.7) | 9/25 (35.9) | 12/23 (53.4) | 6/21 (28.9) |
Treatment-group difference vs. placebo (95% CI) | 5.8 (−20.4 to 31.9) | 24.5 (−3.8 to 52.8) | ||
Responder ≥ 10 points/N (%) | 30/74 (40.8) | 24 /77(30.6) | 33/64 (51.3) | 19/62 (31.1) |
Treatment-group difference vs. placebo (95% CI) | 10.1 (−4.8 to 25.1) | 20.2 (3.2 to 37.1) | ||
CI = confidence interval; NA = not applicable; OCS = oral corticosteroids; LEDAI-2K = Systemic Lupus Erythematosus Disease Activity Index 2000; vs. = versus.
aMaintained OCS reduction is defined as an OCS dosage of no more than 7.5 mg/day by week 40 without a dose increase between week 40 and week 52. Percentages are based upon all patients in the full analysis set with a baseline OCS dosage of 10 mg/day or higher. OCS are described as “prednisone or equivalent.” An OCS administered pro re nata is not considered in the calculation of the daily dose. Patients treated with restricted medication beyond protocol allowed thresholds, and those who discontinued the investigational product, are regarded as nonresponders.
bP value has not been adjusted for multiple testing (i.e., the type I error rate has not been controlled).
cP values were adjusted for multiplicity using the Holm procedure. As prespecified in the statistical analysis plan, the TULIP-1 trial did not adjust secondary outcomes for multiplicity because the primary end point was not met.
Source: Clinical Study Reports and appendices.9,10
Figure 7: OCS Dose (mg) in Patients with a Baseline OCS of 10 mg/day or Higher, Mean Change From Baseline by Time Point in TULIP-2 Full Analysis Set)
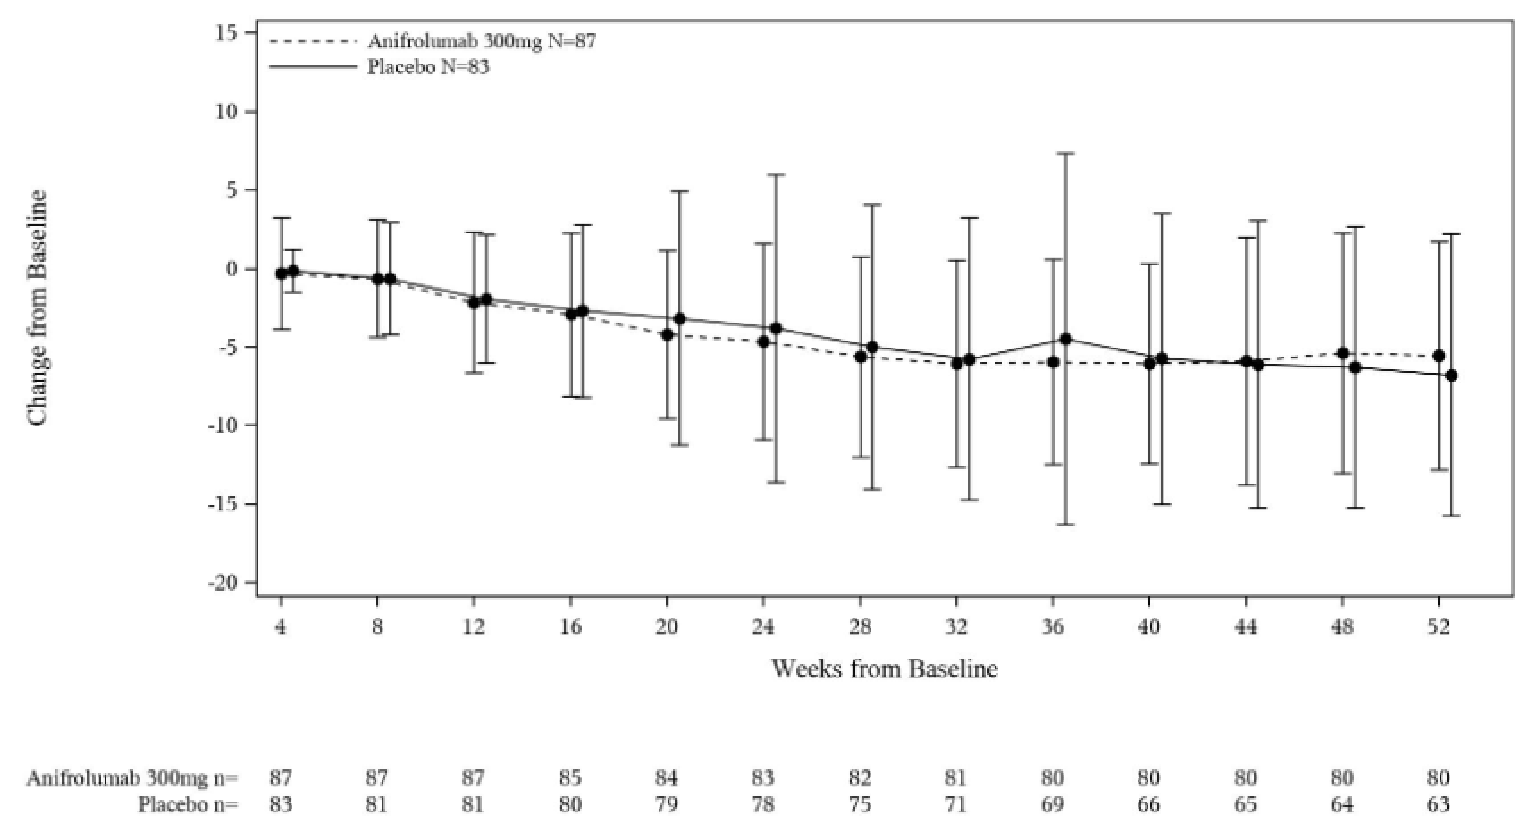
N = number of patients in treatment group; n = number of patients in analysis; OCS = oral corticosteroids.
Note: If the patient used different dose during a visit window, the sum of all doses at the scheduled study day of the respective visit window is used.
Source: Clinical Study Report10
Patient-Reported Outcomes at Week 52
Short Form (36) Health Survey (Acute Recall)
Summary scores for the SF-36 from the pivotal trials can be found in Table 17. Increasing scores on the SF-36 questionnaire indicate improved function. According to the sponsor, clinically meaningful thresholds of change were 3.4 points for the PCS and 4.6 for the MCS. According to the literature, anchor-based MIDs are 2.1 to 2.4 for either summary score.39 In the TULIP-1 and TULIP-2 trials, an average meaningful change from baseline to week 52 was seen in the anifrolumab 300 mg group (N = 140 for TULIP-1; N = 132 for TULIP-2) for the PCS (3.57 with a standard error of [SE] of 0.67, and 3.93 [SE = 0.65], respectively), but not in the placebo group or MCS for either group.
In the TULIP-1 trial, at week 52, the proportion of MCS responders (change of at least 4.6 points) in the anifrolumab 300 mg group compared with the placebo group was 20.9% versus 16.7% (4.2% difference; 95% CI, −4.1 to 12.6); the proportion of PCS responders (change of at least 3.4 points from baseline) in the anifrolumab 300 mg group was lower compared with the placebo group by 25% versus 26.7% (−1.7% difference; 95% CI, −10.9 to 7.5).
In the TULIP-2 trial, at week 52, the proportion of MCS responders in the anifrolumab 300 mg group compared with the placebo group was 27.4% versus 21.2%, respectively (6.2% difference; 95% CI, −2.71 to 15.2). The proportion of PCS responders in the anifrolumab 300 mg group compared with the placebo group was 32.8% versus 24.4%, respectively (8.4% difference; 95% CI, −1.1 to 17.8).
Overall, the difference in responses between the treatment groups was minimal in both trials.
Functional Assessment of Chronic Illness Therapy–Fatigue
Fatigue was measured using the FACIT-F scale. Increasing total scores from the FACIT-F questionnaire (0 to 52) indicate decreasing severity of fatigue. A patient who displayed an improvement of more than 3 points was considered a responder.
In the TULIP-1 trial, a slightly higher proportion of patients in the anifrolumab 300 mg group had reduced fatigue at week 52, as measured by FACIT-F responder rate (improvement from baseline to week 52 of > 3 points), compared with the placebo group (29.3% versus 26.8%, respectively; 2.4% difference; 95% CI, −0.9 to 17.9).
In the TULIP-2 trial, a numerically higher proportion of patients in the anifrolumab 300 mg group had reduced fatigue at week 52, as measured by FACIT-F responder rates compared with the placebo group (33.2% versus 24.7%, respectively; difference = 8.5%; 95% CI, 6.9 to 11.8).
There was no notable difference in the TULIP-1 or TULIP-2 trial in change from baseline to week 52 between groups (TULIP-1: 5.7 anifrolumab versus 3.7 placebo; 2% difference; 95% CI, −0.3 to 4.3; TULIP-2: 3.7 versus 2.5; 1.2% difference; 95% CI, −1.0 to 3.4).
Lupus Quality-of-Life
Results from the Lupus QoL questionnaire are presented in Table 17. Increasing scores indicate improvement. In both trials, Lupus QoL domain scores at baseline were similar across treatment groups. The changes (increases) from baseline in Lupus QoL domain scores were similar between the anifrolumab 300 mg and placebo groups at week 52 across all domains.
5-Level EQ-5D
Results from the EQ-5D-5L are presented in Table 17. Increasing scores in EQ-5D-5L (single summary utility index [where 1.0 is highest score] and EQ VAS [0 to 100]) indicate improvement. In both trials, improvements in QoL as measured by change from baseline in EQ-5D-5L were similar between the treatment groups.
In the TULIP-1 trial, patients in the anifrolumab group experienced numerically greater improvements in QoL at week 52 as measured by change from baseline in EQ-5D-5L compared with patients in the placebo group. For the single summary utility index, the change from baseline was 0.107 (SD = 0.21) (from a baseline value of 0.596) at week 52 for the anifrolumab group (N = 130) versus 0.069 (from a baseline value of 0.613) in the placebo group (N = 138). Mean changes in EQ VAS scores at week 52 were 13.4 (from a baseline score of 53.3) in the anifrolumab group and 8.3 (from a baseline score of 54.6) in the placebo group.
Similarly, in the TULIP 2 trial, for the single summary utility index, the mean change from baseline at week 52 was 0.057 (from a baseline value of 0.630) for the anifrolumab group versus 0.047 (from a baseline value of 0.591) in the placebo group. Mean changes in EQ VAS scores at week 52 were 8.1 (from a baseline score of 58.1) in the anifrolumab group and 4.3 (from a baseline score of 56.6) in the placebo group.
Pain Numerical Rating Score
Results from the pain NRS are presented in Table 17. Decreasing scores from the NRS VAS (0 to 10) indicate decreased pain.
In the TULIP-1 trial, The mean NRS VAS scores at baseline were similar between treatment groups (5.7 and 5.4 in the anifrolumab 300 mg and placebo groups, respectively). At week 52, the mean change (decrease) from baseline in NRS VAS scores was similar in the anifrolumab 300 mg group compared with the placebo group (−0.1 versus −0.8; −0.3 difference; 95% CI, −0.8 to 0.3).
In the TULIP-2 trial, The mean NRS VAS scores at baseline were similar between treatment groups (5.2 and 5.5 in the anifrolumab 300 mg and placebo groups, respectively). At week 52, the mean change (decrease) from baseline in NRS VAS scores was similar in the anifrolumab 300 mg group compared with the placebo group (−0.9 versus −0.7; −0.3 difference; 95% CI, −0.8 to 0.3).
Table 17: Patient-Reported Outcomes in TULIP-1 and TULIP-2
Characteristic | TULIP-1 Anifrolumab (N = 180) | TULIP-1 Placebo N = 184 | TULIP-2 Anifrolumab (N = 180) | TULIP-2 Placebo N = 182 |
|---|---|---|---|---|
SF-36a | ||||
PCS at baseline, n | 172 | 175 | 173 | 173 |
PCS at week 52, n | 132 | 139 | 140 | 125 |
Mean score at baseline (SD) | 36.93 (9.46) | 37.20 (9.14) | 37.93 (8.92) | 38.01 (9.4) |
Estimated change from baseline to week 52 LSM (SE) | 3.57 (0.67) | 3.26 (0.66) | 3.93 (0.65) | 2.83 (0.68) |
Responder at week 52 (full analysis set),b % | 45 (25.0) | 49 (26.7) | 59/180 (32.8) | 44/125 (24.4) |
Comparison with placebo at week 52 (95% CI)c | −1.7 (−10.9 to 7.5) | 8.4 (−1.1 to 17.8) | ||
MCS at baseline, n | 172 | 175 | 173 | 173 |
MCS at week 52, n | 132 | 139 | 140 | 125 |
Mean score at baseline (SD) | 43.3 (11.47) | 45.0 (11.24) | 44.6 (11.73) | 43.0 (10.94) |
Estimated change from baseline to week 52 LSM (SE) | 2.10 (0.83) | 0.91 (0.82) | 1.95 (0.87) | 0.39 (0.90) |
Responder at week 52 (full analysis set),b % | 38 (20.9) | 31 (16.7) | 50 (27.4) | 39 (21.2) |
Treatment difference compared to placebo (95% CI)c | 4.2 (−4.1 to 12.6) | 6.2 (−2.71 to 15.2) | ||
FACIT-F | ||||
Baseline, n | 171 | 174 | 170 | 175 |
Week 52, n | 131 | 138 | 137 | 126 |
Mean score at baseline (SD)a | 24.5 (11.87) | 26.0 (12.56) | 27.0 (12.49) | 25.7 (11.41) |
Estimated change from baseline LSM (SE) | 5.7 (0.90) | 3.7 (0.88) | 3.7 (0.86) | 2.5 (0.88) |
Responder at week 52 (full analysis set)d | 53 (29.3) | 49 (26.8) | 60 (33.2) | 45 (24.7) |
Treatment difference compared to placebo (95% CI) | 2.4 (−6.9 to 11.8) | 8.5 (−0.9 to 17.9) | ||
Lupus QoL | ||||
Baseline, n | 171 | 174 | 170 | 175 |
Week 52, n | 129 | 137 | 136 | 123 |
Physical health | ||||
Mean score at baseline (SD)a | 51.63 (25.01) | 53.34 (25.30) | 56.62 (26.29) | 53.48 (26.20) |
Estimated change from baseline to week 52 LSM (SE) | 8.86 (1.78) | 7.41 (1.74) | 6.56 (1.67) | 6.94 (1.73) |
Comparison with placebo, LSM difference at week 52 (95% CI) | 1.45 (−2.99 to 5.89) | −0.38 (−4.49 to 3.73) | ||
Pain | ||||
Mean score at baseline (SD)a | 50.05 (28.22) | 51.44 (28.21) | 55.00 (29.07) | 51.62 (29.76) |
Estimated change from baseline to week 52 LSM (SE) | 12.08 (2.035) | 8.87 (1.993) | 60.83 (30.888) | 58.19 (30.787) |
Comparison with placebo, LSM difference at week 52 (95% CI) | 3.20 (−1.86 to 8.26) | 1.36 95% CI, (−3.52, 6.23) | ||
Planning | ||||
Mean score at baseline (SD)a | 55.90 (30.26) | 57.33 (30.12) | 8.49 (2.156) | 7.10 (2.220) |
Estimated change from baseline to week 52 LSM (SE) | 9.40 (2.052) | 6.05 (2.011) | 10.86 (2.016) | 7.95 (2.002) |
Comparison with placebo, LSM difference at week 52 (95% CI) | 3.35 (−1.81 to 8.51) | 1.39 (−3.98 to 6.76) | ||
Intimate relationships | ||||
Baseline, n | 149 | 146 | 131 | 134 |
Week 52, n | 93 | 94 | 77 | 81 |
Mean score at baseline (SD)a | 54.53 (32.919) | 59.08 (29.233) | 56.87 (33.116) | 56.34 (31.066) |
Estimated change from baseline to week 52 LSM (SE) | 6.70 (2.535) | 1.86 (2.521) | 5.55 (2.678) | 6.80 (2.655) |
Comparison with placebo, LSM difference at week 52 (95% CI) | 4.84 (−1.59 to 11.27) | −1.24 (−7.98 to 5.49) | ||
Burden to others | ||||
Mean score at baseline (SD)a | 50.68 (29.970) | 49.09 (31.315) | 53.04 (30.898) | 52.81 (30.905) |
Estimated change from baseline to week 52 LSM (SE) | 9.09 (2.188) | 9.53 (2.139) | 9.08 (2.342) | 5.60 (2.402) |
Comparison with placebo, LSM difference at week 52 (95% CI) | −0.44 (−6.01 to 5.13) | 3.49 (−2.41 to 9.38) | ||
Emotional health | ||||
Mean score at baseline (SD)a | 65.96 (24.249) | 65.71 (24.825) | 68.73 (23.866) | 63.43 (26.224) |
Estimated change from baseline to week 52, LSM (SE) | 6.37 (1.669) | 4.95 (1.636) | 4.15 (1.946) | 4.97 (1.999) |
Comparison with placebo, LSM difference at week 52 (95% CI) | 1.42 (−2.78 to 5.63) | −0.82 (−5.82 to 4.19) | ||
Body image | ||||
Baseline, n | 160 | 162 | 157 | 164 |
Week 52, n | 108 | 114 | 114 | 111 |
Mean score at baseline (SD)a | 57.35 (27.891) | 61.80 (27.883) | 61.50 (31.611) | 62.19 (28.527) |
Estimated change from baseline to week 52 LSM (SE) | 9.54 (2.021) | 5.95 (2.000) | 7.31 (2.193) | 7.70 (2.206) |
Comparison with placebo, LSM difference at week 52 (95% CI) | 3.59 (−1.54 to 8.72) | −0.39 (−5.92 to 5.13) | ||
Fatigue | ||||
Mean score at baseline (SD)a | 47.33 (25.920) | 48.67 (26.615) | 50.40 (27.527) | 46.75 (26.217) |
Estimated change from baseline to week 52 LSM (SE) | 9.03 (1.953) | 5.84 (1.912) | 7.10 (2.020) | 5.80 (2.082) |
Comparison with placebo, LSM difference at week 52 (95% CI) | 3.18 (−1.73 to 8.09) | 1.30 (−3.82 to 6.42) | ||
EQ-5D-5L | ||||
VAS at baseline, n | 171 | 174 | 170 | 175 |
VAS at week 52, n | 130 | 138 | 136 | 124 |
Baseline score (SD)a | 53.3 (20.26) | 54.6 (21.19) | 58.1 (19.85) | 56.6 (21.78) |
Mean score at 52 weeks (SD) | 65.7 (21.09) | 63.5 (21.26) | 66.7 (20.58) | 62.5 (22.35) |
Change from baseline (SD) | 13.4 (24.20) | 8.3 (27.48) | 8.1 (24.38) | 4.3 (24.31) |
Single summary score, n | 130 | 138 | 136 | 124 |
Baseline score (SD) | 0.596 (0.22) | 0.613 (0.20) | 0.630 (0.22) | 0.591 (0.26) |
Mean score at 52 weeks (SD) | 0.700 (0.21) | 0.676 (0.22) | 0.705 (0.21) | 0.677 (0.23) |
Change from baseline (SD) | 0.107 (0.21) | 0.069 (0.23) | 0.057 (0.20) | 0.047 (0.23) |
Pain NRS | ||||
Baseline, n | 171 | 174 | 170 | 175 |
Week 52, n | 131 | 138 | 137 | 126 |
Mean score at baseline (SD)a | 5.7 (2.41) | 5.4 (2.43) | 5.2 (2.26) | 5.5 (2.63) |
Estimated change from baseline to week 52, LSM (SE) | −1.0 (0.21) | −0.8 (0.21) | −0.9 (0.20) | −0.7 (0.20) |
Comparison with placebo, LSM difference (95% CI) | −0.3 (−0.8 to 0.3) | −0.3 (−0.8 to 0.3) | ||
CI = confidence interval; EQ-5D-5L = 5-Level EQ-5D; FACIT-F = Functional Assessment of Chronic Illness Therapy–Fatigue; LSM = least squares mean; MCS = mental component score; NRS = numerical rating scale; PCS = physical component score; QoL = quality of life; SD = standard deviation; SE = standard error; SF-36 = Short Form (36) Health Survey; SLEDAI-2K = Systemic Lupus Erythematosus Disease Activity Index 2000; VAS = visual analogue scale; vs. = versus.
aA repeated measures model with fixed effects for baseline value, treatment group, visit, treatment-by-visit interaction and stratification factors (SLEDAI-2K score at screening [< 10 points vs. ≥ 10 points], week 0 OCS dose [< 10 mg/day vs. ≥ 10 mg/day prednisone or equivalent] and type I interferon-test result at screening [high vs. low]) was used.
bPatients were considered a responder if they exhibited a meaningful change of least 3.4 and 4.6 points on the PCS and MCS, respectively, from baseline. The responder rates (percentages) were calculated using a stratified Cochran-Mantel-Haenszel approach with stratification factors (SLEDAI-2K score at screening [< 10 points vs. ≥ 10 points], week 0 OCS dose [< 10 mg/day vs. ≥ 10 mg/day prednisone or equivalent] and type I interferon gene signature test result at screening [high vs. low]). Percentages are based upon all patients in the full analysis set. Patients treated with restricted medication beyond protocol allowed threshold, and those discontinued the investigational product are regarded as nonresponders. If the respective score of SF-36 Version 2.0 (acute) cannot be evaluated, the patient is regarded as a nonresponder.
cThe difference in estimates and associated 95% CI are weighted and calculated using a stratified Cochran-Mantel-Haenszel approach with stratification factors (SLEDAI-2K score at screening [< 10 points vs. ≥ 10 points], week 0 OCS dose [< 10 mg/day vs. ≥ 10 mg/day prednisone or equivalent] and type I interferon gene signature test result at screening [high vs. low]).
dA response in FACIT-F is defined as an improvement from baseline to week 52 of more than 3 points (i.e., change from baseline > 3). Patients treated with restricted medication beyond protocol allowed threshold, and those who discontinued investigational product, are regarded as nonresponders. If the FACIT-F cannot be evaluated, the patient is regarded as a nonresponder.
Source: Clinical Study Reports9,10
Mortality
There were 2 deaths (0.5%) in the TULIP-1 trial, 1 in each treatment arm, and 1 death (0.27%) in the TULIP-2 trial in the anifrolumab group. These deaths were not considered by the investigator to be related to the treatment.
Measure of Organ Damage, Systemic Lupus International Collaborating Clinics/American College of Rheumatology Damage Index
SDI global scores and mean changes from baseline to week 52 are summarized in Table 18. The mean changes in SDI at week 52 were small and similar between the anifrolumab 300 mg and placebo groups across both trials. Mean changes at week 52 were 0.1 (SD = 0.30) in the anifrolumab 300 mg group and 0.1 (SD = 0.24) in the placebo group for both trials. The number of patients with increased damage was low in both treatment groups.
Table 18: SDI Score at Baseline and Week 52 in TULIP-1 and TULIP-2 (Full Analysis Set)
Time point | Treatment group | n | Mean (SD) | Mean change from baseline (SD) |
|---|---|---|---|---|
TULIP-1 | ||||
Baseline | Anifrolumab 300 mg | 179 | 0.7 (1.16) | Reference |
Placebo | 181 | 0.6 (0.98) | Reference | |
Week 52 | Anifrolumab 300 mg | 138 | 0.7 (1.09) | 0.1 (0.30) |
Placebo | 149 | 0.7 (0.97) | 0.1 (0.24) | |
TULIP-2 | ||||
Baseline | Anifrolumab 300 mg | 180 | 0.5 (0.91) | Reference |
Placebo | 182 | 0.5 (0.79) | reference | |
Week 52 | Anifrolumab 300 mg | 152 | 0.6 (1.01) | 0.1 (0.30) |
Placebo | 136 | 0.4 (0.74) | 0.1 (0.24) | |
SD = standard deviation; SDI = Systemic Lupus International Collaborating Clinics/American College of Rheumatology Damage Index.
Source: Clinical Study Reports.9,10
Cutaneous Lupus Erythematosus Disease Area and Severity Index Activity
Results of the key secondary end point, a reduction of 50% or greater in CLASI activity from baseline to week 12 in patients with a baseline CLASI activity score of 10 or higher, from the pivotal trials is presented in Table 19. In the TULIP-1 trial, for patients with baseline CLASI activity score of 10 or higher (n = 142), the difference in response rates were nonsignificant (P value = 0.054). However, the difference in response rates was numerically higher in the anifrolumab 300 mg group compared with the placebo group at 12 weeks (41.9% versus 24.9% respectively), with 17.0% (95% CI, −0.30% to 34.3%) more patients able to achieve a reduction of 50% or greater from baseline in CLASI activity score.
In the TULIP-2 trial, for patients with baseline CLASI activity score of 10 or higher (n = 89), the difference in response rates was statistically significant, with 24% more patients (95% CI, 4.3% to 43.6%, adjusted P value = 0.0392) able to achieve a reduction of 50% or greater from baseline in CLASI activity score in the anifrolumab 300 mg group compared with the placebo group at week 12. Interpretation of the tipping-point analysis was limited, given the small number of patients who discontinued the investigational product (1 and 3 patients on anifrolumab and placebo, respectively).
Subgroup Analysis by CLASI Activity
A summary of CLASI activity stratified by subgroups is presented in Table 19. In the subgroup of patients with an OCS dosage at baseline of 10 mg/day or higher (i.e., the subgroup matching the reimbursement request), the CLASI response at week 52 was 13.3% higher (95% CI, −14.6 to 41.3) in the anifrolumab group (N = 20) versus the placebo group (N = 21) in the TULIP-1 trial; the CLASI response at week 52 was 50.6% higher (95% CI, 19.0 to 82.2) in the anifrolumab group (N = 17) versus the placebo group (N = 12) in the TULIP-2 trial. In general, similar response was seen within each subgroup (interferon-test result; SLEDAI-2K score at screening) and all analyses had a numerically higher proportion of patients achieving the CLASI end point compared to the placebo group, except for the interferon-test low group of TULIP-1 (−2.5% treatment difference; 95% CI, −41.8 to 36.8). However, given the small sample sizes and exploratory nature of this analysis, the results should be interpreted with caution.
Table 19: Summary of CLASI Activity (≥ 50% Reduction from Baseline to Week 12) in Patients With Baseline CLASI Activity Score ≥ 10 and Subgroup Analysis — TULIP-1 and TULIP-2
Characteristic | TULIP-1 Anifrolumab (N = 180) | TULIP-1 Placebo (N = 184) | TULIP-2 Anifrolumab (N = 180) | TULIP-2 Placebo (N = 182) |
|---|---|---|---|---|
N | 58 | 54 | 49 | 40 |
Respondera | 24 (41.9) | 14 (24.9) | 24 (49.0) | 10 (25.0) |
Treatment-group difference vs. placebo (95% CI) | 17.0 (−0.3 to 34.3) | 24 (4.3 to 43.6) | ||
P value | 0.054b | 0.0168b | ||
Adjusted P value | NR | 0.0392c | ||
CLASI activity by interferon-test high vs. low patientsd | ||||
Interferon-test high responder/N (%) | 23/48 (48.0) | 13/46 (27.3) | 23/45 (51.1) | 10/35 (28.6) |
Treatment-group difference vs. placebo (95% CI) | 20.7 1.6, 39.9 | 22.5 (1.4 to 43.7) | ||
Interferon-test low responder/N (%) | 1/10 (10.0) | 1/8 (12.5) | 1/4 (25.0) | 0/5 |
Treatment-group difference vs. placebo (95% CI) | −2.5 (−41.8 to 36.8) | 25.0 (−34.8 to 84.8) | ||
CLASI activity by SLEDAI-2K score at screeningd | ||||
Responder < 10 points/ N (%) | 5 /11(44.7) | 6/15 (41.3) | 5/10 (50.0) | 2/7 (28.6) |
Treatment-group difference vs. placebo (95% CI) | 3.4 (−35.4 to 42.3) | 21.4 (−25.8 to 68.7) | ||
Responder ≥ 10 points/ N (%) | 19/47 (41.3) | 8/39 (20.4) | 19/39 (48.7) | 8/33 (25.2) |
Treatment-group difference vs. placebo (95% CI) | 21.0 (1.3 to 40.7) | 23.5 (1.4 to 45.7) | ||
CLASI activity by OCS dose at screeningd | ||||
Responder OCS dose at baseline < 10 mg/day/N (%) | 7/21 (33.3) | 4/20 (20.0) | 12/17 (70.6) | 3/15 (20.0) |
Treatment-group difference vs. placebo (95% CI) | 13.3 (−14.6 to 41.3) | 50.6 (19.0 to 82.2) | ||
Responder OCS dose at baseline ≥ 10 mg/day/N (%) | 17/37 (45.9) | 10/34 (29.4) | 12/32 (37.5) | 7/25 (28.0) |
Treatment-group difference vs. placebo (95% CI) | 16.5 (−5.9 to 38.9) | 9.5 (−15.3 to 34.3) | ||
CI = confidence interval; CMH = Cochran-Mantel-Haenszel; CLASI = Cutaneous Lupus Erythematosus Disease Area and Severity Index; OCS = oral corticosteroid; SLEDAI-2K = Systemic Lupus Erythematosus Disease Activity Index 2000; vs. = versus.
Note: Baseline is defined as the last measurement before randomization and dose administration on day 1.
aA responder is defined as an at least 50% reduction in CLASI activity score compared to baseline. Percentages are based upon all patients in the full analysis set with a baseline CLASI activity score of 10 or higher. Patients treated with restricted medication beyond protocol-allowed thresholds, and those who discontinued the investigational product are regarded as nonresponders.
bP value has not been adjusted for multiple testing (i.e., the type I error rate has not been controlled).
cP values were adjusted for multiplicity using the Holm procedure. As prespecified in the statistical analysis plan, the TULIP-1 trial did not adjust secondary outcomes for multiplicity because the primary end point was not met.
dThe responder and nonresponder rates (percentages), the difference in estimates and associated 95% CI are weighted and calculated using a stratified CMH approach with stratification factors — as far as applicable — (SLEDAI-2K score at screening [< 10 points vs. ≥ 10 points], baseline OCS dose [< 10 mg/day vs. ≥ 10 mg/day prednisone or equivalent] and type I interferon gene signature test result at screening [high vs. low]).
Source: Clinical Study Reports.9,10
Joint Reduction Rate
Key summary results for joint response in the pivotal trails are presented in Table 20. In the TULIP-2 trial, a key secondary end point was a reduction of 50% or greater in joint swelling and tender joints in patients with at least 6 swollen and 6 tender joints at baseline at week 52. The results of this analysis were not statistically significant and there was no notable difference between treatments in the proportion of patients with at least a 50% reduction in swollen and tender joint counts at week 52 (4.7% difference; 95% CI, −13.5 to 17.6; P value = 0.5469). The results were also nonsignificant for the proportion of patients with at least a 20% reduction in swollen and tender joints at week 52. In the TULIP-1 trial, for the supporting secondary end point of the number of patients with at least a 20% or 50% reduction in at least 8 swollen and at least 8 tender joints at baseline, numerically higher proportions of patients in the anifrolumab 300 mg group compared with the placebo group achieved at least a 20% reduction in swollen and tender joint counts (6.7% treatment difference; 95% CI, −9.7, 23.1) and a 50% reduction in swollen and tender joint counts (14.7 treatment difference; 95% CI, −9.7 to 23.1) and a 50% reduction in swollen and tender joint counts (difference 14.7%; 95% CI, −1.4, 30.8).
Subgroup Analysis by Joint Reduction Rate
The results of the subgroup analysis for joint reduction rate are presented in Table 20. Overall, the results of joint reduction rate by subgroup were variable and inconsistent. Given the exploratory nature of these subgroup analyses and the small sample sizes, the results should be interpreted with caution.
Table 20: Summary of Joint Reduction Rate Among Patients With at Least 6 Swollen and 6 Tender Joints at Week 52 and Subgroup Analysis — TULIP-1 and TULIP-2
Characteristic | TULIP-1 Anifrolumab (N = 180) | TULIP-1 Placebo (N = 184) | TULIP-2 Anifrolumab (N = 180) | TULIP-2 Placebo (N = 182) |
|---|---|---|---|---|
Joint response rate (≥ 50% reduction) in patients with at least 6 swollen and 6 tender joints at baseline at week 52 | ||||
N | 70 | 68 | 71 | 90 |
Respondera (%) | 33 (47.0) | 22 (32.3) | 30 (42.2) | 34 (37.5) |
Treatment-group difference vs. placebo (95% CI) | 14.7 (−1.4 to 30.8) | 4.7 (−10.6 to 20.0) | ||
P value | NR | 0.5469b | ||
Adjusted P value | NR | 0.5469c | ||
Joint reduction rate interferon-test high vs. low patientsd | ||||
N | NR | 56 | 75 | |
Interferon-test high, annual rate estimate(%) | NR | 23 (41.1) | 30 (40.0) | |
Treatment-group difference vs. placebo (95% CI) | NR | 1.1 (−15.9 to 18.1) | ||
N | NR | 15 | 15 | |
Interferon-test low responder, annual rate estimate (%) | NR | 7 (46.7) | 4 (26.7) | |
Treatment-group difference vs. placebo (95% CI) | NR | 20.0 (−14.5 to 54.5) | ||
Joint reduction rate by SLEDAI-2K score at screeningd | ||||
N | NR | 21 | 24 | |
< 10 points, annual rate estimate (%) | NR | 7 (32.7) | 9 (37.3) | |
Treatment-group difference vs. placebo (95% CI) | NR | −4.5 (−33.2 to 24.2) | ||
N | NR | 50 | 66 | |
≥ 10 points, annual rate estimate (%) | NR | 23 (45.9) | 25 (37.6) | |
Treatment-group difference vs. placebo (95% CI) | NR | 8.3 (−9.9 to 26.5) | ||
Joint reduction rate by OCS dose at screeningd | ||||
N | NR | 42 | 47 | |
OCS dose at baseline < 10 mg/day | NR | 19 (44.8) | 18 (38.1) | |
Treatment-group difference vs. placebo (95% CI) | NR | 6.7 (−13.6 to 27.1) | ||
N | NR | 29 | 43 | |
OCS dose at baseline ≥ 10 mg/day | NR | 11 (37.9) | 16 (37.2) | |
Treatment-group difference vs. placebo (95% CI) | NR | 0.7 (−22.2 to 23.7) | ||
CI = confidence interval; OCS = oral corticosteroid; NR = not reported; SLEDAI-2K = Systemic Lupus Erythematosus Disease Activity Index 2000; vs. = versus.
Note: Baseline is defined as the last measurement before randomization and dose administration on day 1.
aResponders are patients with a 50% reduction from baseline in both swollen and tender joints. Patients treated with restricted medication beyond protocol allowed thresholds, and those who discontinued investigational product, are considered nonresponders. Percentages are based upon all patients in the full analysis set with at least 6 swollen and at least 6 tender joints at baseline.
bP value has not been adjusted for multiple testing (i.e., the type I error rate has not been controlled).
cP values were adjusted for multiplicity using the Holm procedure.
dPercentages are based upon all patients in the full analysis set with at least 6 swollen and 6 tender joints at baseline.
Source: Clinical Study Reports.9,10
Lupus Low Disease Activity State
In the TULIP-1 trial, the proportion of patients who achieved an LLDAS response at week 52 was generally similar in the anifrolumab 300 mg group compared with the placebo group (15.0% versus 10.4%; difference 4.6%; 95% CI, −2.9 to 12.1). In the TULIP-2 trial, the proportion of patients who achieved an LLDAS response at week 52 was numerically higher in the anifrolumab 300 mg group compared with the placebo group (14.9% versus 8.8%; difference 6.1%; 95% CI, −1.2 to 13.4).
Annual Flare Rate
Summary results for the key secondary end point of annualized flare rate from the pivotal trials are presented in Table 21. The annualized rate of flares through week 52 was numerically lower in the anifrolumab 300 mg group compared with the placebo group in the TULIP-1 trial (0.60 versus 0.72, respectively) and TULIP-2 (0.43 versus 0.64, respectively). In the TULIP-1 trial, this difference was nonsignificant (0.83 ratio difference; 95% CI, 0.60 to 1.14; P value = 0.258). Similarly, in the TULIP-2 trial the difference was also nonsignificant, with a greater response in the placebo group (0.67 ratio difference; 95% CI, 0.48 to 0.94; adjusted P value = 0.0809). In the TULIP-1 trial, the total follow-up time was similar between groups, whereas in the TULIP-2 trial the total follow-up time was longer in the anifrolumab 300 mg group compared with the placebo group. In the TULIP-2 trial, 31.1% of patients in the anifrolumab 300 mg group had a flare during the study compared with 42.3% of patients in the placebo group.
Flare severity was also captured by the studies using a modified SFI and were presented as part of the safety analysis (as detailed in the Harms section).
A summary of sensitivity analyses is presented in Appendix 3. Sensitivity analyses were not conducted in the TULIP-1 trial for this end point because the primary end point was not met. In the TULIP-2 trial, the results of the sensitivity analyses among the matrix of different flare rates after discontinuation of the investigational product showed that the estimated flare rates were consistent with the primary analysis and robust to the missing-data assumptions.
Subgroup Analysis by Annual Flare Rate
In the subgroup analyses for patients with an OCS dose at baseline of 10 mg/day or higher, the annualized flare rate was lower in the anifrolumab group than the placebo group for both the TULIP-1 trial (0.79 ratio rate group difference; 95% CI, 0.53 to 1.18) and the TULIP-2 trial (0.52 ratio rate group difference; 95% CI, 0.33 to 0.82). Overall, the subgroup analysis for flare rates was generally consistent with that for the overall population, with no notable differences in flare rates in the anifrolumab 300 mg group through week 52 compared to the placebo group. However, given the exploratory nature of these subgroup analyses and the small sample sizes, the results should be interpreted with caution.
Table 21: Summary of Annualized Flare Rate and Subgroup Analysis in TULIP-1 and TULIP-2
Characteristic | TULIP-1 Anifrolumab (N = 180) | TULIP-1 Placebo (N = 184) | TULIP-2 Anifrolumab (N = 180) | TULIP-2 Placebo (N = 182) |
|---|---|---|---|---|
Annual flare rate through week 52 | ||||
N | 180 | 184 | 180 | 182 |
Respondera (rate ratio) | 65 (0.60) | 80 (0.72) | 56 (0.43) | 77 (0.64) |
Treatment-group ratio difference vs. placebo (95% CI) | 0.83a (0.60 to 1.14) | 0.67a (0.48 to 0.94) | ||
P value | 0.258 | 0.0202b | ||
Adjusted P value | NA | 0.0809c | ||
Annualized flare rate by interferon-test high vs. low patientsd | ||||
N | 148 | 151 | 75 | 110 |
Interferon-test high, annual flare rate estimate | 0.55 | 0.74 | 0.52 | 0.81 |
Treatment-group difference vs. placebo (95% CI) | 0.75 (0.52 to 1.07) | 0.64 (0.45 to 0.92) | ||
N | 32 | 33 | 11 | 12 |
Interferon-test low responder, annual flare rate estimate | 0.70 | 0.49 | 0.36 | 0.42 |
Treatment-group difference vs. placebo (95% CI) | 1.43 (0.73 to 2.78) | 0.87 (0.31 to 2.43) | ||
Annualized flare rate by SLEDAI-2K score at screeningd | ||||
N | 55 | 54 | 54 | 52 |
< 10 points, annual rate estimate | 0.44 | 0.56 | 0.59 | 0.47 |
Treatment-group difference vs. placebo (95% CI) | 0.79 (0.42 to 1.50) | 1.24 (0.68 to 2.27) | ||
N | 125 | 130 | 54 | 98 |
≥ 10 points, annual rate estimate | 0.71 | 0.84 | 0.38 | 0.72 |
Treatment-group rate ratio difference vs. placebo (95% CI) | 0.85 (0.58 to 1.23) | 0.53 (0.35 to 0.79) | ||
Annualized flare rate by OCS dose at screeningd | ||||
N | 77 | 82 | 93 | 99 |
OCS dose at baseline < 10 mg/day, annual rate estimate | 0.47 | 0.52 | 0.46 | 0.52 |
Treatment-group difference vs. placebo (95% CI) | 0.91 (0.53 to 1.55) | 0.87 (0.54 to 1.42) | ||
N | 103 | 102 | 87 | 83 |
OCS dose at baseline ≥ 10 mg/day, annual rate estimate | 0.69 | 0.87 | 0.36 | 0.70 |
Treatment-group difference vs. placebo (95% CI) | 0.79 (0.53 to 1.18) | 0.52 (0.33 to 0.82) | ||
British Isles Lupus Assessment Group 2004; CI = confidence interval; OCS = oral corticosteroids; SLEDAI-2K = Systemic Lupus Erythematosus Disease Activity Index 2000; vs. = versus.
Note: Baseline is defined as the last measurement before randomization and dose administration on day 1.
aThis is a rate ratio rather than a rate difference as with other end points. This is calculated as annualized rate of anifrolumab. A flare is defined as either 1 or more new BILAG 2004 A items or 2 or more new BILAG 2004 B items compared to the previous visit (i.e., a worsening from an E, D, or C score to a B score in at least 2 organ systems or a worsening from an E, D, C, or B score to an A score in any 1 organ system compared to the previous visit). The response variable in the model will be the number of flares up to week 52 or early discontinuation visit. The model includes covariates of treatment group, and the stratification factors (SLEDAI-2K score at screening (< 10 points vs. ≥ 10 points), week 0 OCS dose (< 10 mg/day vs. ≥ 10 mg/day prednisone or equivalent) and type I interferon-test result at screening (high vs. low). The logarithm (base e) of the follow-up time is used as an offset variable in the model to adjust for patients having different exposure times.
bP value has not been adjusted for multiple testing (i.e., the type I error rate has not been controlled).
cP values were adjusted for multiplicity using the Holm procedure. As prespecified in the statistical analysis plan, the TULIP-1 trial did not adjust secondary outcomes for multiplicity because the primary end point was not met.
dThe responder and nonresponder rates (percentages), the difference in estimates and associated 95% CI, are weighted and calculated using a stratified Cochran-Mantel-Haenszel approach, with stratification factors — as far as applicable — (SLEDAI-2K score at screening [< 10 points vs. ≥ 10 points], week 0 OCS dose [< 10 mg/day vs. ≥ 10 mg/day prednisone or equivalent] and type I interferon gene signature test result at screening [high vs. low]).
Source: Clinical Study Reports.9,10
Subgroups
The results of each subgroup analysis are presented under the respective efficacy outcomes above. The main subgroup analyses were interferon-test status (high versus low), SLEDAI-2K score at screening (< 10 points versus ≥ 10 points), and baseline OCS dosage (< 10 mg/day versus ≥ 10 mg/day prednisone or equivalent). No statistical testing was conducted to compare the subgroups. Overall, results in each subgroup were similar and no notable differences were observed within each subgroup. The results of the subgroup analyses should be interpreted with caution given the lack of statistical testing within subgroups, small sample sizes, and the exploratory nature of these analyses.
In terms of differences between the anifrolumab group and placebo, the results were mixed across subgroups in the TULIP-1 trial. The SRI-4 by subgroups of interferon-test high, and OCS dosage of 10 mg/day or higher at baseline for the SRI-4 had a nonsignificant difference between anifrolumab and placebo groups. In the TULIP-2 trial, BICLA response by the interferon-test high result and OCS dosage of 10 mg/day or higher demonstrated a statistically significant difference between groups. Overall, the results of the subgroup analyses for the remaining outcomes in the TULIP-2 trial included a numerically higher proportion of patients in the anifrolumab group achieving efficacy outcomes such as SRI-4 and BICLA compared to placebo.
Harms
Only those harms identified in the review protocol are reported. Table 22 provides detailed harms data.
Adverse Events
Rates of AEs were similar across treatment groups and across the pivotal trials (approximately 85% to 90% prevalence in both pivotal trials). In the TULIP-1 and TULIP-2 trials, the most common AEs were nasopharyngitis (20.0% and 15.6% in the anifrolumab 300 mg group versus 12.0% and 11% in the placebo group, respectively), upper respiratory tract infection (12.2% and 21.7% versus 9.8% and 9.9%), and urinary tract infection (12.2% and 11.1% versus 14.7% and 13.7%). Infusion-related reactions were also common in the treatment arm of the TULIP-2 trial (13.9%).
In the TULIP-1 trial, the most frequently reported AEs considered by the investigator to be related to the investigational product were infusion-related reactions (7.8% in anifrolumab 300 mg group versus 7.1% in placebo group), herpes zoster with cutaneous presentation (5.0% versus 0%, respectively), and hypersensitivity (5.6% versus 1.1%). The investigator considered the majority of the AEs to be unrelated to the investigational product; however, AEs considered to be related to the investigational product occurred more often in the anifrolumab 300 mg group compared to the placebo group during the study (30.6% versus 22.8%, respectively)
In the TULIP-2 trial, the most frequently reported AE during the treatment period considered by the investigator to be related to the investigational product was herpes zoster (6.1% in anifrolumab versus 0% in placebo). The investigator considered most AEs to be unrelated to the product; however, AEs considered by the investigator to be related to the investigational product occurred more often in the anifrolumab 300 mg group compared to the placebo group during the study (45% versus 30.2%).
Serious Adverse Events
SAEs were more common in the placebo group versus the anifrolumab group across the TULIP-1 and TULIP-2 trials (13.9% versus 16.3% and 8.3% versus 17%, respectively). In the TULIP-1 trial, the most common SAEs were SLE (1.7% and 1.6%, respectively) and pneumonia (1.7% and 0.5%). In the TULIP-2 trial, the most common SAE was pneumonia (1.7% and 3.8%), followed by SLE (0.6% and 3.3%).
Withdrawal due to Adverse Events
In the TULIP-1 trial, withdrawals were greater in the anifrolumab group versus the placebo group (6.7% versus 3.8%), whereas withdrawals were lower in the anifrolumab group compared to placebo group in the TULIP-2 trial (2.8% versus 7.7%). In the TULIP-1 trial, the most common reason for withdrawal in the anifrolumab group was herpes zoster (1.1%). In the TULIP-2 trial, the most common reason for withdrawal in the placebo group was SLE (1.6%), followed by pneumonia (1.1%).
Mortality
There were 2 deaths during the TULIP-1 trial and 1 death during TULIP-2. One patient in the anifrolumab 300 mg group of each trial had a fatal SAE of pneumonia during the treatment period. In the TULIP-1 trial, 1 patient in the placebo group had a fatal SAE of encephalitis during the follow-up period. The investigator did not find these deaths to be associated by the investigational product.
Notable Harms
In the TULIP-1 trial, notable harms (as outlined in the CADTH protocol) included hypersensitivity reactions (6.1% for anifrolumab 300 mg versus 1.1% for placebo), infusion-related reactions (8.9% versus 7.1%), herpes zoster (5.6% versus 1.6%), serious, nonopportunistic infections (5.0% versus 4.3%), malignancies (1.7% versus 0.5%), depression (2.8% versus 2.7%), and suicidal ideation or behaviour (1.1% versus 1.6%)
In the TULIP-2 trial, notable harms included infusion-related reactions (13.9% for anifrolumab 300 mg versus 7.7% for placebo), herpes zoster (7.2% anifrolumab 300 mg versus 1.1%, placebo), serious, nonopportunistic infections (2.8% versus 5.5%), hypersensitivity (1.1% versus 0.5%), malignancies (0% versus 0.5%), depression (2.8% versus 1.6%), and suicidal ideation or behaviour (1.7% versus 4.4%). Herpes zoster was more common among patients in the anifrolumab group across both trials, but none were considered SAEs.
Depression was measured using PHQ-8 scores. A score of 5 to 9 indicates mild depression and a score of 10 to 14 indicates moderate depression. In both trials, results were similar between treatment groups. No clinically meaningful changes from baseline were observed for any treatment group, with small and similar decreases observed over 52 weeks of treatment across both trials. In the TULIP-1 trial, changes from baseline were similar between groups. PHQ-8 scores at week 52 from baseline decreased by 2.1 and 1.7 points in the anifrolumab group (baseline score = 10.1) versus the placebo group (baseline score = 9.4). In the TULIP-2 trial, PHQ-8 scores at week 52 from baseline decreased by 1.4 and 0.9 points in the anifrolumab group (baseline score = 9.2) versus the placebo group (baseline score = 9.9).
Suicidal ideation and behaviour were measured using the C-SSRS. In the TULIP-1 trial, 2 patients in the anifrolumab group (1.1%) and placebo group (1%) each experienced suicidal ideation during the treatment period; 1 report of suicidal behaviour (actual nonfatal attempt) was documented in the placebo group. During the follow-up period, 1 patient in the placebo group had suicidal ideation. In the TULIP-2 trial, 3 (1.7%) patients in the anifrolumab 300 mg groups versus 8 (4.4%) patients in the placebo group had suicidal ideation during the treatment period; no patients in either treatment group exhibited suicidal behaviour. Overall, few patients reported expressing suicidal ideation or suicidal behaviour at any time during the studies, with no imbalance observed among treatment groups.
The proportion of patients with flares and severity was measured by the modified SFI. In the TULIP-1 trial, there were numerically fewer patients in the anifrolumab 300 mg group (32.2%) compared with the placebo group (36.4%). The proportions of patients with at least 1 mild or moderate flare after initiation of the investigational product treatment were 31.1% in the anifrolumab 300 mg groups versus 32.6% in the placebo group; the proportions of patients with at least 1 severe flare after initiation of the investigational product treatment was 2.8% in the anifrolumab 300 mg groups versus 5.4% in the placebo group. In the TULIP-2 trial, flares were numerically lower for the anifrolumab 300 mg group compared with the placebo group (33.5% versus 38.5%). The proportions of patients with at least 1 mild or moderate flare after initiation of the investigational product treatment were 32.2% in the anifrolumab 300 mg group versus 36.8% in the placebo group; the proportions of patients with at least 1 severe flare after initiation of the investigational product treatment were 1.7% in the anifrolumab 300 mg group and 3.8% in the placebo group.
Table 22: Summary of Harms (Full Analysis Set)
Harm | TULIP-1 Anifrolumab N = 180 | TULIP-1 Placebo N = 184 | TULIP-2 Anifrolumab N = 180 | TULIP-2 Placebo N = 182 |
|---|---|---|---|---|
Patients with ≥ 1 adverse event | ||||
Any AE, n (%) | 161 (89.4) | 241 (88.3) | 162 (90.0) | 154 (84.6) |
Any AE related to investigational product (investigator) | 55 (30.6) | 42 (22.8) | 81 (45.0) | 55 (30.2) |
Most common events,a n (%) | ||||
Nasopharyngitis | 36 (20.0) | 22 (12.0) | 28 (15.6) | 20 (11.0) |
Upper respiratory tract infection | 22 (12.2) | 18 (9.8) | 39 (21.7) | 18 (9.9) |
Urinary tract infection | 22 (12.2) | 27 (14.7) | 20 (11.1) | 25 (13.7) |
Infusion-related reaction | 16 (8.9) | 13 (7.1) | 25 (13.9) | 14 (7.7) |
Bronchitis | 16 (8.9) | 10 (5.4) | 22 (12.2) | 7 (3.8) |
Headache | 17 (9.4) | 16 (8.7) | 9 (5.0) | 16 (8.8) |
Pharyngitis | 12 (6.7) | 13 (7.1) | 2 (1.1) | 3 (1.6) |
Herpes zoster | 10 (5.6) | 3 (1.6) | 13 (7.2) | 2 (1.1) |
Hypersensitivity | 11 (6.1) | 2 (1.1) | 2 (1.1) | 1 (0.5) |
Cough | 11 (6.1) | 7 (3.8) | 10 (5.6) | 6 (3.3) |
Diarrhea | 5 (2.8) | 13 (7.1) | 2 (1.1) | 2 (1.1) |
Sinusitis | 8 (4.4) | 13 (7.1) | 12 (6.7) | 9 (4.9) |
Vomiting | 9 (5.0) | 4 (2.2) | 9 (5.0) | 6 (3.3) |
Arthralgia | 10 (5.6) | 3 (1.6) | 10 (5.6) | 6 (3.3) |
Back pain | 10 (5.6) | 13 (7.1) | 10 (5.6) | 3 (1.6) |
Nausea | 9 (5.0) | 13 (7.1) | 1 (0.6) | 3 (1.6) |
Gastroenteritis viral | NR | NR | 9 (5.0) | 3 (1.6) |
Patients with ≥ 1 SAE | ||||
Any SAE, n (%) | 25 (13.9) | 30 (16.3) | 15 (8.3) | 31 (17.0) |
Most common events,a n (%) | ||||
Systemic lupus erythematosus | 3 (1.7) | 3 (1.6) | 1 (0.6) | 6 (3.3) |
Pneumonia | 3 (1.7) | 1 (0.5) | 3 (1.7) | 7 (3.8) |
Asthma | 2 (1.1) | 0 | NR | NR |
Chest pain | 2 (1.1) | 0 | NR | NR |
Urinary tract infection | 1 (0.6) | 1 (0.5) | NR | NR |
Bronchitis | 1 (0.6) | 1 (0.5) | NR | NR |
Gastroenteritis | 1 (0.6) | 1 (0.5) | 2 (1.1) | 0 |
Pulmonary embolism | 1 (0.6) | 1 (0.5) | NR | NR |
Noncardiac chest pain | 1 (0.6) | 1 (0.5) | NR | NR |
Sepsis | 0 | 1 (0.5) | NR | NR |
Atrial fibrillation | 0 | 2 (1.1) | NR | NR |
Osteonecrosis | NR | NR | 1 (0.6) | 1 (0.5) |
Radius fracture | NR | NR | 0 | 2 (1.1) |
Patients who stopped treatment due to AEs | ||||
Any, n (%) | 12 (6.7) | 7 (3.8) | 5 (2.8) | 14 (7.7) |
Most common events,a n (%) | ||||
Herpes zoster | 2 (1.1) | 0 | NR | NR |
Upper respiratory tract infection | 1 (0.6) | 0 | NR | NR |
Mycobacterium avium complex infection | 1 (0.6) | 0 | NR | NR |
Pneumonia | 1 (0.6) | 0 | 0 | 2 (1.1) |
B-cell lymphomaa | 1 (0.6) | 0 | NR | NR |
Invasive ductal breast carcinoma | 1 (0.6) | 0 | NR | NR |
Headache | 1 (0.6) | 0 | NR | NR |
Migraine | 1 (0.6) | 0 | NR | NR |
Myasthenia gravis | 1 (0.6) | 0 | NR | NR |
Angioedema | 1 (0.6) | 0 | NR | NR |
Nephritis | 1 (0.6) | 0 | NR | NR |
Invasive breast carcinoma | 0 | 0 | NR | NR |
Anaphylactic reaction | 0 | 0 | NR | NR |
Hypersensitivity | 0 | 0 | 0 | 1 (0.5) |
Encephalitis | 0 | 1 (0.5) | NR | NR |
Neuropsychiatric lupus | 0 | 1 (0.5) | NR | NR |
Systemic lupus erythematosus | 0 | 1 (0.5) | 0 | 3 (1.6) |
Lupus nephritis | 0 | 1 (0.5) | NR | NR |
Adnexa uteri cyst | 0 | 1 (0.5) | NR | NR |
Cervical dysplasia | 0 | 1 (0.5) | 1 (0.6) | 0 |
Influenza-like illness | 0 | 1 (0.5) | 0 | 1 (0.5) |
Deaths | ||||
n (%) | 1 (0.6) | 1 (0.5) | 1 (0.6) | 0 |
Pneumonia | 1 (0.6) | 0 | 1 (0.6) | 0 |
Acute meningoencephalitis | 0 | 1 (0.5) | NR | NR |
Notable harms | ||||
Herpes zoster | 10 (5.6) | 3 (1.6) | 13 (7.2) | 2 (1.1) |
Depression | 5 (2.8) | 5 (2.7) | 5 (2.8) | 3 (1.6) |
Suicidal Ideation or behaviour | 2 (1.1) | 3 (1.6) | 3 (1.7) | 8 (4.4) |
Serious infection (nonopportunistic) | 9 (5.0) | 8 (4.3) | 5 (2.8) | 10 (5.5) |
Pneumonia | 3 (1.7) | 1 (0.5) | 3 (1.7) | 7 (3.8) |
Gastroenteritis viral | 1 (0.6) | 0 | 2 (1.1) | 0 |
Urinary tract infection | 1 (0.6) | 1 (0.5) | NR | NR |
Bronchitis | 1 (0.6) | 0 | NR | NR |
Cellulitis | 1 (0.6) | 0 | NR | NR |
Colitis | 1 (0.6) | 0 | NR | NR |
Gastroenteritis | 1 (0.6) | 0 | NR | NR |
Genital herpes | 1 (0.6) | 0 | NR | NR |
Meningitis viral | 1 (0.6) | 0 | NR | NR |
Pyelonephritis acute | 1 (0.6) | 0 | NR | NR |
Sepsis | 0 | 1 (0.5) | 0 | 1 (0.5) |
Abscess | 1 (0.6) | 0 | 0 | 1 (0.5) |
Epididymitis | 0 | 1 (0.5) | NR | NR |
Infectious colitis | 0 | 1 (0.5) | NR | NR |
Meningitis | 0 | 1 (0.5) | NR | NR |
Chronic otitis media | 0 | 1 (0.5) | NR | NR |
Pelvic infection | 0 | 1 (0.5) | NR | NR |
Sinusitis | 0 | 1 (0.5) | NR | NR |
Periodontitis | NR | NR | 0 | 1 (0.5) |
Sialoadenitis | NR | NR | 0 | 1 (0.5) |
Upper respiratory tract infection | NR | NR | 0 | 1 (0.5) |
Malignancy | 3 (1.7) | 1 (0.5) | 0 | 1 (0.5) |
B-cell lymphoma | 1 (0.6) | 0 | NR | NR |
Squamous cell carcinoma | 1 (0.6) | 0 | NR | NR |
Squamous cell carcinoma of skin | 1 (0.6) | 0 | NR | NR |
Squamous cell carcinoma of the cervix | 0 | 1 (0.5) | NR | NR |
Invasive breast carcinoma | 0 | 0 | NR | NR |
Uterine cancer | NR | NR | 0 | 1 (0.5) |
Hypersensitivity | 11 (6.1) | 2 (1.1) | 2 (1.1) | 1 (0.5) |
Any SAE (including events with outcome of death) | 1 (0.6) | 2 (1.1) | 1 (0.6) | 0 |
Any AE leading to discontinuation of IP | 1 (0.6) | 0 | 0 | 0 |
Mild | 21 (11.7) | 17 (9.2) | 1 (0.6) | 1 (0.5) |
Moderate | 11 (6.1) | 6 (3.3) | 1 (0.6) | 0 |
Severe | 1 (0.6) | 1 (0.5) | 0 | 0 |
Infusion-related reaction | 16 (8.9) | 13 (7.1) | 25 (13.9) | 14 (7.7) |
Any SAE (including events with outcome of death) | 0 | 0 | 0 | 0 |
Any AE leading to discontinuation of investigational | 0 | 0 | 0 | 1 (0.5) |
Mild | 8 (4.4) | 10 (5.4) | 21 (11.7) | 13 (7.1) |
Moderate | 8 (4.4) | 3 (1.6) | 4 (2.2) | 1 (0.5) |
Severe | 0 0 | 0 | 0 | 0 |
AE = adverse event; NR = not reported; SAE = serious adverse event.
aFrequency of 5% or higher in any group.
Source: Clinical Study Reports.9,10
Critical Appraisal
Internal Validity
A number of factors between the 2 pivotal trials contributed to bias or general uncertainty of the outcomes. The primary outcomes for TULIP-1 and TULIP-2 were the composite scores of SRI-4 and BICLA, respectively. The decision to switch the primary end point in the TULIP-2 trial was based on the results of the TULIP-1 and MUSE trials and this decision was made before the unblinding of the data in the TULIP-2 trial at week 52. The risk of operational bias is therefore low. As both trials followed the same procedures for blinding, database locking, unblinding, and data analysis, concerns for potential investigator bias are low. The risk of confounding variables was accounted for through stratification (e.g., SLEDAI-2K score at screening, baseline OCS dose, and type I interferon gene signature test results). Baseline imbalances of these factors could affect efficacy and/or safety assessments of anifrolumab versus placebo. Overall baseline characteristics and disease activity scores (e.g., CLASI activity and SLEDAI-2K scores) were generally similar and balanced between groups across both trials; however, there was a greater percentage of patients with a CLASI damage score of 10 or higher in the treatment group compared to placebo in the TULIP-2 trial (8.9% versus 4.4% respectively) versus the TULIP-1 trial (6.1% versus 4.3%), which could potentially allow for greater leaps in improvement in patients with more severe disease for this outcome. Other concerns include potential ceiling effects for patients with lower disease activity scores (e.g., a patient with a baseline SLEDAI-2K score of 6 would be less likely to achieve a 4-point drop compared with someone who starts with a score of 12). The administration of the investigational product and measurement of variables were standardized between both pivotal trials. A disease adjudication committee was utilized to ensure the quality and accuracy of disease activity measurements by the investigator and confirm eligibility of each patient during the screening period.
In the TULIP-1 trial, there were similar rates of withdrawal in both study arms (18.9% anifrolumab versus 19% placebo) while discontinuation was much lower in the treatment group of the TULIP-2 trial versus the placebo group (13.3% versus 25.3%, respectively). Discontinuations were primarily due to patient request, an AE, lack of efficacy, and condition under investigation worsened. In the TULIP-2 trial, a slightly higher proportion of patients requested to discontinue in the placebo group (10.4%) than in the anifrolumab group (6.1%) and there were also more patients in the placebo group who withdrew due to AEs (3.8% versus. 1.7%) and lack of efficacy (4.4% versus 1.1%) before the end of the study.
The sponsor adhered to its established statistical testing hierarchy for the multiplicity adjustment, testing outcomes in sequence. Sensitivity analyses and multiplicity adjustments were only conducted in the TULIP-2 trial because TULIP-1 did not meet its primary end point. The sponsor used a nonresponder imputation approach in which, if a patient who withdrew from the study or received restricted medications beyond the protocol-allowed threshold, such a patient would be considered a nonresponder. With this approach, when more patients withdrew in the placebo group, this may have biased the results in favour of anifrolumab as these patients would be considered nonresponders whether they were responding at the time of withdrawal or not. The sensitivity analyses performed by the sponsor support the findings of its primary analysis of TULIP-2, using approaches such as LOCF as well as tipping-point analyses. The LOCF method was also used to impute missing data in cases for which individual components of the primary composite outcome were missing. Missing data were more common in the BILAG-2004 component for both studies.
In terms of the difference between subgroups (e.g., SLEDAI-2K score at screening [< 10 points versus ≥ 10 points], baseline OCS dose [< 10 mg/day versus ≥ 10 mg/day prednisone or equivalent] and type I interferon-test result at screening [high versus low]), no hypotheses were provided, and therefore they can only be considered to be hypothesis-generating. In addition, given the exploratory nature of these subgroup analyses and the small sample sizes, the results should be interpreted with caution.
HRQoL, specifically symptoms such as fatigue and mental health, was identified as an important outcome by the patient and clinician groups providing input for this review. MIDs were provided by the sponsor for the SF-36 MCS and FACIT-F, which were in line with thresholds reported in the literature. Although numerical improvements were seen in the treatment group versus the placebo group in both trials for fatigue, and for the PCS and MCS of the SF-36, HRQoL results were not clinically meaningful. In general, no conclusions could be drawn based on the HRQoL data from either trial due to several limitations. Given the overlapping CIs, the small magnitude of change and difference between groups, and the lack of statistical testing and a definition of what constituted a clinically meaningful response for many of the outcome measures, it is not possible to draw conclusions with precision based on the available data.
External Validity
The clinical expert consulted by CADTH agreed that the baseline patient characteristics of the TULIP-1 and TULIP-2 trials were reflective of patients seen in Canadian clinical practice for the present indication. Although the majority of patients in each study were enrolled in trial sites from the US and Europe, the population enrolled in the trial was consistent with the population expected to be treated in Canadian clinical practice. The clinical expert noted that prescribing patterns may differ between countries (e.g., higher use of nervous system medication; or use of mizoribine, which is not prescribed in Canada); however, no different treatment effect would be expected based on different disease-management practices. Additionally, ACR criteria were used to identify patients with SLE in both trials, and these are rigorous criteria that are designed for use in clinical trials, rather than clinical practice. There is therefore a higher risk of misdiagnosis of SLE occurring in clinical practice, although the clinical expert consulted by CADTH noted that a diagnosis of SLE should be straightforward for clinicians with specialty training. Furthermore, the subgroup analyses (e.g., interferon-test high versus low) had no statistical comparisons and even smaller sample sizes, which limits the generalizability to a broader population.
According to the clinical expert, improvements in organ damage or other longer-term outcomes (e.g., mortality) while on anifrolumab are unlikely to be detected during a 52-week double-blind treatment phase because of insufficient duration. The composite primary outcome, patients with an SRI-4 or BICLA response, is not something that would be routinely used to assess patient status in clinical practice. However, the components of the composite would be an important part of the assessment of patients with SLE (e.g., clinical SLEDAI score). As anifrolumab has not been studied versus an active comparator, the efficacy and harms of this drug compared to the addition of other drugs used in the treatment of SLE is unknown. A variety of drugs are used chronically to manage SLE, none of which were specifically developed to manage this disease.
Indirect Evidence
A focused literature search for network meta-analyses dealing with SLE was run in MEDLINE All (1946–) on February 28, 2022. No limits were applied to the search. No relevant studies were identified.
Other Relevant Evidence
This section considers 2 submitted studies provided in the sponsor’s submission to CADTH to address the long-term efficacy of the treatment under review. These include a phase II, multinational, multicentre, randomized, double-blind, placebo-controlled study (MUSE)11 and a phase II, single-arm, open-label, LTE study to evaluate the long-term safety of anifrolumab (Study 1145).12
MUSE
MUSE was a phase II study conducted to evaluate the efficacy and safety of anifrolumab in adult patients with chronic, moderately to severely active SLE.
Methods
MUSE was a phase II, multicentre, randomized, double-blind, placebo-controlled, parallel-group study to evaluate the efficacy and safety of 2 IV treatment regimens in adult patients with chronic, moderately to severely active SLE with an inadequate response to standard of care. Approximately 300 patients were to be randomized in a 1:1:1 ratio to receive a fixed IV dose of anifrolumab (300 or 1,000 mg) or placebo every 4 weeks for 48 weeks.
Results for the anifrolumab 1,000 mg group will not be described in this report given that it is not a Health Canada–recommended dose.
Randomization was stratified by SLEDAI-2K score at screening (< 10 points versus ≥ 10 points), day 1 OCS dose (< 10 mg/day versus ≥ 10 mg/day of prednisone or equivalent), and the results of a type I interferon signature test (positive versus negative). The trial assessed the efficacy of anifrolumab compared to placebo at week 24 and week 52 and the effect of anifrolumab compared to placebo in reducing background OCS dosage, with the same tapering protocol as in the pivotal studies. Safety assessments consisted of reporting all AEs, including TEAEs, and SAEs, as well as AESIs.
Populations
In the MUSE study, inclusion and exclusion criteria were consistent with the pivotal TULIP-1 and TULIP-2 clinical trials. A total of 203 of 626 screened patients with chronic, moderately to severely active SLE were randomized into either the placebo (n = 103) or 300 mg anifrolumab (n = 100) groups at 73 sites in 14 countries in North and South America, Europe, and Asia. Baseline demographics were generally similar between the anifrolumab and placebo groups and they were consistent with the pivotal trials. Most patients were ≤ 45 years of age, female, and white. There were numerically fewer patients from Asia in the anifrolumab group (12.7%) compared to the placebo group (3.0%). At screening before randomization, slightly more patients (62.7%) in the placebo group received high-dose corticosteroids (≥ 10 mg/day) compared to the anifrolumab group (55.6%). In terms of disease severity, baseline values for the SLEDAI-2K, SDI, and CLASI were consistent with those in the pivotal trials.
Table 23: Summary of Baseline Characteristics for MUSE (Modified ITT Population)
Characteristic | Placebo N = 102 | Anifrolumab 300 mg N = 99 |
|---|---|---|
Age, years, median (range) | 39.0 (18 to 65) | 38.0 (19 to 65) |
Females, n (%) | 93 (91.2) | 93 (93.9) |
Ethnicity, n (%) | ||
Hispanic or Latino | 42 (41.2) | 46 (46.5) |
Not Hispanic or Latino | 60 (58.8) | 53 (53.5) |
Race, n (%) | ||
American Indian or Alaskan Native | 0 | 4 (4.0) |
Asian | 13 (12.7) | 3 (3.0) |
Black or African American | 12 (11.8) | 19 (19.2) |
White | 41 (40.2) | 35 (35.4) |
Other | 35 (34.3) | 37 (37.4) |
Multiple categories checked | 1 (1.0) | 1 (1.0) |
Weight, kg, median (range) | 64.6 (40.0 to 139.3) | 67.6 (44.7 to 132.9) |
Height, cm, median (range) | 160.0 (142.0 to 182.0) | 132.0 (137.2 to 188.0) |
Body mass index (kg/m2), median (range) | 24.95 (16.1 to 46.7) | 25.72 (17.0 to 44.6) |
SLICC/ACR damage index score, median (range) | 0 (0 to 7) | 0 (0 to 3) |
CLASI activity score, median (range) | 5.0 (0 to 26) | 5.0 (1 to 36) |
Baseline corticosteroid use, n (%)a | 88 (86.3) | 79 (79.8) |
Baseline corticosteroid use (mg/day), median (range)a | 10 (2.5 to 40.0) | 10 (1.3 to 30.0) |
Baseline corticosteroid use ≥ 10 mg/day, n (%)a | 64 (62.7) | 55 (55.6) |
Other immunomodulatory medication used at baseline | ||
Antimalarial | 75 (73.5) | 76 (76.8) |
Azathioprine | 19 (18.6) | 23 (23.2) |
Methotrexate | 16 (15.7) | 19 (19.2) |
Mycophenolate | 11 (10.8) | 11 (11.1) |
Time from SLE diagnosisb to randomization (months), median (range) | 65.75 (6.9 to 403.5) | 71.4 (7.1 to 360.9) |
High type I interferon-test, n (%) | 76 (74.5) | 75 (75.8) |
Abnormal anti-dsDNA (Farr assay)c | 66 (80.5) | 56 (72.7) |
Abnormal anti-dsDNA (multiplex assay)c | 27 (26.5) | 24 (24.2) |
Abnormal complement C3c | 43 (42.2) | 28 (28.3) |
Abnormal complement C4c | 25 (24.5) | 21 (21.2) |
Positive antinuclear antibodyc | 99 (97.1) | 98 (99.0) |
Not current smoker | 91 (89.2) | 88 (88.9) |
Region, n (%)d | ||
Region 1 | 74 (72.5) | 62 (62.6) |
Region 2 | 28 (27.5) | 37 (37.4) |
ACR = American College of Rheumatology; anti-dsDNA = anti–double-stranded DNA; CLASI = Cutaneous Lupus Erythematosus Disease Activity and Severity Index; ITT = intention-to-treat; SLE = systemic lupus erythematosus; SLICC = Systemic Lupus International Collaborating Clinics.
aCorticosteroids and other immunomodulatory medications used on or after screening visit and before study day 1 are counted once for each patient.
bInitial SLE diagnosis date with valid year and month, but missing day: such a date was assumed to be the 15th of the month in the year. Initial SLE diagnosis date with valid year but missing month and day: date assumed to be 15th of June of the year.
cAbnormal anti-dsDNA (Farr assay) is defined as a value ≥ 5 IU/mL; abnormal anti-dsDNA (multiplex assay) is defined as a value ≥ 100 IU/mL; abnormal complement C3 and C4 are defined as values < LLN; abnormal antinuclear antibody is a value of 1:80 or greater.
dRegion 1: Latin and South America, Eastern Europe, and Asia. Region 2: North America.
Source: Clinical Study Report for MUSE.11
Outcomes
The primary efficacy end point for this study was the proportion of patients who at day 169 achieved an SRI-4 response as defined in the TULIP-1 trial. Patients who were unable to taper their OCS dosage to less than 10 mg/day and to less than the day 1 dose of prednisone or equivalent by day 85 and maintain an OCS dosage of less than 10 mg/day and less than the day 1 dose until day 169 were declared nonresponders for the primary end point. Subgroup analyses included the proportion of patients who tested positive for a type I interferon signature achieving an SRI-4 response with OCS tapering. Secondary efficacy end points included the proportion of patients achieving an SRI-4 response at day 365 and the proportion of patients on 10 mg/day or higher dosage of oral prednisone (or equivalent) at baseline who were able to taper to no more than 7.5 mg/day at day 365.
Other efficacy outcomes were also assessed in the MUSE trial; however, they are not reported further in this review given that they were assessed as exploratory efficacy outcomes. These included: subgroup analysis of efficacy and safety based on type I interferon test (high and low), proportion of patients with a CLASI activity score of 10 or higher at baseline who achieve a reduction of 50% or greater, proportion of patients who achieve an improvement of more than 3 points in the FACIT-Fatigue score, proportion of patients achieving an SRI-4 or greater response with or without OCS tapering, change from baseline in BICLA, SLEDAI-2K, clinical SLEDAI, BILAG-2004, SLE flares, SELENA-SLEDAI modification of the Physician’s Global Assessment(MDGA), OCS use, painful, swollen and tender joint count, Systemic Lupus International Collaborating Clinics (SLICC)/ACR, SF-36, Health Assessment Questionnaire, pain VAS score, EQ-5D, Lupus QoL, PGA, C3 and C4 complement proteins, and total hemolytic (CH50) complement levels.
Safety outcomes included TEAEs, SAEs, and AESIs.
Statistical Analysis
The primary analyses consisted of all efficacy and safety data collected through day 169. All efficacy analyses were conducted on the modified intention-to-treat (mITT) population, which consists of all patients who received at least 1 dose of the investigational product. The primary end point was analyzed by a logistic regression model comparing anifrolumab doses versus placebo. The independent variables in the model included treatment groups and stratification factors, including the SLEDAI-2K score at screening (< 10 points versus ≥ 10 points), OCS usage at baseline (≥ 10 mg/day versus < 10 mg/day of prednisone or equivalent), and the result of the interferon test at screening (positive versus negative). The primary analyses were evaluated in 2 study populations: the overall mITT population and the subpopulation of patients with a high result on a type I interferon test at screening. In the primary analyses, multiplicity was controlled for in the dose comparisons within each of the 2 study populations using the Cochran-Armitage trend test. Multiplicity was not controlled for across the 2 study populations. For the primary analyses, patients with missing primary or secondary end point data were imputed as nonresponders for that end point. A relevant subgroup analysis for the primary end point was performed based on interferon gene diagnostic test (positive versus negative) using univariate logistic regression. Secondary end points were analyzed by a logistic regression model in the overall population and the diagnostic-positive subpopulation without controlling for multiplicity. A 2-sided significance level of 0.10 was used.
Patient Disposition
Patient disposition of the extension study is summarized in Table 24 according to the mITT population. A total of 626 patients were screened and 307 patients were randomized into the placebo (n = 103) or anifrolumab (n = 100) groups. Totals of 25.2% and 16.0% of patients in the placebo and anifrolumab groups discontinued the study, respectively, mainly due to other reasons. All 307 randomized patients were included in the ITT population, and all but 2 patients who did not receive the investigation product (1 in either group) were included in the mITT and safety populations. One patient randomized to placebo received a 1,000 mg dose of anifrolumab and was removed from the placebo group for the safety analyses.
Table 24: Patient Disposition in the MUSE Study
Disposition | Placebo | Anifrolumab 300 mg |
|---|---|---|
Screened, n | 626 | |
Randomized, n | 103 | 100 |
Discontinued, n (%) | 26 (25.2) | 16 (16.0) |
Reason for discontinuation, n (%) | ||
Lost to follow-up | 4 (3.9) | 2 (2.0) |
Withdrawal of consent | 11 (10.7) | 3 (3.0) |
Other | 11 (10.7) | 11 (11.0) |
Intention to treat, n | 103 | 100 |
Modified intention to treat, n | 102 | 99 |
Safety, n | 101 | 99 |
Source: Clinical Study Report for MUSE.11
Exposure to Study Treatments
In MUSE, through to week 52, the total number of patient-years of exposure was 93.4 for the anifrolumab group and 84.3 for the placebo group. A higher proportion of patients in the anifrolumab group (65.7%) received the full course of treatment (13 doses) compared with those in the placebo group (53.5%).
The proportions of patients on a 10 mg/day or higher dosage of oral prednisone (or equivalent) at baseline who were able to taper to no more than 7.5 mg/day at day 169 and day 365 were 45.5% and 56.4% for the anifrolumab group and 25.0% and 26.6% for the placebo group, respectively.
Efficacy
SRI-4 Response With Oral Corticosteroid Tapering at Week 24
A total of 34.3% of patients had an SRI-4 response with OCS tapering at week 24 in the anifrolumab group compared to 17.6% in the placebo group, with an OR of 2.38 (90% CI, 1.33 to 4.26). The difference was statistically significant, with a P value of 0.014.
Proportion of Patients With a High Type I Interferon-Test Result Who Had an SRI-4 Response With OCS Tapering at Week 24
The proportion of patients with a high type I interferon-test result who had an SRI-4 response with OCS tapering at week 24 was 36.0% for the anifrolumab group and 13.2% for placebo group with an OR of 3.55 (90% CI, 1.72 to 7.32). The difference was statistically significant, with a P value of 0.034.
SRI-4 Response With Oral Corticosteroid Tapering at Week 52
For this secondary end point at week 52, a total of 51.5% of patients had an SRI-4 response with OCS tapering in the anifrolumab group compared to 25.5% in the placebo group, with an OR of 3.08 (90% CI, 1.86 to 5.09) and a P value of < 0.001.
Proportion of Patients on a 10 mg/day or Higher Dosage of Oral Prednisone (or Equivalent) at Baseline Who Were Able to Taper to No More Than 7.5 mg/day at Week 52
For this secondary end point, a total of 56.4% of patients in the anifrolumab group on a 10 mg/day or higher dosage of oral prednisone (or equivalent) at baseline were able to taper to no more than 7.5 mg/day by week 52 compared to 26.6% in the placebo group, with an OR of 3.59 (90% CI, 1.87 to 6.89) and a P value of < 0.001.
Table 25: Primary and Secondary Efficacy Outcomes in MUSE Study Through Week 24 and Week 52 (mITT Population)
Outcome | Week 24 | Week 52 | |||
|---|---|---|---|---|---|
Placebo N = 102 | Anifrolumab 300 mg N = 99 | Placebo N = 102 | Anifrolumab 300 mg N = 99 | ||
SRI-4 responder rate with OCS tapering | |||||
All patients | N | 102 | 99 | 102 | 99 |
Responder,a n (%) | 18 (17.6) | 34 (34.3) | 26 (25.5) | 51 (51.5) | |
Nonresponder,b n (%) | 84 (82.4) | 65 (65.7) | 76 (74.5) | 48 (48.5) | |
ORc (90% CI) | NA | 2.38 (1.33 to 4.26) | NA | 3.08 (1.86 to 5.09) | |
P valuec | NA | 0.014d | NA | < 0.001 | |
High type I interferon test | N | 76 | 75 | 76 | 75 |
Responder,a n (%) | 10 (13.2) | 27 (36.0) | 15 (19.7) | 39 (52.0) | |
Nonresponder, n (%) | 66 (86.8) | 48 (64.0) | 61 (80.3) | 36 (48.0) | |
ORc (90% CI) | NA | 3.55 (1.72 to 7.32) | NA | 4.3 (2.34 to 7.91) | |
P valuec | NA | 0.004d | NA | < 0.001 | |
Low type I inteferon test | N | 26 | 24 | 26 | 24 |
Responder,a n (%) | 8 (30.8) | 7 (29.2) | 11 (42.3) | 12 (50.0) | |
Nonresponder, n (%) | 18 (69.2) | 17 (70.8) | 15 (57.7) | 12 (50.0) | |
ORc (90% CI) | NA | 0.96 (0.34 to 2.74) | NA | 1.47 (0.55 to 3.93) | |
P valuec | NA | 0.946d | NA | 0.514 | |
Patients on ≥ 10 mg/day OCS at baseline and reduction to ≤ 7.5 mg/day | |||||
All patients | N | 64 | 55 | 64 | 55 |
Reduced to ≤ 7.5 mg/day, n (%) | 16 (25.0) | 25 (45.5) | 17 (26.6) | 31 (56.4) | |
Did not reduce to ≤ 7.5 mg/day, n (%) | 48 (75.0) | 30 (54.5) | 47 (73.4) | 24 (43.6) | |
ORc (90% CI) | NA | 2.48 (1.28 to 4.80) | NA | 3.59 (1.87 to 6.89) | |
P valuec | NA | 0.023 | NA | 0.001 | |
High type I interferon test | N | 53 | 44 | 53 | 44 |
Reduced to ≤ 7.5 mg/day, n (%) | 11 (20.8) | 21 (47.7) | 13 (24.5) | 26 (59.1) | |
Did not reduce to ≤ 7.5 mg/day, n (%) | 42 (79.2) | 23 (52.3) | 40 (75.5) | 18 (40.9) | |
ORc (90% CI) | NA | 3.44 (1.63 to 7.28) | NA | 4.4 (2.12 to 9.16) | |
P valuec | NA | 0.007 | NA | < 0.001 | |
Low type I interferon test | N | 11 | 11 | 11 | 11 |
Reduced to ≤ 7.5 mg/day, n (%) | 5 (45.5) | 4 (36.4) | 4 (36.4) | 5 (45.5) | |
Did not reduce to ≤ 7.5 mg/day, n (%) | 6 (54.5) | 7 (63.6) | 7 (63.6) | 6 (54.5) | |
ORc (90% CI) | NA | 0.74 (0.17 to 3.30) | NA | 1.63 (0.37 to 7.17) | |
P valuec | NA | 0.744 | NA | 0.5888 | |
CI = confidence interval; mITT = modified intention-to-treat; NA = not applicable; OCS = oral corticosteroid; OR = odds ratio; SLEDAI-2K = Systemic Lupus Erythematosus Disease Activity Index 2000; improvement of 4 points or more on the Systemic Lupus Erythematosus Responder Index.
aResponders are defined as those meeting the SRI-4 criteria and OCS tapering requirement. The SRI-4 criteria are defined as 1) a reduction in baseline SLEDAI-2K disease activity score of ≥ 4 points; 2) no worsening in MDGA (worsening is defined as an increase of 0.3 points or more from baseline on a 0 to 3 visual analogue scale); and 3) no worsening in BILAG-2004 (worsening is defined as at least 1 new A score or 2 new B scores on the BILAG-2004 compared with baseline).
bFor the OCS tapering requirement, patients who were unable to taper OCS to less than 10 mg/day and no more than the day 1 dose of prednisone or equivalent by day 85 and maintain OCS dosages of less than 10 mg/d and no more than the day 1 dose until day 169 were declared nonresponders. Dropouts were considered nonresponders for the primary analysis.
cORs (90% CI) and P values are based on a logistic regression model for comparisons of each anifrolumab group vs. placebo adjusted for randomization stratification factors.
dMarked P value has not been adjusted for multiple testing (i.e., the type I error rate has not been controlled).
Source: Clinical Study Report for MUSE.11
Harms
A summary of TEAEs at the interim analysis is presented in Table 26. During the 52-week period, 84.8% of patients in the anifrolumab group and 77.2% of patients in the placebo group reported at least 1 TEAE, the most common being headache, upper respiratory tract infection, nasopharyngitis, and urinary tract infection. Nasopharyngitis occurred at a higher frequency in the anifrolumab group (12.1%) than in the placebo group (4.0%).
The proportion of patients with at least 1 SAE was similar between the anifrolumab and placebo groups, the most common being increase SLE activity and pneumonia. The most common AESIs were infusion, hypersensitivity, and anaphylactic reactions, which represented a higher proportion of the placebo group (5.9%) compared with the anifrolumab group (2.0%). No deaths were reported in the anifrolumab 300 mg/day or placebo groups.
Table 26: Summary of TEAEs in MUSE Extension Study (Safety Population)
Adverse event | Placebo N = 101 | Anifrolumab 300 mg N = 99 |
|---|---|---|
Any TEAEs, n (%) | 78 (77.2) | 84 (84.8) |
Common TEAEs,a n (%) | ||
Headache | 13 (12.9) | 12 (12.1) |
Upper respiratory tract infection | 10 (9.9) | 13 (13.1) |
Nasopharyngitis | 4 (4.0) | 12 (12.1) |
Urinary tract infection | 11 (10.9) | 15 (15.2) |
Bronchitis | 4 (4.0) | 7 (7.1) |
Herpes zoster | 2 (2.0) | 5 (5.1) |
Influenza | 2 (2.0) | 6 (6.1) |
Diarrhea | 4 (4.0) | 4 (4.0) |
Sinusitis | 3 (3.0) | 6 (6.1) |
Cough | 2 (2.0) | 3 (3.0) |
Acute TEAEs,b n (%) | 13 (12.9) | 12 (12.1) |
Patients with drug-related TEAE, n (%) | 25 (24.8) | 21 (21.2) |
Patients with ≥ 1 SAE, n (%) | 19 (18.8) | 16 (16.2) |
Common SAEs,c n (%) | ||
Increased SLE activity | 6 (5.9) | 3 (3.0) |
Pneumonia | 2 (2.0) | 2 (2.0) |
Patients with WDAEs, n (%) | 8 (7.9) | 3 (3.0) |
AESIs,a n (%) | ||
Infusion, hypersensitivity, and anaphylactic reactions | 6 (5.9) | 2 (2.0) |
AESI = adverse event of special interest; SAE = serious adverse event; TEAE = treatment-emergent adverse event; WDAE = withdrawal due to adverse event.
aObserved in 5% or more of patients.
bOccurred within 24 hours after administration of investigational product.
cSAEs affecting 2 or more patients.
Source: Clinical Study Report for MUSE.11
Critical Appraisal
Internal Validity
This phase II study had patients randomized and stratified by SLEDAI-2K score at screening and day 1 OCS dose, and by the results of a type I interferon signature test. The trial was double-blinded, with patients and study personnel involved in patient care or outcome assessment blinded to treatment. It is possible patients may have been potentially unblinded or may have been aware of their assignments due to improvement or lack of improvement (placebo) over the study period. The baseline patient characteristics were generally well balanced between anifrolumab and placebo groups. Despite stratification by OCS dose, a higher proportion of patients in the placebo group used a dosage of 10 mg/day or higher of OCS at baseline than those in the anifrolumab group (62.7% versus 55.6%). The discontinuation rate was higher in the placebo group (25.2%) than in the anifrolumab group (16.0%) which raises the concern of a risk of attrition bias. Discontinued patients were classified as nonresponders in the primary analyses, possibly biasing the results in the direction of placebo, although sensitivity analyses using LOCF imputation produced results similar to those of the primary analyses. Furthermore, it was unclear whether the patients who discontinued were different from those who did not. The primary outcome, SRI-4, is a reliable and valid composite measure for disease activity and response in SLE. The primary outcome was measured at 24 and 56 weeks in the MUSE study, which provided data on long-term treatment effects. The clinical expert consulted for this review agreed that a treatment response should be expected within 24 weeks for a drug to have clinical utility.
In terms of statistical analyses of the primary efficacy outcome, multiplicity was controlled for within the dose comparisons, but multiplicity was not controlled across populations. There was no control for multiplicity in the secondary efficacy outcomes which increases the likelihood of a type I error.
External Validity
The MUSE trial used similar inclusion and exclusion criteria as the pivotal trials and enrolled predominantly middle-aged, white females. The expert consulted for this review considered the patients enrolled in the pivotal trials to be representative of patients with moderate to severe SLE in Canada. Nevertheless, the high dropout rate in the placebo group may have led to patients who are less representative of the recruited population, decreasing the generalizability of the results of the study.
Study 1145
Methods
Study 114512 was a single-arm, open-label, long-term (up to 3 years) safety and tolerability study of anifrolumab 300 mg administered by IV infusion every 4 weeks (before the February 12, 2015, protocol amendment, the dose of anifrolumab was 1,000 mg, which is not a Health Canada–recommended dose). Safety assessments consisted of reporting all AEs, including TEAEs, and SAEs, as well as AESIs.
A total of 218 adult patients with chronic, moderate to severe SLE who were previously treated with any dose of anifrolumab or placebo in the MUSE trial and who completed the treatment and the 85-day follow-up period were enrolled in Study 1145. Patients were enrolled from 59 centres in North and South America, Europe, and Asia. Permitted standard-of-care SLE medications included an OCS (up to 40 mg/day of prednisone or equivalent), intramuscular corticosteroids, intra-articular/tendon sheath/bursa corticosteroid injections, antimalarials, slow-acting immunosuppressants, NSAIDs, and topical therapy. OCS medications at dosages higher than 40 mg/day for more than 14 days could be continued unless there was a safety concern. Slow-acting immunosuppressants were not permitted in Study 1145 above the following dosages: 200 mg/day of azathioprine, 2.0 g/day of mycophenolate or mofetil/mycophenolic acid, or 25 mg/week of methotrexate. Excluded concomitant medications throughout the study included biologics (e.g., belimumab), monoclonal antibodies (e.g., rituximab); IV corticosteroids, interferon therapy, live or attenuated vaccines, plasmapheresis, and immunoglobulin therapy.
Populations
At baseline, the mean disease SLEDAI-2K global score was 4.9 (SD = 3.9). This was lower than in the pivotal trials, which required a SLEDAI-2K score of 6 points or more for inclusion. A total of 72.9% of patients used corticosteroids at baseline and of these, 37.7% were on high-dose corticosteroids (≥ 10 mg/day). This was slightly lower than those in the pivotal trials, which had at least 46% using 10 mg/day or higher. A total of 68.3% of patients were on antimalarial medication at baseline. Approximately 67% of patients were type I interferon gene signature high (abnormal) and most patients were positive for antinuclear antibodies (95.8%).
Table 27: Summary of Baseline Characteristics for Study 1145 (As-Treated Population)
Characteristic | N | Anifrolumab population N = 218 |
|---|---|---|
Age (years), median (range) | 218 | 41.0 (19 to 66) |
Females, n (%) | 218 | 203 (93.1%) |
Ethnicity, n (%) | ||
Hispanic or Latino | 218 | 104 (47.7%) |
Not Hispanic or Latino | 218 | 114 (52.3%) |
Race, n (%) | ||
American Indian or Alaskan Native | 218 | 4 (1.8%) |
Asian | 218 | 11 (5.0%) |
Black or African American | 218 | 29 (13.3%) |
White | 218 | 87 (39.9%) |
Other | 218 | 85 (39.0%) |
Multiple categories checked | 218 | 2 (0.9%) |
Weight, kg, median (range) | 166 | 27.3 (6.8) |
SDI score, median (range) | 218 | 0.0 (0 to 5) |
SLEDAI-2K global score, median (range) | 218 | 4.0 (0 to 22) |
4-gene interferon gene signature | ||
High | 213 | 143 (67.1%) |
Low | 213 | 70 (32.9%) |
Abnormal ANA status | 212 | 203 (95.8%) |
Positive anti-dsDNAa | 205 | 57 (27.8%) |
Abnormal complement C3 protein | 206 | 61 (29.6%) |
Abnormal complement C4 protein | 206 | 49 (23.8%) |
Corticosteroids use | 218 | 159 (72.9%) |
≥ 10 mg/day | 218 | 60 (37.7%) |
< 10 mg/day | 218 | 99 (62.3%) |
Other immunosuppressant use | 218 | — |
Antimalarial | 218 | 149 (68.3%) |
Azathioprine | 218 | 34 (15.6%) |
Methotrexate | 218 | 45 (20.6%) |
Mycophenolate | 218 | 25 (11.5%) |
Leflunomide | 218 | 1 (0.5%) |
ANA = antinuclear antibody; ant–dsDNA = anti–double-stranded DNA; SDI = Systemic Lupus International Collaborating Clinics/American College of Rheumatology Damage Index: SLEDAI-2K = Systemic Lupus Erythematosus Disease Activity Index 2000.
aThe assay to test anti-dsDNA was changed several times during the study. Reported baseline results are from multiple testing assays.
Source: Clinical Study Report for Study 1145.12
Outcomes
The primary end points of the study were the safety and tolerability of IV anifrolumab in adult patients with moderately to severely active SLE and were assessed primarily by summarizing TEAEs, SAEs, AEs leading to discontinuation, and AESIs. The secondary safety outcome included evaluating the immunogenicity results of anifrolumab by summarizing the proportion of patients who developed detectable ADAs. Relevant exploratory outcome assessed was mean change in the SLEDAI-2K global score and the SDI global score from baseline through to year 3.
Statistical Analysis
All analyses were descriptive for Study 1145, which was an open-label extension study. Categorical data were summarized by the number and percentage of patients in each category. Continuous variables were summarized by descriptive statistics, including mean, SD, median, minimum, and maximum.
Patient Disposition
A total of 218 patients completed the MUSE trial, met eligibility criteria, were enrolled into this open-label extension study, and received treatment. Of these, 152 (70%) had received anifrolumab and 66 (30%) had received placebo in the MUSE trial. Patients who permanently discontinued treatment could continue the study if they were followed up through 85 days after their last dose. Patients were considered to have not completed the study if consent was withdrawn or the patient was lost to follow-up. Overall, 63.8% of patients completed treatment and 78.9% of patients completed the study procedures. The most common reason for discontinuation of treatment or study was withdrawal by patient, which was not explored further in the MUSE trial. Patient disposition of the extension study is summarized in Table 28.
Table 28: Patient Disposition in Study 1145
Disposition | Anifrolumab population N = 218 |
|---|---|
Screened, n | 218 |
Enrolled, n | 218 |
Discontinued treatment, n (%) | 79 (36.2) |
Reason for discontinuation, n (%) | |
Adverse event | 15 (6.9) |
Lost to follow-up | 3 (1.3) |
Withdrawal of consent | 31 (14.2) |
Death | 1 (0.5) |
Other | 29 (13.3) |
Discontinued study, n (%) | 46 (21.1) |
Reason for discontinuation, n (%) | |
Lost to follow-up | 6 (2.8) |
Withdrawal of consent | 23 (10.6) |
Death | 1 (0.5) |
Other | 16 (7.3) |
Source: Clinical Study Report for Study 1145.12
Efficacy Outcomes
SLEDAI-2K
The mean SLEDAI-2K score was 4.9 (SD = 3.9) at baseline (n = 218) and 3.7 (SD = 3.5) at week 168 (n = 139); with a mean change of −0.9 (SD = 4.1).
SDI
The mean SDI score was 0.6 (SD = 1.0) at baseline (n = 218) and 0.6 (SD = 1.0) at week 168 (n = 140), with a mean change of 0.1 (SD = 0.6).
Exposure to Study Treatments
All 218 patients received at least 1 dose of anifrolumab in the open-label extension study for up to 3 years. A majority of patients (64.2%) received at least 35 doses and 70.6% of patients were treated for 30 months or longer, for a total of 542 patient-years of exposure. The median duration of exposure in months was 35.877 (range = 0.03 to 36.60). During an infusion, 6 of 218 patients (2.8%) had their treatment interrupted (stopped during the infusion, then restarted), most commonly due to an AE. A total of 72 of 218 patients (33%) had at least 1 dose omitted (missed), most commonly because of an AE.
A total of 112 (51.4%) of patients received concomitant immunomodulatory medications, most commonly prednisone (20.6%) and methylprednisolone (13.3%). Trends related to OCS dosing were not explored in Study 1145.
Table 29: Extent of Exposure and Dose Modifications in Study 1145 (As-Treated Population)
Characteristic | Anifrolumab population N = 218 |
|---|---|
Duration of exposure (months), median (range) | 35.877 (0.03 to 36.60) |
Patients with partial dose administered, n (%) | 4 (1.8%) |
Patients with doses interrupted, n (%) | 6 (2.8%) |
Patients with doses omitted, n (%) | 72 (33.0%) |
Source: Clinical Study Report for Study 1145.12
Harms
The summary of TEAEs reported for up to 3 years of open-label treatment are presented in Table 8. A total of 78% of patients (n = 170) experienced an AE; the most common being nasopharyngitis (14.7%), bronchitis (13.8%), and upper respiratory tract infections (9.2%). A total of 22% of patients (n = 48) had a drug-related TEAE and 22.9% (n = 50) had 1 or more SAEs, with an exposure-adjusted SAE rate of 8.56 per 100 patient-years. The most common SAEs were increased SLE activity and pneumonia, each of which occurred in 2.3% of patients. One patient died from community-acquired pneumonia and this death was assessed by the investigator as related to treatment. In terms of AESIs, 7 patients (3.2%) had infusion, hypersensitivity, or anaphylactic reactions, and 5 patients (2.3%) had latent tuberculosis. Five patients had ADA-positive measurements at any time during Study 1145, of which 3 were at baseline only and 2 were considered persistent.
Table 30: Summary of TEAEs in Study 1145 Through to Year 3 (Safety Population)
Adverse event | Anifrolumab patients N = 218 |
|---|---|
Any TEAEs, n (%) | 170 (78.0) |
Common TEAEs,a n (%) | |
Nasopharyngitis | 32 (14.7) |
Bronchitis | 30 (13.8) |
Upper respiratory tract infection | 20 (9.2) |
Urinary tract infection | 15 (6.9) |
Headache | 14 (6.4) |
Herpes zoster | 11 (5.0) |
Diarrhea | 11 (5.0) |
Patients with drug-related TEAE, n (%) | 48 (22.0) |
Patients with ≥ 1 SAE, n (%) | 50 (22.9) |
Death, n (%) | 1 (0.5) |
Common SAEs,b n (%) | |
Increased SLE activity | 5 (2.3) |
Pneumonia | 5 (2.3) |
AEs of special interest, n (%) | |
Hypersensitivity, infusion-related reaction, nausea | 7 (3.2) |
Latent tuberculosis | 5 (2.3) |
AE = adverse event; SAE = serious adverse event; TEAE treatment-emergent adverse event.
aObserved in 5% or more of patients.
bSAEs affecting 1% or more of patients; includes all events reported after the first dose of anifrolumab.
Source: Clinical Study Report for Study 1145.12
Critical Appraisal
The extension study allowed for investigation of long-term efficacy and harms of anifrolumab. Limitations of the extension study include the absence of an active comparator, which limits causal conclusions. Furthermore, the analysis does not take account of the frequency or recurrence of AEs. As a greater proportion of patients in Study 1145 had previously been treated with anifrolumab in the MUSE study, observations based on frequencies of overall AEs in Study 1145 should be interpreted with caution. This could have resulted in a population of patients who were more tolerant of anifrolumab and therefore potentially less likely to experience harms. A relatively high proportion of patients discontinued the study (36.2%), which can increase the risk of attrition bias in favour of the intervention as patients who do not do well on the intervention tend to withdraw from the study. Although these patients were included in the safety analyses, their characteristics were not reported, and it was unclear whether the patients who discontinued were different from those who did not.
TULIP Long-Term Extension
The TULIP LTE was a 3-year, double-blind, placebo-controlled LTE study of the TULIP-1 and TULIP-2 trials in adults who had moderately to severely active SLE at the start of the trials. Patients who received anifrolumab in the TULIP-1 or TULIP-2 trial and entered the LTE remained on anifrolumab. Patients who received placebo and entered the LTE were rerandomized 1:1 to receive either anifrolumab or placebo in the LTE.13
Methods
The TULIP LTE was a 3-year phase III, global, multicentre, randomized, double-blind, placebo-controlled LTE study, characterizing the long-term safety and tolerability of anifrolumab 300 mg administered as IV monthly infusions versus placebo in patients with moderately to severely active SLE despite standard therapy.
Patients were randomized using an interactive voice-response system algorithm to the following groups during the LTE:
patients previously treated with anifrolumab 300 mg continued on blinded anifrolumab 300 mg
patients previously treated with anifrolumab 150 mg switched to blinded anifrolumab 300 mg
patients previously randomized to placebo were rerandomized 1:1 to blinded anifrolumab 300 mg or placebo.
This resulted in an approximate ratio of anifrolumab 300 mg versus placebo of 4:1 in the LTE study.
The LTE study consisted of a 156-week treatment period, after which patients continued in the study for another 8 weeks to complete a 12-week safety follow-up after the last dose (given at week 152) of the investigational product. Upon unblinding of the LTE study to support the 4-month safety update for a regulatory submission, treatment allocation for all patients became known to AstraZeneca. All study management personnel remained blinded. The blind was maintained for the investigators, investigational site staff, and for the patients. Measures were taken to minimize the potential impact related to the unblinding of data during an ongoing study, including using redacted documents for review of protocol deviations and narratives, restriction of access to documents containing unblinded data, and careful tracking of all individuals not remaining blinded.
Populations
The LTE target population comprised patients who had completed the 52-week double-blind treatment period in 1 of the phase III studies (TULIP-1 or TULIP-2), met all LTE eligibility criteria, and were willing to continue into the extension study. Similar to the TULIP-1 and TULIP-2 trials, certain SLE medications, such as cyclophosphamide, biologics, IV immunoglobulin, and IV steroids, were prohibited in the LTE to protect the safety of participating patients. However, in contrast to the TULIP-1 and TULIP-2 trials, there was no requirement for OCS tapering, and OCS bursts were allowed. In the LTE study, patients remained on background standard-of-care SLE therapy, but investigators were allowed to adjust, as clinically indicated for disease control, throughout the 3-year LTE. Patients were allowed to change dose or add or switch to a new immunosuppressant during the LTE.
Disease characteristics and baseline treatments were well balanced between groups. The mean age was 41 to 43 years and majority of patients were female (92% to 93%) and white (65% to 69%). Overall, this patient population had moderate to severe disease activity at baseline, with a mean overall SLEDAI 2K score of 11.2 in the LTE anifrolumab 300 mg group and 11.3 in the LTE placebo group; respectively. Across treatment analysis groups, approximately 70% of patients had a total SLEDAI-2K score of 10 points or higher. At week 52, the final visit of the feeder studies and the first visit of the LTE study, the mean SLEDAI 2K score was 5.1 in the combined anifrolumab 300 mg group and 6.0 in the all-placebo group. Baseline organ damage (SDI ≥ 1) was observed in less than half of patients, with an overall mean score of 0.6. Approximately 80% of patients were classified as type I interferon gene signature test high at screening, and with balanced proportions across groups.
Table 31: Summary of Baseline Characteristics
Characteristic | TULIP long-term extension | |
|---|---|---|
Anifrolumab (N = 257) | Placebo (N = 112) | |
Age (years) | ||
Mean | 43.4 | 41.4 |
SD | 11.51 | 11.46 |
Median | 43.0 | 42.5 |
Minimum | 18 | 19 |
Maximum | 69 | 65 |
Age subgroups, n (%) | ||
< 18 | 0 | 0 |
≥ 18 to < 65 | 247 (96.1) | 111 (99.1) |
≥ 65 | 10 (3.9) | 1 (0.9) |
Sex n (%) | ||
Female | 237 (92.2) | 103 (92.0) |
Male | 20 (7.8) | 9 (8.0) |
Body mass index (kg/m2), n (%) | ||
≤ 28 | 148 (57.6) | 65 (58.0) |
> 28 | 109 (42.4) | 47 (42.0) |
Race, n (%) | ||
White | 173 (67.3) | 77 (68.8) |
Black or African American | 28 (10.9) | 11 (9.8) |
Asian | 33 (12.8) | 10 (8.9) |
Native Hawaiian or other Pacific Islander | 0 | 0 |
American Indian or Alaska Native | 3 (1.2) | 1 (0.9) |
Other | 15 (5.8) | 11 (9.8) |
Missing | 5 (1.9) | 2 (1.8) |
Ethnic group, n (%) | ||
Hispanic or Latino | 54 (21.0) | 28 (25.0) |
Not Hispanic or Latino | 198 (77.0) | 82 (73.2) |
Missing | 5 (1.9) | 2 (1.8) |
Geographic region, n (%)a | ||
Asia Pacific | 31 (12.1) | 8 (7.1) |
Europe | 90 (35.0) | 41 (36.6) |
Latin America | 33 (12.8) | 15 (13.4) |
US or Canada | 98 (38.1) | 44 (39.3) |
Rest of world | 5 (1.9) | 4 (3.6) |
Disease characteristics | ||
SLEDAI-2K score at baseline | ||
< 10 points, n (%) | 73 (28.4) | 32 (28.6) |
≥ 10 points, n (%) | 184 (71.6) | 80 (71.4) |
Mean (SD) | 11.2 (3.70) | 11.3 (3.58) |
Median (range) | 10.0 (6 to 32) | 10.0 (6 to 24) |
Clinical SLEDAI-2K score at baseline | ||
Mean (SD) | 8.9 (2.83) | 9.3 (2.59) |
Median (range) | 8.0 (4 to 20) | 8.0 (4 to 18) |
PGA score at baseline | ||
Mean (SD) | 1.77 (0.422) | 1.76 (0.406) |
Median (range) | 1.70 (0.8 to 2.7) | 1.70 (0.6 to 2.8) |
SDI global score at baseline | ||
0 (no damage), n (%) | 167 (65.0) | 65 (58.0) |
≥ 1 (damage), n (%) | 90 (35.0) | 46 (41.1) |
Mean (SD) | 0.6 (1.05) | 0.6 (0.91) |
Median | 0 (0 to 5) | 1 (0.9) (0 to 5) |
Time from initial SLE diagnosis to randomization (months) | ||
Mean (SD) | 121.7 (102.33) | 101.2 (93.69) |
Median | 92.0 (0 to 555) | 80.5 (6 to 503) |
Results of type I interferon gene signature test | ||
High, n (%) | 206 (80.2) | 93 (83.0) |
Low, n (%) | 51 (19.8) | 19 (17.0) |
Anti-dsDNA levels at baseline | ||
Positive, n (%) | 113 (44.0) | 38 (33.9) |
Negative, n (%) | 144 (56.0) | 74 (66.1) |
Antinuclear antibody at baseline | ||
Normal (titre < 1:80), n (%) | 20 (7.8) | 11 (9.8) |
Abnormal (titre ≥ 1:80), n (%) | 229 (89.1) | 99 (88.4) |
Missing, n (%) | 8 (3.1) | 2 (1.8) |
SLE-related treatments at baseline | ||
OCS,a n (%) | 208 (80.9) | 92 (82.1) |
Antimalarials, n (%) | 171 (66.5) | 83 (74.1) |
Immunosuppressants, n (%) | ||
Azathioprine, n (%) | 42 (16.3) | 18 (16.1) |
Methotrexate, n (%) | 45 (17.5) | 26 (23.2) |
Mycophenolate n (%) | 37 (14.4) | 14 (12.5) |
Nonsteroidal anti-inflammatory drugs, n (%) | 27 (10.5) | 14 (12.5) |
Other SLE medication | 129 (50.2) | 53 (47.3) |
Anti-dsDNA = anti–double-stranded DNA; OCS = oral corticosteroid; PGA = Physician’s Global Assessment; SD = standard deviation; SDI = Systemic Lupus International Collaborating Clinics/American College of Rheumatology Damage Index; SLE = systemic lupus erythematosus; SLEDAI-2K = Systemic Lupus Erythematosus Disease Activity Index 2000.
aOCS contains prednisone or equivalent. It is defined as oral medications listed in the WHO-DD SDG “Corticosteroids.”
Source: Clinical Study Report for TULIP long-term extension.13
Outcomes
Primary objective: characterize long-term safety and tolerability of IV anifrolumab in patients who completed the TULIP-1 or TULIP-2 trial (e.g., AESIs, SAEs).
Exploratory objectives: limited efficacy assessments (overall disease activity [SLEDAI-2K], OCS use, damage accrual [SDI]). Other exploratory outcomes included HRQoL (e.g., SF-36v2, and EQ-5D-5L)
Statistical Analysis
No formal comparisons were planned in this study. The LTE sample size was not based on statistical considerations but was instead defined by all patients completing the double-blind treatment period in the TULIP-1 and TULIP-2 trials who met all eligibility criteria and consented to continue into LTE.
AEs are summarized by descriptive statistics and qualitative summaries, exposure-adjusted incidence rates and adjusted cumulative proportions. Differences between treatment groups are presented for SAEs, AEs leading to discontinuation, deaths, and AESIs as adjusted differences in cumulative proportions and risk differences (based on exposure-adjusted incidence rates), and respective 95% CIs.
Observed values and changes from baseline in SLEDAI-2K, OCS use, and SDI global score are presented by visit with descriptive statistics.
Patient Disposition
In total, 547 patients who had completed the 52-week treatment period on the investigational product in the TULIP-1 and TULIP-2 trials were enrolled and received at least 1 dose of the product in the LTE study. Of these, 257 patients treated with anifrolumab 300 mg continued on anifrolumab 300 mg (LTE anifrolumab 300 mg group). Of the 223 patients from the feeder studies’ placebo treatment groups who entered the LTE, 112 patients were rerandomized to continue on placebo (LTE placebo group) and 111 patients were rerandomized to anifrolumab 300 mg. In addition, 67 patients switched from anifrolumab 150 mg in the TULIP-1 trial to anifrolumab 300 mg.
A higher proportion of patients In the LTE anifrolumab 300 mg group (69.3%) completed the LTE study compared with LTE placebo (69.3% and 48.2%, respectively). More patients in the LTE placebo group compared to the LTE anifrolumab 300 mg group discontinued the investigational product due to withdrawal by patient (22.3% versus 11.7%) or due to lack of efficacy (7.1% versus 5.4%). The proportions of patients who discontinued treatment due to AEs were low and comparable between the LTE anifrolumab 300 mg group (7.0%) and the LTE placebo group (8.0%).
Table 32: Patient Disposition (Full Analysis Set — LTE Study)
Disposition | Anifrolumab 300 mg | Placebo |
|---|---|---|
Randomized TULIP-1 and TULIP-2 | 809 | |
Rerandomized, n | 257 | 112 |
Completed LTE study | 178 (69.3) | 54 (48.2) |
Discontinued, n (%) | 79 (30.7) | 58 (51.8) |
Reason for discontinuation, n (%) | ||
Adverse event | 11 (4.3) | 4 (3.6) |
Condition under investigation improved or patient recovered | 1 (0.4) | 0 |
Condition under investigation worsened | 0 | 2 (1.8) |
Death | 2 (0.8) | 1 (0.9) |
Development of study-specific withdrawal criteria | 1 (0.4) | 0 |
Lack of efficacy | 10 (3.9) | 6 (5.4) |
Lost to follow-up | 5 (1.9) | 6 (5.4) |
Severe noncompliance to protocol | 1 (0.4) | 2 (1.8) |
Withdrawal by patient | 38 (14.8) | 29 (25.9) |
Missing | 1 (0.4) | 0 |
Other | 9 (3.5) | 8 (7.1) |
Due to COVID-19 pandemic | 7 (2.7) | 2 (1.8) |
Full analysis set, n | 112 | 435 |
LTE = long-term extension.
Source: Clinical Study Report for TULIP LTE.13
Exposure to Study Treatments
Exposure during treatment and follow-up in the LTE study was 683.5 patient-years in the anifrolumab 300 mg group and 250.3 patient-years in the placebo group. The total anifrolumab exposure to any dose at any time point during the feeder or LTE was 1,568 patient-years.
Efficacy
Systemic Lupus Erythematosus Disease Activity Index 2000
The observed treatment effect on SLEDAI-2K of anifrolumab 300 mg compared with placebo at week 52 was sustained throughout the 3-year LTE treatment period, with further improvements observed with anifrolumab 300 mg compared with placebo with longer treatment duration. A sensitivity analysis of all patients, including those excluded from the full analysis set, was conducted and had consistent results with the primary analysis.
The proportion of patients who achieved a reduction of 4 points or more from baseline was also consistently higher in the combined anifrolumab 300 mg group than in the combined placebo group. In the combined anifrolumab 300 mg group, 76.1% of patients who reached the week 52 visit had a reduction of 4 points or more and 90.0% of those who reached week 208, compared with 69.5% and 81.8%, respectively, in the combined placebo group. In addition, larger improvements were seen from baseline to week 208 across all domains in the anifrolumab group compared to placebo.
Table 33: SLEDAI-2K and Change From Baseline, Estimates and Standard Errors, Analysis of Covariance, Combined Data From Feeder and LTE Study (Full Analysis Set)
Study detail | Result | Change from baseline | |||||
|---|---|---|---|---|---|---|---|
Time point | Treatment group | n | LS mean (SE) | 95% CI | n | LS mean (SE) | 95% CI |
Baseline | Combined anifrolumab 300 mg (N = 358) | 358 | 10.9 (0.25) | 10.4 to 11.4 | — | — | — |
Combined placebo (N = 178) | 178 | 10.8 (0.32) | 10.2 to 11.5 | — | — | — | |
Week 24 | Combined anifrolumab 300 mg (N = 358) | 325 | 6.7 (0.26) | 6.2 to 7.2 | 325 | −4.7 (0.26) | −5.2 to −4.2 |
Combined placebo (N = 178) | 165 | 7.9 (0.33) | 7.2 to 8.5 | 165 | −3.5 (0.33) | −4.1 to −2.8 | |
Week 52 | Combined anifrolumab 300 mg (N = 358) | 293 | 5.2 (0.25) | 4.8 to 5.7 | 293 | −6.0 (0.25) | −6.5 to −5.5 |
Combined placebo (N = 178) | 145 | 6.2 (0.33) | 5.5 to 6.8 | 145 | −5.1 (0.33) | −5.7 to −4.4 | |
Week 104 | Combined anifrolumab 300 mg (N = 358) | 198 | 4.0 (0.28) | 3.4 to 4.5 | 198 | −7.2 (0.28) | −7.7 to −6.7 |
Combined placebo (N = 178) | 85 | 5.2 (0.39) | 4.5 to 6.0 | 85 | −5.9 (0.39) | −6.7 to −5.2 | |
Week 128 | Combined anifrolumab 300 mg (N = 358) | 187 | 3.9 (0.30) | 3.3 to 4.5 | 187 | −7.2 (0.30) | −7.8 to −6.6 |
Combined placebo (N = 178) | 72 | 5.1 (0.46) | 4.2 to 6.0 | 72 | −6.1 (0.46) | −7.0 to −5.2 | |
Week 208 | Combined anifrolumab 300 mg (N = 358) | 140 | 3.4 (0.30) | 2.8 to 4.0 | 140 | −7.5 (0.30) | −8.1 to −6.9 |
Combined placebo (N = 178) | 44 | 4.2 (0.47) | 3.2 to 5.1 | 44 | −6.8 (0.47) | −7.7 to −5.8 | |
Week 216 | Combined anifrolumab 300 mg (N = 358) | 146 | 4.2 (0.35) | 3.6 to 4.9 | 146 | −6.7 (0.35) | −7.4 to −6.1 |
Combined placebo (N = 178) | 42 | 5.2 (0.57) | 4.0 to 6.3 | 42 | −5.8 (0.57) | −6.9 to −4.7 | |
CI = confidence interval; LS = least squares; LTE = long-term extension; OCS = oral corticosteroids; SE = standard error; SLEDAI-2K = Systemic Lupus Erythematosus Disease Activity Index 2000.
Notes: Baseline is defined as the last measurement before randomization and investigational product dose administration on day 1. Mean value and change from baseline in SLEDAI-2K will be analyzed using an analysis of covariance including baseline value (continuous), treatment group, visit, and randomization stratification factors reduced to factors of type I interferon gene signature test result at screening and OCS dose at baseline.
Source: Clinical Study Report for TULIP LTE.13
Oral Corticosteroid Use
Overall, and for each year of study, the mean OCS standardized AUC was lower for the combined anifrolumab 300 mg group compared to the all-placebo group. The proportions of patients receiving OCS bursts during the LTE were similar between the combined anifrolumab 300 mg and placebo groups.
Table 34: OCS Standardized AUC, Summary Statistics, Combined Data From Feeder and LTE Study (Full Analysis Set)
Period of standardized AUC | Variable | Combined anifrolumab 300 mg | Combined placebo |
|---|---|---|---|
Total (feeder + LTE) | n | 358 | 178 |
Mean | 9,487.914 | 11,017.735 | |
SD | 12,042.9594 | 8,213.2760 | |
Median | 7,769.642 | 9,613.415 | |
Minimum | 0.00 | 0.00 | |
Maximum | 136,403.91 | 40,142.80 | |
Year 1 | n | 358 | 178 |
Mean | 2,657.466 | 2,889.665 | |
SD | 3,116.4121 | 2,120.2663 | |
Median | 2,275.824 | 2,584.419 | |
Minimum | 0.00 | 0.00 | |
Maximum | 3,5388.97 | 10,035.70 | |
Year 2 | n | 257 | 112 |
Mean | 2,002.994 | 2,303.104 | |
SD | 3,227.9753 | 2,132.6967 | |
Median | 1,826.250 | 1,826.250 | |
Minimum | 0.00 | 0.00 | |
Maximum | 33,648.16 | 14,820.72 | |
Year 3 | n | 236 | 94 |
Mean | 1,943.991 | 2,248.646 | |
SD | 3,386.4459 | 1,705.2513 | |
Median | 1,826.250 | 1,826.250 | |
Minimum | 0.00 | 0.00 | |
Maximum | 3,3603.00 | 7,305.00 | |
Year 4 | n | 211 | 72 |
Mean | 1,885.512 | 2,237.755 | |
SD | 3,463.3678 | 1,799.0330 | |
Median | 1,826.250 | 1,826.250 | |
Minimum | 0.00 | 0.00 | |
Maximum | 33,603.00 | 7,424.22 | |
Total (feeder + LTE) | n | 358 | 178 |
Mean | 9,487.914 | 11,017.735 | |
SD | 12,042.9594 | 8,213.2760 | |
Median | 7,769.642 | 9,613.415 | |
Minimum | 0.00 | 0.00 | |
Maximum | 136,403.91 | 40,142.80 |
AUC = area under the curve; LTE = long-term extension; OCS = oral corticosteroids; PRN = pro re nata (when necessary); SD = standard deviation.
Notes: Baseline is defined as baseline of the phase III feeder studies, i.e., the last nonmissing measurement before dose administration on day 1. OCS are described as “prednisone or equivalent.” OCS administered PRN are not considered in the calculation of the daily dose.
Source: Clinical Study Report for TULIP LTE.13
Systemic Lupus International Collaborating Clinics/American College of Rheumatology Damage Index
Overall, 30% to 40% of patients had organ damage (i.e., SDI score ≥ 1), at baseline in the TULIP-1 and TULIP-2 trials. Organ damage remained stable in both groups throughout the LTE; at week 208 the mean SDI score in patients with a baseline SDI score of 1 or higher was 2.1 in the combined anifrolumab 300 mg and 2.0 in the combined placebo group.
The time to first SDI worsening was numerically longer in the combined anifrolumab 300 mg group (mean = 925.0; SD = 553.0) compared with the combined placebo group (mean = 754.2; SD = 523.3).
Short Form (36) Health Survey Version 2 (Acute Recall)
At week 208 the proportion of PCS responders in the combined anifrolumab 300 mg compared with combined placebo group was 53.7% versus 41.0%; the proportion of MCS responders was 35.6% versus 26.2% in anifrolumab versus placebo group, respectively.
A numerically larger mean increase (indicating improving function) from baseline to week 208 was observed for the combined anifrolumab 300 mg group compared with the combined placebo group for both PCS and MCS. The mean change in PCS score at week 208 from feeder baseline was 5.51 in patients in the combined anifrolumab group compared with 3.82 in the combined placebo group. The mean change in MCS score was at week 208 from feeder baseline was 1.00 in the combined anifrolumab 300 mg group compared with −0.11 in the combined placebo group.
Table 35: SF-36v2 (Acute Recall) Domain, MCS And PCS, Subjects With Response, Combined Data From Feeder, and LTE Study (Full Analysis Set)
Domain | Time point | n/m (%) of patients | |
|---|---|---|---|
Combined anifrolumab 300 mg | Combined placebo (N = 178) | ||
PCS | Week 52 | 138/284 (48.6) | 60/137 (43.8) |
Week 104 | 120/226 (53.1) | 38/90 (42.2) | |
Week 208 | 101/188 (53.7) | 25/61 (41.0) | |
MCS | Week 52 | 103/284 (36.3) | 53/137 (38.7) |
Week 104 | 68/226 (30.1) | 29/90 (32.2) | |
Week 208 | 67/188 (35.6) | 16/61 (26.2) | |
LTE = long-term extension; m = number of patients with at least 1 (partly) completed questionnaire; MCS = mental component score; n = number of patients with response; PCS = physical component score; SF-36v2 = Short Form (36) Health Survey Version 2.
Notes: Percentages are based upon all patients with an at least partly completed questionnaire at the respective visit. If the respective score of SF-36v2 (acute recall) cannot be evaluated, the patient is regarded as a nonresponder.
Source: Clinical Study Report for TULIP LTE.13
5-Level EQ-5D
EQ-5D-5L assessments showed overall improvements in health status as measured by change from baseline in EQ VAS and single summary utility index. The improvements in QoL as measured by change from baseline in EQ-5D-5L were small but consistently numerically higher for the combined anifrolumab 300 mg compared to the combined placebo group throughout the 4 years. Mean change from feeder study baseline at week 208 was 0.088 (from a baseline of 0.615) for the combined anifrolumab 300 mg group versus 0.017 (from baseline value of 0.614) in the combined placebo group. Mean changes in EQ VAS scores at week 208 were 16.4 (from baseline score of 55.9) in the combined anifrolumab 300 mg group versus 9.2 (from baseline score of 56.7) in the combined placebo group.
Harms
The safety profile up to 4 years of exposure, including assessment of rare events, remains unchanged. In addition, there was no increase in malignancy, major adverse cardiac events, no anaphylaxis, or active tuberculosis. During the 52-week period, 87.5% of patients in the anifrolumab group and 81.3% of patients in the placebo group reported 1 or more TEAEs, the most common being nasopharyngitis, urinary tract infection, upper respiratory tract infection, bronchitis, and headache.
The proportion of patients with 1 or more SAEs was similar between the anifrolumab and placebo groups, the most common being infections and infestations. The most common AESI was nonopportunistic infections. Three deaths were reported in the anifrolumab group (1.2%) and 1 death was reported in the placebo group (0.9%). Overall, no new safety signals were identified.
Table 36: Summary of TEAEs in LTE Study (Full Analysis Set)
Adverse event | Anifrolumab 300 mg N = 257 | Placebo N = 112 |
|---|---|---|
Any TEAEs, n (%) | 225 (87.5) | 91 (81.3) |
Common TEAEs,a n (%) | ||
Nasopharyngitis | 63 (24.5) | 13 (11.6) |
Urinary tract infection | 55 (21.4) | 15 (13.4) |
Upper respiratory tract infection | 54 (21.0) | 17 (15.2) |
Bronchitis | 39 (15.2) | 8 (7.1) |
Headache | 27 (10.5) | 11 (9.8) |
Patients with ≥ 1 SAE, n (%) | 56 (21.8) | 27 (24.1) |
Common SAEs,b n (%) | ||
Pneumonia | 6 (2.3) | 2 (1.8) |
Herpes zoster | 6 (2.3) | 1 (0.9) |
COVID-19 | 4 (1.6) | 0 |
COVID-19 pneumonia | 3 (1.2) | 1 (0.9) |
Pyelonephritis | 3 (1.2) | 0 |
Urinary tract infection | 2 (0.8) | 1 (0.9) |
Systemic lupus erythematosus | 6 (2.3) | 6 (5.4) |
Patients with WDAEs, n (%) | 17 (6.6) | 8 (7.1) |
Patients with AESIs, n (%) | 75 (29.2) | 24 (21.4) |
Nonopportunistic serious infections | 25 (9.7) | 9 (8.0) |
Opportunistic infections | 0 | 3 (2.7) |
Malignancy | 2 (0.8) | 2 (1.8) |
Herpes zoster | 23 (8.9) | 7 (6.3) |
Tuberculosis (included latent tuberculosis) | 16 (6.2) | 2 (1.8) |
Influenza | 15 (5.8) | 2 (1.8) |
Major adverse cardiac events according to the CV-EAC | 5 (1.9) | 3 (2.7) |
Death | 3 (1.2) | 1 (0.9) |
AESI = adverse event of special interest; CV-EAC = cardiovascular event adjudication committee; SAE = serious adverse event; TEAE = treatment-emergent adverse event; WDAE = withdrawal due to adverse event.
aObserved in 10% or greater of patients.
bSAEs affecting 2% or greater of patients.
Source: Clinical Study Report for TULIP LTE.13
Critical Appraisal
Internal Validity
Demographics and baseline characteristics were generally well balanced between groups. At the start of the LTE, fewer anifrolumab patients were on steroids compared to placebo. This may contribute to bias in terms of reducing OCS use if greater numbers of patients in the anifrolumab group were already not using OCS. Approximately 72% anifrolumab and 62% placebo of eligible patients completing treatment in predecessor studies (TULIP-1 and TULIP-2) enrolled into the TULIP LTE. More patients on anifrolumab completed the 3-year extension (69% in the anifrolumab group versus 48%) in placebo. The differential dropout rate may increase the risk of attrition bias in favour of anifrolumab.
Limitations regarding efficacy and HRQoL outcomes included the lack of formal statistical testing. Although a higher proportion of patients in the anifrolumab group had lower OCS use and improved SLEDAI-2K scored compared to placebo, no firm conclusions can be drawn based on the efficacy of anifrolumab, and its steroid-sparing effect based on the presented data. Also, the ability to draw conclusions on the effectiveness of anifrolumab in preventing organ damage was limited due to the lack of statistical testing. Last, because the sponsor was unblinded during the analysis phase. there is the potential for investigator and performance bias for efficacy and patient-reported outcomes.
External Validity
While the patient population was considered to be representative of patients with moderate to severe SLE in Canada, patients enrolled in the TULIP LTE had to have the 52-week double-blind treatment period in 1 of the phase III studies (TULIP-1 or TULIP-2). This is therefore a selective patient population, as it only included those who were able to complete the TULIP studies and, while the baseline characteristics of the patients enrolled in TULIP LTE might not differ from those enrolled in the TULIP-1 or TULIP-2 studies, results from the TULIP LTE cannot be generalized to all patients enrolled in the TULIP trials.
Discussion
Summary of Available Evidence
The CADTH systematic review included 2 phase III multicentre, randomized, double-blind, placebo-controlled studies evaluating the efficacy and safety of IV treatment regimen of anifrolumab 300 mg in adult patients (18 to 70 years of age) with moderate to severe, autoantibody-positive SLE while receiving standard-of-care treatment. The primary objective was to evaluate the effect of anifrolumab 300 mg compared to placebo on disease activity as measured by the difference in the proportion of patients who achieve an SRI-4 at week 52 for TULIP-1 or BICLA response at week 52 in the TULIP-2 trial.
In addition, 2 submitted studies provided in the sponsor’s submission to CADTH that were considered to address long-term efficacy (up to 3 years) of the treatment under review were included. These include a phase II, multinational, multicentre, randomized, double-blind, placebo-controlled study (MUSE)11 and a phase II, single-arm, open-label, LTE study to evaluate the long-term safety of anifrolumab (Study 1145).12 The primary efficacy end point for MUSE was the proportion of patients who at day 169 achieved an SRI-4 response as defined in the TULIP-1 trial. Study 1145 (N = 218) was a single-arm, open-label, long-term (up to 3 years) safety and tolerability study of anifrolumab 300 mg administered by IV infusion every 4 weeks in adult patients with chronic, moderate to severe SLE who were previously treated with any dose of anifrolumab or placebo in the MUSE trial. Safety assessments consisted of reporting all AEs. including TEAEs and SAEs, as well as AESI results. The primary end points of the study were the safety and tolerability of IV anifrolumab in adult patients with moderately to severely active SLE and they were assessed primarily by summarizing TEAEs, SAEs, AEs associated with discontinuation, and AESIs.
Interpretation of Results
Efficacy
The clinician group input received by CADTH for this review indicated that the ideal treatment would have a meaningful impact on overall survival by reducing disease activity, risk of subsequent flares, use of OCS, risk of AEs, and long-term complications, while inducing remission (low disease activity), and improving QoL. While the TULIP-1 trial did not meet its primary end point of SRI-4 response at week 52, nor any of its key secondary end points, the TULIP-2 trial did meet its primary end point as well as key secondary end points of BICLA in patients with a high result on an interferon test, maintained OCS reduction, and CLASI response. In terms of maintained OCS reduction and CLASI response, it is uncertain why there was a discrepancy between the trials in statistical significance. The sponsor indicated that, upon review of the prespecified analyses from TULIP-1 following database lock, some of the rules for defining patients as nonresponders due to receiving restricted medications were deemed too stringent and clinically inappropriate. Specifically, the original rules inappropriately classified patients who used NSAIDs or who increased NSAID doses as nonresponders. The sponsor also noted that, because most NSAIDs have a short half-life and a slow and weak effect on inflammation and pain, they were not thought to confound the efficacy assessments at week 52, as long as they were not initiated late in the study. The rules were therefore amended to reflect that a patient would not be considered a nonresponder if such a patient used NSAIDs or increased an NSAID dose. These rules were formally agreed upon before the unblinding of TULIP-2 data. While results after the amended rules from the TULIP-1 trial were consistent with those in the TULIP-2 trial, such results should be interpreted with caution as they were post hoc analyses and were not prespecified in the study protocol of TULIP-1 study. Of note, the tipping-point analysis based on nonresponder imputations weakly supported the robustness of the maintained OCS dose results in the TULIP-2 trial. According to clinical expert consulted for this review, potential reasons for the discrepancy between the 2 trials could be simply due to chance (e.g., regression to the mean).
The key difference between trials was the primary end point being switched from SRI-4 to BICLA in the TULIP-2 trial. The switching of the primary end point was based on the TULIP-1 and MUSE study results, which demonstrated that the BICLA had produced consistent results across time. This switch took place after data collection for TULIP-2 was completed and before the unblinding of the results at week 52, and the risk of bias due to operationalization is low. In the opinion of the clinical expert, although the SRI is a clinically relevant outcome to assess response in patients with SLE, there is a shift toward the BICLA given its ability to capture partial responses and its discriminative nature with respect to detecting difference between placebo and active treatment more effectively than the SRI-4. According to the literature, the BILAG-2004, a main component and driver of the BICLA, is a valid and reliable instrument for SLE patients and is more responsive to change than the SLEDAI-2K.27,29 In comparison with BILAG, the SLEDAI is less responsive to change, it does not capture improvement or worsening, and it does not assess severity in an organ system.33 As discussed in Appendix 4, on the 1 hand, using a single weighted score to summarize disease activity makes the judgment of disease activities much easier and standardized, while on the other, it would have the potential to mask the underlying importance of organ systems that are contributing to the total score (i.e., the same score could represent multiple mild diseases in many organs or severe disease in a single organ, or an unchanged score may occur despite worsening in 1 organ system if there is also improvement in another system). In addition, the SLEDAI is weighted toward neuropsychiatric and renal manifestations, and patients with severe neuropsychiatric and renal disease were excluded from the pivotal trials. Responders and nonresponders on the SRI have been shown to differ on several measures of disease activity, biomarkers, and HRQoL.21,22 For example, the MUSE study demonstrated a statistically significant difference in SRI-4 response (the primary end point) between patients in the anifrolumab versus the placebo group, while the TULIP-1 trial did not.
SLE also causes significant damage to many vital organs and tissues, most notably the kidneys and the CNS. These effects of the disease take longer to develop, and, according to the clinical expert consulted by CADTH for this review, it is unlikely that a 52-week study would be able to demonstrate a reduction in accumulated organ damage. Ideally, the trial would be at least 2 years (104 weeks) in length. In the opinion of the clinical expert, it is not surprising that there was no difference in the SDI, which was used to assess organ damage, between anifrolumab and placebo. As noted, longer-term results are available from extension trials; however, these are of limited value due to the lack of a comparator. It should also be noted that, because both trials excluded patients with severe renal or CNS involvement, the effects of anifrolumab cannot be ascertained in this population.
The patient input received for this CADTH review indicated that patients would like to see new therapies that reduce AEs; symptoms such as fatigue, flares, headaches, brain fog, joint and muscle pain, insomnia, and rash and skin irritations; the number of medications used; increase in lifespan and the ability to perform ADLs; and improved overall HRQoL. According to the clinical expert, HRQoL is generally stable in patients with SLE. Across both trials, anifrolumab and placebo groups observed similar results across a broad range of HRQoL and symptom score measures such as the SF-36 and FACIT-F. Statistical tests were not conducted and the impact of anifrolumab on HRQoL is therefore unclear.
While the Health Canada indication is for all adult patients with active autoantibody-positive SLE (in addition to standard therapy), the sponsor’s reimbursement request is for moderate to severe SLE patients with an OCS dosage of 10 mg/day or higher of prednisone or its equivalent. This subgroup of patients was not statistically assessed for the primary end point nor the key secondary end points, other than maintained OCS reduction. It would have been more appropriate to have tested the primary end points and key secondary end points on the proposed reimbursement indication rather than the FAS. Based on the available data, the efficacy of anifrolumab for this subgroup of patients is unclear. In addition, the clinical expert and clinical groups specified that the reimbursement population ideally should include patients with an OCS dosage of less than 10 mg/day and the target tapering dosage would be greater than 7.5 mg/day versus 7.5 mg/day or higher. The reimbursement request and target tapering dose in the trials therefore may have been too conservative.
Harms
Based on its mechanism of action, targeting the interferon pathway, infection would be 1 of the notable harms that should be monitored with anifrolumab. The clinical expert consulted by CADTH indicated that the safety profile of anifrolumab was in line with other treatments, and it was unsurprising that herpes zoster was a common AE. There has been no indication from the pivotal trials that there is an increased risk of mortality due to AEs while receiving anifrolumab. Between the 2 pivotal trials, there were 3 deaths, 2 in the anifrolumab group (pneumonia), and 1 in the placebo group (encephalitis). In the LTE study (N = 218, duration up to 3 years), there was 1 death (0.5%) from community-acquired pneumonia, and this death was assessed by the investigator as related to treatment. No deaths were reported in the MUSE study. Overall, a higher proportion of patients in the anifrolumab group compared to the placebo group had AEs of nasopharyngitis, upper respiratory tract infections, infusion-related reactions, bronchitis, and herpes zoster. The LTE study confirmed these findings, although the conclusions that can be drawn are limited by the lack of a control group and attrition bias. Concerns over infection risk with anifrolumab also need to be weighed against those of many current standard-of-care medications, including immunosuppressants and corticosteroids, which are known for their increased infection risk.
Conclusions
The clinical expert consulted by CADTH, and the input received from the clinician groups for this review, indicated that the ideal treatment would have a meaningful impact on overall survival by reducing disease activity, risk of subsequent flares, use of OCS, risk of AEs, and long-term complications, while inducing remission (low disease activity), and improving HRQoL. Two multinational, sponsored-submitted, double-blind, RCTs, TULIP-1 and TULIP-2, were included in this review, along with 2 additional studies that provided long-term safety data. Results of the 2 pivotal RCTs were inconsistent with each other. In 1 study, anifrolumab statistically significantly reduced disease activity after 52 weeks compared to placebo, as measured by BICLA response. The other study showed no statistically significant difference in response as measured by SRI-4 response. While 1 of the studies showed a difference in maintained reduction of OCS dose to less than 7.5 mg/day and reduction in cutaneous manifestations of lupus, the other did not. The inconsistent results contribute to uncertainty in forming conclusions regarding the impact of anifrolumab on disease activity, OCS dose reduction, and CLASI reduction. Despite numerical improvements in HRQoL across the included measures, these results were not statistically tested, and the improvements were generally the same between anifrolumab and placebo groups; the impact of anifrolumab on HRQoL is therefore unknown. The duration of the study was not sufficient to study the effects of anifrolumab on organ damage and survival. Data from the included studies do not suggest issues of tolerability or safety, although the extension study was limited by the lack of a control group.
References
1.Wallace DJ. Overview of the management and prognosis of systemic lupus erythematosus in adults. In: Post TW, ed. UpToDate. Waltham (MA): UpToDate; 2021: www.uptodate.com. Accessed 2022 Feb 17.
2.Lupus Canada. What is lupus. 2020; https://www.lupuscanada.org/living-with-lupus/what-is-lupus/. Accessed 2022 Apr 28.
3.Schur PH, Hahn BH. Epidemiology and pathogenesis of systemic lupus erythematosus. In: Post TW, ed. UpToDate. Waltham (MA): UpToDate; 2021: www.uptodate.com. Accessed 2022 Feb 17.
4.Carter EE, Barr SG, Clarke AE. The global burden of SLE: prevalence, health disparities and socioeconomic impact. Nat Rev Rheumatol. 2016;12(10):605-620. PubMed
5.Lupus Canada. Lupus Q&A: Ask the Experts. 2020; https://lupuscanada.org/living-with-lupus/lupus-qa-ask-the-experts/. Accessed 2022 Mar 14.
6.Ibanez D, Gladman DD, Urowitz MB. Adjusted mean Systemic Lupus Erythematosus Disease Activity Index-2K is a predictor of outcome in SLE. J Rheumatol. 2005;32(5):824-827. PubMed
7.John Hopkins Lupus Center. Treating lupus with steroids. 2022; https://www.hopkinslupus.org/lupus-treatment/lupus-medications/steroids/. Accessed 2022 Apr 28.
8.Saphnelo (anifrolumab): 150 mg/mL single dose, sterile vial solution for intravenous infusion [product monograph]. Mississauga (ON): AstraZeneca Canada Inc.; 2021 Nov 30.
9.Clinical Study Report: D3461C00005. TULIP 1: A multicentre, randomised, double-blind, placebo-controlled, phase III study evaluating the efficacy and safety of two doses of anifrolumab in adult subjects with active systemic lupus erythematosus [internal sponsor's report]. Gaithersburg (MD): AstraZeneca PLC; 2019 May 20.
10.Clinical Study Report: D3461C00004. TULIP 2: A multicentre, randomised, double-blind, placebo-controlled, phase III study evaluating the efficacy and safety of anifrolumab in adult subjects with active systemic lupus erythematosus [internal sponsor's report]. Gaithersburg (MD): AstraZeneca PLC; 2019 Dec 16.
11.Clinical Study Report: CD-IA-MEDI-546-1013. MUSE: A phase 2, randomized study to evaluate the efficacy and safety of MEDI-546 in subjects with systemic lupus erythematosus [internal sponsor's report]. Gaithersburg (MD): AstraZeneca PLC; 2016 Mar 07.
12.Clinical Study Report: CD-IA-MEDI-546-1145. A phase 2, open-label extension study to evaluate long-term safety of MEDI-546 in adults with systemic lupus erythematosus [internal sponsor's report]. Gaithersburg (MD): AstraZeneca PLC; 2018 Dec 05.
13.Clinical Study Report: D3461C00009. A Multicentre, Randomised, Double-blind, Placebo-Controlled Phase III Extension Study to Characterise the Long-term Safety and Tolerability of Anifrolumab in Adult Patients with Active Systemic Lupus Erythematosus [internal sponsor's report]. AstraZeneca; 6 October 2022.
14.Schur PH, Wallace DJ. Arthritis and other musculoskeletal manifestations of systemic lupus erythematosus. In: Post TW, ed. UpToDate. Waltham (MA): UpToDate; 2022: www.uptodate.com. Accessed 2022 Feb 17.
15.Cojocaru M, Cojocaru IM, Silosi I, Vrabie CD. Manifestations of systemic lupus erythematosus. Maedica (Bucur). 2011;6(4):330-336. PubMed
16.Health Canada. Regulatory decision summary for Benlysta. 2021; https://hpr-rps.hres.ca/reg-content/regulatory-decision-summary-detail.php?linkID=RDS00843. Accessed 2022 Apr 28.
17.McGowan J, Sampson M, Salzwedel DM, Cogo E, Foerster V, Lefebvre C. PRESS Peer Review of Electronic Search Strategies: 2015 guideline statement. J Clin Epidemiol. 2016;75:40-46. PubMed
18.Grey matters: a practical tool for searching health-related grey literature. Ottawa (ON): CADTH; 2019: https://www.cadth.ca/grey-matters. Accessed 2022 Feb 16.
19.Furie RA, Morand EF, Bruce IN, et al. Type I interferon inhibitor anifrolumab in active systemic lupus erythematosus (TULIP-1): a randomised, controlled, phase III trial. Lancet Rheumatol. 2019;1(4):e208-e219.
20.Morand EF, Furie R, Tanaka Y, et al. Trial of Anifrolumab in Active Systemic Lupus Erythematosus. N Engl J Med. 2020;382(3):211-221. PubMed
21.Furie R, Wang L, Illei G, Drappa J. Systemic Lupus Erythematosus (SLE) Responder Index response is associated with global benefit for patients with SLE. Lupus. 2018;27(6):955-962. PubMed
22.Mahmoud K, Zayat AS, Yusof Y, et al. Responsiveness of clinical and ultrasound outcome measures in musculoskeletal systemic lupus erythematosus. Rheumatology (Oxford). 2019;58(8):1353-1360. PubMed
23.Furie R, Morand EF, Bruce IN, et al. What Does It Mean to Be a British Isles Lupus Assessment Group-Based Composite Lupus Assessment Responder? Post Hoc Analysis of Two Phase III Trials. Arthritis Rheumatol. 2021;73(11):2059-2068. PubMed
24.Isenberg DA, Allen E, Farewell V, et al. An assessment of disease flare in patients with systemic lupus erythematosus: a comparison of BILAG 2004 and the flare version of SELENA. Ann Rheum Dis. 2011;70(1):54-59. PubMed
25.Cresswell L, Yee CS, Farewell V, et al. Numerical scoring for the Classic BILAG index. Rheumatology (Oxford). 2009;48(12):1548-1552. PubMed
26.Mikdashi J, Nived O. Measuring disease activity in adults with systemic lupus erythematosus: the challenges of administrative burden and responsiveness to patient concerns in clinical research. Arthritis Res Ther. 2015;17:183. PubMed
27.Yee CS, Isenberg DA, Prabu A, et al. BILAG-2004 index captures systemic lupus erythematosus disease activity better than SLEDAI-2000. Ann Rheum Dis. 2008;67(6):873-876. PubMed
28.Yee CS, Farewell V, Isenberg DA, et al. British Isles Lupus Assessment Group 2004 index is valid for assessment of disease activity in systemic lupus erythematosus. Arthritis Rheum. 2007;56(12):4113-4119. PubMed
29.Hay EM, Bacon PA, Gordon C, et al. The BILAG index: a reliable and valid instrument for measuring clinical disease activity in systemic lupus erythematosus. Q J Med. 1993;86(7):447-458. PubMed
30.Yee CS, Gordon C, Isenberg DA, et al. The BILAG-2004 systems tally--a novel way of representing the BILAG-2004 index scores longitudinally. Rheumatology (Oxford). 2012;51(11):2099-2105. PubMed
31.Touma Z, Urowitz MB, Gladman DD. Systemic lupus erythematosus disease activity index 2000 responder index-50 website. J Rheumatol. 2013;40(5):733. PubMed
32.Gladman DD, Ibanez D, Urowitz MB. Systemic lupus erythematosus disease activity index 2000. J Rheumatol. 2002;29(2):288-291. PubMed
33.Jesus D, Rodrigues M, Matos A, Henriques C, Pereira da Silva JA, Ines LS. Performance of SLEDAI-2K to detect a clinically meaningful change in SLE disease activity: a 36-month prospective cohort study of 334 patients. Lupus. 2019;28(5):607-612. PubMed
34.Yee CS, Farewell VT, Isenberg DA, et al. The use of Systemic Lupus Erythematosus Disease Activity Index-2000 to define active disease and minimal clinically meaningful change based on data from a large cohort of systemic lupus erythematosus patients. Rheumatology (Oxford). 2011;50(5):982-988. PubMed
35.Gladman DD, Urowitz MB, Kagal A, Hallett D. Accurately describing changes in disease activity in Systemic Lupus Erythematosus. J Rheumatol. 2000;27(2):377-379. PubMed
36.Furie RA, Petri MA, Wallace DJ, et al. Novel evidence-based systemic lupus erythematosus responder index. Arthritis Rheum. 2009;61(9):1143-1151. PubMed
37.Chessa E, Piga M, Floris A, Devilliers H, Cauli A, Arnaud L. Use of Physician Global Assessment in systemic lupus erythematosus: a systematic review of its psychometric properties. Rheumatology (Oxford). 2020;59(12):3622-3632. PubMed
38.Maruish M, Maruish ME, Kosinski K, et al. User's manual for the SF-36v2 health survey; 3rd edition. Lincoln (RD): Quality Metric Incorporated; 2011.
39.Izadi Z, Gandrup J, Katz PP, Yazdany J. Patient-reported outcome measures for use in clinical trials of SLE: a review. Lupus Sci Med. 2018;5(1):e000279. PubMed
40.McElhone K, Abbott J, Shelmerdine J, et al. Development and validation of a disease-specific health-related quality of life measure, the LupusQol, for adults with systemic lupus erythematosus. Arthritis Rheum. 2007;57(6):972-979. PubMed
41.van Reenen M, Janssen B, Stolk E, et al. EQ-5D-5L user guide: basic information on how to use the EQ-5D-5L instrument, version 3.0. Rotterdam (NL): EuroQol Research Foundation; 2019: https://euroqol.org/wp-content/uploads/2021/01/EQ-5D-5LUserguide-08-0421.pdf. Accessed 2021 Nov 24.
42.Aggarwal R, Wilke CT, Pickard AS, et al. Psychometric properties of the EuroQol-5D and Short Form-6D in patients with systemic lupus erythematosus. J Rheumatol. 2009;36(6):1209-1216. PubMed
43.Castrejon I, Tani C, Jolly M, Huang A, Mosca M. Indices to assess patients with systemic lupus erythematosus in clinical trials, long-term observational studies, and clinical care. Clin Exp Rheumatol. 2014;32(5 Suppl 85):S-85-95. PubMed
44.Gladman D, Ginzler E, Goldsmith C, et al. The development and initial validation of the Systemic Lupus International Collaborating Clinics/American College of Rheumatology damage index for systemic lupus erythematosus. Arthritis Rheum. 1996;39(3):363-369. PubMed
45.Romero-Diaz J, Isenberg D, Ramsey-Goldman R. Measures of adult systemic lupus erythematosus: updated version of British Isles Lupus Assessment Group (BILAG 2004), European Consensus Lupus Activity Measurements (ECLAM), Systemic Lupus Activity Measure, Revised (SLAM-R), Systemic Lupus Activity Questionnaire for Population Studies (SLAQ), Systemic Lupus Erythematosus Disease Activity Index 2000 (SLEDAI-2K), and Systemic Lupus International Collaborating Clinics/American College of Rheumatology Damage Index (SDI). Arthritis Care Res (Hoboken). 2011;63(Suppl 11):S37-46. PubMed
46.Stoll T, Seifert B, Isenberg DA. WDAE/ACR Damage Index is valid, and renal and pulmonary organ scores are predictors of severe outcome in patients with systemic lupus erythematosus. Br J Rheumatol. 1996;35(3):248-254. PubMed
47.Chakka S, Krain RL, Concha JSS, Chong BF, Merola JF, Werth VP. The CLASI, a validated tool for the evaluation of skin disease in lupus erythematosus: a narrative review. Ann Transl Med. 2021;9(5):431. PubMed
48.Albrecht J, Taylor L, Berlin JA, et al. The CLASI (Cutaneous Lupus Erythematosus Disease Area and Severity Index): an outcome instrument for cutaneous lupus erythematosus. J Invest Dermatol. 2005;125(5):889-894. PubMed
49.Jolly M, Kazmi N, Mikolaitis RA, Sequeira W, Block JA. Validation of the Cutaneous Lupus Disease Area and Severity Index (CLASI) using physician- and patient-assessed health outcome measures. J Am Acad Dermatol. 2013;68(4):618-623. PubMed
50.Klein R, Moghadam-Kia S, LoMonico J, et al. Development of the CLASI as a tool to measure disease severity and responsiveness to therapy in cutaneous lupus erythematosus. Arch Dermatol. 2011;147(2):203-208. PubMed
51.Lai JS, Beaumont JL, Ogale S, Brunetta P, Cella D. Validation of the functional assessment of chronic illness therapy-fatigue scale in patients with moderately to severely active systemic lupus erythematosus, participating in a clinical trial. J Rheumatol. 2011;38(4):672-679. PubMed
52.Elera-Fitzcarrald C, Vega K, Gamboa-Cardenas RV, et al. Reliability of Visual Analog Scale and Numeric Rating Scale for the Assessment of Disease Activity in Systemic Lupus Erythematosus. J Clin Rheumatol. 2020;26(7S Suppl 2):S170-S173.
53.Franklyn K, Lau CS, Navarra SV, et al. Definition and initial validation of a Lupus Low Disease Activity State (LLDAS). Ann Rheum Dis. 2016;75(9):1615-1621. PubMed
54.Kroenke K, Strine TW, Spitzer RL, Williams JB, Berry JT, Mokdad AH. The PHQ-8 as a measure of current depression in the general population. J Affect Disord. 2009;114(1-3):163-173. PubMed
55.Posner K, Oquendo MA, Gould M, Stanley B, Davies M. Columbia Classification Algorithm of Suicide Assessment (C-CASA): classification of suicidal events in the FDA's pediatric suicidal risk analysis of antidepressants. Am J Psychiatry. 2007;164(7):1035-1043. PubMed
56.Keene ON, Roger JH, Hartley BF, Kenward MG. Missing data sensitivity analysis for recurrent event data using controlled imputation. Pharm Stat. 2014;13(4):258-264. PubMed
57.Burman CF, Sonesson C, Guilbaud O. A recycling framework for the construction of Bonferroni-based multiple tests. Stat Med. 2009;28(5):739-761. PubMed
58.Zhang J, Quan H, Ng J, Stepanavage ME. Some statistical methods for multiple end points in clinical trials. Control Clin Trials. 1997;18(3):204-221. PubMed
59.Ward MM, Marx AS, Barry NN. Comparison of the validity and sensitivity to change of 5 activity indices in systemic lupus erythematosus. J Rheumatol. 2000;27(3):664-670. PubMed
60.Jolly M, Annapureddy N, Arnaud L, Devilliers H. Changes in quality of life in relation to disease activity in systemic lupus erythematosus: post-hoc analysis of the BLISS-52 Trial. Lupus. 2019;28(14):1628-1639. PubMed
61.Isenberg D, Sturgess J, Allen E, et al. Study of Flare Assessment in Systemic Lupus Erythematosus Based on Paper Patients. Arthritis Care Res (Hoboken). 2018;70(1):98-103. PubMed
62.Morand EF, Trasieva T, Berglind A, Illei GG, Tummala R. Lupus Low Disease Activity State (LLDAS) attainment discriminates responders in a systemic lupus erythematosus trial: post-hoc analysis of the Phase IIb MUSE trial of anifrolumab. Ann Rheum Dis. 2018;77(5):706-713. PubMed
63.Jenkinson C, Stewart-Brown S, Petersen S, Paice C. Assessment of the SF-36 version 2 in the United Kingdom. J Epidemiol Community Health. 1999;53:46-50. PubMed
64.Nantes SG, Strand V, Su J, Touma Z. Comparison of the Sensitivity to Change of the 36-Item Short Form Health Survey and the Lupus Quality of Life Measure Using Various Definitions of Minimum Clinically Important Differences in Patients With Active Systemic Lupus Erythematosus. Arthritis Care Res (Hoboken). 2018;70(1):125-133. PubMed
65.Touma Z, Gladman DD, Ibanez D, Urowitz MB. Is there an advantage over SF-36 with a quality of life measure that is specific to systemic lupus erythematosus? J Rheumatol. 2011;38(9):1898-1905. PubMed
66.EuroQol Research Foundation. EQ-5D-5L | About. 2021; https://euroqol.org/eq-5d-instruments/eq-5d-5l-about/. Accessed 2022 Jan 04.
67.Murphy CL, Yee CS, Gordon C, Isenberg D. From BILAG to BILAG-based combined lupus assessment-30 years on. Rheumatology (Oxford). 2016;55(8):1357-1363. PubMed
68.Thanou A, Chakravarty E, James JA, Merrill JT. Which outcome measures in SLE clinical trials best reflect medical judgment? Lupus Sci Med. 2014;1(1):e000005. PubMed
69.Yee CS, Farewell V, Isenberg DA, et al. The BILAG-2004 index is sensitive to change for assessment of SLE disease activity. Rheumatology (Oxford). 2009;48(6):691-695. PubMed
70.Uribe AG, Vila LM, McGwin G, Jr., Sanchez ML, Reveille JD, Alarcon GS. The Systemic Lupus Activity Measure-revised, the Mexican Systemic Lupus Erythematosus Disease Activity Index (SLEDAI), and a modified SLEDAI-2K are adequate instruments to measure disease activity in systemic lupus erythematosus. J Rheumatol. 2004;31(10):1934-1940. PubMed
71.CDR submission: Benlysta (belimumab), subcutaneous (SC) autoinjector [CONFIDENTIAL sponsor's submission]. Mississauga (ON): GlaxoSmithKline Inc.; 2019 May 29.
72.Petri M, Buyon J, Kim M. Classification and definition of major flares in SLE clinical trials. Lupus. 1999;8(8):685-691. PubMed
73.Shariati-Sarabi Z, Monzavi SM, Ranjbar A, Esmaily H, Etemadrezaie H. High disease activity is associated with high disease damage in an Iranian inception cohort of patients with lupus nephritis. Clin Exp Rheumatol. 2013;31(1):69-75. PubMed
74.Castrejon I, Rua-Figueroa I, Rosario MP, Carmona L. Clinical composite measures of disease activity and damage used to evaluate patients with systemic lupus erythematosus: A systematic literature review. Reumatol Clin. 2014;10(5):309-320. PubMed
75.Feld J, Isenberg D. Why and how should we measure disease activity and damage in lupus? Presse Med. 2014;43(6 Pt 2):e151-156. PubMed
76.Oon S, Huq M, Golder V, Ong PX, Morand EF, Nikpour M. Lupus Low Disease Activity State (LLDAS) discriminates responders in the BLISS-52 and BLISS-76 phase III trials of belimumab in systemic lupus erythematosus. Ann Rheum Dis. 2019;78(5):629-633. PubMed
77.Ware JE, Sherbourne CD. The MOS 36-item short-form health survey (SF-36). I. Conceptual framework and item selection. Med Care. 1992;30(6):473-483. PubMed
78.The Short-Form-36 health survey (Rand Corporation and John E. Ware Jr., 1990, revised 1996). Excerpt from Ian McDowell Measuring health: a guide to rating scales and questionnaires. New York (NY): Oxford University Press; 2006: http://www.med.uottawa.ca/courses/CMED6203/Index_notes/SF36%20fn%20.pdf. Accessed 2021 Apr 26.
79.Devilliers H, Amoura Z, Besancenot JF, et al. Responsiveness of the 36-item Short Form Health Survey and the Lupus Quality of Life questionnaire in SLE. Rheumatology (Oxford). 2015;54(5):940-949. PubMed
80.Delis PC, Dowling J. An Integrative Review of the LupusQoL Measure. J Nurs Meas. 2020;28(2):E139-E174. PubMed
81.Carrion-Nessi FS, Marcano-Rojas MV, Freitas-DeNobrega DC, Romero Arocha SR, Antuarez-Magallanes AW, Fuentes-Silva YJ. Validation of the LupusQoL in Venezuela: A specific measurement of quality of life in patients with systemic lupus erythematosus. Reumatol Clin (Engl Ed). 2021.
82.Brooks R. EuroQol: the current state of play. Health Policy. 1996;37(1):53-72. PubMed
83.EuroQol Group. EuroQol--a new facility for the measurement of health-related quality of life. Health Policy. 1990;16(3):199-208. PubMed
84.Ameri H, Yousefi M, Yaseri M, Nahvijou A, Arab M, Akbari Sari A. Mapping the cancer-specific QLQ-C30 onto the generic EQ-5D-5L and SF-6D in colorectal cancer patients. Expert Rev Pharmacoecon Outcomes Res. 2019;19(1):89-96. PubMed
85.Wang SL, Hsieh E, Zhu LA, Wu B, Lu LJ. Comparative Assessment of Different Health Utility Measures in Systemic Lupus Erythematosus. Sci Rep. 2015;5:13297. PubMed
86.Petri MA, Martin RS, Scheinberg MA, Furie RA. Assessments of fatigue and disease activity in patients with systemic lupus erythematosus enrolled in the Phase 2 clinical trial with blisibimod. Lupus. 2017;26(1):27-37. PubMed
87.Rendas-Baum R, Baranwal N, Joshi AV, Park J, Kosinski M. Psychometric properties of FACIT-Fatigue in systemic lupus erythematosus: a pooled analysis of three phase III randomised, double-blind, parallel-group controlled studies (BLISS-SC, BLISS-52, BLISS-76). J Patient Rep Outcomes. 2021;5(1):33. PubMed
88.Furie R, Morand EF, Askanase AD, et al. Anifrolumab reduces flare rates in patients with moderate to severe systemic lupus erythematosus. Lupus. 2021;30(8):1254-1263. PubMed
Appendix 1: Literature Search Strategy
Note that this appendix has not been copy-edited.
Clinical Literature Search
Overview
Interface: Ovid
Databases:
MEDLINE All (1946—)
Embase (1974—)
Note: Patient headings and search fields have been customized for each database. Duplicates between databases were removed in Ovid.
Date of search: March 01, 2022
Alerts: Bi-weekly search updates until project completion
Search filters applied: No filters were applied to limit the retrieval by study type.
Limits:
Publication date limit: none
Language limit: none
Conference abstracts: excluded
Syntax | Description |
|---|---|
/ | At the end of a phrase, searches the phrase as a patient heading |
MeSH | Medical Patient Heading |
* | Before a word, indicates that the marked patient heading is a primary topic; or, after a word, a truncation symbol (wildcard) to retrieve plurals or varying endings |
.ti | Title |
.ot | Original title |
.ab | Abstract |
.hw | Heading word; usually includes patient headings and controlled vocabulary |
.kf | Author keyword heading word (MEDLINE) |
.dq | Candidate term word (Embase) |
.pt | Publication type |
.rn | Registry number |
.nm | Name of substance word (MEDLINE) |
medall | Ovid database code: MEDLINE All, 1946 to present, updated daily |
oemezd | Ovid database code; Embase, 1974 to present, updated daily |
Multidatabase Strategy
(saphnelo* or anifrolumab* or MEDI-546 or MEDI546 or 38RL9AE51Q).ti,ab,kf,ot,hw,rn,nm.
1 use medall
*anifrolumab/
(saphnelo* or anifrolumab* or MEDI-546 or MEDI546).ti,ab,kf,dq.
or/3-4
5 use oemezd
6 not conference abstract.pt.
2 or 7
remove duplicates from 8
Clinical Trials Registries
ClinicalTrials.gov
Produced by the US National Library of Medicine. Targeted search used to capture registered clinical trials.
[Search -- Studies with results | Saphnelo, anifrolumab, MEDI-546, MEDI546]
WHO ICTRP
International Clinical Trials Registry Platform, produced by the WHO. Targeted search used to capture registered clinical trials.
[Search terms – Saphnelo, anifrolumab, MEDI-546, MEDI546]
Health Canada’s Clinical Trials Database
Produced by Health Canada. Targeted search used to capture registered clinical trials.
[Search terms – Saphnelo, anifrolumab]
EU Clinical Trials Register
European Union Clinical Trials Register, produced by the European Union. Targeted search used to capture registered clinical trials.
[Search terms – Saphnelo, anifrolumab, MEDI-546, MEDI546]
Grey Literature
Search dates: February 16, 2022 – February 23, 2022
Keywords: [Saphnelo, anifrolumab, MEDI-546, MEDI546, lupus, SLE]
Limits: Publication years: none
Updated: Search updated before the meeting of the CADTH Canadian Drug Expert Committee (CDEC)
Relevant websites from the following sections of the CADTH grey literature checklist Grey Matters: A Practical Tool for Searching Health-Related Grey Literature were searched:
Health Technology Assessment Agencies
Health Economics
Clinical Practice Guidelines
Drug and Device Regulatory Approvals
Advisories and Warnings
Drug Class Reviews
Clinical Trials Registries
Databases (free)
Internet Search
Appendix 2: Excluded Studies
Note that this appendix has not been copy-edited.
Reference | Reason for exclusion |
|---|---|
Morand EF, Furie R, Tanaka Y, et al. Trial of Anifrolumab in Active Systemic Lupus Erythematosus. N Engl J Med. 2020;382(3):211 to 221. | Duplicate study |
Furie RA, Morand EF, Bruce IN, et al. Type I interferon inhibitor anifrolumab in active systemic lupus erythematosus (TULIP-1): a randomized, controlled, phase III trial. The Lancet Rheumatology. 2019;1(4):e208-e219. | Duplicate study |
Furie R, Morand EF, Askanase AD, et al. Anifrolumab reduces flare rates in patients with moderate to severe systemic lupus erythematosus. Lupus. 2021;30(8):1254 to 1263. | Pooled analysis |
Tummala R, Abreu G, Pineda L, et al. Safety profile of anifrolumab in patients with active SLE: an integrated analysis of phase II and III trials. Lupus sci. 2021;8(1):02. | Study design |
Appendix 3: Detailed Outcome Data
Note that this appendix has not been copy-edited.
Table 39: Secondary Outcomes, SRI[X], TULIP-1, and TULIP-2 (FAS)
Variable | Treatment group | n | Responder number (%) of patientsa | Difference in response ratesb (95% CI) |
|---|---|---|---|---|
TULIP-1 | ||||
SRI(5) | Anifrolumab 300 mg | 179 | 54 (30.2) | 0 (−9.5 to 9.6) |
Placebo | 184 | 55 (30.2) | reference | |
SRI(6) | Anifrolumab 300 mg | 179 | 51 (28.6) | −1.6 (−11.1 to7.8) |
Placebo | 184 | 55 (30.2) | reference | |
SRI(7) | Anifrolumab 300 mg | 173 | 37 (21.6) | 5.1 (−3.7 to 13.8) |
Placebo | 176 | 29 (16.5) | reference | |
SRI(8) | Anifrolumab 300 mg | 173 | 36 (21.0) | 6.1 (−2.5 to 14.7) |
Placebo | 174 | 26 (14.9) | reference | |
TULIP-2 | ||||
SRI-4 | Anifrolumab 300 mg | 180 | 100 (55.5) | 18.2 (8.1 to 28.3) |
Placebo | 182 | 68 (37.3) | reference | |
SRI(5) | Anifrolumab 300 mg | 180 | 79 (44.0) | 15.9 (6.1 to 25.8) |
Placebo | 181 | 51 (28.1) | reference | |
SRI(6) | Anifrolumab 300 mg | 180 | 79 (44.0) | 17.6 (7.8 to 27.3) |
Placebo | 181 | 48 (26.4) | reference | |
SRI(7) | Anifrolumab 300 mg | 167 | 56 (33.6) | 13.6 (4.0 to 23.2) |
Placebo | 169 | 34 (20.0) | reference | |
SRI(8) | Anifrolumab 300 mg | 166 | 50 (30.2) | 10.7 (1.2 to 20.2) |
Placebo | 167 | 33 (19.6) | reference | |
CI = confidence interval; FAS = full analysis set; SRI = Systemic Lupus Erythematosus Responder Index.
Note: Patients with SLEDAI-2K < X at baseline are excluded from analysis of SRI(X) for X = 4, 5, 6, 7, and 8 respectively. SRI(5), SRI(6), SRI(7), SRI(8) were supporting secondary end points in both trials and followed the same assessment schedule as SRI-4.
aThe responder/nonresponder rates (percentages), the difference in estimates, and associated 95% CIs are weighted and are calculated using a stratified CMH approach, with stratification factors (SLEDAI-2K score at screening [< 10 points vs. ≥ 10 points], week 0 OCS dose [< 10 mg/day vs. ≥ 10 mg/day prednisone or equivalent] and type I interferon gene signature test result at screening [high vs. low]).
bComparisons to placebo.
Source: Clinical Study Reports.9,10
Table 40: Sensitivity Analyses for TULIP-1 (FAS)
Variable | Treatment group | n | Responder number (%) of patientsa | Difference in response ratesb (95% CI) |
|---|---|---|---|---|
Sensitivity analysis with multiple imputation at week 52 and stratified CMH approach | ||||
SRI-4 | Anifrolumab 300 mg | 180 | 65 (36.0) | −3.9 (−13.9 to 6.2) |
Placebo | 184 | 73 (39.9) | reference | |
Sensitivity analysis, multiple imputation, and negative binomial regression model | ||||
Flare rate | Anifrolumab 300 mg | 180 | 93 (51.7) | 17.5 (7.4 to 27.6) |
Placebo | 184 | 62 (34.2) | reference | |
CI = confidence interval; CMH = Cochran-Mantel-Haenszel; FAS = full analysis set; SRI = Systemic Lupus Erythematosus Responder Index.
Source: Clinical Study Report appendices (AstraZeneca Canada).13
Table 41: Sensitivity Analyses for TULIP-2 (Full Analysis Set)
Variable | Treatment group | n | Responder number (%) of patients | Difference in response rates (95% CI) |
|---|---|---|---|---|
Sensitivity analysis with multiple imputation at week 52 and stratified CMH approach | ||||
BICLA | Anifrolumab 300 mg | 180 | 86 (47.9) | 16.3 (6.2 to 26.3) |
Placebo | 182 | 57 (31.6) | ||
SRI-4 | Anifrolumab 300 mg | 180 | 100 (55.6) | 18.5 (8.3 to 28.7) |
Placebo | 182 | 68 (37.0) | ||
Sensitivity analysis using modified BILAG, treatment comparison at week 52, stratified CMH approach | ||||
BICLA | Anifrolumab 300 mg | 180 | 93 (51.7) | 17.5 (7.4 to 27.6) |
Placebo | 182 | 62 (34.2) | ||
Sensitivity analysis excluding patients with no BILAG A or B or PGA VAS score > 2.7 at baseline, stratified CMH approach | ||||
BICLA | Anifrolumab 300 mg | 178 | 86 (48.4) | 16.8 (6.8 to 26.8) |
Placebo | 182 | 57 (31.5) | ||
Sensitivity analysis excluding criterion of no restricted medications, treatment comparison at week 52, stratified CMH approach | ||||
BICLA | Anifrolumab 300 mg | 180 | 99 (55.1) | 16.6 (6.4 to 26.7) |
Placebo | 182 | 70 (38.6) | ||
Sensitivity analysis excluding patients with a burst and taper of steroids, treatment comparison at week 12, stratified CMH approach | ||||
Reduction in CLASI activity score among patients with baseline activity score ≥ 10 | Anifrolumab 300 mg | 48 | 24 (50.0) | 20.6 (−0.5 to 41.7) |
Placebo | 34 | 10 (29.4) | reference | |
Sensitivity analysis, multiple imputation, and negative binomial regression model | ||||
Flare rate through week 52 | Anifrolumab 300 mg | 180 | 0.43a (95% CI, 0.31 to 0.59) | 0.66 (0.47 to 0.93)b |
Placebo | 182 | 0.64a (95% CI, 0.47 to 0.87) | ||
BICLA = British Isles lupus assessment group-based composite lupus assessment; BILAG = British Isles Lupus Assessment Group; BILAG-2004 = British Isles Lupus Assessment Group 2004; CI = confidence interval; CLASI = cutaneous lupus erythematosus disease area and severity index; CMH = Cochran-Mantel-Haenszel; FAS = full analysis set; VAS = visual analogue scale.
Note: For flare rate through week 52, the response variable in the model is the number of flares up to week 52 or early discontinuation visit. The model includes covariates of treatment group, and the stratification factors (SLEDAI-2K Score at Screening (< 10 points vs. ≥ 10 points), week 0 OCS dose (< 10 mg/day vs. ≥ 10 mg/day prednisone or equivalent) and Type 1 interferon-test result at screening (high vs. low). The logarithm (to base e) of the follow-up time is used as an offset variable in the model to adjust for patients having different exposure times. The number of flares after withdrawal from study is imputed conditional upon the observed number of flares before the withdrawal, a postwithdrawal model assumption, the baseline covariates included in the main analysis model and the time the patient would have remained in the study if not withdrawn (i.e., date of first administration of IP + 364 days – date of withdrawal). This analysis is repeated multiple times and the results combined using Rubin’s formula.
aSignifies annual flare rate estimate as opposed to responder number.
bThis is a rate ratio in comparison with placebo. A statistically significant difference was found (P value = 0.0181)
Source: Clinical Study Report appendices (AstraZeneca Canada).13
Figure 8: OCS Dose (mg), Mean Change From Baseline by Time Point in TULIP-2 (Full Analysis Set)
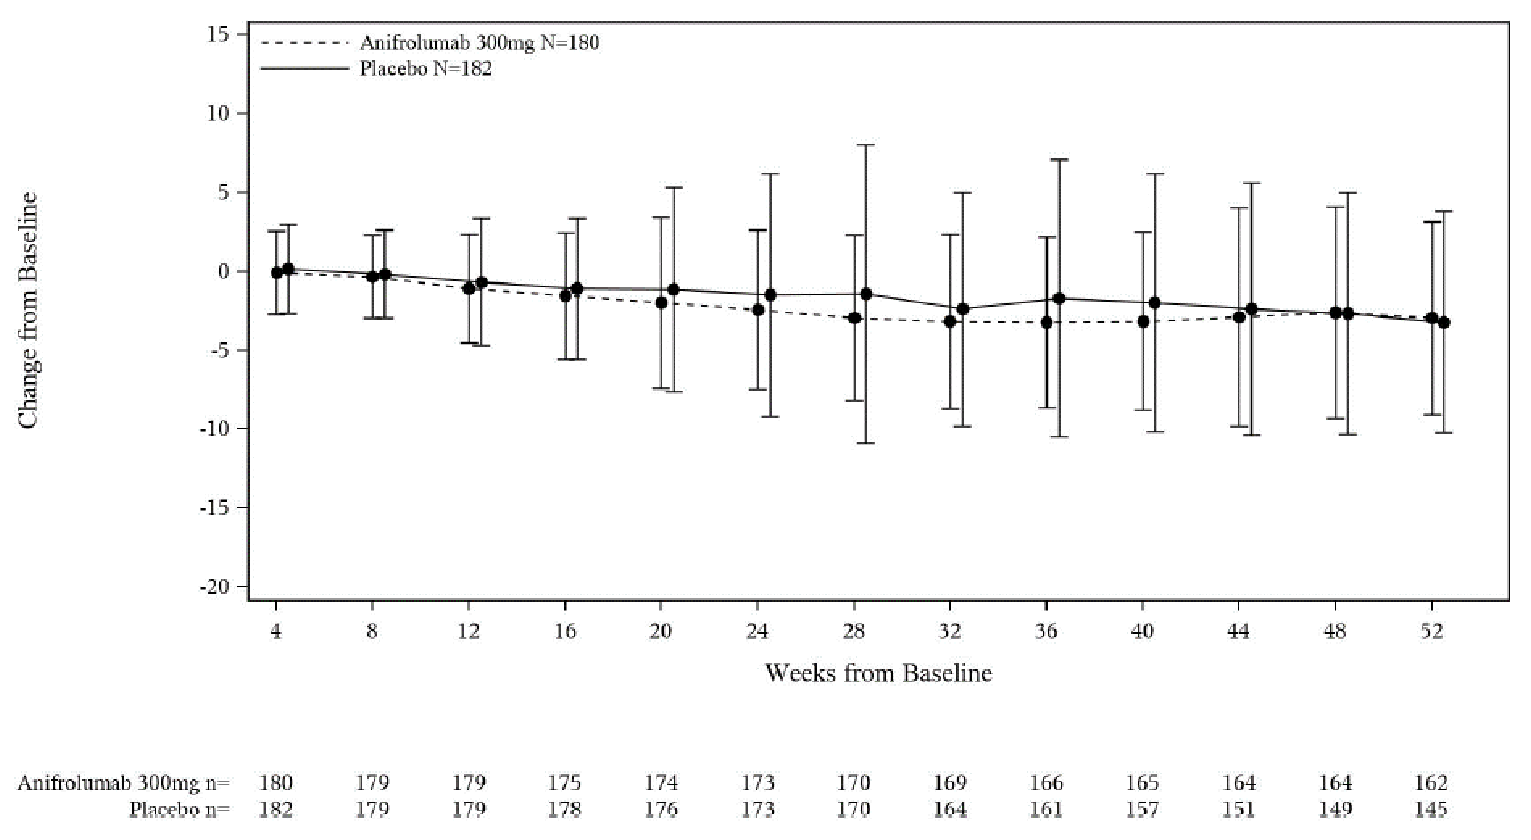
N = Number of patients in treatment group; n = number of patients in analysis; OCS = oral corticosteroids;
Note: OCS when administered as necessary were not considered in the calculation of daily dose.
Source: Clinical Study Report appendices.{AstraZeneca Canada, #709}
Table 42: Shifts From Baseline to Week 52, BILAG-2004 Individual Components — TULIP-2
Organ system | BILAG-2004 score | Anifrolumab | Placebo | Anifrolumab | Placebo |
|---|---|---|---|---|---|
Baseline | Week 52 | ||||
Constitutional | A | 0 | 0 | 0 | 0 |
B | 15 (8.3) | 6 (3.3) | 2 (1.1) | 4. (2.2) | |
C, D, E | 165 (91.7) | 176 (96.7) | 151 (83.9) | 138 (75.8) | |
Missing | 0 | 0 | 27 (15.0) | 41 (22.5) | |
Mucocutaneous | A | 31 (17.2) | 36 (19.8) | 7 (3.9) | 8 (4.4) |
B | 124 (68.9) | 118 (64.8) | 46 (25.6) | 47 (25.8) | |
C, D, E | 25 (13.9) | 28 (15.4) | 100 (55.6) | 86 (47.3) | |
Missing | — | — | 27 (15.0) | 41 (22.5) | |
Neuropsychiatric | A | 1 (0.6) | 0 | 0 | 0 |
B | 0 | 2 (1.1) | 0 | 0 | |
C, D, E | 179 (99.4) | 180 (98.9) | 153 (85.0) | 141 (77.5) | |
Missing | — | — | 27 (15.0) | 41 (22.5) | |
Musculoskeletal | A | 56 (31.1) | 60 (33.0) | 4 (2.2) | 12 (6.6) |
B | 102 (56.7) | 101 (55.5) | 27 (15.0) | 24 (13.2) | |
C, D, E | 12 (12.2) | 21 (11.5) | 122 (67.8) | 105 (57.7) | |
Missing | — | — | 27 (15.0) | 41 (22.5) | |
Cardiorespiratory | A | 1 (0.6) | 1 (0.5) | 1 (0.6) | 0 |
B | 5 (2.8) | 17 (9.3) | 0 | 1 (0.5) | |
C, D, E | 166 (92.2) | 164 (90.1) | 152 (84.4) | 140 (76.5) | |
Missing | — | — | 27 (15.0) | 41 (22.5) | |
Gastrointestinal | A | 0 | 1 (0.5) | 0 | 1 (0.5) |
B | 1 (0.6) | 2 (1.1) | 0 | 1 (0.5) | |
C, D, E | 179 (99.4) | 179 (98.4) | 153 (85.0) | 139 (76.4) | |
Missing | — | — | 27 (15.0) | 41 (22.5) | |
Ophthalmic | A | 0 | 0 | 0 | 0 |
B | 0 | 1 (0.5) | 0 | 1 (0.5) | |
C, D, E | 180 (100) | 181 (99.5) | 153 (85.0) | 140 (76.9) | |
Missing | — | — | 27 (15.0) | 41 (22.5) | |
Renal | A | 1 (0.6) | 4 (2.2) | 0 | 1 (0.5) |
B | 9 (5.0) | 13 (7.1) | 5 (2.8) | 8 (4.4) | |
C, D, E | 170 (94.4) | 165 (90.7) | 148 (82.2) | 132 (72.5) | |
Missing | — | — | 27 (15.0) | 41 (22.5) | |
Hematological | A | 0 | 0 | 0 | 0 |
B | 0 | 0 | 1 (0.6) | 0 | |
C, D, E | 179 (99.4) | 182 (100) | 152 (84.4) | 141 (77.5) | |
Missing | — | — | 27 (15.0) | 41 (22.5) | |
Source: Clinical Study Report appendices.{AstraZeneca Canada, #709}
Table 43: Shifts From Baseline to Week 52, BILAG-2004 Individual Components — TULIP-1
Organ system | BILAG-2004 score | Anifrolumab | Placebo | Anifrolumab | Placebo |
|---|---|---|---|---|---|
Baseline | Week 52 | ||||
Constitutional | A | 1 (0.6) | 0 | 0 | 0 |
B | 9 (5.0) | 11 (6.0) | 1 (0.6) | 1 (0.5) | |
C, D, E | 170 (94.4) | 173 (94.0) | 142 (78.9) | 149 (81.0) | |
Missing | — | — | 37 (20.6) | 34 (18.5) | |
Mucocutaneous | A | 53 (29.4) | 39 (21.2) | 6 (3.3) | 9 (4.9) |
B | 107 (59.4) | 119 (64.7) | 38 (21.1) | 62 (33.7) | |
C, D, E | 20 (11.1) | 26 (14.1) | 99 (55.0) | 79 (42.9) | |
Missing | NA | NA | 37 (20.6) | 34 (18.5) | |
Neuropsychiatric | A | 0 | 1 (0.5) | 1 (0.6) | 1 (0.5) |
B | 8 (4.4) | 2 (1.1) | 3 (1.7) | 0 | |
C, D, E | 172 (95.6) | 181 (98.4) | 139 (77.2) | 149 (81.0) | |
Missing | NA | NA | 37 (20.6) | 34 (18.5) | |
Musculoskeletal | A | 58 (32.2) | 55 (29.9) | 8 (4.4) | 7 (3.8) |
B | 101 (56.1) | 112 (60.9) | 29 (16.1) | 32 (17.4) | |
C, D, E | 21 (11.7) | 17 (9.2) | 106 (58.9) | 111 (60.3) | |
Missing | NA | NA | 37 (20.6) | 34 (18.5) | |
Cardiorespiratory | A | 2 (1.1) | 3 (1.6) | 0 | 2 (1.1) |
B | 14 (7.8) | 6 (3.3) | 3 (1.7) | 0 | |
C, D, E | 164 (91.1) | 175 (95.1) | 140 (77.8) | 148 (80.4) | |
Missing | NA | NA | 37 (20.6) | 34 (18.5) | |
Gastrointestinal | A | 0 | 0 | 0 | 0 |
B | 0 | 1 (0.5) | 0 | 1 (0.5) | |
C, D, E | 180 (100) | 183 (99.5) | 143 (79.4) | 149 (81.0) | |
Missing | NA | NA | 37 (20.6) | 34 (18.5) | |
Ophthalmic | A | 1 (0.6) | 0 | 0 | 0 |
B | 0 | 0 | 0 | 0 | |
C, D, E | 179 (99.4) | 184 (100) | 143 (79.4) | 150 (81.5) | |
Missing | NA | NA | 37 (20.6) | 34 (18.5) | |
Renal | A | 1 (0.6) | 3 (1.6) | 2 (1.1) | 2 (1.1) |
B | 14 (7.8) | 12 (6.5) | 5 (2.8) | 7 (3.8) | |
C, D, E | 165 (91.7) | 169 (91.8) | 136 (75.6) | 141 (76.6) | |
Missing | NA | NA | 37 (20.6) | 34 (18.5) | |
Hematological | A | 0 | 0 | 0 | 0 |
B | 1 (0.6) | 1 (0.5) | 1 (0.6) | 0 | |
C, D, E | 179 (99.4) | 183 (99.5) | 142 (78.9) | 147 (79.9) | |
Missing | NA | NA | 37 (20.6) | 37 (20.1) | |
Source: Clinical Study Report appendices.{AstraZeneca Canada, #709}
Appendix 4: Description and Appraisal of Outcome Measures
Note that this appendix has not been copy-edited.
Aim
To describe the following outcome measures and review their measurement properties (validity, reliability, responsiveness to change, and MID):
BICLA
SRI
BILAG-2004
SLEDAI-2K
PGA
SDI
SFI
LLDAS
CLASI
NRS
FACIT-F
Lupus QoL scale
EQ-5D-5L
SF-36 v.2.0
PHQ-8
C-SSRS.
Findings
Table 44: Summary of Outcome Measures and Their Measurement Properties
Outcome measure | Type | Conclusions about measurement properties | MID |
|---|---|---|---|
BICLA | A composite index that includes criteria from the BILAG-2004, SLEDAI-2000, and PGA indexes. Patients are classified as responders or nonresponders | Validity: BICLA responders had improvements in PROs: SF-36, the FACIT-F, and PGA, indicating convergent validity using the known-groups approach.23 More strict than the SRI as BICLA requires response in all body systems involved at baseline and does not allow for new flares in remaining body systems.26 Reliability: Not assessed in SLE patients. Responsiveness: Not assessed in SLE patients. | NA |
SRI | Disease-specific composite outcome based on SELENA SLEDAI, BILAG, and PGA score. Rated dichotomously as achieved or not achieved.36 | Validity: Correlated with measures of disease activity, biomarkers, and HRQoL measures.21 Reliability: Not assessed in SLE patients. Responsiveness: Less responsive than BILAG or physician VAS for musculoskeletal SLE.22 | NA |
BILAG-2004 | Scoring of 9 organ domains on an ordinal scale of A to E over past 4 weeks. A total score is usually not calculated.10,27 A = most active B = moderate active C = minor activity D = stable E = never present | Validity: Higher BILAG-2004 index scores were associated with increasing ESRs, decreasing C3 and C4 levels, elevated anti-dsDNA levels, and increasing SLEDAI-2K scores.28 Sensitivity and specificity demonstrated with gold standard of new or increase in disease-modifying therapy in original BILAG.29 Reliability: Substantial to almost perfect agreement between raters.29 Good inter-rater reliability for flare index with ICC = 0.54.24 Responsiveness: More responsive to change than the SLEDAI-2K.27 | Minor improvement: change from grade A to B or grade B to C. Minor deterioration: change from grade C to B.30 |
SLEDAI-2K | A measure of disease activity at time of visit or in the preceding 4 weeks. Consists of 24 weighted clinical and laboratory variables in 9 organ systems, with total possible score of 105 (higher scores represent greater disease activity).31,32 | Validity: Strong Spearman rank correlation (0.824) was observed between the SLEDAI-2K and the PGA, supporting construct validity.33 Reliability: Good reliability; agreement for each of the items between 81.7% and 100% in a study of 93 SLE patients.27 Responsiveness: Less responsive to change than the PGA59 and the BILAG-2004.27 | Clinically meaningful: + 3 points for worsening; −1 point for improvement.34 Associated with flare: + 3 points.35 |
PGA | Measure of current disease activity on a VAS with equal markings between 0 to 3, with higher scores representing worse disease activity. 0 = none 1 = mild 2 = moderate 3 = severe | Validity: Strongly correlated with the SLEDAI (r = 0.50 to 0.97); moderately correlated with the SLAM (r = 0.47 to 0.65).37 Reliability: Moderate to excellent reliability with ICC values ranging from 0.67 to 0.96.37 Responsiveness: Responsive to change in SLEDAI (r = 0.39 to 0.66), SLAM (0.61), and the LAI (0.56).37 | SRI-4 uses an increase of ≥ 0.3-points in PGA from baseline as significant worsening.36 In epratuzumab trial a significant improvement was a 20% decrease in PGA score evaluated after 12 months of treatment.37 |
SDI | Disease-specific score of organ damage defined as irreversible change in an organ system, regardless of cause, that has occurred since the onset of SLE, and present for at least 6 months. Consists of 42 items in 12 domains, with a maximum score of 46 (higher scores denote more damage). At SLE diagnosis, the SDI score is 0. Damage is considered if the score is ≥ 1.43 | Validity: Higher scores found in patients with damage vs. stable disease and in patients with active vs. inactive disease. Predictor of mortality. Low correlation observed with SLEDAI and BILAG, although one study found strong correlation with SLEDAI.44 Reliability: Moderate agreement among raters.45 Responsiveness: Scores have been shown to increase with disease duration.46 | SDI ≥ 1 indicates worsening.43 |
SFI | Disease-specific composite measure that classifies flares as mild/moderate or severe, based on criteria of clinical activity, need for additional treatment, or PGA score.46 Pivotal trials used a modified version of SFI where the SLEDAI-2K was used instead of SELENA SLEDAI to identify flares.9,10 | Validity: Associated with a significant change in the FACIT-F and all domains of the SF-36v2 except role emotional scores, indicating convergent validity.60 Reliability: Fair agreement among raters.61 Responsiveness: Not assessed in SLE patients. | NA |
LLDAS | Disease-specific composite measure. If sustained is “associated with a low likelihood of adverse outcome, considering disease activity and medication safety.”53 | Validity: Good criterion validity; patients who spent ≥ 50% of their observed time in LLDAS had significantly reduced organ damage accrual and were less likely to have an SDI increase of ≥ 1.53 Positively associated with, but more stringent than the SRI-4.62 Reliability: Not assessed in SLE patients. Responsiveness: Not assessed in SLE patients. | NA |
CLASI | Disease-specific questionnaire that describes the extent of cutaneous disease in terms of the intensity of involvement measured in 13 different anatomic locations. Has 2 scores; one for each of disease activity (scored from 0 to 70) and disease damage (scored from 0 to 80).47,48 | Validity: Moderate to strong with SLEDAI and SDI domains.49 Reliability: Good to excellent inter-rater reliability.48 Responsiveness: Not assessed in SLE patients. | Clinically important improvement was associated with a mean 3-point or 18% decrease in the CLASI activity score.50 |
SF-36 v.2.0 | A 36-item, generic, self-reported questionnaire using a Likert-type scale. Consists of 8 subscales and 2 component summaries for physical and mental health. Subscale and summary scores range from 0 to 100 where a higher score indicates better HRQoL.38,63 | Validity: Moderate to strong correlations with domains in the Health Assessment questionnaire); demonstrating convergent validity.64 Reliability: Good internal consistency reliability.39 Responsiveness: Poor to moderate SRMs across studies.39 | Anchor-based MIDs for improvement: 2.1 to 2.4 for summary scores and 2.8 to 10.9 in domains.39 |
Lupus QoL | A 34-item SLE-specific health-related quality of life measure. Consists of 8 domains (physical health, pain, planning, intimate relationships, burden to others, emotional health, body image, and fatigue); scores for each domain range from 0 (worst HRQoL) to 100 (best HRQoL).40 | Validity: Strong convergent validity, with correlations with the SF-36.39 Reliability: Good test-retest reliability with an ICC ≥ 0.55 and good internal consistency reliability with Cronbach alpha ≥ 0.85.39 Responsiveness: Effect size and SRMs were poor to moderate in most domains.65 | Anchor-based: 2.4 to 8.7 for deterioration and 3.5 to 7.3 for improvement.39 Distribution-based approaches based on 0.5 SD ranged from 12.9 to 16.7.39 |
EQ-5D-5L | Generic preference based HRQoL scale consisting of a VAS with values between 100 (best imaginable health) and 0 (worst imaginable health) as judged by the patient. A composite index score of 5 dimensions: mobility, self-care, usual activities, pain/discomfort, and anxiety/ depression. Five response levels for each dimension ranging from experiencing no problems to extreme problems.66 | Validity: Related domains on the EQ-5D-3L and the SF-36 had a strong correlation. Able to discriminate between patients with higher disease activity (SLEDAI > 5) vs. lower disease activity (SLEDAI ≤ 5) but not between patients with higher disease damage vs. lower damage.39,42 Reliability: Not assessed in SLE patients. Responsiveness: Not responsive to longitudinal changes in disease activity based on SLEDAI scores. EQ VAS not responsive to self-reported changes in health.39,42 | Not assessed in SLE patients. |
Pain NRS | Generic scale that measures patient-reported pain with an 11-point scale (0 no pain; 10 worst imaginable) with a 1-week recall period.9,10 | Validity: Not assessed in SLE patients. Reliability: Acceptable test-retest reliability.52 Responsiveness: Not assessed in SLE patients. | Not assessed in SLE patients. |
FACIT-F | Generic questionnaire completed by patients to assess fatigue during the past 7 days. Consists of 13 statements, each rated on a 4-point Likert scale.51 | Validity: Differentiated between groups defined on BILAG General domain and BILAG Musculoskeletal domain. Correlated with SF-36, Brief Pain Inventory, and PtGA. Weak to moderate correlation with PGA. Weak correlation with BILAG and SELENA SLEDAI.51 Reliability: Good test-retest reliability in the patient population internal consistency reliability.39 Responsiveness: Responsive to clinical improvement but not clinical deterioration. | Anchor-based MIDs: 2.5 to 8.4 points.51 Distribution-based MIDs: 1/3 SD: 3.8 to 4.6 ½ SD: 5.8 to 6.8 SEM: 2.7 to 2.9.51 |
PHQ-8 | Assesses symptoms of depression over the last 2 weeks using 8 of the 9 criteria on which the DSM-IV diagnosis of depressive disorders is based. Item scores range from 0 to 3; a total score > 10 considered major depression, > 20 is severe major depression.54 | Validity: Not assessed in SLE patients. Reliability: Not assessed in SLE patients. Responsiveness: Not assessed in SLE patients. | Not assessed in SLE patients. |
C-SSRS | Assesses the lethality of attempts and other features of ideation (frequency, duration, controllability, reasons for ideation, and deterrents), all of which are significantly predictive of completed suicide.55 Suicidal ideation: a “yes” response to any of 5 ideation questions ranging from “wish to be dead” to “active suicidal ideation with specific plan and intent.” Suicidal behaviour defined as a “yes” response to any of 5 suicidal behaviour questions ranging from “preparatory acts or behaviour” to “completed suicide.”9,10 | Validity: Not assessed in SLE patients. Reliability: Not assessed in SLE patients. Responsiveness: Not assessed in SLE patients. | Not assessed in SLE patients. |
anti-dsDNA = anti–double-stranded DNA; BICLA = British Isles Lupus Assessment Group-based Composite Lupus Assessment; BILAG = British Isles Lupus Assessment Group; CLASI = Cutaneous Lupus Erythematosus Disease Area and Severity Index; C-SSRS = Columbia Suicide Severity Rating Scale; ESR = erythrocyte sedimentation rate; FACIT-F = Functional Assessment of Chronic Illness Therapy–Fatigue; HRQoL = health-related quality of life; ICC = intraclass correlation coefficient; LAI = Lupus Activity Index; LLDAS = Lupus Low Disease Activity State; Lupus QoL = Lupus Quality of Life questionnaire; MID = minimal important difference; NA = not applicable; NRS = numeric rating scale; PHQ-8 = Patient Health Questionnaire Depression Scale; PGA = Physician’s Global Assessment; PRO = Patient-Reported Outcome; PtGA = Patient Global Assessment; SD = standard deviation; SDI = Systemic Lupus International Collaborating Clinics/American College of Rheumatology Damage Index; SELENA SLEDAI = Safety of Estrogens in Lupus National Assessment-Systemic Lupus Erythematosus Disease Activity Index; SEM = standard error of the mean; SF-36 = 36-Item Short Form Survey; SFI = SELENA SLEDAI Flare Index; SLAM = Systemic Lupus Activity Measure; SLE = systemic lupus erythematosus; SLEDAI-2K = Systemic Lupus Erythematosus Disease Activity Index 2000; SRI = Systemic Lupus Erythematosus Responder Index; SRM = standardized response mean; v2 = version 2; VAS = visual analogue scale.
British Isles Lupus Assessment Group-based Composite Lupus Assessment
Description and Scoring
The BICLA was derived by expert consensus as a composite index that requires patients to meet response criteria across the BILAG-2004 index, SLEDAI-2K, and PGA.67 Details of the individual scales are given in the following sections. In the pivotal trials, the BICLA was a primary end point for TULIP-2 and a secondary end point in the TULIP-1 trial. A patient was defined as a BICLA responder if the following criteria were met:
reduction of all baseline BILAG-2004 A to B/C/D and baseline BILAG-2004 B to C/D, and no BILAG-2004 worsening in other organ systems, as defined by 1 new BILAG-2004 A or more than 1 new BILAG-2004 B item, and
no worsening from baseline in SLEDAI-2K: defined as an increase from baseline of > 0 points in SLEDAI-2K, and
no worsening from baseline in the patients’ lupus disease activity defined by an increase ≥ 0.30 points on a 3-point PGA VAS, and
no discontinuation of investigational product or use of restricted medications beyond the protocol-allowed threshold before assessment.
In contrast to the SRI, improvement in the BICLA is guided by the BILAG-2004 and worsening is assessed using the BILAG-2004, the SLEDAI-2K and PGA.23 The BILAG-2004 can discern inactive disease, partial or complete improvement, and deterioration of disease activity while the SLEDAI- 2K requires complete resolution of disease activity of the specific element to capture improvement.23
Validity
One article noted disagreement between the BICLA and SRI in the EMBLEM trial as BICLA criteria requires a strict response in all body systems involved at baseline and does not allow for new flares in remaining body systems.26 A patient could be a responder on the SRI when a component of SLEDAI resolves, while other issues (if present at baseline) stayed the same or worsened slightly.26 In a post hoc analysis of the TULIP trials, BICLA responders had improvements in patient-reported outcomes, including the physical and mental components of the SF-36, the FACIT-F, and PGA scores, indicating convergent validity using the known-groups approach.23
No literature was identified regarding the reliability and responsiveness of the instrument.
Systemic Lupus Erythematosus Responder Index
Description and Scoring
The SRI is a composite outcome that is rated dichotomously, as to whether a patient has achieved or not achieved response. The SRI-4 response at week 52 was the primary end point in the TULIP-1 trial,9 the secondary end point in the TULIP-2 trial,10 and a prespecified exploratory end point in MUSE.11 The SRI-4 was achieved if all the following criteria were met:
≥ 4-point reduction from baseline in SLEDAI-2K score, and
no new organ system affected as defined by ≥ 1 BILAG-2004 A or ≥ 2 BILAG-2004 B items compared to baseline using BILAG-2004, and
no worsening from baseline in patients’ SLE disease activity defined by an increase ≥ 0.30 points on a 3-point PGAVAS, and
no discontinuation of investigational product or use of restricted medications beyond the protocol-allowed threshold before assessment.9,10
The SRI was developed from an exploratory analyses of a phase II belimumab trial (LBSL99), which included 449 patients with SLE over 56 weeks.36 According to the developers of the SRI, the SLEDAI component was incorporated to capture global improvement, the BILAG domain to ensure no significant worsening in unaffected organ systems, and the PGA to ensure that improvements in disease activity are not at the expense of a patient’s overall condition that are not captured with the SLEDAI or BILAG.36 It is unclear how these particular outcomes for the composite were chosen amid other outcomes available for SLE.
Validity
Studies have found that the SRI is correlated with other clinical parameters of disease activity. In a post hoc analysis of pooled data from 2 52-week Phase IIb trials of sifalimumab and anifrolumab in 736 patients with SLE, changes in disease measures according to SRI responder status were assessed.21 Compared with nonresponders, more SRI responders demonstrated a ≥ 7-point reduction in SLEDAI 2K (P < 0.001); had a greater mean change from baseline in SLEDAI 2K score (P < 0.001), PGA score (P = 0.019), FACIT-F score and SF-36 score (P < 0.001); had more organ domains with improvement in SLEDAI 2K (P < 0.0001); experienced reduction in prednisone equivalent of ≤ 7.5 mg/d (P < 0.001); had ≥ 50% improvement in swollen and tender joint counts (P < 0.001), and ≥ 50% improvement in the Cutaneous Lupus Erythematosus Disease Area and Severity Index (CLASI) (P < 0.001).21 In addition, fewer SRI responders experienced ≥ 1 flare as measured by BILAG A or 2B flares compared with nonresponders (P < 0.001).21 SRI responders had greater mean change from baseline in anti–double-stranded DNA (anti-dsDNA) compared with nonresponders (P = 0.051), although no statistical difference was observed for C3 and C4 concentrations.21
Responsiveness
Among 91 patients from the Oklahoma Lupus Cohort study, SRI was compared with a physician’s assessment of improvement.68 The SRI in this study used the SELENA SLEDAI, except that the scoring for proteinuria was based on the SLEDAI-2K. Physicians rated patient’s disease as either clinically significant improvement, worsening, or no change. In relation to these assessments, the SRI had a sensitivity of 85% and specificity of 74%.68 In a small study of 20 patients with SLE who presented with inflammatory musculoskeletal symptoms, clinical and ultrasound parameters were compared at 2 and 4 weeks from baseline.22 Effect sizes from baseline to 2 or 4 weeks were calculated from paired nonparametric tests (effect size r = Z statistic/sqrt[2N]).22 Among SRI responders, large effect sizes were observed for tender joint counts and swollen joint counts (r = −0.505 and −0.492, P = 0.024 and 0.028, respectively) and smaller, nonsignificant, effect sizes in nonresponders (r = −0.365 and −0.331, and P = 0.122 and 0.160, respectively). However, the SRI was found to be less responsive to musculoskeletal SLE (e.g., SRI underestimated response as there was objective improvement in synovitis among patients classified as nonresponders) than the BILAG or a physician VAS.22
No literature was identified regarding the reliability or responsiveness of the instrument.
BILAG-2004
Description and Scoring
The BILAG-2004 is an updated version of the original ‘classic’ BILAG.26 The classic BILAG had 8 domains and consisted of fewer items that were more related to damage than to disease activity and did not properly include disease activity in the gastrointestinal or ophthalmic systems.24 The BILAG-2004 is an ordinal scale index with 97 organ-specific items in 9 domains (constitutional, mucocutaneous, neuropsychiatric, musculoskeletal, cardiorespiratory, gastrointestinal, ophthalmic, renal, and hematology) that is able to capture changes in clinical manifestations.10,27 The BILAG-2004 records disease activity across the different organ systems by comparing the immediate past 4 weeks to the 4 weeks preceding them where organ manifestations are scored by the investigator as not present ( = 0), improving ( = 1), same ( = 2), worse ( = 3), or new ( = 4) which are then combined with laboratory tests into a single score for that organ. The numerical scoring enables comparisons with global indices by converting the assessments so that grade A = 12 points, B = 8 points, C = 1 point, and D/E = 0 points (where ‘A’ indicates severe disease, ‘B’ is moderate activity, ‘C’ is mild stable disease, ‘D’ is resolved activity, and ‘E’ indicates the organ was never involved). The BILAG-2004 gives equal weight to all affected body systems and can measure incremental improvements or worsening within a body system unlike the SLEDAI-2K which can only record clinical manifestations as absent or present. For example, a 50% improvement, such as a reduction from 40% to 20% of the skin surface involved with a skin eruption, the BILAG-2004 level for that organ would change from A (severe activity) to B (moderate activity). The BILAG-2004 requires improvement in all baseline manifestations within a system to result in a change in that system’s BILAG-2004 level. For example, a patient with skin eruption and severe mucosal ulceration at baseline must show improvement in both to result in a change in the BILAG-2004 mucocutaneous index level.27 In the pivotal trials, for the annualized flare rate, a flare was defined as either ≥ 1 new BILAG-2004 A or ≥ 2 new BILAG-2004 B items compared to the previous visit, which have been defined as severe and moderate flares in the literature, respectively.24
Validity and Reliability
Hay et al. conducted validity and inter-rater reliability studies of the classic BILAG.29 In the validity study, 353 patients with SLE were included.29 Patients were assessed at intervals of at least 1 month apart over a 12-month period, and at least 2 BILAG assessments were conducted on each patient. Criterion validity was based on the gold standard of initiation or increase in disease-modifying therapy (i.e., corticosteroids or immunosuppressants). Construct validity was tested by comparing BILAG assessment with erythrocyte sedimentation rate, double-stranded DNA antibody titres, and need for hospitalization. In examining 1,139 BILAG assessments, compared with the gold standard criterion (starting or increasing disease-modifying therapy), the BILAG had 87% sensitivity and 99% specificity. The positive predictive value was 80% for a BILAG A score in any system.29 The PPVs for a BILAG A score by organ system were: general = 83%, mucocutaneous = 82%, neurologic = 30%, musculoskeletal = 81%, cardiorespiratory = 100%, vasculitis = 100%, renal = 100%, and hematology = 50%).29 Construct validity was also demonstrated. Of those patients with ESR > 40 mm/h, 52% scored A in 1 or more systems compared with 10% with ESR < 20 mm/h (P < 0.001); 56% with anti-dsDNA antibody titre > 30IU/L scored A in 1 or more systems compared with 13% with anti-dsDNA antibody titre < 30 IU/L (P < 0.001); 19 patients admitted to hospital and 18 of their assessments scored A in 1 or more systems versus 6 of the outpatients (P < 0.001).29
Similarly, in a study of 369 patients with SLE in the UK, increasing overall scores on the BILAG-2004 index were associated with increasing ESRs, decreasing C3 levels, decreasing C4 levels, elevated anti-dsDNA levels, and increasing SLEDAI-2K scores, demonstrating construct validity.28 A study examining the inter-rater reliability included 82 patients with SLE treated at outpatient clinics.29 Two rheumatologists who were experienced with the BILAG assessed each patient (renal and hematological systems were not sored because they are based on laboratory results and not prone to inter-rater measurement error). The weighted kappas showed substantial to almost perfect agreement between assessors (general = 0.79, mucocutaneous = 0.80, neurologic = 0.72, musculoskeletal = 0.85, cardiorespiratory = 0.97, and vasculitis = 0.76).29
In a study of 16 SLE patients assessed by 16 rheumatologists, the rate of complete agreement was assessed between physicians for any flare versus no flare for the BILAG-2004, the SFI, and the PGA.24 Under the BILAG-2004 flares was defined as severe: ≥ 1 BILAG-2004 ‘A’ score in any system due to items that are new or worse; moderate: ≥ 2 ‘B’ scores due to items that are new or worse; mild: 1 ‘B’ score due to items that are new or worse or ≥ 3 ‘C’ scores due to items that are new or worse. Anyone without 1 of these criteria was be categorized as no flare. The rate of agreement (95% CI) was 81% (55% to 94%) for the BILAG-2004, 75% (49% to 90%) for the SFI, and 75% (49% to 90%) for the PGA. The ICC (95% CI) values were 0.54 (0.32 to 0.78) for BILAG 2004 flare compared with 0.21 (0.08 to 0.48) for SELENA flare and 0.18 (0.06 to 0.45) for PGA. The agreement was less consistent in mild/moderate flares than in severe flares.24
Responsiveness
In a 2008 study, the ability to detect disease activity was assessed by determining the number of patients with high activity on the BILAG-2004 (overall score A or B) but a low SLEDAI-2K score and number of patients with low activity on the BILAG-2004 (overall score C, D or E) but a high SLEDAI-2K score.27 Results found that 35 patients (37.6%) had high activity on BILAG-2004 but a low SLEDAI-2K score, of which 48.6% had an increase in treatment, indicating that the SLEDAI-2K was less able than the BILAG-2004 to detect active disease. In another study of 347 SLE patients with 1,761 assessments, increases in overall BILAG-2004 index score was associated with increases in therapy and inversely associated with decrease in therapy.69
Minimal Important Difference
Yee et al., (2012)30 developed the BILAG-2004 systems tally (BST) which classified changes in BILAG-2004 index scores according to severity. In the BST a minor deterioration was classified as a change of grade C to B and a minor improvement was classified as a change of grade A to B or grade B to C.
Systemic Lupus Erythematosus Disease Activity Index 2000
Description and Scoring
The SLEDAI is a measure of disease activity that was derived by consensus among experts in rheumatology, followed by regression models to assign relative weights to each parameter.26 The SLEDAI-2K is a modified version of the original SLEDAI to allow for persistent active disease in alopecia, mucous membrane ulcers, rash, and proteinuria to be scored.32 The SLEDAI-2K is based on the presence of 24 descriptors in 9 organ systems which are defined by the investigator as “present” or “absent” in the patient in the past 4 weeks and incudes the use of laboratory samples. Each descriptor has a weighted score and the sum of all 24 descriptor scores falls between 0 and 105, with higher scores representing higher disease activity.31 In the pivotal trials, the “Clinical” SLEDAI-2K score is the SLEDAI-2K assessment score without the inclusion of points attributable to any urine or laboratory results including immunologic measures.9,10
Validity
In a study of 334 SLE patients in Portugal, a strong Spearman rank correlation (0.824) was observed between the SLEDAI-2K and the PGA at the 36-month follow-up, supporting the construct validity of the SLEDAI-2K in SLE patients..33 In another study of 92 patients with SLE, a good correlation coefficient of 0.677 between the SLEDAI 2K and PGA was identified, indicating construct validity,70
Reliability
The reliability of the SLEDAI-2K was demonstrated using inter-rater reliability between 2 raters in a study of 93 SLE patients.27 Results found agreement between the raters for each of the items ranging between 81.7% and 100%.27
Responsiveness
In terms of responsiveness, in 1 study, the SLEDAI-2K was not successful in detecting a clinically meaningful improvement or worsening in SLE disease activity; as it failed to identify more than 60% of cases with a worsening or improvement, which was defined as a change of 0.3 points in the patient global assessment PGA.59 The BILAG-2004 has been found to be more responsive to change in disease activity than the SLEDAI-2K.27 Using a summary score to describe disease activity as in the SLEDAI-2K can mask the underlying organ systems that are contributing to the score (i.e., the same score could indicate mild disease in multiple organs or severe disease in 1 organ; or an unchanged score may occur despite worsening in 1 organ system if there is also improvement in another system).43
Minimal Important Difference
One study identified a minimal clinically meaningful increase of 3 or 4 points for prediction of increase in therapy (worsening) and suggest a minimal clinically meaningful decrease in score of 1 to 2 points for improvement.34 Another study found that the SLEDAI-2K score increased by > 3 points when the clinician assessed that the patient was experiencing a flare.35
Physician’s Global Assessment
Description and Scoring
The PGA represents the physician’s overall assessment of average SLE disease severity on a VAS with equal markings between 0 to 3 where 0 = none, 1 = mild, 2 = moderate, and 3 = severe disease.71
Validity
In a systematic review the PGA was moderately to strongly correlated with the SLEDAI in 12 studies (r = 0.50 to 0.97) and moderately correlated with the Systemic Lupus Activity Measure SLAM in 4 studies (r = 0.47 to 0.65).37
Reliability
Inter-rater reliability was assessed in 7 studies between 2 or more physicians, with results showing moderate to excellent reliability with ICC values ranging from 0.67 to 0.96.37 Intra-rater reliability was assessed in 3 studies with ICC values ranging from 0.55 to 0.88.37
Responsiveness
Studies have assessed responsiveness by correlating changes in the PGA with changes in other instrument scores. Findings have resulted in moderate correlations with SLEDAI (r = 0.39 to 0.66), SLAM (0.61), and the Lupus Activity Index (LAI) (0.56).37
Minimal Important Difference
The PGA is part of the SRI and SFI. In the SRI, no worsening of PGA is defined as an increase of < 0.3 points.36 The change of 0.3 points on the PGA is based on patients with rheumatoid arthritis.36 In the SFI, a mild or moderate flare can occur with an increase in PGA score of ≥ 1, and a severe flare with an increase in PGA score of > 2.5.72 Through consensus, the Hopkins Lupus Center chose a 1-point change on the PGA over the last 93 days, as a gold standard definition of flare.72 Based on this definition, moderate flares were defined as a score of 2 to 2.5, and severe flares as a score of 3.72 In an epratuzumab trial, a significant improvement was a 20% decrease in PGA score evaluated after 12 months of treatment.37
Systemic Lupus International Collaborating Clinics/American College of Rheumatology Damage Index
Description and Scoring
The SDI was developed by the international collaboration, SLICC.43 The purpose of the assessment is to score irreversible damage, regardless of cause. Damage is defined as irreversible change in an organ system that has occurred since the onset of SLE, and is present for at least 6 months.43 The tool is completed by a physician and consists of 42 items in 12 domains (peripheral vascular, ocular, neuropsychiatric, renal, pulmonary, cardiovascular, gastrointestinal, musculoskeletal, skin, endocrine (diabetes), gonadal, and malignancies) with a maximum score of 47 points (higher scores denote more damage).43,45 The items are rated as present or absent and, in the case of recurring events, such as a stroke, there is a possibility of providing a rating of 2 or 3 points to an item.43 At diagnosis of SLE, the SDI score is 0 by definition.45 Damage is considered if the SDI score is ≥ 1 and damage can remain stable or increase over time, however points should not decrease.45
Validity
To assess the validity of the SDI, centres who treated SLE patients submitted 2 assessments, 5 years apart, on 2 patients with active disease (one patient with increase in damage over the 5 years and 1 patient with stable damage) and 2 patients with inactive disease (one patient with increase in damage and 1 patient with stable damage).44 The cases (14 cases in 3 separate packages) were written up in a uniform format and sent back out, in mixed order, to the centres where the SDI was completed by 20 physicians (2 assessments per patient at time 1 and time 2). The SDI scores of patients with damage after 5 years were increased by a greater degree compared with patients with stable disease (2.08 points versus 0.24 points).44 The SDI scores of patients with active disease also increased more compared with patients with inactive disease (1.48 points versus 0.83 points).44 A study of 71 patients found that the SDI was associated with SLEDAI 2K (r = 0.742) and the European Consensus Lupus Activity Measurement (ECLAM) (r = 0.699).73 The SDI and BILAG have been found to have weak correlation (Spearman correlation coefficient 0.19).74
Reliability
Among 20 SLICC members who completed the SDI on 42 cases, there was moderate agreement between raters (ICC = 0.553).45 Similarly, when the SDI was completed by another physician based on retrospective review of patient cases, interobserver reliability was moderate (kappa = 0.47; 95% CI, 0.28 to 0.66).74
Responsiveness
The SDI is a statistically significant predictor of clinically important outcomes. In a 10-year retrospective study of 80 patients with SLE, the mean SDI renal damage score at 1 year after diagnosis was a significant predictor of end stage renal failure (at 1 year: renal failure versus no renal failure, SDI renal damage score 0.33 versus 0.03; at 5 years: SDI renal damage score 1.33 versus 0.14; at 10 years: SDI renal damage score 2.80 versus 0.35).46 The total SDI score was also associated with end stage renal failure at 5 and 10 years.46 The SDI pulmonary damage score at 1 year after diagnosis was a significant predictor of death within 10 years, however total SDI score was not associated with death.46 More recent studies with larger cohorts of patients have shown that the SDI is a predictor of mortality. Patients with SLE (N = 1,297) were identified within 2 years of a first clinical visit from 8 centres, and followed for 2, 5 to 10, and > 10 years.45 The SDI increased over time and was found to be higher among patients who died.45 In the University of Toronto Lupus Clinic, 263 patients were followed for 10 years.75 Within 10 years, 25% of patients who exhibited damage at the first SDI assessment (i.e., 1 year after diagnosis) died, compared with 7.3% of patients who had no early signs of damage.75
Minimal Important Difference
No formal MID has been assessed. An SDI of 1 or higher indicates damage which can remain stable or increase over time.43
SELENA SLEDAI Flare Index
Description and Scoring
The SFI is used to identify and classify flares as mild/moderate or severe, based on clinical activity, need for additional treatment, or PGA score.36 The original definitions of mild/moderate and severe flares were reached by consensus of the investigators of the SELENA trials.72 In the TULIP trials9,10 a modified version of the SFI was used, using the SLEDAI-2K instead of the SELENA SLEDAI. In the pivotal trials, mild/moderate flare and severe flare were defined according to the following criteria:
Mild or moderate flare:
change in SLEDAI-2K score of ≥ 3 points but < 7 points compared to previous visit, or
new or worse discoid, photosensitive, profundus, cutaneous vasculitis, or bullous lupus, or
nasopharyngeal ulcers, pleuritis, pericarditis, arthritis, or SLE fever, or
≥ 1.0 increase in PGA score (not > 2.5).
Severe flare:
change in SLEDAI-2K score ≥ 7 points compared to previous visit, or
new or worse CNS-SLE, vasculitis, nephritis, myositis, hemolytic anemia (Hb < 70 g/L or decrease in Hb > 30 g/L with positive Coombs) AND at least 1 of the following: decreased haptoglobin, increased total bilirubin not due to Gilbert’s disease, increased reticulocyte count, or
hospitalization for SLE, or
Validity
In a post hoc analysis of BLISS-52 trial data with 867 SLE patients, the occurrence of a new SFI flare using the SELENA SLEDAI was associated with a significant change in the FACIT-F and all domains of the SF-36v2 except role emotional scores, indicating convergent validity.60 In a small study of 16 patients who were each evaluated by 4 physicians, there was 52% agreement between the SFI and BILAG-2004 flare index in classifying patients as having no flare, or mild, moderate or severe flare.24 It was unclear, however, if this study used the SFI, or the modified SFI. The agreement among raters on the SFI was fair (ICC 0.21; 95% CI, 0.08 to 0.48), and lower than the BILAG 2004 assessment of flares.24
Reliability
A study evaluated the modified SFI using paper-based cases of patients with SLE.61 Initially, 988 cases were assessed by 3 physicians for degree of flare or presence of disease activity and rated as severe, moderate, or mild flare, or persistent/ongoing disease. For those cases where there was agreement by the 3 physicians (N = 451 cases), they were moved on the second part of the study and assessed by 18 pairs of physicians with 3 instruments, BILAG-2004 flare index, SFI, and modified SFI. The assessments based on these instruments were compared with the assessments conducted initially in the first stage of the study by the 3 physicians. For the modified SFI, assessments matched the conclusions of the thee physicians in 70% of cases (weighted kappa 0.74).61 The discrepancies were concentrated in classifying moderate flares as severe flares, and identifying persistent activity as a flare.61 There was also an issue of over-scoring due to classifying treatment change as a flare, even when there were no new or worsening clinical features.61 The authors of this study indicate that “the problem of capturing lupus flare accurately” is not completely solved.61
No literature was identified regarding the responsiveness of the instrument in SLE patients.
Lupus Low Disease Activity State
Description and Scoring
The LLDAS is a state that if sustained is “associated with a low likelihood of adverse outcome, considering disease activity and medication safety.”53 The LLDAS is achieved by attaining all the following 5 criteria:
SLEDAI-2K ≤ 4, with no activity in major organ systems (renal, CNS, cardiopulmonary, vasculitis, fever) and no hemolytic anemia or gastrointestinal activity, and
no new lupus disease activity compared with the previous assessment (SLEDAI-2K), and
a PGA ≤ 1 (scale 0 to 3), and
a current prednisone (or equivalent) dose ≤ 7.5 mg daily, and
well-tolerated standard maintenance doses of immunosuppressive drugs and approved biologic drugs.53
Validity
Criterion validity was assessed by comparing the LLDAS with damage accrual as measured by the SDI in a study of 191 SLE patients in Australia followed for an average of 3.9 years. For each patient, the LLDAS was measured at each visit and the SDI was completed annually following a baseline measurement.53 Results found that patients who spent ≥ 50% of their observed time in LLDAS had significantly reduced organ damage accrual compared with patients who spent < 50% of their time in LLDAS (P = 0.0007) and were less likely to have an SDI increase of ≥ 1 (relative risk 0.47; 95% CI, 0.28 to 0.79), indicating good criterion validity. The minimum amount to time needed to spend in an LLDAS state to improve outcomes was not calculated due to an insufficient sample size.53
In a post hoc analysis of the MUSE trial, LLDAS attainment was positively associated with, but more stringent than, standard end points.62 For example, 16.7% of all patients achieved LLDS at week 24, and of these patients, 80.4% achieved the primary end point of SRI-4 with OCS taper. However, of the 82 patients that achieved the primary end point, only 50% also met the LLDS criteria. Furthermore, patients who achieved LLDAS at week 52 had a 75.2% lower BILAG flare rate during the study, had lower PGA scores, and higher Lupus QoL scores compared with those who did not attain LLDAS at the same time point, indicating convergent validity.62 Similar results were found in another post hoc analysis, as 17.0% and 19.3% of patients who achieved an SRI-4 also attained LLDAS in BLISS-52 and BLISS-76, respectively.76
No literature was identified regarding the reliability or responsiveness of the instrument in SLE patients.
Cutaneous Lupus Erythematosus Disease Area and Severity Index
Description and Scoring
The CLASI has 2 separate scores; 1 for each of disease activity and disease damage, both of which were used in the pivotal trials.47,48 Disease activity is scored from 0 to 70 and is based on erythema, scale/hyperkeratosis, mucous membrane involvement, acute hair loss and nonscarring alopecia.47,48 Disease damage is scored from 0 to 80 and consists of dyspigmentation and scarring, including scarring alopecia. If patients’ dyspigmentation has lasted for > 12 months, their dyspigmentation score is doubled.47,48 CLASI describes the extent of disease in terms of the intensity of involvement measured in 13 different anatomic locations but does not record the percentage of body surface area or the number of lesions.48
Validity
Convergent validity was assessed in a study of 31 patients with cutaneous lupus erythematosus, comparing the CLASI to the SLEDAI and SDI.49 Results found a moderate correlation (r = 0.42) between CLASI activity and SLEDAI-rash and between total CLASI-damage and SDI-extensive scarring/panniculum (r = 0.51). A strong correlation (r = 0.94) was found between CLASI scalp scarring and the SDI-skin scarring/alopecia domains.49
Reliability
One study had 9 patients with either subacute lupus erythematosus or discoid lupus erythematosus scored by 11 physicians in 2 sessions to estimate the instrument’s inter- and intra-rater reliability.48 Results demonstrated good to excellent inter-rater reliability with ICC (95% CI) values of 0.86 (0.73 to 0.99) for the activity score and 0.92 (0.85 to 1.00) for the damage score. Good to excellent results were found for intra-rater reliability with Spearman’s q (95% CI) values of 0.96 (0.89 to 1.00) for the activity score and 0.99 (0.97 to 1.00) for the damage score.48
Minimal Important Difference
In a study of 75 patients in the US with cutaneous lupus erythematosus or SLE, a clinically important improvement was associated with a mean 3-point or 18% decrease in the CLASI activity score.50
No literature was identified regarding the responsiveness of the instrument in SLE patients.
Short Form (36) Health Survey Version 2
Description and Scoring
The SF-36 is a generic, self-reported health assessment questionnaire that has been used in clinical trials to study the impact of chronic disease on health-related quality of life.38 There are 2 versions of the instrument including the original SF-3677 and the SF-36 version 2 (SF-36v2).38,63 Compared with the original SF-36, the SF-36v2 contains minor changes to the original survey, including changes to: instructions (reduced ambiguity), questions and answers (better layout), item-level response choices (increased), cultural/language comparability (increased), and elimination of a response option from the items in the mental health and vitality subscales.38,63 The questionnaire consists of 36 items representing 8 subscales: physical functioning (PF; 10 items), role physical (RP; 4 items), bodily pain (BP; 2 items), general health (GH; 5 items), vitality (VT; 4 items), social functioning (SF; 2 items), role emotional (RE; 3 items), and mental health (MH; 5 items). The second question of the survey is a single item used to estimate the general health from a cross-sectional stand point.78 The SF-36 has a recall period of 1 week in the pivotal trials9,10 and item response options are presented on a 3- to 6-point, Likert-like scale.38,63 Each item is converted to a score ranging from 0 to 100 where a higher value indicates a more favourable health state and item scores are averaged together to create the 8 subscale scores. The SF-36 also provides 2 component summaries, the PCS and MCS, which are created by aggregating the 8 subscales according to a scoring algorithm. The first 4 subscales (PF, RP, BP, and GH) belong to the PCS while the next 4 subscales (VT, SF, RE, and MH) make up the MCS. Like the individual items, the 8 subscale scores, the PCS, and the MCS are each measured from 0 to 100. Although several measures of HRQoL have been studied in SLE, the most used and accepted measure is the SF-36, a generic tool that can be used to make comparisons with other patient groups or to the population at large using the standardized PCS an MCS.39,65
Validity
A literature review found that the Health Assessment questionnaire was strongly correlated with physical function scores of the SF-36 (r = 0.75) and moderately correlated with role physical, bodily pain, and vitality scores (r = 0.41 to 0.48); demonstrating convergent validity.64
Reliability
Evidence suggests the instrument has good internal consistency reliability with a Cronbach alpha of ≥ 0.71 across various studies.39
Responsiveness
Studies have suggested that the responsiveness of the instrument has been poor in patients with SLE with poor to moderate SRMs across studies.39 For instance, in a study of 41 SLE patients, responsiveness was found in some domains among those who flared (i.e., SRM of moderate effect of 0.64 in role physical) and improved (i.e., SRM of moderate effect of 0.60 in MCS), but not among patients in remission, when compared to their previous visit.65
Minimal Important Difference
Minimum important differences that are specific to SLE patients have been estimated in a literature review of 8 studies.39 Anchor-based MIDs for improvement are estimated to be from 2.1 to 2.4 for summary scores and 2.8 to 10.9 in domains. These estimates are consistent with estimates from other rheumatological conditions (5 to 10 points for domains and 2.5 to 5 points for summary scores). In patients reporting worsening, 1 study noted MIDs ranging from −4.4 to −15.6 in the SF-36 domains.79
Lupus Quality of Life
Description and Scoring
A 34-item SLE-specific health-related quality of life measure.40 The instrument consists of 8 domains: physical health (8 items), pain (3 items), planning (3 items), intimate relationships (2 items), burden to others (3 items), emotional health (6 items), body image (5 items) and fatigue (4 items).
Validity
A recent literature review identified 7 studies which examined the psychometric properties of the instrument in patients with SLE.39 The evidence suggests good construct validity, with correlations between comparable domains in the Lupus QoL and the SF-36 (r > 0.6) including physical health/physical functioning, emotional health/mental health, pain/bodily pain, and fatigue/vitality. Studies also indicated good convergent validity using the known-groups approach.39 For example, in a study using the BILAG index to assess disease activity in 269 patients, patients with no disease activity (Es/Ds/Cs only) or mild activity (B in only 1 system) reported better Lupus QoL scores than those with moderate (B in ≥ 2 systems) or severe (A in any system) disease activity in all domains except fatigue.40
Reliability
The literature review suggested good test-retest reliability in the patient population with an ICC ≥ 0.55 and good internal consistency reliability with Cronbach alpha ≥ 0.85 across all studies.39 Content validity of the instrument was supported by rheumatology and/or medical experts in 4 studies and feedback was gathered from SLE patients to ensure readability and understandability of the tool.80
Responsiveness
Regarding responsiveness, the effect size and SRMs were poor in most domains and inconsistent (poor to moderate) depending on the anchor being used.39 For instance, in a study of 41 SLE patients, responsiveness was found in some domains when compared to the previous visit among patients who flared (i.e., a moderate SRM of 0.67 for fatigue) and improved (i.e., SRM of 0.73 in pain; 0.53 in fatigue, and 0.51 in physical health), but not among patients in remission.65 Studies have validated non-English versions with similar results.81
Minimal Important Difference
MIDs derived using an anchor-based approach ranged from 2.4 to 8.7 for deterioration and from 3.5 to 7.3 for improvement. MIDs derived using distribution-based approaches based on 0.5 SD ranged from 12.9 to 16.7.39
5-Level EQ-5D
Description and Scoring
The EQ-5D is a family of HRQoL instruments that may be applied to a wide range of health conditions and treatments.82,83 The first of part of the EQ-5D-5L is a descriptive system that classifies respondents (aged ≥ 12 years) based on the following 5 dimensions: mobility, self-care, usual activities, pain/discomfort, and anxiety/depression. In 2005, updates were made to the original EQ-5D (i.e., the EQ-5D-3L) to create the EQ-5D-5L which includes 5 response levels (as opposed to the original 3 levels) of severity (no problems, slight problems, moderate problems, severe problems, unable to/extreme problems) in each of the dimensions.41 Respondents are asked to choose the level that reflects their health state for each dimension resulting in 3,125 possible health states.84 A scoring function can be used to assign a value to self-reported health states from a set of population-based preference weights.82,83 The second part is the EQ VAS, which has end points labelled 0 and 100, with respective anchors of “worst imaginable health state” and “best imaginable health state.” Respondents are asked to rate their health by drawing a line from an anchor box to the point on the EQ VAS which best represents their health on that day.
Validity
One study identified in a literature review examined the psychometric properties of the EQ-5D-3L in patients with SLE.39,42 Related domains on the EQ-5D-3L and the SF-36 had a strong correlation (i.e., r = 0.60 for SF-36 mobility and EQ-5D-3L physical functioning) and unrelated domains had a weak/moderate correlation (i.e., r = −0.27 for SF-36 general health perception and EQ-5D-3L pain/discomfort), demonstrating convergent and divergent validity. Evidence of known-groups validity was demonstrated as the instrument was able to discriminate between patients with higher disease activity (SLEDAI > 5) versus those with lower disease activity (SLEDAI ≤ 5). Those with lower disease activity had a higher mean (SD) EQ-5D-3L score of 0.75 (0.18) compared to those with lower disease activity with a mean (SD) score of 0.69 (0.19). However, the instrument was not able to significantly discriminate between patients with high disease damage (SDI > 2) versus those with lower disease damage (SDI ≤ 2). The study suggested that the responsiveness of the instrument has been poor in patients with SLE when comparing self-reported change in health and the EQ VAS. Effect sizes ranged from 0.08 to 0.27 in patients who self-identified as deteriorated and 0.35 to 0.43 in patients who self-identified as improved. Evidence suggests that the instrument was not responsive to longitudinal changes in disease activity measured in 66 patients based on SLEDAI scores with effect sizes of 0.01 in patients who deteriorated (SLEDAI increase > 3) and 0.12 in patients who improved (SLEDAI decrease > 3).
Reliability
One study assessed the reliability of the EQ-5D-5L among 100 SLE patients by determining the ICC for the EQ-5D VAS and kappa coefficients for EQ-5D-5L domains calculated in 2 assessments, 2 to 4 weeks apart, in patients whose self-assessed quality of life was rated as no change on a 15-point health status change scale (−7 to + 7).85 Results found an ICC (95% CI) for the VAS of 0.793 (0.707 to 0.856), indicating good reliability. The kappa coefficients were strong for all EQ-5D-5L domains (> 0.79) expect for anxiety/depression (0.28).85
No literature was identified regarding the responsiveness of the instrument in SLE patients. SLE-specific MIDs for the EQ-5D have not been reported.
Numerical Rating Score
Description and Scoring
The pivotal trials measured patient-reported pain with an 11-point scale (0 no pain; 10 worst imaginable) with a 1-week recall period.9,10
Reliability
A cross-sectional study in Peru, had 204 SLE patients rate their pain on a NRS from 0 (no disease activity) to 4 (the most disease activity possible) with a 1-week recall period.52 Patients competed the scale twice, before and after an encounter with a physician to assess the reliability of the instrument. Results found that the mean (SD) NRS rating among patients was 1.5 (1.2) before and 1.4 (1.1) after the physician encounter with a Spearman rank correlation coefficient of 0.84, indicating acceptable test-retest reliability. The differences between mean scores were smaller among patients receiving a comprehensive care program versus those receiving standard care which suggests that a comprehensive care program could reduce the variability of patients measuring their disease activity.52
No literature was identified regarding the validity or responsiveness of the instrument in SLE patients. An MID was not identified for the Pain NRS in SLE patients.
FACIT-F Score
Description and Scoring
The FACIT-F is completed by patients to assess fatigue. In the pivotal trials, patients were presented with a list of 13 statements (i.e., “I am too tired to eat”) and asked to rate each on a 4-point Likert scale (0 = not at all, 1 = a little bit, 2 = somewhat, 3 = quite a bit, and 4 = very much), to indicate how true the statement was during the past 7 days.9,10 Final scores are the sum of the responses and range from 0 to 52; items are reverse-scored and higher scores indicate better quality of life.9,10
Validity
The FACIT-F was validated in patients with SLE by Lai et al.51 Patients with moderately to severely active extrarenal SLE (N = 254) completed the FACIT-F, Short Form-36 (SF-36), Brief Pain Inventory, and a patient global assessment VAS at baseline, week 12, week 24, and week 52.51 Physicians also completed the BILAG and PGA at the same visits. The FACIT-F was able to differentiate between groups that were defined by BILAG General domain and Musculoskeletal domain ratings at 12 weeks.51 Using the Spearman correlation coefficient, the FACIT-F was found to be moderately to strongly correlated with: the SF-36 (r = 0.69 to 0.87 at week 52), Brief Pain Inventory (r = −0.72 to −0.82 at week 52) and patient global assessment (r = −0.76 at week 52).51 However, the correlations of FACIT-F with total BILAG score and PGA at week 52 were weak, at −0.25 and −0.21, respectively.51 In a phase IIb trial that randomized 547 patients with SLE to blisibimod or placebo, FACIT-F was weakly to moderately correlated with PGA (r = −0.32, P < 0.001), SELENA SLEDAI (−0.13, P = 0.006), and BILAG r = (−0.18, P < 0.001).86 The FACIT-F was responsive to clinical improvement but not clinical deterioration.39
Reliability
In a post hoc analysis of 2,520 SLE patients in BLISS-SC, BLISS-52, and BLISS-76 trials, the FACIT-F showed good internal consistency reliability (Cronbach alpha > 0.90) and good test-retest reliability with an ICC of 0.84 in the pooled results which ranged from 0.76 to 0.92 in each individual trial.87
Minimal Important Difference
The study by Lai et al. included estimation of MIDs for the FACIT-F with anchor and distribution-based techniques.51 The anchors were based on the General and Musculoskeletal domains of the BILAG. These were selected as anchors for the FACIT-F because the General domain contains physician assessment of fatigue and malaise, and the Musculoskeletal domain contains assessment of pain, which is associated with fatigue.51 The anchor-based MIDs were estimated from cross-sectional (i.e., comparing mean FACIT-F scores across groups defined by BILAG disease activity at each assessment) and longitudinal analyses (i.e., changes in FACIT-F with changes in BILAG disease activity between consecutive assessments).51 Changes in BILAG disease activity were classified as more active, less active, or stable (with stable defined as change from BILAG D/E to C or vice versa).51 The anchor-based MIDs ranged from 2.5 to 8.4 points.51 The distribution-based MIDs fell within this range (based on one-third SD: 3.8 to 4.6 points; one-half SD: 5.8 to 6.8 points; standard error of the mean = 2.7 to 2.9 points).51
No literature was identified regarding the responsiveness of the instrument in SLE patients.
8-Item Patient Health Questionnaire
The PHQ-8 Assesses symptoms of depression over the last 2 weeks using 8 of the 9 criteria on which the diagnosis of depressive disorders according to the Diagnostic and Statistical Manual of Mental Disorders (Fourth Edition) is based.54 Each item’s score range from 0 (not at all) to 3 (nearly everyday). The scores for each item are summed to produce a total score between 0 and 24 points. A total score greater than 10 is considered indicative of major depression and greater than 20 is considered indicative of severe major depression.54 The PHQ-8 is completed by the patient and scored by the investigator. No evidence related to the validity, reliability, responsiveness or MID of the instrument among SLE patients was identified.
Columbia Suicide Severity Rating Scale
Assesses the lethality of attempts and other features of ideation (frequency, duration, controllability, reasons for ideation, and deterrents), all of which are significantly predictive of completed suicide.55 In the pivotal trials,9,10 2 different versions of the questionnaire were used: 1 assessing the last 12 months before the assessment and another assessing the time since the last visit. Suicidal ideation was defined as a “yes” answer at any time in the respective study period to any 1 of the 5 (re-ordered) suicidal ideation questions, ranging from category 1 (“wish to be dead”) to category 5 (“active suicidal ideation with specific plan and intent”) on the C-SSRS. Suicidal behaviour was defined as a “yes” answer at any time in the respective study period, to any 1 of the 5 (re-ordered) suicidal behaviour questions, ranging from category 6 (“preparatory acts or behaviour”) to category 10 (“completed suicide”) on the C-SSRS. No evidence related to the validity, reliability, responsiveness or MID of the instrument among SLE patients was identified.
Appendix 5: Summary of Pooled Data (TULIP-1 and TULIP-2)
Note that this appendix has not been copy-edited.
Methods
Pooled data from the phase III TULIP-1 and TULIP-2 trials in patients with moderate to severe SLE were analyzed to determine anifrolumab's effect on flares, including flares in patients with glucocorticoid taper.
Populations
Data were pooled for the placebo and anifrolumab 300-mg treatment groups in the phase III TULIP-1 (n = 364) and TULIP-2 (n = 362) trials. Of these 726 patients, 366 received placebo (184 in TULIP-1, 182 in the TULIP-2 trial), and 360 received anifrolumab 300 mg (180 patients in each trial). Patients in both trials were randomized to receive IV infusions of placebo or anifrolumab every 4 weeks for 48 weeks in addition to standard therapy, with a 52-week treatment period. For patients receiving oral glucocorticoid > 10 mg/day (prednisone or equivalent) at baseline, a protocol-mandated attempt to taper to < 7.5 mg/day was required between weeks 8 and 40; tapering was also permitted for patients receiving oral glucocorticoid < 10 mg/day at baseline. Stable oral glucocorticoid dose was required in all patients between weeks 40 and 52.
In the pooled TULIP data, baseline demographics, disease characteristics, and SLE medications were generally similar between the anifrolumab and placebo groups. In the pooled data, at baseline, 82.8% and 82.5% of patients had a high IFNGS and 17.2% and 17.5% had a low IFNGS in each of the in the anifrolumab and placebo groups, respectively. In the pooled anifrolumab and placebo groups, 80.8% and 83.1% of patients were receiving glucocorticoids and 52.8% and 50.5% were receiving glucocorticoids of ≥ 10 mg/d, respectively. The most prevalent baseline BILAG-2004 A or B disease activity scores occurred in the musculoskeletal (88.8%) and the mucocutaneous (86.4%) domains and were balanced across treatment groups.
Table 45: Summary of Baseline Characteristics in Pooled TULIP Data
Characteristic | TULIP 1 | TUPLIP 2 | Pooled TULIP | |||
|---|---|---|---|---|---|---|
Placebo N = 184 | Anifrolumab N = 360 | Placebo N = 182 | Anifrolumab N = 180 | Placebo N = 366 | Anifrolumab N = 360 | |
Age, mean (SD), years | 41.0 (12.3) | 42.0 (12.0) | 41.1 (11.5) | 43.1 (12.0) | 41.0 (11.9) | 42.6 (12.0) |
Female, n (%) | 171 (92.9) | 165 (91.7) | 170 (93.4) | 168 (93.3) | 341 (93.2) | 333 (92.5) |
Racea, n (%) | ||||||
White | 137 (74.5) | 125 (69.4) | 107 (58.8) | 110 (61.1) | 244 (66.7) | 235 (65.3) |
Asian | 5 (2.7) | 11 (6.1) | 30 (16.5) | 30 (16.7) | 35 (9.6) | 41 (11.4) |
Black/African American | 23 (12.5) | 29 (16.1) | 25 (13.7) | 17 (9.4) | 48 (13.1) | 46 (12.8) |
Other | 19 (10.3) | 15 (8.3) | 12 (6.6) | 15 (8.3) | 31 (8.5) | 30 (8.3) |
Time from SLE diagnosis to randomization, months, median (range) | 79.5 (4 to 503) | 88.0 (0 to 450) | 78.0 (6 to 494) | 94.5 (6 to 555) | 78.5 (4 to 503) | 91.0 (0 to 555) |
IFNGS status at screening, n (%) | ||||||
High | 151 (82.1) | 148 (82.2) | 151 (83.0) | 150 (83.3) | 302 (82.5) | 298 (82.8) |
Low | 33 (17.9) | 32 (17.8) | 31 (17.0) | 30 (16.7) | 64 (17.5) | 62 (17.2) |
≥ 1 BILAG-2004 A, n (%) | 84 (45.7) | 93 (51.7) | 95 (52.2) | 81 (45.0) | 179 (48.9) | 174 (48.3) |
No BILAG-2004 A and ≥ 2 BILAG-2004 B, n (%) | 84 (45.7) | 79 (43.9) | 78 (42.9) | 91 (50.6) | 162 (44.3) | 170 (47.2) |
SLEDAI-2K global score, mean (SD) | 11.5 (3.5) | 11.3 (4.0) | 11.5 (3.9) | 11.4 (3.6) | 11.5 (3.7) | 11.4 (3.8) |
SLEDAI-2K ≥ 10, n (%) | 135 (73.4) | 125 (69.4) | 131 (72.0) | 129 (71.7) | 266 (72.7) | 254 (70.6) |
PGA score, mean (SD) | 1.8 (0.4) | 1.9 (0.4) | 1.8 (0.4) | 1.7 (0.4) | 1.8 (0.4) | 1.8 (0.4) |
CLASI activity score, mean (SD) | 8.1 (6.7) | 8.5 (7.3) | 7.6 (7.8) | 8.3 (7.9) | 7.8 (7.2) | 8.4 (7.6) |
Swollen joint countb, mean (SD) | 7.0 (4.8) | 7.4 (5.8) | 7.4 (6.6) | 6.2 (5.7) | 7.2 (5.7) | 6.8 (5.8) |
Tender joint countb, mean (SD) | 10.6 (7.2) | 11.7 (7.5) | 11.0 (7.9) | 9.0 (7.1) | 10.8 (7.5) | 10.3 (7.4) |
SDI score, mean (SD) | 0.6 (1.0) | 0.7 (1.2) | 0.5 (0.8) | 0.5 (0.9) | 0.6 (0.9) | 0.6 (1.0) |
SLE treatments at baseline, n (%) | ||||||
GCc | 153 (83.2) | 150 (83.3) | 151 (83.0) | 141 (78.3) | 304 (83.1) | 291 (80.8) |
GC ≥ 10 mg/d | 102 (55.4) | 103 (57.2) | 83 (45.6) | 87 (48.3) | 185 (50.5) | 190 (52.8) |
Antimalarials | 134 (72.8) | 124 (68.9) | 133 (73.1) | 119 (66.1) | 267 (73.0) | 243 (67.5) |
Immuno-suppressantsd | 91 (49.5) | 85 (47.2) | 86 (47.3) | 88 (48.9) | 177 (48.4) | 173 (48.1) |
BILAG-2004 = British Isles Lupus Assessment Group 2004; CLASI = Cutaneous Lupus Erythematosus Disease Activity and Severity Index; GC = glucocorticoid; IFNGS = interferon gene signature; N = number of patients; PGA = Physician’s Global Assessment; SD = standard deviation; SDI = ; SLE = Systemic lupus erythematosus; SLEDAI-2K = Systemic Lupus Erythematosus Disease Activity Index 2000.
aRace data were missing from 16 patients in the TULIP-2 trial (8 each in the anifrolumab and placebo groups).
bJoint counts are based on 28 joints.
cGlucocorticoid contains prednisone or equivalent.
dAzathioprine, methotrexate, mycophenolate mofetil, mycophenolic acid, and mizoribine.
Source: Reprinted by Permission of SAGE Publications.88
Outcomes
In the pooled analysis flares were characterized as at least 1 new A or at least 2 new B scores on the BILAG-2004 versus the prior visit. The pooled analysis aimed to evaluate the effects of anifrolumab on flares during the TULIP-1 and TULIP-2 trials, including numbers of flares per patient, annualized flare rates, time to first flare and time spent flare free, flares in individual organ domains, flares within organ domains not affected at baseline, and flares in the subset of patients who were able to achieve sustained oral glucocorticoid taper. A sustained taper included patients who received at least 10 mg/d of oral glucocorticoids at baseline who achieved a dose reduction to 7.5 mg/d or lower by week 40 and maintained this reduction through week 52.
Statistical Analysis
Annualized flare rate was analyzed using a negative binomial regression model, in which the response variable was the number of flares up to week 52 or the discontinuation visit. The independent variables in the model included treatment groups and stratification factors including the SLEDAI-2K score at screening (< 10 points versus ≥ 10 points), OCS usage at baseline (≥ 10 mg/day versus < 10 mg/day of prednisone or equivalent), and the result of the interferon test at screening (positive versus negative). The model was adjusted for variations in exposure time. Time to first flare was evaluated using a Cox regression analysis, with treatment groups, stratification factors, and study as covariates. Responder rates, percentages, differences, and associated 95% confidence intervals were weighted and calculated using a stratified Cochran-Mantel-Haenszel approach with strata corresponding to the stratification factors used for randomization and an additional stratification factor for study in pooled data. Additional factors for study and study-by-treatment interactions were also included in the analysis of pooled data. Flare rates were determined in the subset of patients who attained a BICLA response, as opposed to using the primary response end point for each trial (i.e., SRI-4 in the TULIP-1 trial). For this subset analysis, TULIP-1 data were classified as responders/nonresponders according to the TULIP-2 revised restricted medication analytical rules to ensure that any patient taking an NSAID was not deemed a nonresponder. As these post hoc analyses were exploratory, there was no control for multiplicity and a significance level was not specified.
Patient Disposition
There were 726 patients in the TULIP-1 and TULIP-2 studies combined with 366 patients in the placebo group (n = 184 in the TULIP-1 trial and n = 182 in the TULIP-2 trial) and 360 patients anifrolumab 300 mg/d group (n = 180 in each trial).
Exposure to Study Treatments
Exposure to study treatments was not examined in the pooled analysis.
Efficacy
Annualized Flare Rates, Total Number of Flares, and Time to First Flare
When comparing anifrolumab (n = 360) to placebo (n = 366) in the pooled data, the rate ratio (95% CI) of flares assessed using the BILAG-2004 scoring method was 0.75 (0.60 to 0.95) (Figure 9). Similar results were observed when flares were assessed using the modified flare analysis. The median time to first flare, assessed using the BILAG-2004 scoring method with standard flare analysis, was 140 days for patients receiving anifrolumab (range 24 to 376 days) versus 119 days for placebo (range 21 to 370 days) with a hazard ratio (95% CI) of 0.70 (0.55 to 0.89) (Figure 2).
Figure 9: Annualized Flare Rates Through Week 52 in TULIP-1, TULIP-2, and Pooled TULIP Dataa
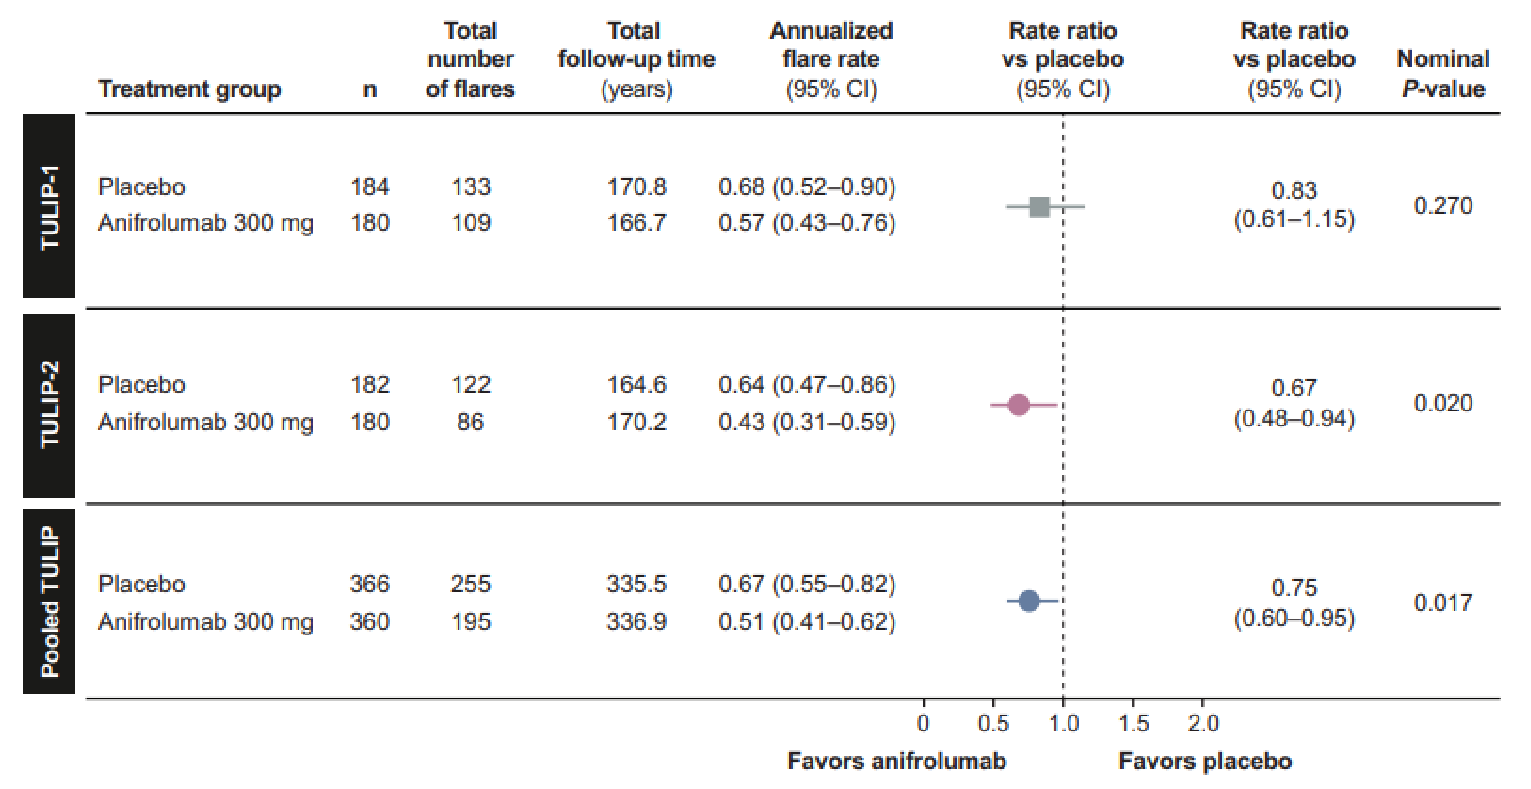
BILAG = British Isles Ludus Assessment Group: CI = confidence interval; N = number of patients.
a Flares were defined as > 1 new BILAG-2004 A or > 2 new BILAG-2004 B domain scores compared with the prior visit. Annualized flare rate was analyzed using a negative binomial regression model. The TULIP-1 flare rates presented here differ slightly from those reported in the primary TULIP-1 manuscript. owing to differences in the databases used for the analyses.
Source: Reprinted by permission of SAGE Publications.88
Figure 10: Time to First Flare in TULIP-1, TULIP-2, and Pooled TULIP Dataa
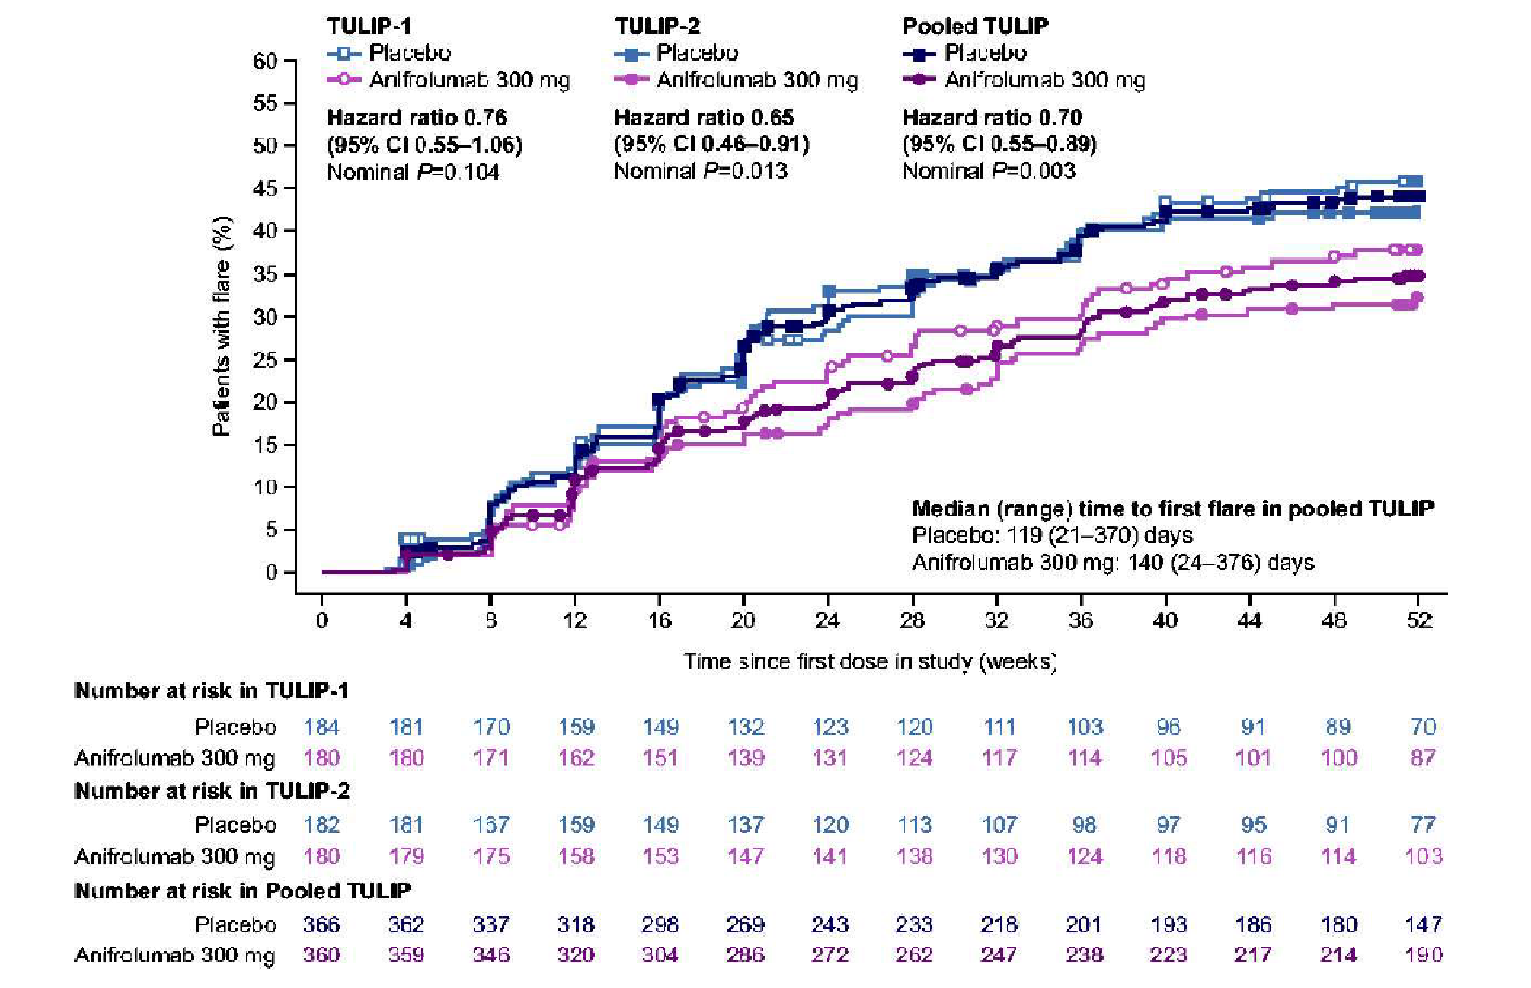
BILAG = British Isles Lupus Assessment Group; CI = confidence interval; N = number of patients.
Note: Flares were defined as 1 or more new BILAG- 2004 A or 2 or more new BILAG-2004 B domain scores compared with the prior visit. The time to flare is derived as date of first flare minus date of first administration of investigational product. If the patient did not have a flare, the time to flare is censored at the end of the flare exposure time. Time to first flare was evaluated using a Cox regression analysis.
Source: Reprinted by Permission of SAGE Publications.88
Flares per Patient and Flare Severity
In the pooled data, the proportion of patients that were flare free was 66.4% and 57.1% in each of the anifrolumab and placebo groups, respectively. The proportion of patients (95% CI) with > 1 flare was 33.6% in the anifrolumab group and 42.9% in the placebo groups, with a difference (95% CI) of −9.3 (−26.3 to −2.3). The proportion of patients with ≥ 3 flares was 5.3% in the anifrolumab group and 5.2% in the placebo group. Among IFNGS-high patients, 33.6% of patients had ≥ 1 flare with anifrolumab and 44.7% with placebo. In IFNGS-low patients, 33.9% of patients had ≥ 1 flare with anifrolumab and 34.4% with placebo.
Flares by Organ Domain
Flares were assessed in each of the 9 BILAG-2004 organ domains in the pooled TULIP population, with most flares occurring in the mucocutaneous (24.8%) and musculoskeletal (22.5%) domains. A total of 22.8% and 19.4% of patients in the anifrolumab group versus 26.8% and 25.4% in the placebo group has ≥ 1 flare in the mucocutaneous and musculoskeletal domains, respectively.
Flares and Oral Glucocorticoid Taper
Among patients with baseline oral glucocorticoid ≥ 10 mg/day, 50.5% (n = 96) achieved sustained oral glucocorticoid dose reduction to 7.5 mg/day with anifrolumab versus 31.8% (n = 36) with placebo. Among these patients with sustained oral glucocorticoid taper, 79.2% (n = 76) were flare free through week 52 with anifrolumab versus 54.2% (n = 32) with placebo. Patients who were not able to taper oral glucocorticoids, there was no difference in the percentage of patients who were flare free between the anifrolumab (50.0%, n = 47) and placebo group (48.4%, n = 61).
Flares and BICLA Response
A total of 78.9% and 69.6% of BICLA responders had no flares through week 52 in each of the pooled anifrolumab and placebo groups, respectively. The proportion of BICLA responders at week 52 (n = 283) with > 1 flare was 21.1% and 30.4% in each of the anifrolumab and placebo group, respectively. The mean (SD) annualized flare rate per patient was 0.29 (0.644) with anifrolumab versus 0.42 (0.721) with placebo. In BICLA nonresponders (n = 443), 45.0% had ≥ 1 flare through week 52 with anifrolumab compared to 48.4% with placebo. The mean (SD) the annualized flare rate per patient was 0.84 (1.158) with anifrolumab versus 0.42 (0.721) with placebo.
Critical Appraisal
Baseline data, inclusion and exclusion criteria, implementation approaches, and outcome measures were similar in the TULIP-1 and TULIP-2 trials, reducing the between-study heterogeneity. None of the P values were adjusted for multiplicity and the post hoc nature of the pooled analysis can be considered hypothesis-generating. The interpretation of results is also limited by the fact that neither of the individual trials were powered for analyses of flares within organ domains or in subgroups of patients able to taper glucocorticoids, limiting the ability to determine a true effect. In addition, the between-group difference was only conducted for the outcomes time to first flare, and annualized flare rates, hence it is unknow what is the incremental benefit of anifrolumab over placebo for the other outcomes, and whether the difference between treatment groups is clinically meaningful.
Pharmacoeconomic Review
Abbreviations
BIA
budget impact analysis
BSC
best supportive care
BICLA
British Isles lupus Assessment Group-based Composite Lupus Assessment
ICER
incremental cost-effectiveness ratio
OCS
oral corticosteroid
QALY
quality-adjusted life-year
SD
standard deviation
SLE
systemic lupus erythematosus
SLEDAI-2K
Systemic Lupus Erythematosus Disease Activity Index 2000
Executive Summary
The executive summary comprises 2 tables (Table 1 and Table 2) and a conclusion.
Item | Description |
|---|---|
Drug product | Anifrolumab (Saphnelo), solution for IV infusion, 150 mg/mL |
Submitted price | Anifrolumab: $1,687.21 per 300 mg single-dose vial |
Indication | In addition to standard therapy for the treatment of adult patients with active, autoantibody-positive SLE |
Health Canada approval status | NOC |
Health Canada review pathway | Standard review |
NOC date | November 30, 2021 |
Reimbursement request | In addition to standard therapy for patients with moderate to severe SLE (based on a SLEDAI-2K score ≥ 6) whose disease activity cannot be controlled despite an oral corticosteroid dose of ≥ 10 mg/day of prednisone or its equivalent |
Sponsor | AstraZeneca Canada Inc. |
Submission history | Previously reviewed: No |
NOC = Notice of Compliance; SLE = systemic lupus erythematosus; SLEDAI = Systemic Lupus Erythematosus Disease Activity Index.
Table 2: Summary of Economic Evaluation
Component | Description |
|---|---|
Type of economic evaluation | Cost-utility analysis Patient-level simulation |
Target population | Treatment of adult patients with active, autoantibody-positive SLE |
Treatment | Anifrolumab (300 mg every 4 weeks) plus BSC |
Comparator | BSC (antimalarials, oral corticosteroids, and immunosuppressants) |
Perspective | Canadian publicly funded health care payer |
Outcomes | QALYs, LYs |
Time horizon | Lifetime (80 years) |
Key data source | A pooled analysis from the TULIP-1 and TULIP-2 trials was used to compare anifrolumab plus BSC with BSC alone; data from the MUSE trial and Toronto Lupus Cohort were used to inform efficacy parameters regarding year 2 and beyond |
Submitted results | The ICER for anifrolumab plus BSC vs. BSC alone was $157,173 per QALY gained (incremental costs: $80,768; incremental QALYs: 0.51) For the reimbursement population (patients with moderate to severe SLE who are uncontrolled on oral corticosteroids), the ICER for anifrolumab plus BSC vs. BSC alone was $130,271 per QALY gained (incremental costs: $80,947; incremental QALYs: 0.62) |
Key limitations |
|
CADTH reanalysis results |
|
BSC = best supportive care; CLASI = Cutaneous Lupus Erythematosus Disease Area and Severity Index; ICER = incremental cost-effectiveness ratio; LY = life-year; QALY = quality-adjusted life-year; SLE = systemic lupus erythematosus; SLEDAI-2K = Systemic Lupus Erythematosus Disease Activity Index 2000.
Conclusions
Based on the CADTH clinical review, the addition of anifrolumab to best supportive care (BSC) for the treatment of active, autoantibody-positive SLE may improve British Isles lupus Assessment Group-based Composite Lupus Assessment (BICLA) scores and Systemic Lupus Erythematosus Disease Activity Index 2000 (SLEDAI-2K) response rates compared to BSC alone. However, the results were not consistent across the 2 trials conducted to evaluate anifrolumab (TULIP-1 and TULIP-2). This inconsistency increases uncertainty regarding the presence and magnitude of the clinical efficacy in the economic evaluation since the pooled results of the TULIP-1 and 2 trials were used. CADTH clinical reviewers also noted that the duration of the clinical trials was not sufficient to study the effects of anifrolumab on organ damage and survival.
CADTH was unable to address several important limitations associated with the model structure and clinical information. Notably, the sponsor’s model considered that only patients on anifrolumab could respond to treatment (assigning to this group an absolute rate of response), while patients in the BSC-alone group had their response during the first year considered to be 0. There was also a lack of face validity of some risk equations and a lack of face validity of the survival distribution. Furthermore, the extent to which the reduction in SLEDAI-2K scores can be extrapolated to provide meaningful survival benefits to patients is unclear. As such, CADTH was unable to derive a base-case estimate of the cost-effectiveness of anifrolumab in patients with active, autoantibody-positive systemic lupus erythematosus (SLE).
CADTH undertook scenario analysis, including adopting an alternate survival distribution, assuming treatment-efficacy waning, and adopting an alternate discontinuation rate. To account for the differences in conclusions from the TULIP trials, CADTH considered the pooled analysis (TULIP-1 plus TULIP-2 trials) and the TULIP-1 trial data only. Based on the pooled analysis, the incremental cost-effectiveness ratio (ICER) for anifrolumab plus BSC compared with BSC alone was $224,736 per quality-adjusted life-year (QALY). When considering only data from TULIP-1 trial, the ICER was $354,355 per QALY. A price reduction of 78% or 88% would be required to achieve a willingness-to-pay threshold of $50,000 per QALY, respectively. When considering the requested reimbursement population (patients with moderate to severe SLE whose disease activity cannot be controlled despite an oral corticosteroid [OCS] dosage higher than or equal to 10 mg/day), the results were similar.
Given the identified limitations and aspects that CADTH could not correct within the sponsor’s economic model, in addition to the inconsistency between the results of the TULIP trials, the cost-effectiveness of anifrolumab is uncertain and results should be considered in this context.
Stakeholder Input Relevant to the Economic Review
This section is a summary of the feedback received from the patient groups, registered clinicians, and drug plans that participated in the CADTH review process.
Patient input was received from 4 groups: Arthritis Consumer Experts, Lupus Canada, Lupus Ontario, and a joint patient input submission from the Canadian Arthritis Patient Alliance, Arthritis Society, and Canadian Skin Patient Alliance. All groups are either national or provincial nonprofit organizations dedicated to helping patients with rheumatologic or skin conditions, including patients with lupus. Input from these groups was based on national online surveys, a focus group, and an in-depth single-person interview. Patient input highlighted as key aspects of SLE the unpredictability of flares, the variability of symptoms from mild to debilitating, and the general impact of SLE on quality of life, stemming from a reduced ability to perform daily activities, maintain active social life, maintain work performance, and others. Patients also shared their concerns about the possibility of organ damage. Patients reported being treated with nonsteroidal anti-inflammatory drugs, antimalarial medications (e.g., hydroxychloroquine), corticosteroids (e.g., prednisone), immunomodulation drugs (e.g., methotrexate, mycophenolate mofetil), and belimumab. Patients reported that current therapies are associated with a range of side effects that are difficult to manage, such as allergic reactions, upset stomach, nausea, anxiety, headaches, tremors, and bone loss. Patients were seeking new treatments that can reduce fatigue, reduce the use of other medications (particularly corticosteroids), reduce flares, reduce disease symptoms, improve the overall quality of life, and allow for increased participation in activities of daily living, including work and school, and that can be easily administered. The inability to take time off from work for treatment infusions was a concern to some patients. No patients had experience with anifrolumab therapy.
Clinician input was received from 2 groups: 1 from the Toronto Lupus Program, University of Toronto, and 1 from the Canadian Network for Improved Outcomes for Systemic Lupus Erythematosus. Clinicians highlighted the relapsing-remitting nature of SLE, which can be associated with a myriad of symptoms and manifestations and often leads to organ damage and death. Clinician’s concerns regarding significant irreversible damage in multiple organs associated with the SLE treatments, particularly corticosteroids, were aligned with concerns raised by patients. The clinician input noted that currently used immunosuppressive drugs frequently fail to induce a complete remission or do so only after prolonged exposure. Clinicians reported that improving patients’ quality of life, reducing the risk for subsequent flares, and increasing remission rates while minimizing the use of corticosteroids and the risk of adverse events were the main expectations for treatment. They also noted that reducing mortality and hospital admissions, improving patients’ productivity, and reducing the burden on health costs, are also valuable.
Drug plan input considered whether anifrolumab could be used outside of the specific requested reimbursement population, and the possibility of concomitant use of anifrolumab with rituximab and belimumab. It was also noted that patients would need access to specialists and infusion centres, requiring some patients to travel, and that treatment with anifrolumab could lead to additional treatments (e.g., vaccinations before initiating treatment or risk of infection requiring treatment). Finally, the drug plan considered the need for clarification regarding the definition of loss of response, and the frequency of response assessment.
Two of these concerns were addressed in the sponsor’s model:
The sponsor used QALYs, a measure that incorporates quality and length of life as main outcomes, in the economic evaluation.
The sponsor included flares, reductions in corticosteroid dose, and organ damage as key events or outcomes in the submitted model.
CADTH was unable to address the following concerns raised in stakeholder input:
Several issues identified by the drug plan could not be addressed by CADTH but were noted as issues for consideration.
Because the sponsor’s economic evaluation did not include a societal perspective analysis, concerns about the impact of SLE on productivity and out-of-pocket costs (e.g., travel to infusion centres) were not addressed.
Economic Review
The current review is for anifrolumab (Saphnelo) in addition to standard-of-care therapy, for adult patients with active, autoantibody-positive SLE.1
Economic Evaluation
Summary of Sponsor’s Economic Evaluation
Overview
The sponsor submitted a cost-utility analysis of anifrolumab as add-on therapy to BSC in patients with active, autoantibody-positive SLE, compared with BSC alone.1 The modelled population comprised adult patients with active, autoantibody-positive SLE, which was aligned with the Health Canada indication.2 The sponsor also provided a scenario analysis for a reimbursement request population, which comprised patients with moderate to severe SLE (SLEDAI-2K score ≥ 6) whose disease activity cannot be controlled despite an OCS dosage of 10 mg/day or higher of prednisone or equivalent.
Anifrolumab is available as a single-dose vial, containing 300 mg of anifrolumab in a 2 mL concentrate solution. The recommended dose of anifrolumab is 300 mg, administered as an IV infusion over 30 minutes every 4 weeks.2 Anifrolumab is given as IV infusions by a health care professional, but administration costs were not included in the base-case analyses. At the sponsor’s submitted price of $1,687.21 per 300 mg per 2 mL single-dose vial, the annual cost of anifrolumab would be $21,934 if patients remained on therapy for a full year.
In its base case, the sponsor considered that BSC comprised antimalarials (e.g., hydroxychloroquine; 70.2% of patients), immunosuppressants such as methotrexate (17.8%), azathioprine (16.9%), and mycophenolate mofetil (13.6%), and OCSs such as prednisone. OCS dosage varied by treatment group, and it was adjusted yearly based on SLEDAI-2K score and the occurrence of severe and nonsevere flares. BSC therapies were assumed to be constant throughout the time horizon and the same proportion was maintained between treatment groups, with exception of OCS dosage. Of note, a different proportion of antimalarials and immunosuppressants was assigned for the reimbursement population analysis, although this was not adequately reported within the sponsor’s submission.
The annual costs for the treatments identified as part of BSC ranged from $37 for methotrexate to $110 for mycophenolate. Based on the sponsor’s assumptions about the proportion of patients receiving each treatment, the annual cost of BSC was $177.05 per patient.
Wastage was not considered for anifrolumab, as the recommended dose (300 mg) is aligned with the size of the single-dose vial. Wastage was also not considered for any medication elements of BSC as it included only oral treatments.
The clinical outcomes of interest were QALYs and life-years. The economic analysis was undertaken over a lifetime (80-year) time horizon from the perspective of the Canadian public health care payer. Discounting at 1.5% per year was applied to both costs and outcomes.
Model Structure
The sponsor submitted a patient-level simulation. The sponsor used a cycle length of 1 year. As such, patients could only experience a treatment response or other key events or outcomes at a single time point each year. The sponsor used a half-cycle correction in which patients who discontinued treatment by the end of each year were assigned the equivalent of a half year of treatment costs and benefits of adding anifrolumab.
In the first year, key events or outcomes were simulated using regression risk equations in the following order: anifrolumab treatment response, anifrolumab discontinuation, nonsevere flares, severe flares, change in SLEDAI-2K score, OCS use, organ damage, and mortality. For subsequent years, key events or outcomes were also simulated using regression risk equations in the following order: anifrolumab discontinuation, nonsevere flares, severe flares, change in SLEDAI-2K score, OCS use, organ damage, and mortality. The sponsor’s model structure is provided in Appendix 3 (Figure 1).
Patients entered the model and received either anifrolumab plus BSC or BSC alone. At the end of first year, patients receiving anifrolumab who achieve a response (≥ 4-point reduction in SLEDAI-2K total score from baseline, no discontinuation of investigational product, and no use of restricted medications beyond the protocol-allowed threshold) continued receiving this treatment until discontinuation for any cause or death, defined as a fixed annual rate. Patients who did not achieve a response to anifrolumab during the first year were moved to BSC treatment alone, which consisted of a weighted bucket of comparators. Patients who received BSC alone were not assessed for treatment response, as the sponsor assumed they would continue to receive treatment during the simulation regardless of disease activity.
Model Inputs
The baseline population characteristics used to inform the model were based on the pooled analysis of the TULIP-1 and TULIP-2 clinical trials. The mean age of patients in the trials was 41.9 and 40.6 years for females and males, respectively (standard deviation [SD] = 11.96 and 11.68, respectively), 92.8% of patients were female, and the mean SLEDAI-2K score at baseline was 11.5 (SD = 3.78).
At the end of year 1, patients receiving anifrolumab plus BSC could respond to treatment (percentage of response = 53.7%), while patients receiving BSC alone were assumed to not respond to treatment (percentage of response = 0%). The percentage of responders in the anifrolumab group was based on pooled data from the TULIP-1 and TULIP-2 trials. The response rate was determined based on patients’ baseline SLEDAI-2K scores. Patients could also experience key events or outcomes.
Number of nonsevere and severe flares, changes in SLEDAI-2K scores, and changes in OCS dosage for the first year were simulated using regression risk equations developed using data pooled from the TULIP-1 and TULIP-2 trials. These equations contained covariates including, but not limited to, baseline SLEDAI-2K scores and treatment response to the anifrolumab group (i.e., anifrolumab response and anifrolumab nonresponse).
The sponsor assumed that patients who responded to anifrolumab in the first year discontinued treatment at an annual rate of 13.9%, based on the 3-year MUSE phase II trial.3 Patients who discontinued anifrolumab received a half year of the treatment costs and half of the benefits, and moved onto the BSC-alone group, represented by a weighted bucket of all relevant treatments. For the base-case analysis, it was assumed that patients on anifrolumab group did not suffer treatment-efficacy waning over time as long as they were receiving anifrolumab.
Beyond the first year, key events and outcomes’ regression risk equations were modelled using data from the Toronto Lupus Cohort.
Incidence of organ damage was assessed for 12 organ systems using an accelerated failure time model derived from the Toronto Lupus Cohort. Potential predictors of organ damage were assessed using Cox regression models for each of the organ systems. The average mean SLEDAI-2K score was included in cardiovascular, renal, and skin models, and cumulative average OCS dose was included in cardiovascular, diabetes, musculoskeletal, neuropsychiatric, ocular, gonadal failure, and pulmonary models.
The risk of mortality was initially calculated by adjusting the increased risk of mortality associated with having SLE using standardized mortality ratios based on a study conducted in Canada.4 The risk of mortality was then calculated as a function of the demographic and disease characteristics, the disease activity including average mean SLEDAI-2K score and cumulative OCS dose, and organ damage (including SDI score, cardiovascular, renal, and peripheral vascular organ damage) using a risk equation based on data from the Toronto Lupus Cohort. This regression assumed that changes in SLEDAI-2K scores were directly linked to decreases in OCS doses, organ damage, and mortality. The mean age of patients in the Toronto Lupus Cohort’s analysis was 35 years, while the mean age of patients in the pooled data from the TULIP-1 and TULIP-2 trials was 41 years. The extrapolation of the survival curve was assumed to follow a log-logistic distribution, resulting in 1% of patients being alive after 70 years’ time horizon.
A linear regression model was developed for health-utility scores based on the pooled data from TULIP-1 and TULIP-2 trials, with utilities assigned yearly based on response to anifrolumab (for patients assigned to receive anifrolumab), mean SLEDAI-2K score, number of severe and nonsevere flares, and patient age and body mass index. In addition, a secondary equation was implemented such that health-utility scores decreased if a patient developed or had continuing organ damage.
The sponsor incorporated a variety of costs in the economic evaluation. Drug acquisition costs for anifrolumab were based on the sponsor’s submitted price, while BSC drug costs were derived from the Ontario Drug Benefit Formulary and CADTH.5 Dose regimens for BSC were informed by clinical feedback. Administration costs were not included in the base-case analysis as the sponsor assumed this service would be provided at no charge through the Patient Support Program. In addition, monitoring costs were also not included in the base-case analysis as the sponsor assumed there would not be additional monitoring costs based on clinical feedback. The incidence of adverse events was obtained from the pooled data from the TULIP-1, TULIP-2, and MUSE clinical trials, while costs were informed by the literature as relevant.6,7
Costs for disease management consisted of nonsevere and severe flares derived from a study conducted by Clarke et al.,8 and costs of organ damage were taken from Barber et al.9 In a scenario analysis, resource-use estimates were based on patient diaries collected during the TULIP-1 and TULIP-2 trials and costed using Ontario Schedule of Benefits.10
Summary of Sponsor’s Economic Evaluation Results
The sponsor submitted cost-effectiveness estimates based on both deterministic (25,000 patients) and probabilistic (1,000 iterations for the probabilistic base-case) analyses. The results of the deterministic analysis are distinct from those of the probabilistic analysis. The latter are presented in the following section.
Base-Case Results
The addition of anifrolumab to BSC was associated with a gain of 0.51 QALYs at an additional cost of $80,768 over the lifetime analysis period, resulting in an ICER of $157,173 compared with BSC alone in the probabilistic analysis. The deterministic analysis resulted in an ICER of $136,572 per QALY (0.61 incremental QALYs and $82,772 incremental costs). The sponsor reported that, compared with BSC alone, anifrolumab plus BSC was cost-effective at a willingness-to-pay threshold of $50,000 per QALY in 0% of iterations. Approximately 1% of patients are alive after a 70-year time horizon.
The submitted analysis is based on the publicly available prices of the comparator.
Table 3: Summary of the Sponsor’s Economic Evaluation Results for Health Canada Indication (Full Population)
Drug | Total costs ($) | Incremental costs ($) | Total QALYs | Incremental QALYs | ICER vs. BSC |
|---|---|---|---|---|---|
BSC alone | 135,350 | Reference | 11.34 | Reference | Reference |
Anifrolumab plus BSC | 216,118 | 80,768 | 11.85 | 0.51 | 157,173 |
BSC = best supportive care; ICER = incremental cost-effectiveness ratio; QALY = quality-adjusted life-year.
Sensitivity and Scenario Analysis Results
The sponsor conducted several sensitivity and scenario analyses. These included the analysis of the reimbursement request population (i.e., patients with moderate to severe SLE whose disease activity cannot be controlled despite an OCS dosage of 10 mg/day or higher of prednisone or equivalent), with results displayed in Table 4. For the reimbursement request population, the addition of anifrolumab to BSC was associated with a lower total cost and lower total QALYs in comparison with the base-case analysis. It resulted in an ICER of $130,271 per QALY gained.
In addition, the sponsor included analysis of varying discount rates (0% and 3%), using the BICLA outcome as a treatment response, using data from trials separately, including administration costs, assuming a linear waning of anifrolumab effect over 10 years, using alternative costing method for disease activity, and using data from the Johns Hopkins Cohort instead of the Toronto Lupus Cohort. In all scenarios, adding anifrolumab to BSC was not cost-effective at a willingness-to-pay threshold of $50,000.
Table 4: Summary of Sponsor’s Economic Evaluation Results for Reimbursement Population (Patients With Active SLE Whose Disease Activity Cannot be Controlled Despite a Dosage of ≥ 10 mg/day of Prednisone or Equivalent)
Drug | Total costs ($) | Incremental costs ($) | Total QALYs | Incremental QALYs | ICER vs. BSC |
|---|---|---|---|---|---|
BSC alone | 133,346 | Reference | 10.79 | Reference | Reference |
Anifrolumab plus BSC | 214,293 | 80,947 | 11.41 | 0.62 | 130,271 |
BSC = best supportive care; ICER = incremental cost-effectiveness ratio; QALY = quality-adjusted life-year.
CADTH Appraisal of the Sponsor’s Economic Evaluation
CADTH identified several key limitations to the sponsor’s analysis that have notable implications on the economic analysis:
Inconsistency and uncertainty are associated with the overall clinical benefit of anifrolumab. The CADTH critical appraisal of the clinical trial evidence highlighted inconsistency and uncertainty across the results from the TULIP-1 and TULIP-2 clinical trials.11 While the TULIP-2 trial resulted in a statistically significant improvement in the primary outcome (BICLA) and secondary outcome (SLEDAI-2K score) in the anifrolumab plus BSC group in comparison with BSC alone, the same findings were not observed in the TULIP-1 clinical trial. A greater percentage of patients had a Cutaneous Lupus Erythematosus Disease Area and Severity Index damage score of 10 or higher in the treatment arm compared to placebo in the TULIP-2 trial versus the TULIP-1 trial, which could allow for greater leaps in improvement in patients with more severe disease. The sponsor’s base case used a pooled analysis of the TULIP-1 and TULIP-2 trials.
CADTH conducted a separate analysis using only data from the TULIP-1 trial to explore the uncertainty of the clinical benefit.
The model structure does not appropriately capture the disease pathway. To estimate the cost-effectiveness of anifrolumab plus BSC compared to BSC alone, the sponsor used a patient-level simulation in which patients were at risk of experiencing key events. Although the structure presented by the sponsor considered certain key events in the disease pathway, clinical expert feedback indicated that the structure was not representative of the relapsing-remitting nature of SLE. The model also used several interconnected risk equations to determine patients’ outcomes while moving through the key events. This resulted in an inflexible model structure, generating a cascade of successive limitations presented throughout CADTH’s appraisal.
In addition, according to clinical expert feedback elicited for this review, an improvement in SLEDAI-2K score needs to occur in patients with active disease before having another period of active disease (i.e., flare). The event “change in SLEDAI-2K score” would therefore have to be simulated before occurrence of severe and nonsevere flares, and the occurrence of subsequent flares would be conditional on improvement from the first flare.
CADTH was unable to explore the implications of changing the order of key events or outcomes due to the inability to change the model structure provided by the sponsor.
Clinical evidence was inappropriately incorporated. In the model provided by the sponsor, patients would go through a set of key events including response to anifrolumab in the first year, which was representative of when response was assessed in the TULIP-1 and TULIP-2 trials. Individuals receiving BSC treatment alone were not differentiated by response status as they were assumed to continue treatment throughout the model simulation regardless of their disease activity and assumed not to respond at any point during the model. However, the response to anifrolumab treatment was modelled as an absolute response (i.e., a 53% response in patients receiving anifrolumab plus BSC). This approach was considered to be methodologically inappropriate given the sponsor’s model structure.
The sponsor’s application of the response rate overestimates the clinical benefit measured using the SLEDAI-2K score in the anifrolumab group, affecting the calculation of OCS dosage, number of flares, incidence of organ damage, and mortality, which were modelled using results derived from a regression model of change in SLEDAI-2K score.
In addition, no direct survival benefit from anifrolumab was demonstrated in the current trials. Most of the incremental benefit of anifrolumab therapy (measured using SLEDAI-2K scores) was accrued between 3 and 10 years after treatment with anifrolumab began based on visual inspection from SLEDAI-2K curves (Figure 3). However, the actual benefit of anifrolumab after 3 years of therapy is highly uncertain and, based on the previous points, overestimated by the risk equations.
CADTH was unable to fully address this limitation. The model submitted to CADTH used a series of interconnected risk equations and other parameters such as discontinuation rate that relied on the absolute number of patients who responded to anifrolumab. CADTH was unable to alter the model to allow for an evaluation of the impact of modelling the BSC-alone response status without the model providing results that did not meet face validity.
Utility inputs were overestimated, favouring anifrolumab. The health-utility scores were calculated using a regression model in which distinct values were generated for patients who responded to anifrolumab, did not respond to anifrolumab, and were receiving BSC therapy alone (patients receiving BSC therapy alone were not distinguished by response status). This regression model resulted in a utility score for the BSC-alone group that was closer to those of patients who did not respond to treatment with anifrolumab. This modelling approach overestimated the utility scores accrued by the anifrolumab plus BSC group in comparison with BSC alone.
CADTH was unable to address this limitation. The lack of distinction between respondents and nonrespondents in the BSC treatment group in health-utility regression favoured the accumulated health benefit of anifrolumab plus BSC by a factor of approximately 1.5 in the first year, based on a simple decision-tree analysis (Table 14).
Regression equations developed by the sponsor lack face validity. The model provided by the sponsor relied on several regression risk equations to simulate key events and outcomes. In the linear regression model for OCS use in the first year, an increase in the number of nonsevere flares resulted in a reduction of the dosage of OCS. This relationship was demonstrated by a negative coefficient for nonsevere flares in the regression equation, which suggested a lack of face validity.
In addition, the linear regression model for “SLEDAI-2K score changes” for the second year and beyond resulted in a consistent drop in SLEDAI-2K mean scores over time (irrespective of the number of flares) due to a high negative coefficient for mean SLEDAI-2K scores in the previous year. This means that the simulation allowed patients to continue to receive anifrolumab and accrue its benefits for a significant period of time even when clinical outcomes such as flares were simulated to be substantially worsening over time.
CADTH was unable to address the limitation regarding the lack of validity of the equations submitted by the sponsor.
Survival estimates lack face validity. The model estimated the cost-effectiveness of anifrolumab using a lifetime horizon (maximum of 80 years) for a cohort of patients with a mean age of 41 years (SD = 11.96; 95% confidence interval, 18 to 66 years). The survival curve was assumed to have a log-logistic distribution, resulting in approximately 1% of patients still being alive after a time horizon of 70 years, and 59% after a time horizon of 20 years. However, reports from the literature suggested that the 20-year survival rate for patients with SLE is 86%.12
In addition, the submitted model estimates gains of 0.66 and 0.84 additional life-years for the full population and reimbursement population, respectively. However, there is no robust evidence that anifrolumab reduces mortality for patients with SLE.
Due to the model structure, CADTH could not fully address this limitation. A scenario analysis using exponential distribution for mortality was conducted, which better reflected the lack of estimates regarding the benefit in survival from anifrolumab and better aligned with reports from literature regarding the 20-year survival for patients with SLE. The results of this exploratory analysis should be considered with caution as they still favour the intervention group.
Discontinuation rate is associated with uncertainty. After the first year, the response of patients to treatment is no longer simulated and the sponsor assumed that patients on anifrolumab discontinued at a rate of 13.9% annually based on data from the MUSE trial alone.3 The discontinuation rate in the pooled analysis of TULIP trials showed a higher discontinuation rate (17.2%, ranging from 15% to 19.4%).
CADTH addressed this limitation by exploring a scenario analysis in which the discontinuation rate was 17.2% based on the pooled analysis of the TULIP trials.
The sponsor assumed patients maintain treatment effect indefinitely. The sponsor assumed that patients receiving anifrolumab plus BSC would stay on treatment and continue to maintain benefit for the duration of treatment (i.e., no waning of treatment effect). According to the clinical experts consulted for this review, the treatment effect is expected to begin waning after 5 years.
CADTH addressed this limitation by exploring a scenario analysis in which the treatment’s effect would begin waning after 5 years.
Parameter uncertainty was inappropriately incorporated. A normal distribution was assumed as part of the probabilistic sensitivity analysis calculations for parameters that are not normally distributed (e.g., costs, specifically flare costs and organ damage costs). Furthermore, for a health-utility score risk equation, the sponsor arbitrarily incorporated uncertainty as all covariates were assumed to be normally distributed, which does not adequately reflect the uncertainty for these parameters.
CADTH was unable to address this limitation due to a lack of information about the true uncertainty of these parameters, and structural limitations within the model.
The sponsor’s economic evaluation programming lacks transparency, flexibility, and face validity. The model provided by the sponsor contained several inputs that were not relevant and unused in the current analysis (e.g., treatment odds ratio, flares odds ratio, indirect comparison, and placeholder data). Furthermore, certain values in the model were overwritten by the VBA code. These parameters had poor or no description of their use or origin.
Several key model inputs were only coded in the VBA scripts and were not accessible from the workbook, including, but not limited to, treatment-effect waning.
Due to the way the model was developed and presented, using interconnected regression risk equations and few inputs in the workbook, the CADTH was unable to validate many parts of the model.
CADTH was unable to address these deficiencies and cautions that results from the submitted economic model could not be fully validated.
Additionally, the following key assumptions made by the sponsor were appraised by CADTH (Table 5).
Table 5: Key Assumptions of the Submitted Economic Evaluation (Not Noted as Limitations to the Submission)
Sponsor’s key assumption | CADTH comment |
|---|---|
The mix of antimalarials and immunosuppressants was held constant for the entire time horizon of the simulation. | Uncertain. The composition and dosage of standard therapy would be determined on an individual patient basis and depends on patient responses to therapy and adverse reactions. However, given the relatively low impact that change in standard therapy would have on overall costs, the impact of this assumption on the ICER is likely small. |
This mix of therapy was assumed to be the same for patients regardless of whether anifrolumab treatment was used. | Uncertain. As stated, the composition and dosage of standard therapy would be determined on an individual patient basis, which can be influenced by adding anifrolumab as part of the treatment regimen. However, given the relatively low impact that reduction in standard therapy would have on overall costs, the impact of this assumption on the ICER is likely small. |
The sponsor used real-world data from the TLC to develop risk equations for years 2 and beyond. A total of 1,255 patients out of the 2,086 enrolled in the TLC were included in this analysis. The inclusion criteria were patients older than 18 years, diagnosed with SLE, with more than 24 months of follow-up, and no active severe lupus nephritis, central nervous system lupus, or history of dialysis or kidney transplant. | Uncertain. The TLC population was not limited to SLEDAI-2K scores higher than 6, as per targeted population included in the trials. CADTH is not able to assess the impact of limiting the patient population would have in the development of risk equations. |
There were differences among key baseline characteristics between the population included in the TLC analysis and the population enrolled in the TULIP trials, including the mean SLEDAI-2K scores at baseline (||| vs. a range of 11.3 to 11.5 in the TLC and TULIP populations, respectively), mean SDI global score (|||| vs. a range of 0.5 to 0.7 in TLC and TULIP population, respectively), mean OCS dose (|||| mg vs. a range of 8.3 to 10.7 mg in the TLC and TULIP populations, respectively), and proportion of patients receiving OCS at baseline (||||% vs. 82% in the TLC and TULIP populations, respectively). | Uncertain. The differences among key baseline characteristics between the population included in the TLC analysis and the population enrolled in the TULIP trials may affect the generalizability of TLC’s analysis to the target population. |
BSC = best supportive care; ICER = incremental cost-effectiveness ratio; SLEDAI-2K = Systemic Lupus Erythematosus Disease Activity Index 2000; OCS = oral corticosteroid; SLE = systemic lupus erythematosus; TLC = Toronto Lupus Cohort; vs. = versus.
CADTH Reanalyses of the Economic Evaluation
Base-Case Results
Due to the limitations with the validation of the model and inability to change key events/outcomes and parameter inputs, CADTH could not determine a base-case estimate of the cost-effectiveness of anifrolumab as an add-on therapy to BSC in adult patients with active, autoantibody-positive SLE.
CADTH undertook a series of scenario analyses to assess the impact of several parameters on the results. The reanalysis (Table 6), includes a treatment-waning assumption, alternative discontinuation rate, and alternative survival distribution. Results were reported for the pooled data of the TULIP-1 and 2 trials and the TULIP-1 trial only, given the differences in clinical findings.
Table 6: CADTH Scenario Analyses
Scenario analysis | Sponsor’s value or assumption | CADTH value or assumption |
|---|---|---|
Changes to derive the CADTH analysis | ||
1. Waning of treatment effect | Persistent effect (no waning) | Based on consultation with clinical expert, waning of treatment effect begins after 5 years of treatment |
2. Discontinuation rate | Based on MUSE trial (13.9%)3 | Based on pooled analysis of TULIP trials for anifrolumab arm (17.2%) |
3. Mortality distribution | Log-logistic | Exponential |
4. Source of clinical data | Pooled analysis of TULIP-1 and 2 trials | TULIP-1 only |
5. CADTH analysis — pooled data from TULIP-1 and TULIP-2 trials (1 + 2 + 3) | — | — |
6. CADTH analysis — TULIP-1 trial only (1 + 2 + 3 + 4) | — | — |
The individual scenario analyses are presented in Table 7. These analyses were considered in combination with the pooled analysis of the TULIP-1 and TULIP-2 trials and data from the TULIP-1 trial only. When considering a combined analysis (including assuming treatment-waning, alternative discontinuation rate, and alternative survival distribution — scenarios 1 + 2 + 3) using the pooled analysis of TULIP trials, the ICER was $224,736 per QALY for anifrolumab plus BSC compared with BSC alone. Alternatively, when using the results of TULIP-1 trial only, the ICER for anifrolumab plus BSC was $354,355 per QALY. The main drivers for the change in the ICER were assuming treatment-waning and using data from the TULIP-1 trial only.
Similar results were found for the reimbursement population. The ICER for anifrolumab plus BSC was $181,708 per QALY compared with BSC when considering the pooled results of TULIP, and $348,887 per QALY when considering TULIP-1 trial alone.
The probability of anifrolumab plus BSC being cost-effective at a willingness-to-pay threshold of $50,000 per QALY was 0%, regardless of which clinical dataset was used, and in both populations.
CADTH conducted price-reduction analyses for both datasets and populations (Table 8). Based on CADTH analyses, a price reduction of at least 79% is necessary to achieve cost-effectiveness at a willingness-to-pay threshold of $50,000 per QALY considering the pooled TULIP trials, or 88% based on TULIP-1 alone. The results were similar when considering the requested reimbursement population, with price reductions of 74% or 88%, respectively, based on pooled data from the both TULIP trials or from TULIP-1 only.
Table 7: Summary of Scenario Analysis Results (Probabilistic Analysis)
Stepped analysis | Drug | Full populationa | Reimbursement populationb | ||||
|---|---|---|---|---|---|---|---|
Total costs ($) | Total QALYs | ICER | Total costs ($) | Total QALYs | ICER | ||
Sponsor’s base case | BSC alone | 135,350 | 11.34 | Reference | 133,346 | 10.79 | Reference |
Anifrolumab + BSC | 216,118 | 11.85 | 157,173 | 214,293 | 11.41 | 130,271 | |
CADTH Scenario analysis 1: Include treatment-waning effect | BSC alone | 135,350 | 11.34 | Reference | 133,346 | 10.79 | Reference |
Anifrolumab + BSC | 214,603 | 11.75 | 194,579 | 212,699 | 11.30 | 155,431 | |
CADTH Scenario analysis 2: Alternate discontinuation rate | BSC alone | 135,350 | 11.34 | Reference | 133,346 | 10.79 | Reference |
Anifrolumab + BSC | 206,793 | 11.80 | 154,823 | 204,737 | 11.36 | 126,420 | |
CADTH Scenario analysis 3: Alternative mortality distribution (exponential) | BSC alone | 158,227 | 12.85 | Reference | 158,295 | 12.40 | Reference |
Anifrolumab + BSC | 242,954 | 13.30 | 191,592 | 242,945 | 12.92 | 161,382 | |
CADTH Scenario analysis 4: Use of results of TULIP-1 trial only | BSC alone | 142,779 | 11.62 | Reference | 136,172 | 11.19 | Reference |
Anifrolumab + BSC | 220,428 | 12.02 | 195,536 | 213,716 | 11.60 | 188,896 | |
CADTH analysis – pooled TULIP trials data: Scenarios 1 + 2 + 3 | BSC alone | 158,227 | 12.85 | Reference | 158,295 | 12.40 | Reference |
Anifrolumab + BSC | 231,735 | 13.18 | 224,736 | 231,530 | 12.80 | 181,708 | |
CADTH analysis – TULIP-1 only: Scenarios 1 + 2 + 3 + 4 | BSC alone | 166,197 | 13.15 | Reference | 160,904 | 12.80 | Reference |
Anifrolumab + BSC | 236,815 | 13.35 | 354,355 | 231,461 | 13.00 | 348,887 | |
BSC = best supportive care; ICER = incremental cost-effectiveness ratio; QALY = quality-adjusted life-year.
aFull population (active, autoantibody-positive SLE).
bReimbursement population (moderate to severe SLE patients (based on SLEDAI-2K score ≥ 6) whose disease activity cannot be controlled despite an OCS dosage of ≥ 10 mg per day of prednisone or equivalent).
Table 8: CADTH Price-Reduction Analyses
Analysis | ICERs for anifrolumab plus BSC vs. BSC ($ per QALY) | |||||
|---|---|---|---|---|---|---|
Full populationa | Reimbursement populationb | |||||
Price reduction | Sponsor base case | CADTH reanalysis (pooled TULIP) | CADTH reanalysis (TULIP-1) | Sponsor base case | CADTH reanalysis (pooled TULIP) | CADTH reanalysis (TULIP-1) |
No price reduction | 157,173 | 224,736 | 354,355 | 130,559 | 181,708 | 348,887 |
10% | 142,008 | 202,482 | 320,191 | 118,162 | 163,840 | 318,595 |
20% | 126,850 | 180,238 | 285,544 | 105,766 | 146,001 | 284,405 |
30% | 111,691 | 157,994 | 250,896 | 93,369 | 128,162 | 250,215 |
40% | 96,532 | 135,751 | 216,249 | 80,972 | 110,323 | 216,025 |
50% | 81,374 | 113,507 | 181,601 | 68,575 | 92,483 | 181,835 |
60% | 66,215 | 91,262 | 146,954 | 56,179 | 74,644 | 147,645 |
70% | 51,057 | 69,018 | 112,306 | 43,782 | 56,804 | 113,445 |
80% | 35,898 | 46,774 | 77,659 | 31,385 | 38,965 | 79,265 |
90% | 20,739 | 24,530 | 43,011 | 18,988 | 21,126 | 45,075 |
100% | 5,581 | 2,287 | 8,363 | 6,591 | 3,287 | 10,885 |
BSC = best standard of care; ICER = incremental cost-effectiveness ratio; QALY = quality-adjusted life-year.
aFull population (active, autoantibody-positive SLE).
bReimbursement population (moderate to severe SLE patients (based on SLEDAI-2K score ≥ 6) whose disease activity cannot be controlled despite an OCS dosage of ≥ 10 mg per day of prednisone or equivalent).
Issues for Consideration
Disparities in funding and treatment access may vary depending on the province or territory and the requirement for access to a centre where infusions can be performed may have equity-of-access implications, which were not fully considered in the economic submission.
Drug plans and clinical expert feedback noted that the prescription of anifrolumab requires assessment by a rheumatologist. Patients living in areas where there are no rheumatologists to assess patients’ eligibility and prescribe anifrolumab would incur a substantive out-of-pocket cost to travel to specialist appointments.
Anifrolumab is given as IV infusion by a health care professional, but administration costs were not included in the base-case analyses as the drug sponsor is assumed to provide this service for patients at no charge through the Patient Support Program.
Data from the TULIP long-term extension study were not incorporated in the sponsor’s pharmacoeconomic submission.
Overall Conclusions
Based on the CADTH clinical review, the addition of anifrolumab to BSC for the treatment of active, autoantibody-positive SLE may improve BICLA and SLEDAI-2K responses compared to BSC alone. However, those results were not consistent across the 2 trials conducted to evaluate anifrolumab (TULIP-1 and TULIP-2), generating uncertainty on the magnitude of the clinical benefit. Furthermore, CADTH clinical reviewers noted that the duration of the clinical trials was not sufficient to study the effects of anifrolumab on organ damage and survival.
CADTH could not address most of the major limitations due to the inflexibility of the model provided by the sponsor, including the use of absolute response to anifrolumab instead of relative response to BSC, lack of face validity of some risk equations, and lack of face validity of the survival distribution. A scenario analysis addressed few limitations in the sponsor’s submission, including adopting an alternate survival distribution, adopting an alternate assumption for waning of treatment effect, and adopting an alternate discontinuation rate. To account for differences in the results of TULIP-1 and TULIP-2 clinical trials, CADTH considered the pooled analysis (TULIP-1 plus TULIP-2 trials) and the TULIP-1 trial data only. Based on the pooled analysis, the ICER for anifrolumab plus BSC compared with BSC alone was $224,736 per QALY. When considering only data from TULIP-1 trial, the ICER was $354,355 per QALY. A price reduction of 78% or 88% would be required to achieve a willingness-to-pay threshold of $50,000 per QALY, respectively. When considering the requested reimbursement population (patients with moderate to severe SLE whose disease activity cannot be controlled despite an OCS dose), similar results were found for the reimbursement population: the ICER for anifrolumab plus BSC was $181,708 per QALY compared with BSC alone when considering the pooled results of TULIP-1 and TULIP-2 clinical trials, and $348,887 per QALY when considering the TULIP-1 trial only.
The submitted economic model does not adequately reflect the remitting-relapsing nature of the disease and as such the validity of the predicted gains in QALYs is questionable. Further, the sponsor’s model inappropriately characterized parameter uncertainty, and the impact of uncertainty on the cost-effectiveness of anifrolumab is therefore unknown.
Given the limitations within the clinical evidence — the inconsistency of results between TULIP-1 and TULIP-2 trials generating uncertainty regarding the magnitude of clinical benefit — it is unclear whether the predicted benefits of anifrolumab are likely to be realized. These factors, in addition to concerns with the model structure and inputs identified within this report, suggest that the cost-effectiveness of anifrolumab is highly uncertain.
References
1.Pharmacoeconomic evaluation [internal sponsor's report]. In: Drug Reimbursement Review sponsor submission: Saphnelo (anifrolumab), 150 mg/mL single dose, sterile vial solution for intravenous infusion. In: Mississauga (ON): AstraZeneca Canada Inc.; 2022 Feb 15.
2.Saphnelo (anifrolumab): 150 mg/mL single dose, sterile vial solution for intravenous infusion [product monograph]. In: Mississauga (ON): AstraZeneca Canada Inc.; 2021 Nov 30.
3.Furie R, Khamashta M, Merrill JT, et al. Anifrolumab, an Anti-Interferon-α Receptor Monoclonal Antibody, in Moderate-to-Severe Systemic Lupus Erythematosus. Arthritis Rheumatol. 2017;69(2):376-386. PubMed
4.Bernatsky S, Boivin JF, Joseph L, et al. Mortality in systemic lupus erythematosus. Arthritis Rheum. 2006;54(8):2550-2557. PubMed
5.Ontario Ministry of H, Ontario Ministry of Long-Term C. Ontario drug benefit formulary/comparative drug index. https://www.formulary.health.gov.on.ca/formulary/. Published 2022. Accessed 1800 Jan 1.
6.Drolet M, Zhou Z, Sauvageau C, et al. Effectiveness and cost-effectiveness of vaccination against herpes zoster in Canada: a modelling study. Can Med Assoc J. 2019;191(34):E932. PubMed
7.Atwood M, Beausoleil L, Breton MC, Laferriere C, Sato R, Weycker D. Cost-effectiveness of alternative strategies for use of 13-valent pneumococcal conjugate vaccine (PCV13) in Canadian adults. Can J Public Health. 2018;109(5-6):756-768. PubMed
8.Clarke AE, Urowitz MB, Monga N, Hanly JG. Costs associated with severe and nonsevere systemic lupus erythematosus in Canada. Arthritis Care Res (Hoboken). 2015;67(3):431-436. PubMed
9.Barber MRW, Hanly JG, Su L, et al. Economic Evaluation of Damage Accrual in an International Systemic Lupus Erythematosus Inception Cohort Using a Multistate Model Approach. Arthritis Care Res (Hoboken). 2020;72(12):1800-1808. PubMed
10.Schedule of benefits for physician services under the Health Insurance Act: effective October 1, 2021. In: Toronto (ON): Ontario Ministry of Health; 2021: https://www.health.gov.on.ca/en/pro/programs/ohip/sob/physserv/sob_master.pdf. Accessed 1800 Jan 1.
11.Drug Reimbursement Review clinical guidance report: ANIFROLUMAB (SAPHNELO) for active, autoantibody-positive, Systemic Lupus Erythematosus. In: Ottawa (ON): CADTH; 1800: URL. Accessed 1800 Jan 1.
12.Abu-Shakra M, Urowitz MB, Gladman DD, Gough J. Mortality studies in systemic lupus erythematosus. Results from a single center. I. Causes of death. J Rheumatol. 1995;22(7):1259-1264. PubMed
13.Table: 13-10-0114-01. Life expectancy and other elements of the life table, Canada, all provinces except Prince Edward Island. In: Ottawa (ON): Statistics Canada; 2022: https://www150.statcan.gc.ca/t1/tbl1/en/tv.action?pid=1310011401. Accessed 1800 Jan 1.
14.Budget Impact Analysis [internal sponsor's report]. In: Drug Reimbursement Review sponsor submission: Saphnelo (anifrolumab), 150 mg/mL single dose, sterile vial solution for intravenous infusion. In: Mississauga (ON): AstraZeneca Canada Inc.; 2022 Feb 15.
Appendix 1: Cost-Comparison Table
Note that this appendix has not been copy-edited.
The comparators presented in the following table have been deemed to be appropriate based on feedback from a clinical expert. Comparators may be recommended (appropriate) practice or actual practice. Existing product listing agreements are not reflected in the table and as such, the table may not represent the actual costs to public drug plans.
Table 9: CADTH Cost-Comparison for SLE
Treatment | Strength / concentration | Form | Price ($) | Recommended dosage | Daily cost ($) | Annual costa ($) |
|---|---|---|---|---|---|---|
Anifrolumab (Saphnelo) | 150 mg/mL | 2 mL single-dose vial solution for IV infusion | 1,687.21 per 300 mg | 300 mg once every 4 weeks | 30.26 | 21,934 |
Antimalarial drugs | ||||||
Hydroxychloroquine (Plaquenil, generic) | 200 mg | Oral tablet | 0.1576 | 200 mg to 400 mg daily | 0.16 to 0.32 | 57 to 115 |
Corticosteroids | ||||||
Prednisolone (generic) | 6.7 mg/5mL | Oral solution | 0.0900 per mL | ≤ 7.5 mL dailyc | Up to 0.50 | Up to 183 |
Immunosuppressants | ||||||
Azathioprine (generic) | 50 mg | Oral tablet | 0.2405 | 50 mg to 100 mg dailyc | 0.24 to 0.48 | 88 to 175 |
Methotrexate (generic) | 2.5 mg 10 mg/0.2 mL | Oral tablet Subcutaneous | 0.5027 29.6400 | 10 mg weeklyc | 0.29 4.23 | 105 1,545 |
Mycophenolate mofetil (Cellcept, generic) | 250 mg 500 mg | Capsule Oral tablet | 0.3712 0.7423 | 1.5 g to 2.0 g dailyc | 2.23 to 2.97 | 814 to 1,084 |
Note: All prices are from the Ontario Drug Benefit Formulary (accessed March 2022), unless otherwise indicated, and do not include dispensing fees.
aCost per 15-day course, state the duration of the course. Delete the term that no longer applies (i.e., “Course” or “Annual”).
bCalculation based on 70 kg.
Appendix 2: Submission Quality
Note that this appendix has not been copy-edited.
Description | Yes/No | Comments |
|---|---|---|
Population is relevant, with no critical intervention missing, and no relevant outcome missing | Yes | None |
Model has been adequately programmed and has sufficient face validity | No | Refer to the CADTH appraisal. |
Model structure is adequate for decision problem | No | Refer to the CADTH appraisal. |
Data incorporation into the model has been done adequately (e.g., parameters for probabilistic analysis) | No | Refer to the CADTH appraisal. |
Parameter and structural uncertainty were adequately assessed; analyses were adequate to inform the decision problem | Yes | None |
The submission was well organized and complete; the information was easy to locate (clear and transparent reporting; technical documentation available in enough details) | No | Refer to the CADTH appraisal. |
Appendix 3: Additional Information on the Submitted Economic Evaluation
Note that this appendix has not been copy-edited.
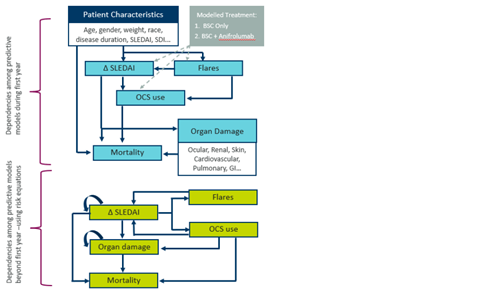
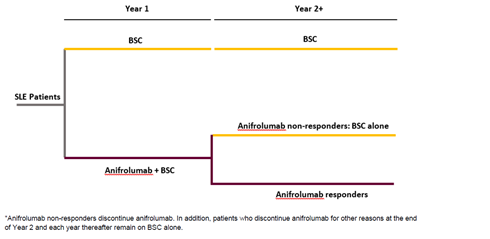
Detailed Results of the Sponsor’s Base Case
Table 11: Breakdown of Clinical Outcomes in the Sponsor’s Economic Evaluation Results at the End of the First Year (Deterministic Analysis)
Clinical benefit breakdown | Full populationa (base-case analysis) | Reimbursement populationb | ||||
|---|---|---|---|---|---|---|
Anifrolumab plus BSC | BSC alone | Incremental | Anifrolumab plus BSC | BSC alone | Incremental | |
Percent responders | 53.6% | 0% | 53.60% | 55.0% | 0.0% | 55.00% |
Mean change in SLEDAI-2K | −5.96 | −5.38 | −0.58 | −6.32 | −5.17 | −1.15 |
Percent experiencing a nonsevere flare | 67.8% | 72.8% | −5.00% | 66.8% | 71.4% | −4.50% |
Mean number of nonsevere flares | 1.39 | 1.59 | −0.2 | 1.36 | 1.55 | −0.19 |
Percent experiencing a severe flare | 36.8% | 46.4% | −9.60% | 38.8% | 53.2% | −14.40% |
Mean number of severe flares | 0.61 | 0.77 | −0.16 | 0.64 | 0.90 | −0.26 |
Mean OCS use (mg per day) | 7.66 | 7.97 | −0.31 | 11.09 | 11.84 | −0.75 |
BSC = best supportive care; mg = milligram; OCS = oral corticosteroid; SLEDAI-2K = Systemic Lupus Erythematosus Disease Activity Index 2000.
aFull population (active, autoantibody-positive SLE).
bReimbursement population (moderate to severe SLE patients (based on SLEDAI-2K score ≥ 6) whose disease activity cannot be controlled despite an OCS dosage of ≥ 10 mg per day of prednisone or equivalent).
Source: Adapted from sponsor’s pharmacoeconomic submission.1
Table 12: Breakdown of Clinical Outcomes in the Sponsor’s Economic Evaluation Results at the End of Time Horizon (Deterministic Analysis)
Clinical benefit breakdown | Full populationa | Reimbursement populationb | ||||
|---|---|---|---|---|---|---|
Anifrolumab plus BSC | BSC alone | Incremental | Anifrolumab plus BSC | BSC alone | Incremental | |
Mean OCS usage (mg) | 6.29 | 6.55 | −0.26 | 7.02 | 7.45 | −0.43 |
Average mean SLEDAI-2K score | 3.92 | 4.41 | −0.49 | 3.95 | 4.59 | −0.64 |
Proportion of patients with ocular damage | 30.3% | 29.4% | 0.91% | 30.6% | 29.6% | 0.97% |
Proportion of patients with neuropsychiatric damage | 17.6% | 17.3% | 0.35% | 18.0% | 17.7% | 0.27% |
Proportion of patients with renal damage | 7.0% | 7.5% | −0.49% | 6.9% | 7.6% | −0.68% |
Proportion of patients with pulmonary damage | 6.2% | 6.2% | −0.03% | 7.2% | 7.3% | −0.16% |
Proportion of patients with cardiovascular damage | 12.1% | 12.3% | −0.20% | 12.0% | 12.0% | 0.02% |
Proportion of patients with peripheral vascular damage | 9.5% | 9.2% | 0.30% | 9.3% | 8.9% | 0.44% |
Proportion of patients with gastrointestinal damage | 3.3% | 3.2% | 0.16% | 3.3% | 3.0% | 0.26% |
Proportion of patients with musculoskeletal damage | 21.6% | 21.2% | 0.38% | 23.4% | 23.1% | 0.34% |
Proportion of patients with skin damage | 10.8% | 11.5% | −0.76% | 10.9% | 12.0% | −1.09% |
Proportion of patients with premature gonadal failure | 3.0% | 2.8% | 0.16% | 3.0% | 3.0% | 0.06% |
Proportion of patients with diabetes | 4.4% | 4.2% | 0.19% | 4.4% | 4.2% | 0.24% |
Proportion of patients with malignancy | 9.4% | 9.0% | 0.35% | 9.1% | 8.7% | 0.39% |
BSC = best supportive care; mg = milligram; OCS = oral corticosteroid; SLEDAI-2K: Systemic Lupus Erythematosus Disease Activity Index.
aFull population (active, autoantibody-positive SLE).
bReimbursement population (moderate to severe SLE patients (based on SLEDAI-2K score ≥ 6) whose disease activity cannot be controlled despite an OCS dosage of ≥ 10 mg per day of prednisone or equivalent).
Source: adapted from sponsor’s pharmacoeconomic submission.1
Table 13: Disaggregated Summary of Sponsor’s Economic Evaluation Results (Deterministic Analysis)
Parameter | Full populationa | Reimbursement populationb | ||||
|---|---|---|---|---|---|---|
Anifrolumab plus BSC | BSC alone | Incremental | Anifrolumab plus BSC | BSC alone | Incremental | |
Discounted LYs | ||||||
End of first year | 0.967 | 0.964 | 0.002 | 0.664 | 0.631 | 0.033 |
Full time horizon (80 years) | 17.74 | 18.40 | 0.66 | 17.09 | 17.94 | 0.84 |
Discounted QALYs | ||||||
End of First year | 0.673 | 0.644 | 0.028 | 0.959 | 0.955 | 0.005 |
Full Time horizon (80 years) | 11.53 | 12.13 | 0.61 | 11.01 | 11.76 | 0.75 |
Discounted costs ($) | ||||||
Total (full time horizon) | $214,061 | $131,289 | $82,773 | $214,301 | $130,730 | $83,571 |
Anifrolumab | $80,208 | $0 | $80,208 | $80,776 | $0 | $80,776 |
BSC | $4,743 | $4,574 | $169 | $4,624 | $4,407 | $217 |
Administration | $0 | $0 | $0 | $0 | $0 | $0 |
Monitoring | $0 | $0 | $0 | $0 | $0 | $0 |
OCS | $174 | $175 | −$1 | $180 | $180 | $0 |
Flare | $34,640 | $35,050 | −$411 | $35,014 | $35,663 | -$649 |
Organ damage | $89,026 | $86,409 | $2,617 | $88,569 | $85,585 | $2,984 |
Adverse event | $5,270 | $5,081 | $189 | $5,138 | $4,895 | $243 |
ICER ($ per QALY) | — | 136,572 | — | 112,114 | ||
BSC = best supportive care; OCS = oral corticosteroid; LY = Life-Year; QALY = quality-adjusted life-years; SLE = systemic lupus erythematosus SLEDAI-2K = Systemic Lupus Erythematosus Disease Activity Index 2000.
aFull population (active, autoantibody-positive SLE).
bReimbursement population (moderate to severe SLE patients (based on SLEDAI-2K score ≥ 6) whose disease activity cannot be controlled despite an OCS dosage of ≥ 10 mg per day of prednisone or equivalent).
Source: adapted from sponsor’s pharmacoeconomic submission.1
Figure 3: Extrapolation Curve for Mean SLEDAI-2K Scores
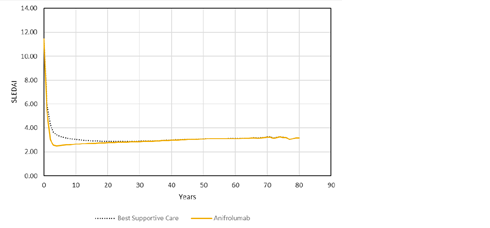
Source: Sponsor’s pharmacoeconomic submission.1
Appendix 4: Additional Details on the CADTH Reanalyses and Sensitivity Analyses of the Economic Evaluation
Note that this appendix has not been copy-edited.
Detailed Results of CADTH Base Case
Not applicable.
Health-Utility Calculation Considering Response for Best Supportive Care Group
The sponsor’s approach to calculate health-utility scores did not distinguish between respondents and nonrespondents in patients receiving BSC. This may have led to an overestimation of the utility scores accrued by anifrolumab plus BSC group in comparison with BSC alone. The results from this utility calculation approach (‘Approach 1’), are presented in Table 14. ‘Approach 1’ resulted in a difference of 0.014 between anifrolumab plus BSC and BSC alone utilities. The health-utility scores for each response status (i.e., anifrolumab – respondent, anifrolumab – nonrespondent, and BSC) for ‘Approach 1’ were derived from the regression equation provided by the sponsor assuming a patient with SLEDAI-2K score of 6, 2 severe and 2 nonsevere flares per year, 40 years of age, and body mass index of 30, using the pooled data from TULIP-1 and TULIP-2 trials.
A second approach (‘Approach 2’) considered separate response categories for the BSC treatment group. The same health-utility scores obtained for anifrolumab plus BSC respondents and nonrespondents from the ‘Approach 1’ regression equation were used to populate the response status of the BSC group (divided into respondents and nonrespondents). These results are also presented in Table 14. The ‘Approach 2’ resulted in a difference between groups of 0.009. This example shows that not distinguishing between response status in the BSC group alone led to overestimation of differences in health-utility scores among treatment groups, favouring anifrolumab plus BSC group by approximately 1.5 times in the first year.
Table 14: Simple Decision Tree Showing Distinct Approaches to Address Treatment Groups’ Responses
Treatment group | Health state | Probability (p)a | Utility score | (p) × utility | Total | Difference between groups |
|---|---|---|---|---|---|---|
Approach 1 (sponsor’s submission) | ||||||
Anifrolumab + BSC | Respondent | 0.528 | |||||| | |||||| | |||||| | — |
Nonrespondent | 0.472 | |||||| | |||||| | — | — | |
BSC alone | BSC | 1 | |||||| | |||||| | |||||| | ||||| |
Approach 2 (exploratory analysis) | ||||||
Anifrolumab + BSC | Respondent | 0.528 | |||||| | |||||| | |||||| | — |
Nonrespondent | 0.472 | |||||| | |||||| | — | — | |
BSC alone | Respondent | 0.415 | |||||| | |||||| | |||||| | ||||| |
Nonrespondent | 0.585 | |||||| | |||||| | — | — | |
BSC = best supportive care.
aProbabilities obtained from the pooled analysis from TULIP-1 and 2 trials.
Appendix 5: Submitted Budget Impact Analysis and CADTH Appraisal
Note that this appendix has not been copy-edited.
Table 15: Summary of Key Takeaways
Key takeaways of the budget impact analysis |
|---|
|
Summary of Sponsor’s Budget Impact Analysis
The submitted budget impact analysis (BIA) assessed the addition of anifrolumab to BSC for the treatment of adult patients with autoantibody-positive, active SLE.14 The sponsors also submitted a scenario analysis for the reimbursement population request which was defined as patients with moderate to severe SLE (based on SLEDAI-2K score ≥ 6), whose disease activity cannot be controlled despite an OCS dosage of ≥ 10 mg/day of prednisone or its equivalent.
The analysis was taken from the perspective of the public drug plans in Canada using a top-down epidemiology approach, with only drug costs considered. A scenario analysis considering a broader health care payer perspective included administration costs, adverse event costs, and costs associated with severe flares for anifrolumab and BSC. A 2-year time horizon was used, from the second quarter of 2023 to the first quarter of 2026, with second quarter 2022 to first quarter 2023 as a base year.
The eligible population was estimated based on data from Statistics Canada, adjusted for the Non-Insured Health Benefits Program, and further limited using epidemiology estimates from various sources including published literature, data from TULIP-1 and 2 clinical trials and Toronto Lupus Cohort, and sponsor’s internal data (Figure 4). Of note, the sponsor submitted 2 distinct patient population flows to identify the number of eligible patients, 1 for base-case analysis (i.e., full population) and 1 for reimbursement request (i.e., reimbursement population). The reimbursement request flow includes 2 extra steps, namely, proportion of patients with moderate to severe SLE, and proportion of patients receiving prednisone ≥ 10 mg/day (Figure 4).
The reference case scenario included a weighted bucket of comparators used in the pharmacoeconomic analysis, including antimalarials (i.e., hydroxychloroquine), immunosuppressants (i.e., azathioprine, methotrexate, mycophenolate), and corticosteroids (i.e., prednisone). The new drug scenario included anifrolumab along with these other comparators. The proportion of patients receiving each 1 of the comparators included in the BSC was estimated from TULIP-1 and 2 trials, the proportions were the same for anifrolumab plus BSC and BSC only, with exception of corticosteroids. Anifrolumab plus BSC market share estimates were based on sponsor’s internal estimates and understanding of the SLE market. Key inputs to the BIA are documented in Table 16.
Figure 4: Sponsor’s Estimation of the Size of the Eligible Population — Redacted

Figure 4 was redacted due to the presence of confidential information.
Source: Sponsor’s budget impact analysis technical report.14
Table 16: Summary of Key Model Parameters
Parameter | Sponsor’s estimate (reported as year 1 / year 2 / year 3 if appropriate) |
|---|---|
Target population | |
Number of patients eligible for drug under review in Canada for the full populationb | 8,154 / 8,276 / 8,400 |
Number of patients eligible for drug under review in Canada for reimbursement populationc scenario analysis | 3,309 / 3,359 / 3,409 |
Market uptake (3 years) | |
Uptake (reference scenario) | |
BSC only | 100% / 100% / 100% |
Uptake (new drug scenario) | |
Anifrolumab + BSC | |||% / |||% / |||% |
BSC only | ||||% / ||||% / ||||% |
Cost of treatment (per patient) | |
Cost of treatment over one year for base-case analysis | |
Anifrolumab + BSC | $22,274 |
BSC only | $290 |
Cost of treatment over one year for reimbursement request scenario analysis | |
Anifrolumab + BSC | $22,261 |
BSC only | $285 |
Additional health care cost per patienta | |
Anifrolumab + BSC | $5,532 |
BSC only | $5,857 |
BSC = best standard of care.
aIncluding administration, adverse event, and severe flare costs.
bFull population (active, autoantibody-positive SLE).
cReimbursement population (moderate to severe SLE patients (based on SLEDAI-2K score ≥ 6) whose disease activity cannot be controlled despite an OCS dosage of ≥ 10 mg per day of prednisone or equivalent).
Summary of the Sponsor’s Budget Impact Analysis Results
The sponsor’s estimated budget impact of funding anifrolumab for the treatment of adult patients with active, autoantibody-positive SLE using the drug program perspective was $2,687,486, $6,005,361, $9,289,393 for years 1, 2, and 3, respectively. The 3-year total was $17,982,240. Results were similar when considering a health care perspective, with the 3-year total at $17,716,151.
For the reimbursement request, the budget impact for years 1, 2, and 3 was $1,090,098, $2,445,707, $3,776,414, respectively. The 3-year total was $7,312,219 (or $7,203,959 from a health care payer perspective).
CADTH Appraisal of the Sponsor’s Budget Impact Analysis
CADTH identified several key limitations to the sponsor’s analysis that have notable implications on the results of the BIA:
The market uptake for anifrolumab may be underestimated. In their BIA, the sponsor estimated that |||% of patients would have anifrolumab prescribed in the first year. This assumption was based on internal estimates. According to the clinical experts consulted for this review, the expected uptake for anifrolumab is 5% in the first year, especially as there are no publicly funded active treatments for SLE. Clinical experts noted that some patients may be currently receiving rituximab or belimumab through private access and may switch if a publicly funded treatment became available.
CADTH changed the base case to address this limitation, with market uptake rates starting from 5% in the first year.
The proportion of patients receiving an OCS dosage equal or higher than 10mg/day is uncertain. The proportion of patients was estimated using data from the Toronto Lupus Cohort. The proportion used in the base case (||||%) represents the proportion of patients with SLEDAI-2K ≥ 6 (classified at the last visit) who were receiving an OCS dose equal or higher than 10mg/day during the last visit of follow-up. Only |||% of patients who had a SLEDAI-2K ≥ 6 at baseline, were still classified as SLEDAI-2K ≥ 6 at the last visit. The analysis revealed that |||% of patients received an OCS dose equal or higher than 10mg/day at any time during follow-up.
In a scenario analysis, CADTH explored the impact of the proportion of patients receiving an OCS dose equal or higher than 10mg/day to be |||%. This scenario analysis was only undertaken on the reimbursement request population, given the OCS use restrictions for that population.
Additional limitations were identified but were not considered to be key limitations. These limitations include the assumption that best standard care therapy costs would not change with the addition of anifrolumab, and the assumption that a different distribution of standard therapy for the reimbursement group.
BSC therapy costs were assumed to be equivalent in both the anifrolumab plus BSC and BSC-alone arms. The submitted BIA assumed that anifrolumab would be added to standard therapy and that standard therapy would remain the same in the presence and absence of anifrolumab (i.e., there would be no change in the cost of standard therapy). The clinical experts consulted by CADTH indicated that, for patients taking anifrolumab in addition to BSC, the composition and dosage of standard therapy would be determined on an individual patient basis. However, the annual cost of the BSC treatments is relatively low, and changes to the background treatments would not be expected to have a large impact on the estimated budget impact of reimbursing anifrolumab.
BSC therapy costs were considered to be different for the reimbursement group. The submitted BIA assumed that for the reimbursement group, the proportion of patients receiving each of the BSC therapies would differ from the full population. This assumption was not in line with the data presented for the economic model evaluation or justified in the current BIA. The rationale for the cost difference was not provided. As the sponsor’s submission lacked transparency, CADTH could not trace the difference. However, as stated, because the annual cost of the BSC treatments is relatively low, and changes to the background treatments would not be expected to have a large impact on the estimated budget impact of reimbursing anifrolumab.
CADTH Reanalyses of the Budget Impact Analysis
CADTH’s base-case analysis revised the market uptake, which was increase to 5, 7.5, and 10%. The base-case analysis is presented in Table 17.
Table 17: CADTH Revisions to the Submitted Budget Impact Analysis
Stepped analysis | Sponsor’s value or assumption | CADTH value or assumption |
|---|---|---|
Changes to derive the CADTH base case | ||
1. Market uptake | |||%, |||%, and |||% | 5%, 7.5%, and 10% |
CADTH base case | 1 | |
The results of the CADTH stepwise reanalysis are presented for both full population and reimbursement population in summary format in Table 18 and a more detailed breakdown is presented in Table 19.
Based on the BIA base case, the expected budget impact for funding anifrolumab for the treatment of active, autoantibody-positive, SLE in the drug program perspective is expected to be $8,958,286 in year 1, $9,410,166 in year 2, and $11,362,161 in year 3, with a 3-year budget impact of $29,730,614.
For the reimbursement population, the expected budged impact is expected to be $3,633,661 in year 1, $3,849,657 in year 2, and $4,636,881 in year 3, with a 3-year budget impact of $12,120,200.
Table 18: Summary of the CADTH Reanalyses of the Budget Impact Analysis
Stepped analysis | 3-year total | |
|---|---|---|
Full populationa | Reimbursement populationb | |
Submitted base case | $17,982,240 | $7,312,219 |
CADTH reanalysis 1: Market uptake (CADTH base case) | $29,730,614 | $12,120,200 |
aFull population (active, autoantibody-positive SLE).
bReimbursement population (moderate to severe SLE patients (based on SLEDAI-2K score ≥ 6) whose disease activity cannot be controlled despite an OCS dosage of ≥ 10 mg per day of prednisone or equivalent).
cOnly applicable to reimbursement population.
Table 19: Detailed Breakdown of the CADTH Reanalyses of the Budget Impact Analysis
Stepped analysis | Scenario | Year 0 (current situation) | Year 1 | Year 2 | Year 3 | 3-year total |
|---|---|---|---|---|---|---|
Full populationa | ||||||
Submitted base case | Reference | $2,465,851 | $2,502,425 | $2,539,579 | $2,577,326 | $7,619,330 |
New drug | $2,465,851 | $5,189,910 | $8,544,941 | $11,866,719 | $25,601,570 | |
Budget impact | $0 | $2,687,486 | $6,005,361 | $9,289,393 | $17,982,240 | |
CADTH base case: 5%, 7.5%, and 10% market uptake | Reference | $2,465,851 | $2,502,425 | $2,539,579 | $2,577,326 | $7,619,330 |
New drug | $2,465,851 | $11,460,711 | $11,949,746 | $13,939,487 | $37,349,943 | |
Budget impact | $0 | $8,958,286 | $9,410,166 | $11,362,161 | $29,730,614 | |
Reimbursement populationb | ||||||
Submitted base case | Reference | $997,407 | $1,012,185 | $1,027,199 | $1,042,450 | $3,081,835 |
New drug | $997,407 | $2,102,284 | $3,472,906 | $4,818,865 | $10,394,054 | |
Budget impact | $0 | $1,090,098 | $2,445,707 | $3,776,414 | $7,312,219 | |
CADTH base case: 5%, 7.5%, and 10% market uptake | Reference | $997,407 | $1,012,185 | $1,027,199 | $1,042,450 | $3,081,835 |
New drug | $997,407 | $4,645,847 | $4,876,856 | $5,679,332 | $15,202,034 | |
Budget impact | $0 | $3,633,661 | $3,849,657 | $4,636,881 | $12,120,200 | |
aFull population (active, autoantibody-positive SLE).
bReimbursement population (moderate to severe SLE patients (based on SLEDAI-2K score ≥ 6) whose disease activity cannot be controlled despite an OCS dosage of ≥ 10 mg per day of prednisone or equivalent).
CADTH also conducted additional scenario analyses to address remaining uncertainty, using the CADTH base case. Results are provided in Table 20.
Reduced the price of anifrolumab to the value in which it would be cost-effective at a $50,000 per QALY threshold using the pooled TULIP trials data (74% and 79% for full population and reimbursement population, respectively).
Reduced the price of anifrolumab to the value in which it would be cost-effective at a $50,000 per QALY threshold using TULIP-1 trial data only (88% for full population and reimbursement population).
Assuming 85% of patients had OCS dosage equal or higher than 10mg/day.
Results of CADTH’s scenario analyses demonstrate that the estimated budget impact is highly sensitive to the change in the proportion of patients receiving a dosage of OCS equal or higher than 10mg/day (49% increase, to $18,073,982 over 3 years for the reimbursement population, respectively)
Table 20: CADTH Scenario Analyses
Stepped analysis | Scenario | Year 0 (current situation) | Year 1 | Year 2 | Year 3 | 3-year total |
|---|---|---|---|---|---|---|
Full populationa | ||||||
CADTH scenario analysis 1: price-reduction scenario 5 (79%) | Reference | $2,465,851 | $2,502,425 | $2,539,579 | $2,577,326 | $7,619,330 |
New drug | $2,465,851 | $4,372,214 | $4,503,694 | $4,948,873 | $13,824,781 | |
Budget impact | $0 | $1,869,790 | $1,964,114 | $2,371,547 | $6,205,451 | |
CADTH scenario analysis 2: price-reduction scenario 6 (88%) | Reference | $2,465,851 | $2,502,425 | $2,539,579 | $2,577,326 | $7,619,330 |
New drug | $2,465,851 | $3,564,664 | $3,655,409 | $3,924,626 | $11,144,699 | |
Budget impact | $0 | $1,062,240 | $1,115,830 | $1,347,300 | $3,525,369 | |
Reimbursement populationb | ||||||
CADTH scenario analysis 1: price-reduction scenario 5 (74%) | Reference | $997,407 | $1,012,185 | $1,027,199 | $1,042,450 | $3,081,835 |
New drug | $997,407 | $1,951,127 | $2,021,957 | $2,240,633 | $6,213,718 | |
Budget impact | $0 | $938,942 | $994,759 | $1,198,183 | $3,131,883 | |
CADTH scenario analysis 2: price-reduction scenario 6 (88%) | Reference | $997,407 | $1,012,185 | $1,027,199 | $1,042,450 | $3,081,835 |
New drug | $997,407 | $1,441,315 | $1,481,841 | $1,590,069 | $4,513,225 | |
Budget impact | $0 | $429,130 | $454,643 | $547,618 | $1,431,391 | |
CADTH scenario analysis 3: proportion of patients with OCS dosage equal or higher than 10mg/day changed to 85% | Reference | $1,487,362 | $1,509,399 | $1,531,787 | $1,554,531 | $4,595,718 |
New drug | $1,487,362 | $6,928,017 | $7,272,504 | $8,469,179 | $22,669,700 | |
Budget impact | $0 | $5,418,618 | $5,740,717 | $6,914,648 | $18,073,982 | |
BIA = budget impact analysis; OCS = oral corticosteroid.
aFull population (active, autoantibody-positive, SLE).
bReimbursement population (moderate to severe SLE patients (based on SLEDAI-2K score ≥ 6) whose disease activity cannot be controlled despite an OCS dosage of ≥ 10 mg per day of prednisone or equivalent).
Stakeholder Input
Patient Input
Arthritis Consumer Experts
About Arthritis Consumer Experts
Canada’s largest, longest running national arthritis patient organization headquartered in Vancouver, BC, Arthritis Consumer Experts (ACE) provides free, science-based information and education programs in both official languages to people with arthritis. ACE serves people living with all forms of arthritis by helping them take control of their disease and improve their quality of life through education and (em)powerment. Founded and led by people with arthritis, ACE also advocates on arthritis health policy and provides research-based education through ACE’s JointHealth™ family of programs and the Arthritis Broadcast Network, directly to consumers/patients, media and government. ACE operates as a non-profit in a fully transparent manner and is guided by a strict set of guiding principles, set out by an advisory board comprised of leading scientists, medical professionals and informed arthritis consumers. Ultimately, we are guided by the needs of our members, who are people living with arthritis, and their caregivers.
Link to website: www.jointhealth.org
Information Gathering
The information was gathered from anonymous data collected from ACE’s 2021 National Survey on Virtual Care for People Living with Arthritis and from an in-depth interview with a female lupus patient.
Disease Experience
How does the disease impact the patients’ day-to-day life and quality of life?
Lupus is an unpredictable disease in which a person’s immune system produces an excess of proteins called antibodies that attach themselves to various structures in the body. The accumulation of these antibodies in the tissues can cause inflammation, damage and pain.
From ACE’s 2021 National Survey on Virtual Care for People Living with Arthritis:
A total of 34 people of all the survey respondents reported they were living with lupus. Eighty-eight per cent of lupus survey respondents were women. Nearly 47% had been living with lupus for over 15 years, while 34% were living with lupus for 5 years or less.
From a female patient living with lupus:
“I was diagnosed with lupus at 50 with acute renal failure due to nephritis. I was critically ill and my mother came out to help. I could not work. Lupus ‘retired’ me and forced me to give away my practice with more than 2000 patients. After I got off the ‘big’ meds, I had a giant identity crisis and became depressed.”
How does the disease impact the caregivers’ day-to-day life and quality of life?
From ACE’s 2021 National Survey on Virtual Care for People Living with Arthritis:
Patients reported challenges in managing the physical symptoms of lupus as it can be severe and debilitating, especially during disease episodes or flares. These physical symptoms also impact a patient’s mental health, relationships with family and friends, and work.
From a female patient living with lupus:
“My mother came out to help. My book group and other friends and neighbours rotated a meal to our family as they saw we needed. Extra help with childcare, driving, shopping, ironing, yard work, and handyman chores were appreciated. A friend’s ear is still the best therapy in the world. Partners need to be intimately honest (relationship-wise, sexually, emotionally) and figure out together what to do and what will work).”
Are there any aspects of the illness that are more important to control than others?
We have no information gathered for this question.
Experiences with Currently Available Treatments
How well are patients managing their disease/condition with currently available treatments?
From a female patient living with lupus:
“To manage my lupus, I began a treatment pathway that includes getting deliberated and regular exercise (yoga and tennis for me, but I started with walking), and having quiet time to consciously set goals. I also have my own book with questions, test results and current medications list to ensure I am prescribed the right medication and maintain good communication with my doctors.”
Improved Outcomes
We have no specific information collected for this specific question, though it is important to note that there are many unmet needs in terms of Health Canada-approved therapies to treat lupus.
Experience with Drug Under Review
From a female patient living with lupus:
The patient did not have experience with anifrolumab.
Companion Diagnostic Test
Not applicable to this submission.
Anything Else?
Arthritis Consumer Experts would like to add that the based on recent research studies reported by Arthritis Research Canada, the risk of premature death in systemic lupus erythematosus patients compared to the general population has not improved in recent years. Lupus is associated with significant premature mortality caused by kidney disease, infections, and cardiovascular disease. Other research found that one in five patients with SLE develop severe infections with 21% of those infections causing death. The increased risk of infection is thought to be a result of two factors. First, immune system dysfunction caused by SLE. Second, use of immunosuppressive medications and glucocorticoids. These medications inhibit the immune network and, therefore, decrease resistance to a wide variety of bacterial, viral, and fungal agents. New, safter therapies are very much needed to effectively treat lupus and improve morbidity and quality of life in people living with the disease.
Conflict of Interest Declaration — Arthritis Consumer Experts
Did you receive help from outside your patient group to complete this submission? If yes, please detail the help and who provided it.
This submission was summarized and written solely by the staff of Arthritis Consumer Experts, free from consultation, advice, influence, or financial support from any outside individual, group or company.
Did you receive help from outside your patient group to collect or analyze data used in this submission? If yes, please detail the help and who provided it.
No.
List any companies or organizations that have provided your group with financial payment over the past two years AND who may have direct or indirect interest in the drug under review.
We have not had any direct or indirect financial support from the manufacturer of the drug under review.
Table 1: Financial Disclosures for Arthritis Consumer Experts
Company | Check Appropriate Dollar Range | |||
|---|---|---|---|---|
$0 to 5,000 | $5,001 to 10,000 | $10,001 to 50,000 | In Excess of $50,000 | |
N/A | — | — | — | — |
Lupus Canada
About Lupus Canada
Lupus Canada is the only national organization focused on lupus research, advocacy, awareness and education in Canada. No other organization provides a bigger opportunity to make an impact on lupus and those who live with it. We are fiercely committed to improving the lives of people living with lupus, their families, and their loved ones by investing in the initiatives that bring us closer to dedicated treatments and, ultimately, a cure.
Lupus Canada firmly believes in the power of awareness and having an informed public – this is where exceptional and compassionate support begins. As the national organization dedicated to lupus awareness and support, one of our main missions is to increase public awareness and advocate on behalf of the lupus patient.
Lupus Canada is run by a talented, diverse, volunteer group of Board of Directors and three (3) employees. www.lupuscanada.org
Information Gathering
Lupus Canada developed an online survey to gather information directly from people living with lupus about their experiences with the disease. The survey was shared nationwide via email, social media and on the Lupus Canada website. One hundred and twelve (112) survey responses were received. The survey results were reviewed by Lupus Canada staff and three Directors on the Lupus Canada Board, one living with lupus. The survey included the collection of demographic data. Those who completed demographic data, 96.4% identified as female, and represented a range of ages from 16 to over 60 years of age.
Disease Experience
Imagine being in a constant state of fatigue with flu-like symptoms – this is lupus.
Lupus is a disease that often strikes during a person’s prime years – between 15 and 44 – when under normal circumstances one is focused on acquiring a good education and pursuing a rewarding career in her/his chosen discipline. Lupus interrupts life’s journey in a significant and long-lasting manner.
It is estimated that over 1 in 1000 Canadians are living with lupus today, a disease more common that leukemia, multiple sclerosis and muscular dystrophy combined. The disease can range from mild to life-threatening. 90% of the people with lupus are women, and 80% of them develop lupus between ages of 15 and 44. Lupus is more common among ethnic minorities and the poor.
Lupus is a chronic disease characterized by inflammation in one or more parts of the body. It is a complex and sometimes baffling condition that can target any organ in the body, in any individual, at any point in their lives. The cause remains unknown, and a cure does not exist. Few medications exist for the purpose of lupus treatment.
The body’s immune system produces antibodies to fight off viruses, bacteria, and germs (‘foreign invaders”, like the flu). Autoimmune means that the immune system cannot tell the difference between these “foreign invaders” and the body’s health tissues, and thereby creates auto antibodies that attack and destroy healthy tissues.
Chronic means that signs and symptoms tend to last longer than six weeks and often for many years. Lupus is very hard to diagnose because symptoms vary from person to person, can come and go over a long period of time, and can mimic symptoms of other illnesses.
Living with a chronic illness such as lupus can certainly be stressful on its own, but with the added burden of work, school and the pressures of family life people with lupus often experience flares – unpredictable bouts of increased disease activity resulting in symptoms such as debilitating fatigue, pain in muscles and joints, difficulty breathing or persistent headaches. For students a sudden flare can jeopardize academic standing as well as the ability to attain and maintain scholarships and financial aid. Many students are unable to maintain a part-time job because of lupus, thereby stretching their financial resources. For a lupus patient this can result in the inability to maintain full-time employment which then has a financial strain on their family.
With 35.7% of respondents to our nationwide survey experiencing 1 to 3 flares in the past 12 months the impact is substantial. People must deal with the unpredictability of flares which often makes it feel like a person is not in control of their disease.
Over 44% responded that lupus impacted their daily life, including the ability to care for themselves or their family.
23% of respondents had to be away from work for more than 25 days due to lupus with 47.7% of family members having to take time off work to help care for their loved one living with lupus.
The list of symptoms lupus patients experience is staggering; severe fatigue, weight gain, extreme headaches, hair loss, joint pain and swelling, sores in the mouth and nose and adverse reaction to sunlight to name only just a few.
In spite of its widespread nature, lupus is not an easily recognizable disease and remains incredibly under-diagnosed as it often presents itself uniquely in every individual. Instead of getting proper support, patients often suffer from debilitating symptoms while bouncing between treatments and physicians until finally, they are given the diagnosis. Even then, however, awareness and support are lacking.
The cause of lupus is unknown. Scientists believe that individuals are genetically predisposed to lupus, and that environmental factors “trigger” the symptoms. While lupus is a serious condition, in most cases it can be treated and controlled with appropriate and timely intervention. However, no cure has yet been found for this debilitating disease.
Diagnosis and treatment are improving, allowing people to live increasingly active and productive lives. However, due to the complexity of the disease, lupus remains under-funded and under-recognized and continues to be life-threatening and life altering.
Some direct quotes received from respondents are:
“How much lupus impacts our day to day, even if we look fine on the outside, we’re probably not feeling well at all making it difficult to do the simplest of tasks. And no, there is no cure, it does not get better, we need more comprehension no matter how well we may seem.”
“Even though we wake up every day wanting to not feel any pain and be productive we simply can’t. And also, we might get better at handling our disease with time but that doesn’t mean that It’s gone, or it no longer impacts negatively our quality of life.”
“Even if you don’t see the symptoms, it doesn’t mean that we’re not sick, Pain is really real and very hard to manage even with the proper medication.”
“I am no longer the person I was pre-lupus and taking the time to be kind to myself requires a lot of work and patience.”
“Even though it is invisible to most people, it is constantly exhausting and painful. Also, a chronic disease plays a large role in your mental health.”
“Always tired, always in pain.”
“Lupus flares may happen at any time and may negatively impact our life and our ability to perform work or daily activities which is not within our control. One cannot easily tell if a person is living with this autoimmune disease as lupus is an invisible illness that can attack your body from the inside in many different ways or forms.”
“I feel guilty about all the things I can’t do all the time. Especially housework and not having the energy to engage with my children in physical activities.”
Experiences With Currently Available Treatments
There are currently limited treatment options for lupus. Most lupus patients are on a cocktail of medications to manage their disease that were not originally developed to treat lupus. Treatments used to manage SLE include Nonsteroidal anti-inflammatory drugs (NSAIDs), antimalarial medications (hydroxychloroquine and chloroquine), corticosteroids, and immunomodulation drugs, such as methotrexate, azathioprine, mycophenolate mofetil and cyclophosphamide. Prolonged use of some of these medications such as Prednisone and Corticosteroids can have adverse long-term effects, including potential bone loss and osteoporosis, excessive weight gain and fluid retention.
Improved Outcomes
Current treatments for lupus may include a variety of side effects which can be challenging to manage which can then require additional medications to treat these side effects. Not all lupus patients respond to the same medication, or their immune systems may adapt to a particular medication resulting in having to switch to an alternate medication.
Some key outcomes lupus patients would like to see from a new therapy, such as Anifrolumab.
Reduction of side effects from medications, such as weight gain
Reduction in fatigue
Reduction in medication
Overall improvement in quality of life
Management of symptoms
Reduction of headaches
Improvement with brain fog
UV tolerance
Ability to engage in daily activities with family and friends
Improvement in sleep patterns
Improvement in joint mobility and pain/swelling
Experience With Drug Under Review
Not applicable.
Companion Diagnostic Test
Not applicable.
Anything Else?
The development of safe and effective lupus specific drugs to date has been minimal due to the heterogeneity of lupus symptom presentation. However, with the recent development of Anifrolumab by AstraZeneca Pharmaceuticals we are hopeful for those living with lupus. Unfortunately, effective drug treatment remains largely inaccessible by a wide segment of the population due to high cost and lack of funding through provincially funded drug plans.
It is imperative that newly developed lupus treatments, such as Anifrolumab, are approved and designated by both provincial and federal governments. We support a collaborative approach towards listing on publicly funded drug plans to provide all Canadian lupus patients easy and equitable access to lupus specific drugs regardless of their economic status.
Conflict of Interest Declaration — Lupus Canada
To maintain the objectivity and credibility of the CADTH reimbursement review process, all patients in the drug review processes must disclose any real, potential, or perceived conflicts of interest. This Patient Group Conflict of Interest Declaration is required for participation. Declarations made do not negate or preclude the use of the patient group input. CADTH may contact your group with further questions, as needed.
Did you receive help from outside your patient group to complete this submission? If yes, please detail the help and who provided it.
No
Did you receive help from outside your patient group to collect or analyze data used in this submission? If yes, please detail the help and who provided it.
No
List any companies or organizations that have provided your group with financial payment over the past 2 years AND who may have direct or indirect interest in the drug under review.
Table 2: Financial Disclosures for Lupus Canada
Company | $0 to 5,000 | $5,001 to 10,000 | $10,001 to 50,000 | In Excess of $50,000 |
|---|---|---|---|---|
AstraZeneca | — | — | X | — |
Canadian Arthritis Patient Alliance / Arthritis Society/ Canadian Skin Patient Alliance
About Canadian Arthritis Patient Alliance / Arthritis Society/ Canadian Skin Patient Alliance
CAPA is a grass-roots, patient-driven and managed, independent, national education and advocacy organization with members and supporters across Canada. CAPA creates links between Canadians with arthritis, assists them to become more effective advocates and seeks to improve the quality of life for all people living with the disease. CAPA believes the first expert on arthritis is the individual who has the disease, as theirs is a unique perspective. We assist members to become advocates not only for themselves but for all people with arthritis. CAPA welcomes all Canadians with arthritis and those who support CAPA's goals to become members. Our website is updated regularly and can be viewed at: www.arthritispatient.ca.
The Arthritis Society has been dedicated to extinguishing the fire of arthritis since 1948. Dedicated to a vision of living in a world where people are free from the devastating affects that arthritis has on the lives of Canadians, the Arthritis Society is Canada’s principal health charity providing education, programs and support to the 6 million Canadians living with arthritis. Since its founding, the Arthritis Society has been the largest non‐government funder of arthritis research in Canada, investing more than $200 million in projects that have led to breakthroughs in the diagnosis, treatment and care of people with arthritis. The Arthritis Society is accredited under Imagine Canada’s Standards Program. The website www.arthritis.ca provides more detailed information.
The Canadian Skin Patient Alliance (CSPA) is a national non-profit organization dedicated to supporting Canadians impacted by skin, hair and nail conditions. Our mission is to promote skin health and improve the quality of life of our community. We advocate for best care and treatment options for all skin patients; we educate on a variety of issues affecting these patients; and we support the members of our Affiliate organizations who work specifically on their disease areas such as acne, scleroderma, melanoma and psoriasis. To learn more, please visit www.canadianskin.ca.
Information Gathering
We developed a survey to hear directly from people living with Systemic Lupus Erythematosus (SLE) about their experiences with the condition and to gather their thoughts about alirocumab. Our organizations collaboratively developed the survey and it was shared via e-mail, and through our respective Canadian networks and communities, including social media and through personal contacts.
Two survey responses were received regarding anifrolumab for SLE. Our survey respondents ranged in age from 18-24, and 51-60, one reporting mild disease, and the other reporting moderate disease.
Neither survey respondent had experience taking anifrolumab. Our previous survey for the use of Belimumab was also used to help inform the greater context around commonly experienced symptoms and side effects from living with SLE, and the patients’ desired quality of life improvements from new medications. These patient experiences have helped to inform how anifrolumab may provide benefit to those living with Systemic Lupus Erythematosus (SLE). This submission was also reviewed by someone that lives with SLE and they provided additional context to the day-to-day challenges of living with the condition.
Disease Experience
Systemic Lupus Erythematosus (SLE) is a chronic autoimmune disease in which the body’s immune system attacks and causes inflammation in its own tissues. Inflammation results in swelling, pain and other symptoms. As a result of SLE, the skin, joints, kidneys, heart, lungs, blood vessels, the nervous system and almost any other organ can be affected. SLE can vary in severity; from mild to very severe. A person may experience active periods, commonly known as flares or flare-ups, and times where there is decreased activity or even inactivity (remission).
SLE affects about one in every 2,000 Canadians. Men, women and children can all be diagnosed with SLE but it is far more common in women (90% of persons with SLE are women).
The following symptoms were shared by people who responded to the current and previous surveys regarding SLE:
Skin rashes
Mouth sores
Fatigue
Nausea
Joint pain
Cognitive dysfunction (brain fog)
People living with SLE shared the following perspectives about living with and dealing with their symptoms:
“It affects my energy. I have joint pain and pain from fibromyalgia. I have gastroparesis which may not be from lupus but it flares when I have a lupus flare. Gastroparesis gives me severe nausea. When I’m in a flare I get pleuritic pain. I am no longer able to work which drastically affects my quality of life. During flares I am unable to keep up with housework. My social life is greatly impacted because of my low energy.”
“1) fatigue, muscle pain, joint pain, muscle weakness 2) impedes upon my ability to do work and do school full-time 3) walk long distances”
“Joint pain, skin rash, mouth sores, fatigue and edema. I get tired very easily and my feet get sore if I try to do too much. Makes it difficult to keep up with daily life and socially.”
“Extreme fatigue, nauseousness, joint pain, brain fog and lack of concentration”
“Joint pain, fatigue, rashes, cognitive dysfunction, swelling.”
“I have joint and muscle pain, and difficulty walking very far. Staying in bed for more than four hours is difficult. I have shortness of breath, likely from having heart failure the last year and a half. I had a mild heart attack caused by lupus, as myocarditis. I also have recently been told I have asthma.”
“Complete exhaustion, facial rash, body rash, sore swollen joints, sore muscles, problems with eyesight because of medications, lung problems, I could go on forever.”
“During flare I have hair loss, arthritis and nephritis but mostly I am dealing with skin lesions, butterfly rash and fatigue.”
The disease impacts patients’ lives in many ways. Impacts on quality of life were noted by all respondents. People living with SLE shared the following perspectives about the impact of the disease on their lives:
“Shopping for groceries is difficult, as are food prep and cooking a meal. Any task requiring bending or kneeling is hard, I need to use a stool or chair to do things. Lifting wet laundry is hard to do, making the bed.”
“I find it extremely hard to complete my work, on some days I find it difficult to write a sentence.”
“Been off work numerous times. Impacts entire life when in a flare.”
“There are so many things that I have had to give up over the years, driving, gardening, most of my crafting, needlework, vacuuming, yard work.”
“The fatigue and need for 10ish hours of sleep to function makes working full time a challenge.”
Experiences With Currently Available Treatments
Medications for SLE aim to control rashes, inflammation, and minimize disease activity so that no long- term joint or organ damage occurs, as there currently is no cure for the disease. Treatments used include nonsteroidal anti-inflammatory drugs (NSAIDs), antimalarial medications (hydroxychloroquine and chloroquine), corticosteroids, and immunomodulation drugs, such as methotrexate, cyclophosphamide, and canakinumab. rituximumab is another treatment option specifically approved to treat lupus, though access to this medication is limited based on the type of drug coverage, and can be quite cost prohibitive. The following provides a general description of the treatments used and their side effects:
NSAIDs are used to treat pain relating to the disease. The NSAIDS may cause many side effects, from stomach upset to changes in kidney function.
Antimalarial medications such as hydroxychloroquine and chloroquine, the most common unwanted effect of which is some stomach upset. However, if hydroxychloroquine and chloroquine are taken in a high dose and over a long period, they may accumulate in the retina and cause a loss of vision and in rare cases, blindness may occur.
Corticosteroids are commonly used in the treatment of lupus and although effective, there are a significant amount of side effects when taken for longer durations and at higher doses. Corticosteroids can cause short-term effects such as weight gain, acne, excess facial hair, mood swings, high blood pressure, high blood sugar, increased infection, stomach ulcers, hyperactivity, and increase in appetite. Long-term effects include osteoporosis, glaucoma and cataracts, osteonecrosis, skin changes, heart disease, and stroke.
Traditional immunomodulation drugs such as methotrexate are also commonly used and have a range of side effects that are difficult to manage. Side effects include nausea, vomiting, hair loss, diarrhea, decrease in white blood count, bone marrow toxicity, liver toxicity, and bladder-related problems. Less commonly used forms of immunomodulation medications used to supress symptoms include cyclosporine, leflunomide.
Belimumab is a more recent medication developed to treat lupus, though carries side effects such as nausea, diarrhea, fever, stuffy or runny nose and sore throat, persistent cough, trouble sleeping, leg or arm pain, depression, headache, and pain, redness, itching, or swelling at the site of injection (when given subcutaneously), in addition to also causing potential allergic reaction. Taking an antihistamine with belimumab is a regular recommended course of medication administration. It is also not covered generally by public drug plans and generally only accessible to those with private drug coverage.
Patients expressed a desire to reduce their use of steroids due to concerns of bone density loss. Patients shared these experiences regarding their current treatments and that they tried a range of treatments using a difficult trial and error process with often less than ideal results:
“Prednisone was effective in managing inflamed kidneys - Plaquenil, Imuran and Benlysta did not make much of a difference symptom wise but helped with blood work…Access to treatments is easy, [but] treatments are not addressing my fatigue.”
“I have been taking the same medications for over 10 years. I know that there are other medications but I’m not sure what the qualifications are to be able to try them. I don’t have kidney or heart Investment. I think that these problems are what qualify people for the infusion treatments. I would be curious to know if my symptoms would be more responsive to infusion treatments.”
“When first diagnosed I was put on Plaquenil and it worked wonders for many years but I then unfortunately developed neuropathy from this medication. Prednisone has worked well but I am now having issues with bone density.”
“I’ve been on prednisone, on and off for over 30 years. Plaquenil for that time as well. I used to take anti-inflammatories, like Celebrex, but they were no longer helping. In recent years I’ve been on Methotrexate, both oral and injectable, Arava, Imuran, Cyclosporine and recently, Cyclophosphamide. Most of these have been hard to tolerate, with nausea, headache, tremors, anxiety. Irritable bowel and urinary tract infection. None of these have helped much with my joint pain.”
“Have taken Plaquenil since the beginning but it wasn't enough on its own after about 2 years. Imuran was not effective at controlling my lupus nephritis and I was switched to MMF/cellcept and that has been working well to control my symptoms until my most recent flare. Currently on benlysta and seems to be keeping my skin conditions under control and allowing me to keep MMF at a lower dose therefore increasing my white cell count.”
“Up to benlysta, the only drug that would work that I could tolerate was prednisone. Long term effects were a concern… Although the prednisone helped to control the disease, the long-term effects of high doses over the 46 years I have had SLE was/is a concern.”
Patients also expressed the difficulty in receiving reimbursement for medications, and had this to say:
“It has been a huge obstacle to get cellcept covered because it is only recognized for transplant patients and not to prevent needing a transplant by controlling lupus. It usually takes months of argument with insurance and province to get it covered and I need to renew annually. Benlysta has been good but working full time is impossible because no job let's you take a half day every month for the infusion and the self-injector needs to be refrigerated which doesn't work well for travel. I think a lot more could be done for this issue.”
Improved Outcomes
People living with SLE reported that current treatments are difficult to tolerate because of side effects. A variety of side effects are difficult to manage such as allergic reaction, stomach upset, nausea, anxiety, headaches, tremors and difficulties in administering injections, as well as concerns about organ damage. Minimizing these side effects are important outcomes that should be considered when evaluating new therapies. Patients shared these perspectives:
“High doses of prednisone terrible side effects. Methotrexate had allergic reaction. Tolerate Plaquenil and Imuran. Benlysta has worked best.”
“I used prednisone to begin with...side effects... mood swings, moon face, unable to sleep, agitated at times. Plaquenil... upset stomach sometimes. Methotrexate injection weekly... nausea, weight loss and had to take other medications to control the nausea. Extremely difficult to tolerate...was unable to go out the day I took it. Benlysta...side effects minimal...headache and tired.”
“[The] hardest side effects to tolerate were weight gain, avascular necrosis, hunger, and GI problems.”
The expectations of the drug are to offer another treatment option for patients with SLE. New treatment options have the potential to ease the burden on patients, their families, caregivers and the healthcare system. Overall, there are several outcomes of importance to people living with SLE including:
a reduction in fatigue, joint and muscle pain, rash and skin irritations
increased mobility and participation in physical activities
ability to participate in school activities and work
ability to carry out ADLs and social roles
Experience With Drug Under Review
Patients’ response to SLE medications vary significantly. Some medications are effective for some people, while not effective for others. Some treatments will only manage the disease for a short period of time before the patient’s immune system adapts to a drug presence (i.e., becomes non-responsive to it) and they will have to switch to another medication. In some cases, patients with SLE may not adequately respond to any of the medications currently available. As a result, patients need a number of medication options in order to effectively manage their disease throughout their lives.
There were no survey patients who had experience with anifrolumab. Though the two respondents who were asked about anifrolumab had this to say regarding a new medication, and risks and benefits of experiencing side effects:
“I would be very willing to try it. I would like to see if I would have more energy leading to a better quality of life.”
“Enhanced quality of life by reducing fatigue; yes I’m willing to experience serious side effects if it works; a 50%-75% improvement would be acceptable”
Companion Diagnostic Test
Not applicable
Anything Else?
Patients often endure a complicated and lengthy process to find a treatment that helps them manage their symptoms. Since most medications are not designed to treat lupus, there can often be a lack of knowledge about which treatment options may work best to treat specific symptoms. Being able to treat the underlying cause of symptoms, such as inflammation may help improve the treatment process for people living with SLE.
Obtaining medications designed specifically to treat SLE, that both work for the patient, and have a low cost is a difficult combination to achieve. Having more medication options available to help treat SLE will help to expand the options available for people hoping to reduce underlying inflammation to reduce side effects, and improve overall quality of life with SLE.
Conflict of Interest Declaration — Canadian Arthritis Patient Alliance / Arthritis Society/ Canadian Skin Patient Alliance
To maintain the objectivity and credibility of the CADTH reimbursement review process, all patients in the drug review processes must disclose any real, potential, or perceived conflicts of interest. This Patient Group Conflict of Interest Declaration is required for participation. Declarations made do not negate or preclude the use of the patient group input. CADTH may contact your group with further questions, as needed.
Did you receive help from outside your patient group to complete this submission? If yes, please detail the help and who provided it.
The patient groups noted on this submission worked collaboratively to develop the survey and submission.
Did you receive help from outside your patient group to collect or analyze data used in this submission? If yes, please detail the help and who provided it.
We did not receive any assistance from outside the patient groups noted on this submission.
List any companies or organizations that have provided your group with financial payment over the past two years AND who may have direct or indirect interest in the drug under review.
Table 3: Conflict of Interest Declaration for the Canadian Arthritis Patient Alliance
Company | Check Appropriate Dollar Range | |||
|---|---|---|---|---|
$0 to 5,000 | $5,001 to 10,000 | $10,001 to 50,000 | In Excess of $50,000 | |
Abbvie Corporation | — | — | X | — |
ACE Planning and Consulting | — | — | — | — |
Canadian Rheumatology Association | X | — | — | — |
CAPDM | X | — | — | — |
Jannssen | X | — | — | — |
CORECOM | X | — | — | — |
Government of Canada | X | — | — | — |
Brooks Group | X | — | — | — |
UCB Canada | — | X | — | — |
CADTH | X | — | — | — |
SmithSolve LLC | X | — | — | — |
The University of British Columbia | X | — | — | — |
Arthritis Society | X | — | — | — |
University of Alberta | X | — | — | — |
Children’s Hospital of Eastern Ontario | X | — | — | — |
Sick Kids Hospital | X | — | — | — |
Dalhousie University | X | — | — | — |
Table 4: Conflict of Interest Declaration for the Arthritis Society
Company | Check Appropriate Dollar Range | |||
|---|---|---|---|---|
$0 to 5,000 | $5,001 to 10,000 | $10,001 to 50,000 | In Excess of $50,000 | |
Abbvie | — | X | — | — |
Alcon | X | — | — | — |
Amgen | — | — | — | X |
Boehringer Ingelheim | — | — | X | — |
BMS | — | — | X | — |
Celgene | X | — | — | — |
Eli Lilly | X | — | — | — |
Eupraxia Pharmaceuticals | X | — | — | — |
Gilead | X | — | — | — |
Innovative Medicines Canada | — | X | — | — |
J+J Shared Services | — | — | — | X |
Janssen | — | X | — | — |
Merck | — | — | — | X |
Novartis | — | — | X | — |
Pfizer | — | — | — | X |
Sanofi | X | — | — | — |
UCB | — | X | — | — |
Table 5: Conflict of Interest Declaration for the Canadian Skin Patient Alliance
Company | Check Appropriate Dollar Range | |||
|---|---|---|---|---|
$0 to 5,000 | $5,001 to 10,000 | $10,001 to 50,000 | In Excess of $50,000 | |
AbbVie Canada | — | — | — | X |
Janssen Canada | — | — | X | — |
Merck Canada | — | — | X | — |
Pfizer Canada | — | — | — | X |
Sanofi Canada | — | — | — | X |
UCB Canada | — | — | X | — |
Lupus Ontario
About Lupus Ontario
Lupus Ontario is the largest provincial voluntary organization dedicated to improving the lives of people living with lupus. Our members currently number almost 6,400 and include lupus patients, friends, family and allies.
Our mission: Lupus Ontario’s mission is to provide vital support, education, awareness, advocacy and research through the fundraising efforts of our staff and volunteer community to help those with lupus live longer, healthier and better lives.
Our goal: Life without Lupus
Website: www.lupusontario.org
Information Gathering
Information was gathered from lupus patients through surveys and focus group discussions. The patients resided across the province of Ontario. Focus group surveys and meetings were held during January to February 2022. The focus group consisted of 10 lupus patients.
Demographic | Percent of patients |
|---|---|
Female | 90 |
Male | 10 |
Age 25-54 | 40 |
Age 55-64 | 50 |
Age 65+ | 10 |
Full-time employment | 40 |
Part-time employment | 10 |
Retired | 50 |
SLE severity: mild | 30 |
SLE severity: moderate | 40 |
SLE severity: severe | 30 |
Figure 1: Geographic Distribution of Patients
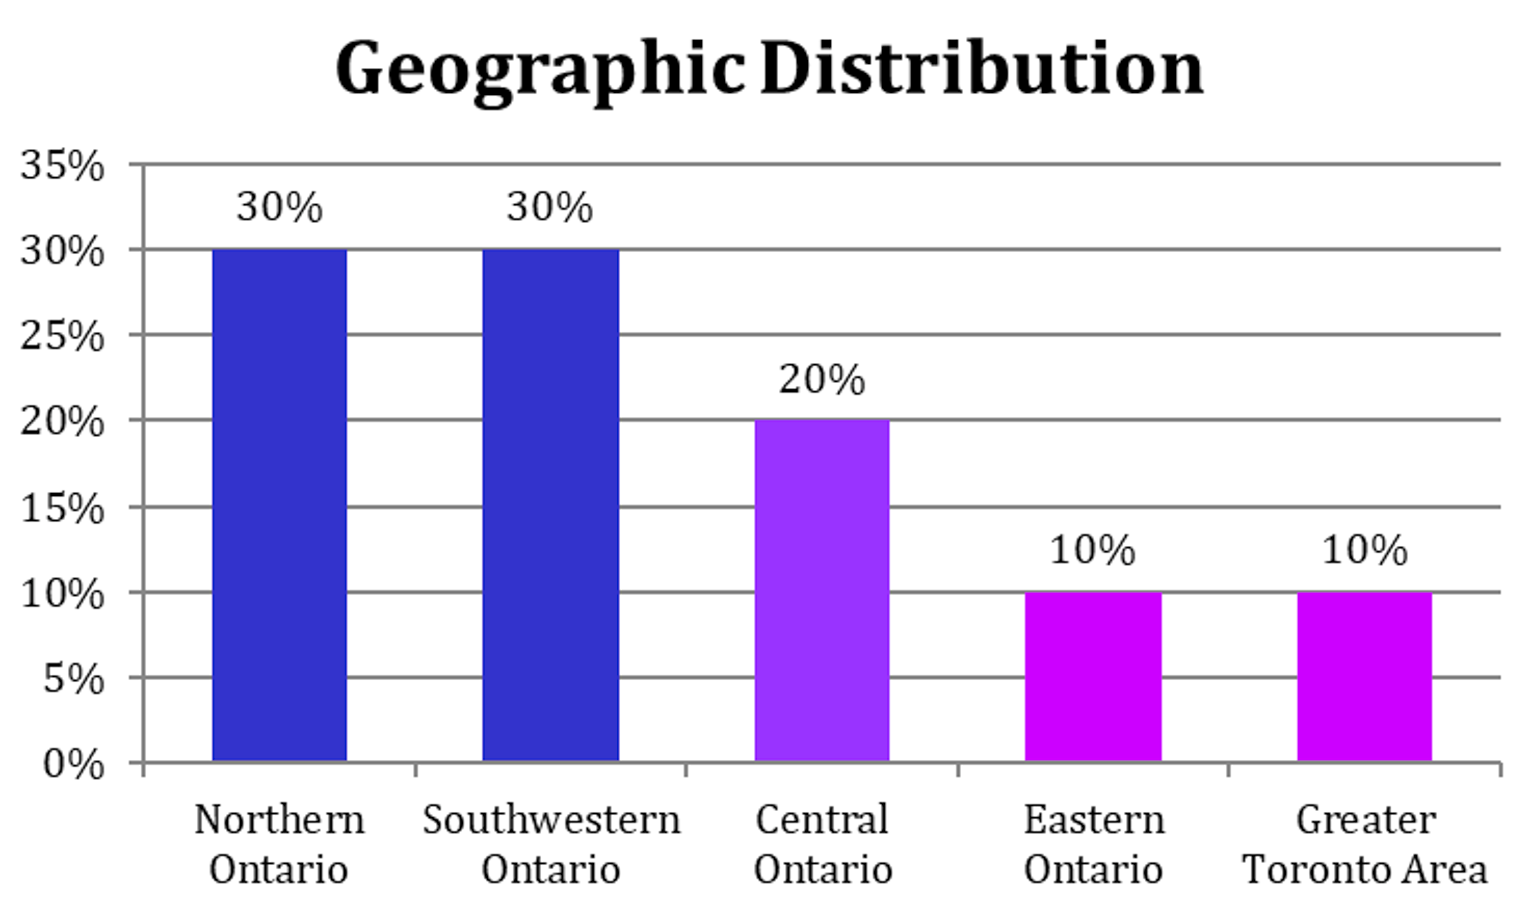
None of the patients had experience with Anifrolumab or participated in the clinical trial.
Disease Experience
Focus group patients with SLE experienced a major impact on their day-to-day life and quality of life due to a variety of symptoms, comorbidities and damage to major organs. In addition, the length of time to determine diagnosis of the disease in 60% of the group was measured in years resulting in added mental and physical stress. All focus group patients required care from family, friends and third-party caregivers during flares. Patients noted that both work and personal activity levels were impacted severely and in some cases resulted in having to stop work. All focus group patients noted an impact on work and a reduction in personal physical activity levels.
Table 7: Disease Experience for Patients
Criteria | Description and percent of patients | ||
|---|---|---|---|
Time taken to diagnose lupus | 5 years+, 40% 1–3 years, 20% | 7–12 months, 30% | Less than 6 months, 10% |
Symptoms | Fatigue, 90% Rashes, 90% Sun sensitivity, 90% | Joint Pain, 80% | Anemia, 40% Mouth ulcers, 40% |
Major organ involvement | Kidneys, 50% | Skin, 40% | Brain, 30% Heart, 30% Lungs, 30% |
Comorbidities | Arthritis, 60% | Fibromyalgia, 50% | Raynauds, 40% |
Flare frequency | 5–8 years, 10% 1–5 years, 40% | 7–12 months, 10% 0–6 months, 10% | No pattern, 30% |
Self care during flare | All of the time, 20% | Most of the time, 50% | Some of the time, 30% |
Caregiver required | Family/friends, 90% | Third-party, 10% | — |
Work impact | Stopped working, 40% | Changed careers, 20% Modified hours, 20% | Virtual, 10% |
Based on the data gathered above and the group discussions following, the most important aspects of the disease to be managed are fatigue, joint pain and flares.
Experiences With Currently Available Treatments
The majority of the focus group patients (60%) indicated that current medications/treatments were effectively managing their disease however they do experience multiple side effects such as headaches, brain fog, additional fatigue, frequent infections, osteoporosis, gastric issues, insomnia, hair loss, weight gain/loss and mood swings. Major medical impacts experienced from the current treatments/medications were: 70% eye issues, 50% cognitive issues, 30% high blood pressure, 30% mental health, 30% severe weight gain. The current treatments being used are Benlysta, Imuran, NSAIDs, Plaquenil, Cellcept, Cytoxin, Methotrexate, Rituximab and OTC pain medications. Note that 30% of the patients stated that the current medications were not effective at managing their disease.
Table 8: Time and Cost to Travel to Appointments
Criteria | Description and percent of patients | ||
|---|---|---|---|
Time to travel one-way to rheumatologist or clinic | 8+ hours, 10% | 4-8 hours, 30% | 1-2 hours, 20% < 1 hour, 40% |
Time to travel one-way to hospital | 1-2 hours, 10% | < 1 hour, 90% | |
Out of pocket costs | $1500+, 10% $1001-$1500, 30% | $100-$500, 50% | < $100, 10% |
Improved Outcomes
Criteria | Description and percent of patients | ||
|---|---|---|---|
Outcomes | Fatigue reduction, 90% Pain reduction, 90% | Flare reduction, 70% Fewer side effects, 70% | Steroid reduction, 50% |
Impact from new treatments on quality of life | Eliminate other medications, 90% Improved quality of life, 80% | Increased life span, 70% | Improve engagement in social activities, 70% |
Trade offs when choosing therapy | Side effects, 90% Cost of medications, 70% | Cost of access, 60% Clinical trials using their demographic, 60% | Oral or IV infusion, 30% |
Experience With Drug Under Review
Not applicable
Anything Else?
Is there anything else specifically related to this drug review that CADTH reviewers or the expert committee should know?
No.
Conflict of Interest Declaration — Lupus Ontario
To maintain the objectivity and credibility of the CADTH reimbursement review process, all patients in the drug review processes must disclose any real, potential, or perceived conflicts of interest. This Patient Group Conflict of Interest Declaration is required for participation. Declarations made do not negate or preclude the use of the patient group input. CADTH may contact your group with further questions, as needed.
Did you receive help from outside your patient group to complete this submission? If yes, please detail the help and who provided it.
No
Did you receive help from outside your patient group to collect or analyze data used in this submission? If yes, please detail the help and who provided it.
No
List any companies or organizations that have provided your group with financial payment over the past two years AND who may have direct or indirect interest in the drug under review.
Table 10: Conflict of Interest Declaration for Lupus Ontario
Company | Check Appropriate Dollar Range | |||
|---|---|---|---|---|
$0 to 5,000 | $5,001 to 10,000 | $10,001 to 50,000 | In Excess of $50,000 | |
Astra Zeneca | — | — | X | — |
Clinician Input
The Toronto Lupus Program, University of Toronto
What is systemic lupus erythematosus (SLE)? SLE is a chronic autoimmune, relapsing-remitting, multisystem disease that can be associated with a myriad of symptoms and manifestations and often leads to organ failure/damage and death. SLE affects more than 1 in every 1000 Canadians, primarily women (female/male ratio 9/1) of childbearing age, typically presenting between ages of 14 and 45 years. People of different ethnicities/descents can develop SLE but people of African descent, Hispanics, and Aboriginals are affected much more compared to Caucasians.
How does SLE manifest? SLE often involves multiple organs in the same patient but at the same time the symptoms can vary significantly amongst patients, consequently SLE is known as the “disease of 1000 faces”. The musculoskeletal (arthritis – joint pain, swelling, severe limitation in activities of daily living, and myositis – muscle pain, muscle weakness and severe limitation in daily activities) and mucocutaneous manifestations (skin rashes - often leading to permanent scars, hair loss and ulcers in the oral and nasal cavities) occur in 70% and 80% of patients, respectively. Frequently, SLE affects the kidneys (in about 65% of patients), and in 15-20% of patients evolves into end stage kidney disease requiring kidney dialysis and transplants. SLE also can affect the brain where it can cause: seizures, stroke, psychosis, delirium, cognitive impairment, headaches, depression, and anxiety.
What is the impact of SLE? SLE has a profound effect on health-related quality of life and a significant cause of loss of work productivity, sick leave, and physical disability. Patients with SLE have a higher mortality rate particularly in the first 3 decades after diagnosis. SLE and its treatment, particularly steroids, lead to significant irreversible damage in multiple organs – osteonecrosis in the hips/knees, requiring joint replacement at an early age, osteoporosis and vertebral fractures, cataracts, diabetes, hypertension, muscles weakness, cognitive impairment and others. The currently used immunosuppressive agents frequently fail to induce a complete remission or do so only after prolonged exposure. Recurrent flares are common and cumulatively over the total disease duration result in significant organ damage. This necessitates keeping patients on immunosuppressive agents for prolonged periods. Newer medications that help induce a remission more quickly and prevent flares are desperately needed.
What is the socioeconomic impact of SLE? SLE is associated with large healthcare costs. Current SLE treatment continues to rely heavily on steroids which is the major driver for organ damage, increasing the burden on the healthcare system. Almost 80% of lupus patients exhibit a relapsing-remitting or persistent active disease course requiring large and chronic doses of steroids. Cohort studies have clearly demonstrated the failure of the current standard of care treatment (steroids/anti- malarial/immunosuppressants) to maintain remission in SLE patients. Often remission is induced by steroids and fails upon tapering the steroid dose. The large use of steroids, along with the currently available immunosuppressants (methotrexate, azathioprine, cyclosporin, and mycophenolate mofetil), have been associated with recurrent infections in SLE patients requiring multiple hospital admissions and a significant healthcare burden. Indeed, the lack of effective treatment has also been the culprit for multiple hospital admissions in many patients with SLE.
What does anifrolumab add? Anifrolumab targets the interferon pathway which plays a major role in the disease pathogenesis. Studies have confirmed the link between the interferon signature (induced by high levels of interferon) and disease severity as well as the trajectory of the disease over time. Three major SLE trials with more than 1000 patients have demonstrated the efficacy of Anifrolumab in SLE, particularly for arthritis, skin rashes, serositis (pleuritis and pericarditis), and myositis manifestations (mild-moderate disease activity excluding advanced kidney and nervous system involvement). It is obvious that there is an unmet need in the treatment of SLE and our existing standard of care treatment has failed to adequately control SLE disease activity. Thus, it is very important to approve and support new medications for SLE, and the Anifrolumab data confirms its effectiveness. We hope that with the availability of Anifrolimuab for SLE patients, the trajectory of the disease can be significantly altered to improve patients’ quality of life, decrease death and hospital admissions, improve patients’ productivity and diminish the burden on health cost.
Biological treatment for other rheumatic diseases, such as rheumatoid arthritis, psoriatic arthritis, and other rheumatic diseases have significantly improved the outcome of these diseases and the time has come to make a difference in the standard of care for patients with SLE.
We, the Toronto Lupus Program Team at the University of Toronto, strongly support the anifrolumab application for the treatment of SLE and we hope it will be approved for our patients”.
Sincerely,
Zahi Touma, MD, PhD Associate Professor of Medicine, University of Toronto, Scientist Krembil Research Institute
Jorge Sanchez-Guerrero, MD MSc Professor of Medicine, University of Toronto, Clinician Investigator, Krembil Research Institute
Joan Wither, MD, PhD, Professor of Medicine and Immunology, University of Toronto, Senior Scientist, Krembil Research Institute
Dafna D. Gladman, MD Professor of Medicine, University of Toronto, Senior Scientist, Krembil Research Institute
Murray B. Urowitz, MD Professor of Medicine, University of Toronto, Senior Scientist, Krembil Research Institute
Nathalie Rozenbojm RN, MN Clinical Nurse Specialist, Lupus Program, Toronto Western Hospital
Canadian Network for Improved Outcomes in Systemic Lupus Erythematosus
About Canadian Network for Improved Outcomes for Systemic Lupus Erythematosus
The Canadian Network for Improved Outcomes for Systemic Lupus Erythematosus (CaNIOS) is a group of Canadian clinicians and researchers spanning the country. CaNIOS is registered as a Not-for Profit Canadian Corporation. Our overarching mission statement is to facilitate the care of Canadian lupus patients and to improve the outcome of lupus patients across our country through collaborative research. Additional goals are to facilitate research in lupus and related autoimmune diseases; to describe the lupus patient population in Canada through a National registry; to provide a large patient base to address clinically important issues through research; to look at subgroups of the Canadian lupus population, and to contribute to the global and international effort on lupus research through the uniqueness of the Canadian lupus population. CaNIOS was originally created in 1995 with the specific goal of running multicentre studies, recognizing that the relatively low prevalence along with the heterogeneity of lupus required Canada wide collaborations to detect clinically important differences and conduct meaningful research.
Collectively CaNIOS members also provide care for more than 4000 SLE patients.
Dr. Konstantinos Tselios, MD, PhD, Assistant Professor
Dr. Christine Peschken MD, Professor of Medicine, Chair, CaNIOS
Dr. John Hanly, MD, Professor of Medicine
Dr. Judah Denburg, MD, FRCP(C), William J. Walsh Chair in Medicine, Professor
Dr. Mark Matsos, MD, FRCPC, Associate Professor
Dr. Kimberly Legault, MD, FRCPC, Associate Professor
Dr. Derek Haaland, MD, MSc, FRCPC, Associate Clinical Professor
Dr. Janet Pope, MD, FRCPC, Professor
Dr. Lily Lim, MBBS, MRCPCH, FRCPC, PhD, Assistant Professor
Dr. Ann Clarke, MD, MSc, Professor
Dr Carol Hitchon MD FRCPC Associate Professor
Dr. Annaliese Tisseverasinghe, MD, MSc, FRCPC, Assistant Professor
Dr. Megan Barber, MD, PhD, FRCPC, Clinical Assistant Professor
Dr. Stephanie Keeling, MD, FRCPC Professor of Medicine
Information Gathering
The information provided herein were gathered from the relevant scientific/medical literature.
Current Treatments
SLE is a chronic, systemic autoimmune disease with multiple clinical manifestations, including musculoskeletal, mucocutaneous, renal, central and peripheral nervous system, blood, heart and lungs involvement. The majority of the lupus patients are women (around 90% in large cohorts) diagnosed at a young age (20-40 years old). The etiology of the disease remains unknown. Its course is characterized by unpredictable relapses and remissions. The current treatment strategies aim at the suppression/modulation of the autoimmune response and include several agents that carry a significant risk for adverse events.
The major drugs that have been used in SLE management can be divided in 4 broad categories.
Antimalarials. These include mainly chloroquine (CQ) and hydroxychloroquine (HCQ) with the latter being available in Canada. Antimalarials are considered the cornerstone of lupus therapeutics and are recommended for all lupus patients without specific contra-indications. They are associated with multiple beneficial effects (symptom control, reduction of risk for future flares, improved metabolic profile, decreasing the rates of thrombotic complications and overall damage and improving survival).
Glucocorticoids. These are widely available in Canada, both in oral and intravenous forms. They are mainly used for aggressive disease manifestations, while they are often maintained at low-to-moderate doses (5-20mg/day) for disease activity control. While they are very effective in suppressing the autoimmune response, they are associated with multiple side effects, including weight gain, osteoporosis and fractures, osteonecrosis, diabetes, hypertension, accelerated atherosclerosis, cataract etc. It has been estimated that half of the chronic irreversible damage that occurs to lupus patients is attributed to glucocorticoids.
Immunosuppressives. This category includes a series of agents such as methotrexate, azathioprine, mycophenolate mofetil, cyclophosphamide, cyclosporine, tacrolimus, sirolimus, leflunomide, thalidomide etc. that are used in combination with antimalarials and glucocorticoids to control refractory disease or renal/heart/lungs/blood and other manifestations. They carry a significant risk for side effects that differ for each medication. A universal side effect is the increased risk of infections.
Biologics. Anifrolumab was approved for SLE (non-renal, non-neuropsychiatric disease) in December 2021. Belimumab was approved for the same indication in 2011. Rituximab is also used occasionally although it has not been approved for use in lupus. Other biologics are used less often on an individual basis.
Apart from the systemic (oral and intravenous) treatments, topical treatments (glucocorticoid or immunosuppressive creams) are often prescribed for cutaneous manifestations.
Non-pharmaceutic treatments include photoprotection (sunscreen) and maintaining a healthy lifestyle with a balanced diet and regular exercise. Vitamin D and calcium supplements are also recommended to prevent osteoporosis, particularly in chronic glucocorticoid users.
From the aforementioned drugs, only the antimalarials, belimumab and, most recently, anifrolumab have been approved for use by Health Canada. The use of all the other medications is based on extensive data from clinical and observational trials and is recommended by international associations such as the American College of Rheumatology (ACR) and the European League against Rheumatism (EULAR). Most of these agents are currently available in Canada.
There are no treatments available through special access programs.
The current treatments modify the underlying pathogenetic mechanisms. However, the exact pathogenetic pathway that is impacted is not known for the majority of the non-specific immunosuppressives and antimalarials. Anifrolumab targets the interferon pathway, considered to be a central mechanism in lupus pathogenesis. Belimumab targets the maturation and differentiation of B cells, a subset of lymphocytes that produce the autoantibodies that are related to lupus pathogenesis.
Treatment Goals
The ideal treatment should have a meaningful impact on overall survival by reducing disease activity, minimizing the risk for subsequent flares as well as mitigating the long-term complications of the disease and improving the quality of life.
Given the clinical and serological heterogeneity of SLE, where multiple drugs are commonly used simultaneously to control disease activity, the ideal treatment should be able to lead to remission (or low disease activity) while minimizing the use of more harmful drugs that are used concomitantly (such as glucocorticoids) without increasing the risk of adverse events.
Treatment Gaps (Unmet Needs)
Considering the treatment goals, please describe goals (needs) that are not being met by currently available treatments.
Based on extensive data from randomized clinical trials, approximately 40% of SLE patients with active musculoskeletal and/or mucocutaneous disease are expected to achieve remission within 12 months. These patients are using a combination of the drugs that are described in Section 3. Thus, a significant proportion of patients are still in an active disease state several months or years after the initiation of therapy.
The majority of these patients are treated with moderate or high doses of glucocorticoids (prednisone greater-than over equal to 7.5mg/day or equivalent) that greatly increases the risk for multiple complications (described in the Current Treatment Section). For example, 10-12% of these patients will develop osteonecrosis and about half of them will require a total joint replacement in the next 12 months. Of note, osteonecrosis is extremely rare in non-glucocorticoid users. Osteoporosis is detected in 30-35% of lupus patients with glucocorticoids acting as a leading risk factor. This leads to osteoporotic fractures in approximately 15-20% of them. Accelerated atherosclerosis is well documented in SLE patients and is associated with both traditional and disease-related factors. Glucocorticoids increase the risk for (or may aggravate pre-existing) diabetes, hypertension and dyslipidemia; hence their contribution to this process is significant. Despite advances in the management of such co-morbidities, 4-5% of SLE patients will suffer a major cardiovascular event (myocardial infarction and/or stroke) at a relatively young age. Overall, half the irreversible damage that occurs in SLE patients derive from glucocorticoids and the reduction of their cumulative dose over time is a major goal in SLE therapeutics.
Flares are a cardinal characteristic of SLE. Approximately 50% of the patients will experience a disease flare in 12 months and half of them will require escalation in their systemic treatment. Flares have been associated with worse outcomes; for example, renal flares are associated with a 4-fold risk for subsequent end-stage renal disease and dialysis. The prevention of flares is another major goal in lupus management.
Compliance (adherence) is an additional obstacle in the long-term management of SLE. Approximately 40-75% of lupus patients have suboptimal compliance to their treatment in the first few years after diagnosis. Multiple factors account for this phenomenon including polypharmacy. For example, a newly diagnosed patient with lupus nephritis may need 20-30 tablets of different drugs daily for a prolonged period of time. Moreover, treatment is lifelong, and many patients have difficulties in maintaining adherence.
Based on the above, the unmet needs in lupus therapeutics include the modest efficacy of the currently existing options, the increased risk for adverse events, the inefficacy to prevent flares and the suboptimal compliance.
Which patients have the greatest unmet need for an intervention such as the drug under review?
Based on our response in the previous section, the patients with the greatest unmet needs for an intervention are:
The patients who will not achieve remission in a reasonable time period (3-6 months) after commencing treatment with the available options for musculoskeletal and mucocutaneous disease.
The patients who experience early flares upon glucocorticoid withdrawal and cannot reduce their daily prednisone dose below 7.5 mg/day (or equivalent), “steroid-dependent disease”.
The patients who experience frequent flares from any organ/system.
The patients in whom compliance (adherence) is a major factor for treatment failure.
Based on observational studies, these patients (with the exception of point No 4) are 10-20% of the general SLE population. Some characteristics that differentiate these patients with more refractory disease include genetic factors (mostly related to genes involved in the interferon pathway, collectively called “interferon signature”) as well as evidence of sustained serologic activity (increased anti-dsDNA antibodies and/or decreased complements C3 and C4) despite treatment. Compliance has been associated with several other factors.
Anifrolumab is expected to address these unmet needs. In the relevant clinical trials, it demonstrated excellent results in active disease whereas it showed very encouraging results with regards to its “steroid-sparing” effect. Given that these results were apparent within the first 12 months, its effect might show further improvement with more prolonged use. Furthermore, anifrolumab is expected to improve compliance since it is administered intravenously every 4 weeks.
Place in Therapy
How would the drug under review fit into the current treatment paradigm?
The mechanism of action of anifrolumab is novel and it disrupts the activated interferon pathway that characterizes 60-80% of patients with SLE. This pathway is central to SLE pathogenesis and drives the functional differentiation of virtually all immune cells that are relevant to tissue damage. Thus, it is reasonable to expect a meaningful impact on disease activity from all affected organ/systems and not only from the musculoskeletal and mucocutaneous systems that were mostly assessed in the relevant clinical trials.
Anifrolumab is the first approved drug to address this disease mechanism.
Anifrolumab was tested as an add-on treatment to pre-existing drugs (mainly antimalarials, glucocorticoids, immunosuppressives). Based on the current knowledge, it should be used in combination with these agents in refractory cases (where treatment goals are not achieved after a reasonable time).
Anifrolumab is expected to cause a shift in the current treatment paradigm. Its unique mechanism of action renders it the most suitable to address the unmet needs discussed in section 5. Moreover, it is expected that anifrolumab will have a major impact for the subpopulation of patients with serologically active disease, those with frequent flares as well as patients with “steroid dependence”.
Please indicate whether or not it would be appropriate to recommend that patients try other treatments before initiating treatment with the drug under review. Please provide a rationale from your perspective.
As discussed in the previous sections, anifrolumab has demonstrated a clinically meaningful benefit for patients with active SLE. The current treatment paradigm for musculoskeletal and/or mucocutaneous manifestations requires antimalarials with or without glucocorticoids and/or immunosuppressives (based on the EULAR recommendations). As mentioned above, approximately 40% of such patients will achieve remission within the first year.
Antimalarial monotherapy has demonstrated efficacy in about 25-30% of patients with mild-to-moderate disease activity and should be the first choice in such cases, particularly given their favorable safety profile. About 80-85% of patients can tolerate antimalarials safely according to large observational studies.
Glucocorticoids should be administered in refractory cases (or immediately in severe cases) to mitigate the autoimmune response. However, every effort should be made to minimize the daily dose to the lowest possible dose that will maintain remission. This dose should be 7.5mg/day or less in order to prevent long-term complications (according to some studies, this dose should be 5mg/day or less).
In refractory cases, methotrexate or azathioprine or mycophenolate mofetil can be used. Methotrexate is effective in approximately 50-60% of such cases (30-40% for mycophenolate, 25-30% for azathioprine).
In cases where the combination of antimalarials, low dose glucocorticoids and immunosuppressive therapy is not effective or other factors (e.g., intolerance) are prohibitive, anifrolumab should be a choice. It is expected that a significant proportion of such refractory patients will respond (attaining remission) in the first 12 months.
Patients who experience frequent flares (>1/year for more than 2-3 years) from any organ/system are the most likely to have activated “interferon signature” as demonstrated by recent studies. In such patients, we would recommend anifrolumab as an add-on to the existing therapies with the goal to reduce the frequency and intensity of the flares and optimize prognosis.
Finally, we would recommend anifrolumab in “steroid-dependent” patients (e.g., those who are not able to reduce the daily prednisone dose below 7.5mg/day without flaring). It is of very high likelihood that these patients will develop irreversible damage over time with deleterious effects to their overall health and well-being secondary to chronic glucocorticoid use. Moreover, these patients will incur significant costs to the health system. The goal of treatment with anifrolumab should be the reduction of the daily prednisone dose below 7.5mg/day in the first 12 months of treatment or a reduction by 50% of the initial (baseline) dose.
How would this drug affect the sequencing of therapies for the target condition?
As discussed in the previous section, the sequence of therapies for SLE includes antimalarials, glucocorticoids and immunosuppressives. For patients without private access, there are currently no available options after treatment failure.
Anifrolumab should become available through public access to such patients. This is not a significant departure from the current practice but rather addresses the management of refractory patients where current therapies are associated with significant toxicity.
Of note, belimumab is currently available only for eligible patients with private access.
There should be an opportunity to treat patients in a subsequent line of therapy as discussed in the previous section (patients with frequent flares and “steroid-dependent” patients).
Which patients would be best suited for treatment with the drug under review?
The patients most likely to respond to anifrolumab are
The patients with active SLE who have failed treatment with a combination of antimalarials, glucocorticoids and/or immunosuppressive or are intolerant to any of these drugs.
The patients who experience frequent flares from any organ/system.
The patients who are “steroid-dependent”.
These patients are in most need of an intervention.
How would patients best suited for treatment with the drug under review be identified?
We believe that the patients that are best suited for anifrolumab should be identified from the aforementioned categories and assessed by a physician with expertise in the management of SLE before commencing the drug.
SLE diagnosis is at times challenging and may evade for years in the cases on non-specific (or spontaneously remitting) presenting symptoms. Most of the required diagnostic tests are available in Canada either through hospital- or community-based laboratories. Underdiagnosis may occur, particularly in the mild cases.
However, this is not expected to affect treatment with anifrolumab since the target population is mainly patients with established disease who already failed previous treatments.
Which patients would be least suitable for treatment with the drug under review?
Patients who are in sustained remission under antimalarials alone or in combination with immunosuppressives and low dose prednisone (<7.5mg/day).
Is it possible to identify those patients who are most likely to exhibit a response to treatment with the drug under review?
These patients can be identified on clinical grounds based on the aforementioned criteria.
Serologic activity (increased anti-dsDNA titers and/or decreased complements C3 and/or C4) can be assessed in most hospital- and community-based laboratories. These tests are widely available in Canada.
What outcomes are used to determine whether a patient is responding to treatment in clinical practice?
The outcomes used to determine response to treatment in academic centers are similar to the ones used in most clinical trials. These include the improvement of structured indices like the SLEDAI-2K (Systemic Lupus Erythematosus Disease Activity Index 2000) and the BILAG (British Isles Lupus Assessment Group). Both indices assess a variety of manifestations from various organ/systems as well as laboratory parameters that are relevant to lupus activity. Other measures include the Physician’s Global Assessment (PGA) that relies on the physician’s impression on a standardized scale.
Other outcomes include the decrease in the daily prednisone dose, the delay in damage accumulation as well as the normalization of serologic activity.
What would be considered a clinically meaningful response to treatment?
A clinically meaningful response to treatment should include any of the following
The reduction of the severity and frequency of symptoms (disease activity) as reflected by the SLEDAI-2K and/or BILAG.
The reduction of daily prednisone dose to levels lower than 7.5mg/day.
The reduction of the frequency and intensity of flares
These outcomes will lead to a significant improvement of the patients’ prognosis.
How often should treatment response be assessed?
Response to treatment should be assessed on a quarterly basis. Sufficient time (at least 12 months) should be allowed for the outcomes to be observed.
What factors should be considered when deciding to discontinue treatment?
Treatment should be discontinued
Immediately in cases of allergy/intolerance
After 12 months, in cases where no response can be demonstrated
After 12 months, if the daily prednisone dose exceeds 7.5mg (or more than 50% from baseline) in “steroid-dependent” patients
After 12 months, if severe flares requiring treatment escalation (particularly with glucocorticoids and/or immunosuppressives) continue to occur in patients with frequent flares
What settings are appropriate for treatment with the drug under review?
Hospital and specialty infusion clinics with experience in the intravenous administration of biologic drugs are the most appropriate for anifrolumab infusion.
For non-oncology drugs, is a specialist required to diagnose, treat, and monitor patients who might receive the drug under review?
Physicians with expertise in the management and treatment of patients with SLE would be required to monitor patients treated with anifrolumab.
Additional Information
The prevalence of SLE in North America is estimated at 1-2 patients in 1000 people, accounting to 37000-74000 patients in Canada. The incidence is approximately 7-8 patients in 100,000 population, meaning that approximately 2600-3000 patients are newly diagnosed every year in Canada. The prevalence and incidence are relatively higher in certain ethnic minorities including African Canadians and First Nations. Although considered a rare disease, SLE has a disproportionate impact on society based on the following facts:
The mean age at onset is 20-40 years of age (in approximately 70% of the patients) and the vast majority (almost 90%) are women. This means that major complications such as death, cardiovascular events, end-stage renal disease and others are detected early in life (5th or 6th decade).
The 10-year survival is estimated at 95% in developed countries. The mean age at death is approximately 60 years in Ontario in the last decade whereas life expectancy is estimated at 82 years.
About 50% of lupus patients will develop lupus nephritis during disease course. Approximately 17-33% of them will develop end-stage renal disease requiring dialysis (and/or transplantation) after 10 years.
About 10-12% of lupus patients on prolonged glucocorticoids will develop osteonecrosis is one or more large joints (including hips and knees). About half of them will need a total joint replacement in the next 12 months from symptom initiation.
About one third of lupus patients will develop glucocorticoid-induced osteoporosis. Approximately 11% will suffer fragility fractures.
Approximately 5-10% of lupus patients will suffer a major cardiovascular event (myocardial infarction, stroke) during disease course.
Cognitive impairment is detected in 30-45% of lupus patients during disease course.
The complications/co-morbidities described above are clearly demonstrating the tremendous impact of SLE on the patients. The cardinal factors that contribute to these are disease activity and concomitant glucocorticoids. Most of these complications occur early and severely affect the patients’ quality of life. In general, about 20-30% of lupus patients are unable to work after the first five years from diagnosis. After 10 years, about half of lupus patients are not able to work while this number grows to 75% after 25 years. Practically, very few lupus patients will be working until normal retirement age.
The quality of life (QoL) is significantly impaired in SLE patients by both the burden of the disease and the administered treatments. Several studies have demonstrated an impact on physical, mental and social health aspects. The most important associated factors are chronic pain, fatigue and accumulated damage. Remission is associated with improved quality of life measures for both the physical and mental components of QoL indices.
The medical costs of SLE are substantial, with a mean total medical care cost of 52000 USD over four years. SLE flares are experienced by more than 90% of patients during disease course, with an average of 2.6 flares per patient per year. Patients with at least one severe flare during the follow-up period had an annual cost of 50000 USD. Patients with at least one severe flare had more than twice the costs of patients with moderate or mild flares. SLE patients have significantly higher health care utilization and higher overall expenditures than patients without SLE (11000 USD more total cost per year). The overall cost of lupus in the US is estimated at $13 billion. That means that in Canada, this cost may exceed $1.3 billion (USD).
Based on the above, it is clear that better treatment strategies are needed for the management of patients with SLE. According to the currently available data, we believe that anifrolumab will offer solutions to refractory patients and this will translate in improved outcomes in the near future. Therefore, we trust that you will consider this application positively and approve the reimbursement of anifrolumab for certain patient groups, as described in Section 6.4.
Conflict of Interest Declarations — Canadian Network for Improved Outcomes for Systemic Lupus Erythematosus
To maintain the objectivity and credibility of the CADTH drug review programs, all patients in the drug review processes must disclose any real, potential, or perceived conflicts of interest. This conflict-of-interest declaration is required for participation. Declarations made do not negate or preclude the use of the clinician group input. CADTH may contact your group with further questions, as needed. Please see the Procedures for CADTH Drug Reimbursement Reviews (section 6.3) for further details.
Did you receive help from outside your clinician group to complete this submission? If yes, please detail the help and who provided it.
No
Did you receive help from outside your clinician group to collect or analyze any information used in this submission? If yes, please detail the help and who provided it.
No
List any companies or organizations that have provided your group with financial payment over the past two years AND who may have direct or indirect interest in the drug under review. Please note that this is required for each clinician who contributed to the input — please add more tables as needed (copy and paste). It is preferred for all declarations to be included in a single document.
Declaration for Clinician 1
Name: Dr. Konstantinos Tselios, MD, PhD
Position: Assistant Professor, Department of Medicine, McMaster University
Date: 09-02-2022
Table 11: Conflict of Interest Declaration for CaNIOS Clinician 1
Company | Check Appropriate Dollar Range | |||
|---|---|---|---|---|
$0 to 5,000 | $5,001 to 10,000 | $10,001 to 50,000 | In Excess of $50,000 | |
Astra Zeneca | X | — | — | — |
Declaration for Clinician 2
Name: Dr. Christine Peschken MD, MSc, FRCPC
Position: Professor of Medicine and Community Health Sciences, University of Manitoba
Date: 09-02-2022
Table 12: Conflict of Interest Declaration for CaNIOS Clinician 2
Company | Check Appropriate Dollar Range | |||
|---|---|---|---|---|
$0 to 5,000 | $5,001 to 10,000 | $10,001 to 50,000 | In Excess of $50,000 | |
Astra Zeneca | X | — | — | — |
GlaxoSmithKline | X | — | — | — |
Declaration for Clinician 3
Name: Dr. John Hanly, MD, FRCPC
Position: Professor of Medicine and Pathology, Department of Medicine (Rheumatology), attending staff rheumatologist, Queen Elizabeth II Health Sciences Center, Dalhousie University, Halifax, NS, Canada
Date: 09-02-2022
Table 13: Conflict of Interest Declaration for CaNIOS Clinician 3
Company | Check Appropriate Dollar Range | |||
|---|---|---|---|---|
$0 to 5,000 | $5,001 to 10,000 | $10,001 to 50,000 | In Excess of $50,000 | |
Astra Zeneca | X | — | — | — |
Eli Lilly | X | — | — | — |
Declaration for Clinician 4
Name: Dr. Judah Denburg, MD, FRCP(C)
Position: William J. Walsh Chair in Medicine, Professor, McMaster University
Date: 09-02-2022
Table 14: Conflict of Interest Declaration for CaNIOS Clinician 4
Company | Check Appropriate Dollar Range | |||
|---|---|---|---|---|
$0 to 5,000 | $5,001 to 10,000 | $10,001 to 50,000 | In Excess of $50,000 | |
None | — | — | — | — |
Declaration for Clinician 5
Name: Dr. Mark Matsos, MD, FRCPC
Position: Associate Professor, Department of Medicine, McMaster University
Date: 08-02-2022
Table 15: Conflict of Interest Declaration for CaNIOS Clinician 5
Company | Check Appropriate Dollar Range | |||
|---|---|---|---|---|
$0 to 5,000 | $5,001 to 10,000 | $10,001 to 50,000 | In Excess of $50,000 | |
Astra-Zeneca | — | X | — | — |
Declaration for Clinician 6
Name: Dr. Kimberly Legault, MD, MSc, PRCPC
Position: Associate Professor, Department of Medicine, McMaster University
Date: 10/02/2022
Table 16: Conflict of Interest Declaration for CaNIOS Clinician 6
Company | Check Appropriate Dollar Range | |||
|---|---|---|---|---|
$0 to 5,000 | $5,001 to 10,000 | $10,001 to 50,000 | In Excess of $50,000 | |
None | — | — | — | — |
Declaration for Clinician 7
Name: Dr. Derek Haaland, MD, MSc, FRCPC
Position: Associate Clinical Professor, Department of Medicine, McMaster University
Date: 09-02-2022
Table 17: Conflict of Interest Declaration for CaNIOS Clinician 7
Company | Check Appropriate Dollar Range | |||
|---|---|---|---|---|
$0 to 5,000 | $5,001 to 10,000 | $10,001 to 50,000 | In Excess of $50,000 | |
AbbVie | X | — | — | — |
Amgen | X | — | — | — |
AstraZeneca | X | — | — | — |
Bristol-Myers Squibb | X | — | — | — |
Eli-Lilly | X | — | — | — |
GlaxoSmithKline | X | — | — | — |
Janssen | X | — | — | — |
Merck | X | — | — | — |
Novartis | X | — | — | — |
Pfizer | X | — | — | — |
Roche | X | — | — | — |
Sanofi-Genzyme | X | — | — | — |
Takeda | X | — | — | — |
UCB | X | — | — | — |
Declaration for Clinician 8
Name: Dr. Janet Pope, MD, FRCPC
Position: Professor, Western University, Schulich School of Medicine and Dentistry
Date: 09-02-2022
Table 18: Conflict of Interest Declaration for CaNIOS Clinician 8
Company | Check Appropriate Dollar Range | |||
|---|---|---|---|---|
$0 to 5,000 | $5,001 to 10,000 | $10,001 to 50,000 | In Excess of $50,000 | |
Astra Zeneca | X | — | — | — |
GlaxoSmithKline | X | — | — | — |
Declaration for Clinician 9
Name: Dr. Lily Lim, MBBS, MRCPCH, FRCPC, PhD
Position: Assistant Professor of Paediatric, University of Manitoba
Date: 08 Feb 2022
Table 19: Conflict of Interest Declaration for CaNIOS Clinician 9
Company | Check Appropriate Dollar Range | |||
|---|---|---|---|---|
$0 to 5,000 | $5,001 to 10,000 | $10,001 to 50,000 | In Excess of $50,000 | |
None | — | — | — | — |
Declaration for Clinician 10
Name: Dr. Ann Clarke, MD, MSc, FRCPC
Position: Professor of Medicine, Director of the University of Calgary Lupus Centre of Excellence, Cumming School of Medicine, University of Calgary
Date: 08-02-2022
Table 20: Conflict of Interest Declaration for CaNIOS Clinician 10
Company | Check Appropriate Dollar Range | |||
|---|---|---|---|---|
$0 to 5,000 | $5,001 to 10,000 | $10,001 to 50,000 | In Excess of $50,000 | |
AstraZeneca | X | — | — | — |
GSK | X | — | — | — |
BMS | X | — | — | — |
Declaration for Clinician 11
Name: Dr. Carol Hitchon, MD, MSc, FRCPC
Position: Associate Professor, University of Manitoba
Date: 08/02/2022
Table 21: Conflict of Interest Declaration for CaNIOS Clinician 11
Company | Check Appropriate Dollar Range | |||
|---|---|---|---|---|
$0 to 5,000 | $5,001 to 10,000 | $10,001 to 50,000 | In Excess of $50,000 | |
AstraZeneca | X | — | — | — |
Pfizer Canada | — | — | X | — |
Declaration for Clinician 12
Name: Dr. Annaliese Tisseverasinghe, MD, MSc, FRCPC
Position: Assistant Professor, University of Manitoba
Date: 09-02-2022
Table 22: Conflict of Interest Declaration for CaNIOS Clinician 12
Company | Check Appropriate Dollar Range | |||
|---|---|---|---|---|
$0 to 5,000 | $5,001 to 10,000 | $10,001 to 50,000 | In Excess of $50,000 | |
None | — | — | — | — |
Declaration for Clinician 13
Name: Megan R.W. Barber, MD, PhD, FRCPC
Position: Clinical Assistant Professor, University of Calgary
Date: 09-02-2022
Table 23: Conflict of Interest Declaration for CaNIOS Clinician 13
Company | Check Appropriate Dollar Range | |||
|---|---|---|---|---|
$0 to 5,000 | $5,001 to 10,000 | $10,001 to 50,000 | In Excess of $50,000 | |
Janssen | X | — | — | — |
AstraZeneca | X | — | — | — |
AbbVie | X | — | — | — |
GSK | X | — | — | — |
Sanofi Genzyme | X | — | — | — |
Declaration for Clinician 14
Name: Stephanie Keeling, MD, FRCPC
Position: Professor of Medicine, University of Alberta
Date: 09-02-2022
Table 24: Conflict of Interest Declaration for CaNIOS Clinician 14
Company | Check Appropriate Dollar Range | |||
|---|---|---|---|---|
$0 to 5,000 | $5,001 to 10,000 | $10,001 to 50,000 | In Excess of $50,000 | |
Astra Zeneca | X | — | — | — |
Pfizer | X | — | — | — |
UCB | X | — | — | — |
Galapagos | X | — | — | — |
AbbVie | — | — | X | — |
Janssen | — | X | — | — |
ISSN: 2563-6596
Disclaimer: The information in this document is intended to help Canadian health care decision-makers, health care professionals, health systems leaders, and policy-makers make well-informed decisions and thereby improve the quality of health care services. While patients and others may access this document, the document is made available for informational purposes only and no representations or warranties are made with respect to its fitness for any particular purpose. The information in this document should not be used as a substitute for professional medical advice or as a substitute for the application of clinical judgment in respect of the care of a particular patient or other professional judgment in any decision-making process. The Canadian Agency for Drugs and Technologies in Health (CADTH) does not endorse any information, drugs, therapies, treatments, products, processes, or services.
While care has been taken to ensure that the information prepared by CADTH in this document is accurate, complete, and up-to-date as at the applicable date the material was first published by CADTH, CADTH does not make any guarantees to that effect. CADTH does not guarantee and is not responsible for the quality, currency, propriety, accuracy, or reasonableness of any statements, information, or conclusions contained in any third-party materials used in preparing this document. The views and opinions of third parties published in this document do not necessarily state or reflect those of CADTH.
CADTH is not responsible for any errors, omissions, injury, loss, or damage arising from or relating to the use (or misuse) of any information, statements, or conclusions contained in or implied by the contents of this document or any of the source materials.
This document may contain links to third-party websites. CADTH does not have control over the content of such sites. Use of third-party sites is governed by the third-party website owners’ own terms and conditions set out for such sites. CADTH does not make any guarantee with respect to any information contained on such third-party sites and CADTH is not responsible for any injury, loss, or damage suffered as a result of using such third-party sites. CADTH has no responsibility for the collection, use, and disclosure of personal information by third-party sites.
Subject to the aforementioned limitations, the views expressed herein are those of CADTH and do not necessarily represent the views of Canada’s federal, provincial, or territorial governments or any third-party supplier of information.
This document is prepared and intended for use in the context of the Canadian health care system. The use of this document outside of Canada is done so at the user’s own risk.
This disclaimer and any questions or matters of any nature arising from or relating to the content or use (or misuse) of this document will be governed by and interpreted in accordance with the laws of the Province of Ontario and the laws of Canada applicable therein, and all proceedings shall be subject to the exclusive jurisdiction of the courts of the Province of Ontario, Canada.
The copyright and other intellectual property rights in this document are owned by CADTH and its licensors. These rights are protected by the Canadian Copyright Act and other national and international laws and agreements. Users are permitted to make copies of this document for non-commercial purposes only, provided it is not modified when reproduced and appropriate credit is given to CADTH and its licensors.
Redactions: Confidential information in this document may be redacted at the request of the sponsor in accordance with the CADTH Drug Reimbursement Review Confidentiality Guidelines.
Stakeholder Input: The views expressed in each submission are those of the submitting organization or individual; not necessarily the views of CADTH or of other organizations. As such, they are independent of CADTH and do not necessarily represent or reflect the view of CADTH. No endorsement by CADTH is intended or should be inferred. By filing with CADTH, the submitting organization or individual agrees to the full disclosure of the information. CADTH does not edit the content of the submissions.
CADTH does use reasonable care to prevent disclosure of personal information in posted material; however, it is ultimately the submitter’s responsibility to ensure no identifying personal information or personal health information is included in the submission. The name of the submitting organization or individual and all conflict of interest information are included in the submission; however, the name of the author, including the name of an individual patient or caregiver submitting the patient input, are not posted.
Accessibility: CADTH is committed to treating people with disabilities in a way that respects their dignity and independence, supports them in accessing material in a timely manner, and provides a robust feedback process to support continuous improvement. All materials prepared by CADTH are available in an accessible format. Where materials provided to CADTH by a submitting organization or individual are not available in an accessible format, CADTH will provide a summary document upon request. More details on CADTH’s accessibility policies can be found here.
About CADTH: CADTH is an independent, not-for-profit organization responsible for providing Canada’s health care decision-makers with objective evidence to help make informed decisions about the optimal use of drugs, medical devices, diagnostics, and procedures in our health care system.
Funding: CADTH receives funding from Canada’s federal, provincial, and territorial governments, with the exception of Quebec.