Drugs, Health Technologies, Health Systems
Health Technology Review
Cryoneurolysis for Patients Undergoing Total Knee Arthroplasty
Key Messages
What Is the Issue?
Knee replacement surgery (knee arthroplasty) is a common surgery in Canada primarily used to treat knee osteoarthritis, which causes pain, swelling, and reduced mobility. Although total knee arthroplasty (TKA) is effective, many people who undergo the procedure experience substantial postoperative pain. Effective pain control is important for helping patients move and leave the hospital sooner, improving patient outcomes. Current best practices emphasize multimodal pain management strategies while limiting opioid use.
Cryoneurolysis uses extreme cold (approximately −70°C) to temporarily damage and disrupt targeted nerve function to reduce pain for weeks or months and is of interest for pain management after TKA. However, its clinical effectiveness and cost-effectiveness compared to those of other pain management strategies for TKA are uncertain. This Rapid Review was requested by policy decision-makers.
What Did We Do?
To inform decisions regarding the use of cryoneurolysis for pain management after TKA, we conducted a rapid review to summarize evidence comparing the clinical effectiveness and cost-effectiveness of cryoneurolysis to those of other pain management interventions not involving cryoneurolysis for people undergoing TKA.
We searched key resources, including journal citation databases, and conducted a focused internet search for relevant evidence published since 2020.
What Did We Find?
We identified 3 systematic reviews and 1 companion report to a cohort study. No cost-effectiveness studies were identified.
All studies were conducted in the US and mostly included older adults (mean age 65 years or older) undergoing primary unilateral TKA. Study sizes ranged from 16 to 356 participants with follow-up ranging from 3 weeks to 12 months. Two cryoneurolysis devices were compared with sham cryoneurolysis or standard care, but the specific nerves targeted, timing, treatment protocols, and standard of care varied across studies.
Overall, studies suggest that cryoneurolysis may modestly reduce early postoperative pain (up to 2 weeks post-TKA), opioid use, and hospital length of stay. However, not all statistically significant differences were large enough to be considered clinically meaningful, and results were inconsistent at most time points. There were no consistent associations observed between cryoneurolysis and physical function or sleep disturbance. Serious adverse events were rare, and larger studies are needed to better understand the risks. The evidence base has limitations, including risk of bias, inconsistent outcomes and results, and uncertain relevance to the context in Canada.
What Does This Mean?
Cryoneurolysis may be associated with modest benefits in early postoperative pain, opioid use, and hospital stay without clear increases in serious adverse events compared to control interventions in the included studies. Limitations in the evidence reduce confidence in these findings, and additional research is needed.
Decision-makers could consider differences in participant populations, surgical procedures, standards of care, and potential equity and implementation issues when deciding how applicable this evidence is to their context.
Abbreviations
AE
adverse event
AM-PAC
Activity Measure for Post-Acute Care (AM-PAC)
BMI
body mass index
COI
conflict of interest
GRADE
Grading of Recommendations Assessment, Development and Evaluation
KOOS
Knee Injury and Osteoarthritis Outcome Score
KOOS, JR
Knee Injury and Osteoarthritis Outcome Score for Joint Replacement
MME
morphine milligram equivalent
OKS
Oxford Knee Score
PROM
patient-reported outcome measure
PROMIS
Patient-Reported Outcomes Measurement Information System
PROMPT
Patient-Reported Outcome Measure for Improving Pain Treatment
RCT
randomized controlled trial
RoB
risk of bias
SAE
serious adverse event
SF-12
Short Form (12) Health Survey
SF-36
Short Form (36) Health Survey
SR
systematic review
TKA
total knee arthroplasty
WOMAC
Western Ontario and McMaster Universities Osteoarthritis Index
Research Questions
What is the clinical effectiveness of cryoneurolysis compared to pain management interventions not involving cryoneurolysis for patients undergoing total knee arthroplasty?
What is the cost-effectiveness of cryoneurolysis compared to pain management interventions not involving cryoneurolysis for patients undergoing total knee arthroplasty?
Context and Policy Issues
What Is Knee Arthroplasty?
Knee arthroplasty, or knee replacement surgery, involves replacing all or part of the knee joint with an artificial implant. In total knee arthroplasty (TKA), both the internal and external joint surfaces are replaced. The procedure is most often performed for older adults (e.g., aged older than 65 years) to treat osteoarthritis,1,2 wherein the cartilage supporting the knee joint has eroded, causing pain, swelling, and reduced mobility. More than 85,000 knee replacement surgeries were performed in Canada in 2023,3 and knee replacement is 1 of the most common inpatient surgeries.4 Rates of knee replacement surgeries are increasing in many countries, in part due to aging populations and growing obesity rates.1,3,5 Outpatient knee replacement surgery is also becoming more common in many regions in Canada, which may decrease costs and wait times.1,3
TKA is widely considered effective for reducing pain, increasing mobility, and improving quality of life,6,7 with prosthetic joints typically lasting at least 15 to 20 years.1 Despite its effectiveness, TKA is associated with substantial postoperative pain, which can delay early mobilization and lead to longer hospital stays, higher costs, and worse patient outcomes. Historically, pain management relied on opioids, yet this carries concerns of adverse effects, potential for increasing costs and longer hospital stays,8 and long-term dependency, which has led to changes in the standard of care over time.
Current recommendations for pain management post-TKA are multimodal and combine pharmacologic and nonpharmacologic approaches, such as spinal anesthesia, nonsteroidal anti-inflammatory drugs, acetaminophen, and regional anesthesia, to target different pain pathways.9-11 Recommended multimodal pain management protocols vary and new approaches, including nonpharmacologic approaches, are of interest to optimize pain control, minimize opioid use, and improve patient experience.
What Is Cryoneurolysis?
Cryoneurolysis — also called cryoneuroablation and cryoanalgesia — uses extremely cold temperatures (typically −70°C) to temporarily damage and disrupt nerve function, inhibiting pain signals between the peripheral and central nervous systems. Following the introduction of cryoneurolysis in the 1960s,12,13 modern cryoneurolysis techniques involve delivering pressurized gases (e.g., nitrous oxide, carbon dioxide) via a closed-ended needle, often guided by ultrasound, to create an ice ball that damages the nerve axon (a process called Wallerian degeneration). The procedure is minimally invasive and can be performed in outpatient settings, and analgesia can last from weeks to months14 until the nerve is regenerated.
Cryoneurolysis has been used to treat both acute and chronic pain conditions including postsurgical pain, trigeminal neuralgia, and phantom limb pain, and it is increasingly of interest to help manage TKA-related pain.15 The nerves targeted for TKA-related pain typically include the anterior superficial genicular nerves, specifically the infrapatellar branch of the saphenous nerve and the anterior femoral cutaneous nerve.13,15 Proposed benefits of cryoneurolysis include extended pain relief, ease of implementation, and cost-effectiveness.15 Side effects may include bleeding, bruising, infection, hair loss, and skin pigmentation changes, and cryoneurolysis is contraindicated for people with conditions such as bleeding disorders, cold urticaria, or Raynaud syndrome.15 We are aware of 1 cryoneurolysis device marketed for TKA — Iovera — that is approved by Health Canada. Many other cryoneurolysis devices are available in Canada, of which some are approved for other indications or their regulation status for use for TKA in Canada is unclear.
Why Is It Important to Do This Review?
Evidence suggests that cryoneurolysis may reduce pain, opioid use, and length of hospital stay and improve function after TKA.11,16-20 However, the risks as well as the validity and generalizability of existing research to settings in Canada are unclear. Cryoneurolysis is being considered as part of multimodal pain management for TKA, with the aim to reduce pain, opioid use, and costs, and to potentially improve physical function. However, its comparative clinical effectiveness and cost-effectiveness relative to other pain management strategies are not clear. Policy decision-makers have requested evidence to inform decisions regarding cryoneurolysis. To assess the available literature, Canada’s Drug Agency compiled a preliminary reference list of relevant research, which was used to prioritize 2 rapid reviews: cryoneurolysis for TKA and cryoneurolysis for surgical stabilization of rib fractures.
Objectives
To support decision-making, we prepared this Rapid Review to summarize and critically appraise available evidence regarding the clinical effectiveness and cost-effectiveness of perioperative use of cryoneurolysis compared to pain management interventions not involving cryoneurolysis for people undergoing TKA.
Methods
An information specialist conducted a customized literature search, balancing comprehensiveness with relevance, of multiple sources and grey literature on November 27, 2025. One reviewer screened citations and selected studies based on the inclusion criteria presented in Table 1. One reviewer critically appraised included studies using established critical appraisal tools. Appendix 1 presents a detailed description of methods and selection criteria for included studies.
Criteria | Description |
|---|---|
Population | Participants (all ages) undergoing total knee arthroplasty |
Intervention | Cryoneurolysis administered using any device or system, alone or with background therapy |
Comparator | Alternative pain management interventions not involving cryoneurolysis (e.g., pharmacotherapy, physical therapy, psychological therapy, multimodal pain management strategies), sham cryoneurolysis, or no additional treatment (e.g., pain management protocol per institution) |
Outcomes | Q1: Pain, physical function, self-efficacy, quality of life, hospital length of stay, analgesic use, adverse events Q2: Cost-effectiveness (e.g., cost per quality-adjusted life-year gained) |
Study designs | Q1: HTAs, SRs, RCTs, and nonrandomized studies Q2: HTAs, SRs, and economic evaluations |
Publication date | January 1, 2020, to November 27, 2025 |
HTA = health technology assessment; RCT = randomized controlled trial; SR = systematic review.
Summary of Evidence
Quantity of Research Available
We included 4 eligible reports: 3 systematic reviews (SRs)21-23 and 1 cohort study,24 which is a companion (additional participants with longer-term follow-up) to a study included in 1 SR.22 All studies assessed clinical effectiveness (research question 1); none assessed cost-effectiveness (research question 2). Appendix 2 presents the Preferred Reporting Items for Systematic reviews and Meta-Analyses (PRISMA)25 flow diagram of the study selection. The SR by Diep et al.23 had broader inclusion criteria than this report, including studies of cryoneurolysis for noncancer knee pain, not limited to TKA; we include only the 5 studies that were relevant to the current rapid review. Similarly, the SR by Goodwin et al.21 included 4 studies (in 5 reports) relevant to this rapid review (1 case series excluded). Overall, the SRs21-23 included 7 primary studies of relevance to the current rapid review. Appendix 6 presents a citation matrix illustrating the overlap between the SRs.
Summary of Study Characteristics
Research Question 1: What Is the Clinical Effectiveness of Cryoneurolysis for TKA?
Four reports met the eligibility criteria for inclusion in this review: 3 SRs21-23 (including 7 relevant studies) and 1 cohort study.24 Appendix 3 provides details of the characteristics of the included SRs (Table 2) and primary studies (Table 3). All SRs searched for experimental and observational studies comparing any cryoneurolysis device with pain management strategies not involving cryoneurolysis. Across the SRs and primary reports, 7 relevant studies were identified; 4 in the Goodwin et al. review21 (electronic search up to April 30, 2024); 6 in the Hajiaghajani et al. review22 (electronic search up to December 25, 2025); and 5 in the Diep et al. review23 (electronic search up to February 2023, limited to English-language studies).
All studies were conducted in the US (primarily in academic or outpatient clinics within the past decade); 3 were randomized controlled trials (RCTs) and 4 were cohort studies. Studies had sample sizes ranging between 16 and 356 participants and had follow-up periods of up to 3 weeks (1 study), 6 weeks (1 study), 12 weeks (3 studies), or 12 months (2 studies). Participants were mainly older adults (mean age between 65 years and 68 years) undergoing primary unilateral TKA (i.e., 1 knee joint). Women composed 53% to 70% of study participants and men 30% to 47%, with no other sexes or genders reported. Mean body mass index (BMI) ranged from 27 kg/m2 to 32 kg/m2, and at least 1 RCT in 1 SR21 excluded participants with BMI greater than or equal to 40 kg/m2. Race or ethnicity was reported in 3 studies (1 included cohort study24 and the primary reports of 3 studies included in the SRs,21-23 of which 1 is a companion to Ng et al.24) and participants were classified as follows within studies: approximately 10% to 20% African American or Black, 80% white, and 5% or less for other defined racial or ethnic categories (including Asian, American Indian or Alaskan Native, Native Hawaiian or other Pacific Islander, Hispanic or Latino [wording of original source]).
Other characteristics, such as American Society of Anesthesiologists physical status and opioid history, were inconsistently reported. Where reported, most participants were classified as having American Society of Anesthesiologists physical status ranging from I to III, with some studies restricted to this population (e.g., 1 RCT in 1 SR21). Two cohort studies included in 2 SRs22,23 reported that the proportion of participants with current or previous opioid use ranged between approximately 10% to 20%, and other studies excluded those with recent use (e.g., 1 RCT in all SRs21-23) or previous opioid addiction (e.g., 1 RCT in 1 SR21).
Interventions included preoperative use of the Iovera cryoneurolysis device (Pacira Pharmaceuticals, Inc.) versus sham cryoneurolysis (1 RCT), Iovera cryoneurolysis versus standard care (1 RCT and 4 cohort studies), and the PainBlocker cryoneurolysis device (Epimed, Dallas, Texas) versus sham cryoneurolysis (1 RCT). Protocols varied in terms of targeted nerves (e.g., infrapatellar branch of the saphenous nerve, with or without the anterior femoral cutaneous nerve and deeper nerves), localization methods (anatomic landmarks, ultrasound, or both), number and duration of cycles (between 1 to 6 cycles, 50 seconds to 120 seconds per cycle), temperatures (−125°C to −70°C), and timing (between 0 to 30 days presurgery). Standard multimodal pain management was permitted in all study arms but was inconsistently described and varied across studies (refer to Table 3 for details). No included SR reported the training or credentials of personnel performing cryoneurolysis.
The following outcomes were reported and are grouped, where relevant, by the Patient-Reported Outcome Measures (PROMs) for Improving Pain Treatment (PROMPT) core outcome domains:26
Pain intensity
Assessed in hospital, up to 2 weeks, 6 weeks, 3 months, or 12 months; also captured in broader PROMs
Analgesic use (opioid consumption)
Assessed up to 3 weeks, 6 weeks, 3 months, and 12 months
Physical function
Assessed using patient- and clinician-assessed measures at 6 weeks, 3 months, and 12 months
Length of hospital stay
Sleep disturbances
Assessed up to 3 weeks and 12 months; also captured in broader PROMs.
Adverse events (AEs)
Assessed up to 3 weeks, 6 weeks, 3 months, and 6 months
Research Question 2: What Is the Cost-Effectiveness of Cryoneurolysis for TKA?
This rapid review did not identify relevant studies that addressed research question 2; therefore, no summary can be provided.
Summary of Critical Appraisal
Appendix 4 (Table 4 and Table 5) provides additional details about the strengths and limitations of the included publications.
Research Question 1: What Is the Clinical Effectiveness of Cryoneurolysis for TKA?
Systematic Reviews
The 3 included SRs21-23 have several strengths, including clearly defined objectives and eligibility criteria and electronic literature search strategies of multiple databases. Authors of only 2 SRs21,23 reported additional search methods: both reported searching reference lists, 1 searched clinical trials registries,23 and 1 reported conducting forward citation searching.21 All review teams selected studies in duplicate; 2 teams extracted data in duplicate; all provided the number of excluded studies after full-text review; and all used satisfactory techniques for assessing risk of bias (RoB), although 1 SR team21 reported assessing RCTs with a tool intended to assess nonrandomized studies. One SR report22 did not state whether the review was funded, and the authors of the other 2 SRs21,23 declared they received no funding for the review. The authors of 2 SRs21,23 declared no conflict of interest (COI) while authors of the other SR22 disclosed COIs due to support from manufacturers of knee system devices, but none from known manufacturers of cryoneurolysis devices.
To what extent review methods of SRs were determined before review conduct is unclear. All SRs were registered: 1 on the day of the literature search,21 1 before the literature search was conducted (although the registration record includes limited details of the planned methods or analyses),22 and 1 after an initial literature search23 that was later updated for the publication. One SR limited study eligibility by language (English).23 All SRs presented some important characteristics of the included studies, but none collected all important variables for assessing their validity and generalizability. For example, the Hajiaghajani et al. review22 presented its study design; the age, BMI, and sex or gender of the study participants; concomitant therapies; and some intervention and comparator details. The Diep et al. review23 presented the study settings (country) and important intervention and comparator details not provided in the Hajiaghajani et al. review.22 The Goodwin et al. review21 reported only the age and gender or sex of participants, plus a few interventions’ details.
Two SRs21,22 included meta-analyses. In 1 SR,21 the meta-analysis methods were not deemed appropriate because duplicate data were included from 2 companion papers with nearly identical participant populations. Meta-analyses in both SRs combined experimental and observational study results; did not report whether and how effect measures were adjusted for covariates; and did not report exploring statistical heterogeneity, where relevant (although this was identified for only 1 analysis). One SR22 did not consider study RoB in relation to the meta-analysis results (the other stated that all studies were at low RoB). Both review teams used Grading of Recommendations Assessment, Development and Evaluation (GRADE)27 methodology to classify the certainty of evidence, which integrates individual study RoB in overall results interpretation. The authors of the other SR23 did not conduct any meta-analyses and presented the RoB results in the narrative summary. No SR authors assessed publication bias; authors of 1 SR22 stated this was due to limited studies and did not downgrade their GRADE assessments.22,23
The RoB of the 2 RCTs and 4 retrospective cohorts studies included in the SRs,21-23 as assessed by the SR authors, are summarized as follows:
One RCT (by Pacira Pharmaceuticals, Inc.) was rated as having an overall low RoB in 1 SR.
One RCT (by Swisher et al.) was rated as having an overall low RoB in 2 SRs.
One RCT (by Mihalko et al., with a subanalysis by Jennewine et al.) was rated as having a low RoB in 1 SR,21 some concerns in 1 SR,22 and a high RoB in 1 SR.23 This study was downgraded across reviews for all domains assessed, including due to the randomization process, deviations from the intended intervention, missing outcomes data, outcome measurement, and selection of the reported results.
One cohort study (by Mont et al.), a companion to the Ng et al. study24 included in this rapid review, was rated as having an overall low RoB by 1 SR.22
One cohort study (by Lung et al.) was rated as having an overall moderate RoB in 1 SR22 and a high RoB in another.23 This study was downgraded across reviews due to confounding, selection of participants, measurement of outcomes, and selection of reported results.
Two cohort studies (by Urban et al. and by Dasa et al.) were rated as having overall low RoB in 1 SR,21 moderate RoB in 1 SR,22 and high RoB in the other.23 Across reviews, the Urban et al. study was downgraded due to confounding, selection of participants, measurement of outcomes, and selection of reported results. The Dasa et al. study was downgraded for all of these reasons and due to missing data.
Authors of 2 SRs22,23 assessed whether primary study investigators had financial COI (based on disclosures, funding sources, or affiliations) or the primary study funding sources.23 Four of the 6 studies included in the Hajiaghajani et al. review22 were deemed to have financial COIs, and 4 of 5 relevant studies in the Diep et al. review23 received industry funding. The Goodwin et al. review21 did not report the sources of funding of included studies.
Nonrandomized Studies
One cohort study24 was included that is a companion report to a study in 1 included SR.22 This study analyzed data from a knee osteoarthritis treatment patient registry. The RoB of this study was assessed using the primary study publication,24 the registration record,28 and the registry protocol.29 The authors clearly described the main study objectives, many important participant characteristics (including distributions of principal confounders within study arms), and estimates of random variability for baseline characteristics and outcomes. However, they did not clearly describe the interventions (cryoneurolysis protocol and standard care), as such details were not recorded in the registry. The staff, places, and facilities where the participants were treated may be representative of the settings where most patients receive treatment, although this was not clear. Many analyses included P values, but not all.
Study participants were not randomized to intervention groups, as this registry is intended to represent real-world implementation; the treating provider decided whether to administer cryoneurolysis based on routine clinical assessment, which may result in selection bias. Similarly, whether those patients who were invited to participate and enrolled in the registry were representative of the entire population from which they were recruited is unclear; the authors did not provide the characteristics of those declining participation, although eligibility criteria are broad. It is also unclear whether rates of treatment with cryoneurolysis versus no cryoneurolysis were consistent over the study period or across study sites.
RoB related to performance, outcome measurement, and outcome assessment also exists in this study. The investigators did not attempt to mask participants or other outcome assessors to the interventions received, and this may have influenced study outcomes, including PROMs. Whether the main outcomes and analyses were prespecified is unclear, as the registration record and protocol were published after recruitment began. The registry record also includes many “primary” outcomes, some of which were not included in the published results. The registry record and protocol stated AEs would be documented; however, the study authors stated the “registry lacks data on…adverse events,” and they did not report any in the publication or discuss the reasons for these differences. Many analyses were adjusted for key baseline characteristics, and while follow-up should be similar between study arms (eligibility required outcome data at 12 months’ follow-up), some time points had substantial missing data, the proportions of which differed between study arms, and reasons for these missing data were not provided.
The authors did not report whether the study was funded or the funding source. Some authors declared COIs associated with the study, although the details were not provided, nor were the methods used to mitigate these conflicts. Pacira Pharmaceuticals, Inc. (manufacturer of a cryoneurolysis device) is the registry sponsor.
Research Question 2: What Is the Cost-Effectiveness of Cryoneurolysis for TKA?
This rapid review did not identify relevant studies that addressed research question 2; therefore, no appraisal can be provided.
Summary of Findings
Appendix 5 presents additional details regarding the main study findings. Data were extracted from SR reports, where possible, with summary measures extracted from primary study reports, where relevant, for additional time points and outcomes not included in SRs.
Research Question 1: What Is the Clinical Effectiveness of Cryoneurolysis for TKA?
Pain Intensity
All included SRs21-23 and the included cohort study24 reported pain intensity, using various measures (e.g., numerical rating scale, visual analogue scale, Brief Pain Inventory–Short Form) at multiple time points (refer to Appendix 5, Table 6). Overall, evidence of an association between cryoneurolysis and pain scores was inconsistent. Some studies reported lower pain scores with cryoneurolysis within the first 2 weeks post-TKA compared to pain management not involving cryoneurolysis, but the observed differences were small and were of unclear clinical relevance. Between 3 weeks’ and 12 months’ follow-up, studies showed no consistent differences between groups.
One SR22 with meta-analysis (2 RCTs, 3 cohort studies) found statistically significantly lower pain scores up to 2 weeks postsurgery with cryoneurolysis treatment compared to pain management without cryoneurolysis (1 outcome and time point selected per study). The review authors rated the certainty of the evidence as high using the GRADE approach.27 The effect size was small and of uncertain clinical relevance.
Another SR21 with meta-analysis (2 RCTs, 2 cohort studies) also reported statistically significantly lower pooled pain scores with cryoneurolysis but included duplicated data (from 2 companion papers with the same population) and did not specify time points (citing only a mean follow-up of 9 months) or outcome measures selected for the analysis, limiting interpretation.
At later time points, results from studies in the SRs varied: 2 RCTs reported similar pain scores at 6 weeks post-TKA, and 1 RCT reported mixed results at 12 weeks post-TKA, depending on the pain outcome measure used.
The included cohort study,24 which is a companion to a study in 1 SR,22 measured pain from 1 week to 12 months post-TKA and reported consistently lower pain scores for treatment with cryoneurolysis and a higher overall proportion of participants achieving clinically meaningful pain relief with cryoneurolysis compared to those who did not receive cryoneurolysis within 6 months (72% vs. 62%, respectively) and within 12 months (71% vs. 63%, respectively). Many results are available only in graphical format, and substantial missing data (where reported) beyond 3-month follow-up limit certainty.
Analgesic Use (Opioid Consumption)
Two SRs22,23 and the included cohort study24 reported opioid use after TKA, using various measurements and time points (refer to Appendix 5, Table 7). Overall, evidence suggests that cryoneurolysis may be associated with reduced opioid consumption at early time points after TKA, which may be clinically relevant; however, the results were inconsistent and the validity of some measurement methods was unclear.
One SR22 with meta-analysis (1 RCT, 2 cohort studies) found lower opioid use at 6 weeks post-TKA with cryoneurolysis compared to pain management not involving cryoneurolysis, though the pooled effect size was considered small. The review authors rated the certainty of the evidence as moderate using the GRADE approach.27
Outside the time point of the meta-analysis, the studies reported mixed results:
Early post-TKA (in hospital to 72 hours): One cohort study found no statistically significant difference in inpatient total mean morphine milligram equivalents (MMEs) of opioids administered in hospital, while 1 RCT and 1 cohort study reported statistically significantly lower opioid use in hospital (administered), at discharge (prescribed), and after 72 hours (self-report) for patients treated with cryoneurolysis. Authors of 1 SR23 judged only 1 of these comparisons, opioid use at discharge in 1 cohort study, as likely to be clinically meaningful.
Two weeks to 3 weeks post-TKA: Two RCTs and 1 cohort study reported inconsistent conclusions regarding the association of cryoneurolysis with opioid use, with some reporting no difference (e.g., total MMEs, cumulative MMEs) across these time points, and 1 cohort study reporting lower cumulative opioid use with cryoneurolysis at 2 weeks post-TKA; authors of 1 SR23 deemed this difference unlikely to be clinically meaningful.
Four weeks to 6 weeks post-TKA: One cohort study found no statistically significant difference in total prescribed MME at 4 weeks for participants regardless of cryoneurolysis use. One RCT reported similar cumulative opioid consumption between groups up to 6 weeks post-TKA; no statistical testing was performed, but standard deviations were wide.
Twelve weeks post-TKA: 1 RCT reported statistically significantly lower opioid use among participants treated with cryoneurolysis compared to those treated without cryoneurolysis; authors of 1 SR23 judged this difference unlikely to be clinically meaningful.
Up to 12 months post-TKA: The included cohort study24 (for which a companion report is included in 1 SR22) assessed the proportion of participants using opioids between 1 week and 12 months post-TKA, finding a statistically significantly lower proportion of participants treated with cryoneurolysis using opioids than those not treated with cryoneurolysis at many time points up to 3 months post-TKA. Inconsistent results were reported thereafter, and they were often limited by substantial missing data.
Physical Function – Patient-Reported and Clinician-Assessed Outcome Measures
Six studies, as well as 2 included SRs,22,23 assessed at least 1 outcome related to physical function or quality of life. A summary of the findings for these outcomes follows and further details may be found in Appendix 5 in Table 8, Table 9, Table 10, Table 11, and Table 12.
Knee Injury and Osteoarthritis Outcome Score (KOOS) and KOOS for Joint Replacement (KOOS, JR): Two SRs22,23 and the included cohort study24 reported physical function using KOOS or KOOS, JR (Table 8). Overall, the evidence suggests that cryoneurolysis is not associated with KOOS or KOOS, JR scores from 3 days to 12 months post-TKA, although findings were inconsistent and limited by missing data at later time points.
One SR with meta-analysis (1 RCT, 3 cohort studies) found no statistically significant differences in KOOS or KOOS, JR scores at 3 months post-TKA for people treated with cryoneurolysis compared to those receiving pain management without cryoneurolysis. The review authors rated the certainty of the evidence as low using the GRADE approach.27
Studies within the SRs also reported this outcome at other time points. One RCT reported larger mean changes in KOOS, JR scores for those treated with cryoneurolysis (based on analyses of area under the curve), suggesting better outcomes, at 72 hours, 2 weeks, and 6 weeks post-TKA; 1 SR21 stated that the clinical relevance of these findings is unclear due to the analysis measure. A cohort study also assessed KOOS domain scores at 2 weeks, 6 weeks, and 12 weeks post-TKA and found no differences for all comparisons, except for increases in KOOS, JR symptom subscale scores at 6 weeks and 12 weeks with cryoneurolysis versus without cryoneurolysis. These differences may be clinically meaningful,23 though missing data limit confidence. Another cohort study found inconsistent results for KOOS, JR scores at 12 months; most analyses suggested no significant difference between study groups, except for KOOS, JR interval scores at 12 months, for which the mean change from baseline was higher for participants treated with cryoneurolysis.
The included cohort study24 (a companion to a study included in the meta-analysis22) reported similar changes from baseline in KOOS, JR scores over time. Only the overall average KOOS, JR score at 12 months favoured treatment with cryoneurolysis, but 1 SR23 suggested this difference is unlikely to be clinically meaningful.
Western Ontario and McMaster Universities Osteoarthritis Index (WOMAC): Overall, evidence from 1 RCT and 1 cohort study included in 1 SR21 and 2 SRs,22,23 respectively (Table 9), showed no association between preoperative cryoneurolysis and post-TKA WOMAC scores at 2 weeks, 6 weeks, or 12 weeks postsurgery compared to pain management not including cryoneurolysis, although confidence in the evidence is uncertain. One cohort study found no statistically significant differences between treatment groups at any time point, although there was substantial missing data at 12 weeks’ follow-up and the authors stated that some WOMAC scores were calculated from the KOOS questionnaire. The RCT record did not report the results of statistical analyses but showed similar change from baseline scores between study arms with large standard deviations in scores in each group.
Short Form 36 (SF-36) and Short Form 12 (SF-12) Health Surveys: Overall, evidence from 1 RCT and 2 cohort studies included in 1 SR21 and 2 SRs,22,23 respectively (Table 10), showed no clear association between preoperative cryoneurolysis and post-TKA SF-36 or SF-12 scores at follow-up at 2 weeks, 6 weeks, 12 weeks, or 12 months compared to pain management without cryoneurolysis. No significant differences were found in absolute or change from baseline scores across primary studies except for 1 cohort study reporting a higher SF-12 mental component score (better outcome) at 12 months, with no corresponding significant difference in change from baseline scores between groups. One RCT did not report the results of statistical analyses but reported wide variability in change from baseline scores in each group.
Other PROMs: Physical function was assessed using other PROMs in 1 RCT and 2 cohort studies included in 1 SR21 and 2 SRs,22,23 respectively (Table 11). The results are summarized as follows:
Oxford Knee Score (OKS): Preoperative cryoneurolysis was not associated with OKS at 2 weeks, 6 weeks, or 12 weeks post-TKA compared to pain management not involving cryoneurolysis in 1 cohort study. Substantial missing data at some time points limit confidence in the conclusion.
Boston University Activity Measure for Post-Acute Care (AM-PAC): Preoperative cryoneurolysis was not associated with inpatient AM-PAC scores compared to pain management not involving cryoneurolysis in 1 cohort study.
Patient-Reported Outcomes Measurement Information System (PROMIS): Overall, preoperative cryoneurolysis was not associated with PROMIS subdomain scores at 2 weeks, 6 weeks, or 12 weeks post-TKA compared to pain management not involving cryoneurolysis in 1 RCT and 1 cohort study. The RCT did not report the results of statistical analyses but found wide variability in change from baseline scores in each group. Substantial missing data in the cohort study limits confidence in the conclusions.
Clinician-assessed outcome measures: Two RCTs and 2 cohort studies included across SRs (Table 12) found no consistent association between cryoneurolysis and clinician-assessed physical function, although results were variable for some outcomes. The results are summarized as follows:
Range of motion: Overall, the findings were inconsistent across time points. One cohort study reported better flexion and extension at hospital discharge among participants receiving cryoneurolysis compared to those receiving pain management not involving cryoneurolysis. After 2 weeks, 4 weeks, 6 weeks, and 12 weeks post-TKA, most studies found no statistically significant differences, with some isolated exceptions at certain time points (e.g., 1 cohort study found significantly better extension 6 weeks post-TKA with cryoneurolysis, but no difference in flexion compared to pain management not involving cryoneurolysis).
Timed Up and Go test: One RCT found no association between cryoneurolysis and Timed Up and Go test results at 3 days, 2 weeks, 6 weeks, or 12 weeks post-TKA; detailed results were not provided in the report.
40-metre walk test and 30-second chair test: The 40-metre walk test measures the average speed in metres per second a participant can walk 40 m, and the 30-second chair test measures the number of times a participant can go from seated in a chair to standing over the course of 30 seconds. One RCT reported both outcomes and found similar mean changes from baseline in these outcomes at follow-up at 2 weeks, 4 weeks, 6 weeks, and 12 weeks for both study groups, sometimes with large standard deviations.
Ambulation distance: One cohort study found no statistically significant difference in mean ambulation distance at discharge for participants treated with cryoneurolysis compared to pain management not involving cryoneurolysis.
Length of Hospital Stay
Two SRs22,23 and the included cohort study24 reported on length of hospital stay (Table 13). One SR22 with meta-analysis (1 RCT, 4 cohort studies) estimated that cryoneurolysis treatment was associated with a 0.63‑day shorter hospital stay (95% confidence interval, 0.2 days to 1.05 days) compared to pain management not involving cryoneurolysis, although substantial unexplained statistical heterogeneity was identified. Despite this, the review authors rated the certainty of the evidence as high using the GRADE approach.27 One additional RCT included in 1 SR21 reported similar mean lengths of stay between study arms, with standard deviations and no statistical testing reported. Overall findings suggest cryoneurolysis may reduce length of stay, but results were inconsistent and heterogeneity in 1 included meta-analysis was high, lowering confidence in the estimate.
Sleep Disturbance
Sleep disturbance was assessed in 4 studies (2 RCTs and 1 cohort study included in 3 SRs21-23 and 1 additional cohort study24) using either a single measure or the PROMIS tool’s Sleep Disturbance domain, with follow-up from 3 weeks to 12 months (Table 11 and Table 14). Overall, findings were inconsistent; some studies showed improved sleep (less sleep disturbance) or earlier clinically meaningful improvement in sleep compared to baseline with presurgical cryoneurolysis, while others found no evidence of effect. Due to inconsistent results and unexplained missing data within most studies, confidence in the overall evidence is low.
Adverse Events
AEs were reported in 3 RCTs and 4 cohort studies included in the SRs21-23 (Table 15) and study follow-up ranged from 3 weeks to 6 months. One SR22 reported an overall AE rate of 1.3% with cryoneurolysis compared to 1.7% with other pain management approaches; however, the AE definition and outcome time points were not reported. Serious adverse event (SAE) rates were low and varied across studies, with no consistent differences between groups. Reported SAEs in the cryoneurolysis study arms included isolated cardiac events, infections, syncope, hypotension, deep vein thrombosis, and persistent dysesthesia, the latter of which was specifically deemed by study authors of 1 cohort study to be likely associated with cryoneurolysis. In the control group study arms, reported isolated SAEs included hernia, chest pain, infections, acute kidney injury, pulmonary complication, and drug reactions (allergic reaction and drug interaction). Within and across studies SAE event counts were low and often not systematically reported, limiting interpretation.
Two RCTs reported treatment-associated AEs. One pilot study reported no treatment-related AEs over the course of 3 weeks. Another RCT reported treatment-emergent AEs over 3 months in 16.9% of participants in the cryoneurolysis arm and 35.0% of participants in the control arm, noting that “most were mild or moderate and related to surgery.”
Health Human Resources
Other than length of hospital stay, no included studies reported on factors, or assessed outcomes, related to health human resources including staff or training requirements for cryoneurolysis use.
Limitations
Current Evidence and Gaps
The evidence has several limitations related to study design, population characteristics, interventions, and outcomes. No studies addressed the cost-effectiveness of cryoneurolysis or its impact on health human resources. There are at least 4 other registered studies evaluating cryoneurolysis for TKA that have been terminated or withdrawn30-33 with the reasons provided as sponsor withdrawal, early stopping based on interim analyses, low recruitment, or lost interest in the study. Lack of available evidence from these trials adds to the uncertainty for the body of evidence.
Most studies had some RoB including selection, performance, and outcome measurement bias (as discussed in the critical appraisal section of this report). Only 3 studies used randomized allocation and 2 included sham controls. Most studies had short follow-up periods (≤ 3 months) limiting our understanding of potential long-term effects on nerve function and patient outcomes. Six of the 7 included studies (or their authors) received some level of industry funding from, or were sponsored by, cryoneurolysis device manufacturers.
Key participant characteristics, including those relevant to health inequity,34 were often not reported. Details on study settings and population characteristics were often missing from SR reports, and, where possible, we extracted this information from the primary reports. Details of cryoneurolysis (e.g., temperature, number of cycles) and other pain management protocols (e.g., mean doses of other analgesics), were also often poorly reported in SRs and primary studies, limiting interpretation of study outcome effects that can be confidently attributed to cryoneurolysis treatment. Most studies assessed the same device (Iovera) and evidence is lacking for other cryoneurolysis devices.
Although most studies addressed PROMPT-recommended outcome domains,26 it is unclear if any assessed self-efficacy; the PROMPT consensus statement authors note that this domain lacks a clear definition and it is possible that this concept may be captured in the PROMs included in our identified studies. The validity of outcome measurement methods also varied; for example, opioid consumption was assessed using opioid administration (in hospital), prescription data, pill counts, and self-report, not all of which may yield equally valid information on true consumption.35 Physical function was also assessed by PROMs with questionable validity.36 The Canadian Institute for Health Information37 has endorsed 2 PROMs for post-TKA assessment, the OKS and EQ-5D-5L (a standardized instrument developed by the EuroQol Group that measures health-related quality of life); we identified only 1 study assessing patient outcomes with the OKS and no studies using the EQ-5D-5L.
Heterogeneity
Patient populations seem broadly similar across studies, where reported, in terms of age, gender or sex, and racial distributions, and all studies were conducted in the US, although specific settings differed. Most studies compared the same cryoneurolysis device (Iovera System) to standard institutional pain management or sham cryoneurolysis; however, where reported, the intervention protocols varied (e.g., cryoneurolysis cycles, temperatures, and timing relative to surgery) and these factors may influence the degree of nerve damage and treatment outcomes.14 Standard pharmacologic pain management also differed among studies, although limited information was provided regarding doses of other pain medications and other aspects of care such as physical therapy.
Outcome measurements were also heterogeneous. Pain intensity, opioid consumption, and functional outcomes were measured using multiple tools, in some cases with questionable or uncertain validity,35,36 limiting comparability across studies.35,36 Where conducted, meta-analyses reported no statistical heterogeneity for pain intensity (at 2 weeks postsurgery), opioid use (at 6 weeks postsurgery), or physical function (KOOS at 3 months postsurgery), but found substantial heterogeneity in length of hospital stay, which was not explored or explained.
Generalizability
All included studies were conducted in the US, which may limit applicability to settings in Canada. The evidence primarily reflects outcomes for adults undergoing primary unilateral TKA; it is unclear how these findings reflect the experiences of younger people, older adults with frailty, or those undergoing revision procedures, for which the costs of the latter are substantially higher. Reporting of some population characteristics was limited, although all studies reported age and sex or gender and some reported racial distribution. Where reported, studies may have included a higher proportion of participants classified as white, with lower representation of some racialized groups such as Asian and Hispanic populations compared to those who might be expected to present with TKA.38 Other equity-related factors,34 such as socioeconomic status, education, and place of residence, were rarely reported despite their potential association with clinical outcomes or opioid use after TKA.39-44 Individuals with recent opioid use or a history of opioid dependence were often not eligible for study participation, and these factors have been associated with subsequent prolonged opioid use.41,42 It is not clear how generalizable these results are to these potentially vulnerable groups.
Although the cryoneurolysis device used in most identified studies (Iovera) is approved in Canada, it is unclear how its implementation within these studies (including intervention protocols and provider training), TKA procedures, and pain management standards of care are comparable to those across Canada in settings where use of these devices might be considered. No evidence was identified on the cost-effectiveness of these devices relevant to settings in Canada.
Limitations of Our Approach
Rapid reviews use accelerated and abbreviated SR methods to balance timeliness with rigour for efficient decision-making, and they have some limitations. We restricted our search to studies published in English from January 1, 2020, to November 27, 2025. To broaden coverage, the search also included relevant SRs and included 3, none of which applied date limits and 2 of which21,22 did not restrict by language of publication. RoB assessments for many studies relied on evaluations reported in the SR reports. Although all the SRs used the same tools (e.g., Cochrane Risk of Bias 2 [RoB-2] or Risk of Bias in Non-randomized Studies of Interventions [ROBINS-I]), 45,46 the SR authors’ domain-specific and overall judgments often conflicted for individual primary studies. Similarly, while we identified RoB concerns in our included cohort study,24 a companion report included in 1 SR22 was rated by SR authors with a low RoB across all domains. This highlights a challenge often noted with such assessments.
Due to the nature of the request, we did not engage with patients, caregivers, or providers for this report, nor did we search for literature on perspectives or experiences of those with lived or living experience of TKA. As a result, we may have missed evidence such as the relative importance of outcomes or potential barriers to equitable access to medical care.
Conclusions and Implications for Policy-Making
This rapid review examined evidence on the clinical effectiveness and cost-effectiveness of perioperative cryoneurolysis compared with pain management interventions not involving cryoneurolysis for people undergoing TKA. Four reports met the eligibility criteria: 3 SRs,22,23 (including 7 relevant studies) and 1 cohort study,24 which is a companion to a study included in 1 SR. Several registered trials have been withdrawn or terminated — at least 1 due to interim analyses. No studies were identified that addressed the cost-effectiveness of cryoneurolysis for TKA.
Summary of Evidence
The evidence comparing cryoneurolysis with other pain management strategies for TKA suggested potential benefits for some outcomes. For other outcomes results were not consistent, or there was an unclear association with cryoneurolysis. Intervention protocols varied widely for cryoneurolysis and co-interventions. There were concerns about RoB across the evidence, with some studies indicating that preoperative cryoneurolysis may be associated with decreased early postoperative pain, decreased opioid use, improved range of motion, and shorter hospital stays; however, significant findings were not always deemed clinically meaningful. One SR with meta-analysis22 reported lower pain intensity with cryoneurolysis within 2 weeks postsurgery compared to pain management without cryoneurolysis, while results at longer follow-up points were inconsistent. Investigators have suggested that these similarities at later time points may be due to early increased activity in the cryoneurolysis groups, potentially leading to later pain (and, in some cases, greater opioid consumption).19,22 One SR with meta-analysis22 reported a small reduction in opioid consumption between groups, although another SR23 concluded that some differences were unlikely to be clinically meaningful.
No clear association was observed between cryoneurolysis and physical function based on PROMs and most clinician-assessed measures, although many different tools were used and there were substantial missing data at longer follow-up times, reducing confidence in some comparisons. AEs included some events considered likely to be associated with cryoneurolysis (e.g., severe dysesthesia) and larger, longer-term studies are needed to better understand the safety of these devices in this population. No studies associated cryoneurolysis with statistically significantly inferior clinical outcomes for any of the domains assessed.
The interpretation of the body of evidence sometimes differed from included SRs due, in part, to the inclusion of additional outcome measures and time points but also due to incomplete overlap across SRs and different SR methods. Even SRs including the same studies may yield different conclusions; for example, we identified an SR47 published only as an abstract (and thus ineligible for our review) that included a meta-analysis examining the association of cryoneurolysis with opioid use, using the same 3 studies at the same time point as the meta-analysis in the SR by Hajiaghajani et al.22 included in our review. Despite the complete overlap, the SR authors reached contradictory conclusions. Specifically, the authors of the meta-analysis reported in the abstract concluded there was no statistically or clinically significant effect of cryoneurolysis on opioid use, in contrast with the authors’ conclusions of the meta-analysis included in our review for this outcome.22 While we did not critically appraise the SR reported as an abstract, these discrepancies underscore the need for thoughtful interpretation of meta-analysis results.
No evidence was identified on equity considerations, provider training requirements, cost-effectiveness, or health human resource implications of cryoneurolysis to inform decision-making within settings in Canada.
We have identified 4 additional registered ongoing RCTs or RCTs of unknown status: 1 comparing cryoablation to no cryoablation (no further intervention details provided, so it is unclear if this would be relevant), which is not yet recruiting;48 1 pilot RCT comparing Iovera to no cryoneurolysis (sponsors are in Canada) with “unknown status”;49 and 2 RCTs assessing cryoneurolysis (Cryo-S device50 or Visual-ICE51) to sham cryoneurolysis, both of which have completed, or nearly completed, recruitment. Results from these studies may provide important insights to support future decision-making.
Considerations for Future Research
Future clinical research should adopt rigorous design and reporting practices. Prospective designs with randomized allocation are recommended, where feasible, masking participants to their interventions or study objectives; only 2 of 7 studies in the current evidence base used sham controls. Where possible, reports should include the number and key characteristics of individuals screened but excluded or declining participation so readers can better understand how study samples compare to the populations from which they were drawn.
Research should aim to include diverse populations to improve generalizability, and both SRs and primary studies should report prognostic variables and equity-associated characteristics to help readers understand whether and how treatment outcomes may vary. Researchers might also wish to compare cryoneurolysis outcomes for inpatient versus outpatient surgery, as many jurisdictions in Canada seek to increase the rate of outpatient surgeries for TKA.1 Comparative evaluations of different cryoneurolysis protocols with clear reporting may also help optimize device use, and planned outcome assessment should align with consensus recommendations.26,37 Gaining understanding of the relative value of outcomes to patients may also be important, as it has been suggested that opioid side effects may be important deterrents for their use even if pain reduction is not equivalent between pain management options.52 Larger studies with longer follow-up are also needed to assess long-term safety. Finally, robust cost-effectiveness analyses are required that reflect protocols, patient preferences, and cost structures applicable to settings in Canada.
Considerations for Policy-Making
When evaluating the implementation or reimbursement of cryoneurolysis for TKA, decision-makers may wish to consider the following:
Evidence limitations: While some studies suggest cryoneurolysis may decrease early postoperative pain, opioid use, and hospital stay, without increasing SAEs, the current body of evidence is methodologically limited and inconsistent. There is also insufficient information provided on the standard pain management protocols in each study to exclude the potential effects of co-interventions on the findings. No studies assessed cost-effectiveness or resource implications relevant to settings in Canada. High-quality, longer-term research with transparent reporting and COI mitigation is needed.
Contextual relevance: All identified studies were conducted in the US, primarily in academic or outpatient clinics, and focused on adults undergoing primary TKA. In Canada, TKA takes place in both inpatient and outpatient settings (the latter generally limited to urban region hospitals1), predominantly in publicly funded hospitals, with some private options; in some jurisdictions, it may also be accessed through private clinics with public funding.53 How the study perioperative protocols compare to standards of care in Canada is unclear. We are aware of only 1 cryoneurolysis device (Iovera) that is marketed for TKA and approved in Canada; other devices marketed internationally for TKA use (e.g., Cryo-S Painless, PainBlocker) do not appear to be approved in Canada. Other cryoneurolysis devices are also currently available in Canada (e.g., Visual-ICE) although it is unclear if they are used for TKA. Despite Iovera having received Health Canada approval in 2013, this technology is not yet recommended in some relevant guidelines or in Enhanced Recovery After Surgery pathways.10,54
Implementation factors: Evidence on implementation requirements is limited. Cryoneurolysis devices are portable and may be easier to adopt as ultrasound availability and provider (e.g., anesthesiologist) expertise with ultrasound increases.15 Procedures may involve multiple personnel.14 While some reports suggest that it requires minimal changes to care processes or infrastructure and minimal training needs, additional costs could be prohibitive in some cases.55
Equity considerations: Decision-makers considering these interventions may also wish to reflect on factors such as barriers, and potential solutions to barriers, to achieving equitable access to cryoneurolysis in Canada. Access to qualified professionals, equipment, and coverage for costs may vary across regions. In Canada, cryoneurolysis may be partially covered by some health plans, but coverage is not universal. As the included studies provided little data on factors that may be associated with inequities in TKA utilization or outcomes (e.g., race or ethnicity, place of residence, socioeconomic status, and concomitant health concerns),40-42,44,56,57 it is difficult to assess the applicability of the evidence to diverse populations in Canada. Decision-makers should be aware of these potential gaps as they consider equitable and supportive access to care.
In summary, pain management is an important consideration for beneficial outcomes after TKA. Opioid-sparing strategies, including cryoneurolysis, are of interest. Current evidence for the clinical effectiveness of cryoneurolysis shows some promise for improving some outcomes (e.g., early pain, opioid use, and length of hospital stay), but the evidence is limited and no cost-effectiveness evidence was identified.
References
1.Canadian Institute for Health Information. Hip and Knee Replacements in Canada: CJRR Annual Report, 2021–2022. Ottawa, ON: CIHI; 2023. Accessed December 23, 2025. https://www.cihi.ca/sites/default/files/document/hip-knee-replacements-in-canada-cjrr-annual-report-2021-2022-en.pdf
2.Canadian Institute for Health Information. Knee Replacements in Canada: Information for People Living With Osteoarthritis. Ottawa, ON: CIHI; 2025. Accessed December 23, 2025. https://www.cihi.ca/sites/default/files/document/knee-replacements-in-canada-osteoarthritis-infosheet-en.pdf
3.Canadian Institute for Health Information. Wait Times for Priority Procedures in Canada, 2008–2024 — Data Tables. Ottawa, ON: CIHI; 2025. Accessed December 23, 2025. https://www.cihi.ca/en/wait-times-for-priority-procedures-in-canada-2025
4.Canadian Institute for Health Information. Hospital stays in Canada, 2023–2024. Accessed December 23, 2025. https://www.cihi.ca/en/hospital-stays-in-canada-2023-2024
5.Organisation for Economic Co-operation and Development. Health at a Glance 2025: OECD Indicators. OECD Publishing, Paris. Accessed December 23, 2025. 10.1787/8f9e3f98-en.
6.Varacallo M, Luo T, Mabrouk A. Total Knee Arthroplasty Techniques. StatPearls [Internet]. StatPearls Publishing; 2025 https://www.ncbi.nlm.nih.gov/books/NBK499896/
7.Weir-Seeley S, Sandoval C, Terner M. How Would We Know Whether Joint Replacements Are Successful if We Do Not Ask Patients? Healthc Q. 2024;26(4):10-13. doi: 10.12927/hcq.2024.27260 PubMed
8.Oderda GM, Said Q, Evans RS, et al. Opioid-Related Adverse Drug Events in Surgical Hospitalizations: Impact on Costs and Length of Stay. The Annals of pharmacotherapy. 2007;41(3):400-406. doi: 10.1345/aph.1h386 PubMed
9.Amundson A, Johnson R. Anesthesia for total knee arthroplasty; UptoDate. 2025. Updated April 15, 2025. Accessed November 26, 2025.
10.Wainwright TW, Gill M, McDonald DA, et al. Consensus statement for perioperative care in total hip replacement and total knee replacement surgery: Enhanced Recovery After Surgery (ERAS) Society recommendations. Acta Orthop. 2020;91(1):3-19. doi: 10.1080/17453674.2019.1683790 PubMed
11.Hansen CW, Carlino EK, Saunee LA, Dasa V, Bhandutia AK. Modern Perioperative Pain Management Strategies to Minimize Opioids after Total Knee Arthroplasty. Orthop Clin North Am. 2023;54(4):359-368. doi: 10.1016/j.ocl.2023.05.002 PubMed
12.Cooper SM, Dawber RP. The history of cryosurgery. J R Soc Med. 2001;94(4):196-201. doi: 10.1177/014107680109400416 PubMed
13.Gabriel RA, Ilfeld BM. Novel Modalities in Regional Anesthesia for Knee Arthroplasty. Anesthesiol Clin. 2025;43(4):819-829. doi: 10.1016/j.anclin.2025.07.007 PubMed
14.Law L, Rayi A, Hendrix J, Derian A. Cryoanalgesia. . StatPearls [Internet] StatPearls Publishing; 2025. https://www.ncbi.nlm.nih.gov/books/NBK482123/
15.Biel E, Aroke EN, Maye J, Zhang SJ. The applications of cryoneurolysis for acute and chronic pain management. Pain pract. 2023;23(2):204-215. doi: 10.1111/papr.13182 PubMed
16.Radnovich R, Scott D, Patel A, et al. Cryoneurolysis to treat the pain and symptoms of knee osteoarthritis: a multicenter, randomized, double-blind, sham-controlled trial. . Osteoarthritis Cartilage. 2017;25(8):1247-1256. doi: 10.1016/j.joca.2017.03.006 PubMed
17.Urban JA, Dolesh K, Martin E. A Multimodal Pain Management Protocol Including Preoperative Cryoneurolysis for Total Knee Arthroplasty to Reduce Pain, Opioid Consumption, and Length of Stay. Arthroplasty Today. 2021;10:87-92. doi: 10.1016/j.artd.2021.06.008 PubMed
18.Dasa V, Lensing G, Parsons M, Harris J, Volaufova J, Bliss R. Percutaneous freezing of sensory nerves prior to total knee arthroplasty. The Knee. 2016;23(3):523-528. doi: 10.1016/j.knee.2016.01.011 PubMed
19.Mihalko WM, Kerkhof AL, Ford MC, Crockarell JR, Jr., Harkess JW, Guyton JL. Cryoneurolysis before Total Knee Arthroplasty in Patients With Severe Osteoarthritis for Reduction of Postoperative Pain and Opioid Use in a Single-Center Randomized Controlled Trial. J Arthroplasty. 2021;36(5):1590-1598. doi: 10.1016/j.arth.2020.11.013 PubMed
20.Swisher MW, Ball ST, Gonzales FB, Cidambi KR, Trescot AM, Ilfeld BM. A Randomized Controlled Pilot Study Using Ultrasound-Guided Percutaneous Cryoneurolysis of the Infrapatellar Branch of the Saphenous Nerve for Analgesia Following Total Knee Arthroplasty. Pain Ther. 2022;11(4):1299-1307. doi: 10.1007/s40122-022-00427-4 PubMed
21.Goodwin B, Brancaccio H, Kaplan M, et al. Preoperative cryoneurolysis for peri- and postoperative pain in total knee arthroplasty: a systematic review and pooled analysis. Pain Manag. 2025;15(8):527-534. doi: 10.1080/17581869.2025.2522063 PubMed
22.Hajiaghajani S, Poursalehian M, Samakoosh AN, Bahrami O, Hecht CJ, Kamath AF. Does Preoperative Anterior Genicular Nerve Cryoneurolysis Improve Early Outcomes of Primary Total Knee Arthroplasty? A Systematic Review and Meta-Analysis. J Arthroplasty. 2025;03:03. doi: 10.1016/j.arth.2025.06.027
23.Diep D, Mittal N, Sangha H, Farag J. Cryoneurolysis for non-cancer knee pain: A scoping review. Interv Pain Med. 2023;2(2):100247. doi: 10.1016/j.inpm.2023.100247 PubMed
24.Ng MK, Lin JH, Spitzer AI, et al. Preoperative Cryoneurolysis Improves Pain and Function for at Least 12 Months after Total Knee Arthroplasty: A Multicenter Registry Study. J Arthroplasty. 2025;13:13. doi: 10.1016/j.arth.2025.10.011 PubMed
25.Page MJ, McKenzie JE, Bossuyt PM, et al. The PRISMA 2020 statement: an updated guideline for reporting systematic reviews. BMJ. 2021;372:n71. doi: 10.1136/bmj.n71
26.Pogatzki-Zahn EM, Liedgens H, Hummelshoj L, et al. Developing consensus on core outcome domains for assessing effectiveness in perioperative pain management: results of the PROMPT/IMI-PainCare Delphi Meeting. Pain. 2021;162(11):2717-2736. doi: 10.1097/j.pain.0000000000002254 PubMed
27.Guyatt GH, Oxman AD, Vist GE, et al. GRADE: an emerging consensus on rating quality of evidence and strength of recommendations. BMJ (Clinical research ed). 2008;336(7650):924-926. doi: 10.1136/bmj.39489.470347.AD PubMed
28.Pacira Pharmaceuticals Inc. NCT05495334. Innovations in Genicular Outcomes Registry (iGOR). clinicaltrials.gov. Accessed December 15, 2025. https://clinicaltrials.gov/study/NCT05495334
29.Dasa V, Mihalko W, Rivadeneyra A, et al. Innovations in Genicular Outcomes Registry (IGOR): protocol for a real-world registry study of treatments for knee osteoarthritis. Ther Adv Musculoskelet Dis. 2024;16:1759720X241304193. doi: 10.1177/1759720X241304193
30.Fondren Orthopedic Group L.L.P. NCT03818022: Pain Control With Pre-operative Cryoneurolysis Following TKA [Withdrawn]. clinicaltrials.gov; 2024. Updated 2024-02-23. Accessed November 26, 2025. https://clinicaltrials.gov/study/NCT03818022
31.CS Ramsay Santé pour l'Enseignement et la Recherche. NCT05059535: Knee Nerve Cryoneurolysis and Impact on Pain After Prosthetic Surgery (Cryogenou) [Terminated]. clinicaltrials.gov. Updated 2025-05-16. Accessed November 26, 2025. https://clinicaltrials.gov/study/NCT05059535
32.Pacira Pharmaceuticals Inc. NCT04191031: Study to Evaluate Iovera®° in Adult Patients Undergoing Total Knee Arthroplasty [Terminated]. clinicaltrials.gov. Accessed November 26, 2025. https://clinicaltrials.gov/study/NCT04191031
33.Brigham and Women's Hospital. NCT03836313: Assessing if Cryoneurolysis Improves Prehabilitation and Decreases Pain After Surgery With Less Opioid Use in TKA Patients [Withdrawn]. clinicaltrials.gov. Updated 2019-07-10. Accessed November 26, 2025. https://clinicaltrials.gov/show/NCT03836313
34.O'Neill J, Tabish H, Welch V, et al. Applying an equity lens to interventions: using PROGRESS ensures consideration of socially stratifying factors to illuminate inequities in health. J Clin Epidemiol. 2014;67(1):56-64. doi: 10.1016/j.jclinepi.2013.08.005 PubMed
35.Lee JK, Grace KA, Foster TG, et al. How should we measure medication adherence in clinical trials and practice? Ther Clin Risk Manag. 2007;3(4):685-90. PubMed
36.Heitkamp H, Heußner D, Rosenberger DC, et al. Systematic reviews and quality assessment of patient-reported outcome measures for physical function in comparative effectiveness studies regarding acute postoperative pain after total knee arthroplasty-Do we need to start all over again? Eur J Pain. 2024;28(9):1415-1430. doi: 10.1002/ejp.2272 PubMed
37.Canadian Institute for Health Information. Data Collection Manual: Hip and Knee Arthroplasty. 2021. Accessed January 9, 2025. https://www.cihi.ca/sites/default/files/document/proms-data-collections-manual-2021-en.pdf
38.Hinman AD, Chan PH, Prentice HA, Paxton EW, Okike KM, Navarro RA. The Association of Race/Ethnicity and Total Knee Arthroplasty Outcomes in a Universally Insured Population. J Arthroplasty. 2020;35(6):1474-1479. doi: 10.1016/j.arth.2020.02.002 PubMed
39.Hoofwijk DMN, Fiddelers AAA, Emans PJ, et al. Prevalence and Predictive Factors of Chronic Postsurgical Pain and Global Surgical Recovery 1 Year After Outpatient Knee Arthroscopy: A Prospective Cohort Study. Medicine (Baltimore). 2015;94(45):e2017. doi: 10.1097/md.0000000000002017 PubMed
40.Mohammad HR, Gooberman-Hill R, Delmestri A, et al. Risk factors associated with poor pain outcomes following primary knee replacement surgery: Analysis of data from the clinical practice research datalink, hospital episode statistics and patient reported outcomes as part of the STAR research programme. PLoS One. 2021;16(12):e0261850. doi: 10.1371/journal.pone.0261850 PubMed
41.Namba RS, Singh A, Paxton EW, Inacio MCS. Patient Factors Associated With Prolonged Postoperative Opioid Use After Total Knee Arthroplasty. J Arthroplasty. 2018;33(8):2449-2454. doi: 10.1016/j.arth.2018.03.068 PubMed
42.Lawal OD, Gold J, Murthy A, et al. Rate and Risk Factors Associated With Prolonged Opioid Use After Surgery: A Systematic Review and Meta-analysis. JAMA Netw Open. 2020;3(6):e207367. doi: 10.1001/jamanetworkopen.2020.7367 PubMed
43.Cao G, Xiang S, Yang M, et al. Risk factors of opioid use associated with an enhanced-recovery programme after total knee arthroplasty. BMC Musculoskelet Disord. 2021;22(1):1046. doi: 10.1186/s12891-021-04937-8 PubMed
44.Garval M, Runge C, Holm CF, et al. Prognostic factors of knee pain and function 12 months after total knee arthroplasty: A prospective cohort study of 798 patients. Knee. 2023;44:201-210. doi: 10.1016/j.knee.2023.08.013 PubMed
45.RoB2 Development Group. PT Higgins JPT, Savović J, Page MJ, Sterne JAC, eds. Revised Cochrane risk-of-bias tool for randomized trials (RoB 2). 2019. Accessed January 6, 2026. https://sites.google.com/site/riskofbiastool/welcome/rob-2-0-tool/current-version-of-rob-2
46.Sterne J, Hernán M, Reeves B, et al. ROBINS-I: a tool for assessing risk of bias in non-randomised studies of interventions. BMJ. 2016;355. doi: 10.1136/bmj.i4919 PubMed
47.Dias A, Vilela R, Schuck G, de Amaral S. Cryoanalgesia before total knee arthroplasty: a systematic review and meta-analysis. Br J Anaesth. 2024;133(6).
48.NYU Langone Health. NCT06991231: The Benefits Of Cryoablation In Patients Undergoing Total Knee Arthroplasty. ClinicalTrials.gov. Updated 2025-05-27. Accessed November 26, 2025. https://clinicaltrials.gov/study/NCT06991231?tab=table
49.Unity Health Toronto. NCT05286996: Cryoneurolysis for TKA - a Pilot Study. ClinicalTrials.gov; 2023. Updated 2023-05-12. Accessed November 26, 2025. https://clinicaltrials.gov/study/NCT05286996
50.Copenhagen University Hospital H. NCT06088602: Cryoneurolysis for Acute Postoperative Pain Following Total Knee Arthroplasty (CRISPP). ClinicalTrials.gov. Updated 2024-07-16. Accessed November 26, 2025. https://clinicaltrials.gov/study/NCT06088602
51.Esbjerg Hospital - University Hospital of Southern Denmark. NCT05840276: Cryoneurolysis Prior to Total Knee Arthroplasty. ClinicalTrials.gov; 2024. Updated 2024-09-27. Accessed November 26, 2025. https://clinicaltrials.gov/study/NCT05840276
52.Goshua A, Craigie S, Guyatt G, et al. Patient Values and Preferences Regarding Opioids for Chronic Noncancer Pain: A Systematic Review. Pain Med 2. 2018;19(12):2469-2480. doi: 10.1093/pm/pnx274
53.CBC News. Ontario set to fund hip and knee replacements at private clinics. 2025. Updated December 8, 2025. Accessed January 6, 2026. https://www.cbc.ca/news/canada/toronto/knee-hip-replacements-private-clinics-ontario-9.7007466
54.Healthcare Excellence Canada (HEC). Clinical Pathway for Inpatient and Outpatient Hip and Knee Arthroplasty - Enhanced Recovery Canada: A Collaborative to Improve Surgical Care. 2021. Accessed January 7, 2026. https://www.healthcareexcellence.ca/media/qydkk40o/20220919_erc_hipknee_clinicalpathway_en.pdf
55.Emergency Care Research Institute. Iovera System (Pacira Biosciences, Inc.) for Treating Knee Osteoarthritis Pain. 2023. Accessed December 8, 2025.
56.Burgesson B, Lethbridge L, Haase DA, Dunbar M. Disparities in Utilization Rates of Total Knee and Hip Arthroplasty Among Racially Visible Populations in Canada: A Retrospective Cohort Analysis. J Arthroplasty. 2025;40(11):2805-2810.e3. doi: 10.1016/j.arth.2025.04.010 PubMed
57.Chun DS, Leonard AK, Enchill Z, Suleiman LI. Racial Disparities in Total Joint Arthroplasty. Curr Rev Musculoskelet Med. 2021;14(6):434-440. doi: 10.1007/s12178-021-09718-3 PubMed
58.Shea BJ, Reeves BC, Wells G, et al. AMSTAR 2: a critical appraisal tool for systematic reviews that include randomised or non-randomised studies of healthcare interventions, or both. BMJ. 2017;358:j4008. doi: 10.1136/bmj.j4008 PubMed
59.Downs SH, Black N. The feasibility of creating a checklist for the assessment of the methodological quality both of randomised and non-randomised studies of health care interventions. J Epidemiol Community Health. 1998;52(6):377-384. doi: 10.1136/jech.52.6.377 PubMed
60.Canada’s Drug Agency. Canada's Drug Agency Style: A Guide for Authors and Editors. 2025. Accessed January 6, 2026. https://www.cda-amc.ca/sites/default/files/pdf/style_guide_2025_digital.pdf
61.Pacira Pharmaceuticals Inc. NCT02284113. A Post-Market, Multi-Center, Prospective, Double-Blind, Randomized, Controlled Study to Evaluate the Iovera° Device in Treating Pain Associated With Total Knee Arthroplasty. ClinicalTrials.gov. Updated 2024-01-24. Accessed December 15, 2025. https://clinicaltrials.gov/study/NCT02284113?a=1&b=12&tab=results
62.Grade Working Group. Neumann I, Schünemann H, editors. The GRADE Book version 1.0. Updated September 2024. Accessed December 22, 2025. https://book.gradepro.org
Appendix 1: Detailed Methods and Selection of Included Studies
Please note that this appendix has not been copy-edited.
What Is a Rapid Review?
Rapid reviews are based on accelerated and abbreviated SR methods, balancing timeliness with rigour, to allow for timely decision-making. Due to these abbreviated methods, rapid reviews have some limitations. For example, we included studies published from 2020, excluding older studies. We attempted to mitigate this by searching for and including relevant SRs published in the past 5 years that included older studies. Focusing on more recently published articles may be more reflective of current practices. One reviewer conducted screening, critical appraisal, and data extraction. Our rapid review intends to summarize the available evidence, rather than provide recommendations. These findings should not be interpreted as prescriptive guidance.
Literature Search Methods
An information specialist conducted a literature search on key resources including MEDLINE, the Cochrane Database of Systematic Reviews, the International HTA Database, the websites of health technology assessment agencies in Canada and major international HTA agencies, as well as a focused internet search. The search approach was customized to retrieve a limited set of results, balancing comprehensiveness with relevance. The search strategy comprised both controlled vocabulary, such as the National Library of Medicine’s MeSH (Medical Subject Headings), and keywords. Search concepts were developed based on the elements of the research questions and selection criteria. The main search concepts were cryoneurolysis and knee arthroplasty. The search was completed on November 27, 2025, and limited to English-language documents published since January 1, 2020. The search strategy is available on request.
Selection Criteria and Methods
One reviewer screened citations and selected studies. We first reviewed titles and abstracts, and potentially relevant articles were retrieved and assessed for inclusion. The final selection of full-text articles was based on the inclusion criteria presented in Table 1.
Exclusion Criteria
We excluded publications for the following reasons:
did not meet the selection criteria outlined in Table 1
duplicate publications or published before 2020
SRs in which all relevant studies were captured in other more recent or more comprehensive SRs
primary studies captured in 1 or more included SRs
protocols to relevant studies.
Critical Appraisal of Individual Studies
One reviewer critically appraised the included studies using the following tools as a guide: A MeaSurement Tool to Assess systematic Reviews 2 (AMSTAR 2)58 for SRs, and the Downs and Black checklist59 for randomized and nonrandomized studies. Summary scores were not calculated for the included studies; rather, the strengths and limitations of each included publication were described narratively.
Data Extraction
One reviewer extracted data directly into tables created in Microsoft Word, modifying them as necessary. The extracted information included characteristics of the study (e.g., study design), populations, interventions, comparators, and results regarding the outcomes of interest. Details are reported in Appendix 3.
The PROGRESS-Plus34 framework, which includes place of residence, race (or ethnicity, culture), occupation, gender or sex, religion, education, socioeconomic status, and social capital, guided equity considerations. These characteristics are discussed across the evidence, where available. When reporting on sex, gender, race, or ethnicity in this Rapid Review, we retained the language used by the original study authors, and, whenever possible, we referred to these groups based on guidance from Canada’s Drug Agency Style: A Guide for Authors and Editors60 at the time this rapid review was conducted, with an understanding that language is constantly evolving.
Appendix 2: Selection of Included Studies
Please note that this appendix has not been copy-edited.
Figure 1: Selection of Included Studies — PRISMA Flow Chart of Selected Reports
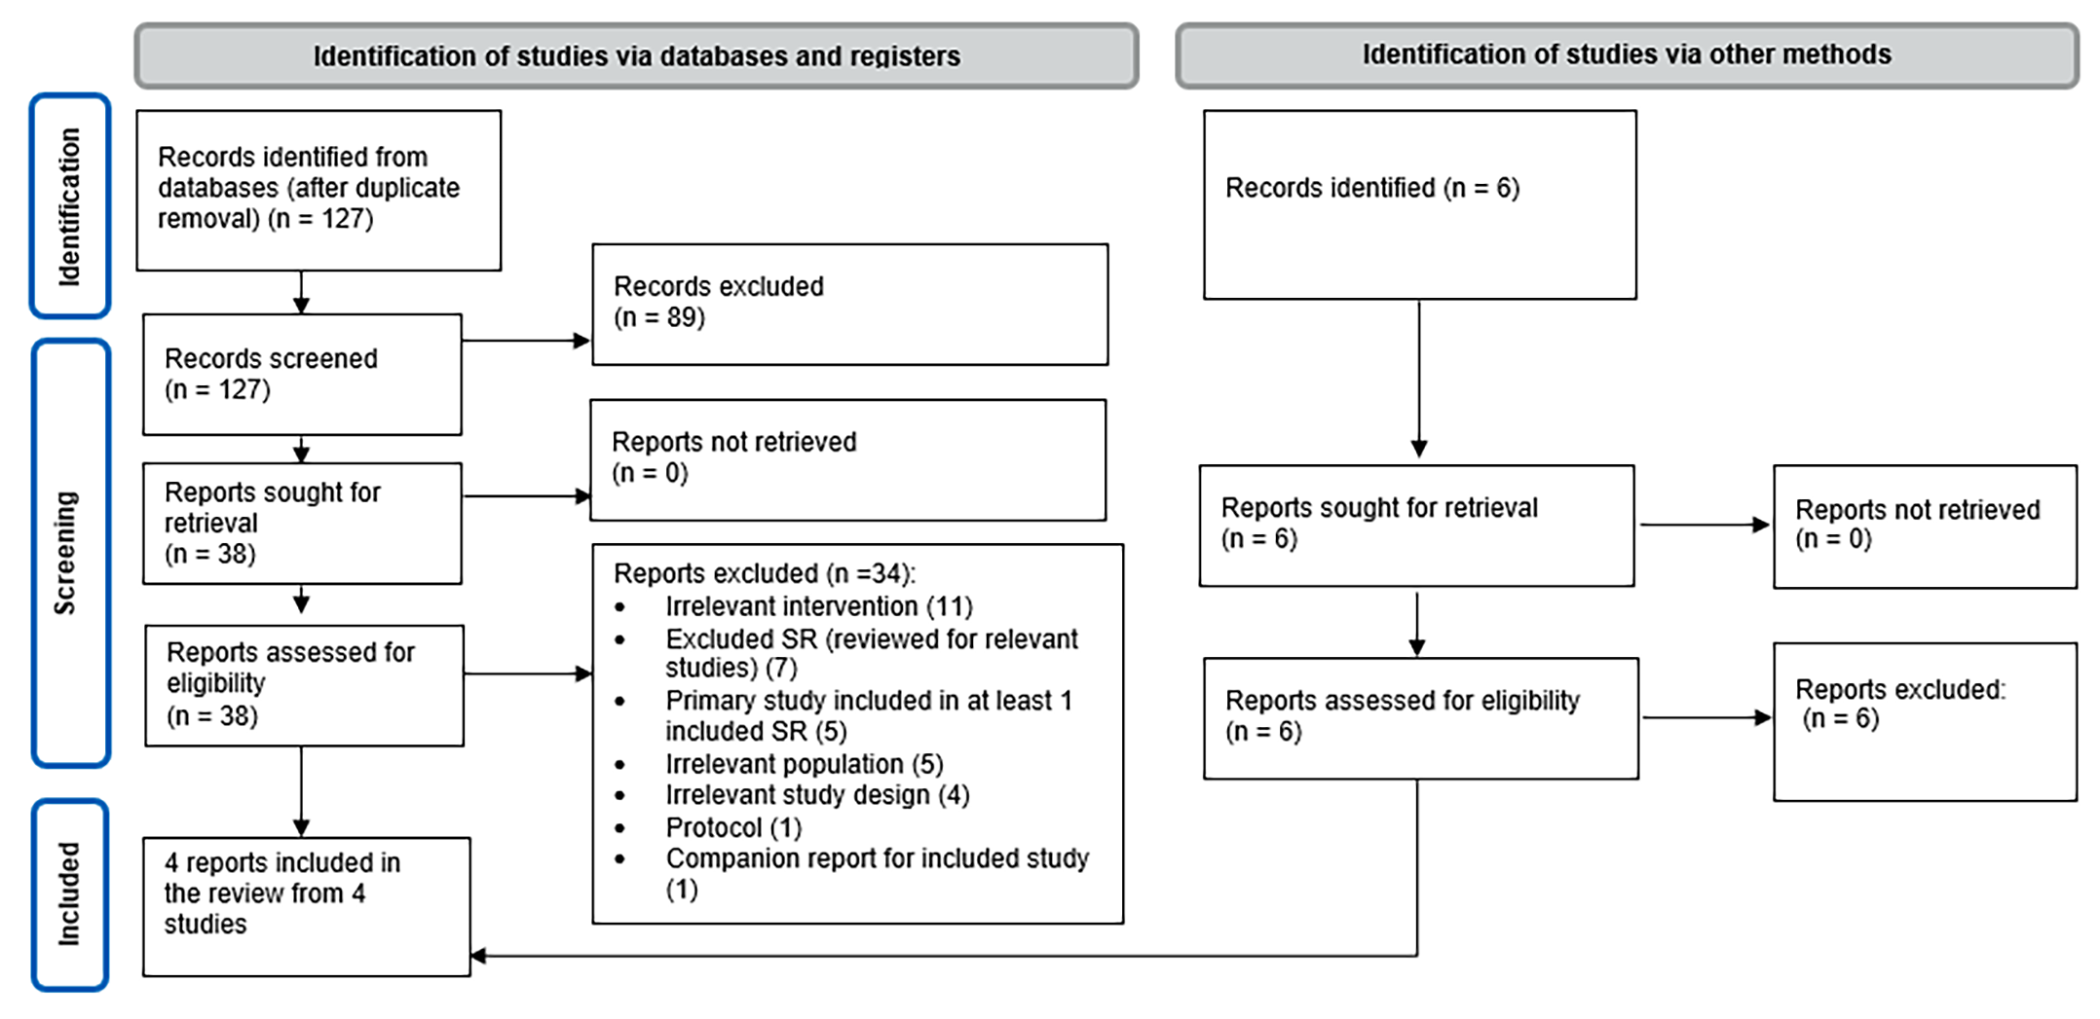
PRISMA = Preferred Reporting Items for Systematic reviews and Meta-Analyses;25 SR = systematic review.
Appendix 3: Characteristics of Included Publications
Table 2: Characteristics of Included Systematic Reviews
Study citation, countries of eligible studies, funding source | Study designs and numbers of primary studies included | Population characteristics | Intervention and comparators | Clinical outcomes, length of follow-up |
|---|---|---|---|---|
Goodwin et al. (2025)21 Geographic settings of included studies NR Funding source: Authors state that this paper was not funded and declare no COI. They provide no information on funding source of included studies. | Study design: SR with meta-analyses of comparative experimental and observational studies indexed up to April 30, 2024. No language restrictions. Number of included studies: 6 reports, of which 4 studies in 5 publications are relevant to the current review (2 RCTs, 2 cohort studies) | Adults undergoing TKA Number of participants: Relevant primary studies included between 100 and 267 participantsa Age (years), mean: across studies - cryoneurolysis: 65.3 years to 68.5 years; control: 65.2 years to 68 years Sex or gender: numbers of men and women reported in SR but not all correct – this is extracted separately in Table 3; other sexes or genders were NR BMI: NR in SR Other PROGRESS-Plus criteriab and select baseline characteristics of interestc: NR in SR | Interventions:
Comparators: NR in this SR | Outcomes:d
Follow-up: NR. Follow-up from primary studies NR, authors reported mean follow-up of 9 weeks |
Hajiaghajani et al. (2025)22 Although stated as extracted, geographic settings are not presented in report Funding source: NR for SR. Authors stated that 4 included studies had financial COI and 2 declared no COIe | Study design: SR with meta-analyses of comparative experimental and observational studies indexed up to December 25, 2024. No language restrictions. Number of included studies: 6 (2 RCTs, 4 cohort studies), all relevant to the current report | Adults undergoing primary TKA Number of participants: Primary studies included between 16 and 267 participants (676 total)a Age (mean), years: 65 years to 68 years across studies Sex or gender (% women): 53% to 70% across studies; other sexes or genders were NR BMI (mean): 27 to 32 across studies Other PROGRESS-Plus criteriab and select baseline characteristics of interestc: NR in SR | Interventions:
Comparators: Control group not undergoing cryoneurolysis. Details of control group interventions are NR in this SR. | Outcomes:
Follow-up: No limits. Follow-up in primary studies ranged from 3 weeks to 12 months. |
Diep et al. (2023)23 No limits in SR; all included studies eligible for this rapid review were conducted in US Funding source: The authors report that they received no funding for this review. The authors note that 4 of the 5 included studies relevant to this rapid review “received some level of industry funding.” | Study design: SR without meta-analyses of experimental and observational primary studies (including case reports and case series) indexed up to February 2023. Limited to those available in English. Number of included studies: 14 studies included in the SR, 5 of which are relevant to the current rapid review (2 RCTs, 3 cohort studies) | Participants with noncancer knee pain (any age and sex) Number of participants: Relevant primary studies included between 16 and 267 participantsa Age: Mean age ranged from 65 years to 68 years across studies Sex or gender: The proportion of women (vs. men) in primary studies ranged from 53% to 70%; other sexes or genders were NR BMI (mean): Ranged from 27 to 32 across studies Other PROGRESS-Plus criteriab and select baseline characteristics of interestc: NR in SR | Interventions:
Comparators: Standard therapy (preoperative, intraoperative, and postoperative multimodal pain regimen) (4 studies); sham cryoneurolysis (1 study) | Outcomes:
Follow-up: No limits. Studies relevant to this rapid review had follow-up times ranging from 3 weeks to 12 months. |
AE = adverse event; BMI = body mass index; COI = conflict of interest; IPBSN = infrapatellar branches of the saphenous nerve; KOOS = Knee Injury and Osteoarthritis Outcome Score; KOOS, JR = Knee Injury and Osteoarthritis Outcome Score for Joint Replacement; NR = not reported; PROGRESS = place of residence, race, ethnicity, culture, language, occupation, gender or sex, religion, education, and socioeconomic status; RCT = randomized controlled trial; SR = systematic review; TKA = total knee arthroplasty; vs. = versus.
Please note that this appendix has not been copy-edited.
aFor 1 study included in SRs (Mihalko et al.), Hajiaghajani et al.22 reports the number of participants included in the per-protocol population (48 per arm), while Goodwin et al.21 and Diep et al.23 report the number of participants included in the intention-to-treat population (62 per arm).
bThe main PROGRESS-Plus criteria include place of residence, race, ethnicity, culture, language, occupation, gender, sex, religion, education, socioeconomic status, social capital, personal characteristics associated with discrimination (e.g., age, disability), features of relationships, and time-dependent relationships.34
cOther baseline characteristics of interest not reported in SRs include race, prevalence of diabetes, American Society of Anesthesiologists physical status classification, opioid or alcohol use or dependency, and smoking status.
dThis SR evaluated only 1 outcome – pain status – although they provide conclusions in their abstract and “article insights” regarding outcomes they did not report assessing: including mobility, return to routine activities, and overall satisfaction.
eThe authors “evaluated the studies for disclosures of financial conflicts of interest (COIs), including funding of trials by companies currently offering [cryoneurolysis] technology or potential author affiliations and declared COIs.”
fDefined as “any intervention that involved percutaneous insertion of a cryoprobe induced to temperatures between −20°C and −100°C with the purpose of providing pain relief.”
gDiep et al.23 states that all studies relevant to the current rapid review used Iovera but 1 included study (Swisher et al.) used PainBlocker (Epimed, Dallas, Texas).
Table 3: Characteristics of Primary Clinical Studies
Study citation, country, funding source | Study design and eligibility | Sample characteristics | Intervention and comparator | Clinical outcomes, length of follow-up |
|---|---|---|---|---|
Ng et al. (2025)24a,b / Mont et al. (2025) Cohort study. Mont et al. (2025) is included in 1 SR.22 US Funding source: The authors do not report if the study was funded or the source of funding; the sponsor of the registry in which these data are collected is Pacira Pharmaceuticals, Inc. and the study steering committee receives compensation from this organization. | Multicentre retrospective cohort study (registry) of participants undergoing TKA between September 2021 to December 2024 at up to 14 centresc Eligibility: Patients who underwent unilateral, primary TKA for OA with follow-up data at 30 days to 12 months Excluded (among others) those with previous preoperative opioid prescriptions and those with planned or prior surgery on a different joint Mont et al. (2025): RoB rated by SR authors:22 Low | Number of participants: 356 analyzed Age (years), mean (SD): Cryoneurolysis: 67 (8.8); Control: 65 (8.4) Sex or gender (%): Cryoneurolysis: 60.9% women, 39.1% men; Control: 58.8% women, 41.2% men. No other sexes or genders reported. Race or ethnicity (cryoneurolysis vs. control): Asian: 2.9% vs. 1.6%; Black or African American: 11.5% vs. 2.7%; white: 80.5% vs. 89.5%; Other or Unknown: 5.1% vs. 5.9%. BMI, mean (SD): Cryoneurolysis: 30.3 (5.77); Control: 30.7 (6.22) ASA classification (cryoneurolysis vs. control): I: 14.9% vs. 17.0%; II: 53.5% vs. 52.8%; III: 31.4% vs. 29.7%; IV: 0.0% vs. 0.55% Kellgren-Lawrence grade (cryoneurolysis vs. control):d 2 (mild): 0.0% vs. 2.7%; 3 (moderate): 1.7% vs. 7.7%; 4 (severe): 98.3% vs. 89.6% History of alcohol or substance abuse [wording of original source] (%): cryoneurolysis: 1.7%; control: 1.6% Diabetes or smoking: NR Other PROGRESS-Plus criteria:e NR | Intervention:
Comparator: No cryoneurolysis (n = 182). All patients received standard perioperative care at their respective institutions, with no prescribed opioids the night before surgery or in the preoperative area. | Outcomes:
Follow-up: Up to 6 months (Mont et al. [2025]) and up to 12 months (Ng et al. [2025]) |
Pacira Pharmaceuticals, Inc. (Sponsor) (2024)f RCT included in 1 SR21 US Funding source: NR, study sponsor is Pacira Pharmaceuticals, Inc. | Multicentre double-masked parallel-group RCT. Participants were recruited between December 2014 to May 2016 at 8 centres in the US. Eligibility: Patients (aged 22 to 79 years) scheduled to undergo primary unilateral TKA under spinal anesthesia for primary diagnosis of OA; ASA I-III; anticipated to be discharged to home. Excluded (among others) those with chronic opioid use, BMI ≥ 40, current potential need for analgesic treatment for other purpose, prior surgery potentially affecting relevant nerves, a history of substance use (opioids or alcohol) abuse [wording from study protocol], those not in general good health. RoB rated by SR authors:21 Low | Number of participants: 150 Age (years), mean (SD): cryoneurolysis: 65.3 (7.53), sham: 65.3 (9.33) Sex or gender (%): cryoneurolysis: 51.4% female, 48.6% male; sham: 59.2% female, 40.8% male. Other sexes or genders were NR Race or ethnicity (cryoneurolysis vs. sham): American Indian or Alaskan Native: 1.4% vs. 0.0%; Asian: 1.4% vs. 0.0%; Black: 18.9% vs. 18.4%; Native Hawaiian or other Pacific Islander: 0.0% vs. 0.0%; white: 78.4% vs. 78.9%; more than 1 race: 0.0% vs. 0.0%; unknown or not reported: 0.9% vs. 2.6%. BMI, mean (SD): cryoneurolysis: 31.0 (4.61); sham: 30.6 (4.79) Diabetes, prior opioid use, alcohol use, smoking NR but prior alcohol and opioid addiction excluded. Other PROGRESS-Plus criteria: NRe | Intervention:
Comparator: Iovera sham (n = 76) Both study arms: Pre-emptive analgesia (pre-TKA): not stated, only that it would be recorded Anesthesia: during arthroplasty, limited to SA, LIA acceptable, Postoperative main management: single ACB and opioid or other, to be recorded. | Outcomes:g
Follow-up: Some outcomes up to 2 weeks and some up to 12 weeks post-TKA |
Lung et al. (2022)h Cohort study included in 2 SRs22,23 Funding source: SR22 states “Declared no COI” | Retrospective cohort study Eligibility: Preoperative TKA-related pain RoB as rated by review authors: some concerns in 1 SR22 (downgraded due to risk of selection bias); serious in 1 SR23 (downgraded due to risk of confounding, outcome measurement, and reporting biases) | Number of participants: 57 Age (years), mean: 68 (total sample) Sex or gender: 37 women, 20 men. Other sexes or genders were NR Race or ethnicity n (%): NR BMI, mean: 32 (total sample) Diabetes: cryoneurolysis: 8 (28.5%); control: 8 (30.7%) Smoking: cryoneurolysis: 3 (10.7%); control: 2 (7.7%) ASA (cryoneurolysis vs. control): I: 13 (54.1%) vs. 2 (48%): II: 11 (45.8%) vs. 13 (52%) Prior opioid use: cryoneurolysis: 5 (18.5%); control: 5 (19.2%) Other PROGRESS-Plus criteriae: NR in SR or primary report | Interventions:
Comparators: Standard therapy (preoperative, intraoperative, and postoperative multimodal pain regimen) (n = 28) Both study arms: Anesthesia: Single or continuous ACB Postoperative pain management: SR states NR for this study | Outcomes: SRs report a subset of outcomes and time points from the study Follow-up: up to 12 months |
Swisher et al. (2022)h Funding source: SR22 states “Financial COI” | Parallel-group RCT Eligibility: Preoperative TKA-related pain | Number of participants: 16 Age (years), mean: 68 (total sample) Sex or gender: 10 women / 6 men. Other sexes or genders were NR Race or ethnicity n (%): NR BMI, mean: 27 (total sample) Other PROGRESS-Plus criteriae and select baseline characteristics of interest: NR in SR or primary report | Interventions:
Comparators: Sham cryoneurolysis (n = 8) Both study arms: Anesthesia: Single or continuous ACB, GA; Postoperative pain management: Acetaminophen, celecoxib, gabapentin, oxycodone, hydromorphone. | Outcomes: SRs report a subset of outcomes and time points from the study Follow-up: up to 3 weeks |
Mihalko (2021) / Jennewine (2023)h, j Funding source: SR22 states ‘Financial COI’ | Parallel-group RCT Eligibility: Preoperative TKA-related pain RoB as rated by review authors: low risk in 1 SR;21 some concerns in 1 SR;22 high risk in 1 SR23 (downgraded across all domains) | Number of participants: 96 PP, 124 ITT Age (years), mean: 65 (total sample) Sex or gender: 41 women / 45 men. Other sexes or genders were NR Race or ethnicity (cryoneurolysis vs. control) n (%): (extracted from primary study report): Asian: 1 (2.1%) vs. 0 (0%); Black: 8 (16.7%) vs. 12 (25.0%); white: 40 (83.3%) vs. 36 (75.0%); Ethnicity n (%): Hispanic or Latino: 0 (0%) vs 0 (0%); Not Hispanic or Latino: 48 (100%) vs. 48 (100%) BMI, mean: 30.9 (total sample) Current / previous opioid use: Excluded those with current habitual use for > 3 months pre-enrolment Other PROGRESS-Plus criteriae and select baseline characteristics of interest: NR in SR or primary report | Interventions:
Comparators Standard therapy (preoperative, intraoperative, and postoperative multimodal pain regimen) (n = 48 PP, 62 ITT) Both study arms: Anesthesia: SA, ACB, GA; Postoperative pain management: Acetaminophen, gabapentin, meloxicam, tramadol, oxycodone. | Outcomes: SRs report a subset of outcomes and time points from the study Follow-up: up to 3 weeks |
Urban (2021)h Cohort study included in 3 SRs21-23 Funding source: SR22 states ‘Financial COI’ | Retrospective cohort study Eligibility: Preoperative TKA-related pain RoB as rated by review authors: low risk in 1 SR21; “some concerns” in 1 SR22 (downgraded due to RoB due to confounding and participant selection); serious concerns in 1 SR23 (downgraded for RoB due to confounding, outcome measurement, and selection of reported results) | Number of participants: 267 Age (years), mean: 67 (total sample) Sex or gender: 165 women / 102 men. Other sexes or genders were NR Race or ethnicity: NR BMI, mean: 29.7 (total sample) ASA physical status classification n (%) cryoneurolysis vs. control: I: 10 (6%) vs. 12 (12%); II: 120 (71%) vs. 61 (62%); III: 39 (23%) vs. 25 (26%) Current / previous opioid use – no prior exposure, n (%), cryoneurolysis vs. control: 162 (96%) vs. 79 (81%) Other PROGRESS-Plus criteriae and select baseline characteristics of interest: NR in SR or primary report | Interventions:
Comparators Standard therapy (preoperative, intraoperative, and postoperative multimodal pain regimen) (n = 98) Both study arms: Anesthesia: Single ACB, GA; Postoperative pain management: Acetaminophen, meloxicam, tramadol oxycodone, morphine | Outcomes: SRs report a subset of outcomes and time points from the study Follow-up: up to 6 weeks |
Dasa (2016)h Cohort study included 3 SRs21-23 Funding source: SR22 states ‘Declared no COI’ | Retrospective cohort study Eligibility: Preoperative TKA-related pain RoB as rated by review authors: low risk in 1 SR21; ‘some concerns’ in 1 SR22 (downgraded due to RoB due to participant selection); serious concerns in 1 SR23 (downgraded for RoB due to confounding, missing data, outcome measurement, and selection of reported results) | Number of participants: 100 Age (years), mean: 67 (total sample) Sex or gender: 70 women, 30 men; other sexes or genders were NR Race or ethnicity: NR BMI, mean: 31.6 (total sample) Other PROGRESS-Plus criteriae and select baseline characteristics of interest: NR in SR | Interventions:
Comparators Standard therapy (preoperative, intraoperative, and postoperative multimodal pain regimen) (n = 50) Both study arms: Anesthesia: SA and FNB, or ACB Postoperative pain management: Acetaminophen, celecoxib, pregabalin, oxycodone | Outcomes: SRs report a subset of outcomes and time points from the study Follow-up: up to 12 weeks |
ACB = adductor canal block; AFCN = anterior femoral cutaneous nerve; ASA = American Society of Anesthesiologists; BMI = body mass index; COI = conflict of interest; FNB = not defined in SR but assumed to be femoral nerve block; GA = general anesthesia; IPBSN = infrapatellar branches of the saphenous nerve; ITT = intention to treat; LIA = local infiltration analgesia; NR = not reported; OA = osteoarthritis; PP = per protocol; PROGRESS = place of residence, race, ethnicity, culture, language, occupation, gender or sex, religion, education, and socioeconomic status; RCT = randomized controlled trial; RoB = risk of bias; SA = spinal anesthesia; SD = standard deviation; SR = systematic review; TKA = total knee arthroplasty; vs. = versus.
Notes: Please note that this appendix has not been copy-edited.
Racial categories used in the table are as reported in the source and may not align with Canada's Drug Agency inclusive language guidelines.
aCompanion (more participants and longer-term follow-up) to study reported in Mont et al. which is included in Hajiaghajani et al.22 Note: the references in Ng et al.24 are not all cited correctly.
bProtocol for the registry used for this study: Dasa et al.;29 registered at clinicaltrials.gov (NCT05495334).28
cNumber of centres NR and unclear. Mont et al. stated participants were recruited from 8 centres, with up to 11 expected for the registry; the trial registration record cites 14 centres.
dSignificantly more severity in the cryoneurolysis group.
eThe main PROGRESS-Plus criteria include place of residence, race, ethnicity, culture, language, occupation, gender, sex, religion, education, socioeconomic status, social capital, personal characteristics associated with discrimination (e.g., age, disability), features of relationships, and time-dependent relationships.34
fInformation extracted from SR,21 trials registry record,61 and protocol appended to registry.
gPrimary outcomes were changed throughout the course of the trial (per trial registry) but the protocol seems congruent with report. The latest version was updated during recruitment.
hStudy characteristics extracted primarily from the relevant SRs. Some participant characteristics (e.g., race, ASA physical score) and outcome measures not reported in SRs are extracted from the primary reports.
iDiep et al.23 states that this study tested the Iovera device but it tested the PainBlocker device (Epimed, Dallas, Texas).
jCompanion studies. Mihalko et al. is the main study and Jennewine et al. includes a subgroup analysis with data from most of the same participants.
Appendix 4: Critical Appraisal of Included Publications
Please note that this appendix has not been copy-edited.
Table 4: Clinical Effectiveness of Cryoneurolysis for Total Knee Arthroplasty — Strengths and Limitations of Systematic Reviews Using AMSTAR 258
Strengths | Limitations |
|---|---|
Goodwin et al. (2025)21 | |
|
|
Hajiaghajani et al. (2025)22 | |
|
|
Diep et al. (2023)23 | |
|
|
AMSTAR 2 = A MeaSurement Tool to Assess systematic Reviews 2; BMI = body mass index; GRADE = Grading of Recommendations Assessment, Development and Evaluation; PICO = population, intervention, comparators, outcomes; RCT = randomized controlled trial; RoB = risk of bias.
aAuthors state: “[W]e evaluated the studies for disclosures of financial conflicts of interest (COIs), including funding of trials by companies currently offering CNL technology (Pacira CryoTech, Inc., and Myoscience, Fremont, California) or potential author affiliations and declared COIs.”
Table 5: Clinical Effectiveness of Cryoneurolysis for Total Knee Arthroplasty — Strengths and Limitations of Cohort Study Using the Downs and Black Checklist59
Strengths | Limitations |
|---|---|
Ng et al. (2025)24 | |
|
|
ASA = American Society of Anesthesiologists; BMI = body mass index; PROGRESS = place of residence, race, ethnicity, culture, language, occupation, gender or sex, religion, education, and socioeconomic status; TKA = total knee arthroplasty.
aThe main PROGRESS-Plus criteria include place of residence, race, ethnicity, culture, language, occupation, gender, sex, religion, education, socioeconomic status, social capital, personal characteristics associated with discrimination (e.g., age, disability), features of relationships, and time-dependent relationships.34
Appendix 5: Main Study Findings
Table 6: Summary of Findings by Outcome — Pain or Pain Intensity
Citation and study design | Outcome tool and measurement method | Timing | Outcome result | Difference from baseline | Between-group comparison | P value for between-group comparison | ||
|---|---|---|---|---|---|---|---|---|
With cryoneurolysis | Without cryoneurolysis | With cryoneurolysis | Without cryoneurolysis | |||||
Hajiaghajani et al. (2025)22 SR with MA of 5 studies (RCTs and observational studies) | Outcome: Early pain; postoperative pain scores. No limits on tool used (those used include BPI-SF, NRS, VAS, PROMIS pain intensity) | Up to 2 weeks | NR | NR | NR | NR | Hedge’s g (95% CI) −0.33 (−0.49 to −0.17) I2 = 0% | < 0.001a |
Ng et al. (2025)24 / Mont et al. (2025) Cohort Mont et al. (2025) is a companion report and included 1 SR22 | BPI-Painb,c | 1 week | Ng et al. (2025) n = 174 3.77 (0.22) Mont et al. (2025) n = 65 / 80 (81%) LSM (SE): 3.82 (0.57) | Ng et al. (2025) n = 182 4.13 (0.21) Mont et al. (2025) n = 44 / 60 (73%) LSM (SE): 4.64 (0.64) | LSMd (95% CI) 0.99 (−0.64 to 2.63) | LSMd (95% CI) 0.32 (−1.14 to 1.79) | NR | NRe |
2 weeks | Reported in figures only | Reported in figures only | LSMd (95% CI) 1.33 (−0.30 to 2.96) | LSMd (95% CI) 0.81 (−0.65 to 2.27) | NR | NRe | ||
3 weeks | Reported in figures only | Reported in figures only | LSMd (95% CI) 1.79 (0.16 to 3.42) | LSMd (95% CI) 0.90 (−0.57 to 2.36) | NR | NRe | ||
4 weeks | Reported in figures only | Reported in figures only | LSMd (95% CI) 2.02 (0.39 to 3.65) | LSMd (95% CI) 1.23 (0.23 to 2.70) | NR | NRe | ||
5 weeks | Reported in figures only | Reported in figures only | LSMd (95% CI) 2.18 (0.55 to 3.81) | LSMd (95% CI) 1.85 (0.39 to 3.31) | NR | NRe | ||
6 weeks | Reported in figures only | Reported in figures only | LSMd (95% CI) 2.39 (0.76 to 4.03) | LSMd (95% CI) 1.81 (0.35 to 3.27) | NR | NRe | ||
2 months | Reported in figures only | Reported in figures only | LSMd (95% CI) 2.73 (1.10 to 4.36) | LSMd (95% CI) 1.82 (0.36 to 3.27) | NR | NRe | ||
3 months | Reported in figures only | Reported in figures only | LSMd (95% CI) 2.82 (1.18 to 4.45) | LSMd (95% CI) 2.27 (0.81 to 3.73) | NR | NRe | ||
4 months | Reported in figures only | Reported in figures only | LSMd (95% CI) 3.25 (1.62 to 4.89) | LSMd (95% CI) 1.93 (0.45 to 3.40) | NR | NRe | ||
5 months | Reported in figures only | Reported in figures only | LSMd (95% CI) 3.24 (1.60 to 4.88) | LSMd (95% CI) 2.38 (0.90 to 3.87) | NR | NRe | ||
6 months | Reported in figures only | Reported in figures only | LSMd (95% CI) 3.10 (1.45 to 4.74) | LSMd (95% CI) 1.89 (0.41 to 3.38) | NR | NRe | ||
Up to 6 months (Overall) | Overall LSM (SE) 2.45 (0.55) | Overall LSM (SE) 3.07 (0.49) | LSMd (95% CI) 2.35 (0.73 to 3.97)f | LSMd (95% CI) 1.57 (0.13 to 3.01)f | NR | 0 0.024g 0.049h | ||
9 months | Reported in figures only | Reported in figures only | NR | NR | NR | NRe | ||
12 months | Reported in figures only | Reported in figures only | Trend toward decreased severity in both cohorts P < 0.001 | Trend toward decreased severity in both cohorts P < 0.001 | NR | < 0.001d | ||
Proportion (%) of participants achieving MCID for pain severity (using Pain Catastrophizing Scale)c,i | 1 week | n = 65 / 80 (81%) 54.2% | n = 44 / 60 (73%) 48.8% | NR | NR | NR | NR | |
2 weeks | n = 66 / 80 (83%) 64.9% | n = 50 / 60 (83%) 52.1% | NR | NR | NR | NR | ||
3 weeks | n = 60 / 80 (75%) 60.9% | n = 45 / 60 (75%) 54.8% | NR | NR | NR | NR | ||
4 weeks | n = 65 / 80 (81%) 68.9% | n = 44 / 60 (73%) 62.3% | NR | NR | NR | NR | ||
5 weeks | n = 69 / 80 (86%) 66.1% | n = 51 / 60 (85%) 58.9% | NR | NR | NR | NR | ||
6 weeks | n = 58 / 80 (73%) 71.5% | n = 49 / 60 (82%) 65.3% | NR | NR | NR | NR | ||
2 months | n = 67 / 80 (84%) 80.4% | n = 54 / 60 (75%) 65.5% | NR | NR | NR | NR | ||
3 months | n = 60 / 80 (75%) 75.1% | n = 48 / 60 (80%) 65.5% | NR | NR | NR | NR | ||
4 months | n = 53 / 80 (66%) 80.3% | n = 36 / 60 (60%) 60.2% | NR | NR | NR | NR | ||
5 months | n = 45 / 80 (56%) 78.2% | n = 30 / 60 (50%) 73.4% | NR | NR | NR | NR | ||
6 months | n = 41 / 80 (51%) 80.9% | n = 29 / 60 (48%) 72.7% | NR | NR | NR | NR | ||
Up to 6 months (Overall) | 71.7% | 62.2% | NR | NR | OR (95% CI) 1.55 (1.15 to 2.07) | 0.004 | ||
9 months | NR | NR | NR | NR | NR | NR | ||
12 monthsj | 71% | 63% | NR | NR | NR | < 0.001 | ||
Pacira Pharmaceuticals, Inc. (Sponsor) (2024) | NRS for pain – rated “now”k | 6 weeks | NR | NR | n = 73 / 74 Mean (SD) −2.7 (2.96) | n = 75 / 76 Mean (SD) −3.6 (3.03) | NR | NR |
NRS for pain – rated for the “past 7 days”k | 6 weeks | NR | NR | Mean (SD) −2.4 (3.01) | Mean (SD) −2.9 (3.28) | NR | NR | |
Lung et al. (2022) | VAS pain scoresl | Inpatients | NR | NR | NR | NR | NR | “[F]ailed to reach statistical significance.” |
Swisher et al. (2022) | NRS (average and worst in primary publication) | Day 1 to 21 | NR | NR | NR | NR | NR | NRm |
NRS pain scores | 2 weeks | n = NR Mean (SD) 2.38 (1.11)n | n = NR Mean (SD) 3.86 (2.63)n | NR | NR | SRs22,23 report: “comparable / non-significant for NRS pain scores” | NR | |
Milhalko et al. (2021) | NRS Pain scorek pain in the past week, AUC change from baseline | 72 hour | NR | NR | n = 48° Mean (SD) 0.2 (1.4) | n = 48° Mean (SD) −0.2 (1.1) | Mean differencep between groups (95% CI) 0.4 (−0.1 to 0.9) | 0.0642 |
2 weeks | NR | NR | n = 48° Mean (SD) 1.0 (2.1) | n = 48° Mean (SD) 0.4 (1.8) | Mean differencep between groups (95% CI) 0.6 (−0.2 to 1.4) | 0.0615 | ||
6 weeks | NR | NR | n = 48° Mean (SD) 2.2 (2.2) | n = 48° Mean (SD) 1.6 (2.0) | Mean differencep between groups (95% CI) 0.6 (−0.2 to 1.5) | 0.0680 | ||
12 weeks | NR | NR | n = 48° Mean (SD) 3.2 (2.3) | n = 48° Mean (SD) 2.3 (2.0) | Mean differencep between groups (95% CI) 0.9 (0.0 to 1.7) | 0.0256 | ||
NRS Pain score,k current pain, AUC change from baseline | 72 hour | NR | NR | n = 48° Mean (SD) 0.5 (1.7) | n = 48° Mean (SD) −0.4 (1.3) | Mean differencep between groups (95% CI) 0.9 (0.3 to 1.5) | 0.0023 | |
2 weeks | NR | NR | n = 48° Mean (SD) 1.3 (2.6) | n = 48° Mean (SD) 0.1 (2.0) | Mean differencep between groups (95% CI) 1.2 (0.2 to 2.1) | 0.0074 | ||
6 weeks | NR | NR | n = 48° Mean (SD) 2.1 (2.6) | n = 48° Mean (SD) 1.4 (2.0) | Mean differencep between groups (95% CI) 0.8 (−0.2 to 1.7) | 0.0568 | ||
12 weeks | NR | NR | n = 48° Mean (SD) 2.9 (2.6) | n = 48° Mean (SD) 2.3 (2.0) | Mean differencep between groups (95% CI) 0.6 (−0.3 to 1.6) | 0.1045 | ||
Urban et al. (2021) | NRS pain score,k adjusted mean (95% CI)q | During hospital stay | 3.06 (2.71 to 3.46) | 3.92 (3.49 to 4.40) | NR | NR | Ratio estimate (95% CI) 0.78 (0.70 to 0.88) | < 0.0001 |
Maximum NRS pain scorek adjusted mean (95% CI)q | During hospital stay | 6.68 (6.18 to 7.23) | 8.21 (7.63 to 8.85) | NR | NR | Ratio estimate (95% CI) 0.81 (0.75 to 0.88) | < 0.0001 | |
Mean NRSk pain score ≥ 4, n (%) | During hospital stay | 25 / 169 (15%) | 36 / 98 (37%) | NR | NR | Ratio estimate (95% CI) 0.38 (0.20 to 0.72) | 0.0031 | |
Dasa et al. (2016) | PROMIS pain intensity | 2 weeks | NR | NR | Mean (SD) 5.7 (2.3)r | Mean (SD) 6.4 (2.8)r | NR | SR23 reports: statistically significant improvement in favour of the intervention group. |
ASA = American Society of Anesthesiologists score; AUC = area under the curve; BMI = body mass index; BPI-SF = Brief Pain Inventory-Short Form; CI = confidence interval; LSM = least squares mean; MA = meta-analysis; MCID = minimal clinically important difference; NR = not reported; NRS = Numerical Rating Scale; OR = odds ratio; PROMIS = Patient-Reported Outcomes Measurement Information System; RCT = randomized controlled trial; SD = standard deviation; SE = standard error; SR = systematic review; VAS = visual analogue scale.
Please note that this appendix has not been copy-edited.
aHajiaghajani et al.22 assessed the “quality of the evidence” using the Grading of Recommendations Assessment, Development and Evaluation (GRADE) approach.27 They rated the overall certainty of evidence for this outcome as high.
bFrom Ng et al.:24 “The pain severity outcome was scored based on items #3 to #6 from the BPI-SF, each of which ranged from 0 (no pain) to 10 (unimaginable pain) and was documented by patients at baseline, weekly, and monthly during follow-up. Specifically, this modified scoring system included overall pain intensity at its worst, at its least, on average, and at the time of recording.”
cExtracted from Mont et al. except where indicated. This study was included in 1 SR.22
dLSM is calculated by: baseline pain score [minus] follow-up pain score. Positive values indicate pain improvement from the baseline, negative values indicate the opposite. Pain severity improvement was adjusted by Pain Catastrophizing Scale scores, Kellgren-Lawrence grade, age, sex, BMI, and ASA baseline score.
eNg et al.24 report that “patients treated with preoperative cryoneurolysis had significantly lower pain severity over time than controls at all time points (P < 0.001).”
fMont et al. also states that over 6 months of follow-up, there was a significant trend toward decreased pain severity in both cohorts (P < 0.001).
gP value for comparison of scores between groups at this time point.
hP value for comparison of change from baseline scores between groups at this time point
iAn MCID (Kazis effect size) = group mean difference from baseline/group baseline standard deviation. Adjusted for age, sex, BMI, ASA, Kellgren-Lawrence grade, and baseline PCS.
jExtracted from Ng et al.24
kThe Numeric Rating Scale for Pain (NRS for Pain) is a measure of pain intensity which is assessed on a scale from 0 to 10 with 0 being no pain at all and 10 being the worst pain imaginable. The participant provides a self-reported score.
lThe VAS is a continuous scale in which a higher score suggests greater pain intensity and a reduction in scores suggests improvement. A score of 0 cm indicates “no pain” and 10 cm indicates “worst pain imaginable.” Diep et al.23 determined that an MCID for this scale is an absolute and relative change of −19.9 mm and −40.8%, respectively.
mText states “cryoneurolysis had lower average and worst pain scores compared to control from pre-operative day 4 to 21.” No significance testing mentioned.
nPresented only in figures in primary report; extracted by SR22 using software.
oThe number of participants in the per-protocol population in Mihalko et al. is 48 per arm; the number of participants included in the intention-to-treat population is 62 per arm.
pMean difference calculated as standard of care group mean minus cryoneurolysis group mean.
qModel adjusted for age, sex, ASA physical status class, BMI, and prior opioid exposure.
rExtracted from Hajiaghajani et al.22
Table 7: Summary of Findings by Outcome — Opioid Consumption
Citation and study design | Outcome measurement | Timing | Outcome result | Difference from baseline | Between-group comparison (as reported) | P value for between-group comparison | ||
|---|---|---|---|---|---|---|---|---|
With cryoneurolysis | Without cryoneurolysis | With cryoneurolysis | Without cryoneurolysis | |||||
Hajiaghajani et al. (2025)22 SR with MA of 3 studies (RCT and observational studies) | No limits on measurement method (included TMEs, number of tablets, MME) | 6 weeks | NR | NR | NR | NR | Hedge’s g (95% CI) −0.26; (−0.46 to −0.07) I2 = 0 | 0.01a |
Ng et al. (2025)24 / Mont et al. (2026) Cohort study. Mont et al. (2025) is a companion report and included in 1 SR22 | Opioid use (%)b | 1 week | Ng et al. (2025) n = 174 75% Mont et al. (2025) n = 66 / 80 (83%) 76.7% | Ng et al. (2025) n = 182 94% Mont et al. (2025) n = 45 / 60 (75%) 95.5% | NR | NR | NR | Ng et al. (2025) < 0.001 |
2 weeks | n = 67 / 80 (84%) 63.9% | n = 50 / 60 (83%) 94.5% | NR | NR | NR | NR | ||
3 weeks | n = 62 / 80 (78%) 48.0% | n = 46 / 60 (78%) 84.9% | NR | NR | NR | NR | ||
4 weeks | n = 64 / 80 (80%) 45.7% | n = 45 / 60 (75%) 73.5% | NR | NR | NR | NR | ||
5 weeks | n = 69 / 80 (86%) 34.1% | n = 51/ 60 (85%) 66.9% | NR | NR | NR | NR | ||
6 weeks | n = 58 / 80 (73%) 31.3% | n = 49 / 60 (82%) 60.7% | NR | NR | NR | NR | ||
2 months | Ng et al. (2025) 25% Mont et al. (2025) n = 67 / 80 (84%) 17.7% | Ng et al. (2025) 45% Mont et al. (2025) n = 54 / 60 (90%) 56.1% | NR | NR | NR | NRc | ||
3 months | n = 60 / 80 (75%) 24.3% | n = 48 / 60 (80%) 32.3% | NR | NR | NR | > 0.05d | ||
4 months | n = 53 / 80 (66%) 7.6% | n = 36 / 60 (60%) 27.1% | NR | NR | NR | 0.003d | ||
5 months | n = 45 / 80 (56%) 15.0% | n = 30 / 60 (50%) 19.7% | NR | NR | NR | > 0.05d | ||
6 months | n = 41 / 80 (51%) 14.5% | n = 29 / 60 (48%) 24.3% | NR | NR | Mont et al. (2025): The reported use of opioids decreased from 3 to 6 months postoperatively in both cohorts (< 14%). | > 0.05d | ||
Up to 6 months overall | 31.4% | 62.8% | NR | NR | OR (95% CI) 0.27 (0.19 to 0.38) | < 0.001 | ||
9 months | Reported only in figures, not extracted | Reported only in figures, not extracted | NR | NR | NR | NR | ||
12 months | Reported only in figures, not extracted | Reported only in figures, not extracted | NR | NR | NR | NR | ||
Overall, average opioid use up to 12 months | 24% | 41% | NR | NR | NR | < 0.001d | ||
Pacira Pharmaceuticals, Inc. (Sponsor) (2024) | Cumulative consumption of opioids total daily MME (mg/day) | Hospital discharge to 6 weeks postsurgery | n = 69 / 74 Mean (SD) 23.9 (15.25) | n = 71 / 76 Mean (SD) 27.1 (20.87) | NR | NR | NR | NR |
Lung et al. (2022) | MME (administered) | Inpatient stay | Mean (SD) 29.3 (23.8) Median (range) 24.3 (0 to 86.5) | Mean (SD) 35 (24) Median (range) 25 (1.2 to 83) | NR | NR | NR | 0.31 |
MME (total doses prescribed) | 4 weeks | Mean (SD) 313 (478) Median (range) 88 (0 to 2,025) | Mean (SD) 561 (619) Median (range) 450 (0 to 2,565) | NR | NR | NR | 0.0534 | |
MME (total doses prescribed) | 6 weeks | Mean (SD) 154 (427) Median (range) 0 (0 to 2,025) | Mean (SD) 289 (439) Median (range) 0 (0 to 1,350) | NR | NR | NR | 0.19 | |
Swisher et al. (2022) | Number of participants using opioids | Up to 3 weeks | At 2 weeks: 3 / 8 At 3 weeks: 3 / 8 | At 2 weeks: 5 / 8 At 3 weeks: 3 / 8 | NR | NR | NR | Hajiaghajani et al. (2025)22 states nonsignificant difference in number of tablets |
Milhalko et al. (2021) | Opioid consumption in TMEs, mean (SE), mg, self-reported | 72 hours | n = 48e 10.9 (1.4) | n = 48e 14.9 (1.7) | NR | NR | ITT: Mean differencef (95% CI)e 1.3 (−0.5 to 3.2) PP: Mean differencef (95% CI) 4.0 (−0.5 to 8.4) | ITT: 0.841 PP: 0.0389 |
Opioid consumption in TMEs (mean daily cumulative) (SE), mg, pill counts by study coordinator | 2 weeks | n = 48e 9.2 (1.0) | n = 48e 9.8 (1.1) | NR | NR | PP: Mean differencef (95% CI) 0.6 (−2.3 to 3.5) | PP: 0.3461 | |
6 weeks | n = 48e 4.2 (0.5) | n = 48e 5.9 (0.6) | NR | NR | ITT: Mean differencef (95% CI) 1.3 (−0.5 to 3.2) PP: Mean differencef (95% CI) 1.6 (0.1 to 3.2) | PP: 0.00186 | ||
12 weeks | n = 48e 2.4 (0.3) | n = 48e 3.4 (0.4) | NR | NR | PP: Mean differencef (95% CI) 1.0 (0.0 to 2.0) | PP: 0.0234 | ||
Patients who were not opioid free, n (%) | Discharge to 6 weeks | 7 (15%) | 19 (40%) | NR | NR | NR | 0.0059 | |
Discharge to 12 weeks | NR | NR | NR | NR | “[T]he cryoneurolysis group consumed 29% fewer opioids than the [control] group.” | NR | ||
Urban et al. (2021) | Daily MMEs, adjusted mean (95% CI)g | In hospital | 47 (41 to 54) | 97 (85 to 111) | NR | NR | Ratio estimate (95% CI) 0.49 (0.43 to 0.56) | < 0.0001 |
Total MMEs adjusted mean (95% CI)g | In hospital | 104 (80 to 122) | 324 (279 to 376) | NR | NR | Ratio estimate (95% CI) 0.32 (0.28 to 0.37) | < 0.001 | |
Total MMEs adjusted mean (95% CI)g (prescribed) | At discharge | 660 (593 to 736) | 1,154 (1,044 to 1,277) | NR | NR | Ratio estimate (95% CI) 0.57 (0.52 to 0.63) | < 0.0001 | |
2 weeks | 203 (114 to 361) | 115 (64 to 208) | NR | NR | Ratio estimate (95% CI) 1.76 (1.00 to 3.11) | 0.509 | ||
6 weeks | 34 (19 to 62) | 87 (48 to 159) | NR | NR | Ratio estimate (95% CI) 0.39 (0.22 to 0.69) | 0.0012 | ||
Cumulative MME, adjusted mean (95% CI)g (prescribed from discharge) | 2 weeks | 885 (765 to 957) | 1,312 (1,182 to 1,457) | NR | NR | Ratio estimate (95% CI) 0.65 (0.59 to 0.73) | < 0.0001 | |
6 weeks | 894 (795 to 1,004) | 1,406 (1,260 to 1,570) | NR | NR | Ratio estimate (95% CI) 0.64 (0.57 to 0.71) | < 0.0001 | ||
Dasa et al. (2016) | Mean (SE) cumulative morphine use (mg) | Up to 12 weeks | 2,069.12 (132.09) | 3,764.42 (287.95) | NR | NR | “[C]ryoneurolysis group used 45% less morphine equivalent narcotics than control during 12 weeks postsurgery, after adjusting for age, gender and BMI.” | < 0.0001 |
ASA = American Society of Anesthesiologists score; BMI = body mass index; CI = confidence interval; ITT = intention to treat; LSM = least squares mean; MA = meta-analysis; MME = morphine milligram equivalent; NR = not reported; OR = odds ratio; PP = per protocol; RCT = randomized controlled trial; SD = standard deviation; SE = standard error; SR = systematic review; TME = total morphine equivalent.
Please note that this appendix has not been copy-edited
cHajiaghajani et al.22 assessed the quality of the evidence using the Grading of Recommendations Assessment, Development and Evaluation (GRADE) approach.27 They rated the overall certainty of evidence for this outcome as moderate.
bExtracted from Mont et al., which is included in Hajiaghajani et al.,22 except where indicated. Mont et al. state that this is adjusted for age, sex, BMI, Kellgren-Lawrence grade, ASA score, and Pain Catastrophizing Scale baseline score. Also presented at some time points in Ng et al.24 in figures only.
cMont et al. state that “Substantially, more control patients reported using opioids than patients treated with cryoneurolysis…at 2 months (9 versus 26%) postoperatively.” Does not match data in table to which it refers.
dAs reported in Ng et al. (2025)24 for a larger participant population with data presented in figures only.
eThe number of participants in the per-protocol population in Mihalko et al. is 48 per arm, the number of participants included in the ITT population is 62 per arm. The per-protocol analysis excluded those with excess (6 cryoneurolysis and 9 control participants) or insufficient (2 cryoneurolysis and 0 control participants) opioid prescriptions, no tramadol prescription (2 participants in each group), or those lacking follow-up data up to 6 weeks (1 participant in each group).
fMean difference is calculated as standard of care group mean minus cryoneurolysis group mean.
gUrban et al.: models adjusted for age, sex, ASA status, BMI, and prior opioid exposure.
Table 8: Summary of Findings by Outcome — Physical Function – Patient-Reported Outcomes (KOOS; KOOS, JR)
Citation and study design | Outcome measurement | Timing | Outcome result | Difference from baseline | Between-group comparison (as reported) | P value for between-group comparison | ||
|---|---|---|---|---|---|---|---|---|
With cryoneurolysis | Without cryoneurolysis | With cryoneurolysis | Without cryoneurolysis | |||||
Hajiaghajani et al. (2025)22 SR with MA of 4 studies (RCT and observational studies) | KOOS (1 study) or KOOS, JR | 3 months | NR | NR | NR | NR | Hedges' g (95% CI) 0.150 (−0.047 to 0.348) I2 = 0% | P = 0.136a |
Ng et al. (2025)24 / Mont et al. (2025) Cohort study. Mont et al. (2025) is a companion report and included in 1 SR22 | KOOS, JRb | 1 week | LSM (SE) 50.54 (3.72) | Presented in figure only | LSM (95% CI)c 2.85 (−7.14 to 12.85) | LSM (95% CI)c 0.56 (−8.46 to 9.58) | NR | NR |
2 weeks | Presented in figure only | LSM (SE) 52.9 (3.71) | LSM (95% CI)c 8.58 (−1.41 to 18.57) | LSM (95% CI)c 5.15 (−3.83 to 14.12) | NR | NR | ||
3 weeks | Presented in figure only | Presented in figure only | LSM (95% CI)c 11.93 (1.93 to 21.93) | LSM (95% CI)c 7.85 (−1.15 to 16.86) | NR | NR | ||
4 weeks | Presented in figure only | Presented in figure only | LSM (95% CI)c 13.66 (3.67 to 23.65) | LSM (95% CI)c 9.46 (0.45 to 18.47) | NR | NR | ||
5 weeks | Presented in figure only | Presented in figure only | LSM (95% CI)c 14.40 (4.42 to 24.39) | LSM (95% CI)c 12.53 (3.55 to 21.51) | NR | NR | ||
6 weeks | Presented in figure only | Presented in figure only | LSM (95% CI)c 16.28 (6.25 to 26.30) | LSM (95% CI)c 13.34 (4.36 to 22.33) | NR | NR | ||
2 months | Presented in figure only | Presented in figure only | LSM (95% CI)c 18.72 (8.73 to 28.70) | LSM (95% CI)c 15.63 (6.67 to 24.59) | NR | NR | ||
3 months | Mean (SD): 68.96 (32.2)d | Mean (SD) 68.12 (26)d | LSM (95% CI)c 20.98 (10.97 to 30.99) | LSM (95% CI)c 20.50 (11.52 to 29.48) | NR | NR | ||
4 months | Presented only in figure | Presented only in figure | LSM (95% CI)c 25.71 (15.67 to 35.75) | LSM (95% CI)c 20.31 (11.21 to 29.41) | NR | NR | ||
5 months | Presented only in figure | Presented only in figure | LSM (95% CI)c 26.00 (15.92 to 36.09) | LSM (95% CI)c 22.48 (13.29 to 31.67) | NR | NR | ||
6 months | LSM (SE) 64.60 (3.59) | LSM (SE) 61.31 (3.19) | LSM (95% CI)c 25.40 (15.28 to 35.53) | LSM (95% CI)c 22.12 (12.91 to 31.32) | NR | 0.061e | ||
6 months overall | NR | NR | LSM (95% CI)c 16.77 (6.88 to 26.67) | LSM (95% CI)c 13.63 (4.84 to 22.41) | NR | 0.194 | ||
12 months | Overall average: 65.2 | Overall average: 63.9 | NR | NR | NR | 0.004 | ||
Proportion (%) achieving a MCID for KOOS, JR outcomef | 1 week | n = 66 / 80 (83%) 56.5% | n = 44 / 60 (73%) 58.0% | NA | NA | NR | SR22 states (for Mont et al. [2025]): No significant difference for KOOS, JR MCID achievement | |
2 weeks | n = 67 / 80 (84%) 65.5% | n = 50 / 60 (83%) 56.3% | NA | NA | NR | |||
3 weeks | n = 62 / 80 (78%) 76.3% | n = 46 / 60 (77%) 76.3% | NA | NA | NR | |||
4 weeks | n = 64 / 80 (80%) 76.6% | n = 45 / 60 (75%) 80.0% | NA | NA | NR | |||
5 weeks | n = 69 / 80 (86%) 82.9% | n = 51 / 60 (85%) 78. 8% | NR | NR | NR | |||
6 weeks | n = 58 / 80 (73%) 84.4% | n = 49 / 60 (82%) 83.0% | NR | NR | NR | |||
2 months | n = 67 / 80 (84%) 89.2% | n = 54 / 60 (90%) 85.3% | NR | NR | NR | |||
3 months | n = 60 / 80 (75%) 92.8% | n = 48 / 60 (80%) 95.8% | NR | NR | NR | |||
4 months | n = 53 / 80 (66%) 95.4% | n = 36 / 60 (60%) 95.4% | NR | NR | NR | |||
5 months | n = 45 / 80 (56%) 96.2% | n = 30 / 60 (50%) 96.3% | NR | NR | NR | |||
6 months | n = 41 / 80 (51%) 95.4% | n = 29 / 60 (48%) 98.2% | NR | NR | NR | |||
6 months overall | 86.6% | 87.3% | NR | NR | OR (95% CI): 0.94 (0.62 to 1.41) | 0.761 | ||
12 months | 88.4% | 87.8% | NR | NR | NR | 0.696 | ||
Lung et al. (2022) | KOOS, JR – intervalg (higher is better) | 3 months | Mean (SD) 66.4 (14.8) | Mean (SD) 62 (11.9) | Mean (SD) 27.5 (10) | Mean (SD) 25.7 (22.1) | NR | P = 0.5e P = 0.4h |
KOOS, JRi (lower is better) | Mean (SD) 8.1 (5.9) | Mean (SD) 10 (4.8) | Mean (SD) −0.8 (13.8) | Mean (SD) −10 (8.3) | NR | P = 0.5e P = 0.4h | ||
KOOS, JR – intervalg (higher is better) | 12 months | Mean (SD) 77 (21.7) | Mean (SD) 65.7 (5.5) | Mean (SD) 38.8 (11.2) | Mean (SD) 11.1 (9.6) | NR | P = 0.1e P = 0.007h | |
KOOS, JRi (lower is better) | Mean (SD) 5.7 (7.3) | Mean (SD) 7.7 (2.5) | Mean (SD) −11.2 (6.1) | Mean (SD) −7 (6.5) | NR | P = 0.1e P = 0.2h | ||
Milhalko et al. (2021) | KOOS, JR | 3 days | NR | NR | Mean change in AUC/time from baselinej, k −8.4 | Mean change in AUC/time from baselinej, k −1.4 | NR | < 0.0001 |
2 weeks | NR | NR | Mean change in AUC/time from baselinej, k 2.3 | Mean change in AUC/time from baselinej, k 1.0 | NR | < 0.0001 | ||
6 weeks | NR | NR | Mean change in AUC/time from baselinej, k 9.7 | Mean change in AUC/time from baselinej, k 7.7 | NR | < 0.0001 | ||
12 weeks | Mean (SD)d, l 66.4 (14.8) | Mean (SD)d, l 62 (11.9) | Mean change in AUC/time from baseline (SD)d, j, k, 16.0 (3.25) | Mean change in AUC/time from baseline (SD)d, j, k, 14.1 (2.93) | NR | < 0.0001 | ||
Dasa et al. (2016) | KOOS – Symptoms | 2 weeks | n = 43 / 50 Mean (SD) 52.4 (16.8) | n = 33 / 50 Mean (SD) 50.8 (16.2) | NR | NR | NR | > 0.05h |
KOOS – Pain | n = 43 / 50 Mean (SD) 46.7 (17.0) | n = 33 / 50 Mean (SD) 43.3 (18.2) | NR | NR | NR | > 0.05h | ||
KOOS – ADL | n = 42 / 50 Mean (SD) 48.4 (19.9) | n = 33 / 50 Mean (SD) 48.2 (20.5) | NR | NR | NR | > 0.05h | ||
KOOS – QOL | n = 42 / 50 Mean (SD) 34.0 (17.3) | n = 30 / 50 Mean (SD) 32.9 (22.4) | NR | NR | NR | > 0.05h | ||
KOOS – Sports/Recreation | n = 24 / 50 Mean (SD) 24.6 (32.9) | n = 20 / 50 Mean (SD) 35.5 (39.3) | NR | NR | NR | > 0.05h | ||
KOOS – Symptoms | 6 weeks | n = 46 / 50 Mean (SD) 63.8 (18.7) | n = 36 / 50 Mean (SD) 55.6 (15.3) | NR | NR | NR | 0.0037m | |
KOOS – Pain | n = 43 / 50 Mean (SD) 60.7 (16.7) | n = 36 / 50 Mean (SD) 54.3 (17.4) | NR | NR | NR | > 0.05h | ||
KOOS – ADL | n = 45 / 50 Mean (SD) 67.4 (17.7) | n = 36 / 50 Mean (SD) 63.4 (19.0) | NR | NR | NR | > 0.05h | ||
KOOS – QOL | n = 42 / 50 Mean (SD) 48.5 (20.4) | n = 36 / 50 Mean (SD) 44.1 (20.1) | NR | NR | NR | > 0.05h | ||
KOOS – Sports/Recreation | n = 19 / 50 Mean (SD) 35.0 (31.7) | n = 17 / 50 Mean (SD) 48.1 (38.5) | NR | NR | NR | > 0.05h | ||
KOOS – total | 12 weeks | Mean (SD)d, l 67.57 (23.82) | Mean (SD)d, l 59.48 (24.39) | NR | NR | NR | NR | |
KOOS – Symptoms | n = 39 / 50 Mean (SD) 69.9 (18.0) | n = 30 / 50 Mean (SD) 57.7 (16.6) | NR | NR | NR | 0.0011m | ||
KOOS – Pain | n = 39 / 50 Mean (SD) 75.1 (19.9) | n = 30 / 50 Mean (SD) 62.2 (20.0) | NR | NR | NR | > 0.05h | ||
KOOS – ADL | n = 38 / 50 Mean (SD) 75.5 (17.7) | n = 29 / 50 Mean (SD) 66.7 (19.3) | NR | NR | NR | > 0.05h | ||
KOOS – QOL | n = 38 / 50 Mean (SD) 61.8 (24.9) | n = 30 / 50 Mean (SD) 53.9 (23.3) | NR | NR | NR | > 0.05h | ||
KOOS – Sports/Recreation | n = 22 / 50 Mean (SD) 55.5 (34.4) | n = 17 / 50 Mean (SD) 56.9 (37.2) | NR | NR | NR | > 0.05h | ||
ADL = activities of daily living; ASA = American Society of Anesthesiologists; AUC = area under the curve; BMI = body mass index; CI = confidence interval; KOOS = Knee Injury and Osteoarthritis Outcome Score; KOOS, JR = Knee Injury and Osteoarthritis Outcome Score, Joint Replacement; LSM = least squares mean; MA = meta-analysis; MCID = minimum clinically important difference; NR = not reported; OR = odds ratio; PP = per protocol; QOL = quality of life; RCT = randomized controlled trial; SD = standard deviation; SE = standard error; SR = systematic review; TKA = total knee arthroplasty.
Notes: Please note that this appendix has not been copy-edited
From 1 included SR,23 the KOOS consists of 42 items divided into 5 subscales: pain (9 items), symptoms (7 items), ADL function (17 items), sport and recreation function (5 items), and quality of life (4 items). Each item is rated on a scale of 0 (no problems) to 4 (extreme problems). Each of the 5 subscales is calculated as the sum of items and then transformed to a 0 to 100 scale where 0 indicates extreme knee problems and 100 represents no knee problems.
KOOS, JR is a short form of the KOOS for joint replacement populations. The minimum clinically important differences of the KOOS symptom subscale and KOOS, JR scores, based on anchoring methods using data from TKA populations, were determined to be absolute changes of 7 and 15.1, respectively.
aHajiaghajani et al.22 assessed the “quality of the evidence” using the Grading of Recommendations Assessment, Development and Evaluation (GRADE) approach.27 They rated the overall certainty of evidence for this outcome as low.
bExtracted from Mont et al., which is included in Hajiaghajani et al.,22 except where indicated.
cLSM and 95% CI for functional improvement, which is calculated by: follow-up functional score [minus] baseline functional score. Positive values indicate functional improvement from the baseline, negative values indicate the opposite; Functional improvement was adjusted by Pain Catastrophizing Scale, Kellgren-Lawrence grade, age, sex, BMI, and American Society of Anesthesiologist physical status. For data from Ng. Model also adjusted the respective baseline outcome score.
dReported in Hajiaghajani et al.;22 sometimes extracted from figure with software.
eComparison between-group scores at time point.
fMCID (Kazis effect size) = group mean difference from baseline/group baseline SD; adjusted for age, sex, BMI, American Society of Anesthesiologist physical status, Kellgren-Lawrence grade, baseline Pain Catastrophizing Scale score.
gKOOS, JR interval preoperative scores were as follows, mean (SD): cryoneurolysis 47.4 (13.7), control: 40.7 (18.6), P = 0.2.
hComparison between-group changes from baseline at time point.
IKOOS, JR preoperative scores were as follows, mean (SD): cryoneurolysis 15.7 (4.8), control: 17.9 (6.4), P = 0.2.
jThe number of participants in the per-protocol population in Mihalko et al. is 48 per arm; the number of participants included in the intention-to-treat population is 62 per arm.
kAUC of change scores from baseline to the 6-week follow-up assessment divided by the number of days from TKA until the 6-week assessment; KOOS, JR.
lAssumed SD, measure (SE, SD) not reported
mDasa et al. report that the significant findings reported at 6 and 12 weeks were “attenuated” but remained statistically significant after adjusting for age, gender, and BMI.
Table 9: Summary of Findings by Outcome — Physical Function, Patient-Reported (WOMAC)a
Citation and study design | Time point | WOMAC subdomain | Outcome result | Difference from baseline | P value for between-group difference | ||
|---|---|---|---|---|---|---|---|
With cryoneurolysis | Without cryoneurolysis | With cryoneurolysis | Without cryoneurolysis | ||||
Pacira Pharmaceuticals, Inc. (Sponsor) (2024) | 6 weeks | Pain | NR | NR | n = 73 / 74 Mean (SD) −13.1 (12.60) | n = 75 / 76 Mean (SD) −14.6 (13.18) | NR |
Stiffness | NR | NR | n = 73 / 74 Mean (SD) −4.7 (5.29) | n = 75 / 76 Mean (SD) −5.5 (6.78) | NR | ||
Function | NR | NR | n = 73 / 74 Mean (SD) −49.4 (41.66) | n = 75 / 76 Mean (SD) −51.4 (44.56) | NR | ||
Dasa et al. (2016)b,c,d | 2 weeks | Pain | n = 43 / 50 Mean (SD)e: 54.4 (17.4) | n = 35 / 50 Mean (SD)e 49.3 (20.3) | NR | NR | > 0.05f |
Stiffness | n = 43 / 50 Mean (SD)e 41.7 (20.0) | n = 36 / 50 Mean (SD)e 41.2 (17.6) | NR | NR | > 0.05f | ||
Function | n = 42 / 50 Mean (SD)e 52.2 (19.6) | n = 36 / 50 Mean (SD)e 53.1 (21.9) | NR | NR | > 0.05f | ||
6 weeks | Pain | n = 44 / 50 Mean (SD)e 65.9 (17.7) | n = 38 / 50 Mean (SD)e 60.4 (18.8) | NR | NR | > 0.05f | |
Stiffness | n = 45 / 50 Mean (SD)e: 55.4 (21.0) | n = 38 / 50 Mean (SD)e 53.8 (21.3) | NR | NR | > 0.05f | ||
Function | n = 45 / 50 Mean (SD)e 68.4 (17.6) | n = 38 / 50 Mean (SD)e 65.5 (18.6) | NR | NR | > 0.05f | ||
12 weeks | Pain | n = 39 / 50 Mean (SD)e 76.8 (19.7) | n = 31 / 50 Mean (SD)e 65.8 (19.6) | NR | NR | > 0.05f | |
Stiffness | n = 40 / 50 Mean (SD)e 64.2 (22.8) | n = 31 / 50 Mean (SD)e 57.0 (23.5) | NR | NR | > 0.05f | ||
Function | n = 38 / 50 Mean (SD)e 76.1 (17.5) | n = 31 / 50 Mean (SD)e 67.8 (18.3) | NR | NR | > 0.05f | ||
BMI = body mass index; KOOS = Knee Injury and Osteoarthritis Outcome Score; SD = standard deviation; SE = standard error; WOMAC = Western Ontario and McMaster Universities Arthritis Index.
Please note that this appendix has not been copy-edited.
aFrom Pacira Pharmaceuticals, Inc. (Sponsor):61 The Western Ontario and McMaster Universities Arthritis Index (WOMAC) is a tri-dimensional, disease-specific, patient-reported outcome measure. It consists of 24 questions with 5 questions regarding pain, 2 questions regarding stiffness and 17 questions regarding function in [people] with osteoarthritis of the hip or knee. Each question is answered on a scale of 0 (none) to 10 (extreme). Higher scores are associated with worse outcomes.” According to 1 included SR,23 the minimum clinically important differences for total WOMAC subscale scores are −4.15 for pain, −2.02 for stiffness, −12.8 for physical function, and −19.68 for total score.
bExtracted from primary study. Refer to Appendix 6 for citation.
cReport states that WOMAC scores were calculated based on responses to the KOOS questionnaire.
dBaseline WOMAC scores were as follows, mean (SD): Pain – cryoneurolysis, 42.55 (17.74); control: 41.20 (22.69) (P = 0.74); Stiffness: cryoneurolysis: 36.94 (17.03); control: 40.82 (26.19) (P = 0.39); Function: cryoneurolysis: 41.90 ± 17.00; control; 41.92 ± 22.10 (P = 0.99).
eAssumed SD, measure (SE, SD) not reported. It is also not clear if these are intended to be scores at this time point or change from baseline, as suggested in the text. In either case, the results reported exceed the maximum WOMAC subscale scores, and the scores seem to worsen over time in both groups (or the change from baseline increases), although the values are larger than would be expected in either case.
fP values are for comparison of change from baseline between treatment and control groups; repeated measures analysis adjusted for age, gender, and BMI.
Table 10: Summary of Findings by Outcome — Physical Function, Patient-Reported (SF-36 and SF-12)a
Citation and study design Outcome tool | Time point | SF-12 or SF-36 subdomain | Outcome result | Difference from baseline | P value for between-group comparison | ||
|---|---|---|---|---|---|---|---|
With cryoneurolysis | Without cryoneurolysis | With cryoneurolysis | Without cryoneurolysis | ||||
Pacira Pharmaceuticals, Inc. (Sponsor) (2024) RCT included in 1 SR21 61SF-36 | 6 weeks | SF-36 –Physical component | NR | NR | n = 73 / 74 Mean (SD) 3.8 (7.70) | n = 75 / 76 Mean (SD) 6.3 (9.58) | NRb |
SF-36 –Mental component | NR | NR | n = 72 / 74 Mean (SD) 0.7 (10.73) | n = 75 / 76 Mean (SD) 0.3 (10.61) | NRb | ||
SF-36 –Physical Functioning component | NR | NR | n = 73 / 74 Mean (SD) 13.6 (23.83) | n = 75 / 76 Mean (SD) 16.7 (28.49) | NRb | ||
SF-36 –Role- Physical component | NR | NR | n = 72 / 74 Mean (SD) 4.3 (31.83) | n = 75 / 76 Mean (SD) 17.8 (33.67) | NRb | ||
SF-36 –Bodily Pain component | NR | NR | n = 73 / 74 Mean (SD) 13.2 (23.07) | n = 75 / 76 Mean (SD) 16.9 (26.66) | NRb | ||
SF-36 –General Health component | NR | NR | n = 73 / 74 Mean (SD) 1.7 (12.18) | n = 75 / 76 Mean (SD) 1.5 (14.17) | NRb | ||
SF-36 – Vitality component | NR | NR | n = 73 / 74 Mean (SD): 3.2 (20.15) | n = 75 / 76 Mean (SD) 4.2 (17.78) | NRb | ||
SF-36 - Social Functioning component | NR | NR | n = 73 / 74 Mean (SD) 4.3 (30.56) | n = 75 / 76 Mean (SD) 4.5 (27.54) | NRb | ||
SF-36 - Role Emotional component | NR | NR | n = 72 / 74 Mean (SD) 0.7 (32.61) | n = 75 / 76 Mean (SD) 7.5 (34.62) | NRb | ||
SF-36 - Health Transition component | NR | NR | n = 73 / 74 Mean (SD): −0.5 (1.13) | n = 75 / 76 Mean (SD): −0.07 (1.12) | NRb | ||
Lung et al. (2022)c | 12 weeks | SF-12 PCS | n = NR Mean (SD) 38.3 (8.7) | n = NR Mean (SD) 33.3 (12.1) | Mean (SD) 8.8 (4.3) | Mean (SD) 2.5 (18.2) | 0.4d 0.1e |
SF-12 MCS | n = NR Mean (SD) 53.5 (11.4) | n = NR Mean (SD) 57.7 (3.8) | Mean (SD) −0.6 (7.8) | Mean (SD) 3.5 (6.8) | 0.9d 0.2e | ||
12 months | SF-12 PCS | n = NR Mean (SD) 45 (11.5) | n = NR Mean (SD) 43.2 (6.6) | n = NR Mean (SD) 12.9 (11.4) | n = NR Mean (SD) 4 (7.8) | 0.4d 0.2e | |
SF-12 MCS | n = NR Mean (SD) 60.4 (5.1) | n = NR Mean (SD) 50.4 (6.7) | n = NR Mean (SD) 3.6 (9.7) | n = NR Mean (SD) −3.8 (6.2); as reported | 0.01d 0.2e | ||
Dasa et al. (2016)f,g Cohort study included in 3 SRs21-23 SF-12 | 2 weeks | SF-12 PCS | n = 36 / 50 Mean (SD)h 29.1 (7.2) | n = 22 / 50 Mean (SD)h 32.2 (8.6) | NR | NR | > 0.05e,i |
SF-12 MCS | n = 36 / 50 Mean (SD)h 47.1 (12.0) | n = 22 / 50 Mean (SD)h 45.5 (11.3) | NR | NR | > 0.05e,i | ||
6 weeks | SF-12 PCS | n = 29 / 50 Mean (SD)h 34.2 (9.7) | n = 23 / 50 Mean (SD)h 34.8 (8.0) | NR | NR | > 0.05e,i | |
SF-12 MCS | n = 29 / 50 Mean (SD)h 52.0 (11.8) | n = 23 / 50 Mean (SD)h 42.0 (10.6) | NR | NR | > 0.05e,i | ||
12 weeks | SF-12 PCS | n = 28 / 50 Mean (SD)h 40.2 (11.4) | n = 15 / 50 Mean (SD)h 38.6 (8.7) | NR | NR | > 0.05e,i | |
SF-12 MCS | n = 28 / 50 Mean (SD)h 53.7 (11.2) | n = 16 / 50 Mean (SD)h 47.1 (11.1) | NR | NR | > 0.05e,i | ||
BMI = body mass index; MCS = Mental Component Summary; NR = not reported; PCS = physical component summary; RCT = randomized controlled trial; SD = standard deviation; SE = standard error; SF-12 = Short Form (12-item) Health Survey; SF-36 = Short Form (36-item) Health Survey; SR = systematic review; TKA = total knee arthroplasty.
Please note that this appendix has not been copy-edited
aFrom Pacira Pharmaceuticals, Inc. (2024)61: “The 36-question survey captures the [participant’s] perception of their general health by sorting them into multi-item scales that assess eight health concepts rather than a single total score. The survey used ten components to assess the health concepts: Physical, Mental, Physical Functioning, Role- Physical, Bodily Pain, General Health, Vitality, Social Functioning, Role Emotional, and Health Transition. [Participant] responses to the SF-36 survey were recorded. Scores can range from 0 to 100. Higher scores indicate better health status, and a mean score of 50 has been articulated as a normative value for all scales.” One included SR23 states that the minimum clinically important difference for SF-12 MCS, based on anchoring methods using data from TKA populations, is an absolute change of 1.8.
bNo statistical analysis reported.23
cBaseline SF-12 scores for Lung et al. were as follows, mean (SD) - SF −12 – PCS: cryoneurolysis: 33.1 (9.3); control: 32.4 (9); P = 0.8. SF −12 – MSC: cryoneurolysis: 54.5 (7.9); control: 41.2 (10.7), P = 0.4.
dP value for comparison of scores between groups at this time point.
eP value for comparison between groups of changes from baseline of SF-12 scores at this time point.
fExtracted from primary study report.22,23 Refer to Appendix 6 for citation.
gBaseline SF-12 scores for Dasa et al. were as follows, mean (SD) - SF −12 – PCS: cryoneurolysis: 28.77 (6.41), n = 41 / 50; control: 30.76 (7.12), n = 30 / 50; P = 0.22. SF −12 – MSC: cryoneurolysis: 50.00 (10.43), n = 41 / 50; control: 42.77 (12.28), n = 30 / 50, P = 0.01.
hAssumed SD, measure (SE, SD) not reported.
iMean change from baseline compared using a repeated measures analysis adjusted for age, gender, and BMI.
Table 11: Summary of Findings by Outcome — Physical Function, Patient-Reported (Other)
Citation and study design | Time point | Subdomain | Outcome result | Difference from baseline | P value for between-group comparison | ||
|---|---|---|---|---|---|---|---|
With cryoneurolysis | Without cryoneurolysis | With cryoneurolysis | Without cryoneurolysis | ||||
Oxford Knee Score | |||||||
Dasa et al. (2016)a,b | 2 weeks | NA | n = 40 / 50 Mean (SD)c 20.6 (8.7) | n = 34 / 50 Mean (SD)c 18.7 (10.3) | NR | NR | > 0.05d |
6 weeks | n = 41 / 50 Mean (SD)c 30.3 (9.3) | n = 39 / 50 Mean (SD)c 27.7 (10.2) | NR | NR | |||
12 weeks | n = 36 / 50 Mean (SD)c 34.4 (10.1) | n = 30 / 50 Mean (SD)c 30.9 (11.1) | NR | NR | |||
Boston University Activity Measure for Post-Acute Care (AM-PAC) | |||||||
Lung et al. (2022) | Inpatiente | NA | Mean (SD) 17.3 (3.2) | Mean (SD) 17.5 (2) | NA | NA | 0.8 |
PROMISf | |||||||
Pacira Pharmaceuticals, Inc. (Sponsor) (2024) | 6 weeks | PROMIS – Anxiety | NR | NR | n = 73 / 74 1.0 (3.17) | n = 75 / 76 −1.2 (2.94) | NRg |
PROMIS – Depression | NR | NR | n = 73 / 74 −0.3 (2.47) | n = 75 / 76 0.1 (2.85) | NRg | ||
PROMIS – Fatigue | NR | NR | n = 73 / 74 9.6 (3.74) | n = 75 / 76 8.7 (3.79) | NRg | ||
PROMIS – Pain Interference | NR | NR | n = 72 / 74 −2.5 (4.55) | n = 75 / 76 −2.8 (4.56) | NRg | ||
PROMIS – Physical Function | NR | NR | n = 72 / 74 −2.3 (4.36) | n = 75 / 76 −2.6 (4.50) | NRg | ||
PROMIS – Pain Intensity | NR | NR | n = 73 / 74 −2.6 (2.8) | n = 75 / 76 −3.3 (2.8) | NRg | ||
PROMIS – Sleep Disturbance | NR | NR | n = 73 / 74 0.1 (1.83) | n = 74 / 76 0.22 (1.98) | NRg | ||
PROMIS – Social Satisfaction | NR | NR | n = 73 / 74 −0.3 (4.48) | n = 74 / 76 −0.6 (3.83) | NRg | ||
Dasa et al. 2016b,c | 2 weeks | PROMIS – Anxiety | n = 38 / 50 Mean (SD)c 55.2 (12.2) | n = 15 / 50 Mean (SD)c 58.7 (10.5) | NR | NR | > 0.05d |
PROMIS – Depression | n = 38 / 50 Mean (SD)c 50.2 (10.8) | n = 16 / 50 Mean (SD)c 50.6 (11.2) | NR | NR | > 0.05d | ||
PROMIS –Fatigue | n = 38 / 50 Mean (SD)c 55.7 (11.1) | n = 16 / 50 Mean (SD)c 56.8 (9.4) | NR | NR | > 0.05d | ||
PROMIS – Pain Interference | n = 40 / 50 Mean (SD)c 64.1 (7.9) | n = 15 / 50 Mean (SD)c 65.2 (7.2) | NR | NR | > 0.05d | ||
PROMIS – Physical Function | n = 37 / 50 Mean (SD)c 30.3 (7.9) | n = 16 / 50 Mean (SD)c 30.1 (6.4) | NR | NR | > 0.05d | ||
PROMIS – Pain Intensity | n = 41 / 50 Mean (SD)c 5.7 (2.3) | n = 16 / 50 Mean (SD)c 6.4 (2.8) | NR | NR | > 0.05d | ||
PROMIS – Sleep Disturbance | n = 40 / 50 Mean (SD)c 54.0 (7.7) | n = 15 / 50 Mean (SD)c 55.3 (8.5) | NR | NR | > 0.05d | ||
PROMIS – Social Satisfaction | n = 39 / 50 Mean (SD)c 38.7 (8.9) | n = 15 / 50 Mean (SD)c 38.9 (6.8) | NR | NR | > 0.05d | ||
6 weeks | PROMIS – Anxiety | n = 41 / 50 Mean (SD)c 49.4 (10.2) | n = 15 / 50 Mean (SD)c 50.8 (16.2) | NR | NR | > 0.05d | |
PROMIS – Depression | n = 42 / 50 Mean (SD)c 47.2 (9.3) | n = 15 / 50 Mean (SD)c 49.2 (9.0) | NR | NR | > 0.05d | ||
PROMIS –Fatigue | n = 40 / 50 Mean (SD)c 52.3 (10.8) | n = 15 / 50 Mean (SD)c 51.9 (10.5) | NR | NR | > 0.05d | ||
PROMIS – Pain Interference | n = 40 / 50 Mean (SD)c 57.9 (8.6) | n = 15 / 50 Mean (SD)c 61.6 (7.6) | NR | NR | > 0.05d | ||
PROMIS – Physical Function | n = 39 / 50 Mean (SD)c 37.2 (7.5) | n = 15 / 50 Mean (SD)c 36.2 (6.4) | NR | NR | > 0.05d | ||
PROMIS – Pain Intensity | n = 40 / 50 Mean (SD)c 3.7 (2.3) | n = 15 / 50 Mean (SD)c 4.8 (2.5) | NR | NR | > 0.05d | ||
PROMIS – Sleep Disturbance | n = 41 / 50 Mean (SD)c 53.8 (9.1) | n = 16 / 50 Mean (SD)c 55.3 (8.7) | NR | NR | > 0.05d | ||
PROMIS – Social Satisfaction | n = 39 / 50 Mean (SD)c 45.5 (11.6) | n = 14 / 50 Mean (SD)c 45.9 (11.6) | NR | NR | > 0.05d | ||
12 weeks | PROMIS – Anxiety | n = 36 / 50 Mean (SD)c 47.9 (9.9) | n = 16 / 50 Mean (SD)c 53.0 (10.2) | NR | NR | > 0.05d | |
PROMIS – Depression | n = 36 / 50 Mean (SD)c 44.7 (7.1) | n = 16 / 50 Mean (SD)c 49.7 (8.8) | NR | NR | > 0.05d | ||
PROMIS – Fatigue | n = 36 / 50 Mean (SD)c 47.4 (10.5) | n = 16 / 50 Mean (SD)c 48.5 (9.1) | NR | NR | > 0.05d | ||
PROMIS – Pain Interference | n = 34 / 50 Mean (SD)c 54.1 (8.7) | n = 16 / 50 Mean (SD)c 57.5 (6.3) | NR | NR | > 0.05d | ||
PROMIS – Physical Function | n = 34 / 50 Mean (SD)c 42.5 (7.7) | n = 16 / 50 Mean (SD)c 39.3 (7.0) | NR | NR | > 0.05d | ||
PROMIS – Pain Intensity | n = 36 / 50 Mean (SD)c 2.7 (2.2) | n = 16 / 50 Mean (SD)c 3.8 (2.7) | NR | NR | > 0.05d | ||
PROMIS – Sleep Disturbance | n = 33 / 50 Mean (SD)c 46.9 (8.8) | n = 16 / 50 Mean (SD)c 52.4 (9.4) | NR | NR | > 0.05d | ||
PROMIS – Social Satisfaction | n = 34 / 50 Mean (SD)c 50.6 (9.4) | n = 16 / 50 Mean (SD)c 48.0 (9.5) | NR | NR | > 0.05d | ||
BMI = body mass index; NA = not applicable; NR = not reported; PROMIS = Patient-Reported Outcomes Measurement Information System; RCT = randomized controlled trial; SD = standard deviation; SE =standard error.
Please note that this appendix has not been copy-edited
aExtracted from primary study report. Refer to Appendix 6 for citation.
bBaseline Oxford Knee Scores for Dasa et al. were as follows, mean (SD) cryoneurolysis: 18.78 (8.45), n = 46 / 50; control: 18.72 (10.30), n = 46 / 50; P = 0.97. Baseline PROMIS domain scores reported in publication; no significant differences between groups, substantial missing data (for cryoneurolysis group in particular). Mean change from baseline PROMIS scores “were compared using a repeated measures analysis that allowed for modeling dependencies between observations within subjects with age, gender, and BMI as covariates, the Kenward-Roger adjusted F-test for statistical significance, and the TukeyKramer adjustment for multiple comparisions.
cAssumed SD; measure (SE, SD) not reported.
dSignificant differences were denoted by an asterisk in the supplementary table and were for comparisons of change from baseline between treatment and control groups.
eAssumed, based on reporting.
fPROMIS scores have a mean of 50 and standard deviation (SD) of 10 in a referent population. The referent population is usually the US General Population. Lower scores are less favourable, and higher scores are more favourable.
gNo statistical analysis reported.
Table 12: Summary of Findings by Outcome — Physical Function, Clinician-Assessed Outcomes (e.g., ROM, TUG)
Citation and study design | Outcome | Time point | Outcome result | Difference from baseline | Between-group comparison (as reported) | P value for between-group comparison | ||
|---|---|---|---|---|---|---|---|---|
With cryoneurolysis | Without cryoneurolysis | With cryoneurolysis | Without cryoneurolysis | |||||
Range of motion | ||||||||
Pacira Pharmaceuticals, Inc. (Sponsor) (2024) | Physical function of the replaced knee during active flexion, degrees | 2 weeks | NR | NR | n = 73 / 74 Mean (SD) −10.1 (19.51) | n = 72 / 76 Mean (SD) −11.8 (15.56) | NR | NRa |
Lung et al. (2022) | ROM – not specified | 2 weeks | Mean (SD) 88 (18) | Mean (SD) 91 (14) | NR | NR | NR | 0.71 |
4 weeks | Mean (SD) 106 (9) | Mean (SD) 109 (13) | NR | NR | NR | 0.31 | ||
6 weeks | Mean (SD) 112 (10) | Mean (SD) 116 (11) | Mean (SD) 12 (9) Median (range) 10 (−10 to 35) | Mean (SD) 3 (12) Median (range) 5 (−25 to 25) | NR | 0.4b 0.0420c | ||
Milhalko et al. (2021) | ROM, degrees | 6 weeks | Mean (SD) 111.6° (9.4°) | Mean (SD) 107.9° (10.0°) | Mean (SD) −1.6° (16.6°) | Mean (SD) −4.2° (11.6°) | MD (95% CI) 2.6° (−3.2° to 8.5°) | 0.3750 |
12 weeks | Mean (SD) 114.3° (7.6°) | Mean (SD) 112.1° (9.1°) | Mean (SD) 1.3° (15.4°) | Mean (SD) −0.3° (12.8°) | MD (95% CI) 1.6° (−4.3° to 7.4°) | 0.5892 | ||
Urban et al. (2021) | Flexion degree, adjusted, mean (95% CI) | At discharged | 104 (102 to 106) | 91.5 (90 to 95) | NR | NR | Ratio estimate (95% CI) 1.14 (1.11 to 1.16) | < 0.0001 |
Range of motion – knee flexion ≥ 90°, n (%)e | 165 (98%) | 78 (80%) | NR | NR | Ratio estimate (95% CI) 11.72 (3.56 to 38.55) | < 0.0001 | ||
Extension degree, adjusted mean (95% CI) | 3.83 (3.37 to 4.35) | 4.57 (4.04 to 5.18) | NR | NR | Ratio estimate (95% CI) 0.84 (0.74 to 0.94) | 0.0037 | ||
Range of motion – knee extension ≤ 5°, n (%)e | 164 (97%) | 77 (79%) | NR | NR | Ratio estimate (95% CI) 10.83 (3.68 to 31.92) | < 0.0001 | ||
Flexion degree, adjusted mean (95% CI) | 2 weeksd | 107 (103 to 110) | 103 (100 to 107) | NR | NR | Ratio estimate (95% CI) 1.03 (1.00 to 1.07) | 0.0501 | |
Knee flexion ≥ 90°, n (%)e | 149 (88%) | 84 (87%) | NR | NR | Ratio estimate (95% CI) 0.95 (0.42 to 2.16) | 0.9117 | ||
Extension degree, adjusted mean (95% CI) | 4.44 (3.68 to 5.36) | 4.61 (3.92 to 5.44) | NR | NR | Ratio estimate (95% CI) 0.96 (0.80 to 1.16) | 0.6855 | ||
Knee extension ≤ 5°, n (%)e | 164 (97%) | 91 (94%) | NR | NR | Ratio estimate (95% CI) 1.73 (0.44 to 6.86) | 0.4332 | ||
Flexion degree, adjusted mean (95% CI) | 6 weeksd | 124 (121 to 126) | 123 (121 to 126) | NR | NR | Ratio estimate (95% CI) 1.00 (0.98 to 1.02) | 0.6787 | |
Knee flexion ≥ 90°, n (%)e | 161 (95%) | 93 (96%) | NR | NR | Ratio estimate (95% CI) 1.28 (0.34 to 4.88) | 0.7144 | ||
Knee flexion ≥ 115°, n (%)e | 145 (86%) | 87 (90%) | NR | NR | Ratio estimate (95% CI) 0.61 (0.26 to 1.47) | 0.2712 | ||
Extension degree, adjusted mean (95% CI) | 2.11 (1.61 to 2.77) | 4.14 (3.21 to 5.34) | NR | NR | Ratio estimate (95% CI) 0.51 (0.38 to 0.68) | < 0.0001 | ||
Knee extension ≤ 5°, n (%)e | 160 (100%) | 87 (93%) | NR | NR | NA | < 0.0001 | ||
Knee extension ≤ 2.5°, n (%)e | 141 (88%) | 67 (71%) | NR | NR | Ratio estimate (95% CI) 2.61 (1.27 to 5.40) | 0.0094 | ||
Timed Up and Go (TUG) test | ||||||||
Mihalko et al. (2021) | TUG test | 3 days, 2 weeks, 6 weeks, 12 weeks | NR | NR | NR | NR | NR | “no significant between- group differences for change from baseline in AUC/time for the TUG test at any follow-up assessment” |
40-metre walk test | ||||||||
Pacira Pharmaceuticals, Inc. (Sponsor) (2024) | 40 m walk testf,g | 2 weeks | NR | NR | n = 69 / 74 0.8 (0.34) | n = 71 / 76 0.8 (0.31) | NR | NRa |
4 weeks | NR | NR | n = 66 / 74 0.9 (0.31) | n = 70 / 76 0.9 (0.34) | NR | NRa | ||
6 weeks | NR | NR | n = 73 / 74 1.0 (0.34) | n = 73 / 76 1.0 (0.38) | NR | NRa | ||
12 weeks | NR | NR | n = 73 / 74 1.1 (0.35) | n = 72 / 76 1.1 (0.36) | NR | NRa | ||
30-second chair stand test | ||||||||
Pacira Pharmaceuticals, Inc. (Sponsor) (2024)61 | 30-second sit-chair stand test scoreh,i | 2 weeks | NR | NR | n = 69 / 74 6.9 (3.26) | n = 71 / 76 7.5 (3.07) | NR | NRa |
4 weeks | NR | NR | n = 66 / 74 9.6 (3.81) | n = 70 / 76 9.5 (3.81) | NR | NRa | ||
6 weeks | NR | NR | n = 73 / 74 12.4 (13.75) | n = 73 / 76 11.1 (3.93) | NR | NRa | ||
12 weeks | NR | NR | n = 73 / 74 12.1 (4.31) | n = 72 / 76 13.0 (4.11) | NR | NRa | ||
Ambulation distance | ||||||||
Lung et al. (2022) | Ambulation distance, (ft)j | At discharge | Mean (SD) 154 (119) Median (range): 135 (50 to 600) | Mean (SD) 193 (121) Median (range): 180 (45 to 500) | NR | NR | NR | 0.0640 |
AUC = area under the curve; CI = confidence interval; ft = feet; NA = not applicable; NR = not reported; RCT = randomized controlled trial; ROM = range of motion; SD = standard deviation; SR = systematic review; TUG =Timed Up and Go.
Please note that this appendix has not been copy-edited
aNo statistical analysis reported.
bP value for comparison of group outcomes at this time point.
cP value for comparison of changes from baseline between groups at this time point.
dData available for 168 of 169 in the cryoneurolysis group and 95 of 98 in the control group at discharge; 158 of 169 and 91 of 98 at 2 weeks; and 160 of 169 and 94 of 98 at 6 weeks.
eExtracted as reported in publication. Percentages in the report were sometimes calculated using total number of subjects in each group as the denominator and other times the total number of participants with data at that time point.
fThe 40-metre walk test measured the average speed in metres per second a participant could walk 40 m.
gBaseline 40-metre walk test scores for Pacira Pharmaceuticals, Inc. (2024)61 were as follows, mean (SD) cryoneurolysis: 1 (0.41), n = 74 / 74; sham: 1 (0.42), n = 76 / 76.
hThe 30-second chair test evaluates physical function during recovery by measuring the number of times a participant could go from seated in a chair to standing over the course of 30 seconds.
iBaseline 30-second chair test scores for Pacira Pharmaceuticals, Inc. (2024)61 were as follows, mean (SD) cryoneurolysis: 8.2 (3.38), n = 74 / 74; sham: 8.6 (4.34), n = 76 / 76.
jMeasurement is assumed to be in feet (ft) as this is the measure stated in the text; however, the numbers reported in the summary statement in the text are not congruent with results in the table, so this is unclear.
Table 13: Summary of Findings by Outcome — Length of Hospital Stay
Citation and study design Study design | Outcome | Outcome result | Between-group comparison (as reported) | P value for between-group comparison | |
|---|---|---|---|---|---|
With cryoneurolysis | Without cryoneurolysis | ||||
Hajiaghajani et al. (2025)22 SR with MA of 5 studies (RCT and observational studies) | Outcome: Length of hospital stay (days) | NR | NR | Hedge’s g (95% CI) −0.63 (−1.05 to −0.20) I2 = 71.6% | 0.004a |
Ng et al. (2025)24 Cohort, companion to Mont (2025) which is reported in 1 included SR22 | Length of stay | Ng et al. (2025) n = 174 Mean 19 hours Mont et al. (2025) n = 80 17.2 hours Mean (SD)b 0.71 (1.09) days | Ng et al. (2025) n = 182 Mean: 16 hours Mont et al. (2025) n = 60 20.6 hours Mean (SD)b 0.86 (1.15) days | From MA in SRb MD (95% CI) −0.140 (−0.514 to 0.234) days | P value for MD from SR22 for Mont et al. (2025) = 0.463 |
Pacira Pharmaceuticals, Inc. (Sponsor) (2024) | Length of stay | n = 71 / 74 Mean (SD) hours: 54.7 (27.34) | n = 73 / 76 Mean (SD) hours: 52.6 (24.42) | NR | NRc |
Lung et al. (2022) | Length of stay | Mean (SD) 2.5 (0.8) days | Mean (SD) 3.5 (2.9) days | From MA in SRb MD (95% CI) −1.00 (−2.096, 0.096) days | P value for comparison between groups = 0.12 P value for MD as reported in SR22 = 0.074 |
Swisher et al. (2022) | Length of stay | Mean (SD) 1.38 (0.48) daysb Day 1 discharge: 5 (63%) Day 2 discharge: 3 (38%) | Mean (SD) 1.63 (0.48 days)b Day 1 discharge: 3 (38%) Day 2 discharge: 5 (63%) | From MA in SRb MD (95%) −0.250 (−7.20 to 0.220) days | P value for MD from SR22 = 0.298 |
Mihalko et al. (2021) | Length of stay (NR) | NR | NR | NR | Table in SR22 states no significant difference |
Urban et al. (2021) | Overall length of stay (days), adjusted mean (95% CI) | 1.42 (1.16 to 1.74) | 2.52 (2.12 to 2.99) | From MA in SR MD (95% CI) −1.100 (- 1.601 to −0.599) Ratio estimate from text: 0.56 (0.47 to 0.68) | From Urban et al. (2021): < 0.0001 |
Length of stay ≥ 2 days, n (%) | 29 / 169 (27%) | 97 / 98 (99%) | Ratio estimate 0.001 (0.0001 to 0.08) | < 0.0001 | |
Dasa et al. (2016) | Length of stay (days) | Mean (SD) 0.8 (1.14) Range: 0 to 5 | Mean (SD) 1.7 (1.01) Range: 0 to 7 | From MA in SR MD (95% CI) −0.900 (−1.322, −0.478) | For MD in SR22 = 0.000b |
Proportion (%) of participants with 0 days’ stay in hospital | 44.9% | 14.3% | NR | < 0.0001d | |
Proportion (%) of participants with 1 day’s stay in hospital | 49.0% | 18.4% | NR | < 0.0001d | |
Proportion (%) of participants with ≥ 2 days’ stay in hospital | n = 3 / 49 6.1% | n = 33 / 49 67.3% | NR | < 0.0001d | |
CI = confidence interval; GRADE = Grading of Recommendations Assessment, Development and Evaluation; MA = meta-analysis; MD = mean difference; NR = not reported; RCT = randomized controlled trial; SD = standard deviation; SE = standard error; SR = systematic review.
Please note that this appendix has not been copy-edited
aHajiaghajani et al.22 rated this as high-certainty evidence (using GRADE).62
bAs reported in Hajiaghajani et al.22
cNo statistical analysis reported.
dStated in Diep et al.23
Table 14: Summary of Findings by Outcome — Sleep Disturbancesa
Citation and study design | Outcome definition | Time point | Outcome result | Difference from baseline | Between-group comparison and P value, as reported | ||
|---|---|---|---|---|---|---|---|
With cryoneurolysis | Without cryoneurolysis | With cryoneurolysis | Without cryoneurolysis | ||||
Ng et al. (2025)24 / Mont et al. (2025) Cohort, Mont et al. (2025) is a companions report which is reported in 1 included SR22 | Patient-Reported Outcomes Measurement Information System (PROMIS) Sleep Disturbance Short Form 8b | Week 1 | Shown only in figure, not extracted | Shown only in figure, not extracted | LSM (95% CI)b, c 3.74 (−1.66 to 9.13) | LSM (95% CI)b, c 1.44 (−3.45 to 6.34) | NR |
Week 2 | LSM (95% CI)b, c 2.10 (−3.28 to 7.49) | LSM (95% CI)b, c 2.89 (−1.98 to 7.75) | NR | ||||
Week 3 | LSM (95% CI)b, c 3.75 (−1.65 to 9.15) | LSM (95% CI)b, c 1.60 (−3.30 to 6.49) | NR | ||||
Week 4 | LSM (95% CI)b, c 4.88 (−0.51 to 10.27) | LSM (95% CI)b, c 1.89 (−3.01 to 6.78) | NR | ||||
Weeks 5 | NR | NR | LSM (95% CI)b, c 5.62 (0.23 to 11.00) | LSM (95% CI)b, c 1.95 (−2.92 to 6.82) | NR | ||
Week 6 | NR | NR | LSM (95% CI)b, c 6.89 (1.47 to 12.30) | LSM (95% CI)b, c 3.41 (- 1.46 to 8.28) | NR | ||
Month 2 | LSM (SE) 50.25 (2.35) | NR | LSM (95% CI)b, c 7.10 (1.72 to 12.49) | LSM (95% CI)b, c 4.27 (- 0.58 to 9.12) | Mont (2025): At 2 months postop, those in the cryoneurolysis cohort demonstrated similar sleep quality to the general population: | ||
Month 3 | Overall average: 52.3 | LSM (SE) 49.05 (2.15) Overall average: 53.3 | LSM (95% CI)b, c 8.38 (2.98 to 13.78) | LSM (95% CI)b, c 8.32 (3.45 to 13.19) | Ng et al. and Mont et al. (2025): At 3 months postop, those in the cryoneurolysis cohort demonstrated similar sleep quality to the general population. P < 0.001 (for overall average) | ||
4 months | NR | NR | LSM (95% CI)b, c 10.35 (4.93 to 15.78) | LSM (95% CI)b, c 6.93 (1.97 to 11.89) | NR | ||
5 months | NR | NR | LSM (95% CI)b, c 8.94 (3.48 to 14.39) | LSM (95% CI)b, c 7.52 (2.49 to 12.55) | NR | ||
6 months | LSM (SE): 50.74 (2.27) | LSM (SE): 52.92 (2.02) | LSM (95% CI)b, c 11.16 (5.67 to 16.65) | LSM (95% CI)b, c 8.42 (3.38 to 13.46) | P = 0.046b for comparison of 6-month outcomes | ||
6 months, overall | NR | NR | LSM (95% CI)b, c 6.63 (1.34 to 11.92) | LSM (95% CI)b, c 4.42 (−0.27 to 9.12) | P = 0.09 | ||
12 months, overall average | 52.3 | 53.3 | NR | NR | P < 0.001 | ||
Proportion (%) of patients achieving MCID for sleep disturbance outcomeb,d | Week 1 | n = 63 / 80 (79%) 53.4% | n = 44 / 60 (73%) 37.2% | NR | NR | NR | |
Week 2 | n = 66 / 80 (83%) 46.7% | n = 50 / 60 (83%) 38.1% | NR | NR | NR | ||
Week 3 | n = 61 / 80 (76%) 46.6% | n = 45 / 60 (75%) 47.4% | NR | NR | NR | ||
Week 4 | n = 63 / 80 (79%) 55.4% | n = 44 / 60 (73%) 41.8% | NR | NR | NR | ||
Weeks 5 | n = 67 / 80 (84%) 58.2% | n = 50 / 60 (83%) 35.5% | NR | NR | NR | ||
Week 6 | n = 57 / 80 (71%) 62.1% | n = 49 / 60 (82%) 41.4% | NR | NR | NR | ||
Month 2 | n = 66 / 80 (83%) 65.2% | n = 54 / 60 (90%) 38.0% | NR | NR | NR | ||
Month 3 | n = 60 / 80 (75%) 67.8% | n = 48 / 60 (80%) 68.8% | NR | NR | NR | ||
4 months | n = 53 / 80 (66%) 76.8% | n = 36 / 60 (60%) 61.2% | NR | NR | NR | ||
5 months | n = 45 / 80 (56%) 69.7% | n = 30 / 60 (50%) 61.2% | NR | NR | NR | ||
6 months | n = 41 / 80 (51%) 76.6% | n = 29 / 60 (48%) 70.1% | NR | NR | NR | ||
Overall, up to 6 months | 62.2% | 49.2% | NR | NR | OR (95%CI): 1.70 (1.28 to 2.26) P < 0.001 | ||
12 months | n = NR 54% | n = NR 47% | NR | NR | P = 0.003 | ||
Swisher et al. (2022) | Difficulty sleeping due to pain (binary outcome: yes or no - % Yes; n = 8 per arm) | Day 1 | 25% | 38% | NR | NR | NR |
Day 2 | 50% | 75% | NR | NR | NR | ||
Day 3 | 63% | 83% | NR | NR | NR | ||
Day 4 | 50% | 42% | NR | NR | NR | ||
Week 1 | 57% | 38% | NR | NR | NR | ||
Week 2 | 38% | 57% | NR | NR | NR | ||
Week 3 | 13% | 50% | NR | NR | NR | ||
Number of awakenings due to pain and nausea. Median (IQR) | Day 1 | 0 (0 to 1) | 0 (0 to 0) | NR | NR | NR | |
Day 2 | 0 (0 to 0) | 0 (0 to 2) | NR | NR | NR | ||
Day 3 | 1 (0 to 2) | 3 (0 to 4) | NR | NR | NR | ||
Day 4 | 1 (0 to 2) | 2 (0 to 3) | NR | NR | NR | ||
Week 1 | 0 (0 to 1) | 0 (0 to 0) | NR | NR | NR | ||
Week 2 | 0 (0 to 1) | 0 (0 to 3) | NR | NR | NR | ||
Week 3 | 0 (0 to 0) | 0 (0 to 2) | NR | NR | NR | ||
BMI = body mass index; CI = confidence interval; IQR = interquartile range; LSM = least squares mean; MCID = minimum clinically important difference; NR = not reported; PROMIS = Patient-Reported Outcomes Measurement Information System; RCT = randomized controlled trial; SD = standard deviation; SE = standard error; SR = systematic review; TKA = total knee arthroplasty.
Please note that this appendix has not been copy-edited
aHajiaghajani et al.22 note that this is an outcome of interest in the review registration record and part of the published eligibility criteria, but they do not report it.
bExtracted from Mont et al., which is included in Hajiaghajani et al.22
cFrom Mont et al.: “Least square mean (LSM) and 95% confidence interval (CI) for SD improvement, which is calculated by: (baseline [sleep disturbance] score [minus] follow-up [sleep disturbance] score). Positive values indicate [sleep disturbance] improvement from the baseline, negative values indicate the opposite. [Sleep disturbance] improvement was adjusted by baseline pain catastrophizing scale, Kelgren-Lawrence grade, age, sex, BMI, American Society of Anesthesiologists physical classification, and the respective baseline score.” Ng. et al.24 also adjusted for timing of TKA (yes or no at study enrolment).
dMCID (Kazis effect size) = group mean difference from baseline/group baseline [sleep disturbance]; Adjusted for age, sex, BMI, American Society of Anesthesiologists physical classification, Kelgren-Lawrence grade, and baseline pain catastrophizing scale.
Table 15: Summary of Findings by Outcome — Adverse Events, Complications
Citation and study design | Time point | Outcome | Outcome result | P value for between-group comparison and notes | |
|---|---|---|---|---|---|
With cryoneurolysis | Without cryoneurolysis | ||||
Hajiaghajani et al. (2025)22 SR | NR | Overall AE event rate | 1.3% | 1.7% | NR |
Pacira Pharmaceuticals, Inc. (Sponsor) (2024)61a RCT included in 1 SR21 | Up to 6 weeks | All-cause mortality | 0 / 74 (0.00%) | 0 / 76 (0.00%) | NA |
SAE - Total | 5 / 74 (6.76%) | 5 / 76 (6.58%) | NA | ||
SAE - Cardiac disorders | 1 / 74 (1.35%) | 0 / 76 (0.00%) | Atrial fibrillation | ||
SAE - Gastrointestinal disorders | 0 / 74 (0.00%) | 1 /76 (1.32%) | Left inguinal hernia | ||
SAE - General disorders | 0 / 74 (0.00%) | 1 / 76 (1.32%) | Chest pain, left arm numbness | ||
SAE - Infections and infestations | 2 / 74 (2.70%) | 2 / 76 (2.64%) | Cryoneurolysis: Incision site cellulitis, infection left knee post TKA Control: Staphylococcal infection left hand, subcutaneous abscess left buttocks | ||
SAE - Investigations | 1 / 74 (1.35%) | 0 / 76 (0.00%) | Elevated white blood count | ||
SAE - Nervous system disorders | 1 / 74 (1.35%) | 0 / 76 (0.00%) | Syncope | ||
SAE - Renal and urinary disorders | 0 / 74 (0.00%) | 1 / 76 (1.32%) | Acute kidney injury CKD stage 3 | ||
SAE - Vascular disorders | 1 / 74 (1.35%) | 0 / 76 (0.00%) | Hypotension | ||
Mont et al. (2025) Cohort study included in 1 SR22 | Up to 6 months | SAEs (counts) | 0 | 0 | NA NR in Ng et al. (2025)24 |
Lung et al. (2022) | Up to 6 weeks | Surgical site infection | 0 / 29 (0%) | 1 / 28 (3.7%)b | 0.31 |
Pulmonary complication | 0 / 29 (0%) | 1 / 28 (3.8%)b | 1.00 | ||
Cardiac complication | 1 / 28 (3.8) | 1 / 28 (3.8%)b | 1.00 | ||
Neurologic complication | 0 | 0 | NA | ||
Swisher et al. (2022) | Up to 3 weeks | Observed treatment-related AEs | 0 | 0 | NA |
Mihalko et al. (2021) | Up to 3 months | Any treatment-emergent adverse events (TEAEs)d | 10 / 59 (16.9%) | 21 / 60 (35.0%) | “[M]ost were mild or moderate and related to surgery” |
Any serious TEAEd,e | 2 / 59 (3.4%) | 2 / 60 (3.3%) | NR | ||
Urban et al. (2021) | Up to 6 weeks | Serious AEs | 2 | 0 | Severe dysesthesia that did not resolve within 6 weeks’ follow-up |
Dasa et al. (2016) | Up to 3 months | AEsf | 0 | 0 | Text states similar incidence between AEs at 12 weeks |
AE = adverse event; CKD = chronic kidney disease; ITT = intention to treat; NA = not applicable; NR = not reported; RCT = randomized controlled trial; SAE = serious adverse event; SOC = standard of care; SR = systematic review; TEAE = treatment-emergent adverse event.
Please note that this appendix has not been copy-edited
aThis trial registry record also includes data collected for “Other” (Not Including Serious) Adverse Events. These have not been extracted for this report.
bPercentages as reported in Lung et al.
cOther TEAEs reported (nonserious, as per Hajiaghajani et al.22 in Mihalko et al. and not extracted for this report).
dSafety population. Cryoneurolysis 59 / 60 ITT; control: 60 / 60 ITT.
eThe Mihalko et al. study noted: “Serious TEAEs in the cryoneurolysis group included 1 patient who reported shortness of breath on exertion and was given a computed tomography scan to rule out pulmonary embolism, and 1 patient diagnosed with deep vein thrombosis in the right lower extremity who was treated with apixaban. Serious TEAEs in the SOC group included 1 patient who had a severe allergic reaction later attributed to allergy to sulfur contained in celecoxib, and 1 patient admitted to the hospital with general weakness, confusion, lethargy, hallucinations, and slurred speech. The patient was discontinued from tramadol because of its interference in controlling preexisting epilepsy and increased seizure activity and was also discontinued from oxycodone because of its sedating effects.”
fNo complications related to cryoneurolysis. No local infections, excess bleeding, or local soft tissue necrosis within the surgical lines. No complaints of persistent numbness or other neurologic effects at 3 months. Most common side effect was local bruising at site of treatment.
Appendix 6: Overlap Between Included Systematic Reviews
Please note that this appendix has not been copy-edited.
Table 16: Overlap in Relevant Primary Studies Between Included Systematic Reviews
Primary study citation | Goodwin et al. (2025)21 | Hajiaghajani et al. (2025)22 | Diep et al. (2023)23 |
|---|---|---|---|
Pacira Pharmaceuticals, Inc. NCT02284113. ClinicalTrials.gov: https://clinicaltrials.gov/study/NCT02284113 | Yes | — | — |
Mont MA et al. J Arthroplasty. 2024;40:92-101.e3. | — | Yes | — |
Jennewine BR et al. Arthroplasty Today. 2023;22:101164.a | Yes | — | — |
Lung BE et al. Life (Basel). 2022;12:1344. | — | Yes | Yes |
Swisher MW et al. Pain Ther. 2022;11(4):1299-1307. | — | Yes | Yes |
Mihalko WM et al. J Arthroplasty. 2021;36:1590-8.a | Yes | Yes | Yes |
Urban JA et al. Arthroplast Today. 2021;10:87-92. | Yes | Yes | Yes |
Dasa V et al. Knee. 2016;23(3):523-528. | Yes | Yes | Yes |
aCompanion papers. Mihalko et al. is the main study report and Jennewine et al. is a subgroup analysis.
ISSN: 2563-6596
Canada’s Drug Agency (CDA-AMC) is a pan-Canadian health organization. Created and funded by Canada’s federal, provincial, and territorial governments, we’re responsible for driving better coordination, alignment, and public value within Canada’s drug and health technology landscape. We provide Canada’s health system leaders with independent evidence and advice so they can make informed drug, health technology, and health system decisions, and we collaborate with national and international partners to enhance our collective impact.
Disclaimer: CDA-AMC has taken care to ensure that the information in this document was accurate, complete, and up to date when it was published, but does not make any guarantee to that effect. Your use of this information is subject to this disclaimer and the Terms of Use at cda-amc.ca.
The information in this document is made available for informational and educational purposes only and should not be used as a substitute for professional medical advice, the application of clinical judgment in respect of the care of a particular patient, or other professional judgments in any decision-making process. You assume full responsibility for the use of the information and rely on it at your own risk.
CDA-AMC does not endorse any information, drugs, therapies, treatments, products, processes, or services. The views and opinions of third parties published in this document do not necessarily reflect those of CDA-AMC. The copyright and other intellectual property rights in this document are owned by the Canadian Agency for Drugs and Technologies in Health (operating as CDA-AMC) and its licensors.
Questions or requests for information about this report can be directed to Requests@CDA-AMC.ca.