CADTH Health Technology Review
Real-Time Continuous Glucose Monitoring for People Living With Type 2 Diabetes
Rapid Review
Authors: Anusree Subramonian, Aleksandra Grobelna
Abbreviations
CGM
continuous glucose monitoring
DM
diabetes mellitus
T1D
type 1 diabetes mellitus
T2D
type 2 diabetes mellitus
MA
meta-analysis
RCT
randomized controlled trial
rtCGM
real-time continuous glucose monitoring
SMBG
self-monitoring of blood glucose
SR
systematic review
TIR
time in range
Key Messages
The evidence regarding clinical and cost-effectiveness of real-time continuous glucose monitoring (rtCGM) compared to self-monitoring of blood glucose (SMBG) in patients with type 2 diabetes mellitus is summarized in this report.
Results from 5 systematic reviews and 1 randomized controlled study suggest that in adult patients, rtCGM may be favoured over SMBG in improving glycated hemoglobin levels, and in lowering time with extreme low or high blood glucose levels. However, the evidence is uncertain due to limited quality evidence.
In adults, limited safety evidence suggests that rtCGM is safe with low rates of adverse events.
A cost-effectiveness analysis conducted in Spain found that rtCGM is not a cost-effective option compared to SMBG in adults with type 2 diabetes mellitus.
No evidence was identified regarding clinical or cost-effectiveness of rtCGM in pediatric patients with type 2 diabetes mellitus.
Context and Policy Issues
Diabetes mellitus (DM) is a serious public health concern affecting 1 in 10 Canadians.1 Globally, it has been estimated that approximately 9.3% of the population lives with diabetes.2 Type 2 DM (T2D), also known as non-insulin dependent DM, accounts for about 90% to 95% of all patients with diabetes.3 T2D is a metabolic disorder characterized by chronic hyperglycemia and impaired metabolism of carbohydrates, lipids, and proteins resulting from insulin insufficiency and action.4 It is associated with microvascular (e.g., diabetic retinopathy, nephropathy) and macrovascular (e.g., cardiovascular disease, strokes) complications that significantly influence the morbidity and mortality of patients. Thus, glycemic control in T2D patients is of high importance. Monitoring of glucose levels (glycemic monitoring) is recommended to ensure stable blood glucose levels, manage symptoms, and determine appropriate medications and insulin.
As the name indicates, self-monitoring blood of glucose (SMBG) refers to patients monitoring their own blood glucose levels using glucose test strips, requiring frequent finger pricks. Continuous glucose monitoring (CGM) involves a needle-like sensor inserted into the abdomen or upper arm, a transmitter, and a monitor to show results. CGM systems continuously measure glucose values from the interstitial fluid. Real-time CGM (rtCGM), also known as personal CGM, measures glucose values as frequently as every 5 minutes and displays measurements in real time.5 In addition, device wearers are alerted in case the values go above or below the calibrated target range. Examples of rtCGM devices include Dexcom, Medtronic, and MiniMed systems, and are available in several models.6,7
Although CGM, including rtCGM, is used mostly in patients with type 1 DM (T1D), its effectiveness in T2D has been researched.6 A recently published CADTH report did not identify any evidence regarding the comparative effectiveness of rtCGM and intermittently scanned CGM devices in people living with T2D.8 The objective of this report is to summarize the evidence regarding the clinical effectiveness and cost-effectiveness of glycemic monitoring with rtCGM compared to SMBG in adult and pediatric individuals with T2D.
Research Questions
What is the clinical effectiveness of monitoring glycemia with real-time continuous glucose monitoring for adults living with type 2 diabetes?
What is the clinical effectiveness of monitoring glycemia with real-time continuous glucose monitoring for pediatric patients living with type 2 diabetes?
What is the cost-effectiveness of monitoring glycemia with real-time continuous glucose monitoring for people living with type 2 diabetes?
Methods
Literature Search Methods
A limited literature search was conducted by an information specialist on key resources including MEDLINE, Embase, the Cochrane Database of Systematic Reviews, the International HTA Database, and the websites of Canadian and major international health technology agencies, as well as a focused internet search. The search strategy comprised both controlled vocabulary, such as the National Library of Medicine’s MeSH (Medical Subject Headings), and keywords. The main search concepts were real time continuous glucose monitoring (rtCGM) and type 2 diabetes (T2D). No filters were applied to limit the retrieval by study type. Comments, newspaper articles, editorials, letters, and conference abstracts were excluded.
Where possible, retrieval was limited to the human population. The search was completed on June 9, 2022, and limited to English-language documents published since January 1, 2017.
Selection Criteria and Methods
One reviewer screened citations and selected studies. In the first level of screening, titles and abstracts were reviewed and potentially relevant articles were retrieved and assessed for inclusion. The final selection of full-text articles was based on the inclusion criteria presented in Table 1.
Exclusion Criteria
Articles were excluded if they did not meet the selection criteria outlined in Table 1, they were duplicate publications, or they were published before 2017. Systematic reviews in which all relevant studies were captured in other more recent or more comprehensive systematic reviews were excluded. Primary studies retrieved by the search were excluded if they were captured in 1 or more of the included systematic reviews.
Critical Appraisal of Individual Studies
The included publications were critically appraised by 1 reviewer using the following tools as a guide: A MeaSurement Tool to Assess systematic Reviews 2 (AMSTAR 2)9 for systematic reviews, the Downs and Black checklist10 for randomized and non-randomized studies, and the Drummond checklist11 for economic evaluations. Summary scores were not calculated for the included studies; rather, the strengths and limitations of each included publication were described narratively.
Criteria | Description |
|---|---|
Population | Q1: Adults (ages ≥ 18) living with type 2 diabetes Q2: Pediatric patients (ages < 18) living with type 2 diabetes Q3: People living with type 2 diabetes |
Intervention | Real-time continuous glucose monitoring |
Comparator | Self-monitoring blood glucose meter |
Outcomes | Q1, Q2: Clinical effectiveness (e.g., hemoglobin A1C, quality of life, glucose time in range metrics [e.g., time spent in target glucose ranges], glucose variability, safety [e.g., hypoglycemia events, device-related adverse events, hospitalizations]) Q3: Cost-effectiveness (e.g., cost per QALY gained [ICER], cost per adverse event avoided) |
Study designs | Health technology assessments, systematic reviews, randomized controlled trials, non-randomized studies, economic evaluations |
ICER = incremental cost-effectiveness ratio; Q = question; QALY = quality-adjusted life-year.
Summary of Evidence
Quantity of Research Available
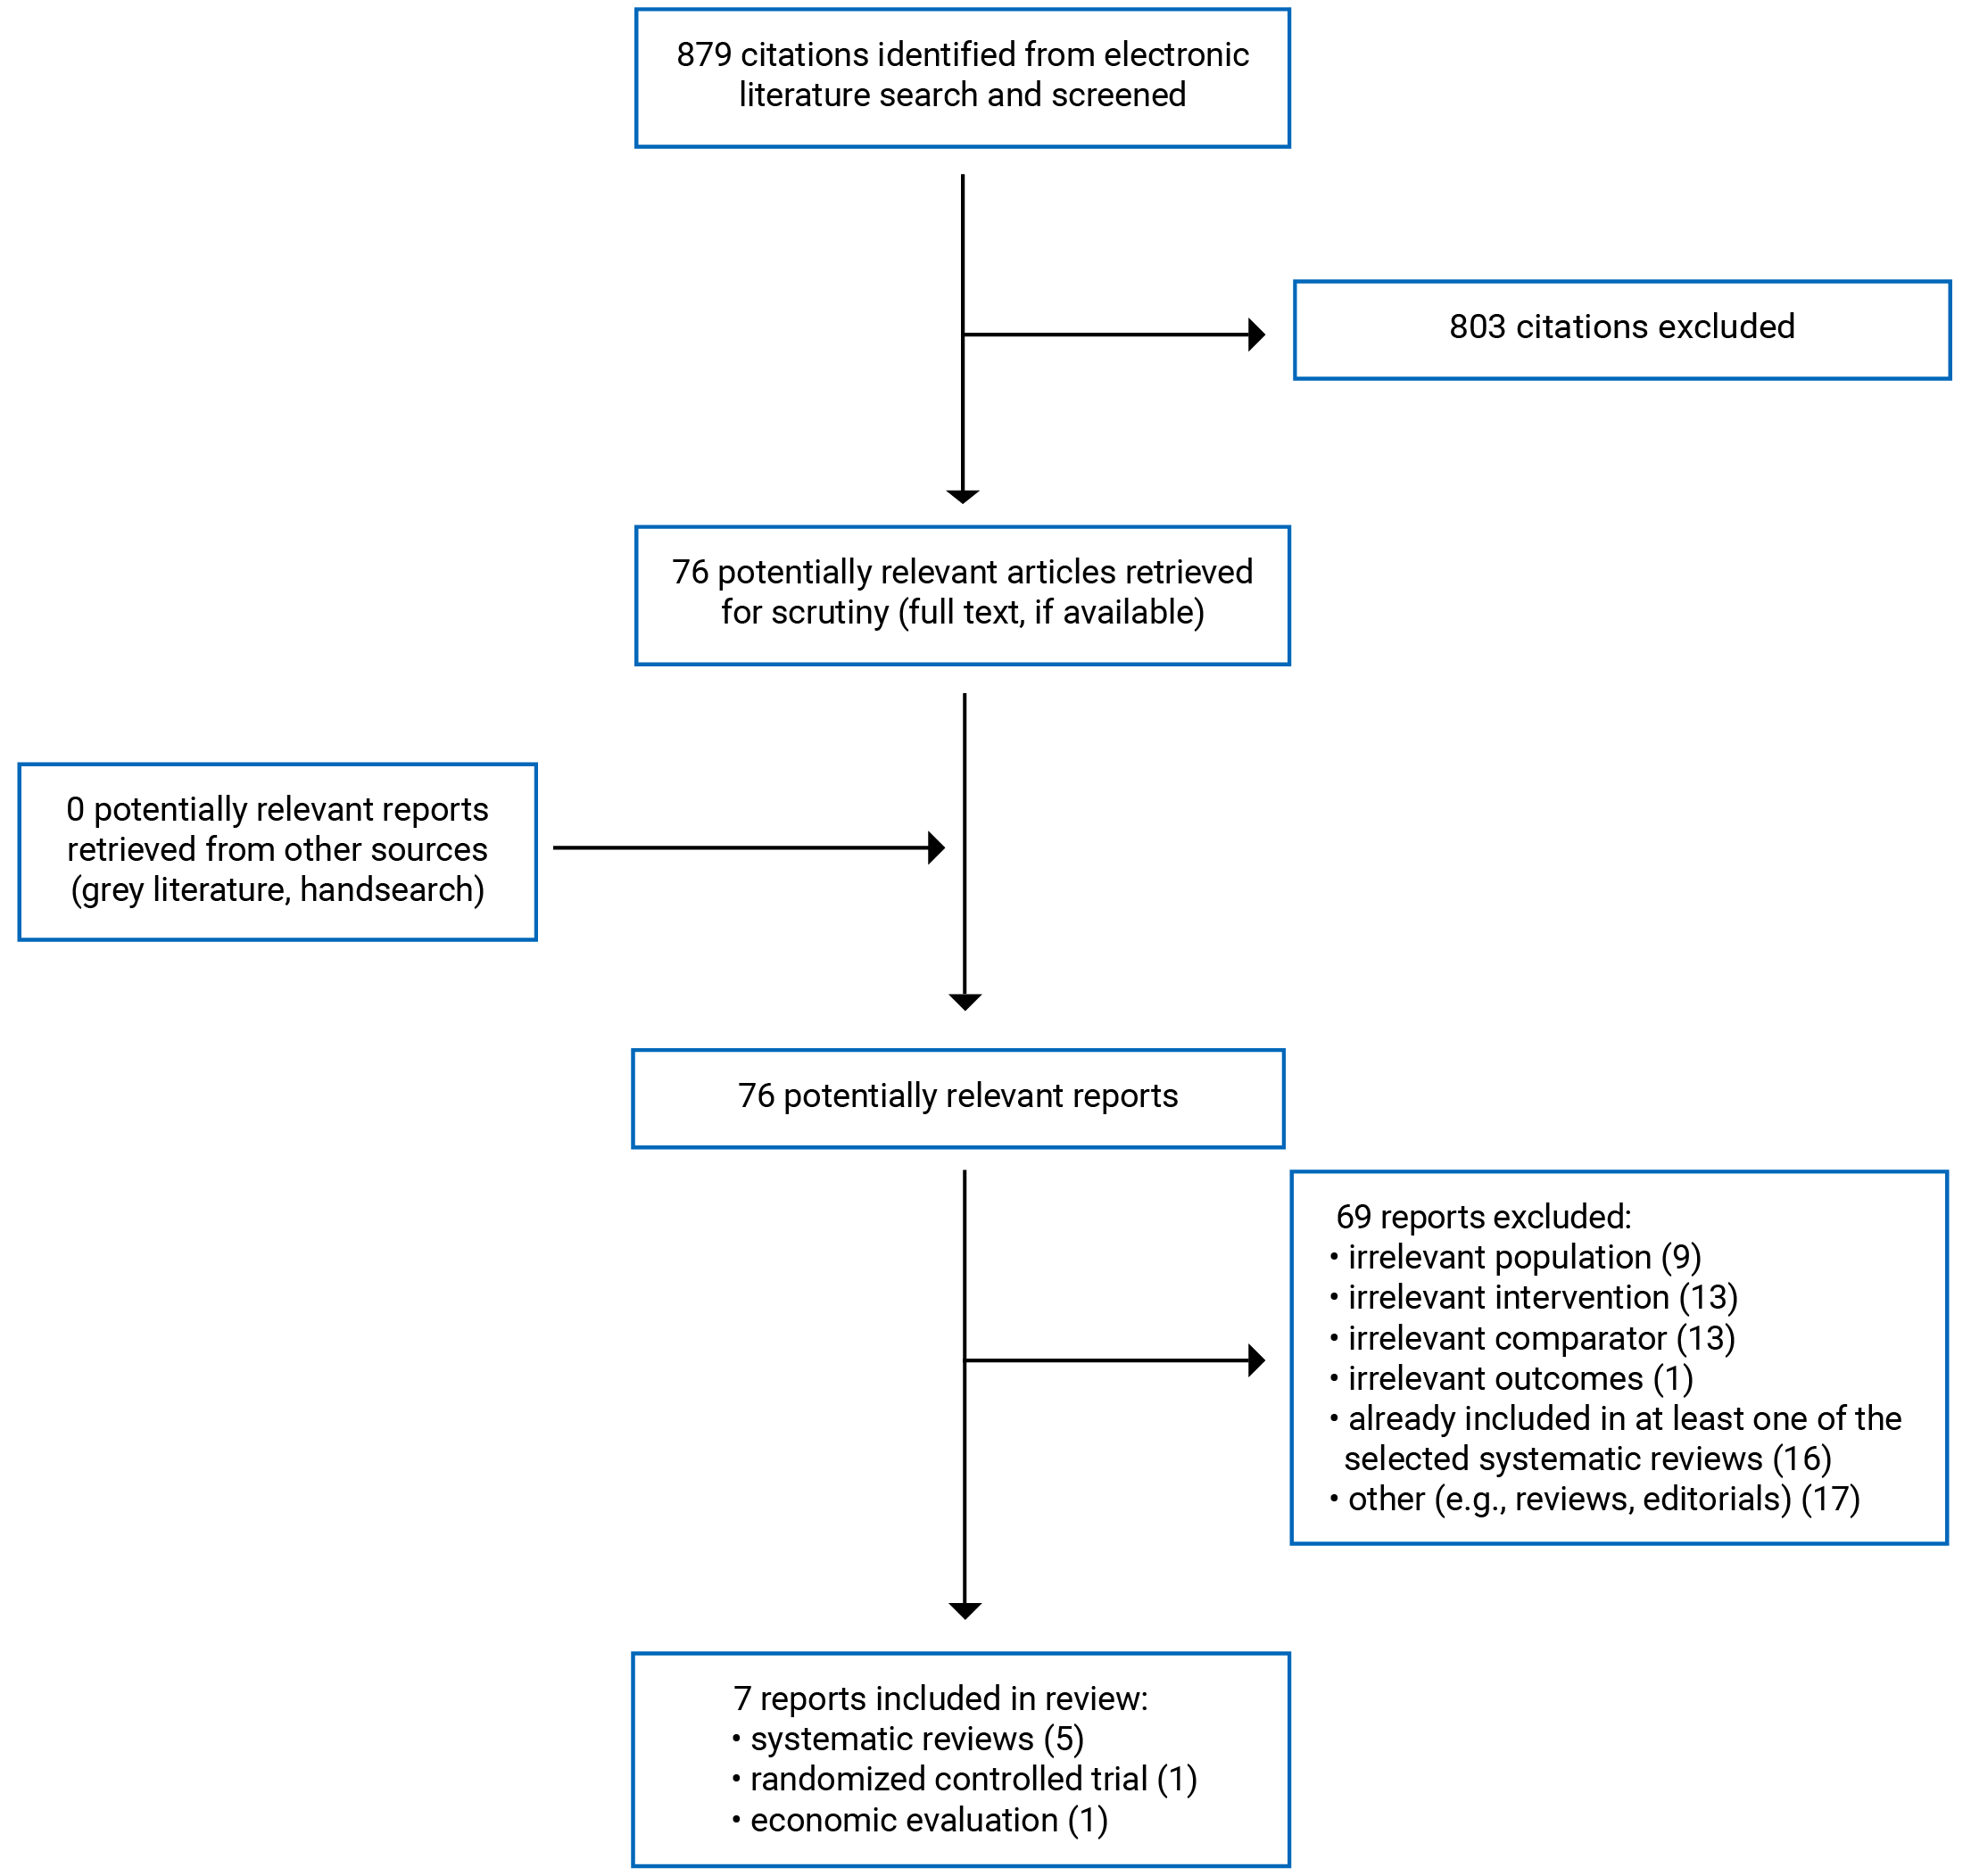
A total of 879 citations were identified in the literature search. Following screening of titles and abstracts, 803 citations were excluded and 76 potentially relevant reports from the electronic search were retrieved for full-text review. No potentially relevant publications were retrieved from the grey literature search for full-text review. Of these potentially relevant articles, 69 publications were excluded for various reasons, and 7 publications met the inclusion criteria and were included in this report. These comprised 5 systematic reviews (SRs),12-16 1 randomized controlled trial (RCT),17 and 1 economic evaluation.18 Appendix 1 presents the PRISMA19 flow chart of the study selection.
References of potential interest that did not meet the inclusion criteria but provided real-world evidence about the use of rtCGM for people living with T2D are provided in Appendix 6. Additional references of potential interest are provided in Appendix 7.
Summary of Study Characteristics
Five SRs,12-16 1 RCT,17 and 1 economic evaluation18 were included in this report. Three SRs12,13,16 were published in 2022, and 214,15 were published in 2019. The RCT17 was published in 2022, and the economic evaluation was published in 2018.18
All included SRs had broader inclusion criteria than the present review in terms of interventions of interest. All SRs12-16 included studies on rtCGM as well as intermittent CGM or flash glucose monitoring. One SR was part of a larger review evaluating multiple interventions for diabetes.14 The publication included in this report summarized 2 interventions in T2D, namely CGM and continuous subcutaneous insulin infusion. As for populations considered in the SRs, 3 of them had a broader scope than the present review.12,13,16 They all included studies on patients with T1D, T2D, and gestational diabetes.12,13,16
Additionally, 2 SRs had specific inclusion criteria regarding population.13,16 Specifically, Chang et al.13 limited the study population to perinatal women with diabetes (aged 18 years or older), and Kieu et al.16 limited the population to patients with diabetes managed by a primary care provider (with or without co-management by endocrinologists). None of the included studies from these 2 SRs met the inclusion criteria for the current report. These SRs included studies published up to January 202113 and June 2021,16 respectively.
Thus, 3 of the included SRs identified primary studies that are relevant to the current report.12,14,15 Only the characteristics and results of the subset of relevant studies will be described in this report. Additional details regarding the characteristics of included publications are provided in Appendix 2.
Study Design
Among the 3 SRs that included primary studies relevant to the current report,12,14,15 1 SR12 included RCTs and observational studies, and the other 214,15 included RCTs only. Two SRs14,15 reported quantitative syntheses of results by conducting a meta-analysis (MA), 1 using a fixed effect model15 and the other using both fixed and random effect models.14
The SR by Aggarwal et al. (2022)12 searched multiple electronic databases for studies published between 2018 and July 2021. They included 26 studies, of which 3 (2 RCTs and 1 non-randomized study) were relevant to the current report. The SR with MA by Dicembrini et al. (2019)14 searched for RCTs published up to 2018. Among the 10 RCTs included, 5 were relevant to the current report. However, 1 of the relevant RCTs17 was unpublished at the time of the publication of the SR, and partial information about the trial was obtained from the clinical trials registry. Since the results from the RCT were not included in the MA or reported in the SR, it is included in the current report separately to capture relevant evidence.17 Lastly, the SR with MA by Janapala et al. (2019)15 searched for studies published over the previous 10 years (the search date was not reported). They included 5 RCTs, of which 4 were relevant to the current report. There was some overlap of relevant included studies between the SRs by Dicembrini et al.14 and Janapala et al.15 A detailed overlap table is provided in Appendix 5.
The study by Bergenstal et al. (2022)17 was an open-label, parallel group RCT (NCT01237301). After a 2-week run-in period to adjust medications, participants were randomized to 2 study groups using random block allocation. Randomized participants then entered a 14-day baseline period before the study, during which participants wore a blinded CGM device and used SMBG for calibration measurements. This was done to obtain baseline measurements for each outcome. Participants entered the open-label study after this 14-day baseline period.
The economic evaluation by García-Lorenzo et al. (2018)18 was a cost-effectiveness analysis conducted with a public payer perspective, using a lifetime horizon with annual cycles. A Markov model was used for the analysis. Health states used in the model were: no complications, retinopathy (leading to blindness), neuropathy (leading to amputation), cardiovascular disease (leading to amputation), and nephropathy (leading to end-stage renal disease). Costs were reported in 2017 Euro and a 3% discount rate was applied. The clinical data were sourced from an MA conducted by the study authors, cost data were obtained from the device manufacturers, and utility data and data about transition risks were obtained from the literature. Disutility values obtained from a US-based study were modified to apply to the Spanish population. The key assumptions used in the analysis were that the association between relative risk reduction for T2D complications and hemoglobin A1C were linear, patients diagnosed with T2D could develop only 1 comorbidity per cycle, and complications such as blindness or amputation could be developed after a specific complication. Costs of multiple conditions were also assumed to be the sum of cost of each condition.
Country of Origin
The authors of the 3 SRs that included relevant studies were from India,12 Italy,14 and the US.15 They did not report the countries in which the primary studies were conducted.
The RCT by Bergenstal et al.17 was conducted in the US, and the economic evaluation was conducted in Spain.18
Patient Population
The relevant population in the SR by Aggarwal et al.12 was patients of all ages with T2D. Across the 3 included relevant primary studies, there were 35,325 participants (35,080 from a single observational study), with mean age ranging from 42.4 years to 56 years in the rtCGM group and 59 years to 63.4 years in the control group. In the SR with MA by Dicembrini et al.,14 the eligible population was patients with T2D. Across the included relevant RCTs, there were 429 patients with a mean age ranging from 58 years to 63 years. Lastly, the SR by Janapala et al.15 included studies on adult patients (≥ 19 years of age) with T2D. There were 348 participants across the relevant primary studies. Mean age was not reported.
In the RCT, Bergenstal et al.17 enrolled adult patients (18 to 75 years of age) with T2D with hemoglobin A1C ≥ 7% treated with sulfonylurea, incretin, or insulin along with metformin. Patients on thiazolidinediones were excluded. There were 114 participants (rtCGM group, n = 59; SMBG group, n = 55). The mean age of the participants was 59.3 years in the rtCGM group and 58.8 years in the control group.
The target population for the cost-effectiveness analysis18 was people living with T2D. For the analysis, clinical data were obtained from an MA of 227 patients with a mean age of 57 years.
None of the included studies reported evidence on pediatric patients with T2D.
Interventions and Comparators
Relevant to the current report, the intervention and comparator of interest in all included studies were rtCGM and SMBG, respectively.12-18
Across the primary studies included in the SRs, the length of study follow-up ranged from 12 weeks14 to 9 months.12 The duration of rtCGM use was reported in 1 SR15; it ranged from 48 hours (in a period of 3 months) to daily use for 3 months.
In the RCT by Bergenstal et al.,17 the participants were followed up for 16 weeks (after a 14-day baseline period) with outcome assessments at weeks 8 and 16. Participants in the intervention group used rtCGM throughout the study period. Participants in the control group wore a blinded CGM device for 2 weeks before each follow-up assessment. This was done to obtain the ambulatory glucose profile. Participants in the rtCGM group were trained to self-adjust their medications, insulin, and diet based on the CGM data. Participants in the SMBG group were asked to “graph” the blood glucose values (method unclear) and use them along with clinician instructions to adjust medications or diet. Participants were followed up by endocrinologists every 4 weeks and given advice on medication or diet adjustments based on the data from the rtCGM or SMBG.
The economic evaluation compared the cost-effectiveness of rtCGM and SMBG compared to SMBG alone.18
Outcomes
Changes from baseline of glycated hemoglobin (hemoglobin A1C) levels were evaluated as an outcome in 3 included SRs,14,15 and in the included RCT.17
Time in range (TIR) is defined as the percentage of time in which blood glucose remains between specific target levels. TIR of 70 mg/dL to 180 mg/dL is considered a marker for glycemic control when using CGM.20 A higher TIR of 70 mg/dL to 180 mg/dL is correlated with better long-term glycemic control. This outcome was reported in the SR by Aggarwal et al.12 and in the RCT by Bergenstal et al.17
Glucose variability measured using coefficient of variation (CV) was reported in 2 SRs. It is calculated as standard deviation (SD) divided by mean glucose, and reported as a percentage.21 A CV of less than 36% is considered a stable glucose level.22
Other outcomes reported in the included studies were hypoglycemic events (3 SRs,12,14,15 1 RCT17), glucose variability (2 SRs12,14), health-related quality of life (HRQoL) (1 SR14), patient satisfaction(1 SR15), percentage of time above 250mg/dL (1 SR12), insulin dose (1 SR14), and adverse events (1 SR12).
The other outcomes reported in the included RCT were hypoglycemic events (percentage of time < 50 mg/dL, < 60 mg/dL, or < 70 mg/dL) as well as percentage of time above 180 mg/dL.17
The cost-effectiveness analysis reported on incremental cost-effectiveness ratios (ICERs) of cost per QALY.18
Summary of Critical Appraisal
Additional details regarding the strengths and limitations of included publications are provided in Appendix 3.
Systematic Reviews and Meta-Analysis
All included SRs described their research question and inclusion criteria, and included components of population, intervention, comparators, and outcome.12-16 In 3 SRs, the review protocol was established a priori and registered in PROSPERO.13,14,16 Multiple electronic databases were searched in 3 SRs,12,13,16 and a bibliographic search for additional studies was done in 3 SRs.12-14 A detailed search strategy was reported in 4 SRs.12,14-16 In all included SRs, study selection, data extraction, and quality assessment were performed independently by 2 reviewers, and any discrepancies were resolved with the help of a third reviewer.12-16 Chang et al. also evaluated inter-rater agreement using Cohen’s kappa statistic.13 Assessment of quality of included studies was conducted by valid instruments such as Newcastle–Ottawa Scale,12 modified Jadad scale,12,14 Cochrane’s Risk of Bias tool,13-15 and the National Heart, Lung, and Blood Institute Quality Assessment Tools.16 One SR conducted quantitative synthesis using an MA that was relevant to the current report.14 Dicembrini et al.14 conducted an MA with appropriate methods using fixed and random effect models. They also examined heterogeneity between the studies using the I2 statistic. No heterogeneity was observed in the analysis (I2 = 0%) Publication bias was explored in 3 SRs using funnel plots and Egger’s test; however, none was detected.13-15 Lastly, none of the included SRs received external funding or had potential conflicts of interest that could affect the findings of the reviews.12-16
The SRs had several limitations. Two SRs did not identify any studies relevant to the current report; however, this could be due to limited scope of the reviews.13,16 The scope of 1 SR was limited to perinatal women with diabetes,13 and the scope of the other SR was limited to patients with diabetes being managed by primary care providers.16 Two of the other SRs (which included relevant studies) did not conduct a comprehensive literature search.14,15 Only 1 electronic database (MEDLINE) was searched; grey literature was not searched, and it was unclear whether reference lists were searched for additional publications.14,15 Due to these limitations, it is possible that some relevant studies were not captured in the review and in the MA. The SR by Aggarwal et al. limited their search to studies published since 2018.12 Although this ensured that the most recent evidence is captured, some previous studies relevant to the research question were not included. In this review, authors also mentioned that out of 60 “relevant” publications, only high-to-moderate quality studies were included in the review.12 Since a list of excluded studies (and reason for exclusion) was not reported, it is unclear whether the findings of excluded studies differed from those included in the review. Aggarwal et al. also did not report results of all individual studies; only a selective summary of findings for each outcome was reported.12 This meant that some results of included trials (e.g., hemoglobin A1C results of the MOBILE trial) were not reported in the SR. A list of excluded studies and reason for exclusion were not reported in any of the SRs.12-16 In the SR with MA by Dicembrini et al.,14 results of outcomes for which an MA was not conducted were not reported in detail. Without details of results such as effect sizes or confidence intervals from each study, the certainty of those findings was difficult to ascertain. Furthermore, it was not clear whether any of the included primary studies were conducted in Canada, making the generalizability to Canadian settings unclear.12-16
Randomized Controlled Trial
The study objectives were described, and the trial was registered with prespecified outcomes listed.17 The inclusion and exclusion criteria for the study were described and were appropriate for the objective. The study was conducted as a multi-centre, parallel group randomized trial. Participants were randomized by a predefined block allocation sequence. Study personnel were concealed to allocation until after the randomization. Randomization was done after a 2-week run-in period to adjust medications. Characteristics of study participants at baseline were reported. Potential confounders, such as duration of disease, body mass index (BMI), and age, were similar between the groups. Participants in both groups were followed up for the same duration of time. Simple outcome data for the main outcomes were reported. An adjusted analysis for a potential confounder (antidiabetic medication) was conducted and results reported.17
The RCT had several limitations. The trial was open-label, which means the participants and outcome assessors were aware of the intervention received. Since the outcomes were objective and not patient reported, the open-label design of the study is less likely to affect outcome bias. Approximately 30% of screened individuals were not enrolled in the study for various reasons (e.g., failed screening, not interested in participating). Ten patients withdrew from the study during the run-in period due to side effects of medication or for device-related reasons. Lastly, 7 patients (6.1%) withdrew after the study initiation due to side effects or time constraints. Study analysis was conducted excluding these patients. It is possible that the withdrawn patients would have had different outcomes from the study results. When describing the study findings, effect sizes and estimates of random variability such as confidence intervals were not reported for the comparative results between the groups. The details of statistical tests used to compare between the groups were unclear. The results of the subgroup analysis were not reported in a tabular form; interpretation of graphical presentation of those results were difficult to interpret. The study was funded by a pharmaceutical company and the study authors disclosed conflicts of interest related to pharmaceutical companies. The trial was not conducted in Canada, and the generalizability to Canadian settings was unclear.
Economic Evaluation
The economic evaluation had several strengths.18 The objectives and economic importance were described, and the interventions and comparators of interest were clearly reported. The form of analysis and perspectives were described along with the sources of input parameters in the analysis. Choice of model (Markov model) and the key parameters were justified. Currency, discount rates, and price data used to report the results were described. Clinical effectiveness data were obtained from a systematic review conducted by the authors, which was reported in the publication. Incremental cost-effectiveness results of the intervention compared to the control were reported. Results of the base-case analysis and various sensitivity and scenario analyses were reported. Conclusions were consistent with the data reported and were accompanied by the appropriate caveats.
One of the assumptions used in the model was that only 1 chronic comorbidity would be developed in each patient at each cycle. It is possible that patients could develop multiple comorbidities. The treatment and associated costs of medications considered in the model was unclear. It was unclear whether the patients using rtCGM or SMBG are taking insulin or oral hypoglycemic medications to manage their diabetes. Additional costs of comorbidities could increase the total annual costs of rtCGM and SMBG. The clinical effectiveness data were obtained from an SR, which included studies up to 6 months follow-up. Therefore, long-term clinical effectiveness is unclear and not considered in the economic evaluation. Lastly, the study was conducted in Spain from the perspective of Spanish National health Service.18 Based on the prevalence of T2D, differences in health care systems, and different willingness-to-pay (WTP) thresholds, generalizability to Canadian settings is unclear.
Summary of Findings
A summary of findings from the included studies are provided in the following paragraphs. Appendix 4 presents the main study findings and authors’ conclusions.
Clinical Effectiveness of rtCGM Versus SMBG for Adults With T2D
Among the studies included in the current report, 3 SRs and 1 RCT reported on the clinical effectiveness of rtCGM versus SMBG for adults with T2D. There was some overlap in the primary studies that were included in the SRs; to avoid duplication of data, results from each primary study are reported only once. When pooled estimates from the MA are available, results of relevant primary studies not included in the MA are presented separately, in addition to the results of the MA.
Hemoglobin A1C Levels
Hemoglobin A1C levels were reported in 2 SRs14,15 and 1 RCT.17 A random effects MA14 of 4 RCTs (n = 429) with study durations ranging from 12 weeks to 26 weeks found that rtCGM use was associated with significantly lower hemoglobin A1C levels at the end of the study compared to SMBG (mean difference for rtCGM versus SMBG = –0.28% [95% CI, –0.43 to –0.13]).14 There was no heterogeneity between the studies (I2 = 0%).
Two other RCTs included in the SR by Janapala et al.15 found no differences in change from baseline of hemoglobin A1C levels at 3 months between rtCGM and SMBG groups. The open-label RCT by Bergenstal et al.17 (n = 114) found that, at week 16, there was significant within-group improvement in hemoglobin A1C levels from baseline, but there was no difference in change in hemoglobin A1C levels between rtCGM and SMBG groups (P = 0.11).
It is possible that the pooled analysis in the MA detected between-group differences due to increased statistical power.
TIR of 70 mg/dL to 180 mg/dL
In the MOBILE trial (n = 175) included in the SR by Aggarwal et al.,12 participants in the rtCGM group reported 15% (95% CI, 8% to 23%) more TIR of 70 mg/dL to 180 mg/dL at month 8 compared to the SMBG group. The between-group difference was statistically significant (P < 0.001).
Bergenstal et al.17 reported that rtCGM and SMBG were associated with a 18.21% and 11.55% increase, respectively, in TIR of 70 mg/dL to 180 mg/dL at week 16. However, there was no significant between-group difference (P = 0.13). The between-group effect estimate and 95% CI were not reported.
The MOBILE trial included participants on basal insulin,12 whereas the trial by Bergenstal et al. included patients taking oral medications as well as insulin. It is possible that the difference in population and follow-up times along with the lower sample size (n = 114) in the Bergenstal trial accounts for the difference in findings. A subgroup analysis on patients on basal insulin was not reported by Bergenstal et al.17
Glucose Variability
One RCT included in the SR by Aggarwal and colleagues found that mean glucose values in the rtCGM group were significantly lower compared to those in SMBG group at month 8 (adjusted difference –26 [95% CI, –41 to –12]; n = 175).12 The study was conducted among patients with T2D using basal insulin. The clinical significance of this finding is unclear.
Glucose variability measured using CV was reported in 2 SRs.12,14 Aggarwal et al.12 reported results from 1 RCT (n = 175) in which the CVs of rtCGM and SMBG groups at month 8 were 27% and 29%, respectively. Adjusted between-group differences indicated little to no difference between the groups (–1.8 [95% CI, –3.5 to 0]), and this was not statistically significant (P = 0.05). In the SR by Dicembrini et al.,14 results from 1 RCT (n = 158) found “no significant between-group difference” in the rtCGM (CV = 30%) and SMBG (CV = 29%) groups at 12 weeks (between-group effect estimates not reported).
Percentage of Time Above 180 mg/dL
Results from the RCT(n = 114) by Bergenstal et al17 showed that percentage of time above 180mg/dL decreased by a mean of 17.41% in the rtCGM group, compared to a 12.77% decrease in the SMBG group. The between-group comparison was not statistically significant.
Percentage of Time Above 250 mg/dL
Results from the MOBILE trial (included in an SR12) found that, at the 8-month follow-up, rtCGM use was associated with a significantly lower percentage of time above 250mg/dL compared to SMBG (adjusted difference = –16% [95% CI, –21% to –11%]; P < 0.001).
Hypoglycemic Events
Aggarwal et al.12 reported results from a large (n = 36,080) observational study in which rtCGM initiators were compared with matched non-initiators using claims data. The study found that rtCGM initiation was associated with a greater reduction in hypoglycemia rate compared to non-initiation (adjusted rate difference = –4.0% [95% CI, –7.8% to –0.2%]). However, it was unclear whether all non-initiators were using SMBG to monitor their glycemic levels.
Two other SRs14,15 reported results from multiple RCTs comparing rates or occurrences of hypoglycemic events between rtCGM and SMBG. There were no severe hypoglycemic events observed in either group in 2 RCTs.14 As for non-severe hypoglycemic events, the SRs reported that there was no significant difference between rtCGM and SMBG (across 5 RCTs).14,15 It was noted that the studies included in 1 SR14 defined “hypoglycemic events” in different ways, ranging from self-reported events to measured blood glucose between 55 mg/dL and 70 mg/dL. The other SR15 did not provide definitions of hypoglycemia used in individual studies or numerical results from each study.
In 2 trials12,17 (1 reported in an SR), rtCGM use was associated with a significant reduction in the percentage of time below 70 mg/dL. The MOBILE trial (included in the Aggarwal et al.12 SR), found that at 8 months, rtCGM use was associated with a significant reduction in the percentage of time below 70 mg/dL. However, the effect was small (adjusted difference for rtCGM versus SMBG = –0.24% [95% CI, –0.42 to –0.05]), and the clinical significance is unclear. Similarly, in the RCT by Bergenstal et al.17 at week 16, rtCGM was favoured over SMBG in reducing the percentage of time below 70 mg/dL (P < 0.005).
Bergenstal et al. also found that rtCGM use was associated with significantly greater reductions in percentage of time below 60 mg/dL and below 50 mg/dL, compared to SMBG use. It was noted that in the SMBG group, the percentage of time below 70 mg/dL, 60 mg/DL, and 50 mg/dL increased from baseline at 16 weeks.17
Insulin Dose
The SR by Dicembrini et al.14 provided results from 2 RCTs that evaluated total insulin dose between rtCGM and SMBG groups. The trials found no difference between the groups (data not reported).
Quality of Life and Patient Satisfaction
HRQoL outcomes were evaluated in 2 RCTs, as reported in 2 SRs.14,15 There was no “meaningful” difference in HRQoL measures between the rtCGM and SMBG groups in 1 RCT (data not reported).14,15 One SR14 reported that “SMBG (was) better” as found in the second RCT (data not reported). Due to gaps in reporting, the clinical meaningfulness of these findings is uncertain.
Janapala and colleagues15 reported that rtCGM use was associated with a “significant reduction” in BMI, calorie intake and postprandial glucose level, as well as an increase in weekly exercise duration (1 RCT). However, no numerical data were provided.
Adverse Events
A summary of adverse events was reported in 1 SR12 (from 1 RCT). No serious adverse events were observed in the trial by Price et al. (n = 70). In both the rtCGM and SMBG groups, there was 1 incidence of device-related skin irritation, and in the SMBG group there was an incidence of a disease-related hypoglycemic event. In the RCT by Bergenstal et al. (n = 114),17 there were no observed adverse events in either group.
Occurrence of adverse events was not evaluated or reported in 2 SRs.14,15
Clinical Effectiveness of rtCGM Versus SMBG for Pediatric Patients With T2D
No relevant evidence regarding rtCGM versus SMBG for pediatric patients with T2D was identified; therefore, no summary can be provided.
Cost-Effectiveness of rtCGM Versus SMBG for Patients With T2D
The included cost-effectiveness analysis found that rtCGM use is associated with an ICER of 180,533€ per QALY compared to SMBG.18 The results suggested that rtCGM is not a cost-effective option at a WTP threshold of €20,000 to €25,000 per QALY. The authors concluded that the cost of rtCGM is considerably higher than SMBG.
The cost-effectiveness acceptability curve similarly showed that rtCGM is not cost-effective compared to SMBG in T2D. At the estimated WTP threshold (€20,000 to €25,000 per QALY) in the base case, the probability of rtCGM becoming the cost-effective option is 0%. The threshold in which there is 70% probability of rtCGM becoming cost-effective is approximately €220,000.
Limitations
Two of the included SRs did not identify any relevant primary studies for inclusion, due to their scope being limited to perinatal women with diabetes13 or patients with diabetes being managed by primary care providers.16 The SRs that identified relevant primary studies had serious limitations as described in earlier sections.12,14,15 The evidence was also heterogeneous across the studies in terms of devices used for rtCGM and medications or insulin used to manage glycemic levels. Another major limitation is the relatively shorter follow-up periods in the included trial. The length of rtCGM use in included primary studies (where reported) ranged from 48 hours (Cosson et al.)15 to 9 months (MOBILE trial).12 No evidence was identified regarding the clinical effectiveness or cost-effectiveness of rtCGM in pediatric patients with T2D. Lastly, it was not clear whether any of the included primary studies in the SRs were conducted in Canada12-16 The RCT was not conducted in Canada. Thus, the generalizability to Canadian settings is unclear. The cost-effectiveness study18 was conducted in Spain; therefore, its applicability to Canadian settings is unclear as well.
Conclusions and Implications for Decision- or Policy-Making
Five SRs12-16 and 1 RCT17 were included in this report to summarize the evidence regarding the clinical effectiveness of rtCGM compared to SMBG in adult individuals with T2D. One economic evaluation was identified regarding the cost-effectiveness of rtCGM compared to SMBG in people with T2D.18 No evidence was identified regarding the clinical effectiveness of rtCGM in pediatric patients with T2D.
In adults living with T2D, evidence from an MA14 showed that glycemic monitoring with rtCGM is associated with improved hemoglobin A1C levels compared to SMBG. Evidence from 2 RCTs regarding the outcome TIR of 70 mg/dL to 180 mg/dL was mixed, with 1 trial finding results favouring rtCGM and the other finding no difference between the groups. rtCGM was also found to be favoured over SMBG in maintaining a stable blood glucose level, as indicated by decreased percentages of time in either extreme, including time below 50 mg/dL, 60 mg/dL, and 70 mg/dL, as well as time above 250 mg/dL. There was little to no difference in glucose variability (measured using CV), hypoglycemic events, or insulin dose between rtCGM and SMBG. Due to lack of reporting of data in the SRs, the clinical effectiveness of rtCGM versus SMBG in quality-of-life outcomes is uncertain. In the 2 RCTs (1 reported in an SR) that reported adverse events, rtCGM appeared to be relatively safe. One incidence of skin irritation was reported in both the rtCGM and SMBG groups in an RCT of 70 participants. The identified evidence is uncertain due to risk of bias within the included studies, indirectness due to possible limited generalizability to Canadian settings, and heterogeneity across the studies.
Evidence from a cost-effective analysis conducted in Spain suggested that glycemic monitoring with rtCGM was not cost-effective compared to SMBG alone in individuals living with T2D.18
A recent CADTH report23 on the clinical effectiveness and cost-effectiveness of rtCGM compared to SMBG in T1D found that rtCGM is favoured over SMBG for glycemic monitoring in adults and pediatric patients. rtCGM was also found to be cost-effective compared to SMBG at a WTP threshold of $50,000 per QALY. Another CADTH report on evidence-based guidelines regarding the use of rtCGM in all patients with diabetes is currently being produced.
Future large-scale clinical trials with longer periods of follow-up are warranted to evaluate the effectiveness of rtCGM in T2D. Economic evaluations from a Canadian perspective, in light of recent trials, could help inform decision-makers in a Canadian setting.
References
1.Diabetes in Canada: backgrounder. Ottawa (ON): Diabetes Canada; 2020: https://www.diabetes.ca/DiabetesCanadaWebsite/media/Advocacy-and-Policy/Backgrounder/2020_Backgrounder_Canada_English_FINAL.pdf. Accessed 2022 Jul 11.
2.Saeedi P, Petersohn I, Salpea P, et al. Global and regional diabetes prevalence estimates for 2019 and projections for 2030 and 2045: results from the International Diabetes Federation Diabetes Atlas, 9(th) edition. Diabetes Res Clin Pract. 2019;157:107843. PubMed
3.Bullard KM, Cowie CC, Lessem SE, et al. Prevalence of diagnosed diabetes in adults by diabetes type - United States, 2016. MMWR Morb Mortal Wkly Rep. 2018;67(12):359-361. PubMed
4.Wu Y, Ding Y, Tanaka Y, Zhang W. Risk factors contributing to type 2 diabetes and recent advances in the treatment and prevention. Int J Med Sci. 2014;11(11):1185-1200. PubMed
5.Farkas B, Corbett C, Hofmeister M, et al. Glucose monitoring technologies for the management of insulin-dependent diabetes. Calgary (AB): The Health Technology Assessment Unit, University of Calgary; 2019: https://www2.gov.bc.ca/assets/gov/health/about-bc-s-health-care-system/heath-care-partners/health-authorities/bc-health-technology-assessments/glucose-monitoring-hta.pdf. Accessed 2022 Jul 28.
6.Lin R, Brown F, James S, Jones J, Ekinci E. Continuous glucose monitoring: a review of the evidence in type 1 and 2 diabetes mellitus. Diabet Med. 2021;38(5):e14528. PubMed
7.Gomez AM, Henao Carrillo DC, Munoz Velandia OM. Devices for continuous monitoring of glucose: update in technology. Med Devices (Auckl). 2017;10:215-224. PubMed
8.Farrell K, Loshak H. Intermittently scanned and real-time continuous glucose monitoring for people with diabetes. Can J Health Technol. 2022;2(7). https://www.cadth.ca/sites/default/files/pdf/htis/2022/RC1436%20rtCGM%20vs%20isCGM%20Diabetes_Final.pdf. Accessed 2022 Aug 09.
9.Shea BJ, Reeves BC, Wells G, et al. AMSTAR 2: a critical appraisal tool for systematic reviews that include randomised or non-randomised studies of healthcare interventions, or both. BMJ. 2017;358:j4008. PubMed
10.Downs SH, Black N. The feasibility of creating a checklist for the assessment of the methodological quality both of randomised and non-randomised studies of health care interventions. J Epidemiol Community Health. 1998;52(6):377-384. PubMed
11.Higgins JPT, Green S, editors. Figure 15.5.a: Drummond checklist (Drummond 1996). Cochrane handbook for systematic reviews of interventions. London (GB): The Cochrane Collaboration; 2011: http://handbook-5-1.cochrane.org/chapter_15/figure_15_5_a_drummond_checklist_drummond_1996.htm. Accessed 2022 Jul 22.
12.Aggarwal A, Pathak S, Goyal R. Clinical and economic outcomes of continuous glucose monitoring system (CGMS) in patients with diabetes mellitus: a systematic literature review. Diabetes Res Clin Pract. 2022;186:109825. PubMed
13.Chang VYX, Tan YL, Ang WHD, Lau Y. Effects of continuous glucose monitoring on maternal and neonatal outcomes in perinatal women with diabetes: a systematic review and meta-analysis of randomized controlled trials. Diabetes Res Clin Pract. 2022;184:109192. PubMed
14.Dicembrini I, Mannucci E, Monami M, Pala L. Impact of technology on glycaemic control in type 2 diabetes: A meta-analysis of randomized trials on continuous glucose monitoring and continuous subcutaneous insulin infusion. Diabetes Obes Metab. 2019;21(12):2619-2625. PubMed
15.Janapala RN, Jayaraj JS, Fathima N, et al. Continuous glucose monitoring versus self-monitoring of blood glucose in type 2 diabetes mellitus: a systematic review with meta-analysis. Cureus. 2019;11(9):e5634. PubMed
16.Kieu A, King J, Govender RD, Ostlundh L. The benefits of utilizing continuous glucose monitoring of diabetes mellitus in primary care: a systematic review. J Diabetes Sci Technol. 2022:19322968211070855. PubMed
17.Bergenstal RM, Mullen DM, Strock E, Johnson ML, Xi MX. Randomized comparison of self-monitored blood glucose (BGM) versus continuous glucose monitoring (CGM) data to optimize glucose control in type 2 diabetes. J Diabetes Complications. 2022;36(3):108106. PubMed
18.García-Lorenzo B, Rivero-Santana A, Vallejo-Torres L, et al. Cost-effectiveness analysis of real-time continuous monitoring glucose compared to self-monitoring of blood glucose for diabetes mellitus in Spain. J Eval Clin Pract. 2018;24(4):772-781. PubMed
19.Liberati A, Altman DG, Tetzlaff J, et al. The PRISMA statement for reporting systematic reviews and meta-analyses of studies that evaluate health care interventions: explanation and elaboration. J Clin Epidemiol. 2009;62(10):e1-e34. PubMed
20.Battelino T, Danne T, Bergenstal RM, et al. Clinical targets for continuous glucose monitoring data interpretation: recommendations from the International Consensus on Time in Range. Diabetes Care. 2019;42(8):1593-1603. PubMed
21.Umpierrez GE, P Kovatchev B. Glycemic variability: how to measure and its clinical implication for type 2 diabetes. Am J Med Sci. 2018;356(6):518-527. PubMed
22.Danne T, Nimri R, Battelino T, et al. International consensus on use of continuous glucose monitoring. Diabetes Care. 2017;40(12):1631-1640. PubMed
23.Barbara AM, Grobelna A. Real time continuous glucose monitoring for people living with type 1 diabetes. Can J Health Technol. 2022;2(8). https://canjhealthtechnol.ca/index.php/cjht/article/view/RC1442/RC1442. Accessed 2022 Aug 09.
Appendix 1: Selection of Included Studies
Appendix 2: Characteristics of Included Publications
Note that this appendix has not been copy-edited.
Table 2: Characteristics of Included Systematic Reviews and Meta-Analyses
Study citation, country, funding source | Study designs and numbers of primary studies included | Population characteristics | Intervention and comparator(s) | Clinical outcomes, length of follow-up |
|---|---|---|---|---|
Aggarwal et al., 202212 India Funding source: No external funding. Authors employees of IQVIA | Systematic review of RCTs and observational studies Number of primary studies included = 26 Number of relevant primary studies = 3 (2 RCTs, 1 NRS) | Eligible Population: Patients of all ages with T1D, T2D, or gestational diabetes Relevant population: Patients with T2D irrespective of age (n = 36,325) Mean age (SD): rtCGM group: Ranged from 42.4 (19.9) to 56 (9) SMBG group: ranged from 59 (9) to 63.4 (13.4) | Eligible Intervention: CGMS (e.g., rtCGM, isCGM [FGM]) Eligible Comparator: Other glucose monitoring devices. Relevant intervention: rtCGM (Dexcom G6) Relevant comparator: SMBG | Outcomes: Change in hemoglobin A1C, TIR, adverse events Follow-up: 8 months and 9 months (not reported for 1 study) |
Chang et al., 202213 Singapore Funding source: No external funding | Systematic review and meta-analysis of RCTs. Number of primary studies included = 10 Number of relevant primary studies = None | Eligible Population: Perinatal women aged 18 years or older with T1D, T2D, or gestational diabetes Relevant population: Patients with T2D | Eligible Intervention: CGMS (retrospective and real-time) Eligible Comparator: SMBG, placebo Relevant intervention: rtCGM Relevant comparator: SMBG | Outcomes: maternal outcomes (e.g., hemoglobin A1C levels, weight gain), neonatal outcomes (e.g., birth weight, macrosomia, hypoglycemic episodes) Follow-up: Not Applicable |
Kieu et al., 202216 UAE Funding source: No external funding | Systematic review of RCTs and observational studies Number of primary studies included = 10 Number of relevant primary studies = None | Eligible Population: Patients of all ages with T1D, T2D, or gestational diabetes under the care of a primary care provider (including co-management by endocrinologist) Relevant population: Patients with T2D under the care of a primary care provider | Eligible Intervention: CGMs (e.g., rtCGM, isCGM [FGM]) Eligible Comparator: usual care (e.g., SMBG) Relevant intervention: rtCGM Relevant comparator: SMBG | Outcomes: Change in hemoglobin A1C, TIR, time above range, adverse events (e.g., hypoglycemic events) Follow-up: Not Applicable |
Dicembrini et al., 201914 Italy Funding source: No external funding | Systematic review and meta-analysis of RCTs Number of primary studies included = 10 Number of relevant primary studies = 5 (4 published and one unpublished triala) | Eligible Population: Patients with T2D. Relevant population: Patients with T2D (n = 429) Mean age, years: Ranged from 58 to 63 Duration of DM, mean, years: Ranged from 13 to 17 (NR in 1 study) | Eligible Interventions: CSII, rtCGM/FGM Eligible Comparators: MDI, SMBG Relevant intervention: rtCGM (Dexcom in 2 studies, Guardian in 1 study, device NR in 1 study) Relevant comparator: SMBG | Outcomes: hemoglobin A1C levels, severe hypoglycemia, nocturnal rates of hypoglycemia, glucose variability, HRQoL, Follow-up: Ranged from 12 weeks to 26 weeks |
Janapala et al., 201915 US Funding source: NR | Systematic review and meta-analysis of RCTs Number of primary studies included = 5 (from 6 publications) Number of relevant primary studies = 4 RCTs (from 5 publications) | Eligible Population: Patients (≥ 19 years of age) with T2D. Relevant population: Patients (≥ 19 years of age) with T2D. (n = 348) Mean age, years: NR Duration of DM, mean, years: NR | Eligible Intervention: CGMS (real-time and retrospective), FGM Eligible Comparator: routine methods for monitoring hyperglycemia (e.g., SMBG) Relevant intervention: rtCGM Relevant comparator: SMBG | Outcomes: hemoglobin A1C levels, hypoglycemia, patient satisfaction Follow-up: ranged from 12 weeks to 6 months |
CGM = continuous glucose monitoring; CSII = continuous subcutaneous insulin infusion: DM = diabetes mellitus; FGM = flash glucose monitoring; HRQoL = health-related quality of life; MDI = multiple daily injections; n = number; NR = not reported; NRS = non-randomized study; RCT = randomized controlled trial; rtCGM = real-time continuous glucose monitoring; SD = standard deviation; SMBG = self-monitoring of blood glucose; T1D = type 1 diabetes mellitus; T2D = type 2 diabetes mellitus; TIR = time in range
aOnly partial results from the unpublished trial (NCT01237301) were available when this SR was conducted. The results of that trial were not included in the meta-analysis. Therefore, the trial has been included separately in the current report (Bergenstal et al., 202217)
Table 3: Characteristics of Included Randomized Controlled Trial
Study citation, country, funding source | Study design | Population characteristics | Intervention and comparator(s) | Clinical outcomes, length of follow-up |
|---|---|---|---|---|
Bergenstal et al., 202217 NCT01237301 US Funding source: Roche Diagnostics Diabetes Care | Open-label, parallel group RCT | Adult patients (18 to 75 years) with uncontrolled T2D, with hemoglobin A1C ≥ 7%, treated with Sulfonylurea ± metformin, incretin (DPP4 inhibitor or GLP-1 agonist) ± metformin or insulin ± metformin. Exclusion criteria: Treatment with TZD or a maltose metabolizing agents, recent steroid use, pregnancy or potential future pregnancy, inherited galactosemia, or physical/cognitive/psychological impairment. Participants: rtCGM, n = 59 SMBG, n = 55 Age, mean (SD), years rtCGM = 59.3 (8.9) SMBG = 58.8 (10) Sex: rtCGM: 49% female SMBG: 58% female Duration of diabetes,a mean (SD) years: rtCGM: 11.8 (6.5) SMBG = 12.7 (7) | Intervention: Dexcom SevenPlus CGM Comparator: SMBG 4 times per day with an Aviva glucose metre | Change in hemoglobin A1C, changes in hypoglycemia rates, TIR Follow-up: 16 weeks, with assessments at 8 and 16 weeks |
CGM = continuous glucose monitoring; DPP4 = dipeptidyl peptidase 4; GLP = Glucagon like peptide; n = number; RCT = randomized controlled trial; rtCGM = real-time continuous glucose monitoring; SD = standard deviation; SMBG = self-monitoring of blood glucose; T2D = type 2 diabetes mellitus; TIR = time in range; TZD = thiazolidinediones.
aReported as T2D onset age in the publication.
Table 4: Characteristics of Included Economic Evaluation
Study citation country, funding source | Type of analysis, time horizon, perspective | Population characteristics | Intervention and comparator(s) | Approach | Source of clinical, cost, and utility data used in analysis | Main assumptions |
|---|---|---|---|---|---|---|
García-Lorenzo et al., 201818 Spain Funding source: Canary Islands Health Research Foundation, Carlos III Health Institute, Spanish Ministry of Health, Social Services, and Equality in Spain | Analysis: Cost-effectiveness analysis Time horizon: lifetime horizon using annual cycles Perspective: public health payer (Spanish NHS) | Target population: People with T2 DM Characteristics of the patient cohort: n = 227, mean age = 57 years | Intervention: rtCGM Comparator: SMBG | Model: Markov model Willingness-to-pay threshold: €20,000 to €25,000 per QALY Outcomes: ICER (cost/QALY) Health states: No complications, retinopathy (leading to blindness), neuropathy (leading to amputation), cardiovascular disease (leading to amputation), nephropathy (leading to ESRD) Sensitivity analyses: Deterministic and a PSA using 10,000 Monte Carlo simulations were conducted. Uncertainty was reported in a cost-effectiveness acceptability curve. | Costs were reported in 2017 Eur. Discount rate 3%. Source of clinical data: A meta-analysis (for clinical effectiveness) conducted by the authors. It included 5 studies (n = 227). Data about transition risks were obtained from an earlier study, mortality risks were sourced from Spanish life tables, and literature. Source of cost data: Costs of device obtained from provider; costs of health states obtained from literature review. Source of utility data: US based study. Disutility values were applied to the average Spanish adult population. | Patients diagnosed with T2D develop only 1 chronic comorbidity in each cycle. Complications such as blindness, amputation, and ESRD can only be developed after a specific complication. Costs of multiple conditions were assumed to be the sum of cost of each condition. Relative risk reduction for complications and hemoglobin A1C levels were assumed to have a linear relationship. |
ESRD = end stage renal disease; ICER = incremental cost-effectiveness ratio; n = number of participants; NHS = National Health Service; PSA = probabilistic sensitivity analysis; QALY = Quality-adjusted life-year; rtCGM = real-time continuous glucose monitoring; SMBG = self-monitoring of blood glucose; T2D = type 2 diabetes mellitus.
Appendix 3: Critical Appraisal of Included Publications
Note that this appendix has not been copy-edited.
Table 5: Strengths and Limitations of Systematic Reviews and Meta-Analyses Using AMSTAR 29
Strengths | Limitations |
|---|---|
Aggarwal et al., 202212 | |
The research question and inclusion criteria for the review were clearly reported and included components of population, intervention, comparators, and outcome. Randomized and non-randomized studies were eligible for inclusion. The authors also considered other systematic reviews and meta-analyses eligible. A comprehensive search strategy was used and was published along with the article. Multiple electronic databases, trial registries, and other sources were searched. Bibliographic search was conducted for additional articles. Search was done within 24 months of completion of the review. Study selection, data extraction, and quality assessment were conducted in duplicate by 2 independent researchers. Discrepancies were resolved with the help of a third reviewer. Characteristics of included studies were reported in adequate detail. Quality of the included studies were assessed using Newcastle-Ottawa Scale for the non-randomized studies and the modified Jadad scale for the randomized controlled trials. For RCTs, the scale covered domains such as method of randomization, blinding, study withdrawals, selection, adverse events, and statistical analysis methods. For NRSs the covered domains such as selection, comparability, and outcome. Quality assessment of all included studies were reported. Relevant to the current reports all included studies were marked as “good” or “high quality”. The authors reported no potential conflicts of interest or external funding for this review. | It was unclear whether the review methods were established before the conduct of the review. The authors limited the search to studies published from 2018 onwards. This could mean relevant evidence published earlier would not be captured in the review. Authors mentioned that out of 60 relevant publications identified, high-to-moderate quality studied were included in the review. Since a list of excluded studies (and reason for exclusion) was not reported, it is unclear whether the finding of excluded studies differed from those included on the review. Results of all individual studies were not reported. Only a selective summary of findings for each outcome were provided in the publication. Sources of funding for the studies included in the review were not reported. A meta-analysis was not conducted. |
Chang et al., 202213 | |
Note: The systematic review did not identify any studies relevant to the current report. Therefore, strength and limitations of the quantitative synthesis was not assessed and summarized here. The research question and inclusion criteria for the review were clearly reported and included components of population, intervention, comparators, and outcome. The review protocol was established a priori and registered. A comprehensive search strategy was used and was published along with the article. Multiple electronic databases, trial registries, and grey literature were searched. Bibliographic search was conducted for additional articles. Search was done within 24 months of completion of the review. There were no restrictions on publication date of the studies. Study selection, data extraction, and quality assessment were conducted in duplicate by 2 independent researchers. Discrepancies were resolved by discussion and with the help of a third reviewer. Inter-rater agreement was assessed using Cohen’s kappa statistic. Characteristics of included studies were reported in adequate detail. Quality of the included studies were assessed using Cochrane collaboration’s Risk of Bias too. It covered domains such as randomization, allocation concealment, blinding, incomplete outcome data, and selective outcome reporting. Certainty of evidence was assessed using GRADE approach. Publication bias was assessed using funnel plot and Egger’s test. None was detected. The authors reported no potential conflicts of interest or external funding for this review. | A list of excluded studies (and reason for exclusion) was not reported. Results of all individual studies were not reported. Sources of funding for the studies included in the review were not reported. |
Kieu et al., 202216 | |
Note: The systematic review did not identify any studies relevant to the current report. Therefore, strength and limitations of the quantitative synthesis was not assessed and summarized here. The research question was clearly stated. The inclusion criteria for the review were provided and included components of population, intervention, comparators, and outcome. The review protocol was established a priori and registered. Multiple electronic databases, trial registries were searched. Search strategy was published along with the article. Search was done within 24 months of completion of the review. There were no restrictions on publication date of the studies. Study selection, data extraction, and quality assessment were conducted in duplicate by 2 independent researchers. Discrepancies were resolved by discussion and with the help of a third reviewer. Characteristics of included studies were reported in adequate detail. Sources of funding in the included studies were also reported. Quality of the included studies were assessed using the National Heart, Lung, and Blood Institute Quality Assessment Tools. Certainty of evidence was assessed using GRADE approach. The authors reported no potential conflicts of interest or external funding for this. | The selection of study designs eligible for the review and its rationale was unclear from the publication. Grey literature search was not conducted, and any grey literature studies were excluded. Bibliographic search or hand searching of reference lists were not conducted. A list of excluded studies (and reason for exclusion for each study) was not reported. However, grouped reasons for exclusion were listed in the PRISMA flow chart. |
Dicembrini et al., 201914 | |
The research question and inclusion criteria for the review were clearly reported and included components of population, intervention, comparators, and outcome. The review protocol was established a priori and registered. Keywords used for search was reported. Bibliographic search was conducted for additional articles. Search was done within 24 months of completion of the review. There were no restrictions on publication date of the studies. Study selection, data extraction, and quality assessment were conducted in duplicate by 2 independent researchers. Discrepancies were resolved by discussion and with the help of a third reviewer. Baseline characteristics of included studies were reported. Quality of the included studies covered domains such as randomization, allocation concealment, blinding, incomplete outcome data, selective outcome reporting, and other bias. An overall Jadad score was given to each trial. Quality assessment of each included trials were reported. . A meta-analysis was conducted using appropriate methods. Reasoning for conducting meta-analysis was adequate. Relevant to the current report, a fixed and random effect model was used. There was no observed heterogeneity (assessed using I2 statistic). Publication bias was assessed using funnel plots (there were none) The authors reported no potential conflicts of interest or external funding for this. | Inclusion was limited to RCTs, however an explanation for selection of study designs eligible for the review was unclear from the publication. Only one electronic database (MEDLINE) was searched. Grey literature search was not conducted. A list of excluded studies (and reason for exclusion for each study) was not reported. However, grouped reasons for exclusion were listed in the PRISMA flow chart. Sources of funding in the included studies were not reported. Numerical results of all individual studies were not reported for all outcomes. The authors judged the quality of studies as fair. However, it was unclear whether the impact of risk of bias on results were considered. |
Janapala et al., 201915 | |
The research question and inclusion criteria for the review were clearly reported and included components of population, intervention, comparators, and outcome. Study selection, data extraction, and quality assessment were conducted in duplicate by 2 independent researchers. Discrepancies were resolved by discussion and with the help of a third reviewer. Quality of the included studies were assessed using Cochrane collaboration’s Risk of Bias too. It covered domains such as randomization, allocation concealment, blinding, incomplete outcome data, and selective outcome reporting. A summary of risk of bias assessment was reported. All but one of the included RCTs were judged to have a low risk of bias. The main limitations of each study were reported alongside the findings. A meta-analysis was conducted using appropriate methods. Reasoning for conducting meta-analysis was adequate. A fixed effect model was used. There was no observed heterogeneity (assessed using I2 statistic). Sensitivity analyses was not conducted. Publication bias was assessed using funnel plots (there were none). The authors reported no potential conflicts of interest or external funding for this. | It was unclear whether the review methods were established before the conduct of the review. The selection of study designs eligible for the review and its rationale was unclear from the publication. The literature search was not comprehensive. Only one electronic database (MEDLINE) was searched. Grey literature search was not conducted. It was unclear whether reference lists were searched for additional publications of interest. Date of literature search was not reported. A list of excluded studies (and reason for exclusion for each study) was not reported. Some characteristics of included studies were reported. However, details such as mean age or participants, duration of diabetes, and rtCGM device used were not reported. Sources of funding in the included studies were not reported. |
AMSTAR 2 = A MeaSurement Tool to Assess systematic Reviews 2; GRADE = Grading of Recommendations, Assessment, Development, and Evaluations; NRS = non-randomized study; PRISMA = Preferred Reporting Items for Systematic Reviews and Meta-Analyses; RCT = randomized controlled trial; rtCGM = real-time continuous glucose monitoring.
Table 6: Strengths and Limitations of Clinical Study Using the Downs and Black Checklist10
Strengths | Limitations |
|---|---|
Bergenstal et al., 202217 | |
The objectives of trial were clearly described. The trial was registered, where pre-specified outcomes were listed. They were valid and reliable for the study. The study was a multicenter parallel group RCT. Randomized allocation was done using a block random allocation sequence. Inclusion and exclusion criteria for participant selection were reported. The main characteristics of study participants were comparable between the groups. Interventions and comparators were clearly described. Participants in both groups were followed up for the same duration. The compliance with the intervention was reliable. Simple outcome data for the main outcomes were reported. Actual P values were reported in the results. The staff, facilities, and places were likely representative of the care major of patients would receive. Adjusted analysis for a potential confounder (anti diabetic medications) were conducted. The distribution of them across the groups were comparable. A sample size calculation was conducted for the primary outcome to detect a difference of 0.5% of change in hemoglobin A1C. | This was an open-label trial; therefore, the participants and outcome assessors were aware of the allocation. The AGP reports were blinded. There was no concealment of allocation. When describing the study findings, effect sizes and estimates of random variability such as confidence intervals were not reported for the comparative results between the groups. The details of statistical tests used to compare between the groups were unclear. The results of some outcomes (subgroup based on DM medications) were not reported in tables. They were reported only in figures which were a difficult to interpret. Any adverse events related to intervention or comparator were not reported. Overall, 7 participants withdrew from the study. The reasons for withdrawal were reported. 2 patients in the CGM group withdrew due to “side effects”, however additional details were not reported. Analyses were conducted excluding the withdrawn participants. Around 30% of screened individuals were not enrolled in the study due to various reasons. |
AGP = ambulatory glucose profile; CGM = continuous glucose monitoring; DM = diabetes mellitus; RCT = randomized controlled trial.
Table 7: Strengths and Limitations of Economic Evaluation Using the Drummond Checklist11
Strengths | Limitations |
|---|---|
García-Lorenzo et al., 201818 | |
The research question and its economic importance were stated. The type of analysis, perspectives, and time horizon were clearly stated and was appropriate. The interventions and comparators of interest were reported and were appropriate. Sources of data used in the analysis were reported. The clinical effectiveness was estimated by the authors by conducting MA. Brief methodological details of the MA were reported. The primary outcome measure was ICER (cost per QALY) which was appropriate for the research question. Sources of cost of intervention and utilities were also stated. Currency and price data along with discount rates were reported. Choice of model (Markov model) and the key parameters are justified. Results of the base-case analysis, and various sensitivity analyses were reported in detail. Sensitivity analyses and scenario analyses were conducted. Details, rationale, and results were reported in the study. Study conclusions were reported and were accompanied by appropriate caveats. | It was assumed that only one chronic comorbidity would be developed in patients in each cycle. The clinical justification of this assumption is unclear. It was also assumed than patients would have up to 3 complications at a time. The clinical justification of this assumption is unclear. It was unclear whether the T2D patients would be on insulin or taking other medications to manage their glycemic levels. Clinical effectiveness estimates were based on studies of up to 6 months follow-up. Therefore, long-term clinical effectiveness is unclear and not considered in the economic evaluation. |
ICER = incremental cost-effectiveness ratio; MA = meta-analysis; QALY = quality-adjusted life years; T2D = type 2 diabetes mellitus.
Appendix 4: Main Study Findings and Authors’ Conclusions
Note that this appendix has not been copy-edited.
Table 8: Summary of Findings by Outcome — Hemoglobin A1C Levels
Study Citation, Study Design, and Duration of Study | Detailed Findings |
|---|---|
Dicembrini et al., 201914 SR and MA (of 4 RCTs) 12 to 26 weeks | MA using random-effects model, n = 429 Difference in hemoglobin A1C levels and end of follow-up: rtCGM vs. SMBG = –0.28% (95% CI –0.43 to –0.13), P < 0.01 n = 224, I2 = 0%. MA using fixed-effects model rtCGM vs. SMBG = [–]0.28% (95% CI –0.43 to –0.13), P < 0.01 |
Janapala et al., 201915 SR and MA (of 4 RCTs) 12 to 6 months | Beck et al., 2017, n = 158, 24 weeks duration Mean change in hemoglobin A1C levels: Adjusted difference (rtCGM vs. SMBG) = –0.3% (95% CI, –0.5 to 0.05%), P = 0.022 |
Yoo et al., 2008, n = 65, 12 weeks duration Hemoglobin A1C levels at baseline and follow-up, mean (SD): rtCGM group: 9 (1) and 8 (1.2) SMBG group: 8.7 (0.7) and 8.3 (1.1) P = 0.004 Weighted mean difference from forest plot: rtCGM vs. SMBG = –0.30 (–0.90 to 0.30) | |
Ehrhardt et al., 2011 and Vigersky et al., 2012, n = 100 At week 12: “Significant decrease in unadjusted HbA1C at the end of 12 weeks of intermittent CGM usage (Table 2)”15 rtCGM vs. SMBG = 1.0% vs. 0.5% At week 40: rtCGM vs. SMBG = 0.8% vs. 0.2% Average adjusted decline between groups: –0.48%, P = 0.006 Weighted mean difference from forest plot: rtCGM vs. SMBG = –0.30 (–0.73 to 0.13) | |
Cosson et al., 2009, n = 25, 3 months duration Change from baseline of hemoglobin A1C, %, mean (SD): rtCGM group = –0.63 (0.34), P = 0.05 SMBG group = –0.31 (0.29), P = 0.18 Weighted mean difference from forest plot: rtCGM vs. SMBG = –0.17 (–1.14 to 0.80) | |
Bergenstal et al., 202217 RCT 16 weeks | Open-label RCT, n = 114 hemoglobin A1C level, % (SD) Baseline: CGM = 8.19 (1.2); SMBG = 7.85 (0.79) Week 16: CGM = 7.07 (0.9); SMBG = 7.03 (0.5) Change from baseline, % (SD): CGM = –1.12 (1.1), P < 0.001; SMBG = –0.82 (0.9), P < 0.001 SMBG vs. CGM change in mean, P = 0.11 |
CI = confidence interval; MA = meta-analysis; n = number; NR = not reported; RCT = randomized controlled trial; rtCGM = real-time continuous glucose monitoring; SD = standard deviation; SMBG = self-monitoring of blood glucose; SR = systematic review; T2D = type 2 diabetes mellitus; vs. = versus.
Table 9: Summary of Findings by Outcome — Time in Range
Study Citation, Study Design, and Duration of Study | Detailed Findings |
|---|---|
Aggarwal et al.,202212 SR (3 studies) | Time in range of 70 to 180 mg/dL Martens et al., 2021, n = 175 TIR of 70 to 180 at month 8, mg/dL rtCGM group = 59%, SMBG group = 43% Adjusted difference, % (95% CI) = 15 (8 to 23), P < 0.001 |
Bergenstal et al., 202217 RCT 16 weeks | % 70 to 180 mg/dL, mean (SD) Baseline: CGM = 52.44 (23.8); SMBG = 54.95 (19.7) Week 16: CGM = 70.65 (21); SMBG = 66.51 (20.4) Change from baseline, mean (SD) CGM = 18.21 (23.3), P < 0.001; SMBG = 11.55 (23.5), P < 0.001 SMBG vs. CGM change in mean, P = 0.13 |
CI = confidence interval; n = number; RCT = randomized controlled trial; rtCGM = real-time continuous glucose monitoring; SD = standard deviation; SMBG = self-monitoring of blood glucose; SR = systematic review; T2D = type 2 diabetes mellitus; TIR = time in range; vs. = versus.
Table 10: Summary of Findings by Outcome — Glucose Variability
Study Citation, Study Design, and Duration of Study | Detailed Findings |
|---|---|
Aggarwal et al.,202212 SR (3 studies) | Martens et al., 2021, n = 175 Mean glucose values, mg/dL rtCGM group = 179, SMBG group = 206 Adjusted difference, mg/dL (95% CI) = –26 (–41 to –12), P < 0.001 Coefficient of variation (CV), % rtCGM group = 27, SMBG group = 29 Adjusted difference, % (95% CI) = –1.8(–3.5 to 0), P = 0.05 |
Dicembrini et al., 201914 SR and MA 12 to 26 weeks | Beck et al., 2017, n = 158 Coefficient of variation (CV), % rtCGM group = 30 (26 to 33), SMBG group = 29 (25 to 36) “No significant between-group difference. (p.2622)”14 |
CI = confidence interval; MA = meta-analysis: n = number; RCT = randomized controlled trial; rtCGM = real-time continuous glucose monitoring; SD = standard deviation; SMBG = self-monitoring of blood glucose; SR = systematic review; T2D = type 2 diabetes mellitus; vs. = versus.
Table 11: Summary of Findings by Outcome — Percentage of Time > 180 mg/dL
Study Citation, Study Design, and Duration of Study | Detailed Findings |
|---|---|
Bergenstal et al., 202217 RCT 16 weeks | % > 180 mg/dL, mean (SD) Baseline: CGM = 45.88 (24.9); SMBG = 44.01 (20.1) Week 16: CGM = 28.47 (21.2) ; SMBG = 31.23 (21.3) Change from baseline, mean (SD) CGM = –17.41(24.9), P < 0.0001; SMBG = –12.77 (24.2), P < 0.001 SMBG vs. CGM change in mean, P = 0.32 |
CI = confidence interval; MA = meta-analysis: n = number; RCT = randomized controlled trial; rtCGM = real-time continuous glucose monitoring; SD = standard deviation; SMBG = self-monitoring of blood glucose; SR = systematic review; T2D = type 2 diabetes mellitus; vs. = versus
Table 12: Summary of Findings by Outcome — Percentage of Time > 250 mg/dL
Study Citation, Study Design, and Duration of Study | Detailed Findings |
|---|---|
Aggarwal et al.,202212 SR | Martens et al., 2021, n = 175 Mean percentage of time at > 250mg/dL rtCGM group = 11%, SMBG group = 27% Adjusted difference, % (95% CI) = –16 (–21 to –11), P < 0.001 |
SMBG = blood glucose monitoring; CI = confidence interval; n = number; RCT = randomized controlled trial; rtCGM = real-time continuous glucose monitoring; SMBG = self-monitoring of blood glucose; SR = systematic review; T2D = type 2 diabetes mellitus; vs. = versus.
Table 13: Summary of Findings by Outcome — Hypoglycemic Events
Study Citation, Study Design, and Duration of Study | Detailed Findings |
|---|---|
Aggarwal et al.,202212 SR | Rate of hypoglycemic events: Reported by 1 trial: Karter et al., 2021, n = 36,080 Adjusted hypoglycemia rate reduction (rtCGM vs. SMBG) = –4.0% (95% CI, –7.8% to –0.2%), P = 0.04 |
Dicembrini et al., 201914 SR and MA 12 to 26 weeks | Severe hypoglycemic events: Reported by 3 trials (Tang et al., 2017; Tildesley et al., 2013, and Beck et al., 2017) No severe hypoglycemic events were observed. |
Non-severe hypoglycemic events: Reported by 4 trials: Ilany et al., 2018, n = 121: Reported on hypoglycemia defined as 55 to 70 mg/dL and/or symptoms: rtCGM vs. SMBG: “nonsignificant”, Data NR Tang et al., 2017 ; Tildesley et al., 2013,n = 60 Reported on self-reported hypoglycemic events: rtCGM vs. SMBG: “nonsignificant”, Data NR Beck et al., 2017, n = 158 Reported on hypoglycemia defined as < 55 to 70 mg/dL (sensor derived events): rtCGM vs. SMBG: “nonsignificant”, Data NR | |
Janapala et al., 201915 SR and MA (of 4 RCTs) 12 to 6 months | Beck et al., 2017, n = 158, 24 weeks duration “Did not differ meaningfully in measured hypoglycemia (Table 2)”;15 Data NR |
Yoo et al., 2008, n = 65, 12 weeks duration “No significant difference between the groups (Table 2)”;15 Data NR | |
Cosson et al., 2009, n = 25, 3 months duration “No significant difference between the groups (Table 2)”;15 Data NR | |
Percentage of time < 70 mg/dL | |
Aggarwal et al.,202212 SR (3 studies) | Martens et al., 2021, n = 175 Mean percentage of time at < 70 mg/dL rtCGM group = 0.2%, SMBG group = 0.5% Adjusted difference, % (95% CI) = –0.24 (–0.42 to –0.05), P = 0.02 |
Bergenstal et al., 202217 RCT 16 weeks | % < 70 mg/dL, mean (SD) Baseline: CGM = 1.68 (4.8) SMBG = 1.04 (1.5) Week 16: CGM = 0.88 (1.7) ; SMBG = 2.26 (3.3) Change from baseline, mean (SD) CGM = –0.8(4.4), P = 0.17; SMBG = 1.22 (2.8), P < 0.01 SMBG vs. CGM change in mean, P < 0.005 |
Percentage of time < 60 mg/dL | |
Bergenstal et al., 202217 RCT 16 weeks | % < 60 mg/dL, mean (SD) Baseline: CGM = 1.05 (3.4) SMBG = 0.51 (0.8) Week 16: CGM = 0.38 (1.0) ; SMBG = 1.24 (2.0) Change from baseline, mean (SD) CGM = –0.67(3.0), P = 0.09; SMBG = –0.7 (1.8), P < 0.01 SMBG vs. CGM change in mean, P < 0.005 |
Percentage of time < 50 mg/dL | |
Bergenstal et al., 202217 RCT 16 weeks | % < 50 mg/dL, mean (SD) Baseline: CGM = 0.58 (2.1) SMBG = 0.21 (0.4) Week 16: CGM = 0.16 (0.4) ; SMBG = 0.62 (1.2) Change from baseline, mean (SD) CGM = –0.42(1.9), P = 0.09; SMBG = 0.41 (1.2), P = 0.02 SMBG vs. CGM change in mean, P < 0.01 |
CGM = continuous glucose monitoring; CI = confidence interval; MA = meta-analysis: n = number; NR = not reported; RCT = randomized controlled trial; rtCGM = real-time continuous glucose monitoring; SD = standard deviation; SMBG = self-monitoring of blood glucose; SR = systematic review; T2D = type 2 diabetes mellitus; vs. = versus.
Table 14: Summary of Findings by Outcome — Quality of Life
Study Citation, Study Design, and Duration of Study | Detailed Findings |
|---|---|
Dicembrini et al., 201914 SR and MA 12 to 26 weeks | HRQoL: Reported by 2 RCTs Tang et al., 2017 ; Tildesley et al., 2013,n = 60 Reported on DTSQ rtCGM vs. SMBG: “SMBG better”, Data NR Beck et al., 2017, n = 158 Reported on WHO well-being index and EuroQoL rtCGM vs. SMBG: “nonsignificant”, Data NR |
Janapala et al., 201915 SR and MA (of 4 RCTs) 12 to 6 months | Beck et al., 2017, n = 158, 24 weeks duration Reported on ease of use/quality of life “Did not differ meaningfully in Quality of life measures. However, the CGM group had high satisfaction with use of CGM(Table 2)”;15 Data NR |
Yoo et al., 2008, n = 65, 12 weeks duration Significant reduction in total daily calorie intake, weight, body mass index (BMI), and postprandial glucose level, and a significant increase in total exercise time per week. (Table 2)”;15 Data NR | |
Ehrhardt et al., 2011 and Vigersky et al., 2012, n = 100 No difference in Weight, Blood pressure, and The Problem Areas in Diabetes (PAID) scores. (Table 2)”;15 Data NR | |
Cosson et al., 2009, n = 25, 3 months duration Most patients reported no or mild pain, while mixed reporting on bothersome of the device due to its bulkiness. (Table 2)”;15 Data NR |
CMG = continuous glucose monitoring; CI = confidence interval; DTSQ = diabetes treatment satisfaction questionnaire; HRQoL = health-related quality of life; MA = meta-analysis: n = number; NR = not reported; RCT = randomized controlled trial; rtCGM = real-time continuous glucose monitoring; SD = standard deviation; SMBG = self-monitoring of blood glucose; SR = systematic review; T2D = type 2 diabetes mellitus; vs. = versus.
Table 15: Summary of Findings by Outcome — Insulin Dose
Study Citation, Study Design, and Duration of Study | Detailed Findings |
|---|---|
Dicembrini et al., 201914 SR and MA 12 to 26 weeks | Total insulin dose: Reported by 2 RCTs (Tildesley et al., 2013 and Beck et al., 2017) “CGM and SMBG did not differ for total insulin dose. (p. 2622)”,14 Data NR In Ilany et al., 2018: “no difference was observed in basal or bolus insulin dose (p. 2622)”,14 Data NR |
CMG = continuous glucose monitoring; CI = confidence interval; MA = meta-analysis; n = number; NR = not reported; RCT = randomized controlled trial; rtCGM = real-time continuous glucose monitoring; SD = standard deviation; SMBG = self-monitoring of blood glucose; SR = systematic review; T2D = type 2 diabetes mellitus; vs. = versus.
Table 16: Summary of Findings by Outcome — Adverse Events
Study Citation, Study Design, and Duration of Study | Detailed Findings |
|---|---|
Aggarwal et al.,202212 SR (3 studies) | Price et al., 2021, n = 70 No serious adverse events were reported. rtCGM group: Device-related excessive skin irritation (n = 1), dental extraction (n = 1, not device-related) SMBG group: Study related excessive skin irritation (n = 1), Disease related hypoglycemic event (n = 1), Events unrelated to disease or device (coronary artery disease [n = 1], fibromyalgia [n = 1], poison ivy rash [n = 1], low iron level [n = 1]) |
Bergenstal et al., 202217 RCT 16 weeks | No adverse events were observed. |
n = number; RCT = randomized controlled trial; rtCGM = real-time continuous glucose monitoring; SMBG = self-monitoring of blood glucose; SR = systematic review.
Table 17: Summary of Findings of Included Economic Evaluation
Main study findings | Authors’ conclusion |
|---|---|
García-Lorenzo et al., 201818 | |
The study examined the cost-effectiveness if rtCGM vs. SMBG for T1D and T2D. Only the results of T2D are summarized here. Cost-effectiveness analysis using Markov modelling, on a lifetime horizon and from the public payer perspective. WTP threshold = €20,000 to €25,000 per QALY Base case: In the base case, discount rate was 3%, adherence was 5 days, average age of patient was 57 years and a liner relation between hemoglobin A1C and relative risk reduction was assumed. Lifetime horizon was considered as 42 for T2D. Cost (in 2017 Eur): rtCGM = €194,750, SMBG = €145,577 Difference (rtCGM – SMBG) = €49,173 QALY: rtCGM = 12.63; SMBG = 12.36 Difference (rtCGM – SMBG) = 0.272 ICER (rtCGM vs. SMBG) = 180,533€/QALY Sensitivity analysis (rtCGM vs. SMBG): Discount rate, % (0 to 5): ICER range (€/QALY) = 101,655 to 255,984 Average age, years (54 to 60): ICER range (€/QALY) = 197,246 to 166,128 Time horizon, years (10): ICER range (€/QALY) = 551,230 Logarithmic relation between hemoglobin A1C and relative risk reduction: ICER range (€/QALY) = 125,568 Scenario analysis (rtCGM vs. SMBG): Transition probabilities (95% CI): ICER (€/QALY) = 227,020 to 182,737 Disutilities (95% CI): ICER (€/QALY) = 180,798 to 180, 269 Complication costs (95% CI): ICER (€/QALY) = 173, 189 to 187, 877 Multiplicative methods for utilities: ICER (€/QALY) = 123, 651 In the graph of Monte Carlo simulations, all simulations were above the WTP threshold. In the CEAC, the rtCGM becomes cost-effective at WTP threshold of €155,000/QALY. At the estimated WTP threshold (€20,000 to €25,000 per QALY) in the base case, the probability of rtCGM becoming the cost-effective option is 0%. The threshold in which there is 70% probability of rtCGM becoming cost-effective is around €220,000. | “According to our results, we conclude that RT‐CGM is not a cost-effective technology when compared to SMBG for both T1DM and T2D patients in Spain. These results are in line with the recommendations of some European countries.[…] Despite some countries recommending limited reimbursement for certain DM patient subgroups or indications, our extensive sensitivity analysis revealed constant, robust, and unfavourable results for the ICER of RT‐CGM compared to SMBG. Further research is required for DM patient subgroups such as children, pregnant, and hypoglycaemic patients with difficulties recognizing hypoglycaemia symptoms.” (p.8)18 |
ICER = incremental cost-effectiveness ratio; QALY = Quality-adjusted life-year; rtCGM = real-time continuous glucose monitoring; SMBG = self-monitoring of blood glucose; T1D = type 1 diabetes mellitus; T2D = type 2 diabetes mellitus; vs. = versus; WTP = willingness-to-pay.
Appendix 5: Overlap Between Included Systematic Reviews
Note that this appendix has not been copy-edited.
Table 18: Overlap in Relevant Primary Studies Between Included Systematic Reviews
Primary study citation | Aggarwal et al.,202212 | Chang et al.,202213 | Kieu et al., 202216 | Dicembrini et al., 201914 | Janapala et al., 201915 |
|---|---|---|---|---|---|
Beck RW, et al. Ann Intern Med. 2017;167(6):365 to 374. | — | — | — | Yes | Yes |
Cosson E, et al. Diabetes Metab. 2009, 35:312 to 8. | — | — | — | — | Yes |
Ehrhardt NM, et al. J Diabetes Sci Technol. 2011, 5:668 to 75.a | — | — | — | Yes | Yes |
Ilany J, et al. Diabetes Obes Metab. 2018;20(5):1186 to 1192. | — | — | — | Yes | — |
Karter AJ et al. JAMA 2021;325(22): 2273 to 84. | Yes | — | — | — | — |
Martens T, et al. JAMA. 2021;325(22): 2262 to 2272 | Yes | — | — | — | — |
Price DA, et al. Diabetes Ther 2021;12(7):2089 to 99. | Yes | — | — | — | — |
Tang TS, et al. Diabetes Res Clin Pract. 2014;106(3):481 to 486.b | — | — | — | Yes | — |
Tildesley HD, et al. Can J Diabetes. 2013;37(5):305 to 308.b | — | — | — | Yes | — |
Vigersky RA et al. Diabetes Care. 2012;35(1):32 to 38.a | — | — | — | Yes | — |
Yoo HJ, et al. Diabetes Res Clin Pract. 2008, 82:73 to 9. | — | — | — | — | Yes |
a,bThese were separate publications of the same trial
Appendix 6: Real-World Evidence from the Literature Search
Note that this appendix has not been copy-edited.
The following publications were identified because they provide information related to real-world evidence for real-time continuous glucose monitoring for people living with type 2 Diabetes.
Gavin JR, Bailey CJ. Real-world studies support use of continuous glucose monitoring in type 1 and type 2 diabetes independently of treatment regimen. Diabetes Technol Ther. 2021 09;23(S3):S19-S27. PubMed
Da Silva J, Bosi E, Jendle J, et al. Real-world performance of the MiniMedTM 670G system in Europe. Diabetes Obes Metab. 2021 Aug;23(8):1942-1949. PubMed
Van Der Linden, van der Linden J, Welsh JB, Hirsch IB, Garg SK. Real-time continuous glucose monitoring during the coronavirus disease 2019 pandemic and its impact on time in range. Diabetes Technol Ther. 2021 Mar;23(S1):S1-S7. PubMed
Appendix 7: References of Potential Interest
Note that this appendix has not been copy-edited.
Previous CADTH Reports
Flash glucose monitoring and continuous glucose monitoring for people with diabetes in acute care settings. (CADTH reference list: summary of abstracts). Ottawa (ON): CADTH; 2021: https://www.cadth.ca/sites/default/files/pdf/htis/2021/RB1562%20CGM%20and%20FGM%20in%20Acute%20Care%20Final.pdf. Accessed 2022 Jul 28.
Continuous glucose monitoring for patients with all diabetes types: clinical effectiveness and guidelines. (CADTH rapid response report: summary of abstracts). Ottawa (ON): CADTH; 2018: https://www.cadth.ca/sites/default/files/pdf/htis/2018/RB1289%20Continuous%20Glucose%20Monitoring%20Final.pdf. Accessed 2022 Jul 28.
Review Articles
Rosenberg K. Self-monitoring of blood glucose can lead to improved glycemic control. Am J Nurs. 2022 02 01;122(2):50. PubMed
Kesavadev J, Misra A, Saboo B, et al. Time-in-range and frequency of continuous glucose monitoring: recommendations for South Asia. Diabetes Metab Syndr. 2022 Jan;16(1):102345. PubMed
Babu RN, Pravallika MYL, Kumar NDP, Bhargavi MB. Continuous glucose monitoring devices: a systematic review. J Glob Trends Pharm Sci. 2020;11(2):7562-7568.
Oser TK, Litchman ML, Allen NA, et al. Personal continuous glucose monitoring use among adults with type 2 diabetes: clinical efficacy and economic impacts. Curr Diab Rep. 2021 12 09;21(11):49. PubMed
Additional References
Jackson MA, Ahmann A, Shah VN. Type 2 diabetes and the use of real-time continuous glucose monitoring. Diabetes Technol Ther. 2021 03;23(S1):S27-S34. PubMed
Meng R, Meng R, Gu T, Yang F, Liu J, Sun Q, Zhu D. Performance evaluation of the Glunovo® continuous blood glucose monitoring system in Chinese participants with diabetes: a multicenter, self-controlled trial. Diabetes Ther. 2021 Dec;12(12):3153-3165. PubMed
ISSN: 2563-6596
Disclaimer: The information in this document is intended to help Canadian health care decision-makers, health care professionals, health systems leaders, and policy-makers make well-informed decisions and thereby improve the quality of health care services. While patients and others may access this document, the document is made available for informational purposes only and no representations or warranties are made with respect to its fitness for any particular purpose. The information in this document should not be used as a substitute for professional medical advice or as a substitute for the application of clinical judgment in respect of the care of a particular patient or other professional judgment in any decision-making process. The Canadian Agency for Drugs and Technologies in Health (CADTH) does not endorse any information, drugs, therapies, treatments, products, processes, or services.
While care has been taken to ensure that the information prepared by CADTH in this document is accurate, complete, and up to date as at the applicable date the material was first published by CADTH, CADTH does not make any guarantees to that effect. CADTH does not guarantee and is not responsible for the quality, currency, propriety, accuracy, or reasonableness of any statements, information, or conclusions contained in any third-party materials used in preparing this document. The views and opinions of third parties published in this document do not necessarily state or reflect those of CADTH.
CADTH is not responsible for any errors, omissions, injury, loss, or damage arising from or relating to the use (or misuse) of any information, statements, or conclusions contained in or implied by the contents of this document or any of the source materials.
This document may contain links to third-party websites. CADTH does not have control over the content of such sites. Use of third-party sites is governed by the third-party website owners’ own terms and conditions set out for such sites. CADTH does not make any guarantee with respect to any information contained on such third-party sites and CADTH is not responsible for any injury, loss, or damage suffered as a result of using such third-party sites. CADTH has no responsibility for the collection, use, and disclosure of personal information by third-party sites.
Subject to the aforementioned limitations, the views expressed herein are those of CADTH and do not necessarily represent the views of Canada’s federal, provincial, or territorial governments or any third-party supplier of information.
This document is prepared and intended for use in the context of the Canadian health care system. The use of this document outside of Canada is done so at the user’s own risk.
This disclaimer and any questions or matters of any nature arising from or relating to the content or use (or misuse) of this document will be governed by and interpreted in accordance with the laws of the Province of Ontario and the laws of Canada applicable therein, and all proceedings shall be subject to the exclusive jurisdiction of the courts of the Province of Ontario, Canada.
The copyright and other intellectual property rights in this document are owned by CADTH and its licensors. These rights are protected by the Canadian Copyright Act and other national and international laws and agreements. Users are permitted to make copies of this document for non-commercial purposes only, provided it is not modified when reproduced and appropriate credit is given to CADTH and its licensors.
About CADTH: CADTH is an independent, not-for-profit organization responsible for providing Canada’s health care decision-makers with objective evidence to help make informed decisions about the optimal use of drugs, medical devices, diagnostics, and procedures in our health care system.
Funding: CADTH receives funding from Canada’s federal, provincial, and territorial governments, with the exception of Quebec.
Questions or requests for information about this report can be directed to Requests@CADTH.ca