CADTH Health Technology Review
Real-Time Continuous Glucose Monitoring for People Living With Type 1 Diabetes
Rapid Review
Authors: Angela M. Barbara, Aleksandra Grobelna
Abbreviations
ICER
incremental cost-effectiveness ratio
NICE
National Institute for Health and Care Excellence
QALY
quality-adjusted life-year
RCT
randomized controlled trial
rtCGM
real-time continuous glucose monitoring
SMBG
self-monitoring of blood glucose
Key Messages
Continuous glucose monitoring (CGM) is a method of glucose testing in which a sensor is inserted into the skin and continuously monitors interstitial glucose concentrations. Real-time continuous glucose monitoring (rtCGM) systems automatically measure glucose and display a recent glucose value.
Evidence suggests that rtCGM may improve hemoglobin A1C and time in range in adults and pediatric patients with type 1 diabetes, but this is uncertain.
Limited evidence suggests that in people with type 1 diabetes, there is little to no difference between rtCGM and self-monitoring of blood glucose (SMBG) on quality of life, diabetic ketoacidosis, and severe adverse events.
Safety evidence suggests that rtCGM may decrease severe hypoglycemia in adults and pediatric patients with type 1 diabetes, but this is uncertain.
rtCGM may be more cost-effective in the long term than SMBG in adults with type 1 diabetes.
Context and Policy Issues
Diabetes is a chronic condition in which the body is not able to produce enough insulin and/or properly use insulin.1 The body needs insulin to use sugar as an energy source.1 Type 1 diabetes is an autoimmune condition in which the insulin-producing beta cells of the pancreas are destroyed by the immune system.1 Type 1 diabetes is often diagnosed in childhood and common presenting symptoms include frequent urination, excessive thirst, weight loss, and diabetic ketoacidosis (a potentially life-threatening complication of diabetes in which acids called ketones build up to dangerous levels in the body).2,3 In addition, hypoglycemia-related changes can have a negative impact on the quality of life of people with type 1 diabetes and lead to hypoglycemia fears.4 Approximately 300,000 Canadians have type 1 diabetes.5 The most common type of diabetes in children and youth is type 1,6 accounting for at least 85% of diabetes cases in patients younger than 20 years of age.5
All people living with type 1 diabetes need to take insulin to keep blood glucose levels within the target range.1,7 There are many ways insulin therapy can be delivered, including multiple daily injections and insulin pumps.7 Blood glucose monitoring is used in combination with insulin therapy to adjust insulin doses and maintain glucose control.8 The traditional method for blood glucose monitoring is SMBG using a glucometer (also called intermittent capillary blood glucose monitoring).9 SMBG requires a fingerstick to take a blood sample, which can be painful and time-consuming.10 Some people living with diabetes find it difficult to practice SMBG at the recommended rates (e.g., 6 to 10 times per day).8 Additionally, nocturnal or asymptomatic hypoglycemia (low blood glucose) may not be recognized through SMBG.10 Severe hypoglycemia can lead to coma or death.10
The management of type 1 diabetes poses some specific problems in pediatric populations, who are more exposed to the risk of both severe hypoglycemia and diabetic ketoacidosis.11,12 Also, children have reduced abilities of self-adjusting insulin doses based on current glucose.11,12 Adolescents also face distinctive challenges, including lower engagement of diabetes self-management, adjustment to the demands of diabetes treatment, and psychological burden of living with diabetes during this developmental period of their lives.11-14
CGM systems continuously measure glucose concentration in the interstitial fluid and transfer the data to a receiver that displays the results.10 These devices represent an alternative to SMBG for people living with type 1 diabetes. CGM systems typically consist of 3 components: a sensor inserted into the deepest layer of the skin, a transmitter that is attached to the sensor, and a receiver (monitor or smartphone) that displays the results.10,15 There are several types of CGM systems, including personal-use CGM or rtCGM, which measures glucose values and automatically displays a recent value.10 rtCGM systems have the capability for alerts and alarms for current and/or impending glycemic events, such as hyperglycemia or hypoglycemia.16 Some of the older rtCGM systems (e.g., Dexcom G5) require daily calibration with SMBG, whereas newer devices (e.g., Dexcom G6) do not.14,16 The rtCGM sensor application site is typically the abdomen or gluteus area.10,17
Diabetes is regarded as a burdensome disease for health care systems because of the time and resource costs related to the management of diabetes and its complications.5 The direct cost to the Canadian health care system for type 1 and type 2 diabetes was $3.8 million in 2020 and is estimated to climb to $4.9 million in 2030.18 The financial burden of rtCGM use in type 1 diabetes in patients is also high.19 Many Canadians with diabetes pay more than 3% of their income, or more than $1,500 per year, for prescribed medications, devices, and supplies; these out-of-pocket costs affect treatment adherence.18 A retrospective cohort study using US national administrative claims data20 reported that rtCGM use was associated with higher medical and pharmacy costs compared to SMBG use by adult patients with type 1 diabetes. However, it is important to consider the costs relative to the benefits.
The aim of this report is to summarize the evidence regarding the clinical effectiveness and cost-effectiveness of monitoring glycemia with rtCGM versus SMBG in people living with type 1 diabetes.
Research Questions
What is the clinical effectiveness of monitoring glycemia with rtCGM for adults living with type 1 diabetes?
What is the clinical effectiveness of monitoring glycemia with rtCGM for pediatric patients living with type 1 diabetes?
What is the cost-effectiveness of monitoring glycemia with rtCGM for people living with type 1 diabetes?
Methods
Literature Search Methods
A limited literature search was conducted by an information specialist on key resources including MEDLINE, Embase, the Cochrane Database of Systematic Reviews, the International HTA Database, and the websites of Canadian and major international health technology agencies, as well as a focused internet search. The search strategy comprised both controlled vocabulary, such as the National Library of Medicine’s MeSH (Medical Subject Headings), and keywords. The main search concepts were continuous glucose monitoring (CGM), real-time continuous glucose monitoring (rtCGM), and type 1 diabetes. No filters were applied to limit the retrieval by study type. Comments, newspaper articles, editorials, letters, and conference abstracts were excluded.
Where possible, retrieval was limited to the human population. The search was completed on July 12, 2022, and was limited to English-language documents published since January 1, 2017.
Selection Criteria and Methods
One reviewer screened citations and selected studies. In the first level of screening, titles and abstracts were reviewed and potentially relevant articles were retrieved and assessed for inclusion. The final selection of full-text articles was based on the inclusion criteria presented in Table 1.
Criteria | Description |
|---|---|
Population | Q1: Adults (ages 18+) living with type 1 diabetes Q2: Pediatric patients (ages < 18) living with type 1 diabetes Q3: People living with type 1 diabetes |
Intervention | rtCGM |
Comparator | Q1 to Q3: SMBG meter |
Outcomes | Q1 and Q2: Clinical effectiveness (e.g., hemoglobin A1C, glucose time in range metrics [e.g., time spent in target glucose ranges], glucose variability, quality of life, safety [e.g., hypoglycemia events, device-related adverse events, hospitalizations]) Q3: Cost-effectiveness (e.g., cost per quality-adjusted life-years [QALYs] gained [incremental cost-effectiveness ratio], cost per adverse event avoided) |
Study designs | Health technology assessments, systematic reviews, randomized controlled trials (RCTs), economic evaluations |
Exclusion Criteria
Articles were excluded if they did not meet the selection criteria outlined in Table 1, they were duplicate publications, or they were published before 2020. Studies that focused on pregnant people living with type 1 diabetes were excluded. Systematic reviews in which all relevant studies were captured in other more recent or more comprehensive systematic reviews were excluded. Reports of primary studies retrieved by the search were excluded if they were captured in 1 or more included systematic review. Systematic reviews were excluded if results of all primary studies were fully captured in 1 or more included systematic reviews.
Critical Appraisal of Individual Studies
The included publications were critically appraised by 1 reviewer using the following tools as a guide: A MeaSurement Tool to Assess systematic Reviews 2 (AMSTAR 2)21 for systematic reviews, the Downs and Black checklist22 for randomized studies, and the Drummond checklist23 for economic evaluations. Summary scores were not calculated for the included studies; rather, the strengths and limitations of each included publication were described narratively.
Summary of Evidence
Quantity of Research Available
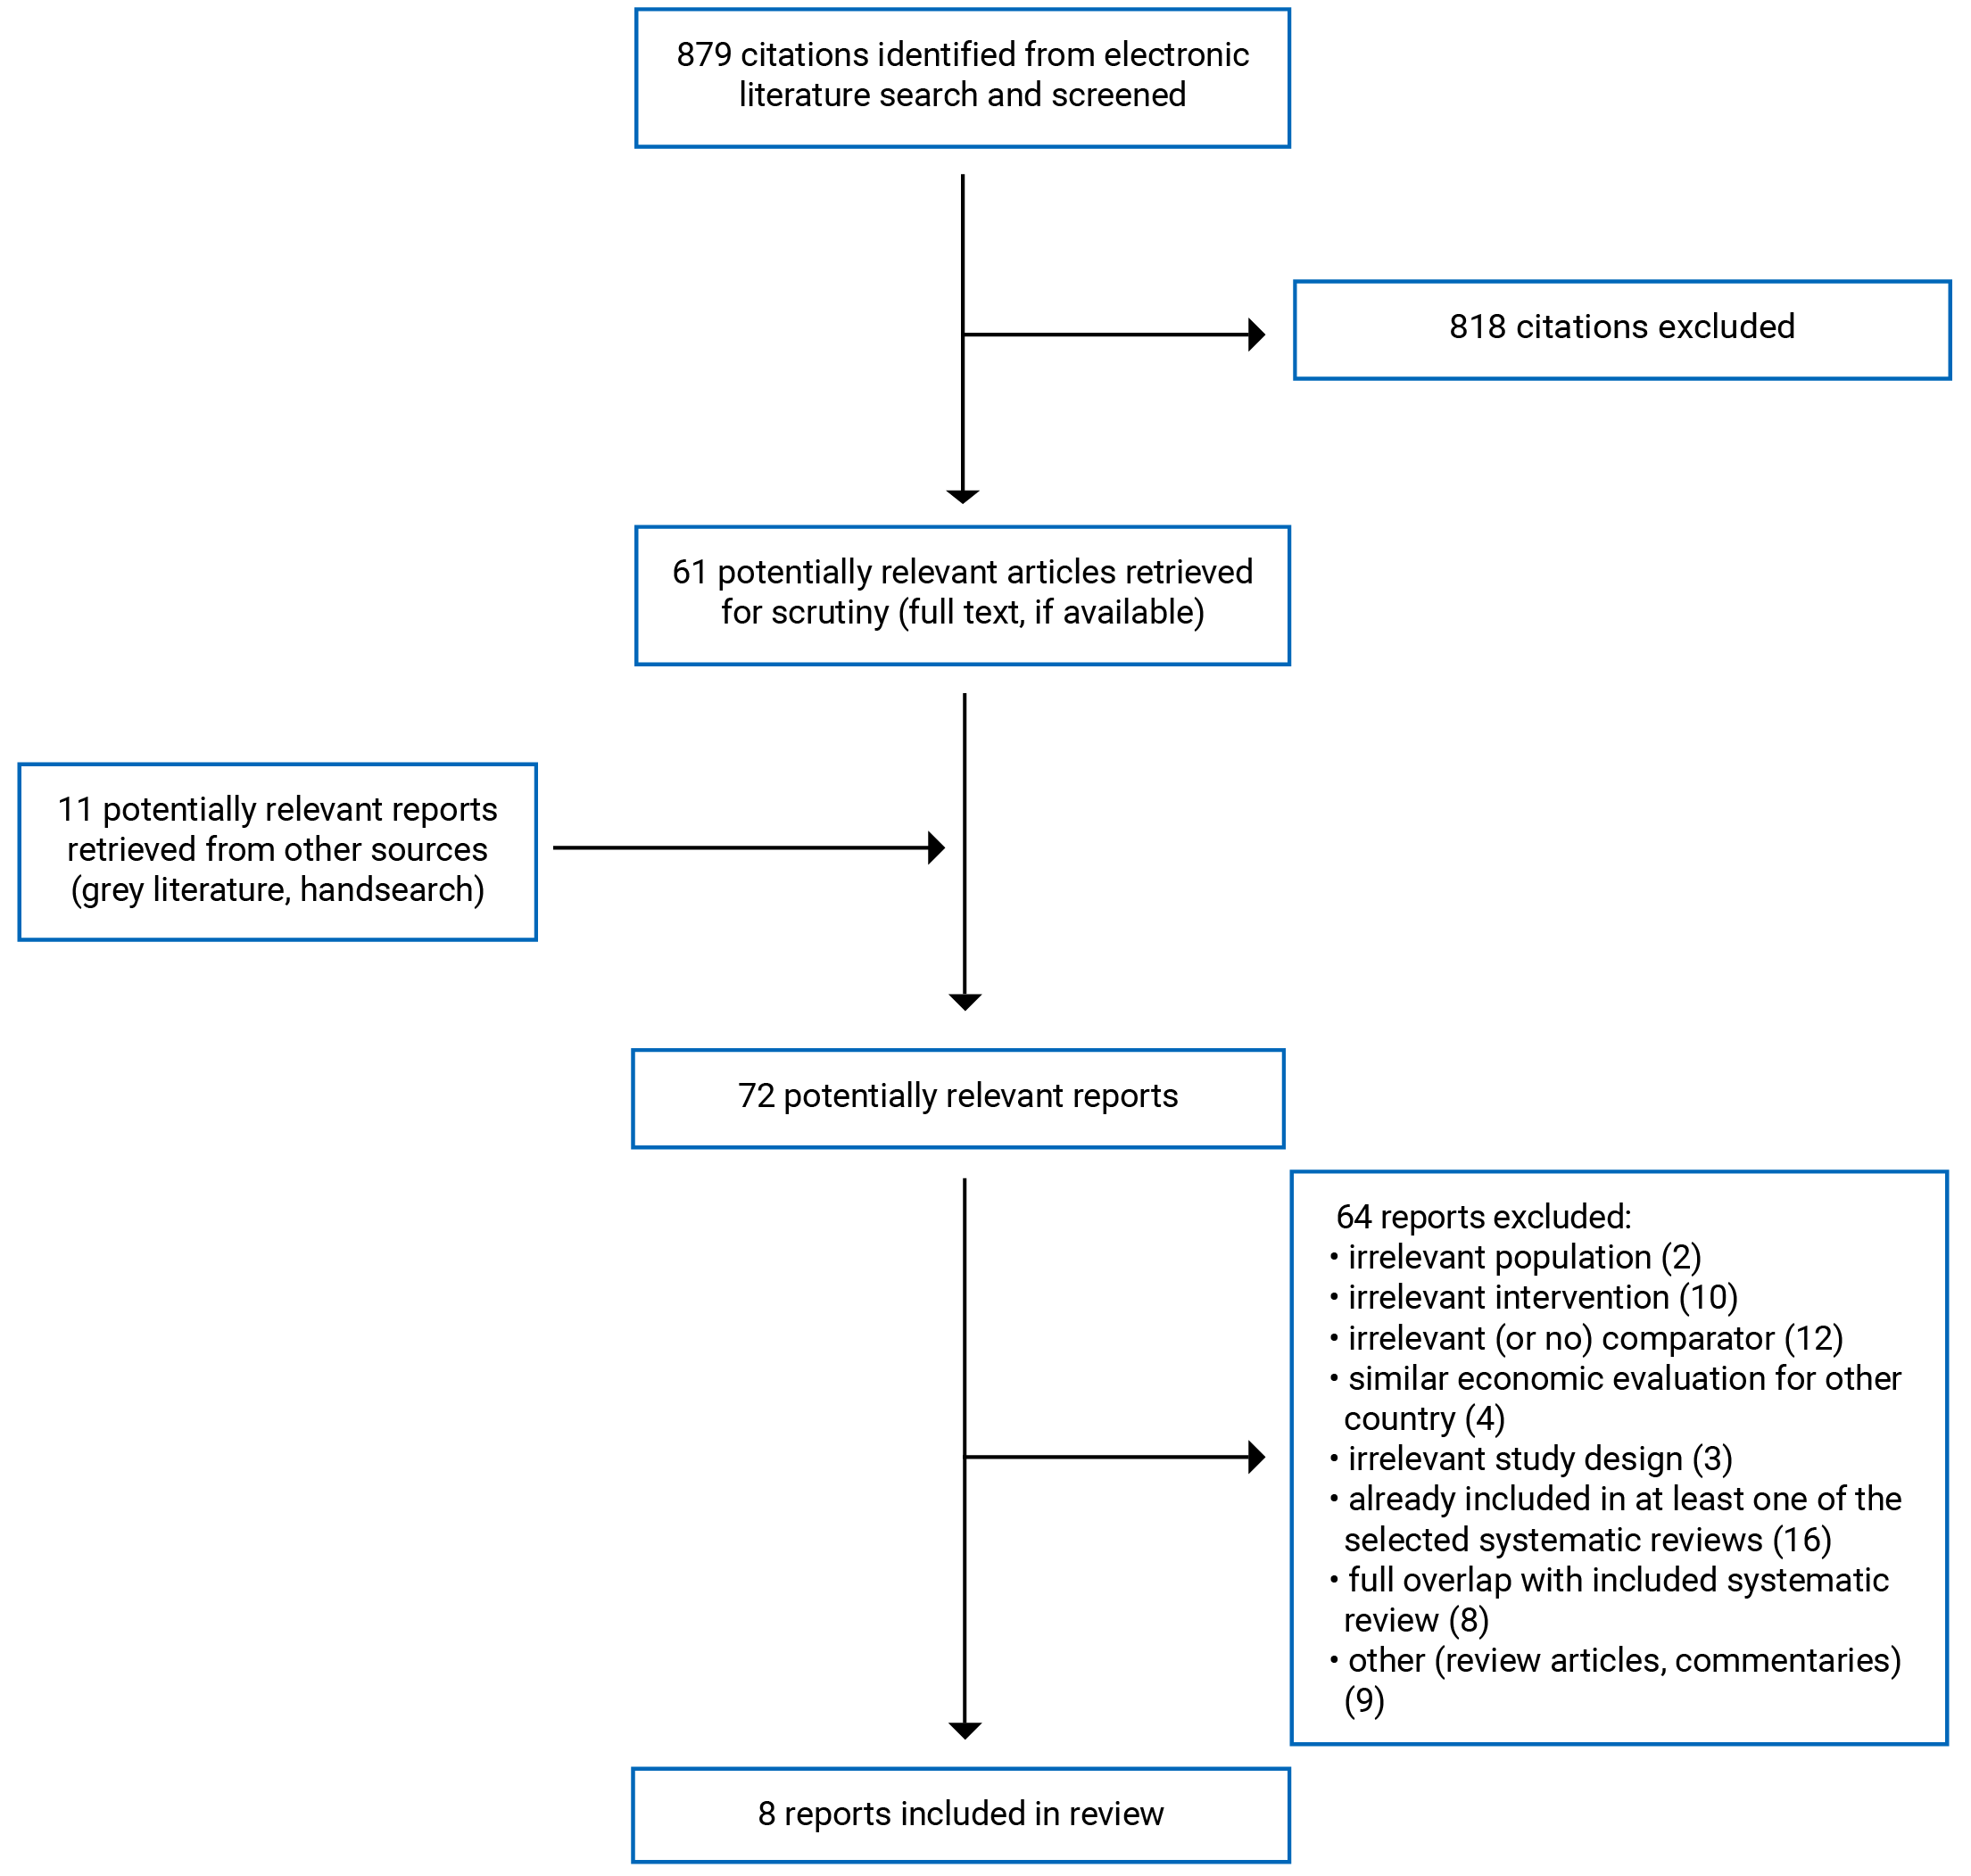
A total of 879 citations were identified in the literature search. Following screening of titles and abstracts, 818 citations were excluded and 61 potentially relevant reports from the electronic search were retrieved for full-text review. Eleven potentially relevant publications were retrieved from the grey literature search for full-text review. Of these 72 potentially relevant articles, 64 publications were excluded for various reasons, and 8 publications met the inclusion criteria and were included in this report. These comprised 5 systematic reviews, 1 RCT, and 2 economic evaluations. Appendix 1 presents the Preferred Reporting Items for Systematic Reviews and Meta-Analyses (PRISMA)24 flow chart of the study selection.
There were 4 economic evaluations25-28 that used the same approach and source data to assess the cost-effectiveness of rtCGM versus SMBG in people with type 1 diabetes, but in 4 different countries: Canada,25 Australia,26 France,27 and the UK.9,28, The cost-utility analyses in the 4 economic evaluations25-28 had comparable findings and made similar conclusions. Therefore, we included the Canadian-specific cost-utility analysis25 and excluded the other reports.9,26-28
References of potential interest that did not meet the inclusion criteria but provided real-world evidence about the use or implementation of rtCGM for people living with type 1 diabetes are included in Appendix 6. Additional references of potential interest are provided in Appendix 7.
Summary of Study Characteristics
Five systematic reviews,9,11,29-31 1 RCT,14 and 2 economic evaluations25,32 were included in this report.
The 5 systematic reviews9,11,29-31 had broader inclusion criteria than the present review. One systematic review reported primary studies of both adult and pediatric populations with type 1 diabetes;11 these studies were only included if the data were reported separately for adult and pediatric subgroups. All 5 systematic reviews9,11,29-31 also assessed other interventions (e.g., intermittently scanned CGM or flash glucose monitoring). Four systematic reviews9,11,29,30 also included studies with other comparators or no comparison group. Only the subset of primary studies meeting our inclusion criteria is presented here.
There were 2 systematic reviews by the National Institute for Health and Care Excellence (NICE)9,31 that assessed both clinical effectiveness and cost-effectiveness: 1 systematic review of adults9 and 1 systematic review of children and young adults under the age of 18 years.31 Thirteen primary RCTs of clinical effectiveness from the NICE systematic review in adults with type 1 diabetes9 were relevant to the current report. However, neither of the 2 economic evaluations in adults with type 1 diabetes included in the systematic review were relevant.9 In the NICE systematic review in pediatric populations,31 5 primary RCTs of clinical effectiveness were relevant to the current report;31 however, no economic evaluations in children and young people with type 1 diabetes were identified in this systematic review.31
There was some overlap in the primary studies included in the systematic reviews and the degree of overlap is summarized in Appendix 5.
Study Design
Of the 5 systematic reviews,9,11,29-31 4 included meta-analyses.9,11,30,31 The relevant primary studies included in the systematic reviews were parallel or crossover RCTs, and ranged in number between 5 and 13 RCTs. The latest literature search dates were between June 2019 and May 2021.
The RCT14 was an open-label, crossover study conducted at 2 hospitals. Participants were assigned to rtCGM or SMBG in random order for 8 weeks, followed by a 3- to 4-week washout period. During the SMBG period, blinded CGM was worn by each participant for 10 days at the start, week 4, and week 7 of the control period.
Two economic evaluations25,32 with cost-utility analyses and lifetime time horizons were included. Both economic analyses25,32 were performed using the IQVIA CORE Diabetes Model,33 which is a lifetime Markov simulation model predicting the progression of diabetes over time using a series of interlinked and interdependent Markov sub-models for diabetes-related complications (e.g., long-term cardiovascular, ophthalmic, and renal complications; peripheral neuropathy; foot ulcers; amputation; or acute events, including hypoglycemic events). The model was previously validated against epidemiological and clinical studies of type 1 diabetes. Outputs provided by the model include life expectancy, quality-adjusted life expectancy, cumulative incidence of long-term complications, direct and indirect costs, and the incremental cost-effectiveness ratio (ICER).
The NICE economic evaluation32 took a UK health care payer perspective and used data from a UK-based RCT. The other economic evaluation25 took a Canadian health care payer perspective and took data from a US-based RCT.
Country of Origin
The first authors of the systematic reviews were from England,9,31 Italy,11,29 and Poland.30 The primary studies in 4 systematic reviews9,29-31 that were relevant to this report were conducted in Australia, Europe, France, Germany, Israel, Slovenia, Sweden, the Netherlands, the UK, and the US. The systematic review by Dicembrini et al.11 did not report where the included RCTs were conducted.
The authors of the RCT14 were from the UK, where the trial was conducted.
The 2 economic evaluations25,32 had first authors from France25 and the UK.32
Patient Population
Two systematic reviews9,30 included adults with type 1 diabetes. The number of adults in individual studies included in these systematic reviews ranged from 20 to 285.9,30 The range of mean ages were between 42 and 71 years in the 2 systematic reviews.9,30 The mean duration of the disease ranged from 12 to 38 years.9,30 The baseline glycated hemoglobin A1C ranged between 7.0% and 11%.9,30 Between 45% and 64% of participants were female in the primary studies included in the 2 systematic reviews.9,30
Two systematic reviews included pediatric populations with type 1 diabetes29,31 The number of participants in individual studies included in these systematic reviews ranged from 30 patients to 434 patients and parents or caregivers.29,31 Ages ranged between 2 and 24 years in the 2 systematic reviews.29,31 Baseline hemoglobin A1C levels ranged between 7.0% and 10.9%.29,31
One systematic review11 included both adult and pediatric patients living with type 1 diabetes. The number of participants in the individual studies included in this systematic review ranged from 15 to 322. The mean ages ranged between 7 and 49 years. The mean duration of disease ranged from 0 to 30 years; baseline hemoglobin A1C ranged between 52 and 100 mmol/mol.11
The RCT14 included young people from the ages of 16 to 24 years. The mean age was older than 18 years (21.2 years); therefore, the outcome data for this study was reported as part of the adult population. The mean hemoglobin A1C at screening was 9.3% (78.4 mmol/mol). Sixty-five percent self-identified as White British, and 58% lived in areas of relatively high deprivation. Fifty-four percent of participants were female.14
Patients in the NICE economic evaluation32 were a simulated cohort of adults with type 1 diabetes based on a UK cluster trial.34 The mean age was 47 years and the mean duration of diabetes was 21 years. The mean baseline hemoglobin A1C was 9.1% and the cohort was 43% female.32 Patients in Canadian economic evaluation25 were a simulated cohort of adults with type 1 diabetes based on the RCT by Beck et al. (2017).9,11,35 Patients were aged 25 years or older and treated with multiple daily injections of insulin for at least 1 year before entering the trial. The mean baseline hemoglobin A1C was assumed to be 8.6% (70 mmol/mol).25
Interventions and Comparators
For all clinical effectiveness and cost-effectiveness outcomes, the comparison was rtCGM versus SMBG.
The devices used for rtCGM in the systematic reviews were the Abbott Navigator,11 Dexcom G4,11 Dexcom G5,31 Dexcom G7,11 Dexcom Seven,31 FreeStyle Navigator,31 Medtronic Enlite,11 Medtronic Guardian,11,31 Medtronic MiniMed,31 and a mix of devices.11 The RCT14 evaluated Dexcom G6 rtCGM.
The duration of treatment with the intervention and comparator ranged from 3 to 24 months in the systematic reviews,9,11,29-31 and 8 weeks in the RCT.14
The NICE economic evaluation32 assessed the cost effectiveness of the Dexcom G6 rtCGM system compared to usual care with SMBG. The Canadian economic evaluation25 examined the cost effectiveness of the Dexcom G4 rtCGM system compared to SMBG.
Outcomes
The clinical effectiveness outcomes reported in the selected systematic reviews included hemoglobin A1C,9,11,30,31 quality of life,9,29-31 glucose time in range,9,31 time below range or time in hypoglycemia,9 time above range or time in hyperglycemia,9,31 glucose variability,9 and adverse events.9,11,29,31
The outcomes reported by the RCT14 were hemoglobin A1C, glucose time in range metrics, glucose monitoring satisfaction, and diabetes distress.
In 2 systematic reviews9,31 and the included RCT,14 time in target range was defined as a sensor glucose of 70 to 180 mg/dL (3.9 to 10.0 mmol/L). This clinical target was proposed as a specific outcome measure to compliment hemoglobin A1C by the Advanced Technologies and Treatments for Diabetes Congress in 2019.36 Time spent below target glucose range was below 70 mg/dL (< 3.9 mmol/L)9,14 and time spent above target glucose range was above 180 mg/dL (> 10.0 mmol/L).9,14,31
Glucose variability, characterized by the amplitude, frequency, and duration of fluctuations in blood glucose,37 was expressed as coefficient of variation (CV) in 1 systematic review31 and the RCT.14 The CV is a measure of short-term within-day variability; generally, a value less than 36% defines stability, whereas a value greater than 36% reflects instability with significantly increased risk of hypoglycemia.37
Quality of life was assessed with multiple validated self-assessment tools. For pediatric populations, these tools were completed by the participants (children or youth) and/or their parents or caregivers.29 Health-related quality of life measures included the WHO-5 Well-Being Index9,11,29,30 and Short Form Health Survey9 The Social Functioning Health Survey included a mental component and a physical component.9,29 The EuroQol-5D health utility instrument assessed participants’ current health status in specific dimensions such as mobility, pain, social functioning, and ability to self-care.11
The Pediatric Quality of Life Inventory had 3 modules: generic core scales, a diabetes-specific module, and a family impact module, which measured parent health-related quality of life and family functioning.11,29,31 Other diabetes-specific measures included the Diabetes Family Conflict Scale29 and the Diabetes Worry Scale,29
The Hypoglycemia Confidence Scale included common situations where hypoglycemia occurs (e.g., physical activity, driving) and evaluates the degree to which patients feel able, secure, and comfortable about their ability to stay safe from hypoglycemic-related problems.29,30 Problem Areas in Diabetes assessed psychosocial adjustments related to diabetes, and included questions about anger, interpersonal distress, and frustration with diabetes treatment.9,11,29,30 The Diabetes Distress Scale measured diabetes-related concerns about powerlessness, management, hypoglycemia, social perceptions, eating, physicians, and friends and family.9,14,29,30 The Hypoglycemia Fear Survey consisted of a Worry subscale that measured anxiety and fear surrounding hypoglycemia and a Behaviour subscale that measured behaviours involved in avoidance and over-treatment of hypoglycemia.9,11,29,30 Hypoglycemia awareness was assessed using the Clarke hypoglycemic unawareness scale9 and Gold score.9 The Gold method poses the question “Do you know when your hypos are commencing?” The respondent then completes a 7-point Likert scale (1 = “always aware” to 7 = “never aware”). A score of 4 or higher implies impaired awareness of hypoglycemia.9 The Diabetes Self-Management Profile is a validated interview assessing 5 areas of diabetes self-management: exercise, hypoglycemia, diet, blood glucose testing, and insulin.29
The Diabetes Treatment Satisfaction Questionnaire was a measure of treatment satisfaction, as well as perceived frequency of hyperglycemic and hypoglycemic episodes.9,11,30 The Glucose Monitoring System Satisfaction Survey assessed device satisfaction and quality of life.14 The CGM Satisfaction questionnaire assessed satisfaction with and perceived therapeutic impact of CGM.29
Adverse events included severe hypoglycemia,9,11,14,31 diabetic ketoacidosis,14,31 severe adverse events,9,31 and hospitalizations.9 Severe hypoglycemia was defined as occurring when glucose levels fall below 3.9 mmol/L,31 loss of consciousness from hypoglycemia,14 or hypoglycemia requiring hospitalization and/or third-party assistance.9,11,14
Outcomes in the 2 economic evaluations25,32 were direct medical costs for treatment, health care, and complications; quality of life; reduction in hemoglobin A1C levels; fear of hypoglycemia; severe hypoglycemic events; and other adverse events. Outcomes were also reported for incremental costs. Incremental costs, incremental QALYs, and ICERs were also reported.25,32
Additional details regarding the characteristics of included publications are provided in Appendix 2.
Summary of Critical Appraisal
An overview of the critical appraisal of the included publications is summarized in the following text. Additional details regarding the strengths and limitations of the included publications are provided in Appendix 3.
Systematic Reviews
In all 5 systematic reviews,9,11,29-31 the review objective was clearly stated, a literature search was conducted using multiple databases, a list of the included primary studies was presented, and the characteristics of the included studies were described. Providing details of the literature search strategy increases the reproducibility of the review. All 5 systematic reviews9,11,29-31 also presented a PRISMA flow diagram showing the progress of studies through the review. Four systematic reviews9,11,30,31 registered their study protocol in PROSPERO. One systematic review29 did not report whether a protocol had been published before the conduct of the review; therefore, it is unknown whether any significant protocol deviations occurred that may impact the interpretation of the findings of this systematic review.
Study selection and data extraction were done independently by 2 reviewers in 1 systematic review.30 Two systematic reviews9,31 only reported on title and abstract screening, but did not report the approach for full-text screening or data extraction. Two systematic reviews11,29 did not report how study selection was performed, but did report that data extraction was performed independently by 2 reviewers. Therefore, the potential for errors in selection and data abstraction cannot be ruled out in these reviews. A list of excluded studies was presented in 3 systematic reviews,9,30,31 but not in the other 2 systematic reviews.11,29 In the absence of justifications for excluding studies, it is unclear if the selection process captured all the relevant studies.
Four systematic reviews9,11,30,31 used the Cochrane Risk of Bias tool to assess risk of bias in individual RCTs. The Cochrane tool has been shown to be valid and reliable, and is a frequently used tool for assessing methodological quality and risk of bias. The systematic review by Franceschini et al. 29 assessed the risk of bias in primary studies as recommended by the GRADE (Grading of Recommendations Assessment, Development and Evaluation) approach, but did not report which tool was used.29
Meta-analyses were conducted in 4 systematic reviews9,11,30,31 and were appropriate. Conflicts of interest were reported by all systematic review authors.9,29-31
RCT
The included RCT14 clearly reported the objective, interventions, and findings. The authors described the randomization method and reported baseline characteristics of all randomized participants, including those who dropped out. The participants were recruited at the same site over the same time, and the treatment site was likely representative of typical care. However, it is unclear if the participants were representative of the population due to the relatively small sample size.
The main outcome was assessed with appropriate statistical tests.14 Blinding was not feasible for them due to the nature of the intervention. However, the lack of blinding is unlikely to significantly affect objective outcomes such as hemoglobin A1C or glucose time in range; a potential exists for performance bias of subjective outcomes, such as self-reported diabetes distress and glucose monitoring satisfaction.
Sample size calculation was conducted based on time in target range, and the required sample size was achieved at the desired 80% power to detect differences in treatment effect between the study periods.14 From the 31 recruited participants, 1 withdrew before randomization and 1 lost contact during the control phase (SMBG) of the study.14
The authors14 reported that the funding sponsor of the study was the manufacturer of the rtCGM device being evaluated. While the role of the funder in the study was reported (i.e., read the manuscript before submission, but had no role in the study design, data collection, data analysis, data interpretation, or writing of the report), it remains unclear whether this affected the study conduct. The authors also report their conflicts of interest.14
Economic Evaluations
Strengths of the economic evaluations25,32 were clear descriptions of the research question, economic importance, outcomes, viewpoint, model used, time horizon, and discount rate. Authors also described the relevant alternatives, sources for effectiveness data, and the patients that the valuations were derived from. They also described their sensitivity analysis approach and presented major outcomes in disaggregated and aggregated forms.25,32
The NICE economic evaluation32 was based on a UK health care payer perspective and used data from 1 UK-based trial; therefore it is unclear whether the findings are relevant to the Canadian context. The authors of the Canadian economic evaluation25 declared that the study received funding from Dexcom Inc.; therefore, it is unclear whether this affected the conduct of the study and interpretation of its findings.
Additional details regarding the strengths and limitations of included publications are provided in Appendix 3.
Summary of Findings
The main findings from the included systematic reviews are summarized in the following sections and Appendix 4. There was some overlap in the primary studies that were included in the systematic reviews. Therefore, to avoid duplication of reporting, outcome data from an individual RCT was reported only once as part of 1 systematic review. If study outcomes were included in 1 of the meta-analyses,9 they are reported only in the pooled estimates (and not the individual study level results). In the systematic review by Dicembrini et al.,11 only outcome data from the separate meta-analyses of subgroups by age (adult versus pediatric) were included in this report. Analyses of studies with mixed populations (both adult and pediatric patients) were excluded. A citation matrix illustrating the degree of overlap is presented in Appendix 5.
Appendix 4 presents the main study findings and authors’ conclusions.
Clinical Effectiveness of rtCGM Versus SMBG for Adults With Type 1 Diabetes
Evidence regarding the clinical effectiveness of rtCGM versus SMBG for adults with type 1 diabetes was available from 3 systematic reviews9,11,30 and 1 crossover RCT.14 Clinical significance was based on reporting by the NICE systematic review authors9,31 about their findings.
Hemoglobin A1C
Findings from the NICE meta-analysis9 and RCT14 suggested that hemoglobin A1C was significantly lower with rtCGM versus SMBG in adults with type 1 diabetes followed for up to 6 months. However, there was no statistically significant difference in hemoglobin A1C at shorter durations (≤ 3 months) or when measured as mmol/mol in the NICE review.9 In 2 systematic reviews,11,30 2 RCTs suggested a statistically significant difference in hemoglobin A1C in favour of rtCGM versus SMBG in adults with type 1 diabetes, while 3 other RCTs found no statistically significant difference between rtCGM and SMBG in hemoglobin A1C.
Time in Range
In both the NICE meta-analysis9 and RCT14 there was a statistically and clinically significant difference in time in range (70 to 180 mg/dL or 3.9 to 10.0 mmol/L) in favour of rtCGM versus SMBG in adults with type 1 diabetes.
Time Below Range or Time in Hypoglycemia
The NICE meta-analysis9 and RCT14 reported a statistically significant difference in time below range (< 70 mg/dL or < 3.9 mmol/L) in favour of rtCGM versus SMBG in adults with type 1 diabetes.
Time Above Range or Time in Hyperglycemia
In the NICE meta-analysis9 and RCT14 there was also a statistically significant difference in time above range (> 180 mg/dL or > 10.0 mmol/L) in favour of rtCGM compared to SMBG in adults with type 1 diabetes. However, the authors of the NICE meta-analysis9 reported that there was no clinically meaningful difference.
Glucose Variability
Results of the NICE meta-analysis9 suggested there was a statistically significant effect in glucose variability at up to 6 months, as measured by CV, in favour of rtCGM versus SMBG in adults with type 1 diabetes. However, results of the RCT14 reported a statistically significant increase in glucose variability at 8 weeks with rtCGM compared to SMBG (favouring SMBG) in older adults.
Quality of Life
Results from 3 systematic reviews9,11,30 and the RCT14 suggested no significant differences on the Diabetes Distress Scale, Hypoglycemia Fear Survey, Problem Area in Diabetes Scale, WHO-5 Well-Being Index, and Short Form Health Survey between rtCGM and SMBG in adults with type 1 diabetes. However, 1 RCT in the systematic review by Klak et al. 30 did report a statistically significant and medium effect size on fear of hypoglycemia.
Hypoglycemic awareness (as measured by the Clarke score, but not the Gold score) in the NICE meta-analysis9 was statistically significantly lower in the rtCGM group compared to the SMBG group. However, the authors concluded that there was no clinically meaningful difference.9 In the systematic review by Klak et al., 30 1 RCT analyzed the Hypoglycemic Confidence Questionnaire and reported statistically better scores in the rtCGM group compared with the SMBG group.
Results of the RCT14 indicated greater satisfaction with rtCGM compared to SMBG in young adults with type 1 diabetes. In 2 systematic reviews (3 RCTs),9,11 satisfaction with rtCGM use was high in adults with type 1 diabetes, but there was no statistically significant difference between rtCGM and SMBG. The RCT by Beck et al.11 reported high scores on the CGM Satisfaction Survey for the rtCGM group (mean = 4.2; standard deviation [SD] = 0.4), but did not report satisfaction scores for the SMBG group.
Safety
Results from the NICE systematic review9 suggested there was a statistically and clinically significant decrease in severe hypoglycemia with rtCGM compared to SMBG in adults with type 1 diabetes. Results from 1 RCT in the systematic review by Dicembrini et al. 11 also reported a statistically significant difference in severe hypoglycemia in favour of rtCGM compared to SMBG. However, another RCT in the same systematic review11 found no significant difference in severe hypoglycemia between groups. Results from the NICE systematic review9 suggested that there were no significant differences in diabetic ketoacidosis in rtCGM versus SMBG in adults with type 1 diabetes. No participants in the RCT14 experienced severe hypoglycemia or diabetic ketoacidosis during the rtCGM and SMBG periods.
The NICE systematic review9 reported significantly fewer hypoglycemia events with rtCGM compared to SMBG in adults with type 1 diabetes. However, because the confidence limits were smaller than the minimally important differences in both directions, the authors stated that the evidence demonstrates that there was no meaningful difference.9 The NICE systematic review9 also reported a statistically and clinically significant effect on nocturnal hypoglycemia in favour of rtCGM versus SMBG in adults with type 1 diabetes.
One RCT in the NICE systematic review9 reported no significant difference in hospitalization between rtCGM and SMBG. Another RCT in the NICE systematic review9 reported no significant difference in severe adverse events between rtCGM and SMBG. The RCT by Thabit et al.14 reported 3 adverse events during the rtCGM period and 5 adverse events in the SMBG periods. The adverse events (reported during the rtCGM phase of the RCT14) were gastroenteritis, ketonemia related to missed basal insulin injection, and a fractured foot.
Clinical Effectiveness of rtCGM Versus SMBG for Pediatric Patients With Type 1 Diabetes
Evidence regarding the clinical effectiveness of rtCGM versus SMBG for pediatric populations with type 1 diabetes was available from 3 systematic reviews.11,29,31
Hemoglobin A1C
Results from the NICE systematic review31 suggested that mean hemoglobin A1C was significantly lower with rtCGM versus SMBG. However, while the results of the dichotomous hemoglobin A1C outcomes (relative reduction at > 10% or ≥ 5%) were considered clinically meaningful (according to the study authors), there was no clinically meaningful difference on continuous outcome (mmol/mol).31 There were no statistically significant differences on continuous measure hemoglobin A1C between the rtCGM group and SMBG group in the meta-analysis by Dicembrini et al..11
Time in Range
In 1 relevant RCT in the NICE systematic review,31 there was a statistically significant difference in time in range (70 to 180 mg/dL) in favour of rtCGM versus SMBG in children and young people with type 1 diabetes.
Time Below Range or Time in Hypoglycemia
No relevant evidence regarding the rtCGM versus SMBG for pediatric patients with type 1 diabetes was identified; therefore, no summary can be provided.
Time Above Range or Time in Hyperglycemia
In 1 RCT in the NICE systematic review,31 there was a statistically significant difference in time above range (> 180 mg/dL) favouring rtCGM versus SMBG in children and young people with type 1 diabetes.
Glucose Variability
In 1 relevant RCT in the NICE systematic review,31 there was a statistically significant difference in glucose variability (expressed as correlation of variance) favouring rtCGM versus SMBG in children and young people with type 1 diabetes.
Quality of Life
Results from 3 systematic reviews11,29,31 suggested that there were no statistically significant differences between rtCGM versus SMBG in the Pediatric Quality of Life Inventory modules and the Problem Areas in Diabetes survey in pediatric patients with type 1 diabetes. One RCT in the NICE systematic review31 suggested a statistically significant reduction in hypoglycemia fear with rtCGM use compared to SMBG, but another RCT in the same review31 did not find a statistically significant difference. There was also evidence of statistically significant higher satisfaction scores with rtCGM compared to SMBG in 2 systematic reviews (3 RCTs).29,11
Safety
Results from the meta-analysis by Dicembrini et al.11 suggested that there were statistically significant differences in severe hypoglycemia in favour of rtCGM versus SMBG in pediatric patients with type 1 diabetes. However, 1 RCT in the NICE systematic review31 found no significant difference in severe hypoglycemia between treatment groups. Results from 2 systematic reviews11,31 suggested that there was no significant difference in diabetic ketoacidosis between rtCGM and SMBG; and 1 RCT in the NICE systematic review31 found no significant difference in severe adverse events.
Cost-Effectiveness of rtCGM Versus SMBG in People With Type 1 Diabetes
The NICE economic evaluation32 reported that rtCGM resulted in incremental costs of £22,628, with a 0.928 QALY gain compared to SMBG, resulting in an ICER of £24,436 per QALY. When the utility benefits of reduced hypoglycemia fear were included, there was a 1.388 QALY gain compared to SMBG, resulting in an ICER of £16,351 per QALY. At the willingness-to-pay threshold of £30,000 per QALY, rtCGM appeared to be cost-effective compared with SMBG. With a lower willingness-to-pay threshold of £20,000 per QALY, the probability of rtCGM being cost-effective was around 75%.
The Canadian economic evaluation25 reported that rtCGM resulted in additional direct costs of $35,353, with a 2.088 QALY gain compared to SMBG, resulting in an ICER of $16,931 per QALY gained. The likelihood of cost effectiveness at the willingness-to-pay threshold of $50,000 per QALY was 99.7%.
Limitations
None of the included primary studies on clinical effectiveness in this report9,11,14,29-31 were conducted in Canada. The systematic review by Dicembrini et al.11 did not report the countries in which the included RCTs were conducted. Access to rtCGM devices and diabetes demographics can vary significantly depending on the type of health care system a country possesses (i.e., privately versus publicly funded). Therefore, the generalizability of the findings to Canadians (and/or populations belonging to specific geographical, ethnic, or cultural groups in Canada) cannot be determined.
The findings summarized in this review are based on the way the outcomes were reported in the included publications. Four systematic reviews9,11,30 and the RCT14 evaluated hemoglobin A1C; however, the clinical significance of this outcome is uncertain. There is some evidence suggesting that hemoglobin A1C has a strong relationship with time in range.38 However, hemoglobin A1C has several limitations. Hemoglobin A1C provides the average of blood glucose readings over the prior 3 to 4 months,31 does not account for glycemic variability31,37 or glucose excursions (e.g., hyperglycemia and hypoglycemia),9,39 may be affected by factors unrelated to glycemia (e.g., conditions affecting erythrocyte turnover, iron deficiency, genetics, race, and ethnicity),37,40,41 and is unreliable in certain conditions (e.g., renal failure, anemia).37 Time in range is a measurement over a shorter time period, captures variation, and can be more directly linked to risk of complications.9,31,39,42 However, the validity of time in range as a surrogate outcome for diabetes-related complications is a complex issue, and a 2019 review43 concluded that time in range should not be considered a validated surrogate marker of diabetes-related complications due to lack of evidence.
The primary studies in the systematic reviews9,11,29-31 and the RCT14 were open-label. Unblinded studies are at an increased risk for multiple forms of bias. Due to the nature of rtCGM and SMBG, unblinded assignment to the intervention and comparison was impossible to avoid.
The RCT14 and several primary studies in 1 systematic review30 have been funded by the rtCGM device manufacturers. The other systematic reviews9,11,29,31 did not report the funding sources of the included primary studies.
Most quality of life outcomes could not be pooled or compared across primary studies in the included systematic reviews11,29,30 due to the variety of measures and heterogeneity in reporting. Therefore, results were analyzed qualitatively for each primary study. Quality of life and treatment satisfaction were often included as secondary outcomes in most primary studies and the individual studies were not powered to find significant findings.29,30 Another source of heterogeneity was the type of rtCGM device used, with possible differences in accuracy.
The quality of the evidence (as assessed by the systematic review authors)9,11,29-31 ranged from very low to high quality. For example, the quality of the evidence in the NICE meta-analysis31 of hemoglobin A1C % in adults with type 1 diabetes was graded as very low due to moderate and high risk of bias in individual studies and inconsistency across studies (high heterogeneity). The NICE systematic review of CGM in adults with type 1 diabetes31 included 2 RCTs with both adult and pediatric participants (Battelino et al. [2011]; Battelino et al. [2014]) in the meta-analyses of hemoglobin A1C, time in range metrics, severe hypoglycemia, and diabetic ketoacidosis in adults with type 1 diabetes; therefore, certainty of this evidence is affected by partial indirectness.
Because of the small sizes of most of the included primary studies, the sample sizes were insufficient to draw reliable conclusions on some comparisons.9,11,14,29-31 The duration of trials was relatively short, allowing an estimate of the effects of rtCGM in the short term but not in the long term.9,11,14,29-31 Other methodological limitations of the primary studies included limited (or lack of) information on allocation concealment, deviations from the intended interventions, use of subjective outcomes, imprecision (e.g., low number of events), incomplete outcome data, selective reporting, and unclear reporting.9,11,29-31 Any quality issues from the primary studies cause uncertainty in the findings presented in the systematic review.
In the NICE economic evaluation,32 data for some input parameters were taken from type 2 diabetes populations due to a lack of reliable type 1 diabetes data sources (e.g., impact on quality of life from long-term diabetes-related complications).32 The economic evaluation by Roze et al.25 was performed from the Canadian public payer perspective and did not capture indirect costs, such as potential decrease in productivity losses due to complications with rtCGM. In the absence of long-term longitudinal data, clinical input data from an RCT with a duration of 24 weeks was used to project long-term clinical outcomes.25 Both economic evaluations25,32 used patient cohorts with mean ages of 47 years and living with type 1 diabetes for an average of 19 to 20 years, which limits the generalizability of the findings. Results may not be generalizable to children, adolescents, parents, caregivers, or patients newly diagnosed with type 1 diabetes. No economic evaluations were identified that assessed the cost-effectiveness of monitoring glycemia with rtCGM for pediatric populations living with type 1 diabetes.
Conclusions and Implications for Decision- or Policy-Making
This report summarizes the evidence on the clinical effectiveness and cost-effectiveness of monitoring glycemia with rtCGM versus SMBG in people living with type 1 diabetes from 5 systematic reviews,9,11,29-31 1 RCT,14 and 2 economic evaluations.25,32
Overall, the evidence regarding clinical effectiveness tended to be in favour of rtCGM over SMBG for people living with type 1 diabetes. This general conclusion was supported by the authors of the publications included in this report.9,11,14,25,29-32
In adults with type 1 diabetes, the evidence was uncertain due to serious risk of bias, high heterogeneity among studies, partial indirectness, and/or imprecision. Pooled estimates from the NICE systematic review9 suggested that rtCGM may have beneficial effects on dichotomous hemoglobin A1C, but not on continuous outcomes. However, results from other systematic reviews11,30 regarding the effect of rtCGM compared to SMBG on hemoglobin A1C were mixed. Time in range outcomes were consistently in favour of rtCGM compared to SMBG, and increased more than the preset minimally important difference (> 5%).9 The results of multiple quality of life questionnaires9,11,14,30 suggested that rtCGM did not impede quality of life or increase diabetes burden compared to SMBG. However, the effect of rtCGM on fear of hypoglycemia in adults with type 1 diabetes was inconclusive.9,11,30 Satisfaction with rtCGM was high in all primary studies; however, there were no statistically significant differences between rtCGM and SMBG in adults with type 1 diabetes.9,11
Meta-analyses9,11 suggested there may be a statistically significant decrease in severe hypoglycemia with rtCGM compared to SMBG in adults with type 1 diabetes. There was also evidence that rtCGM reduced the number of hypoglycemic events experienced per week compared to SMBG; however, the authors of the systematic review9 stated that the difference between treatments was not clinically meaningful. There was no significant difference in diabetic ketoacidosis between rtCGM and SMBG in adults with type 1 diabetes.9,11
In general, the evidence in children and young people with type 1 diabetes was comparable to that in adults with type 1 diabetes. The evidence was also uncertain due to serious risk of bias, high heterogeneity among studies, partial indirectness, and/or imprecision. The findings of this report suggested positive effects of rtCGM on hemoglobin A1C, time in range, time above range, and treatment satisfaction.11,29,31 However, there were no statistically significant differences between rtCGM versus SMBG on the many measures of quality of life. There was a statistically significant decrease in severe hypoglycemia with rtCGM compared to SMBG in pediatric patients with type 1 diabetes. No significant difference between rtCGM versus SMBG on diabetic ketoacidosis or severe adverse events was found.
Overall, when an effect was found, it consistently favoured the use of rtCGM. The 1 exception was an increase in glucose variability (expressed as correlation of variance) with rtCGM compared to SMBG in the RCT.14 The study authors reported that this finding was likely explained by participants correcting high glucose levels in the rtCGM period compared with persistent underrecognized, and therefore uncorrected, high glucose levels in the control period. This finding was in contrast with the NICE meta-analysis in adults with type 1 diabetes9 and 1 RCT in the NICE systematic review in children and young people.31 Both systematic reviews31 reported a statistically significant decrease in glucose variability with rtCGM compared to SMBG. However, the evidence for adults with type 1 diabetes was uncertain due to serious risk of bias, high heterogeneity, and imprecision,31 and the evidence for children and young people was also uncertain because of partial indirectness and imprecision.31
Results from the 2 economic evaluations25,32 were consistent about the long-term cost-effectiveness in favour of rtCGM compared to SMBG. The cost-utility analysis set in Canada concluded that the rtCGM system was cost-effective relative to SMBG at a willingness-to-pay threshold of $50,000 per QALY. The NICE cost-utility analysis concluded that rtCGM was cost-effective compared to SMBG under a willingness-to-pay threshold of £30,000 per QALY.32 Both economic evaluations25,32 found that rtCGM had better cost-effectiveness at a lower threshold when incorporating reduced fear of hypoglycemia.
The limitations of the included literature should be considered when interpreting the findings of this report. Large-scale clinical trials with longer follow-up periods are required to better determine the true effect of rtCGM. Future economic evaluations conducted from Canadian perspectives may be helpful to further inform clinical and policy decisions.
References
1.Public Health Agency of Canada. Diabetes facts. 2012; https://www.canada.ca/en/public-health/services/chronic-diseases/diabetes/diabetes-facts.html. Accessed 2022 July 6.
2.DiMeglio LA, Evans-Molina C, Oram RA. Type 1 diabetes. Lancet. 2018;391(10138):2449-2462. PubMed
3.Centers for Disease Control and Prevention. Diabetic ketoacidosis. 2021; https://www.cdc.gov/diabetes/basics/diabetic-ketoacidosis.html. Accessed 2022 July 6.
4.Hermanns N, Kubiak T, Kulzer B, Haak T. Emotional changes during experimentally induced hypoglycaemia in type 1 diabetes. Biol Psychol. 2003;63(1):15-44. PubMed
5.Health Quality Ontario. Continuous monitoring of glucose for type 1 diabetes: a health technology assessment. Ont Health Technol Assess Ser. 2018;18(2):1-160. PubMed
6.Public Health Agency of Canada. Diabetes in Canada. 2017; https://www.canada.ca/en/public-health/services/publications/diseases-conditions/diabetes-canada-highlights-chronic-disease-surveillance-system.html. Accessed 2022 July 6.
7.Shah RB, Patel M, Maahs DM, Shah VN. Insulin delivery methods: past, present and future. Int J Pharm Investig. 2016;6(1):1-9. PubMed
8.McGill JB, Ahmann A. Continuous glucose monitoring with multiple daily insulin treatment: outcome studies. Diabetes Technol Ther. 2017;19(S3):S-3-S-12. PubMed
9.Type 1 diabetes in adults: diagnosis and management. [B] Evidence reviews for continuous glucose monitoring in adults with type 1 diabetes. NICE evidence reviews collection; NICE guideline NG17. London (GB): National Institute for Health and Care Excellence; 2022: https://www.nice.org.uk/guidance/ng17/evidence/b-continuous-glucose-monitoring-in-adults-with-type-1-diabetes-pdf-11013435182. Accessed 2022 July 2.
10.Freckmann G. Basics and use of continuous glucose monitoring (CGM) in diabetes therapy. J Lab Med. 2020;44(2):71-79.
11.Dicembrini I, Cosentino C, Monami M, Mannucci E, Pala L. Effects of real-time continuous glucose monitoring in type 1 diabetes: a meta-analysis of randomized controlled trials. Acta Diabetol. 2021;58(4):401-410. PubMed
12.Babar GS, Ali O, Parton EA, Hoffmann RG, Alemzadeh R. Factors associated with adherence to continuous subcutaneous insulin infusion in pediatric diabetes. Diabetes Technol Ther. 2009;11(3):131-137. PubMed
13.Holt RI. The burden of diabetes self‐management in children and young adults. Diabet Med. 2017;34(6):747. PubMed
14.Thabit H, Prabhu JN, Mubita W, et al. Use of factory-calibrated real-time continuous glucose monitoring improves time in target and HbA1C in a multiethnic cohort of adolescents and young adults with type 1 diabetes: The MILLENNIALS study. Diabetes Care. 2020;43(10):2537-2543. PubMed
15.Galindo RJ, Aleppo G. Continuous glucose monitoring: The achievement of 100 years of innovation in diabetes technology. Diabetes Res Clin Pract. 2020;170:108502. PubMed
16.Edelman SV, Argento NB, Pettus J, Hirsch IB. Clinical implications of real-time and intermittently scanned continuous glucose monitoring. Diabetes Care. 2018;41(11):2265-2274. PubMed
17.Faccioli S, Del Favero S, Visentin R, et al. Accuracy of a CGM sensor in pediatric subjects with type 1 diabetes. Comparison of three insertion sites: arm, abdomen, and gluteus. J Diabetes Sci Technol. 2017;11(6):1147-1154. PubMed
18.Diabetes in Canada. Backgrounder. Ottawa (ON): Diabetes Canada; 2020: https://www.diabetes.ca/DiabetesCanadaWebsite/media/Advocacy-and-Policy/Backgrounder/2020_Backgrounder_Canada_English_FINAL.pdf. Accessed 2022 July 11.
19.Parkin CG, Graham C, Smolskis J. Continuous glucose monitoring use in type 1 diabetes: longitudinal analysis demonstrates meaningful improvements in HbA1c and reductions in health care utilization. J Diabetes Sci Technol. 2017;11(3):522-528. PubMed
20.Wong B, Deng Y, Rascati KL. Healthcare utilization, costs, and adverse events of real-time continuous glucose monitoring (rtCGM) versus traditional blood glucose monitoring (BG) among US adults with type 1 diabetes. J Diabetes Sci Technol. 2021:1-8. PubMed
21.Shea BJ, Reeves BC, Wells G, et al. AMSTAR 2: a critical appraisal tool for systematic reviews that include randomised or non-randomised studies of healthcare interventions, or both. BMJ. 2017;358:1-9. PubMed
22.Downs SH, Black N. The feasibility of creating a checklist for the assessment of the methodological quality both of randomised and non-randomised studies of health care interventions. J Epidemiol Community Health. 1998;52(6):377-384. PubMed
23.Higgins JPT, Green S, editors. Figure 15.5.a: Drummond checklist (Drummond 1996). Cochrane handbook for systematic reviews of interventions. London (GB): The Cochrane Collaboration; 2011: http://handbook-5-1.cochrane.org/chapter_15/figure_15_5_a_drummond_checklist_drummond_1996.htm. Accessed 2022 Jul 22.
24.Liberati A, Altman DG, Tetzlaff J, et al. The PRISMA statement for reporting systematic reviews and meta-analyses of studies that evaluate health care interventions: explanation and elaboration. J Clin Epidemiol. 2009;62(10):e1-e34. PubMed
25.Roze S, Isitt JJ, Smith-Palmer J, Lynch P. Evaluation of the long-term cost-effectiveness of the dexcom G6 continuous glucose monitor versus self-monitoring of blood glucose in people with type 1 diabetes in Canada. ClinicoEcon Outcomes Res. 2021;13:717-725. PubMed
26.Isitt JJ, Roze S, Tilden D, et al. Long-term cost-effectiveness of Dexcom G6 real-time continuous glucose monitoring system in people with type 1 diabetes in Australia. Diabet Med. 2022:1-11. PubMed
27.Roze S, Isitt JJ, Smith-Palmer J, et al. Long-term cost-effectiveness the dexcom G6 real-time continuous glucose monitoring system compared with self-monitoring of blood glucose in people with type 1 diabetes in France. Diabetes Ther. 2021;12(1):235-246. PubMed
28.Roze S, Isitt J, Smith-Palmer J, Javanbakht M, Lynch P. Long-term cost-effectiveness of dexcom G6 real-time continuous glucose monitoring versus self-monitoring of blood glucose in patients with type 1 diabetes in the U.K. Diabetes Care. 2020;43(10):2411-2417. PubMed
29.Franceschi R, Micheli F, Mozzillo E, et al. Intermittently scanned and continuous glucose monitor systems: a systematic review on psychological outcomes in pediatric patients. Front Pediatr. 2021;9:660173. PubMed
30.Klak A, Manczak M, Owoc J, Olszewski R. Impact of continuous glucose monitoring on improving emotional well-being among adults with type 1 diabetes mellitus: a systematic review and meta-analysis. Pol Arch Intern Med. 2021;131(9):808-818. PubMed
31.Type 1 diabetes in children and young people: diagnosis and management. [B] Evidence review for continuous glucose monitoring in children and young people with type 1 diabetes. NICE evidence reviews collection; NICE guideline NG18. London (GB): National Institute for Health and Care Excellence; 2022: https://www.nice.org.uk/guidance/ng18/evidence/b-continuous-glucose-monitoring-in-children-and-young-people-with-type-1-diabetes-pdf-11011942190. Accessed 2022 July 02.
32.Type 1 diabetes in adults: diagnosis and management. Economic modelling for continuous glucose monitoring in adults with type 1 diabetes. Economic model report; NICE guideline NG17. London (GB): National Institute for Health and Care Excellence; 2022: https://www.nice.org.uk/guidance/ng17/evidence/economic-model-report-pdf-9196141213. Accessed 2022 June 27.
33.Palmer AJ, Roze S, Valentine WJ, et al. The CORE Diabetes Model: projecting long-term clinical outcomes, costs and cost-effectiveness of interventions in diabetes mellitus (types 1 and 2) to support clinical and reimbursement decision-making. Curr Med Res Opin. 2004;20(sup1):S5-S26.
34.Heller S, White D, Lee E, et al. A cluster randomised trial, cost-effectiveness analysis and psychosocial evaluation of insulin pump therapy compared with multiple injections during flexible intensive insulin therapy for type 1 diabetes: the REPOSE Trial. Health Technology Assessment (Winchester, England). 2017;21(20):1-278. PubMed
35.Beck RW, Riddlesworth T, Ruedy K, et al. Effect of continuous glucose monitoring on glycemic control in adults with type 1 diabetes using insulin injections: the DIAMOND randomized clinical trial. JAMA. 2017;317(4):371-378. PubMed
36.Battelino T, Danne T, Bergenstal RM, et al. Clinical targets for continuous glucose monitoring data interpretation: recommendations from the international consensus on time in range. Diabetes Care. 2019;42(8):1593-1603. PubMed
37.Ajjan RA, Jackson N, Thomson SA. Reduction in HbA1c using professional flash glucose monitoring in insulin-treated type 2 diabetes patients managed in primary and secondary care settings: A pilot, multicentre, randomised controlled trial. Diab Vasc Dis Res. 2019;16(4):385-395. PubMed
38.Vigersky RA. Going beyond HbA1c to understand the benefits of advanced diabetes therapies. J Diabetes. 2019;11(1):23-31. PubMed
39.Wright LA-C, Hirsch IB. Metrics beyond hemoglobin A1C in diabetes management: time in range, hypoglycemia, and other parameters. Diabetes Technol Ther. 2017;19(S2):S-16-S-26. PubMed
40.Herman WH, Ma Y, Uwaifo G, et al. Differences in A1C by race and ethnicity among patients with impaired glucose tolerance in the Diabetes Prevention Program. Diabetes Care. 2007;30(10):2453-2457. PubMed
41.Bergenstal RM, Gal RL, Beck RW. Racial differences in the relationship of glucose concentrations and hemoglobin A1c levels. Ann Intern Med. 2018;168(3):232-233. PubMed
42.Yapanis M, James S, Craig ME, O'Neal D, Ekinci EI. Complications of diabetes and metrics of glycemic management derived from continuous glucose monitoring. J Clin Endocrinol Metab. 2022;107(6):e2221-e2236. PubMed
43.Glucose monitoring technologies for the management of insulin-dependent diabetes. Calagary (AB): University of Calgary; 2019: https://www2.gov.bc.ca/assets/gov/health/about-bc-s-health-care-system/heath-care-partners/health-authorities/bc-health-technology-assessments/glucose-monitoring-hta.pdf. Accessed 2022 July 19.
44.Guidelines for the economic evaluation of health technologies: Canada CADTH methods and guidelines. Ottawa (ON): CADTH; 2017: https://www.cadth.ca/sites/default/files/pdf/guidelines_for_the_economic_evaluation_of_health_technologies_canada_4th_ed.pdf. Accessed 2022 Jul 22.
Appendix 1: Selection of Included Studies
Appendix 2: Characteristics of Included Publications
Note that this appendix has not been copy-edited.
Table 2: Characteristics of Included Systematic Reviews
Study citation, country, funding source | Review objective, search dates, numbers of primary studies included | Population characteristics | Relevant intervention and comparator | Clinical outcomes, length of follow-up, time horizon |
|---|---|---|---|---|
NICE NG (2022) 179 England Funding source: NICE | Review objective: To determine the clinical and cost effectiveness of different glucose monitoring methods in improving glycaemic control in adults with T1 diabetes Search dates: Electronic database inception to May 2021 Number of included studies: 17 RCTs + 2 CUAs in total; 13 RCTs relevant to the present review | Adults (aged 18 years and older) with T1 diabetes Sample sizes: 20 to 203 Mean age: 42 to 68 years Mean duration of T1 diabetes: 19 to 38 years Baseline hemoglobin A1C level: 7.0% to 11% % female: 45 to 64 | Intervention: rtCGM Comparator: SMBG | Outcomes:
Follow-up: 3 to 24 months |
NICE NG (2022) 189 England Funding source: NICE | Review objective: To determine the clinical and cost effectiveness of different glucose monitoring methods in improving glycaemic control in children and young people with T1 diabetes Search dates: Electronic database inception to May 2021 Number of included studies: 7 RCTs + 0 economic evaluations in total; 5 RCTs relevant to the present review | Children and young people with T1 diabetes (< 18 years old) Sample size: 30 to 114 Age range: 2 to 24 years1 Duration of T1 diabetes: > = 1 year Baseline hemoglobin A1C level: 7.0% to 10.0% % female: NR | Intervention: rtCGM Comparator: SMBG | Outcomes:
Follow-up: 3 to 6 months |
Dicembrini et al. (2021)11 Italy No funding | Review objective: To assess the effect of CGM and flash glucose monitoring on glycemic control in T1 diabetes Search dates: Electronic database inception to 31 July 2019 Number of included studies: 27 RCTs in total; 13 RCTs relevant to the present review | Adult and pediatric patients with T1 diabetes Sample sizes: 15 to 322 Mean age: 7 to 49 years Mean duration of T1 diabetes: 0 to 30 years Baseline hemoglobin A1C level: 52 to 100 mmol/mol % female: NR | Intervention: rtCGM Comparator: SMBG | Outcomes:
Follow-up: 12 to 104 weeks |
Franceschi et al. (2021)29 Italy Funding source: NR | Review objective: To explore the impact of rtCGM or isCGM on psychological outcomes in children and caregivers Search dates: 1 January 2006 to 31 December 2020 Number of included studies: 25 studies in total; 6 RCTs relevant to the present review | Pediatric patients with T1 diabetes between 0 and 18 years old and their caregivers Sample sizes: 98 to 434 (children + caregivers) Age range: 2 to 24 years1 Duration of T1 diabetes: NR Baseline hemoglobin A1C level: 7.5% to 10.9% % female: NR | Intervention: rtCGM Comparator: Capillary glucose testing | Outcomes:
Follow-up: 26 weeks to 6 months |
Klak et al. (2021)30 Poland Funding source: NR | Review objective: To compare the emotional well-being of adults with T1 diabetes mellitus who used rtCGM and those using conventional SBGM Search dates: 1 January 2013 to 30 October 2019 Number of included studies: 11 studies in total; 6 RCTs relevant to the present review | Individuals aged 18 years or older classified as having T1 diabetes mellitus with a hemoglobin A1C level of at least 7.5% (58 mmol/mol) Sample sizes: 52 to 285 Mean age: 43 to 71 years Mean duration of T1 diabetes: 12 to 31 years Baseline hemoglobin A1C level: 7.5% to 10% % female: 45 to 64 | Intervention: rtCGM Comparator: SMBG | Outcomes:
Follow-up: 24 to 69 weeks |
CV = coefficient of variation; isCGM = intermittently scanned/viewed continuous glucose monitoring; NG = NICE guideline; NICE = National Institute for Health and Care Excellence; NR = not reported; RCT = randomized controlled trial; rtCGM = real-time continuous glucose monitoring; SMBG = self-monitoring of blood glucose; T1 = type 1.
1The RCT by Laffel et al. included youth aged 14 to 24 years; the mean age was 17.2 years.
Table 3: Characteristics of Included Primary Clinical Study
Study citation, country, funding source | Study design, setting | Population characteristics | Intervention and comparator(s) | Clinical outcomes, length of follow-up |
|---|---|---|---|---|
Thabit et al. (2020)14 UK Source of funding: Dexcom Inc. | Open-label crossover RCT 2 hospitals (Manchester, UK) | Adolescents and young adults between 16 and 24 years with T1 diabetes (as defined by WHO) for at least 1 year on MDI or insulin pump therapy, hemoglobin A1C 7.5 to 14% on laboratory analyses, had a Smartphone compatible with Dexcom G6, literate in English Sample size: 31 Mean age (range): 21.2 (16 to 24) years Median duration of T1 diabetes: 12.9 years Mean baseline hemoglobin A1C level: 9.3% (78.4 mmol/mol) Ethnicity: White 64.5%, Black British/African/ Caribbean 19.4%, Asian 6.5%, mixed/multiple ethnic groups 9.7% % female: 58.1 | Intervention: rtCGM Comparator: SMBG | Outcomes:
Follow-up: 8 weeks |
CV = coefficient of variation; MDI = multiple daily injections; RCT = randomized controlled trial; rtCGM = real-time continuous glucose monitoring; SMBG = self-monitoring of blood glucose; T1 = type 1.
Table 4: Characteristics of Included Economic Evaluations
Study citation country, funding source | Type of analysis, time horizon, perspective, discount rate | Population characteristics | Intervention and comparator(s) | Approach | Source of clinical, cost, and utility data used in analysis | Main assumptions |
|---|---|---|---|---|---|---|
NICE (2022)32 UK Funding source: NICE | Cost-utility analysis Time horizon: Lifetime of 80 years Perspective: UK NHS and Personal Social Services Discount rate: 3.5% | A cohort of adults (18 years and older) with representing the average individuals with T1 diabetes in the UK. Baseline characteristics were based on a UK cluster RCT of 267 adults with T1 diabetes34 Mean (SD) age: 46.5 (12.13) years Mean (SD) duration of diabetes: 21 (13.5) years Mean (SD) hemoglobin A1C: 9.1% (1.7%) Ethnicity: White 94.2%, Black 2.3%, Asian / Pacific Islander 3.5% % female: 43 | Intervention: rtCGM Comparator: SMBG | IQVIA CORE Diabetes Model.33 - validated lifetime simulation model which simulates the progression of diabetes and diabetes-related complications based on a series of Markov interdependent sub-models, which use time, state, and diabetes type-dependent probabilities from published sources. Interactions between these sub-models are moderated by employing Monte Carlo simulations using tracker variables. | Costs for medicines were taken from the NHS Drug Tariff, while costs associated with complications were sourced from other relevant NICE guidelines, published papers, or guideline committee knowledge. Treatment outcomes were taken for NICE clinical reviews. UK specific sources were used for model inputs relating to costs, utilities, and other management parameters. In cases where UK specific sources were not available, default IQVIA CDM parameters were used. Treatment specific costs were calculated using published national sources. | Standard assumptions of the NICE reference case For rtCGM, the base case assumes an annual cost of £2,000. This is the ceiling price listed in the NHS England and NHS Improvement funding document. In the base analyses, it was assumed that the difference in hemoglobin A1C levels between rtCGM and SMBG arms remained constant over time. In sensitivity analyses, the UKPDS progression approach was adopted, assuming that the difference in hemoglobin A1C between study arms reduced over time. A higher frequency of SMBG (10 times per day) was assumed for both the SMBG arm (10 times per day) and rtCGM arm (3 times per day). |
Roze et al. (2021)25 Canada Funding source: Dexcom | Cost-utility analysis Time horizon: Patient lifetimes (50 years) Perspective: Public payer (Canada) Discount rate: 1.5% per annum (reported by the authors as being in line with CADTH guidelines for economic evaluations of health technologies44) | Patient cohort based on the participants in 1 RCT35 Adults ≥ 25 years with T1 diabetes and treated daily with multiple daily injections of insulin for at least 1 year Mean age: 47.6 years Mean duration of diabetes: 20.3 years % female: 56 | Intervention: rtCGM Comparator: SMBG | IQVIA CORE Diabetes Model33 | Clinical input data and hypoglycemia event rates were based on the findings from 1 RCT35 supplemented where necessary data from other trials in people with T1 diabetes. Health state utility values associated with diabetes-related complications were sourced from the literature. Direct medical costs were sourced from published literature and inflated to 2019 Canadian dollars. | For patients with no complications, a utility value of 0.90 was assumed, based on findings of 1 RCT.35 Annual costs with Dexcom G6 was CAD 3588, which included 36 sensors per year and 4 transmitters per year. Annual costs in SMBG arm were CAD 1226, which assumed a mean of 4.6 SMBG tests per day, based on findings from 1 RCT.35 |
CAD = Canadian dollars; ICER = incremental cost-effectiveness ratio; NICE = National Institute for Health and Care Excellence; NIH = National Institute of Health; RCT = randomized controlled trial; rtCGM = real-time continuous glucose monitoring; SMBG = self-monitoring of blood glucose; T1 = type 1; UKPDS = UK Prospective Diabetes Study.
Appendix 3: Critical Appraisal of Included Publications
Note that this appendix has not been copy-edited.
Table 5: Strengths and Limitations of Systematic Reviews Using AMSTAR 221
Strengths | Limitations |
|---|---|
NICE NG 17 (2022)9 | |
|
|
NICE NG 18 (2022)31 | |
|
|
Dicembrini et al. (2021)11 | |
|
|
Franceschi et al. (2021)29 | |
|
|
Klak et al. (2021)30 | |
|
|
AMSTAR 2 = A MeaSurement Tool to Assess systematic Reviews; CHERRIES = Checklist for Reporting Results of Internet E-Surveys; GRADE = Grading of Recommendations Assessment, Development and Evaluation; NICE = National Institute for Heath and Care Excellence; PICO = population/participants, intervention, comparison, outcomes.
Table 6: Strengths and Limitations of RCT Using the Downs and Black Checklist22
Strengths | Limitations |
|---|---|
Thabit et al. (2020)14 | |
Reporting:
External validity:
Internal validity – bias:
Internal validity – confounding:
Other:
| External validity:
Internal validity – bias:
Other:
|
Table 7: Strengths and Limitations of Economic Evaluations Using the Drummond Checklist23
Strengths | Limitations |
|---|---|
NICE 2022 NG 1732 | |
|
|
Roze et al. 202125 | |
|
|
Appendix 4: Main Study Findings and Authors’ Conclusions
Note that this appendix has not been copy-edited.
Table 8: Summary of Findings by Outcome – Hemoglobin A1C in Adults
Study citation and study design | Detailed findings |
|---|---|
rtCGM vs. SMBG | |
NICE (2022) NG 179 SR and MA | Change from baseline hemoglobin A1C (%) at ≤ 6 months (8 RCTs,a n = 1,259)
Change from baseline hemoglobin A1C (%) at ≤ 3 months (2 RCTs,c n = 346)
Change in hemoglobin A1C (mmol/mL) at ≤ 6 months (3 RCTs,d n = 477)
|
Dicembrini et al. (2021)11 SR (2 RCTs) | Olafsdottir et al. 2018 (n = 142) Hemoglobin A1C at 69 weeks
|
Sequeira et al. 2013 (n = 78) Hemoglobin A1C at 28 weeks
| |
Klak et al. (2021)30 SR (3 RCTs) | Ehrmann et al. 2019 (n = 141) Change in mean hemoglobin A1C (SD) at 30 weeks, baseline-adjusted
|
Polonsky et al. 2017 (n = 158) Change in mean hemoglobin A1C (SD) at 24 weeks
| |
Little et al. 2018 (n = 76) Change in mean hemoglobin A1C (SD) at 24 weeks
| |
Thabit et al. (2020)14 Crossover RCT | Change in mean hemoglobin A1C % (SD) at 8 weeks (n = 30)
Change in mean hemoglobin A1C mmol/mol (SD) at 8 weeks (n = 30)
|
CI = confidence interval; MA = meta-analysis; MD = mean difference; RCT = randomized controlled trial; rtCGM = real-time continuous glucose monitoring; SMBG = self-monitoring of blood glucose; SR = systematic review.
a. Battelino 2014; Beck et al. 2017; Heinemann et al. 2018; JDRF 2008; Lind et al. 2017; Pratley et al. 2020; Tumminia 2015; van Beers 2016.
b. Because the confidence limits were smaller than the meaningful important differences in both directions, the authors state that the evidence demonstrated there was no meaningful difference.
c. Beck et al. 2017; New et al. 2015.
d. Heinemann et al. 2018; Lind et al. 2017; van Beers 2016.
Table 9: Summary of Findings by Outcome – Hemoglobin A1C in Pediatric Patients
Study citation and study design | Detailed findings |
|---|---|
rtCGM vs. SMBG | |
NICE (2022) NG 1831 SR and MA | Hb1Ac (mmol/mol) at 6 months (2 RCTsa; n = 267)
Hb1Ac relative reduction > 10% at 6 months (2 RCTsc; n = 267)
|
NICE (2022) NG 1831 SR (1 parallel RCT) | JDRF 2008 (n = 114) Hemoglobin A1C relative reduction ≥ 5% 6 months
|
Dicembrini et al. (2021)11 SR and MA | Hemoglobin A1C at 12 to 104 weeks (7 RCTs2; n = 721)
|
CI = confidence interval; MA = meta-analysis; MD = mean difference; RCT = randomized controlled trial; rtCGM = real-time continuous glucose monitoring; SMBG = self-monitoring of blood glucose; SR = systematic review.
a. JDRF 2008; Laffel et al. 2010.
b. Because the confidence limits were smaller than the meaningful important differences in both directions, the authors state that the evidence demonstrated there was no meaningful difference.
c. Deiss et al. 2006, Guilman-Crepon et al. 2019, Kordonouri et al. 2012, Lagarde et al. 2006, Mauras et al. 2012, Oliver et al. 2014, Tamorlane et al. 2008.
d. Data are only consistent, at a 95% confidence level, with an effect in 1 direction (statistically significant), and the magnitude of the effect was most likely to meet or exceed the minimally important difference (the point estimate is not in the zone of equivalence). Therefore, the authors stated that the evidence showed that there is an effect, favouring rtCGM.
Table 10: Summary of Findings by Outcome – Time in Range Estimates in Adults
Study citation and study design | Detailed findings |
|---|---|
rtCGM vs. SMBG | |
NICE (2022) NG 179 SR and MA | TIR (%) [3.9 to 10 mmol/L] at ≤ 6 months (6 RCTs,a n = 1,023)
Time below range (%) [< 3.9 mmol/L] at ≤ 6 months (3 RCTs,c n = 371)
Time above range (%) [> 10 mmol/L] at ≤ 6 months (3 RCTs,d n = 511)
|
Thabit et al. (2020)14 Crossover RCT | Paired MD (95% CI) at 8 weeks (n = 30)
Mean time (IQR) below range
|
CI = confidence interval; IQR = interquartile range; MA = meta-analysis; MD = mean difference; RCT = randomized controlled trial; rtCGM = real-time continuous glucose monitoring; SMBG = self-monitoring of blood glucose; SR = systematic review; TIR = time in range; WMD = weighted mean difference.
a. Battelino et al. 2011; Battelino 2014; Beck et al. 2017; Heinemann et al. 2018; Pratley et al. 2020; van Beers 2016.
b. Data were only consistent, at a 95% confidence level, with an effect in 1 direction (statistically significant), and the magnitude of the effect was most likely to meet or exceed the minimally important difference (the point estimate is not in the zone of equivalence). Therefore, the authors stated that the evidence showed that there was an effect, favouring rtCGM.
c. Battelino et al. 2011; Pratley et al. 2020; van Beers 2016.
d. Battelino et al. 2011; Heinemann et al. 2018; Pratley et al. 2020.
e. Because the confidence limits were smaller than the meaningful important differences in both directions, the authors stated that the evidence demonstrated there was no meaningful difference.4. Battelino et al. 2011; Pratley et al. 2020.
Table 11: Summary of Findings by Outcome – Time in Range Estimates in Pediatric Patients
Study citation and study design | Detailed findings |
|---|---|
rtCGM vs. SMBG | |
NICE (2022) NG 1831 SR (1 RCT) | Lafell et al. (n = 153) TIR (%) [70 to 180 mg/dL] at 6 months
Time above range (%) > 180 mg/dL at 6 months
|
MD = mean difference; RCT = randomized controlled trial; rtCGM = real-time continuous glucose monitoring; SMBG = self-monitoring of blood glucose; TIR = time in range; systematic review.
a. Data were only consistent, at a 95% confidence level, with an effect in 1 direction (statistically significant), and the magnitude of the effect was most likely to meet or exceed the minimally important difference (the point estimate is not in the zone of equivalence). Therefore, the authors stated that the evidence showed that there was an effect, favouring rtCGM.
b. The data were only consistent, at a 95% confidence level, with an effect in 1 direction, but the magnitude of that effect was most likely to be less than the minimally important difference. Therefore, the authors stated that the evidence showed there was an effect, but it was less than the defined minimally important difference.
Table 12: Summary of Findings by Outcome – Glucose Variability in Adults
Study citation and study design | Detailed findings |
|---|---|
rtCGM vs. SMBG | |
NICE (2022) NG 179 SR and MA | CV at < = 6 months (5 RCTs,a n = 584)
|
Thabit et al. (2020)14 Crossover RCT | CV at 8 weeks (n = 30)
|
CV = correlation of variance; MD = mean difference; RCT = randomized controlled trial; rtCGM = real-time continuous glucose monitoring; SMBG = self-monitoring of blood glucose; SR = systematic review.
a. Beck et al. 2017; Heinemann et al. 2017; Pratley et al. 2020; Tummunia et al. 2015; van Beers 2016.
b. Data were only consistent, at a 95% confidence level, with an effect in 1 direction (statistically significant), and the magnitude of the effect was most likely to meet or exceed the minimally important difference (the point estimate is not in the zone of equivalence). Therefore, the authors stated that the evidence showed that there was an effect, favouring rtCGM.
Table 13: Summary of Findings by Outcome – Glucose Variability in Pediatric Patients
Study citation and study design | Detailed findings |
|---|---|
rtCGM vs. SMBG | |
NICE (2022) NG 1831 SR (1 RCT) | Laffel et al. 2020 (n = 153) Glycemic variability: CV at 6 months
|
CI = confidence interval; CV = correlation of variance; MD = mean difference; RCT = randomized controlled trial; SR = systematic review
a. The data were only consistent, at a 95% confidence level, with an effect in 1 direction, but the magnitude of that effect was most likely to be less than the minimally important difference. Therefore, the authors stated that the evidence showed there was an effect, but it was less than the defined minimally important difference.
Table 14: Summary of Findings by Outcome – Quality of Life in Adults
Study citation and study design | Detailed findings |
|---|---|
rtCGM vs. SMBG | |
NICE (2022) NG 179 SR and MA | DTSQ at < = 6 months (2 RCTs,a n = 369)
Hypoglycemia awareness (Clarke score) at ≤ 6 months (3 RCTs,b n = 303)
Hypoglycemia awareness (Gold score) at ≤ 6 months (2 RCTs,d n = 148)
|
NICE (2022) NG 179 SR (1 crossover RCT and 2 parallel RCTs) | Lind et al. 2017 (n = 279) MD (95% CI) score at 6 months
|
New et al. 2015 (n = 82) MD (95% CI) score at 3 months
| |
Little et al. 2014 (n = 96) MD (95% CI) score at 24 weeks
| |
JDRF 2010 (n = 158) MD (95% CI) score at 6 months
| |
Dicembrini et al. (2021)11 SR (5 parallel RCTs and 1 crossover RCT) | Heinemann et al. 2018 (n = 149) Findings at 26 weeks
|
Olafsdottir et al. 2018 (n = 142) Findings at 69 weeks
| |
van Beers et al. 2016 (crossover trial, n = 104) Findings at 16 weeks
| |
New et al. 2015 (n = 96) Findings at 13 weeks
| |
Sequeira et al. 2013 (n = 78) Findings are 28 weeks
| |
Klak et al. (2021)30 SR (3 RCTs) | Ehrmann et al. 2019 (n = 141) Change in DDS score at 30 weeks
Change in HFS score at 30 weeks
|
Olafsdottir et al. 2018 (n = 161) Mean HCQ score (95% CI) at 30 weeks
| |
Polonsky et al. 2017 (n = 158) HFS-W score at 24 weeks
| |
Thabit et al. (2020)14 Crossover RCT | Mean (SD) GMSS score at 8 weeks (n = 31)
DDS score at 8 weeks
|
CI = confidence interval; DDS = Diabetes Distress Scale; DTSQ = Diabetes Treatment Satisfaction Questionnaire status; GMSS = Glucose Monitoring System Satisfaction Survey; HAS = Hypoglycemia Awareness Survey; HCQ = Hypoglycemic Confidence Questionnaire; HFS = Hypoglycemia Fear Survey; MD = mean difference; PAID = Problem Areas in Diabetes survey; RCT = randomized controlled trial; rtCGM = real-time continuous glucose monitoring; SD = standard deviation; SF-8 = Short Form Health Survey version 8; SF-12 = Short Form Health Survey version 12; SMBG = self-monitoring of blood glucose; SR = systematic review; WHO-5 = WHO-5 Well-Being Index.
a. Lind et al. 2017; Little et al. 2014.
b. Beck et al. 2017; Little et al. 2014; van Beers 2016.
c. Because the confidence limits were smaller than the meaningful important differences in both directions, the authors stated that the evidence demonstrated there was no meaningful difference.
d. Little et al. 2014; van Beers 2016.
Table 15: Summary of Findings by Outcome – Quality of Life in Pediatric Patients
Study citation and study design | Detailed findings |
|---|---|
rtCGM vs. SMBG | |
NICE (2022) NG 1831 SR and MA | PedsQL generic score at 6 months (2 RCTsa; n = 362)
PedsQL generic score by parents at 6 months (2 RCTsa; n = 362)
|
NICE (2022) NG 1831 SR (1 crossover RCT and 1 parallel RCT) | Burckhardt et al. 2018 (n = 98) MD (95% CI) on scales at 3 months
|
JDRF 2010 (n = 218) MD (95% CI) on scales at 6 months
| |
Dicembrini et al. (2021)11 SR (3 RCTs) | Guilmin-Crepon et al. 2019 (n = 100) Findings at 52 weeks
|
Olivier et al. 2014 (n = 15) Findings at 16 weeks
| |
Mauras et al. 2012 (n = 146) Findings at 26 weeks
| |
Franceschi et al. (2021)29 SR (5 RCTs) | Laffel et al. 2020 (n = 153) Findings at 26 weeks
|
Mauras et al. 2012 (n = 146) Findings at 26 weeks
| |
JDRF 2010 (n = 206 children, 228 parents) Findings at 26 weeks
| |
Markowitz et al. 2010 (n = 49) Findings at 6 months
| |
DirecNet 2006 (n = 200) Findings at 6 months
| |
CGM-SAT = Continuous Glucose Monitoring Satisfaction; CI = confidence interval; DFCS = Diabetes Family Conflict Scale; DirecNet = Diabetes Research in Children Network; DSMP = Diabetes Self-Management Profile; DWS = Diabetes Worry Scale; GMSS = Glucose Monitoring System Satisfaction; HCS = Hypoglycemia Confidence Scale; HFS = Hypoglycemia Fear Survey – Worry scale; MD = mean difference; PAID = Problem Areas in Diabetes survey; PedsQL = Pediatric Quality of Life Inventory; RCT = randomized controlled trial; rtCGM = real-time continuous glucose monitoring; SMBG = self-monitoring of blood glucose; SR = systematic review.
a. Hommel et al. 2014; JDRF 2010.
Table 16: Summary of Findings by Outcome – Adverse Events in Adults
Study citation and study design | Detailed findings |
|---|---|
rtCGM vs. SMBG | |
NICE (2022) NG 179 SR and MA | Severe hypoglycemia at ≤ 6 months (7 RCTs,a n = 1,000)
DKA at ≤ 6 months (5 RCTs,c n = 849)
Hypoglycemia events/week < 3.9 mmol/L at ≤ 6 months (3 RCTs,d n = 310)
Nocturnal hypoglycemia (% of time) < 3.9 mmol/L at ≤ 6 months (2 RCTs,f n = 194)
|
NICE (2022) NG 179 SR (3 RCTs) | Pratley et al. 2020 (n = 203) Hospitalizations at 6 months
|
Beck et al. 2017 (n = 158) SAE at ≤ 6 months
| |
Tanenberg et al. 2004 (n = 109) Hypoglycemia events/day at ≤ 3 months
Hypoglycemia event duration (minutes) at ≤ 3 months
| |
Dicembrini et al. (2021)11 SR (1 parallel RCT and 1 crossover RCT) | Heinemann et al. 2018 Severe hypoglycemia at 6 months
DKA (rtCGM vs. SMBG) at 6 months
|
Lind et al. 2017 Severe hypoglycemia at 6 months
DKA (rtCGM vs. SMBG) at 6 months
| |
Thabit et al. (2020)14 Crossover RCT | Adverse events (rtCGM vs. SMBG) at 8 weeks
|
CI = confidence interval; DKA = Diabetic ketoacidosis; ED = emergency department; MA = meta-analysis; MD = mean difference; RCT = randomized controlled trial; rtCGM = real-time continuous glucose monitoring; SMBG = self-monitoring of blood glucose; SR = systematic review.
a. Battelino et al. 2014; Beck et al. 2017; JDRF et al. 2008; Little et al. 2014; Pratley et al. 2020; Tanenberge 2004; van Beers et al. 2017.
b. Data were only consistent, at a 95% confidence level, with an effect in 1 direction (statistically significant), and the magnitude of the effect was most likely to meet or exceed the minimally important difference (the point estimate is not in the zone of equivalence). Therefore, the authors stated that the evidence showed that there was an effect, favouring rtCGM.
c. Battelino et al. 2014; Beck et al. 2017; JDRF et al. 2008; Little et al. 2014; Pratley et al. 2020.
d. Battelino et al. 2011; Olafsdottir et al. 2018; van Beers et al. 2017.
e. Because the confidence limits were smaller than the meaningful important differences in both directions, the authors stated that the evidence demonstrated there was no meaningful difference.
f. Olafsdottir et al. 2018; van Beers et al. 2017.
Table 17: Summary of Findings by Outcome – Adverse Events in Pediatric Patients
Study citation and study design | Detailed findings |
|---|---|
rtCGM vs. SMBG | |
NICE (2022) NG 1831 SR and MA | DKA at 6 months (2 RCTsa; n = 267)
|
NICE (2022) NG 1831 SR (1 RCT) | Laffel et al. 2020 (n = 153) RR (95% CI) at 6 months
|
Dicembrini et al. (2021)11 SR and MA | Severe hypoglycemia at 26 to 104 weeks (4 RCTsb; n = 598)
|
Dicembrini et al. (2021)11 SR (4 RCTs) | Guilmin-Crepon et al. 2019 DKA at 52 weeks
|
Kordonouri et al. 2012 DKA at 104 weeks
| |
Mauras et al. 2012 DKA at 26 weeks
| |
Lagarde et al. 2006 DKA at 26 weeks
| |
DKA = Diabetic ketoacidosis; MA = meta-analysis; RCT = randomized controlled trial; rtCGM = real-time continuous glucose monitoring; SAE = severe adverse events; SMBG = self-monitoring of blood glucose.
a. JDRF 2008; Laffel et al. 2010
b. Kordonouri et al. 2012, Lagarde et al. 2006, Mauras et al. 2012, JDRF et al. 2008.
Table 18: Summary of Findings of Included Economic Evaluations
Main study findings | Authors’ conclusion |
|---|---|
NICE (2022)32 | |
Cost-utility analysis of the cost-effectiveness rtCGM to SMBG in patients T1 diabetes using a UK health care payer perspective. Base-case deterministic cost-utility results (without utility benefits associated with reduced fear of hypoglycemia)
Base-case deterministic cost-utility results (with utility benefits associated with reduced fear of hypoglycemia)
Sensitivity analysis
| In the base-case analysis where the utility gains associated with FOH were not considered, rtCGM was only cost-effective compared with SMBG at the £30,000 threshold per QALY. In the base-case analysis where the utility gains associated with FOH were considered, rtCGM was cost-effective compared with SMBG at a threshold of £20,000 per QALY. (p. 24) |
Roze et al. (2021)25 | |
Cost-utility analysis of the cost-effectiveness Dexcom CG rtCGM to SMBG in patients T1 diabetes using a Canadian health care payer perspective. Base-case results
Sensitivity analysis
| “Overall, findings from long-term health economic analyses suggest that for adults with long-standing T1D based in Canada, the use of the Dexcom G6 rtCGM system represents a cost-effective management option compared with SMBG. In the base-case analysis, the ICER was CAD 16,931 per QALY gained, suggesting that at a WTP threshold of CAD 50,000 per QALY gained the Dexcom G6 rtCGM system is likely to represent good value for money relative to SMBG.” (p. 721) |
CAD = Canadian dollars; FOH = fear of hypoglycemia; ICER = incremental cost-effectiveness ratio; NICE = National Institute of Health and Care Excellence; QALY = quality-adjusted life-year; rtCGM = real-time continuous glucose monitoring; SMBG = self-monitoring of blood glucose; WTP = willingness to pay.
Appendix 5: Overlap Between Included Systematic Reviews
Note that this appendix has not been copy-edited.
Table 19: Overlap in Relevant Primary Studies between Included Systematic Reviews
Primary study citation(s)a | NICE 2022 NG 179 | NICE 2022 NG 1831 | Dicembrini et al. 202111 | Franceschi et al. 202129 | Klak et al. 202130 |
|---|---|---|---|---|---|
Laffel et al. JAMA. 2020; 323:2388 to 96 | No | Yes | No | Yes | No |
Pratley et al. JAMA. 2020; 323:2397 to 406. | Yes | No | No | No | No |
Guilmin-Crepon et al. Pediatr Diabetes. 2019; 20:304 to 13 | No | No | Yes | No | No |
Ehrmann et al. Diabetes Technol Ther. 2019; 21:86 to 93 | No | No | No | No | Yes |
Burckhardt et al. Diabetes Care. 2018; 41:2641 to 3 | No | Yes | No | Yes | No |
Heinemann et al. Lancet. 2018; 391:1367 to 77 | Yes | No | Yes | No | No |
Little et al. Diabetes Care. 2018; 41: 1600 to 7; Little 2014 | Yes | No | No | No | Yes |
Beck et al. JAMA. 2017; 317:371 to 8 | Yes | No | Yes | No | No |
Lind et al. JAMA. 2017; 317:379 to 87; Olafsdottir et al. Diabetes Technol Ther. 2018; 20:274 to 84 | Yes | No | Yes | No | Yes |
Polonsky et al. Diabetes Care. 2017; 40:736 to 41 | No | No | No | No | Yes |
van Beers et a. Lancet Diabetes Endocrinol. 2016; 4:893 to 902; van Beers et al. Diabetes Technol Ther. 2017;19:595 to 9 | Yes | No | Yes | No | Yes |
New et al. Diabet Med. 2015; 32:609 to 17 | Yes | No | Yes | No | No |
Tumminia et al. Diabetes Metab Res Rev. 2015; 31:61 to 8 | Yes | No | No | No | No |
Battelino et al. Diabetes Technol Therapeut. 2014; 16: s101 to 2 | Yes | No | No | No | No |
Hommel et al. Acta Diabetologica. 2014; 51:845 to 51 | No | Yes | No | No | No |
Little et al. Diabetes Care. 2014; 37:2114 to 22 | Yes | No | No | No | Yes |
Oliver et al. J Diabetes Sci Technol. 2014; 8:523 to 8 | No | No | Yes | No | No |
Sequeira et al. Diabetes Technol Ther. 2013; 15:855 to 8 | No | No | Yes | No | No |
Kordonouri et al. Pediatr Diabetes. 2012; 35:515 to 8 | No | No | Yes | No | No |
Markowitz et al. Diabetes Technol Ther. 2012; 14:523 to 6 | No | No | No | Yes | No |
Mauras et al. Diabetes Care. 2012; 35:204 to 10 | No | No | Yes | Yes | No |
Battelino et al. Diabetes Care, 2011; 34:795 to 800 | Yes | No | No | No | No |
JDRF Group. Diabetes Care. 2010; 33:2175 to 7 JDRF Group. NEJM; 2008: 359:1474 to 76 | Yes | Yes | Yes | Yes | No |
Deiss et al. Diabetes Care. 2006; 29:2730 to 2 | No | Yes | Yes | No | No |
DirecNet Study Group. Pediatr Diabetes. 2006; 7:32 to 8 | No | No | No | Yes | No |
Lagarde et al. Pediatr Diabetes. 2006; 7:159 to 64 | No | No | Yes | No | No |
Tannenberg et al. Mayo Clinic Proceedings. 2004; 79:1521 to 6 | Yes | No | No | No | No |
DirecNet = Diabetes Research in Children Network; JDRF = Juvenile Diabetes Research Foundation.
a. Primary studies of clinical effectiveness only.
Appendix 6: Real-World Evidence from the Literature Search
Note that this appendix has not been copy-edited.
The following publications were identified because they provide information related to real-world evidence for rtCGM for people living with type 1 diabetes. The type of evidence presented in this section include non-randomized studies and are grouped as either real-world evidence related to use or real-world evidence related to implementation of rtCGM for people living with type 1 diabetes.
Use of rtCGM
Huhn F, Lange K, Jordening M, Ernst G. Real-world use of continuous glucose monitoring (CGM) systems among adolescents and young adults with type 1 diabetes: reduced burden, but little interest in data analysis. J Diabetes Sci Technol. 2022 Mar 07:19322968221081216. PubMed
Note: Questionnaire completed by young people (mean age 21.4) in Germany during a diabetes camp on their method of glucose monitoring (30% using rtCGM, 25% using SMBG, and 46% using isCGM), satisfaction, quality of CGM use, hemoglobin A1C, and diabetes distress.
Win M, Beckett R, Thomson L, Thankamony A, Beardsall K. Continuous glucose monitoring in the management of neonates with persistent hypoglycemia and congenital hyperinsulinism. J Clin Endocrinol Metab. 2022 01 Jan;107(1):E246-E253. PubMed
Note: Single-centre retrospective study of rtCGM use over 4 years in 14 babies with persistent hypoglycemia.
Da Silva J, Bosi E, Jendle J, et al. Real-world performance of the MiniMedTM 670G system in Europe. Diabetes Obes Metab. 2021 August;23(8):1942 to 1949.
Note: Evaluation of real-world performance of the MiniMed 670G system in 14,899 people with diabetes in Europe.
Dubose SN, Bauza C, Verdejo A, Beck RW, Bergenstal RM, Sherr J. Real- world, patient-reported and clinic data from individuals with type 1 diabetes using the MiniMed 670G hybrid closed-loop system. Diabetes Technol Ther. 2021 December;23(12):791 to 798.
Note: Real-world data on the use of Medtronic 670G rtCGM system from 132 people with Type 1 diabetes was collected via questionnaires before initiation of rtCGM (baseline) and at 6 weeks, 6 months, and 12 months; and clinical data at routine clinical visits.
Garg S, Norman GJ. Impact of COVID-19 on health economics and technology of diabetes care: use cases of real-time continuous glucose monitoring to transform health care during a global pandemic. Diabetes Technol Ther. 2021 March;23(S1):S15-S20. PubMed
Note: Review and summary of findings on use cases for rtCGM in the community, for telehealth, and in hospital setting during the COVID-19 pandemic.
Lee K, Gunasinghe S, Chapman A, et al. Real-world outcomes of glucose sensor use in type 1 diabetes-findings from a large UK centre. Biosensors. 2021 Nov 15;11(11):15. PubMed
Note: Retrospective study to evaluate the impact of rtCGM and flash glucose monitoring use on glycemic outcomes in 789 adults with type 1 diabetes.
Rusak E, Ogarek N, Wolicka K, et al. The quality of life and satisfaction with continuous glucose monitoring therapy in children under 7 years of age with t1d using the rtCGM system integrated with insulin pump-a caregivers point of view. Sensors. 2021 May 25;21(11):25. PubMed
Note: Survey study of quality of life in 38 children (aged 2 to 7 years) with type 1 diabetes.
Van Der Linden J, Welsh JB, Hirsch IB, Garg SK. Real- time continuous glucose monitoring during the coronavirus disease 2019 pandemic and its impact on time in range. Diabetes Technol Ther. 2021 March;23(S1):S1-S7. PubMed
Note: Study of glycemic outcomes in 65,067 US-based users of the G6 rtCGM system before and during the COVID-19 pandemic.
van der Linden J, Welsh JB, Walker TC. Sustainable use of a real-time continuous glucose monitoring system from 2018 to 2020. Diabetes Technol Ther. 2021 07;23(7):508 to 511. PubMed
Note: Real-world cohort study of glycemic outcomes and persistent use in 31,034 US-based rtCGM users who transitioned from the G5 to the G6 Dexcom system in 2018.
Charleer S, De Block C, Nobels F, et al. Sustained impact of real-time continuous glucose monitoring in adults with type 1 diabetes on insulin pump therapy: results after the 24-month RESCUE Study. Diabetes Care. 2020 12;43(12):3016 to 3023. PubMed
Note: Two-year prospective cohort study of glycemic outcomes and quality of life (including fear of hypoglycemia) in 441 adults with insulin pumps receiving full reimbursement for rtCGM.
Implementation of rtCGM
Baker M, Musselman ME, Rogers R, Hellman R. Practical implementation of remote continuous glucose monitoring in hospitalized patients with diabetes. Am J Health Syst Pharm. 2022 03 07;79(6):452 to 458. PubMed
Note: Description of a program for inpatient rtCGM at a community hospital and accuracy evaluation of rtCGM-based glucose estimates (compared to point-of-care glucose values).
Beck SE, Kelly C, Price DA, Group CS. Non-adjunctive continuous glucose monitoring for control of hypoglycaemia (COACH): Results of a post-approval observational study. Diabet Med. 2022 02;39(2):e14739. PubMed
Note: One-year observational study of hypoglycemic events, hemoglobin A1C, and diabetic ketoacidosis in 518 adults with insulin-requiring diabetes (66.5% with type 1 diabetes) using rtCGM.
Agarwal S, Mathew J, Davis GM, et al. Continuous glucose monitoring in the intensive care unit during the COVID-19 pandemic. Diabetes Care. 2021 03;44(3):847 to 849. PubMed
Note: Real-world preliminary analysis of implementation of Dexcom G6 rtCGM on intensive care unit patients at 1 hospital with confirmed COVID-19 infection and glycemic variability.
Meng R, Gu T, Yang F, Liu J, Sun Q, Zhu D. Performance Evaluation of the Glunovo R Continuous Blood Glucose Monitoring System in Chinese Participants with Diabetes: A Multicenter, Self-Controlled Trial. Diabetes Therapy Research, Treatment and Education of Diabetes and Related Disorders. 2021 Dec;12(12):3153 to 3165. PubMed: PM34704201
Note: Multi-centre, self-controlled clinical trial evaluating the performance and safety of Glunovo R rtCGM over a 14-day period in 78 adults with diabetes (25 with type 1 diabetes).
Murata T, Kuroda A, Matsuhisa M, et al. Predictive factors of the adherence to real-time continuous glucose monitoring sensors: a prospective observational study (PARCS STUDY). J Diabetes Sci Technol. 2021 09;15(5):1084 to 1092. PubMed
Note: Study of adherence and quality of life in 46 participants with type 1 diabetes (mean age 44 years) using rtCGM.
Preau Y, Armand M, Galie S, Schaepelynck P, Raccah D. Impact of switching from intermittently scanned to real-time continuous glucose monitoring systems in a type 1 diabetes patient French cohort: an observational study of clinical practices. Diabetes Technol Ther. 2021 04;23(4):259 to 267. PubMed
Note: Observational study assessing the impact of switching from isCGM to Dexcom G4 rtCGM on glycemic outcomes in 18 adults with type 1 diabetes and high risk of hypoglycemia and/or elevated hemoglobin A1C.
Preau Y, Galie S, Schaepelynck P, Armand M, Raccah D. Benefits of a switch from intermittently scanned continuous glucose monitoring (isCGM) to real-time (rt) CGM in diabetes type 1 suboptimal controlled patients in real-life: a 1-year prospective study. Sensors. 2021 Sep 13;21(18):13. PubMed
Note: Observational study assessing the impact of switching from isCGM to Dexcom G4 rtCGM on glycemic outcomes in 21 adults with type 1 diabetes.
Appendix 7: References of Potential Interest
Note that this appendix has not been copy-edited.
Previous CADTH Reports
Flash glucose monitoring and continuous glucose monitoring for people with diabetes in acute care settings. CADTH reference list: summary of abstracts. Ottawa (ON): CADTH; 2021: https://www.cadth.ca/sites/default/files/pdf/htis/2021/RB1562%20CGM%20and%20FGM%20in%20Acute%20Care%20Final.pdf. Accessed 2022 Jul 25.
Continuous glucose monitoring for patients with all diabetes types: clinical effectiveness and guidelines. CADTH rapid response report: summary of abstracts. Ottawa (ON): CADTH; 2018: https://www.cadth.ca/sites/default/files/pdf/htis/2018/RB1289%20Continuous%20Glucose%20Monitoring%20Final.pdf. Accessed 2022 Jul 25.
Insulin pumps for adults with type 1 diabetes: a review of clinical effectiveness, cost-effectiveness and guidelines. CADTH rapid response report: summary with critical appraisal. Ottawa (ON): CADTH; 2015: https://www.cadth.ca/sites/default/files/pdf/htis/dec-2015/RC0731_Insulin%20pumps_Final.pdf. Accessed 2022 Jul 25.
Review Articles
Babu RN, Pravallika MYL, Kumar NDP, Bhargavi MB. Continuous glucose monitoring devices: a systematic review. J Global Trends Pharm Sci. 2020;11(2):7562-7568.
Galindo RJ, Aleppo G. Continuous glucose monitoring: The achievement of 100 years of innovation in diabetes technology. Diabetes Res Clin Pract. 2020;170:108502. PubMed
Kim JH. Current status of continuous glucose monitoring among Korean children and adolescents with type 1 diabetes mellitus. Ann Pediatr Endocrinol Metab. 2020;25(3):145-151. PubMed
National Institute for Health and Care Excellence. Dexcom G6 for real-time continuous glucose monitoring. (Medtech innovation briefing MIB 233) 2020; https://www.nice.org.uk/advice/mib233/resources/dexcom-g6-for-realtime-continuous-glucose-monitoring-pdf-2285965570801093. Accessed 2022 June 30.
Pease A, Lo C, Earnest A, Kiriakova V, Liew D, Zoungas S. The efficacy of technology in type 1 diabetes: a systematic review, network meta-analysis, and narrative synthesis. Diabetes Technol Ther. 2020;22(5):411-421. PubMed
Polonsky WH. Psychosocial aspects of diabetes technology: adult perspective. Endocrinol Metab Clin North Am. 2020;49(1):143-155. PubMed
Soni A, Wright N, Agwu JC, et al. A practical approach to continuous glucose monitoring (rtCGM) and FreeStyle Libre systems (isCGM) in children and young people with Type 1 diabetes. Diabetes Res Clin Pract. 2022;184:109196. PubMed
Non-Randomized Studies
Beck SE, Kelly C, Price DA, Group CS. Non-adjunctive continuous glucose monitoring for control of hypoglycaemia (COACH): results of a post-approval observational study. Diabet Med. 2022;39(2):e14739. PubMed
Gurnurkar S, Owens L, Chalise S, Vyas N. Evaluation of hemoglobin A1c before and after initiation of continuous glucose monitoring in children with Type 1 diabetes mellitus. J Pediatr Endocrinol Metab. 2021;34(3):311-317. PubMed
Karter AJ, Parker MM, Moffet HH, Gilliam LK, Dlott R. Association of real-time continuous glucose monitoring with glycemic control and acute metabolic events among patients with insulin-treated diabetes. JAMA. 2021;325(22):2273-2284. PubMed
Miller KM, Kanapka LG, Rickels MR, et al. Benefit of continuous glucose monitoring in reducing hypoglycemia Is sustained through 12 months of use among older adults with Type 1 diabetes. Diabetes Technol Ther. 2022;24(6):424-434. PubMed
Šoupal J, Petruzelkova L, Grunberger G, et al. Glycemic outcomes in adults With T1D are impacted more by continuous glucose monitoring than by insulin delivery method: 3 years of follow-up from the COMISAIR study. Diabetes Care. 2020;43(1):37-43. PubMed
Tanenbaum ML, Zaharieva DP, Addala A, et al. 'I was ready for it at the beginning': parent experiences with early introduction of continuous glucose monitoring following their child's Type 1 diabetes diagnosis. Diabet Med. 2021;38(8):e14567. PubMed
Wong B, Deng Y, Rascati KL. Healthcare utilization, costs, and adverse events of real-time continuous glucose monitoring (rtCGM) versus traditional blood glucose monitoring (BG) among US adults with Type 1 diabetes. J Diabetes Sci Technol. 2021:1-8. PubMed
Alternative Comparator
Boscari F, Vettoretti M, Cavallin F, et al. Implantable and transcutaneous continuous glucose monitoring system: a randomized cross over trial comparing accuracy, efficacy and acceptance. J Endocrinol Invest. 2022;45(1):115-124. PubMed
Elbalshy MM, Styles S, Haszard JJ, et al. The effect of do-it-yourself real-time continuous glucose monitoring on psychological and glycemic variables in children with Type 1 diabetes: A randomized crossover trial. Pediatr Diabetes. 2022;23(4):480-488. PubMed
Hásková A, Radovnicka L, Petruzelkova L, et al. Real-time CGM Is superior to flash glucose monitoring for glucose control in Type 1 diabetes: The CORRIDA randomized controlled trial. Diabetes Care. 2020;43(11):2744-2750. PubMed
Renard E, Riveline JP, Hanaire H, Guerci B, on behalf of the investigators of France Adoption Clinical Trial. Reduction of clinically important low glucose excursions with a long-term implantable continuous glucose monitoring system in adults with Type 1 diabetes prone to hypoglycaemia: the France Adoption Randomized Clinical Trial. Diabetes Obes Metab. 2022;24(5):859-867. PubMed
ISSN: 2563-6596
Disclaimer: The information in this document is intended to help Canadian health care decision-makers, health care professionals, health systems leaders, and policy-makers make well-informed decisions and thereby improve the quality of health care services. While patients and others may access this document, the document is made available for informational purposes only and no representations or warranties are made with respect to its fitness for any particular purpose. The information in this document should not be used as a substitute for professional medical advice or as a substitute for the application of clinical judgment in respect of the care of a particular patient or other professional judgment in any decision-making process. The Canadian Agency for Drugs and Technologies in Health (CADTH) does not endorse any information, drugs, therapies, treatments, products, processes, or services.
While care has been taken to ensure that the information prepared by CADTH in this document is accurate, complete, and up to date as at the applicable date the material was first published by CADTH, CADTH does not make any guarantees to that effect. CADTH does not guarantee and is not responsible for the quality, currency, propriety, accuracy, or reasonableness of any statements, information, or conclusions contained in any third-party materials used in preparing this document. The views and opinions of third parties published in this document do not necessarily state or reflect those of CADTH.
CADTH is not responsible for any errors, omissions, injury, loss, or damage arising from or relating to the use (or misuse) of any information, statements, or conclusions contained in or implied by the contents of this document or any of the source materials.
This document may contain links to third-party websites. CADTH does not have control over the content of such sites. Use of third-party sites is governed by the third-party website owners’ own terms and conditions set out for such sites. CADTH does not make any guarantee with respect to any information contained on such third-party sites and CADTH is not responsible for any injury, loss, or damage suffered as a result of using such third-party sites. CADTH has no responsibility for the collection, use, and disclosure of personal information by third-party sites.
Subject to the aforementioned limitations, the views expressed herein are those of CADTH and do not necessarily represent the views of Canada’s federal, provincial, or territorial governments or any third-party supplier of information.
This document is prepared and intended for use in the context of the Canadian health care system. The use of this document outside of Canada is done so at the user’s own risk.
This disclaimer and any questions or matters of any nature arising from or relating to the content or use (or misuse) of this document will be governed by and interpreted in accordance with the laws of the Province of Ontario and the laws of Canada applicable therein, and all proceedings shall be subject to the exclusive jurisdiction of the courts of the Province of Ontario, Canada.
The copyright and other intellectual property rights in this document are owned by CADTH and its licensors. These rights are protected by the Canadian Copyright Act and other national and international laws and agreements. Users are permitted to make copies of this document for non-commercial purposes only, provided it is not modified when reproduced and appropriate credit is given to CADTH and its licensors.
About CADTH: CADTH is an independent, not-for-profit organization responsible for providing Canada’s health care decision-makers with objective evidence to help make informed decisions about the optimal use of drugs, medical devices, diagnostics, and procedures in our health care system.
Funding: CADTH receives funding from Canada’s federal, provincial, and territorial governments, with the exception of Quebec.
Questions or requests for information about this report can be directed to Requests@CADTH.ca