Drugs, Health Technologies, Health Systems
Reimbursement Review
Mirvetuximab Soravtansine (Elahere)
Sponsor: AbbVie Corporation
Therapeutic area: Epithelial ovarian, fallopian tube, or primary peritoneal cancer
This multi-part report includes:
Clinical Review
TPA Review
Pharmacoeconomic Review
Clinical Review
Abbreviations
ADC
antibody-drug conjugate
AE
adverse event
AIBW
adjusted ideal body weight
BICR
blinded independent central review
BOR
best overall response
C1D1
cycle 1, day 1
CA-125
cancer antigen 125
CDA-AMC
Canada’s Drug Agency
CI
confidence interval
CR
complete response
DCO
data cut-off
DOR
duration of response
ECOG PS
Eastern Cooperative Oncology Group Performance Status
EOC
epithelial ovarian cancer
EORTC QLQ-OV28
European Organisation for Research and Treatment of Cancer Quality of Life Questionnaire Ovarian Cancer Module
ESS
effective sample size
FR
folate receptor
GI
gastrointestinal
GOC
Society of Gynecologic Oncology of Canada
GRADE
Grading of Recommendations, Assessment, Development and Evaluations
HR
hazard ratio
HRQoL
health-related quality of life
IC
investigator's choice
ILD
interstitial lung disease
IPD
individual patient data
ITC
indirect treatment comparison
ITT
intention to treat
MAIC
matching-adjusted indirect comparison
MIRV
mirvetuximab soravtansine
OC
ovarian cancer
OCC
Ovarian Cancer Canada
OH (CCO)
Ontario Health (Cancer Care Ontario)
OR
odds ratio
ORR
objective response rate
OS
overall survival
PARP
poly (ADP-ribose) polymerase 1
PFS
progression-free survival
PLD
pegylated liposomal doxorubicin
PR
partial response
PROC
platinum-resistant ovarian cancer
PSOC
platinum-sensitive ovarian cancer
QoL
quality of life
RCT
randomized controlled trial
RECIST 1.1
Response Evaluation Criteria in Solid Tumours Version 1.1
RMST
restricted mean survival time
SAE
serious adverse event
TEAE
treatment-emergent adverse event
Executive Summary
An overview of the submission details for the drug under review is provided in Table 1.
Table 1: Background Information on the Application Submitted for Review
Item | Description |
|---|---|
Drug product | Mirvetuximab soravtansine (Elahere), 5 mg/mL, concentrate for solution for injection, IV infusion |
Sponsor | AbbVie Corporation |
Indication | As monotherapy indicated for the treatment of adult patients with folate receptor (FR-alpha) alpha-positive, platinum-resistant epithelial ovarian, fallopian tube, or primary peritoneal cancer, who have received 1 to 3 prior systemic treatment regimens |
Reimbursement request | As per indication |
Health Canada approval status | NOC |
Health Canada review pathway | Priority review |
NOC date | August 29, 2025 |
Recommended dose | 6 mg/kg AIBW administered q.3.w. (21-day cycle) as an IV infusion until disease progression or unacceptable toxicity |
ABIW = adjusted ideal body weight; FR = folate receptor; NOC = Notice of Compliance; q.3.w. = once every 3 weeks.
Introduction
Epithelial ovarian cancer (EOC) is the most common type of ovarian cancer (OC) and the deadliest gynecologic malignancy. EOC can arise from the epithelium covering the fimbria of the fallopian tubes, the ovaries, or the peritoneal cavity.1 Approximately 85% to 95% of OCs are epithelial in origin.2-5 In most patients with advanced OC, the OC will initially respond to platinum-based chemotherapy; however, up to 70% experience disease recurrence.6-11 OC that responds to platinum-based chemotherapy but subsequently relapses 6 months or more after completion of platinum-based therapy is considered “platinum sensitive” whereas OC that relapses within 6 months of completing platinum-based therapy is considered “platinum resistant.”12 Up to 70% of patients with recurrent disease eventually develop platinum-resistant OC.6-11 Compared to other late-stage cancers, platinum-resistant OC (PROC) is difficult to treat; patients have severe symptoms that impair their quality of life (QoL) and have a very poor prognosis with limited treatment options. PROC is characterized by low expected objective response rates (ORRs) (i.e., 10% to 15%),12,13 short progression-free survival (PFS) (i.e., 3 to 6 months), and limited survival (i.e., median overall survival [OS]: 9 to 12 months).12,14 In addition to poor survival, patients have severe impairments in health-related quality of life (HRQoL), including frequent bowel obstruction, abdominal pain, residual neuropathy from prior therapies, and anxiety and fear, all of which have direct, severe impacts on their daily lives.
There is no cure for PROC. Therefore, the conventional treatment goals are to maximize or maintain HRQoL while improving OS by controlling disease or delaying further progression.15,16 Current therapies for patients with PROC consist primarily of non–platinum-based chemotherapy (e.g., weekly paclitaxel, pegylated liposomal doxorubicin [PLD], or topotecan), administered either as a single drug or in combination with bevacizumab.17-19 Single-drug, non–platinum-based chemotherapy treatments are associated with many toxicities in the clinical context of residual effects of prior chemotherapy, including sensory and motor neurotoxicity.20-25 Chemotherapy is also associated with numerous significant, severe adverse events (AEs);26-28 these are often experienced without any improvement in disease-related symptoms. Non–platinum-based chemotherapy is associated with low ORRs of 4% to 13%, median PFS of 3 to 4 months, and median OS of approximately 9 months to 12 months, as well as significant adverse effects that negatively affect HRQoL.17,26,27,29 Although bevacizumab in combination with chemotherapy shows modest improvements in PFS (median PFS = 6.7 months) and ORR (30.9%), it can be associated with higher rates of gastrointestinal (GI) perforation, hypertension, thrombotic complications, and proteinuria in patients with OC.30-35 Additional challenges in the treatment of PROC include the lack of meaningful, predictive biomarkers, which impedes targeted treatment. There is a significant unmet need for a novel therapeutic option for PROC that takes advantage of molecular targets, such as FR alpha, which have yet to be leveraged.
Mirvetuximab soravtansine (MIRV) is a first-in-class antibody-drug conjugate (ADC) targeting FR alpha, a protein that is commonly overexpressed on ovarian carcinomas and minimally expressed on normal tissues. MIRV comprises an FR alpha–binding antibody, a cleavable linker, and the maytansinoid DM4, a potent tubulin-targeting drug. Single-drug MIRV has shown anticancer activity and a safety profile that primarily includes low-grade GI, neurosensory, rare interstitial lung disease (ILD), and reversible ocular AEs. MIRV is approved by Health Canada as monotherapy for the treatment of adult patients with FR alpha–positive, platinum-resistant epithelial ovarian, fallopian tube, or primary peritoneal cancer who have received 1 to 3 prior systemic treatment regimens. The sponsor is requesting reimbursement as per the Health Canada indication.
The objective of this report is to review and critically appraise the evidence submitted by the sponsor on the beneficial and harmful effects of MIRV (5 mg/mL, concentrate for solution for injection, IV infusion) in the treatment of adult patients with FR alpha–positive, platinum-resistant epithelial ovarian, fallopian tube, or primary peritoneal cancer who have received 1 to 3 prior systemic treatment regimens.
Perspectives of Patient, Clinicians, and Drug Programs
The information in this section is a summary of the input provided by the patient and clinician groups who responded to our call for input and from the clinical experts consulted for the purpose of this review.
Patient Input
Input for this review was submitted by 1 patient group, Ovarian Cancer Canada (OCC). Information for this input was gathered through 10 patient or caregiver interviews conducted between December 16, 2024, and February 28, 2025, and through an online survey distributed to patients living in Canada conducted from February 12, 2025, to March 3, 2025. The survey received responses from 41 participants, 34 of whom were patients living with PROC and 7 of whom were caregivers. Most survey respondents had EOC (59%), were diagnosed between 2022 and 2024 (52%) at stage III or IV (95%), and had experienced a recurrence (91%). A total of 3 respondents (1 patient and 2 caregivers) had experience with MIRV.
Patients highlighted that OC led to severe impacts on their self-esteem, ability to participate in physical activity, sleep, and ability to care for themselves and their families. Patients noted that their OC had resulted in an inability to plan their future, particularly due to the known poor prognosis with recurrence or platinum resistance. Patients also noted a profound fear of leaving their families and children. Regarding prior treatment, 24% strongly disagreed and 43% neither agreed nor disagreed that prior treatments were able to manage their cancer. Survey respondents ranked prolonged survival (70%), improved QoL (65%), and lengthening time to recurrence (70%) as the most important outcomes for a new treatment. Eighty percent of patients indicated that they had considered taking MIRV. According to the patients, they are willing to tolerate hair loss (100%), fatigue (95%), aching joints (79%), neuropathy (70%), and eye problems (55%) if MIRV prolonged their life and improved daily functioning. Most respondents (71%) felt that the benefits of MIRV would outweigh the risks.
OCC interviewed 1 patient (aged 69 years) who had been diagnosed with stage III OC in 2021 and was treated with MIRV in the US from 2023 to 2024 as well as a caregiver whose mother was diagnosed in 2022 at age 77 years with PROC who also received treatment in the US from June to August 2024. Both patients had paid out of pocket for treatment; 1 patient required a reverse mortgage on their home to pay the approximate $108,000 in treatment costs, excluding travel, to receive only 3 treatments.
A total of 2 patients and 2 caregivers had experience with FR alpha testing to confirm eligibility for treatment with MIRV. The patient group highlighted that to access FR alpha testing in the US from Canada, patients need the time, funds, ability to travel, and an understanding of how to access tests in the US, often having to obtain this information through self-advocacy and self-education. Patients reported the FR alpha testing process is costly, lengthy, confusing, and stressful. They also reported no side effects from testing. FR alpha testing in the US was an additional out-of-pocket cost (US$4,500). There were delays associated with receiving test results and starting treatment.
Clinician Input
Input From Clinical Experts Consulted for This Review
Two clinical experts with experience in the diagnosis and medical management of patients with platinum-resistant epithelial ovarian, fallopian tube, or primary peritoneal cancer were consulted by Canada’s Drug Agency (CDA-AMC) for the review of MIRV.
The clinical experts consulted for the review noted that most patients become resistant to platinum-based therapy during their disease course and that PROC is characterized by high recurrence rates. The clinical experts noted that the treatment goals for PROC are to control disease, delay progression, manage symptoms, and maintain HRQoL. Current standard non–platinum-based chemotherapies, including paclitaxel, PLD, topotecan, and gemcitabine, with or without bevacizumab, offer limited clinical benefit, with low response rates (approximately 10% to 15%) and short expected durations of response (less than 6 months). As a result, new therapies that can meaningfully improve response rates, prolong survival, and address the underlying disease process while maintaining HRQoL are urgently needed.
The clinical experts noted that, compared to currently available therapies, which primarily offer symptom control, MIRV selectively targets tumour cells with high FR alpha expression and delivers a cytotoxic payload, offering a more targeted, disease-specific treatment. According to the clinical experts, MIRV should be considered as a first-line therapy upon confirmation of platinum resistance in eligible patients, given its response rate and survival benefit over existing available therapies. Both clinical experts noted that MIRV should be used as a single drug in patients with recurrent progressive PROC with high FR alpha expression, assessed using VENTANA FOLR1 (FOLR1-2.1) RxDx companion diagnostic assay (herein referred to as VENTANA FOLR1 Assay). Patients with low or absent FR alpha expression, or those unable to tolerate ADC-related toxicities, are less suitable candidates for treatment. According to the clinical experts, the diagnostic infrastructure for FR alpha expression is not yet standardized across Canada.
The clinical experts indicated that response to treatment should be assessed through a combination of symptom improvement, clinical and radiologic assessments, and standard outcome measures, including PFS, OS, and HRQoL. Treatment should be discontinued upon evidence of disease progression or the development of significant unresolved AEs, particularly ILD. The 2 clinical experts emphasized that MIRV should be administered in specialized oncology settings with multidisciplinary support, including optometry, ophthalmology, and pulmonology specialists, to monitor and manage drug-specific toxicities and ensure appropriate patient counselling and follow-up.
Clinician Group Input
Input for this review was submitted by 3 clinician groups: the BC Cancer Gynecologic Oncology Provincial Tumour Group, the Ontario Health (Cancer Care Ontario) Gynecologic Cancer Drug Advisory Committee (OH [CCO]), and the Society of Gynecologic Oncology of Canada (GOC). Information was gathered through published literature and the clinical experiences of physicians who treat patients with platinum-resistant cancer.
The groups noted that although initial OC treatment is typically effective with high response rates, most will subsequently relapse and develop recurrent disease, which is associated with poor prognosis and survival of 6 months to 12 months. The clinician groups highlighted that patients diagnosed with PROC represent a group with a high unmet need. According to clinical experts consulted for the review, treatment goals consist of improving PFS, delaying disease progression, and improving QoL by reducing symptom severity. The clinician groups noted the main treatment options are bevacizumab in combination with non–platinum-based chemotherapy, both of which have shown minimal impact on OS historically, have response rates less than 30%, and are associated with significant toxicity; in addition, OS rapidly becomes refractory to subsequent lines of treatment, which is in agreement with the input from the clinical experts consulted for the review.
The clinician group expressed differing opinions on the place in therapy for MIRV. OH (CCO) indicated it would provide an additional treatment option for patients for whom existing platinum-resistant options have failed; GOC indicated that MIRV would fit into the current treatment paradigm as an additional treatment option for platinum-resistant, recurrent, high-grade serous OC; and BC Cancer noted it would be used as the first treatment option in the setting of platinum resistance with high FR alpha expression, replacing non–platinum-based chemotherapy with or without bevacizumab. GOC noted that MIRV would be used as monotherapy and not combined with other treatments.
Clinician groups agreed that the patients best suited for MIRV are those with platinum-resistant, high-grade serous EOC with a high FR alpha expression (≥ 75% of cells with ≥ 2+ staining intensity). In clinical practice, the clinician groups noted that PFS and OS are the standard measures for assessing treatment response. The clinician groups agreed that a clinically meaningful treatment response would be defined as radiographic disease control (i.e., tumour response or stabilization as shown on CT or MRI) with improvement in cancer-related symptom burden and tolerable toxicity. Treatment discontinuation should be considered in the event of disease progression, intolerable AEs, or patient choice. Patients should receive treatment in an outpatient setting under the supervision (or guidance, in remote areas) of an oncologist. The clinician groups noted that access to optometry or ophthalmology is necessary to ensure ocular toxicities are appropriately assessed and managed.
Drug Program Input
Input was obtained from the drug programs that participate in the CDA-AMC reimbursement review process. Please refer to Table 4 for further information. The following were identified as key factors that could potentially affect the implementation of MIRV:
relevant comparators
considerations for initiation of therapy
considerations for continuation or renewal of therapy
considerations for prescribing of therapy
generalizability
funding algorithm (oncology only)
care provision issues
system and economic issues.
Clinical Evidence
Systematic Review
Description of Studies
One randomized controlled trial (RCT), the MIRASOL trial, was included in the sponsor’s systematic review. From February 2020 to July 2022, 453 patients (including patients from 8 Canadian sites) were enrolled in the MIRASOL trial. Patients were randomized at a ratio of 1 to 1 to receive single-drug MIRV (3-week regimen) (N = 227) or investigator’s choice (IC) chemotherapy (n = 226) (i.e., paclitaxel, PLD, or topotecan; 3-week or 4-week regimens). Randomization was stratified by the number of previous lines of therapy (1, 2, or 3) and the chemotherapy drug. Female patients aged 18 years of age or older with platinum-resistant disease and a confirmed diagnosis of high-grade serous EOC, primary peritoneal cancer, or fallopian tube cancer were included. Key inclusion criteria were radiographic progression on or after the most recent line of therapy; positive FR alpha expression, as assessed by the VENTANA FOLR1 Assay, prior treatment with at least 1 but no more than 3 prior systemic lines of anticancer therapy; and eligibility for single-drug therapy as the next appropriate line of treatment. All patients randomized to MIRV received MIRV at 6 mg/kg adjusted ideal body weight (AIBW) administered through IV every 3 weeks. For patients randomized to IC chemotherapy, the choice of chemotherapy (paclitaxel, PLD, or topotecan) was made before randomization; body weight from baseline was used to calculate body surface area to determine the required dose. No dose modifications were anticipated unless the patient’s body weight changed by plus or minus 10% from baseline. Patients continued to receive MIRV or the matching IC chemotherapy until disease progression, unacceptable toxicity, withdrawal of consent, or death, or until the sponsor terminated the study (whichever came first).
The primary objective of the MIRASOL trial was to compare the PFS of patients randomized to MIRV treatment versus IC chemotherapy. Key secondary objectives were to compare ORR, OS, and HRQoL assessed using the European Organisation for Research and Treatment of Cancer Quality of Life Questionnaire Ovarian Cancer Module (EORTC QLQ-OV28) for patients randomized to MIRV versus patients randomized to IC chemotherapy. Safety outcomes were AEs, serious adverse events (SAEs), AEs of special interest, and deaths. Notable harms included peripheral neuropathy, fatigue, keratopathy, blurred vision, and pneumonitis.
Demographic and baseline characteristics were similar between the MIRV and IC chemotherapy groups. The median ages were 64.0 years in the MIRV group and 62.0 years in the IC group. In the MIRV group, 80% of patients had EOC, 12% had fallopian tube cancer, 7% had primary peritoneal cancer, and 13% were BRCA-positive (87% had negative or unknown BRCA status); in the IC group, these proportions were 81%, 10%, 9%, and 16% BRCA-positive, respectively. High-grade serous histology that was poorly differentiated (██%) or unknown (██% versus ██%) was common in both groups. The most frequent stages at diagnosis were stage IIIC (53%) and stage IV (29%), with a median time since diagnosis of █████ months.
The primary data cut-off (DCO) date was March 6, 2023, and the latest DCO date was September 26, 2024.
Efficacy Results
The efficacy outcomes in the MIRASOL trial were PFS, OS, ORR, duration of response (DOR), and EORTC QLQ-OV28. Results are reported at the latest DCO unless otherwise stated.
Progression-Free Survival
The primary end point was PFS per investigator assessment. PFS was assessed based on radiological imaging and determined using Response Evaluation Criteria in Solid Tumours Version 1.1 (RECIST 1.1). CT or MRI scans were collected and held for sensitivity analysis by the BICR and were tested using a stratified log-rank test. The PFS curve was estimated using the Kaplan-Meier estimator. The DCO date for the primary PFS analysis was March 6, 2023; by that time, 330 events had occurred. The median PFS was 5.62 months (95% CI, 4.34 months to 5.95 months) in the MIRV treatment group compared to 3.98 months (95% CI, 2.86 months to 4.47 months) in the IC chemotherapy group. The hazard ratio (HR) for PFS was 0.65 (95% CI, 0.521 to 0.808; P < 0.0001). The Kaplan-Meier estimated difference in PFS probabilities between treatment groups at 6 months was ████ (95% CI, ████ ██ ████) in favour of MIRV. At 12 months, the estimated difference in PFS probability was ████ (95% CI, ████ ██ ████) in favour of MIRV. The results of the subgroup analyses of PFS by blinded independent central review (BICR) and sensitivity analysis were consistent with those of the overall population analyses and the investigator assessment, respectively. The PFS results at the latest DCO date were consistent with those at the primary DCO date.
Overall Survival
OS was a key secondary outcome, and its curve was estimated using the Kaplan-Meier estimator. The comparison of OS between treatment groups was performed using Cox proportional hazard regression and log-rank test. The DCO date for OS analysis was September 26, 2024; by that time, 300 events had occurred. The median OS was 16.85 months (95% CI, 14.36 months to 19.78 months) in patients randomized to MIRV and 13.34 months (95% CI, 11.37 months to 15.15 months) in the IC chemotherapy group. The HR for OS was 0.68 (95% CI, 0.543 to 0.840; P = 0.0004). The Kaplan-Meier estimated difference in OS probabilities between groups at 6 months was ████ (95% CI, █████ ██ ████) in favour of MIRV. At 18 months, the estimated difference in OS probability was ████ (95% CI, ████ ██ ████) in favour of MIRV. The results of the subgroup analysis showed a trend for benefit of MIRV over IC chemotherapy in OS at both DCO dates and was consistent with the results of the primary analyses.
Objective Response Ratio
ORR refers to the proportion of patients who achieved a pre-established reduction in tumour volume as a complete response (CR) or partial response (PR). ORR was a key secondary outcome and was assessed using RECIST Version 1.1. At the latest DCO date, a higher percentage of patients treated with MIRV achieved an ORR compared to patients treated with IC chemotherapy (████% versus ████%), with a between-group difference of ████% (95% CI, ████ ██ ████) in favour of MIRV. The results of the subgroup analyses were consistent with those of the overall primary analysis at both DCO dates. ORR per BICR was evaluated as a sensitivity analysis, and the results were consistent with those of the investigator assessment.
Duration of Response
DOR was a secondary outcome. It was defined only for patients who had a confirmed best overall response (BOR) of CR or PR. The comparison of DOR between treatment groups was conducted using Cox proportional hazard regression and log-rank test. At the latest DCO date, among the ██ patients with events in the MIRV group, the median DOR was ██ months (95% CI, ████ ██ ████) compared to ███ months (95% CI, ████ ██ ████) in the ██ patients with events in the IC chemotherapy group, with a between-group difference of ███ months (95% CI, ████ ██ ████) in favour of MIRV. In a sensitivity analysis, the median DOR by BICR was ████ months (95% CI, ████ ██ ████ months) in the MIRV group compared to ████ (95% CI, ████ ██ █████) in the IC chemotherapy group. No subgroup analyses were performed.
Health-Related Quality of Life
HRQoL was assessed using the EORTC QLQ-OV28. The EORTC QLQ-OV28 Abdominal/GI Symptoms subscale at week 8 or 9 was a key secondary end point. The EORTC QLQ-OV2836,37 consists of 28 items that assess QoL in patients with OC. Items are scored from 1 (not at all) to 4 (very much). Scores are derived by linearly transforming scale and/or standalone item raw scores to a 0-to-100 scale. Higher scores indicate worse symptoms. At the primary DCO date, 21% of patients in the MIRV group compared to 15% in the IC chemotherapy group achieved a 15-point symptom subscale decrease on the QLQ-OV28 Abdominal/GI Symptoms subscale at week 8 or 9, with a between-group difference of ████ (95% CI, █████ ██ █████) in favour of MIRV. In the change-from-baseline analysis, the difference in change from baseline in EORTC QLQ-OV28 Abdominal/GI Symptoms subscale at week 8 or 9 was –5.0 in favour of MIRV. These results were consistent with those at the primary DCO date.
Harms Results
A total of 210 patients (96%) treated with MIRV reported treatment-emergent adverse events (TEAEs) of any grade compared to 94% of patients in the IC chemotherapy group. Patients treated with MIRV reported fewer SAEs than those treated with IC chemotherapy (24% versus 33%). Compared to 16% of patients in the IC chemotherapy group, 9% of patients treated with MIRV reported TEAEs leading to discontinuation. Among patients treated with MIRV, ██ (████%) patients died compared to ███ (████%) patients in the IC chemotherapy. In both treatment groups, the primary cause of death was disease progression: ███% in the MIRV group versus ███% in the IC chemotherapy group.
Notable harms included peripheral neuropathy, fatigue, keratopathy, blurred vision, and pneumonitis. The proportions of patients with grade 3 peripheral neuropathy were similar in both treatment groups. Five patients in the MIRV group reported grade 3 fatigue compared to 11 patients in the IC chemotherapy group. Compared to IC chemotherapy, a greater proportion of patients treated with MIRV reported ocular TEAEs, including keratopathy (32% versus 0%) and blurred vision (41% versus 2%). The percentage of patients with pneumonitis was higher in the MIRV group than in the IC chemotherapy group (██% versus ██%).
Critical Appraisal
Internal Validity
The MIRASOL trial used stratified randomization of treatment based on the prognostic factors: number of previous lines of therapy (1, 2, or 3) and IC choice of chemotherapy (paclitaxel, PLD, or topotecan). However, details on allocation concealment were not provided by the sponsor. Baseline characteristics were balanced between treatment groups, and all analyses were conducted in the intention-to-treat (ITT) population. Missing data were low for efficacy outcomes, including PFS, OS, and ORR, while ██% (n = ██) and ██% (n = ██) of patients randomized to MIRV and IC chemotherapy had missing data on HRQoL assessed using the EORTC QLQ-OV28. The imputation methods for missing data were not fully described by the sponsor. The open-label design of the trial introduces the possibility of reporting, performance, and detection biases in the efficacy estimation of subjective harms and benefits. Among tumour efficacy outcomes (PFS, ORR), bias was minimized through the use of BICR, with high concordance between the investigator and BICR-assessed end points; OS is considered less susceptible to bias due to its objective nature. The trial reported that ██% of patients randomized to the MIRV group and ██% of patients randomized to IC chemotherapy received subsequent therapies. Notably, subsequent anticancer therapies were not formally balanced by protocol and were administered at investigator discretion. There was no formal sensitivity analysis adjusting OS estimates for postprogression therapies in the clinical study reports submitted by the sponsor. CDA-AMC notes that subsequent anticancer therapies could present a risk of bias for OS estimates if differential access or effectiveness of subsequent therapies existed between treatment groups. For the primary end point of PFS, the widths of the 95% confidence intervals (CIs) were not adjusted for multiplicity. For the key secondary end points of ORR, OS, and the EORTC QLQ-OV28 Abdominal/GI Symptoms scale, a hierarchical testing procedure was applied to control the family-wise type I error only if the null hypothesis for the primary end point was rejected at a 2-sided alpha level of 0.05.
External Validity
The population enrolled in the MIRASOL trial consisted of patients with platinum-resistant EOC who showed high FR alpha expression, defined as greater than or equal to 75% of tumour cells exhibiting greater than or equal to 2+ staining intensity, as assessed by the VENTANA FOLR1 Assay. According to the clinical experts consulted for the review, only 35% to 40% of patients with platinum-resistant EOC would meet this biomarker threshold, suggesting that MIRV is specific for this subgroup of patients with EOC. In addition, only patients with an Eastern Cooperative Oncology Group Performance Status (ECOG PS) of 0 or 1 were eligible, whereas in practice, a considerable proportion of patients with platinum-resistant disease have an ECOG PS of 2 or higher, particularly after multiple lines of therapy. The exclusion of patients with primary refractory disease, active ocular conditions, significant neuropathy, or serious comorbidities from the trial limits the generalizability of the efficacy results to patients with worse prognostic status who may still be considered eligible for treatment.
The clinical experts consulted for the review indicated that the comparator arm of IC chemotherapy, consisting of weekly paclitaxel, PLD, or topotecan, reflected the standard of care treatment options for platinum-resistant EOC in Canada and that the dosage schedules were consistent with Health Canada–approved labelling. Inputs from the clinical experts and patient and clinician groups suggested that the trial measured meaningful outcomes that are relevant to patients, including PFS, OS, and HRQoL as assessed through the EORTC QLQ-OV28. However, a key limitation was the incomplete measurement of HRQoL: the primary HRQoL analysis was assessed at week 8 or 9 only, with limited longer-term data reported. Given that HRQoL was identified as a key outcome by both patients and clinicians, the lack of long-term assessment of these data is a notable limitation.
GRADE Summary of Findings and Certainty of the Evidence
For the pivotal studies and RCTs identified in the sponsor’s systematic review, Grading of Recommendations, Assessment, Development and Evaluations (GRADE) was used to assess the certainty of the evidence for the outcomes considered most relevant to inform expert committee deliberations, and a final certainty rating was determined as outlined by the GRADE Working Group.38,39
Following the GRADE approach, evidence from the RCTs started as high-certainty evidence and could be rated down for concerns related to study limitations (which refers to internal validity or risk of bias), inconsistency across studies, indirectness, imprecision of effects, or publication bias.
When possible, certainty was rated in the context of the presence of an important (nontrivial) treatment effect; if this was not possible, certainty was rated in the context of the presence of any treatment effect (i.e., the clinical importance is unclear). In all cases, the target of the certainty of evidence assessment was based on the point estimate and its location relative to the threshold for a clinically important effect (when a threshold was available) or to the null.
The reference points for the certainty of evidence assessment for PFS, OS, ORR, HRQoL assessed using EORTC QLQ-OV28, and notable harms (including peripheral neuropathy, fatigue, keratopathy, blurred vision, and pneumonitis) were set according to the presence or absence of an important effect based on thresholds informed by the clinical experts consulted for this review. The reference point for the certainty of the evidence assessment for the EORTC QLQ-OV28 Abdominal/GI Symptoms subscale was set according to the 15-point symptom subscale decrease threshold that was informed by the literature.
Results of GRADE Assessments
Table 2 presents the GRADE summary of findings for MIRV from the MIRASOL trial for the treatment of adult patients with FR alpha–positive, platinum-resistant epithelial ovarian, fallopian tube, or primary peritoneal cancer who have received 1 to 3 prior systemic treatment regimens.
The selection of outcomes for the GRADE assessment was based on the sponsor’s Summary of Clinical Evidence, consultation with clinical experts, and input received from patient and clinician groups and public drug plans. The following list of outcomes was finalized in consultation with expert committee members:
PFS
OS
ORR
HRQoL measured using the EORTC QLQ-OV28
notable harms (peripheral neuropathy, fatigue, keratopathy, blurred vision, and pneumonitis).
Table 2: Summary of Findings for MIRV vs. IC Chemotherapy for Patients With FR Alpha–Positive, Platinum-Resistant Epithelial Ovarian, Fallopian Tube, or Primary Peritoneal Cancer (DCO Date of September 26, 2024)
Outcome and follow-up | Patients (studies), N | Relative effect (95% CI) | Absolute effects (95% CI) | Certaintya | What happens | ||
|---|---|---|---|---|---|---|---|
IC chemotherapy | MIRV | Difference | |||||
PFS by investigator | |||||||
Probability of PFS at 6 months Median follow-up: █████ months | 453 (1 RCT) | NR | ████ ███ | ████ ███ | ████ | Moderateb | MIRV likely results in an increase in PFS compared to IC chemotherapy at 6 months. |
Probability of PFS at 12 months Median follow-up: █████ months | 453 (1 RCT) | NR | ████ ███ | ████ ███ | ████ | Highc | MIRV results in an increase in PFS compared to IC chemotherapy at 12 months. |
OS | |||||||
Probability of OS at 6 months Median (range) follow-up: █████ (██████) months | 453 (1 RCT) | NR | ████ ███ | ████ ███ | ████ | Lowd | MIRV may result in little to no difference in OS compared to IC chemotherapy at 6 months. |
Probability of OS at 18 months Median follow-up: █████ months | 453 (1 RCT) | NR | ████ ███ | ████ ███ | ████ | Moderatee | MIRV likely results in an increase in OS compared to IC chemotherapy at 18 months. |
ORR per investigator | |||||||
ORR (per investigator) Median follow-up: █████ months | 453 (1 RCT) | NR | ████ ███ | ████ ███ | ████ | Highf | MIRV results in a higher proportion of patients achieving overall response compared to IC chemotherapy. |
HRQoL | |||||||
N (%) of patients achieving at least a 15% (i.e., ≥ 15-point) absolute improvement on the EORTC QLQ-OV28 Abdominal/GI Symptoms scale Time point: 8/9 weeks | 312 (1 RCT) | NR | 23 (15.3) | 34 (21.0) | ████ | Lowg | MIRV may result in little to no difference in HRQoL compared to IC chemotherapy. |
Harms | |||||||
Patients with peripheral neuropathy Follow-up: NR Time point: end of trial | 425 (1 RCT) | ████ ███ | ████ ███ | ████ ███ | ████ | Lowh | MIRV may result in little to no difference in peripheral neuropathy compared to IC chemotherapy. |
Patients with fatigue Follow-up: NR Time point: end of trial | 425 (1 RCT) | ████ ███ | ████ ███ | ████ ███ | ████ | Lowi | MIRV may result in little to no difference in fatigue compared to IC chemotherapy. |
Patients with keratopathy Follow-up: NR Time point: end of trial | 425 (1 RCT) | NR | ████ ███ | ████ ███ | ████ | Moderatej | MIRV likely results in an increase in keratopathy compared to IC chemotherapy. |
Patients with blurred vision Follow-up: NR Time point: end of trial | 425 (1 RCT) | ████ ███ | ████ ███ | ████ ███ | ████ | Highj | MIRV results in an increase in blurred vision compared to IC chemotherapy. |
Patients with pneumonitis Follow-up: NR Time point: end of trial | 425 (1 RCT) | ████ ███ | ████ ███ | ████ ███ | ████ | Moderatek | MIRV likely results in an increase in pneumonitis compared to IC chemotherapy. |
CI = confidence interval; DCO = data cut-off; DOR = duration of response; IC = investigator’s choice; EORTC QLQ-OV28 = European Organisation for Research and Treatment of Cancer Quality of Life Questionnaire Ovarian Cancer Module; FR = folate receptor; GI = gastrointestinal; LS = least squares; MID = minimal important difference; MIRV = mirvetuximab soravtansine; NR = not reported; OS = overall survival; ORR = overall response rate; PFS = progression-free survival; RCT = randomized controlled trial.
aStudy limitation (which refers to internal validity or risk of bias), inconsistency across studies, indirectness, imprecision of effects, and publication bias were considered when assessing the certainty of the evidence. All serious concerns in these domains that led to the rating down of the level of certainty are documented in the table footnotes.
bRated down 1 level for imprecision. In the absence of a validated MID, the threshold was informed by clinical experts consulted for this review. A between-group absolute risk difference of 5% (i.e., ≥ 50 fewer events per 1,000 patients) at 6 months and 12 months was considered clinically significant by the clinical experts. The 95% CI included both a meaningful benefit and the possibility of no effect.
cIn the absence of a validated MID, the threshold was informed by clinical experts consulted for this review. A between-group absolute risk difference of 5% (i.e., ≥ 50 fewer events per 1,000 patients) at 6 months and 12 months was considered clinically significant by the clinical experts. The point estimate and entire CI exceeded the threshold.
dRated down 2 levels for serious imprecision. In the absence of a validated MID, the threshold was informed by clinical experts consulted for this review. A between-group absolute risk difference of 5% (i.e., ≥ 50 fewer events per 1,000 patients) at 6 months was considered clinically significant by the clinical experts. The 95% CI included both a meaningful benefit and the possibility of no effect.
eRated down 1 level for imprecision. In the absence of a validated MID, the threshold was informed by clinical experts consulted for this review. A between-group absolute risk difference of 5% (i.e., ≥ 50 fewer events per 1,000 patients) at 18 months was considered clinically significant by the clinical experts
fIn the absence of a validated MID, the threshold was informed by clinical experts consulted for this review. A between-group absolute risk difference of 10% (i.e., ≥ 100 fewer events per 1,000 patients) was considered clinically significant by the clinical experts. The point estimate and entire CI exceeded the threshold.
gRated down 2 levels for serious imprecision. In the absence of a validated MID, the threshold was informed by clinical experts consulted for this review. A between-group absolute risk difference of 10% (i.e., ≥ 100 fewer events per 1,000 patients) was considered clinically significant by the clinical experts. The 95% CI included both a meaningful benefit and the possibility of no effect.
hRated down 2 levels for serious imprecision. In the absence of a validated MID, the threshold was informed by clinical experts consulted for this review. A between-group absolute risk difference of 10% (≥ 100 fewer events per 1,000 patients) was considered clinically significant by the clinical experts. The point estimate did not exceed this threshold, and the CI included the possibility of no effect, introducing uncertainty.
iRated down 2 levels for serious imprecision. In the absence of a validated MID, the threshold was informed by clinical experts consulted for this review. A between-group absolute risk difference of 10% (i.e., ≥ 100 fewer events per 1,000 patients) was considered clinically significant by the clinical experts. The point estimate was lower than this threshold, and the CI included both a meaningful increase and no effect, introducing uncertainty.
jIn the absence of a validated MID, the threshold was informed by the clinical experts consulted for this review. The point estimate and CI exceeded the 10% threshold (i.e., 100 per 1,000 patients) for clinical significance.
kRated down 1 level for imprecision. In the absence of a validated MID, the threshold was informed by clinical experts consulted for this review. A between-group absolute risk difference of 10% (i.e., ≥ 100 fewer events per 1,000 patients) was considered clinically significant by the clinical experts. Although the point estimate and upper CI exceeded this threshold, the lower CI was slightly lower than this threshold, introducing uncertainty.
Source: MIRASOL trial Clinical Study Report.40 Details included in the table are from the sponsor’s Summary of Clinical Evidence.
Long-Term Extension Studies
There were no relevant long-term extension studies submitted for this review.
Indirect Comparisons
In the absence of direct head-to-head trials evaluating the efficacy of MIRV compared to bevacizumab and chemotherapy in adult patients with PROC who have received 1 to 3 prior systemic treatment regimens, the sponsor conducted and submitted an indirect treatment comparison (ITC). The objective of this section is to summarize and critically appraise the sponsor-submitted ITC and to inform the pharmacoeconomic model.
Description of Studies
The sponsor conducted a matching-adjusted indirect comparison (MAIC) using individual patient data (IPD) from the MIRASOL study and published aggregate data from the AURELIA study (bevacizumab plus IC chemotherapy). The MAIC adjusted for the following baseline characteristics: IC chemotherapy, age, number of prior lines of therapy, platinum-free interval, ECOG PS, and cancer antigen 125 (CA-125) levels. It was not feasible to adjust additional baseline characteristics due to lack of testing or reporting in the AURELIA trial, more restrictive inclusion criteria in the MIRASOL trial, and impact on sample size.
Efficacy Results
The risk of progression or death in the MIRV arm was comparable to that in the bevacizumab and chemotherapy arm, both before matching (HR = ████ [95% CI, ████ ██████]) and after matching (HR = ████ [95% CI, ████ ██ ████]). Risk of death in the MIRV arm was lower than in the bevacizumab and chemotherapy arm, with an HR of ████ (95% CI, ████ ██ ████) before matching and an HR of ████ (95% CI, ████ ██ ████) after matching for MIRV versus bevacizumab and chemotherapy. For ORR, the OR of MIRV versus bevacizumab and chemotherapy was ████ (95% CI, ████ ██ ████) before matching; it increased to ████ (95% CI, ████ ██ ████) after matching, indicating numerically higher odds of overall response in the MIRV arm than in the bevacizumab and chemotherapy arm.
Harms Results
After matching, the odds ratio (OR) of grade 3 or higher TEAEs in the MIRV group versus the bevacizumab and chemotherapy group was ████ (95% CI, ████ ██ ████), indicating numerically lower odds of grade 3 or higher TEAEs in the MIRV arm than in the bevacizumab and chemotherapy arm. The ORs of discontinuation due to any TEAE in the MIRV arm versus the bevacizumab and chemotherapy arm were ████ (95% CI, ████ ██ ████) before matching and ████ (95% CI, ████ ██ ████) after matching, indicating lower odds of discontinuation due to any TEAE in the MIRV arm than in the bevacizumab and chemotherapy arm.
Critical Appraisal
The sponsor-submitted ITC was informed by a systematic literature review. The 2 included studies, the MIRASOL trial and the AURELIA trial, were phase III, global, multicentre, open-label RCTs among adult patients with epithelial ovarian, fallopian tube, or primary peritoneal cancer, with a focus on adult patients with platinum-resistant disease and similar median follow-up durations. The trials were conducted 10 years apart. The sponsor conducted a methodologically sound MAIC and reported on key aspects, including patient population matching, outcome definitions, statistical methods, and assessment of heterogeneity. Some key patient characteristics could feasibly be adjusted in the MAIC, including the number of prior lines of therapy, platinum-free intervals, choice of preassigned chemotherapy, and ECOG PS. Other key characteristics identified by the clinical experts consulted for this review — including tumour histology, FR alpha expression status, prior poly (ADP-ribose) polymerase (PARP) inhibitor use, and prior bevacizumab use — could not be adjusted due to lack of testing or reporting in the AURELIA trial, more restrictive inclusion criteria in the MIRASOL trial, or impact on sample size. The sponsor and the clinical experts have noted that the treatment landscape of OC evolved in the time between the trials; as a result, in the AURELIA trial, all patients had no prior exposure to PARP inhibitors and had prior antiangiogenic therapy at baseline. The clinical experts noted that the serous histology subtype, which was a required subtype for inclusion in the MIRASOL trial but not in the AURELIA trial, generally has a better prognosis than other subtypes. The sponsor and clinical expert noted that FR alpha expression has been shown to be an effect modifier for both MIRV and pooled chemotherapy; FR alpha was not reported in the AURELIA trial. As a result of this heterogeneity between patient populations in the trials, the clinical experts concluded that no meaningful cross-trial comparison could be made. In addition, due to poor overlap in patients’ baseline characteristics between the trials, the small effective sample size (ESS) after matching (██ for the MIRV arm and ██ for the chemotherapy arm in the MIRASOL trial) limited the power to detect statistically significant differences in treatment effects and constrained the ability to adjust for additional baseline characteristics.
ITC results were presented for OS, PFS, ORR, and harms outcomes; other outcomes of relevance to patients (e.g., HRQoL) were not reported.
Studies Addressing Gaps in the Evidence From the Systematic Review
No relevant studies addressing gaps in the evidence from the systematic review were submitted by the sponsor.
Conclusions
The MIRASOL trial demonstrated with moderate to high certainty that MIRV offers clinically meaningful improvement in PFS compared with IC chemotherapy in patients with platinum-resistant EOC whose tumours express high FR alpha, assessed according to the VENTANA FOLR1 Assay (i.e., ≥ 75% of viable tumour cells with ≥ 2+ staining intensity). MIRV likely led to an increase in OS compared to IC chemotherapy at 18 months. However, while MIRV demonstrated a higher ORR compared to IC chemotherapy, it resulted in little to no clinically important difference in the proportion of patients who reported a clinically meaningful improvement on the EORTC QLQ-OV28 Abdominal/GI Symptoms subscale compared to IC chemotherapy. MIRV was characterized by low-grade, reversible ocular, GI, and neurosensory AEs, including dry eye, abdominal pain, diarrhea, nausea, and constipation. We determined with low to moderate certainty that notable harms, including peripheral neuropathy, fatigue, keratopathy, and pneumonitis, showed little to no difference in patients treated with MIRV compared to IC chemotherapy. On the other hand, there was high-certainty evidence that treatment with MIRV resulted in blurred vision compared to IC chemotherapy.
The sponsor-submitted ITC provides mixed or comparable treatment effects of MIRV and of bevacizumab combined with chemotherapy on PFS and OS. Evidence from the ITC favours MIRV in the safety outcomes. As a result of the heterogeneity between patient populations in both trials and the evolution of the treatment landscape of OC in the time between the trials, the effects estimates could be biased and underestimate treatment differences.
Introduction
The objective of this report is to review and critically appraise the evidence submitted by the sponsor on the beneficial and harmful effects of MIRV (5 mg/mL, concentrate for solution for injection, IV infusion) in the treatment of adult patients with FR alpha–positive, platinum-resistant epithelial ovarian, fallopian tube, or primary peritoneal cancer who have received 1 to 3 prior systemic treatment regimens.
Disease Background
The contents within this section have been informed by materials submitted by the sponsor and by clinical expert input. The following has been summarized and validated by the review team.
OC is a highly heterogenous disease and the third most frequently diagnosed gynecological cancer globally.41 The age-standardized incidence rate of OC in Canada (excluding Québec) was 14.3 per 100,000 in 2019.42 In 2022, the 5-year prevalence of OC was estimated to be 54.6 per 100,000.43 Estimates from 2024 suggests there were 3,000 new cases and 2,000 deaths that year due to OC, making it the leading cause of death from gynecological cancers.44 EOC comprises the vast majority of all OCs and is the deadliest gynecologic malignant neoplasm. EOC arises from the epithelium covering the fimbria of the fallopian tubes, the ovaries, or the peritoneal cavity.1 The main subtypes of epithelial ovarian tumours are high-grade serous, low-grade serous, endometrioid, clear cell, and mucinous tumours.12,45,46 About 85% to 95% of OCs are epithelial in origin, and the majority (75% to 92%) are high-grade serous OCs.2-5 The overall lifetime risk of developing EOC is 1.3%; this risk is elevated substantially (to 40% to 45%) for patients who carry a BRCA1 mutation. It is elevated to 15% to 20% for BRCA2 mutation carriers.47,48
Most people with advanced OC will initially respond to platinum-based chemotherapy; however, up to 70% will experience disease recurrence, with subsequent treatment determined by the DOR following platinum therapy.6-11 Although there is no universally accepted definition of PROC, OC that responds to platinum-based chemotherapy and subsequently relapses 6 months or more after completion is classified as platinum sensitive, while OC that relapses within 6 months is classified as platinum resistant.12 Platinum-sensitive ovarian cancer (PSOC) will respond to further platinum-based chemotherapy, with response rates ranging from 30% to 90%.12 However, up to 70% with recurrence will eventually develop platinum resistance.6-11 Compared to other late-stage cancers, PROC is difficult to treat, and patients face a very poor prognosis with limited treatment options. PROC is associated with worse outcomes than PSOC, characterized by low expected ORRs (10% to 15%),12,13 short PFS (3 to 6 months), and limited survival (median OS = 9 to 12 months for PROC versus 24 to 36 months for PSOC).12,14 In addition to poor survival, patients have severe impairments in HRQoL, including frequent bowel obstruction, abdominal pain, residual neuropathy from prior therapies, and anxiety and fear, all of which have direct, severe impacts on their daily activities.
The diagnosis of OC uses a layered approach. Depending on the absence or presence of symptoms, staging is performed following clinical workup on the tumour and various assessments (e.g., ultrasound, CT, and/or MRI). Genetic testing for OC susceptibility genes is also recommended.49 Genes that are tested include, but are not limited to, BRCA1 and BRCA2 and genes from the mismatch repair family. An additional challenge in the treatment of PROC is the lack of meaningful, predictive biomarkers, which can impede the continuation of treatment. FR alpha is a novel biomarker of therapeutic relevance. It is a 3,840 kDA glycosylphosphatidylinositol-anchored cell surface protein encoded by the FOLR1 gene.6 This protein is constitutively overexpressed in nearly 40% of OC solid tumours50 and minimally expressed in nonmalignant tissues.51-53 This allows targeted delivery of therapy to the malignant tissue while minimizing collateral toxic side effects.53-57 Folate receptors have been shown to be expressed at elevated levels in more than 70% of primary and 80% of recurrent EOCs.53,57 The VENTANA FOLR1 Assay is IHC assay used to identify patients with EOC who are eligible for FOLR1-targeted treatment. In EOC tissue, neoplastic cells labelled with the VENTANA FOLR1 Assay are evaluated for the percentage of tumour cell staining using immunohistochemistry.
Standards of Therapy
The contents within this section have been informed by materials submitted by the sponsor and by clinical expert input. The following has been summarized and validated by the review team.
The treatment goals for OC vary depending on the stage at which it is diagnosed and response to platinum-based chemotherapy. When diagnosed early (i.e., early-stage OC), the treatment goal is to eradicate disease through surgery and chemotherapy while adequately preserving HRQoL.15,19 As previously noted, platinum resistance is a major factor contributing to mortality in patients, especially because PROC is more difficult to treat than other late-stage cancers. PROC is associated with worse outcomes. These are characterized by low ORRs (10% to 15%), short PFS (3 months to 6 months),12,13 shorter survival compared with PSOC (median OS = 9 to 12 months for PROC versus 24 to 36 months for PSOC),12,14 and significant impacts on patients’ QoL. There is no cure for PROC; therefore, the conventional treatment goals are to maximize or maintain HRQoL and to improve OS by controlling disease or delaying progression.15,16
In the Canadian practice landscape, treatment options for PROC include single-drug, non–platinum-based chemotherapy (i.e., paclitaxel, PLD, topotecan, gemcitabine) with or without bevacizumab.17-19 These treatments for PROC are associated with multiple limitations. The single-drug, non–platinum-based chemotherapy treatments are associated with many toxicities in the clinical context of residual effects of prior chemotherapy, including sensory and motor neurotoxicity following treatment.20-25 Chemotherapy is also associated with many significant, severe AEs (grade ≥ 3 AEs are reported in 54% to 65.2% of patients treated with chemotherapy);26-28 these are often experienced without any improvement in disease-related symptoms. Furthermore, non–platinum-based chemotherapy is associated with low ORRs (4% to 13%), median PFS (3 to 4 months), median OS of 9 months to 12 months, and significant adverse effects that negatively affect patients’ QoL.17,26,27,29 The efficacy and safety of bevacizumab is limited to patients in the early-line treatment setting (i.e., 2 or fewer prior anticancer regimens); although bevacizumab in combination with chemotherapy shows modest improvements in PFS (median PFS = 6.7 months) and ORR (30.9%), it can be associated with higher rates of GI perforation, hypertension, thrombotic complications, and proteinuria in patients with OC.30-34 There is a high unmet medical need in patients with no standard treatment option after their third-line treatment. The clinical experts consulted for this review indicated that the choice of non–platinum-based chemotherapy drug is based on various patient factors, preexisting residual chemotherapy side effects, and the anticipated toxicity profile for each chosen chemotherapeutic drug. The expected response rate in this clinical setting is 10% to 15%, with a DOR around 6 months; expected survival after diagnosis of platinum-resistant disease is 9 months to 12 months. Ongoing symptom management with disease progression is frequently needed. The limitations of current therapies suggest that there is a significant, urgent need for a novel therapeutic option to treat PROC that leverages biomarkers, such as FR alpha. Given the poor efficacy in terms of survival and response rates — as well as the notable impacts on QoL and the safety concerns associated with current treatments — effective and tolerable treatments that improve survival and QoL and reduce the symptom burden and toxicities associated with current treatments are needed.
Drug Under Review
The key characteristics of MIRV are summarized in Table 3 along with those of other treatments available for adult patients with platinum-resistant epithelial ovarian, fallopian tube, or primary peritoneal cancer.
MIRV is indicated as monotherapy for the treatment of adult patients with FR alpha–positive, platinum-resistant epithelial ovarian, fallopian tube, or primary peritoneal cancer who have received 1 to 3 prior systemic treatment regimens. MIRV is provided as concentrate for solution for IV infusion, 5 mg/mL per vial. The recommended dosage is 6 mg/kg AIBW administered once every 3 weeks (i.e., in 21-day cycles). MIRV is an ADC. The antibody is a chimeric immunoglobulin G1 directed against FR alpha. The small molecule, DM4, is a microtubule inhibitor attached to the antibody through a cleavable linker. Upon binding to FR alpha, MIRV is internalized; this is followed by the intracellular release of DM4 through proteolytic cleavage. DM4 disrupts the microtubule network within the cell, resulting in cell cycle arrest and apoptotic cell death. MIRV is approved by Health Canada as monotherapy for the treatment of adult patients with FR alpha–positive, platinum-resistant epithelial ovarian, fallopian tube, or primary peritoneal cancer who have received 1 to 3 prior systemic treatment regimens. The sponsor is requesting reimbursement as per the Health Canada indication. The approved MIRV indication in the US aligns with the approved Health Canada indication.
Table 3: Key Characteristics of MIRV and Comparators
Characteristic | MIRV | Paclitaxel | PLD | Topotecan | Bevacizumab |
|---|---|---|---|---|---|
Mechanism of action | Antibody-drug conjugate that binds to FR alpha and disrupts the cell microtubule network, resulting in cell cycle arrest and apoptotic cell death | Antimicrotubule, antineoplastic drug that disrupts the microtubule system and blocks cells in the late gap2 and mitotic phases of the cell cycle, inhibiting cell replication and impairing nervous tissue function | Intercalates DNA, leading to the inhibition of replication and proper cell division | Inhibits topoisomerase 1, inducing breaks in the protein-associated DNA and resulting in cell death | Recombinant humanized monoclonal antibody that selectively binds to and neutralizes the biologic activity of VEGF to inhibit its binding to receptors Flt-1 and KDR on the surface of endothelial cells, reducing vascularization of tumours and inhibiting growth |
Indication | As monotherapy for the treatment of adult patients with FR alpha–positive, platinum-resistant epithelial ovarian, fallopian tube, or primary peritoneal cancer who have received 1 to 3 prior systemic treatment regimens | First-line treatment in combination with other chemotherapeutic drugs Second-line treatment of metastatic carcinoma of the ovary after failure of standard therapy | Treatment of advanced ovarian carcinoma in patients for whom standard first-line therapy (i.e., platinum and paclitaxel-based chemotherapy) has failed | Metastatic carcinoma of the ovary after failure of initial or subsequent therapy | In combination with carboplatin and gemcitabine for the treatment of patients with first recurrence of platinum-sensitive epithelial ovarian, fallopian tube, or primary peritoneal cancer (these patients should not have received prior VEGF-targeted therapy, including Avastin) |
Route of administration | IV | IV | IV | IV | IV |
Recommended dose | 6 mg/kg AIBW q.3.w. (i.e., 21-day cycles) until disease progression or unacceptable toxicity | For platinum-resistant ovarian cancer: 80 mg/m2 on days 1, 8, 15, and 22 of a 4-week cycle | 40 mg/m2 to 50 mg/m2 on day 1 of a 4-week cycle | 4 mg/m2 on days 1, 8, and 15 of a 4-week cycle OR 1.25 mg/m2 on days 1 to 5 of a 3-week cycle | 10 mg/kg of body weight q.2.w., administered in combination with 1 of paclitaxel, topotecan (weekly), or pegylated liposomal doxorubicin;58 or 15 mg/kg q.3.w. when administered in combination with topotecan given on days 1 to 5 |
Serious adverse effects or safety issues |
|
|
|
|
|
AIBW = adjusted ideal body weight; CHF = congestive heart failure; CV = cardiovascular; FR = folate receptor; GI = gastrointestinal; MIRV = mirvetuximab soravtansine; KDR = kill-to-death ratio ; PLD = pegylated liposomal doxorubicin; PRES = posterior reversible encephalopathy syndrome; q.2.w. = every 2 weeks; q.3.w. = every 3 weeks; TE = tracheoesophageal; VEGF = vascular endothelial growth factor.
Sources: MIRV Product Monograph;59 Paclitaxel Drug Monograph;60 PLD Drug Monograph;61 Topotecan Regimen Monograph;62 Bevacizumab Drug Monograph.63
Perspectives of Patients, Clinicians, and Drug Programs
The full patient and clinician group submissions received are available in the consolidated patient and clinician group input document for this review on the project website.
Patient Group Input
This section was prepared by the review team based on the input provided by patient groups.
Input for this review was submitted by 1 patient group, OCC. OCC is a national charity that advocates for people affected by OC through research, education, and support. Information for this input was gathered through 10 patient or caregiver interviews from December 16, 2024, to February 28, 2025, and through an online Canadian survey distributed to patients in Canada available from February 12, 2025, to March 3, 2025. The survey received responses from 41 participants, 34 of whom were patients living with PROC and 7 of whom were caregivers. Survey and interview participants were from Alberta, British Columbia, Manitoba, Ontario, Québec, Saskatchewan, and California. Most had EOC (59%), had been diagnosed between 2022 and 2024 (52%) at stage III or IV (95%), and had experienced a recurrence (91%). A total of 3 interviewees (1 patient and 2 caregivers) had experience with MIRV.
Patients highlighted that OC had a severe impact on their self-esteem, sleep, ability to participate in physical activity, and ability to care for themselves and their families. Patients noted that their OC had resulted in an inability to plan for their future, particularly due to the known poor prognosis with recurrence or platinum resistance. Patients also noted a profound fear of leaving their families and children. Prior reported treatments included surgery (95%), chemotherapy (91%), PARP inhibitors (41%), bevacizumab (36%), and radiation (5%); however, 24% of those who responded strongly disagreed (and 43% neither agreed nor disagreed) that these treatments were able to manage their cancer. Fatigue, hair loss, bowel problems, brain fog, shortness of breath, neuropathy, and blood-related conditions (e.g., anemia) were among the reported side effects of treatment, with the greatest impact being poor QoL. Patients also reported significant barriers to accessing treatment, particularly due to travel burden and treatment cost. While most patients initially respond well to platinum-based chemotherapy, the patient group noted that many develop resistance and are left with no effective treatment options.
Survey respondents ranked prolonged survival (70%), improved QoL (65%), and lengthening time to recurrence (70%) as the most important outcomes for a new treatment. Most had considered MIRV (80%) and indicated that an associated moderate improvement (63%) in OC (as opposed to high improvement) would be sufficient for them to consider using it. According to patients, they would be willing to tolerate hair loss (100%), fatigue (95%), aching joints (79%), neuropathy (70%), and eye problems (55%) if MIRV prolonged their lives and improved their daily functioning. As a result, most respondents (71%) felt that the benefits of MIRV would outweigh the risks.
OCC interviewed 1 patient (aged 69 years) who had been diagnosed with stage III OC in 2021 and treated with MIRV in the US from 2023 to 2024. OCC also interviewed 1 caregiver whose mother was diagnosed in 2022 at age 77 years with PROC and received treatment in the US from June 2024 to August 2024. Both patients paid out of pocket for treatment, with 1 patient requiring a reverse mortgage on their home to pay the approximate $108,000 in treatment costs, excluding travel, to receive 3 only treatments. Both patients reported a decrease in CA-125 markers, with 1 patient experiencing a decrease to 1,800 from 3,700 after 1 treatment. One patient experienced additional improvements in energy and mobility, with minimal side effects except a slow onset of eye; this initially resolved with steroids, but progressed over time, and the patient will require cataract surgery in both eyes. The other patient reported a “somewhat negative” impact on QoL due to the stress of having to travel for treatment and secure financing (resulting in a 3- to 4-month treatment gap); this patient also reported fatigue and appetite issues. They were eventually required to stop treatment due to being too weak to travel to California.
A total of 2 patients and 2 caregivers had experience with FR alpha testing in the US. The patient group highlighted that to access FR alpha testing in the US from Canada, patients need time, funds, the ability to travel, and an understanding of how to access the tests; often, they must obtain this information through self-advocacy and self-education. Patients reported the FR alpha testing process was costly, lengthy, confusing, and stressful. However, they reported no side effects from testing. FR alpha testing in the US was an additional out-of-pocket cost (US$4,500), and there were delays associated with receiving results and starting treatment.
Clinician Input
Input From Clinical Experts Consulted for This Review
All CDA-AMC review teams include at least 1 clinical specialist with expertise regarding the diagnosis and management of the condition for which the drug is indicated. Clinical experts are a critical part of the review team and are involved in all phases of the review process (e.g., providing guidance on the development of the review protocol, assisting in the critical appraisal of clinical evidence, interpreting the clinical relevance of the results, and providing guidance on the potential place in therapy). The following input was provided by 2 clinical specialists with expertise in the diagnosis and management of epithelial ovarian, fallopian tube, or primary peritoneal cancer.
Unmet Needs
The clinical experts consulted for this review highlighted that platinum-resistant epithelial ovarian, fallopian tube, and primary peritoneal cancers are characterized by high recurrence rates; most patients become resistant to platinum-based therapy during their disease trajectory. The clinical experts noted that the treatment goals for PROC are to control disease progression, manage symptoms, and maintain HRQoL. According to the clinical experts, current treatments, including non–platinum-based chemotherapies (such as paclitaxel, PLD, topotecan, and gemcitabine with or without bevacizumab) offer limited clinical benefit and duration. The response rates with these therapies are low (approximately 10% to 15%), and the DOR is about 6 months. The clinical experts emphasized that currently available therapies largely focus on symptom control and do not meaningfully alter the disease trajectory or significantly improve survival outcomes. Many patients become refractory to these options or experience cumulative additional toxicities that limit their ability to tolerate further treatment. As a result, new therapies that can meaningfully improve response rates, prolong survival, and address the underlying disease process while maintaining HRQoL are urgently needed.
Place in Therapy
The clinical experts noted that compared to current therapies, which primarily offer symptom control, MIRV targets tumour cells with FR alpha expression and delivers a cytotoxic payload, offering a more targeted, disease-modifying treatment. According to the clinical experts, MIRV should be considered as a first-line therapy upon confirmation of platinum resistance in eligible patients, given its response rate and survival benefit over existing therapies in PROC. The clinical experts noted that MIRV should be used as a single drug in the management of platinum-resistant disease. According to the clinical experts, MIRV will lead to a shift in the treatment paradigm for PROC, with an estimated 30% of patients potentially eligible based on high FR alpha expression. The clinical experts noted that MIRV should be prioritized before other nontargeted chemotherapy options to maximize clinical benefit and avoid cumulative treatment-limiting toxicities from other regimens, like weekly paclitaxel.
Patient Population
The clinical experts consulted for the review indicated that patients with recurrent, progressive PROC with high FR alpha expression are suitable for MIRV treatment. PROC can be identified through a combination of clinical and imaging assessments. FR alpha expression level can be assessed using the VENTANA FOLR1 Assay as a companion diagnostic test. The clinical experts indicated that MIRV provides significant response in patients with high FR alpha expression (PS2+ scoring method; i.e., ≥ 75% of viable tumour cells with moderate [2+] or strong [3+] staining intensity). Patients with low or absent FR alpha expression or those who cannot tolerate ADC-associated toxicities are not suitable for MIRV. According to the clinical experts, the diagnostic infrastructure for FR alpha expression is not yet standardized across Canada.
Assessing the Response Treatment
The clinical experts consulted for this review noted that in general, the outcomes used in clinical practice align with those observed in clinical trials of PROC treatments. Important outcomes for patients with PROC include PFS, OS, ORR, and HRQoL. Both clinical experts indicated that meaningful response to treatment should be assessed based on clinical improvement in patients' reported symptoms and on clinical and imaging assessments. This includes reduction in symptoms, radiologic evidence of tumour response, and clinical measures, including PFS and OS.
Discontinuing Treatment
According to the 2 clinical experts, disease progression or intolerable, severe toxicity should be an indication for discontinuation of treatment. The clinical experts also noted that the AEs that should lead to treatment discontinuation with MIRV are unresolved AEs, including rare ILD, blurred vision, and pneumonitis.
Prescribing Considerations
The clinical experts noted that MIRV should be prescribed and administered in specialized oncology settings by clinicians familiar with the unique safety profile of ADCs. Multidisciplinary team involvement, including ophthalmologists and/or optometrists and pulmonologists, is essential to monitor for toxicity and to provide patient counselling, given that these patients require ongoing frequent eye examinations and follow-ups during treatment to detect signs of keratopathy and manage pneumonitis.
Clinician Group Input
This section was prepared by the review team based on the input provided by clinician groups.
Input for this review was submitted by 3 clinician groups: the BC Cancer Gynecologic Oncology Provincial Tumour Group, the OH (CCO) Gynecologic Cancer Drug Advisory Committee, and GOC. The BC Cancer Provincial Gynecological Oncology Tumour Group comprises clinicians, pathologists, researchers, and allied staff involved in the care of patients with gynecological malignancies in the Province of British Columbia. OH (CCO)’s Drug Advisory Committees provide evidence-based clinical and health system guidance on drug-related issues. GOC is a national, nonprofit, multidisciplinary organization representing health care professionals involved in the treatment and prevention of gynecologic cancers, including physicians, nurses, pharmacists, and scientists. Information was gathered from published literature and the clinical experiences of physicians who treat patients with platinum-resistant cancer.
According to clinician groups, initial treatment for EOC is multimodal, typically involving a combination of surgical cytoreduction and systemic chemotherapy, most commonly carboplatin and paclitaxel. The groups noted that while initial OC treatment is typically effective, with high response rates, most patients will subsequently relapse and develop recurrent disease, which is associated with poor prognosis and survival of 6 months to 12 months. For patients with recurrence and PROC, treatment goals consist of improving PFS, delaying disease progression, and improving QoL by reducing symptom severity. In this setting, clinician groups noted that the main treatment options are bevacizumab and non–platinum-based chemotherapy, both of which have shown minimal impact on OS, have response rates of less than 30%, and are associated with significant toxicity; in addition, patients rapidly become refractory to individual lines of these treatments. Overall, the clinician groups highlighted that patients diagnosed with PROC represent a group of patients with a high unmet need for more efficacious treatment options.
The clinician group expressed differing opinions on the place in therapy for MIRV. OH (CCO) indicated that it would provide an additional treatment option for patients who have failed existing platinum-resistant options. GOC indicated that MIRV would fit into the current treatment paradigm as an additional treatment option for platinum-resistant, recurrent, high-grade serous OC. BC Cancer noted that it would be used as the first treatment option in the setting of platinum resistance with high FR alpha expression, replacing non–platinum-based chemotherapy with or without bevacizumab. GOC noted that MIRV would be used as monotherapy, not combined with other treatments. GOC anticipates that MIRV will cause a shift in the current treatment paradigm; the group’s position is that MIRV is currently the most effective treatment option available for this patient population. However, some OH (CCO) members felt that it would be difficult to justify its use as a first-line treatment in patients with platinum-resistant disease with no prior treatment with bevacizumab due to the high proportion of patients in the MIRASOL trial who had received prior bevacizumab and to the lack of head-to-head comparison with chemotherapy or bevacizumab. This organization also noted that evidence supporting the sequencing of bevacizumab followed by MIRV is limited, given that subgroup data suggest that MIRV may be less effective after bevacizumab. OH (CCO) suggested that if there are no access restrictions based on prior bevacizumab status, then real-world data should be reviewed to ensure effectiveness and improvements in OS in patients who have previously received bevacizumab.
Clinician groups agreed that the patients best suited for MIRV are those with platinum-resistant, high-grade serous EOC with high FR alpha expression (i.e., ≥ 75% of cells with ≥ 2+ staining intensity); OH (CCO) noted that patients with primary peritoneal or fallopian tube cancer would also be well suited to this treatment and suggested that eligibility should be restricted to this patient population. Those least suitable for treatment with MIRV are those with low FR alpha expression, poor functional status (e.g., ECOG 4), platinum-sensitive disease, or pre-existing conditions that may worsen the impact of AEs known to be associated with MIRV (e.g., severe liver or eye toxicities; peripheral neuropathy > grade 1; a chronic corneal disorder; history of cornea transplant; or an active ocular condition for which the patient is receiving ongoing treatment and monitoring).
In clinical practice, the clinician groups noted that PFS and OS are the standard measures for assessing treatment response. The clinician groups agreed that a clinically meaningful treatment response would be defined as radiographic disease control (tumour response or stabilization on CT or MRI) with improvement in cancer-related symptom burden and tolerable toxicity. For patients with a poor overall prognosis, GOC noted that improved PFS is clinically meaningful even in the absence of OS. GOC noted that safety and clinical assessment is performed every 3 weeks, before each treatment cycle, and radiologic assessment is performed every 9 weeks (3 cycles). Treatment discontinuation should be considered in the event of disease progression, intolerable AEs, or patient choice. Patients should receive treatment in an outpatient setting under the supervision (or guidance, in remote areas) of an oncologist. The clinician groups noted that access to optometry or ophthalmology is necessary to ensure ocular toxicities are appropriately assessed and managed.
Drug Program Input
The drug programs provide input on each drug being reviewed through the reimbursement review process by identifying issues that may affect their ability to implement a recommendation. The implementation questions and corresponding responses from the clinical experts consulted for this review are summarized in Table 4.
Table 4: Summary of Drug Plan Input and Clinical Expert Response
Drug program implementation questions | Clinical expert response |
|---|---|
Relevant comparators | |
Currently funded treatment options for PROC include single-drug, non-platinum chemotherapy (paclitaxel, pegylated liposomal doxorubicin, topotecan, gemcitabine, docetaxel) with or without bevacizumab. Is there evidence comparing mirvetuximab soravtansine to chemotherapy + bevacizumab? | The 2 clinical experts consulted for this review indicated that they are not aware of any head-to-head trials comparing mirvetuximab soravtansine and chemotherapy plus bevacizumab. pERC agreed with the clinical experts. |
Considerations for initiation of therapy | |
The trial defined platinum-resistant patients who had received 1 line of platinum-based therapy, at least 4 cycles of initial platinum-containing regimen, had a response, and had disease progression 3 months to 6 months after their last dose. Is this appropriate for clinical practice in Canada? | The 2 clinical experts indicated that the definition of patients with platinum-resistant disease in the MIRASOL trial is consistent with the definition used in clinical practice in Canada. They further noted that fewer cycles (3) of initial platinum regimen can avert toxicities and facilitate transition to second-line treatment. The experts also indicated the concept of platinum resistance is evolving in current clinical practice. Although patients with platinum-refractory disease are often excluded from clinical trials due their poor prognosis, the experts indicated that a patient receiving first-line therapy for advanced, platinum-refractory ovarian cancer would be treated with a non–platinum-based therapy, such as mirvetuximab soravtansine. pERC agreed with the clinical experts. |
Should patients who have received more than 3 prior lines of therapy be eligible? | The clinical experts agreed that patients who have received more than 3 prior lines of therapy should be eligible; however, there are very few patients with more than 3 prior lines of non–platinum-based therapy. The clinical experts also noted that patients currently on fourth-line treatment who are considering switching to mirvetuximab soravtansine should have high folate receptor alpha expression and no other significant comorbidities. pERC agreed with the clinical experts, noting that it is anticipated that this scenario will apply to only a few patients when mirvetuximab soravtansine is available. As such, patients who have received more than 3 prior lines of therapy may be considered eligible for treatment on a time-limited basis. |
Should patients who cycle through multiple platinum-sensitive regimens (exceeds 3 prior lines) and then become platinum-resistant be considered? | The 2 clinical experts noted that patients who become platinum resistant after more than 3 prior lines of therapy should be eligible if platinum rechallenging is no longer available. pERC agreed with the clinical experts. |
Considerations for continuation or renewal of therapy | |
Mirvetuximab soravtansine is dosed at 6 mg/kg of adjusted ideal body weight and requires a titration for the first infusion. There is potential for drug wastage given the vial size. | This is a comment from the drug plans to inform expert committee deliberations. |
Considerations for prescribing of therapy | |
Consider alignment with prescribing criteria for bevacizumab in PROC. | This is a comment from the drug plans to inform expert committee deliberations. |
Should ophthalmic exams be necessary for consideration, and if so, when should ophthalmic exams take place and should it be conducted by an ophthalmologist, or would an optometrist suffice? | The 2 clinical experts recommended frequent assessments by either an optometrist or ophthalmologist. The clinical experts indicated that the protocol should include an ophthalmic examination at screening, and that regular monitoring is required during the treatment period and at follow-up. pERC agreed that regular monitoring for ocular toxicities should be required. pERC also noted the potential for challenges associated with managing the significant ocular toxicities outside of the clinical trial setting, particularly in smaller, remote, or rural care settings. |
Generalizability | |
Should patients with an ECOG Performance Status > 1 be considered eligible? | The 2 clinical experts noted that patients with an ECOG Performance Status of 1 or 2 should be eligible for mirvetuximab soravtansine treatment. pERC agreed with the clinical experts. |
Should patients with more than grade 1 peripheral neuropathy per CTCAE be eligible for mirvetuximab soravtansine? | The clinical experts indicated that patients with more than grade 1 peripheral neuropathy should be eligible. They further noted that these patients will require close monitoring for worsening symptoms and that the decision should be at the discretion of the treating physician. pERC agreed with the clinical experts. |
Should patients with endometrioid, clear cell, mucinous, or sarcomatous histology, mixed tumours containing any of the above histologies, or low-grade or borderline ovarian tumours be eligible for mirvetuximab soravtansine? | The clinical experts noted that patient eligibility for mirvetuximab soravtansine treatment should be based on folate receptor status. The experts also noted that PROC with serous histology is the most common histology type; there is a lack of data for other types. However, patients with other histology types should still be considered for treatment. pERC agreed with the clinical experts and noted concerns with the status of testing and nationwide access to folate receptor alpha testing. |
Funding algorithm (oncology only) | |
The manufacturer assumes that mirvetuximab soravtansine will displace another treatment option in the algorithm. What available evidence supports sequencing between mirvetuximab soravtansine and other drugs (e.g., bevacizumab-based regimens)? | The 2 clinical experts suggested that treatment with mirvetuximab soravtansine should be prioritized once platinum resistance is diagnosed, before other bevacizumab-based regimens. pERC agreed with the clinical experts and noted that earlier treatment should be recommended in patients with eligible folate receptor alpha expression. |
Care provision issues | |
Prophylactic glucocorticoid eye drops are needed for 9 days each cycle. Preservative-free lubricating eye drops are recommended daily. Ocular testing and therapies may represent an out-of-pocket expense for some patients. | This is a comment from the drug plans to inform expert committee deliberations. |
Folate receptor alpha testing is not currently standard in Canada, representing additional costs to the health care system. AbbVie recommends reflex testing to reduce burden on labs. | This is a comment from the drug plans to inform expert committee deliberations. |
System and economic issues | |
Confidential pricing exists for bevacizumab, and there are several marketed biosimilars. | This is a comment from the drug plans to inform expert committee deliberations. |
CTCAE = Common Terminology Criteria for Adverse Events; ECOG = Eastern Cooperative Oncology Group; pERC = pan-Canadian Oncology Drug Review Expert Review Committee; PROC = platinum-resistant ovarian cancer.
Clinical Evidence
The objective of this Clinical Review Report is to review and critically appraise the clinical evidence submitted by the sponsor on the beneficial and harmful effects of MIRV (5 mg/mL, concentrate for solution for injection, IV infusion) in the treatment of adult patients with FR alpha–positive, platinum-resistant epithelial ovarian, fallopian tube, or primary peritoneal cancer who have received 1 to 3 prior systemic treatment regimens. The focus is on comparing MIRV to relevant comparators and identifying gaps in the current evidence.
A summary of the clinical evidence included by the sponsor in the review of MIRV is presented in 4 sections, with our critical appraisal of the evidence included at the end of each section. The first section, the Systematic Review, includes pivotal studies and RCTs that were selected according to the sponsor’s systematic review protocol. Our assessment of the certainty of the evidence in this first section using the GRADE approach follows the critical appraisal of the evidence. The second section includes sponsor-submitted long-term extension studies; however, none were submitted by the sponsor. The third section includes indirect evidence from the sponsor. The fourth section includes additional studies that were considered by the sponsor to address important gaps in the systematic review evidence; however, no studies addressing gaps were submitted by the sponsor.
Included Studies
Clinical evidence from the following is included in the review and appraised in this document:
one pivotal study (the MIRASOL trial) identified in the systematic review50
one ITC, including a MAIC.64
Systematic Review
The contents within this section have been informed by materials submitted by the sponsor. The following has been summarized and validated by the review team.
Description of Studies
The MIRASOL trial was a randomized, open-label, phase III study designed to compare the efficacy and safety of MIRV to IC standard chemotherapy for patients with platinum-resistant, high-grade EOC, primary peritoneal cancer, or fallopian tube cancer whose tumours express a high level of FR alpha.
Between February 2020 and July 2022, a total of 453 patients (including patients from 8 Canadian sites) were enrolled in the study. The trial included a screening period (up to 28 days), a treatment period, an end-of-treatment visit, and a 30-day follow-up period (Figure 1). Patients were randomized at a ratio of 1 to 1 to receive single-drug MIRV (administered once every 3 weeks) or IC chemotherapy (paclitaxel [administered once weekly within a 4-week cycle], PLD [administered every 4 weeks], or topotecan [administered either on days 1, 8, and 15 every 4 weeks or for 5 consecutive days on days 1 to 5 once every 3 weeks]). Randomization was stratified by the number of previous lines of therapy (1, 2, or 3) and chemotherapy drug.
Treatment assignment was open-label due to distinct dosage schedules for each drug. However, radiographic tumour assessments were evaluated independently by a BICR that remained blinded to treatment allocation. All patients were deemed appropriate for single-drug therapy by the investigator.
FR alpha expression was assessed using to the VENTANA FOLR1 Assay (i.e., ≥ 75% of viable tumour cells with moderate [2+] and/or strong [3+] membrane staining). Disease progression was evaluated using RECIST 1.1. CT or MRI scans of tumour assessments were collected for sensitivity analysis by the BICR. Tumour assessments, including radiological assessments using CT or MRI scans, were performed at screening, every 6 weeks from cycle 1, day 1 (C1D1) for the first 36 days, and then every 12 weeks until disease progression, death, or initiation of anticancer therapy, whichever occurred first.
The primary objective of the MIRASOL trial was to compare the PFS of patients randomized to MIRV treatment versus IC chemotherapy. Key secondary objectives were to compare ORR, OS, and HRQoL assessed using the EORTC QLQ-OV28 Abdominal/GI Symptoms scale in patients randomized to MIRV treatment versus IC chemotherapy.
Characteristics of the included studies are summarized in Table 5.
Figure 1: Study Design of the MIRASOL Trial
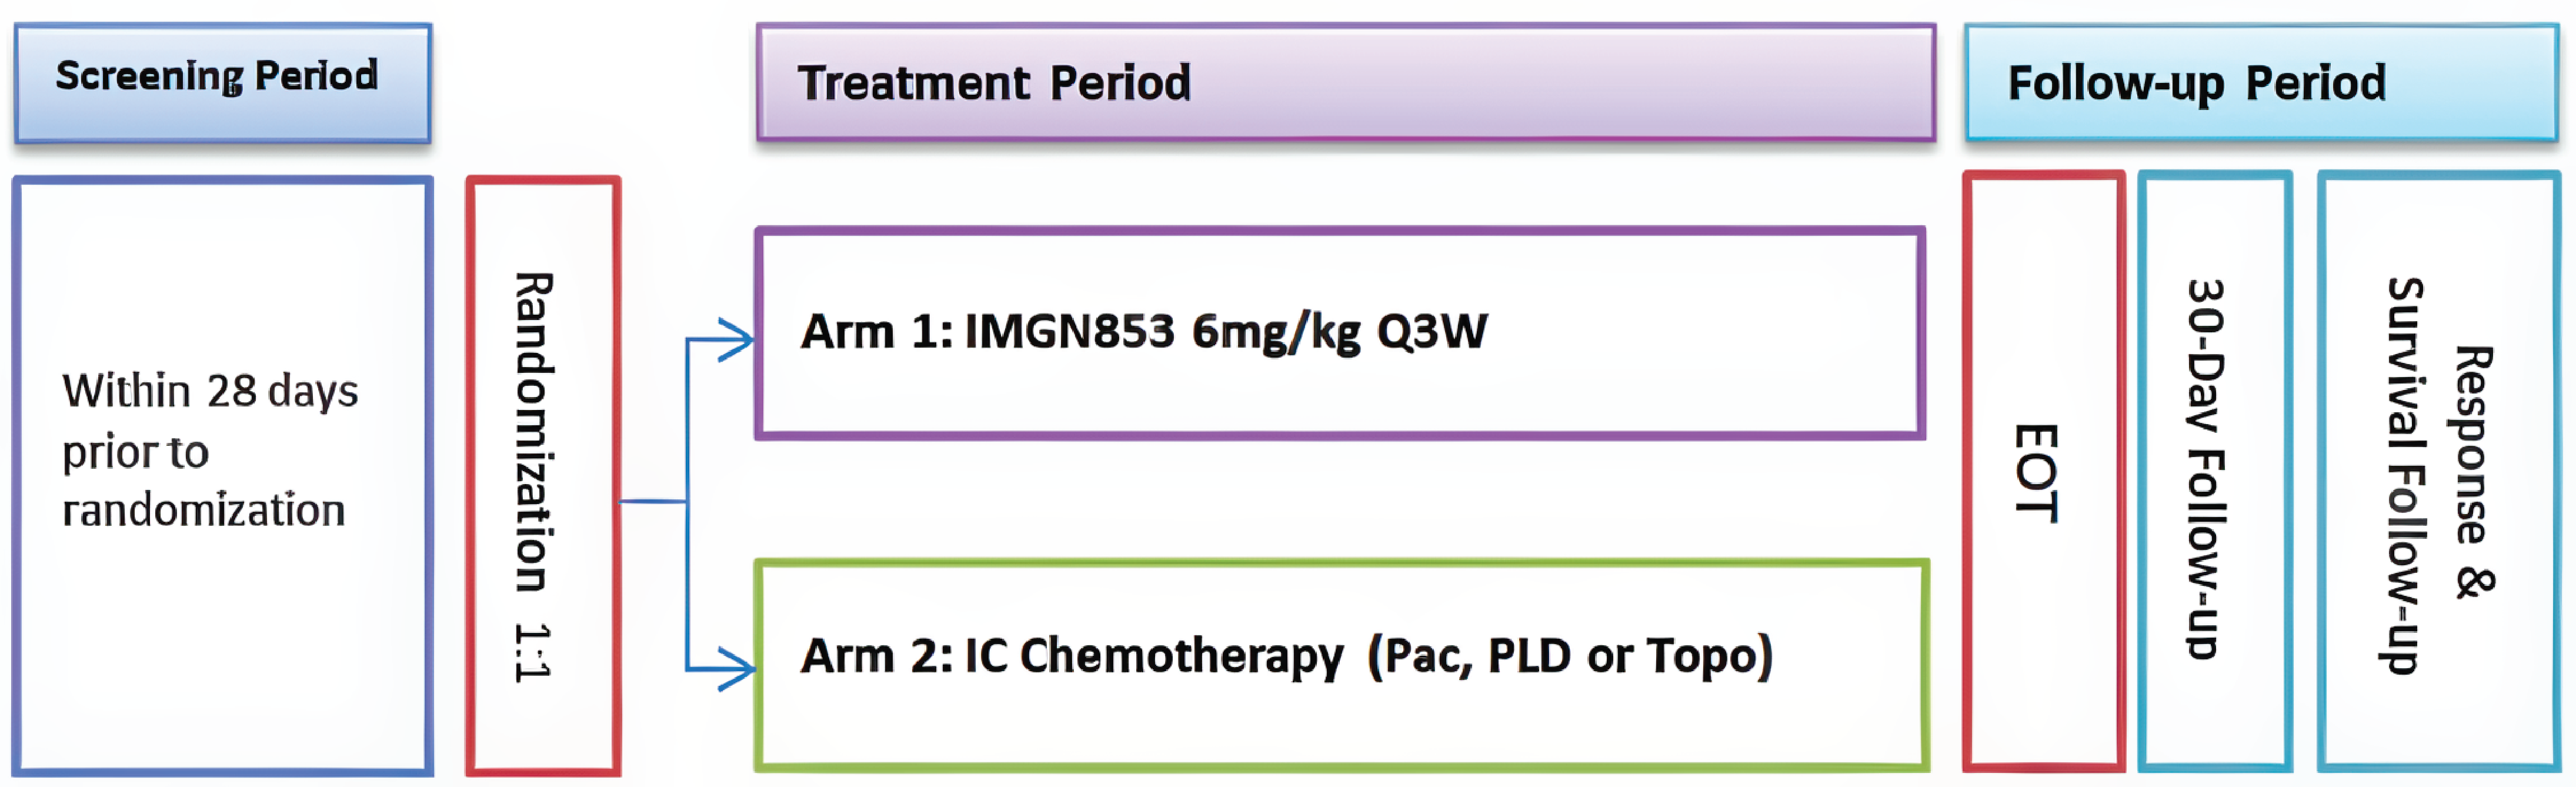
EOT = end of treatment; Pac = paclitaxel; PLD = pegylated liposomal doxorubicin; Q3W = every 3 weeks; Topo = topotecan.
Source: MIRASOL Clinical Study Report.40
Table 5: Details of Studies Included in the Systematic Review
Details | MIRASOL trial |
|---|---|
Designs and populations | |
Study design | Randomized, open-label, phase III study |
Locations | 201 centres globally: Australia (6); Belgium (4); Bulgaria (2); Canada (8); China (13); Czechia (3); France (15); Germany (5); Israel (6); Italy (10); Netherlands (4); Poland (4); Portugal (4); Russia (4); Serbia (1); South Korea (6); Spain (12); Taiwan (2); UK (9); Ukraine (1); US (82). |
Patient enrolment dates | Start date: February 3, 2020 End date: July 25, 2022 |
Randomized (N) | Randomized, N = 453 MIRV, N = 227 IC chemotherapy, N = 226 |
Inclusion criteria |
|
Exclusion criteria | Patients were excluded if they had:
|
Drugs | |
Intervention | MIRV 6 mg/kg AIBW administered through IV every 3 weeks until disease progression or unacceptable toxicity |
Comparators |
|
Study duration | |
Screening phase | Up to 28 days |
Treatment phase | Patients received the study drug until they presented with PD per RECIST 1.1 (as assessed by study investigator) or unacceptable toxicity, withdrew consent, or died, whichever came first. |
Follow-up phase | 30 days |
Outcomes | |
Primary end point | PFS, defined as the time from date of randomization to investigator-assessed PD or death, whichever occurred first |
Secondary and exploratory end pointsa | Key secondary end points:
Other secondary end points:
|
Publication status | |
Publications | Moore KN, Angelergues A, Konecny GE, et al. Mirvetuximab soravtansine in FR-alpha-positive, platinum-resistant ovarian cancer. New England Journal of Medicine 2023;389(23):2162 to 2174. NCT04209855 |
AIBW = adjusted ideal body weight; CR = complete response; CTCAE = Common Terminology Criteria for Adverse Events; DOR = duration of response; ECHO = echocardiography; ECOG PS = Eastern Cooperative Oncology Group Performance Status; EOC = epithelial ovarian cancer; EORTC QLQ-OV28 = European Organisation for Research and Treatment of Cancer Quality of Life Questionnaire Ovarian Cancer Module; FR = folate receptor; IC = investigator’s choice; IHC = immunohistochemistry; ILD = interstitial lung disease; LVEF = left ventricular ejection fraction; MIRV = mirvetuximab soravtansine; MUGA = multigated acquisition; OS = overall survival; PARP = poly (ADP-ribose) polymerase; PD = progressive disease; PFS = progression-free survival; PLD = pegylated liposomal doxorubicin; PR = partial response; PRO = patient-reported outcome; RECIST 1.1 = Response Evaluation Criteria in Solid Tumours Version 1.1; TEAE = treatment-emergent adverse event; VENTANA FOLR1 Assay = VENTANA (FOLR1) (FOLR1-2.1) RxDx assay.
aThis is a list of relevant end points included in this review. It is not an exhaustive list of end points included in the MIRASOL trial.
Source: MIRASOL trial Clinical Study Report.40
Populations
Inclusion and Exclusion Criteria
The trial included female patients aged 18 years or older with platinum-resistant disease and a confirmed diagnosis of high-grade serous EOC, primary peritoneal cancer, or fallopian tube cancer. Key inclusion criteria were radiographic progression on or after the most recent line of therapy; positive FR alpha expression, as assessed by the VENTANA FOLR1 Assay; prior treatment with at least 1 but no more than 3 systemic lines of anticancer therapy; and eligibility for single-drug therapy as the next appropriate line of treatment. Patients were excluded if they had endometrioid, clear cell, mucinous, or sarcomatous histology, mixed tumours with the previously mentioned histologies, or low-grade or borderline ovarian tumour or if they had primary platinum-refractory disease or had progressed within 3 months of the last dose of first-line platinum-containing chemotherapy. Table 5 contains the detailed inclusion and exclusion criteria.
Interventions
All patients randomized to MIRV received single-drug MIRV at 6 mg/kg AIBW IV administered every 3 weeks. At C1D1, MIRV was administered at a rate of 1 mg per minute for 30 minutes; after 30 minutes, the rate was increased to 3 mg per minute if well tolerated. If well tolerated after 30 minutes at 3 mg per minute, the infusion rate was increased to 5 mg per minute. Subsequent infusions were delivered at the tolerated rate. The overall duration of infusion varied depending on dose and patient tolerance. After infusion, the IV line was flushed with 5% dextrose to ensure delivery of the full dose. Before the infusion of each MIRV dose, patients received 325 mg to 650 mg of acetaminophen (orally or through IV), 10 mg IV dexamethasone, and 25 mg to 50 mg diphenhydramine (IV or orally) (equivalent drugs of similar drug classes were also acceptable) for approximately 30 minutes. An antiemetic medication (e.g., 5-hydroxytryptamine type 3 serotonin receptor antagonists, such as palonosetron, granisetron, ondansetron, or an appropriate alternative) was recommended before each MIRV dose and used any time at the discretion of the treating physician. All patients received prophylactic corticosteroid eye drops (unless contraindicated by an ophthalmologist or physician) and daily lubricating artificial tears as directed.
For patients randomized to IC chemotherapy, the choice of chemotherapy (paclitaxel, PLD, or topotecan) was made before randomization. For all IC chemotherapy, body weight at C1D1 was used to calculate body surface area to determine the required dose; no dose modifications were anticipated unless the patient’s body weight changed by plus or minus 10% from baseline. Paclitaxel was administered at 80 mg/m2 as a 1-hour IV infusion on days 1, 8, 15, and 22 of a 4-week cycle; PLD was administered at 40 mg/m2 as a 1 mg per minute IV infusion on day 1 of a 4-week cycle. Topotecan was administered at 4 mg/m2 as a 30-minute IV infusion on days 1, 8, and 15 of a 4-week cycle or alternatively at 1.25 mg/m2 as a 30-minute IV infusion on days 1 to 5 of a 3-week cycle. Each IC chemotherapy drug was prepared as described in the prescribing information; no dose modifications were made unless the patient’s body weight changed by plus or minus 10% from baseline. Patients randomized to paclitaxel, PLD, or topotecan received premedication at the discretion of the investigator or according to institutional guidelines.
Patients continued treatment until disease progression, unacceptable toxicity, withdrawal of consent, death, or study termination by the sponsor (whichever came first). Patients who discontinued the study treatment for reasons other than progressive disease continued with tumour assessments until the start of a new anticancer therapy. All patients who discontinued the study drug were followed every 3 months (± 1 month) until death, loss to follow-up, withdrawal of consent for survival follow-up, or end of study.
Outcomes
A list of efficacy end points assessed in this Clinical Review Report is provided in Table 6, followed by descriptions of the outcome measures. Summarized end points are based on outcomes included in the sponsor’s Summary of Clinical Evidence as well as any outcomes identified as important to this review, according to the clinical experts consulted for this review and the input from patient and clinician groups and public drug plans. Using the same considerations, we selected the end points that were considered most relevant to inform expert committee deliberations and finalized this list of end points in consultation with members of the expert committee. All summarized efficacy end points were assessed using GRADE. Select notable harms outcomes considered important for informing expert committee deliberations were also assessed using GRADE.
Table 6: Outcomes Included in the Systematic Review
Outcome measure | Time point | MIRASOL trial |
|---|---|---|
Efficacy | ||
PFS | 3 months, 6 months | Primarya |
ORR | 6 months | Key secondarya |
OS | 6 months | Key secondarya |
DOR | 6 months | Other secondary |
Health-related quality of life | ||
EORTC QLQ-OV28 | Week 8/9 | Key secondarya |
Harms | ||
AEs, SAEs, WDAEs, mortality, notable harms | Throughout the study (from screening until last study treatment) | Secondary |
AE = adverse event; DOR = duration of response; EORTC QLQ-OV28 = European Organisation for Research and Treatment of Cancer Quality of Life Questionnaire Ovarian Cancer Module; ORR = objective response rate; OS = overall survival; PFS = progression-free survival; SAE = serious adverse event; WDAE = withdrawal due to adverse event.
aIf the primary end point of PFS by investigator assessment was met, then a hierarchical testing procedure was applied to key secondary end points (in the order listed previously) to control the study-wise type I error.
Source: Details included in the table are from the sponsor’s Summary of Clinical Evidence.65
Progression-Free Survival
The primary end point of the MIRASOL trial was PFS per investigator assessment. PFS is the time from randomization until objective tumour progression or death, whichever occurs first. PFS was assessed based on radiological imaging and determined by the investigator (primary analyses) using RECIST 1.1. CT or MRI scans were collected and held for sensitivity analysis by the BICR. Clinical progression was not considered a progression end point in this trial. PFS was not considered a validated surrogate for OS because PFS has not demonstrated a benefit in OS among patients with platinum-sensitive or PROC.66,67
Table 7: PFS Definitions in the MIRASOL Trial
Situation | Date of PFS event or censoring | Outcome |
|---|---|---|
No baseline tumour assessments or postbaseline radiological assessments; patient did not die within 105 days of randomization | Date of randomization | Censored |
No baseline tumour assessments or postbaseline radiological assessments; patient died within 105 days of randomization | Date of death | Death |
Death | Date of death | Death |
Radiological progression | Date of first radiological assessment indicating progression | Progression |
New anticancer therapy before PD or death (including palliative radiotherapy during study treatment) | Date of last radiological assessment before the start of the new anticancer therapy | Censored |
No death or PD | Date of last radiological assessment | Censored |
PD or death after missing 2 or more consecutive radiological assessments (i.e., PD or death date minus last radiological assessment date plus 1 ≥ 105 days; or ≥ 231 days, if the assessment schedule changed from every 6 weeks [± 1 week] to every 12 weeks [± 3 weeks] after week 36 or after discontinuing the study treatment per local requirements) | Date of last adequate radiological assessment showing no PD | Censored |
PD = progressive disease.
Source: MIRASOL trial Clinical Study Report.40
Objective Response Rate
ORR refers to the proportion of patients who achieved a pre-established reduction in tumour volume, indicating CR or PR. ORR was a key secondary outcome in the MIRASOL trial. ORR, assessed by RECIST 1.1, is an accepted end point for accelerated approval in OC.68 Patients without postbaseline RECIST 1.1 assessment were as analyzed as those whose disease did not respond to treatment (i.e., these patients contributed to the denominator, but not the numerator).
Overall Survival
OS is the time from the date of randomization until the date of death from any cause. OS was a key secondary outcome of the trial. Patients who were alive or lost to follow-up at the analysis were censored at the last date they were known to be alive. When an analysis cut-off date was implemented, only deaths occurring on or before the cut-off date were counted as OS events. Patients without death events were censored on the latest date with a known alive status on or before the cut-off date. Patients whose date of death or last known date alive occurred after the DCO date were censored at the analysis cut-off date.
Duration of Response
DOR was defined as the time from the date of the first response (CR or PR) to the date of progression or death from any cause, whichever occurred first. DOR was a secondary outcome and was defined only for patients who had a confirmed BOR of CR or PR. Per the BOR definition, patients with an overall response of CR or PR must have had a repeat tumour assessment performed no fewer than 4 weeks after the criteria for response were first met. The first date at which a CR or PR response was noted (not the date of the confirmatory tumour assessment) was used to calculate DOR. DOR end dates and censoring rules were the same as those for PFS, as shown in Table 7.
Health-Related Quality of Life
The EORTC QLQ-OV28 was used to collect data on patients’ functioning, HRQoL, disease symptoms, and health status. The EORTC QLQ-OV2836,37 is a disease-specific module of the Quality of Life Questionnaire Core 30 designed for patients with local or advanced OC who receive surgical treatment with or without chemotherapy. It consists of 28 items assessing abdominal and/or GI symptoms, peripheral neuropathy, other chemotherapy side effects, hormonal symptoms, body image issues, negative attitudes toward disease and/or treatment, and sexual dysfunction. Items are scored from 1 (not at all) to 4 (very much). The recall period for the first 24 questions was “during the past week”; for the last 4 questions (sexual dysfunction), it was “during the past 4 weeks.” Scores were derived by linearly transforming scale or standalone item raw scores to a 0-to-100 scale. Higher scores indicated worse symptoms or health states. The primary end point was the number of patients achieving at least a 15% (i.e., ≥ 15-point) absolute improvement on the QLQ-OV28 Abdominal/GI Symptoms subscale (items 31 to 36) at the week 8 or 9 assessment.
Harms
The numbers of patients experiencing AEs, SAEs, AEs of special interest, and mortality were assessed as secondary outcomes. An AE was defined as any noxious, pathological, or unintended change in anatomic, physiological, or metabolic function, as indicated by physical signs, symptoms, or laboratory abnormalities and occurring at any point during the clinical study. All AEs — including those attributed to study procedures — occurring from the time of informed consent until 30 days after the last dose of study treatment were reported, regardless of severity or relationship to the study drug. Investigators were responsible for managing AEs appropriately and monitoring patients until resolution. Any SAE, regardless of relationship to study medication, that occurred in a patient from the time of informed consent until 30 days after the last study treatment were recorded on the patient’s AE electronic case report form along with the investigator’s assessment of the relationship of the SAE to the study drug (i.e., MIRV, paclitaxel, PLD, or topotecan). TEAEs were defined as AEs with onset on or after the first dose of study drug and occurring within 30 days of the last dose or before the initiation of a new anticancer therapy, whichever occurred first.
Table 8: Summary of Outcome Measures and Associated Measurement Properties
Outcome measure | Type | Conclusions about measurement properties | MID |
|---|---|---|---|
EORTC QLQ-OV28 | A disease-specific module of the QLQ-C30 was designed for patients with local or advanced ovarian cancer who receive surgical treatment with or without chemotherapy. It was designed to supplement the EORTC QLQ-C30. It consists of 28 items that assess abdominal and GI symptoms (7 items), peripheral neuropathy (3 items), other chemotherapy side effects (5 items), hormonal symptoms (2 items), body image issues (2 items), negative attitudes toward disease and/or treatment (3 items), and sexual dysfunction (2 of 4 items). Each item is scored from 1 (not at all) to 4 (very much). The recall period for the first 24 questions is “during the past week”; for the last 4 questions (sexual dysfunction), it is “during the past 4 weeks.” Scores are derived by linearly transforming scale or standalone item raw scores to a 0-to-100 scale. Higher scores indicate worse symptoms and/or health states. | The validity, reliability, and responsiveness of the EORTC QLQ-OV28 was evaluated in a 2003 study of patients with ovarian cancer.36 Validity: Internal consistency was considered high for all scales (Cronbach alpha > 0.70) except the body image scale in the baseline or off-treatment dataset (Cronbach alpha = 0.58). Reliability: Test-retest reliability showed repeatability, with ICC coefficient values ranging from 0.74 to 0.94. Responsiveness: Treatment responsiveness of the scales was tested by comparing pretreatment to on treatment. Nearly all scales showed significant differences between the 2 assessments, except body image and hormonal and/or menopausal symptoms. | A MID was not identified by the sponsor. |
EORTC QLQ-C30 = European Organisation for Research and Treatment of Cancer Quality of Life Questionnaire Core 30; EORTC QLQ-OV28 = European Organisation for Research and Treatment of Cancer Quality of Life Questionnaire Ovarian Cancer Module; GI = gastrointestinal; ICC = intraclass correlation coefficient; MID = minimal important difference.
Source: MIRASOL trial Clinical Study Report.40
Statistical Analysis
Sample Size and Power Calculation
Sample size and power were determined based on the following assumptions: a median PFS for the IC chemotherapy group of 3.5 months, a median PFS for the MIRV group of 5.0 months, overall attrition of approximately 13% in both groups, uniform enrolment over an 18-month period, a 6-month follow-up duration, a median OS for the IC chemotherapy group of 12 months, and a median OS for the MIRV group of 17.5 months. Testing of group differences was conducted using the log-rank test.
The study was powered to test the null hypothesis of no difference in PFS between the MIRV arm and the IC chemotherapy arm against an alternative assumed HR of 0.7. To reject the null hypothesis with 90% power at a 2-sided type I error rate of 0.05, 430 patients (approximately 215 patients per treatment group) would be required. For the secondary end points of OS and ORR, it was estimated that, based on the chosen sample size of 430 patients (215 patients in each arm), an alternative OS HR of 0.6857 would have 90% power to reject the null hypothesis at a type I error rate of 0.05.
Statistical Testing
The primary outcome, investigator-assessed PFS, was estimated using the Kaplan-Meier method. Group differences in PFS were tested using the stratified log-rank test (stratified by the stratification factors used in randomization). The final analysis of PFS was assessed when at least 330 events had occurred at a DCO of March 6, 2023. If the primary end point of PFS was statistically significant at a 2-sided alpha level of 0.05, then the hierarchical testing procedure was used to test the key secondary end points in the following order at a 2-sided alpha level of 0.05 to control the study-wise type I error. The order was ORR, OS, and primary HRQoL outcome of the Abdominal/GI Symptoms scale of the EORTC QLQ-OV28. In the stratified analysis regarding the primary end point of PFS, the strata were IC chemotherapy (paclitaxel versus PLD versus topotecan) and number of prior lines of therapy (1 versus 2 versus 3). The restricted mean survival time (RMST) for investigator-assessed PFS at 12 months was compared between treatments.
For the secondary end point of ORR, differences between the MIRV treatment group and the IC chemotherapy were compared using the stratified Cochran-Mantel-Haenszel test for treatment comparison and the Clopper-Pearson method for 95% CI estimation. The secondary end points of OS and DOR were estimated using the Kaplan-Meier method. The comparison of OS and DOR between treatment groups was conducted using Cox regression and a log-rank test. The final analysis of OS was conducted when at least 300 events had occurred at the DCO of September 26, 2024. The stratified analyses were conducted according to randomization stratification factors, including the number of previous lines of therapy and IC chemotherapy. For the EORTC QLQ-OV28, the primary HRQoL outcome analysis was the number of patients achieving at least a 15% (i.e., ≥ 15-point) absolute improvement on the QLQ-OV28 Abdominal/GI Symptoms subscale at the week 8 or 9 assessment. Patients with missing week 8 or 9 questionnaires were excluded from the analysis unless they had progressive disease or death before the week 8 or 9 assessment, in which case they were included as unimproved. The secondary analysis was change from baseline in EORTC QLQ-OV28 scores, which was analyzed using a mixed model for repeated measures. The sponsor noted that interim analyses were conducted. The first interim analysis was futility only and was conducted when at least 110 PFS events had occurred. The study stopped for futility at interim analyses if the observed PFS HR (MIRV to IC chemotherapy) was greater than 1. This analysis was applied to PFS only. Another interim analysis was conducted for OS at the time of the final analysis of PFS, at which time approximately 180 deaths (60%) would have been observed. The final analysis of PFS occurred when at least 330 PFS events had occurred (DCO, March 6, 2023). A Lan-DeMets alpha-spending function using an O’Brien-Fleming stopping boundary was used to control overall type I error for OS at a 2-sided alpha level of 0.05.69 The final analysis of OS was conducted when at least 300 deaths had occurred (DCO, September 26, 2024). It was projected that the final analysis of OS would be approximately 1 year after the final analysis of PFS. If the primary end point of PFS was statistically significant and the preliminary data suggested that 300 deaths would not occur within 1 year after the final analysis of PFS, then another interim analysis of OS would be conducted 1 year after the final analysis of PFS, and the stopping boundary would be adjusted.
Multiplicity Control
The PFS 95% CI reported was not adjusted for multiplicity; however, type I error was controlled for in the testing procedure. For the key secondary end points of ORR, OS, and the Abdominal/GI Symptoms scale of the EORTC QLQ-OV28, a hierarchical testing procedure was applied to control the family-wise type I error only if the null hypothesis for the primary end point was rejected at a 2-sided alpha level of 0.05.
Handling of Missing Data
Handling of missing data for the outcome measures is described in Table 9. For the primary and secondary end points, if the start date of subsequent anticancer therapy was missing, it was imputed using the earliest possible date that did not conflict with any other available data in the database. For records with a partial death date, the death date was imputed using the earliest possible date that did not conflict with any other available data in the database. For the HRQoL data, patients with missing data were excluded from the analysis unless otherwise described.
Sensitivity Analyses
A summary of the sensitivity analyses for select end points is provided in Table 9. If the primary end point of investigator-assessed PFS was statistically significant, PFS by BICR was analyzed using the same methods as in investigator-assessed PFS, and the concordance or discordance rate between the PFS outcomes for the BICR assessment and the investigator assessment were summarized. The RMST for PFS was estimated as a sensitivity analysis using an unstratified Kaplan-Meier estimator. Similarly, ORR and DOR as assessed by BICR were analyzed as sensitivity analyses using the same methods as in the investigator-assessed ORR and DOR, respectively. OS rates were summarized for the per-protocol population as sensitivity analyses. A series of sensitivity analyses was conducted on the EORTC QLQ-OV28 Abdominal/GI Symptoms subscale. First, analyses were repeated excluding patients who had died or progressed. Second, only patients who experienced progression before the week 8 or 9 assessment were classified as unimproved. Lastly, responder analyses were repeated using 2 alternative thresholds: 11.1 (representing the next smaller observable change score) and 22.2 (the next larger observable change score).
Subgroup Analyses
Investigator-assessed PFS, ORR, and OS were analyzed according to the following subgroups:
BRCA status (positive versus negative or unknown)
age (< 65 years versus ≥ 65 years)
baseline ECOG PS (0 versus 1)
prior exposure to bevacizumab
number of prior lines of therapy
primary platinum-free interval (≤ 6 months versus > 6 months)
most recent platinum-free interval (≤ 3 months versus > 3 months)
prior exposure to PARP inhibitor maintenance therapy (yes versus no versus uncertain)
country (US versus rest of world)
stage at diagnosis (I to III versus IV)
weight at baseline (≤ 60 kg, 60 to 80 kg, or > 80 kg).
The summaries for time-to-event variables included the number and percentage of events, the median and its 95% CI, 2-sided P values, and the HR (MIRV to IC chemotherapy) and its 95% CI. All subgroup analyses were unstratified. No subgroup analyses were conducted for DOR.
Table 9: Statistical Analysis of Efficacy End Points in the MIRASOL Trial
End point | Statistical model | Adjustment factors | Handling of missing data | Sensitivity analyses |
|---|---|---|---|---|
PFS as assessed by the investigator | Log-rank test for group differences stratified by the randomization stratification factors. The RMST for PFS was reported at 3-month intervals. The RMST at 12 months was compared for treatments stratified by the randomization stratification factors. The HR for PFS was estimated using a stratified Cox proportional hazards model. | In stratified analysis, the strata were IC chemotherapy (paclitaxel vs. PLD vs. topotecan) and the number of prior lines of therapy (1 vs. 2 vs. 3). | For records in which the start date of subsequent anticancer therapy was missing, imputation was performed using the earliest plausible date that did not conflict with any other available data in the database. For records with partially missing death dates, the date of death was imputed as the earliest noncontradictory date. | Stratified analysis using values collected on the eCRFs. An unstratified log-rank analysis. Unstratified RMST analysis at 12 months. A sensitivity analysis of PFS in the per-protocol population. Patients were analyzed by the actual treatment they received. If the primary end point of PFS by investigator was statistically significant, the following were performed as sensitivity analyses:
|
ORR per RECIST 1.1 criteria based on the investigator’s assessment | Based on the ITT population; also summarized using the response-evaluable population. Analyzed using a CMH test stratified by the randomization stratification factors to test for differences between the MIRV arm and the IC chemotherapy arm. The OR and its 95% CI were also reported. | Randomization stratification factors were IC chemotherapy (paclitaxel vs. PLD vs. topotecan) and the number of prior lines of therapy (1 vs. 2 vs. 3). | BOR: For records in which the start date of subsequent anticancer therapy was missing, imputation was performed using the earliest plausible date that did not conflict with any other available data in the database. | A sensitivity analysis of ORR in the per-protocol population was conducted in the per-protocol population. If the primary end point of PFS by investigator was statistically significant, ORR by BICR was analyzed using the same methods used in investigator-assessed ORR as a sensitivity analysis. If PFS by investigator was significant, the concordance or discordance rate between the BICR BOR and the investigator BOR were summarized. |
OS | Log-rank test stratified by the randomization stratification factors. HRs for the OS treatment comparisons were estimated using a stratified Cox proportional hazards model. | Same as previously listed. | For records with a partial death date, imputation was performed using the earliest plausible date that did not conflict with any other available data in the database. | An unstratified log-rank analysis. A sensitivity analysis of OS in the per-protocol population. |
DOR | DOR was analyzed for the subset of patients who achieved a BOR of CR or PR, and the primary comparison between treatments used the unstratified log-rank test. The HR for DOR treatment comparisons was estimated using an unstratified Cox proportional hazards model. | NA | For records with a partial death date, the death date was imputed using the earliest possible date that did not conflict with any other available data in the database. | If the primary end point of PFS by INV was statistically significant, DOR by BICR was analyzed using the same methods used in investigator-assessed DOR as a sensitivity analysis. |
EORTC QLQ-OV28 Number of patients achieving at least a 15% (or equivalently, a 15-point) improvement on the QLQ-OV28 Abdominal/GI Symptoms subscale (items 31 to 36) at the week 8 or 9 assessment | Summarized using the LPP. The LPP includes all randomized patients who survived and remained in the study from randomization through to the week 8 or 9 assessment for whom QoL data are available for both baseline and week 8/9. The proportion of participants with improvement or deterioration were summarized at week 8 or 9 for the EORTC QLQ-OV28 and subscale scores. A CMH test stratified by the randomization stratification factors to test for differences between the MIRV arm IC chemotherapy arms was performed. | The randomization stratification factors were IC chemotherapy (paclitaxel vs. PLD vs. topotecan) and the number of prior lines of therapy (1 vs. 2 vs. 3). | Patients with missing week 8 or 9 questionnaires were excluded from analysis unless PD or death had occurred before the week 8 or 9 assessment, in which case they were included as unimproved. |
|
BICR = blinded independent central review; BOR = best overall response; CI = confidence interval; CMH = Cochran-Mantel-Haenszel; CR = complete response; DOR = duration of response; eCRF = electronic case report form; EORTC QLQ-C30 = European Organisation for Research and Treatment of Cancer Quality of Life Questionnaire Core 30; EORTC QLQ-OV28 = European Organisation for Research and Treatment of Cancer Quality of Life Questionnaire Ovarian Cancer Module; HR = hazard ratio; IC = investigator’s choice; INV = investigator; ITT = intention to treat; LPP = longitudinal period population; MIRV = mirvetuximab soravtansine; NA = not applicable; OR = odds ratio; ORR = objective response rate; OS = overall survival; PFS = progression-free survival; PLD = pegylated liposomal doxorubicin; PR = partial response; QoL = quality of life; RECIST 1.1 = Response Evaluation Criteria in Solid Tumours Version 1.1; RMST = restricted mean survival time; vs. = versus.
Source: MIRASOL trial Clinical Study Report; MIRASOL trial Statistical Analysis Plan; MIRASOL trial patient-reported outcomes report.65,70,71
Analysis Populations
The analysis populations in the MIRASOL trial are summarized in Table 10.
Table 10: Analysis Populations in the MIRASOL Trial
Population | Definition | Application |
|---|---|---|
ITT | All patients randomized to the study, regardless of whether or not they received study treatment | Baseline, patient disposition, and efficacy analyses |
Per protocol | All patients randomized to the study who received at least 1 dose of the study drug, excluding patients with critical or major protocol deviations that were deemed to affect primary and/or key secondary objectives | Efficacy analyses |
Response evaluable | All patients randomized to the study who received at least 1 dose of study drug and had measurable disease at baseline per investigator or BICR | ORR analysis only |
Safety | All patients who received at least 1 dose of MIRV or IC chemotherapy | Safety analyses |
LPP | All randomized patients who survived and remained in the study from randomization through the week 8 or 9 assessment and had available QoL data for baseline and week 8/9 | QoL population analyses |
BICR = blinded independent central review; IC = investigator’s choice; ITT = intention to treat; LPP = longitudinal period population; MIRV = mirvetuximab soravtansine; ORR = objective response rate; QoL = quality of life.
Source: MIRASOL trial Clinical Study Report.65
Results
Patient Disposition
Patient disposition in the MIRASOL trial is summarized in Table 11. Of the 227 patients randomized to MIRV treatment, 218 patients received treatment; 9 patients were not dosed due to various reasons, including patient exclusion at C1D1, pretreatment AEs, or withdrawal from treatment. Among those treated, 195 patients (86%) discontinued treatment, mainly due to disease progression (154 patients, 68%) or AEs (20 patients, 9%). The primary reason for permanent study discontinuation was death (██ patients, ██%). At the primary analysis, 32 patients (14%) remained on treatment. In the IC chemotherapy group, 207 of 226 randomized patients were treated, with 220 patients (97%) discontinuing treatment due to disease progression (145 patients, 64%) or AEs (28 patients, 12%). The IC chemotherapy group had ███ deaths (██%) as the main reason for study discontinuation. Only 6 patients (3%) remained on treatment at the primary analysis. Compared to IC chemotherapy, patients in the MIRV treatment group had lower rates of treatment discontinuation (86% versus 97%), permanent study withdrawal (██% versus ██%), and death (██% versus ██%), with more patients remaining on treatment at analysis (14% versus 3%).
Table 11: Summary of Patient Disposition in the MIRASOL Trial (DCO Date of March 6, 2023)
Patient disposition | MIRV (N = 227) | IC chemotherapy (N = 226) |
|---|---|---|
Randomized (ITT population), N (%) | 227 (100) | 226 (100) |
Discontinued from treatment, N (%) | 195 (86) | 220 (97) |
Primary reason for treatment discontinuation, N (%) | ||
Adverse event | 20 (9) | 28 (12) |
Death | 3 (1) | 1 (< 1) |
PI discretion | 4 (2) | 9 (4) |
Patient withdrew consent to treatmenta | ████ ███ | ████ ███ |
Patient withdrew consent to treatment and follow-up | ████ ███ | ████ ███ |
Progressive disease | 154 (68) | 145 (64) |
Radiological | ████ ███ | ████ ███ |
Clinical | ████ ███ | ████ ███ |
Protocol deviation | 1 (< 1) | 1 (< 1) |
Other | 5 (2) | 10 (4) |
Permanently discontinued from study, N (%) | ███ ████ | ███ ████ |
Primary reason for study discontinuation, N (%) | ||
Death | ████ ███ | ████ ███ |
PI discretion | ████ ███ | ████ ███ |
Lost to follow-up | ████ ███ | ████ ███ |
Withdrew consent | ████ ███ | ████ ███ |
Other | ████ ███ | ████ ███ |
Safety population, N (%) | 218 (96) | 207 (92) |
Per-protocol population, N (%) | ███ ████ | ███ ████ |
Response-evaluable population per BICR, N (%) | ███ ████ | ███ ████ |
Response-evaluable population per investigator, N (%) | ███ ████ | ███ ████ |
BICR = blinded independent central review; DCO = data cut-off; IC = investigator’s choice; ITT = intention to treat; MIRV = mirvetuximab soravtansine; NA = not applicable; PI = principal investigator.
aPatients who withdrew consent to treatment continued to be followed.
Source: Table 10 and Table 11, MIRASOL trial Clinical Study Report.65
Baseline Characteristics
A summary of baseline and disease characteristics for the ITT population in the MIRASOL trial are provided in Table 12. Demographic and baseline characteristics were similar between the MIRV and IC chemotherapy treatment groups. Among the 227 patients randomized to MIRV, the median age was 64.0 years, with most patients identifying as Asian (12%) or white (69%). In the IC chemotherapy group (n = 226), the median age was 62.0 years, with most patients identifying as Asian (11%) or white (64%). Among patients treated with MIRV, 80% had EOC, followed by fallopian tube cancer (12%) and primary peritoneal cancer (7%); 13% were positive for any BRCA mutations (BRCA status was negative or unknown for 87% of patients). In the IC chemotherapy group, 81% had EOC, 10% had fallopian tube cancer, and 9% had primary peritoneal cancer, with 16% BRCA-positive. All patients in the MIRV group had high-grade serous histology that was poorly differentiated (██%) or had an unknown histological grade (██%). Similarly, almost all patients (225 of 226) in the IC chemotherapy group had high-grade serous histology that was poorly differentiated (██%) or had an unknown histological grade (██%). Stage IIIC (53%) and stage IV (29%) were the most prominent cancer stages at initial diagnosis, with a median time from diagnosis to randomization of █████ months. In the MIRV treatment group, 48% of patients had received 3 prior lines of therapy, 55% had prior PARP inhibitor use, and 61% had received prior bevacizumab (compared to 46%, 56%, and 63% of patients, respectively, in the chemotherapy group). Overall, the number of patients who have had first and last lines of therapy were similar between the MIRV and chemotherapy treatment groups. The most recent platinum-free interval was greater than or equal to 3 to at least 6 months in 61% of patients in the MIRV group and in 55% of patients in the IC chemotherapy group. In both groups, most patients had an ECOG PS of 0 (57% versus 53%) or 1 (43% versus 45%).
Table 12: Summary of Baseline and Disease Characteristics of Patients (ITT Population; DCO Date of March 6, 2023)
Characteristic | MIRASOL trial | ||
|---|---|---|---|
MIRV (N = 227) | IC chemotherapy (N = 226) | Overall (N = 453) | |
Age (years) | |||
n | 227 | 226 | 453 |
Mean (SD) | ████ ███ | ████ ███ | ████ ███ |
Median | 64.0 | 62.0 | 63.0 |
Minimum to maximum | 32 to 88 | 29 to 87 | 29 to 88 |
Age group (years), n (%) | |||
18 to 64 | ████ ███ | ████ ███ | ████ ███ |
≥ 65 | 107 (47) | 92 (41) | 199 (44) |
65 to 74 | ████ ███ | ████ ███ | ████ ███ |
75 to 84 | ████ ███ | ████ ███ | ████ ███ |
≥ 85 | ████ ███ | ████ ███ | ████ ███ |
18 to 69 | ████ ███ | ████ ███ | ████ ███ |
≥ 70 | ████ ███ | ████ ███ | ████ ███ |
Female, n (%) | 227 (100) | 226 (100) | 453 (100) |
Child-bearing potential | ████ ███ | ████ ███ | ████ ███ |
Ethnicity, n (%) | |||
Hispanic or Latino | 12 (5) | 15 (7) | 27 (6) |
Not Hispanic or Latino | 177 (78) | 163 (72) | 340 (75) |
Missing | 1 (< 1) | 1 (< 1) | 2 (< 1) |
Not reported | 35 (15) | 45 (20) | 80 (18) |
Unknown | 2 (< 1) | 2 (< 1) | 4 (< 1) |
Race, n (%) | |||
Asian | 28 (12) | 25 (11) | 53 (12) |
Black or African American | 8 (4) | 5 (2) | 13 (3) |
White | 156 (69) | 145 (64) | 301 (66) |
Not reported | 32 (14) | 49 (22) | 81 (18) |
Other | 3 (1) | 2 (< 1) | 5 (1) |
Region, n (%) | |||
APACa | ████ ███ | ████ ███ | ████ ███ |
Europeb | ████ ███ | ████ ███ | ████ ███ |
Middle Eastc | ████ ███ | ████ ███ | ████ ███ |
North Americad | ████ ███ | ████ ███ | ████ ███ |
Baseline weight (kg) | |||
n | ████ ███ | ████ ███ | ████ ███ |
Mean (SD) | ████ ███ | ████ ███ | ████ ███ |
Median | ████ ███ | ████ ███ | ████ ███ |
Minimum to maximum | ████ ███ | ████ ███ | ████ ███ |
Baseline AIBW (kg) | |||
n | ████ ███ | ████ ███ | ████ ███ |
Mean (SD) | ████ ███ | ████ ███ | ████ ███ |
Median | ████ ███ | ████ ███ | ████ ███ |
Minimum to maximum | ████ ███ | ████ ███ | ████ ███ |
Primary diagnosis, n (%) | |||
Epithelial ovarian | 182 (80) | 182 (81) | 364 (80) |
Fallopian tube | 27 (12) | 23 (10) | 50 (11) |
Primary peritoneal | 16 (7) | 20 (9) | 36 (8) |
Other | 2 (< 1)a | 1 (< 1)b | 3 (< 1) |
Any BRCA mutations, n (%) | |||
Positive | 29 (13) | 36 (16) | 65 (14) |
BRCA1 | 24 (11) | 29 (13) | 53 (12) |
BRCA2 | 9 (4) | 7 (3) | 16 (4) |
Negative or unknown | 198 (87) | 190 (84) | 388 (86) |
Time from initial diagnosis to randomization date (months)c | |||
n | ████ ███ | ████ ███ | ████ ███ |
Mean (SD) | ████ ███ | ████ ███ | ████ ███ |
Median | ████ ███ | ████ ███ | ████ ███ |
Minimum to maximum | ████ ███ | ████ ███ | ████ ███ |
Number of prior lines of therapy, n (%) | |||
1 | 29 (13) | 34 (15) | 63 (14) |
2 | 90 (40) | 88 (39) | 178 (39) |
3 | 108 (48) | 104 (46) | 212 (47) |
Prior exposure to PARP inhibitors, n (%) | |||
Yes | 124 (55) | 127 (56) | 251 (55) |
No | ████ ███ | ████ ███ | ████ ███ |
Uncertaind | ████ ███ | ████ ███ | ████ ███ |
Prior exposure to taxanes, n (%) | |||
Yes | 227 (100) | 224 (99) | 451 (100) |
No | ████ ███ | ████ ███ | ████ ███ |
Prior exposure to doxorubicin or PLD, n (%) | |||
Yes | 130 (57) | 133 (59) | 263 (58) |
No | ████ ███ | ████ ███ | ████ ███ |
Prior exposure to topo, n (%) | |||
Yes | 1 (< 1) | 2 (< 1) | 3 (< 1) |
No | ████ ███ | ████ ███ | ████ ███ |
Primary platinum-free interval,e n (%) | |||
≤ 12 months | 146 (64) | 142 (63) | 288 (64) |
> 12 months | 80 (35) | 84 (37) | 164 (36) |
Missing | 1 (< 1) | 0 | 1 (< 1) |
Platinum-free interval,f n (%) | |||
≤ 3 months | 88 (39) | 99 (44) | 187 (41) |
> 3 months to ≤ 6 months | 138 (61) | 124 (55) | 262 (58) |
> 6 months | 1 (< 1) | 3 (1) | 4 (< 1) |
ECOG Performance Status, n (%) | |||
0 | 130 (57) | 120 (53) | 250 (55) |
1 | 97 (43) | 101 (45) | 198 (44) |
2 | 0 | 3 (1)g | 3 (< 1) |
Missing | 0 | 2 (< 1)h | 2 (< 1) |
FR alpha PS2 score (%) | |||
n | ████ ███ | ████ ███ | ████ ███ |
Mean (SD) | ████ ███ | ████ ███ | ████ ███ |
Median | ████ ███ | ████ ███ | ████ ███ |
Minimum, maximum | ████ ███ | ████ ███ | ████ ███ |
AIBW = adjusted ideal body weight; APAC = Asia Pacific; C1D1 = cycle 1, day 1; DCO = data cut-off; ECOG = Eastern Cooperative Oncology Group; EOT = end of treatment; FR = folate receptor; IC = investigator’s choice; ITT = intention to treat; MIRV = mirvetuximab soravtansine; PARP = poly (ADP-ribose) polymerase; PLD = pegylated liposomal doxorubicin; PS = Performance Status; PS2 = moderate to strong staining intensity; SD = standard deviation.
aPrimary diagnoses of “other” included tubo-ovarian primary (1 patient) and tubo-ovarian (1 patient).
bPrimary diagnoses of “other” included cancers of tubo-ovarian origin (1 patient).
cTime (months) was calculated as the number of days between the initial diagnosis date and the randomization date, divided by 30.4375.
dFor patients who participated in double-blind trials evaluating PARP inhibitor vs. placebo for whom the actual treatment was not known.
ePrimary platinum-free interval: 3 months to ≤ 12 months vs. > 12 months, defined as time from last dose of first-line platinum therapy to the date of disease progression and/or relapse following first-line therapy. Two patients were determined to be primary platinum-refractory (1 patient: primary platinum-free interval of 1.38 months; 1 patient: primary platinum-free interval of 0.59 months).
fTime from last dose of latest line of platinum therapy to the date of disease progression and/or relapse following that line of therapy.
gAll patients had an ECOG PS of 1 at screening; 3 patients shifted to an ECOG PS of 2 at C1D1.
hThe 2 patients with missing ECOG PS were randomized but not dosed; therefore, their ECOG PSs were not recorded at screening or EOT.
Source: MIRASOL trial Clinical Study Report.65
Exposure to Study Treatments
As of the DCO date of March 6, 2023, patients in the MIRV group had received a median of 7.0 cycles (1 to 39 cycles) of treatment. In the IC chemotherapy group, patients who received paclitaxel had a median of 4.0 cycles (1 to 9 cycles); those who received PLD had a median of 3.0 cycles (1 to 16 cycles); those who were treated with 1.25 mg/m2 topotecan had a median of 6.0 cycles (1 to 19 cycles); and those who were treated with 4.0 mg/m2 topotecan had a median of 2.0 cycles (1 to 12 cycles). The median duration of dosing was longer in the MIRV treatment group than in the IC chemotherapy group (4.98 months versus 2.96 months), and the number of cycles of treatment received was greater in patients who received MIRV (7.0 cycles versus 3.0 cycles). A larger proportion of patients treated with MIRV received a total of at least 2 cycles to at least 10 cycles of treatment compared with IC chemotherapy. If an incident of grade 1 medication error was reported on day 1, the patient continued MIRV treatment at the appropriate AIBW dosing without issue, and the dose was calculated using actual body weight instead of AIBW, resulting in a ██% greater dose at their first infusion.
Subsequent Anticancer Therapy
A total of ████% and ████% of patients treated with MIRV and IC chemotherapy received new anticancer therapies. In the MIRV treatment group, the most common new anticancer therapies received by patients were taxanes (████%), gemcitabine (████%), anthracyclines (████%), other chemotherapy (████%), bevacizumab (████%), and platinum compounds (████%). Of those treated with IC chemotherapy, the most common new anticancer therapies received were gemcitabine (████%), taxanes (████%), other chemotherapy (████%), platinum compounds (████%), and bevacizumab (████%).
Table 13: Summary of Patient Exposure in the MIRASOL Trial (ITT Population; DCO Date of March 6, 2023)
Exposure | MIRV (N = 218) | IC chemotherapy | ||||
|---|---|---|---|---|---|---|
Total (N = 207) | Pac, 80 mg/m2 (N = 82) | PLD, 40 mg/m2 (N = 76) | Topo, 1.25 mg/m2 (N = 9) | Topo, 4.0 mg/m2 (N = 41) | ||
Number of doses received | ||||||
n | ████ | ████ | ████ | ████ | ████ | ████ |
Mean (SD) | ████ | ████ | ████ | ████ | ████ | ████ |
Median | ████ | ████ | ████ | ████ | ████ | ████ |
Number of cycles received | ||||||
n | ████ | ████ | ████ | ████ | ████ | ████ |
Mean (SD) | ████ | ████ | ████ | ████ | ████ | ████ |
Median | 7.0 | 3.0 | 4.0 | 3.0 | ████ | ████ |
Duration of dosing (weeks) | ||||||
n | ████ | ████ | ████ | ████ | ████ | ████ |
Mean (SD) | ████ | ████ | ████ | ████ | ████ | ████ |
Median | ████ | ████ | ████ | ████ | ████ | ████ |
Total cumulative dose (mg) | ||||||
n | ████ | ████ | ████ | ████ | ████ | ████ |
Mean (SD) | ████ | ████ | ████ | ████ | ████ | ████ |
Median | ████ | ████ | ████ | ████ | ████ | ████ |
Absolute dose intensitya | ||||||
n | ████ | ████ | ████ | ████ | ████ | ████ |
Mean (SD) | ████ | ████ | ████ | ████ | ████ | ████ |
Median | ████ | ████ | ████ | ████ | ████ | ████ |
Relative dose intensity (% of planned)b | ||||||
n | ████ | ████ | ████ | ████ | ████ | ████ |
Mean (SD) | ████ | ████ | ████ | ████ | ████ | ████ |
Median | ████ | ████ | ████ | ████ | ████ | ████ |
AIBW = adjusted ideal body weight; BSA = body surface area; DCO = data cut-off; IC = investigator’s choice; ITT = intention to treat; MIRV = mirvetuximab soravtansine; Pac = paclitaxel; PLD = pegylated liposomal doxorubicin; SD = standard deviation; Topo = topotecan.
aFor MIRV: Dose (mg/kg) was calculated as the total cumulative dose (mg) divided by the number of valid drug administration records (performed or held infusions) and by AIBW (kg). For the remaining investigational products: Dose (mg/m2) was calculated as the total cumulative dose (mg) divided by the number of valid drug administration records (performed or held infusions) and by BSA (m2).
bFor MIRV: calculated as (absolute dose intensity divided by 6) × 100. For Pac: calculated as (absolute dose intensity divided by 80) × 100. For PLD: calculated as (absolute dose intensity divided by 40) × 100. For Topo 1.25 mg/m2 once daily for 5 days every 3 weeks.: calculated as (absolute dose intensity divided 1.25) × 100. For Topo 4 mg/m2 on days 1, 8, and 15 every 4 weeks: calculated as (absolute dose intensity divided by 4) × 100.
Source: MIRASOL trial Clinical Study Report.65
Concomitant Medications and Cointerventions
A summary of common (≥ 20%) concomitant medications is provided in Table 14. Overall, ███ (██%) and ███ (██%) of patients treated with MIRV and IC chemotherapy had at least 1 prior medication within 4 weeks of C1D1. ███% and ██% of patients treated with MIRV and IC chemotherapy received at least 1 concomitant medication, respectively. In the MIRV group, a total of ██ (██%) underwent prior and concomitant procedures compared to ██ patients (██%) in the IC chemotherapy group.
Efficacy
Progression-Free Survival
The DCO date for the primary PFS (investigator-assessed) analysis was March 6, 2023, by which time 330 events had occurred (Table 15). The median PFS was 5.62 months (95% CI, 4.34 to 5.95 months) in the MIRV treatment group compared to 3.98 months (95% CI, 2.86 to 4.47 months) in the IC chemotherapy group. The HR for PFS per investigator assessment was 0.65 (95% CI, 0.521 to 0.808; P < 0.0001). The Kaplan-Meier estimated differences in PFS probabilities between groups at 6 months was ████ (95% CI, ████ ██ ████) in favour of MIRV. At 12 months, the estimated difference in PFS probability was ████ (95% CI, ████ ██ ████) in favour of MIRV. The restricted mean PFS survival times at 12 months were ████ months (95% CI, ████ ██ ████) in the MIRV treatment group and ████ months (95% CI, ████ ██ ████) in the IC chemotherapy group. The Kaplan-Meier plot of PFS curves is shown in Figure 2.
Table 14: Common (≥ 20%) Concomitant Medications (ITT Population; DCO Date of March 6, 2023)
ATC level 1 term | MIRASOL trial, n (%) | |
|---|---|---|
MIRV (N = 227) | IC chemotherapy (N = 226) | |
Patients with at least 1 concomitant medication | ████ | ████ |
Nervous system | ████ | ████ |
Systemic hormonal preparations, excluding sex hormones and insulins | ████ | ████ |
Respiratory system | ████ | ████ |
Alimentary tract and metabolism | ████ | ████ |
Blood and blood-forming organs | ████ | ████ |
Cardiovascular system | ████ | ████ |
Anti-infectives for systemic use | ████ | ████ |
Sensory organs | ████ | ████ |
Musculoskeletal system | ████ | ████ |
ATC = anatomical therapeutic chemical; DCO = data cut-off; IC = investigator’s choice; ITT = intention to treat; MIRV = mirvetuximab soravtansine.
Notes: Medications are coded using WHODrug Global-B3, March 2021 version.
Concomitant medications are defined as medications used during the course of study treatment, within 30 days of the last dose of the study drug, or before the start of a new anticancer treatment, whichever occurs first.
Source: MIRASOL trial Clinical Study Report (Table 14.1.5.2).65
The PFS results at the latest DCO date of September 26, 2024, were consistent with those on March 6, 2023. The median PFS was 5.59 months (95% CI, 4.34 months to 5.88 months) in the MIRV group compared to 3.98 months (95% CI, 2.86 to 4.47 months) in the IC chemotherapy, with a between-group difference of ████ months (95% CI, ████ ██ ████) in favour of MIRV. The HR for PFS was 0.63 (95% CI, 0.51 to 0.78; P = 0.0001).
Results of the subgroup analyses of PFS by BICR at both DCOs were consistent with those of the overall population analyses with respect to prior number of lines of platinum and non–platinum-based lines of therapy before enrolment. PFS by BICR was evaluated as a sensitivity analysis at both DCOs; the results were generally consistent with those of the investigator assessment.
Figure 2: Kaplan-Meier Plot for PFS per Investigator (ITT Population; DCO of March 6, 2023)
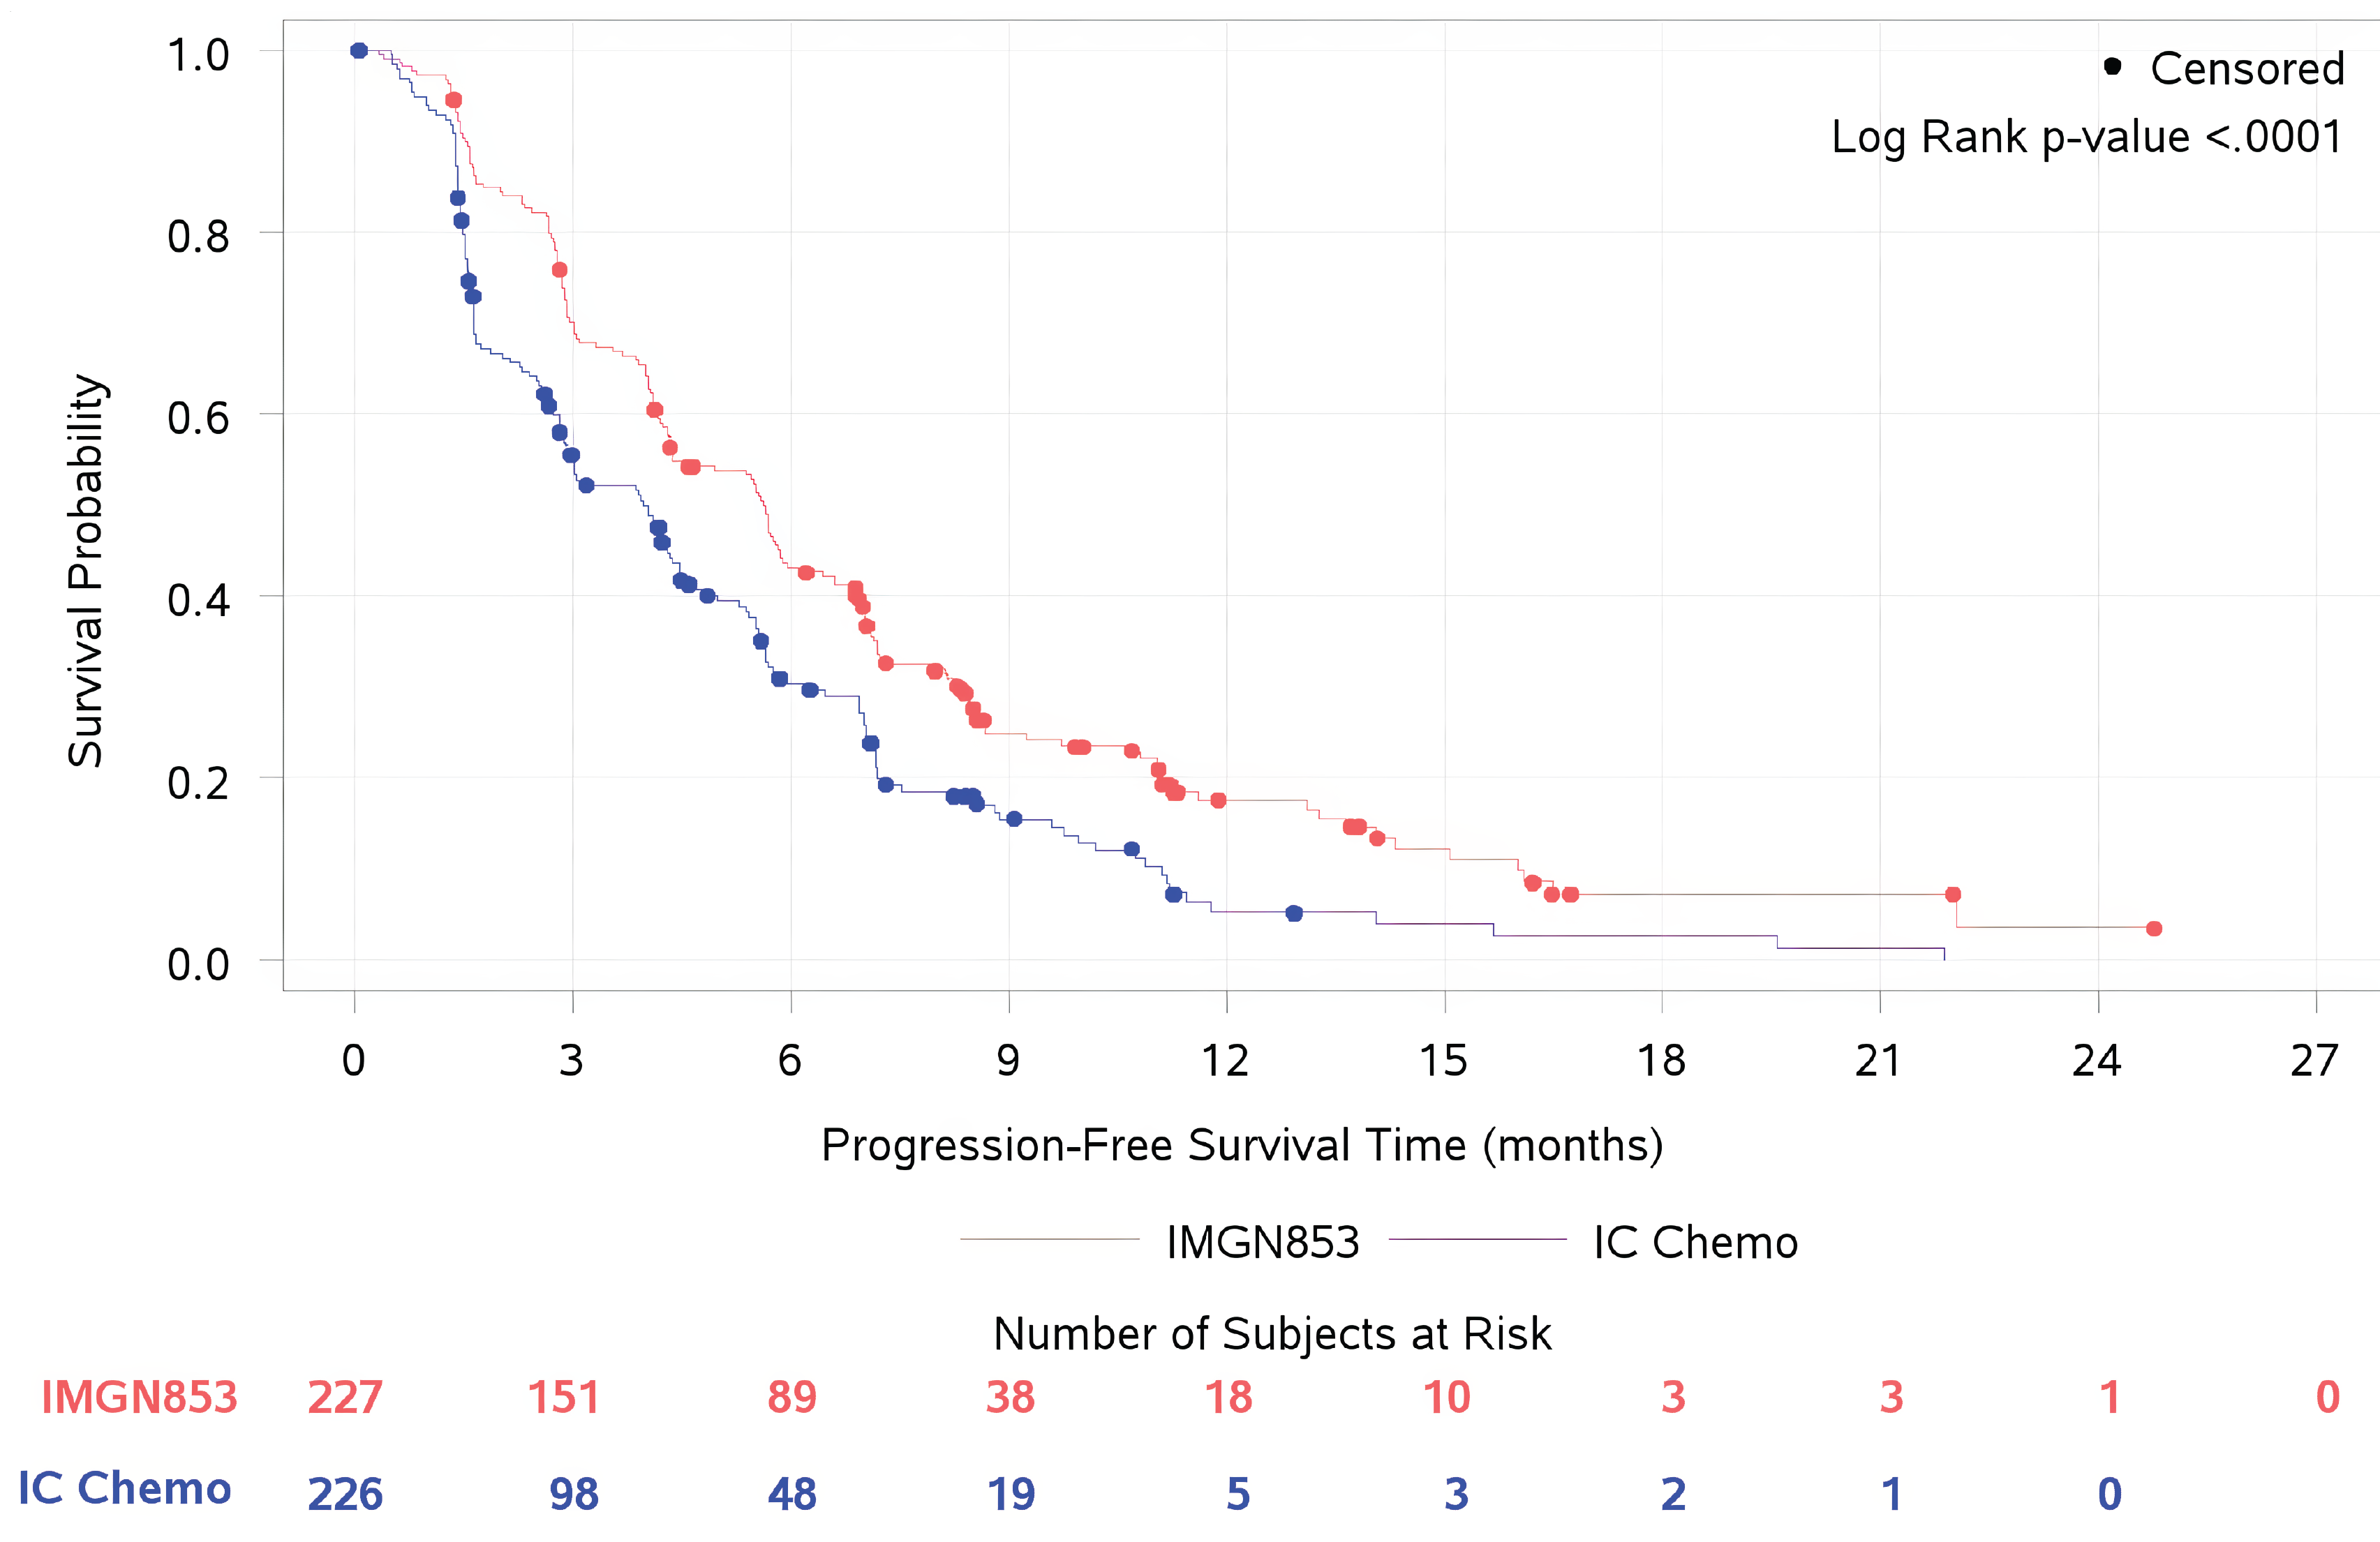
DCO = data cut-off; IC = investigator’s choice; IMGN853 = mirvetuximab soravtansine; PD = progressive disease; PFS = progression-free survival.
Note: PFS is defined as the time from the date of the first dose of MIRV to the date of PD or death from any cause, whichever occurred first.
Source: MIRASOL trial Clinical Study Report (Figure 2).65
Table 15: Summary of PFS Results From the MIRASOL Trial (ITT Population; DCO Date of September 26, 2024)
Measure | MIRV (N = 227) | IC chemotherapy(N = 226) |
|---|---|---|
PFS by INV (ITT population; DCO date of March 6, 2023) | ||
Number of patients with events, n (%) | ███ ██████ | ███ ██████ |
Radiological progression | ███ ██████ | ███ ██████ |
Death | ███ ██████ | ███ ██████ |
Number of patients censored n (%) | ███ ██████ | ███ ██████ |
Estimated PFS time (months) | ||
Median (95% CI) | 5.62 (4.34 to 5.95) | 3.98 (2.86 to 4.47) |
Difference in PFS (MIRV minus IC chemotherapy) (95% CI) | ███ ██████ | |
Estimated PFS time at 6 months | ||
Probability (95% CI) | ███ ██████ | ███ ██████ |
Difference in PFS (MIRV minus IC chemotherapy) (95% CI) | ███ ██████ | |
Stratified analysis with IRT randomization values | ||
Cox proportional hazards model, HR (95% CI) | 0.65 (0.521 to 0.808) | |
2-sided P value from log-rank test | < 0.0001 | |
Estimated probabilities (95% CI) of PFS | ||
12 months | ███ ██████ | ███ ██████ |
RMST (95% CI) for PFS | ||
12 months | ███ ██████ | ███ ██████ |
PFS by INV (ITT population; DCO date of September 26, 2024) | ||
Number of patients with events, n (%) | ███ ██████ | ███ ██████ |
Radiological progression | ███ ██████ | ███ ██████ |
Death | ███ ██████ | ███ ██████ |
Number of patients censored, n (%) | ███ ██████ | ███ ██████ |
Estimated PFS time (months) | ||
Median (95% CI) | 5.59 (4.34 to 5.88) | 3.98 (2.86 to 4.47) |
Difference in PFS (MIRV minus IC chemotherapy) (95% CI) | ███ ██████ | |
Estimated PFS time at 6 months | ||
Probability (95% CI) | ███ ██████ | ███ ██████ |
Difference in PFS (MIRV minus IC chemotherapy) (95% CI) | ███ ██████ | |
Stratified analysis with IRT randomization values | ||
Cox proportional hazards model, HR (95% CI) | 0.63 (0.513 to 0.785) | |
2-sided P value from log-rank test | < 0.0001 | |
Estimated probabilities (95% CI) of PFS | ||
12 months | ███ ██████ | ███ ██████ |
RMST (95% CI) for PFS | ||
12 months | ███ ██████ | ███ ██████ |
PFS by BICR (ITT population; DCO date of September 26, 2024) | ||
Number of patients with events, n (%) | ███ ██████ | ███ ██████ |
Radiological progression | ███ ██████ | ███ ██████ |
Death | ███ ██████ | ███ ██████ |
Number of patients censored, n (%) | ███ ██████ | ███ ██████ |
Estimated PFS time (months) | ||
Probability (95% CI) | 5.82 (4.93 to 6.97) | 4.34 (3.52 to 4.99) |
Stratified analysis with IRT randomization values | ||
Cox proportional hazards model, HR (95% CI) | 0.70 (0.54 to 0.89) | |
2-sided P value from log-rank test | 0.0035 | |
Estimated probabilities (95% CI) of PFS | ||
12 months | ███ ██████ | ███ ██████ |
RMST (95% CI) for PFS | ||
12 months | ███ ██████ | ███ ██████ |
BICR = blinded independent central review; CI = confidence interval; DCO = data cut-off; HR = hazard ratio; IC = investigator’s choice; INV = investigator; ITT = intention to treat; IRT = interactive response technology; MIRV = mirvetuximab soravtansine; PFS = progression-free survival; RMST = restricted mean survival time.
Source: MIRASOL trial Clinical Study Report.65
Overall Survival
The DCO date for the OS analysis was September 26, 2024, by which time 300 events had occurred. At a median follow-up period of 30.49 months, 300 patients had died, including ███ (████%) in the MIRV group and ███ (████%) in the IC chemotherapy group. The median OS was 16.85 months (95% CI, 14.36 months to 19.78 months) in patients randomized to MIRV compared with 13.34 months (95% CI, 11.37 months to 15.15 months) in the IC chemotherapy group. The HR for OS was 0.68 (95% CI, 0.543 to 0.840; P = 0.0004). The Kaplan-Meier estimated differences in OS probabilities between groups at 6 months was ████ (95% CI, █████ ██ ████) in favour of MIRV. At 18 months, the estimated difference in OS probability was ████ (95% CI, ████ ██ ████) in favour of MIRV. The Kaplan-Meier plot of OS curves at the DCO date of September 26, 2024, is shown in Figure 3. Additionally, the restricted mean OS (RMST) at 18 months was █████ months (95% CI, █████ ██ █████) in the MIRV group compared to █████ months (95% CI, █████ ██ █████) in the IC chemotherapy group.
The results of subgroup analyses of OS were consistent with those of the overall population analysis with respect to prior number of lines of platinum and non–platinum-based line of therapy before inclusion. A trend for benefit of MIRV in OS over IC chemotherapy, regardless of the subgroup including prior number of lines of therapy, was observed at both DCO dates. No sensitivity analyses were performed.

Objective Response Rate
At the DCO date of September 26, 2024, █ (██%) patients randomized to MIRV and █ (██%) patients randomized to IC chemo achieved a BOR of CR, and ██ (██%) patients in the MIRV group and ██ (██%) patients in the IC chemotherapy group achieved a BOR of PR, respectively. A higher percentage of patients treated with MIRV achieved an ORR compared to patients who received IC chemotherapy (██% versus ██%), with a between-group difference of ██% (95% CI, ████ ██ ████) in favour of MIRV. The OR was ████ (95% CI, ████ ██ ███; ████████). Of the 227 patients randomized to MIRV who were included in the ITT population, ██ were nonevaluable for ORR, primarily due to not receiving the study drug; of the 226 patients in the IC chemotherapy group, ██ patients were nonevaluable for ORR, primarily due to not receiving the study drug. These ORR results were consistent with those at the DCO date of March 6, 2023.
Results of subgroup analyses were consistent with the overall analysis population for investigator-assessed ORR regardless of prior number of lines of platinum and non–platinum lines of therapy before enrolment at both DCOs. ORR per BICR was evaluated as a sensitivity analysis, and the results were consistent with those of the investigator’s assessment of ORR.
Duration of Response
At the latest DCO date of September 26, 2024, the percentages of patients who remained progression-free were similar between the MIRV and IC chemotherapy groups (██% versus ██%) Among the ██ patients with events in the MIRV group, the median DOR was ██ months (95% CI, ████ ██ ████ months) compared to ██ months (95% CI, ████ ██ ████) in the ██ patients with events in the IC chemotherapy group, with a between-group difference of ███ months (95% CI, ████ ██ ████) in favour of MIRV. These results were consistent with the results at the primary DCO.
DOR assessed by BICR was evaluated as a sensitivity analysis, and among patients randomized to MIRV, ██% had DOR events compared to ██% in the IC chemotherapy group. █████████████████████████████The median DOR by BICR was ██ months (95% CI, ████ ██ ████) in the MIRV group compared to ████ (95% CI, ████ ██ █████) in the IC chemotherapy group, with a between-group difference of ██ months (95% CI, ████ ██ ████) in favour of MIRV. No subgroup analyses were performed for DOR at either DCO date.
Health-Related Quality of Life (EORTC QLQ-OV28)
The proportions of patients who achieved a 15-point symptom subscale decrease (i.e., improvement) on the EORTC QLQ-OV28 Abdominal/GI Symptoms subscale at week 8 or 9 by March 6, 2023, were 21.0% in the MIRV group and 15.3% in the IC chemotherapy group. The between-group difference was ████ (95% CI, █████ ██ █████) in favour of MIRV.
In the analysis of change from baseline, the difference in change from baseline in EORTC QLQ-OV28 Abdominal/GI Symptoms subscale score at week 8 or 9 was –5.0 in favour of MIRV. In the subscale measuring attitude to disease, the difference in change from baseline at week 8 or 9 was 8.0 in favour of MIRV. No significant differences in change from baseline in peripheral neuropathy or sexual function at week 8 or 9 were observed between the MIRV and IC chemotherapy groups. In the attitude to disease and treatment subscale, the percentages of patients with improvement from baseline to week 8 or 9 were greater in the MIRV (████%) group than in the IC chemotherapy group (████%). The results at the DCO date of September 26, 2024, were consistent with those at the DCO date of March 6, 2023.
Table 16: Key Efficacy Results of the MIRASOL Trial (ITT Population; DCO Date of September 26, 2024)
Measure | MIRV (N = 227) | IC chemotherapy (N = 226) |
|---|---|---|
OS (ITT population; DCO date of September 26, 2024) | ||
Patients with death events, n (%) | ███ ██████ | ███ ██████ |
Patients censored, n (%) | ███ ██████ | ███ ██████ |
OS time (months) | ||
Median (95% CI) | 16.85 (14.36 to 19.78) | 13.34 (11.37 to 15.15) |
Difference in OS (MIRV minus IC chemotherapy) (95% CI) | ███ ██████ | |
Estimated probabilities (95% CI) of survival at 6 months | ||
Probability (95% CI) | ███ ██████ | ███ ██████ |
Difference in OS (MIRV minus IC chemotherapy) (95% CI) | ███ ██████ | |
Estimated probabilities (95% CI) of survival at 18 months | ||
Probability (95% CI) | ███ ██████ | ███ ██████ |
Difference in OS (MIRV minus IC chemotherapy) (95% CI) | ███ ██████ | |
RMST (95% CI) for OS | ||
18 months | ███ ██████ | ███ ██████ |
Stratified analysis with IRT randomization values | ||
Cox PH model, HR (95% CI) | 0.68 (0.543 to 0.840) | |
2-sided P value from log-rank test | 0.0004 | |
Objective response rate by INV (ITT population; DCO date of September 26, 2024) | ||
Best overall response, n (%) | ||
Complete response | ███ ██████ | ███ ██████ |
Partial response | ███ ██████ | ███ ██████ |
Stable disease | ███ ██████ | ███ ██████ |
Progressive disease | ███ ██████ | ███ ██████ |
Not evaluable | ███ ██████ | ███ ██████ |
ORR, n (%)a | ███ ██████ | ███ ██████ |
95% CIb | ███ ██████ | ███ ██████ |
Difference in ORR (MIRV minus IC chemotherapy) (95% CI) | ███ ██████ | |
Cochran-Mantel-Haenszel method | ||
Stratified on randomization factorsb | ||
Odds ratio (95% CI) | ███ ██████ | |
2-sided P value | ███ ██████ | |
Duration of response per INV (ITT population; DCO date of September 26, 2024) | ||
Number of patients with events, n (%) | ███ ██████ | ███ ██████ |
Number of patients censored, n (%) | ███ ██████ | ███ ██████ |
Estimated duration of response time (months) | ||
Median (95% CI) | ███ ██████ | ███ ██████ |
Difference in DOR (MIRV minus IC chemotherapy) (95% CI) | ███ ██████ | |
CI = confidence interval; DCO = data cut-off; IC = investigator’s choice; INV = investigator; IRT = interactive response technology; ITT = intention to treat MIRV = mirvetuximab soravtansine; ORR = objective response rate; OS = overall survival; Pac = paclitaxel; PH = proportional hazards; PLD = pegylated liposomal doxorubicin; RMST = restricted mean survival time; Topo = topotecan.
aObjective response rate is defined as the proportion of patients with complete or partial response per investigator assessment.
bStratification factors include the number of prior lines (1 versus 2 versus 3) of IC chemotherapy (Pac versus PLD versus Topo) chosen before randomization.
Source: Details included in the table are from the MIRASOL trial Clinical Study Report.65
Table 17: Summary of HRQoL Results in the MIRASOL Trial (ITT Population; DCO Date of March 6, 2023)
Time point | MIRV (N = 150) | IC chemotherapy (N = 162) |
|---|---|---|
EORTC Abdominal/GI Symptoms scale, CFB | ||
Week 8/9 | ||
Estimated difference in CFB, mean (SE)a | –3.2 (1.17) | 1.8 (1.25) |
95% CI | –5.5 to –0.8 | –0.7 to 4.3 |
Difference in mean (95% CI) | –5.0 (–8.3 to –1.6) | |
P value | 0.0041 | |
Patients with 15-point symptom improvement, n (%) | 34 (21.0) | 23 (15.3) |
Difference (MIRV minus IC chemotherapy) (95% CI) | ███ ██████ | |
PN, CFB | ||
Week 8/9 | ||
Estimated difference in CFB, mean (SE)a | 11.3 (1.48) | 9.9 (1.58) |
95% CI | 8.4 to 14.2 | 6.8 to 13.0 |
Difference in mean (95% CI) | 1.4 (–2.9 to 5.6) | |
P value | 0.5312 | |
Patients with 15-point symptom improvement, n (%) | ███ ██████ | ███ ██████ |
SF, CFB | ||
Week 8/9 | ||
Estimated difference in CFB, mean (SE)a | –2.1 (0.84) | –2.3 (0.90) |
95% CI | –3.7 to −0.4 | –4.1 to −0.6 |
Difference in mean (95% CI) | 0.2 (–2.2 to 2.7) | |
P value | 0.8390 | |
Patients with 15-point symptom improvement, n (%) | ███ ██████ | ███ ██████ |
Attitude to disease and treatment, CFB | ||
Week 8/9 | ||
Estimated difference in CFB, mean (SE)a | 6.5 (1.40) | –1.5 (1.50) |
95% CI | 3.7 to 9.3 | –4.4 to 1.5 |
Difference in mean (95% CI) | 8.0 (3.9 to 12.0) | |
P value | < 0.0001 | |
Patients with 15-point symptom improvement, n (%) | 41 (25.5) | 17 (11.4) |
CFB = change from baseline; CI = confidence interval; DCO = data cut-off; EORTC = European Organisation for Research and Treatment of Cancer; GI = gastrointestinal; HRQoL = health-related quality of life; IC = investigator’s choice; ITT = intention to treat; MIRV = mirvetuximab soravtansine; PN = peripheral neuropathy; SE = standard error; SF = sexual function.
aEstimated using a mixed model for repeated measures.
Source: Sponsor-submitted MIRASOL trial patient-reported outcomes report. Details included in the table are from the MIRASOL trial Clinical Study Report.65
Harms
Refer to Table 18 for harms data.
Adverse Events
A total of 210 patients (96%) treated with MIRV reported TEAEs of any grade, with 86% experiencing 1 TEAE of any grade compared with 94% of patients in the IC chemotherapy group. Notably, 42% of patients treated with MIRV reported TEAEs that were at least grade 3 in severity, and 24% reported at least 1 SAE related to MIRV. Compared to the IC chemotherapy group, a greater proportion of patients treated with MIRV reported ocular TEAEs, including dry eye (28% versus 2%), photophobia (18% versus < 1%), cataract (15% versus < 1%), and reduced visual acuity (12% versus 0%). Similarly, a higher proportion of patients treated with MIRV reported abdominal pain (30% versus 15%), arthralgia (██% versus ██%), and diarrhea (29% versus 17%). Additionally, fewer patients treated with MIRV reported neutropenia (11% versus 29%), anemia (10% versus 34%), and alopecia (1% versus 14%) compared with those who received IC chemotherapy.
Serious AEs
Patients treated with MIRV reported fewer SAEs compared to those treated with IC chemotherapy (24% versus 33%). In the MIRV treatment group, the most common SAEs of any grade were GI disorders (██%), pleural effusion (██%), and small intestinal obstruction (██%). Among patients treated with IC chemotherapy, the most common SAEs of any grade were GI disorders (██%), small intestinal obstruction (██%), and neutropenia (██%).
Withdrawals Due to TEAEs
Compared to 16% of patients in the IC chemotherapy group, 9% of patients treated with MIRV reported TEAEs leading to discontinuation. The most common events leading to discontinuation were respiratory, thoracic, and mediastinal disorders (██%), pneumonitis and blurred vision (████%). Among patients treated with IC chemotherapy, the most common AEs were GI disorders (██%), peripheral neuropathy (██%), thrombocytopenia, and fatigue (██%).
Mortality
The proportion of patients with TEAEs leading to death were similar between treatment groups (████████ ████). Among patients treated with MIRV, ██ (████%) patients died. ██ patients (███%) died while on the study drug or within 30 days of the last dose; the primary cause of death was disease progression (██ patients, ███%), followed by AEs (██ patients, ███%). ████████████ (████%) patients died 30 or more days after the last dose, with the most common causes being disease progression (██ patients, ████%), “unknown” cause (██ patients, ███%), and AEs and “other” causes (██████████ ████, ███%). Of the patients treated with IC chemotherapy, ███ (████%) patients died; ██ patients (███%) died while on the study drug or within 30 days of the last dose, with the primary causes of death being disease progression (██ patients, ███%) and AEs (██ patients, ███%). ███ ███████ (████%) patients died 30 or more days after the last dose; the most common cause of death was disease progression (██ patients, ████%).
Notable Harms
Notable harms included peripheral neuropathy, fatigue, keratopathy, blurred vision, and pneumonitis. The proportions of patients with grade 3 peripheral neuropathy were similar in both treatment groups (i.e., 3 patients in the MIRV group and 4 patients in the IC chemotherapy group). Five patients in the MIRV group reported grade 3 fatigue compared to 11 patients in the IC chemotherapy group. Compared to IC chemotherapy, a greater proportion of patients treated with MIRV reported ocular TEAEs, including keratopathy (32% versus 0%) and blurred vision (41% versus 2%). Pneumonitis was reported in ██ patients (██%) in the MIRV treatment group compared to ██ patients (██%) in the IC chemotherapy group.
Table 18: Summary of Harms Results in the MIRASOL Trial (Safety Population; DCO Date of March 6, 2023)
Harm | MIRV (N = 218) | IC chemotherapy | |||
|---|---|---|---|---|---|
Total (N = 207) | Pac (N = 82) | PLD (N = 76) | Topo (N = 49) | ||
TEAEs, n (%) | |||||
Patients with any TEAE that was reported by ≥ 10% of patients, by preferred term, n (%) | 210 (96) | 194 (94) | ██ | ██ | ██ |
Blurred vision | 89 (41) | 5 (2) | ██ | ██ | ██ |
Keratopathy | 70 (32) | 0 | ██ | ██ | ██ |
Abdominal pain | 66 (30) | 31 (15) | ██ | ██ | ██ |
Fatigue | 66 (30) | 52 (25) | ██ | ██ | ██ |
Diarrhea | 64 (29) | 36 (17) | ██ | ██ | ██ |
Dry eye | 61 (28) | 5 (2) | ██ | ██ | ██ |
Constipation | 59 (27) | 40 (19) | ██ | ██ | ██ |
Nausea | 58 (27) | 60 (29) | ██ | ██ | ██ |
Peripheral neuropathy | 47 (22) | 30 (14) | ██ | ██ | ██ |
Asthenia | ██ | ██ | ██ | ██ | ██ |
Decreased appetite | ██ | ██ | ██ | ██ | ██ |
Photophobia | 39 (18) | 1 (< 1) | ██ | ██ | ██ |
Vomiting | ██ | ██ | ██ | ██ | ██ |
Arthralgia | ██ | ██ | ██ | ██ | ██ |
Cataract | 32 (15) | 1 (< 1) | ██ | ██ | ██ |
Headache | ██ | ██ | ██ | ██ | ██ |
Reduced visual acuity | 26 (12) | 0 | ██ | ██ | ██ |
Aspartate aminotransferase increase | ██ | ██ | ██ | ██ | ██ |
Neutropenia | 24 (11) | 59 (29) | ██ | ██ | ██ |
Anemia | 21 (10) | 71 (34) | ██ | ██ | ██ |
Peripheral sensory neuropathy | 20 (9) | 12 (6) | ██ | ██ | ██ |
Alanine aminotransferase increase | ██ | ██ | ██ | ██ | ██ |
Thrombocytopenia | 16 (7) | 33 (16) | ██ | ██ | ██ |
Dyspnea | ██ | ██ | ██ | ██ | ██ |
Hypokalemia | ██ | ██ | ██ | ██ | ██ |
Dysgeusia | ██ | ██ | ██ | ██ | ██ |
Ascites | ██ | ██ | ██ | ██ | ██ |
Peripheral edema | ██ | ██ | ██ | ██ | ██ |
Hypomagnesemia | ██ | ██ | ██ | ██ | ██ |
Stomatitis | 7 (3) | 23 (11) | ██ | ██ | ██ |
White blood cell count decrease | ██ | ██ | ██ | ██ | ██ |
Epistaxis | ██ | ██ | ██ | ██ | ██ |
Alopecia | 3 (1) | 29 (14) | ██ | ██ | ██ |
Blood creatinine increase | ██ | ██ | ██ | ██ | ██ |
Dry skin | ██ | ██ | ██ | ██ | ██ |
Leukopenia | ██ | ██ | ██ | ██ | ██ |
Nail disorder | ██ | ██ | ██ | ██ | ██ |
Palmar-plantar erythrodysesthesia syndrome | ██ | ██ | ██ | ██ | ██ |
Patients with any TEAE with CTCAE ≥ grade 3, n (%) | 91 (42) | 112 (54) | ██ | ██ | ██ |
Keratopathy | 20 (9) | 0 | ██ | ██ | ██ |
Blurred vision | 17 (8) | 0 | ██ | ██ | ██ |
Small intestinal obstruction | ██ | ██ | ██ | ██ | ██ |
Peripheral neuropathy | 3 (1) | 4 (2) | ██ | ██ | ██ |
Fatigue | 5 (2) | 11 (5) | ██ | ██ | ██ |
Anemia | 2 (< 1) | 21 (10) | ██ | ██ | ██ |
Neutropenia | 2 (< 1) | 36 (17) | ██ | ██ | ██ |
Thrombocytopenia | 2 (< 1) | 13 (6) | ██ | ██ | ██ |
White blood cell count decrease | ██ | ██ | ██ | ██ | ██ |
Serious TEAEs, n (%) | |||||
Patients with any serious TEAE, n (%) | 52 (24) | 68 (33) | ██ | ██ | ██ |
Serious adverse events occurring in ≥ 2% | |||||
Small intestinal obstruction | ██ | ██ | ██ | ██ | ██ |
Pleural effusion | ██ | ██ | ██ | ██ | ██ |
Neutropenia | ██ | ██ | ██ | ██ | ██ |
TEAEs leading to study drug discontinuation, n (%) | |||||
Patients with any TEAE leading to study drug discontinuation, n (%) | 20 (9) | 33 (16) | ██ | ██ | ██ |
Deaths, n (%) | |||||
Any death | ██ | ██ | ██ | ██ | ██ |
Death occurred ≤ 30 days after last dose | ██ | ██ | ██ | ██ | ██ |
Primary cause of death | |||||
Adverse event | ██ | ██ | ██ | ██ | ██ |
Disease progression | ██ | ██ | ██ | ██ | ██ |
Unknown | ██ | ██ | ██ | ██ | ██ |
Death 30 or more days after the last dose | ██ | ██ | ██ | ██ | ██ |
Primary cause of death | |||||
Adverse event | ██ | ██ | ██ | ██ | ██ |
Disease progression | ██ | ██ | ██ | ██ | ██ |
Unknown | ██ | ██ | ██ | ██ | ██ |
Other | ██ | ██ | ██ | ██ | ██ |
Ocular TEAEs occurring in ≥ 10%, n (%) | |||||
Patients with any ocular TEAE, n (%) | |||||
Any grade | ██ | ██ | ██ | ██ | ██ |
Grade 3 or greater | ██ | ██ | ██ | ██ | ██ |
Blurred vision, n (%) | |||||
Any grade | 89 (41) | 5 (2) | ██ | ██ | ██ |
Grade 3 or greater | 17 (8) | 0 | ██ | ██ | ██ |
Keratopathy, n (%) | |||||
Any grade | 70 (32) | 0 | ██ | ██ | ██ |
Grade 3 or greater | 20 (9) | 0 | ██ | ██ | ██ |
Dry eye, n (%) | |||||
Any grade | 61 (28) | 5 (2) | ██ | ██ | ██ |
Grade 3 or greater | 7 (3) | 0 | ██ | ██ | ██ |
Photophobia, n (%) | |||||
Any grade | 39 (18) | 1 (< 1) | ██ | ██ | ██ |
Grade 3 or greater | 1 (< 1) | 0 | ██ | ██ | ██ |
Cataract, n (%) | |||||
Any grade | 32 (15) | 1 (< 1) | ██ | ██ | ██ |
Grade 3 or greater | 7 (3) | 0 | ██ | ██ | ██ |
Reduced visual acuity, n (%) | |||||
Any grades | 26 (12) | 0 | ██ | ██ | ██ |
Grade 3 or greater | 7 (3) | 0 | ██ | ██ | ██ |
CTCAE = National Cancer Institute Common Terminology Criteria for Adverse Events; DCO = data cut-off; IC = investigator’s choice; MIRV = mirvetuximab soravtansine; Pac = paclitaxel; PLD = pegylated liposomal doxorubicin; TEAE = treatment-emergent adverse event; Topo = topotecan.
Source: Details included in the table are from the sponsor’s Summary of Clinical Evidence.
Critical Appraisal
Internal Validity
The MIRASOL trial used stratified randomization of treatments based on the prognostic factors: the number of prior lines of therapy (1, 2, or 3) and the IC choice of chemotherapy (paclitaxel, PLD, or topotecan). The method of allocation concealment was not explicitly described by the sponsor, but the use of centralized randomization suggests it was likely concealed. The use of an open-label design was justified because each treatment intervention has a unique dose, examination schedule, and safety profile. The baseline characteristics were generally similar between treatment groups. Although there were some differences in characteristics, such as histologic subtypes (EOC, fallopian tube cancer, and primary peritoneal cancer) or number of prior therapies, the clinical experts consulted by CDA-AMC did not expect these differences to influence the efficacy results significantly.
The open-label design of the trial introduces the possibility of reporting, performance, and detection biases in the efficacy estimation of subjective harms and benefits. Among tumour efficacy outcomes (PFS, ORR), bias was minimized through the use of BICR, with high concordance observed between the investigator- and BICR-assessed end points. OS is considered less susceptible to bias due to its objective nature. One rule in the PFS outcomes was to censor patients who received new anticancer therapy. CDA-AMC notes that this approach may inflate PFS estimates due to censoring. For example, patients who start new therapy often do so due to their prognosis or disease trajectory. The trial reported that ██% of patients randomized to MIRV and ██% in the IC chemotherapy group received subsequent therapies, taxanes, gemcitabine, or other chemotherapy. Notably, subsequent anticancer therapies were not formally controlled by the protocol; these were administered at the investigator’s discretion. We note that subsequent anticancer therapies could be a risk of bias for efficacy estimates of OS if differential access or effectiveness of subsequent therapies existed between treatment groups.
Missing data were minimal for the primary efficacy outcome of PFS and for the secondary outcomes of OS and ORR. All randomized patients were included in the ITT analysis set. The PFS and OS analysis had low attrition rates at both DCO dates. About ██% (n = ██) and ██% (n = ██) of patients randomized to MIRV and IC chemotherapy, respectively, had missing HRQoL data assessed using the EORTC QLQ-OV28. Imputation methods for missing data were not fully described. We note that this raises concerns about bias in the HRQoL results. Notably, the key secondary end point of the EORTC QLQ-OV28 did not meet the prespecified 15-point improvement in the Abdominal/GI Symptoms scale; however, a prespecified sensitivity analysis with a difference of 11.1 between groups favoured MIRV over IC chemotherapy.
The primary efficacy analyses for PFS and OS were based on stratified Cox proportional hazards models, which assume a constant HR between treatment groups over time. At the final analysis, the results demonstrated a statistically significant improvement in OS for patients treated with MIRV compared to those treated with IC chemotherapy. However, visual inspection of the Kaplan-Meier OS curves showed initial overlap between treatment arms, with notable separation beginning around 3 months and becoming more distinct by 6 months, suggesting potential nonproportional hazards. A similar pattern was observed in the PFS curves, which began to diverge around 2 to 3 months postrandomization. These patterns may indicate time-varying treatment effects, potentially violating the proportional hazards assumption. We note that neither the statistical analysis plan nor the Clinical Study Report specified whether formal tests or sensitivity analyses were conducted to assess this assumption. Although this introduces some uncertainty regarding the interpretation of HRs, the direction and magnitude of the treatment effects remained consistent across the prespecified subgroups and supported the OS benefit observed. The sponsor performed hierarchical testing beginning with PFS — then ORR, OS, and HRQoL — to control the family-wise type I error rate. Subgroup analyses were prespecified for prognostic variables, including number of prior lines of platinum- and non–platinum-based therapy. Overall, the benefits for PFS, OS, and ORR were consistent across subgroups. No interaction tests were performed.
External Validity
The population enrolled in the MIRASOL trial consisted of f patients with platinum-resistant EOC who showed high FR alpha expression (assessed using the VENTANA FOLR1 Assay as ≥ 75% of tumour cells exhibiting ≥ 2+ staining intensity). According to the clinical experts, only 35% to 40% of patients with platinum-resistant EOC would meet this biomarker threshold; this suggests that MIRV is specific to this subset of patients with EOC. In addition, only patients with an ECOG PS of 0 or 1 were eligible, whereas in practice, a considerable proportion of patients with platinum-resistant disease have an ECOG PS of 2 or higher, particularly after multiple lines of therapy. The exclusion of patients with primary refractory disease, active ocular conditions, significant neuropathy, or serious comorbidities limits the generalizability of the trial’s efficacy results to patients with worse prognostic statuses who may still be considered eligible for treatment.
The clinical experts noted that the administration of MIRV at 6 mg/kg AIBW every 3 weeks aligns with dosing in Canadian practice. However, MIRV is associated with specific ocular toxicities (e.g., blurred vision, keratopathy) that require specialized monitoring, including ophthalmologic assessments. Access to ophthalmology services is variable across Canada; wait times for specialist consultations could delay the detection and management of ocular AEs compared to the trial conditions. In the trial, systematic ophthalmologic evaluations were mandated and readily accessible.
The clinical experts consulted for this review indicated that the comparator arm of IC chemotherapy, consisting of weekly paclitaxel, PLD, or topotecan, reflected standard of care treatment options for PROC in Canada, and that the dosage schedules were consistent with Health Canada–approved labelling. The multinational nature of the trial, which involved sites in North America, Europe, Asia Pacific, and Canada, enhances the external validity, given that many participating centres were in countries with health care systems similar to Canada’s.
Input from the clinical experts and patient and clinician groups suggested that the trial measured meaningful outcomes relevant to patients, including PFS, OS, and HRQoL. However, a key limitation was the incomplete measurement of HRQoL: the primary HRQoL analysis was assessed at week 8 or 9 only, with limited longer-term data reported. Given that HRQoL was identified as a key outcome in patient and clinician input, the lack of long-term assessment of these data is a notable limitation.
GRADE Summary of Findings and Certainty of the Evidence
Methods for Assessing the Certainty of the Evidence
For the pivotal studies and RCTs identified in the sponsor’s systematic review, GRADE was used to assess the certainty of the evidence for the outcomes considered most relevant to inform expert committee deliberations, and a final certainty rating was determined as outlined by the GRADE Working Group:38,39
High certainty: We are very confident that the true effect lies close to that of the estimate of the effect.
Moderate certainty: We are moderately confident in the effect estimate. The true effect is likely to be close to the estimate of the effect, but there is a possibility that it is substantially different. We use the word “likely” for evidence of moderate certainty (e.g., “X intervention likely results in Y outcome”).
Low certainty: Our confidence in the effect estimate is limited. The true effect may be substantially different from the estimate of the effect. We use the word “may” for evidence of low certainty (e.g., “X intervention may result in Y outcome”).
Very low certainty: We have very little confidence in the effect estimate. The true effect is likely to be substantially different from the estimate of the effect. We describe evidence of very low certainty as “very uncertain.”
Following the GRADE approach, evidence from the RCTs started as high-certainty evidence and could be rated down for concerns related to study limitations (which refer to internal validity or risk of bias), inconsistency across studies, indirectness, imprecision of effects, or publication bias.
When possible, certainty was rated in the context of the presence of an important (nontrivial) treatment effect; if this was not possible, certainty was rated in the context of the presence of any treatment effect (i.e., the clinical importance is unclear). In all cases, the target of the certainty of evidence assessment was based on the point estimate and its location relative to the threshold for a clinically important effect (when a threshold was available) or to the null.
The selection of outcomes for the GRADE assessment was based on the sponsor’s Summary of Clinical Evidence, consultation with clinical experts, and input received from patient and clinician groups and public drug plans. The following list of outcomes was finalized in consultation with expert committee members:
PFS
OS
ORR
HRQoL (measured using the EORTC QLQ-OV28)
notable harms (peripheral neuropathy, fatigue, keratopathy, vision blurred, and pneumonitis).
The reference points for the certainty of evidence assessment for PFS, OS, ORR, HRQoL (assessed using EORTC QLQ-OV28), and notable harms (including peripheral neuropathy, fatigue, keratopathy, blurred vision, and pneumonitis) were set according to the presence or absence of an important effect based on thresholds informed by the clinical experts consulted for this review. The reference point for the certainty of the evidence assessment for the EORTC QLQ-OV28 Abdominal/GI Symptoms subscale was set according to the 15-point symptom subscale decrease threshold that was informed by the literature.
Results of GRADE Assessments
Table 2 presents the GRADE summary of findings for MIRV from the MIRASOL trial for the treatment of adult patients with FR alpha–positive, platinum-resistant epithelial ovarian, fallopian tube, or primary peritoneal cancer who have received 1 to 3 prior systemic treatment regimens.
Long-Term Extension Studies
No relevant long-term extension studies were submitted for this review.
Indirect Evidence
The contents within this section have been informed by materials submitted by the sponsor. The following has been summarized and validated by the review team.
Objectives for the Summary of Indirect Evidence
In the absence of direct head-to-head trials evaluating the efficacy of MIRV compared to bevacizumab and chemotherapy in adult patients with PROC who have received 1 to 3 prior systemic treatment regimens, the sponsor conducted and submitted a MAIC using IPD from the MIRASOL trial and published aggregate data from the AURLEIA trial (bevacizumab plus IC chemotherapy).64 The objectives of this section are to summarize and critically appraise the sponsor-submitted ITC and to inform the pharmacoeconomic model.
Description of Indirect Comparison
Objective
The primary objective of this ITC was to compare the efficacy and safety of MIRV versus bevacizumab plus IC chemotherapy (AURELIA trial) in patients with previously treated, platinum-resistant epithelial ovarian, primary peritoneal, or fallopian tube cancers.
Study Selection Methods
The studies eligible for inclusion in the sponsor-submitted ITC were selected according to a sponsor-conducted literature review with a broader scope than the ITC objectives. The sponsor identified adult female patients with platinum-resistant or -refractory epithelial ovarian, primary peritoneal, or fallopian tube cancers who had received at least 1 prior systemic anticancer regimen as the broad population inclusion criteria and any pharmacological intervention as the broad intervention or comparator inclusion criteria. The sponsor’s systematic literature review was further refined by the population, intervention, comparators, outcomes, and study design (PICOS) described as relevant for the ITC in Table 19. The scope of the systematic literature review that is relevant for the ITC included trial evidence of adult patients with PROC who had received 1 to 3 prior systemic treatment regimens.
Table 19: Study Selection Criteria and Methods for the ITC Submitted by the Sponsor
Characteristics | Indirect comparison |
|---|---|
Population | Adult female patients with PROC who had received 1 to 3 prior systemic treatment regimens |
Intervention | MIRV 6 mg/kg of AIBW IV on day 1 of a 3-week cycle |
Comparator | Bevacizumab (10 mg/kg IV every 2 weeks or 15 mg/kg IV every 3 weeks) in combination with any of the following:
|
Outcome | PFS, OS, ORR, rate of grade 3 or higher TEAEs, and rate of discontinuation due to any TEAE |
Study designs | RCTs (phase II and beyond), multiarm nonrandomized trials, open-label extension studies, or long-term follow-up trials |
Publication characteristics | Published studies |
Exclusion criteria |
|
Databases searched | Embase, MEDLINE, the Cochrane Library, recent conferences (2021 to 2024 inclusive), clinical trial registries, previous HTA reports, and the bibliographic reference lists of relevant SLRs and meta-analyses |
Selection process | Articles were screened independently by 2 reviewers; arbitration was provided by a third, more senior reviewer if required. |
Data extraction process | Data from the included publications were extracted by 1 reviewer into a standardized, piloted data extraction table in Microsoft Excel, and the information was quality-checked by a second independent reviewer. |
Quality assessment | Quality assessment was performed using the Cochrane Risk of Bias tool. Quality assessment was performed by 1 reviewer and quality-checked by a second independent reviewer. |
AIBW = adjusted ideal body weight; HTA = health technology assessment; ITC = indirect treatment comparison; MIRV = mirvetuximab soravtansine; NMA = network meta-analysis; ORR = objective response rate; OS = overall survival; PFS = progression-free survival; PLD = pegylated liposomal doxorubicin; PROC = platinum-resistant ovarian cancer; RCT = randomized controlled trial; SLR = systematic literature review; TEAE = treatment-emergent adverse event.
Source: Details included in the table are from the sponsor’s Summary of Clinical Evidence.
ITC Analysis Methods
An indirect comparison of MIRV versus bevacizumab plus chemotherapy was conducted using a MAIC estimator. Before the analysis, a feasibility assessment was conducted to identify key areas of similarity and heterogeneity between the MIRASOL and AURELIA studies, including a comparison of inclusion and exclusion criteria, outcome definitions, and study designs. An anchored MAIC was conducted using IC chemotherapy as a common comparator in both studies, enabling a cross-trial comparison.
The MAIC was adjusted for the following baseline characteristics: IC chemotherapy, age, number of prior lines of therapy, platinum-free interval, ECOG PS, and CA-125 levels (descriptions provided in Table 20). These characteristics were identified by the sponsor as effect modifiers that were available in the published literature for the AURELIA study and in the MIRASOL trial’s IPD. Baseline characteristics were compared between trials using Wald tests and chi-square tests (or Fisher’s exact test for small frequencies) for continuous and categorical variables, respectively. Variables were matched by reweighting IPD patients in the MIRASOL trial. The sponsor identified key cross-trial differences that were not adjusted in the MAIC, including prior use of bevacizumab, positive FR alpha expression, histology type and grade, and prior use of a PARP inhibitor. The MIRASOL trial contains missing values for ECOG PS and CA-125 among all the matching characteristics. For ECOG PS, the AURELIA trial reported the number of missing values; thus, the available data in the MIRASOL trial was matched with the available data in the AURELIA trial by the specified category. However, the AURELIA trial did not report the number of missing values for CA-125; therefore, the CA-125 less than 100 U/mL category and missing values were combined into 1 category.
Individual patients in the MIRASOL study were assigned weights corresponding with the respective arms of the AURELIA study — specifically, the MIRV group was matched to the bevacizumab arm, and the chemotherapy arms were matched to each other. The weights represented the odds of being in the MIRASOL trial arm versus the corresponding AURELIA trial arm, calculated using a logistic regression model based on all matched baseline characteristics. The method of moments was used for parameter estimation in the logistic regression, and an ESS was calculated by dividing the squared sum of the weights by the sum of the squared weights. Patients in the MIRASOL trial with missing information on matching variables were removed from the analysis. The statistical analyses were conducted using R 4.2.2, with source codes adapted from the National Institute for Health and Care Excellence Decision Support Unit materials.72 The process is summarized in Supplementary Appendix 3.
The efficacy outcomes analyzed in the ITC of the MIRASOL and AURELIA trials included PFS per investigator, OS, and ORR per investigator, while the safety outcomes included the rates of grade 3 or higher TEAEs and treatment discontinuation due to TEAEs. These outcomes were selected based on availability and comparability across trials. The MAIC analysis methods are summarized in Table 21.
Table 20: Matching Variables in the MAIC and Definitions
Baseline characteristics | Definition |
|---|---|
Investigator’s choice of chemotherapy before randomization | Paclitaxel vs. PLD vs. topotecan |
Age | Age < 65 years vs. ≥ 65 years |
Number of prior lines | 1 line vs. 2 to 3 lines |
Platinum-free interval | < 3 months vs. ≥ 3 months |
ECOG PS | 0 vs. 1 to 2 |
CA-125a | ≥ 100 U/mL vs. < 100 U/mL or missing |
CA-125 = cancer antigen 125; ECOG PS = Eastern Cooperative Oncology Group Performance Status; MAIC = matching-adjusted indirect comparison; PLD = pegylated liposomal doxorubicin; vs. = versus.
Source: Sponsor-submitted ITC report.64
Table 21: MAIC Analysis Methods
Methods | Description |
|---|---|
Analysis methods | Anchored MAIC |
Outcomes | PFS per investigator, OS, ORR per investigator, rate of grade 3 or higher TEAEs, rate of discontinuation due to any TEAE |
Follow-up time points | MIRASOL trial:
AURELIA trial:
|
Construction of nodes | The MIRASOL and AURELIA studies shared a common comparator (chemotherapy) |
DCO = data cut-off; ITC = indirect treatment comparison; MAIC = matching-adjusted indirect comparison; NR = not reported; ORR = objective response rate; OS = overall survival; PFS = progression-free survival; TEAE = treatment-emergent adverse event.
Source: Sponsor-submitted ITC report.64 Details included in the table are from the sponsor’s Summary of Clinical Evidence.
Results of the ITC
Summary of Included Studies
The study designs of the MIRASOL and AURELIA trials were generally comparable. Some of the differences between trials were in the distributions of patient characteristics. Some of these characteristics were adjusted for in the matching procedure, including the number of prior lines of therapy, platinum-free interval, choice of preassigned chemotherapy, and ECOG PS. However, other characteristics were not feasible to include as adjustment variables due to lack of testing or reporting in the AURELIA trial, more restrictive inclusion criteria in the MIRASOL trial, or impact on sample size. FR alpha expression was considered a potential effect modifier for both MIRV and pooled chemotherapy;73 however, FR alpha was not reported in the AURELIA trial. The 2 trials differed in the criteria used to measure response, progression, and AEs as well as in the censoring rules applied to PFS and OS. The assessment of homogeneity related to the MIRASOL and AURELIA trials is summarized in Table 22.
Table 22: Assessment of Homogeneity in the ITC
Characteristics | Description and handling of potential effect modifiers |
|---|---|
Study design | Both trials were phase III, global, multicentre, open-label, randomized controlled trials involving adult patients with epithelial ovarian, fallopian tube, or primary peritoneal cancer. |
Median follow-up | The follow-up durations were similar between the 2 trials, at approximately 13 months for all outcomes except OS, which the AURELIA trial reported using a data cut taken 1 year later. |
Inclusion and exclusion criteria | Both the MIRASOL and AURELIA trials focused on adult patients with platinum-resistant epithelial ovarian, fallopian tube, or primary peritoneal cancer. The primary inclusion and exclusion criteria of the trials were generally comparable, with key differences described as follows:
|
Investigator’s choice of chemotherapy before randomization | A higher proportion of patients was preassigned to receive paclitaxel in the MIRASOL trial (41%) compared to the AURELIA trial (32%), and a slightly lower proportion of patients was preassigned to receive topotecan in the MIRASOL trial (23%) compared to the AURELIA trial (33%); the proportions were similar for PLD across the trials (36% in the MIRASOL trial and 35% in the AURELIA trial). |
Number of prior chemotherapies/ prior lines |
|
ECOG PS | The MIRASOL trial specified an ECOG PS ≤ 1, and 44.6% of patients had an ECOG PS of 1. The AURELIA trial specified an ECOG PS ≤ 2, and 41.6% of patients had an ECOG PS of 1 to 2 (only 6% of patients had a score of 2). The proportions of patients in the AURELIA trial with an ECOG PS of 1 and 2 were combined to preserve the sample size. The proportion of patients with an ECOG PS of 0 vs. 1 to 2 was matched between the 2 studies. |
Prior use of bevacizumab | In the AURELIA trial, approximately 7% of patients had prior antiangiogenic therapy at baseline; in the MIRASOL trial, approximately 62% patients had received bevacizumab previously, but the proportion of patients who had received other types of antiangiogenic therapy was unknown. The sponsor opted not adjust for this variable due to potential effective sample size reductions. |
Positive FR alpha expression | All patients in the MIRASOL trial had positive FR alpha expression, whereas FR alpha expression was not reported in the AURELIA trial; thus, adjustment was not feasible. |
Histology type and grade | The AURELIA trial included a broad range of histology types, whereas 99.8% patients had serous cancer in the MIRASOL trial; thus, adjustment was not feasible. In the MIRASOL trial, around 54% patients were missing a histologic grade; thus, adjustment was not feasible. |
Primary platinum resistance | Around 70% of patients experienced primary platinum resistance (i.e., they progressed within 6 months after receiving 1 line of platinum therapy) in the AURELIA trial, while less than 60% of patients experienced primary platinum resistance in the MIRASOL trial. The sponsor notes that these data were not directly reported in the MIRASOL trial; rather, they were inferred based on the proportion of patients with primary platinum-free intervals ≤ 12 months. |
Measurable disease | All patients in the MIRASOL trial had measurable disease per RECIST 1.1, whereas only around 80% patients in the AURELIA trial had measurable disease per RECIST 1.0 (given that the AURELIA trial also included patients with measurable disease, defined according to GCIG CA-125 criteria, who required chemotherapy treatment). The sponsor reports that adjustment was not feasible, given that the MIRASOL trial had more restricted inclusion criteria and that redefining the MIRASOL trial’s patients using the AURELIA trial’s definition was not possible. |
Prior PARP inhibitor | The AURELIA trial was conducted before the introduction of PARP inhibitors; thus, all patients had no prior exposure to PARP inhibitor. However, in the MIRASOL trial, around 55% patients had received a prior PARP inhibitor. The sponsor opted not to adjust for this variable due to potential effective sample size reductions. |
BRCA mutation | In the MIRASOL trial, 14% of the ITT population tested positive for BRCA mutations; the remaining percentage had negative or unknown BRCA status. In the AURELIA trial, BRCA status was not reported. Thus, matching on this variable is not feasible. |
Origin of cancer | Approximately 81% of patients in the MIRASOL trial and 90% in the AURELIA trial had ovarian-origin cancer. The sponsor did not consider this factor a key effect modifier among the diagnosis characteristics in this patient population. |
Disease stage | Approximately 94% and 85% to 90% of patients were diagnosed at stage III or stage IV in the MIRASOL trial and AURELIA trial, respectively. Given that all patients in both trials experienced relapses, disease stage was considered irrelevant to treatment efficacy. |
End point definition | The definitions of PFS per investigator and OS were similar in the MIRASOL trial and AURELIA trial, with differences in the criteria (as mentioned earlier) and censoring rules. The definitions of ORR per investigator were similar in both studies. For safety outcomes, the MIRASOL and AURELIA trials used different versions of the NCI CTCAE (5.0 and 3.0 respectively). In addition, the AURELIA trial reported the rate of discontinuation due to any TEAE outcome separately for bevacizumab and chemotherapy in the bevacizumab plus chemotherapy arm. This MAIC used the bevacizumab discontinuation rate to represent the combination therapy arm. |
CA-125 = cancer antigen 125; CR = complete response; ECOG PS = Eastern Cooperative Oncology Group Performance Status; FR = folate receptor; GCIG = Gynecologic Cancer InterGroup; ITC = indirect treatment comparison; ITT = intention to treat; MAIC = matching-adjusted indirect comparison; NCI CTCAE = National Cancer Institute Common Terminology Criteria for Adverse Events; OC = ovarian cancer; ORR = objective response rate; OS = overall survival; PARP = poly (ADP-ribose) polymerase; PFS = progression-free survival; PLD = pegylated liposomal doxorubicin; PR = partial response; RECIST 1.0 = Response Evaluation Criteria in Solid Tumour Version 1.0; RECIST 1.1 = Response Evaluation Criteria in Solid Tumour Version 1.1; TEAE = treatment-emergent adverse event; vs. = versus.
Source: Details included in the table are from the sponsor’s Summary of Clinical Evidence.
Results
After excluding patients with missing characteristics, a total of ███ patients who received MIRV in the MIRASOL trial were matched with the ███ patients who received bevacizumab plus chemotherapy in the AURELIA trial, and ███ patients in the IC chemotherapy arm in the MIRASOL trial were matched with the ███ patients who received chemotherapy in the AURELIA trial. After matching on the baseline characteristics listed in Table 20, the ESSs were ██ for the MIRV arm and ██ for the chemotherapy arm. Weights ranged from ████ ██ ████ for the MIRV arm, with ██% of patients assigned to a weight less than or equal to 0.50 and ██% assigned to a weight greater than or equal to 1. In the chemotherapy arm, weights ranged from ████ ██ ████ with ██% of patients receiving a weight less than or equal to 0.50 and ██% receiving a weight greater than or equal to 1.
The baseline characteristics were compared between the MIRASOL and the AURELIA studies and are presented in Table 23 before and after matching. Before matching, preassigned chemotherapy, numbers of prior lines, and platinum-free interval durations were statistically significantly different between the studies. After matching, all baseline characteristics included in the adjustment were balanced between the studies.
Table 23: Baseline Characteristics Before and After Matching
Baseline characteristics | MIRASOL trial | AURELIA trial | ||||
|---|---|---|---|---|---|---|
MIRV | Chemotherapy | MIRV | Chemotherapy | BEV plus chemotherapy | Chemotherapy | |
N = ███ | N = ███ | ESS = ███ | ESS = ███ | N = ███ | N = ███ | |
Preassigned chemotherapy: paclitaxel | ██ | ██ | ██ | ██ | ██ | ██ |
Preassigned chemotherapy: PLD | ██ | ██ | ██ | ██ | ██ | ██ |
Preassigned chemotherapy: topotecan | ██ | ██ | ██ | ██ | ██ | ██ |
Age ≥ 65 years | ██ | ██ | ██ | ██ | ██ | ██ |
2 to 3 prior lines | ██ | ██ | ██ | ██ | ██ | ██ |
Platinum-free interval ≥ 3 months2 | ██ | ██ | ██ | ██ | ██ | ██ |
ECOG PS 1 to 22 | ██ | ██ | ██ | ██ | ██ | ██ |
CA-125 ≥ 100 IU/mL3 | ██ | ██ | ██ | ██ | ██ | ██ |
BEV = bevacizumab; CA-125 = cancer antigen 125; ECOG PS = Eastern Cooperative Oncology Group Performance Status; ESS = effective sample size; MIRV = mirvetuximab soravtansine; PLD = pegylated liposomal doxorubicin.
aIn the MIRASOL trial, patients with missing values in matched baseline characteristics were removed from both the before- and after-matching analyses.
bIn the AURELIA trial, 3 patients had missing values for platinum-free interval (1 in the bevacizumab plus chemotherapy arm and 2 in the chemotherapy arm). In addition, 5 patients had missing values for ECOG PS (2 in the bevacizumab plus chemotherapy arm and 3 in the chemotherapy arm). Proportions were calculated among patients with nonmissing values.
cFor CA-125, matching was based on CA-125 ≥ 100 U/mL vs. < 100 U/mL or missing. In the MIRASOL trial, there were 28 patients with missing baseline CA-125 values in the MAIC sample (11 in the MIRV arm and 17 in the chemotherapy arm of the ITT population). In the AURELIA trial, the number of patients with missing values was not reported.
Source: Sponsor-submitted ITC report.64
Progression-Free Survival
The PFS curves after matching are shown in Figure 4, with median PFS results reported in Table 24. Before matching, the median PFS was ████ months (95% CI, ████ ██ ████) for the MIRV arm and ████ months (95% CI, ████ ██ ████) for the chemotherapy arm in the MIRASOL trial. After matching, the median PFS for the MIRV and chemotherapy arms in the MIRASOL study increased to ████ months (95% CI, ████ ██ █████) and ████ months (95% CI, ████ ██ ████), respectively. For the AURELIA trial, the median PFS was ████ months (95% CI, ████ ██ ████) for the bevacizumab and chemotherapy arm and ████ months (95% CI, ████ ██ ████) for the chemotherapy arm.
Figure 4: KM Curves of PFS After Matching (MIRASOL Trial, DCO Date of September 26, 2024) [Redacted]

Table 24: Median PFS Before and After Matching (MIRASOL Trial, DCO Date of September 26, 2024)
Trial | Arm | Median PFS (months), 95% CI | |
|---|---|---|---|
Before matching | After matching | ||
MIRASOL trial | MIRV | ████ ███ | ████ ███ |
Chemotherapy | ████ ███ | ████ ███ | |
AURELIA trial | Bevacizumab plus chemotherapy | ████ ███ | ████ ███ |
Chemotherapy | ████ ███ | ||
CI = confidence interval; DCO = data cut-off; MIRV = mirvetuximab soravtansine; PFS = progression-free survival.
Source: Sponsor-submitted ITC report.64
The HRs for PFS were estimated using a Cox proportional hazards model before and after matching. The risk of progression or death in the MIRV arm was comparable to that in the bevacizumab and chemotherapy arm, both before (HR = ████; 95% CI, ████ ██████) and after matching (HR = ████; 95% CI, ████ ██ ████). The proportional hazards assumption was not rejected based on the scaled Schoenfeld residuals when comparing PFS across the MIRV and chemotherapy arms in the MIRASOL trial (before matching: P value = ████; after matching: P value = ████). However, the proportional hazards assumption was rejected when comparing the bevacizumab plus chemotherapy and chemotherapy arms in the AURELIA trial (P value ████).
Table 25: PFS HR Before and After Matching (MIRASOL Trial, DCO Date of September 26, 2024)
Comparison | Before matching | After matching | ||||
|---|---|---|---|---|---|---|
HR | 95% CI | P value | HR | 95% CI | P value | |
MIRV vs. chemotherapy (MIRASOL trial) | ██ | ██ | ██ | ██ | ██ | ██ |
Bevacizumab plus chemotherapy vs. chemotherapy (AURELIA trial) | ██ | ██ | ██ | ████████ | ||
Chemotherapy (MIRASOL trial) vs. chemotherapy (AURELIA trial) | ██ | ██ | ██ | ██ | ██ | ██ |
MIRV vs. bevacizumab plus chemotherapy | ██ | ██ | ██ | ██ | ██ | ██ |
CI = confidence interval; DCO = data cut-off; HR = hazard ratio; ITC = indirect treatment comparison; MIRV = mirvetuximab soravtansine; PFS = progression-free survival; vs. = versus.
Source: Sponsor-submitted ITC report.64
Overall Survival
The OS curves after matching are shown in Figure 5; median OS is shown in Table 26. The median OS periods were █████ months (95% CI, █████ ██ █████) for the MIRV arm and █████ months (95% CI, █████ ██ █████) for the chemotherapy arm in the MIRASOL trial. After matching, in the MIRASOL trial, the median OS for the MIRV arm increased to █████ months (95% CI, █████ ██ █████), while the median OS for the chemotherapy arm decreased to █████ months (95% CI, ████ ██ █████). For the AURELIA trial, the median OS periods were █████ months (95% CI, █████ ██ █████) for the bevacizumab plus chemotherapy arm and █████ months (95% CI, █████ ██ █████) for the chemotherapy arm.

Table 26: Median OS Before and After Matching (MIRASOL Trial, DCO Date of September 26, 2024)
Trial | Arm | Median OS (months), 95% CI | |
|---|---|---|---|
Before matching | After matching | ||
MIRASOL trial | MIRV | █████ ██ | █████ ██ |
Chemotherapy | █████ ██ | █████ ██ | |
AURELIA trial | Bevacizumab plus chemotherapy | █████ ██ | █████ ██ |
Chemotherapy | █████ ██ | ||
CI = confidence interval; DCO = data cut-off; ITC = indirect treatment comparison; MIRV = mirvetuximab soravtansine; OS = overall survival.
Source: Sponsor-submitted ITC report.64
The HR estimates from the Cox proportional hazards model before and after matching are shown in Table 27. Risk of death in the MIRV arm was lower than in the bevacizumab and chemotherapy arm, with an HR of ████ (95% CI, ████ ██ ████) before matching and an HR of ████ (95% CI, ████ ██ ████) after matching for MIRV versus bevacizumab plus chemotherapy. The proportional hazards assumption based on the scaled Schoenfeld residuals was met both before and after matching for the MIRASOL trial (before matching: P value = ████; after matching: P value = ████) and the AURELIA trial (P value = ████).
Table 27: OS HR Before and After Matching (MIRASOL Trial, DCO Date of September 26, 2024)
Comparison | Before matching | After matching | ||||
|---|---|---|---|---|---|---|
HR | 95% CI | P value | HR | 95% CI | P value | |
MIRV vs. chemotherapy (MIRASOL trial) | ███ | ███ | ███ | ███ | ███ | ███ |
Bevacizumab plus chemotherapy vs. chemotherapy (AURELIA trial) | ███ | ███ | ███ | ███ | ||
Chemotherapy (MIRASOL trial) vs. chemotherapy (AURELIA trial) | ███ | ███ | ███ | ███ | ███ | ███ |
MIRV vs. bevacizumab plus chemotherapy | ███ | ███ | ███ | ███ | ███ | ███ |
CI = confidence interval; DCO = data cut-off; HR = hazard ratio; ITC = indirect treatment comparison; MIRV = mirvetuximab soravtansine; OS = overall survival; vs. = versus.
Source: Sponsor-submitted ITC report.64
ORR (MIRASOL Trial, DCO Date of September 26, 2024)
After matching, the estimated ORRs in the MIRASOL trial were ██% within the MIRV arm and ██% within the chemotherapy arm. The OR of ORR for MIRV versus bevacizumab and chemotherapy was ████ (95% CI, ████ ██ ████) before matching; it increased to ████ (95% CI, ████ ██ ████) after matching.
Table 28: ORR ORs Before and After Matching (MIRASOL Trial, DCO Date of September 26, 2024)
Comparison | Before matching | After matching | ||||
|---|---|---|---|---|---|---|
OR | 95% CI | P value | OR | 95% CI | P value | |
MIRV vs. chemotherapy (MIRASOL trial) | ███ | ███ | ███ | ███ | ███ | ███ |
Bevacizumab + chemotherapy vs. chemotherapy (AURELIA trial) | ███ | ███ | ███ | ███ | ||
Chemotherapy (MIRASOL trial) vs. chemotherapy (AURELIA trial) | ███ | ███ | ███ | ███ | ███ | ███ |
MIRV vs. bevacizumab plus chemotherapy | ███ | ███ | ███ | ███ | ███ | ███ |
CI = confidence interval; DCO = data cut-off; ITC = indirect treatment comparison; MIRV = mirvetuximab soravtansine; OR = odds ratio; ORR = objective response rate; vs. = versus.
Source: Sponsor-submitted ITC report.64
Harms
TEAEs of Grade 3 or Higher
In the AURELIA trial, the grade 3 or higher TEAE rates were ██% in the bevacizumab plus chemotherapy arm and ██% in the chemotherapy arm. After matching, the grade 3 or higher TEAE rates in the MIRASOL trial were ██% in the MIRV arm and ██% in the chemotherapy arm. The OR of grade 3 or higher TEAEs for MIRV versus bevacizumab and chemotherapy was ████ (95% CI, ████ ██ ████) before matching. After matching, the OR of MIRV versus bevacizumab and chemotherapy was ████ (95% CI, ████ ██ ████), indicating numerically lower odds of grade 3 or higher TEAEs in the MIRV arm than in the bevacizumab and chemotherapy arm, as shown in Table 29.
Table 29: Grade 3 or Higher TEAE Rate ORs Before and After Matching (MIRASOL Trial, DCO Date of September 26, 2024)
Comparison | Before matching | After matching | ||||
|---|---|---|---|---|---|---|
OR | 95% CI | P value | OR | 95% CI | P value | |
MIRV vs. chemotherapy (MIRASOL trial) | ███ | ███ | ███ | ███ | ███ | ███ |
Bevacizumab plus chemotherapy vs. chemotherapy (AURELIA trial) | ███ | ███ | ███ | ███ | ||
Chemotherapy (MIRASOL trial) vs. chemotherapy (AURELIA trial) | ███ | ███ | ███ | ███ | ███ | ███ |
MIRV vs. bevacizumab plus chemotherapy | ███ | ███ | ███ | ███ | ███ | ███ |
CI = confidence interval; DCO = data cut-off; ITC = indirect treatment comparison; MIRV = mirvetuximab soravtansine; OR = odds ratio; TEAE = treatment-emergent adverse event; vs. = versus.
Source: Sponsor-submitted ITC report.64
Discontinuation Due to Any TEAE
For the AURELIA trial, the discontinuation rates due to any TEAE were ████% in the bevacizumab and chemotherapy arm and ████% in the chemotherapy arm. After matching, the discontinuation rates due to any TEAE were ████% in the MIRV arm and ████% in the chemotherapy arm. The ORs for discontinuation due to any TEAE of MIRV versus bevacizumab and chemotherapy were ████ (95% CI, ████ ██ ████) before matching and ████ (95% CI, ████ ██ ████) after matching, indicating lower odds of discontinuation due to any TEAE in the MIRV arm than in the bevacizumab and chemotherapy arm, as shown in Table 30.
Table 30: Discontinuation Rates Due to Any TEAE — ORs Before and After Matching (MIRASOL Trial, DCO Date of September 26, 2024)
Comparison | Before matching | After matching | ||||
|---|---|---|---|---|---|---|
OR | 95% CI | P value | OR | 95% CI | P value | |
MIRV vs. chemotherapy (MIRASOL trial) | ███ | ███ | ███ | ███ | ███ | ███ |
Bevacizumab plus chemotherapy vs. chemotherapy (AURELIA trial) | ███ | ███ | ███ | ███ | ||
Chemotherapy (MIRASOL trial) vs. chemotherapy (AURELIA trial) | ███ | ███ | ███ | ███ | ███ | ███ |
MIRV vs. bevacizumab plus chemotherapy | ███ | ███ | ███ | ███ | ███ | ███ |
CI = confidence interval; DCO = data cut-off; ITC = indirect treatment comparison; MIRV = mirvetuximab soravtansine; OR = odds ratio; TEAE = treatment-emergent adverse event; vs. = versus.
Source: Sponsor-submitted ITC report.64
Critical Appraisal
The sponsor-submitted ITC was informed by a systematic literature review that was conducted with broad PICO inclusion criteria that were refined to more relevant criteria for the ITC. Risk of bias assessments of the included studies were conducted using the Cochrane Risk of Bias tool. The sponsor did not provide details on the findings from this systematic review beyond identifying MIRASOL and AURELIA as studies relevant for the ITC. The AURELIA study evaluated the benefit of adding bevacizumab to chemotherapy in patients with PROC. Enrolment began in 2009, nearly 10 years before the MIRASOL trial was conducted. Both trials were phase III, global, multicentre, open-label RCTs involving adult patients with epithelial ovarian, fallopian tube, or primary peritoneal cancer, with a focus on adult patients with platinum resistance. Both trials had similar follow-up durations for all outcomes except OS, which the AURELIA trial reported using a data cut taken 1 year later. The sponsor conducted a MAIC and reported on key aspects, including patient population matching, outcome definitions, statistical methods, and assessment of heterogeneity.
The sponsor reported on potential sources of heterogeneity between the trials, including among key patient characteristics. Some of these differences could feasibly be adjusted in the MAIC, including the number of prior lines of therapy, platinum-free interval, choice of preassigned chemotherapy, and ECOG PS. The sponsor identified other differences between variables that could not be adjusted, such as BRCA mutation status, choice of chemotherapy, differences in the criteria used to measure response, progression, and AEs, as well as differences in the censoring rules applied to PFS and OS. The clinical experts consulted for this review did not believe that the imbalances between trials in these criteria would result in substantial bias. The sponsor and clinical experts noted that the treatment landscape of OC has evolved in the time between the trials; as a result, all patients in the AURELIA trial had no prior exposure to PARP inhibitors and had prior antiangiogenic therapy at baseline. As a result of this heterogeneity between the anchored chemotherapy arms, the clinical experts believed there is serious potential for bias when comparing the cross-trial treatment effects. The anchored MAIC may be overly optimistic, and the inability to adjust for all prognostic factors introduces sufficient bias to make the magnitude of the comparative effect too uncertain to determine.
Key differences in patient populations between the trials that were considered critical by the clinical experts and could not be adjusted included tumour histology, FR alpha expression status, prior PARP inhibitor use, and prior use of bevacizumab. The clinical experts noted that the serous histology subtype, which was a required subtype for inclusion in the MIRASOL trial but not for the AURELIA trial, generally has a better prognosis than other subtypes. The sponsor and clinical experts noted that FR alpha expression has been shown to be an effective modifier for both MIRV and pooled chemotherapy; however, FR alpha was not reported in the AURELIA trial. In addition, poor overlap in baseline characteristics between the trials and a small ESS after matching (██ for the MIRV arm and ██ for the chemotherapy arm in the MIRASOL trial) increased the uncertainty around the magnitude of treatment effects and constrained the ability to adjust for additional baseline characteristics.
ITC results were presented for OS, PFS, ORR, and harms outcomes; other outcomes of relevance to patients (e.g., HRQoL) were not reported. The clinical experts noted that the clinical management of TEAEs and supportive measures has improved in the time between the trials; therefore, no meaningful conclusions can be drawn about the comparison of harms outcomes.
Studies Addressing Gaps in the Systematic Review Evidence
No relevant studies addressing gaps in the evidence from the systematic review were submitted by the sponsor.
Discussion
Summary of Available Evidence
The MIRASOL trial was a multicentre, phase III, open-label RCT that compared the efficacy and safety of MIRV with IC chemotherapy in the treatment of adult patients with FR alpha–positive, platinum-resistant EOC, fallopian tube, or primary peritoneal cancer who have received 1 to 3 prior systemic treatment regimens. From February 2020 to July 2022, 453 patients (including patients at 8 Canadian sites) were enrolled in the MIRASOL trial. Patients were randomized at a ratio of 1 to 1 to receive single-drug MIRV (3-week regimen) (N = 227) or IC chemotherapy (n = 226) (paclitaxel, PLD, or topotecan in 3-week or 4-week regimens). Randomization was stratified by the number of previous lines of therapy (1, 2, or 3) and by chemotherapy drug. Key inclusion criteria were radiographic progression on or after the most recent line of therapy and positive FR alpha expression, as assessed using the VENTANA FOLR1 Assay. The primary efficacy outcome was PFS. The key secondary objectives were to compare OS, ORR, and HRQoL as measured using the EORTC QLQ-OV28. Safety outcomes included AE, SAEs, AEs of special interest, and deaths. Notable harms included peripheral neuropathy, fatigue, keratopathy, blurred vision, and pneumonitis.
Demographic and baseline characteristics were similar between the MIRV and IC chemotherapy groups. The median age was 64.0 years in the MIRV group and 62.0 years in the IC chemotherapy group. Most participants had high-grade serous (100%) EOC (80.4%), had received 2 or 3 previous lines of therapy (86.1%), and had previous exposure to taxane (99.6%), bevacizumab (62.0%), or PARP inhibitors (55.4%). High-grade serous histology that was poorly differentiated (██%) or unknown (██% versus ██%) was common in both groups. The most frequent stages at diagnosis were stage IIIC (53%) and stage IV (29%), with a median time since diagnosis of █████ months.
A sponsor-submitted ITC estimated the comparative effectiveness of MIRV versus bevacizumab plus IC chemotherapy (based on the AURELIA trial) in patients with previously treated platinum-resistant ovarian, primary peritoneal, or fallopian tube cancers.
Interpretation of Results
Efficacy
Evidence from the MIRASOL trial suggests there is moderate to high certainty that MIRV results in an increase in PFS compared to IC chemotherapy. At the latest DCO date, the observed difference in PFS probability at 6 months was ████ (95% CI, █████ ████); the difference at 12 months was ████ (95% CI, ████ ██ ████). Both favour MIRV. The difference in PFS probability at 12 months surpassed the 5% threshold for clinical significance set by the clinical experts consulted for the review, suggesting that MIRV provides benefit over IC chemotherapy. The HR for PFS (0.63; 95% CI, 0.51 to 0.78; P < 0.0001) indicates a 37% reduction in the hazard of progression in favour of MIRV. Subgroup analyses also demonstrated a reduction in the time to progression or death regardless of prior number of lines of therapy. Specifically, PFS results among both the bevacizumab-naive and the bevacizumab-pretreated subgroups demonstrated a consistent benefit of MIRV over IC chemotherapy.
The observed difference in OS probability at 6 months (████; 95% CI, █████ ██ ████) included both a clinically meaningful benefit and the possibility of no survival benefit or harm, suggesting that MIRV may result in little to no difference in OS compared to IC chemotherapy at 6 months. Point estimates of efficacy for OS favoured MIRV over IC chemotherapy, suggesting treatment benefit; and the observed OS probability at 18 months exceeded the 5% absolute difference in OS probability threshold for clinical significance set by the clinical experts, suggesting a clinically meaningful effect in favour of MIRV compared to IC chemotherapy. Sources of uncertainty regarding treatment efficacy in OS include the effects of subsequent anticancer therapies. In the trial, ████% and ████% of patients treated with MIRV and IC chemotherapy, respectively, received new anticancer therapies. The HR for OS (0.68; 95% CI, 0.5 to 0.8; P = 0004) suggests a 32% reduction in the hazard of death in patients randomized to MIRV compared to IC chemotherapy. Subgroup analyses for OS were consistent with the overall population.
According to the clinical experts consulted for the review, the ORR reflects a reduction in tumour size and distribution, in turn affecting patients’ disease symptoms and functional status. The results from the MIRASOL trial showed that there is high-certainty evidence that MIRV led to a clinically meaningful improvement in ORR compared to IC chemotherapy. The observed difference in ORR was beyond the 10% threshold for clinical significance set by the clinical experts consulted for the review.
The clinical experts noted that improvements in abdominal and/or GI symptoms are particularly important to patients because these significantly affect QoL. In the MIRASOL trial, a clinically meaningful improvement in HRQoL was defined as a decrease of 15 points or more on the EORTC QLQ-OV28 Abdominal/GI Symptoms scale. A higher proportion of patients treated with MIRV (████%) achieved this level of symptom relief compared to patients treated with IC chemotherapy (████%). However, based on the between-group absolute risk difference of 10% considered clinically important by the clinical experts in the absence of a validated MID for this outcome, the certainty of the evidence was assessed to be low because the CI of the observed effect (████%; 95% CI, █████ ██ █████) included the possibility of no improvement in HRQoL; this suggests that MIRV may result in little to no difference in improvement in abdominal and/or GI symptoms compared to IC chemotherapy. The review team acknowledges that the change from baseline on the EORTC QLQ-OV28 Abdominal/GI Symptoms scale is numerically in favour of MIRV relative to IC chemotherapy at week 8/9; however, the clinical relevance of this difference and how it would translate to clinical practice is challenging to interpret. A lower proportion of patients treated with MIRV achieved an improvement of 15 points or more on the EORTC QLQ-OV28 Peripheral Neuropathy scale (███% versus ██%), while a higher proportion achieved improvement in the attitude to disease subscale.
The sponsor-submitted ITC comparing MIRV to bevacizumab and chemotherapy suggested shorter PFS (HR = ████; 95% CI, ████ ██ ████), longer OS (HR = ████; 95% CI, ████ ██ ████), and higher ORR (OR = ████; 95% CI, █████████). The clinical experts noted sources of significant clinical heterogeneity in the patient populations of both trials, including in key variables that could not feasibly be adjusted, such as tumour histology, FR alpha expression status, and prior use of PARP inhibitors or bevacizumab; they concluded that the valid cross-trial comparisons should be interpreted with caution.
Patients with platinum-resistant EOC often become refractory to current non–platinum-based chemotherapies, including paclitaxel, PLD, topotecan, and gemcitabine, with or without bevacizumab. Fatigue, hair loss, bowel problems, and neuropathy were among the most reported side effects of currently available treatments, with the greatest impact being poor QoL. Inputs from the clinician and patient groups noted that the treatment outcomes most valued by patients include controlling disease progression, managing symptoms, and maintaining HRQoL. The clinical experts emphasized that the limitations of current therapies suggest a significant unmet need for a novel therapeutic option for patients with platinum-resistant EOC that leverages the use of biomarkers, such as FR alpha. New therapies that can meaningfully improve response rates, prolong survival, and address the underlying disease process while maintaining HRQoL are needed. Evidence from the MIRASOL trial suggests that MIRV may meet some of the needs identified by patients and clinicians.
Harms
The safety profile of MIRV in the MIRASOL trial was characterized by a distinct pattern of AEs compared to IC chemotherapy. TEAEs of any grade were reported in nearly all patients (96% with MIRV versus 94% with IC chemotherapy), with TEAEs of grade 3 or higher occurring in a lower percentage of patients randomized to MIRV compared to IC chemotherapy. Importantly, ocular AEs, including blurred vision, keratopathy, dry eye, and photophobia were more frequent with MIRV, reflecting its known on-target toxicity due to FR expression in ocular tissues. MIRV was also associated with a lower incidence of SAEs (24% versus 33%) and fewer treatment discontinuations due to TEAEs (9% versus 16%). Although both groups had similar rates of TEAEs leading to death (████████ ████), pneumonitis was notably more frequent with MIRV (██%).
The incidence of grade 3 or higher peripheral neuropathy and fatigue was comparable in both groups. Overall, the safety profile of MIRV appears more favourable in terms of hematologic and systemic burden, but its ocular harms are clinically significant. According to the clinical experts, these ocular AEs are generally reversible and can be managed with prophylactic treatments, such as eyedrop regimens and dose modifications, which have been shown to be effective. In the sponsor-submitted ITC, compared to bevacizumab and chemotherapy, MIRV was associated with a lower risk of grade 3 or higher TEAEs and of discontinuation due to any TEAE; however, the clinical experts have noted that this may be due to the evolution in the clinical management of TEAEs in the 10 years between the trials.
Conclusion
The MIRASOL trial demonstrated with moderate to high certainty that MIRV offers clinically meaningful improvement in PFS compared with IC chemotherapy in patients with platinum-resistant EOC whose tumours express high FR alpha, defined as greater than or equal to 75% of viable tumour cells exhibiting greater than or equal to 2+ membrane staining intensity, as assessed using the VENTANA FOLR1 Assay. MIRV likely led to an increase in OS compared to IC chemotherapy at 18 months. While MIRV demonstrated a higher ORR compared to IC chemotherapy, it resulted in little to no clinically important difference in the proportion of patients who reported a clinically meaningful improvement on the EORTC QLQ-OV28 Abdominal/GI Symptoms subscale compared with IC chemotherapy. MIRV was characterized by low-grade, reversible ocular, GI, and neurosensory AEs, including dry eye, abdominal pain, diarrhea, nausea, and constipation. We determined with low to moderate certainty that notable harms, including peripheral neuropathy, fatigue, keratopathy, and pneumonitis, showed little to no difference in patients treated with MIRV compared to IC chemotherapy. On the other hand, there was high-certainty evidence that treatment with MIRV resulted in blurred vision compared to IC chemotherapy.
The sponsor-submitted ITC shows mixed or comparable treatment effects of MIRV and bevacizumab plus chemotherapy on PFS and OS. Evidence from the ITC favours MIRV in the safety outcomes. As a result of the heterogeneity between patient populations in both trials and the evolution of the treatment landscape for OC in the time between trials, the effects estimates could be biased and underestimate the treatment differences.
References
1.Moore KN, Angelergues A, Konecny GE, et al. Mirvetuximab soravtansine in FR-alpha-positive, platinum-resistant ovarian cancer. New England Journal of Medicine. 2023;389(23):2162-2174. PubMed
2.What Is Ovarian Cancer? American Cancer Society. 2018. Available at: https://www.cancer.org/cancer/types/ovarian-cancer/about/what-is-ovarian-cancer.html.
3.Arora T, Mullangi S, Vadakekut ES, et al. Epithelial Ovarian Cancer. [Updated 2024 May 6]. In: StatPearls [Internet]. Treasure Island (FL): StatPearls Publishing; 2025 Jan-. Available from: https://www.ncbi.nlm.nih.gov/books/NBK567760/.
4.Drug Intelligence. ONCO-CAPPS Patient Treatment Dynamics Ovarian Cancer. 2023 Q3 Update and Trends. April 2024.
5.Ovarian Cancer Research Alliance. High-Grade Serous Carcinoma. Available at: https://ocrahope.org/news/high-grade-serous-carcinoma/.
6.Markman M, Rothman R, Hakes T, et al. Second-line platinum therapy in patients with ovarian cancer previously treated with cisplatin. J Clin Oncol. 1991;9(3):389-93. doi:10.1200/jco.1991.9.3.389 PubMed
7.Cannistra SA. Cancer of the ovary. N Engl J Med. 2004;351(24):2519-29. doi:10.1056/NEJMra041842 PubMed
8.Lokadasan R, James FV, Narayanan G, Prabhakaran PK. Targeted agents in epithelial ovarian cancer: review on emerging therapies and future developments. Ecancermedicalscience. 2016;10:626. doi:10.3332/ecancer.2016.626 PubMed
9.Rutherford T, Orr J, Jr., Grendys E, Jr., et al. A prospective study evaluating the clinical relevance of a chemoresponse assay for treatment of patients with persistent or recurrent ovarian cancer. Gynecol Oncol. 2013;131(2):362-7. doi:10.1016/j.ygyno.2013.08.009 PubMed
10.González-Martín A, Harter P, Leary A, et al. Newly diagnosed and relapsed epithelial ovarian cancer: ESMO Clinical Practice Guideline for diagnosis, treatment and follow-up. Supplementary Material. Ann Oncol. 2023;34(10)doi:10.1016/j.annonc.2023.07.011 PubMed
11.González-Martín A, Harter P, Leary A, et al. Newly diagnosed and relapsed epithelial ovarian cancer: ESMO Clinical Practice Guideline for diagnosis, treatment and follow-up. Ann Oncol. 2023;34(10):833-848. doi:10.1016/j.annonc.2023.07.011 PubMed
12.Davis A, Tinker AV, Friedlander M. “Platinum resistant” ovarian cancer: what is it, who to treat and how to measure benefit? Gynecol Oncol. 2014;133(3):624-31. doi:10.1016/j.ygyno.2014.02.038 PubMed
13.St Laurent J, Liu JF. Treatment Approaches for Platinum-Resistant Ovarian Cancer. J Clin Oncol. 2024;42(2):127-133. doi:10.1200/jco.23.01771 PubMed
14.Pujade-Lauraine E, Banerjee S, Pignata S. Management of Platinum-Resistant, Relapsed Epithelial Ovarian Cancer and New Drug Perspectives. J Clin Oncol. 2019;37(27):2437-2448. doi:10.1200/JCO.19.00194 PubMed
15.Colombo N, Sessa C, du Bois A, et al. ESMO-ESGO consensus conference recommendations on ovarian cancer: pathology and molecular biology, early and advanced stages, borderline tumours and recurrent disease†. Ann Oncol. 2019;30(5):672-705. doi:10.1093/annonc/mdz062 PubMed
16.Chase DM, Wenzel L. Health-related quality of life in ovarian cancer patients and its impact on clinical management. Expert Rev Pharmacoecon Outcomes Res. 2011;11(4):421-31. doi:10.1586/erp.11.41 PubMed
17.Richardson DL, Eskander RN, O'Malley DM. Advances in Ovarian Cancer Care and Unmet Treatment Needs for Patients With Platinum Resistance: A Narrative Review. JAMA Oncol. 2023;9(6):851-859. doi:10.1001/jamaoncol.2023.0197 PubMed
18.Yang L, Xie HJ, Li YY, Wang X, Liu XX, Mai J. Molecular mechanisms of platinum-based chemotherapy resistance in ovarian cancer (Review). Oncol Rep. 2022;47(4)doi:10.3892/or.2022.8293 PubMed
19.National Comprehensive Cancer Network. NCCN Clinical Practice Guidelines in Oncology (NCCN Guidelines®) for ovarian cancer including fallopian tube cancer and primary peritoneal cancer (v.1.2024)©. 2024.
20.du Bois A, Lück HJ, Meier W, et al. A randomized clinical trial of cisplatin/paclitaxel versus carboplatin/paclitaxel as first-line treatment of ovarian cancer. J Natl Cancer Inst. 2003;95(17):1320-9. doi:10.1093/jnci/djg036 PubMed
21.Neijt JP, Engelholm SA, Tuxen MK, et al. Exploratory phase III study of paclitaxel and cisplatin versus paclitaxel and carboplatin in advanced ovarian cancer. J Clin Oncol. 2000;18(17):3084-92. doi:10.1200/jco.2000.18.17.3084 PubMed
22.Ozols RF, Bundy BN, Greer BE, et al. Phase III trial of carboplatin and paclitaxel compared with cisplatin and paclitaxel in patients with optimally resected stage III ovarian cancer: a Gynecologic Oncology Group study. J Clin Oncol. 2003;21(17):3194-200. doi:10.1200/jco.2003.02.153 PubMed
23.Markman M, Kennedy A, Webster K, Kulp B, Peterson G, Belinson J. Neurotoxicity associated with a regimen of carboplatin (AUC 5-6) and paclitaxel (175 mg/m2 over 3 h) employed in the treatment of gynecologic malignancies. J Cancer Res Clin Oncol. 2001;127(1):55-8. doi:10.1007/s004320000157 PubMed
24.Vasey PA, Jayson GC, Gordon A, et al. Phase III randomized trial of docetaxel-carboplatin versus paclitaxel-carboplatin as first-line chemotherapy for ovarian carcinoma. J Natl Cancer Inst. 2004;96(22):1682-91. doi:10.1093/jnci/djh323 PubMed
25.Kuroi K, Shimozuma K. Neurotoxicity of taxanes: symptoms and quality of life assessment. Breast Cancer. 2004;11(1):92-9. doi:10.1007/bf02968010 PubMed
26.Gaillard S, Oaknin A, Ray-Coquard I, et al. Lurbinectedin versus pegylated liposomal doxorubicin or topotecan in patients with platinum-resistant ovarian cancer: A multicenter, randomized, controlled, open-label phase 3 study (CORAIL). Gynecol Oncol. 2021;163(2):237-245. doi:10.1016/j.ygyno.2021.08.032 PubMed
27.Hamanishi J, Takeshima N, Katsumata N, et al. Nivolumab Versus Gemcitabine or Pegylated Liposomal Doxorubicin for Patients With Platinum-Resistant Ovarian Cancer: Open-Label, Randomized Trial in Japan (NINJA). J Clin Oncol. 2021;39(33):3671-3681. doi:10.1200/jco.21.00334 PubMed
28.Pignata S, De Placido S, Biamonte R, et al. Residual neurotoxicity in ovarian cancer patients in clinical remission after first-line chemotherapy with carboplatin and paclitaxel: the Multicenter Italian Trial in Ovarian cancer (MITO-4) retrospective study. BMC Cancer. 2006;6:5. doi:10.1186/1471-2407-6-5 PubMed
29.Pujade-Lauraine E, Fujiwara K, Ledermann JA, et al. Avelumab alone or in combination with chemotherapy versus chemotherapy alone in platinum-resistant or platinum-refractory ovarian cancer (JAVELIN Ovarian 200): an open-label, three-arm, randomised, phase 3 study. Lancet Oncol. 2021;22(7):1034-1046. doi:10.1016/s1470-2045(21)00216-3 PubMed
30.Roche. Bevacizumab SmPC. 2023.
31.Tewari KS, Sill MW, Penson RT, et al. Bevacizumab for advanced cervical cancer: final overall survival and adverse event analysis of a randomised, controlled, open-label, phase 3 trial (Gynecologic Oncology Group 240). Lancet. 2017;390(10103):1654-1663. doi:10.1016/s0140-6736(17)31607-0 PubMed
32.Han ES, Monk BJ. What is the risk of bowel perforation associated with bevacizumab therapy in ovarian cancer? Gynecol Oncol. 2007;105(1):3-6. doi:10.1016/j.ygyno.2007.01.038 PubMed
33.Diaz JP, Tew WP, Zivanovic O, et al. Incidence and management of bevacizumab-associated gastrointestinal perforations in patients with recurrent ovarian carcinoma. Gynecol Oncol. 2010;116(3):335-9. doi:10.1016/j.ygyno.2009.11.017 PubMed
34.Hurwitz H, Fehrenbacher L, Novotny W, et al. Bevacizumab plus irinotecan, fluorouracil, and leucovorin for metastatic colorectal cancer. N Engl J Med. 2004;350(23):2335-42. doi:10.1056/NEJMoa032691 PubMed
35.Duska LR LJ, Calderón Boyle TA, et al. The BEV1L study: Do real-world outcomes associated with the addition of bevacizumab to first-line chemotherapy in patients with ovarian cancer reinforce clinical trial findings?. Cancer. 2025:e35821. doi:10.1002/cncr.35821 PubMed
36.Greimel E, Bottomley A, Cull A, et al. An international field study of the reliability and validity of a disease-specific questionnaire module (the QLQ-OV28) in assessing the quality of life of patients with ovarian cancer. Eur J Cancer. 2003;39(10):1402-8. doi:10.1016/s0959-8049(03)00307-1 PubMed
37.Cull A, Howat S, Greimel E, et al. Development of a European Organization for Research and Treatment of Cancer questionnaire module to assess the quality of life of ovarian cancer patients in clinical trials: a progress report. Eur J Cancer. 2001;37(1):47-53. doi:10.1016/s0959-8049(00)00369-5 PubMed
38.Balshem H, Helfand M, Schünemann HJ, et al. GRADE guidelines: 3. Rating the quality of evidence. J Clin Epidemiol. 2011;64(4):401-6. doi:10.1016/j.jclinepi.2010.07.015 PubMed
39.Santesso N, Glenton C, Dahm P, et al. GRADE guidelines 26: informative statements to communicate the findings of systematic reviews of interventions. J Clin Epidemiol. 2020;119:126-135. doi:10.1016/j.jclinepi.2019.10.014 PubMed
40.MIRASOL Clinical Study Report. Mirvetuximab Soravtansine. Study IMGN853-0416 MIRASOL: A Randomized, Open-Label, Phase 3 Study of Mirvetuximab Soravtansine Vs. Investigator’s Choice of Chemotherapy in Platinum-Resistant Advanced High-grade Epithelial Ovarian, Primary Peritoneal, or Fallopian Tube Cancers With High Folate Receptor-alpha Expression. 11 September 2023.
41.Sung H, Ferlay J, Siegel RL, et al. Global cancer statistics 2020: GLOBOCAN estimates of incidence and mortality worldwide for 36 cancers in 185 countries. CA Cancer J Clin. 2021;71(3):209-249. doi:10.3322/caac.21660 PubMed
42.Statistics Canada. Table 13-10-0111-01 Number and rates of new cases of primary cancer, by cancer type, age group and sex. https://doi.org/10.25318/1310011101-eng.
43.Prevalence. Cancer Today. World Health Organization (WHO) International Agency for Research on Cancer. Available at: https://gco.iarc.fr/today/en/dataviz/tables-prevalence?mode=cancer&types=2&cancers=25&group_populations=1&multiple_populations=1&populations=124.
44.Brenner DR, Gillis J, Demers AA, et al. Projected estimates of cancer in Canada in 2024. CMAJ. 2024;196(18):E615-E623. PubMed
45.Mackay HJ, Brady MF, Oza AM, et al. Prognostic relevance of uncommon ovarian histology in women with stage III/IV epithelial ovarian cancer. Int J Gynecol Cancer. 2010;20(6):945-52. doi:10.1111/IGC.0b013e3181dd0110 PubMed
46.Wentzensen N, Poole EM, Trabert B, et al. Ovarian Cancer Risk Factors by Histologic Subtype: An Analysis From the Ovarian Cancer Cohort Consortium. J Clin Oncol. 2016;34(24):2888-98. doi:10.1200/jco.2016.66.8178 PubMed
47.Kuchenbaecker KB, Hopper JL, Barnes DR, et al. Risks of Breast, Ovarian, and Contralateral Breast Cancer for BRCA1 and BRCA2 Mutation Carriers. JAMA. 2017;317(23):2402-2416. doi:10.1001/jama.2017.7112 PubMed
48.Kuroki L, Guntupalli SR. Treatment of epithelial ovarian cancer. BMJ. 2020;371:m3773. doi:10.1136/bmj.m3773 PubMed
49.National Comprehensive Cancer Network. NCCN Clinical Practice Guidelines in Oncology (NCCN Guidelines®) for Genetic/Familial High-Risk Assessment: Breast, Ovarian, and Pancreatic (v.2.2024)©. 2024.
50.Moore K, Angekergues A, Konecny GE, et al. Phase III MIRASOL (GOG 3045/ENGOT-ov55) study: mirvetuximab soravtansine vs investigator's choice of chemotherapy in platinum-resistant, advanced high-grade epithelial ovarian, primary peritoneal or fallopian tube cancers with high folate receptor-alpha (FR-alpha) expression. Presentation presented at: ASCO; June 2-6 2023; Chicago, IL.
51.Moore KN, Borghaei H, O'Malley DM, et al. Phase 1 dose-escalation study of mirvetuximab soravtansine (IMGN853), a folate receptor α-targeting antibody-drug conjugate, in patients with solid tumors. Cancer. 2017;123(16):3080-3087. doi:10.1002/cncr.30736 PubMed
52.Ab O, Whiteman KR, Bartle LM, et al. IMGN853, a Folate Receptor-α (FR-alpha)-Targeting Antibody-Drug Conjugate, Exhibits Potent Targeted Antitumor Activity against FR-alpha-Expressing Tumors. Mol Cancer Ther. 2015;14(7):1605-13. doi:10.1158/1535-7163.Mct-14-1095 PubMed
53.Kalli KR, Oberg AL, Keeney GL, et al. Folate receptor alpha as a tumor target in epithelial ovarian cancer. Gynecol Oncol. 2008;108(3):619-26. doi:10.1016/j.ygyno.2007.11.020 PubMed
54.Ledermann JA, Canevari S, Thigpen T. Targeting the folate receptor: diagnostic and therapeutic approaches to personalize cancer treatments. Ann Oncol. 2015;26(10):2034-43. doi:10.1093/annonc/mdv250 PubMed
55.Kelemen LE. The role of folate receptor alpha in cancer development, progression and treatment: Cause, consequence or innocent bystander? Int J Cancer. 2006;119(2):243-50. doi:10.1002/ijc.21712 PubMed
56.Parker N, Turk MJ, Westrick E, Lewis JD, Low PS, Leamon CP. Folate receptor expression in carcinomas and normal tissues determined by a quantitative radioligand binding assay. Anal Biochem. 2005;338(2):284-93. doi:10.1016/j.ab.2004.12.026 PubMed
57.Crane LM, Arts HJ, van Oosten M, et al. The effect of chemotherapy on expression of folate receptor-alpha in ovarian cancer. Cell Oncol (Dordr). 2012;35(1):9-18. doi:10.1007/s13402-011-0052-6 PubMed
58.Cancer Care Ontatio Drug Formulary https://www.cancercareontario.ca/en/drugformulary/regimens/monograph/45421 accessed April 20, 2025.
59.ELAHERE (mirvetuximab soravtansine). AbbVie Corporation. Draft Product Monograph. 2024.
60.Paclitaxel. Drug Monograph. Cancer Care Ontario. Available at: https://www.cancercareontario.ca/en/drugformulary/drugs/monograph/44151.
61.Pegylated liposomal doxorubicin. Drug Monograph. Cancer Care Ontario. Available at: https://www.cancercareontario.ca/en/drugformulary/drugs/monograph/44186.
62.Topotecan. Regimen Monograph. Cancer Care Ontario. Available at: https://www.cancercareontario.ca/en/drugformulary/regimens/monograph/45691.
63.Bevacizumab. Drug Monograph. Cancer Care Ontario. Available at: https://www.cancercareontario.ca/en/drugformulary/drugs/monograph/44071.
64.Study Report: Matching-adjusted indirect comparison of mirvetuximab soravtansine versus bevacizumab plus chemotherapy in the treatment of platinum resistant ovarian cancer.
65.MIRASOL Clinical Study Report. Mirvetuximab Soravtansine. Study IMGN853-0416 MIRASOL: A Randomized, Open-Label, Phase 3 Study of Mirvetuximab Soravtansine Vs. Investigator’s Choice of Chemotherapy in Platinum-Resistant Advanced High-grade Epithelial Ovarian, Primary Peritoneal, or Fallopian Tube Cancers With High Folate Receptor-alpha Expression. 11 September 2023.
66.Matulonis UA, Lorusso D, Oaknin A, et al. Efficacy and safety of mirvetuximab soravtansine in patients with platinum-resistant ovarian cancer with high folate receptor alpha expression: results from the SORAYA study. J Clin Oncol. 2023;41(13):2436-2445. PubMed
67.Committee for Medicinal Products for Human Use (CHMP). Guideline on the clinical evaluation of anticancer medicinal products. 05 January 2019: EMA/CHMP/205/95 Rev.6. Accessed 16 February 2023. Available from URL: https://www.ema.europa.eu/en/documents/scientific-guideline/draft-guideline-evaluationanticancer-medicinal-products-man-revision-6_en.pdf..
68.NF A, T Ö. Objective response rate assessment in oncology: Current situation and future expectations.. World J Clin Oncol. 2020;24(2)(11):53-57. doi: 10.5306/wjco.v11.i2.53.
69.Chen LM, Ibrahim JG, H. C. Flexible stopping boundaries when changing primary endpoints after unblinded interim analyses. J Biopharm Stat. 2014;24(4):817-33. doi: 10.1080/10543406.2014.901341. PubMed
70.MIRASOL Statistical Analysis Plan. Version 3.0. ImmunoGen, Inc. Protocol #: IMGN853-0416. MIRASOL: A Randomized, Open-label, Phase 3 Study of Mirvetuximab Soravtansine vs. Investigator’s Choice of Chemotherapy in Platinum-Resistant, Advanced High-Grade Epithelial Ovarian, Primary Peritoneal, or Fallopian Tube Cancers with High Folate Receptor-Alpha Expression. 14 February 2023..
71.Patient Reported Outcomes Report. IQVIA. Randomized, Open-label, Phase 3 Study of Mirvetuximab Soravtansine vs. Investigator’s Choice of Chemotherapy in Advanced High-Grade Epithelial Ovarian, Primary Peritoneal, or Fallopian Tube Cancers with High Folate Receptor-Alpha Expression. Protocol number IMGN853-0416. v1.0, 13 Nov 2023.
72.NICE. Decision Support Unit. Population-adjusted indirect comparisons (MAIC and STC). https://www.sheffield.ac.uk/nice-dsu/tsds/population-adjusted. Accessed August 2024.
73.Moore K, Oza A, Colombo N, et al. FORWARD I (GOG 3011): A phase III study of mirvetuximab soravtansine, a folate receptor alpha (FRa)-targeting antibody-drug conjugate (ADC), versus chemotherapy in patients (pts) with platinum-resistant ovarian cancer (PROC). Ann Oncol. 2019;30:v403. doi:10.1093/annonc/mdz250
Appendix 1: Summary of PFS Results in the MIRASOL Trial
Please note that this appendix has not been copy-edited.
Table 31: Summary of PFS Results From the MIRASOL Trial (DCO March 6, 2023)
Measure | MIRV (N = 227) | IC chemotherapy (N = 226) |
|---|---|---|
PFS by INV (ITT population; DCO March 6, 2023) | ||
Number of patients with events, n (%) | ███ ██████ | ███ ██████ |
Radiological progression | ███ ██████ | ███ ██████ |
Death | ███ ██████ | ███ ██████ |
Number of patients censored n (%) | ███ ██████ | ███ ██████ |
Estimated PFS time (months) | ||
Median (95% CI) | 5.62 (4.34 to 5.95) | 3.98 (2.86 to 4.47) |
Stratified analysis with IRT randomization values | ||
Cox PH model, HR (95% CI) | 0.65 (0.521 to 0.808) | |
2-sided P value from Log-rank test | < 0.0001 | |
Follow-up time (reverse KM method, months) | ||
Median (95% CI) | ███ ██████ | |
Estimated probabilities (95% CI) of PFS | ||
12 months | ███ ██████ | ███ ██████ |
RMST (95% CI) for PFS | ||
12 months | ███ ██████ | ███ ██████ |
15 months | ███ ██████ | ███ ██████ |
PFS by BICR (ITT population; DCO March 6, 2023) | ||
Number of patients with events, n (%) | ███ ██████ | ███ ██████ |
Radiological progression | ███ ██████ | ███ ██████ |
Death | ███ ██████ | ███ ██████ |
Number of patients censored, n (%) | ███ ██████ | ███ ██████ |
Estimated PFS time (months) | ||
Median (95% CI) | ███ ██████ | ███ ██████ |
Stratified analysis with IRT randomization values | ||
Cox PH model, Hazard ratio (95% CI) | ███ ██████ | |
2-sided P value from Log-rank test | ███ ██████ | |
Follow-up time (Reverse KM method, months) | ||
Median (95% CI) | ███ ██████ | |
Estimated probabilities (95% CI) of PFS | ||
12 months | ███ ██████ | ███ ██████ |
RMST (95% CI) for PFS | ||
12 months | ███ ██████ | ███ ██████ |
15 months | ███ ██████ | ███ ██████ |
BICR = Blinded Independent Central Review; CI = confidence interval; DCO = data cut-off; EHR = hazard ratio; HR = hazard ratio; IC = investigator’s choice; INV = investigator; ITT = intent-to-treat; KM = Kaplan-Meier; MIRV = mirvetuximab soravtansine; no = number; PFS = progression-free survival; RMST = restricted mean survival time
Source: MIRASOL trial Clinical Study Report.65
Appendix 2: Summary of Survival Results From the MIRASOL Trial
Please note that this appendix has not been copy-edited.
Table 32: Summary of Survival Results From the MIRASOL Trial (DCO Date of March 6, 2023)
Measure | MIRV (N = 227) | IC chemotherapy (N = 226) |
|---|---|---|
OS (ITT population; DCO March 6, 2023) | ||
Patients with death events, n (%) | ███ ██████ | ███ ██████ |
Patients censored, n (%) | ███ ██████ | ███ ██████ |
OS time (months) | ||
Median (95% CI) | 16.46 (14.46 to 24.57) | 12.75 (10.91 to 14.36) |
Stratified analysis with IRT randomization values | ||
Cox PH model, Hazard ratio (95% CI) | 0.67 (0.504 to 0.885) | |
2-sided P value from Log-rank test | 0.0046 | |
OS interim analysis P value boundary | ███ ██████ | |
Follow-up Time (reverse KM method, months) | ||
Median (95% CI) | ███ ██████ | |
Estimated probabilities (95% CI) of survival | ||
18 months | ███ ██████ | ███ ██████ |
21 months | ███ ██████ | ███ ██████ |
RMST (95% CI) for OS | ||
18 months | ███ ██████ | ███ ██████ |
Best overall response rate by INV (ITT population; DCO March 6, 2023) | ||
Best overall response, n (%) | ||
Complete response | 12 (5.3) | 0 |
Partial response | 84 (37.0) | 36 (15.9) |
Stable disease | 86 (37.9) | 91 (40.3) |
Progressive disease | 31 (13.7) | 62 (27.4) |
Not evaluable | 14 (6.2) | 37 (16.4) |
ORR, n (%)a | 96 (42.3) | 36 (15.9) |
95% CIb | (35.8 to 49.0) | (11.4 to 21.4) |
Difference in ORR (MIRV – IC chemotherapy) (95% CI)b | ███ ██████ | |
Odds Ratio (95% CI) | 3.81 (2.440 to 5.940) | |
2-sided P value | < 0.0001 | |
Best overall response rate by BICR (ITT population; DCO March 6, 2023) | ||
Best overall response, n (%) | ||
Complete response | 16 (7.0) | 4 (1.8) |
Partial response | 66 (29.1) | 29 (12.8) |
Stable disease | 97 (42.7) | 107 (47.3) |
Progressive disease | 32 (14.1) | 45 (19.9) |
Not evaluable | 16 (7.0) | 41 (18.1) |
ORR, n (%)a | 82 (36.1) | 33 (14.6) |
95% CIb | (29.9 to 42.7) | (10.3 to, 19.9) |
Difference in ORR (MIRV – IC chemotherapy) (95% CI)b | ███ ██████ | |
Odds Ratio (95% CI) | 3.22 (2.043 to 5.088) | |
2-sided P value | < 0.0001 | |
Duration of response per INV (ITT population; DCO March 6, 2023) | ||
Number of patients with events, n (%) | ███ ██████ | ███ ██████ |
Number of patients censored, n (%) | ███ ██████ | ███ ██████ |
Estimated duration of response time (months) | ||
Median (95% CI) | 6.77 (5.62 to 8.31) | 4.47 (4.17 to 5.82) |
Follow-up Time (reverse KM method, months) | ||
Median (95% CI) | ███ ██████ | |
Duration of response per BICR (ITT population; DCO March 6, 2023) | ||
Number of patients with events, n (%) | ███ ██████ | ███ ██████ |
Number of patients censored, n (%) | ███ ██████ | ███ ██████ |
Estimated duration of response time (months) | ||
Median (95% CI) | ███ ██████ | ███ ██████ |
Follow-up Time (Reverse KM method, months) | ||
Median (95% CI) | ███ ██████ | |
CA-125 Response Rate (CA-125-Evaluable Population; DCO March 6, 2023) | ||
Number of patients, n | 181 | 155 |
CA-125 response rate, n (%) | 105 (58.0) | 47 (30.3) |
95% CI | 50.5 to 65.3 | 23.2 to 38.2 |
Difference in response rate (95% CI) | 27.7 (17.5 to 37.9) | |
2-sided P value | < 0.0001 | |
PFS2 by INV (ITT population; DCO March 6, 2023) | ||
Number of patients with events, n (%) | ███ ██████ | ███ ██████ |
Radiological progression | ███ ██████ | ███ ██████ |
Death | ███ ██████ | ███ ██████ |
Number of patients censored, n (%) | ███ ██████ | ███ ██████ |
Estimated PFS2 time (months) | ||
Median (95% CI) | ███ ██████ | ███ ██████ |
Stratified analysis with IRT randomization values | ||
Cox PH model, HR (95% CI) | ███ ██████ | |
2-sided P value from Log-rank test | ███ ██████ | |
Follow-up time (reverse KM method, months) | ||
Median (95% CI) | ███ ██████ | |
BICR = Blinded Independent Central Review; CA-125 = cancer antigen 125; CI = confidence interval; DCO = data cut-off; HR = hazard ratio; IC = investigator’s choice; INV = investigator; ITT = intent-to-treat; KM = Kaplan-Meier; MIRV = mirvetuximab soravtansine; ORR = objective response rate; OS = overall survival; PFS2 = time to second disease progression; PH = proportional hazards; RMST = restricted mean survival time; Topo = topotecan.
aObjective response rate is defined as proportion of patients with complete or partial response per investigator assessment.
Stratification factors include number of prior lines of therapy (1 versus 2 versus 3) IC chemotherapy (Pac versus PLD versus Topo) chosen before randomization.
Source: Details included in the table are from the MIRASOL trial Clinical Study Report.65
Appendix 3: Additional Results From the Sponsor-Submitted ITC
Please note that this appendix has not been copy-edited.
Figure 6: Distribution of Weights for the MAIC of MIRV vs. Bevacizumab Plus Chemotherapy and MIRASOL Trial Chemotherapy vs. AURELIA Trial Chemotherapy

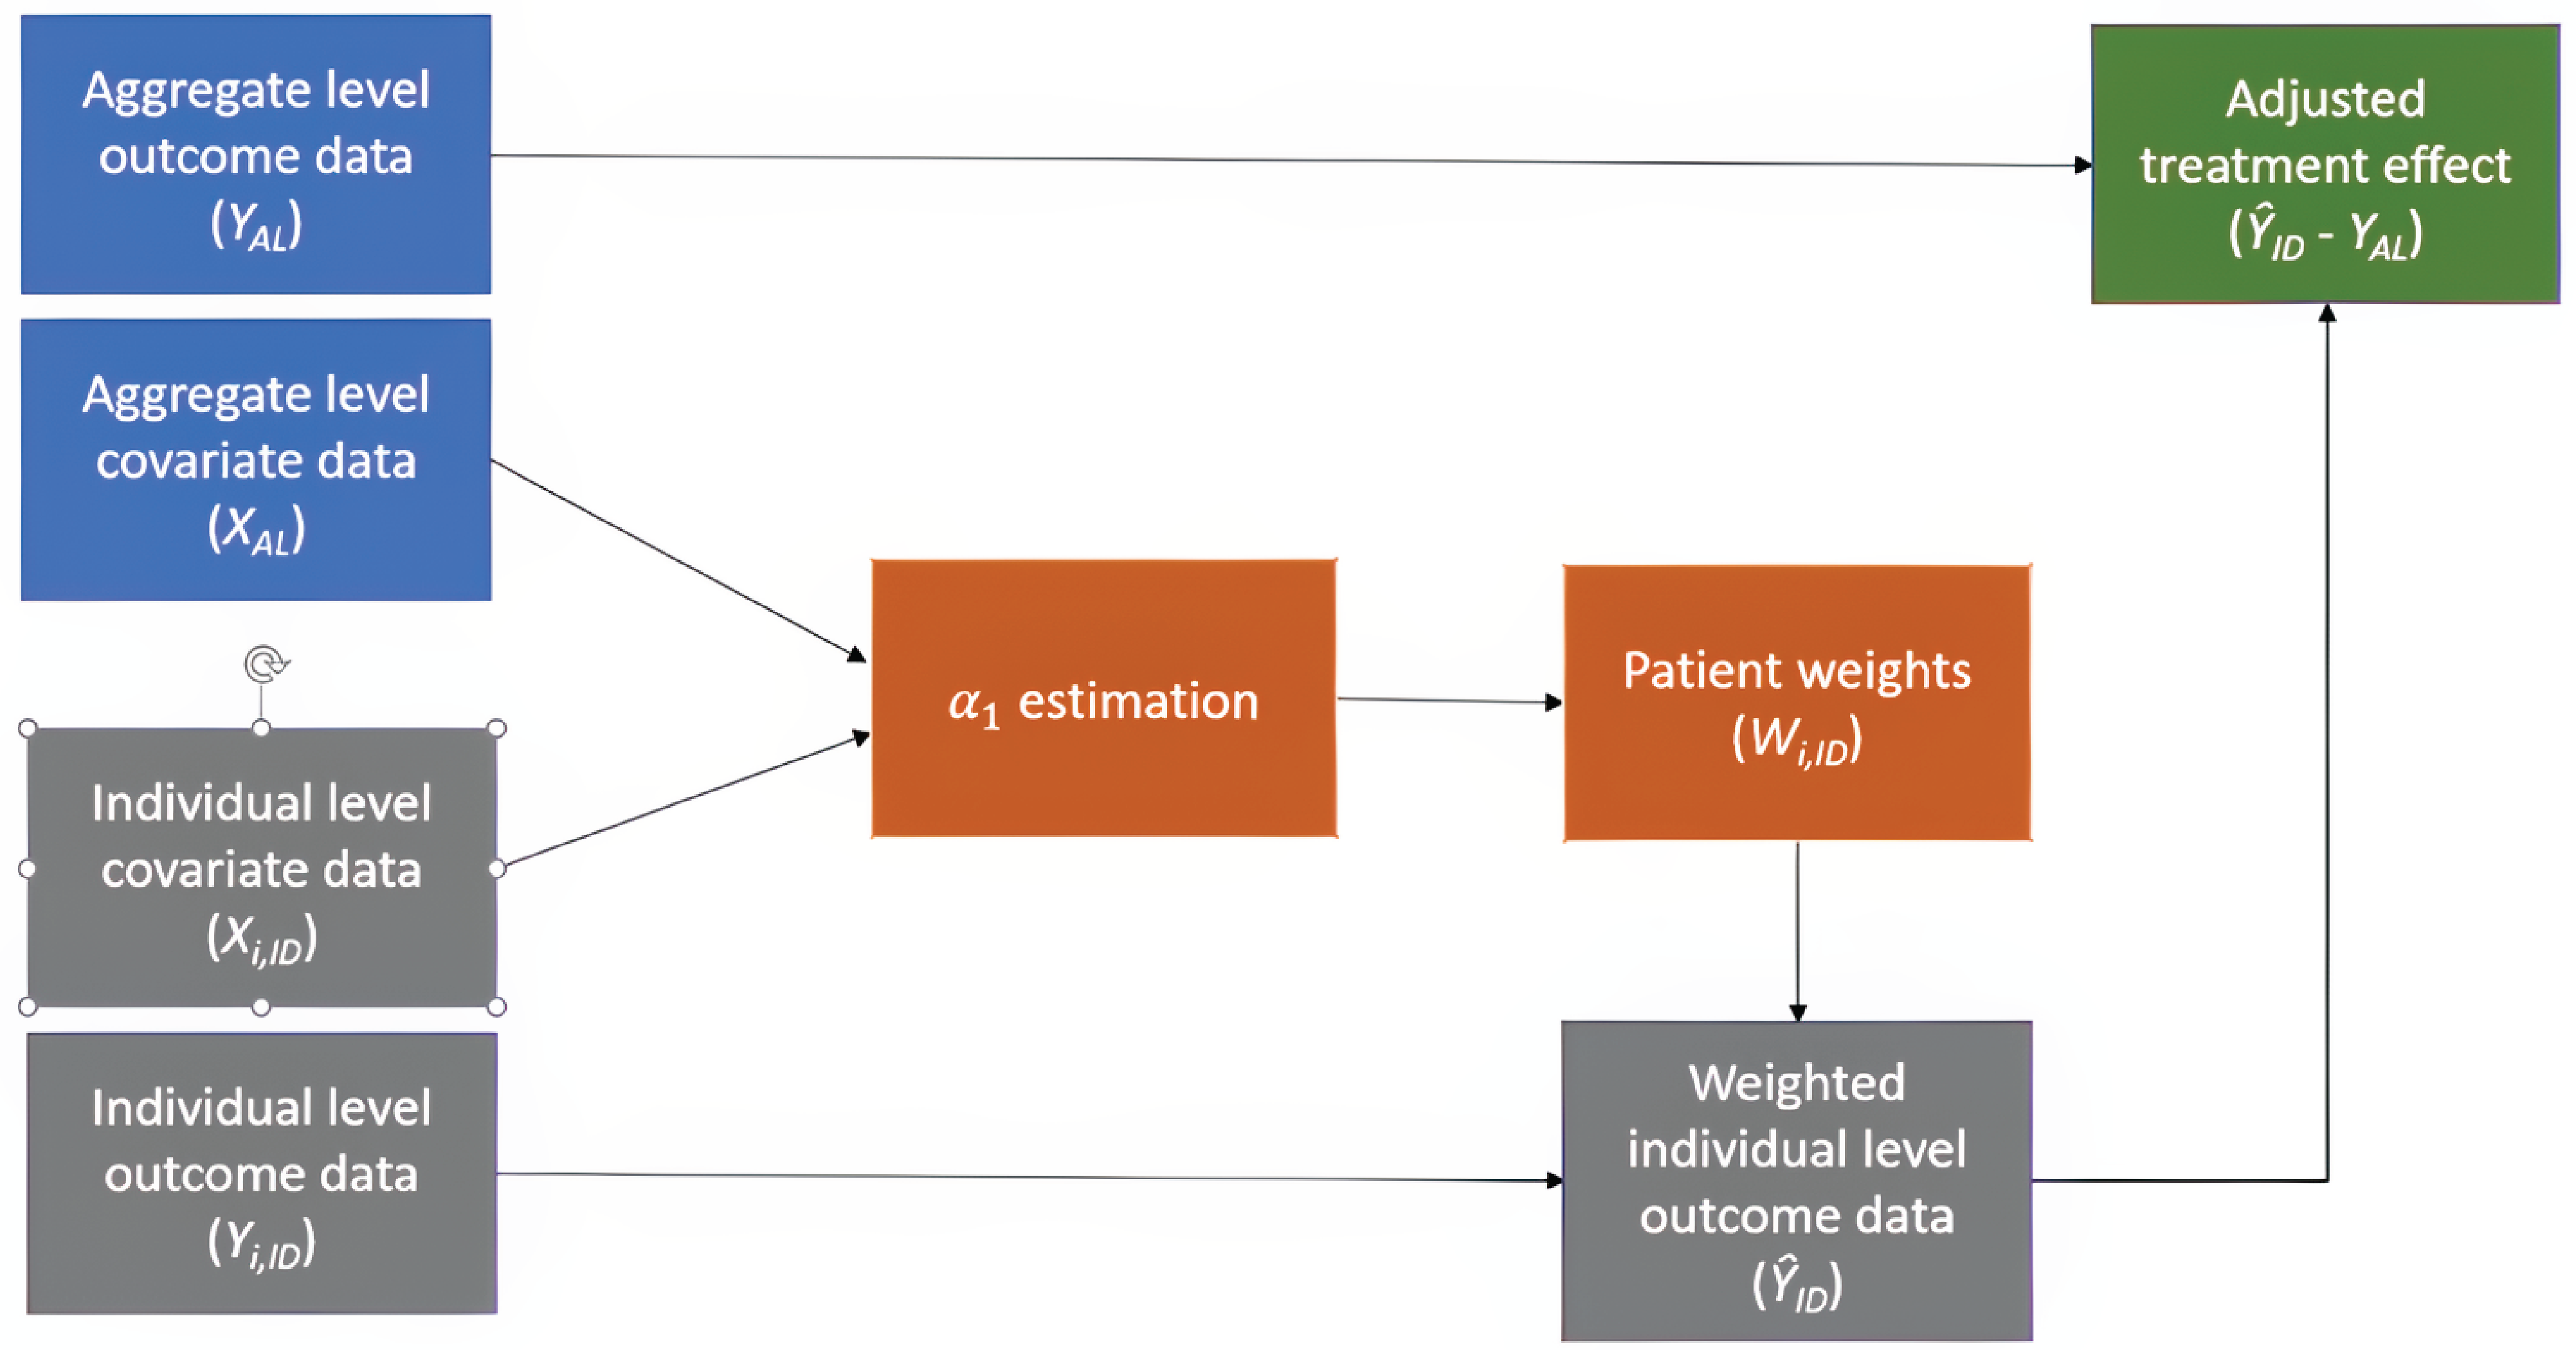
PFS (MIRASOL Trial DCO Date of September 26, 2024)
KM Curves of PFS Before Matching (MIRASOL Trial DCO Date of September 26, 2024)
███ █ ███ █ █████████ ██████ █████ ████ █ ████████████ ██████████████████ ███ █████████████ ███████████████████ ████████████ █████████ ███ ███ ████████████ ████ ███ ███████████████ ██ ███ ███████ ██████████████ ███████ █████████ ██.
OS (MIRASOL Trial DCO Date of September 26, 2024)
██ ██████ ██ ██ ██████ ████████ ████████ ███ ██ █████████ █████████ █ █████████ ██████ █████ ████ █ ████████████ ██████████████████ ██ ██████████████████████████████████ ██████████ ███ ████████████ █████████ ████ ████ ███ ████████ ████████ ██████ ███ █████ █████████
ORR (MIRASOL Trial DCO Date of September 26, 2024)
Table 33: ORRs Before and After Matching (MIRASOL Trial DCO Date of September 26, 2024)
Trial | Arm | Before matching | After matching | ||
|---|---|---|---|---|---|
Rate | 95% CI | Rate | 95% CI | ||
MIRASOL1 | MIRV | ███ | ███ | ███ | ███ |
Chemotherapy | ███ | ███ | ███ | ███ | |
AURELIA2 | Bevacizumab + chemotherapy | ███ | ███ | ███ | |
Chemotherapy | ███ | ███ | |||
CI = confidence interval; ITT = intention to treat; MIRV = mirvetuximab soravtansine; ORR = objective response rate; RECIST = Response Evaluation Criteria in Solid Tumours.
In the MIRASOL trial, the ORR was reported among patients in the response-evaluable population measured using RECIST v1.1 (216 patients in MIRV arm and 206 patients in the chemotherapy arm). No patients were excluded due to missing value in matched baseline characteristics.
In the AURELIA trial, the ORR was reported among patients who had responses measured using RECIST v1.0 (143 patients in the bevacizumab + chemotherapy arm and 144 patients in the chemotherapy arm).
Source: Sponsor-submitted ITC report.64
Harms
Grade 3 or Higher TEAEs (MIRASOL Trial DCO September 26, 2024)
Table 34: Grade 3 or Higher TEAE Rates Before and After Matching (MIRASOL Trial DCO Date of September 26, 2024)
Trial | Arm | Before matching | After matching | ||
|---|---|---|---|---|---|
Rate | 95% CI | Rate | 95% CI | ||
MIRASOL trial1 | MIRV | ███ | ███ | ███ | ███ |
Chemotherapy | ███ | ███ | ███ | ███ | |
AURELIA trial2 | Bevacizumab + chemotherapy | ███ | ███ | ███ | |
Chemotherapy | ███ | ███ | |||
CI = confidence interval; ITT = intention to treat; MIRV = mirvetuximab soravtansine; TEAE = treatment-emergent adverse event.
In the MIRASOL trial, safety outcomes were calculated among the safety population (218 patients in MIRV arm and 207 patients in the chemotherapy arm). No patients were excluded due to missing value in matching variables.
In the AURELIA trial, safety outcomes were reported among the safety population (179 patients in the bevacizumab + chemotherapy arm and 181 patients in the chemotherapy arm).
Source: Sponsor-submitted ITC report.64
Discontinuation Due to Any TEAE (MIRASOL Trial DCO Date of September 26, 2024)
Table 35: Discontinuation Rates Due to Any TEAE Before and After Matching (MIRASOL Trial DCO Date of September 26, 2024)
Trial | Arm | Before matching | After matching | ||
|---|---|---|---|---|---|
Rate | 95% CI | Rate | 95% CI | ||
MIRASOL trial1 | MIRV | ███ | ███ | ███ | ███ |
Chemotherapy | ███ | ███ | ███ | ███ | |
AURELIA trial2 | Bevacizumab + chemotherapy | ███ | ███ | ███ | |
Chemotherapy | ███ | ███ | |||
CI = confidence interval; ITT = intention to treat; MIRV = mirvetuximab soravtansine; TEAE = treatment-emergent adverse event.
In the MIRASOL trial, safety outcomes were calculated among the safety population (218 patients in MIRV arm and 207 patients in the chemotherapy arm). No patients were excluded due to missing value in matching variables.
In the AURELIA trial, safety outcomes were reported among the safety population (179 patients in the bevacizumab + chemotherapy arm and 181 patients in the chemotherapy arm).
Source: Sponsor-submitted ITC report.64
TPA Review
Abbreviations
EOC
epithelial ovarian cancer
FOLR1
folate receptor 1
FR
folate receptor
IHC
immunohistochemistry
MIRV
mirvetuximab soravtansine
PS2+
proportional score 2+
Objective
The objective of this Testing Procedure Assessment is to identify and describe important health system implications of folate receptor (FR) alpha testing in patients with platinum-resistant epithelial ovarian, fallopian tube, or primary peritoneal cancer who have received 1 to 3 prior systemic treatment regimens to determine their eligibility for mirvetuximab soravtansine (MIRV).
Methods
The contents within this section have been informed by materials submitted by the sponsor, a literature search, and clinical expert input as well as by the input from patient and clinician groups collected as part of the review.
Materials submitted by the sponsor related to FR alpha testing and a proposed implementation plan in Canada were validated when possible and summarized by the review team.
An information specialist conducted a literature search of key resources, including MEDLINE, the Cochrane Database of Systematic Reviews, the International HTA Database, the websites of health technology assessment agencies in Canada, and major international health technology assessment agencies. A focused internet search was also conducted. The search approach was customized to retrieve a limited set of results, balancing comprehensiveness with relevance. The search strategy comprised both controlled vocabulary, such as the National Library of Medicine’s MeSH (Medical Subject Headings), and keywords. The main search concepts were epithelial ovarian, fallopian tube, and primary peritoneal cancer as well as FR alpha testing. Search filters were applied to limit retrieval to health technology assessments, systematic reviews, meta-analyses, indirect treatment comparisons, or guidelines. The search was completed on April 1, 2025, and limited to English-language documents.
Clinical expert input was provided by 2 clinical specialists with expertise in the diagnosis and management of patients with epithelial ovarian, fallopian tube, or primary peritoneal cancer. Input from 1 clinician group (the Society of Gynecologic Oncology of Canada) and 1 patient group (Ovarian Cancer Canada) was used to inform current practices and insights related to access to and the utility of FR alpha testing.
Context
FR Alpha
FR alpha, also referred to as the folate receptor 1 (FOLR1) protein, is a novel biomarker characterized as a glycosylphosphatidylinositol-anchored cell surface protein that is encoded by the FOLR1 gene.1 FR alpha plays a pivotal role in regulating cellular processes, including cell division, proliferation, and tissue growth.1 FR alpha expression in nonmalignant tissues is limited, but it is present in up to 97% of patients with epithelial ovarian cancers (EOCs), which includes fallopian tube and primary peritoneal cancers.2,3 High FR alpha expression has been associated with poorly differentiated and aggressive tumour biology and resistance to conventional chemotherapy.1,2 FR alpha expression is preserved over time and remains unaffected by prior therapy, which highlights its utility as a clinically actionable biomarker and therapeutic target throughout EOC progression.1
FR Alpha Identification
MIRV is intended for patients with EOC whose tumours show high FR alpha expression. It is currently determined using the FDA-approved and FDA-validated VENTANA FOLR1 (FOLR1-2.1) RxDX Assay (herein referred to as VENTANA FOLR1 Assay), which is performed on a formalin-fixed, paraffin-embedded tissue sample. The VENTANA FOLR1 Assay is an immunohistochemistry (IHC)-based assay that uses a mouse monoclonal primary antibody that binds to the FOLR1 protein in the tissue.4 Tissue samples from the tumour, which are collected during an EOC diagnostic workup or surgery, are evaluated to determine the signal intensity and the percentage of stained tumour cells that correspond to an FR alpha expression signal.4 The signal is classified as negative (0), weak (1+), moderate (2+), or strong (3+), based on its intensity.4 Additionally, the relative percentages of tumour cells with each signal intensity are visually estimated by pathologists.4
FR alpha expression levels are calculated using proportional score 2+ (PS2+) methodology,1,5 in which both the intensity of staining and the percentage of tumour cells staining at each intensity are taken into consideration. The levels can be categorized as low (i.e., 25% to 50% of cells have at least 2+ staining intensity), medium (i.e., 50% to 74% of cells have at least 2+ staining intensity), and high (i.e., ≥ 75% of cells have at least 2+ staining intensity).6 Patients with EOC and high FR alpha expression levels would be eligible for MIRV.
Current Diagnostic Practice for Platinum-Resistant Epithelial Ovarian, Fallopian Tube, or Primary Peritoneal Cancer in Canada
The diagnosis of platinum-resistant epithelial ovarian, fallopian tube, or primary peritoneal cancer is done through initial clinical assessments that detect tumour progression. Assessments often include abdominal and pelvic ultrasound, CT scan, or MRI scan for diagnostic workup, depending on the presence or absence of symptoms.7 Additional workups may include nutritional status and gastrointestinal evaluations and an assessment of family history or genetic testing.7 Most ovarian cancers are diagnosed after pathologic analysis of a biopsy or surgical sample of the primary tumour, which may be obtained preoperatively, intraoperatively, or postoperatively.7 According to the sponsor, FR alpha testing is ideally performed reflexively using biopsy or surgical samples taken during the initial diagnostic workup. The clinical experts consulted for this review remarked that the optimal time for testing would be early in the clinical journey.
Testing Procedure Considerations
Health System–Related Considerations
Number of Individuals in Canada Expected to Require the Test
To determine the projected number of individuals in Canada expected to require FR alpha testing, the sponsors used an estimated proportion of patients with high-grade serous ovarian cancer who are expected to undergo cytoreductive surgery. This population is estimated to comprise 90% of all patients with high-grade serous ovarian cancer who are expected to undergo cytoreductive surgery (approximately 1,766 patients per year). Because FR alpha testing is not yet standard practice in Canada, the sponsor assumed a 50% test rate for 2026, with an increase in test rate over time to 75% in 2027 and 95% in 2028.8 Thus, the projected number of annual FR alpha tests performed in Canada (excluding Quebec and the territories) is expected to be approximately 885 in 2026, with an estimated increase to 1,330 tests in 2027 and 1,688 in 2028.8 The clinical experts consulted for this review agreed that the expected number of FR alpha tests required would increase annually if MIRV were to be funded. The clinical experts also noted that most patients with recurrent EOC will likely have cancer that becomes platinum resistant with time and would eventually require FR alpha testing to determine their eligibility for FR alpha–targeted therapy. They suggested that, ideally, all patients with EOC would have access to testing. Accordingly, the number of individuals in Canada expected to require FR alpha testing would be better represented by the total number of patients with EOC, which is estimated to be 2,137 to 2,146 patients per year over the next 3 years, based on the sponsor-submitted information.8 However, because MIRV is not intended to be a first-line therapy, it is unclear whether all patients with EOC would benefit from FR alpha testing because disease progression may not occur after first-line therapy.
Availability and Reimbursement Status of FR Alpha Testing in Jurisdictions Across Canada
According to the sponsor-submitted information and clinical expert input, currently, FR alpha testing is neither performed as part of routine care for patients with EOC nor publicly funded in Canada. At the time of writing this report, the VENTANA FOLR1 Assay is under review by Health Canada. According to the sponsor, approval was anticipated in fall 2025.
In an effort to facilitate the implementation of FR alpha testing, the sponsor and the manufacturer of the VENTANA FOLR1 Assay have identified key laboratory sites throughout Canada to enable equitable access to patients. The sponsor suggested that these laboratories, presented in Table 1, were strategically selected based on key geographic locations in Canada and expressed interest from the laboratories in implementing the VENTANA FOLR1 Assay test at their centres; however, it is yet to be determined if this approach would ensure equitable access to testing for patients living in other jurisdictions, regardless of the intended implementation strategy. The sponsor and manufacturer engagement includes support for training, validation, and navigating the reimbursement process (for the assay) in each jurisdiction. This effort is aimed to make the assay available to patients upon Health Canada approval. Despite the sponsor’s indication of active engagement to facilitate equitable and seamless testing implementation across jurisdictions, it is unclear if testing availability would guarantee funding for each jurisdiction or whether the funding would be the responsibility of the jurisdiction or the manufacturer. In addition, timing for adequate testing set-up and implementation may vary across laboratory sites; this variation may affect the sponsor’s claim that testing would be available and ready upon Health Canada approval.
The sponsor anticipates that the VENTANA FOLR1 Assay will be validated for use in approximately 10 to 15 laboratories across Canada within the first year after Health Canada approval of the test. However, according to the clinical experts consulted for this review, in practice, the implementation of FR alpha testing would likely be centralized to 1 or 2 laboratory sites.
Table 1: Key Laboratory Sites Across Jurisdictions
Jurisdiction | Laboratory sites |
|---|---|
Quebec | ████ ████ ██ █████████████ █████████ |
Ontario | ████ ████ ██ █████████████ █████████ |
Saskatchewan | ████ ████ ██ █████████████ █████████ |
Alberta | ████ ████ ██ █████████████ █████████ |
Source: Sponsor-submitted Companion Diagnostic Implementation Plan in Canada.9
Expected Timing and Frequency of FR Alpha Testing
The optimal timing for FR alpha testing is currently unknown. Evidence suggests that FR alpha testing at diagnosis may offer insight into the initial genomic landscape and maintenance therapy after front-line chemotherapy.1 As part of the implementation strategy, the sponsor recommends that FR alpha be tested once and reflexively, where testing is automatically initiated by the pathologist at the time of cancer diagnosis. The sponsor claims that this would eliminate the need for a separate requisition from oncologists, and that reflex testing may improve treatment access, accelerate time to treatment, and alleviate potential burden on laboratories. The clinical experts indicated that FR alpha is a stable biomarker; as such, repeat testing is not necessary at the time of platinum resistance development. Additionally, evidence suggests that when comparing the median time from when a tissue sample is tested to when the FR alpha status outcome is known, no statistically significant difference was observed between patients with FR alpha–positive or FR alpha–negative test result (P = 0.08). This suggests the timing of FR alpha testing does not affect test outcomes; however, outcomes from this study were not critically appraised by the review team.1 The MIRASOL trial included patients who were tested using both archival tissue and fresh biopsy samples.3
Expected Impacts of FR Alpha Testing for Human and Other Health Care Resources
According to the sponsor-submitted information, the implementation of FR alpha testing using the VENTANA FOLR1 Assay would be facilitated with assistance from AbbVie Corporation in collaboration with Roche (the manufacturer of the assay kit). The sponsor noted that the Roche VENTANA BenchMark ULTRA system for IHC testing is already installed and available in many laboratories across Canada. This would suggest that, if MIRV were to be funded in Canada, many laboratories would be ready to handle the potential implementation of the VENTANA FOLR1 Assay with minimal upfront investment and training. However, the clinical experts consulted for this review noted that the implementation of FR alpha testing would likely lead to an expected increase in human resource and laboratory costs due to the need to upscale the capacity associated with additional IHC-based testing and appropriate equipment in laboratories across Canada if MIRV was to be funded in Canada.
Patient-Related Considerations
Accessibility of FR Alpha Testing in Jurisdictions Across Canada
Because FR alpha testing is not currently performed as part of routine care for patients with EOC in Canada, the current accessibility of FR alpha testing is highly limited. According to the patient group input, patients can access FR alpha testing by travelling to the US; however, this is associated with major logistical and accessibility concerns. For example, 1 patient indicated that FR alpha testing was only available if the patient was being treated in a US facility; in addition, the out-of-pocket cost for FR alpha testing was approximately US$4,500, not including additional costs, such as travelling for the test. Patients indicated that accessing FR alpha testing in the US as a resident of Canada is complicated because patients and caregivers need adequate funding and time as well as the ability to travel and the competency to navigate the US health care system.
As mentioned earlier, AbbVie Corporation — in collaboration with Roche — is strategically engaging with the laboratory sites outlined in Table 1. The sponsor claims that this collaboration will enable prompt, equitable access to the VENTANA FOLR1 Assay upon Health Canada approval. The sponsor claims that this engagement and the subsequent expansion of laboratory accessibility to the VENTANA FOLR1 Assay testing will reduce wait times for and the burden on laboratories, health care professionals, and patients.
Expected Turnaround Times for FR Alpha Testing
According to the sponsor-submitted information, the estimated turnaround time for testing using the VENTANA FOLR1 Assay is approximately 48 hours to 72 hours, based on information from US commercial laboratories. The sponsor did not provide additional context to determine the parameters used to define turnaround time for the test, which may differ between clinical and laboratory settings. The clinical experts consulted for this review indicated that for most testing procedures, turnaround time in Canada is approximately 10 to 14 working days, depending on the test complexity, but may be closer to 7 days once a sample is made available. Accordingly, a turnaround time to 48 hours to 72 hours may not be a realistic estimate.
Burden Associated With FR Alpha Testing for Patients, Families, or Caregivers
According to the patient group input, patients who experienced FR alpha testing noted that waiting for testing results caused anxiety. Patient advocacy groups have also reported that receiving the results of FR alpha testing may be anxiety-inducing because the results may guide both treatment decision-making and eligibility status for FOLR1-targeted therapy.10 Only patients who test FR alpha high would be eligible for MIRV; thus, patients with lower FR alpha expression levels may not have the same access to treatment options.11 No additional burdens associated with FR alpha testing are anticipated for patients, families, or care partners.
Clinical Considerations
Diagnostic Accuracy and Validity of FR Alpha Testing
The VENTANA FOLR1 Assay is primarily used as a companion diagnostic test to aid in identifying patients who are FR alpha high and may benefit from FOLR1-targeted therapy. Evidence suggests that testing for FR alpha using primary tissue samples from the ovary, fallopian tube, adnexa, or pelvic mass is more likely to yield positive results than testing samples collected from lymph nodes or other anatomic locations.1 These findings can inform our understanding of testing site location in relation to FR alpha expression levels and subsequent treatment decisions.
The current standard of practice for determining FR alpha expression is the PS2+ scoring methodology, which provides FR alpha expression levels by assessing both the intensity of staining and the percentage of tumour cells that stain at each intensity. Previous clinical trials used a 10× scoring method, in which FR alpha positivity was determined by 50% or more of tumour cells that had any FR alpha membrane staining visible at 10× magnification or less. In that system, 50% to 74% represented medium expression, and 75% or more represented high expression.5 A reanalysis of previous clinical trials revealed that the 10× scoring method used for initial screening diluted the apparent treatment effect of MIRV by including patients with lower-than-expected FR alpha expression levels.1 These findings support the adoption and use of the more stringent PS2+ scoring method to assess FR alpha expression levels in subsequent clinical trials.1,3
According to the sponsor-submitted information and clinical expert input, no specific measurements for test sensitivity or specificity for the VENTANA FOLR1 Assay are available because the assay is the evidentiary standard FR alpha test; no relevant comparators have been approved.12
The VENTANA FOLR1 Assay product information provides analyses of intermediate precision (i.e., within-lab reproducibility), reader (i.e., pathologist) precision, and interlaboratory and interreader precision (i.e., external reproducibility) studies. Results of the precision analysis studies are presented in Table 2. The results of the precision analysis studies showed high overall percentage agreement for each measurement of intermediate precision, reader precision, and interlaboratory and interreader precision.4 In the intermediate precision analysis, 24 unique EOC tissue samples (12 positive samples and 12 negative samples) were used; all sample slides were blinded, randomized, and evaluated using the VENTANA FOLR1 Assay.4 In the reader precision analysis, 100 unique EOC tissue samples (50 positive and 50 negative) were assessed by 3 pathologists, with a minimum of 2 weeks between each read to determine within-reader and between-reader precision.4 The interlaboratory and interreader reproducibility analysis included 28 EOC tissue samples (14 positive samples and 14 negative samples) assessed across 3 BenchMark ULTRA instruments to determine between-reader, between-day, and between-site precision.4 Overall percentage agreement refers to the percentage of overall cases in which positive or negative FOLR1 status agreement was determined between read results.13 Additional information from the literature confirms the reproducibility of the VENTANA FOLR1 Assay results from results that show a greater than 98% positive percentage agreement, negative percentage agreement, and overall percentage agreement for repeatability and intermediate precision studies.13
Table 2: VENTANA FOLR1 Assay Precision Analysis Results
Precision analysis measurement | Overall percentage agreement, % (95% confidence interval) |
|---|---|
Intermediate precision analysis | |
Between FOLR1 antibodya | 100 (97.4 to 100) |
Between instrument | 99.3 (98.6 to 100) |
Between decision kit | 99.3 (98.6 to 100) |
Between day | 98.6 (97.2 to 100) |
Within run | 99.1 (98.1 to 100) |
Reader precision analysis | |
Within reader | 97.0 (95 to 98.7) |
Between reader | 93.3 (90 to 96.7) |
Interlaboratory and interreader precision analysis | |
Between site | 84.0 (78.7 to 88.7) |
Between reader | 85.35 (80.5 to 89.6) |
Between days | 92.6 (90.1 to 94.9) |
aThe intermediate precision analysis used 3 validated FOLR1 antibodies, which are needed to detect the FOLR1 protein.14
Source: VENTANA FOLR1 (FOLR1-2.1) RxDx Assay product manufacturer information.4
Risks of Harm Associated With FR Alpha Testing
The summary of safety and effectiveness data on the VENTANA FOLR1 Assay by the FDA notes that there are potential risks associated with potential incorrect test results or incorrect interpretation of the results.14 Failure of the device to perform adequately or failure to interpret test results correctly may lead to improper patient management decisions.14 FR alpha testing is done using tumour tissue samples, which involves a procedure that is often invasive and could have associated risk of harms, including infection and swelling, bruising, and bleeding at the biopsy site.15 However, although collecting tissue biopsy samples may be invasive, FR alpha testing can be performed on tissue samples that have already been collected during diagnosis. Any additional risk of harms associated with tissue sample collection is likely low.
Cost Considerations
Projected Cost and Expected Health System Impacts of FR Alpha Testing
According to the sponsor’s budget impact analysis, the estimated cost of FR alpha testing is $2,600 for 50 tests or $52 per test; however, this includes only the cost of the antibody. It does not include the costs associated with preparation, detection, or reagents.8 Additionally, this estimate assumes that the laboratory is already equipped with and performing IHC-based testing using the appropriate benchmark instrument. The sponsor reported that the total estimated cost would likely vary from $150 to $200 per test when accounting for reagents, laboratory technologists, and pathologist time. According to the clinical experts consulted for this review, the estimated cost of $150 to $200 is reasonable and in line with other similar testing procedures. The clinical experts noted that, considering the relatively low number of patients in Canada that would require this test annually (approximately 2,100), no significant impact is anticipated in terms of health care system cost.
References
1.Previs RA, Strickland KC, Wallen Z, et al. Analysis of real world FRα testing in ovarian, fallopian tube, and primary peritoneal cancers. Gynecol Oncol. 2025;192:102-110. doi:10.1016/j.ygyno.2024.11.010 PubMed
2.Crane LM, Arts HJ, van Oosten M, et al. The effect of chemotherapy on expression of folate receptor-alpha in ovarian cancer. Cell Oncol (Dordr). 2012;35(1):9-18. doi:10.1007/s13402-011-0052-6 PubMed
3.Moore KN, Angelergues A, Konecny GE, et al. Mirvetuximab soravtansine in FRα-positive, platinum-resistant ovarian cancer. N Engl J Med. 2023;389(23):2162-2174. doi:10.1056/NEJMoa2309169 PubMed
4.Roche Diagnostics. VENTANA FOLR1 (FOLR1-2.1) RxDx Assay. Accessed May 6, 2025. https://www.accessdata.fda.gov/cdrh_docs/pdf22/P220006C.pdf
5.Moore KN, Oza AM, Colombo N, et al. Phase III, randomized trial of mirvetuximab soravtansine versus chemotherapy in patients with platinum-resistant ovarian cancer: primary analysis of FORWARD I. Ann Oncol. 2021;32(6):757-765. doi:10.1016/j.annonc.2021.02.017 PubMed
6.Gonzalez-Ochoa E, Veneziani AC, Oza AM. Mirvetuximab soravtansine in platinum-resistant ovarian cancer. Clin Med Insights Oncol. 2023;17:11795549231187264. doi:10.1177/11795549231187264 PubMed
7.National Comprehensive Care Network. Ovarian cancer including fallopian tube cancer and primary peritoneal cancer. Accessed May 6, 2025. https://www.nccn.org/guidelines/guidelines-detail?category=1&id=1453
8.AbbVie Corporation. Budget Impact Analysis [internal sponsor's report]. In: Drug Reimbursement Review sponsor submission: Elahere (mirvetuximab soravtansine), concentrate for solution for infusion, intravenous infusion 100 mg in 20 mL (5 mg/mL). March 2025.
9.AbbVie Corporation. Companion diagnostic implementation plan in Canada [internal sponsor's report]. In: Drug Reimbursement Review sponsor submission: Elahere (mirvetuximab soravtansine), concentrate for solution for infusion, intravenous infusion 100 mg in 20 mL (5 mg/mL). March 2025.
10.PeerVoice. To target we need to test: Why and how to identify folate receptor alpha-positive ovarian cancer. Accessed May 14, 2025. https://c.peervoice.com/programs/140202273-2/downloads/PV_transcript_FKD_EN.pdf
11.Kim ET, Kim JH, Park EY, et al. The efficacy and safety of folate receptor α-targeted antibody-drug conjugate therapy in patients with high-grade epithelial ovarian, primary peritoneal, or fallopian tube cancers: a systematic review and meta-analysis. Cancer Med. 2024;13(21):e70392. doi:10.1002/cam4.70392 PubMed
12.Center for Devices and Radiological Health. Statistical guidance on reporting results from studies evaluating diagnostic tests. Accessed March 14, 2025. https://www.fda.gov/media/71147/download
13.James RL, Sisserson T, Cai Z, et al. Development of an FRα companion diagnostic immunohistochemical assay for mirvetuximab soravtansine. Arch Pathol Lab Med. 2024;148(11):1226-1233. doi:10.5858/arpa.2023-0149-OA PubMed
14.Food and Drug Administration. Summary of safety and effectiveness data: VENTANA FOLR1 (FOLR-2.1) RxDx Assay. Accessed May 6, 2025. https://www.accessdata.fda.gov/cdrh_docs/pdf22/P220006B.pdf
15.Krans B, Hobbs H, Rogers G. Biopsy. Accessed May 14, 2025. https://www.healthline.com/health/biopsy
Pharmacoeconomic Review
Abbreviations
BIA
budget impact analysis
CDA-AMC
Canada’s Drug Agency
CUA
cost-utility analysis
FR
folate receptor
ICER
incremental cost-effectiveness ratio
LY
life-year
MAIC
matching-adjusted indirect comparison
MIRV
mirvetuximab soravtansine
OS
overall survival
PARP
poly (ADP-ribose) polymerase 1
PFS
progression-free survival
QALY
quality-adjusted life-year
TTD
time to treatment discontinuation
Economic Review
The objective of this economic review is to review and critically appraise the pharmacoeconomic evidence submitted by the sponsor on the cost-effectiveness and budget impact of mirvetuximab soravtansine (MIRV) compared to pooled chemotherapy for the treatment of adult patients with folate receptor-alpha (FR) positive, platinum-resistant epithelial ovarian, fallopian tube, or primary peritoneal cancer who have received 1 to 3 prior systemic treatment regimens.
Item | Description |
|---|---|
Drug product | Mirvetuximab soravtansine (ELAHERE), 5 mg/mL solution for infusion |
Indication | As monotherapy for the treatment of adult patients with folate receptor-alpha positive, platinum-resistant epithelial ovarian, fallopian tube, or primary peritoneal cancer who have received 1 to 3 prior systemic treatment regimens |
Submitted price | $5,495.00 for 100 mg per 20 mL vial |
Health Canada approval status | NOC |
Health Canada review pathway | Priority review |
NOC date | August 29, 2025 |
Reimbursement request | Per indication |
Sponsor | AbbVie Corporation |
Submission history | Previously reviewed: No |
NOC = Notice of Compliance.
Key Messages
MIRV is available as 5 mg/mL single-use vials (100 mg in 20 mL).1 At the submitted price of $5,495.00 per vial, the 28-day cycle cost of MIRV is expected to be $29,307 per patient, based on the Health Canada–recommended dosage. FR alpha testing is required to determine FR alpha status and patient eligibility for MIRV.
Clinical efficacy in the economic analysis for MIRV versus pooled chemotherapy (i.e., paclitaxel and pegylated liposomal doxorubicin) was derived from the MIRASOL trial. Evidence submitted by the sponsor indicates that MIRV is likely to improve progression-free survival (PFS) with moderate certainty when compared with pooled chemotherapy among patients with FR alpha–positive, platinum-resistant epithelial ovarian, fallopian tube, or primary peritoneal cancer who have received 1 to 3 prior systemic treatment regimens. Moreover, the Clinical Review by Canada’s Drug Agency (CDA-AMC) concluded with low certainty that MIRV may result in little to no difference in overall survival (OS) compared to pooled chemotherapy at 6 months, and with moderate certainty that MIRV likely improves OS compared to pooled chemotherapy at 18 months.
MIRV was also compared to bevacizumab plus chemotherapy, informed by sponsor-submitted matching-adjusted indirect comparison (MAIC). The MAIC displayed inconsistent results (i.e., MIRV may be associated with a shorter PFS, but higher OS, than bevacizumab plus chemotherapy). Clinical heterogeneity in the patient populations of both trials, including in key variables that could not feasibly be adjusted (i.e., tumour histology, FR alpha expression status, prior poly [ADP-ribose] polymerase 1 [PARP] inhibitor use, and prior use of bevacizumab) were identified by CDA-AMC, resulting in the magnitude of comparative effectiveness of MIRV versus bevacizumab plus chemotherapy being too uncertain to determine.
The results of the CDA-AMC base case suggest:
MIRV is predicted to be associated with higher costs to the health care system than pooled chemotherapy (incremental cost = $195,857), primarily driven by increased drug acquisition costs associated with MIRV.
MIRV is predicted to be associated with a gain of 0.43 life-years (LYs) and may result in a gain of 0.30 quality-adjusted life-years (QALYs) compared to pooled chemotherapy.
The incremental cost-effectiveness ratio (ICER) of MIRV compared to pooled chemotherapy is $642,249 per QALY gained in the CDA-AMC base case. The estimated ICER was highly sensitive to assumptions about long-term OS.
Although the CDA-AMC base case estimated a gain in LYs with MIRV compared to pooled chemotherapy (incremental: 0.43 LYs), the magnitude of the survival benefit is highly uncertain, and the predicted incremental LYs may be overestimated. Therefore, additional price reductions may be required.
CDA-AMC estimates that the budget impact of reimbursing MIRV in the indicated population will be approximately $120 million over the first 3 years of reimbursement compared to the amount currently spent on pooled chemotherapy, with an estimated expenditure of $140 million on MIRV over this period. The actual budget impact of reimbursing MIRV will depend on the placement of the FR alpha test in current practice (i.e., patients could be tested at diagnosis, after first recurrence, or after the development of platinum resistance) and the potential costs associated with the additional resources needed to implement FR alpha testing. Because the budget impact of MIRV exceeds $40 million in year 3 of the analysis, the budget impact must be addressed to ensure the feasibility of adoption.
Summary of the Submitted Economic Evaluation
The sponsor submitted a cost-utility analysis (CUA) to estimate the cost-effectiveness of MIRV from the perspective of a public health care payer in Canada over a lifetime horizon (37 years).2 The modelled population comprised adult patients with FR alpha–positive, platinum-resistant epithelial ovarian, fallopian tube, or primary peritoneal cancer who have received 1 to 3 prior systemic treatment regimens. This population aligns with the Health Canada indication and was based on the population of patients in the MIRASOL trial. The sponsor’s base-case analysis included costs related to drug acquisition, administration, monitoring, FR alpha testing, and health care costs. FR alpha testing costs were assumed to be incurred by all patients receiving MIRV during the first cycle. In the sponsor’s base case, MIRV was associated with an incremental cost of $182,204 and 0.67 incremental QALYs relative to pooled chemotherapy. This resulted in an ICER of $271,993 per QALY gained. Additional information about the sponsor’s submission is summarized in Appendix 3.
CDA-AMC identified several key issues with the sponsor’s analysis (refer to Table 2; full details are provided in Appendix 4). Therefore, a revised base case was developed.
Table 2: Key Issues With the Sponsor’s Economic Submission
Issue | What evidence is there to inform this issue? | How was this issue addressed by CDA-AMC? | Did CDA-AMC explore uncertainty in a scenario analysis? |
|---|---|---|---|
The long-term extrapolations of PFS and OS for MIRV are likely overestimated. | The sponsor’s choice of PFS and OS extrapolation lacks long-term face validity, based on the clinical expert input obtained for this review. No evidence was presented to support the long-term benefit of MIRV suggested by the sponsor’s base case. | The CDA-AMC base case adopted an alternative extrapolation for PFS and OS as a base-case change. These extrapolations better reflect clinical expectations. | CDA-AMC explored an alternative extrapolation of OS in scenario analyses. |
The comparative effectiveness with bevacizumab plus chemotherapy is highly uncertain. | The sponsor used a MAIC as the source of comparative effectiveness between MIRV and bevacizumab plus chemotherapy for PFS and OS. Clinical heterogeneity in the patient populations of both trials resulted in the magnitude of comparative effectiveness of MIRV vs. bevacizumab plus chemotherapy to be too uncertain to determine. | CDA-AMC could not address this issue due to the heterogeneity and uncertainty of the comparative clinical information. The cost-effectiveness of MIRV in comparison to bevacizumab plus chemotherapy is too uncertain to determine. | Because the relative effectiveness of MIRV versus bevacizumab plus chemotherapy was too uncertain to determine, no scenario analysis was conducted. |
The costs associated with FR alpha testing are highly uncertain. | FR alpha testing is not currently available nor publicly funded in Canada. Based on clinical expert input, although minimal upfront investment and training appear to be required, the implementation of FR alpha testing would likely lead to an increased need for human resources and laboratory equipment. Additionally, there is a lack of evidence on the rate of false-negative and false-positive results with the test. | CDA-AMC was unable to address this issue due to uncertainty in the cost per positive FR alpha test and a lack of data on test accuracy. No change was made to the CDA-AMC base case; however, both the testing costs associated with MIRV and the ICER are likely underestimated. | Given the lack of data on the additional costs associated with FR alpha testing and test accuracy, no scenario analysis was conducted. |
Health-related utility values were modelled inappropriately. | The health-related utility values were stratified by time of death and response status. The approach used to calculate a patient’s health utility stratified by time of death lacks methodological validity due to inherent limitations of PSMs. | CDA-AMC was unable to validate the QALYs predicted for patients when stratified by time of death. No change was made to the CDA-AMC base case. | No scenario analysis was conducted because there is little impact associated with the base-case change. |
RDI was included. | Consistent with previous reviews, the CDA-AMC base case does not incorporate RDI. A reduction in RDI can be derived from a delayed dose, a missed dose, or a reduction in dose. | The CDA-AMC base case assumed RDI to be 100% for all treatments. | To explore uncertainty around this issue, CDA-AMC conducted a scenario analysis in which RDI is included. |
The model overestimated the costs of comparators. | Paclitaxel drug formulation forms were missing, and the drug acquisition costs of paclitaxel, pegylated liposomal doxorubicin, and bevacizumab were accounted for incorrectly. These issues likely overestimated the costs of comparators, potentially biasing the results toward pooled chemotherapy. | The CDA-AMC base case used the latest publicly available prices for all comparators and all relevant formulations available. | No scenario analysis was conducted because there is little uncertainty associated with the base-case change. |
CDA-AMC = Canada’s Drug Agency; FR = folate receptor; ICER = incremental cost-effectiveness ratio; MAIC = matching-adjusted indirect comparison; MIRV = mirvetuximab soravtansine; OS = overall survival; PFS = progression-free survival; QALY = quality-adjusted life-year; RDI = relative dose intensity.
Note: Full details of the issues identified by CDA-AMC are provided in Appendix 3.
CDA-AMC Assessment of Cost-Effectiveness
The CDA-AMC base case was derived by making changes to model parameter values and assumptions (refer to Table 8) in consultation with clinical experts. Given that the relative effectiveness of MIRV versus bevacizumab plus chemotherapy was too uncertain to determine, CDA-AMC did not include bevacizumab plus chemotherapy as a comparator in the analysis. Detailed information about the base case is provided in Appendix 4.
Impact on Health Care Costs
MIRV is predicted to be associated with additional health care costs compared to pooled chemotherapy (incremental cost = $195,857). This increase in health care spending results from drug acquisition costs associated with MIRV (refer to Figure 1).
Figure 1: Impact of MIRV vs. Pooled Chemotherapy on Health Care Costs
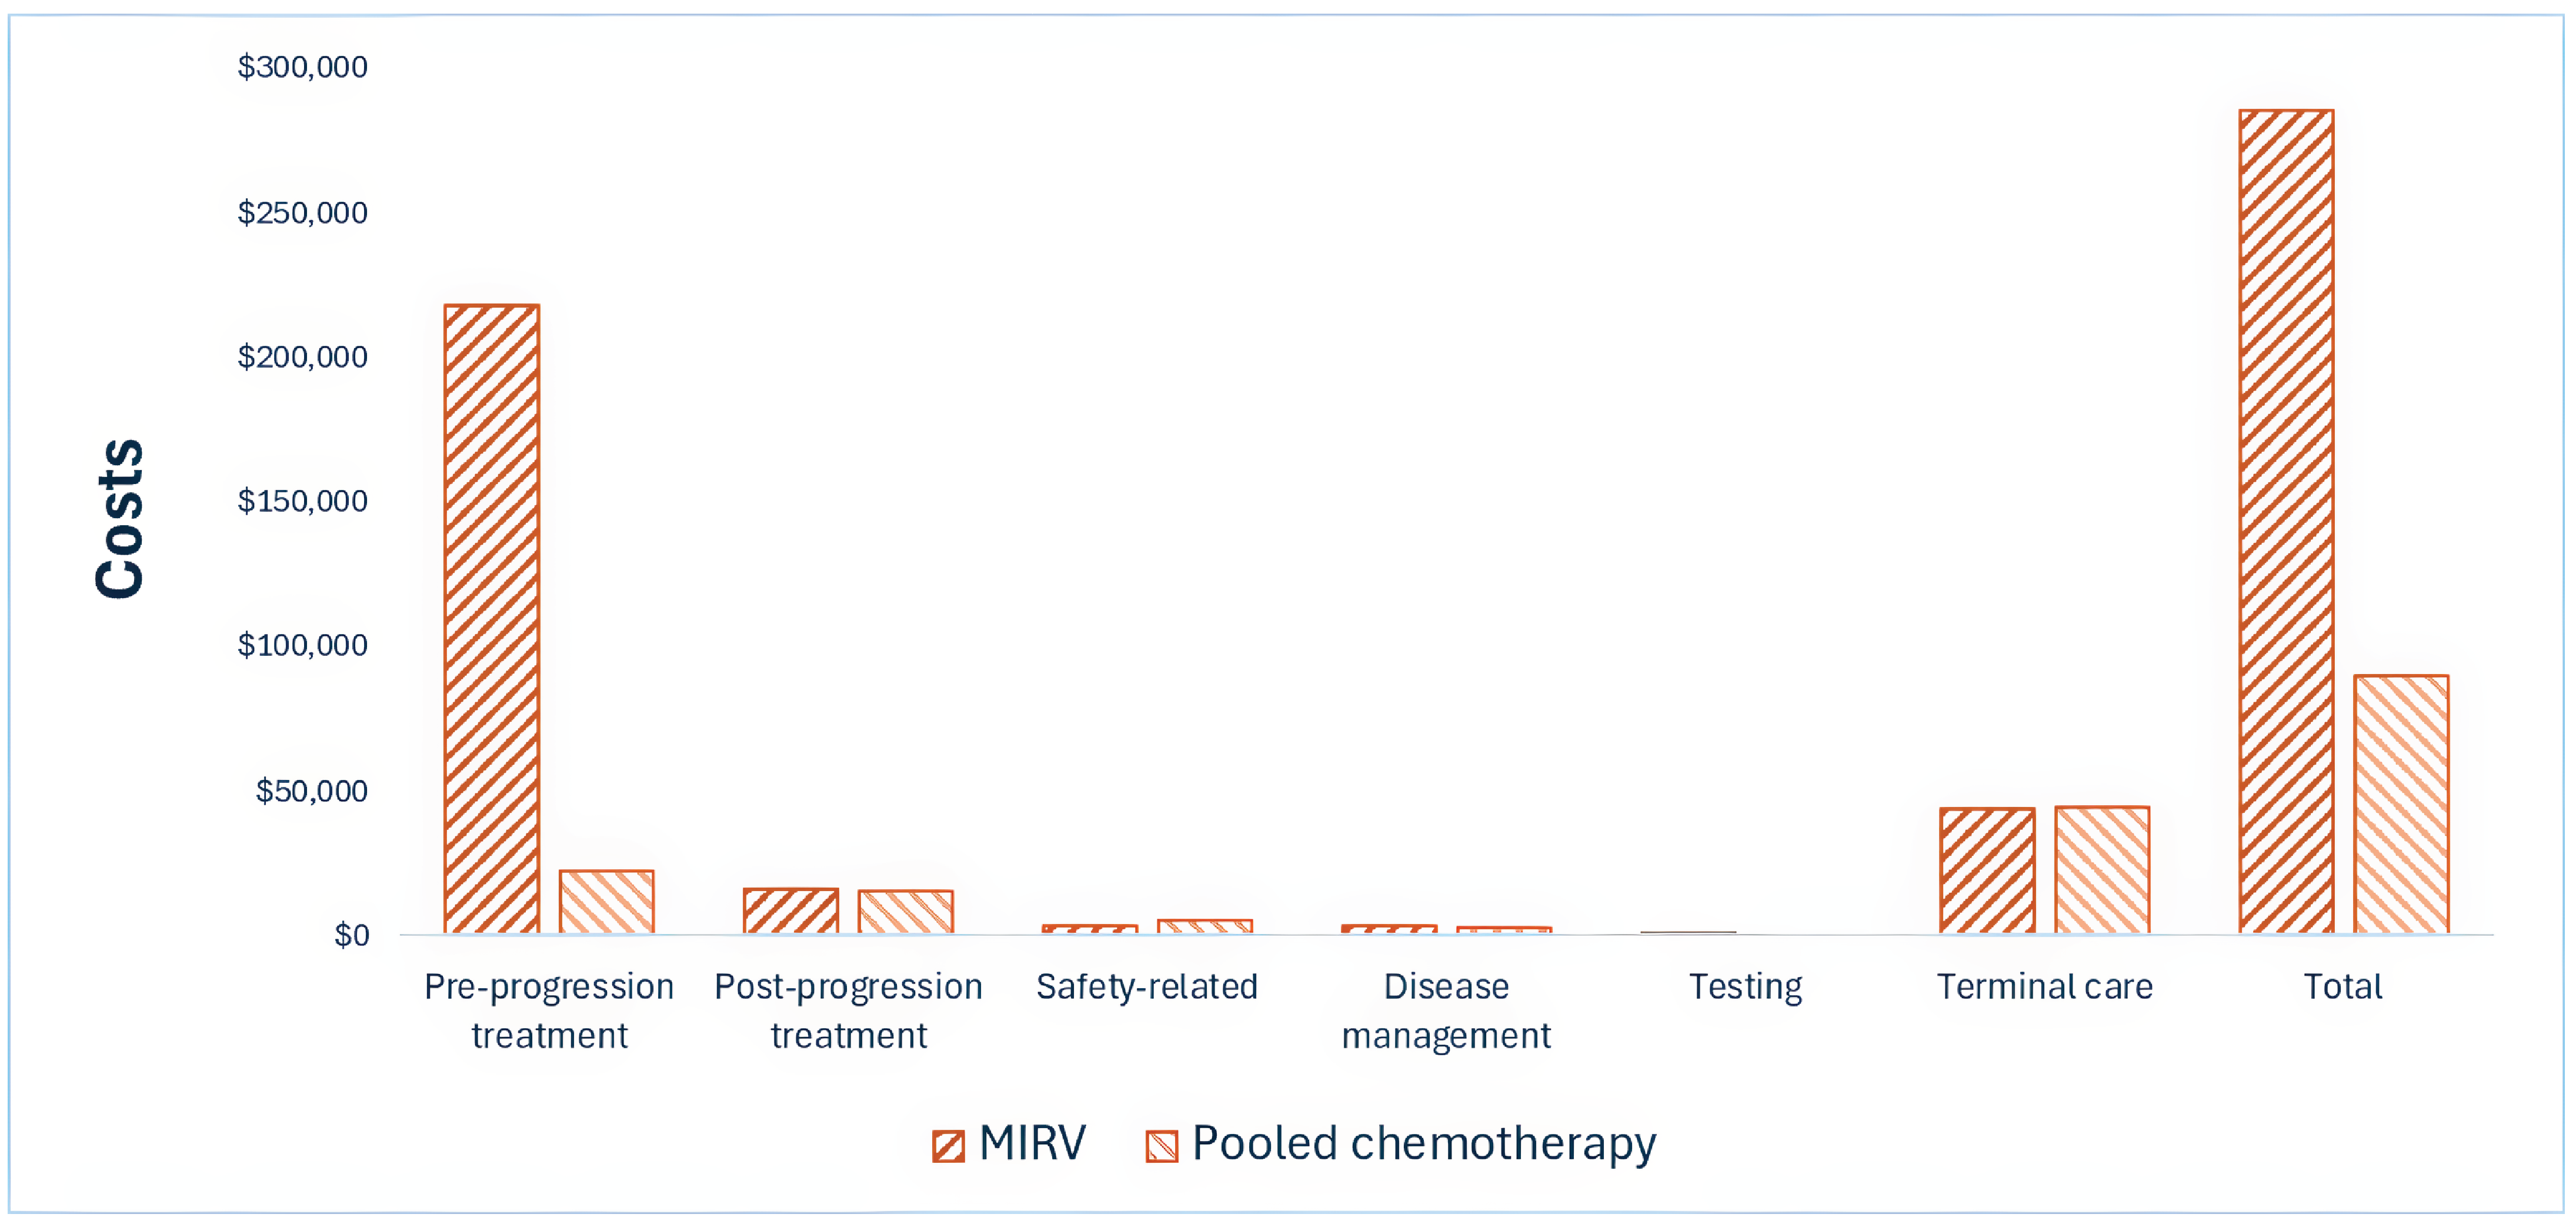
MIRV = mirvetuximab soravtansine; vs. = versus.
Note: Safety-related costs included adverse events, hospitalizations, transfusions, and granulocyte colony-stimulating factor.
Impact on Health
Relative to pooled chemotherapy, MIRV is predicted to result in 0.30 additional QALYs per patient over the lifetime horizon (refer to Figure 2). In addition, MIRV is predicted to result in 0.42 additional LYs, accrued in both the preprogression (0.22 incremental LYs) and postprogression (0.21 incremental LYs) health states relative to pooled chemotherapy.
Figure 2: Impact of MIRV vs. Pooled Chemotherapy on Patient Health
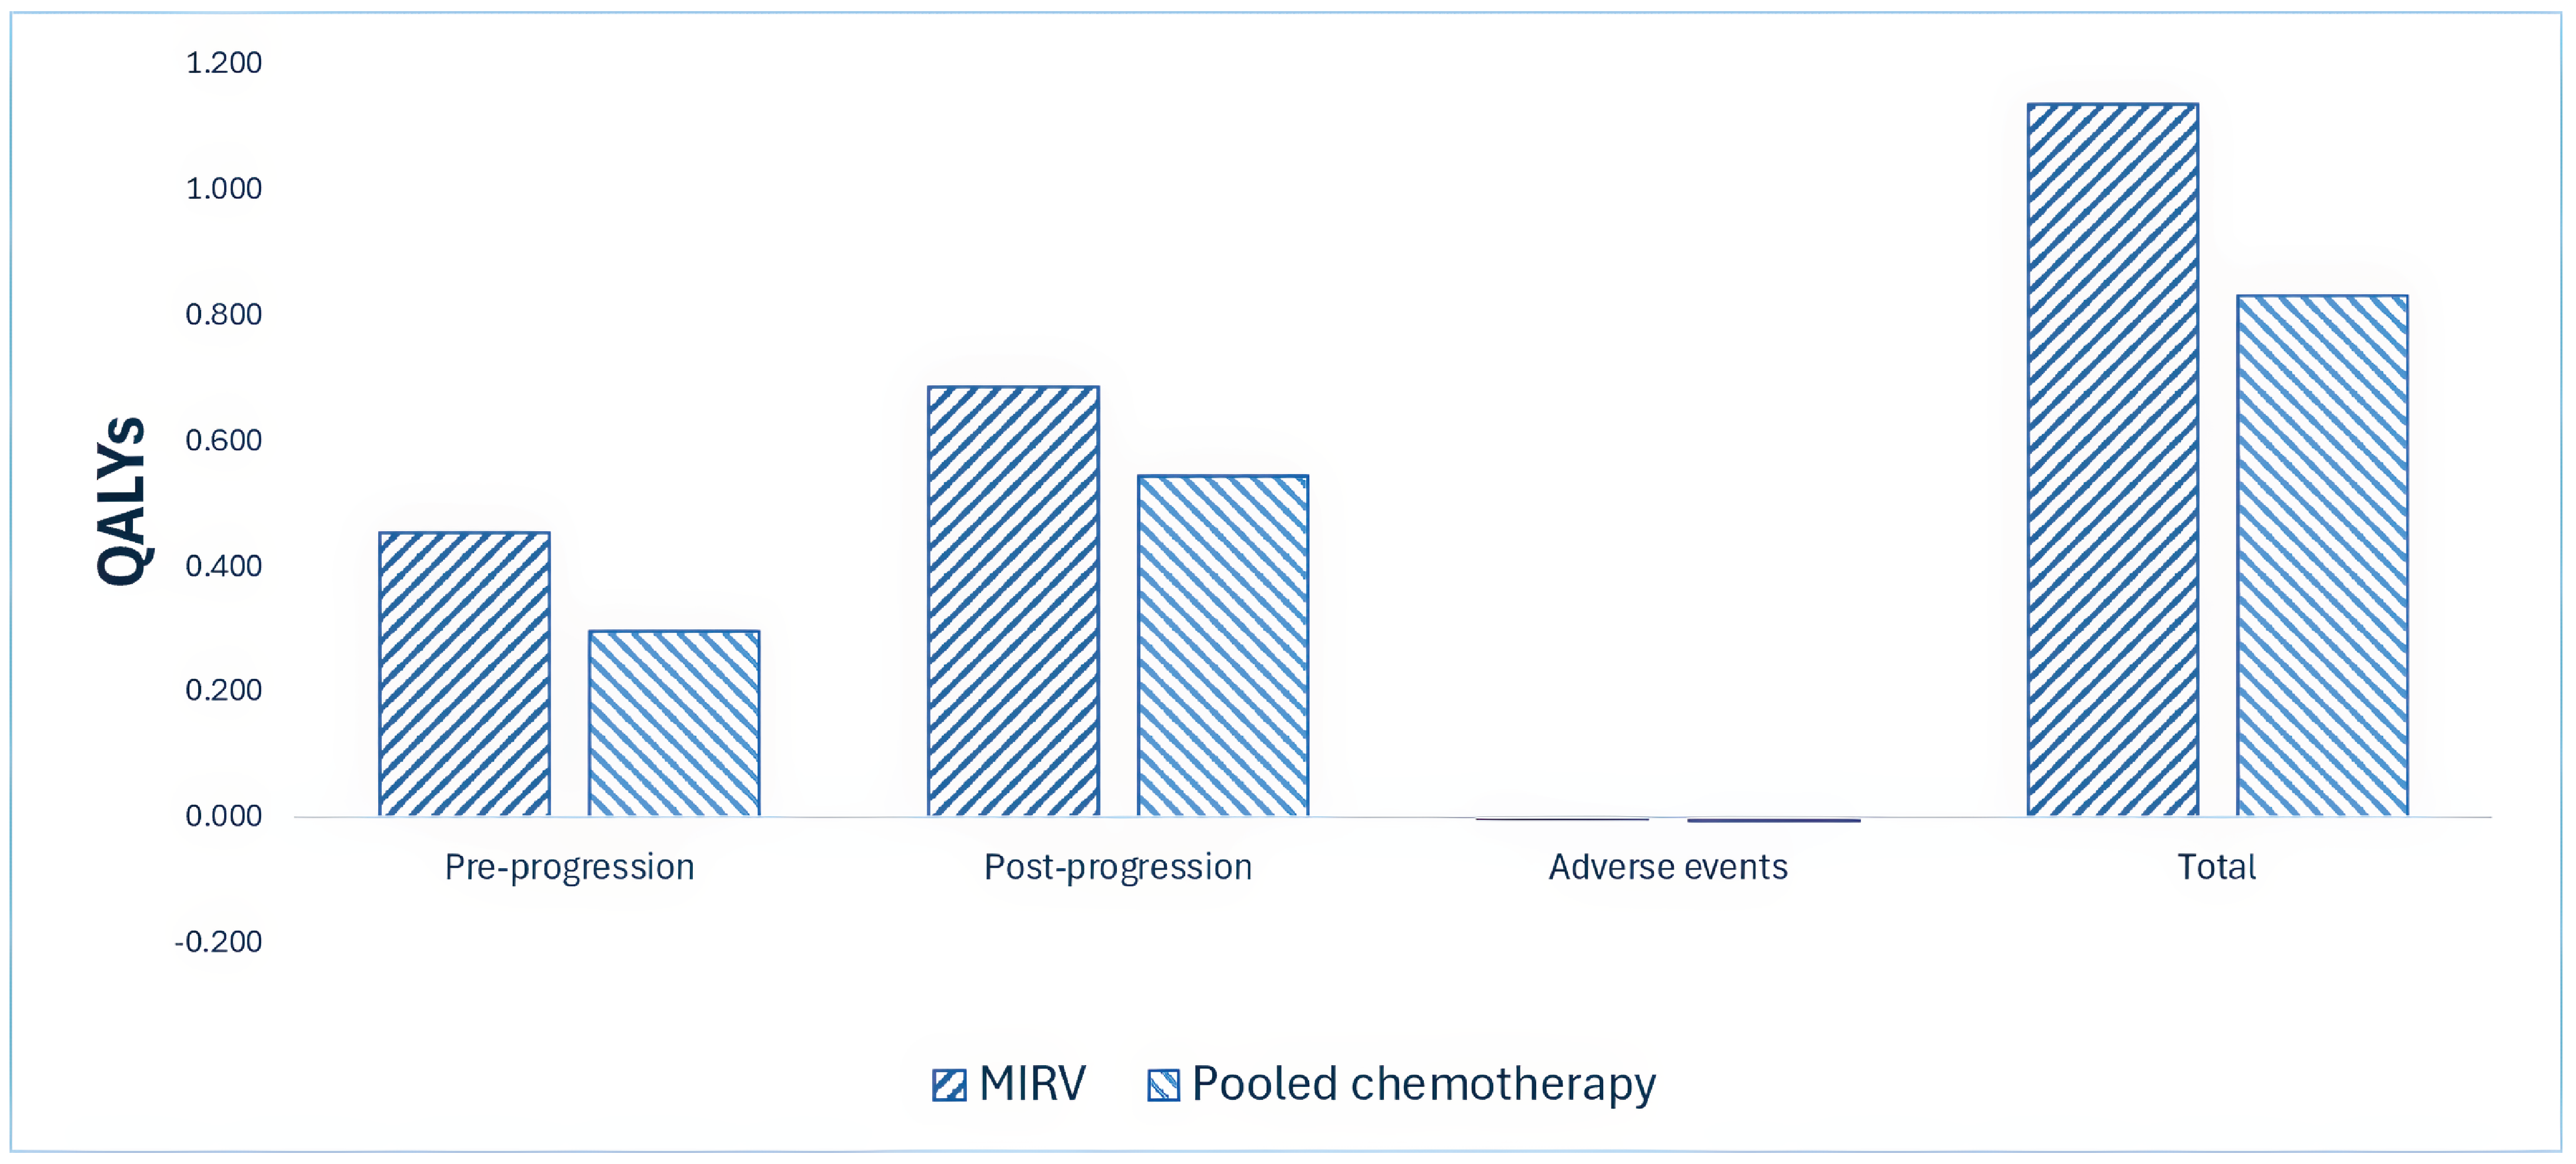
MIRV = mirvetuximab soravtansine; QALY = quality-adjusted life-year; vs. = versus.
Overall Results
The results of the CDA-AMC base case suggest an ICER of $481,709 per QALY gained for MIRV compared to pooled chemotherapy (refer to Table 3). Additional details on the CDA-AMC base case are available in Appendix 4.
Table 3: Summary of the CDA-AMC Economic Evaluation Results
Drug | Total costs ($) | Total LYs | Total QALYs | ICER vs. pooled chemotherapy ($/QALY) |
|---|---|---|---|---|
Pooled chemotherapy | 89,556 | 1.28 | 0.83 | Reference |
MIRV | 285,413 | 1.71 | 1.14 | 642,249 |
CDA-AMC = Canada’s Drug Agency; ICER = incremental cost-effectiveness ratio; LY = life-year; MIRV = mirvetuximab soravtansine; QALY = quality-adjusted life-year; vs. = versus.
Note: Publicly available list prices were used for all comparators.
Uncertainty and Sensitivity
Uncertainty was explored in the scenario analyses outlined in Table 2. For uncertainty associated with the comparison between MIRV and pooled chemotherapy, OS had the largest impact on cost-effectiveness (refer to Table 12, Appendix 4). Because the relative effectiveness of MIRV versus bevacizumab plus chemotherapy was too uncertain to determine, CDA-AMC could not address the uncertainty associated with using bevacizumab plus chemotherapy as a comparator in the analysis. Therefore, the cost-effectiveness of MIRV in comparison to bevacizumab plus chemotherapy is too uncertain to determine.
Summary of the Budget Impact
The sponsor submitted a budget impact assessment (BIA) to estimate the 3-year (2026 to 2028) budget impact of reimbursing MIRV for use in the treatment of adult patients with FR alpha–positive, platinum-resistant epithelial ovarian, fallopian tube, or primary peritoneal cancer who have received 1 to 3 prior systemic treatment regimens.3 The sponsor assumed that the payer would be CDA-AMC–participating public drug plans and derived the size of the eligible population using an epidemiologic approach. The price of MIRV was aligned with the price included in the sponsor’s economic evaluation, while the prices of comparators were based on the publicly available list prices. FR alpha testing was assumed to be performed in patients with high-grade serous ovarian cancer after cytoreductive surgery, with an uptake of 50% in year 1 and up to 95% in year 3. Additional information pertaining to the sponsor’s submission is provided in Appendix 5. CDA-AMC identified a number of issues with the sponsor’s estimated budget impact and made changes to model parameters and assumptions in consultation with clinical experts to derive the CDA-AMC base case (Appendix 5). CDA-AMC estimated that 837 patients would be eligible for treatment with MIRV over a 3-year period (year 1 = 190 patients; year 2 = 285 patients; year 3 = 362 patients), of whom 682 would be expected to receive MIRV (year 1 = 114 patients; year 2 = 243 patients; year 3 = 326 patients). The estimated incremental budget impact of reimbursing MIRV is expected to be approximately $120 million over the first 3 years, with an expected expenditure of $140 million on MIRV and an additional $585,000 on FR alpha testing, if testing is performed in patients with high-grade serous ovarian cancer undergoing cytoreductive surgery.
Conclusion
Based on the CDA-AMC base case, MIRV would be considered cost-effective at the submitted price if the public health care system was willing to pay at least $642,249 for each additional QALY gained. If the public health care system is not willing to pay that amount, a price reduction should be considered (refer to Figure 3; full details in Table 11). The estimated cost-effectiveness of MIRV compared to pooled chemotherapy is uncertain due to lack of evidence on the long-term OS benefit associated with treatment with MIRV and the limitations associated with accounting for FR alpha testing.
In a sponsor’s scenario analysis, MIRV was compared to bevacizumab plus chemotherapy, with comparative efficacy parameters informed by a MAIC. Although the MAIC submitted by the sponsor suggested an OS benefit of MIRV over bevacizumab plus chemotherapy, the CDA-AMC Clinical Review concluded that the trial populations included in the MAIC were heterogeneous, and that this resulted in the magnitude of comparative effectiveness of MIRV versus bevacizumab plus chemotherapy being too uncertain to determine. The evidence of clinical benefit is too uncertain to estimate the price reduction needed to ensure cost-effectiveness for MIRV compared to bevacizumab plus chemotherapy.
The budget impact of reimbursing MIRV to the public drug plans in the first 3 years is estimated to be approximately $88 million. The 3-year expenditure on MIRV (i.e., not accounting for current expenditure on comparators) is estimated to be $108 million. The estimated budget impact is uncertain due to the unknown placement of FR alpha testing in current practice (i.e., patients could be tested at diagnosis, after first recurrence, or after developing platinum resistance) and due to the potential costs associated with the additional resources needed to implement FR alpha testing. Because the budget impact of MIRV exceeds $40 million in year 3 of the analysis, the budget impact must be addressed to ensure the feasibility of adoption.
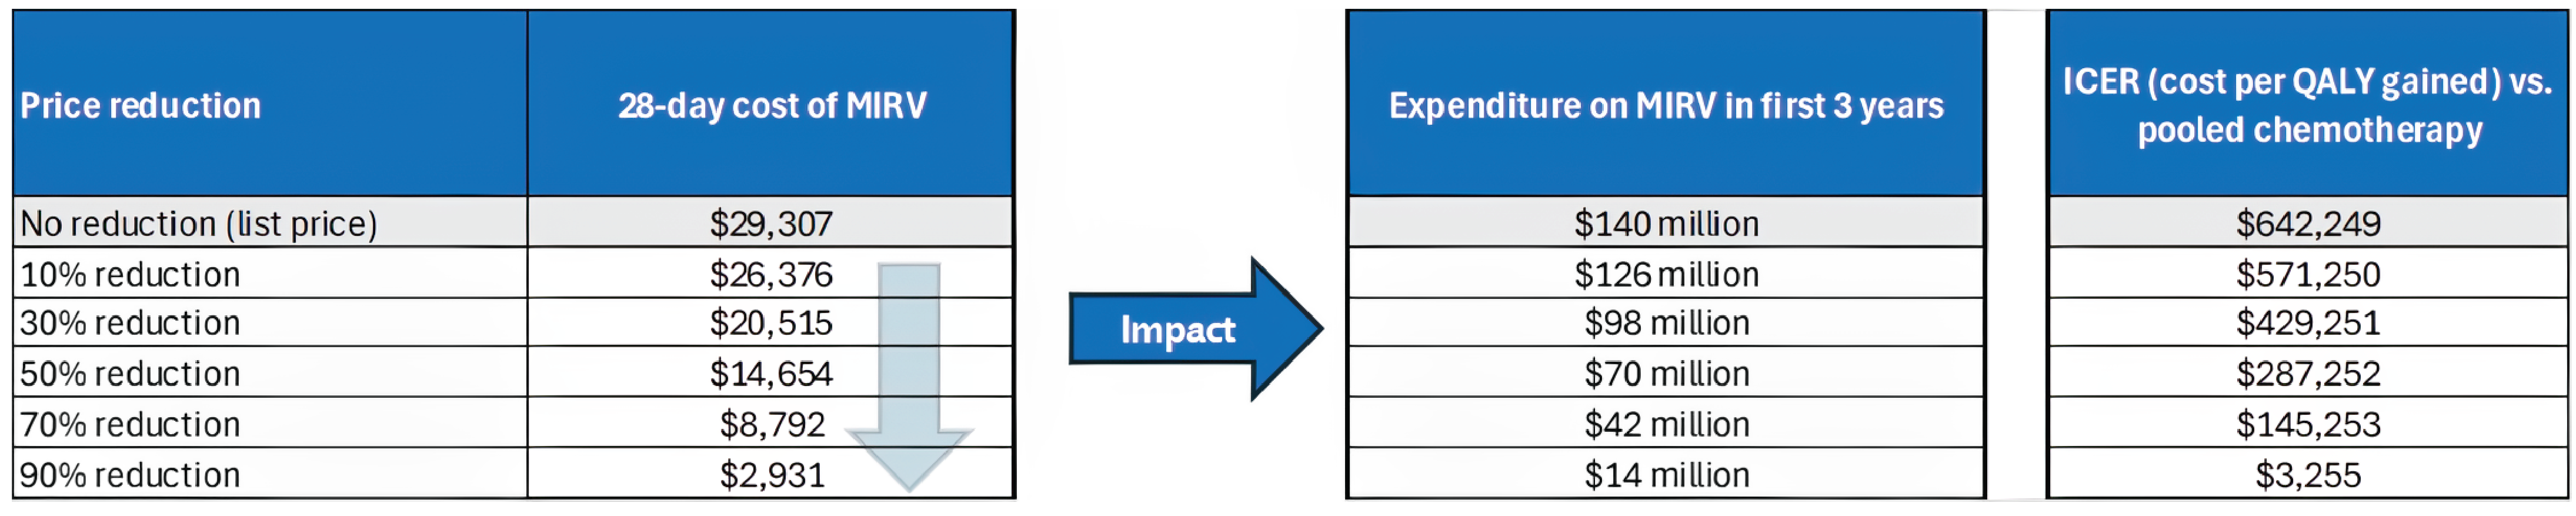
References
1.ELAHERE (mirvetuximab soravtansine). AbbVie Corporation. Draft Product Monograph. 2024.
2.AbbVie Corporation. Pharmacoeconomic evaluation [internal sponsor's report]. In: Drug Reimbursement Review sponsor submission: Elahere (mirvetuximab soravtansine), concentrate for solution for infusion, intravenous infusion 100 mg in 20 mL (5 mg/mL). March 3, 2025.
3.AbbVie Corporation. Budget Impact Analysis [internal sponsor's report]. In: Drug Reimbursement Review sponsor submission: Elahere (mirvetuximab soravtansine), concentrate for solution for infusion, intravenous infusion 100 mg in 20 mL (5 mg/mL). March 3, 2025.
4.Iqvia. DeltaPA. 2023. Accessed April 14, 2025. https://www.iqvia.com/
5.Sullivan PW, Ghushchyan V. Preference-Based EQ-5D index scores for chronic conditions in the United States. Med Decis Making. 2006;26(4):410-20. doi: 10.1177/0272989x06290495 PubMed
6.Lloyd A, Nafees B, Narewska J, Dewilde S, Watkins J. Health state utilities for metastatic breast cancer. Br J Cancer. 2006;95(6):683-90. doi: 10.1038/sj.bjc.6603326 PubMed
7.Shah BD, Smith NJ, Feng C, et al. Cost-Effectiveness of KTE-X19 for Adults with Relapsed/Refractory B-Cell Acute Lymphoblastic Leukemia in the United States. Adv Ther. 2022;39(8):3678-3695. doi: 10.1007/s12325-022-02201-6 PubMed
8.Ontario Ministry of H. Schedule of Benefits: Physician Services Under the Health Insurance Act (Februrary 20, 2024). 2024. https://www.ontario.ca/files/2024-04/moh-schedule-benefit-2024-02-20.pdf
9.Iqvia. DeltaPA. 2024. Accessed March 3, 2025.
10.Government of Y. Yukon Drug Formulary. 2025. Accessed March 3, 2025. https://ihs.gov.yk.ca/drugs/f?p=161:9000::::::
11.Canadian Institute for Health I. Patient cost estimator. 2024. Accessed March 3, 2025. https://www.cihi.ca/en/patient-cost-estimator
12.Walker H, Anderson M, Farahati F, et al. Resource use and costs of end-of-Life/palliative care: Ontario adult cancer patients dying during 2002 and 2003. J Palliat Care. 2011;27(2):79-88. PubMed
13.What Is Ovarian Cancer? American Cancer Society. 2018. Available at: https://www.cancer.org/cancer/types/ovarian-cancer/about/what-is-ovarian-cancer.html.
14.Arora T, Mullangi S, Vadakekut ES, et al. Epithelial Ovarian Cancer. [Updated 2024 May 6]. In: StatPearls [Internet]. Treasure Island (FL): StatPearls Publishing; 2025 Jan-. Available from: https://www.ncbi.nlm.nih.gov/books/NBK567760.
15.Drug Intelligence. ONCO-CAPPS Patient Treatment Dynamics Ovarian Cancer. 2023 Q3 Update and Trends. April 2024.
16.St Laurent J, Liu JF. Treatment Approaches for Platinum-Resistant Ovarian Cancer. J Clin Oncol. 2024;42(2):127-133. doi: 10.1200/jco.23.01771 PubMed
17.Elyashiv O, Aleohin N, Migdan Z, et al. The Poor Prognosis of Acquired Secondary Platinum Resistance in Ovarian Cancer Patients. Cancers 2024;16(3):641. PubMed
Appendix 1: Cost Comparison Table
Please note that this appendix has not been copy-edited.
The comparators presented in the following table have been deemed to be appropriate based on feedback from clinical experts and CDA-AMC–participating public drug plans. Comparators may be recommended (appropriate) practice or actual practice. Existing Product Listing Agreements are not reflected in the table and as such, the table may not represent the actual costs to public drug plans
Table 4: Cost Comparison for Treatments for Epithelial Ovarian, Fallopian Tube, or Primary Peritoneal Cancer
Treatment | Strength and/or concentration | Form | Price ($) | Recommended dosage | Daily cost ($) | 28-day cycle cost ($) |
|---|---|---|---|---|---|---|
Mirvetuximab soravtansine (ELAHERE) | 100 mg per 20mL | Single dose vial | 5,495.0000 per viala | 6 mg/kg AIBW once every 3 weeksb | 1,046.67 | 29,307 |
Chemotherapy | ||||||
Paclitaxel (Generic) | 30 mg per 5 mL vial 96 mg per 16 mL vial 150mg per 25 mL vial 300mg per 50 mL vial | Vial | 60.0000 per mL 74.8000 per mL 74.8000 per mL 74.8000 per mL | 80 mg/m2 on Day 1, 8, 15, and 22 of each 28-day cycle | 256.69 | 7,187 |
Pegylated liposomal doxorubicin (Generic) | 20 mg per 10 mL vial | Vial | 69.2560 per mL | 40 mg/m2 on Day 1 of each 28-day cycle | 98.94 | 2,770 |
Topotecan (Generic) | 4 mg vial 20 mL vial | Vial | 141.7500 per mg 138.7500 per mL | 4 mg/m2 on Day 1, 8, 15, and 22 of each 28-day cycle or 1.25 mg/m2 on Day 1 to 5 of each 21‑day cycle | 81.00 135.00 | 2,268 3,780 |
Gemcitabine (Generic) | 1,000mg 2,000mg | Vial | 270.0000 1,080.0000 | 800 to 1,000 mg/m2 on Day 1, 8, and 15 of each 21-day cycle | 77.14 | 2,160 |
Bevacizumab plus chemotherapy | ||||||
Bevacizumab (Generic) | 4 mL vial 16 mL vial | Vial | 86.7500 per mL 86.7500 per mL | 10 mg/kg on Day 1 and 15 every 28-day cycle | 173.50 | 4,858 |
Paclitaxel (Generic) | 5 mL vial 16 mL vial 25 mL vial 50 mL vial | Vial | 60.0000 per mL 74.8000 per mL 74.8000 per mL 74.8000 per mL | 80 mg/m2 on Day 1, 8, 15, and 22 of each 28-day cycle | 256.69 | 7,187 |
Pegylated liposomal doxorubicin (Generic) | 10 mL vial | Vial | 69.2560 | 40 mg/m2 on Day 1 of each 28-day cycle | 98.94 | 2,770 |
Bevacizumab plus paclitaxel | — | — | — | — | 430.19 | 12,045 |
Bevacizumab plus pegylated liposomal doxorubicin | — | — | — | — | 272.44 | 7,628 |
AIBW = adjusted ideal body weight.
Note: All prices are from the Delta PA IQVIA (accessed March 2025), unless otherwise indicated, and do not include dispensing fees.4 Costs were calculated considering AIBW = 59.05, body weight = 68.8 kg; and body surface area = 1.73 m2 based on data from MIRASOL trial.
aPrice submitted by the sponsor.2
bAIBW was calculated as (IBW [kg]) + 0.4*(actual weight [kg]) – IBW; female IBW [kg] = 0.9*height[cm] – 92.
Appendix 2: Input Relevant to the Economic Review
Please note that this appendix has not been copy-edited.
This section is a summary of the input received from the patient groups, clinician groups, and drug plans that participated in the CDA-AMC review process.
Patient input was received from Ovarian Cancer Canada. The information was obtained from patients and caregivers via telephone interviews (n = 10) and an online survey (n = 41). Most respondents were from Canada (numbers not provided). The input indicated that current treatment options included surgery, chemotherapy, PARP inhibitors, bevacizumab and radiation. Their experience with these treatment options included moderate to severe adverse events and short progression-free survival. Goals for treatment include prolonging survival, improving quality of life, and lengthening time to recurrence. Patients reported to be willing to tolerate potential eye problems and other adverse events associated with MIRV if this therapy would work on prolonging survival. A total of 3 respondents (one patient and 2 caregivers) indicated to have had experience with MIRV. Patient input noted fewer adverse events while on MIRV with significantly better quality of life in comparison to chemotherapy. However, patients and caregivers noted that adverse events were not nonexistent and included eye problems such as cataract, as well as fatigue, and bowel issues.
Clinician group input was received from BC Cancer Gynecologic Oncology Provincial Tumour Group, Ontario Health (Cancer Care Ontario) Gynecologic Cancer Drug Advisory Committee, and Society of Gynecologic Oncology of Canada. Treatment options for platinum-resistant ovarian cancer include non–platinum-based chemotherapy (i.e., paclitaxel, pegylated liposomal doxorubicin, topotecan) with or without bevacizumab. Clinician input noted that current treatment options have failed to demonstrate significant impact on increasing patient’s survival. Clinician group input indicated that treatment goals include extending progression-free and overall survival while maintaining health-related quality of life. Clinician input noted that MIRV is expected to be used as treatment for patients with FR alpha–positive status ovarian cancer, followed then by non–platinum-based chemotherapy with or without bevacizumab, which will delay the use of standard cytotoxic therapies. However, clinician input also indicated concern regarding the magnitude of benefit associated with MIRV treatment for patients who have received bevacizumab in previous treatment lines. Clinician input also noted that access to ophthalmologists due to potential ocular toxicity associated with MIRV might be limited in some centres.
Input from CDA-AMC–participating drug plans noted that FR alpha testing is not standard in Canada, hence its implementation represents additional cost to the health care system. Drug plan input noted that MIRV has a potential for drug wastage given its vial size. Also, drug plans noted that patients will need ophthalmic exams before starting treatment, at the onset of ocular symptoms, and every other cycle thereafter. Patients would also need prophylactic eye drops during MIRV treatment, which may not be publicly funded. In addition, it is uncertain whether these eye assessments can be conducted by an ophthalmologist or optometrist, which can represent an out-of-pocket cost for patients. Drug plan input indicated concern with the lack of evidence in how to sequence MIRV and bevacizumab plus chemotherapy.
Several of these concerns were addressed in the sponsor’s model:
Treatment goals of progression-free survival and overall survival, as well as adverse events, were modelled.
FR-alpha testing costs were included in the cost-utility analysis and budget impact analysis.
Health care resource use due to visits to the ophthalmologist were included in the model.
CDA-AMC was unable to address the following concerns:
Uncertainty of the magnitude of benefit associated with MIRV treatment for patients who have received bevacizumab previously.
Out-of-pocket costs associated with prophylactic eye drops and potential optometrist visits.
Appendix 3: Summary of the Sponsor’s Submission
Please note that this appendix has not been copy-edited.
Summary of the Sponsor’s Economic Evaluation
For the pharmaceutical reviews program, clinical and economic information is submitted to CDA-AMC by the sponsor. The CDA-AMC health economics team reviews the submitted economic information and appraises the information in collaboration with clinical experts and the clinical review team to evaluate key assumptions, influential parameters, and the overall rigour of the economic submission. Based on what the team learns through this process, adjustments may be made to the sponsor’s model to produce the CDA-AMC base case. The CDA-AMC base case represents the team’s current understanding of the clinical condition, clinical evidence currently available, and best interpretation of the economic evidence based on the information provided.
For the review of MIRV, the sponsor provided a cost-utility analysis and a budget impact analysis. The sponsor’s economic submission is summarized in Table 5.
Table 5: Key Components of the Sponsor’s Economic Evaluation
Component | Description |
|---|---|
Treatment information | |
Drug under review | Mirvetuximab soravtansine (TBC), IV solution (100 mg/ 20 mL) |
Submitted price of drug under review | $5,495.0000 per vial |
Regimen | Monotherapy |
Per 28-day course cost of drug under review | $25,715 per patient (assuming vial wastage and RDI) |
Model information | |
Type of economic evaluation | Cost-utility analysis PSM |
Treatment | MIRV |
Included comparators | Pooled chemotherapy, including:
Scenario analysis:
|
Perspective | Publicly funded health care payer perspective |
Time horizon | Lifetime (37 years) |
Cycle length | 7 days |
Modelled population | Adult patients with FR alpha–positive, platinum-resistant epithelial ovarian, fallopian tube, or primary peritoneal cancer, who have received 1 to 3 prior systemic treatment regimens |
Characteristics of modelled population | Derived from the MIRASOL trial (mean age: 63 years; body surface area: 1.73 m2; weight: ████ kg; adjusted ideal body weight: █████ kg) |
Model health states |
|
Data sources | |
Comparative efficacy |
|
Natural history and/or clinical pathway |
|
Health-related utilities and disutilities | • Health state utility values were derived from EQ-5D data collected in the MIRASOL trial. Health state utilities values were stratified time to death and response status in all health states. Adverse event disutilities were obtained from the literature.5-7 |
Costs included in the model |
|
Summary of the submitted results | |
Base-case results | ICER = $271,993 per QALY gained (incremental costs = $182,204; incremental QALYs = 0.67) |
Scenario analysis resultsa |
|
AE = adverse events; FR-alpha = folate receptor alpha; ICER = incremental cost-effectiveness ratio; MAIC = matching-adjusted indirect comparison; MIRV = mirvetuximab soravtansine; PFS = progression-free survival; PSM = partition survival model; OS = overall survival; QALY = quality-adjusted life-years; RDI = relative dose intensity; TTD = time to treatment discontinuation.
aResults of scenario analyses that had a meaningful impact on the estimated ICER compared to the sponsor’s base case. Additional scenarios were submitted that had no meaningful impact on the estimated ICER included alternative OS distribution for pooled chemotherapy, alternative TTD distribution, utilities values dependent only on health states, exclusion of disutilities related to AEs, exclusion of subsequent treatment costs, and alternative discount rates.
Table 6: Summary of the Sponsor’s Economic Evaluation Results (Probabilistic Results)
Drug | Total costs ($) | Incremental costs ($) | Total LYs | Total QALYs | Incremental QALYs | ICER vs. ($/QALY) |
|---|---|---|---|---|---|---|
Pooled chemotherapy | 73,438 | Reference | 1.30 | 0.85 | Reference | Reference |
MIRV | 255,642 | 182,204 | 2.31 | 1.52 | 0.67 | 271,993 |
Table 7: Summary of the Sponsor’s Economic Evaluation Scenario Analysis, Including Bevacizumab Plus Chemotherapy as Comparator (Deterministic Results)
Drug | Total costs ($) | Incremental costs ($) | Total LYs | Total QALYs | Incremental QALYs | ICER vs. ($/QALY) |
|---|---|---|---|---|---|---|
Bevacizumab plus chemotherapy | 124,463 | Reference | 1.58 | 1.05 | Reference | Reference |
MIRV | 255,286 | 130,823 | 2.30 | 1.52 | 0.47 | 277,592 |
Appendix 4: Additional Details of CDA-AMC Reanalyses
Please note that this appendix has not been copy-edited.
Clinical Data in the Economic Model
The key clinical efficacy data (i.e., PFS, OS, and TTD) used to inform the economic model were derived from the MIRASOL trial (data cut-off date: September 26, 2024) for MIRV and pooled chemotherapy. The CDA-AMC clinical review found that with moderate certainty MIRV may improve PFS among patients with platinum-resistant epithelial ovarian cancer, whose tumours express a high FR-alpha defined according to the VENTANA FOLR1 Assay (≥ 75% of viable tumour cells) in comparison with pooled chemotherapy. Although there was moderate-certainty evidence that MIRV led to an increase in OS compared to pooled chemotherapy at 18 months, the certainty of the evidence at 6 months was assessed to be low as the lower bound of the confidence interval included the possibility of no OS benefit. Assessment of notable harms suggested that there were little to no difference in these notable harms (i.e., peripheral neuropathy, fatigue, keratopathy, and pneumonitis) in patients treated with MIRV compared to pooled chemotherapy. However, there was high certainty evidence that treatment with MIRV resulted in vision blurred compared to pooled chemotherapy.
The sponsor assessed the comparative effectiveness of MIRV with bevacizumab plus chemotherapy using the sponsor-submitted MAIC. The outcomes of interest from the MAIC, as it relates to the economic evaluation, were the PFS and OS. The MAIC displayed inconsistent results (MIRV may have a shorter PFS, but higher OS than bevacizumab plus chemotherapy). The CDA-AMC clinical review noted heterogeneity in the patient populations of both trials, including key variables that could have been adjusted, but were not, such as number of prior lines of therapy, platinum-free interval, choice of preassigned chemotherapy, and ECOG scores. Key differences in patient populations between both trials that were considered critical by the clinical experts but that could not be adjusted included tumour histology, FR-alpha expression status, prior PARP use, and prior use of bevacizumab. The CDA-AMC Clinical Team have noted that the treatment landscape of ovarian cancer has evolved in the time between AURELIA and MIRASOL trials, and so all patients were PARP inhibitor–naive and had prior antiangiogenic therapy at baseline in the AURELIA trial. As a result of this heterogeneity between the anchored chemotherapy arms, the clinical experts expressed a serious potential for bias when comparing the cross-trial treatment effects. Hence, the relative effectiveness of MIRV and bevacizumab plus chemotherapy was considered too uncertain to determine.
Key Issues of the Submitted Economic Evaluation
CDA-AMC identified the following key issues with the sponsor’s analysis:
PFS and OS long-term extrapolation of MIRV are likely overestimated. The sponsor submitted a cost-utility analysis, in which the long-term clinical efficacy of MIRV was based on the sponsor’s extrapolations of data for PFS and OS obtained from the MIRASOL trial (median follow-up 30 months; 95% confidence interval from 29 to 34 months; maximum follow-up not reported). PFS and OS were extrapolated to 37 years using parametric survival analysis. Although the PFS and OS curves from the trial were mature, 61% of QALYs derived from treatment with MIRV were accrued after the upper 95% confidence interval limit trial follow-up duration (34 months).
Upon validation of the sponsor’s chosen survival extrapolations, CDA-AMC noted that the sponsor’s PFS extrapolation resulted in 0.3% and 0.1% of patients receiving MIRV to be progression-free after 10 and 20 years, respectively. In addition, the sponsor’s OS extrapolation resulted in 3.4% and 1.1% of patients receiving MIRV to be alive after a time horizon of 10 and 20 years, respectively. The proportion of patients who were progression-free or alive at 10 and 20-years’ time point were considered overestimated according to clinical expert input sought by CDA-AMC, as patients are not expected to remain progression-free beyond 5 years and alive beyond 10 years. The sponsor’s extrapolation choices likely overestimated the survival benefit and incremental QALYs associated with MIRV, which biased the cost-effectiveness results in favour of MIRV.
CDA-AMC selected alternative parametric PFS and OS extrapolations that resulted in more plausible long-term extrapolations based on clinical expert input sought by CDA-AMC. CDA-AMC explored uncertainty in these assumptions in scenario analyses.
Comparative effectiveness between MIRV and bevacizumab plus chemotherapy is highly uncertain. The sponsor included bevacizumab plus chemotherapy as a comparator in a scenario analysis, as there are currently no treatments specifically for patients with tumours expressing a high level of FR-alpha. This was accepted by CDA-AMC as per deviation request. Clinical expert input sought by CDA-AMC indicated that as current standard of care, regardless of FR-alpha status, patients who are diagnosed with platinum-resistant epithelial ovarian, fallopian tube, or primary peritoneal cancer, who have received 1 to 3 prior systemic treatment regimens would likely to be treated with bevacizumab plus chemotherapy. Given there is no head-to-head comparison between MIRV and bevacizumab plus chemotherapy, the scenario analysis submitted by the sponsor used a MAIC as source of comparative effectiveness for PFS and OS between MIRV and bevacizumab plus chemotherapy. As stated in the “Clinical Data in the Economic Model” section, the MAIC has several limitations that deem the comparative effectiveness between MIRV and bevacizumab plus chemotherapy in this population too uncertain to determine. Therefore, the cost-effectiveness of MIRV in comparison to bevacizumab plus chemotherapy is unknown.
This issue could not be addressed.
Costs associated with FR-alpha testing were uncertain. FR-alpha testing is not performed as part of routine care for patients with epithelial ovarian cancer, and it is not currently available nor publicly funded in Canada. At the time of writing this report, VENTANA FOLR1 Assay is under review by Health Canada. According to the sponsor, approval is anticipated by Fall of 2025. The sponsor has identified 6 key laboratory sites throughout Canada to enable equitable access to patients based on key geographic locations and their expressed interest in implementing the FR-alpha test within their centres. FR-alpha testing will need to be done across jurisdictions. Although minimal upfront investment and training appears to be required to implement FR-alpha testing, clinical expert input sought by CDA-AMC notes that implementation of FR-alpha testing would likely lead to an expected increase in human resource and laboratory costs due to upscaling the capacity associated with additional immunohistochemistry-based testing and appropriate equipment needs in laboratories across Canada if MIRV was to be funded. Costs associated with additional resources needed for the implementation of FR-alpha testing were not considered in the CUA.
The sponsor included the cost of FR-alpha testing in the cost-utility analysis for all patients treated with MIRV (patients treated with pooled chemotherapy would not incur testing cost). The FR-alpha cost was deemed to be $150 to account for future proxy tests. However, the CDA-AMC Testing Procedure Assessment team reports that the total estimated cost of 1 FR-alpha test would likely vary between $150 and $200 when accounting for reagents, laboratory technologists, and pathologist time. Therefore, the $150 proposed in this analysis would not account for future proxy tests. Moreover, the approach to including FR-alpha testing in the CUA does not fully account for the cost and implications of testing to identify eligible patients. That is, more patients will need to be tested to identify FR alpha–positive patients eligible for MIRV. For instance, in the BIA report,3 which takes a different approach to account for testing (i.e., all patients with high-grade serous ovarian cancer who undergo cytoreductive surgery were considered eligible for testing), the sponsor assumed that among patients who underwent cytoreductive surgery and received a FR-alpha test, 40% (40 out of 100) of would be FR alpha–positive and eligible to be treated with MIRV. However, the CUA considers that only 40 patients (out of 100; total testing cost of $6,000 considering a cost of $150 per test) would be tested for FR-alpha, as opposed to the entire population potentially eligible for MIRV (n = 100; $10,000 considering a cost of $150 per test). In addition, according to clinical expert input sought by CDA-AMC, there is uncertainty regarding when patients would be tested (i.e., patients could be tested at diagnosis, after first recurrence, or after platinum-resistance), which would influence in the cost per positive FR-alpha test. As such, the CUA does not account for the true magnitude of FR-alpha testing in this population.
Also, given there is no gold standard for FR-alpha testing, the sensitivity and specificity of the test is unknown. The lack of information on test accuracy results in uncertainty in the number of false-positive tests (patients that would receive MIRV and would not benefit from treatment), and conversely, the number of false-negatives (patients who would benefit from MIRV and would not be treated).
CDA-AMC was unable to address this issue due to uncertainty in the cost per positive FR-alpha test and lack of data on test accuracy. As such the costs associated with MIRV are underestimated.
Health-related utility values were modelled inappropriately. In the sponsor’s base case, the health-related utility values were stratified by time of death (e.g., less than 4 weeks, between 4 and 12 weeks, between 12 and 24 weeks, and more than 24 weeks), with patients displaying lower utility scores closer to time of death. The health-related utility values were also stratified by response status. Although CDA-AMC acknowledges that patient’s quality of life may decline as their disease progresses, the approach used to calculate patient’s health utility stratified by time of death within a PSM lacks methodological validity. PSMs have inherent limitations such as inability to track the amount of time each individual patient spends in a health state, or to track an individual’s patient transition to the next health state. With that, to calculate the utility for each time of death per cycle the sponsor used the number of new deaths in future cycles and multiply by the PFS and PPS state occupancy adjusted for that cycle. The same structure is used when selecting utility to be stratified by health state only, which when compared to a regular method to calculate QALYs, resulted in a slight underestimation of incremental differences between MIRV and pooled chemotherapy. Consequently, changes associated with the stratification of utilities and utility’s calculation structure had a small impact on the ICER.
CDA-AMC was unable to fully validate the QALYs predicted for patients when stratified by time of death, however, no scenario analysis was conducted because there is little impact associated with the base-case change.
Inclusion of RDI is inappropriate. The sponsor’s base case incorporated RDI for MIRV and pooled chemotherapy based on data from the MIRASOL trial. Consistent with previous reviews, given the inability to link reduced dose intensity with outcomes, the CDA-AMC base case does not incorporate reduced dose intensity in the base case. A reduction in RDI can be derived from a delayed dose, a missed dose, or a reduction in dose. When considering wastage, each component can have a very different influence on drug costs. Likewise, it is unclear how treatment discontinuation influences RDI.
In the CDA-AMC base case, RDI was assumed to be 100% for all treatments. The impact of this change was explored in a scenario analysis.
The model overestimated the costs of comparators. The sponsor’s submitted model included costs for paclitaxel and pegylated liposomal doxorubicin in the base case, and bevacizumab plus chemotherapy as scenario analysis. The cost of each of the comparators per administration accounted for the possibility of via sharing (i.e., option of vial sharing [no wastage] and no vial sharing [wastage]). In the base case, the sponsor opted to calculate the acquisition drug costs with no vial sharing, which considered a normal distribution of the expected dosage for MIRV and all comparators. While the sponsor obtained the costs from CDA-AMC submissions, Ontario Drug Benefit Formulary,8 IQVIA delta PA,9 and Yukon formulary,10 CDA-AMC noted that some drug formulations were missing or no longer available, and drug acquisition costs were accounted for incorrectly for many comparators. For example, paclitaxel had 3 out of the 4 formulations included in the drug cost calculation (including 30 mg, 96 mg, 150 mg while missing 300 mg vial). Moreover, the costs for paclitaxel 30mg and 150mg vials included in the model were $4.79 and $22.37, respectively, whereas costs obtained from DeltaPA4 for these presentations are $300 and 1,870, respectively. Consequently, when corrected, the total cost per administration of paclitaxel changes from $760 to $1,796. Similar issues were observed in pegylated liposomal doxorubicin, topotecan, and bevacizumab costs. The issues encountered in the model likely overestimated the costs of comparators, which favoured results against MIRV.
CDA-AMC used the latest publicly available prices for all comparators in the base case and all relevant presentations available.
Additional issues were identified but were not considered to be key issues: Among the notable harms considered relevant by clinical expert input sought by CDA-AMC, pneumonitis (all grades) was more common among patients who received MIRV (10%) than pooled chemotherapy (less than 1%), and it was not included in the submitted model. The inclusion of only grade 3+ adverse events with more than 5% incidence in the pharmacoeconomic model may underestimate the cost associated with pneumonitis, as additional visits to a health care provider and drug treatments may be required regardless of the grade. In addition, the CUA model submitted by the sponsor overwrites the changes proposed by CDA-AMC before running the probabilistically analysis with default values.
CDA-AMC Reanalysis of the Economic Evaluation
The CDA-AMC base case was derived by making changes in model parameter values and assumptions, in consultation with clinical experts (refer to Table 8). The results of the CDA-AMC base case are presented deterministically, as the model does not run probabilistic analysis with values other than default ones submitted by the sponsor. The impact of these changes, individually and collectively, is presented in Table 9.
Table 8: Revisions to the Submitted Economic Evaluation
Stepped analysis | Sponsor’s value or assumption | CDA-AMC value or assumption |
|---|---|---|
1. PFS extrapolation | Log-logistic distribution | Exponential distribution |
2. OS extrapolation | Log-logistic distribution | Gompertz distribution |
3. RDI | Derived from the MIRASOL trial | Assumed to be 100% for all therapies |
4. Comparator’s drug presentations and costs | Based on CDA-AMC submissions, Ontario Drug Benefit Formulary, IQVIA delta PA, and Yukon formulary | Based on the latest publicly available prices for all comparators |
CDA-AMC base case (health care payer perspective) | ― | Reanalysis 1 + 2 + 3 + 4 |
CDA-AMC = Canada’s Drug Agency; OS = overall survival; PFS = progression-free survival; RDI = relative dose intensity.
Table 9: Summary of the Stepped Analysis
Stepped analysis | Drug | Total costs ($) | Total QALYs | ICER ($/QALY) |
|---|---|---|---|---|
Sponsor’s base case (deterministic) | Pooled chemotherapy | 73,955 | 0.83 | Reference |
MIRV | 255,286 | 1.52 | 263,591 | |
CDA-AMC reanalysis 1 | Pooled chemotherapy | 73,955 | 0.83 | Reference |
MIRV | 255,311 | 1.51 | 265,130 | |
CDA-AMC reanalysis 2 | Pooled chemotherapy | 73,955 | 0.83 | Reference |
MIRV | 254,533 | 1.14 | 588,219 | |
CDA-AMC reanalysis 3 | Pooled chemotherapy | 77,418 | 0.83 | Reference |
MIRV | 286,152 | 1.52 | 303,423 | |
CDA-AMC reanalysis 4 | Pooled chemotherapy | 84,517 | 0.83 | Reference |
MIRV | 255,286 | 1.52 | 248,237 | |
CDA-AMC base case: Reanalysis 1 + 2 + 3 + 4 (deterministic) | Pooled chemotherapy | 89,556 | 0.83 | Reference |
MIRV | 285,413 | 1.14 | 642,249 |
CDA-AMC = Canada’s Drug Agency; ICER = incremental cost-effectiveness ratio; MIRV = mirvetuximab soravtansine; QALY = quality-adjusted life-year.
Note: The CDA-AMC reanalysis is based on the publicly available prices of the comparator treatments. Deterministic results are presented, unless otherwise indicated.
Table 10: Disaggregated Results of the CDA-AMC Base Case
Parameter | Pooled chemotherapy | MIRV |
|---|---|---|
Discounted LYs | ||
Total | 1.29 | 1.71 |
By health state | ||
Preprogression | 0.42 | 0.63 |
Post progression | 0.87 | 1.08 |
Discounted QALYs | ||
Total | 0.83 | 1.13 |
By health state | ||
Preprogression | 0.29 | 0.45 |
Post progression | 0.54 | 0.68 |
Decrement due adverse events | −0.01 | 0.00 |
Discounted costs ($) | ||
Total | 89,556 | 285,413 |
Preprogression treatment | 22,205 | 218,063 |
Postprogression treatment | 15,591 | 15,998 |
Adverse events | 4,982 | 3,636 |
Preprogression disease management | 738 | 1,393 |
Postprogression disease management | 1,734 | 2,155 |
Testing | 150 | 0 |
Terminal care | 44,306 | 44,306 |
CDA-AMC = Canada’s Drug Agency; LY = life-year; MIRV = mirvetuximab soravtansine; QALY = quality-adjusted life-year.
Price Reduction Analysis
CDA-AMC conducted price reduction analyses using the sponsor’s base case and the CDA-AMC base case (refer to Table 11).
Table 11: Results of the Price Reduction Analysis
Price reduction | Unit drug cost ($) | Cost per 28 days ($) | ICERs for MIRV vs. pooled chemotherapy ($/QALY) | |
|---|---|---|---|---|
Sponsor base case | CDA-AMC base case | |||
No price reduction | 5,495a | 29,307 | 271,993 | 642,249 |
10% | 4,945.5 | 26,376 | 237,534 | 571,250 |
20% | 4,396 | 23,445 | 210,208 | 500,250 |
30% | 3,846.5 | 20,515 | 182,883 | 429,251 |
40% | 3,297 | 17,584 | 155,557 | 358,252 |
50% | 2,747.5 | 14,653 | 128,232 | 287,252 |
60% | 2,198 | 11,723 | 100,906 | 216,253 |
70% | 1,648.5 | 8,792 | 73,581 | 145,253 |
80% | 1,099 | 5,861 | 46,255 | 74,254 |
90% | 549.5 | 2,931 | 18,930 | 3,255 |
CDA-AMC = Canada’s Drug Agency; ICER = incremental cost-effectiveness ratio; MIRV = mirvetuximab soravtansine; vs. = versus.
aSponsor’s submitted price for MIRV.
Assessment of Uncertainty
CDA-AMC used the CDA-AMC base case to conduct scenario analyses to address uncertainty within the economic evaluation. The results are provided in Table 12.
Assuming an alternate parametric distribution for OS (gamma).
Including RDI, based on sponsor-provided values.
Table 12: Results of CDA-AMC Scenario Analyses
Analysisa | Drug | Total costs ($) | Total QALYs | ICER ($/QALYs) |
|---|---|---|---|---|
CDA-AMC base case | Pooled chemotherapy | 89,556 | 0.83 | Reference |
MIRV | 285,413 | 1.14 | 642,249 | |
CDA-AMC scenario 1: gamma distribution for OS | Pooled chemotherapy | 89,556 | 0.83 | Reference |
MIRV | 285,521 | 1.19 | 548,308 | |
CDA-AMC scenario 2: including RDI | Pooled chemotherapy | 84,517 | 0.83 | Reference |
MIRV | 254,545 | 1.14 | 557,551 |
CDA-AMC = Canada’s Drug Agency; ICER = incremental cost-effectiveness ratio; MIRV = mirvetuximab soravtansine; OS = overall survival; QALY = quality-adjusted life-year; RDI = relative dose intensity.
aDeterministic analyses.
Appendix 5: Budget Impact Analysis
Please note that this appendix has not been copy-edited.
Summary of the Submitted BIA
The sponsor submitted a BIA that estimated the expected incremental budgetary impact of reimbursing MIRV for the treatment of adult patients with FR alpha–positive, platinum-resistant epithelial ovarian, fallopian tube, or primary peritoneal cancer, who have received 1 to 3 prior systemic treatment regimens.3
The BIA was conducted from the perspective of public drug plan payers over a 3-year time horizon (2026 to 2028), with 2025 as the base year. The sponsor’s estimate reflects the aggregated results from the jurisdictional provincial budgets (excluding Quebec). The sponsor estimated the eligible population using an epidemiological approach. FR-alpha testing was assumed to be performed in patients with high-grade serous ovarian cancer after cytoreductive surgery, with an uptake of 50% in Year 1, and up to 95% in Year 3. The sponsor assumed the cost per FR-alpha test would be $52 based on manufacturer input.3 The sponsor’s base case included only drug acquisition and did not include testing costs. The market uptake for MIRV was estimated by using assumptions. The key inputs to the BIA are documented in Table 13.
The sponsor estimated the 3-year incremental budget impact associated with reimbursing MIRV would be $111,786,444 (year 1 = $18,660,117; year 2 = $39,732,055; year 3 = $53,394,272).
Table 13: Key Model Parameters
Parameter | Sponsor’s estimate (reported as year 1 / year 2 / year 3 if appropriate) |
|---|---|
Target population | |
Number of patients with ovarian cancer | Province-specifica |
Proportion of patients with epithelial ovarian cancer | |
Proportion of patients with high-grade serous ovarian cancer | 92%15 |
Proportion of patients undergoing cytoreductive surgery | 90%2 |
Proportion of patients tested for FR expression | 50% / 75% / 95%b |
Proportion of patients with high FR expression | 40%16 |
Proportion of patients receiving first-line therapy | 85%b |
Proportion of patients who are PR | 42%15 |
First line - > second line | |
Second line - > third line | |
Third line - > fourth line | |
Proportion of patients who are PS | 58%15 |
First line - > second line | |
Second line - > third line | |
Second line PS - > third line PR | |
Third line - > fourth line | |
Third line PS - > fourth line PR | |
Number of patients eligible for drug under review | 190 / 285 / 362 |
Market shares (reference scenario) | |
MIRV | ██ █ ██ █ ██ |
Chemotherapy | ██ █ ██ █ ██ |
Paclitaxel | ██ █ ██ █ ██ |
Pegylated liposomal doxorubicin | ██ █ ██ █ ██ |
Topotecan | ██ █ ██ █ ██ |
Gemcitabine | ██ █ ██ █ ██ |
Bevacizumab + chemotherapy | ██ █ ██ █ ██ |
Bevacizumab + paclitaxel | ██ █ ██ █ ██ |
Bevacizumab + pegylated liposomal doxorubicin | ██ █ ██ █ ██ |
Market shares (new drug scenario) | |
MIRV | ██ █ ██ █ ██ |
Chemotherapy | ██ █ ██ █ ██ |
Paclitaxel | ██ █ ██ █ ██ |
Pegylated liposomal doxorubicin | ██ █ ██ █ ██ |
Topotecan | ██ █ ██ █ ██ |
Gemcitabine | ██ █ ██ █ ██ |
Bevacizumab + chemotherapy | ██ █ ██ █ ██ |
Bevacizumab + paclitaxel | ██ █ ██ █ ██ |
Bevacizumab + pegylated liposomal doxorubicin | ██ █ ██ █ ██ |
Cost of treatment (per patient per 28-days cycle)2 | |
MIRV | $29,307c |
Chemotherapy | |
Paclitaxel | $9,574 |
Pegylated liposomal doxorubicin | $3,415 |
Topotecan | $416 |
Gemcitabine | $1,620 |
Bevacizumab + chemotherapy | |
Bevacizumab + paclitaxel | $12,350 |
Bevacizumab + pegylated liposomal doxorubicin | $6,191 |
FR = folate receptor; MIRV = mirvetuximab soravtansine; PR = platinum-resistant; PS = platinum-sensitive.
aSponsor provided the number of patients with ovarian cancer by province. The number of patients per province and the incidence used to calculate the number of patients was not provided.
bSponsor’s assumption.
cNo vial sharing, and RDI was included.
Key Issues of the Submitted BIA
CDA-AMC identified several key issues to the sponsor’s analysis that have notable implications on the results of the BIA:
Costs associated with FR-alpha testing are uncertain. FR-alpha testing is not performed as part of routine care for patients with epithelial ovarian cancer and it is not currently available or publicly funded in Canada. In the BIA, the sponsor considered the testing cost would be $52 dollars based on estimation from the manufacturer. However, the CDA-AMC Testing Procedure Assessment team reports that the total estimated cost of 1 FR-alpha test would likely vary between $150 and $200 when accounting for reagents, laboratory technologists, and pathologist time. Therefore, the $52 proposed in the BIA would not account for the other costs associated with the FR-alpha test. Some of the testing costs could be mitigated if they are conducted at laboratories already equipped with the required equipment.
Moreover, in the BIA, the sponsor assumed FR-alpha testing would occur after new patients with high-risk serous ovarian cancer undergo cytoreductive surgery based on input from clinical experts (74% of incident cases). However, according to clinical expert input sought by CDA-AMC, there is uncertainty regarding when patients would be tested (i.e., patients could be tested at diagnosis, after first recurrence, or after platinum-resistance), which would influence on the number of patients tested.
Finally, as reported in the “Key Issues of the Submitted Economic Evaluation” section on Appendix 4, clinical expert input sought by CDA-AMC noted increase in human resource and laboratory costs due to upscaling the capacity associated might be likely due to additional immunohistochemistry-based testing and appropriate equipment needs in laboratories across Canada, if MIRV was to be funded. Costs associated with additional resources needed to the implementation of FR-alpha testing were also not considered in the BIA.
CDA-AMC changed the FR-alpha testing cost from $52 to $150, in alignment with the values used in the CUA (reported by the sponsor). In addition, CDA-AMC included testing costs in the base-case analysis. CDA-AMC highlights that if FR-alpha testing would be performed at the time of diagnosis, testing costs in this analysis are likely to be underestimated.
Inclusion of RDI. The sponsor’s BIA base case incorporated RDI for MIRV and pooled chemotherapy based on data from the MIRASOL trial. Consistent with previous reviews, given the inability to link reduced dose intensity with outcomes, the CDA-AMC base case does not incorporate reduced dose intensity. A reduction in RDI can be derived from a delayed dose, a missed dose, or a reduction in dose. When considering wastage, each component can have a very different influence on drug costs. Likewise, it is unclear how treatment discontinuation influences RDI.
CDA-AMC changed the RDI to 100%.
The sponsor overestimated the costs of comparators. The sponsor’s submitted BIA included costs for paclitaxel, pegylated liposomal doxorubicin, topotecan, gemcitabine, and bevacizumab. The sponsor obtained the costs from health technology assessment submissions, and IQVIA delta PA.9 CDA-AMC noted that some drug presentations were missing for paclitaxel (30mg, 150mg, and 300mg vials), and drug acquisition costs were incorrectly accounted for pegylated liposomal doxorubicin and topotecan. The issues encountered in the BIA overestimated the costs of comparators, which favoured results toward MIRV.
CDA-AMC used the latest publicly available prices for all comparators in the base case and included all relevant presentations available.
Comparative effects of TTD between MIRV and bevacizumab were highly uncertain. The calculation of drug acquisition costs considers the average time patients spend on each treatment. The sponsor reports that average TTD for each treatment were obtained from the CUA estimates, which were based on data from MIRASOL trial (for paclitaxel, and pegylated liposomal doxorubicin, topotecan) and AURELIA trial (for bevacizumab). In the scenario analysis in the CUA, the TTD curve for MIRV was calibrated to proxy the duration of treatment of bevacizumab plus chemotherapy. In the BIA, the duration of MIRV and bevacizumab treatments were 6.4 and 8.1 months, respectively. Given that this comparison is naive (not adjusted for patient characteristics, confounders, or effect modifiers), the difference in TTD between the 2 treatments is highly uncertain.
o CDA-AMC adjusted the treatment duration of bevacizumab to be the same as MIRV’s in the BIA base case.
Additional issues were identified, but were not considered to be key issues. These issues include that sponsor’s spreadsheet of results did not combine drug acquisition costs and testing costs. CDA-AMC results included both drug acquisition and FR-alpha testing costs.
CDA-AMC Reanalyses of the BIA
CDA-AMC revised the sponsor’s submitted analyses by making changes in model parameter values and assumptions, in consultation with clinical experts, as outlined in Table 13.
Table 14: Revisions to the Submitted BIA
Stepped analysis | Sponsor’s value or assumption | CDA-AMC value or assumption |
|---|---|---|
1. FR-alpha testing cost | $52 | $150 |
2. Remove RDI | RDI obtained from MIRASOL trial | Assumed to be 100% for all drugs |
3. Comparator’s drug presentations and costs | Based on health technology assessment submissions and IQVIA delta PA. | Based on the latest publicly available prices for all comparators. |
4. TTD of bevacizumab | 8.1 months | 6.4 months (same as MIRV) |
CDA-AMC base case | ― | Reanalysis 1 + 2 + 3 + 4 |
BIA = budget impact analysis; CDA-AMC = Canada’s Drug Agency; MIRV = mirvetuximab soravtansine; RDI = relative dose intensity; TTD = time to treatment discontinuation.
CDA-AMC was unable to resolve the issues regarding the uncertainty associated with when FR-alpha test will be performed and, consequently, with the number of patients tested.
The results of the CDA-AMC step-wise reanalysis are presented in summary format in Table 15 and a more detailed breakdown is presented in Table 16. In the CDA-AMC base case, the 3-year budget impact of reimbursing MIRV for treatment of patients with FR alpha–positive, platinum-resistant epithelial ovarian, fallopian tube, or primary peritoneal cancer, who have received 1 to 3 prior systemic treatment regimens was $88,262,192 (year 1 = $14,733,297; year 2 = $31,370,872; year 3 = $42,158,023).
Table 15: Summary of the Stepped Analysis of the CDA-AMC Base Case
Stepped analysis | Three-year total ($) |
|---|---|
Submitted base case | 111,786,444 |
CDA-AMC reanalysis 1 | 111,786,444 |
CDA-AMC reanalysis 2 | 111,786,444 |
CDA-AMC reanalysis 3 | 116,963,919 |
CDA-AMC reanalysis 4 | 115,155,048 |
CDA-AMC base case: Reanalysis 1 + 2 + 3 + 4 | 119,914,912 |
CDA-AMC = Canada’s Drug Agency.
Note: The CDA-AMC reanalysis is based on publicly available prices of the comparator treatments
CDA-AMC used the CDA-AMC base case to conduct scenario analyses to explore uncertainty in the estimated budget impact of reimbursing MIRV. The results are provided in Table 16.
Table 16: Disaggregated Summary of the BIA
Stepped analysis | Scenario | Year 0 (current situation) ($) | Year 1 ($) | Year 2 ($) | Year 3 ($) | Three-year total ($) |
|---|---|---|---|---|---|---|
Submitted base case | Reference total | $7,829,559 | $7,845,218 | $11,791,363 | $14,965,598 | $34,602,180 |
MIRV | $0 | $0 | $0 | $0 | $0 | |
All other comparators | $7,829,559 | $7,845,218 | $11,791,363 | $14,965,598 | $34,602,180 | |
New drug total | $7,829,559 | $26,505,336 | $51,523,418 | $68,359,871 | $146,388,624 | |
MIRV | $0 | $23,367,248 | $49,754,713 | $66,863,311 | $139,985,272 | |
All other comparators | $7,829,559 | $3,138,087 | $1,768,705 | $1,496,560 | $6,403,352 | |
Budget Impact | $0 | $18,660,117 | $39,732,055 | $53,394,272 | $111,786,444 | |
CDA-AMC base case | Reference total | $5,572,646 | $5,583,791 | $8,392,438 | $10,651,682 | $24,627,910 |
MIRV | $0 | $0 | $0 | $0 | $0 | |
All other comparators | $5,572,646 | $5,583,791 | $8,392,438 | $10,651,682 | $24,627,910 | |
New drug total | $5,572,646 | $25,600,765 | $51,013,579 | $67,928,479 | $144,542,823 | |
MIRV | $0 | $23,367,248 | $49,754,713 | $66,863,311 | $139,985,272 | |
All other comparators | $5,572,646 | $2,233,516 | $1,258,866 | $1,065,168 | $4,557,550 | |
Budget Impact | $0 | $20,016,974 | $42,621,142 | $57,276,797 | $119,914,912 | |
Scenario 1: including testing costs | Reference total | $5,572,646 | $5,583,791 | $8,392,438 | $10,651,682 | $24,627,910 |
MIRV | $0 | $0 | $0 | $0 | $0 | |
All other comparators | $5, 572,646 | $5, 583,791 | $8,392,438 | $10,651,682 | $24,627,910 | |
New drug total | $5,705,090 | $25,733,474 | $51,213,041 | $68,181,636 | $145,128,150 | |
MIRV | $132,444 | $23,499,957 | $49,954,175 | $67,116,468 | $140,570,600 | |
All other comparators | $5,572,646 | $2,233,516 | $1,258,866 | $1,065,168 | $4,557,550 | |
Budget Impact | $132,444 | $20,149,683 | $42,820,603 | $57,529,954 | $120,500,240 |
BIA = budget impact analysis; CDA-AMC = Canada’s Drug Agency; MIRV = mirvetuximab soravtansine.
Note: The CDA-AMC reanalysis is based on the publicly available prices of the comparator treatments.
ISSN: 2563-6596
Canada’s Drug Agency (CDA-AMC) is a pan-Canadian health organization. Created and funded by Canada’s federal, provincial, and territorial governments, we’re responsible for driving better coordination, alignment, and public value within Canada’s drug and health technology landscape. We provide Canada’s health system leaders with independent evidence and advice so they can make informed drug, health technology, and health system decisions, and we collaborate with national and international partners to enhance our collective impact.
Disclaimer: CDA-AMC has taken care to ensure that the information in this document was accurate, complete, and up to date when it was published, but does not make any guarantee to that effect. Your use of this information is subject to this disclaimer and the Terms of Use at cda-amc.ca.
The information in this document is made available for informational and educational purposes only and should not be used as a substitute for professional medical advice, the application of clinical judgment in respect of the care of a particular patient, or other professional judgments in any decision-making process. You assume full responsibility for the use of the information and rely on it at your own risk.
CDA-AMC does not endorse any information, drugs, therapies, treatments, products, processes, or services. The views and opinions of third parties published in this document do not necessarily reflect those of CDA-AMC. The copyright and other intellectual property rights in this document are owned by the Canadian Agency for Drugs and Technologies in Health (operating as CDA-AMC) and its licensors.
Questions or requests for information about this report can be directed to Requests@cda-amc.ca.